Fisher County, TX Map & Demographics
Fisher County Map
Fisher County Overview
$32,722
PER CAPITA INCOME
$64,554
AVG FAMILY INCOME
$60,461
AVG HOUSEHOLD INCOME
41.5%
WAGE / INCOME GAP [ % ]
58.5¢/ $1
WAGE / INCOME GAP [ $ ]
0.42
INEQUALITY / GINI INDEX
3,680
TOTAL POPULATION
1,901
MALE POPULATION
1,779
FEMALE POPULATION
106.86
MALES / 100 FEMALES
93.58
FEMALES / 100 MALES
42.2
MEDIAN AGE
2.9
AVG FAMILY SIZE
2.4
AVG HOUSEHOLD SIZE
1,869
LABOR FORCE [ PEOPLE ]
63.0%
PERCENT IN LABOR FORCE
2.9%
UNEMPLOYMENT RATE
Fisher County Area Codes
Income in Fisher County
Income Overview in Fisher County
Per Capita Income in Fisher County is $32,722, while median incomes of families and households are $64,554 and $60,461 respectively.
| Characteristic | Number | Measure |
| Per Capita Income | 3,680 | $32,722 |
| Median Family Income | 1,030 | $64,554 |
| Mean Family Income | 1,030 | $82,937 |
| Median Household Income | 1,514 | $60,461 |
| Mean Household Income | 1,514 | $73,425 |
| Income Deficit | 1,030 | $0 |
| Wage / Income Gap (%) | 3,680 | 41.55% |
| Wage / Income Gap ($) | 3,680 | 58.45¢ per $1 |
| Gini / Inequality Index | 3,680 | 0.42 |
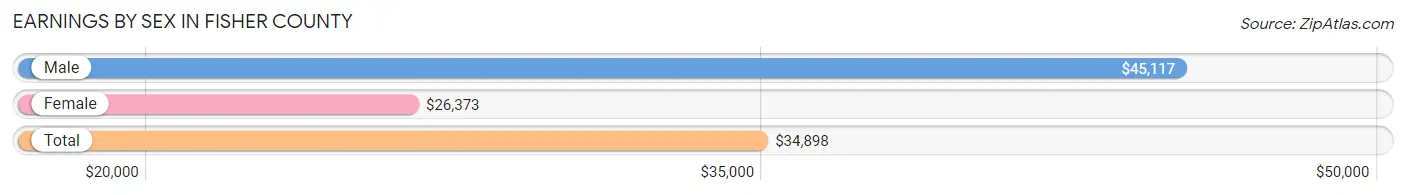
Earnings by Sex in Fisher County
Average Earnings in Fisher County are $34,898, $45,117 for men and $26,373 for women, a difference of 41.5%.
| Sex | Number | Average Earnings |
| Male | 1,135 (57.7%) | $45,117 |
| Female | 831 (42.3%) | $26,373 |
| Total | 1,966 (100.0%) | $34,898 |
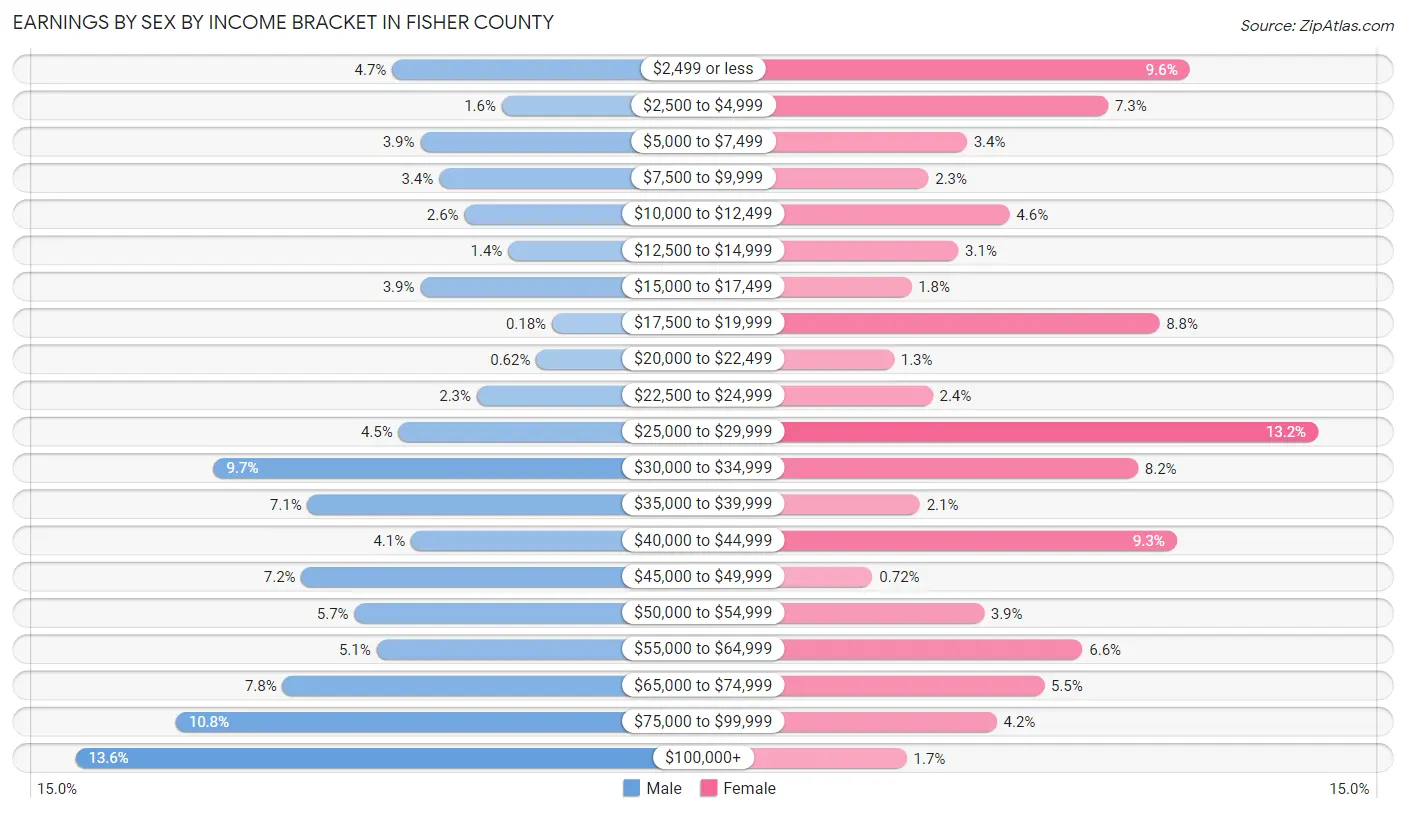
Earnings by Sex by Income Bracket in Fisher County
The most common earnings brackets in Fisher County are $100,000+ for men (154 | 13.6%) and $25,000 to $29,999 for women (110 | 13.2%).
| Income | Male | Female |
| $2,499 or less | 53 (4.7%) | 80 (9.6%) |
| $2,500 to $4,999 | 18 (1.6%) | 61 (7.3%) |
| $5,000 to $7,499 | 44 (3.9%) | 28 (3.4%) |
| $7,500 to $9,999 | 38 (3.4%) | 19 (2.3%) |
| $10,000 to $12,499 | 30 (2.6%) | 38 (4.6%) |
| $12,500 to $14,999 | 16 (1.4%) | 26 (3.1%) |
| $15,000 to $17,499 | 44 (3.9%) | 15 (1.8%) |
| $17,500 to $19,999 | 2 (0.2%) | 73 (8.8%) |
| $20,000 to $22,499 | 7 (0.6%) | 11 (1.3%) |
| $22,500 to $24,999 | 26 (2.3%) | 20 (2.4%) |
| $25,000 to $29,999 | 51 (4.5%) | 110 (13.2%) |
| $30,000 to $34,999 | 110 (9.7%) | 68 (8.2%) |
| $35,000 to $39,999 | 80 (7.0%) | 17 (2.1%) |
| $40,000 to $44,999 | 47 (4.1%) | 77 (9.3%) |
| $45,000 to $49,999 | 82 (7.2%) | 6 (0.7%) |
| $50,000 to $54,999 | 65 (5.7%) | 32 (3.8%) |
| $55,000 to $64,999 | 58 (5.1%) | 55 (6.6%) |
| $65,000 to $74,999 | 88 (7.7%) | 46 (5.5%) |
| $75,000 to $99,999 | 122 (10.7%) | 35 (4.2%) |
| $100,000+ | 154 (13.6%) | 14 (1.7%) |
| Total | 1,135 (100.0%) | 831 (100.0%) |
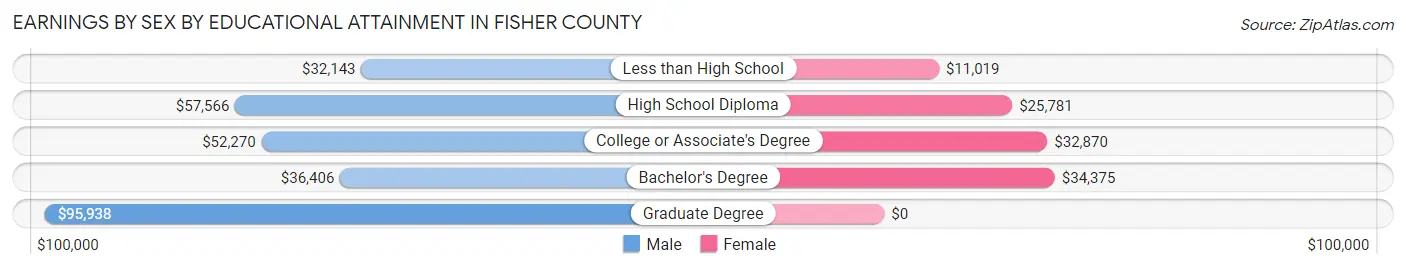
Earnings by Sex by Educational Attainment in Fisher County
Average earnings in Fisher County are $48,850 for men and $27,358 for women, a difference of 44.0%. Men with an educational attainment of graduate degree enjoy the highest average annual earnings of $95,938, while those with less than high school education earn the least with $32,143. Women with an educational attainment of bachelor's degree earn the most with the average annual earnings of $34,375, while those with less than high school education have the smallest earnings of $11,019.
| Educational Attainment | Male Income | Female Income |
| Less than High School | $32,143 | $11,019 |
| High School Diploma | $57,566 | $25,781 |
| College or Associate's Degree | $52,270 | $32,870 |
| Bachelor's Degree | $36,406 | $34,375 |
| Graduate Degree | $95,938 | $0 |
| Total | $48,850 | $27,358 |
Family Income in Fisher County
Family Income Brackets in Fisher County
According to the Fisher County family income data, there are 231 families falling into the $50,000 to $74,999 income range, which is the most common income bracket and makes up 22.4% of all families. Conversely, the $10,000 to $14,999 income bracket is the least frequent group with only 18 families (1.8%) belonging to this category.
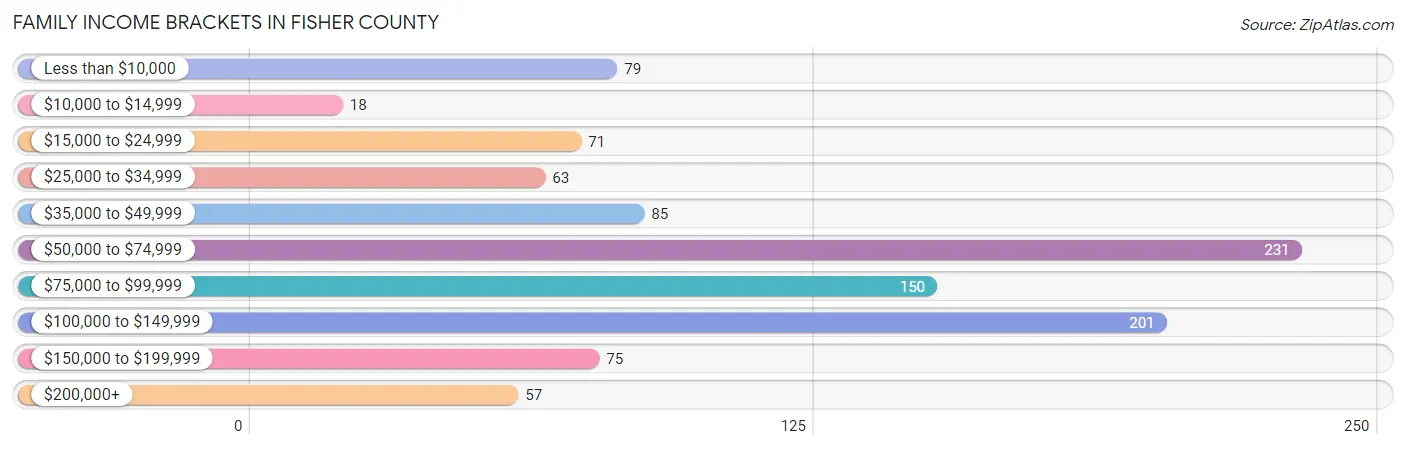
| Income Bracket | # Families | % Families |
| Less than $10,000 | 79 | 7.7% |
| $10,000 to $14,999 | 18 | 1.7% |
| $15,000 to $24,999 | 71 | 6.9% |
| $25,000 to $34,999 | 63 | 6.1% |
| $35,000 to $49,999 | 85 | 8.3% |
| $50,000 to $74,999 | 231 | 22.4% |
| $75,000 to $99,999 | 150 | 14.6% |
| $100,000 to $149,999 | 201 | 19.5% |
| $150,000 to $199,999 | 75 | 7.3% |
| $200,000+ | 57 | 5.5% |
Family Income by Famaliy Size in Fisher County
3-person families (197 | 19.1%) account for the highest median family income in Fisher County with $85,938 per family, while 2-person families (563 | 54.7%) have the highest median income of $31,432 per family member.
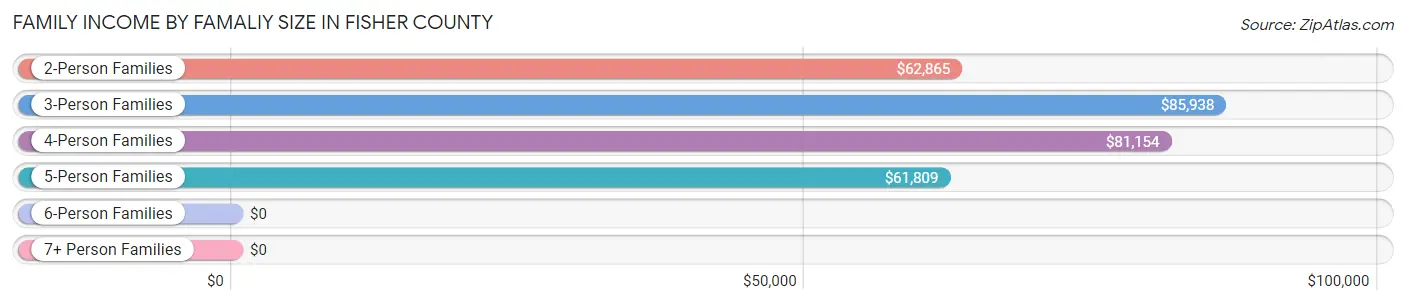
| Income Bracket | # Families | Median Income |
| 2-Person Families | 563 (54.7%) | $62,865 |
| 3-Person Families | 197 (19.1%) | $85,938 |
| 4-Person Families | 126 (12.2%) | $81,154 |
| 5-Person Families | 127 (12.3%) | $61,809 |
| 6-Person Families | 11 (1.1%) | $0 |
| 7+ Person Families | 6 (0.6%) | $0 |
| Total | 1,030 (100.0%) | $64,554 |
Family Income by Number of Earners in Fisher County
The median family income in Fisher County is $64,554, with families comprising 3+ earners (67) having the highest median family income of $172,708, while families with no earners (171) have the lowest median family income of $32,639, accounting for 6.5% and 16.6% of families, respectively.
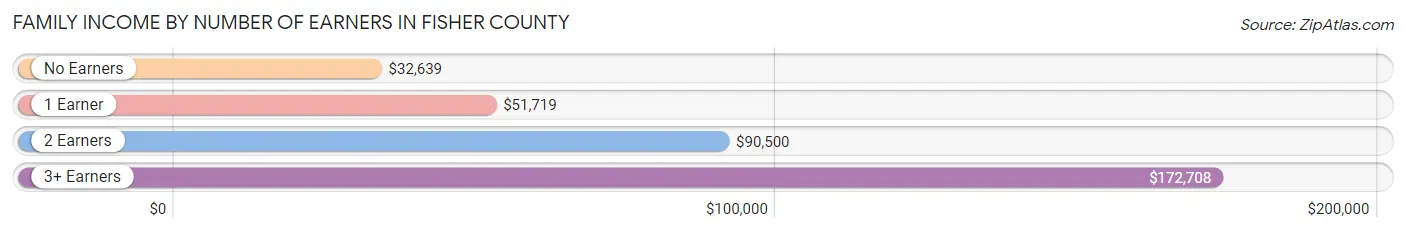
| Number of Earners | # Families | Median Income |
| No Earners | 171 (16.6%) | $32,639 |
| 1 Earner | 354 (34.4%) | $51,719 |
| 2 Earners | 438 (42.5%) | $90,500 |
| 3+ Earners | 67 (6.5%) | $172,708 |
| Total | 1,030 (100.0%) | $64,554 |
Household Income in Fisher County
Household Income Brackets in Fisher County
With 301 households falling in the category, the $50,000 to $74,999 income range is the most frequent in Fisher County, accounting for 19.9% of all households. In contrast, only 50 households (3.3%) fall into the $10,000 to $14,999 income bracket, making it the least populous group.
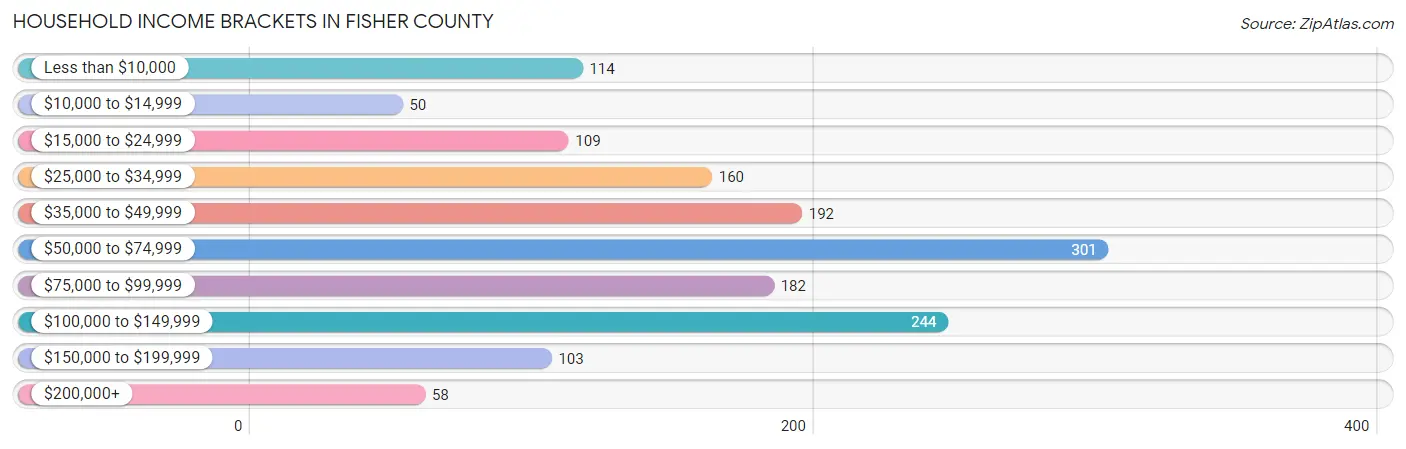
| Income Bracket | # Households | % Households |
| Less than $10,000 | 114 | 7.5% |
| $10,000 to $14,999 | 50 | 3.3% |
| $15,000 to $24,999 | 109 | 7.2% |
| $25,000 to $34,999 | 160 | 10.6% |
| $35,000 to $49,999 | 192 | 12.7% |
| $50,000 to $74,999 | 301 | 19.9% |
| $75,000 to $99,999 | 182 | 12.0% |
| $100,000 to $149,999 | 244 | 16.1% |
| $150,000 to $199,999 | 103 | 6.8% |
| $200,000+ | 58 | 3.8% |
Household Income by Householder Age in Fisher County
The median household income in Fisher County is $60,461, with the highest median household income of $68,636 found in the 45 to 64 years age bracket for the primary householder. A total of 508 households (33.6%) fall into this category. Meanwhile, the 15 to 24 years age bracket for the primary householder has the lowest median household income of $0, with 33 households (2.2%) in this group.
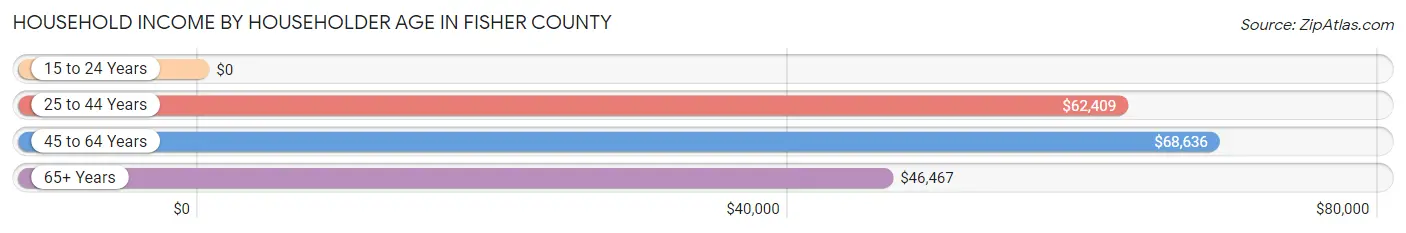
| Income Bracket | # Households | Median Income |
| 15 to 24 Years | 33 (2.2%) | $0 |
| 25 to 44 Years | 418 (27.6%) | $62,409 |
| 45 to 64 Years | 508 (33.6%) | $68,636 |
| 65+ Years | 555 (36.7%) | $46,467 |
| Total | 1,514 (100.0%) | $60,461 |
Poverty in Fisher County
Income Below Poverty by Sex and Age in Fisher County
With 10.3% poverty level for males and 14.2% for females among the residents of Fisher County, 5 year old males and 16 and 17 year old females are the most vulnerable to poverty, with 4 males (57.1%) and 12 females (34.3%) in their respective age groups living below the poverty level.
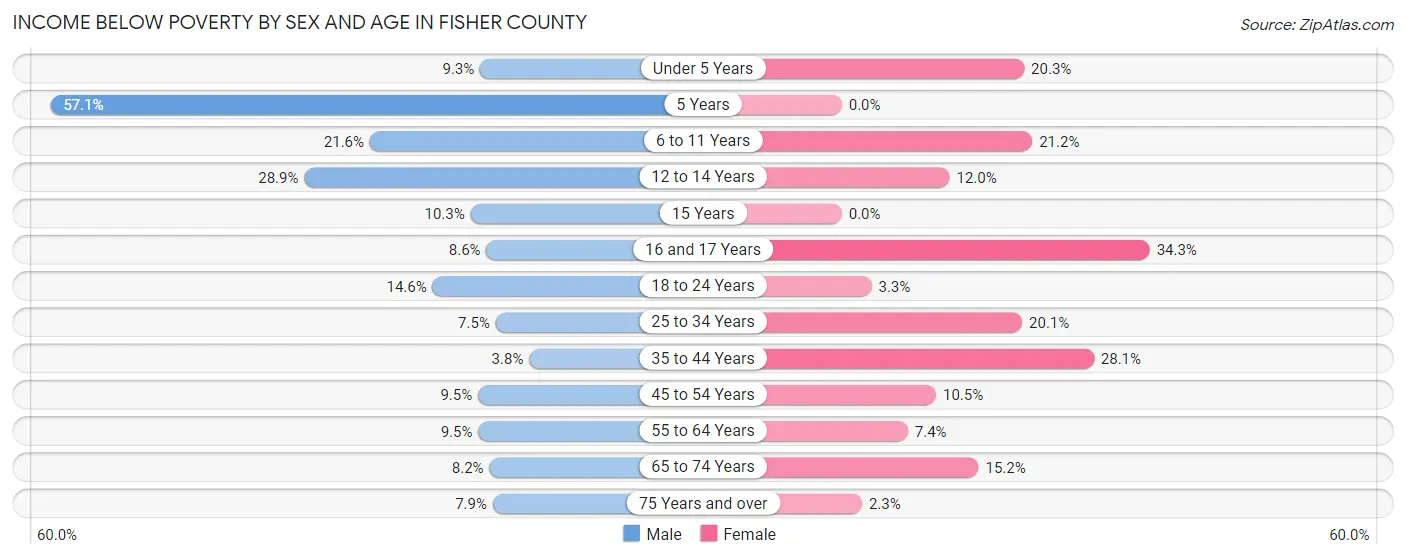
| Age Bracket | Male | Female |
| Under 5 Years | 14 (9.3%) | 13 (20.3%) |
| 5 Years | 4 (57.1%) | 0 (0.0%) |
| 6 to 11 Years | 25 (21.5%) | 35 (21.2%) |
| 12 to 14 Years | 15 (28.8%) | 9 (12.0%) |
| 15 Years | 3 (10.3%) | 0 (0.0%) |
| 16 and 17 Years | 3 (8.6%) | 12 (34.3%) |
| 18 to 24 Years | 22 (14.6%) | 4 (3.3%) |
| 25 to 34 Years | 21 (7.5%) | 51 (20.1%) |
| 35 to 44 Years | 6 (3.8%) | 48 (28.1%) |
| 45 to 54 Years | 23 (9.5%) | 21 (10.5%) |
| 55 to 64 Years | 27 (9.5%) | 12 (7.4%) |
| 65 to 74 Years | 19 (8.2%) | 39 (15.2%) |
| 75 Years and over | 11 (7.9%) | 5 (2.2%) |
| Total | 193 (10.3%) | 249 (14.2%) |
Income Above Poverty by Sex and Age in Fisher County
According to the poverty statistics in Fisher County, males aged 35 to 44 years and females aged 5 years are the age groups that are most secure financially, with 96.2% of males and 100.0% of females in these age groups living above the poverty line.
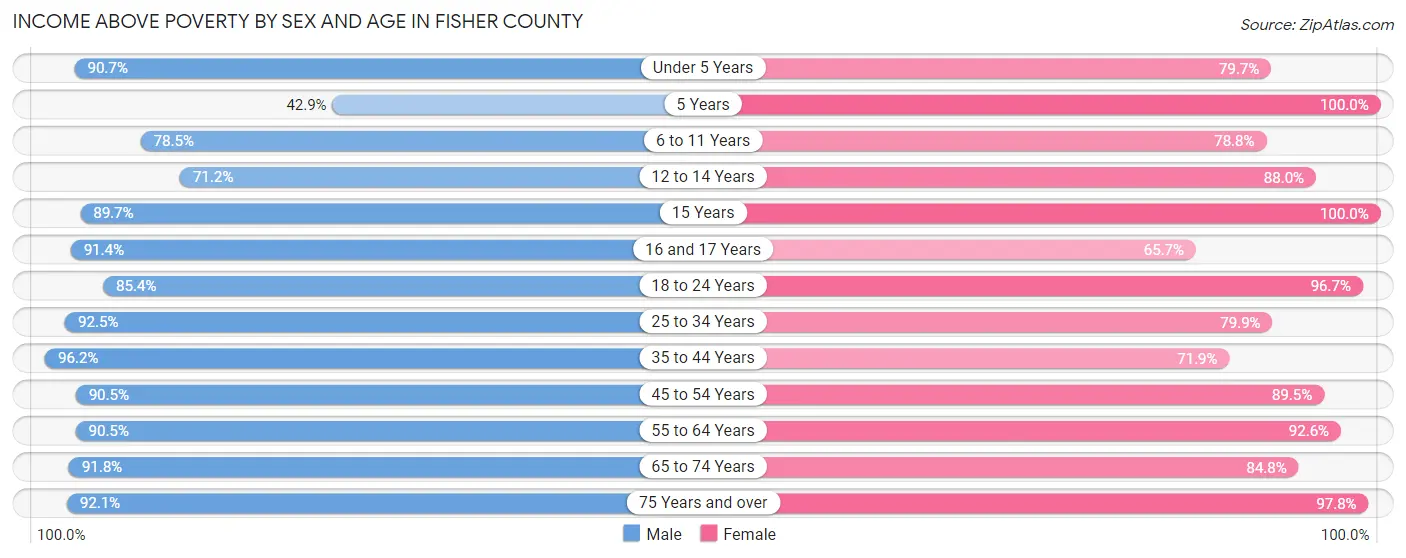
| Age Bracket | Male | Female |
| Under 5 Years | 137 (90.7%) | 51 (79.7%) |
| 5 Years | 3 (42.9%) | 22 (100.0%) |
| 6 to 11 Years | 91 (78.4%) | 130 (78.8%) |
| 12 to 14 Years | 37 (71.2%) | 66 (88.0%) |
| 15 Years | 26 (89.7%) | 5 (100.0%) |
| 16 and 17 Years | 32 (91.4%) | 23 (65.7%) |
| 18 to 24 Years | 129 (85.4%) | 117 (96.7%) |
| 25 to 34 Years | 258 (92.5%) | 203 (79.9%) |
| 35 to 44 Years | 152 (96.2%) | 123 (71.9%) |
| 45 to 54 Years | 219 (90.5%) | 179 (89.5%) |
| 55 to 64 Years | 258 (90.5%) | 151 (92.6%) |
| 65 to 74 Years | 212 (91.8%) | 217 (84.8%) |
| 75 Years and over | 129 (92.1%) | 217 (97.8%) |
| Total | 1,683 (89.7%) | 1,504 (85.8%) |
Income Below Poverty Among Married-Couple Families in Fisher County
The poverty statistics for married-couple families in Fisher County show that 5.1% or 42 of the total 815 families live below the poverty line. Families with no children have the highest poverty rate of 6.4%, comprising of 32 families. On the other hand, families with 3 or 4 children have the lowest poverty rate of 0.0%, which includes 0 families.
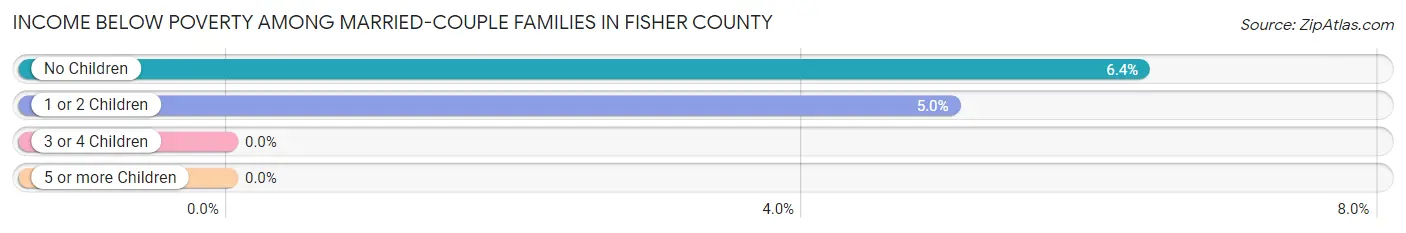
| Children | Above Poverty | Below Poverty |
| No Children | 472 (93.6%) | 32 (6.4%) |
| 1 or 2 Children | 189 (95.0%) | 10 (5.0%) |
| 3 or 4 Children | 106 (100.0%) | 0 (0.0%) |
| 5 or more Children | 6 (100.0%) | 0 (0.0%) |
| Total | 773 (94.9%) | 42 (5.1%) |
Income Below Poverty Among Single-Parent Households in Fisher County
According to the poverty data in Fisher County, 23.9% or 11 single-father households and 48.5% or 82 single-mother households are living below the poverty line. Among single-father households, those with 1 or 2 children have the highest poverty rate, with 11 households (64.7%) experiencing poverty. Likewise, among single-mother households, those with 3 or 4 children have the highest poverty rate, with 19 households (100.0%) falling below the poverty line.
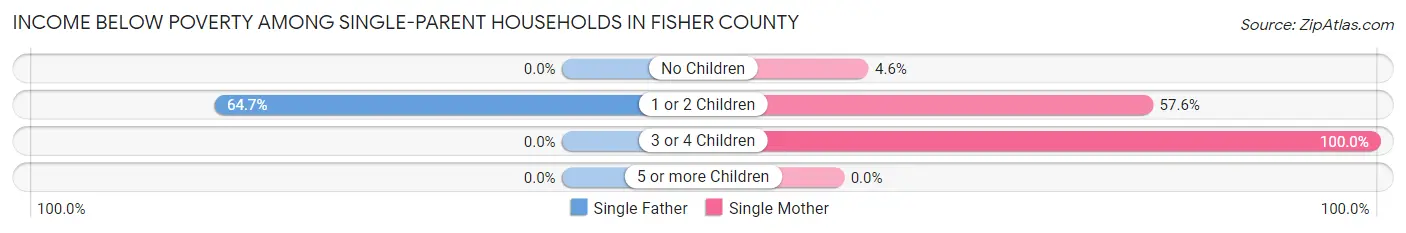
| Children | Single Father | Single Mother |
| No Children | 0 (0.0%) | 2 (4.5%) |
| 1 or 2 Children | 11 (64.7%) | 61 (57.6%) |
| 3 or 4 Children | 0 (0.0%) | 19 (100.0%) |
| 5 or more Children | 0 (0.0%) | 0 (0.0%) |
| Total | 11 (23.9%) | 82 (48.5%) |
Income Below Poverty Among Married-Couple vs Single-Parent Households in Fisher County
The poverty data for Fisher County shows that 42 of the married-couple family households (5.1%) and 93 of the single-parent households (43.3%) are living below the poverty level. Within the married-couple family households, those with no children have the highest poverty rate, with 32 households (6.4%) falling below the poverty line. Among the single-parent households, those with 3 or 4 children have the highest poverty rate, with 19 household (70.4%) living below poverty.
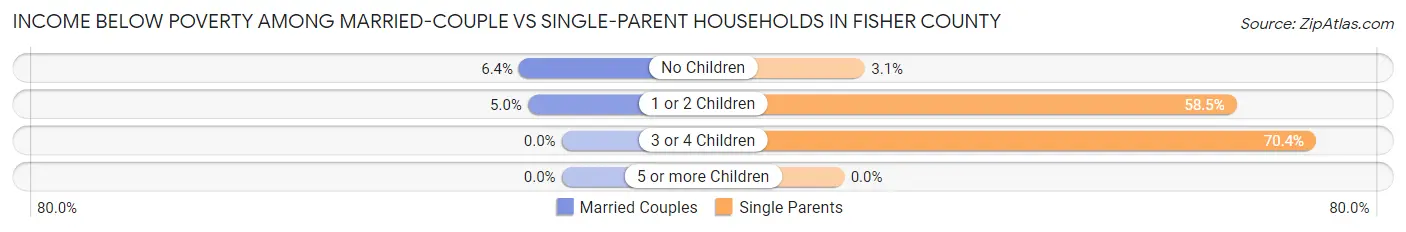
| Children | Married-Couple Families | Single-Parent Households |
| No Children | 32 (6.4%) | 2 (3.1%) |
| 1 or 2 Children | 10 (5.0%) | 72 (58.5%) |
| 3 or 4 Children | 0 (0.0%) | 19 (70.4%) |
| 5 or more Children | 0 (0.0%) | 0 (0.0%) |
| Total | 42 (5.1%) | 93 (43.3%) |
Race in Fisher County
The most populous races in Fisher County are White / Caucasian (2,718 | 73.9%), Hispanic or Latino (1,207 | 32.8%), and Two or more Races (625 | 17.0%).
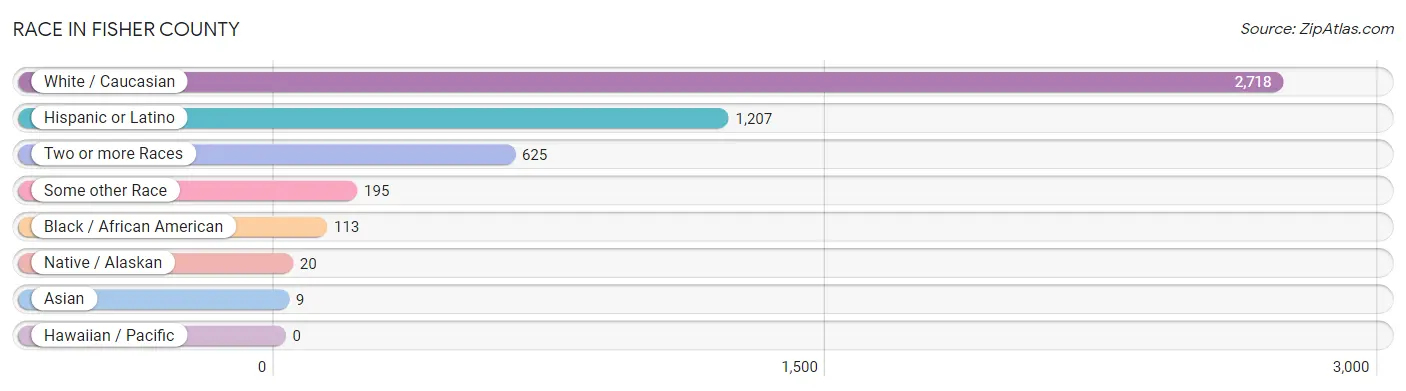
| Race | # Population | % Population |
| Asian | 9 | 0.2% |
| Black / African American | 113 | 3.1% |
| Hawaiian / Pacific | 0 | 0.0% |
| Hispanic or Latino | 1,207 | 32.8% |
| Native / Alaskan | 20 | 0.5% |
| White / Caucasian | 2,718 | 73.9% |
| Two or more Races | 625 | 17.0% |
| Some other Race | 195 | 5.3% |
| Total | 3,680 | 100.0% |
Ancestry in Fisher County
The most populous ancestries reported in Fisher County are Mexican (1,194 | 32.5%), English (459 | 12.5%), American (390 | 10.6%), Irish (340 | 9.2%), and German (284 | 7.7%), together accounting for 72.5% of all Fisher County residents.
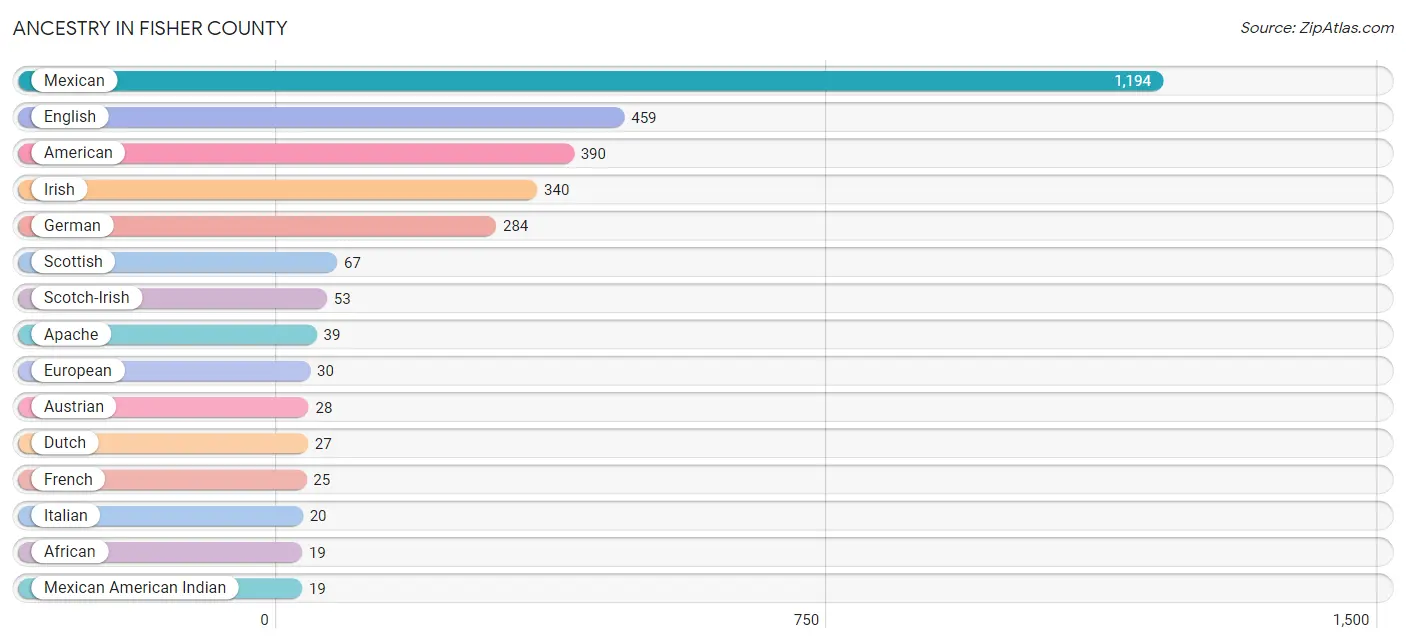
| Ancestry | # Population | % Population |
| African | 19 | 0.5% |
| American | 390 | 10.6% |
| Apache | 39 | 1.1% |
| Arab | 5 | 0.1% |
| Austrian | 28 | 0.8% |
| British | 3 | 0.1% |
| Cajun | 2 | 0.1% |
| Canadian | 15 | 0.4% |
| Central American | 1 | 0.0% |
| Cherokee | 9 | 0.2% |
| Chickasaw | 10 | 0.3% |
| Choctaw | 8 | 0.2% |
| Creek | 9 | 0.2% |
| Dutch | 27 | 0.7% |
| English | 459 | 12.5% |
| European | 30 | 0.8% |
| French | 25 | 0.7% |
| French Canadian | 10 | 0.3% |
| German | 284 | 7.7% |
| Guatemalan | 1 | 0.0% |
| Iranian | 7 | 0.2% |
| Irish | 340 | 9.2% |
| Italian | 20 | 0.5% |
| Lebanese | 5 | 0.1% |
| Mexican | 1,194 | 32.5% |
| Mexican American Indian | 19 | 0.5% |
| Navajo | 5 | 0.1% |
| Norwegian | 3 | 0.1% |
| Polish | 7 | 0.2% |
| Puerto Rican | 1 | 0.0% |
| Scandinavian | 16 | 0.4% |
| Scotch-Irish | 53 | 1.4% |
| Scottish | 67 | 1.8% |
| Sioux | 2 | 0.1% |
| Slavic | 4 | 0.1% |
| Spanish | 3 | 0.1% |
| Subsaharan African | 19 | 0.5% |
| Swedish | 8 | 0.2% |
| Thai | 9 | 0.2% |
| Welsh | 8 | 0.2% |
| Yaqui | 1 | 0.0% | View All 41 Rows |
Immigrants in Fisher County
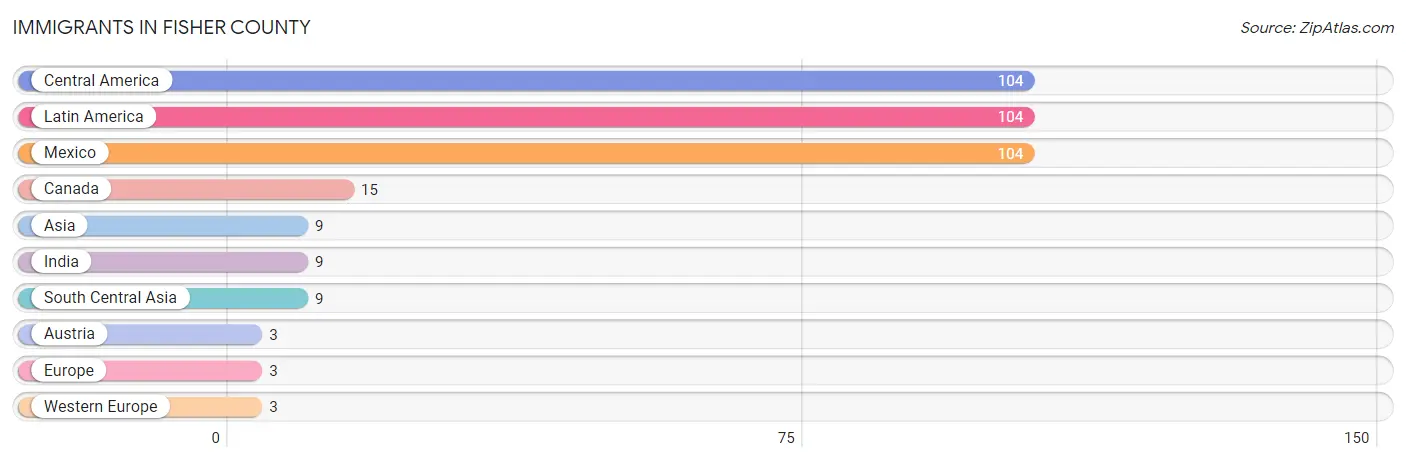
The most numerous immigrant groups reported in Fisher County came from Central America (104 | 2.8%), Latin America (104 | 2.8%), Mexico (104 | 2.8%), Canada (15 | 0.4%), and Asia (9 | 0.2%), together accounting for 9.1% of all Fisher County residents.
| Immigration Origin | # Population | % Population |
| Asia | 9 | 0.2% |
| Austria | 3 | 0.1% |
| Canada | 15 | 0.4% |
| Central America | 104 | 2.8% |
| Europe | 3 | 0.1% |
| India | 9 | 0.2% |
| Latin America | 104 | 2.8% |
| Mexico | 104 | 2.8% |
| South Central Asia | 9 | 0.2% |
| Western Europe | 3 | 0.1% | View All 10 Rows |
Sex and Age in Fisher County
Sex and Age in Fisher County
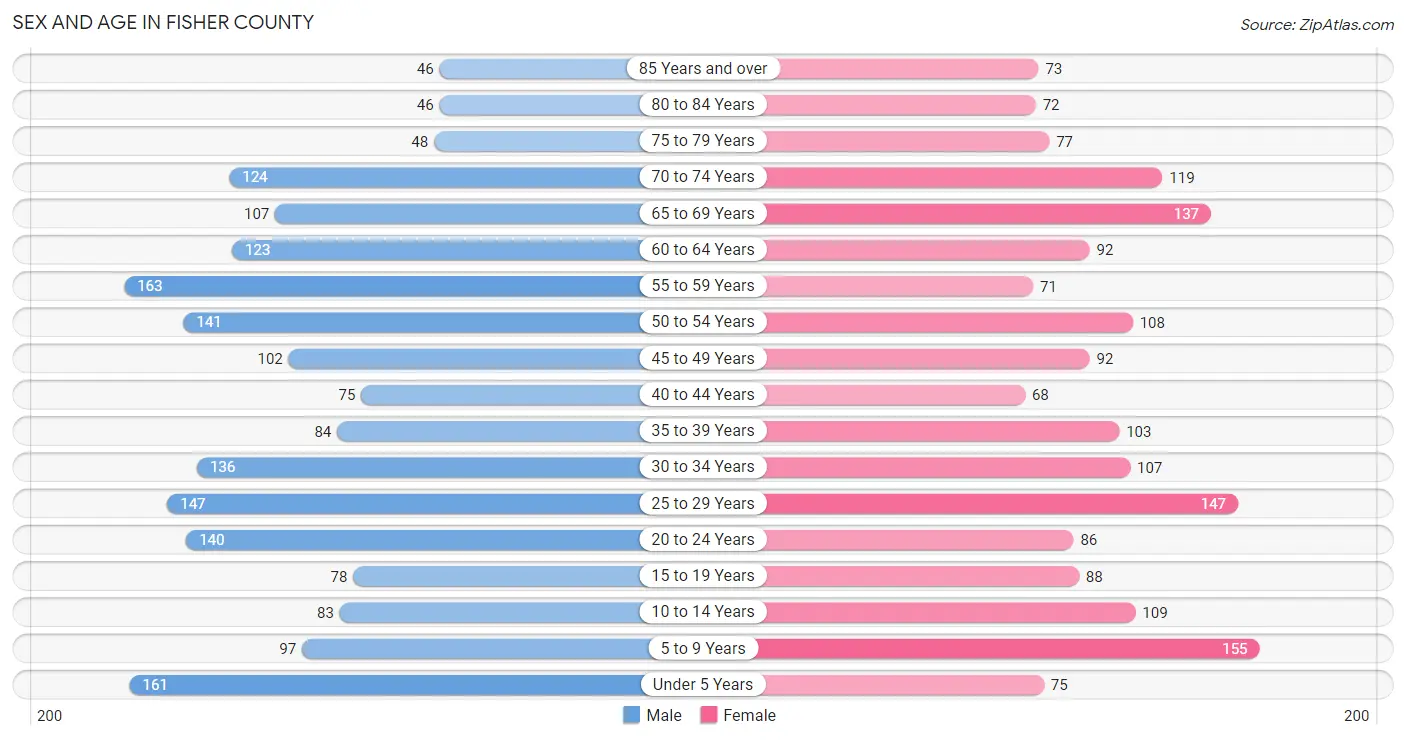
The most populous age groups in Fisher County are 55 to 59 Years (163 | 8.6%) for men and 5 to 9 Years (155 | 8.7%) for women.
| Age Bracket | Male | Female |
| Under 5 Years | 161 (8.5%) | 75 (4.2%) |
| 5 to 9 Years | 97 (5.1%) | 155 (8.7%) |
| 10 to 14 Years | 83 (4.4%) | 109 (6.1%) |
| 15 to 19 Years | 78 (4.1%) | 88 (5.0%) |
| 20 to 24 Years | 140 (7.4%) | 86 (4.8%) |
| 25 to 29 Years | 147 (7.7%) | 147 (8.3%) |
| 30 to 34 Years | 136 (7.1%) | 107 (6.0%) |
| 35 to 39 Years | 84 (4.4%) | 103 (5.8%) |
| 40 to 44 Years | 75 (4.0%) | 68 (3.8%) |
| 45 to 49 Years | 102 (5.4%) | 92 (5.2%) |
| 50 to 54 Years | 141 (7.4%) | 108 (6.1%) |
| 55 to 59 Years | 163 (8.6%) | 71 (4.0%) |
| 60 to 64 Years | 123 (6.5%) | 92 (5.2%) |
| 65 to 69 Years | 107 (5.6%) | 137 (7.7%) |
| 70 to 74 Years | 124 (6.5%) | 119 (6.7%) |
| 75 to 79 Years | 48 (2.5%) | 77 (4.3%) |
| 80 to 84 Years | 46 (2.4%) | 72 (4.1%) |
| 85 Years and over | 46 (2.4%) | 73 (4.1%) |
| Total | 1,901 (100.0%) | 1,779 (100.0%) |
Families and Households in Fisher County
Median Family Size in Fisher County
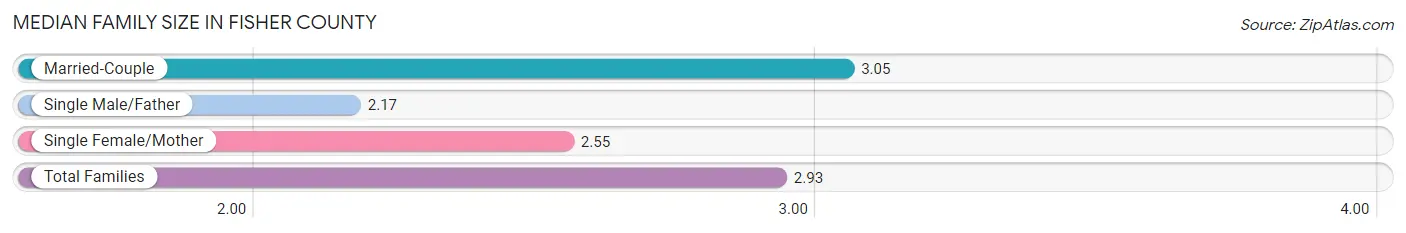
The median family size in Fisher County is 2.93 persons per family, with married-couple families (815 | 79.1%) accounting for the largest median family size of 3.05 persons per family. On the other hand, single male/father families (46 | 4.5%) represent the smallest median family size with 2.17 persons per family.
| Family Type | # Families | Family Size |
| Married-Couple | 815 (79.1%) | 3.05 |
| Single Male/Father | 46 (4.5%) | 2.17 |
| Single Female/Mother | 169 (16.4%) | 2.55 |
| Total Families | 1,030 (100.0%) | 2.93 |
Median Household Size in Fisher County
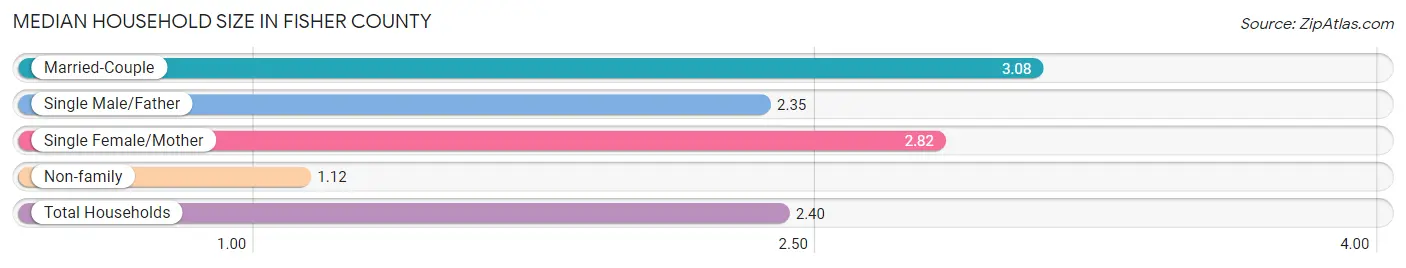
The median household size in Fisher County is 2.40 persons per household, with married-couple households (815 | 53.8%) accounting for the largest median household size of 3.08 persons per household. non-family households (484 | 32.0%) represent the smallest median household size with 1.12 persons per household.
| Household Type | # Households | Household Size |
| Married-Couple | 815 (53.8%) | 3.08 |
| Single Male/Father | 46 (3.0%) | 2.35 |
| Single Female/Mother | 169 (11.2%) | 2.82 |
| Non-family | 484 (32.0%) | 1.12 |
| Total Households | 1,514 (100.0%) | 2.40 |
Household Size by Marriage Status in Fisher County
Out of a total of 1,514 households in Fisher County, 1,030 (68.0%) are family households, while 484 (32.0%) are nonfamily households. The most numerous type of family households are 2-person households, comprising 529, and the most common type of nonfamily households are 1-person households, comprising 441.
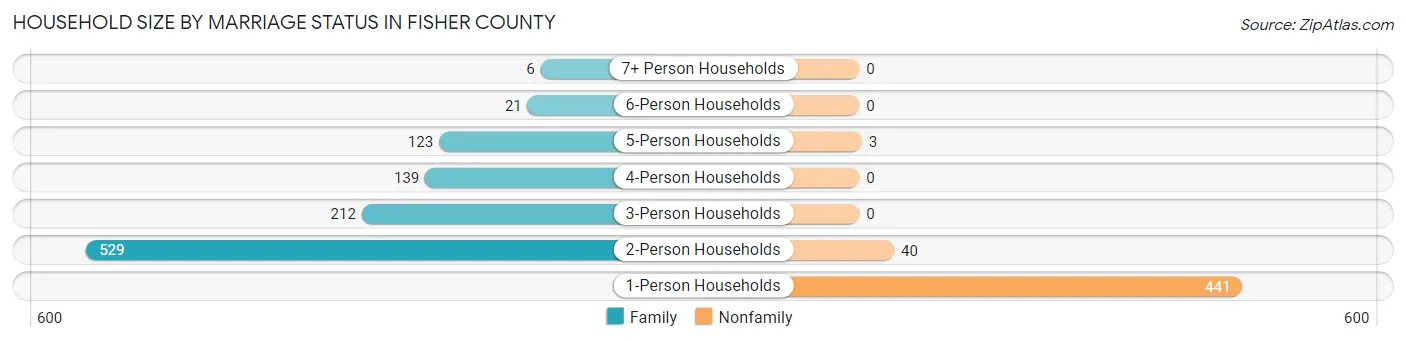
| Household Size | Family Households | Nonfamily Households |
| 1-Person Households | - | 441 (29.1%) |
| 2-Person Households | 529 (34.9%) | 40 (2.6%) |
| 3-Person Households | 212 (14.0%) | 0 (0.0%) |
| 4-Person Households | 139 (9.2%) | 0 (0.0%) |
| 5-Person Households | 123 (8.1%) | 3 (0.2%) |
| 6-Person Households | 21 (1.4%) | 0 (0.0%) |
| 7+ Person Households | 6 (0.4%) | 0 (0.0%) |
| Total | 1,030 (68.0%) | 484 (32.0%) |
Female Fertility in Fisher County
Fertility by Age in Fisher County
Average fertility rate in Fisher County is 42.0 births per 1,000 women. Women in the age bracket of 20 to 34 years have the highest fertility rate with 88.0 births per 1,000 women. Women in the age bracket of 20 to 34 years acount for 100.0% of all women with births.
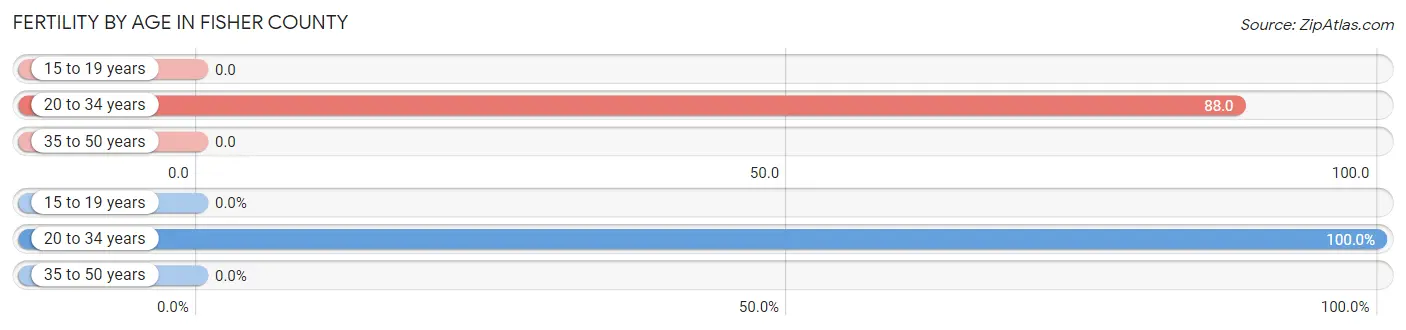
| Age Bracket | Women with Births | Births / 1,000 Women |
| 15 to 19 years | 0 (0.0%) | 0.0 |
| 20 to 34 years | 30 (100.0%) | 88.0 |
| 35 to 50 years | 0 (0.0%) | 0.0 |
| Total | 30 (100.0%) | 42.0 |
Fertility by Age by Marriage Status in Fisher County
70.0% of women with births (30) in Fisher County are married. The highest percentage of unmarried women with births falls into 20 to 34 years age bracket with 30.0% of them unmarried at the time of birth, while the lowest percentage of unmarried women with births belong to 20 to 34 years age bracket with 30.0% of them unmarried.
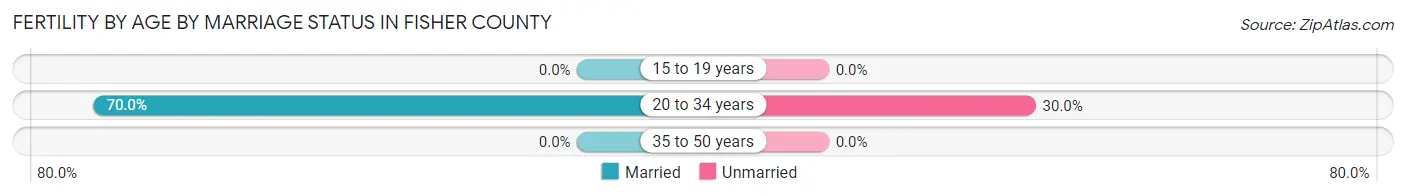
| Age Bracket | Married | Unmarried |
| 15 to 19 years | 0 (0.0%) | 0 (0.0%) |
| 20 to 34 years | 21 (70.0%) | 9 (30.0%) |
| 35 to 50 years | 0 (0.0%) | 0 (0.0%) |
| Total | 21 (70.0%) | 9 (30.0%) |
Fertility by Education in Fisher County
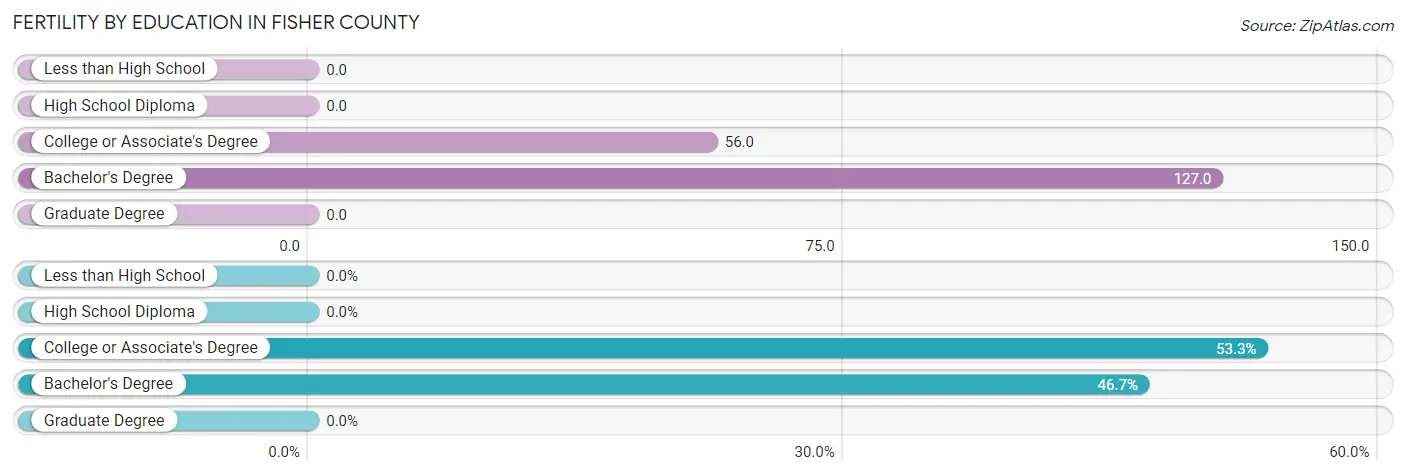
| Educational Attainment | Women with Births | Births / 1,000 Women |
| Less than High School | 0 (0.0%) | 0.0 |
| High School Diploma | 0 (0.0%) | 0.0 |
| College or Associate's Degree | 16 (53.3%) | 56.0 |
| Bachelor's Degree | 14 (46.7%) | 127.0 |
| Graduate Degree | 0 (0.0%) | 0.0 |
| Total | 30 (100.0%) | 42.0 |
Fertility by Education by Marriage Status in Fisher County
30.0% of women with births in Fisher County are unmarried. Women with the educational attainment of bachelor's degree are most likely to be married with 100.0% of them married at childbirth, while women with the educational attainment of college or associate's degree are least likely to be married with 56.2% of them unmarried at childbirth.
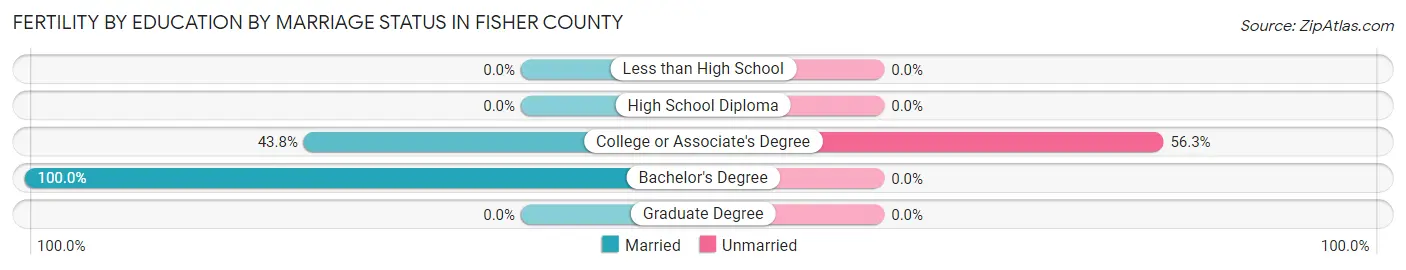
| Educational Attainment | Married | Unmarried |
| Less than High School | 0 (0.0%) | 0 (0.0%) |
| High School Diploma | 0 (0.0%) | 0 (0.0%) |
| College or Associate's Degree | 7 (43.8%) | 9 (56.2%) |
| Bachelor's Degree | 14 (100.0%) | 0 (0.0%) |
| Graduate Degree | 0 (0.0%) | 0 (0.0%) |
| Total | 21 (70.0%) | 9 (30.0%) |
Employment Characteristics in Fisher County
Employment by Class of Employer in Fisher County
Among the 1,793 employed individuals in Fisher County, private company employees (993 | 55.4%), local government employees (288 | 16.1%), and self-employed (not incorporated) (207 | 11.5%) make up the most common classes of employment.
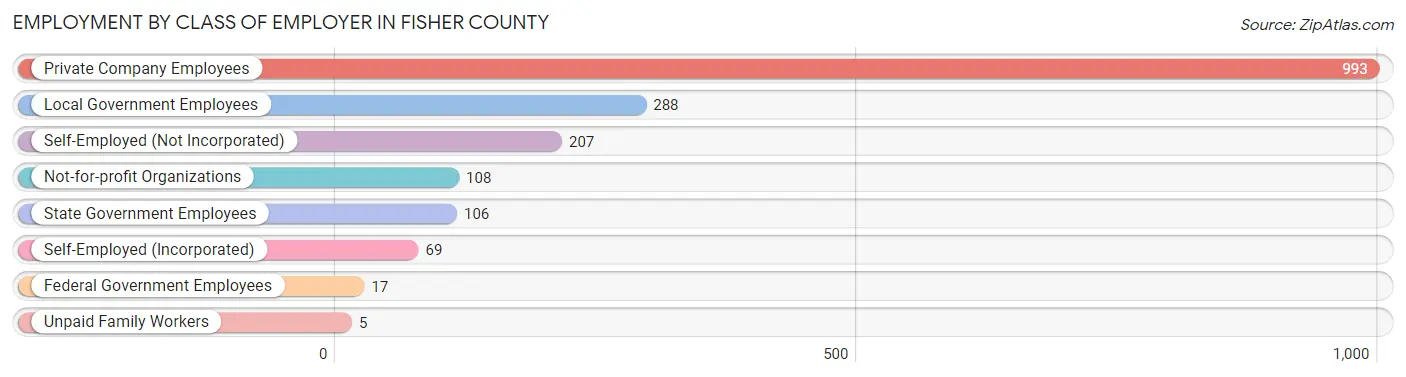
| Employer Class | # Employees | % Employees |
| Private Company Employees | 993 | 55.4% |
| Self-Employed (Incorporated) | 69 | 3.8% |
| Self-Employed (Not Incorporated) | 207 | 11.5% |
| Not-for-profit Organizations | 108 | 6.0% |
| Local Government Employees | 288 | 16.1% |
| State Government Employees | 106 | 5.9% |
| Federal Government Employees | 17 | 0.9% |
| Unpaid Family Workers | 5 | 0.3% |
| Total | 1,793 | 100.0% |
Employment Status by Age in Fisher County
According to the labor force statistics for Fisher County, out of the total population over 16 years of age (2,966), 63.0% or 1,869 individuals are in the labor force, with 2.9% or 54 of them unemployed. The age group with the highest labor force participation rate is 25 to 29 years, with 92.9% or 273 individuals in the labor force. Within the labor force, the 16 to 19 years age range has the highest percentage of unemployed individuals, with 19.5% or 8 of them being unemployed.
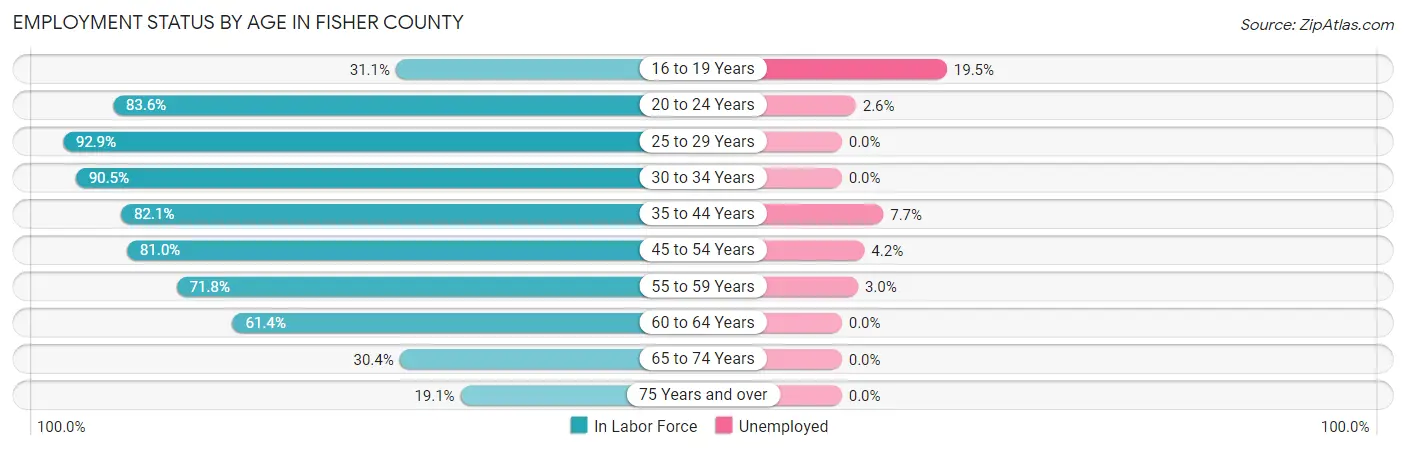
| Age Bracket | In Labor Force | Unemployed |
| 16 to 19 Years | 41 (31.1%) | 8 (19.5%) |
| 20 to 24 Years | 189 (83.6%) | 5 (2.6%) |
| 25 to 29 Years | 273 (92.9%) | 0 (0.0%) |
| 30 to 34 Years | 220 (90.5%) | 0 (0.0%) |
| 35 to 44 Years | 271 (82.1%) | 21 (7.7%) |
| 45 to 54 Years | 359 (81.0%) | 15 (4.2%) |
| 55 to 59 Years | 168 (71.8%) | 5 (3.0%) |
| 60 to 64 Years | 132 (61.4%) | 0 (0.0%) |
| 65 to 74 Years | 148 (30.4%) | 0 (0.0%) |
| 75 Years and over | 69 (19.1%) | 0 (0.0%) |
| Total | 1,869 (63.0%) | 54 (2.9%) |
Employment Status by Educational Attainment in Fisher County
According to labor force statistics for Fisher County, 80.9% of individuals (1,423) out of the total population between 25 and 64 years of age (1,759) are in the labor force, with 2.9% or 41 of them being unemployed. The group with the highest labor force participation rate are those with the educational attainment of bachelor's degree or higher, with 91.9% or 329 individuals in the labor force. Within the labor force, individuals with high school diploma education have the highest percentage of unemployment, with 3.9% or 19 of them being unemployed.
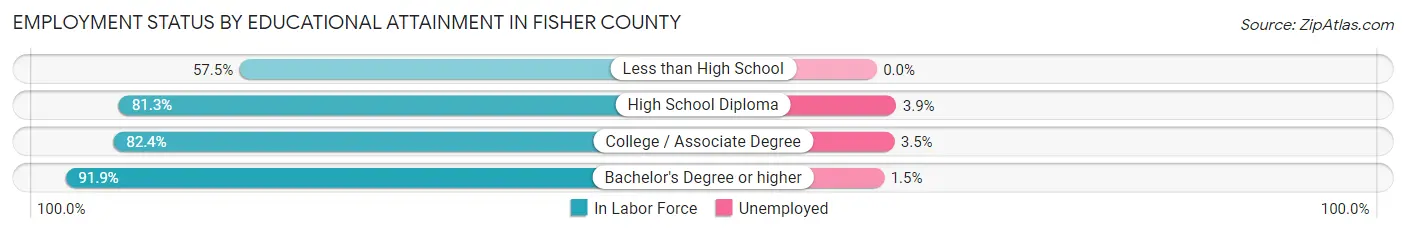
| Educational Attainment | In Labor Force | Unemployed |
| Less than High School | 123 (57.5%) | 0 (0.0%) |
| High School Diploma | 490 (81.3%) | 24 (3.9%) |
| College / Associate Degree | 481 (82.4%) | 20 (3.5%) |
| Bachelor's Degree or higher | 329 (91.9%) | 5 (1.5%) |
| Total | 1,423 (80.9%) | 51 (2.9%) |
Employment Occupations by Sex in Fisher County
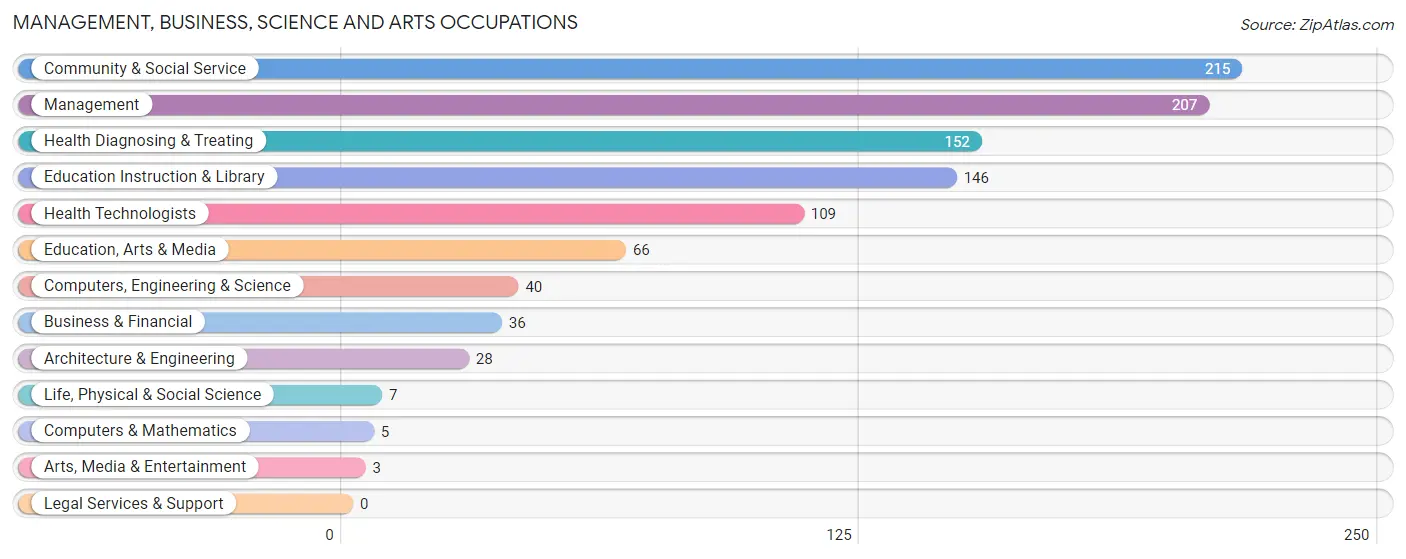
Management, Business, Science and Arts Occupations
The most common Management, Business, Science and Arts occupations in Fisher County are Community & Social Service (215 | 11.8%), Management (207 | 11.4%), Health Diagnosing & Treating (152 | 8.4%), Education Instruction & Library (146 | 8.0%), and Health Technologists (109 | 6.0%).
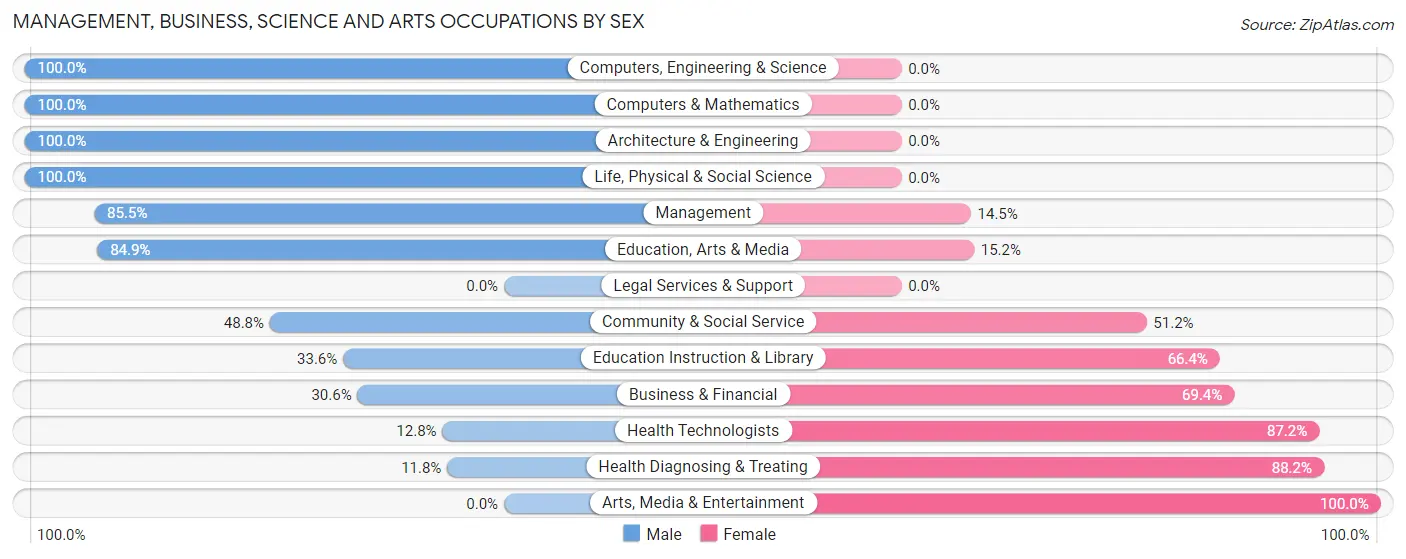
Management, Business, Science and Arts Occupations by Sex
Within the Management, Business, Science and Arts occupations in Fisher County, the most male-oriented occupations are Computers, Engineering & Science (100.0%), Computers & Mathematics (100.0%), and Architecture & Engineering (100.0%), while the most female-oriented occupations are Arts, Media & Entertainment (100.0%), Health Diagnosing & Treating (88.2%), and Health Technologists (87.2%).
| Occupation | Male | Female |
| Management | 177 (85.5%) | 30 (14.5%) |
| Business & Financial | 11 (30.6%) | 25 (69.4%) |
| Computers, Engineering & Science | 40 (100.0%) | 0 (0.0%) |
| Computers & Mathematics | 5 (100.0%) | 0 (0.0%) |
| Architecture & Engineering | 28 (100.0%) | 0 (0.0%) |
| Life, Physical & Social Science | 7 (100.0%) | 0 (0.0%) |
| Community & Social Service | 105 (48.8%) | 110 (51.2%) |
| Education, Arts & Media | 56 (84.9%) | 10 (15.1%) |
| Legal Services & Support | 0 (0.0%) | 0 (0.0%) |
| Education Instruction & Library | 49 (33.6%) | 97 (66.4%) |
| Arts, Media & Entertainment | 0 (0.0%) | 3 (100.0%) |
| Health Diagnosing & Treating | 18 (11.8%) | 134 (88.2%) |
| Health Technologists | 14 (12.8%) | 95 (87.2%) |
| Total (Category) | 351 (54.0%) | 299 (46.0%) |
| Total (Overall) | 1,073 (59.1%) | 743 (40.9%) |
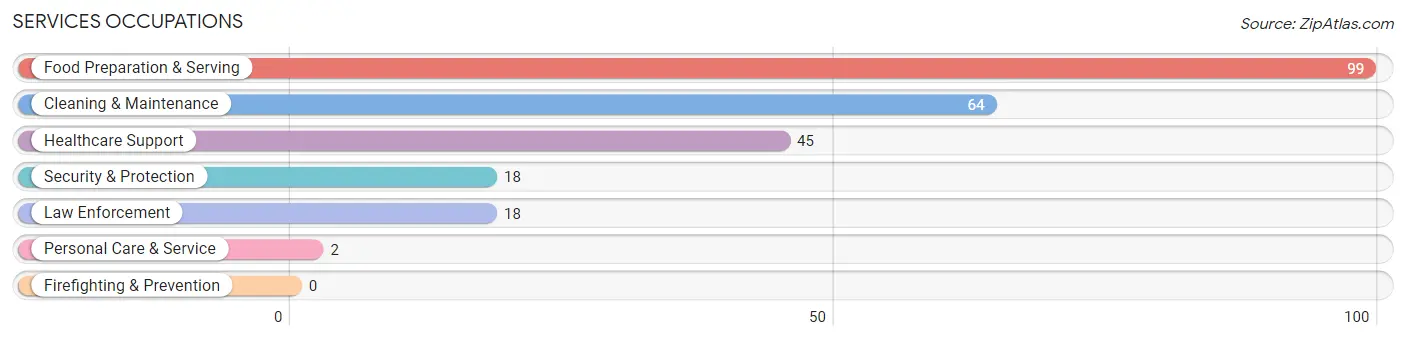
Services Occupations
The most common Services occupations in Fisher County are Food Preparation & Serving (99 | 5.4%), Cleaning & Maintenance (64 | 3.5%), Healthcare Support (45 | 2.5%), Security & Protection (18 | 1.0%), and Law Enforcement (18 | 1.0%).
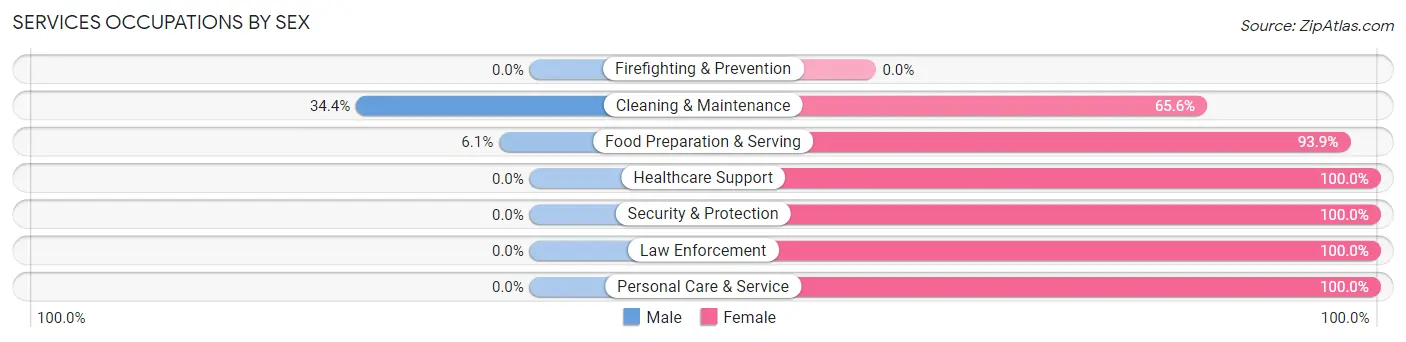
Services Occupations by Sex
Within the Services occupations in Fisher County, the most male-oriented occupations are Cleaning & Maintenance (34.4%), and Food Preparation & Serving (6.1%), while the most female-oriented occupations are Healthcare Support (100.0%), Security & Protection (100.0%), and Law Enforcement (100.0%).
| Occupation | Male | Female |
| Healthcare Support | 0 (0.0%) | 45 (100.0%) |
| Security & Protection | 0 (0.0%) | 18 (100.0%) |
| Firefighting & Prevention | 0 (0.0%) | 0 (0.0%) |
| Law Enforcement | 0 (0.0%) | 18 (100.0%) |
| Food Preparation & Serving | 6 (6.1%) | 93 (93.9%) |
| Cleaning & Maintenance | 22 (34.4%) | 42 (65.6%) |
| Personal Care & Service | 0 (0.0%) | 2 (100.0%) |
| Total (Category) | 28 (12.3%) | 200 (87.7%) |
| Total (Overall) | 1,073 (59.1%) | 743 (40.9%) |
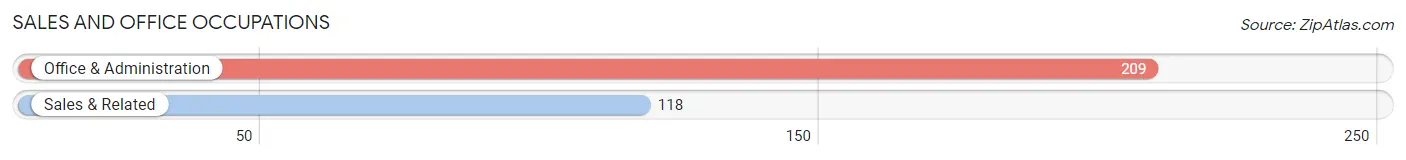
Sales and Office Occupations
The most common Sales and Office occupations in Fisher County are Office & Administration (209 | 11.5%), and Sales & Related (118 | 6.5%).
Sales and Office Occupations by Sex
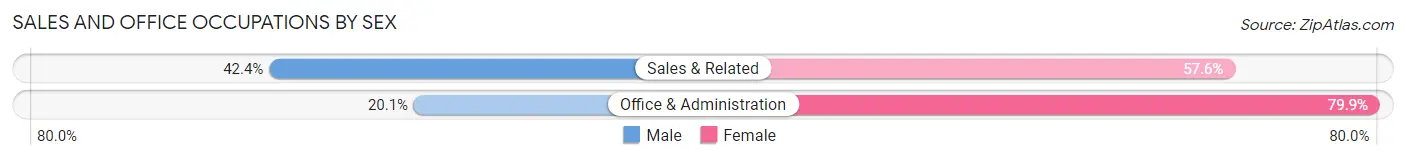
| Occupation | Male | Female |
| Sales & Related | 50 (42.4%) | 68 (57.6%) |
| Office & Administration | 42 (20.1%) | 167 (79.9%) |
| Total (Category) | 92 (28.1%) | 235 (71.9%) |
| Total (Overall) | 1,073 (59.1%) | 743 (40.9%) |
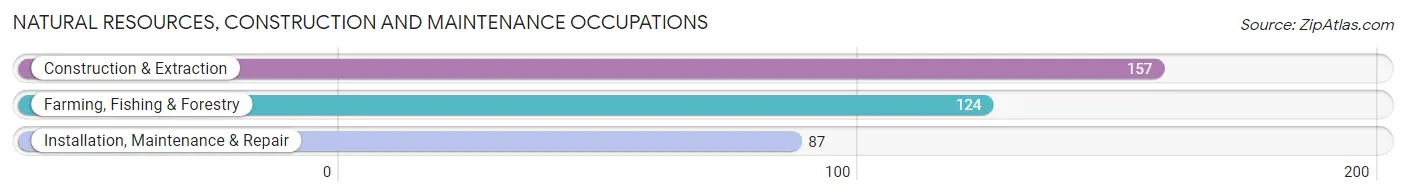
Natural Resources, Construction and Maintenance Occupations
The most common Natural Resources, Construction and Maintenance occupations in Fisher County are Construction & Extraction (157 | 8.6%), Farming, Fishing & Forestry (124 | 6.8%), and Installation, Maintenance & Repair (87 | 4.8%).
Natural Resources, Construction and Maintenance Occupations by Sex
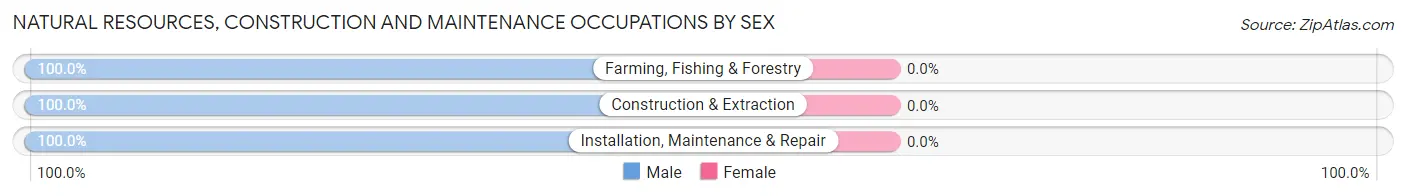
| Occupation | Male | Female |
| Farming, Fishing & Forestry | 124 (100.0%) | 0 (0.0%) |
| Construction & Extraction | 157 (100.0%) | 0 (0.0%) |
| Installation, Maintenance & Repair | 87 (100.0%) | 0 (0.0%) |
| Total (Category) | 368 (100.0%) | 0 (0.0%) |
| Total (Overall) | 1,073 (59.1%) | 743 (40.9%) |
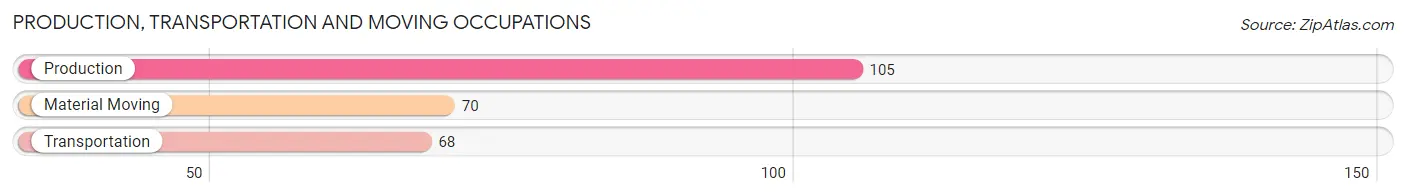
Production, Transportation and Moving Occupations
The most common Production, Transportation and Moving occupations in Fisher County are Production (105 | 5.8%), Material Moving (70 | 3.8%), and Transportation (68 | 3.7%).
Production, Transportation and Moving Occupations by Sex
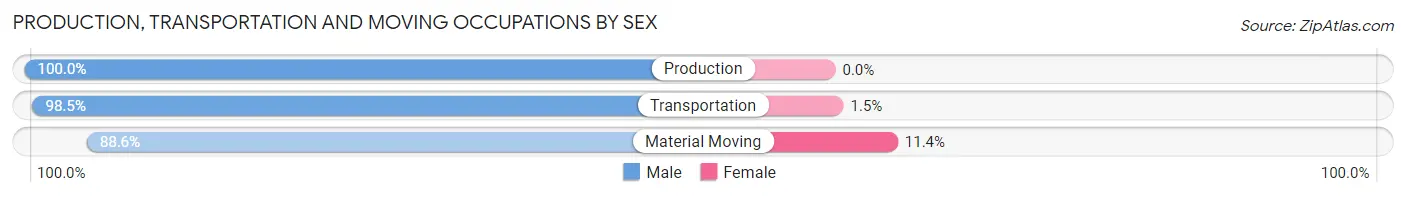
| Occupation | Male | Female |
| Production | 105 (100.0%) | 0 (0.0%) |
| Transportation | 67 (98.5%) | 1 (1.5%) |
| Material Moving | 62 (88.6%) | 8 (11.4%) |
| Total (Category) | 234 (96.3%) | 9 (3.7%) |
| Total (Overall) | 1,073 (59.1%) | 743 (40.9%) |
Employment Industries by Sex in Fisher County
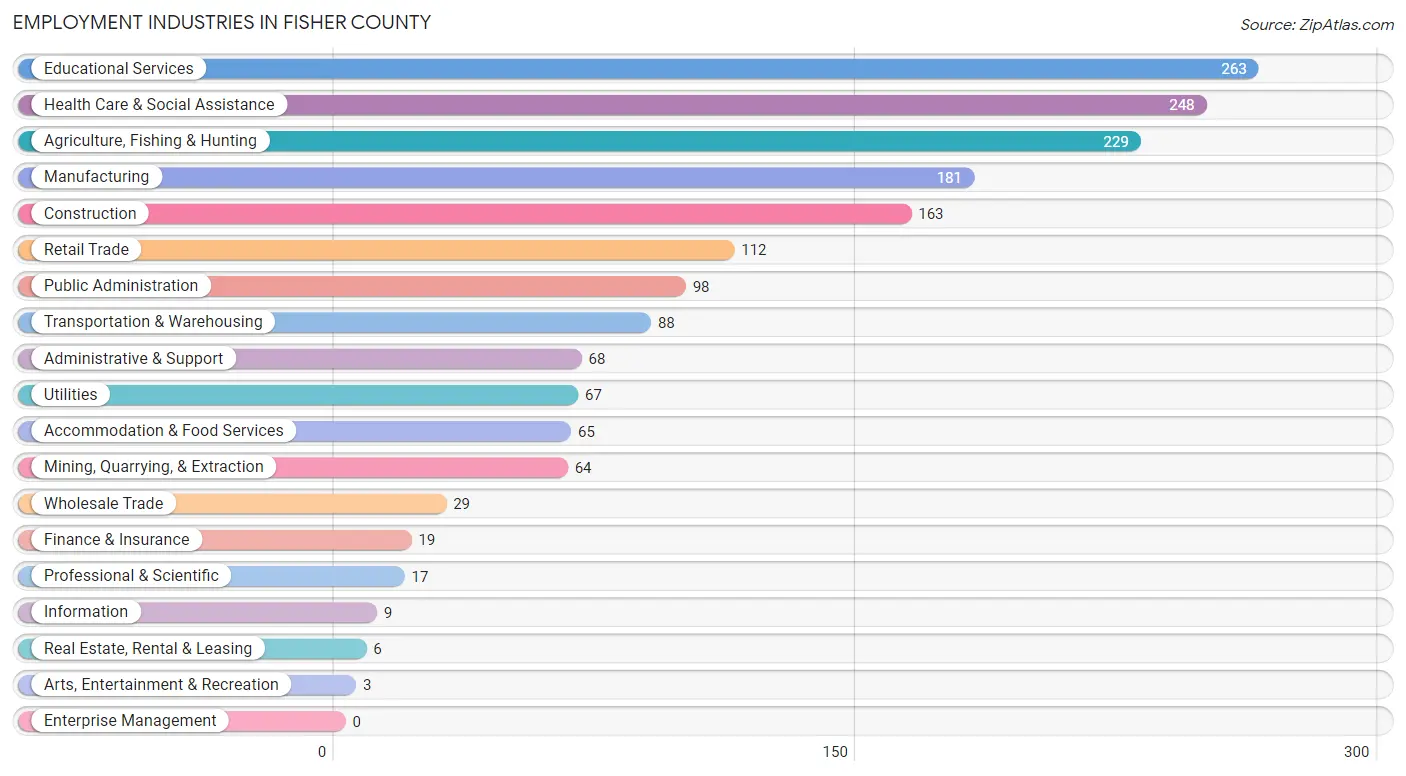
Employment Industries in Fisher County
The major employment industries in Fisher County include Educational Services (263 | 14.5%), Health Care & Social Assistance (248 | 13.7%), Agriculture, Fishing & Hunting (229 | 12.6%), Manufacturing (181 | 10.0%), and Construction (163 | 9.0%).
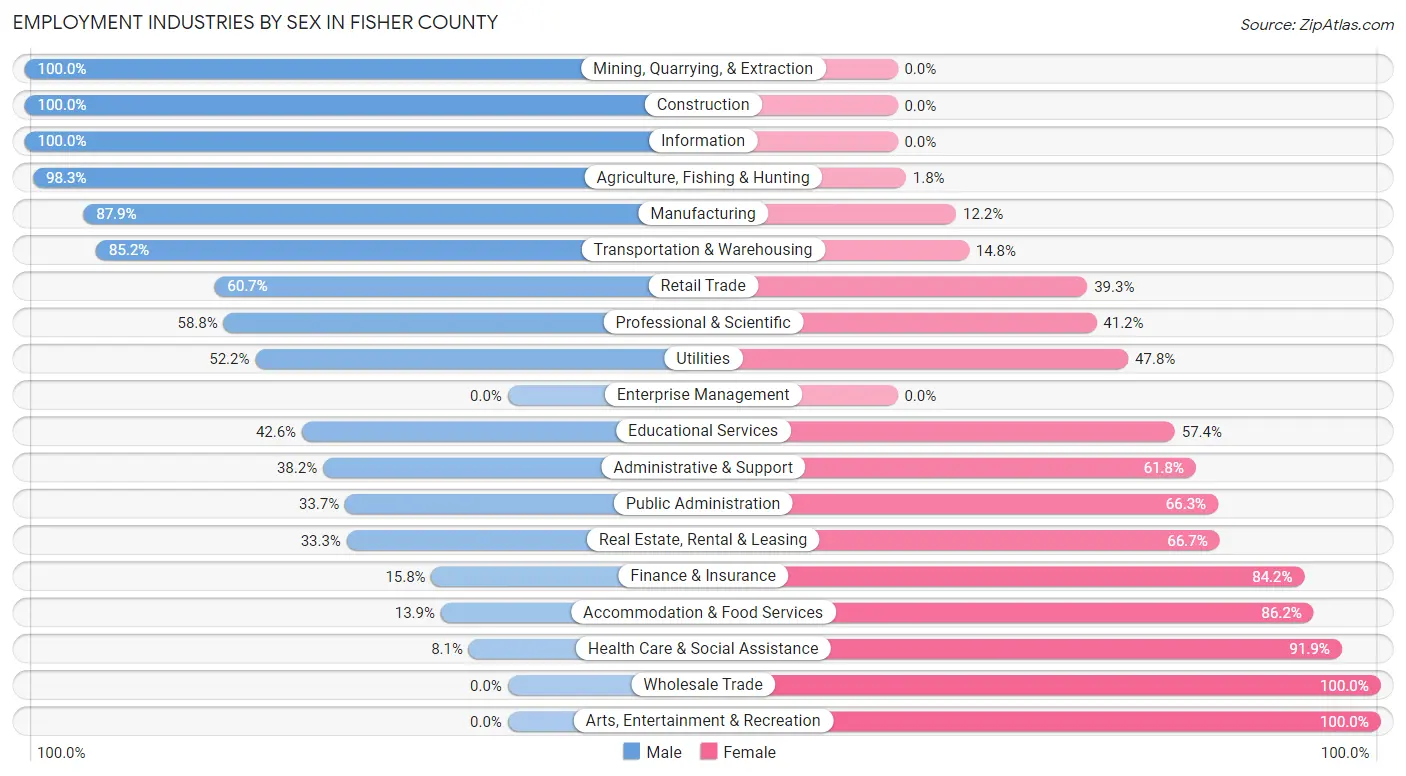
Employment Industries by Sex in Fisher County
The Fisher County industries that see more men than women are Mining, Quarrying, & Extraction (100.0%), Construction (100.0%), and Information (100.0%), whereas the industries that tend to have a higher number of women are Wholesale Trade (100.0%), Arts, Entertainment & Recreation (100.0%), and Health Care & Social Assistance (91.9%).
| Industry | Male | Female |
| Agriculture, Fishing & Hunting | 225 (98.3%) | 4 (1.8%) |
| Mining, Quarrying, & Extraction | 64 (100.0%) | 0 (0.0%) |
| Construction | 163 (100.0%) | 0 (0.0%) |
| Manufacturing | 159 (87.8%) | 22 (12.1%) |
| Wholesale Trade | 0 (0.0%) | 29 (100.0%) |
| Retail Trade | 68 (60.7%) | 44 (39.3%) |
| Transportation & Warehousing | 75 (85.2%) | 13 (14.8%) |
| Utilities | 35 (52.2%) | 32 (47.8%) |
| Information | 9 (100.0%) | 0 (0.0%) |
| Finance & Insurance | 3 (15.8%) | 16 (84.2%) |
| Real Estate, Rental & Leasing | 2 (33.3%) | 4 (66.7%) |
| Professional & Scientific | 10 (58.8%) | 7 (41.2%) |
| Enterprise Management | 0 (0.0%) | 0 (0.0%) |
| Administrative & Support | 26 (38.2%) | 42 (61.8%) |
| Educational Services | 112 (42.6%) | 151 (57.4%) |
| Health Care & Social Assistance | 20 (8.1%) | 228 (91.9%) |
| Arts, Entertainment & Recreation | 0 (0.0%) | 3 (100.0%) |
| Accommodation & Food Services | 9 (13.9%) | 56 (86.2%) |
| Public Administration | 33 (33.7%) | 65 (66.3%) |
| Total | 1,073 (59.1%) | 743 (40.9%) |
Education in Fisher County
School Enrollment in Fisher County
The most common levels of schooling among the 719 students in Fisher County are elementary school (184 | 25.6%), high school (153 | 21.3%), and middle school (145 | 20.2%).
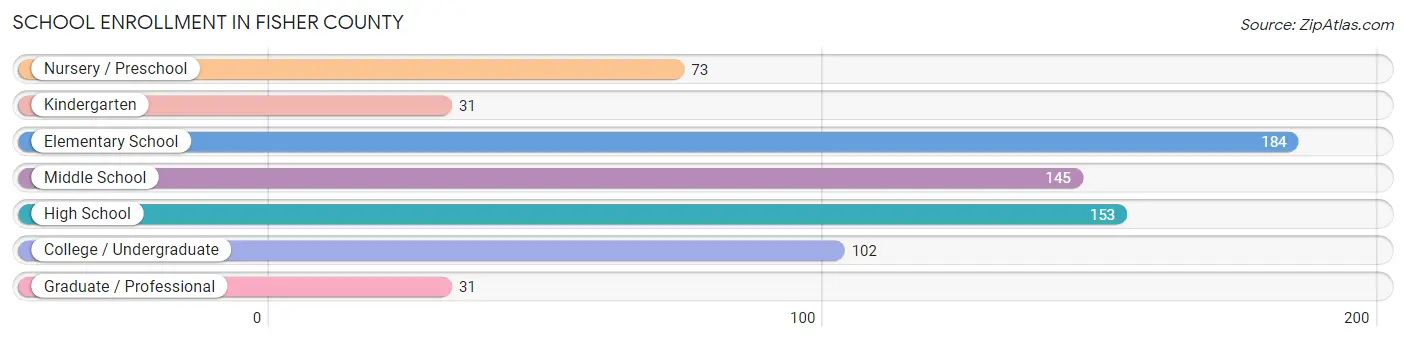
| School Level | # Students | % Students |
| Nursery / Preschool | 73 | 10.2% |
| Kindergarten | 31 | 4.3% |
| Elementary School | 184 | 25.6% |
| Middle School | 145 | 20.2% |
| High School | 153 | 21.3% |
| College / Undergraduate | 102 | 14.2% |
| Graduate / Professional | 31 | 4.3% |
| Total | 719 | 100.0% |
School Enrollment by Age by Funding Source in Fisher County
Out of a total of 719 students who are enrolled in schools in Fisher County, 69 (9.6%) attend a private institution, while the remaining 650 (90.4%) are enrolled in public schools. The age group of 25 to 34 year olds has the highest likelihood of being enrolled in private schools, with 15 (39.5% in the age bracket) enrolled. Conversely, the age group of 5 to 9 year old has the lowest likelihood of being enrolled in a private school, with 208 (100.0% in the age bracket) attending a public institution.
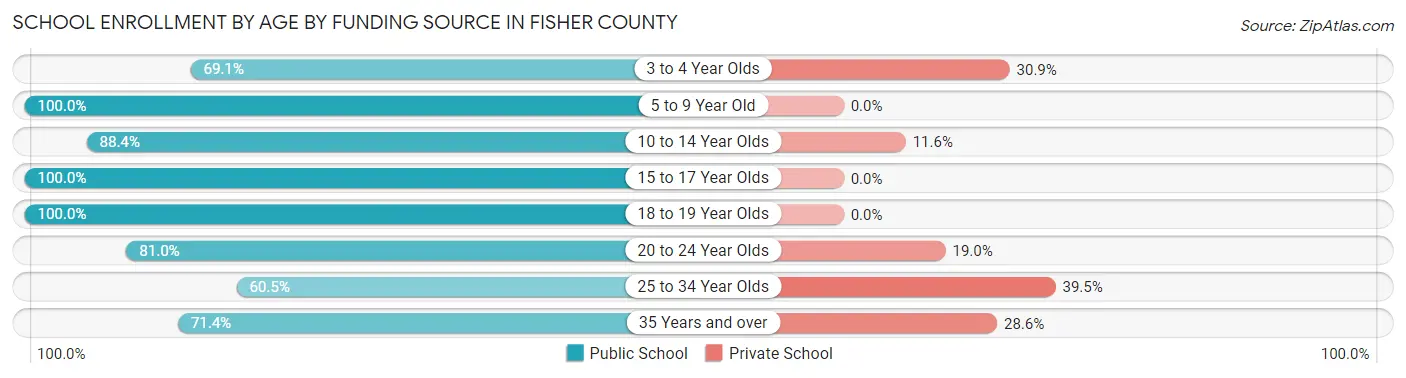
| Age Bracket | Public School | Private School |
| 3 to 4 Year Olds | 38 (69.1%) | 17 (30.9%) |
| 5 to 9 Year Old | 208 (100.0%) | 0 (0.0%) |
| 10 to 14 Year Olds | 153 (88.4%) | 20 (11.6%) |
| 15 to 17 Year Olds | 105 (100.0%) | 0 (0.0%) |
| 18 to 19 Year Olds | 61 (100.0%) | 0 (0.0%) |
| 20 to 24 Year Olds | 47 (81.0%) | 11 (19.0%) |
| 25 to 34 Year Olds | 23 (60.5%) | 15 (39.5%) |
| 35 Years and over | 15 (71.4%) | 6 (28.6%) |
| Total | 650 (90.4%) | 69 (9.6%) |
Educational Attainment by Field of Study in Fisher County
Education (146 | 25.7%), business (70 | 12.3%), science & technology (62 | 10.9%), bio, nature & agricultural (58 | 10.2%), and liberal arts & history (51 | 9.0%) are the most common fields of study among 568 individuals in Fisher County who have obtained a bachelor's degree or higher.
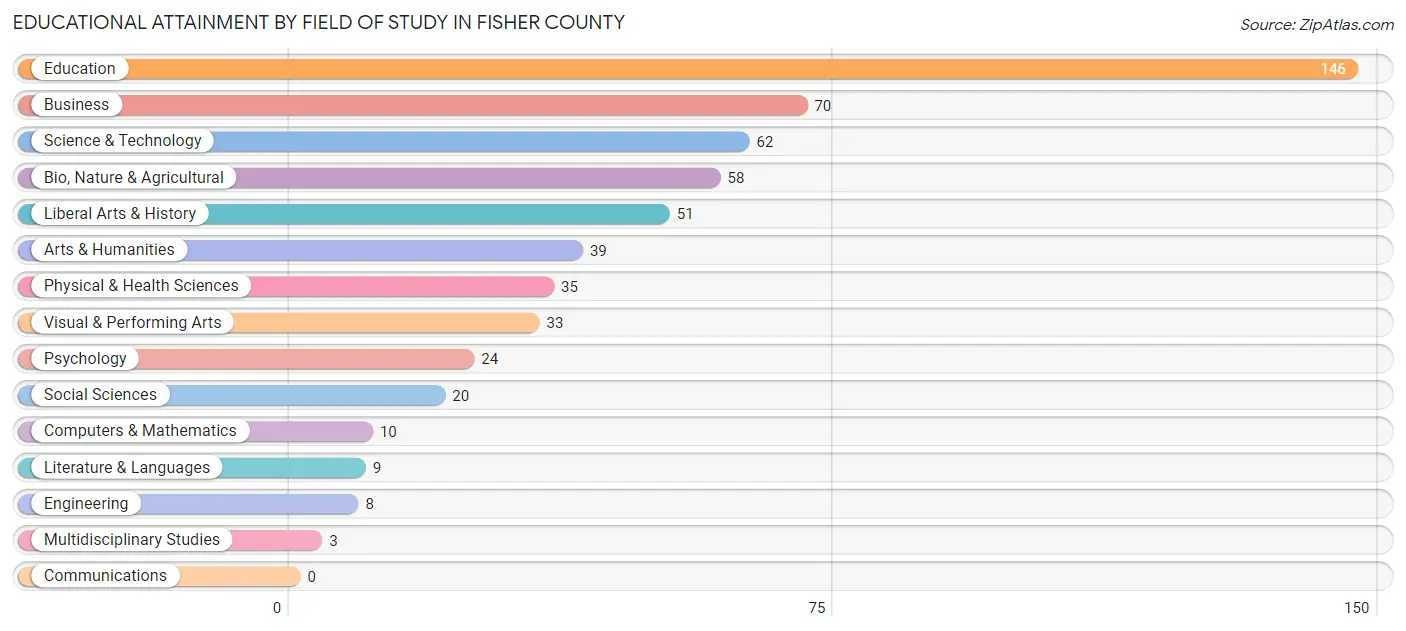
| Field of Study | # Graduates | % Graduates |
| Computers & Mathematics | 10 | 1.8% |
| Bio, Nature & Agricultural | 58 | 10.2% |
| Physical & Health Sciences | 35 | 6.2% |
| Psychology | 24 | 4.2% |
| Social Sciences | 20 | 3.5% |
| Engineering | 8 | 1.4% |
| Multidisciplinary Studies | 3 | 0.5% |
| Science & Technology | 62 | 10.9% |
| Business | 70 | 12.3% |
| Education | 146 | 25.7% |
| Literature & Languages | 9 | 1.6% |
| Liberal Arts & History | 51 | 9.0% |
| Visual & Performing Arts | 33 | 5.8% |
| Communications | 0 | 0.0% |
| Arts & Humanities | 39 | 6.9% |
| Total | 568 | 100.0% |
Transportation & Commute in Fisher County
Vehicle Availability by Sex in Fisher County
The most prevalent vehicle ownership categories in Fisher County are males with 2 vehicles (451, accounting for 42.4%) and females with 2 vehicles (271, making up 62.1%).
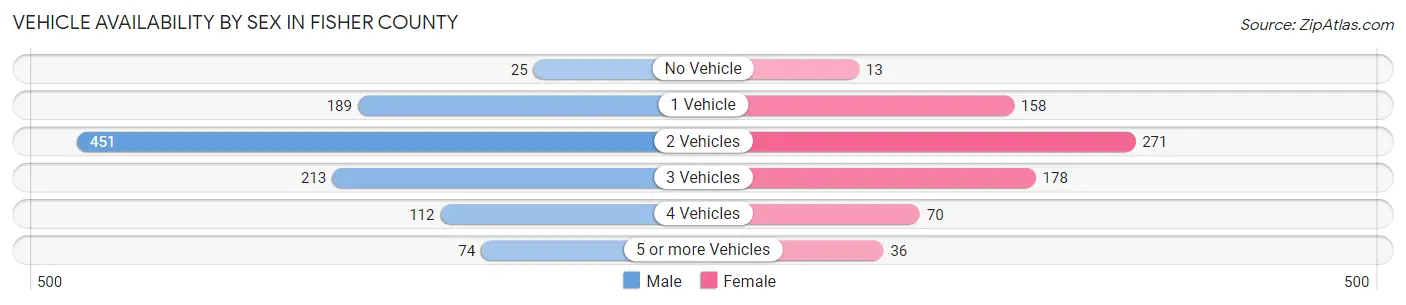
| Vehicles Available | Male | Female |
| No Vehicle | 25 (2.4%) | 13 (1.8%) |
| 1 Vehicle | 189 (17.8%) | 158 (21.8%) |
| 2 Vehicles | 451 (42.4%) | 271 (37.3%) |
| 3 Vehicles | 213 (20.0%) | 178 (24.5%) |
| 4 Vehicles | 112 (10.5%) | 70 (9.6%) |
| 5 or more Vehicles | 74 (7.0%) | 36 (5.0%) |
| Total | 1,064 (100.0%) | 726 (100.0%) |
Commute Time in Fisher County
The most frequently occuring commute durations in Fisher County are 5 to 9 minutes (384 commuters, 22.1%), 30 to 34 minutes (253 commuters, 14.5%), and 10 to 14 minutes (243 commuters, 14.0%).
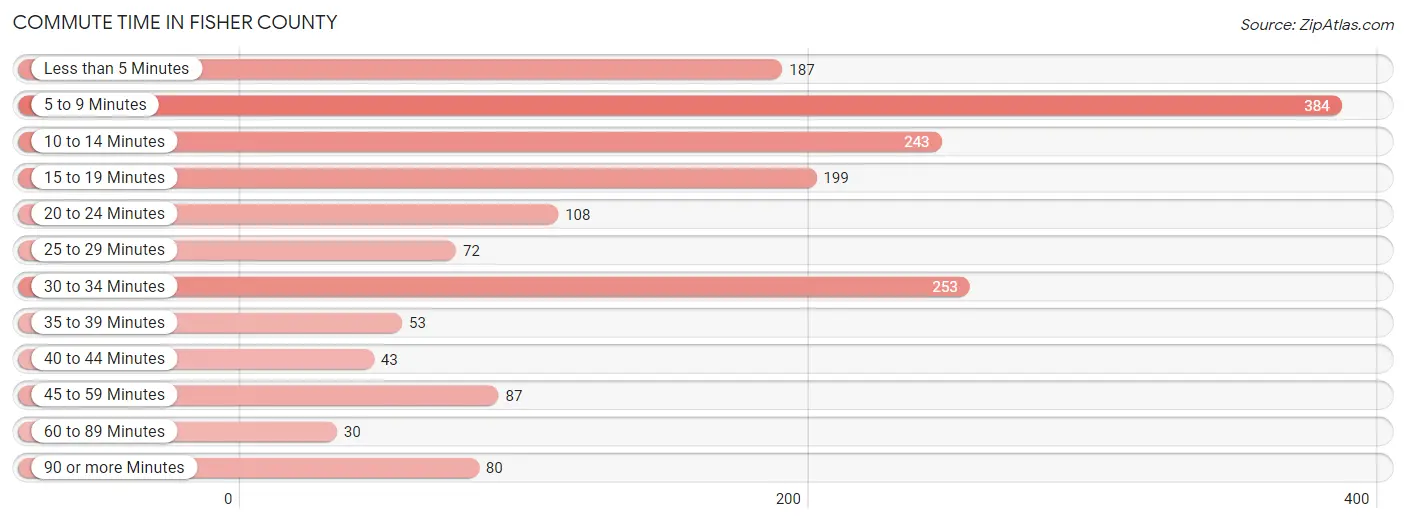
| Commute Time | # Commuters | % Commuters |
| Less than 5 Minutes | 187 | 10.7% |
| 5 to 9 Minutes | 384 | 22.1% |
| 10 to 14 Minutes | 243 | 14.0% |
| 15 to 19 Minutes | 199 | 11.4% |
| 20 to 24 Minutes | 108 | 6.2% |
| 25 to 29 Minutes | 72 | 4.1% |
| 30 to 34 Minutes | 253 | 14.5% |
| 35 to 39 Minutes | 53 | 3.0% |
| 40 to 44 Minutes | 43 | 2.5% |
| 45 to 59 Minutes | 87 | 5.0% |
| 60 to 89 Minutes | 30 | 1.7% |
| 90 or more Minutes | 80 | 4.6% |
Commute Time by Sex in Fisher County
The most common commute times in Fisher County are 5 to 9 minutes (250 commuters, 24.3%) for males and 10 to 14 minutes (136 commuters, 19.2%) for females.
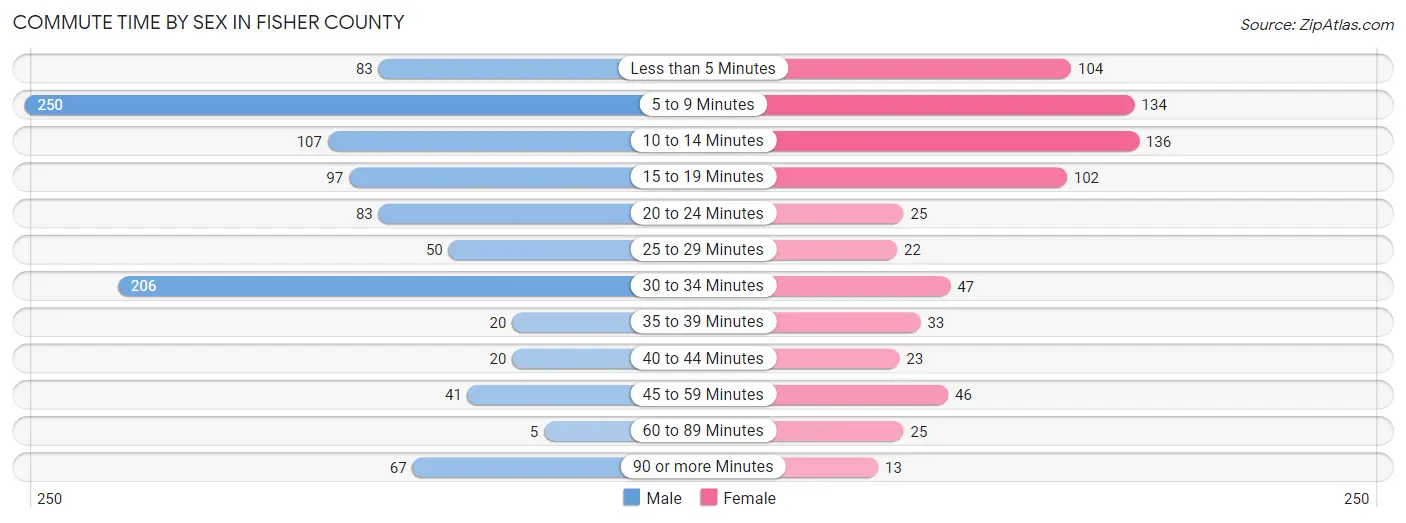
| Commute Time | Male | Female |
| Less than 5 Minutes | 83 (8.1%) | 104 (14.6%) |
| 5 to 9 Minutes | 250 (24.3%) | 134 (18.9%) |
| 10 to 14 Minutes | 107 (10.4%) | 136 (19.2%) |
| 15 to 19 Minutes | 97 (9.4%) | 102 (14.4%) |
| 20 to 24 Minutes | 83 (8.1%) | 25 (3.5%) |
| 25 to 29 Minutes | 50 (4.9%) | 22 (3.1%) |
| 30 to 34 Minutes | 206 (20.0%) | 47 (6.6%) |
| 35 to 39 Minutes | 20 (1.9%) | 33 (4.6%) |
| 40 to 44 Minutes | 20 (1.9%) | 23 (3.2%) |
| 45 to 59 Minutes | 41 (4.0%) | 46 (6.5%) |
| 60 to 89 Minutes | 5 (0.5%) | 25 (3.5%) |
| 90 or more Minutes | 67 (6.5%) | 13 (1.8%) |
Time of Departure to Work by Sex in Fisher County
The most frequent times of departure to work in Fisher County are 7:00 AM to 7:29 AM (278, 27.0%) for males and 7:00 AM to 7:29 AM (157, 22.1%) for females.
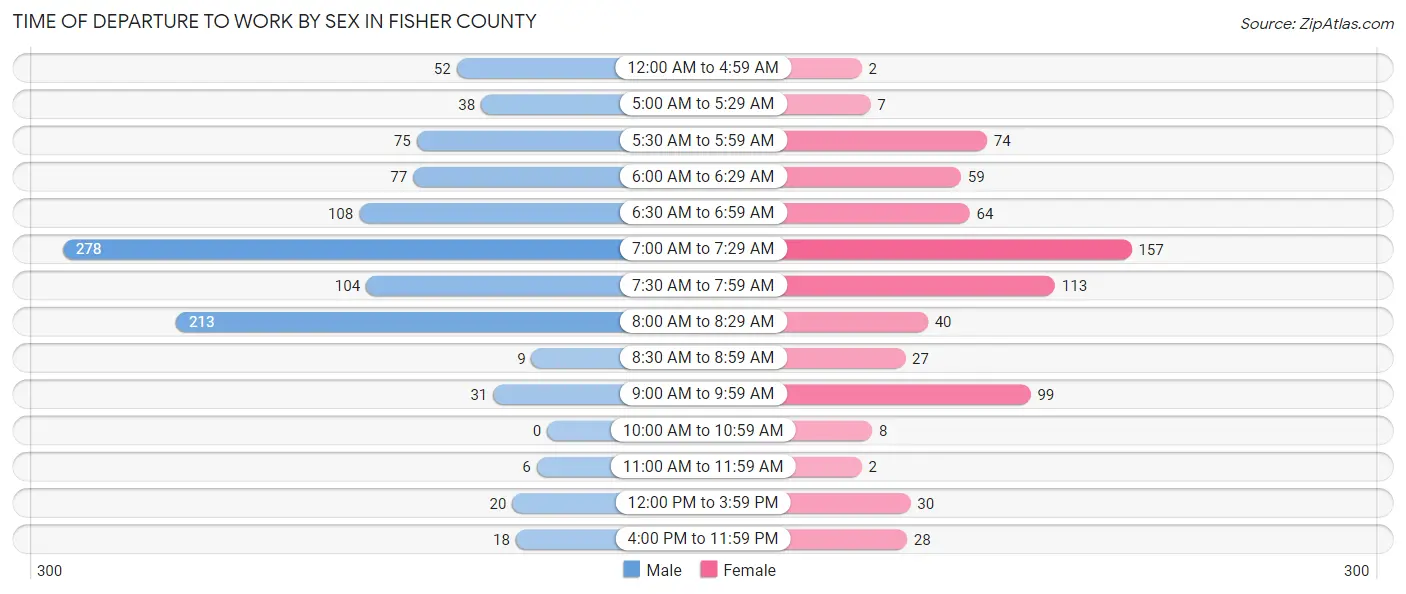
| Time of Departure | Male | Female |
| 12:00 AM to 4:59 AM | 52 (5.1%) | 2 (0.3%) |
| 5:00 AM to 5:29 AM | 38 (3.7%) | 7 (1.0%) |
| 5:30 AM to 5:59 AM | 75 (7.3%) | 74 (10.4%) |
| 6:00 AM to 6:29 AM | 77 (7.5%) | 59 (8.3%) |
| 6:30 AM to 6:59 AM | 108 (10.5%) | 64 (9.0%) |
| 7:00 AM to 7:29 AM | 278 (27.0%) | 157 (22.1%) |
| 7:30 AM to 7:59 AM | 104 (10.1%) | 113 (15.9%) |
| 8:00 AM to 8:29 AM | 213 (20.7%) | 40 (5.6%) |
| 8:30 AM to 8:59 AM | 9 (0.9%) | 27 (3.8%) |
| 9:00 AM to 9:59 AM | 31 (3.0%) | 99 (13.9%) |
| 10:00 AM to 10:59 AM | 0 (0.0%) | 8 (1.1%) |
| 11:00 AM to 11:59 AM | 6 (0.6%) | 2 (0.3%) |
| 12:00 PM to 3:59 PM | 20 (1.9%) | 30 (4.2%) |
| 4:00 PM to 11:59 PM | 18 (1.8%) | 28 (3.9%) |
| Total | 1,029 (100.0%) | 710 (100.0%) |
Housing Occupancy in Fisher County
Occupancy by Ownership in Fisher County
Of the total 1,514 dwellings in Fisher County, owner-occupied units account for 1,197 (79.1%), while renter-occupied units make up 317 (20.9%).
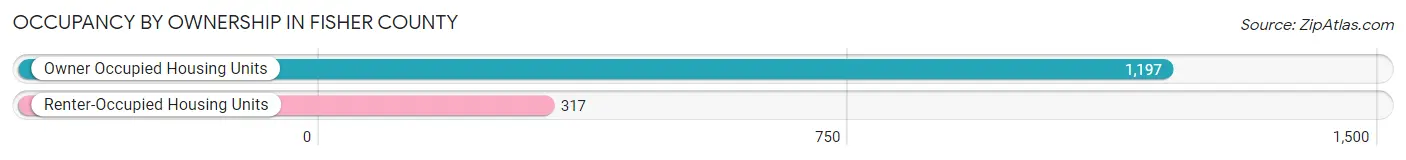
| Occupancy | # Housing Units | % Housing Units |
| Owner Occupied Housing Units | 1,197 | 79.1% |
| Renter-Occupied Housing Units | 317 | 20.9% |
| Total Occupied Housing Units | 1,514 | 100.0% |
Occupancy by Household Size in Fisher County
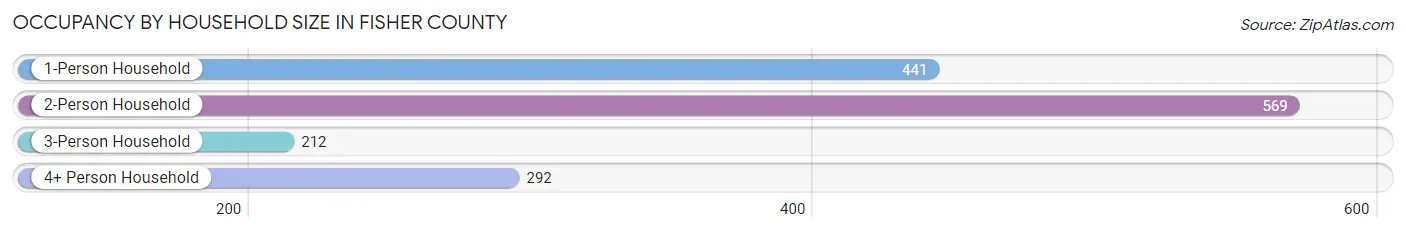
| Household Size | # Housing Units | % Housing Units |
| 1-Person Household | 441 | 29.1% |
| 2-Person Household | 569 | 37.6% |
| 3-Person Household | 212 | 14.0% |
| 4+ Person Household | 292 | 19.3% |
| Total Housing Units | 1,514 | 100.0% |
Occupancy by Ownership by Household Size in Fisher County
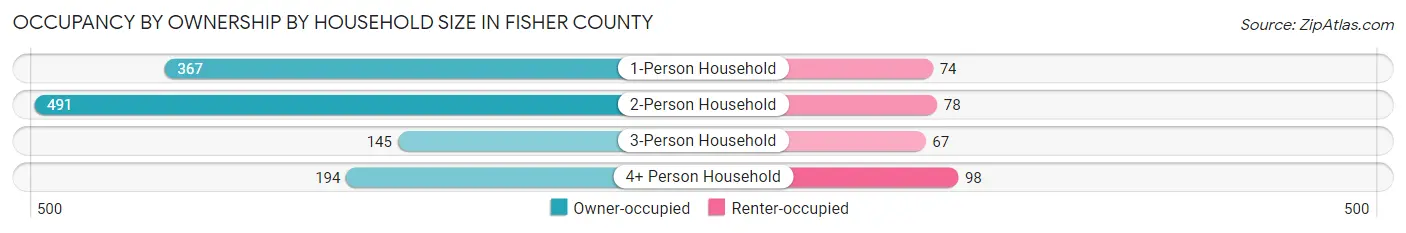
| Household Size | Owner-occupied | Renter-occupied |
| 1-Person Household | 367 (83.2%) | 74 (16.8%) |
| 2-Person Household | 491 (86.3%) | 78 (13.7%) |
| 3-Person Household | 145 (68.4%) | 67 (31.6%) |
| 4+ Person Household | 194 (66.4%) | 98 (33.6%) |
| Total Housing Units | 1,197 (79.1%) | 317 (20.9%) |
Occupancy by Educational Attainment in Fisher County
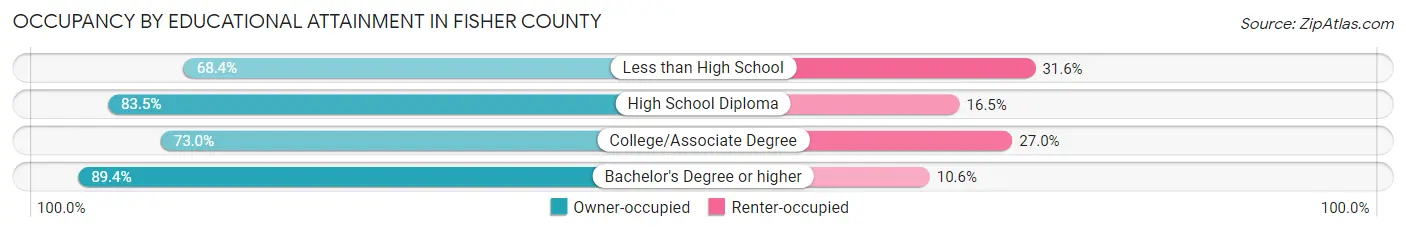
| Household Size | Owner-occupied | Renter-occupied |
| Less than High School | 130 (68.4%) | 60 (31.6%) |
| High School Diploma | 434 (83.5%) | 86 (16.5%) |
| College/Associate Degree | 381 (73.0%) | 141 (27.0%) |
| Bachelor's Degree or higher | 252 (89.4%) | 30 (10.6%) |
Occupancy by Age of Householder in Fisher County
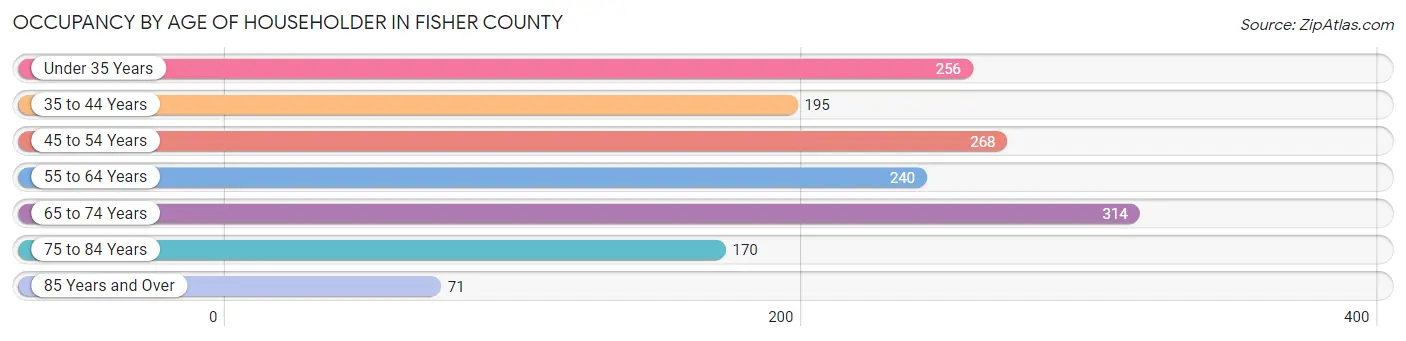
| Age Bracket | # Households | % Households |
| Under 35 Years | 256 | 16.9% |
| 35 to 44 Years | 195 | 12.9% |
| 45 to 54 Years | 268 | 17.7% |
| 55 to 64 Years | 240 | 15.9% |
| 65 to 74 Years | 314 | 20.7% |
| 75 to 84 Years | 170 | 11.2% |
| 85 Years and Over | 71 | 4.7% |
| Total | 1,514 | 100.0% |
Housing Finances in Fisher County
Median Income by Occupancy in Fisher County
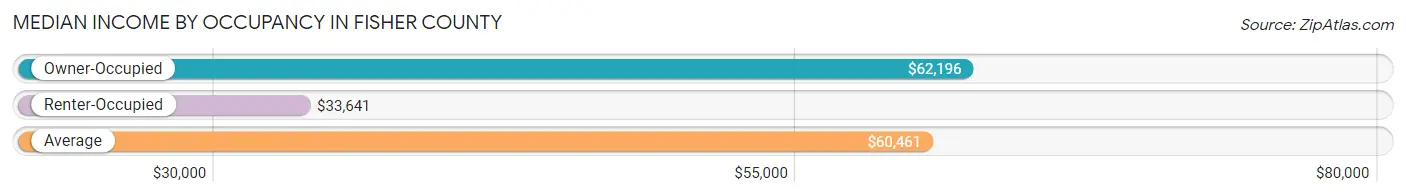
| Occupancy Type | # Households | Median Income |
| Owner-Occupied | 1,197 (79.1%) | $62,196 |
| Renter-Occupied | 317 (20.9%) | $33,641 |
| Average | 1,514 (100.0%) | $60,461 |
Occupancy by Householder Income Bracket in Fisher County
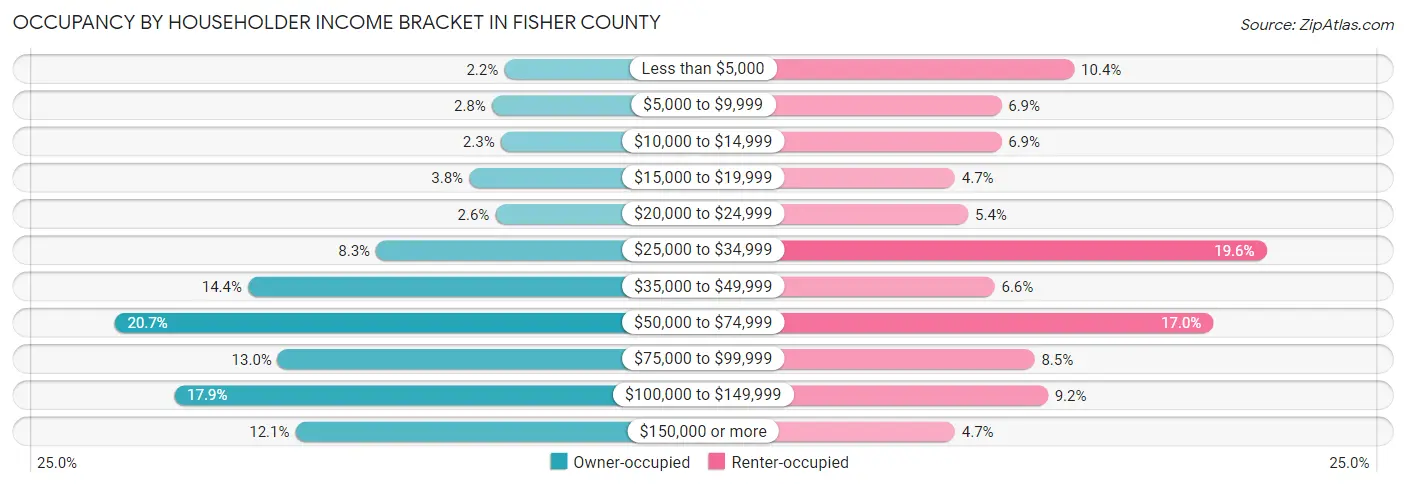
| Income Bracket | Owner-occupied | Renter-occupied |
| Less than $5,000 | 26 (2.2%) | 33 (10.4%) |
| $5,000 to $9,999 | 33 (2.8%) | 22 (6.9%) |
| $10,000 to $14,999 | 28 (2.3%) | 22 (6.9%) |
| $15,000 to $19,999 | 46 (3.8%) | 15 (4.7%) |
| $20,000 to $24,999 | 31 (2.6%) | 17 (5.4%) |
| $25,000 to $34,999 | 99 (8.3%) | 62 (19.6%) |
| $35,000 to $49,999 | 172 (14.4%) | 21 (6.6%) |
| $50,000 to $74,999 | 248 (20.7%) | 54 (17.0%) |
| $75,000 to $99,999 | 155 (13.0%) | 27 (8.5%) |
| $100,000 to $149,999 | 214 (17.9%) | 29 (9.1%) |
| $150,000 or more | 145 (12.1%) | 15 (4.7%) |
| Total | 1,197 (100.0%) | 317 (100.0%) |
Monthly Housing Cost Tiers in Fisher County
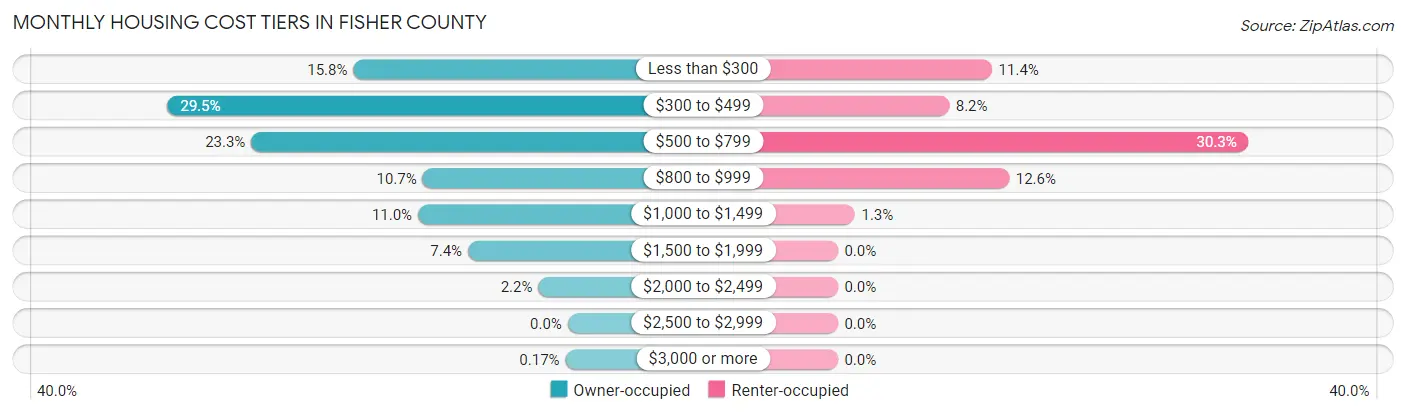
| Monthly Cost | Owner-occupied | Renter-occupied |
| Less than $300 | 189 (15.8%) | 36 (11.4%) |
| $300 to $499 | 353 (29.5%) | 26 (8.2%) |
| $500 to $799 | 279 (23.3%) | 96 (30.3%) |
| $800 to $999 | 128 (10.7%) | 40 (12.6%) |
| $1,000 to $1,499 | 132 (11.0%) | 4 (1.3%) |
| $1,500 to $1,999 | 88 (7.3%) | 0 (0.0%) |
| $2,000 to $2,499 | 26 (2.2%) | 0 (0.0%) |
| $2,500 to $2,999 | 0 (0.0%) | 0 (0.0%) |
| $3,000 or more | 2 (0.2%) | 0 (0.0%) |
| Total | 1,197 (100.0%) | 317 (100.0%) |
Physical Housing Characteristics in Fisher County
Housing Structures in Fisher County
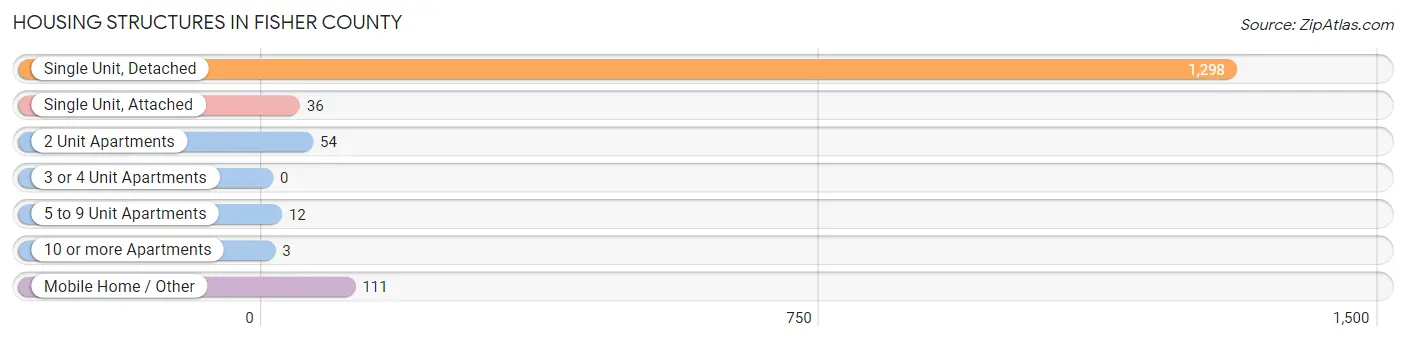
| Structure Type | # Housing Units | % Housing Units |
| Single Unit, Detached | 1,298 | 85.7% |
| Single Unit, Attached | 36 | 2.4% |
| 2 Unit Apartments | 54 | 3.6% |
| 3 or 4 Unit Apartments | 0 | 0.0% |
| 5 to 9 Unit Apartments | 12 | 0.8% |
| 10 or more Apartments | 3 | 0.2% |
| Mobile Home / Other | 111 | 7.3% |
| Total | 1,514 | 100.0% |
Housing Structures by Occupancy in Fisher County
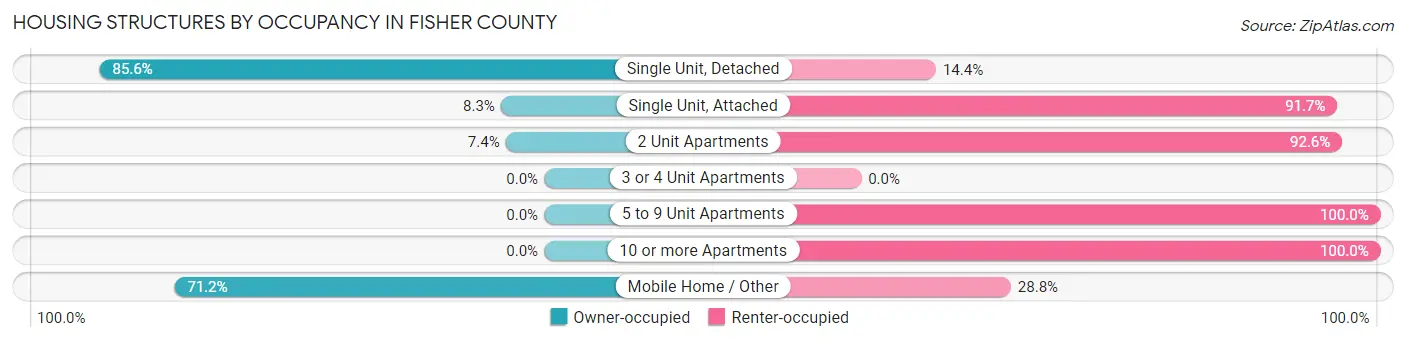
| Structure Type | Owner-occupied | Renter-occupied |
| Single Unit, Detached | 1,111 (85.6%) | 187 (14.4%) |
| Single Unit, Attached | 3 (8.3%) | 33 (91.7%) |
| 2 Unit Apartments | 4 (7.4%) | 50 (92.6%) |
| 3 or 4 Unit Apartments | 0 (0.0%) | 0 (0.0%) |
| 5 to 9 Unit Apartments | 0 (0.0%) | 12 (100.0%) |
| 10 or more Apartments | 0 (0.0%) | 3 (100.0%) |
| Mobile Home / Other | 79 (71.2%) | 32 (28.8%) |
| Total | 1,197 (79.1%) | 317 (20.9%) |
Housing Structures by Number of Rooms in Fisher County
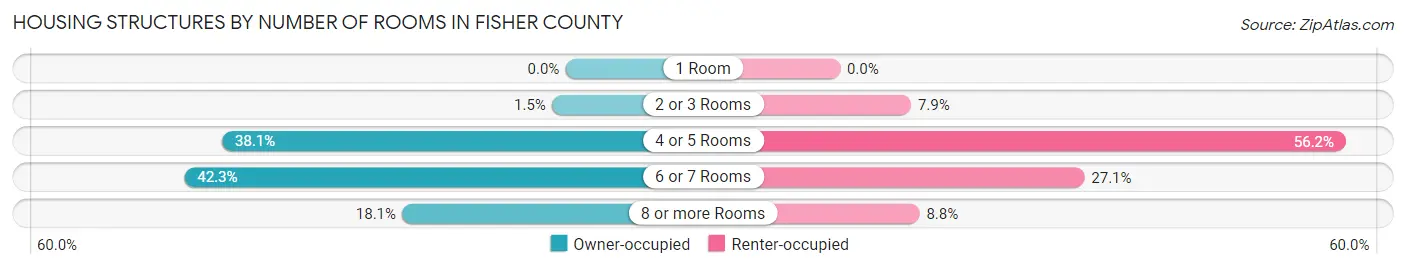
| Number of Rooms | Owner-occupied | Renter-occupied |
| 1 Room | 0 (0.0%) | 0 (0.0%) |
| 2 or 3 Rooms | 18 (1.5%) | 25 (7.9%) |
| 4 or 5 Rooms | 456 (38.1%) | 178 (56.1%) |
| 6 or 7 Rooms | 506 (42.3%) | 86 (27.1%) |
| 8 or more Rooms | 217 (18.1%) | 28 (8.8%) |
| Total | 1,197 (100.0%) | 317 (100.0%) |
Housing Structure by Heating Type in Fisher County
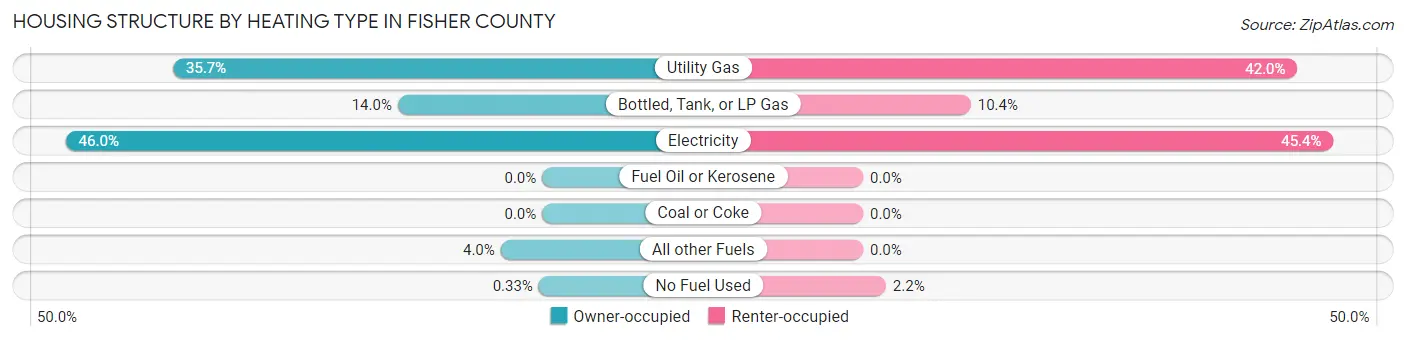
| Heating Type | Owner-occupied | Renter-occupied |
| Utility Gas | 427 (35.7%) | 133 (42.0%) |
| Bottled, Tank, or LP Gas | 167 (14.0%) | 33 (10.4%) |
| Electricity | 551 (46.0%) | 144 (45.4%) |
| Fuel Oil or Kerosene | 0 (0.0%) | 0 (0.0%) |
| Coal or Coke | 0 (0.0%) | 0 (0.0%) |
| All other Fuels | 48 (4.0%) | 0 (0.0%) |
| No Fuel Used | 4 (0.3%) | 7 (2.2%) |
| Total | 1,197 (100.0%) | 317 (100.0%) |
Household Vehicle Usage in Fisher County
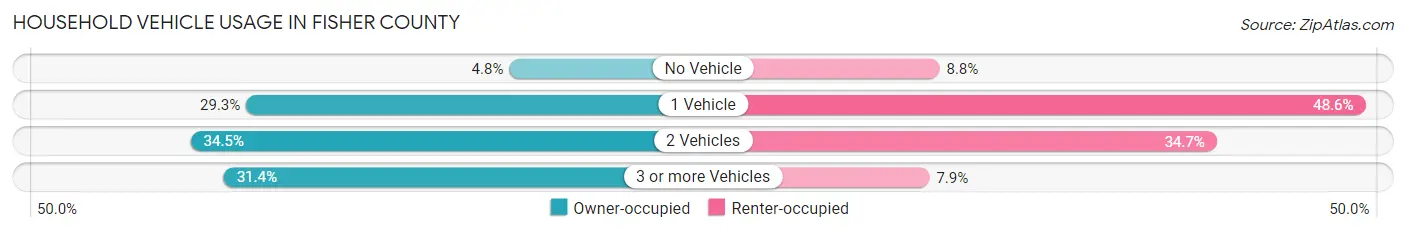
| Vehicles per Household | Owner-occupied | Renter-occupied |
| No Vehicle | 57 (4.8%) | 28 (8.8%) |
| 1 Vehicle | 351 (29.3%) | 154 (48.6%) |
| 2 Vehicles | 413 (34.5%) | 110 (34.7%) |
| 3 or more Vehicles | 376 (31.4%) | 25 (7.9%) |
| Total | 1,197 (100.0%) | 317 (100.0%) |
Real Estate & Mortgages in Fisher County
Real Estate and Mortgage Overview in Fisher County
| Characteristic | Without Mortgage | With Mortgage |
| Housing Units | 892 | 305 |
| Median Property Value | $67,900 | $119,200 |
| Median Household Income | $57,188 | $78 |
| Monthly Housing Costs | $440 | $2 |
| Real Estate Taxes | $1,135 | $20 |
Property Value by Mortgage Status in Fisher County
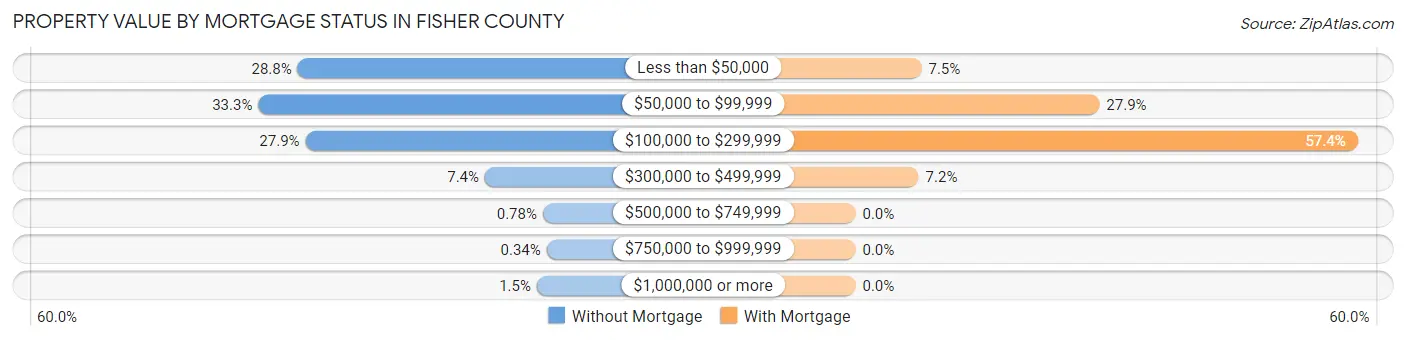
| Property Value | Without Mortgage | With Mortgage |
| Less than $50,000 | 257 (28.8%) | 23 (7.5%) |
| $50,000 to $99,999 | 297 (33.3%) | 85 (27.9%) |
| $100,000 to $299,999 | 249 (27.9%) | 175 (57.4%) |
| $300,000 to $499,999 | 66 (7.4%) | 22 (7.2%) |
| $500,000 to $749,999 | 7 (0.8%) | 0 (0.0%) |
| $750,000 to $999,999 | 3 (0.3%) | 0 (0.0%) |
| $1,000,000 or more | 13 (1.5%) | 0 (0.0%) |
| Total | 892 (100.0%) | 305 (100.0%) |
Household Income by Mortgage Status in Fisher County
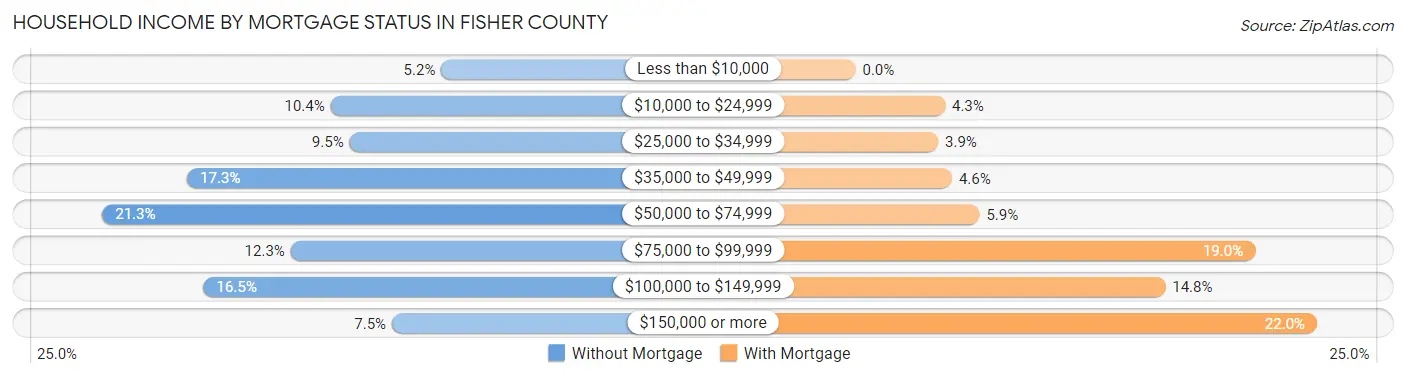
| Household Income | Without Mortgage | With Mortgage |
| Less than $10,000 | 46 (5.2%) | 0 (0.0%) |
| $10,000 to $24,999 | 93 (10.4%) | 13 (4.3%) |
| $25,000 to $34,999 | 85 (9.5%) | 12 (3.9%) |
| $35,000 to $49,999 | 154 (17.3%) | 14 (4.6%) |
| $50,000 to $74,999 | 190 (21.3%) | 18 (5.9%) |
| $75,000 to $99,999 | 110 (12.3%) | 58 (19.0%) |
| $100,000 to $149,999 | 147 (16.5%) | 45 (14.7%) |
| $150,000 or more | 67 (7.5%) | 67 (22.0%) |
| Total | 892 (100.0%) | 305 (100.0%) |
Property Value to Household Income Ratio in Fisher County
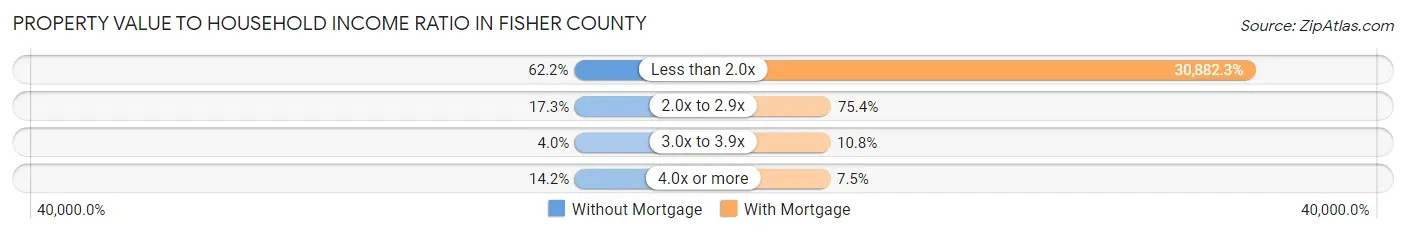
| Value-to-Income Ratio | Without Mortgage | With Mortgage |
| Less than 2.0x | 555 (62.2%) | 94,191 (30,882.3%) |
| 2.0x to 2.9x | 154 (17.3%) | 230 (75.4%) |
| 3.0x to 3.9x | 36 (4.0%) | 33 (10.8%) |
| 4.0x or more | 127 (14.2%) | 23 (7.5%) |
| Total | 892 (100.0%) | 305 (100.0%) |
Real Estate Taxes by Mortgage Status in Fisher County
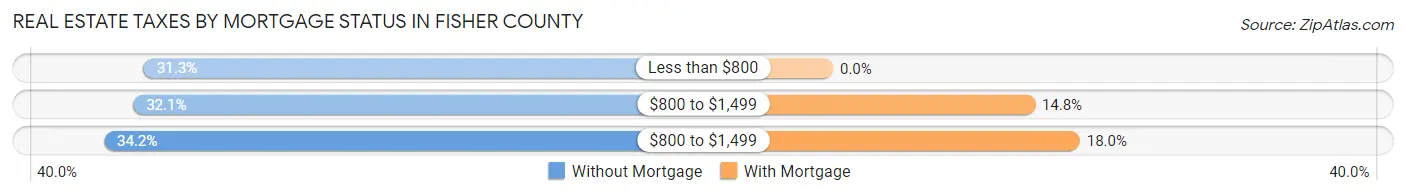
| Property Taxes | Without Mortgage | With Mortgage |
| Less than $800 | 279 (31.3%) | 0 (0.0%) |
| $800 to $1,499 | 286 (32.1%) | 45 (14.7%) |
| $800 to $1,499 | 305 (34.2%) | 55 (18.0%) |
| Total | 892 (100.0%) | 305 (100.0%) |
Health & Disability in Fisher County
Health Insurance Coverage by Age in Fisher County
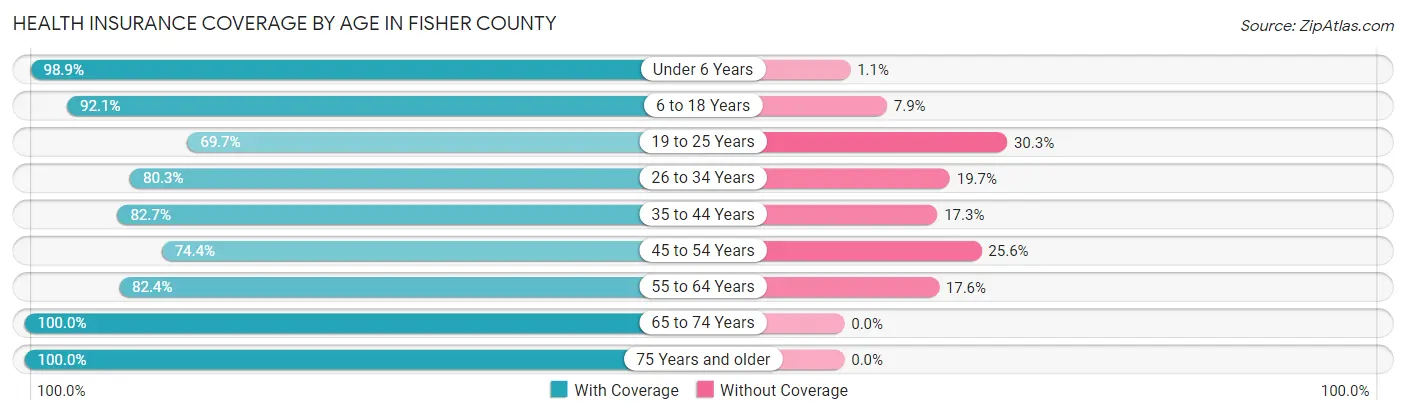
| Age Bracket | With Coverage | Without Coverage |
| Under 6 Years | 267 (98.9%) | 3 (1.1%) |
| 6 to 18 Years | 510 (92.1%) | 44 (7.9%) |
| 19 to 25 Years | 186 (69.7%) | 81 (30.3%) |
| 26 to 34 Years | 400 (80.3%) | 98 (19.7%) |
| 35 to 44 Years | 272 (82.7%) | 57 (17.3%) |
| 45 to 54 Years | 329 (74.4%) | 113 (25.6%) |
| 55 to 64 Years | 369 (82.4%) | 79 (17.6%) |
| 65 to 74 Years | 487 (100.0%) | 0 (0.0%) |
| 75 Years and older | 362 (100.0%) | 0 (0.0%) |
| Total | 3,182 (87.0%) | 475 (13.0%) |
Health Insurance Coverage by Citizenship Status in Fisher County
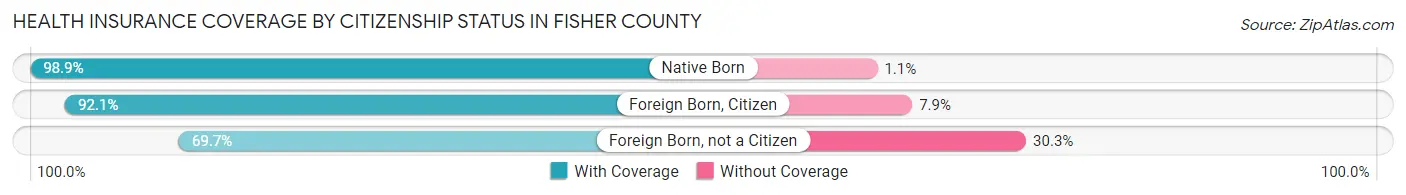
| Citizenship Status | With Coverage | Without Coverage |
| Native Born | 267 (98.9%) | 3 (1.1%) |
| Foreign Born, Citizen | 510 (92.1%) | 44 (7.9%) |
| Foreign Born, not a Citizen | 186 (69.7%) | 81 (30.3%) |
Health Insurance Coverage by Household Income in Fisher County
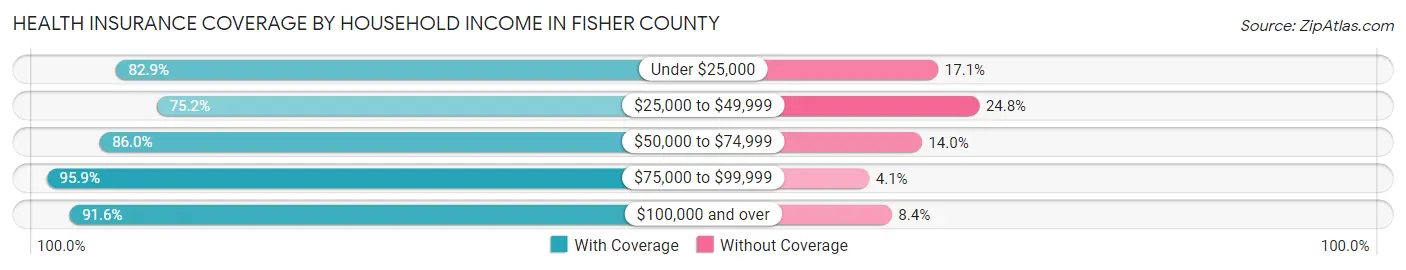
| Household Income | With Coverage | Without Coverage |
| Under $25,000 | 408 (82.9%) | 84 (17.1%) |
| $25,000 to $49,999 | 462 (75.2%) | 152 (24.8%) |
| $50,000 to $74,999 | 713 (86.0%) | 116 (14.0%) |
| $75,000 to $99,999 | 441 (95.9%) | 19 (4.1%) |
| $100,000 and over | 1,140 (91.6%) | 104 (8.4%) |
Public vs Private Health Insurance Coverage by Age in Fisher County
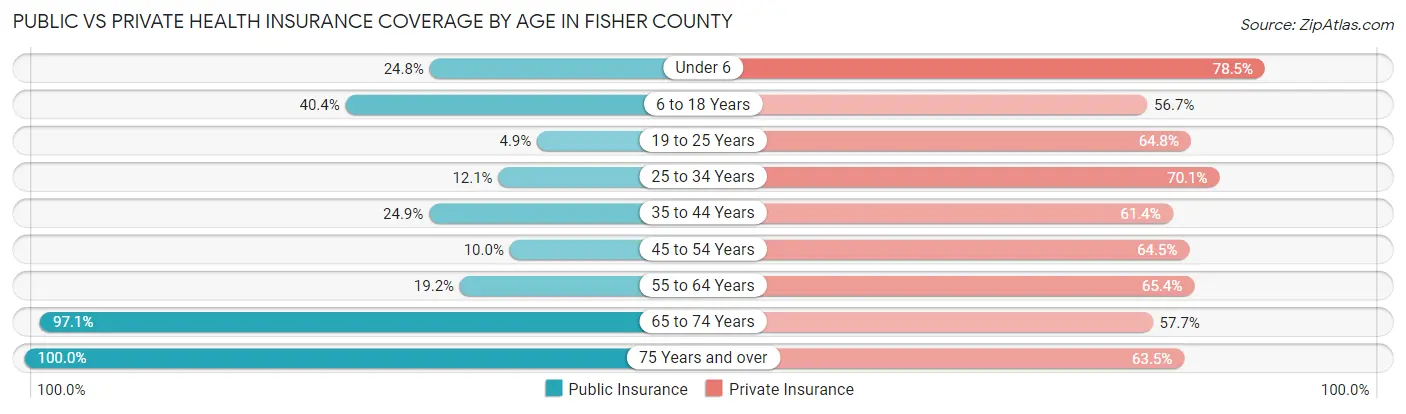
| Age Bracket | Public Insurance | Private Insurance |
| Under 6 | 67 (24.8%) | 212 (78.5%) |
| 6 to 18 Years | 224 (40.4%) | 314 (56.7%) |
| 19 to 25 Years | 13 (4.9%) | 173 (64.8%) |
| 25 to 34 Years | 60 (12.0%) | 349 (70.1%) |
| 35 to 44 Years | 82 (24.9%) | 202 (61.4%) |
| 45 to 54 Years | 44 (10.0%) | 285 (64.5%) |
| 55 to 64 Years | 86 (19.2%) | 293 (65.4%) |
| 65 to 74 Years | 473 (97.1%) | 281 (57.7%) |
| 75 Years and over | 362 (100.0%) | 230 (63.5%) |
| Total | 1,411 (38.6%) | 2,339 (64.0%) |
Disability Status by Sex by Age in Fisher County
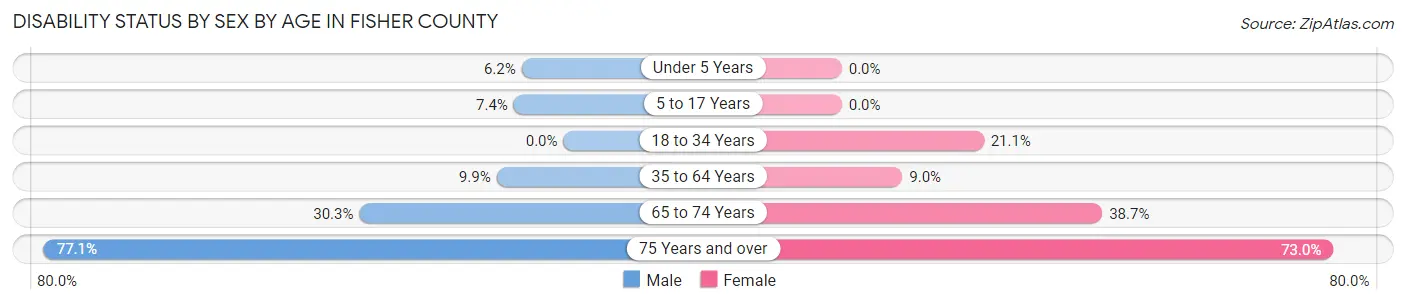
| Age Bracket | Male | Female |
| Under 5 Years | 10 (6.2%) | 0 (0.0%) |
| 5 to 17 Years | 18 (7.4%) | 0 (0.0%) |
| 18 to 34 Years | 0 (0.0%) | 79 (21.1%) |
| 35 to 64 Years | 68 (9.9%) | 48 (9.0%) |
| 65 to 74 Years | 70 (30.3%) | 99 (38.7%) |
| 75 Years and over | 108 (77.1%) | 162 (73.0%) |
Disability Class by Sex by Age in Fisher County
Disability Class: Hearing Difficulty
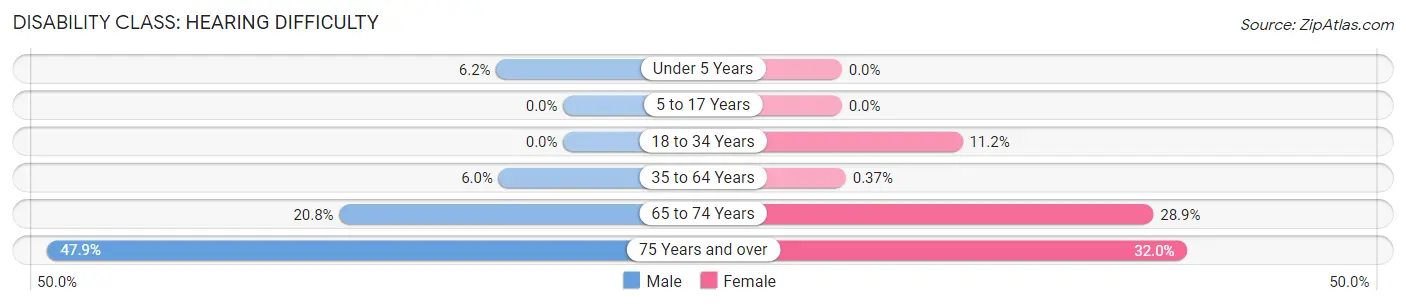
| Age Bracket | Male | Female |
| Under 5 Years | 10 (6.2%) | 0 (0.0%) |
| 5 to 17 Years | 0 (0.0%) | 0 (0.0%) |
| 18 to 34 Years | 0 (0.0%) | 42 (11.2%) |
| 35 to 64 Years | 41 (6.0%) | 2 (0.4%) |
| 65 to 74 Years | 48 (20.8%) | 74 (28.9%) |
| 75 Years and over | 67 (47.9%) | 71 (32.0%) |
Disability Class: Vision Difficulty
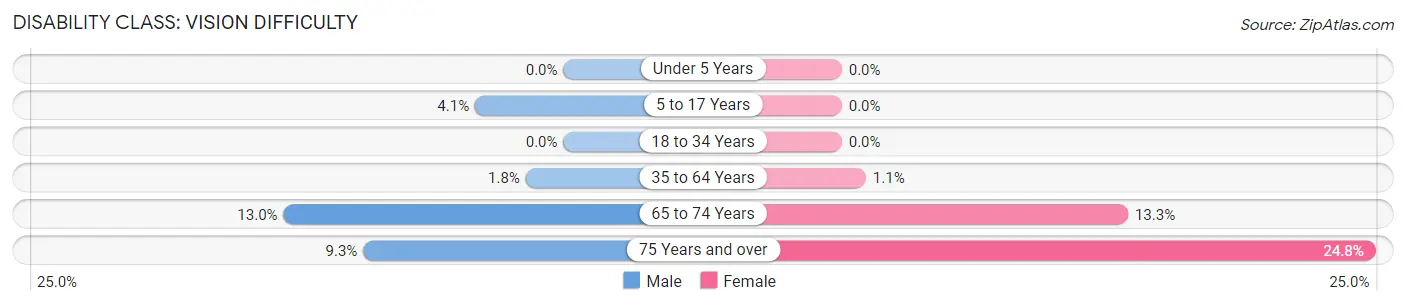
| Age Bracket | Male | Female |
| Under 5 Years | 0 (0.0%) | 0 (0.0%) |
| 5 to 17 Years | 10 (4.1%) | 0 (0.0%) |
| 18 to 34 Years | 0 (0.0%) | 0 (0.0%) |
| 35 to 64 Years | 12 (1.8%) | 6 (1.1%) |
| 65 to 74 Years | 30 (13.0%) | 34 (13.3%) |
| 75 Years and over | 13 (9.3%) | 55 (24.8%) |
Disability Class: Cognitive Difficulty
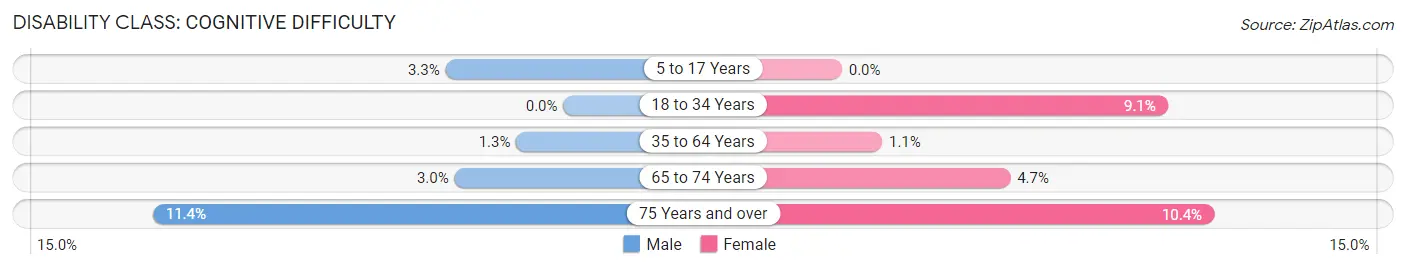
| Age Bracket | Male | Female |
| 5 to 17 Years | 8 (3.3%) | 0 (0.0%) |
| 18 to 34 Years | 0 (0.0%) | 34 (9.1%) |
| 35 to 64 Years | 9 (1.3%) | 6 (1.1%) |
| 65 to 74 Years | 7 (3.0%) | 12 (4.7%) |
| 75 Years and over | 16 (11.4%) | 23 (10.4%) |
Disability Class: Ambulatory Difficulty
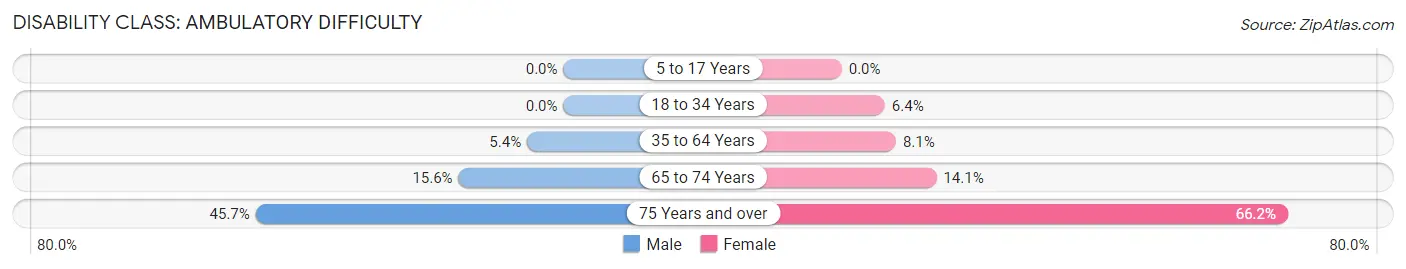
| Age Bracket | Male | Female |
| 5 to 17 Years | 0 (0.0%) | 0 (0.0%) |
| 18 to 34 Years | 0 (0.0%) | 24 (6.4%) |
| 35 to 64 Years | 37 (5.4%) | 43 (8.1%) |
| 65 to 74 Years | 36 (15.6%) | 36 (14.1%) |
| 75 Years and over | 64 (45.7%) | 147 (66.2%) |
Disability Class: Self-Care Difficulty
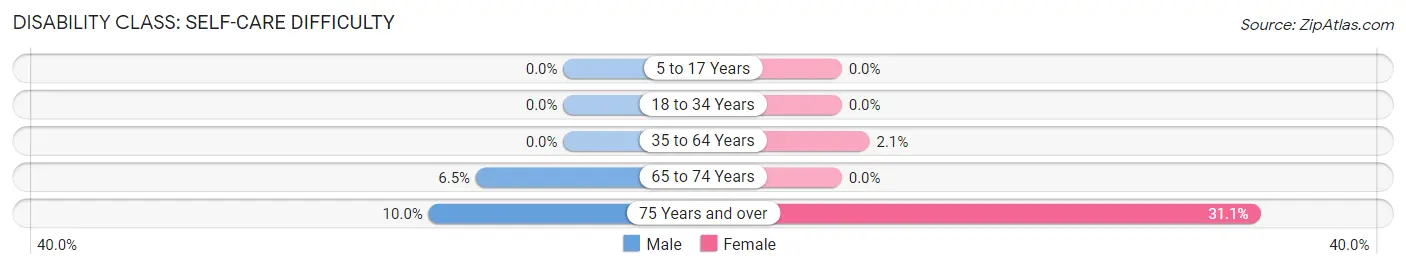
| Age Bracket | Male | Female |
| 5 to 17 Years | 0 (0.0%) | 0 (0.0%) |
| 18 to 34 Years | 0 (0.0%) | 0 (0.0%) |
| 35 to 64 Years | 0 (0.0%) | 11 (2.1%) |
| 65 to 74 Years | 15 (6.5%) | 0 (0.0%) |
| 75 Years and over | 14 (10.0%) | 69 (31.1%) |
Technology Access in Fisher County
Computing Device Access in Fisher County
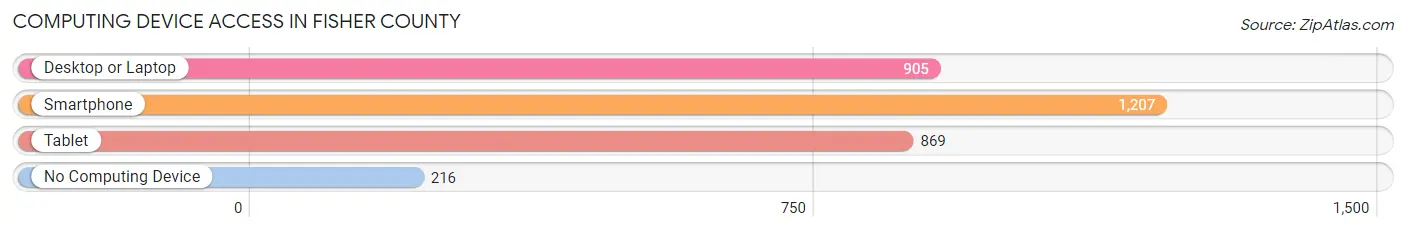
| Device Type | # Households | % Households |
| Desktop or Laptop | 905 | 59.8% |
| Smartphone | 1,207 | 79.7% |
| Tablet | 869 | 57.4% |
| No Computing Device | 216 | 14.3% |
| Total | 1,514 | 100.0% |
Internet Access in Fisher County
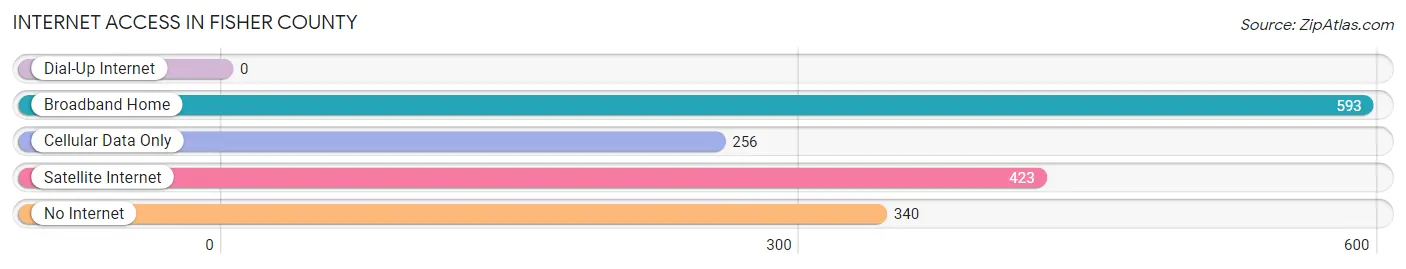
| Internet Type | # Households | % Households |
| Dial-Up Internet | 0 | 0.0% |
| Broadband Home | 593 | 39.2% |
| Cellular Data Only | 256 | 16.9% |
| Satellite Internet | 423 | 27.9% |
| No Internet | 340 | 22.5% |
| Total | 1,514 | 100.0% |
Fisher County Summary
Fisher County is located in the western part of the state of Texas, in the United States. It is part of the Big Country region of Texas and is bordered by Jones County to the north, Nolan County to the east, Mitchell County to the south, and Scurry County to the west. The county seat is Roby, and the largest city is Rotan. As of the 2010 census, the population of Fisher County was 3,974, making it the second-least populous county in Texas.
Geography
Fisher County covers an area of 919 square miles, making it the second-smallest county in Texas by land area. The terrain is mostly flat, with some rolling hills in the northern part of the county. The county is drained by the Colorado River, which forms its western boundary. The county is located in the High Plains region of Texas, and is mostly covered in grasslands and prairies.
The climate of Fisher County is semi-arid, with hot summers and mild winters. The average annual temperature is 64°F, and the average annual precipitation is 20 inches.
History
Fisher County was established in 1876, and was named for James B. Fisher, a Texas state senator. The county was originally part of Bexar County, but was later split off to form its own county.
The first settlers in the area were ranchers, who established large cattle ranches in the area. The county was also home to several Native American tribes, including the Comanche, Kiowa, and Apache.
The county was largely rural until the early 20th century, when oil was discovered in the area. This led to an influx of people and businesses, and the county's population grew rapidly.
Economy
The economy of Fisher County is largely based on agriculture and oil production. The county is home to several large ranches, and the main crops grown in the area are wheat, cotton, and sorghum.
Oil production is also an important part of the economy, and the county is home to several oil fields. The county is also home to several manufacturing plants, including a plant that produces wind turbines.
Demographics
As of the 2010 census, the population of Fisher County was 3,974, with a population density of 4.3 people per square mile. The racial makeup of the county was 81.3% White, 11.2% Hispanic or Latino, 5.2% African American, 0.7% Native American, 0.3% Asian, and 1.5% from other races.
The median household income in Fisher County was $37,917, and the median family income was $45,938. The per capita income was $18,945. About 16.2% of the population was below the poverty line.
The largest city in Fisher County is Rotan, with a population of 1,845. Other cities in the county include Roby, Sylvester, and Rotan.
Common Questions
What is Per Capita Income in Fisher County?
Per Capita income in Fisher County is $32,722.
What is the Median Family Income in Fisher County?
Median Family Income in Fisher County is $64,554.
What is the Median Household income in Fisher County?
Median Household Income in Fisher County is $60,461.
What is Income or Wage Gap in Fisher County?
Income or Wage Gap in Fisher County is 41.5%.
Women in Fisher County earn 58.5 cents for every dollar earned by a man.
What is Inequality or Gini Index in Fisher County?
Inequality or Gini Index in Fisher County is 0.42.
What is the Total Population of Fisher County?
Total Population of Fisher County is 3,680.
What is the Total Male Population of Fisher County?
Total Male Population of Fisher County is 1,901.
What is the Total Female Population of Fisher County?
Total Female Population of Fisher County is 1,779.
What is the Ratio of Males per 100 Females in Fisher County?
There are 106.86 Males per 100 Females in Fisher County.
What is the Ratio of Females per 100 Males in Fisher County?
There are 93.58 Females per 100 Males in Fisher County.
What is the Median Population Age in Fisher County?
Median Population Age in Fisher County is 42.2 Years.
What is the Average Family Size in Fisher County
Average Family Size in Fisher County is 2.9 People.
What is the Average Household Size in Fisher County
Average Household Size in Fisher County is 2.4 People.
How Large is the Labor Force in Fisher County?
There are 1,869 People in the Labor Forcein in Fisher County.
What is the Percentage of People in the Labor Force in Fisher County?
63.0% of People are in the Labor Force in Fisher County.
What is the Unemployment Rate in Fisher County?
Unemployment Rate in Fisher County is 2.9%.