Fannin County, TX Map & Demographics
Fannin County Map
Fannin County Overview
$33,481
PER CAPITA INCOME
$81,299
AVG FAMILY INCOME
$65,835
AVG HOUSEHOLD INCOME
24.9%
WAGE / INCOME GAP [ % ]
75.1¢/ $1
WAGE / INCOME GAP [ $ ]
$9,721
FAMILY INCOME DEFICIT
0.47
INEQUALITY / GINI INDEX
36,052
TOTAL POPULATION
19,230
MALE POPULATION
16,822
FEMALE POPULATION
114.31
MALES / 100 FEMALES
87.48
FEMALES / 100 MALES
40.4
MEDIAN AGE
3.1
AVG FAMILY SIZE
2.6
AVG HOUSEHOLD SIZE
15,808
LABOR FORCE [ PEOPLE ]
53.9%
PERCENT IN LABOR FORCE
4.7%
UNEMPLOYMENT RATE
Income in Fannin County
Income Overview in Fannin County
Per Capita Income in Fannin County is $33,481, while median incomes of families and households are $81,299 and $65,835 respectively.
| Characteristic | Number | Measure |
| Per Capita Income | 36,052 | $33,481 |
| Median Family Income | 8,775 | $81,299 |
| Mean Family Income | 8,775 | $108,126 |
| Median Household Income | 12,699 | $65,835 |
| Mean Household Income | 12,699 | $91,939 |
| Income Deficit | 8,775 | $9,721 |
| Wage / Income Gap (%) | 36,052 | 24.93% |
| Wage / Income Gap ($) | 36,052 | 75.07¢ per $1 |
| Gini / Inequality Index | 36,052 | 0.47 |
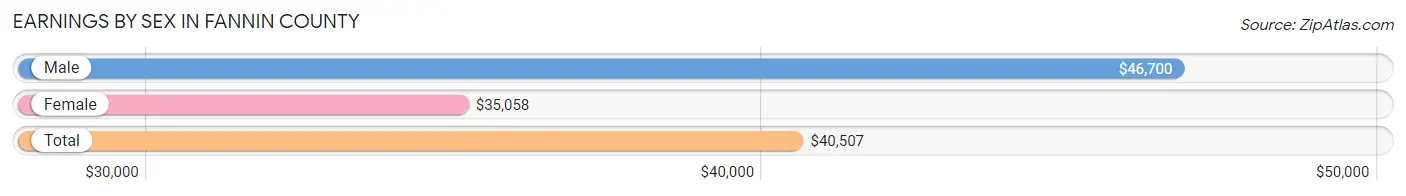
Earnings by Sex in Fannin County
Average Earnings in Fannin County are $40,507, $46,700 for men and $35,058 for women, a difference of 24.9%.
| Sex | Number | Average Earnings |
| Male | 9,393 (56.0%) | $46,700 |
| Female | 7,384 (44.0%) | $35,058 |
| Total | 16,777 (100.0%) | $40,507 |
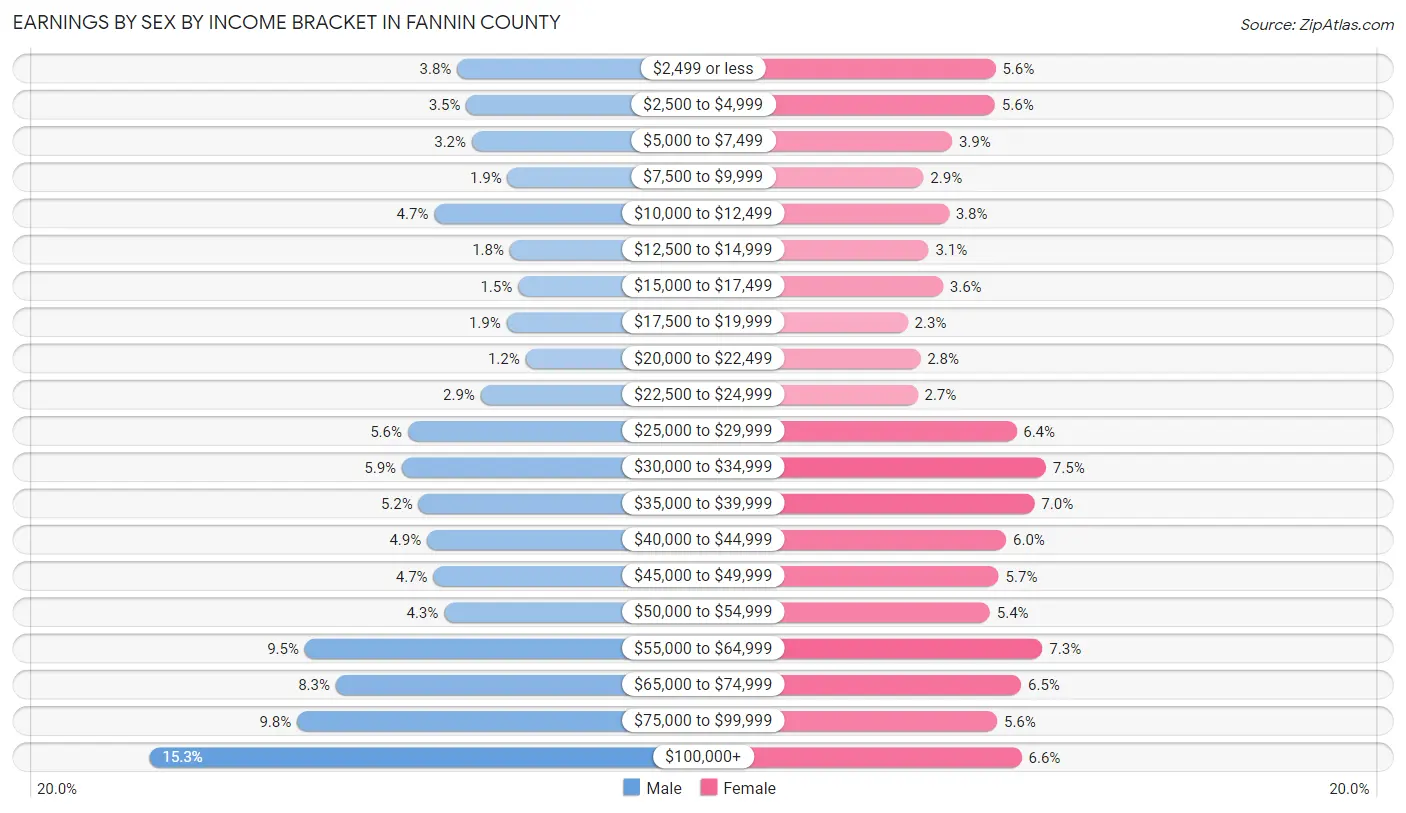
Earnings by Sex by Income Bracket in Fannin County
The most common earnings brackets in Fannin County are $100,000+ for men (1,439 | 15.3%) and $30,000 to $34,999 for women (551 | 7.5%).
| Income | Male | Female |
| $2,499 or less | 356 (3.8%) | 411 (5.6%) |
| $2,500 to $4,999 | 324 (3.5%) | 410 (5.6%) |
| $5,000 to $7,499 | 304 (3.2%) | 291 (3.9%) |
| $7,500 to $9,999 | 178 (1.9%) | 212 (2.9%) |
| $10,000 to $12,499 | 437 (4.6%) | 282 (3.8%) |
| $12,500 to $14,999 | 171 (1.8%) | 226 (3.1%) |
| $15,000 to $17,499 | 142 (1.5%) | 266 (3.6%) |
| $17,500 to $19,999 | 182 (1.9%) | 168 (2.3%) |
| $20,000 to $22,499 | 116 (1.2%) | 203 (2.8%) |
| $22,500 to $24,999 | 273 (2.9%) | 196 (2.6%) |
| $25,000 to $29,999 | 530 (5.6%) | 469 (6.4%) |
| $30,000 to $34,999 | 550 (5.9%) | 551 (7.5%) |
| $35,000 to $39,999 | 492 (5.2%) | 519 (7.0%) |
| $40,000 to $44,999 | 462 (4.9%) | 441 (6.0%) |
| $45,000 to $49,999 | 440 (4.7%) | 420 (5.7%) |
| $50,000 to $54,999 | 402 (4.3%) | 396 (5.4%) |
| $55,000 to $64,999 | 892 (9.5%) | 541 (7.3%) |
| $65,000 to $74,999 | 783 (8.3%) | 482 (6.5%) |
| $75,000 to $99,999 | 920 (9.8%) | 416 (5.6%) |
| $100,000+ | 1,439 (15.3%) | 484 (6.6%) |
| Total | 9,393 (100.0%) | 7,384 (100.0%) |
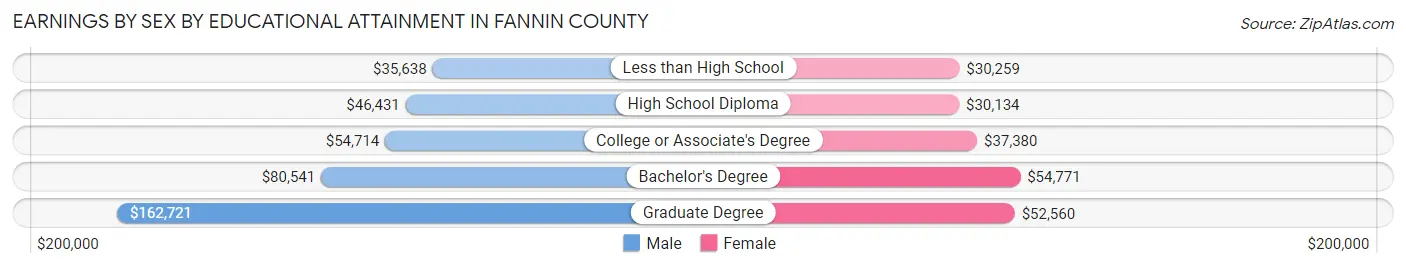
Earnings by Sex by Educational Attainment in Fannin County
Average earnings in Fannin County are $54,298 for men and $38,405 for women, a difference of 29.3%. Men with an educational attainment of graduate degree enjoy the highest average annual earnings of $162,721, while those with less than high school education earn the least with $35,638. Women with an educational attainment of bachelor's degree earn the most with the average annual earnings of $54,771, while those with high school diploma education have the smallest earnings of $30,134.
| Educational Attainment | Male Income | Female Income |
| Less than High School | $35,638 | $30,259 |
| High School Diploma | $46,431 | $30,134 |
| College or Associate's Degree | $54,714 | $37,380 |
| Bachelor's Degree | $80,541 | $54,771 |
| Graduate Degree | $162,721 | $52,560 |
| Total | $54,298 | $38,405 |
Family Income in Fannin County
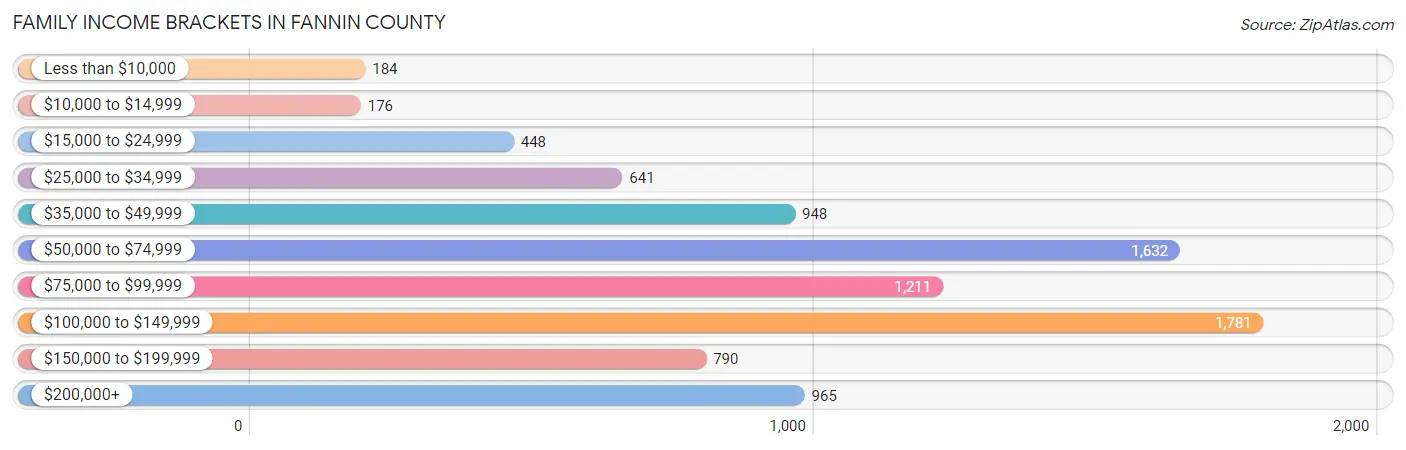
Family Income Brackets in Fannin County
According to the Fannin County family income data, there are 1,781 families falling into the $100,000 to $149,999 income range, which is the most common income bracket and makes up 20.3% of all families. Conversely, the $10,000 to $14,999 income bracket is the least frequent group with only 176 families (2.0%) belonging to this category.
| Income Bracket | # Families | % Families |
| Less than $10,000 | 184 | 2.1% |
| $10,000 to $14,999 | 176 | 2.0% |
| $15,000 to $24,999 | 448 | 5.1% |
| $25,000 to $34,999 | 641 | 7.3% |
| $35,000 to $49,999 | 948 | 10.8% |
| $50,000 to $74,999 | 1,632 | 18.6% |
| $75,000 to $99,999 | 1,211 | 13.8% |
| $100,000 to $149,999 | 1,781 | 20.3% |
| $150,000 to $199,999 | 790 | 9.0% |
| $200,000+ | 965 | 11.0% |
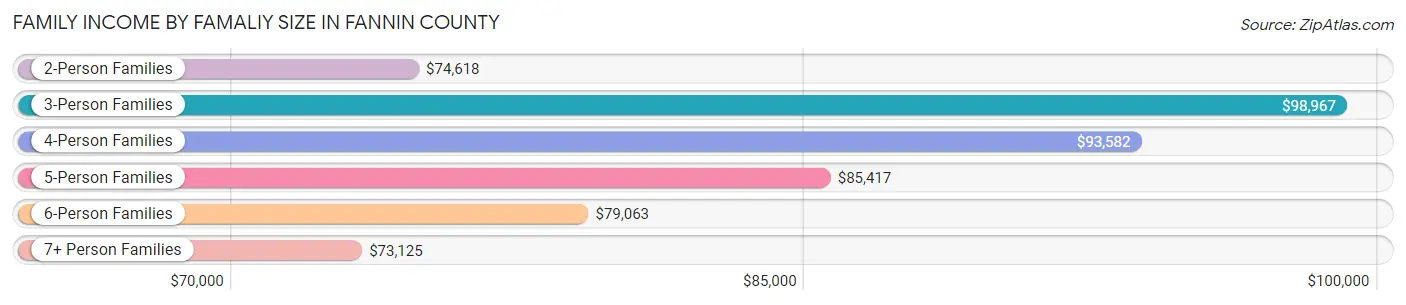
Family Income by Famaliy Size in Fannin County
3-person families (1,538 | 17.5%) account for the highest median family income in Fannin County with $98,967 per family, while 2-person families (4,083 | 46.5%) have the highest median income of $37,309 per family member.
| Income Bracket | # Families | Median Income |
| 2-Person Families | 4,083 (46.5%) | $74,618 |
| 3-Person Families | 1,538 (17.5%) | $98,967 |
| 4-Person Families | 1,906 (21.7%) | $93,582 |
| 5-Person Families | 712 (8.1%) | $85,417 |
| 6-Person Families | 373 (4.3%) | $79,063 |
| 7+ Person Families | 163 (1.9%) | $73,125 |
| Total | 8,775 (100.0%) | $81,299 |
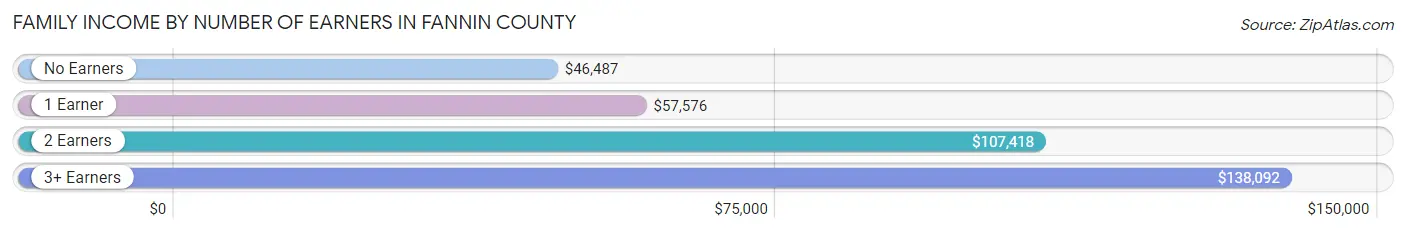
Family Income by Number of Earners in Fannin County
The median family income in Fannin County is $81,299, with families comprising 3+ earners (893) having the highest median family income of $138,092, while families with no earners (1,467) have the lowest median family income of $46,487, accounting for 10.2% and 16.7% of families, respectively.
| Number of Earners | # Families | Median Income |
| No Earners | 1,467 (16.7%) | $46,487 |
| 1 Earner | 3,019 (34.4%) | $57,576 |
| 2 Earners | 3,396 (38.7%) | $107,418 |
| 3+ Earners | 893 (10.2%) | $138,092 |
| Total | 8,775 (100.0%) | $81,299 |
Household Income in Fannin County
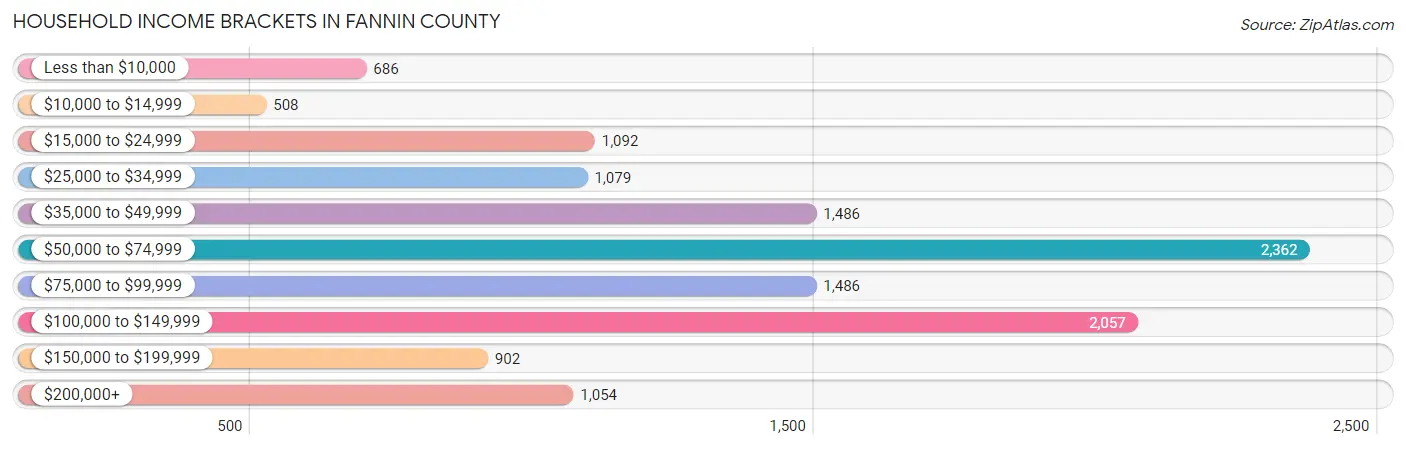
Household Income Brackets in Fannin County
With 2,362 households falling in the category, the $50,000 to $74,999 income range is the most frequent in Fannin County, accounting for 18.6% of all households. In contrast, only 508 households (4.0%) fall into the $10,000 to $14,999 income bracket, making it the least populous group.
| Income Bracket | # Households | % Households |
| Less than $10,000 | 686 | 5.4% |
| $10,000 to $14,999 | 508 | 4.0% |
| $15,000 to $24,999 | 1,092 | 8.6% |
| $25,000 to $34,999 | 1,079 | 8.5% |
| $35,000 to $49,999 | 1,486 | 11.7% |
| $50,000 to $74,999 | 2,362 | 18.6% |
| $75,000 to $99,999 | 1,486 | 11.7% |
| $100,000 to $149,999 | 2,057 | 16.2% |
| $150,000 to $199,999 | 902 | 7.1% |
| $200,000+ | 1,054 | 8.3% |
Household Income by Householder Age in Fannin County
The median household income in Fannin County is $65,835, with the highest median household income of $86,944 found in the 45 to 64 years age bracket for the primary householder. A total of 4,862 households (38.3%) fall into this category. Meanwhile, the 15 to 24 years age bracket for the primary householder has the lowest median household income of $39,088, with 445 households (3.5%) in this group.
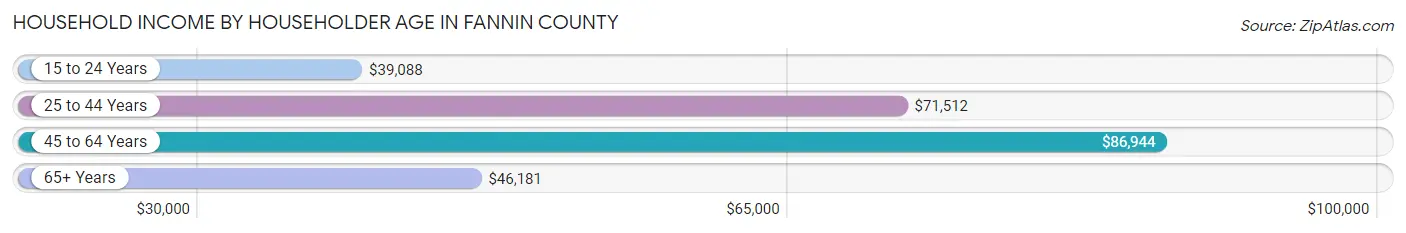
| Income Bracket | # Households | Median Income |
| 15 to 24 Years | 445 (3.5%) | $39,088 |
| 25 to 44 Years | 3,444 (27.1%) | $71,512 |
| 45 to 64 Years | 4,862 (38.3%) | $86,944 |
| 65+ Years | 3,948 (31.1%) | $46,181 |
| Total | 12,699 (100.0%) | $65,835 |
Poverty in Fannin County
Income Below Poverty by Sex and Age in Fannin County
With 12.2% poverty level for males and 13.4% for females among the residents of Fannin County, 18 to 24 year old males and 15 year old females are the most vulnerable to poverty, with 314 males (23.1%) and 80 females (25.4%) in their respective age groups living below the poverty level.
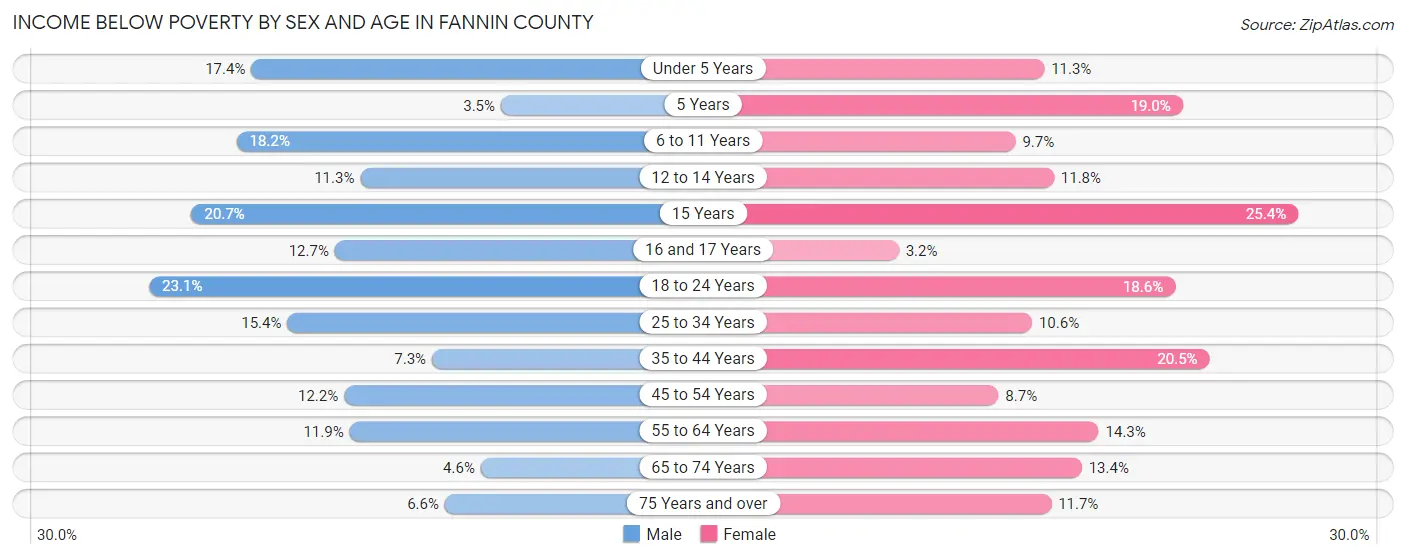
| Age Bracket | Male | Female |
| Under 5 Years | 158 (17.4%) | 93 (11.3%) |
| 5 Years | 8 (3.5%) | 56 (19.0%) |
| 6 to 11 Years | 221 (18.2%) | 116 (9.7%) |
| 12 to 14 Years | 93 (11.3%) | 71 (11.8%) |
| 15 Years | 35 (20.7%) | 80 (25.4%) |
| 16 and 17 Years | 69 (12.7%) | 12 (3.2%) |
| 18 to 24 Years | 314 (23.1%) | 250 (18.5%) |
| 25 to 34 Years | 284 (15.4%) | 186 (10.6%) |
| 35 to 44 Years | 155 (7.3%) | 423 (20.5%) |
| 45 to 54 Years | 259 (12.2%) | 187 (8.7%) |
| 55 to 64 Years | 274 (11.9%) | 342 (14.3%) |
| 65 to 74 Years | 84 (4.6%) | 232 (13.4%) |
| 75 Years and over | 74 (6.6%) | 161 (11.7%) |
| Total | 2,028 (12.2%) | 2,209 (13.4%) |
Income Above Poverty by Sex and Age in Fannin County
According to the poverty statistics in Fannin County, males aged 5 years and females aged 16 and 17 years are the age groups that are most secure financially, with 96.5% of males and 96.8% of females in these age groups living above the poverty line.
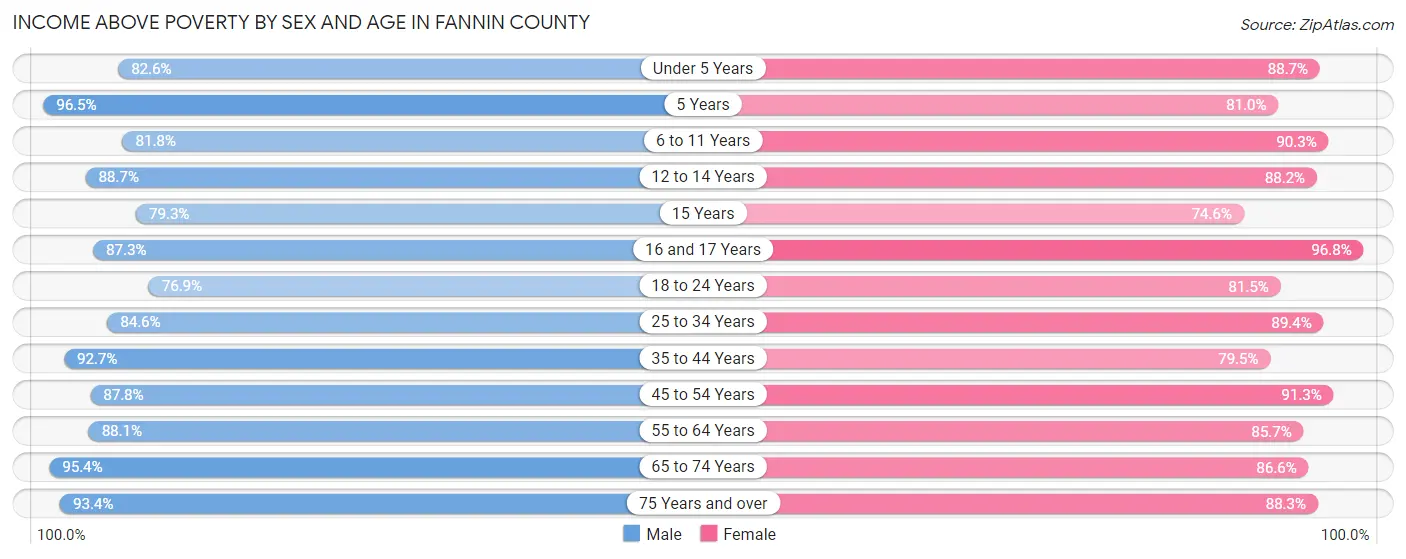
| Age Bracket | Male | Female |
| Under 5 Years | 751 (82.6%) | 732 (88.7%) |
| 5 Years | 222 (96.5%) | 239 (81.0%) |
| 6 to 11 Years | 993 (81.8%) | 1,083 (90.3%) |
| 12 to 14 Years | 729 (88.7%) | 530 (88.2%) |
| 15 Years | 134 (79.3%) | 235 (74.6%) |
| 16 and 17 Years | 473 (87.3%) | 367 (96.8%) |
| 18 to 24 Years | 1,047 (76.9%) | 1,098 (81.5%) |
| 25 to 34 Years | 1,564 (84.6%) | 1,570 (89.4%) |
| 35 to 44 Years | 1,962 (92.7%) | 1,643 (79.5%) |
| 45 to 54 Years | 1,862 (87.8%) | 1,957 (91.3%) |
| 55 to 64 Years | 2,027 (88.1%) | 2,049 (85.7%) |
| 65 to 74 Years | 1,744 (95.4%) | 1,505 (86.6%) |
| 75 Years and over | 1,047 (93.4%) | 1,220 (88.3%) |
| Total | 14,555 (87.8%) | 14,228 (86.6%) |
Income Below Poverty Among Married-Couple Families in Fannin County
The poverty statistics for married-couple families in Fannin County show that 4.4% or 294 of the total 6,617 families live below the poverty line. Families with 5 or more children have the highest poverty rate of 28.4%, comprising of 25 families. On the other hand, families with 1 or 2 children have the lowest poverty rate of 1.9%, which includes 42 families.
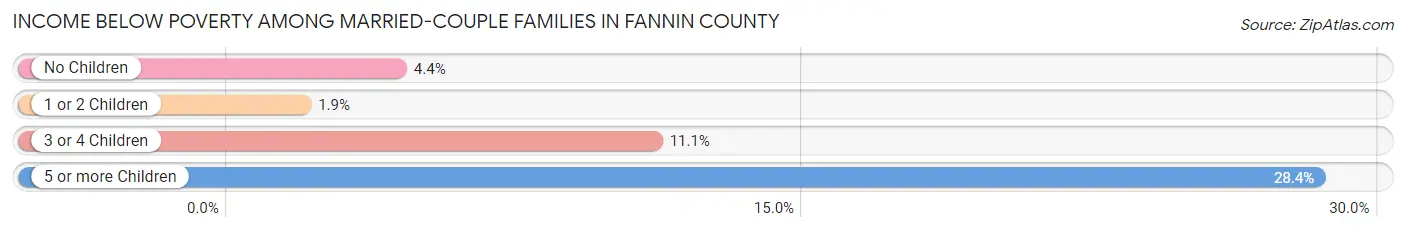
| Children | Above Poverty | Below Poverty |
| No Children | 3,620 (95.6%) | 167 (4.4%) |
| 1 or 2 Children | 2,159 (98.1%) | 42 (1.9%) |
| 3 or 4 Children | 481 (88.9%) | 60 (11.1%) |
| 5 or more Children | 63 (71.6%) | 25 (28.4%) |
| Total | 6,323 (95.6%) | 294 (4.4%) |
Income Below Poverty Among Single-Parent Households in Fannin County
According to the poverty data in Fannin County, 12.3% or 92 single-father households and 26.1% or 367 single-mother households are living below the poverty line. Among single-father households, those with 3 or 4 children have the highest poverty rate, with 13 households (46.4%) experiencing poverty. Likewise, among single-mother households, those with 5 or more children have the highest poverty rate, with 11 households (78.6%) falling below the poverty line.
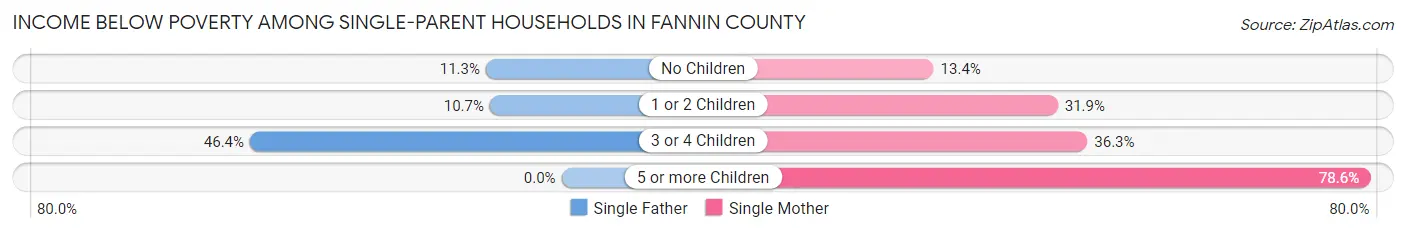
| Children | Single Father | Single Mother |
| No Children | 38 (11.3%) | 70 (13.4%) |
| 1 or 2 Children | 41 (10.7%) | 225 (31.9%) |
| 3 or 4 Children | 13 (46.4%) | 61 (36.3%) |
| 5 or more Children | 0 (0.0%) | 11 (78.6%) |
| Total | 92 (12.3%) | 367 (26.1%) |
Income Below Poverty Among Married-Couple vs Single-Parent Households in Fannin County
The poverty data for Fannin County shows that 294 of the married-couple family households (4.4%) and 459 of the single-parent households (21.3%) are living below the poverty level. Within the married-couple family households, those with 5 or more children have the highest poverty rate, with 25 households (28.4%) falling below the poverty line. Among the single-parent households, those with 5 or more children have the highest poverty rate, with 11 household (78.6%) living below poverty.
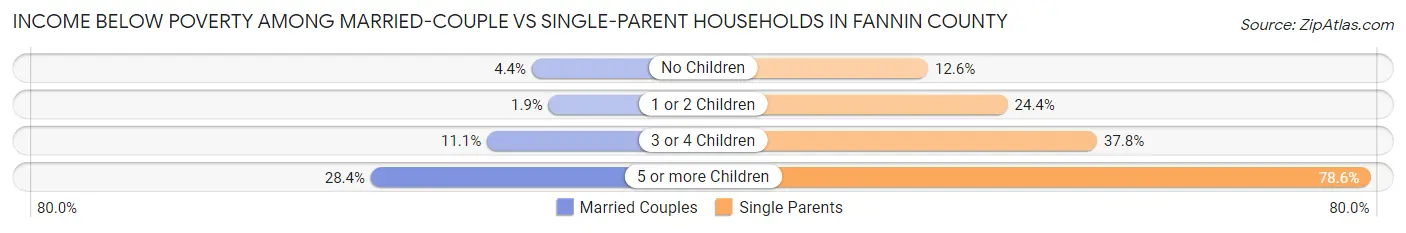
| Children | Married-Couple Families | Single-Parent Households |
| No Children | 167 (4.4%) | 108 (12.6%) |
| 1 or 2 Children | 42 (1.9%) | 266 (24.4%) |
| 3 or 4 Children | 60 (11.1%) | 74 (37.8%) |
| 5 or more Children | 25 (28.4%) | 11 (78.6%) |
| Total | 294 (4.4%) | 459 (21.3%) |
Race in Fannin County
The most populous races in Fannin County are White / Caucasian (30,856 | 85.6%), Hispanic or Latino (4,557 | 12.6%), and Black / African American (2,175 | 6.0%).
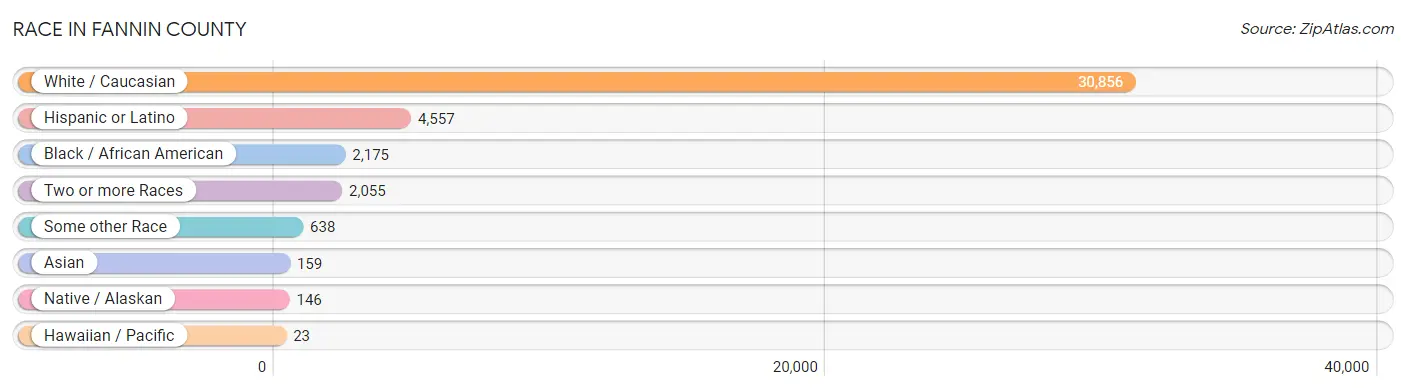
| Race | # Population | % Population |
| Asian | 159 | 0.4% |
| Black / African American | 2,175 | 6.0% |
| Hawaiian / Pacific | 23 | 0.1% |
| Hispanic or Latino | 4,557 | 12.6% |
| Native / Alaskan | 146 | 0.4% |
| White / Caucasian | 30,856 | 85.6% |
| Two or more Races | 2,055 | 5.7% |
| Some other Race | 638 | 1.8% |
| Total | 36,052 | 100.0% |
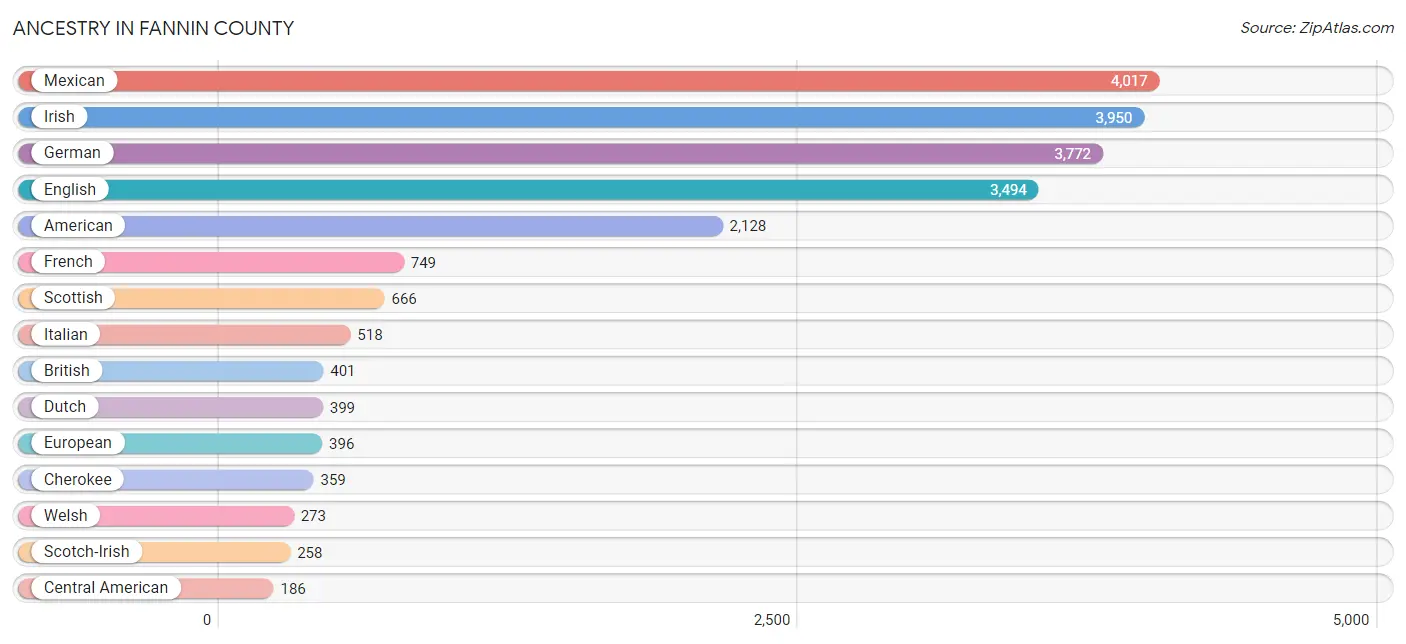
Ancestry in Fannin County
The most populous ancestries reported in Fannin County are Mexican (4,017 | 11.1%), Irish (3,950 | 11.0%), German (3,772 | 10.5%), English (3,494 | 9.7%), and American (2,128 | 5.9%), together accounting for 48.1% of all Fannin County residents.
| Ancestry | # Population | % Population |
| African | 89 | 0.3% |
| American | 2,128 | 5.9% |
| Apache | 5 | 0.0% |
| Arab | 77 | 0.2% |
| Argentinean | 9 | 0.0% |
| Armenian | 20 | 0.1% |
| Austrian | 4 | 0.0% |
| Basque | 5 | 0.0% |
| Belgian | 21 | 0.1% |
| Bhutanese | 21 | 0.1% |
| Blackfeet | 33 | 0.1% |
| Brazilian | 45 | 0.1% |
| British | 401 | 1.1% |
| Burmese | 91 | 0.3% |
| Cajun | 30 | 0.1% |
| Canadian | 22 | 0.1% |
| Central American | 186 | 0.5% |
| Cherokee | 359 | 1.0% |
| Chickasaw | 48 | 0.1% |
| Chippewa | 24 | 0.1% |
| Choctaw | 175 | 0.5% |
| Colombian | 26 | 0.1% |
| Comanche | 3 | 0.0% |
| Costa Rican | 9 | 0.0% |
| Creek | 11 | 0.0% |
| Croatian | 11 | 0.0% |
| Cuban | 27 | 0.1% |
| Czech | 82 | 0.2% |
| Czechoslovakian | 2 | 0.0% |
| Danish | 76 | 0.2% |
| Delaware | 1 | 0.0% |
| Dutch | 399 | 1.1% |
| Dutch West Indian | 15 | 0.0% |
| Eastern European | 12 | 0.0% |
| Egyptian | 3 | 0.0% |
| English | 3,494 | 9.7% |
| European | 396 | 1.1% |
| French | 749 | 2.1% |
| French Canadian | 20 | 0.1% |
| German | 3,772 | 10.5% |
| Greek | 10 | 0.0% |
| Guamanian / Chamorro | 82 | 0.2% |
| Guatemalan | 24 | 0.1% |
| Honduran | 117 | 0.3% |
| Hungarian | 24 | 0.1% |
| Indian (Asian) | 130 | 0.4% |
| Indonesian | 54 | 0.2% |
| Inupiat | 1 | 0.0% |
| Iranian | 36 | 0.1% |
| Irish | 3,950 | 11.0% |
| Iroquois | 1 | 0.0% |
| Italian | 518 | 1.4% |
| Jordanian | 9 | 0.0% |
| Korean | 48 | 0.1% |
| Lebanese | 22 | 0.1% |
| Maltese | 17 | 0.1% |
| Mexican | 4,017 | 11.1% |
| Native Hawaiian | 55 | 0.2% |
| Northern European | 28 | 0.1% |
| Norwegian | 80 | 0.2% |
| Pakistani | 11 | 0.0% |
| Polish | 185 | 0.5% |
| Portuguese | 80 | 0.2% |
| Potawatomi | 23 | 0.1% |
| Puerto Rican | 14 | 0.0% |
| Romanian | 51 | 0.1% |
| Russian | 74 | 0.2% |
| Salvadoran | 36 | 0.1% |
| Scandinavian | 150 | 0.4% |
| Scotch-Irish | 258 | 0.7% |
| Scottish | 666 | 1.8% |
| Seminole | 2 | 0.0% |
| Sioux | 4 | 0.0% |
| Somali | 6 | 0.0% |
| South American | 35 | 0.1% |
| Spaniard | 36 | 0.1% |
| Spanish | 60 | 0.2% |
| Sri Lankan | 112 | 0.3% |
| Subsaharan African | 95 | 0.3% |
| Swedish | 124 | 0.3% |
| Swiss | 131 | 0.4% |
| Ukrainian | 65 | 0.2% |
| Welsh | 273 | 0.8% | View All 83 Rows |
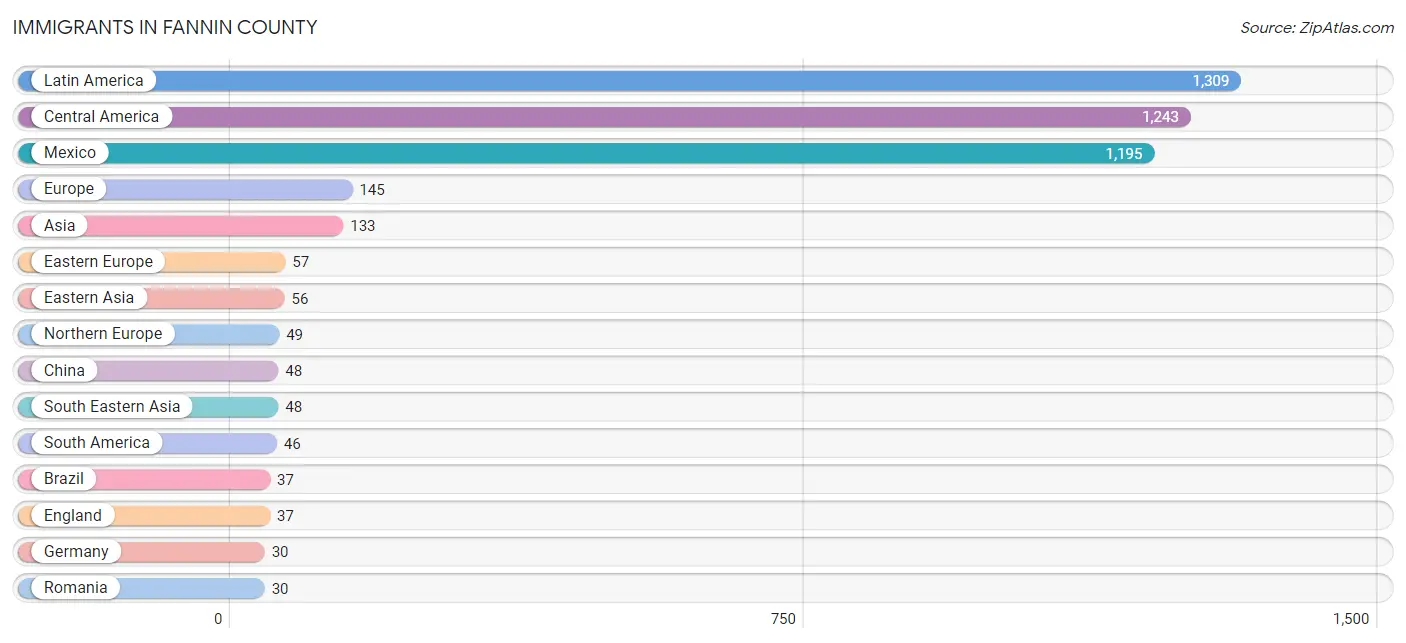
Immigrants in Fannin County
The most numerous immigrant groups reported in Fannin County came from Latin America (1,309 | 3.6%), Central America (1,243 | 3.5%), Mexico (1,195 | 3.3%), Europe (145 | 0.4%), and Asia (133 | 0.4%), together accounting for 11.2% of all Fannin County residents.
| Immigration Origin | # Population | % Population |
| Africa | 8 | 0.0% |
| Argentina | 9 | 0.0% |
| Asia | 133 | 0.4% |
| Australia | 17 | 0.1% |
| Brazil | 37 | 0.1% |
| Cameroon | 3 | 0.0% |
| Canada | 25 | 0.1% |
| Caribbean | 20 | 0.1% |
| Central America | 1,243 | 3.5% |
| China | 48 | 0.1% |
| Cuba | 10 | 0.0% |
| Eastern Asia | 56 | 0.2% |
| Eastern Europe | 57 | 0.2% |
| El Salvador | 19 | 0.1% |
| England | 37 | 0.1% |
| Europe | 145 | 0.4% |
| Germany | 30 | 0.1% |
| Guatemala | 1 | 0.0% |
| Honduras | 28 | 0.1% |
| Iran | 29 | 0.1% |
| Ireland | 9 | 0.0% |
| Jamaica | 10 | 0.0% |
| Korea | 8 | 0.0% |
| Latin America | 1,309 | 3.6% |
| Mexico | 1,195 | 3.3% |
| Middle Africa | 3 | 0.0% |
| Northern Africa | 4 | 0.0% |
| Northern Europe | 49 | 0.1% |
| Oceania | 17 | 0.1% |
| Philippines | 4 | 0.0% |
| Poland | 13 | 0.0% |
| Romania | 30 | 0.1% |
| Russia | 14 | 0.0% |
| South America | 46 | 0.1% |
| South Central Asia | 29 | 0.1% |
| South Eastern Asia | 48 | 0.1% |
| Southern Europe | 9 | 0.0% |
| Spain | 9 | 0.0% |
| Sweden | 3 | 0.0% |
| Thailand | 7 | 0.0% |
| Western Europe | 30 | 0.1% | View All 41 Rows |
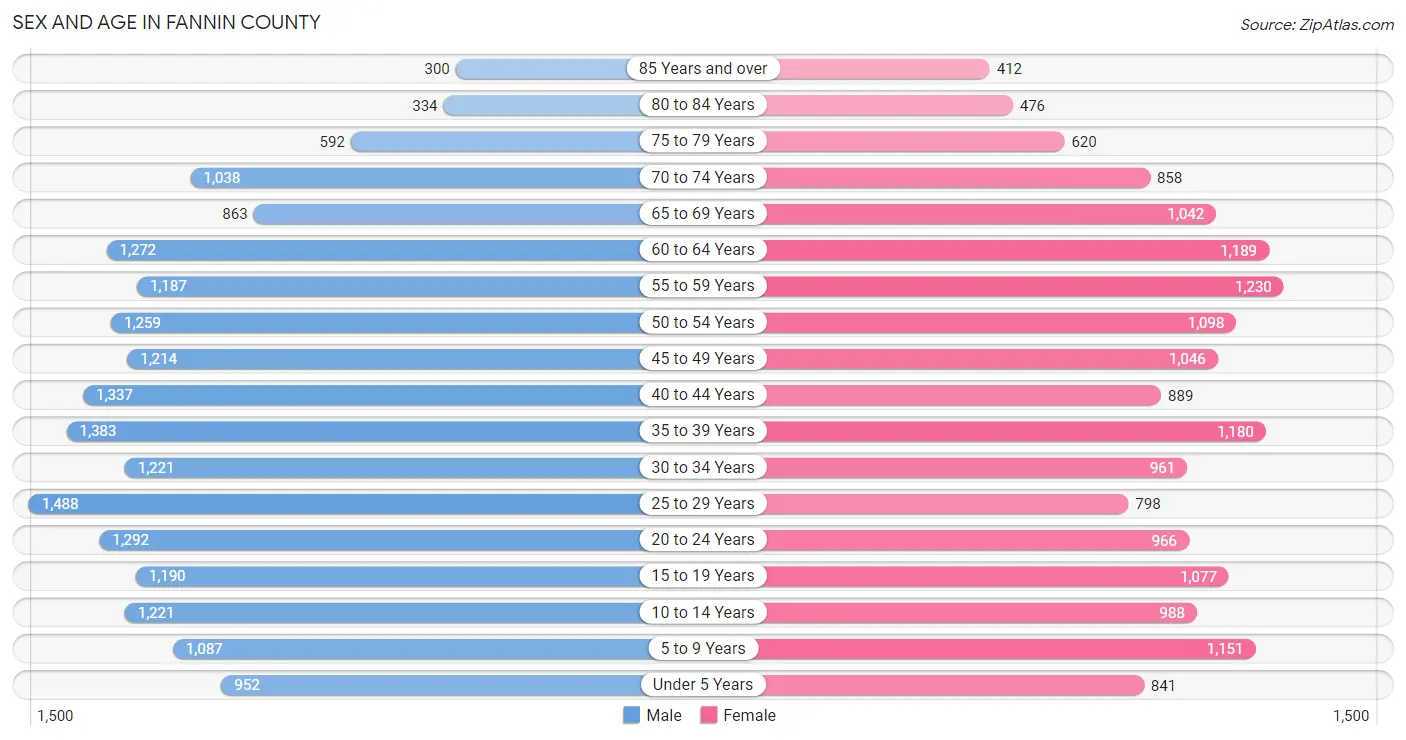
Sex and Age in Fannin County
Sex and Age in Fannin County
The most populous age groups in Fannin County are 25 to 29 Years (1,488 | 7.7%) for men and 55 to 59 Years (1,230 | 7.3%) for women.
| Age Bracket | Male | Female |
| Under 5 Years | 952 (5.0%) | 841 (5.0%) |
| 5 to 9 Years | 1,087 (5.7%) | 1,151 (6.8%) |
| 10 to 14 Years | 1,221 (6.4%) | 988 (5.9%) |
| 15 to 19 Years | 1,190 (6.2%) | 1,077 (6.4%) |
| 20 to 24 Years | 1,292 (6.7%) | 966 (5.7%) |
| 25 to 29 Years | 1,488 (7.7%) | 798 (4.7%) |
| 30 to 34 Years | 1,221 (6.4%) | 961 (5.7%) |
| 35 to 39 Years | 1,383 (7.2%) | 1,180 (7.0%) |
| 40 to 44 Years | 1,337 (7.0%) | 889 (5.3%) |
| 45 to 49 Years | 1,214 (6.3%) | 1,046 (6.2%) |
| 50 to 54 Years | 1,259 (6.6%) | 1,098 (6.5%) |
| 55 to 59 Years | 1,187 (6.2%) | 1,230 (7.3%) |
| 60 to 64 Years | 1,272 (6.6%) | 1,189 (7.1%) |
| 65 to 69 Years | 863 (4.5%) | 1,042 (6.2%) |
| 70 to 74 Years | 1,038 (5.4%) | 858 (5.1%) |
| 75 to 79 Years | 592 (3.1%) | 620 (3.7%) |
| 80 to 84 Years | 334 (1.7%) | 476 (2.8%) |
| 85 Years and over | 300 (1.6%) | 412 (2.5%) |
| Total | 19,230 (100.0%) | 16,822 (100.0%) |
Families and Households in Fannin County
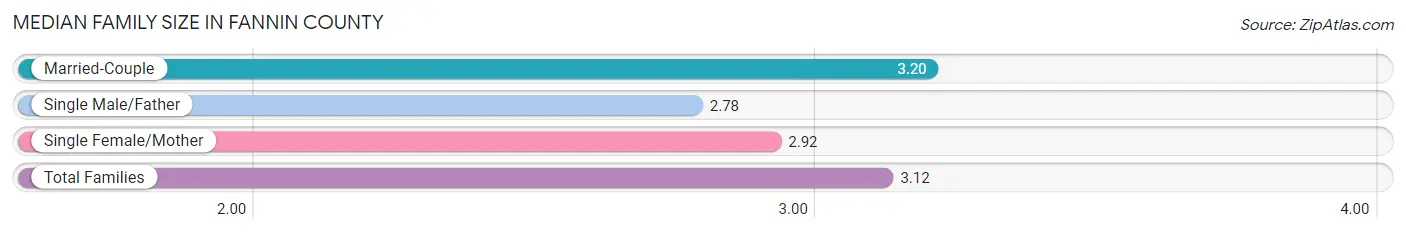
Median Family Size in Fannin County
The median family size in Fannin County is 3.12 persons per family, with married-couple families (6,617 | 75.4%) accounting for the largest median family size of 3.2 persons per family. On the other hand, single male/father families (749 | 8.5%) represent the smallest median family size with 2.78 persons per family.
| Family Type | # Families | Family Size |
| Married-Couple | 6,617 (75.4%) | 3.20 |
| Single Male/Father | 749 (8.5%) | 2.78 |
| Single Female/Mother | 1,409 (16.1%) | 2.92 |
| Total Families | 8,775 (100.0%) | 3.12 |
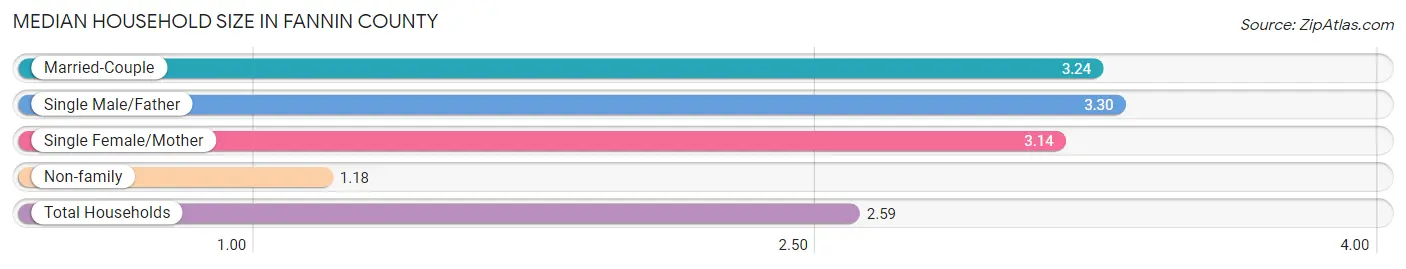
Median Household Size in Fannin County
The median household size in Fannin County is 2.59 persons per household, with single male/father households (749 | 5.9%) accounting for the largest median household size of 3.3 persons per household. non-family households (3,924 | 30.9%) represent the smallest median household size with 1.18 persons per household.
| Household Type | # Households | Household Size |
| Married-Couple | 6,617 (52.1%) | 3.24 |
| Single Male/Father | 749 (5.9%) | 3.30 |
| Single Female/Mother | 1,409 (11.1%) | 3.14 |
| Non-family | 3,924 (30.9%) | 1.18 |
| Total Households | 12,699 (100.0%) | 2.59 |
Household Size by Marriage Status in Fannin County
Out of a total of 12,699 households in Fannin County, 8,775 (69.1%) are family households, while 3,924 (30.9%) are nonfamily households. The most numerous type of family households are 2-person households, comprising 3,763, and the most common type of nonfamily households are 1-person households, comprising 3,509.
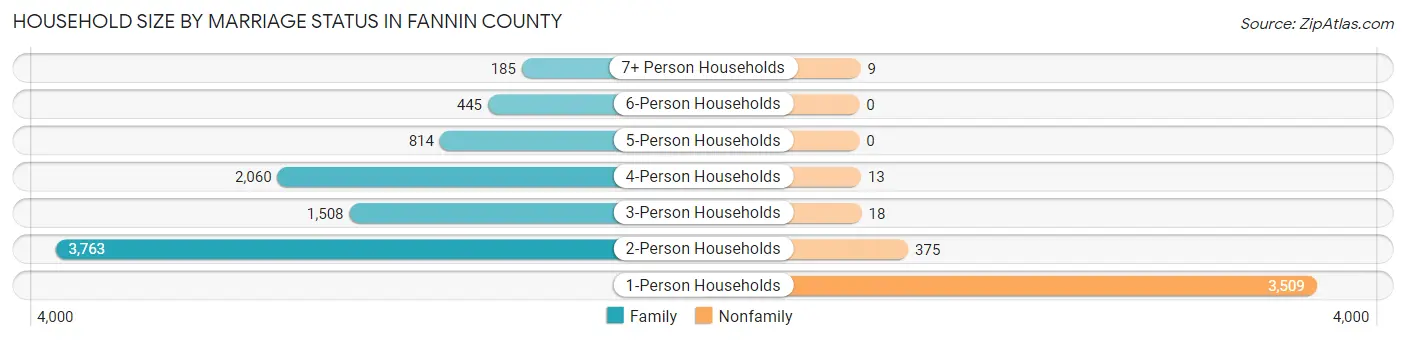
| Household Size | Family Households | Nonfamily Households |
| 1-Person Households | - | 3,509 (27.6%) |
| 2-Person Households | 3,763 (29.6%) | 375 (2.9%) |
| 3-Person Households | 1,508 (11.9%) | 18 (0.1%) |
| 4-Person Households | 2,060 (16.2%) | 13 (0.1%) |
| 5-Person Households | 814 (6.4%) | 0 (0.0%) |
| 6-Person Households | 445 (3.5%) | 0 (0.0%) |
| 7+ Person Households | 185 (1.5%) | 9 (0.1%) |
| Total | 8,775 (69.1%) | 3,924 (30.9%) |
Female Fertility in Fannin County
Fertility by Age in Fannin County
Average fertility rate in Fannin County is 52.0 births per 1,000 women. Women in the age bracket of 20 to 34 years have the highest fertility rate with 108.0 births per 1,000 women. Women in the age bracket of 20 to 34 years acount for 79.1% of all women with births.
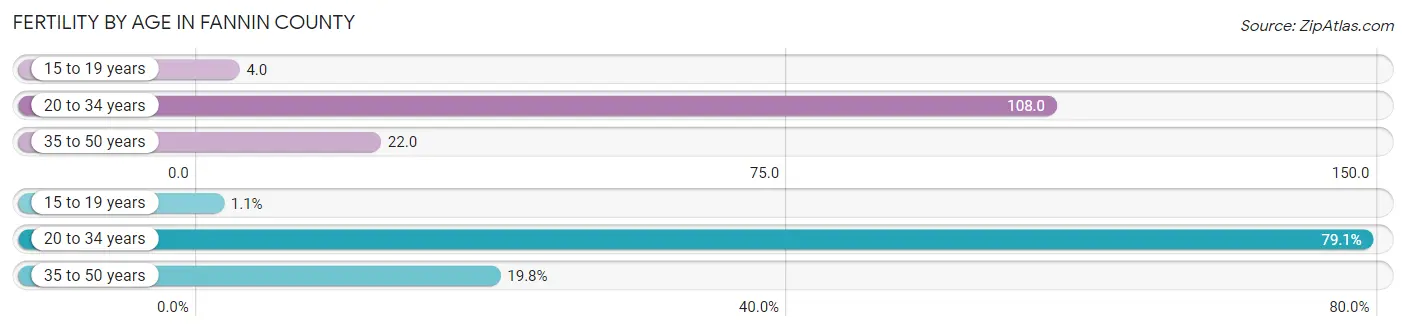
| Age Bracket | Women with Births | Births / 1,000 Women |
| 15 to 19 years | 4 (1.1%) | 4.0 |
| 20 to 34 years | 295 (79.1%) | 108.0 |
| 35 to 50 years | 74 (19.8%) | 22.0 |
| Total | 373 (100.0%) | 52.0 |
Fertility by Age by Marriage Status in Fannin County
77.5% of women with births (373) in Fannin County are married. The highest percentage of unmarried women with births falls into 20 to 34 years age bracket with 28.5% of them unmarried at the time of birth, while the lowest percentage of unmarried women with births belong to 15 to 19 years age bracket with 0.0% of them unmarried.
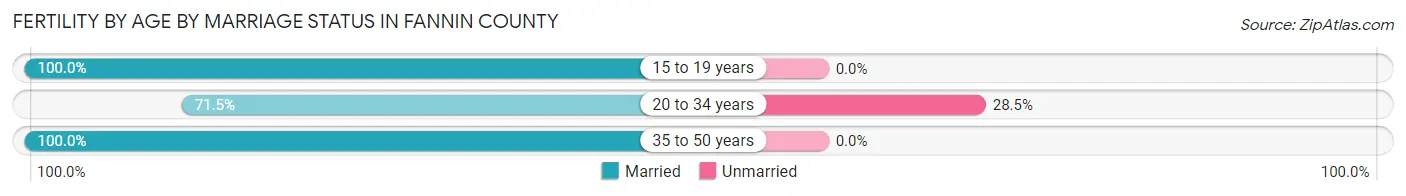
| Age Bracket | Married | Unmarried |
| 15 to 19 years | 4 (100.0%) | 0 (0.0%) |
| 20 to 34 years | 211 (71.5%) | 84 (28.5%) |
| 35 to 50 years | 74 (100.0%) | 0 (0.0%) |
| Total | 289 (77.5%) | 84 (22.5%) |
Fertility by Education in Fannin County
Average fertility rate in Fannin County is 52.0 births per 1,000 women. Women with the education attainment of bachelor's degree have the highest fertility rate of 112.0 births per 1,000 women, while women with the education attainment of less than high school have the lowest fertility at 11.0 births per 1,000 women. Women with the education attainment of high school diploma represent 36.7% of all women with births.
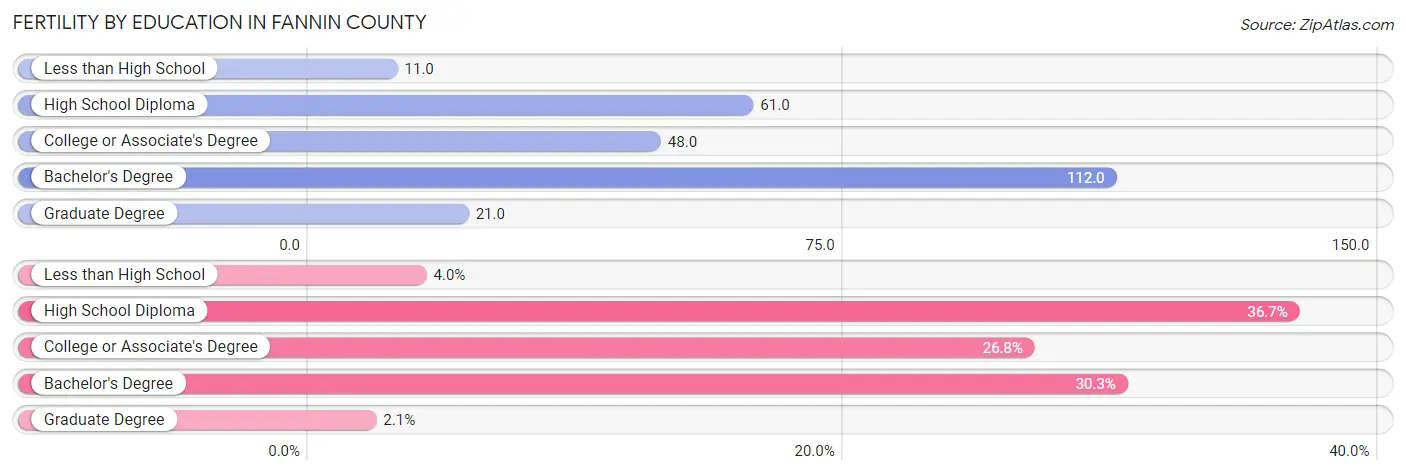
| Educational Attainment | Women with Births | Births / 1,000 Women |
| Less than High School | 15 (4.0%) | 11.0 |
| High School Diploma | 137 (36.7%) | 61.0 |
| College or Associate's Degree | 100 (26.8%) | 48.0 |
| Bachelor's Degree | 113 (30.3%) | 112.0 |
| Graduate Degree | 8 (2.1%) | 21.0 |
| Total | 373 (100.0%) | 52.0 |
Fertility by Education by Marriage Status in Fannin County
22.5% of women with births in Fannin County are unmarried. Women with the educational attainment of bachelor's degree are most likely to be married with 100.0% of them married at childbirth, while women with the educational attainment of college or associate's degree are least likely to be married with 60.0% of them unmarried at childbirth.
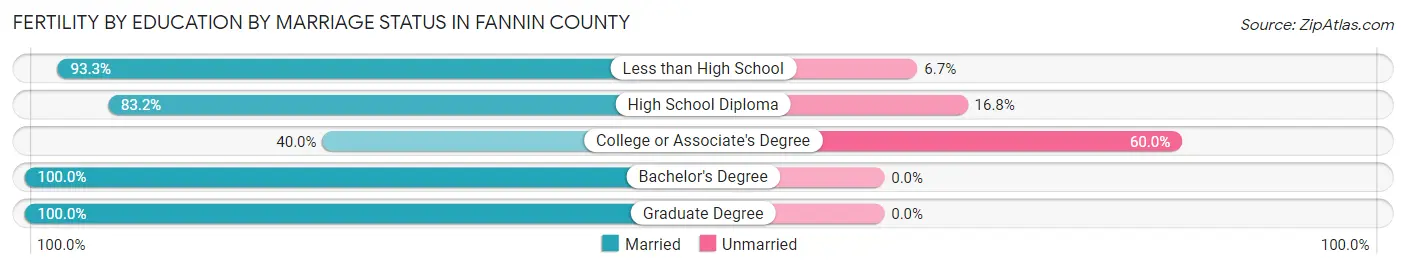
| Educational Attainment | Married | Unmarried |
| Less than High School | 14 (93.3%) | 1 (6.7%) |
| High School Diploma | 114 (83.2%) | 23 (16.8%) |
| College or Associate's Degree | 40 (40.0%) | 60 (60.0%) |
| Bachelor's Degree | 113 (100.0%) | 0 (0.0%) |
| Graduate Degree | 8 (100.0%) | 0 (0.0%) |
| Total | 289 (77.5%) | 84 (22.5%) |
Employment Characteristics in Fannin County
Employment by Class of Employer in Fannin County
Among the 14,759 employed individuals in Fannin County, private company employees (9,318 | 63.1%), self-employed (not incorporated) (1,726 | 11.7%), and local government employees (1,621 | 11.0%) make up the most common classes of employment.
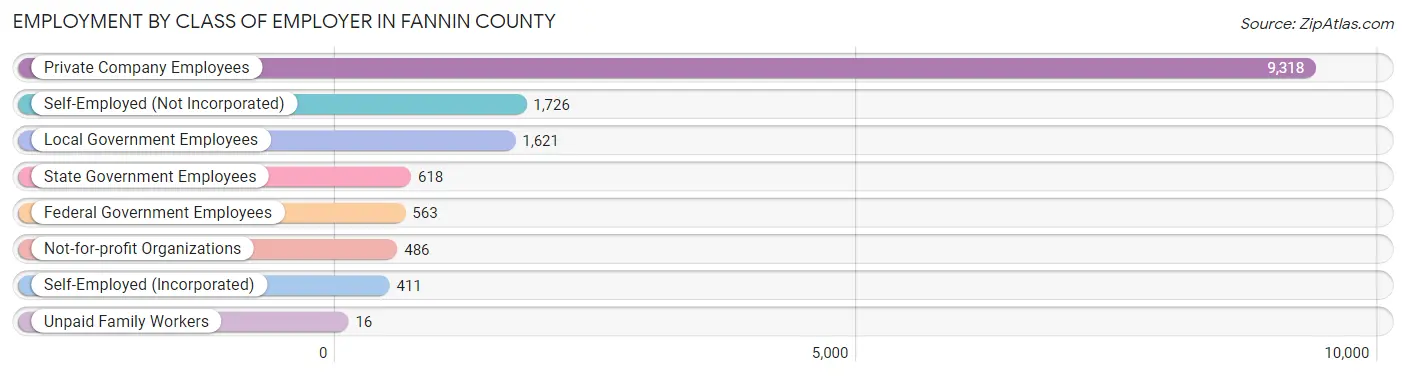
| Employer Class | # Employees | % Employees |
| Private Company Employees | 9,318 | 63.1% |
| Self-Employed (Incorporated) | 411 | 2.8% |
| Self-Employed (Not Incorporated) | 1,726 | 11.7% |
| Not-for-profit Organizations | 486 | 3.3% |
| Local Government Employees | 1,621 | 11.0% |
| State Government Employees | 618 | 4.2% |
| Federal Government Employees | 563 | 3.8% |
| Unpaid Family Workers | 16 | 0.1% |
| Total | 14,759 | 100.0% |
Employment Status by Age in Fannin County
According to the labor force statistics for Fannin County, out of the total population over 16 years of age (29,328), 53.9% or 15,808 individuals are in the labor force, with 4.7% or 743 of them unemployed. The age group with the highest labor force participation rate is 35 to 44 years, with 74.6% or 3,573 individuals in the labor force. Within the labor force, the 25 to 29 years age range has the highest percentage of unemployed individuals, with 13.8% or 174 of them being unemployed.
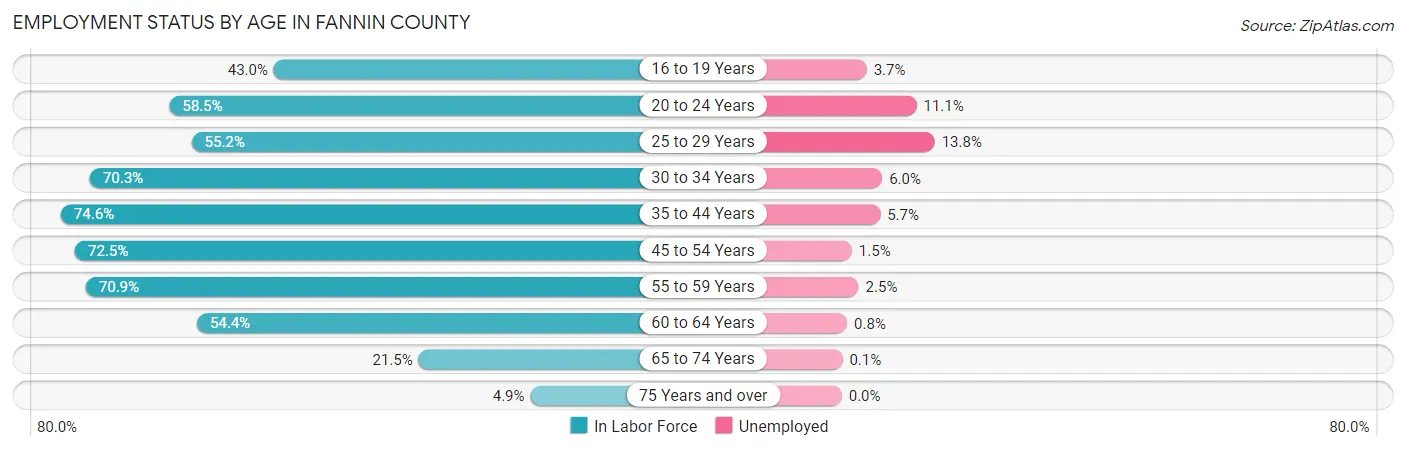
| Age Bracket | In Labor Force | Unemployed |
| 16 to 19 Years | 767 (43.0%) | 28 (3.7%) |
| 20 to 24 Years | 1,321 (58.5%) | 147 (11.1%) |
| 25 to 29 Years | 1,262 (55.2%) | 174 (13.8%) |
| 30 to 34 Years | 1,534 (70.3%) | 92 (6.0%) |
| 35 to 44 Years | 3,573 (74.6%) | 204 (5.7%) |
| 45 to 54 Years | 3,347 (72.5%) | 50 (1.5%) |
| 55 to 59 Years | 1,714 (70.9%) | 43 (2.5%) |
| 60 to 64 Years | 1,339 (54.4%) | 11 (0.8%) |
| 65 to 74 Years | 817 (21.5%) | 1 (0.1%) |
| 75 Years and over | 134 (4.9%) | 0 (0.0%) |
| Total | 15,808 (53.9%) | 743 (4.7%) |
Employment Status by Educational Attainment in Fannin County
According to labor force statistics for Fannin County, 68.1% of individuals (12,770) out of the total population between 25 and 64 years of age (18,752) are in the labor force, with 4.5% or 575 of them being unemployed. The group with the highest labor force participation rate are those with the educational attainment of bachelor's degree or higher, with 87.5% or 3,155 individuals in the labor force. Within the labor force, individuals with high school diploma education have the highest percentage of unemployment, with 6.5% or 277 of them being unemployed.
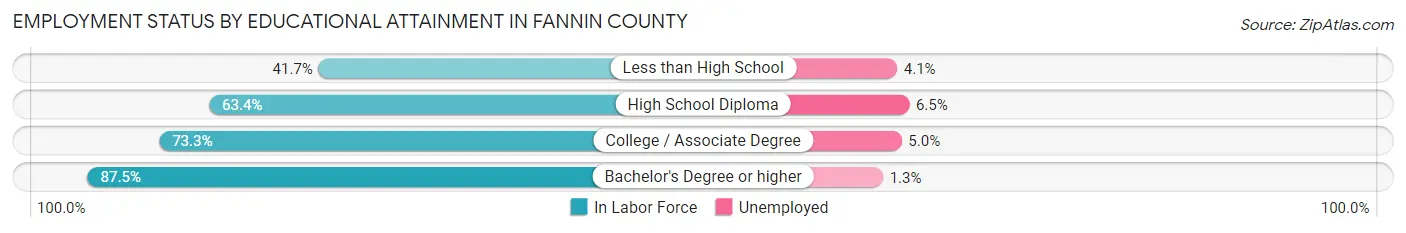
| Educational Attainment | In Labor Force | Unemployed |
| Less than High School | 1,085 (41.7%) | 107 (4.1%) |
| High School Diploma | 4,262 (63.4%) | 437 (6.5%) |
| College / Associate Degree | 4,267 (73.3%) | 291 (5.0%) |
| Bachelor's Degree or higher | 3,155 (87.5%) | 47 (1.3%) |
| Total | 12,770 (68.1%) | 844 (4.5%) |
Employment Occupations by Sex in Fannin County
Management, Business, Science and Arts Occupations
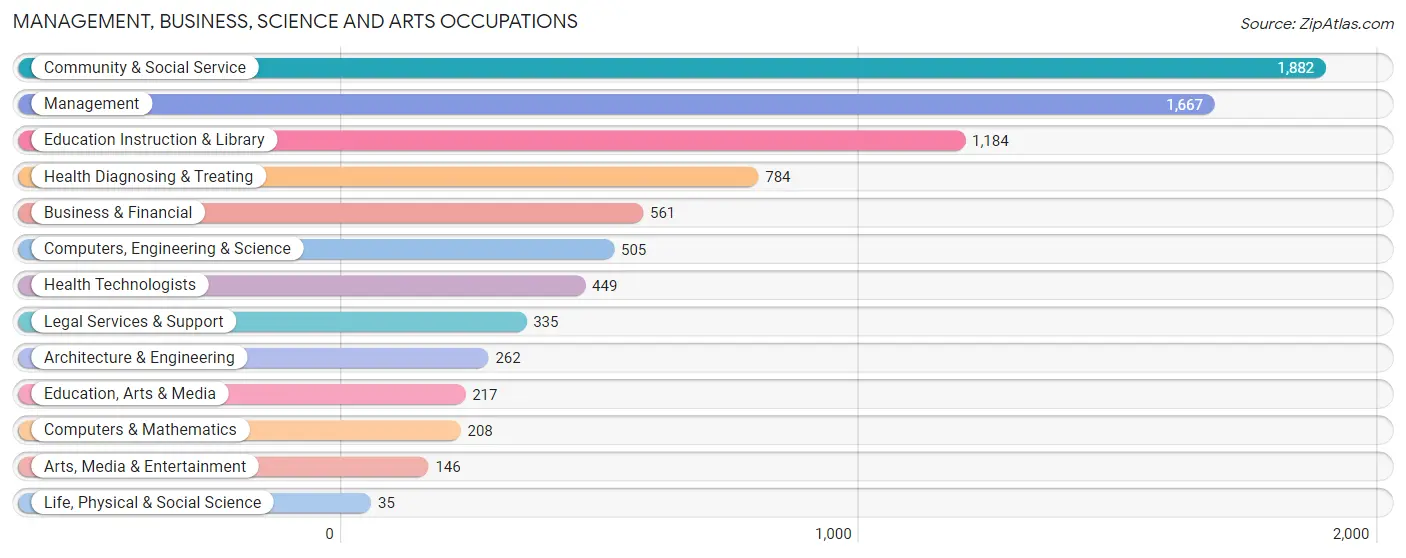
The most common Management, Business, Science and Arts occupations in Fannin County are Community & Social Service (1,882 | 12.5%), Management (1,667 | 11.1%), Education Instruction & Library (1,184 | 7.9%), Health Diagnosing & Treating (784 | 5.2%), and Business & Financial (561 | 3.7%).
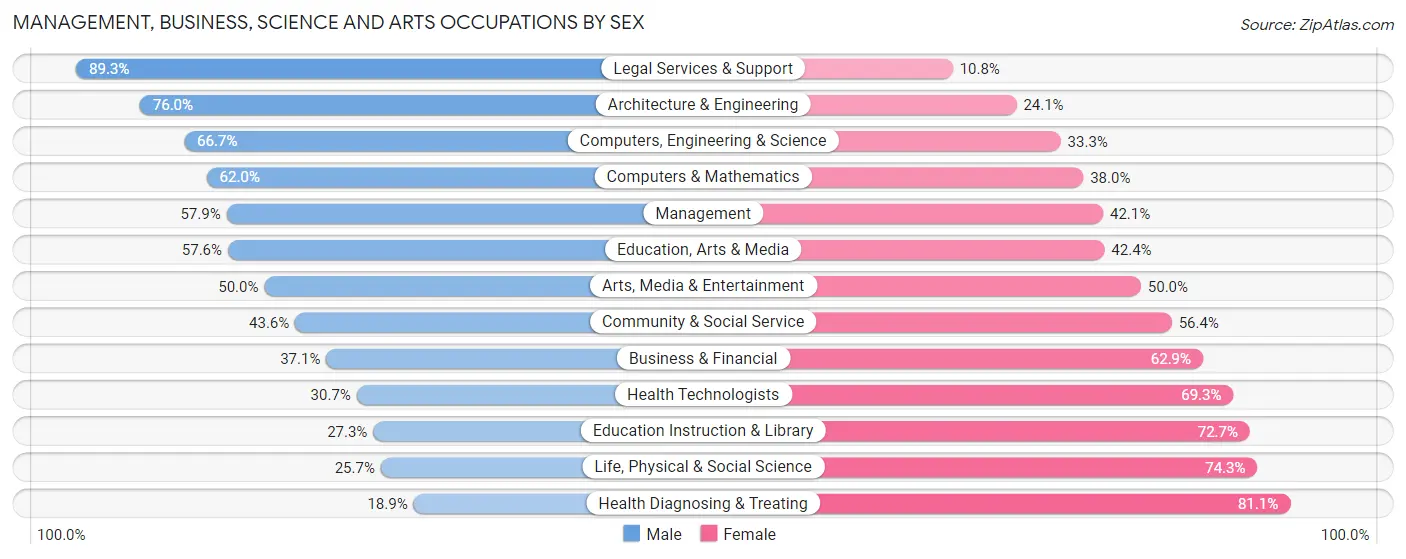
Management, Business, Science and Arts Occupations by Sex
Within the Management, Business, Science and Arts occupations in Fannin County, the most male-oriented occupations are Legal Services & Support (89.2%), Architecture & Engineering (75.9%), and Computers, Engineering & Science (66.7%), while the most female-oriented occupations are Health Diagnosing & Treating (81.1%), Life, Physical & Social Science (74.3%), and Education Instruction & Library (72.7%).
| Occupation | Male | Female |
| Management | 965 (57.9%) | 702 (42.1%) |
| Business & Financial | 208 (37.1%) | 353 (62.9%) |
| Computers, Engineering & Science | 337 (66.7%) | 168 (33.3%) |
| Computers & Mathematics | 129 (62.0%) | 79 (38.0%) |
| Architecture & Engineering | 199 (75.9%) | 63 (24.0%) |
| Life, Physical & Social Science | 9 (25.7%) | 26 (74.3%) |
| Community & Social Service | 820 (43.6%) | 1,062 (56.4%) |
| Education, Arts & Media | 125 (57.6%) | 92 (42.4%) |
| Legal Services & Support | 299 (89.2%) | 36 (10.7%) |
| Education Instruction & Library | 323 (27.3%) | 861 (72.7%) |
| Arts, Media & Entertainment | 73 (50.0%) | 73 (50.0%) |
| Health Diagnosing & Treating | 148 (18.9%) | 636 (81.1%) |
| Health Technologists | 138 (30.7%) | 311 (69.3%) |
| Total (Category) | 2,478 (45.9%) | 2,921 (54.1%) |
| Total (Overall) | 8,341 (55.4%) | 6,719 (44.6%) |
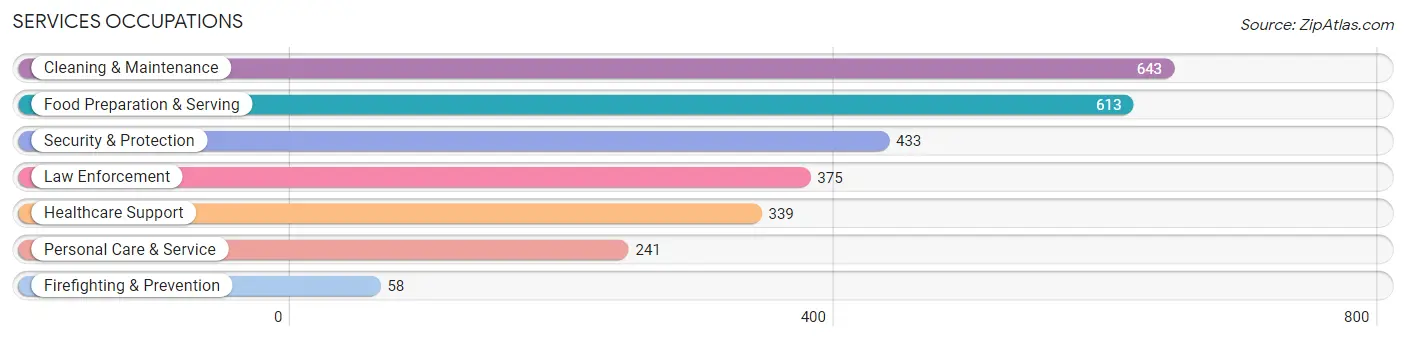
Services Occupations
The most common Services occupations in Fannin County are Cleaning & Maintenance (643 | 4.3%), Food Preparation & Serving (613 | 4.1%), Security & Protection (433 | 2.9%), Law Enforcement (375 | 2.5%), and Healthcare Support (339 | 2.2%).
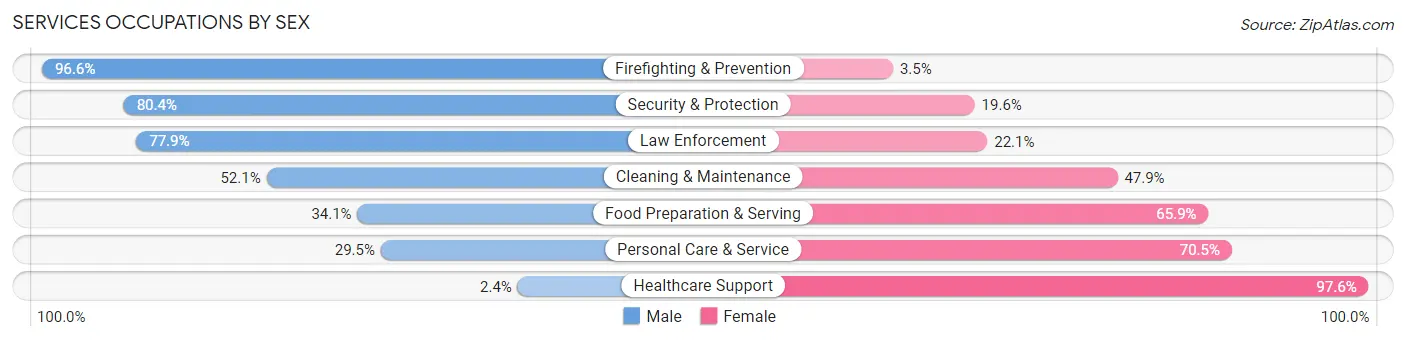
Services Occupations by Sex
Within the Services occupations in Fannin County, the most male-oriented occupations are Firefighting & Prevention (96.6%), Security & Protection (80.4%), and Law Enforcement (77.9%), while the most female-oriented occupations are Healthcare Support (97.6%), Personal Care & Service (70.5%), and Food Preparation & Serving (65.9%).
| Occupation | Male | Female |
| Healthcare Support | 8 (2.4%) | 331 (97.6%) |
| Security & Protection | 348 (80.4%) | 85 (19.6%) |
| Firefighting & Prevention | 56 (96.6%) | 2 (3.5%) |
| Law Enforcement | 292 (77.9%) | 83 (22.1%) |
| Food Preparation & Serving | 209 (34.1%) | 404 (65.9%) |
| Cleaning & Maintenance | 335 (52.1%) | 308 (47.9%) |
| Personal Care & Service | 71 (29.5%) | 170 (70.5%) |
| Total (Category) | 971 (42.8%) | 1,298 (57.2%) |
| Total (Overall) | 8,341 (55.4%) | 6,719 (44.6%) |
Sales and Office Occupations
The most common Sales and Office occupations in Fannin County are Office & Administration (1,773 | 11.8%), and Sales & Related (1,394 | 9.3%).

Sales and Office Occupations by Sex

| Occupation | Male | Female |
| Sales & Related | 674 (48.3%) | 720 (51.6%) |
| Office & Administration | 475 (26.8%) | 1,298 (73.2%) |
| Total (Category) | 1,149 (36.3%) | 2,018 (63.7%) |
| Total (Overall) | 8,341 (55.4%) | 6,719 (44.6%) |
Natural Resources, Construction and Maintenance Occupations
The most common Natural Resources, Construction and Maintenance occupations in Fannin County are Construction & Extraction (1,137 | 7.5%), Installation, Maintenance & Repair (673 | 4.5%), and Farming, Fishing & Forestry (223 | 1.5%).
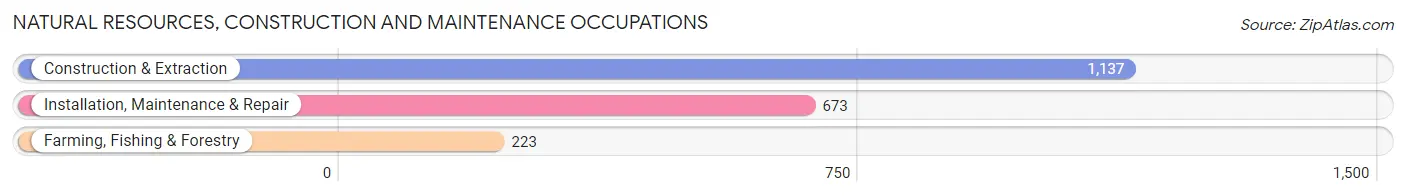
Natural Resources, Construction and Maintenance Occupations by Sex
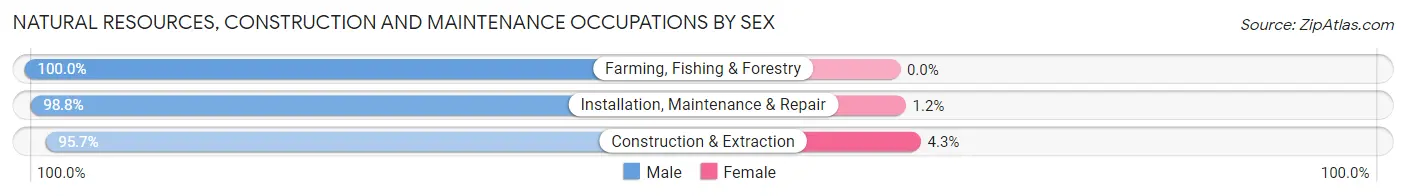
| Occupation | Male | Female |
| Farming, Fishing & Forestry | 223 (100.0%) | 0 (0.0%) |
| Construction & Extraction | 1,088 (95.7%) | 49 (4.3%) |
| Installation, Maintenance & Repair | 665 (98.8%) | 8 (1.2%) |
| Total (Category) | 1,976 (97.2%) | 57 (2.8%) |
| Total (Overall) | 8,341 (55.4%) | 6,719 (44.6%) |
Production, Transportation and Moving Occupations
The most common Production, Transportation and Moving occupations in Fannin County are Production (1,085 | 7.2%), Material Moving (560 | 3.7%), and Transportation (547 | 3.6%).
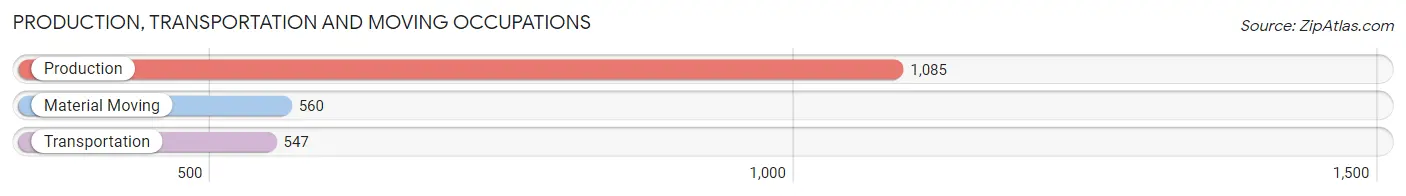
Production, Transportation and Moving Occupations by Sex
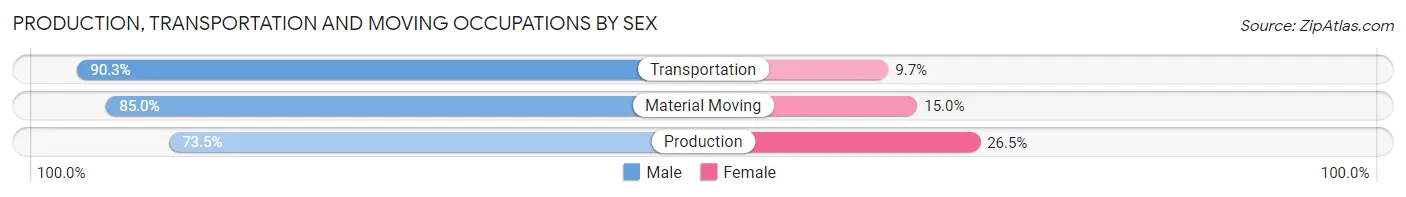
| Occupation | Male | Female |
| Production | 797 (73.5%) | 288 (26.5%) |
| Transportation | 494 (90.3%) | 53 (9.7%) |
| Material Moving | 476 (85.0%) | 84 (15.0%) |
| Total (Category) | 1,767 (80.6%) | 425 (19.4%) |
| Total (Overall) | 8,341 (55.4%) | 6,719 (44.6%) |
Employment Industries by Sex in Fannin County
Employment Industries in Fannin County
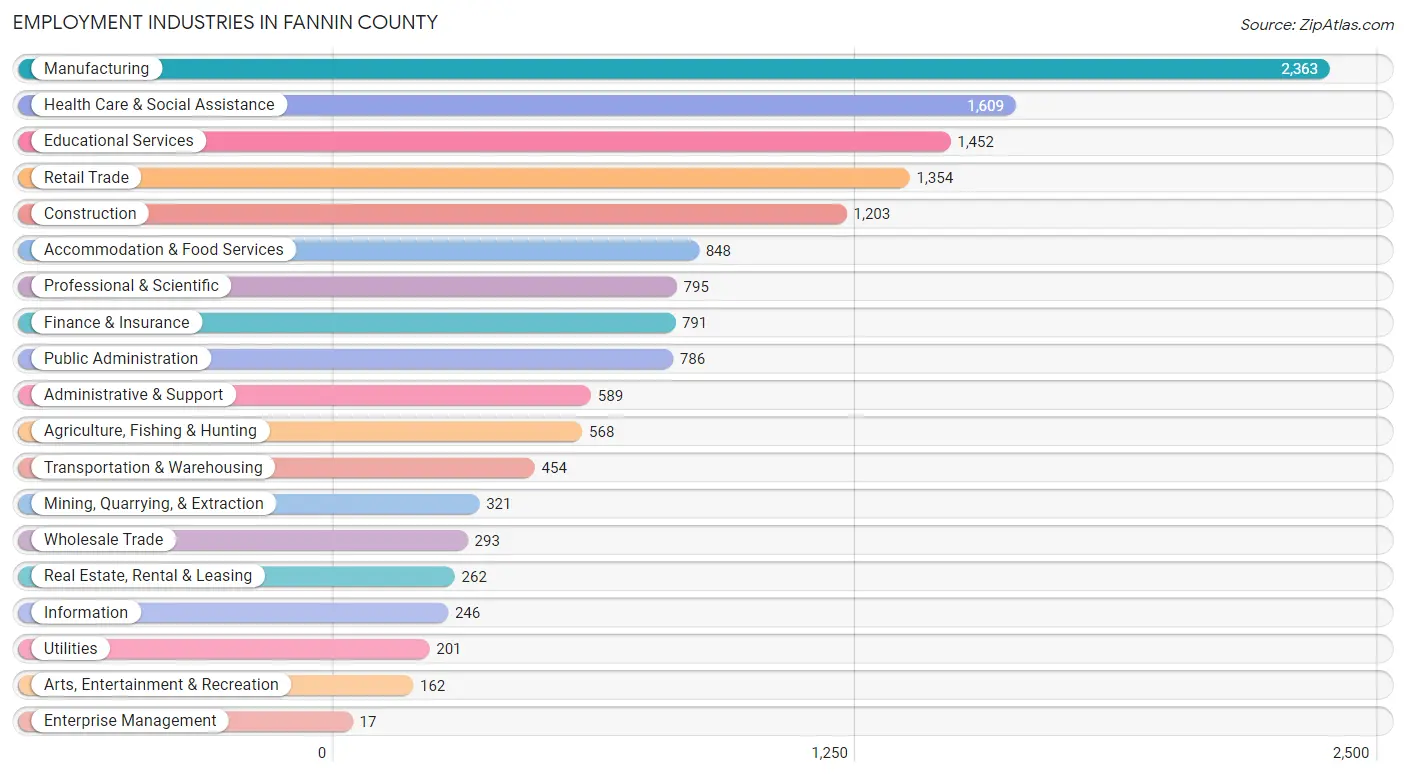
The major employment industries in Fannin County include Manufacturing (2,363 | 15.7%), Health Care & Social Assistance (1,609 | 10.7%), Educational Services (1,452 | 9.6%), Retail Trade (1,354 | 9.0%), and Construction (1,203 | 8.0%).
Employment Industries by Sex in Fannin County
The Fannin County industries that see more men than women are Construction (92.2%), Agriculture, Fishing & Hunting (91.9%), and Utilities (91.5%), whereas the industries that tend to have a higher number of women are Finance & Insurance (82.4%), Health Care & Social Assistance (81.7%), and Real Estate, Rental & Leasing (69.1%).
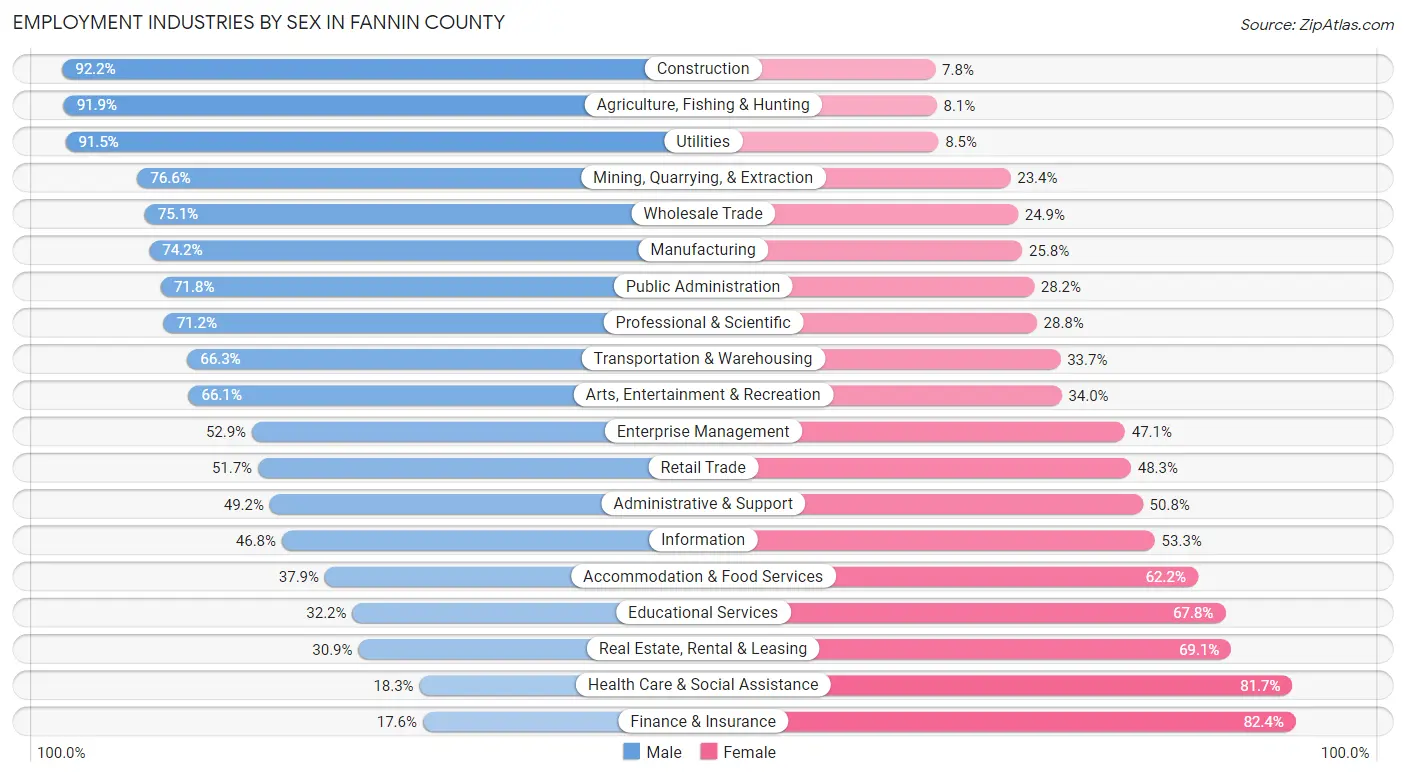
| Industry | Male | Female |
| Agriculture, Fishing & Hunting | 522 (91.9%) | 46 (8.1%) |
| Mining, Quarrying, & Extraction | 246 (76.6%) | 75 (23.4%) |
| Construction | 1,109 (92.2%) | 94 (7.8%) |
| Manufacturing | 1,753 (74.2%) | 610 (25.8%) |
| Wholesale Trade | 220 (75.1%) | 73 (24.9%) |
| Retail Trade | 700 (51.7%) | 654 (48.3%) |
| Transportation & Warehousing | 301 (66.3%) | 153 (33.7%) |
| Utilities | 184 (91.5%) | 17 (8.5%) |
| Information | 115 (46.8%) | 131 (53.2%) |
| Finance & Insurance | 139 (17.6%) | 652 (82.4%) |
| Real Estate, Rental & Leasing | 81 (30.9%) | 181 (69.1%) |
| Professional & Scientific | 566 (71.2%) | 229 (28.8%) |
| Enterprise Management | 9 (52.9%) | 8 (47.1%) |
| Administrative & Support | 290 (49.2%) | 299 (50.8%) |
| Educational Services | 467 (32.2%) | 985 (67.8%) |
| Health Care & Social Assistance | 294 (18.3%) | 1,315 (81.7%) |
| Arts, Entertainment & Recreation | 107 (66.0%) | 55 (34.0%) |
| Accommodation & Food Services | 321 (37.9%) | 527 (62.2%) |
| Public Administration | 564 (71.8%) | 222 (28.2%) |
| Total | 8,341 (55.4%) | 6,719 (44.6%) |
Education in Fannin County
School Enrollment in Fannin County
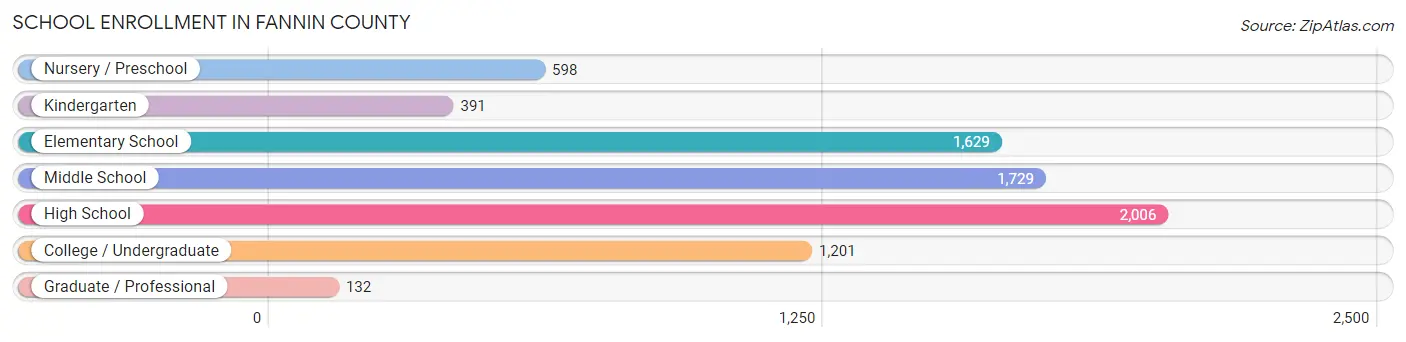
The most common levels of schooling among the 7,686 students in Fannin County are high school (2,006 | 26.1%), middle school (1,729 | 22.5%), and elementary school (1,629 | 21.2%).
| School Level | # Students | % Students |
| Nursery / Preschool | 598 | 7.8% |
| Kindergarten | 391 | 5.1% |
| Elementary School | 1,629 | 21.2% |
| Middle School | 1,729 | 22.5% |
| High School | 2,006 | 26.1% |
| College / Undergraduate | 1,201 | 15.6% |
| Graduate / Professional | 132 | 1.7% |
| Total | 7,686 | 100.0% |
School Enrollment by Age by Funding Source in Fannin County
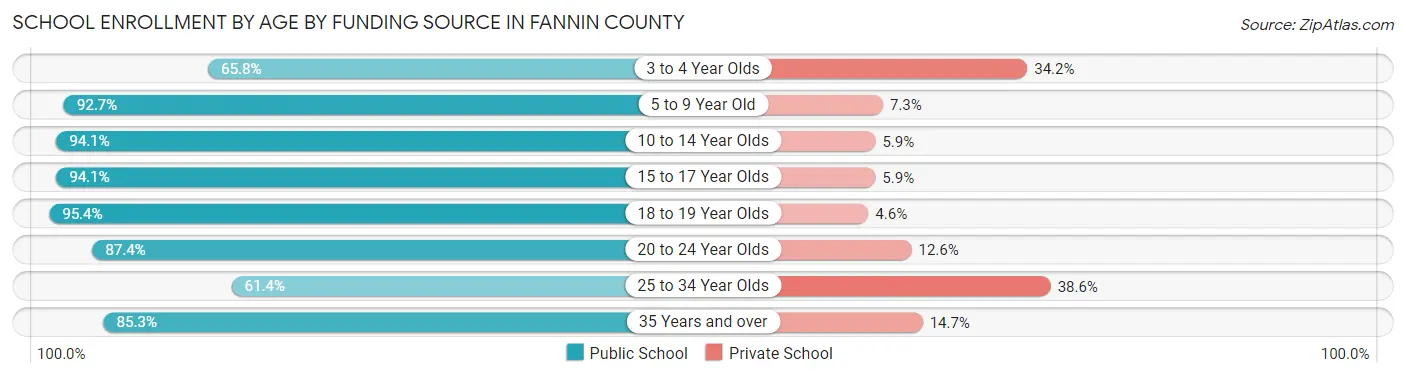
Out of a total of 7,686 students who are enrolled in schools in Fannin County, 753 (9.8%) attend a private institution, while the remaining 6,933 (90.2%) are enrolled in public schools. The age group of 25 to 34 year olds has the highest likelihood of being enrolled in private schools, with 145 (38.6% in the age bracket) enrolled. Conversely, the age group of 18 to 19 year olds has the lowest likelihood of being enrolled in a private school, with 538 (95.4% in the age bracket) attending a public institution.
| Age Bracket | Public School | Private School |
| 3 to 4 Year Olds | 227 (65.8%) | 118 (34.2%) |
| 5 to 9 Year Old | 1,937 (92.7%) | 153 (7.3%) |
| 10 to 14 Year Olds | 1,988 (94.1%) | 125 (5.9%) |
| 15 to 17 Year Olds | 1,305 (94.1%) | 82 (5.9%) |
| 18 to 19 Year Olds | 538 (95.4%) | 26 (4.6%) |
| 20 to 24 Year Olds | 477 (87.4%) | 69 (12.6%) |
| 25 to 34 Year Olds | 231 (61.4%) | 145 (38.6%) |
| 35 Years and over | 226 (85.3%) | 39 (14.7%) |
| Total | 6,933 (90.2%) | 753 (9.8%) |
Educational Attainment by Field of Study in Fannin County
Education (1,098 | 19.5%), business (1,027 | 18.3%), arts & humanities (466 | 8.3%), science & technology (429 | 7.6%), and bio, nature & agricultural (418 | 7.4%) are the most common fields of study among 5,618 individuals in Fannin County who have obtained a bachelor's degree or higher.
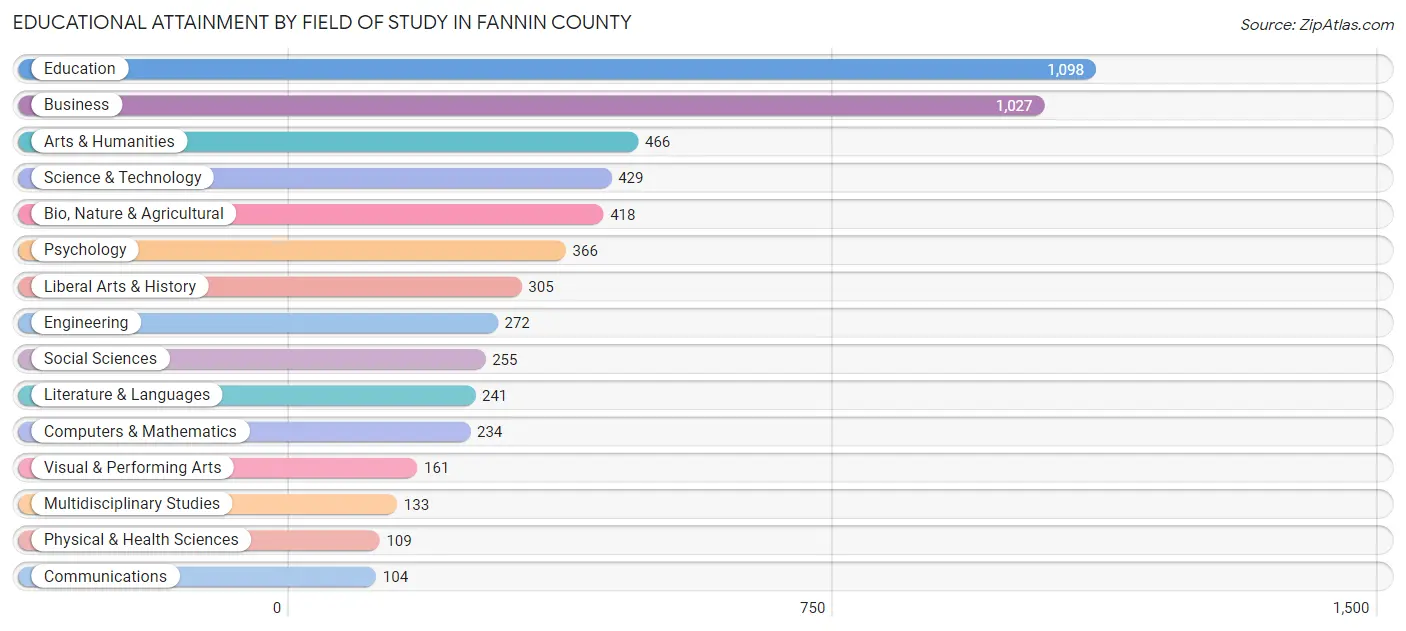
| Field of Study | # Graduates | % Graduates |
| Computers & Mathematics | 234 | 4.2% |
| Bio, Nature & Agricultural | 418 | 7.4% |
| Physical & Health Sciences | 109 | 1.9% |
| Psychology | 366 | 6.5% |
| Social Sciences | 255 | 4.5% |
| Engineering | 272 | 4.8% |
| Multidisciplinary Studies | 133 | 2.4% |
| Science & Technology | 429 | 7.6% |
| Business | 1,027 | 18.3% |
| Education | 1,098 | 19.5% |
| Literature & Languages | 241 | 4.3% |
| Liberal Arts & History | 305 | 5.4% |
| Visual & Performing Arts | 161 | 2.9% |
| Communications | 104 | 1.8% |
| Arts & Humanities | 466 | 8.3% |
| Total | 5,618 | 100.0% |
Transportation & Commute in Fannin County
Vehicle Availability by Sex in Fannin County
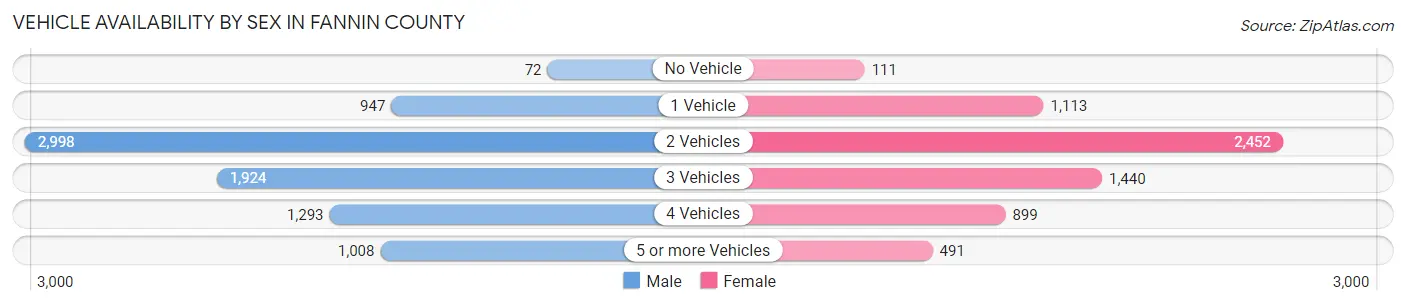
The most prevalent vehicle ownership categories in Fannin County are males with 2 vehicles (2,998, accounting for 36.4%) and females with 2 vehicles (2,452, making up 46.1%).
| Vehicles Available | Male | Female |
| No Vehicle | 72 (0.9%) | 111 (1.7%) |
| 1 Vehicle | 947 (11.5%) | 1,113 (17.1%) |
| 2 Vehicles | 2,998 (36.4%) | 2,452 (37.7%) |
| 3 Vehicles | 1,924 (23.3%) | 1,440 (22.1%) |
| 4 Vehicles | 1,293 (15.7%) | 899 (13.8%) |
| 5 or more Vehicles | 1,008 (12.2%) | 491 (7.5%) |
| Total | 8,242 (100.0%) | 6,506 (100.0%) |
Commute Time in Fannin County
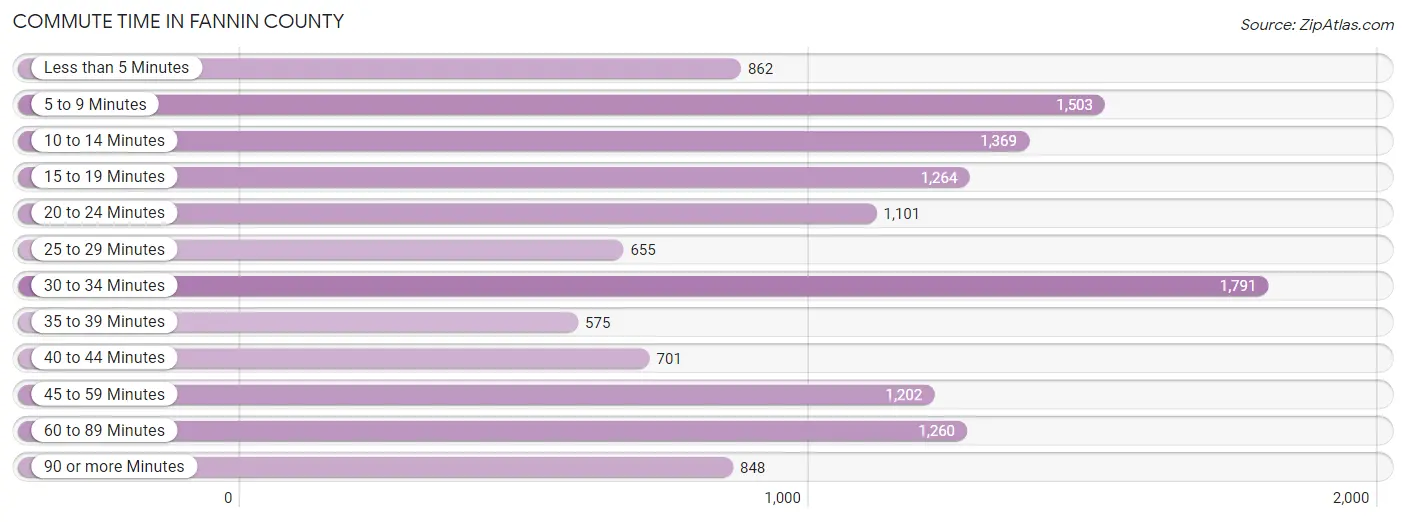
The most frequently occuring commute durations in Fannin County are 30 to 34 minutes (1,791 commuters, 13.6%), 5 to 9 minutes (1,503 commuters, 11.5%), and 10 to 14 minutes (1,369 commuters, 10.4%).
| Commute Time | # Commuters | % Commuters |
| Less than 5 Minutes | 862 | 6.6% |
| 5 to 9 Minutes | 1,503 | 11.5% |
| 10 to 14 Minutes | 1,369 | 10.4% |
| 15 to 19 Minutes | 1,264 | 9.6% |
| 20 to 24 Minutes | 1,101 | 8.4% |
| 25 to 29 Minutes | 655 | 5.0% |
| 30 to 34 Minutes | 1,791 | 13.6% |
| 35 to 39 Minutes | 575 | 4.4% |
| 40 to 44 Minutes | 701 | 5.3% |
| 45 to 59 Minutes | 1,202 | 9.1% |
| 60 to 89 Minutes | 1,260 | 9.6% |
| 90 or more Minutes | 848 | 6.5% |
Commute Time by Sex in Fannin County
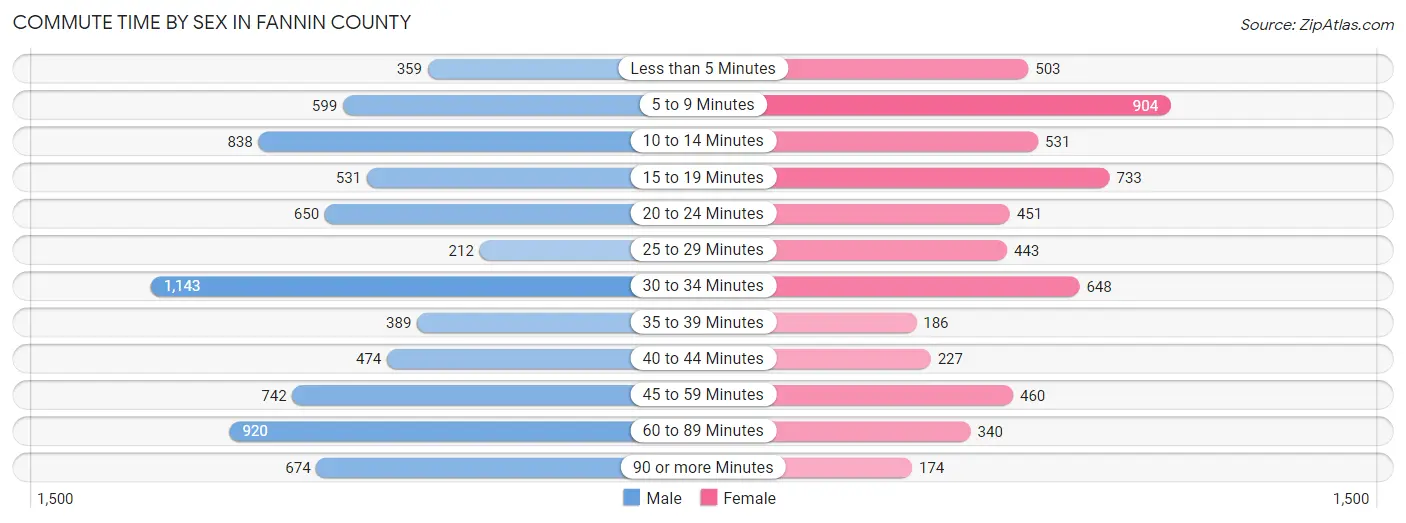
The most common commute times in Fannin County are 30 to 34 minutes (1,143 commuters, 15.2%) for males and 5 to 9 minutes (904 commuters, 16.1%) for females.
| Commute Time | Male | Female |
| Less than 5 Minutes | 359 (4.8%) | 503 (9.0%) |
| 5 to 9 Minutes | 599 (8.0%) | 904 (16.1%) |
| 10 to 14 Minutes | 838 (11.1%) | 531 (9.5%) |
| 15 to 19 Minutes | 531 (7.0%) | 733 (13.1%) |
| 20 to 24 Minutes | 650 (8.6%) | 451 (8.1%) |
| 25 to 29 Minutes | 212 (2.8%) | 443 (7.9%) |
| 30 to 34 Minutes | 1,143 (15.2%) | 648 (11.6%) |
| 35 to 39 Minutes | 389 (5.2%) | 186 (3.3%) |
| 40 to 44 Minutes | 474 (6.3%) | 227 (4.1%) |
| 45 to 59 Minutes | 742 (9.9%) | 460 (8.2%) |
| 60 to 89 Minutes | 920 (12.2%) | 340 (6.1%) |
| 90 or more Minutes | 674 (8.9%) | 174 (3.1%) |
Time of Departure to Work by Sex in Fannin County
The most frequent times of departure to work in Fannin County are 7:00 AM to 7:29 AM (933, 12.4%) for males and 7:00 AM to 7:29 AM (1,039, 18.5%) for females.
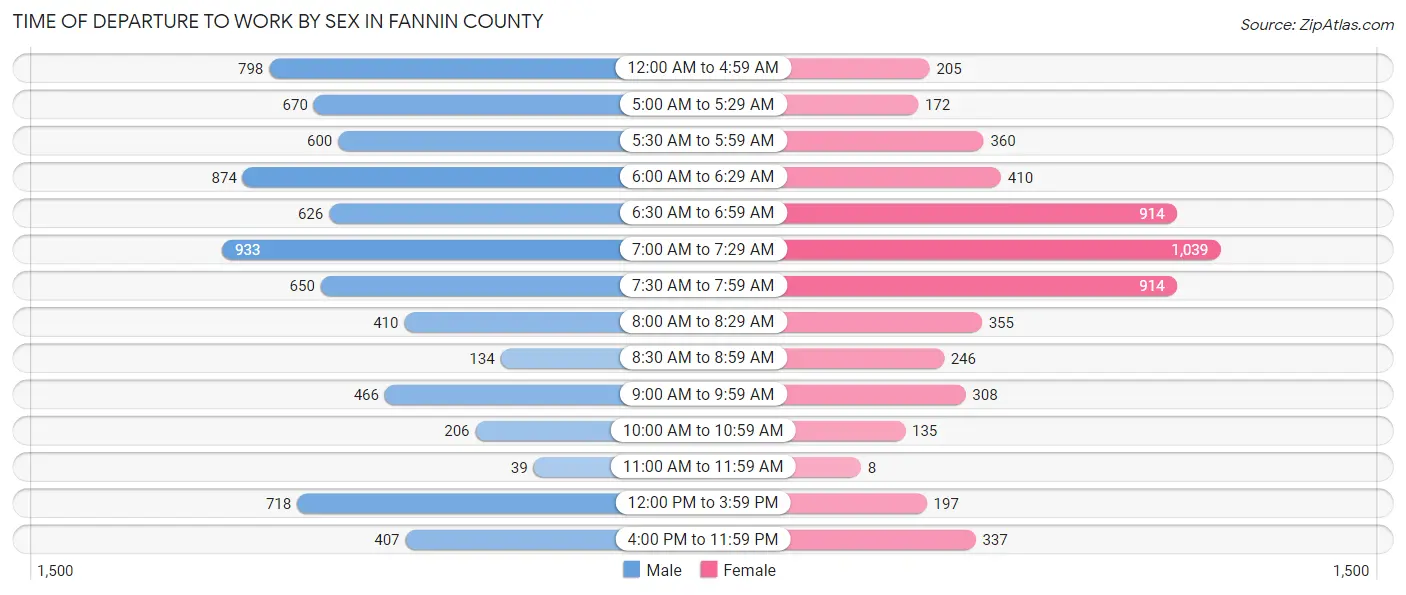
| Time of Departure | Male | Female |
| 12:00 AM to 4:59 AM | 798 (10.6%) | 205 (3.7%) |
| 5:00 AM to 5:29 AM | 670 (8.9%) | 172 (3.1%) |
| 5:30 AM to 5:59 AM | 600 (8.0%) | 360 (6.4%) |
| 6:00 AM to 6:29 AM | 874 (11.6%) | 410 (7.3%) |
| 6:30 AM to 6:59 AM | 626 (8.3%) | 914 (16.3%) |
| 7:00 AM to 7:29 AM | 933 (12.4%) | 1,039 (18.5%) |
| 7:30 AM to 7:59 AM | 650 (8.6%) | 914 (16.3%) |
| 8:00 AM to 8:29 AM | 410 (5.4%) | 355 (6.3%) |
| 8:30 AM to 8:59 AM | 134 (1.8%) | 246 (4.4%) |
| 9:00 AM to 9:59 AM | 466 (6.2%) | 308 (5.5%) |
| 10:00 AM to 10:59 AM | 206 (2.7%) | 135 (2.4%) |
| 11:00 AM to 11:59 AM | 39 (0.5%) | 8 (0.1%) |
| 12:00 PM to 3:59 PM | 718 (9.5%) | 197 (3.5%) |
| 4:00 PM to 11:59 PM | 407 (5.4%) | 337 (6.0%) |
| Total | 7,531 (100.0%) | 5,600 (100.0%) |
Housing Occupancy in Fannin County
Occupancy by Ownership in Fannin County
Of the total 12,699 dwellings in Fannin County, owner-occupied units account for 9,528 (75.0%), while renter-occupied units make up 3,171 (25.0%).
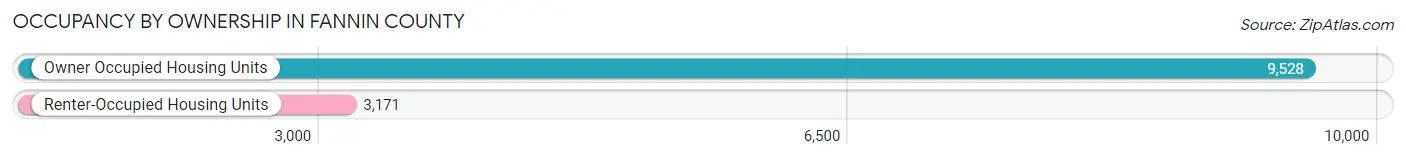
| Occupancy | # Housing Units | % Housing Units |
| Owner Occupied Housing Units | 9,528 | 75.0% |
| Renter-Occupied Housing Units | 3,171 | 25.0% |
| Total Occupied Housing Units | 12,699 | 100.0% |
Occupancy by Household Size in Fannin County
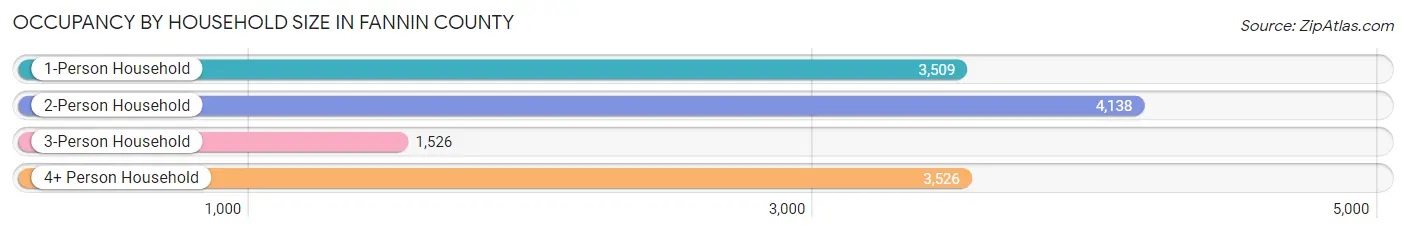
| Household Size | # Housing Units | % Housing Units |
| 1-Person Household | 3,509 | 27.6% |
| 2-Person Household | 4,138 | 32.6% |
| 3-Person Household | 1,526 | 12.0% |
| 4+ Person Household | 3,526 | 27.8% |
| Total Housing Units | 12,699 | 100.0% |
Occupancy by Ownership by Household Size in Fannin County
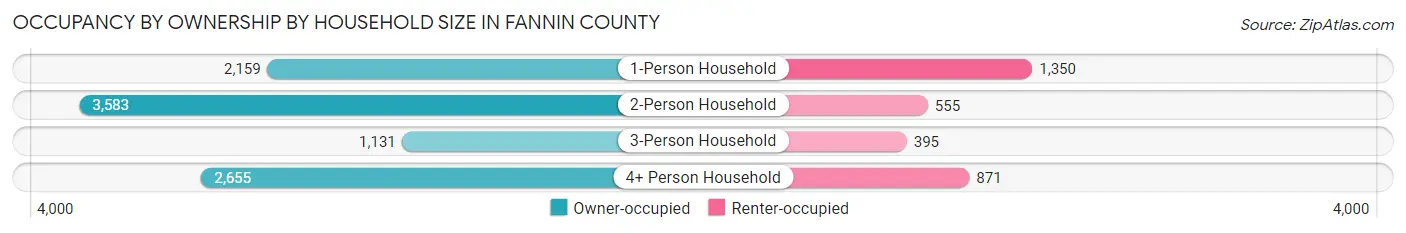
| Household Size | Owner-occupied | Renter-occupied |
| 1-Person Household | 2,159 (61.5%) | 1,350 (38.5%) |
| 2-Person Household | 3,583 (86.6%) | 555 (13.4%) |
| 3-Person Household | 1,131 (74.1%) | 395 (25.9%) |
| 4+ Person Household | 2,655 (75.3%) | 871 (24.7%) |
| Total Housing Units | 9,528 (75.0%) | 3,171 (25.0%) |
Occupancy by Educational Attainment in Fannin County
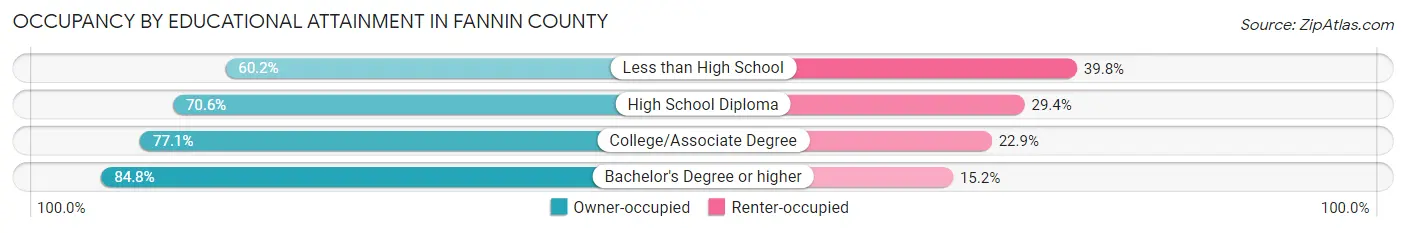
| Household Size | Owner-occupied | Renter-occupied |
| Less than High School | 838 (60.2%) | 554 (39.8%) |
| High School Diploma | 2,845 (70.6%) | 1,186 (29.4%) |
| College/Associate Degree | 3,240 (77.1%) | 963 (22.9%) |
| Bachelor's Degree or higher | 2,605 (84.8%) | 468 (15.2%) |
Occupancy by Age of Householder in Fannin County
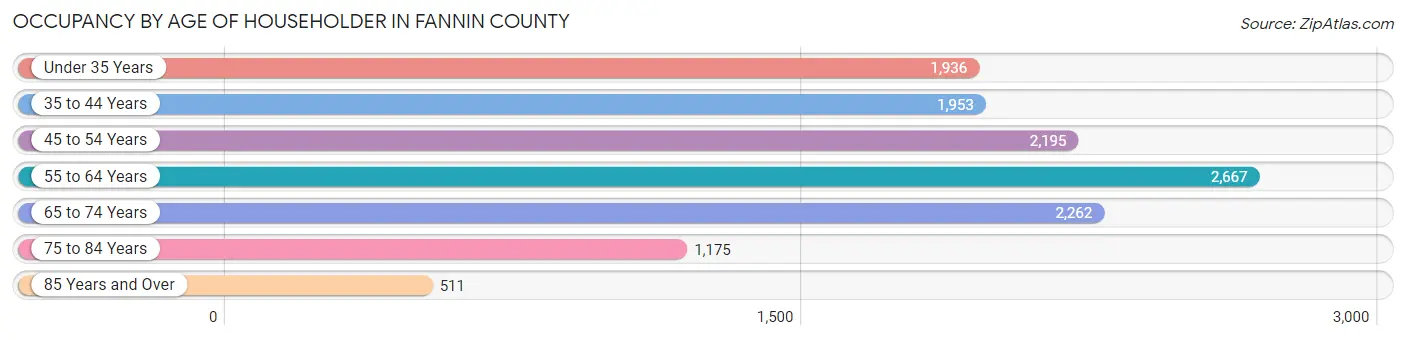
| Age Bracket | # Households | % Households |
| Under 35 Years | 1,936 | 15.2% |
| 35 to 44 Years | 1,953 | 15.4% |
| 45 to 54 Years | 2,195 | 17.3% |
| 55 to 64 Years | 2,667 | 21.0% |
| 65 to 74 Years | 2,262 | 17.8% |
| 75 to 84 Years | 1,175 | 9.2% |
| 85 Years and Over | 511 | 4.0% |
| Total | 12,699 | 100.0% |
Housing Finances in Fannin County
Median Income by Occupancy in Fannin County
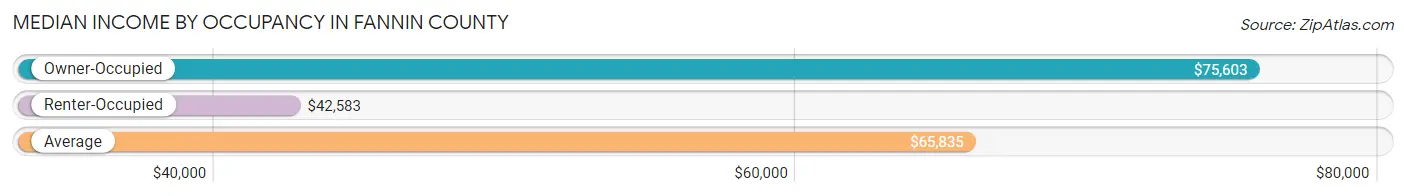
| Occupancy Type | # Households | Median Income |
| Owner-Occupied | 9,528 (75.0%) | $75,603 |
| Renter-Occupied | 3,171 (25.0%) | $42,583 |
| Average | 12,699 (100.0%) | $65,835 |
Occupancy by Householder Income Bracket in Fannin County
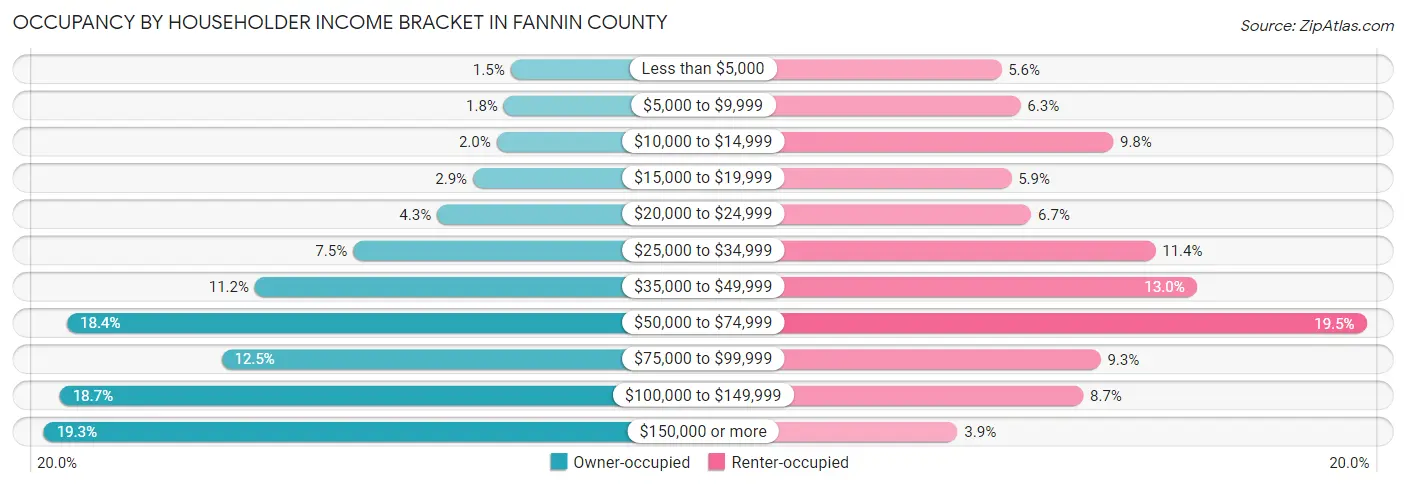
| Income Bracket | Owner-occupied | Renter-occupied |
| Less than $5,000 | 142 (1.5%) | 176 (5.6%) |
| $5,000 to $9,999 | 167 (1.8%) | 199 (6.3%) |
| $10,000 to $14,999 | 192 (2.0%) | 311 (9.8%) |
| $15,000 to $19,999 | 278 (2.9%) | 188 (5.9%) |
| $20,000 to $24,999 | 409 (4.3%) | 212 (6.7%) |
| $25,000 to $34,999 | 714 (7.5%) | 362 (11.4%) |
| $35,000 to $49,999 | 1,070 (11.2%) | 412 (13.0%) |
| $50,000 to $74,999 | 1,751 (18.4%) | 617 (19.5%) |
| $75,000 to $99,999 | 1,191 (12.5%) | 296 (9.3%) |
| $100,000 to $149,999 | 1,778 (18.7%) | 275 (8.7%) |
| $150,000 or more | 1,836 (19.3%) | 123 (3.9%) |
| Total | 9,528 (100.0%) | 3,171 (100.0%) |
Monthly Housing Cost Tiers in Fannin County
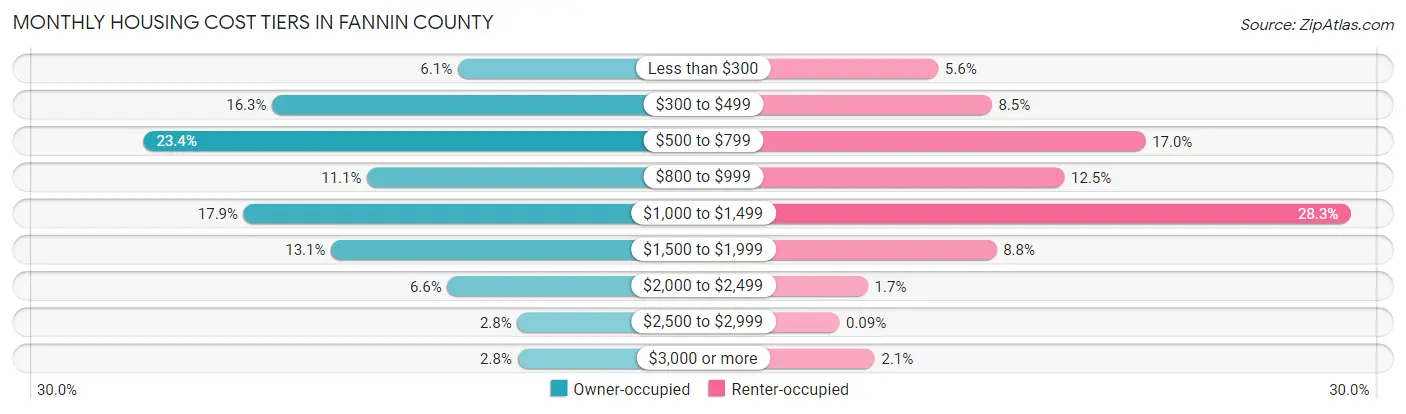
| Monthly Cost | Owner-occupied | Renter-occupied |
| Less than $300 | 577 (6.1%) | 176 (5.6%) |
| $300 to $499 | 1,555 (16.3%) | 270 (8.5%) |
| $500 to $799 | 2,232 (23.4%) | 539 (17.0%) |
| $800 to $999 | 1,055 (11.1%) | 397 (12.5%) |
| $1,000 to $1,499 | 1,705 (17.9%) | 898 (28.3%) |
| $1,500 to $1,999 | 1,244 (13.1%) | 278 (8.8%) |
| $2,000 to $2,499 | 633 (6.6%) | 53 (1.7%) |
| $2,500 to $2,999 | 264 (2.8%) | 3 (0.1%) |
| $3,000 or more | 263 (2.8%) | 65 (2.1%) |
| Total | 9,528 (100.0%) | 3,171 (100.0%) |
Physical Housing Characteristics in Fannin County
Housing Structures in Fannin County
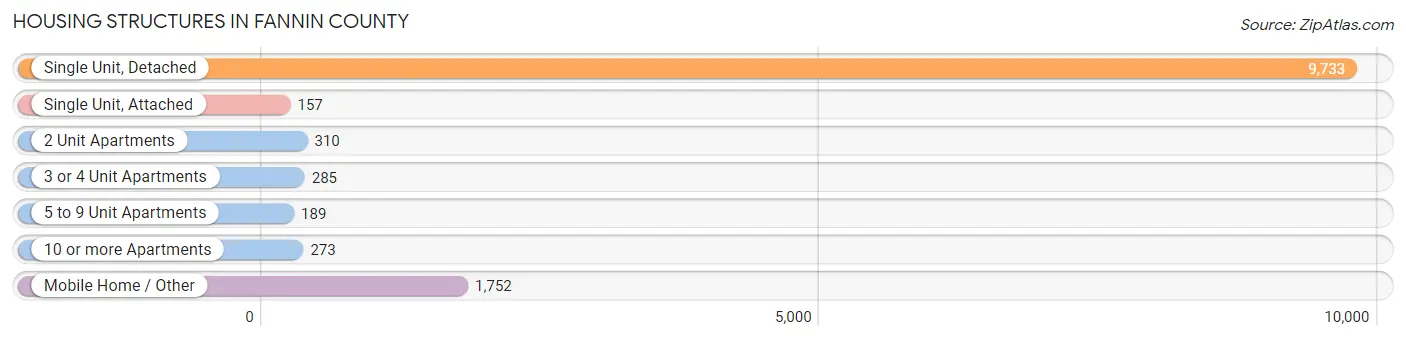
| Structure Type | # Housing Units | % Housing Units |
| Single Unit, Detached | 9,733 | 76.6% |
| Single Unit, Attached | 157 | 1.2% |
| 2 Unit Apartments | 310 | 2.4% |
| 3 or 4 Unit Apartments | 285 | 2.2% |
| 5 to 9 Unit Apartments | 189 | 1.5% |
| 10 or more Apartments | 273 | 2.1% |
| Mobile Home / Other | 1,752 | 13.8% |
| Total | 12,699 | 100.0% |
Housing Structures by Occupancy in Fannin County
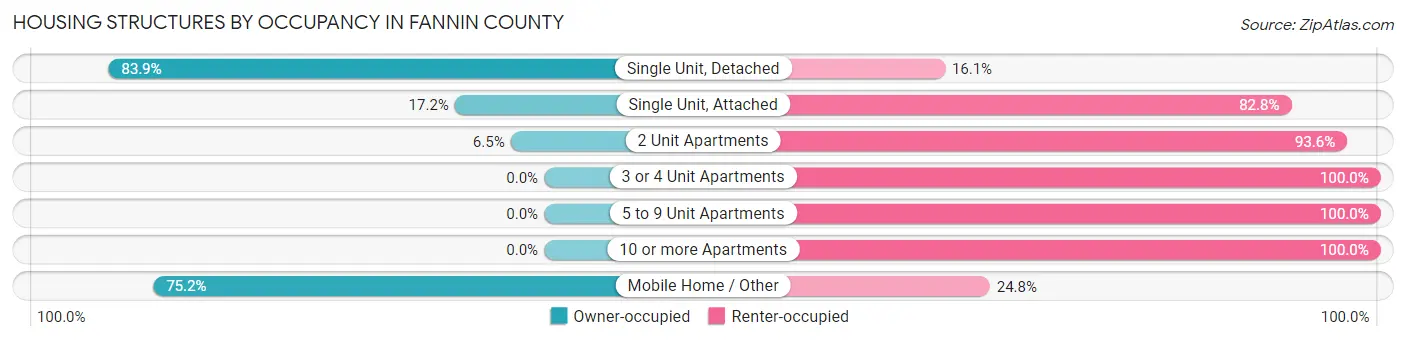
| Structure Type | Owner-occupied | Renter-occupied |
| Single Unit, Detached | 8,163 (83.9%) | 1,570 (16.1%) |
| Single Unit, Attached | 27 (17.2%) | 130 (82.8%) |
| 2 Unit Apartments | 20 (6.5%) | 290 (93.5%) |
| 3 or 4 Unit Apartments | 0 (0.0%) | 285 (100.0%) |
| 5 to 9 Unit Apartments | 0 (0.0%) | 189 (100.0%) |
| 10 or more Apartments | 0 (0.0%) | 273 (100.0%) |
| Mobile Home / Other | 1,318 (75.2%) | 434 (24.8%) |
| Total | 9,528 (75.0%) | 3,171 (25.0%) |
Housing Structures by Number of Rooms in Fannin County
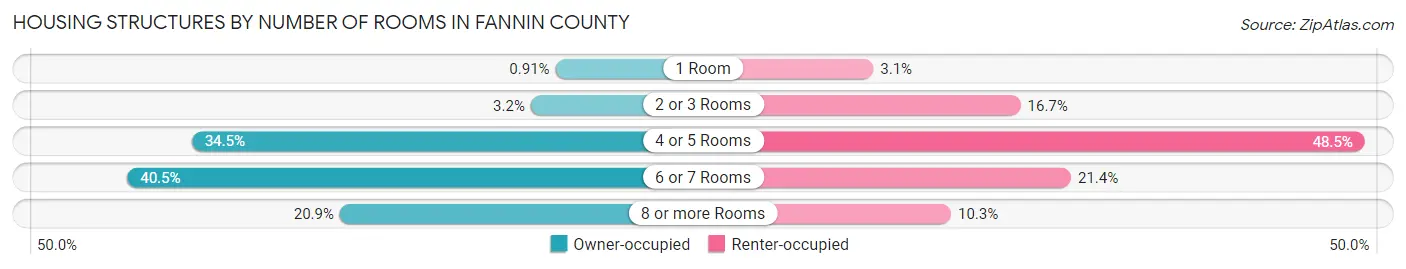
| Number of Rooms | Owner-occupied | Renter-occupied |
| 1 Room | 87 (0.9%) | 98 (3.1%) |
| 2 or 3 Rooms | 304 (3.2%) | 530 (16.7%) |
| 4 or 5 Rooms | 3,291 (34.5%) | 1,539 (48.5%) |
| 6 or 7 Rooms | 3,859 (40.5%) | 678 (21.4%) |
| 8 or more Rooms | 1,987 (20.8%) | 326 (10.3%) |
| Total | 9,528 (100.0%) | 3,171 (100.0%) |
Housing Structure by Heating Type in Fannin County
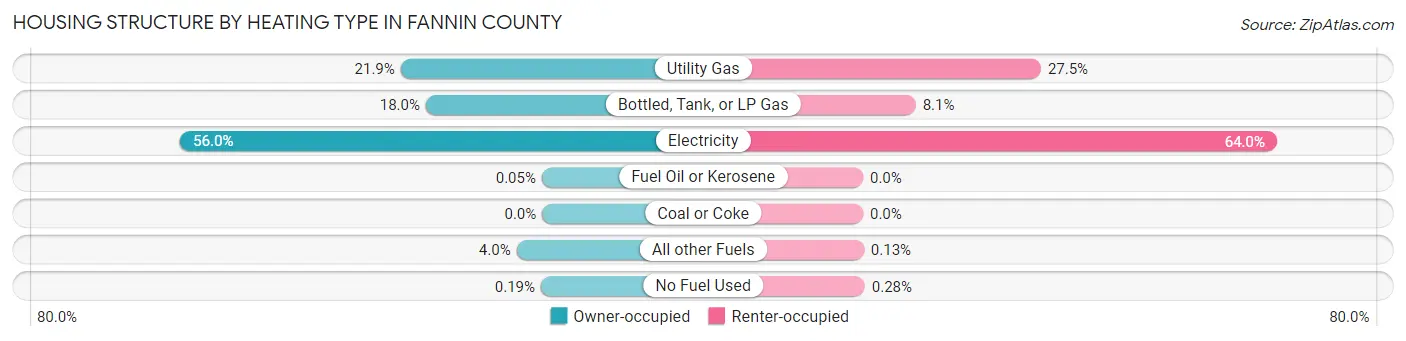
| Heating Type | Owner-occupied | Renter-occupied |
| Utility Gas | 2,084 (21.9%) | 872 (27.5%) |
| Bottled, Tank, or LP Gas | 1,713 (18.0%) | 258 (8.1%) |
| Electricity | 5,331 (55.9%) | 2,028 (63.9%) |
| Fuel Oil or Kerosene | 5 (0.1%) | 0 (0.0%) |
| Coal or Coke | 0 (0.0%) | 0 (0.0%) |
| All other Fuels | 377 (4.0%) | 4 (0.1%) |
| No Fuel Used | 18 (0.2%) | 9 (0.3%) |
| Total | 9,528 (100.0%) | 3,171 (100.0%) |
Household Vehicle Usage in Fannin County
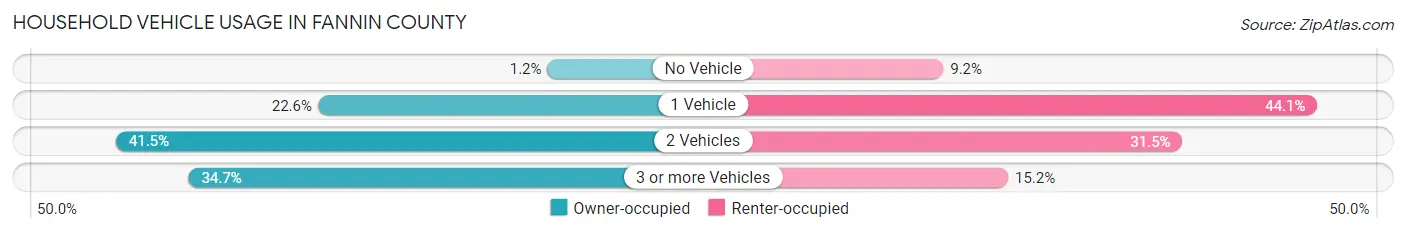
| Vehicles per Household | Owner-occupied | Renter-occupied |
| No Vehicle | 114 (1.2%) | 291 (9.2%) |
| 1 Vehicle | 2,156 (22.6%) | 1,398 (44.1%) |
| 2 Vehicles | 3,952 (41.5%) | 999 (31.5%) |
| 3 or more Vehicles | 3,306 (34.7%) | 483 (15.2%) |
| Total | 9,528 (100.0%) | 3,171 (100.0%) |
Real Estate & Mortgages in Fannin County
Real Estate and Mortgage Overview in Fannin County
| Characteristic | Without Mortgage | With Mortgage |
| Housing Units | 5,153 | 4,375 |
| Median Property Value | $166,700 | $213,600 |
| Median Household Income | $58,697 | $1,093 |
| Monthly Housing Costs | $563 | $263 |
| Real Estate Taxes | $1,739 | $130 |
Property Value by Mortgage Status in Fannin County
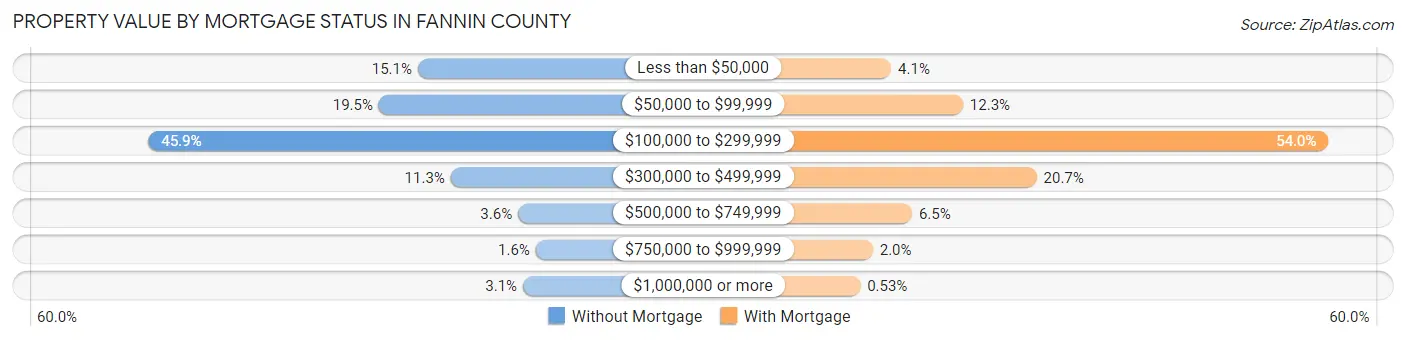
| Property Value | Without Mortgage | With Mortgage |
| Less than $50,000 | 776 (15.1%) | 178 (4.1%) |
| $50,000 to $99,999 | 1,006 (19.5%) | 537 (12.3%) |
| $100,000 to $299,999 | 2,363 (45.9%) | 2,364 (54.0%) |
| $300,000 to $499,999 | 583 (11.3%) | 905 (20.7%) |
| $500,000 to $749,999 | 186 (3.6%) | 282 (6.5%) |
| $750,000 to $999,999 | 82 (1.6%) | 86 (2.0%) |
| $1,000,000 or more | 157 (3.0%) | 23 (0.5%) |
| Total | 5,153 (100.0%) | 4,375 (100.0%) |
Household Income by Mortgage Status in Fannin County
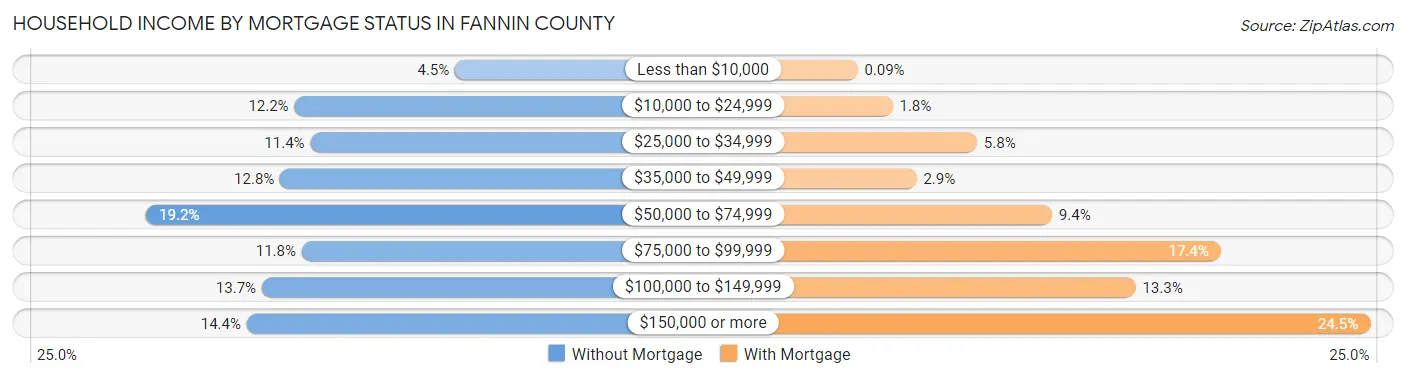
| Household Income | Without Mortgage | With Mortgage |
| Less than $10,000 | 232 (4.5%) | 4 (0.1%) |
| $10,000 to $24,999 | 626 (12.1%) | 77 (1.8%) |
| $25,000 to $34,999 | 587 (11.4%) | 253 (5.8%) |
| $35,000 to $49,999 | 661 (12.8%) | 127 (2.9%) |
| $50,000 to $74,999 | 990 (19.2%) | 409 (9.3%) |
| $75,000 to $99,999 | 608 (11.8%) | 761 (17.4%) |
| $100,000 to $149,999 | 706 (13.7%) | 583 (13.3%) |
| $150,000 or more | 743 (14.4%) | 1,072 (24.5%) |
| Total | 5,153 (100.0%) | 4,375 (100.0%) |
Property Value to Household Income Ratio in Fannin County
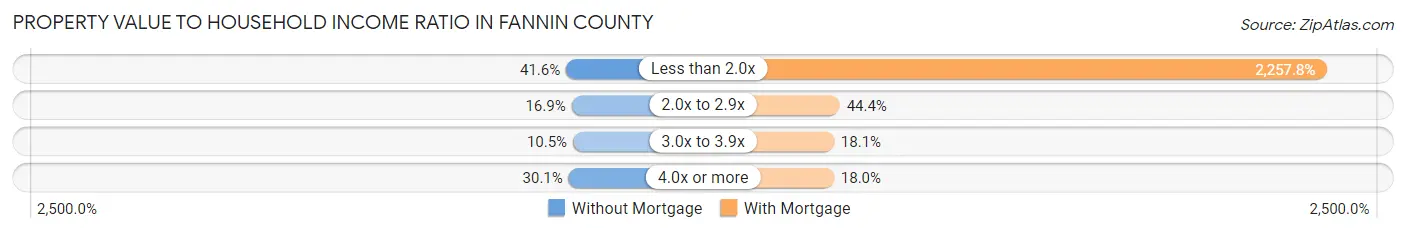
| Value-to-Income Ratio | Without Mortgage | With Mortgage |
| Less than 2.0x | 2,144 (41.6%) | 98,777 (2,257.8%) |
| 2.0x to 2.9x | 873 (16.9%) | 1,941 (44.4%) |
| 3.0x to 3.9x | 539 (10.5%) | 792 (18.1%) |
| 4.0x or more | 1,550 (30.1%) | 786 (18.0%) |
| Total | 5,153 (100.0%) | 4,375 (100.0%) |
Real Estate Taxes by Mortgage Status in Fannin County
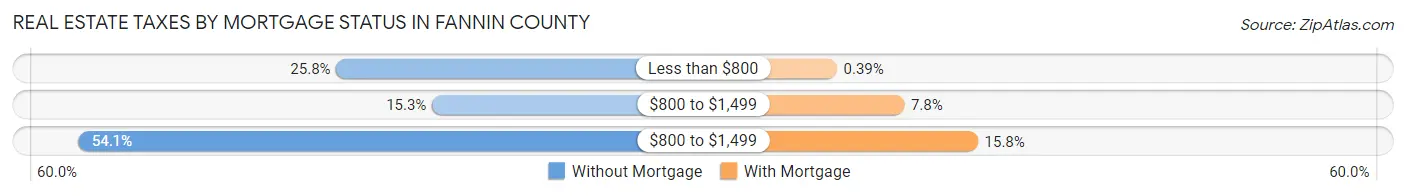
| Property Taxes | Without Mortgage | With Mortgage |
| Less than $800 | 1,331 (25.8%) | 17 (0.4%) |
| $800 to $1,499 | 790 (15.3%) | 340 (7.8%) |
| $800 to $1,499 | 2,785 (54.0%) | 693 (15.8%) |
| Total | 5,153 (100.0%) | 4,375 (100.0%) |
Health & Disability in Fannin County
Health Insurance Coverage by Age in Fannin County
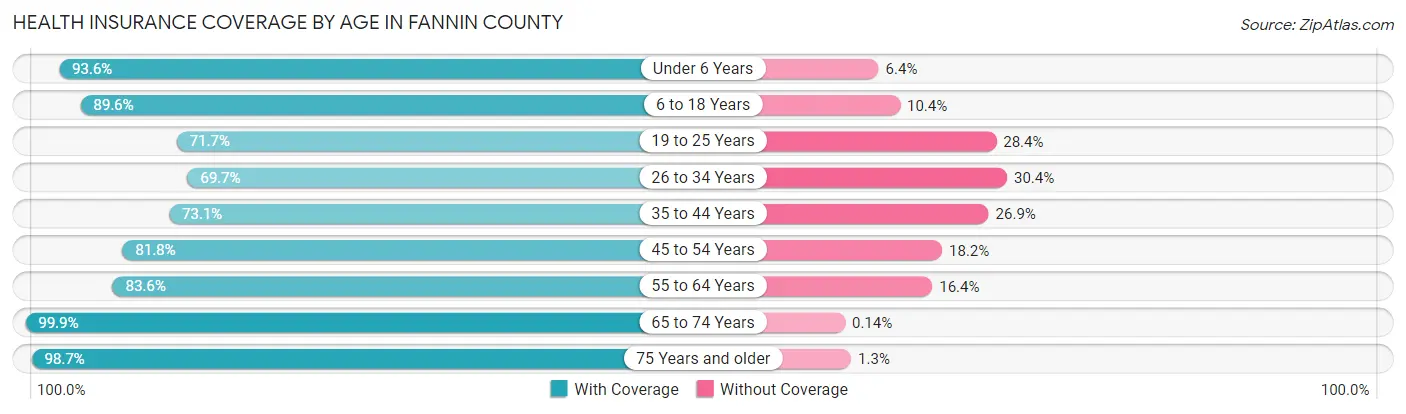
| Age Bracket | With Coverage | Without Coverage |
| Under 6 Years | 2,203 (93.6%) | 151 (6.4%) |
| 6 to 18 Years | 5,184 (89.6%) | 602 (10.4%) |
| 19 to 25 Years | 1,928 (71.7%) | 763 (28.3%) |
| 26 to 34 Years | 2,178 (69.7%) | 949 (30.3%) |
| 35 to 44 Years | 3,057 (73.1%) | 1,126 (26.9%) |
| 45 to 54 Years | 3,487 (81.8%) | 778 (18.2%) |
| 55 to 64 Years | 3,922 (83.6%) | 770 (16.4%) |
| 65 to 74 Years | 3,560 (99.9%) | 5 (0.1%) |
| 75 Years and older | 2,470 (98.7%) | 32 (1.3%) |
| Total | 27,989 (84.4%) | 5,176 (15.6%) |
Health Insurance Coverage by Citizenship Status in Fannin County
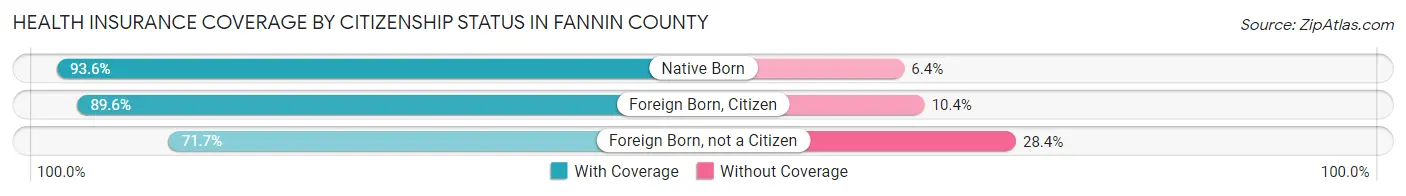
| Citizenship Status | With Coverage | Without Coverage |
| Native Born | 2,203 (93.6%) | 151 (6.4%) |
| Foreign Born, Citizen | 5,184 (89.6%) | 602 (10.4%) |
| Foreign Born, not a Citizen | 1,928 (71.7%) | 763 (28.3%) |
Health Insurance Coverage by Household Income in Fannin County
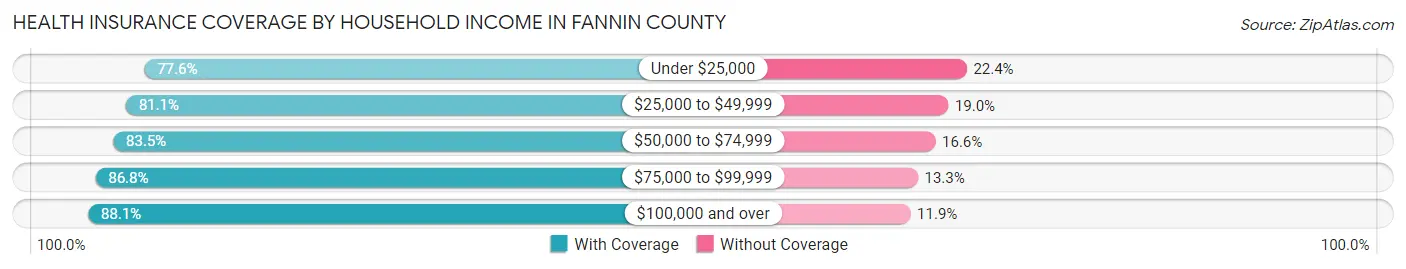
| Household Income | With Coverage | Without Coverage |
| Under $25,000 | 3,004 (77.6%) | 868 (22.4%) |
| $25,000 to $49,999 | 4,481 (81.0%) | 1,048 (19.0%) |
| $50,000 to $74,999 | 5,270 (83.5%) | 1,045 (16.6%) |
| $75,000 to $99,999 | 3,698 (86.8%) | 565 (13.3%) |
| $100,000 and over | 11,429 (88.1%) | 1,540 (11.9%) |
Public vs Private Health Insurance Coverage by Age in Fannin County
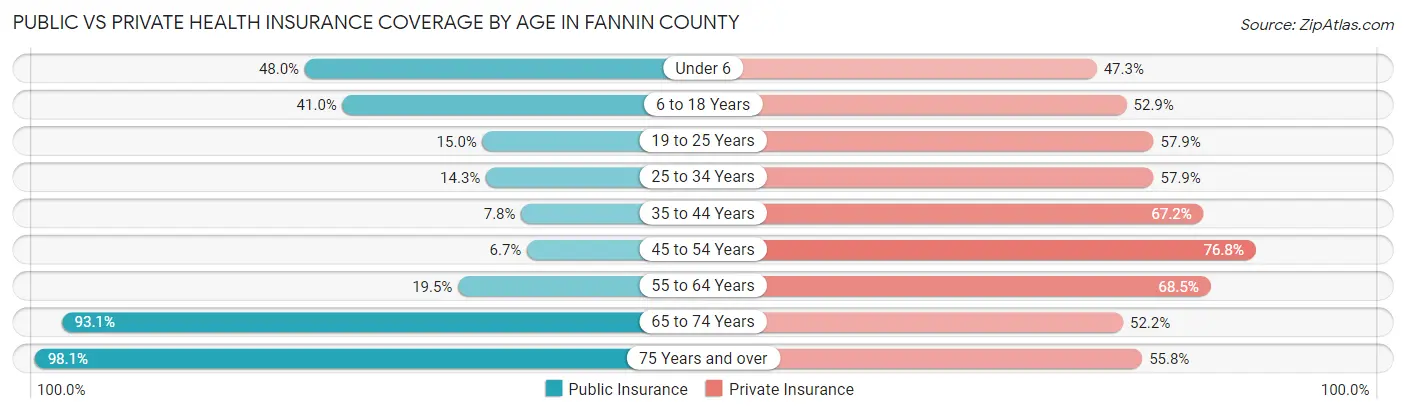
| Age Bracket | Public Insurance | Private Insurance |
| Under 6 | 1,129 (48.0%) | 1,114 (47.3%) |
| 6 to 18 Years | 2,370 (41.0%) | 3,059 (52.9%) |
| 19 to 25 Years | 403 (15.0%) | 1,557 (57.9%) |
| 25 to 34 Years | 448 (14.3%) | 1,810 (57.9%) |
| 35 to 44 Years | 326 (7.8%) | 2,809 (67.1%) |
| 45 to 54 Years | 286 (6.7%) | 3,277 (76.8%) |
| 55 to 64 Years | 916 (19.5%) | 3,212 (68.5%) |
| 65 to 74 Years | 3,320 (93.1%) | 1,861 (52.2%) |
| 75 Years and over | 2,455 (98.1%) | 1,395 (55.8%) |
| Total | 11,653 (35.1%) | 20,094 (60.6%) |
Disability Status by Sex by Age in Fannin County
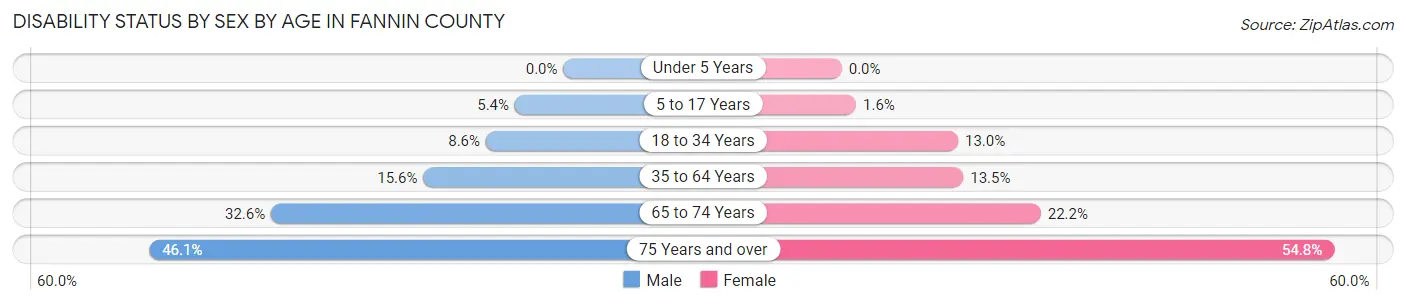
| Age Bracket | Male | Female |
| Under 5 Years | 0 (0.0%) | 0 (0.0%) |
| 5 to 17 Years | 163 (5.4%) | 45 (1.6%) |
| 18 to 34 Years | 277 (8.6%) | 402 (13.0%) |
| 35 to 64 Years | 1,020 (15.6%) | 893 (13.5%) |
| 65 to 74 Years | 595 (32.6%) | 385 (22.2%) |
| 75 Years and over | 517 (46.1%) | 757 (54.8%) |
Disability Class by Sex by Age in Fannin County
Disability Class: Hearing Difficulty
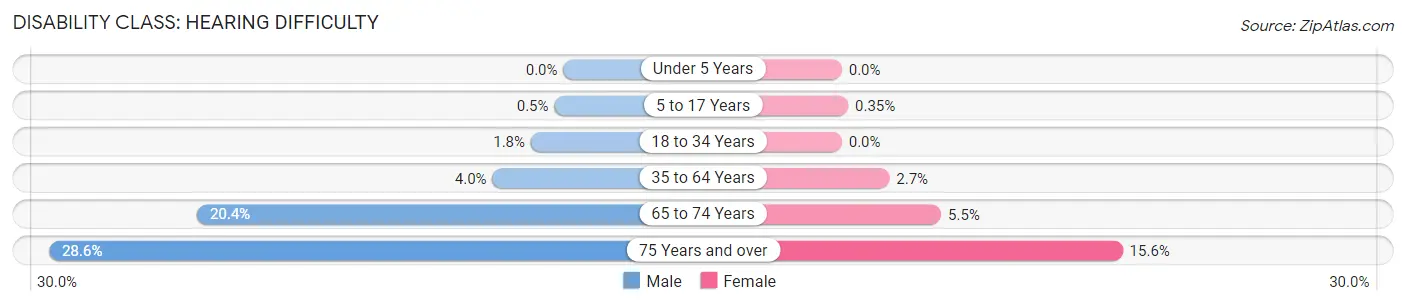
| Age Bracket | Male | Female |
| Under 5 Years | 0 (0.0%) | 0 (0.0%) |
| 5 to 17 Years | 15 (0.5%) | 10 (0.4%) |
| 18 to 34 Years | 58 (1.8%) | 0 (0.0%) |
| 35 to 64 Years | 258 (4.0%) | 175 (2.6%) |
| 65 to 74 Years | 373 (20.4%) | 96 (5.5%) |
| 75 Years and over | 321 (28.6%) | 216 (15.6%) |
Disability Class: Vision Difficulty
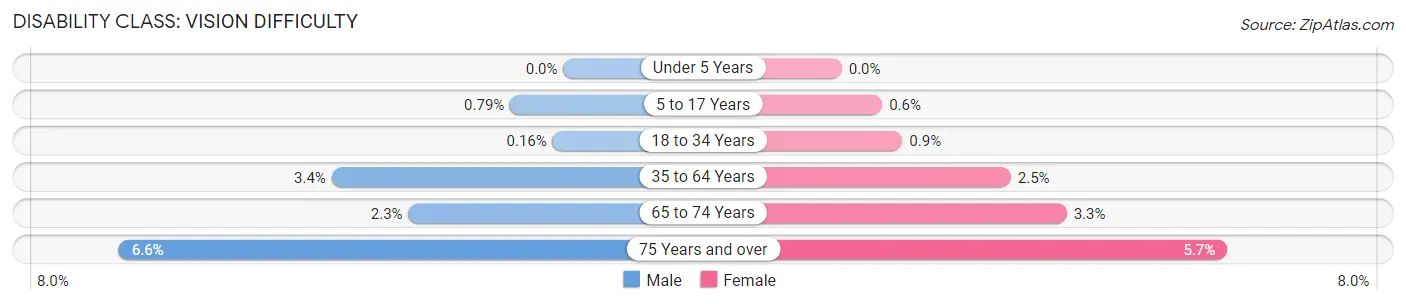
| Age Bracket | Male | Female |
| Under 5 Years | 0 (0.0%) | 0 (0.0%) |
| 5 to 17 Years | 24 (0.8%) | 17 (0.6%) |
| 18 to 34 Years | 5 (0.2%) | 28 (0.9%) |
| 35 to 64 Years | 225 (3.4%) | 166 (2.5%) |
| 65 to 74 Years | 42 (2.3%) | 58 (3.3%) |
| 75 Years and over | 74 (6.6%) | 79 (5.7%) |
Disability Class: Cognitive Difficulty
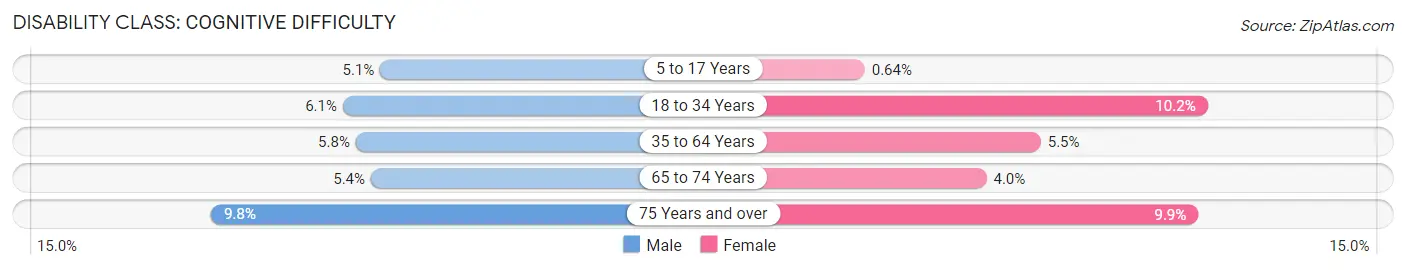
| Age Bracket | Male | Female |
| 5 to 17 Years | 154 (5.1%) | 18 (0.6%) |
| 18 to 34 Years | 197 (6.1%) | 316 (10.2%) |
| 35 to 64 Years | 378 (5.8%) | 366 (5.5%) |
| 65 to 74 Years | 98 (5.4%) | 70 (4.0%) |
| 75 Years and over | 110 (9.8%) | 137 (9.9%) |
Disability Class: Ambulatory Difficulty
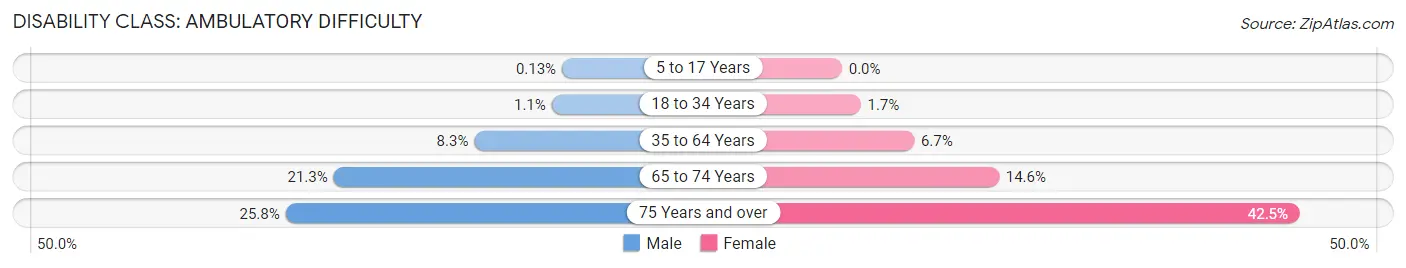
| Age Bracket | Male | Female |
| 5 to 17 Years | 4 (0.1%) | 0 (0.0%) |
| 18 to 34 Years | 35 (1.1%) | 54 (1.7%) |
| 35 to 64 Years | 541 (8.3%) | 442 (6.7%) |
| 65 to 74 Years | 390 (21.3%) | 253 (14.6%) |
| 75 Years and over | 289 (25.8%) | 587 (42.5%) |
Disability Class: Self-Care Difficulty
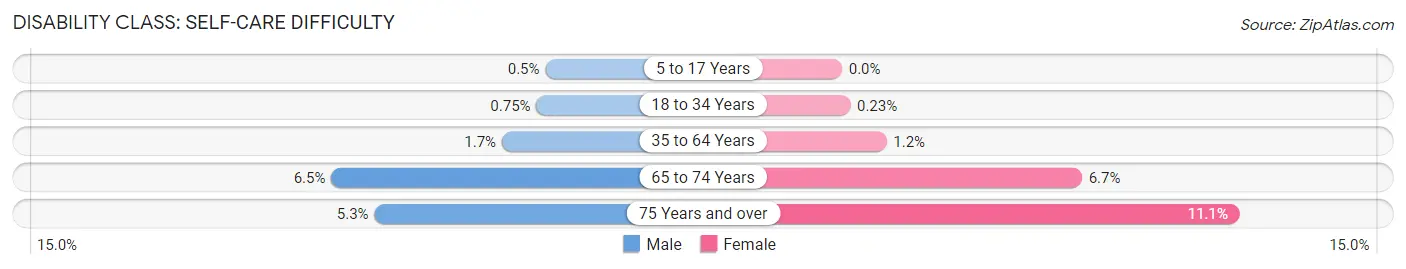
| Age Bracket | Male | Female |
| 5 to 17 Years | 15 (0.5%) | 0 (0.0%) |
| 18 to 34 Years | 24 (0.7%) | 7 (0.2%) |
| 35 to 64 Years | 112 (1.7%) | 82 (1.2%) |
| 65 to 74 Years | 118 (6.5%) | 116 (6.7%) |
| 75 Years and over | 59 (5.3%) | 153 (11.1%) |
Technology Access in Fannin County
Computing Device Access in Fannin County
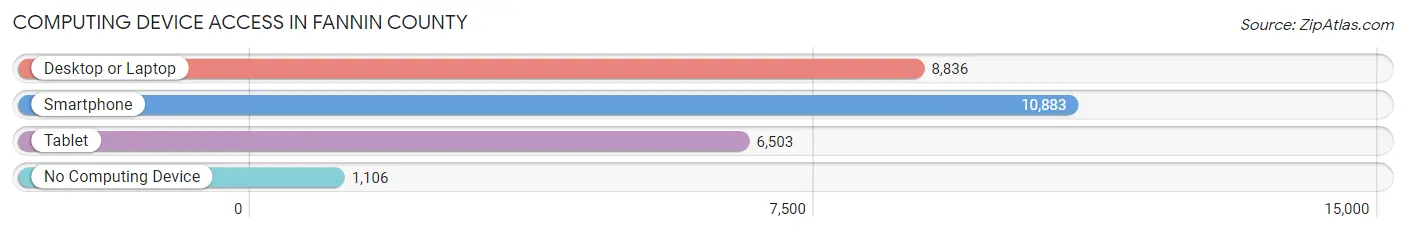
| Device Type | # Households | % Households |
| Desktop or Laptop | 8,836 | 69.6% |
| Smartphone | 10,883 | 85.7% |
| Tablet | 6,503 | 51.2% |
| No Computing Device | 1,106 | 8.7% |
| Total | 12,699 | 100.0% |
Internet Access in Fannin County
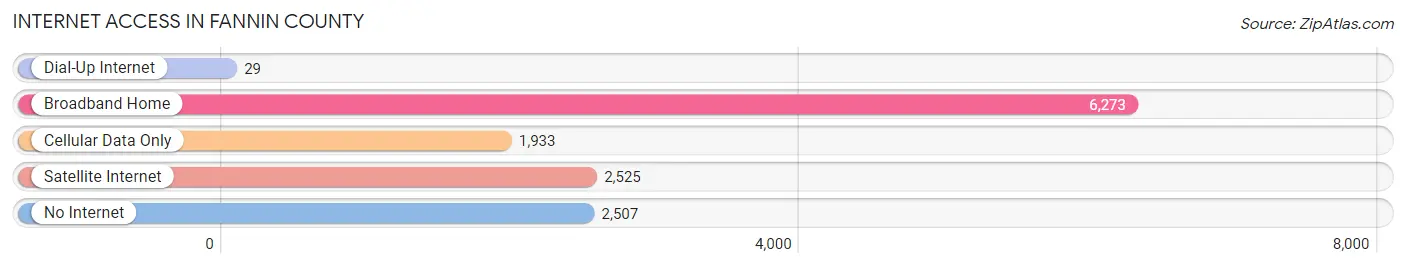
| Internet Type | # Households | % Households |
| Dial-Up Internet | 29 | 0.2% |
| Broadband Home | 6,273 | 49.4% |
| Cellular Data Only | 1,933 | 15.2% |
| Satellite Internet | 2,525 | 19.9% |
| No Internet | 2,507 | 19.7% |
| Total | 12,699 | 100.0% |
Fannin County Summary
Fannin County is located in the northeast corner of Texas, and is part of the Texoma region. It is bordered by Grayson County to the north, Hunt County to the east, Delta County to the south, and Lamar County to the west. The county seat is Bonham, and the largest city is Sherman. The county was named for James Walker Fannin, Jr., a leader in the Texas Revolution.
Geography
Fannin County covers an area of 837 square miles, of which 835 square miles is land and 2 square miles is water. The terrain is mostly rolling hills, with some flat areas in the western part of the county. The county is drained by the Red River, which forms its northern boundary. The major highways in the county are U.S. Highway 82, U.S. Highway 69, and State Highway 78.
The county is home to several state parks, including Bonham State Park, Cooper Lake State Park, and Lake Crockett. There are also several lakes in the county, including Lake Bonham, Lake Crockett, and Lake Fannin.
Demographics
As of the 2010 census, there were 33,915 people, 12,845 households, and 9,072 families living in the county. The population density was 40.5 people per square mile. The racial makeup of the county was 81.3% White, 11.7% African American, 0.7% Native American, 0.5% Asian, 0.1% Pacific Islander, 4.2% from other races, and 1.6% from two or more races. Hispanic or Latino of any race were 10.3% of the population.
The median income for a household in the county was $41,945, and the median income for a family was $50,945. The per capita income for the county was $20,945. About 14.3% of families and 17.7% of the population were below the poverty line, including 25.2% of those under age 18 and 11.2% of those age 65 or over.
Economy
The economy of Fannin County is largely based on agriculture and manufacturing. The county is home to several large farms, which produce cotton, corn, wheat, and other crops. The county is also home to several manufacturing companies, including a paper mill, a plastics plant, and a steel mill.
The county is also home to several tourist attractions, including the Bonham State Park, Cooper Lake State Park, and Lake Crockett. These attractions bring in visitors from all over the state and beyond.
Conclusion
Fannin County is a rural county located in the northeast corner of Texas. It is bordered by Grayson County to the north, Hunt County to the east, Delta County to the south, and Lamar County to the west. The county is home to several state parks, lakes, and tourist attractions, and its economy is largely based on agriculture and manufacturing. As of the 2010 census, the population of the county was 33,915.
Common Questions
What is Per Capita Income in Fannin County?
Per Capita income in Fannin County is $33,481.
What is the Median Family Income in Fannin County?
Median Family Income in Fannin County is $81,299.
What is the Median Household income in Fannin County?
Median Household Income in Fannin County is $65,835.
What is Income or Wage Gap in Fannin County?
Income or Wage Gap in Fannin County is 24.9%.
Women in Fannin County earn 75.1 cents for every dollar earned by a man.
What is Family Income Deficit in Fannin County?
Family Income Deficit in Fannin County is $9,721.
Families that are below poverty line in Fannin County earn $9,721 less on average than the poverty threshold level.
What is Inequality or Gini Index in Fannin County?
Inequality or Gini Index in Fannin County is 0.47.
What is the Total Population of Fannin County?
Total Population of Fannin County is 36,052.
What is the Total Male Population of Fannin County?
Total Male Population of Fannin County is 19,230.
What is the Total Female Population of Fannin County?
Total Female Population of Fannin County is 16,822.
What is the Ratio of Males per 100 Females in Fannin County?
There are 114.31 Males per 100 Females in Fannin County.
What is the Ratio of Females per 100 Males in Fannin County?
There are 87.48 Females per 100 Males in Fannin County.
What is the Median Population Age in Fannin County?
Median Population Age in Fannin County is 40.4 Years.
What is the Average Family Size in Fannin County
Average Family Size in Fannin County is 3.1 People.
What is the Average Household Size in Fannin County
Average Household Size in Fannin County is 2.6 People.
How Large is the Labor Force in Fannin County?
There are 15,808 People in the Labor Forcein in Fannin County.
What is the Percentage of People in the Labor Force in Fannin County?
53.9% of People are in the Labor Force in Fannin County.
What is the Unemployment Rate in Fannin County?
Unemployment Rate in Fannin County is 4.7%.