Falls County, TX Map & Demographics
Falls County Map
Falls County Overview
$29,183
PER CAPITA INCOME
$64,278
AVG FAMILY INCOME
$45,172
AVG HOUSEHOLD INCOME
8.0%
WAGE / INCOME GAP [ % ]
92.0¢/ $1
WAGE / INCOME GAP [ $ ]
$10,856
FAMILY INCOME DEFICIT
0.50
INEQUALITY / GINI INDEX
17,013
TOTAL POPULATION
8,065
MALE POPULATION
8,948
FEMALE POPULATION
90.13
MALES / 100 FEMALES
110.95
FEMALES / 100 MALES
40.0
MEDIAN AGE
3.7
AVG FAMILY SIZE
2.8
AVG HOUSEHOLD SIZE
6,753
LABOR FORCE [ PEOPLE ]
48.9%
PERCENT IN LABOR FORCE
7.4%
UNEMPLOYMENT RATE
Falls County Area Codes
Income in Falls County
Income Overview in Falls County
Per Capita Income in Falls County is $29,183, while median incomes of families and households are $64,278 and $45,172 respectively.
| Characteristic | Number | Measure |
| Per Capita Income | 17,013 | $29,183 |
| Median Family Income | 3,402 | $64,278 |
| Mean Family Income | 3,402 | $84,007 |
| Median Household Income | 5,499 | $45,172 |
| Mean Household Income | 5,499 | $67,718 |
| Income Deficit | 3,402 | $10,856 |
| Wage / Income Gap (%) | 17,013 | 8.05% |
| Wage / Income Gap ($) | 17,013 | 91.95¢ per $1 |
| Gini / Inequality Index | 17,013 | 0.50 |
Earnings by Sex in Falls County
Average Earnings in Falls County are $31,092, $32,374 for men and $29,768 for women, a difference of 8.1%.
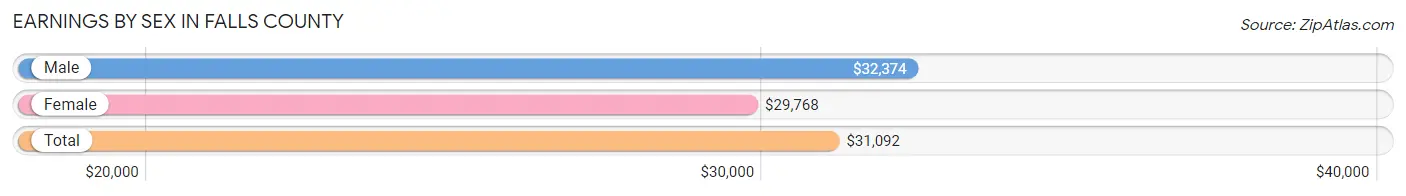
| Sex | Number | Average Earnings |
| Male | 3,655 (52.5%) | $32,374 |
| Female | 3,301 (47.5%) | $29,768 |
| Total | 6,956 (100.0%) | $31,092 |
Earnings by Sex by Income Bracket in Falls County
The most common earnings brackets in Falls County are $2,499 or less for men (528 | 14.4%) and $65,000 to $74,999 for women (395 | 12.0%).
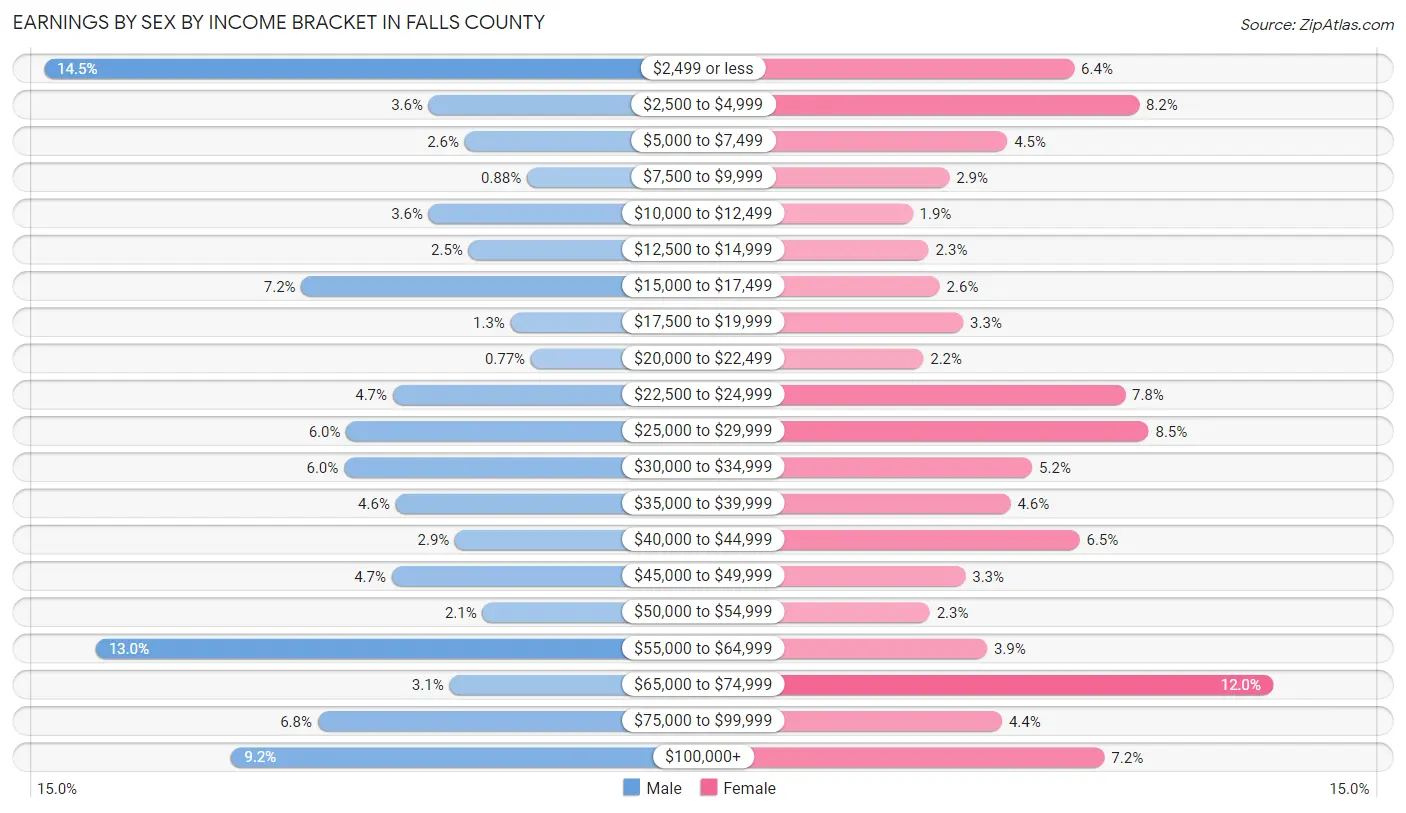
| Income | Male | Female |
| $2,499 or less | 528 (14.4%) | 211 (6.4%) |
| $2,500 to $4,999 | 133 (3.6%) | 271 (8.2%) |
| $5,000 to $7,499 | 96 (2.6%) | 149 (4.5%) |
| $7,500 to $9,999 | 32 (0.9%) | 95 (2.9%) |
| $10,000 to $12,499 | 133 (3.6%) | 61 (1.8%) |
| $12,500 to $14,999 | 92 (2.5%) | 76 (2.3%) |
| $15,000 to $17,499 | 264 (7.2%) | 86 (2.6%) |
| $17,500 to $19,999 | 49 (1.3%) | 108 (3.3%) |
| $20,000 to $22,499 | 28 (0.8%) | 71 (2.1%) |
| $22,500 to $24,999 | 170 (4.6%) | 258 (7.8%) |
| $25,000 to $29,999 | 218 (6.0%) | 280 (8.5%) |
| $30,000 to $34,999 | 220 (6.0%) | 172 (5.2%) |
| $35,000 to $39,999 | 167 (4.6%) | 152 (4.6%) |
| $40,000 to $44,999 | 106 (2.9%) | 216 (6.5%) |
| $45,000 to $49,999 | 171 (4.7%) | 110 (3.3%) |
| $50,000 to $54,999 | 78 (2.1%) | 77 (2.3%) |
| $55,000 to $64,999 | 475 (13.0%) | 130 (3.9%) |
| $65,000 to $74,999 | 112 (3.1%) | 395 (12.0%) |
| $75,000 to $99,999 | 247 (6.8%) | 144 (4.4%) |
| $100,000+ | 336 (9.2%) | 239 (7.2%) |
| Total | 3,655 (100.0%) | 3,301 (100.0%) |
Earnings by Sex by Educational Attainment in Falls County
Average earnings in Falls County are $45,408 for men and $34,390 for women, a difference of 24.3%. Men with an educational attainment of graduate degree enjoy the highest average annual earnings of $87,885, while those with less than high school education earn the least with $30,179. Women with an educational attainment of graduate degree earn the most with the average annual earnings of $68,333, while those with less than high school education have the smallest earnings of $18,538.
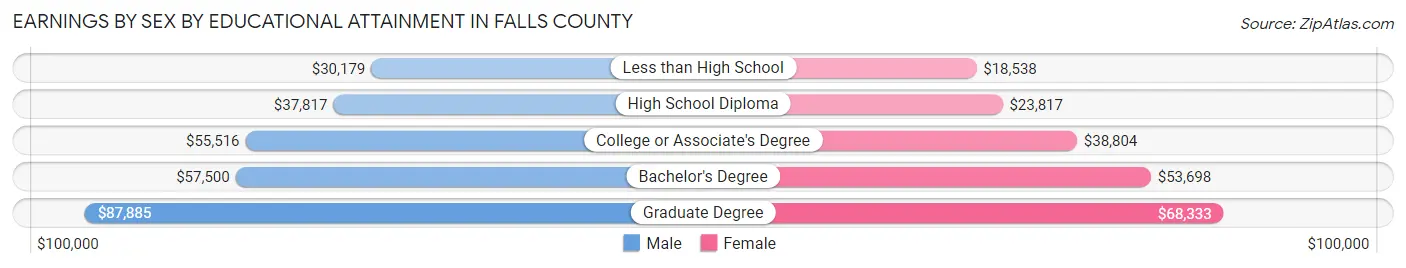
| Educational Attainment | Male Income | Female Income |
| Less than High School | $30,179 | $18,538 |
| High School Diploma | $37,817 | $23,817 |
| College or Associate's Degree | $55,516 | $38,804 |
| Bachelor's Degree | $57,500 | $53,698 |
| Graduate Degree | $87,885 | $68,333 |
| Total | $45,408 | $34,390 |
Family Income in Falls County
Family Income Brackets in Falls County
According to the Falls County family income data, there are 663 families falling into the $50,000 to $74,999 income range, which is the most common income bracket and makes up 19.5% of all families. Conversely, the less than $10,000 income bracket is the least frequent group with only 129 families (3.8%) belonging to this category.
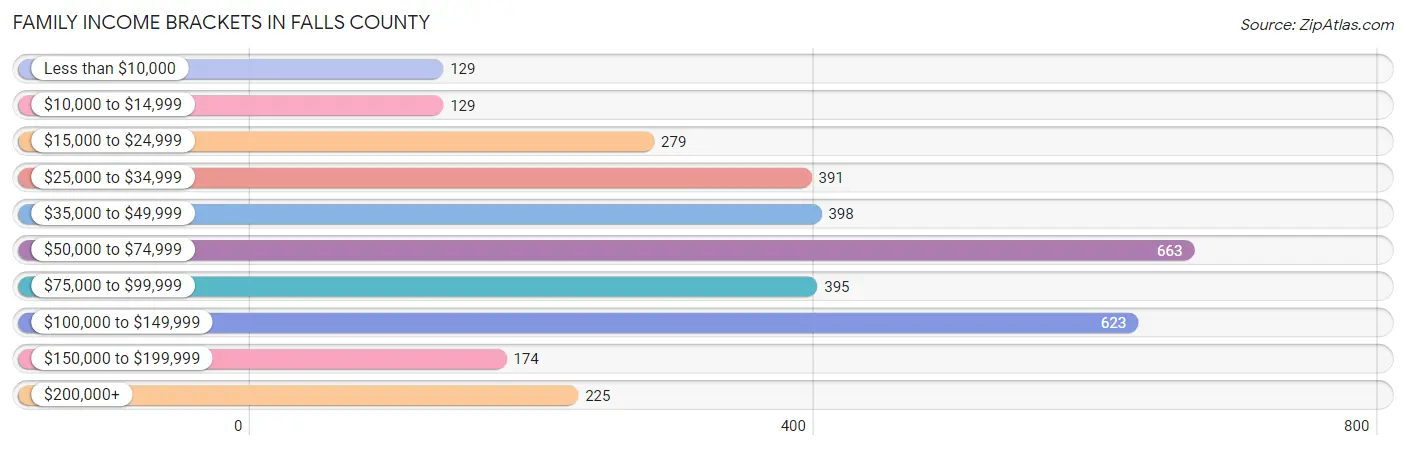
| Income Bracket | # Families | % Families |
| Less than $10,000 | 129 | 3.8% |
| $10,000 to $14,999 | 129 | 3.8% |
| $15,000 to $24,999 | 279 | 8.2% |
| $25,000 to $34,999 | 391 | 11.5% |
| $35,000 to $49,999 | 398 | 11.7% |
| $50,000 to $74,999 | 663 | 19.5% |
| $75,000 to $99,999 | 395 | 11.6% |
| $100,000 to $149,999 | 623 | 18.3% |
| $150,000 to $199,999 | 174 | 5.1% |
| $200,000+ | 225 | 6.6% |
Family Income by Famaliy Size in Falls County
6-person families (63 | 1.8%) account for the highest median family income in Falls County with $92,083 per family, while 3-person families (711 | 20.9%) have the highest median income of $25,586 per family member.
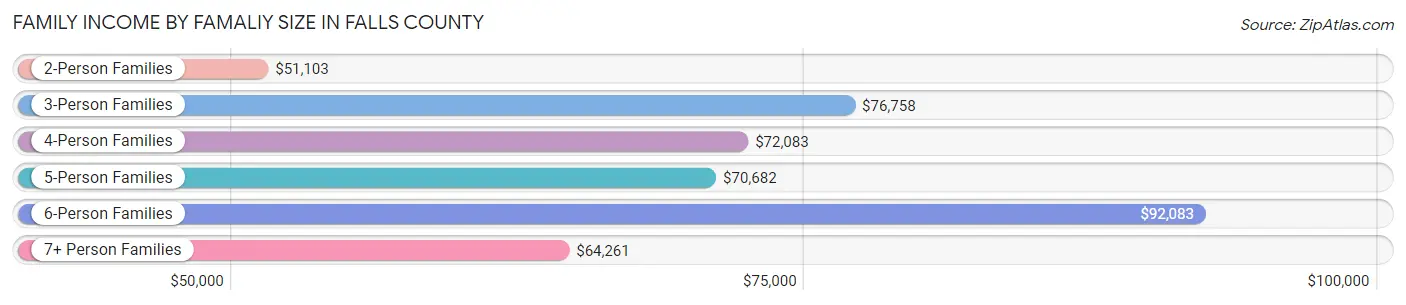
| Income Bracket | # Families | Median Income |
| 2-Person Families | 1,702 (50.0%) | $51,103 |
| 3-Person Families | 711 (20.9%) | $76,758 |
| 4-Person Families | 368 (10.8%) | $72,083 |
| 5-Person Families | 272 (8.0%) | $70,682 |
| 6-Person Families | 63 (1.8%) | $92,083 |
| 7+ Person Families | 286 (8.4%) | $64,261 |
| Total | 3,402 (100.0%) | $64,278 |
Family Income by Number of Earners in Falls County
The median family income in Falls County is $64,278, with families comprising 2 earners (1,023) having the highest median family income of $93,347, while families with no earners (843) have the lowest median family income of $28,941, accounting for 30.1% and 24.8% of families, respectively.
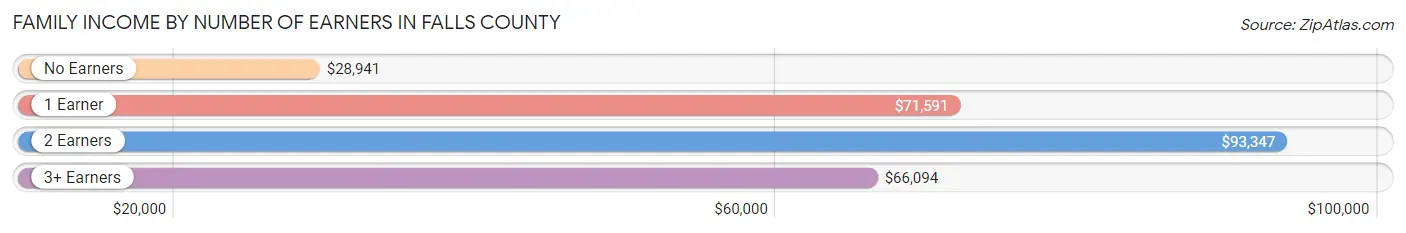
| Number of Earners | # Families | Median Income |
| No Earners | 843 (24.8%) | $28,941 |
| 1 Earner | 1,052 (30.9%) | $71,591 |
| 2 Earners | 1,023 (30.1%) | $93,347 |
| 3+ Earners | 484 (14.2%) | $66,094 |
| Total | 3,402 (100.0%) | $64,278 |
Household Income in Falls County
Household Income Brackets in Falls County
With 962 households falling in the category, the $50,000 to $74,999 income range is the most frequent in Falls County, accounting for 17.5% of all households. In contrast, only 176 households (3.2%) fall into the $150,000 to $199,999 income bracket, making it the least populous group.
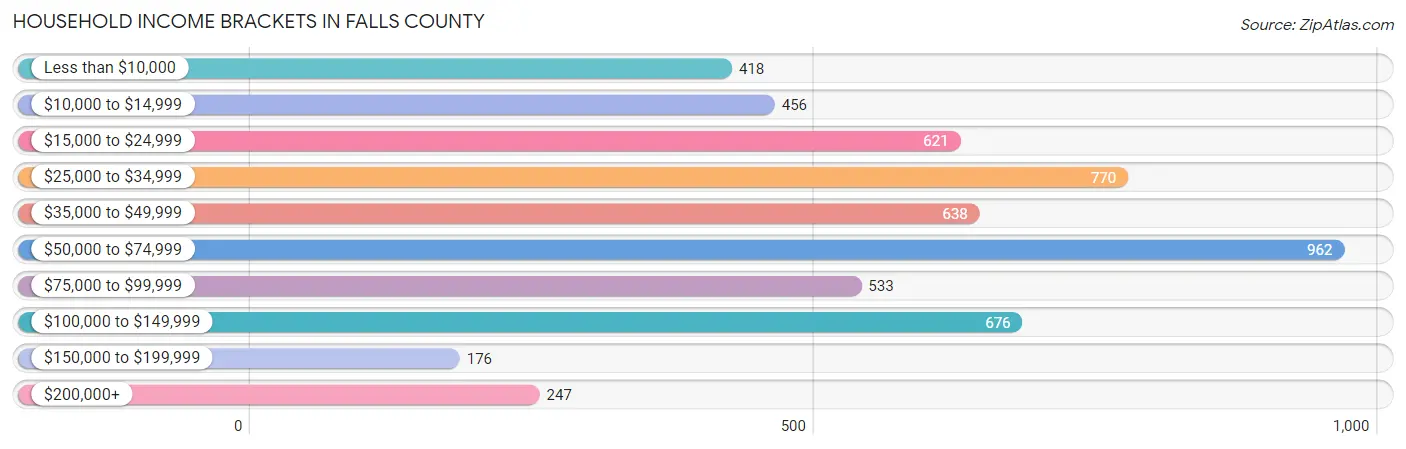
| Income Bracket | # Households | % Households |
| Less than $10,000 | 418 | 7.6% |
| $10,000 to $14,999 | 456 | 8.3% |
| $15,000 to $24,999 | 621 | 11.3% |
| $25,000 to $34,999 | 770 | 14.0% |
| $35,000 to $49,999 | 638 | 11.6% |
| $50,000 to $74,999 | 962 | 17.5% |
| $75,000 to $99,999 | 533 | 9.7% |
| $100,000 to $149,999 | 676 | 12.3% |
| $150,000 to $199,999 | 176 | 3.2% |
| $200,000+ | 247 | 4.5% |
Household Income by Householder Age in Falls County
The median household income in Falls County is $45,172, with the highest median household income of $64,656 found in the 25 to 44 years age bracket for the primary householder. A total of 1,072 households (19.5%) fall into this category. Meanwhile, the 65+ years age bracket for the primary householder has the lowest median household income of $31,835, with 2,041 households (37.1%) in this group.
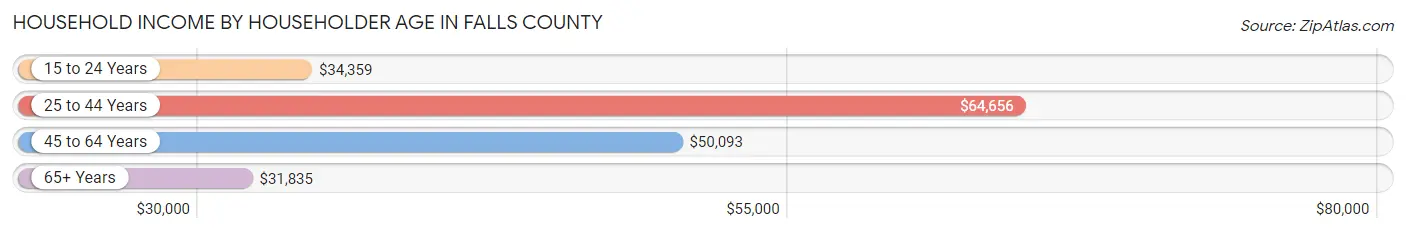
| Income Bracket | # Households | Median Income |
| 15 to 24 Years | 108 (2.0%) | $34,359 |
| 25 to 44 Years | 1,072 (19.5%) | $64,656 |
| 45 to 64 Years | 2,278 (41.4%) | $50,093 |
| 65+ Years | 2,041 (37.1%) | $31,835 |
| Total | 5,499 (100.0%) | $45,172 |
Poverty in Falls County
Income Below Poverty by Sex and Age in Falls County
With 19.2% poverty level for males and 12.3% for females among the residents of Falls County, 6 to 11 year old males and 75 year old and over females are the most vulnerable to poverty, with 231 males (33.6%) and 132 females (23.4%) in their respective age groups living below the poverty level.
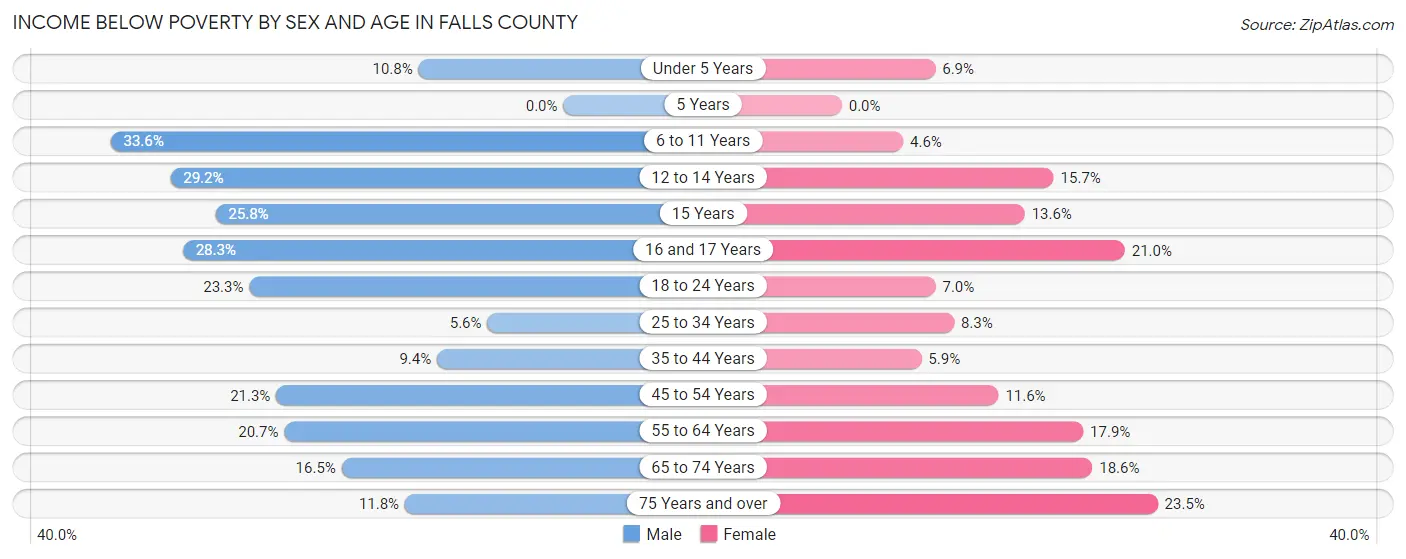
| Age Bracket | Male | Female |
| Under 5 Years | 30 (10.7%) | 40 (6.9%) |
| 5 Years | 0 (0.0%) | 0 (0.0%) |
| 6 to 11 Years | 231 (33.6%) | 28 (4.5%) |
| 12 to 14 Years | 117 (29.2%) | 56 (15.7%) |
| 15 Years | 39 (25.8%) | 11 (13.6%) |
| 16 and 17 Years | 65 (28.3%) | 29 (21.0%) |
| 18 to 24 Years | 292 (23.3%) | 32 (7.0%) |
| 25 to 34 Years | 39 (5.6%) | 50 (8.3%) |
| 35 to 44 Years | 54 (9.4%) | 67 (5.9%) |
| 45 to 54 Years | 190 (21.3%) | 99 (11.6%) |
| 55 to 64 Years | 219 (20.7%) | 188 (17.9%) |
| 65 to 74 Years | 132 (16.5%) | 181 (18.6%) |
| 75 Years and over | 79 (11.8%) | 132 (23.4%) |
| Total | 1,487 (19.2%) | 913 (12.3%) |
Income Above Poverty by Sex and Age in Falls County
According to the poverty statistics in Falls County, males aged 5 years and females aged 5 years are the age groups that are most secure financially, with 100.0% of males and 100.0% of females in these age groups living above the poverty line.
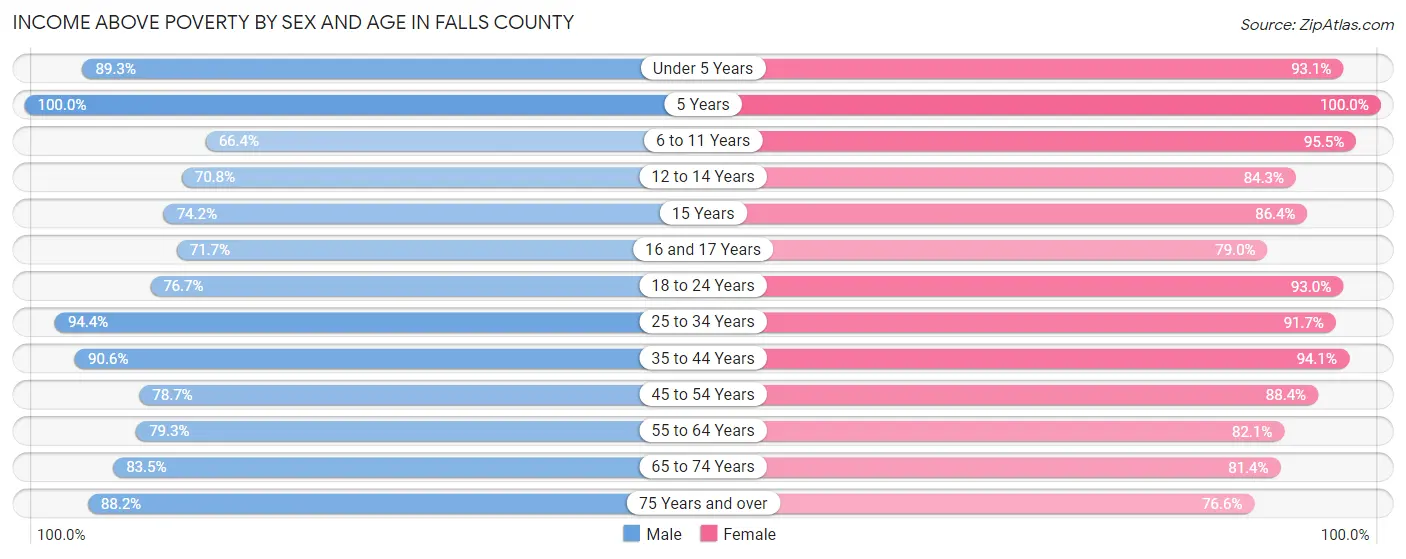
| Age Bracket | Male | Female |
| Under 5 Years | 249 (89.2%) | 536 (93.1%) |
| 5 Years | 46 (100.0%) | 12 (100.0%) |
| 6 to 11 Years | 456 (66.4%) | 587 (95.5%) |
| 12 to 14 Years | 284 (70.8%) | 300 (84.3%) |
| 15 Years | 112 (74.2%) | 70 (86.4%) |
| 16 and 17 Years | 165 (71.7%) | 109 (79.0%) |
| 18 to 24 Years | 960 (76.7%) | 428 (93.0%) |
| 25 to 34 Years | 652 (94.4%) | 550 (91.7%) |
| 35 to 44 Years | 522 (90.6%) | 1,066 (94.1%) |
| 45 to 54 Years | 701 (78.7%) | 752 (88.4%) |
| 55 to 64 Years | 838 (79.3%) | 861 (82.1%) |
| 65 to 74 Years | 670 (83.5%) | 792 (81.4%) |
| 75 Years and over | 593 (88.2%) | 431 (76.5%) |
| Total | 6,248 (80.8%) | 6,494 (87.7%) |
Income Below Poverty Among Married-Couple Families in Falls County
The poverty statistics for married-couple families in Falls County show that 4.9% or 124 of the total 2,520 families live below the poverty line. Families with 3 or 4 children have the highest poverty rate of 5.9%, comprising of 11 families. On the other hand, families with 5 or more children have the lowest poverty rate of 0.0%, which includes 0 families.
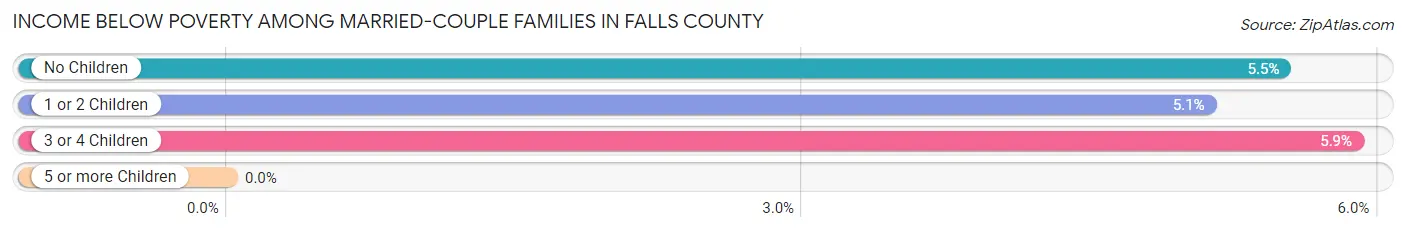
| Children | Above Poverty | Below Poverty |
| No Children | 1,444 (94.5%) | 84 (5.5%) |
| 1 or 2 Children | 539 (94.9%) | 29 (5.1%) |
| 3 or 4 Children | 176 (94.1%) | 11 (5.9%) |
| 5 or more Children | 237 (100.0%) | 0 (0.0%) |
| Total | 2,396 (95.1%) | 124 (4.9%) |
Income Below Poverty Among Single-Parent Households in Falls County
According to the poverty data in Falls County, 67.5% or 104 single-father households and 29.9% or 218 single-mother households are living below the poverty line. Among single-father households, those with 3 or 4 children have the highest poverty rate, with 12 households (100.0%) experiencing poverty. Likewise, among single-mother households, those with 3 or 4 children have the highest poverty rate, with 41 households (69.5%) falling below the poverty line.
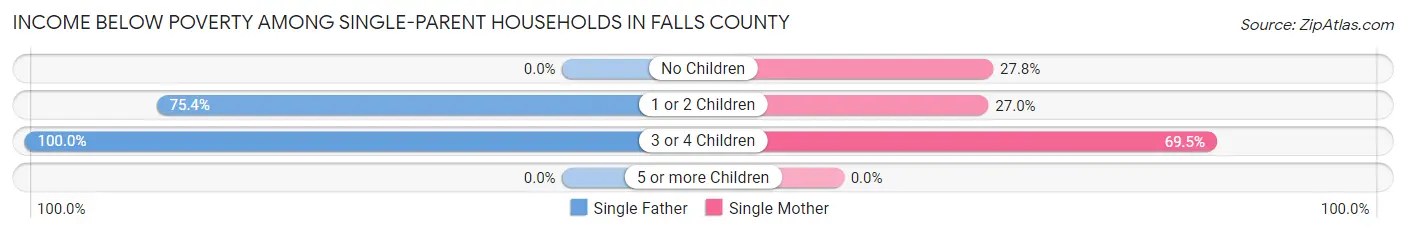
| Children | Single Father | Single Mother |
| No Children | 0 (0.0%) | 98 (27.8%) |
| 1 or 2 Children | 92 (75.4%) | 79 (27.0%) |
| 3 or 4 Children | 12 (100.0%) | 41 (69.5%) |
| 5 or more Children | 0 (0.0%) | 0 (0.0%) |
| Total | 104 (67.5%) | 218 (29.9%) |
Income Below Poverty Among Married-Couple vs Single-Parent Households in Falls County
The poverty data for Falls County shows that 124 of the married-couple family households (4.9%) and 322 of the single-parent households (36.5%) are living below the poverty level. Within the married-couple family households, those with 3 or 4 children have the highest poverty rate, with 11 households (5.9%) falling below the poverty line. Among the single-parent households, those with 3 or 4 children have the highest poverty rate, with 53 household (74.7%) living below poverty.
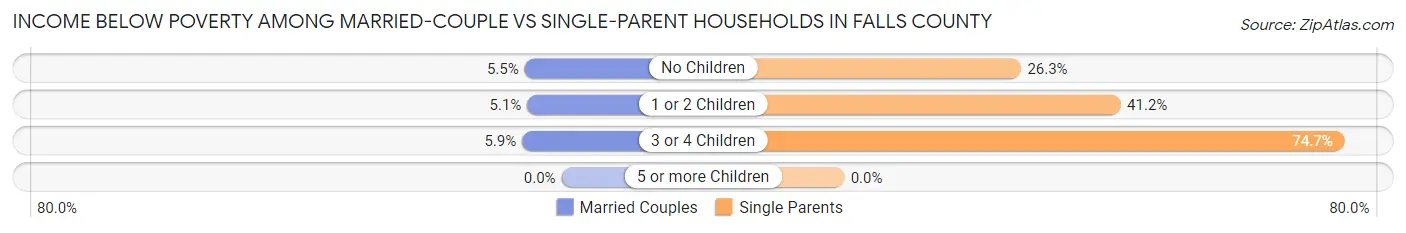
| Children | Married-Couple Families | Single-Parent Households |
| No Children | 84 (5.5%) | 98 (26.3%) |
| 1 or 2 Children | 29 (5.1%) | 171 (41.2%) |
| 3 or 4 Children | 11 (5.9%) | 53 (74.7%) |
| 5 or more Children | 0 (0.0%) | 0 (0.0%) |
| Total | 124 (4.9%) | 322 (36.5%) |
Race in Falls County
The most populous races in Falls County are White / Caucasian (9,702 | 57.0%), Hispanic or Latino (4,216 | 24.8%), and Black / African American (3,513 | 20.6%).
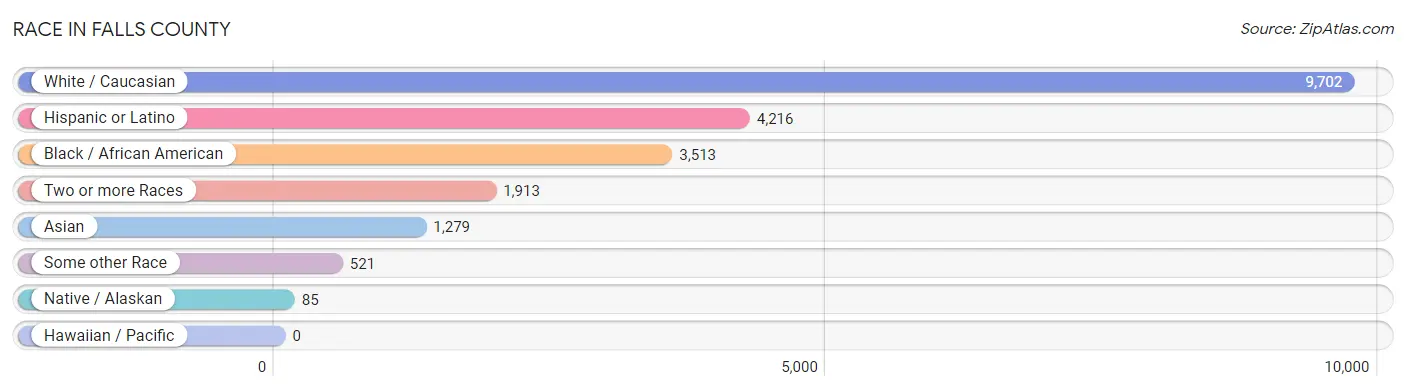
| Race | # Population | % Population |
| Asian | 1,279 | 7.5% |
| Black / African American | 3,513 | 20.6% |
| Hawaiian / Pacific | 0 | 0.0% |
| Hispanic or Latino | 4,216 | 24.8% |
| Native / Alaskan | 85 | 0.5% |
| White / Caucasian | 9,702 | 57.0% |
| Two or more Races | 1,913 | 11.2% |
| Some other Race | 521 | 3.1% |
| Total | 17,013 | 100.0% |
Ancestry in Falls County
The most populous ancestries reported in Falls County are Mexican (3,930 | 23.1%), German (2,658 | 15.6%), Japanese (1,212 | 7.1%), Irish (1,178 | 6.9%), and English (924 | 5.4%), together accounting for 58.2% of all Falls County residents.
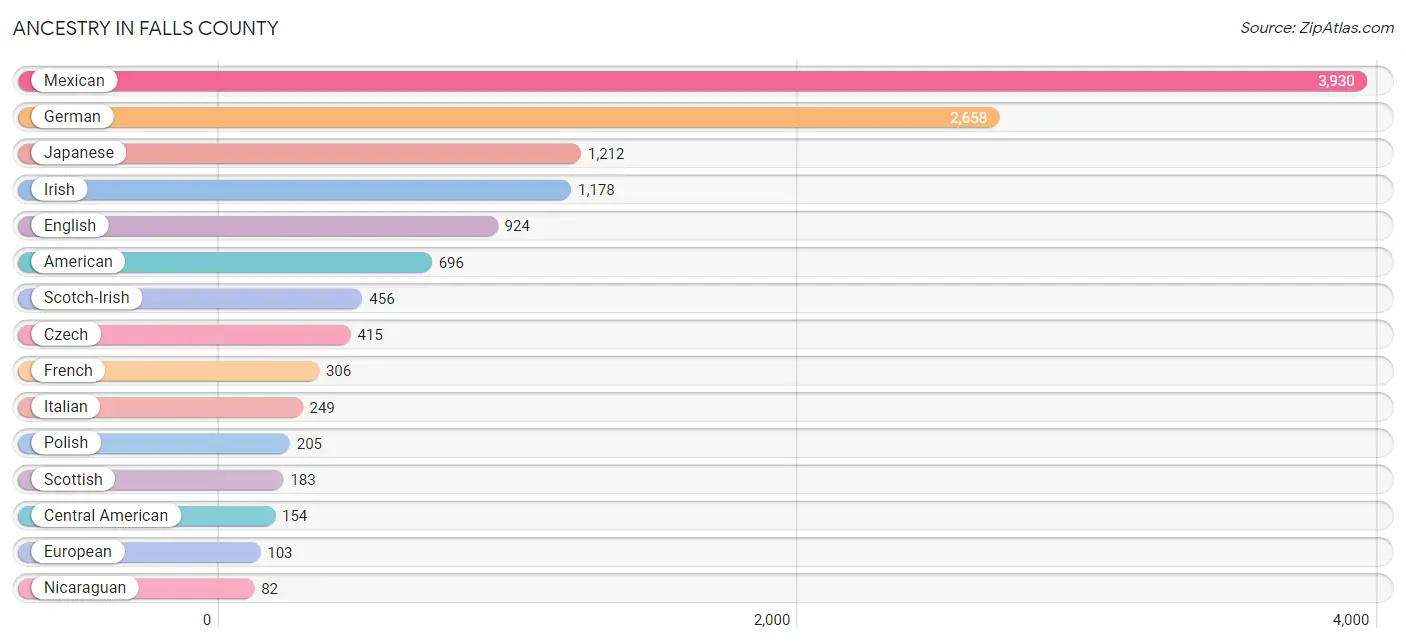
| Ancestry | # Population | % Population |
| African | 39 | 0.2% |
| American | 696 | 4.1% |
| Apache | 46 | 0.3% |
| Austrian | 14 | 0.1% |
| British | 11 | 0.1% |
| Central American | 154 | 0.9% |
| Cherokee | 70 | 0.4% |
| Chickasaw | 7 | 0.0% |
| Colombian | 34 | 0.2% |
| Comanche | 18 | 0.1% |
| Creek | 4 | 0.0% |
| Czech | 415 | 2.4% |
| Czechoslovakian | 23 | 0.1% |
| Danish | 12 | 0.1% |
| Dominican | 5 | 0.0% |
| Dutch | 68 | 0.4% |
| Eastern European | 18 | 0.1% |
| English | 924 | 5.4% |
| European | 103 | 0.6% |
| French | 306 | 1.8% |
| French Canadian | 1 | 0.0% |
| German | 2,658 | 15.6% |
| Greek | 29 | 0.2% |
| Honduran | 11 | 0.1% |
| Hungarian | 31 | 0.2% |
| Irish | 1,178 | 6.9% |
| Italian | 249 | 1.5% |
| Japanese | 1,212 | 7.1% |
| Korean | 6 | 0.0% |
| Mexican | 3,930 | 23.1% |
| Nicaraguan | 82 | 0.5% |
| Norwegian | 50 | 0.3% |
| Pennsylvania German | 9 | 0.1% |
| Polish | 205 | 1.2% |
| Puerto Rican | 47 | 0.3% |
| Russian | 16 | 0.1% |
| Salvadoran | 61 | 0.4% |
| Samoan | 82 | 0.5% |
| Scandinavian | 10 | 0.1% |
| Scotch-Irish | 456 | 2.7% |
| Scottish | 183 | 1.1% |
| Slovak | 14 | 0.1% |
| Slovene | 18 | 0.1% |
| South American | 34 | 0.2% |
| Spanish | 6 | 0.0% |
| Subsaharan African | 46 | 0.3% |
| Swedish | 42 | 0.3% |
| Swiss | 12 | 0.1% |
| Thai | 67 | 0.4% |
| Ukrainian | 19 | 0.1% |
| Welsh | 3 | 0.0% | View All 51 Rows |
Immigrants in Falls County
The most numerous immigrant groups reported in Falls County came from Central America (634 | 3.7%), Latin America (634 | 3.7%), Mexico (526 | 3.1%), Asia (216 | 1.3%), and South Eastern Asia (203 | 1.2%), together accounting for 13.0% of all Falls County residents.
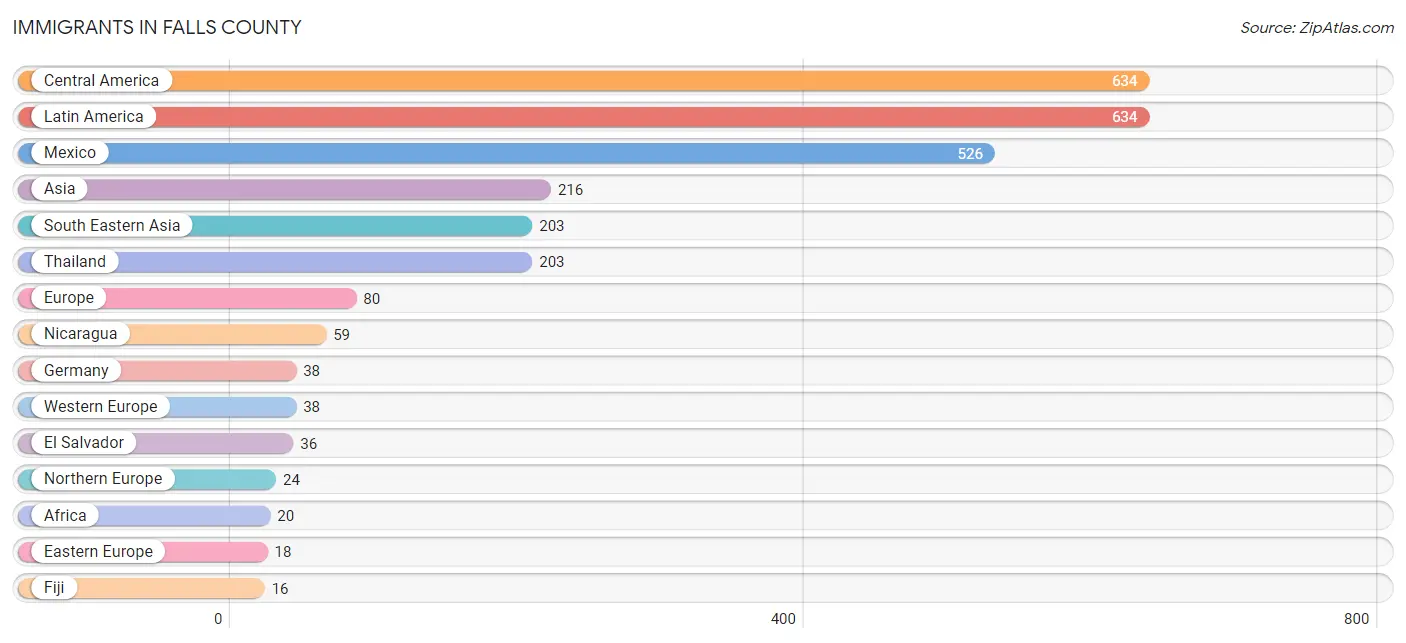
| Immigration Origin | # Population | % Population |
| Africa | 20 | 0.1% |
| Asia | 216 | 1.3% |
| Belize | 2 | 0.0% |
| Cameroon | 7 | 0.0% |
| Central America | 634 | 3.7% |
| Eastern Europe | 18 | 0.1% |
| El Salvador | 36 | 0.2% |
| England | 7 | 0.0% |
| Europe | 80 | 0.5% |
| Fiji | 16 | 0.1% |
| Germany | 38 | 0.2% |
| Honduras | 11 | 0.1% |
| Hungary | 13 | 0.1% |
| Latin America | 634 | 3.7% |
| Mexico | 526 | 3.1% |
| Middle Africa | 7 | 0.0% |
| Nicaragua | 59 | 0.4% |
| Northern Europe | 24 | 0.1% |
| Oceania | 16 | 0.1% |
| Pakistan | 13 | 0.1% |
| Russia | 5 | 0.0% |
| South Central Asia | 13 | 0.1% |
| South Eastern Asia | 203 | 1.2% |
| Thailand | 203 | 1.2% |
| Western Europe | 38 | 0.2% | View All 25 Rows |
Sex and Age in Falls County
Sex and Age in Falls County
The most populous age groups in Falls County are 15 to 19 Years (970 | 12.0%) for men and 35 to 39 Years (830 | 9.3%) for women.
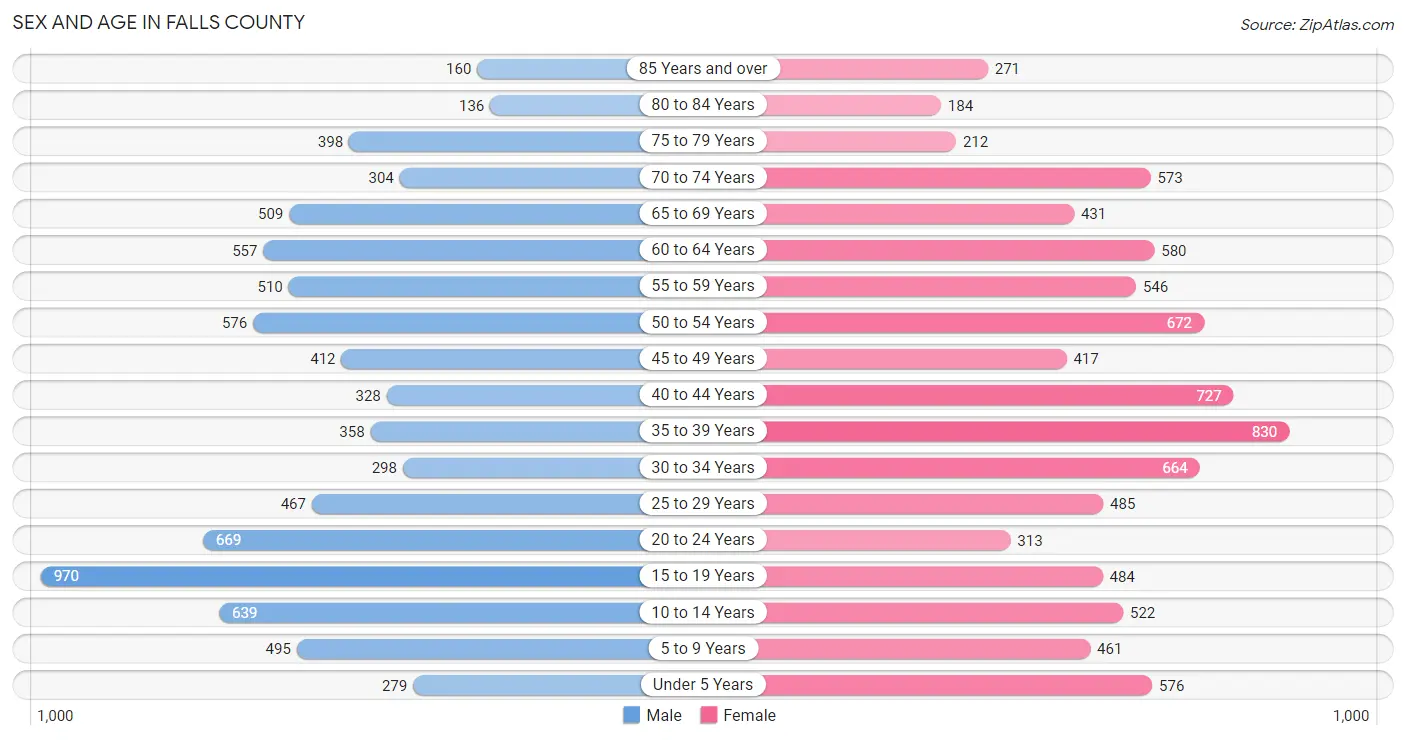
| Age Bracket | Male | Female |
| Under 5 Years | 279 (3.5%) | 576 (6.4%) |
| 5 to 9 Years | 495 (6.1%) | 461 (5.1%) |
| 10 to 14 Years | 639 (7.9%) | 522 (5.8%) |
| 15 to 19 Years | 970 (12.0%) | 484 (5.4%) |
| 20 to 24 Years | 669 (8.3%) | 313 (3.5%) |
| 25 to 29 Years | 467 (5.8%) | 485 (5.4%) |
| 30 to 34 Years | 298 (3.7%) | 664 (7.4%) |
| 35 to 39 Years | 358 (4.4%) | 830 (9.3%) |
| 40 to 44 Years | 328 (4.1%) | 727 (8.1%) |
| 45 to 49 Years | 412 (5.1%) | 417 (4.7%) |
| 50 to 54 Years | 576 (7.1%) | 672 (7.5%) |
| 55 to 59 Years | 510 (6.3%) | 546 (6.1%) |
| 60 to 64 Years | 557 (6.9%) | 580 (6.5%) |
| 65 to 69 Years | 509 (6.3%) | 431 (4.8%) |
| 70 to 74 Years | 304 (3.8%) | 573 (6.4%) |
| 75 to 79 Years | 398 (4.9%) | 212 (2.4%) |
| 80 to 84 Years | 136 (1.7%) | 184 (2.1%) |
| 85 Years and over | 160 (2.0%) | 271 (3.0%) |
| Total | 8,065 (100.0%) | 8,948 (100.0%) |
Families and Households in Falls County
Median Family Size in Falls County
The median family size in Falls County is 3.70 persons per family, with single female/mother families (728 | 21.4%) accounting for the largest median family size of 4.38 persons per family. On the other hand, married-couple families (2,520 | 74.1%) represent the smallest median family size with 3.50 persons per family.
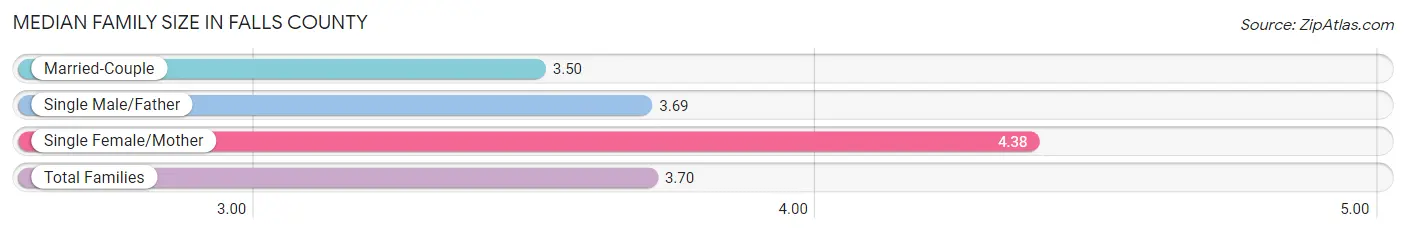
| Family Type | # Families | Family Size |
| Married-Couple | 2,520 (74.1%) | 3.50 |
| Single Male/Father | 154 (4.5%) | 3.69 |
| Single Female/Mother | 728 (21.4%) | 4.38 |
| Total Families | 3,402 (100.0%) | 3.70 |
Median Household Size in Falls County
The median household size in Falls County is 2.75 persons per household, with single female/mother households (728 | 13.2%) accounting for the largest median household size of 4.58 persons per household. non-family households (2,097 | 38.1%) represent the smallest median household size with 1.03 persons per household.
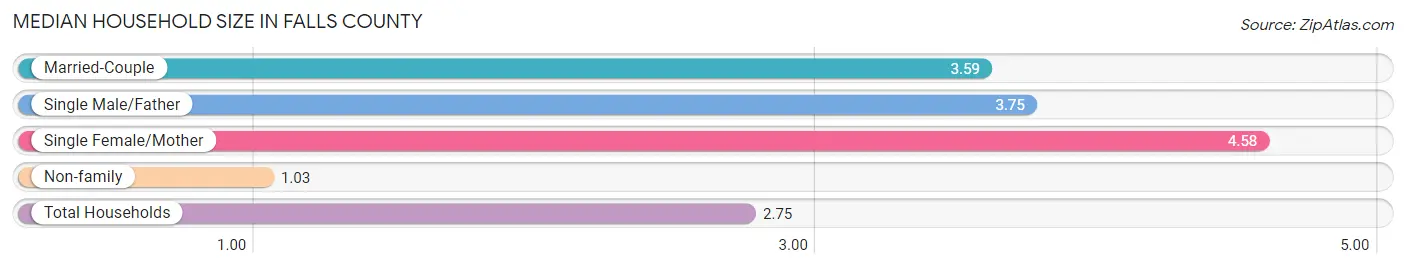
| Household Type | # Households | Household Size |
| Married-Couple | 2,520 (45.8%) | 3.59 |
| Single Male/Father | 154 (2.8%) | 3.75 |
| Single Female/Mother | 728 (13.2%) | 4.58 |
| Non-family | 2,097 (38.1%) | 1.03 |
| Total Households | 5,499 (100.0%) | 2.75 |
Household Size by Marriage Status in Falls County
Out of a total of 5,499 households in Falls County, 3,402 (61.9%) are family households, while 2,097 (38.1%) are nonfamily households. The most numerous type of family households are 2-person households, comprising 1,664, and the most common type of nonfamily households are 1-person households, comprising 2,030.
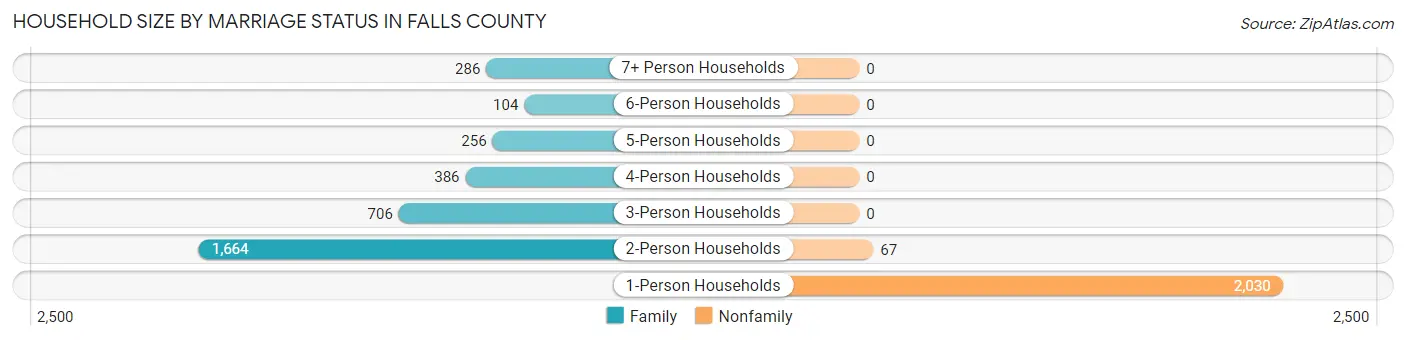
| Household Size | Family Households | Nonfamily Households |
| 1-Person Households | - | 2,030 (36.9%) |
| 2-Person Households | 1,664 (30.3%) | 67 (1.2%) |
| 3-Person Households | 706 (12.8%) | 0 (0.0%) |
| 4-Person Households | 386 (7.0%) | 0 (0.0%) |
| 5-Person Households | 256 (4.7%) | 0 (0.0%) |
| 6-Person Households | 104 (1.9%) | 0 (0.0%) |
| 7+ Person Households | 286 (5.2%) | 0 (0.0%) |
| Total | 3,402 (61.9%) | 2,097 (38.1%) |
Female Fertility in Falls County
Fertility by Age in Falls County
Average fertility rate in Falls County is 97.0 births per 1,000 women. Women in the age bracket of 35 to 50 years have the highest fertility rate with 128.0 births per 1,000 women. Women in the age bracket of 35 to 50 years acount for 67.6% of all women with births.
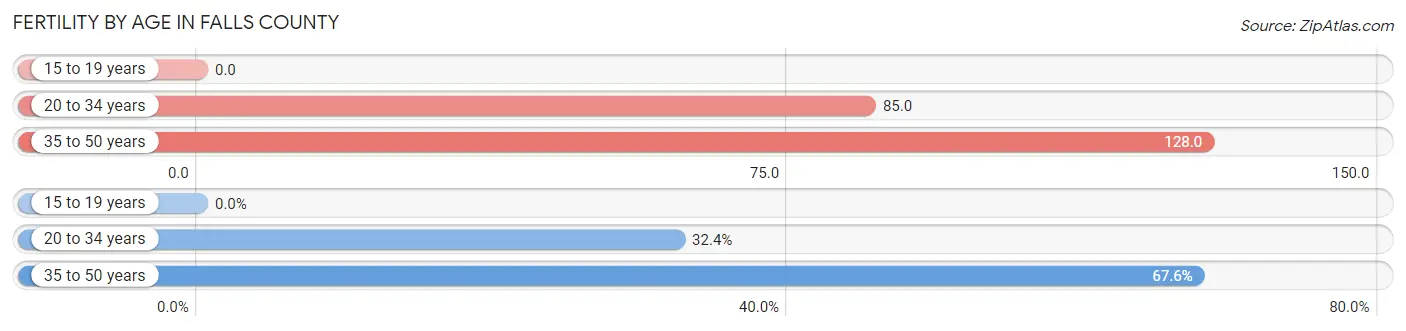
| Age Bracket | Women with Births | Births / 1,000 Women |
| 15 to 19 years | 0 (0.0%) | 0.0 |
| 20 to 34 years | 125 (32.4%) | 85.0 |
| 35 to 50 years | 261 (67.6%) | 128.0 |
| Total | 386 (100.0%) | 97.0 |
Fertility by Age by Marriage Status in Falls County
94.3% of women with births (386) in Falls County are married. The highest percentage of unmarried women with births falls into 20 to 34 years age bracket with 11.2% of them unmarried at the time of birth, while the lowest percentage of unmarried women with births belong to 35 to 50 years age bracket with 3.1% of them unmarried.
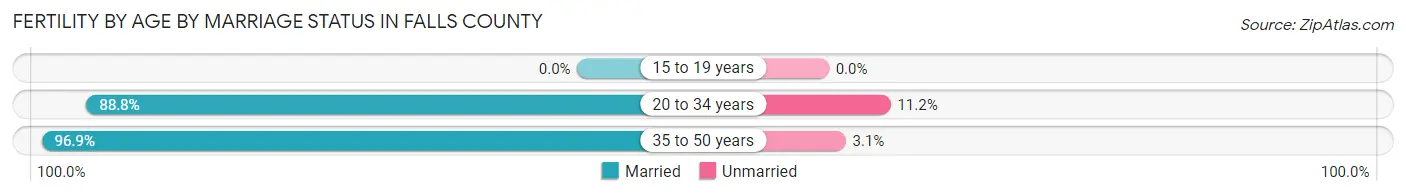
| Age Bracket | Married | Unmarried |
| 15 to 19 years | 0 (0.0%) | 0 (0.0%) |
| 20 to 34 years | 111 (88.8%) | 14 (11.2%) |
| 35 to 50 years | 253 (96.9%) | 8 (3.1%) |
| Total | 364 (94.3%) | 22 (5.7%) |
Fertility by Education in Falls County
Average fertility rate in Falls County is 97.0 births per 1,000 women. Women with the education attainment of college or associate's degree have the highest fertility rate of 175.0 births per 1,000 women, while women with the education attainment of high school diploma have the lowest fertility at 7.0 births per 1,000 women. Women with the education attainment of college or associate's degree represent 65.3% of all women with births.
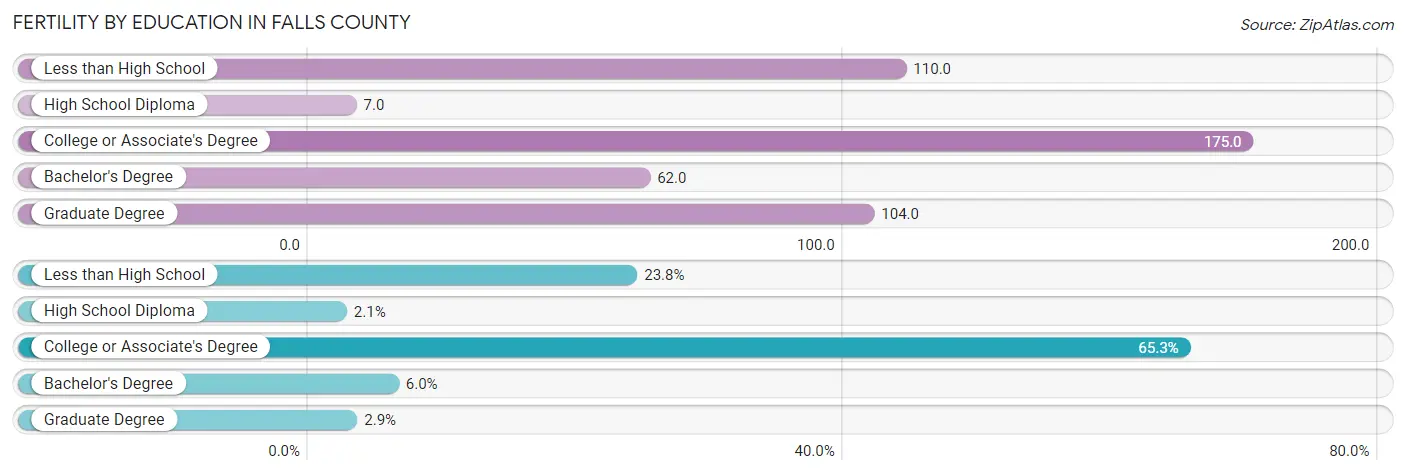
| Educational Attainment | Women with Births | Births / 1,000 Women |
| Less than High School | 92 (23.8%) | 110.0 |
| High School Diploma | 8 (2.1%) | 7.0 |
| College or Associate's Degree | 252 (65.3%) | 175.0 |
| Bachelor's Degree | 23 (6.0%) | 62.0 |
| Graduate Degree | 11 (2.9%) | 104.0 |
| Total | 386 (100.0%) | 97.0 |
Fertility by Education by Marriage Status in Falls County
5.7% of women with births in Falls County are unmarried. Women with the educational attainment of less than high school are most likely to be married with 100.0% of them married at childbirth, while women with the educational attainment of high school diploma are least likely to be married with 100.0% of them unmarried at childbirth.
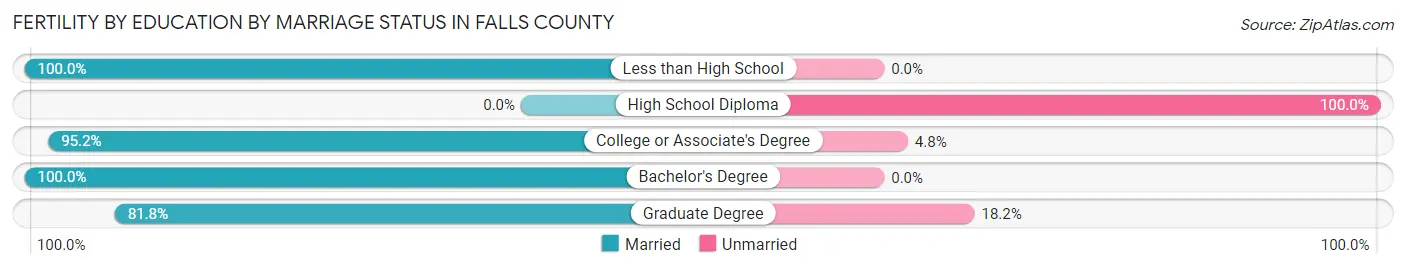
| Educational Attainment | Married | Unmarried |
| Less than High School | 92 (100.0%) | 0 (0.0%) |
| High School Diploma | 0 (0.0%) | 8 (100.0%) |
| College or Associate's Degree | 240 (95.2%) | 12 (4.8%) |
| Bachelor's Degree | 23 (100.0%) | 0 (0.0%) |
| Graduate Degree | 9 (81.8%) | 2 (18.2%) |
| Total | 364 (94.3%) | 22 (5.7%) |
Employment Characteristics in Falls County
Employment by Class of Employer in Falls County
Among the 6,200 employed individuals in Falls County, private company employees (3,015 | 48.6%), self-employed (not incorporated) (973 | 15.7%), and not-for-profit organizations (697 | 11.2%) make up the most common classes of employment.
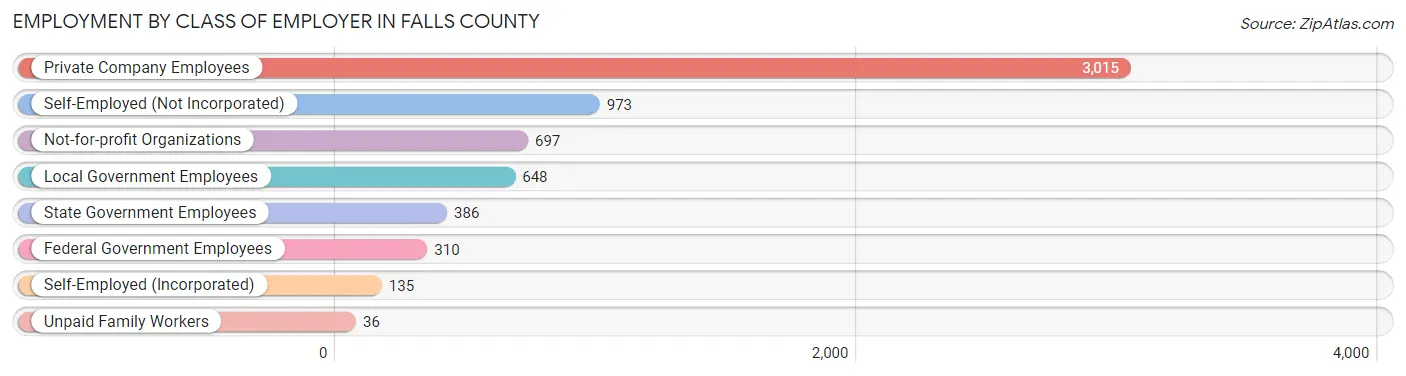
| Employer Class | # Employees | % Employees |
| Private Company Employees | 3,015 | 48.6% |
| Self-Employed (Incorporated) | 135 | 2.2% |
| Self-Employed (Not Incorporated) | 973 | 15.7% |
| Not-for-profit Organizations | 697 | 11.2% |
| Local Government Employees | 648 | 10.4% |
| State Government Employees | 386 | 6.2% |
| Federal Government Employees | 310 | 5.0% |
| Unpaid Family Workers | 36 | 0.6% |
| Total | 6,200 | 100.0% |
Employment Status by Age in Falls County
According to the labor force statistics for Falls County, out of the total population over 16 years of age (13,809), 48.9% or 6,753 individuals are in the labor force, with 7.4% or 500 of them unemployed. The age group with the highest labor force participation rate is 35 to 44 years, with 68.2% or 1,530 individuals in the labor force. Within the labor force, the 25 to 29 years age range has the highest percentage of unemployed individuals, with 34.6% or 183 of them being unemployed.
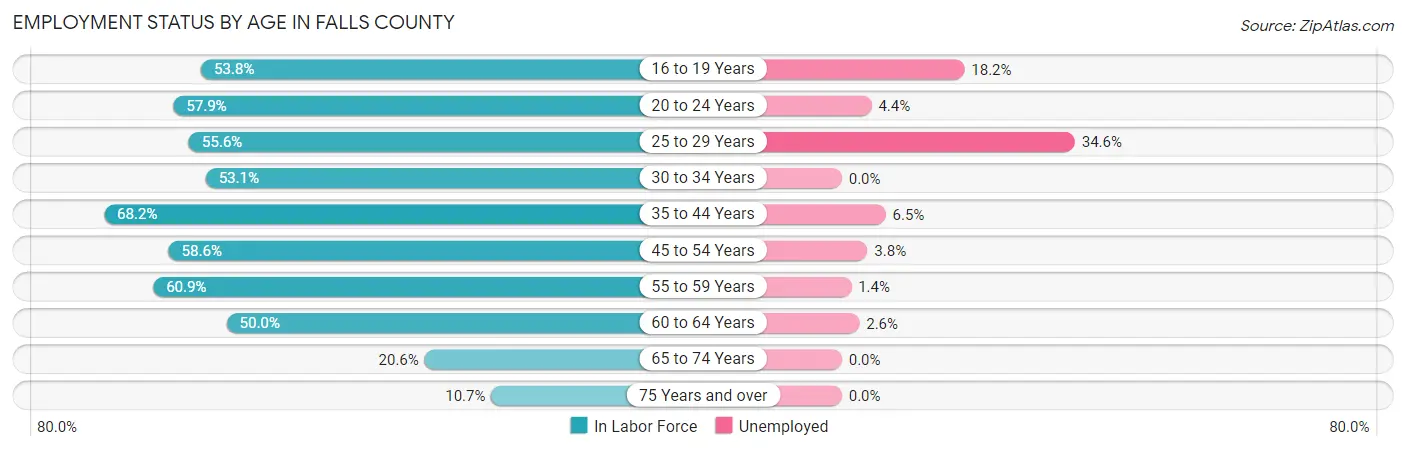
| Age Bracket | In Labor Force | Unemployed |
| 16 to 19 Years | 657 (53.8%) | 120 (18.2%) |
| 20 to 24 Years | 569 (57.9%) | 25 (4.4%) |
| 25 to 29 Years | 529 (55.6%) | 183 (34.6%) |
| 30 to 34 Years | 511 (53.1%) | 0 (0.0%) |
| 35 to 44 Years | 1,530 (68.2%) | 99 (6.5%) |
| 45 to 54 Years | 1,217 (58.6%) | 46 (3.8%) |
| 55 to 59 Years | 643 (60.9%) | 9 (1.4%) |
| 60 to 64 Years | 568 (50.0%) | 15 (2.6%) |
| 65 to 74 Years | 374 (20.6%) | 0 (0.0%) |
| 75 Years and over | 146 (10.7%) | 0 (0.0%) |
| Total | 6,753 (48.9%) | 500 (7.4%) |
Employment Status by Educational Attainment in Falls County
According to labor force statistics for Falls County, 59.3% of individuals (4,997) out of the total population between 25 and 64 years of age (8,427) are in the labor force, with 7.1% or 355 of them being unemployed. The group with the highest labor force participation rate are those with the educational attainment of bachelor's degree or higher, with 78.2% or 956 individuals in the labor force. Within the labor force, individuals with college / associate degree education have the highest percentage of unemployment, with 12.3% or 274 of them being unemployed.
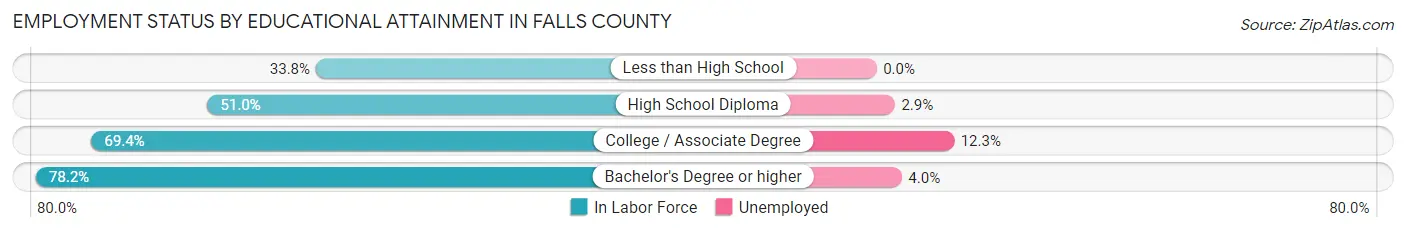
| Educational Attainment | In Labor Force | Unemployed |
| Less than High School | 437 (33.8%) | 0 (0.0%) |
| High School Diploma | 1,375 (51.0%) | 78 (2.9%) |
| College / Associate Degree | 2,231 (69.4%) | 395 (12.3%) |
| Bachelor's Degree or higher | 956 (78.2%) | 49 (4.0%) |
| Total | 4,997 (59.3%) | 598 (7.1%) |
Employment Occupations by Sex in Falls County
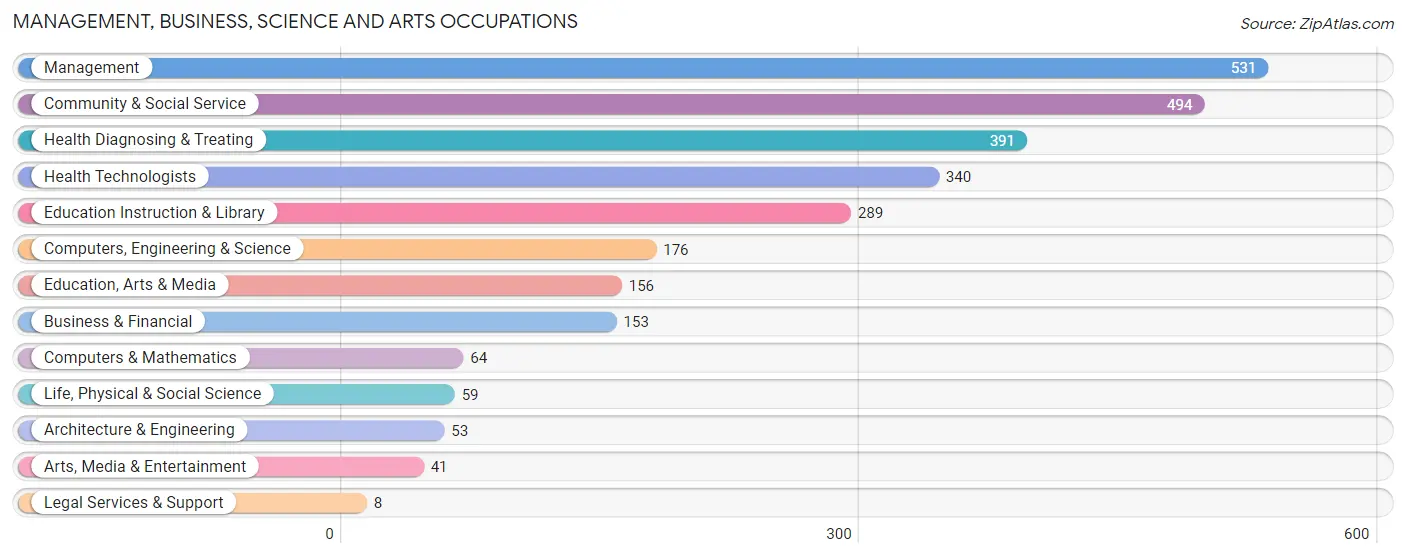
Management, Business, Science and Arts Occupations
The most common Management, Business, Science and Arts occupations in Falls County are Management (531 | 8.5%), Community & Social Service (494 | 7.9%), Health Diagnosing & Treating (391 | 6.3%), Health Technologists (340 | 5.4%), and Education Instruction & Library (289 | 4.6%).
Management, Business, Science and Arts Occupations by Sex
Within the Management, Business, Science and Arts occupations in Falls County, the most male-oriented occupations are Architecture & Engineering (100.0%), Computers & Mathematics (92.2%), and Computers, Engineering & Science (92.0%), while the most female-oriented occupations are Health Technologists (100.0%), Health Diagnosing & Treating (98.2%), and Education Instruction & Library (71.3%).
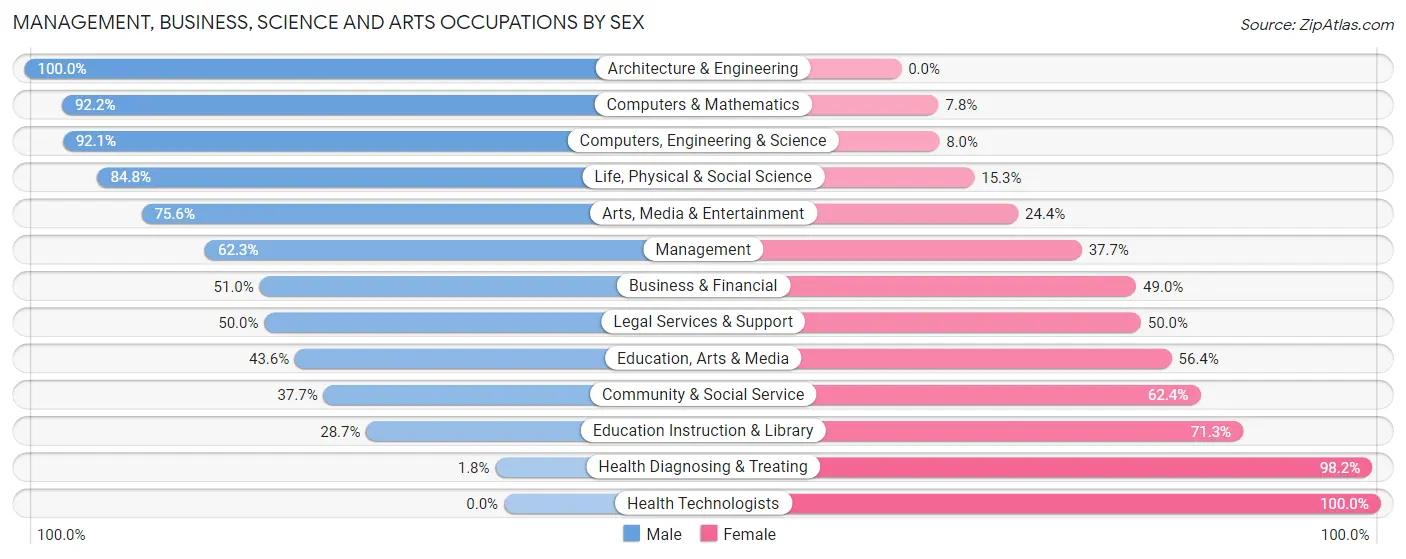
| Occupation | Male | Female |
| Management | 331 (62.3%) | 200 (37.7%) |
| Business & Financial | 78 (51.0%) | 75 (49.0%) |
| Computers, Engineering & Science | 162 (92.0%) | 14 (8.0%) |
| Computers & Mathematics | 59 (92.2%) | 5 (7.8%) |
| Architecture & Engineering | 53 (100.0%) | 0 (0.0%) |
| Life, Physical & Social Science | 50 (84.8%) | 9 (15.2%) |
| Community & Social Service | 186 (37.7%) | 308 (62.4%) |
| Education, Arts & Media | 68 (43.6%) | 88 (56.4%) |
| Legal Services & Support | 4 (50.0%) | 4 (50.0%) |
| Education Instruction & Library | 83 (28.7%) | 206 (71.3%) |
| Arts, Media & Entertainment | 31 (75.6%) | 10 (24.4%) |
| Health Diagnosing & Treating | 7 (1.8%) | 384 (98.2%) |
| Health Technologists | 0 (0.0%) | 340 (100.0%) |
| Total (Category) | 764 (43.8%) | 981 (56.2%) |
| Total (Overall) | 3,335 (53.4%) | 2,913 (46.6%) |
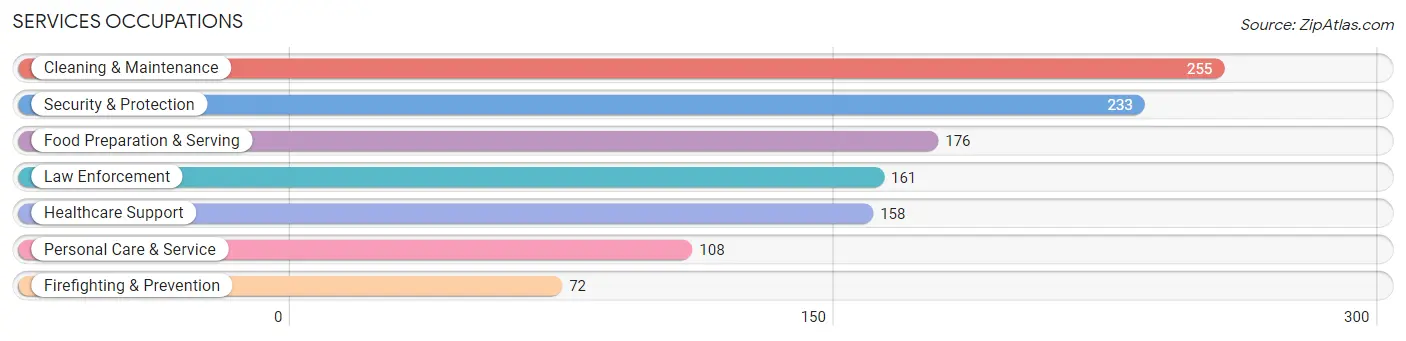
Services Occupations
The most common Services occupations in Falls County are Cleaning & Maintenance (255 | 4.1%), Security & Protection (233 | 3.7%), Food Preparation & Serving (176 | 2.8%), Law Enforcement (161 | 2.6%), and Healthcare Support (158 | 2.5%).
Services Occupations by Sex
Within the Services occupations in Falls County, the most male-oriented occupations are Firefighting & Prevention (100.0%), Security & Protection (84.1%), and Law Enforcement (77.0%), while the most female-oriented occupations are Personal Care & Service (100.0%), Food Preparation & Serving (83.0%), and Healthcare Support (82.9%).
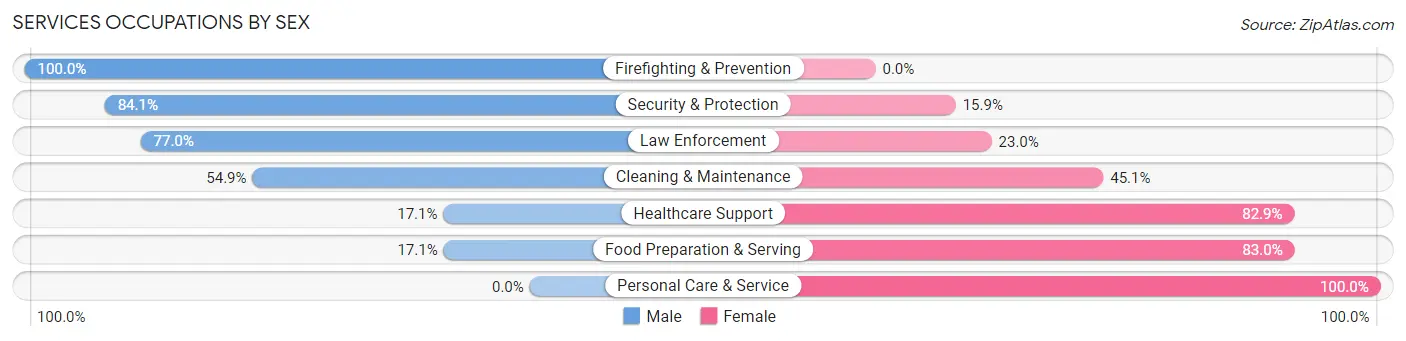
| Occupation | Male | Female |
| Healthcare Support | 27 (17.1%) | 131 (82.9%) |
| Security & Protection | 196 (84.1%) | 37 (15.9%) |
| Firefighting & Prevention | 72 (100.0%) | 0 (0.0%) |
| Law Enforcement | 124 (77.0%) | 37 (23.0%) |
| Food Preparation & Serving | 30 (17.1%) | 146 (83.0%) |
| Cleaning & Maintenance | 140 (54.9%) | 115 (45.1%) |
| Personal Care & Service | 0 (0.0%) | 108 (100.0%) |
| Total (Category) | 393 (42.3%) | 537 (57.7%) |
| Total (Overall) | 3,335 (53.4%) | 2,913 (46.6%) |
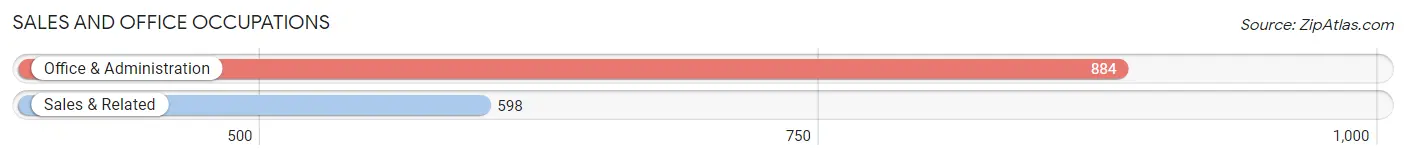
Sales and Office Occupations
The most common Sales and Office occupations in Falls County are Office & Administration (884 | 14.1%), and Sales & Related (598 | 9.6%).
Sales and Office Occupations by Sex
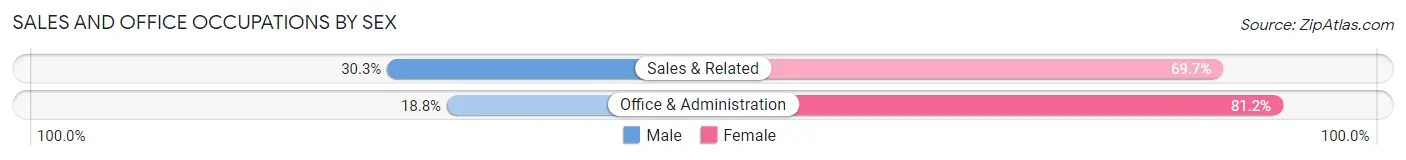
| Occupation | Male | Female |
| Sales & Related | 181 (30.3%) | 417 (69.7%) |
| Office & Administration | 166 (18.8%) | 718 (81.2%) |
| Total (Category) | 347 (23.4%) | 1,135 (76.6%) |
| Total (Overall) | 3,335 (53.4%) | 2,913 (46.6%) |
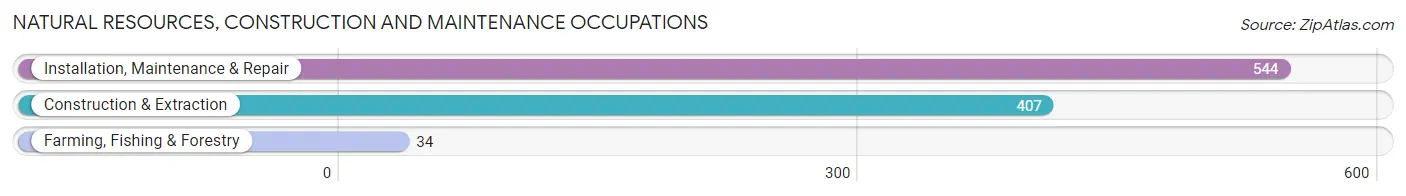
Natural Resources, Construction and Maintenance Occupations
The most common Natural Resources, Construction and Maintenance occupations in Falls County are Installation, Maintenance & Repair (544 | 8.7%), Construction & Extraction (407 | 6.5%), and Farming, Fishing & Forestry (34 | 0.5%).
Natural Resources, Construction and Maintenance Occupations by Sex
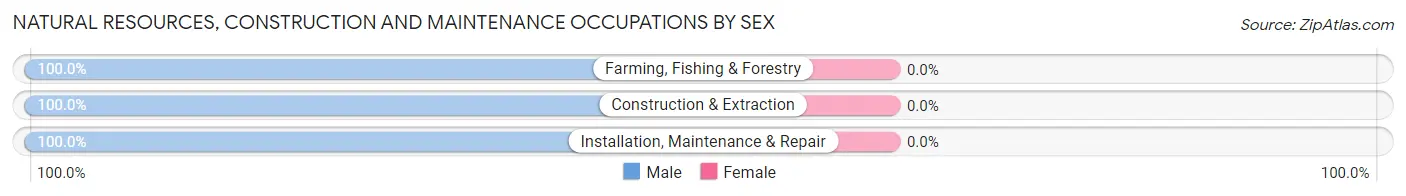
| Occupation | Male | Female |
| Farming, Fishing & Forestry | 34 (100.0%) | 0 (0.0%) |
| Construction & Extraction | 407 (100.0%) | 0 (0.0%) |
| Installation, Maintenance & Repair | 544 (100.0%) | 0 (0.0%) |
| Total (Category) | 985 (100.0%) | 0 (0.0%) |
| Total (Overall) | 3,335 (53.4%) | 2,913 (46.6%) |
Production, Transportation and Moving Occupations
The most common Production, Transportation and Moving occupations in Falls County are Production (499 | 8.0%), Transportation (328 | 5.2%), and Material Moving (279 | 4.5%).
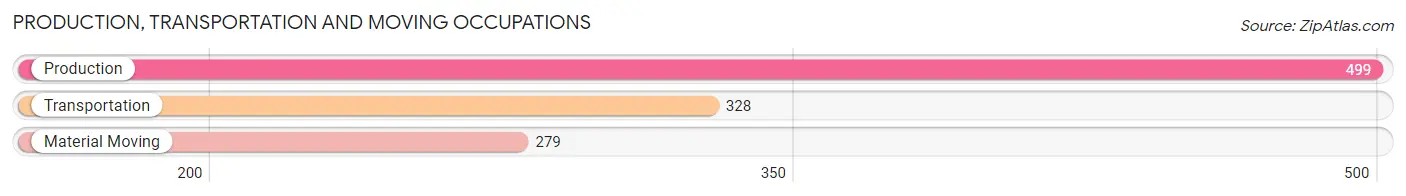
Production, Transportation and Moving Occupations by Sex
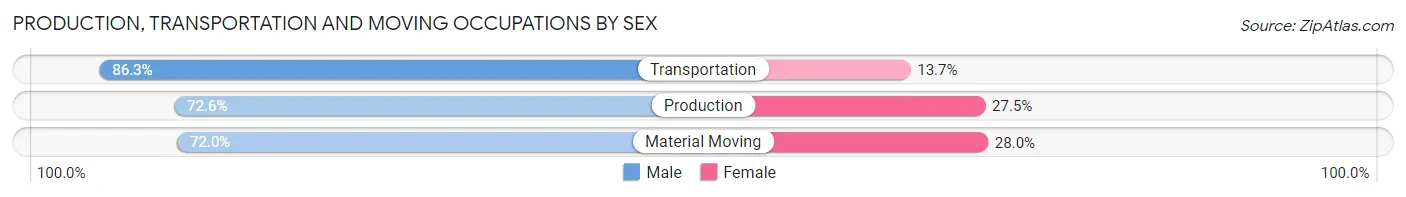
| Occupation | Male | Female |
| Production | 362 (72.6%) | 137 (27.5%) |
| Transportation | 283 (86.3%) | 45 (13.7%) |
| Material Moving | 201 (72.0%) | 78 (28.0%) |
| Total (Category) | 846 (76.5%) | 260 (23.5%) |
| Total (Overall) | 3,335 (53.4%) | 2,913 (46.6%) |
Employment Industries by Sex in Falls County
Employment Industries in Falls County
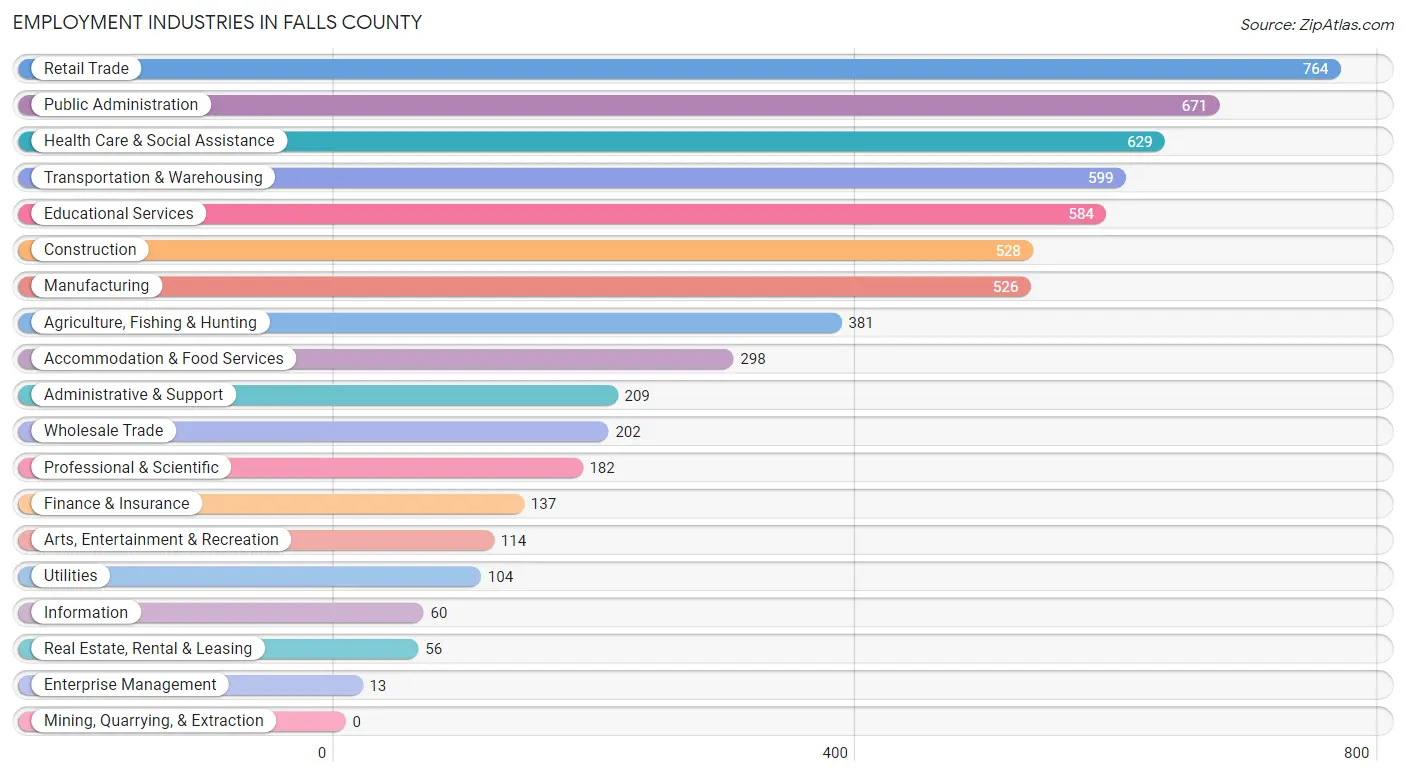
The major employment industries in Falls County include Retail Trade (764 | 12.2%), Public Administration (671 | 10.7%), Health Care & Social Assistance (629 | 10.1%), Transportation & Warehousing (599 | 9.6%), and Educational Services (584 | 9.3%).
Employment Industries by Sex in Falls County
The Falls County industries that see more men than women are Transportation & Warehousing (96.2%), Construction (94.9%), and Agriculture, Fishing & Hunting (80.6%), whereas the industries that tend to have a higher number of women are Enterprise Management (100.0%), Health Care & Social Assistance (94.9%), and Finance & Insurance (89.0%).
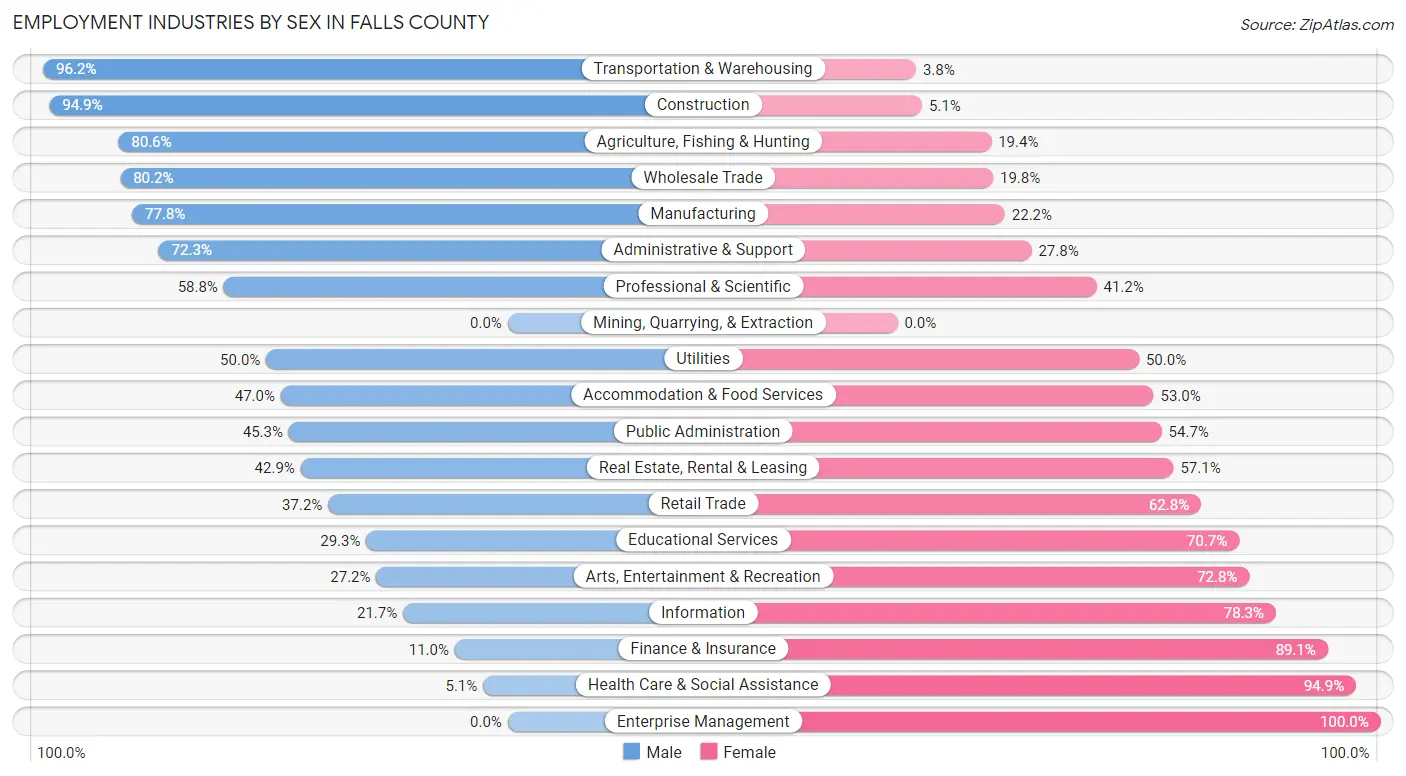
| Industry | Male | Female |
| Agriculture, Fishing & Hunting | 307 (80.6%) | 74 (19.4%) |
| Mining, Quarrying, & Extraction | 0 (0.0%) | 0 (0.0%) |
| Construction | 501 (94.9%) | 27 (5.1%) |
| Manufacturing | 409 (77.8%) | 117 (22.2%) |
| Wholesale Trade | 162 (80.2%) | 40 (19.8%) |
| Retail Trade | 284 (37.2%) | 480 (62.8%) |
| Transportation & Warehousing | 576 (96.2%) | 23 (3.8%) |
| Utilities | 52 (50.0%) | 52 (50.0%) |
| Information | 13 (21.7%) | 47 (78.3%) |
| Finance & Insurance | 15 (11.0%) | 122 (89.0%) |
| Real Estate, Rental & Leasing | 24 (42.9%) | 32 (57.1%) |
| Professional & Scientific | 107 (58.8%) | 75 (41.2%) |
| Enterprise Management | 0 (0.0%) | 13 (100.0%) |
| Administrative & Support | 151 (72.3%) | 58 (27.8%) |
| Educational Services | 171 (29.3%) | 413 (70.7%) |
| Health Care & Social Assistance | 32 (5.1%) | 597 (94.9%) |
| Arts, Entertainment & Recreation | 31 (27.2%) | 83 (72.8%) |
| Accommodation & Food Services | 140 (47.0%) | 158 (53.0%) |
| Public Administration | 304 (45.3%) | 367 (54.7%) |
| Total | 3,335 (53.4%) | 2,913 (46.6%) |
Education in Falls County
School Enrollment in Falls County
The most common levels of schooling among the 3,813 students in Falls County are high school (1,220 | 32.0%), middle school (825 | 21.6%), and elementary school (788 | 20.7%).
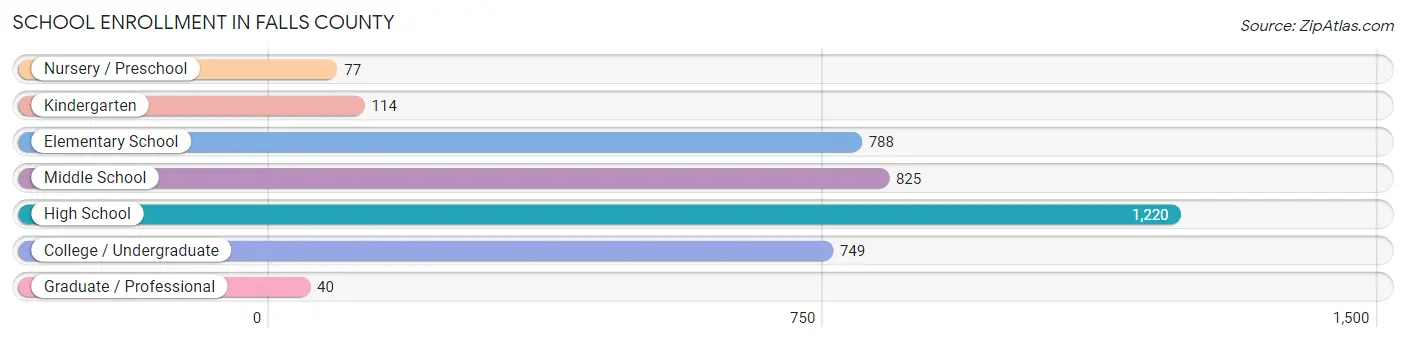
| School Level | # Students | % Students |
| Nursery / Preschool | 77 | 2.0% |
| Kindergarten | 114 | 3.0% |
| Elementary School | 788 | 20.7% |
| Middle School | 825 | 21.6% |
| High School | 1,220 | 32.0% |
| College / Undergraduate | 749 | 19.6% |
| Graduate / Professional | 40 | 1.1% |
| Total | 3,813 | 100.0% |
School Enrollment by Age by Funding Source in Falls County
Out of a total of 3,813 students who are enrolled in schools in Falls County, 404 (10.6%) attend a private institution, while the remaining 3,409 (89.4%) are enrolled in public schools. The age group of 20 to 24 year olds has the highest likelihood of being enrolled in private schools, with 55 (52.4% in the age bracket) enrolled. Conversely, the age group of 18 to 19 year olds has the lowest likelihood of being enrolled in a private school, with 629 (97.8% in the age bracket) attending a public institution.
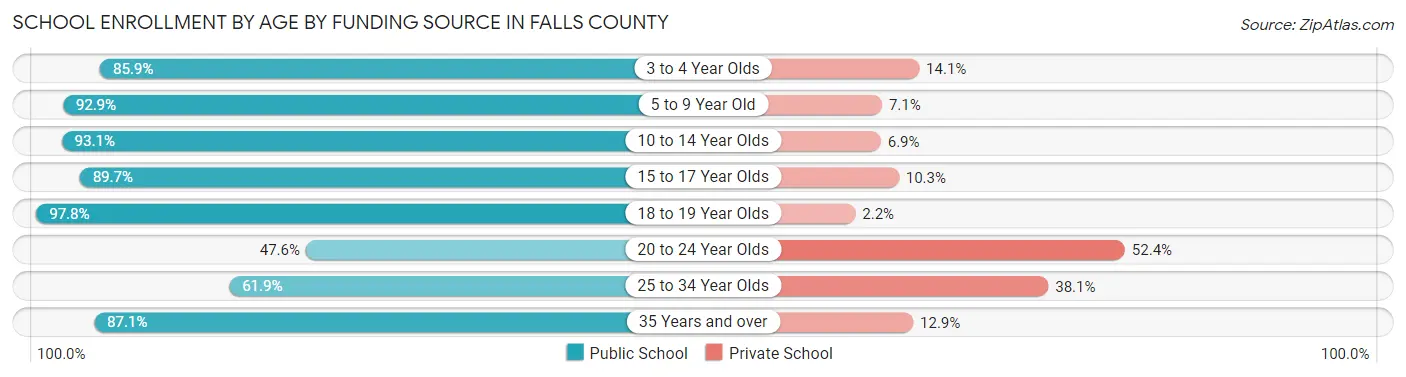
| Age Bracket | Public School | Private School |
| 3 to 4 Year Olds | 55 (85.9%) | 9 (14.1%) |
| 5 to 9 Year Old | 795 (92.9%) | 61 (7.1%) |
| 10 to 14 Year Olds | 835 (93.1%) | 62 (6.9%) |
| 15 to 17 Year Olds | 524 (89.7%) | 60 (10.3%) |
| 18 to 19 Year Olds | 629 (97.8%) | 14 (2.2%) |
| 20 to 24 Year Olds | 50 (47.6%) | 55 (52.4%) |
| 25 to 34 Year Olds | 138 (61.9%) | 85 (38.1%) |
| 35 Years and over | 384 (87.1%) | 57 (12.9%) |
| Total | 3,409 (89.4%) | 404 (10.6%) |
Educational Attainment by Field of Study in Falls County
Business (385 | 23.3%), education (271 | 16.4%), science & technology (175 | 10.6%), arts & humanities (174 | 10.5%), and liberal arts & history (160 | 9.7%) are the most common fields of study among 1,654 individuals in Falls County who have obtained a bachelor's degree or higher.
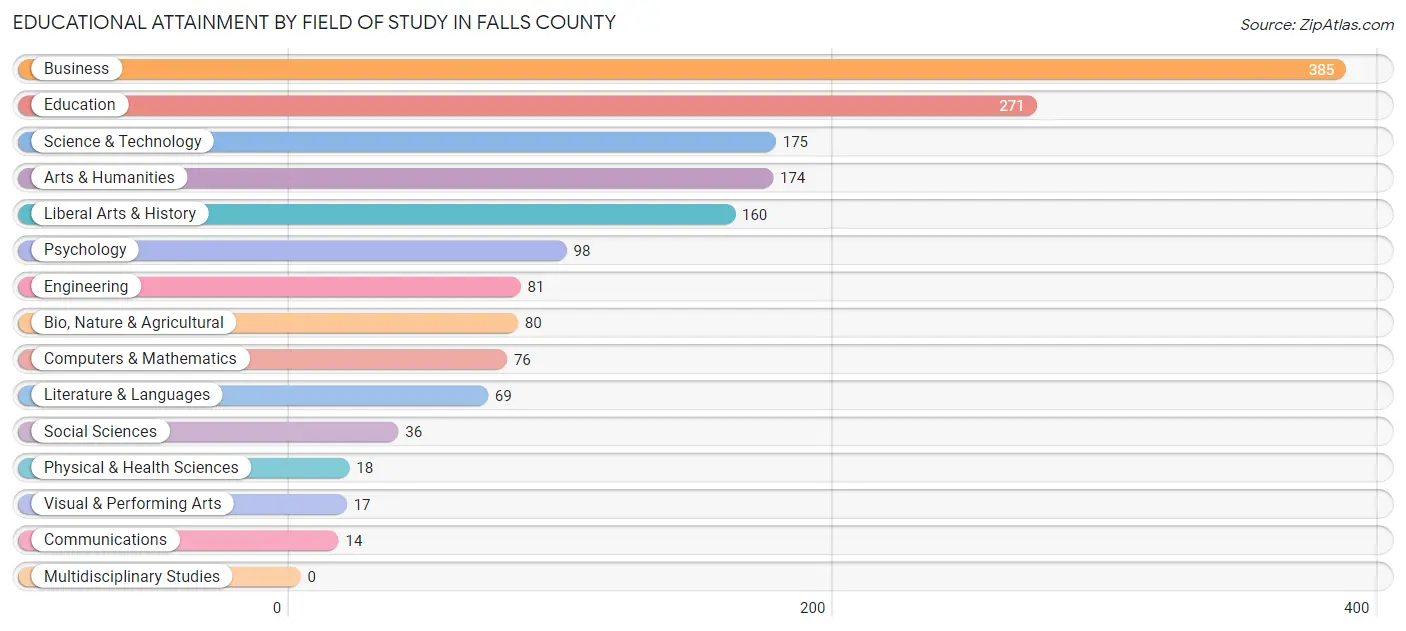
| Field of Study | # Graduates | % Graduates |
| Computers & Mathematics | 76 | 4.6% |
| Bio, Nature & Agricultural | 80 | 4.8% |
| Physical & Health Sciences | 18 | 1.1% |
| Psychology | 98 | 5.9% |
| Social Sciences | 36 | 2.2% |
| Engineering | 81 | 4.9% |
| Multidisciplinary Studies | 0 | 0.0% |
| Science & Technology | 175 | 10.6% |
| Business | 385 | 23.3% |
| Education | 271 | 16.4% |
| Literature & Languages | 69 | 4.2% |
| Liberal Arts & History | 160 | 9.7% |
| Visual & Performing Arts | 17 | 1.0% |
| Communications | 14 | 0.9% |
| Arts & Humanities | 174 | 10.5% |
| Total | 1,654 | 100.0% |
Transportation & Commute in Falls County
Vehicle Availability by Sex in Falls County
The most prevalent vehicle ownership categories in Falls County are males with 2 vehicles (897, accounting for 27.3%) and females with 2 vehicles (887, making up 30.8%).
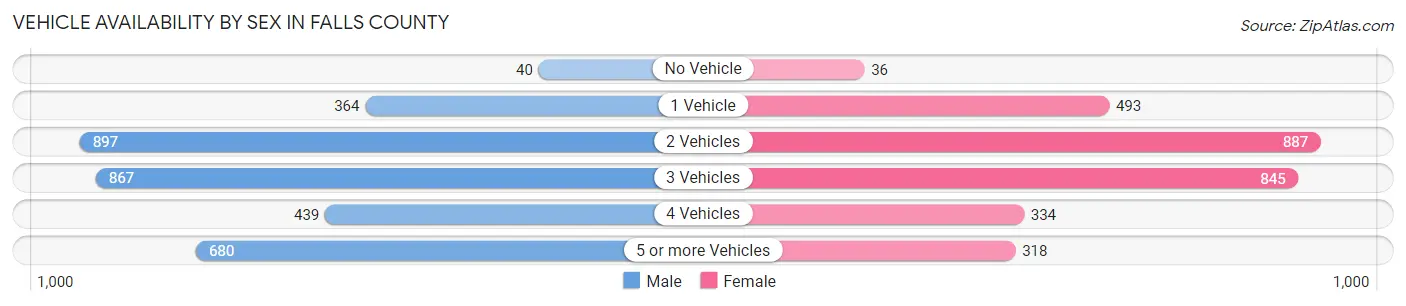
| Vehicles Available | Male | Female |
| No Vehicle | 40 (1.2%) | 36 (1.2%) |
| 1 Vehicle | 364 (11.1%) | 493 (16.9%) |
| 2 Vehicles | 897 (27.3%) | 887 (30.4%) |
| 3 Vehicles | 867 (26.4%) | 845 (29.0%) |
| 4 Vehicles | 439 (13.4%) | 334 (11.5%) |
| 5 or more Vehicles | 680 (20.7%) | 318 (10.9%) |
| Total | 3,287 (100.0%) | 2,913 (100.0%) |
Commute Time in Falls County
The most frequently occuring commute durations in Falls County are 30 to 34 minutes (1,036 commuters, 17.6%), 5 to 9 minutes (840 commuters, 14.3%), and 20 to 24 minutes (739 commuters, 12.6%).
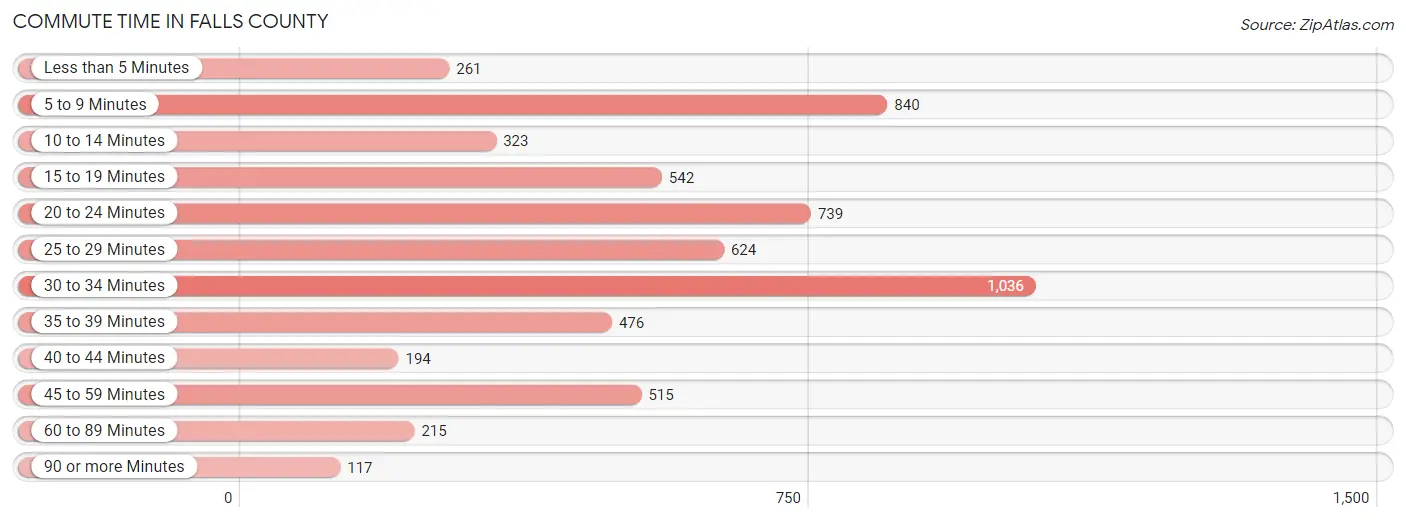
| Commute Time | # Commuters | % Commuters |
| Less than 5 Minutes | 261 | 4.4% |
| 5 to 9 Minutes | 840 | 14.3% |
| 10 to 14 Minutes | 323 | 5.5% |
| 15 to 19 Minutes | 542 | 9.2% |
| 20 to 24 Minutes | 739 | 12.6% |
| 25 to 29 Minutes | 624 | 10.6% |
| 30 to 34 Minutes | 1,036 | 17.6% |
| 35 to 39 Minutes | 476 | 8.1% |
| 40 to 44 Minutes | 194 | 3.3% |
| 45 to 59 Minutes | 515 | 8.8% |
| 60 to 89 Minutes | 215 | 3.7% |
| 90 or more Minutes | 117 | 2.0% |
Commute Time by Sex in Falls County
The most common commute times in Falls County are 5 to 9 minutes (682 commuters, 21.4%) for males and 30 to 34 minutes (561 commuters, 20.8%) for females.
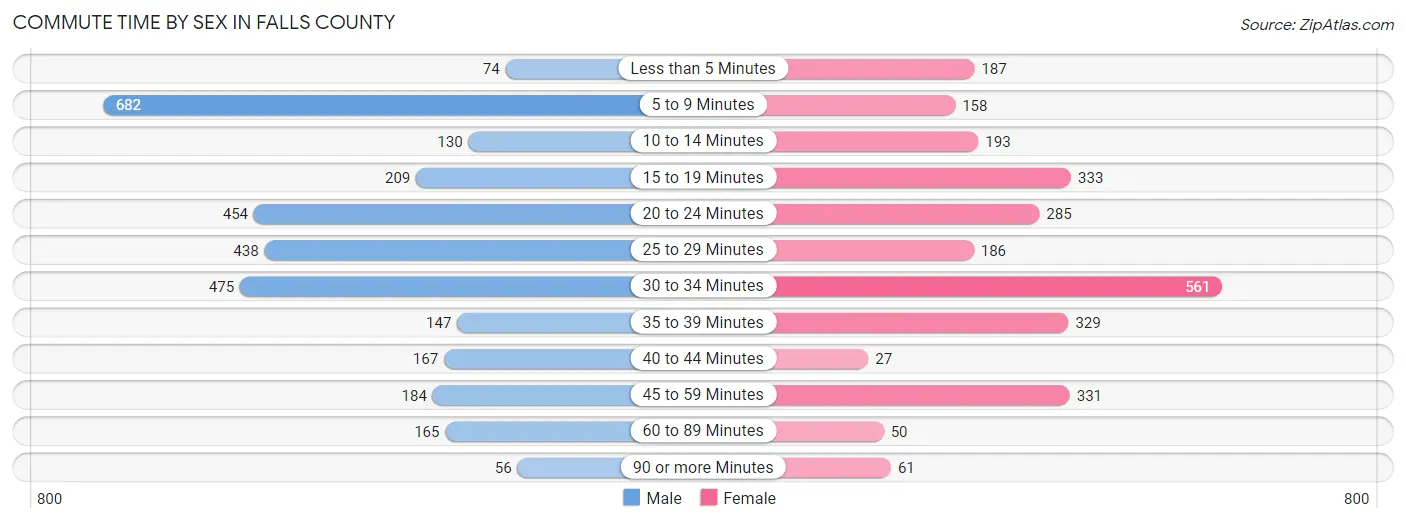
| Commute Time | Male | Female |
| Less than 5 Minutes | 74 (2.3%) | 187 (6.9%) |
| 5 to 9 Minutes | 682 (21.4%) | 158 (5.9%) |
| 10 to 14 Minutes | 130 (4.1%) | 193 (7.1%) |
| 15 to 19 Minutes | 209 (6.6%) | 333 (12.3%) |
| 20 to 24 Minutes | 454 (14.3%) | 285 (10.5%) |
| 25 to 29 Minutes | 438 (13.8%) | 186 (6.9%) |
| 30 to 34 Minutes | 475 (14.9%) | 561 (20.8%) |
| 35 to 39 Minutes | 147 (4.6%) | 329 (12.2%) |
| 40 to 44 Minutes | 167 (5.2%) | 27 (1.0%) |
| 45 to 59 Minutes | 184 (5.8%) | 331 (12.2%) |
| 60 to 89 Minutes | 165 (5.2%) | 50 (1.8%) |
| 90 or more Minutes | 56 (1.8%) | 61 (2.3%) |
Time of Departure to Work by Sex in Falls County
The most frequent times of departure to work in Falls County are 7:00 AM to 7:29 AM (826, 26.0%) for males and 7:00 AM to 7:29 AM (638, 23.6%) for females.
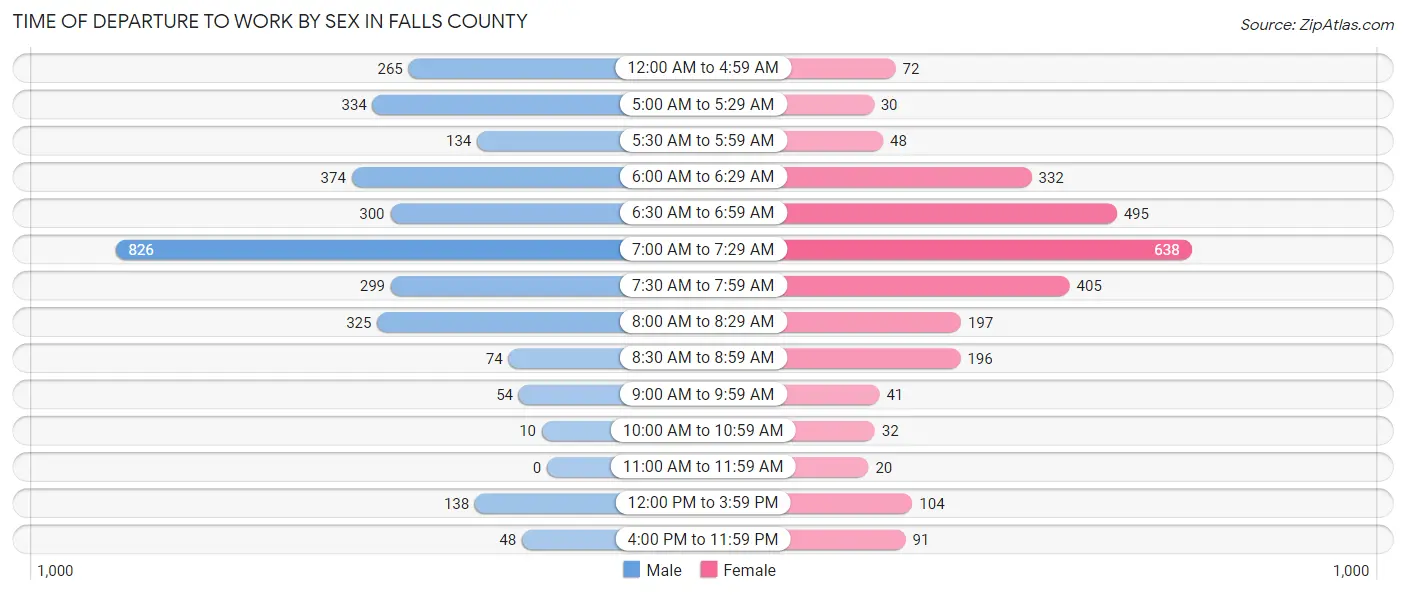
| Time of Departure | Male | Female |
| 12:00 AM to 4:59 AM | 265 (8.3%) | 72 (2.7%) |
| 5:00 AM to 5:29 AM | 334 (10.5%) | 30 (1.1%) |
| 5:30 AM to 5:59 AM | 134 (4.2%) | 48 (1.8%) |
| 6:00 AM to 6:29 AM | 374 (11.8%) | 332 (12.3%) |
| 6:30 AM to 6:59 AM | 300 (9.4%) | 495 (18.3%) |
| 7:00 AM to 7:29 AM | 826 (26.0%) | 638 (23.6%) |
| 7:30 AM to 7:59 AM | 299 (9.4%) | 405 (15.0%) |
| 8:00 AM to 8:29 AM | 325 (10.2%) | 197 (7.3%) |
| 8:30 AM to 8:59 AM | 74 (2.3%) | 196 (7.3%) |
| 9:00 AM to 9:59 AM | 54 (1.7%) | 41 (1.5%) |
| 10:00 AM to 10:59 AM | 10 (0.3%) | 32 (1.2%) |
| 11:00 AM to 11:59 AM | 0 (0.0%) | 20 (0.7%) |
| 12:00 PM to 3:59 PM | 138 (4.3%) | 104 (3.8%) |
| 4:00 PM to 11:59 PM | 48 (1.5%) | 91 (3.4%) |
| Total | 3,181 (100.0%) | 2,701 (100.0%) |
Housing Occupancy in Falls County
Occupancy by Ownership in Falls County
Of the total 5,499 dwellings in Falls County, owner-occupied units account for 4,313 (78.4%), while renter-occupied units make up 1,186 (21.6%).
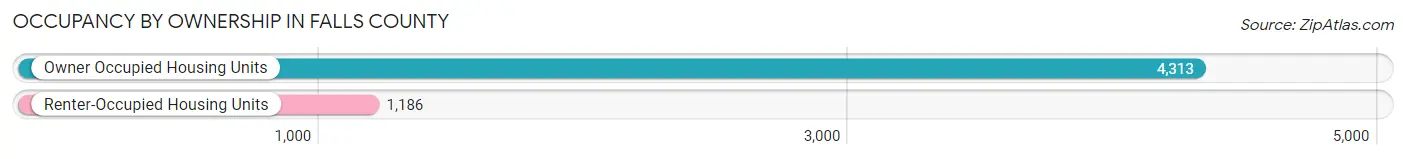
| Occupancy | # Housing Units | % Housing Units |
| Owner Occupied Housing Units | 4,313 | 78.4% |
| Renter-Occupied Housing Units | 1,186 | 21.6% |
| Total Occupied Housing Units | 5,499 | 100.0% |
Occupancy by Household Size in Falls County
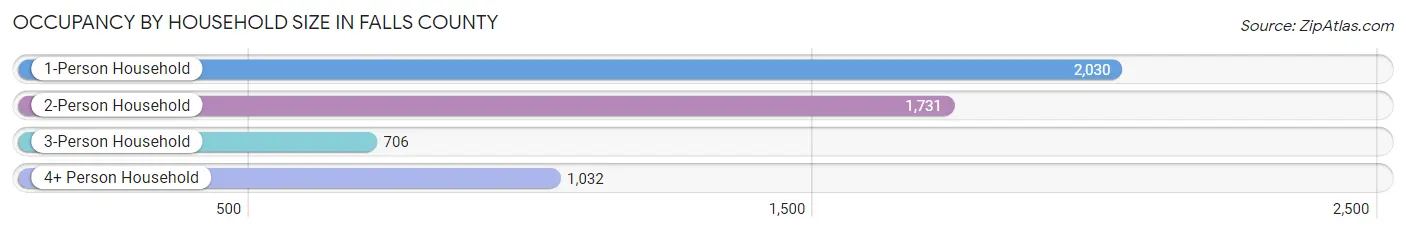
| Household Size | # Housing Units | % Housing Units |
| 1-Person Household | 2,030 | 36.9% |
| 2-Person Household | 1,731 | 31.5% |
| 3-Person Household | 706 | 12.8% |
| 4+ Person Household | 1,032 | 18.8% |
| Total Housing Units | 5,499 | 100.0% |
Occupancy by Ownership by Household Size in Falls County
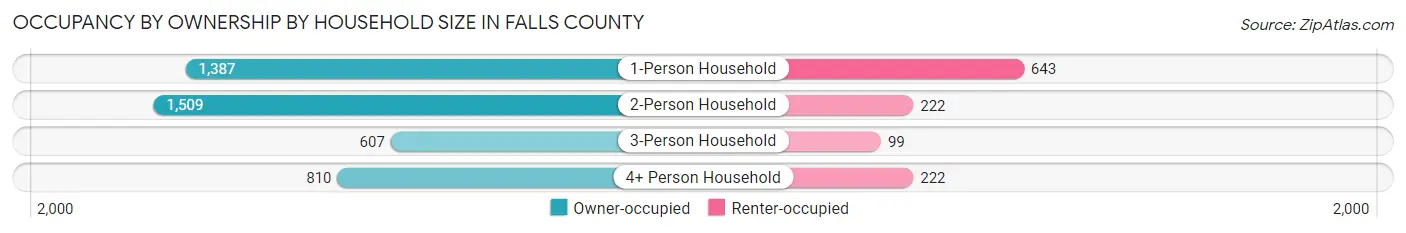
| Household Size | Owner-occupied | Renter-occupied |
| 1-Person Household | 1,387 (68.3%) | 643 (31.7%) |
| 2-Person Household | 1,509 (87.2%) | 222 (12.8%) |
| 3-Person Household | 607 (86.0%) | 99 (14.0%) |
| 4+ Person Household | 810 (78.5%) | 222 (21.5%) |
| Total Housing Units | 4,313 (78.4%) | 1,186 (21.6%) |
Occupancy by Educational Attainment in Falls County
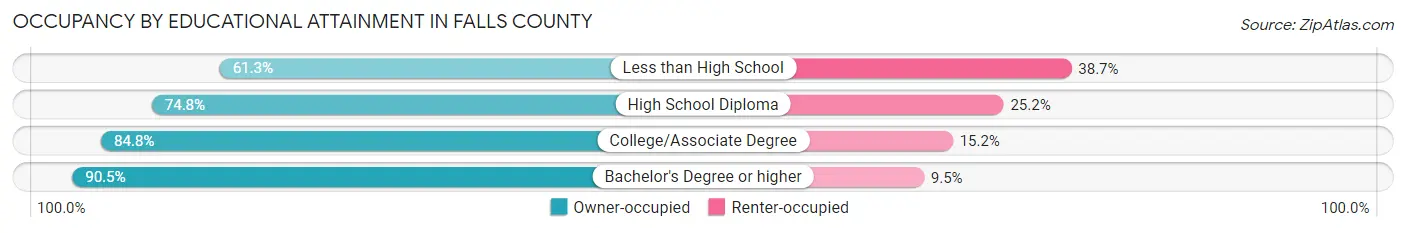
| Household Size | Owner-occupied | Renter-occupied |
| Less than High School | 583 (61.3%) | 368 (38.7%) |
| High School Diploma | 1,318 (74.8%) | 445 (25.2%) |
| College/Associate Degree | 1,627 (84.8%) | 291 (15.2%) |
| Bachelor's Degree or higher | 785 (90.5%) | 82 (9.5%) |
Occupancy by Age of Householder in Falls County
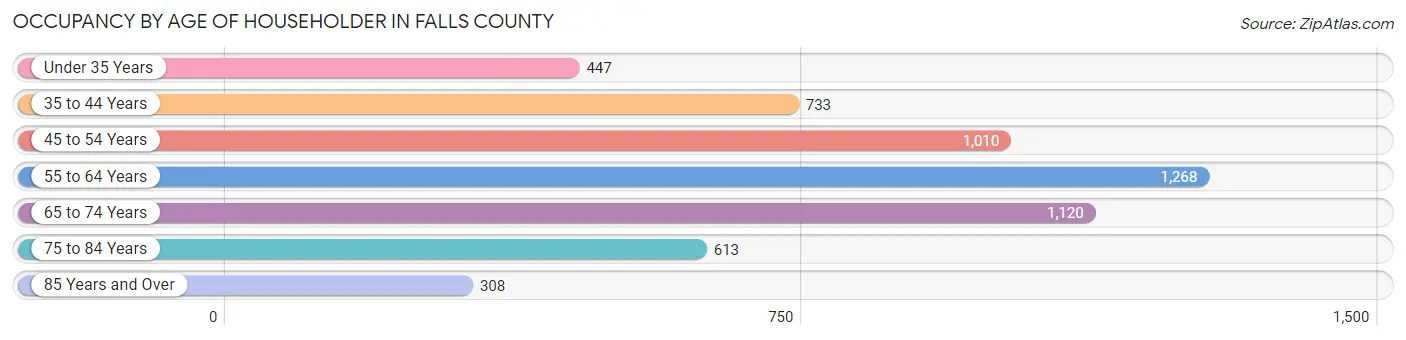
| Age Bracket | # Households | % Households |
| Under 35 Years | 447 | 8.1% |
| 35 to 44 Years | 733 | 13.3% |
| 45 to 54 Years | 1,010 | 18.4% |
| 55 to 64 Years | 1,268 | 23.1% |
| 65 to 74 Years | 1,120 | 20.4% |
| 75 to 84 Years | 613 | 11.2% |
| 85 Years and Over | 308 | 5.6% |
| Total | 5,499 | 100.0% |
Housing Finances in Falls County
Median Income by Occupancy in Falls County
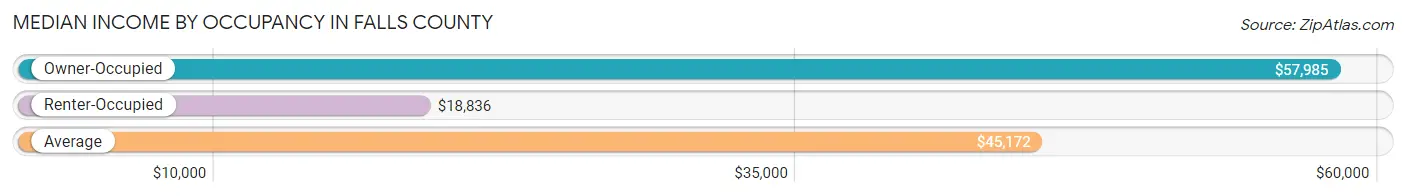
| Occupancy Type | # Households | Median Income |
| Owner-Occupied | 4,313 (78.4%) | $57,985 |
| Renter-Occupied | 1,186 (21.6%) | $18,836 |
| Average | 5,499 (100.0%) | $45,172 |
Occupancy by Householder Income Bracket in Falls County
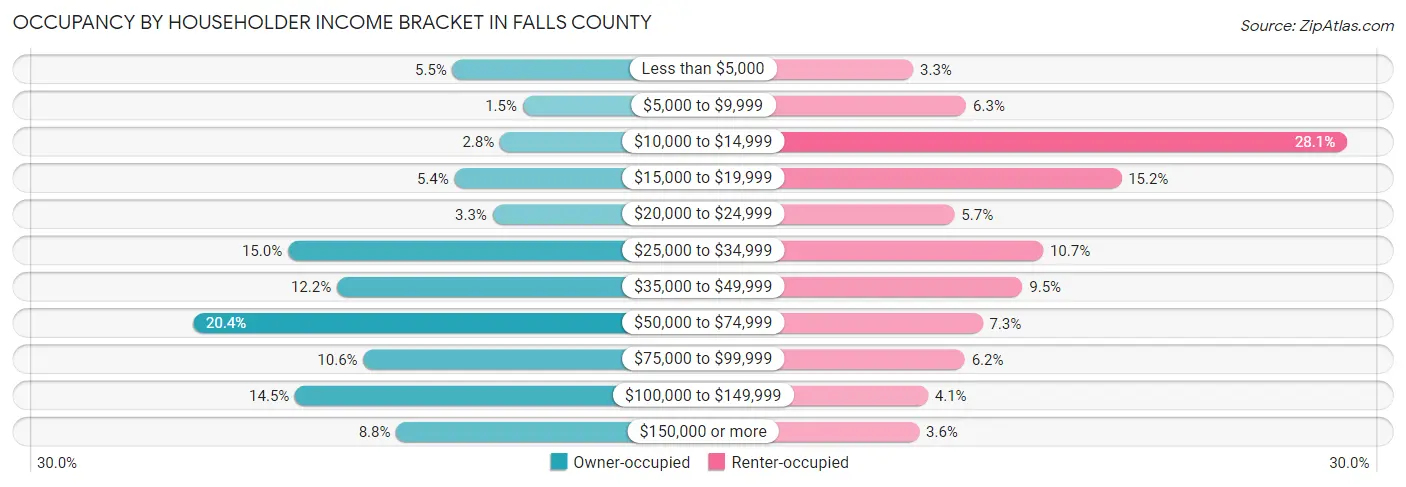
| Income Bracket | Owner-occupied | Renter-occupied |
| Less than $5,000 | 239 (5.5%) | 39 (3.3%) |
| $5,000 to $9,999 | 66 (1.5%) | 75 (6.3%) |
| $10,000 to $14,999 | 122 (2.8%) | 333 (28.1%) |
| $15,000 to $19,999 | 234 (5.4%) | 180 (15.2%) |
| $20,000 to $24,999 | 140 (3.3%) | 67 (5.7%) |
| $25,000 to $34,999 | 645 (14.9%) | 127 (10.7%) |
| $35,000 to $49,999 | 524 (12.1%) | 113 (9.5%) |
| $50,000 to $74,999 | 879 (20.4%) | 86 (7.2%) |
| $75,000 to $99,999 | 459 (10.6%) | 74 (6.2%) |
| $100,000 to $149,999 | 627 (14.5%) | 49 (4.1%) |
| $150,000 or more | 378 (8.8%) | 43 (3.6%) |
| Total | 4,313 (100.0%) | 1,186 (100.0%) |
Monthly Housing Cost Tiers in Falls County
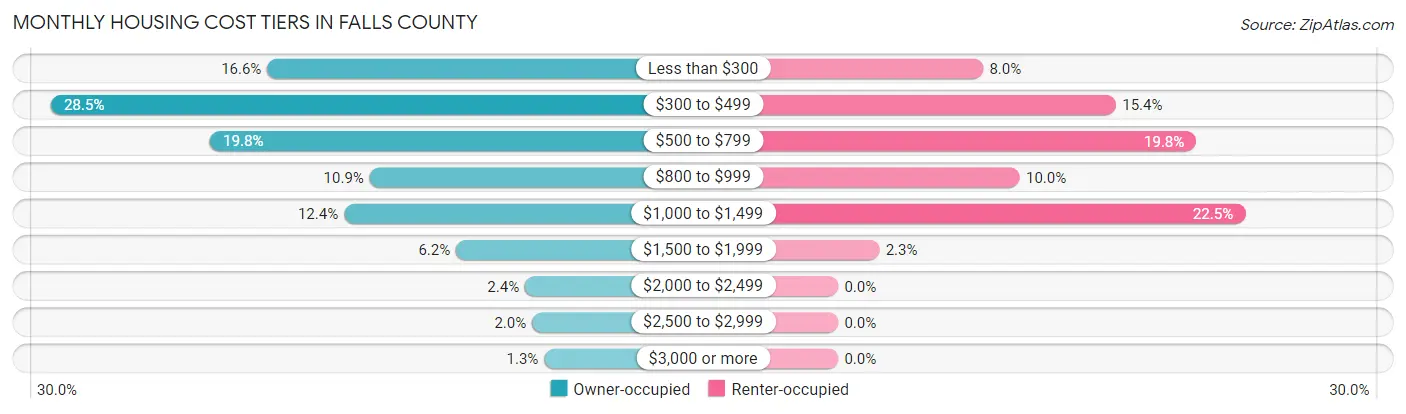
| Monthly Cost | Owner-occupied | Renter-occupied |
| Less than $300 | 716 (16.6%) | 95 (8.0%) |
| $300 to $499 | 1,231 (28.5%) | 182 (15.3%) |
| $500 to $799 | 852 (19.8%) | 235 (19.8%) |
| $800 to $999 | 472 (10.9%) | 119 (10.0%) |
| $1,000 to $1,499 | 533 (12.4%) | 267 (22.5%) |
| $1,500 to $1,999 | 266 (6.2%) | 27 (2.3%) |
| $2,000 to $2,499 | 102 (2.4%) | 0 (0.0%) |
| $2,500 to $2,999 | 85 (2.0%) | 0 (0.0%) |
| $3,000 or more | 56 (1.3%) | 0 (0.0%) |
| Total | 4,313 (100.0%) | 1,186 (100.0%) |
Physical Housing Characteristics in Falls County
Housing Structures in Falls County
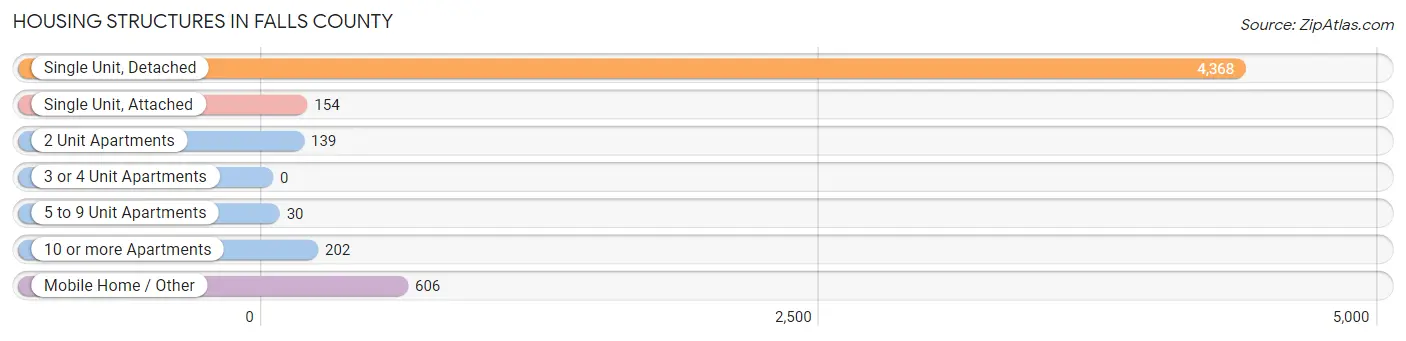
| Structure Type | # Housing Units | % Housing Units |
| Single Unit, Detached | 4,368 | 79.4% |
| Single Unit, Attached | 154 | 2.8% |
| 2 Unit Apartments | 139 | 2.5% |
| 3 or 4 Unit Apartments | 0 | 0.0% |
| 5 to 9 Unit Apartments | 30 | 0.5% |
| 10 or more Apartments | 202 | 3.7% |
| Mobile Home / Other | 606 | 11.0% |
| Total | 5,499 | 100.0% |
Housing Structures by Occupancy in Falls County
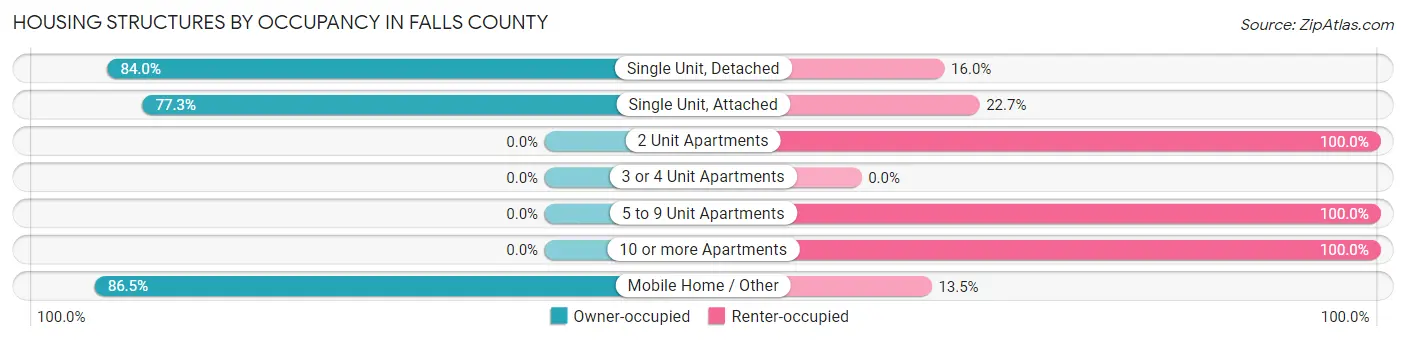
| Structure Type | Owner-occupied | Renter-occupied |
| Single Unit, Detached | 3,670 (84.0%) | 698 (16.0%) |
| Single Unit, Attached | 119 (77.3%) | 35 (22.7%) |
| 2 Unit Apartments | 0 (0.0%) | 139 (100.0%) |
| 3 or 4 Unit Apartments | 0 (0.0%) | 0 (0.0%) |
| 5 to 9 Unit Apartments | 0 (0.0%) | 30 (100.0%) |
| 10 or more Apartments | 0 (0.0%) | 202 (100.0%) |
| Mobile Home / Other | 524 (86.5%) | 82 (13.5%) |
| Total | 4,313 (78.4%) | 1,186 (21.6%) |
Housing Structures by Number of Rooms in Falls County
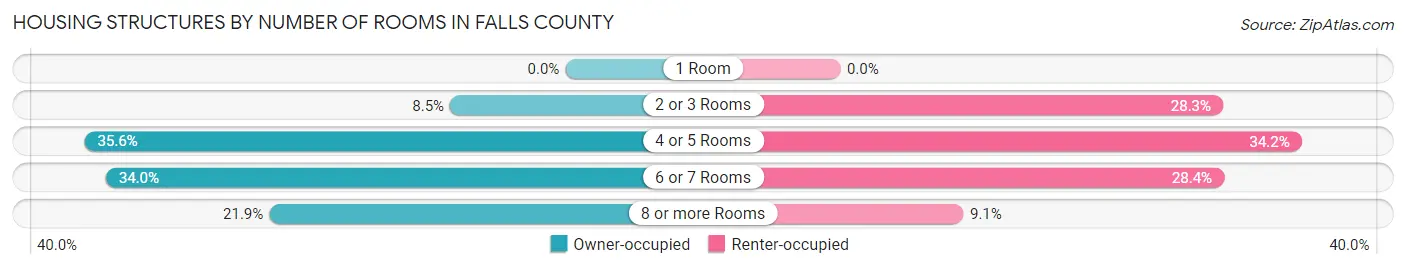
| Number of Rooms | Owner-occupied | Renter-occupied |
| 1 Room | 0 (0.0%) | 0 (0.0%) |
| 2 or 3 Rooms | 368 (8.5%) | 336 (28.3%) |
| 4 or 5 Rooms | 1,534 (35.6%) | 405 (34.2%) |
| 6 or 7 Rooms | 1,466 (34.0%) | 337 (28.4%) |
| 8 or more Rooms | 945 (21.9%) | 108 (9.1%) |
| Total | 4,313 (100.0%) | 1,186 (100.0%) |
Housing Structure by Heating Type in Falls County
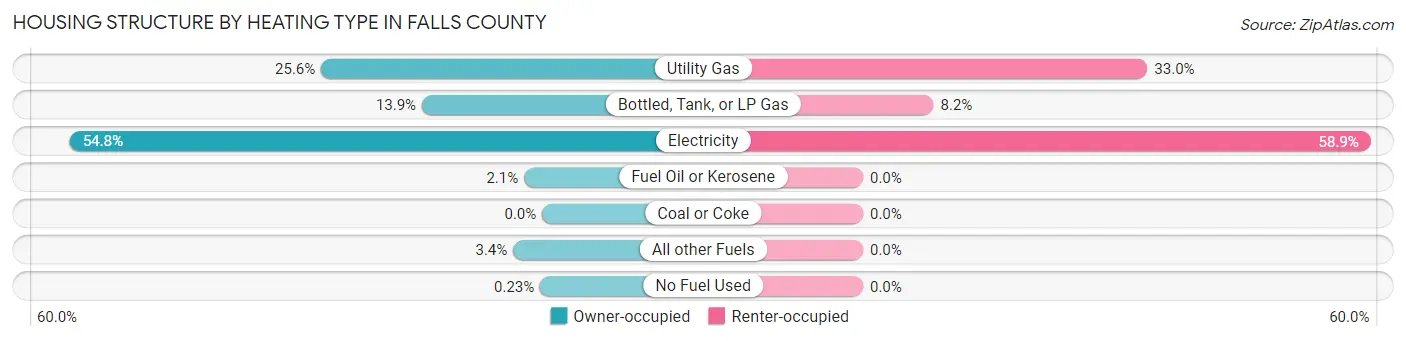
| Heating Type | Owner-occupied | Renter-occupied |
| Utility Gas | 1,105 (25.6%) | 391 (33.0%) |
| Bottled, Tank, or LP Gas | 601 (13.9%) | 97 (8.2%) |
| Electricity | 2,362 (54.8%) | 698 (58.9%) |
| Fuel Oil or Kerosene | 90 (2.1%) | 0 (0.0%) |
| Coal or Coke | 0 (0.0%) | 0 (0.0%) |
| All other Fuels | 145 (3.4%) | 0 (0.0%) |
| No Fuel Used | 10 (0.2%) | 0 (0.0%) |
| Total | 4,313 (100.0%) | 1,186 (100.0%) |
Household Vehicle Usage in Falls County
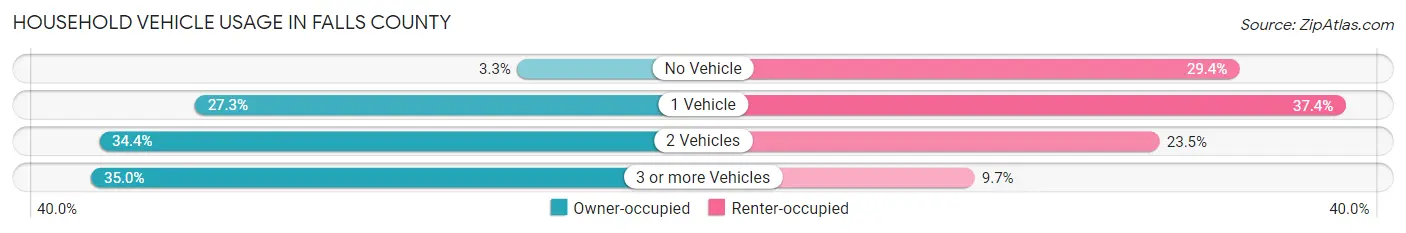
| Vehicles per Household | Owner-occupied | Renter-occupied |
| No Vehicle | 140 (3.3%) | 349 (29.4%) |
| 1 Vehicle | 1,177 (27.3%) | 443 (37.3%) |
| 2 Vehicles | 1,485 (34.4%) | 279 (23.5%) |
| 3 or more Vehicles | 1,511 (35.0%) | 115 (9.7%) |
| Total | 4,313 (100.0%) | 1,186 (100.0%) |
Real Estate & Mortgages in Falls County
Real Estate and Mortgage Overview in Falls County
| Characteristic | Without Mortgage | With Mortgage |
| Housing Units | 2,968 | 1,345 |
| Median Property Value | $98,900 | $115,400 |
| Median Household Income | $46,818 | $209 |
| Monthly Housing Costs | $432 | $54 |
| Real Estate Taxes | $1,154 | $103 |
Property Value by Mortgage Status in Falls County
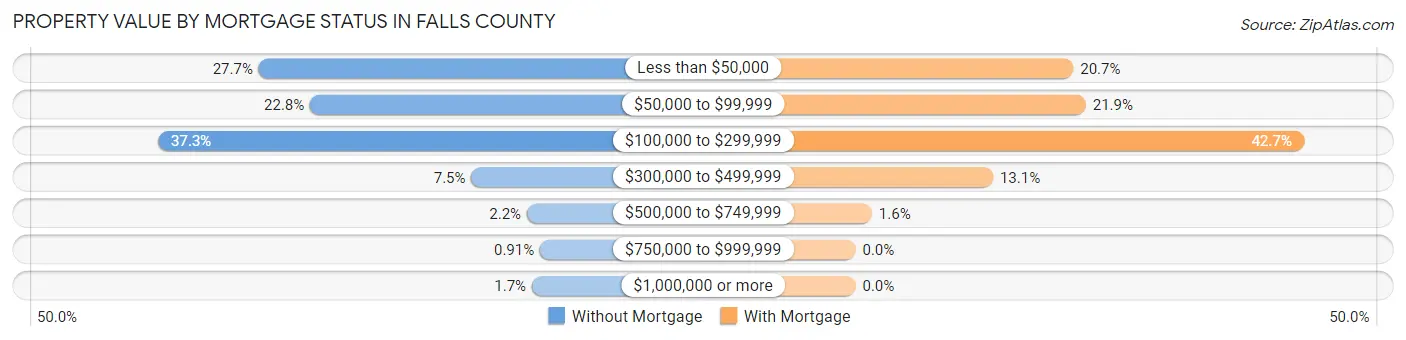
| Property Value | Without Mortgage | With Mortgage |
| Less than $50,000 | 822 (27.7%) | 279 (20.7%) |
| $50,000 to $99,999 | 677 (22.8%) | 295 (21.9%) |
| $100,000 to $299,999 | 1,107 (37.3%) | 574 (42.7%) |
| $300,000 to $499,999 | 221 (7.4%) | 176 (13.1%) |
| $500,000 to $749,999 | 64 (2.2%) | 21 (1.6%) |
| $750,000 to $999,999 | 27 (0.9%) | 0 (0.0%) |
| $1,000,000 or more | 50 (1.7%) | 0 (0.0%) |
| Total | 2,968 (100.0%) | 1,345 (100.0%) |
Household Income by Mortgage Status in Falls County
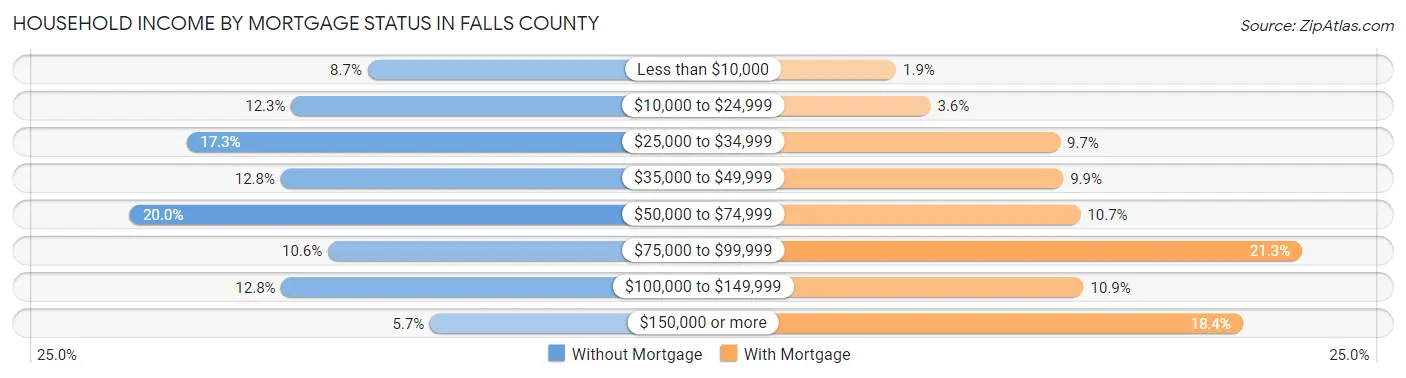
| Household Income | Without Mortgage | With Mortgage |
| Less than $10,000 | 257 (8.7%) | 26 (1.9%) |
| $10,000 to $24,999 | 365 (12.3%) | 48 (3.6%) |
| $25,000 to $34,999 | 512 (17.2%) | 131 (9.7%) |
| $35,000 to $49,999 | 380 (12.8%) | 133 (9.9%) |
| $50,000 to $74,999 | 593 (20.0%) | 144 (10.7%) |
| $75,000 to $99,999 | 313 (10.5%) | 286 (21.3%) |
| $100,000 to $149,999 | 379 (12.8%) | 146 (10.9%) |
| $150,000 or more | 169 (5.7%) | 248 (18.4%) |
| Total | 2,968 (100.0%) | 1,345 (100.0%) |
Property Value to Household Income Ratio in Falls County
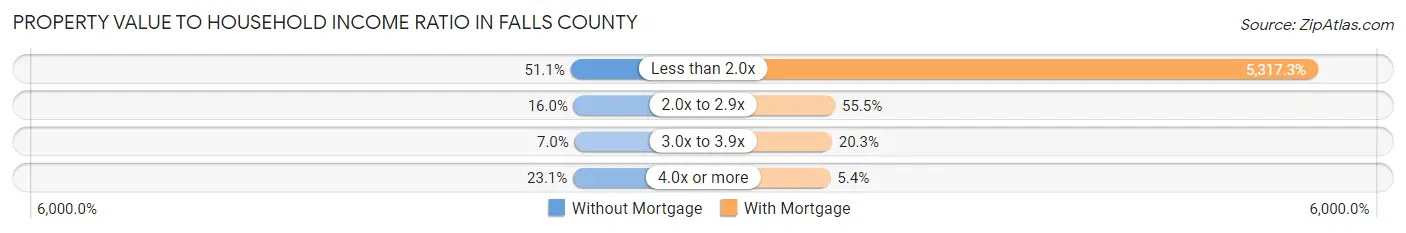
| Value-to-Income Ratio | Without Mortgage | With Mortgage |
| Less than 2.0x | 1,516 (51.1%) | 71,517 (5,317.2%) |
| 2.0x to 2.9x | 476 (16.0%) | 746 (55.5%) |
| 3.0x to 3.9x | 208 (7.0%) | 273 (20.3%) |
| 4.0x or more | 685 (23.1%) | 72 (5.3%) |
| Total | 2,968 (100.0%) | 1,345 (100.0%) |
Real Estate Taxes by Mortgage Status in Falls County
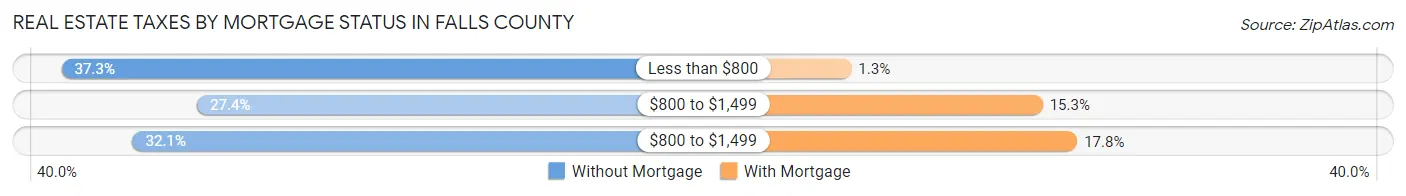
| Property Taxes | Without Mortgage | With Mortgage |
| Less than $800 | 1,107 (37.3%) | 18 (1.3%) |
| $800 to $1,499 | 813 (27.4%) | 206 (15.3%) |
| $800 to $1,499 | 953 (32.1%) | 240 (17.8%) |
| Total | 2,968 (100.0%) | 1,345 (100.0%) |
Health & Disability in Falls County
Health Insurance Coverage by Age in Falls County
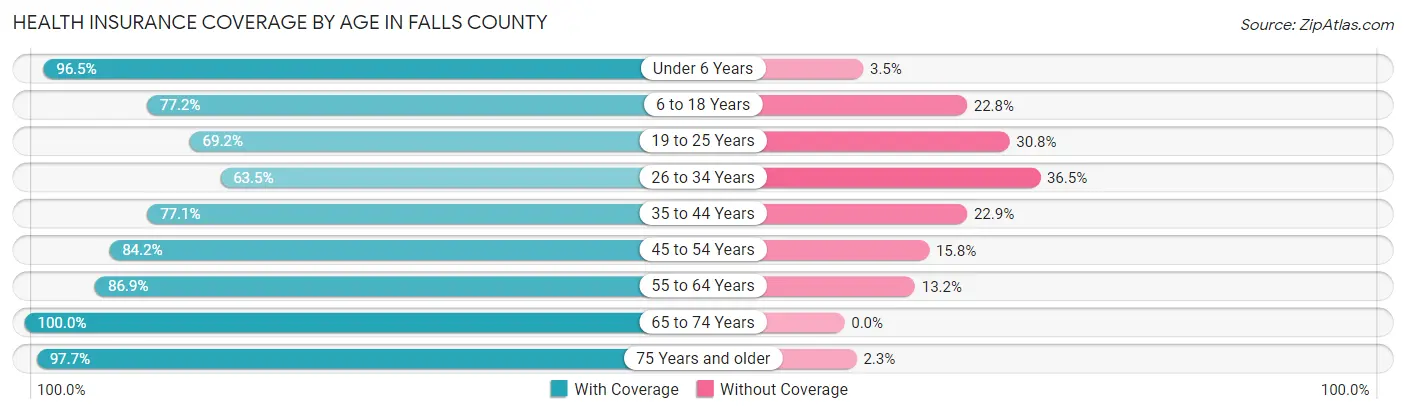
| Age Bracket | With Coverage | Without Coverage |
| Under 6 Years | 881 (96.5%) | 32 (3.5%) |
| 6 to 18 Years | 2,504 (77.2%) | 741 (22.8%) |
| 19 to 25 Years | 884 (69.2%) | 393 (30.8%) |
| 26 to 34 Years | 724 (63.5%) | 416 (36.5%) |
| 35 to 44 Years | 1,318 (77.1%) | 391 (22.9%) |
| 45 to 54 Years | 1,467 (84.2%) | 275 (15.8%) |
| 55 to 64 Years | 1,829 (86.9%) | 277 (13.2%) |
| 65 to 74 Years | 1,775 (100.0%) | 0 (0.0%) |
| 75 Years and older | 1,207 (97.7%) | 28 (2.3%) |
| Total | 12,589 (83.1%) | 2,553 (16.9%) |
Health Insurance Coverage by Citizenship Status in Falls County
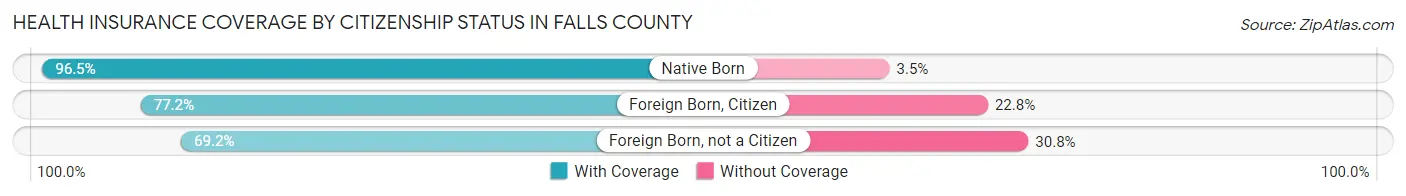
| Citizenship Status | With Coverage | Without Coverage |
| Native Born | 881 (96.5%) | 32 (3.5%) |
| Foreign Born, Citizen | 2,504 (77.2%) | 741 (22.8%) |
| Foreign Born, not a Citizen | 884 (69.2%) | 393 (30.8%) |
Health Insurance Coverage by Household Income in Falls County
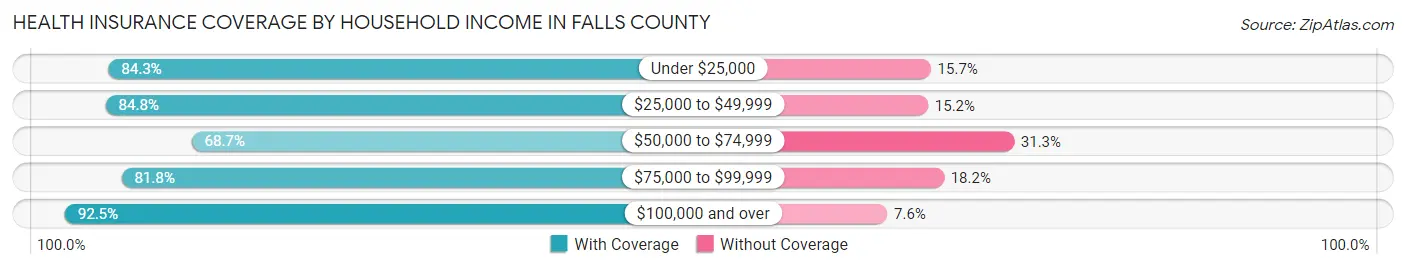
| Household Income | With Coverage | Without Coverage |
| Under $25,000 | 2,238 (84.3%) | 417 (15.7%) |
| $25,000 to $49,999 | 2,534 (84.8%) | 454 (15.2%) |
| $50,000 to $74,999 | 2,248 (68.7%) | 1,024 (31.3%) |
| $75,000 to $99,999 | 1,451 (81.8%) | 322 (18.2%) |
| $100,000 and over | 4,104 (92.4%) | 335 (7.5%) |
Public vs Private Health Insurance Coverage by Age in Falls County
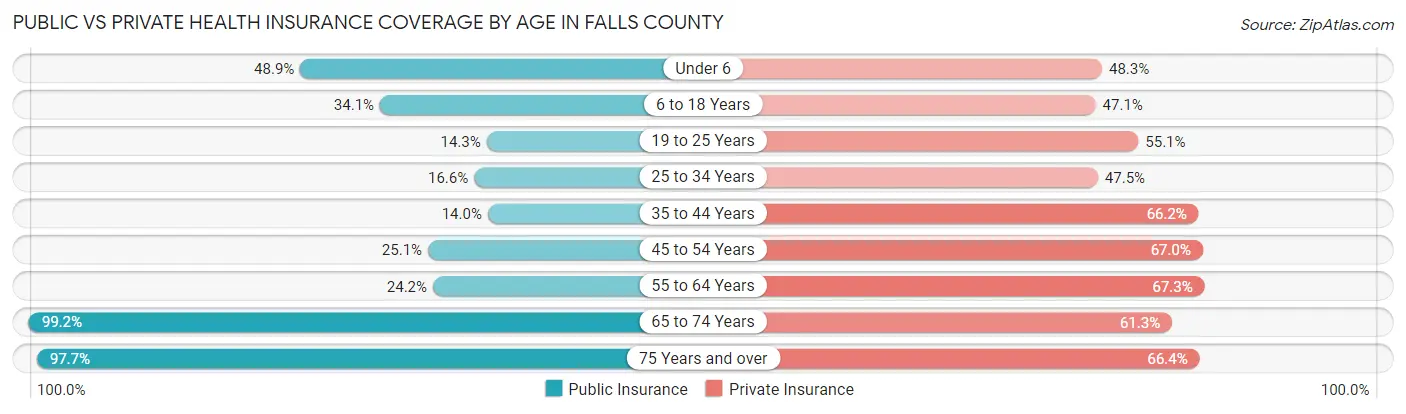
| Age Bracket | Public Insurance | Private Insurance |
| Under 6 | 446 (48.8%) | 441 (48.3%) |
| 6 to 18 Years | 1,105 (34.1%) | 1,529 (47.1%) |
| 19 to 25 Years | 182 (14.2%) | 703 (55.0%) |
| 25 to 34 Years | 189 (16.6%) | 542 (47.5%) |
| 35 to 44 Years | 240 (14.0%) | 1,132 (66.2%) |
| 45 to 54 Years | 438 (25.1%) | 1,167 (67.0%) |
| 55 to 64 Years | 510 (24.2%) | 1,418 (67.3%) |
| 65 to 74 Years | 1,761 (99.2%) | 1,088 (61.3%) |
| 75 Years and over | 1,207 (97.7%) | 820 (66.4%) |
| Total | 6,078 (40.1%) | 8,840 (58.4%) |
Disability Status by Sex by Age in Falls County
| Age Bracket | Male | Female |
| Under 5 Years | 0 (0.0%) | 59 (10.2%) |
| 5 to 17 Years | 169 (11.2%) | 131 (10.9%) |
| 18 to 34 Years | 150 (7.7%) | 88 (8.3%) |
| 35 to 64 Years | 580 (23.0%) | 442 (14.6%) |
| 65 to 74 Years | 342 (42.6%) | 262 (26.9%) |
| 75 Years and over | 310 (46.1%) | 297 (52.7%) |
Disability Class by Sex by Age in Falls County
Disability Class: Hearing Difficulty
| Age Bracket | Male | Female |
| Under 5 Years | 0 (0.0%) | 0 (0.0%) |
| 5 to 17 Years | 0 (0.0%) | 84 (7.0%) |
| 18 to 34 Years | 138 (7.1%) | 7 (0.7%) |
| 35 to 64 Years | 256 (10.1%) | 71 (2.3%) |
| 65 to 74 Years | 145 (18.1%) | 53 (5.4%) |
| 75 Years and over | 157 (23.4%) | 136 (24.2%) |
Disability Class: Vision Difficulty
| Age Bracket | Male | Female |
| Under 5 Years | 0 (0.0%) | 59 (10.2%) |
| 5 to 17 Years | 0 (0.0%) | 0 (0.0%) |
| 18 to 34 Years | 123 (6.3%) | 45 (4.3%) |
| 35 to 64 Years | 123 (4.9%) | 217 (7.1%) |
| 65 to 74 Years | 116 (14.5%) | 43 (4.4%) |
| 75 Years and over | 23 (3.4%) | 68 (12.1%) |
Disability Class: Cognitive Difficulty
| Age Bracket | Male | Female |
| 5 to 17 Years | 147 (9.7%) | 47 (3.9%) |
| 18 to 34 Years | 135 (7.0%) | 33 (3.1%) |
| 35 to 64 Years | 93 (3.7%) | 85 (2.8%) |
| 65 to 74 Years | 72 (9.0%) | 33 (3.4%) |
| 75 Years and over | 37 (5.5%) | 96 (17.1%) |
Disability Class: Ambulatory Difficulty
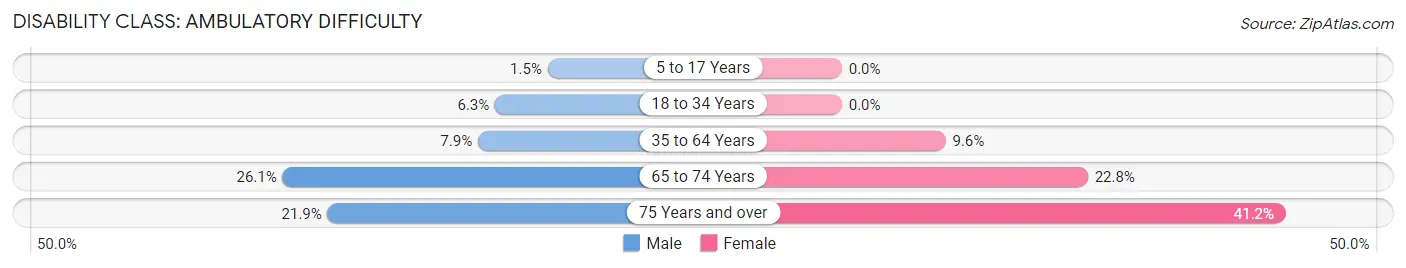
| Age Bracket | Male | Female |
| 5 to 17 Years | 22 (1.5%) | 0 (0.0%) |
| 18 to 34 Years | 123 (6.3%) | 0 (0.0%) |
| 35 to 64 Years | 200 (7.9%) | 292 (9.6%) |
| 65 to 74 Years | 209 (26.1%) | 222 (22.8%) |
| 75 Years and over | 147 (21.9%) | 232 (41.2%) |
Disability Class: Self-Care Difficulty
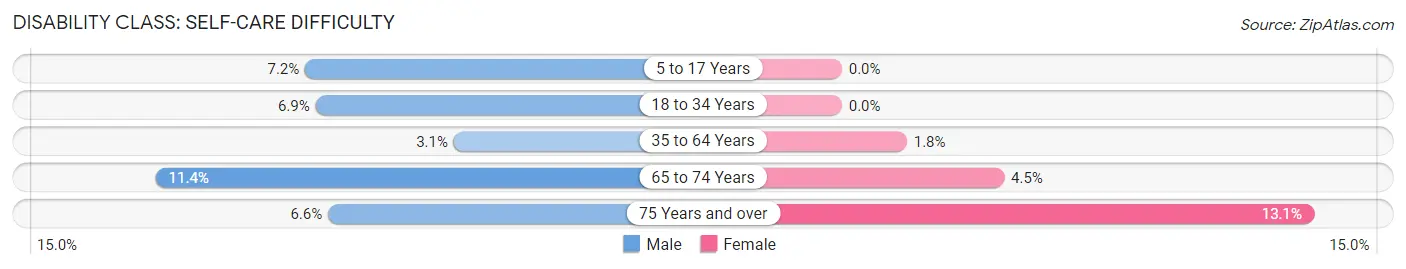
| Age Bracket | Male | Female |
| 5 to 17 Years | 109 (7.2%) | 0 (0.0%) |
| 18 to 34 Years | 134 (6.9%) | 0 (0.0%) |
| 35 to 64 Years | 77 (3.0%) | 55 (1.8%) |
| 65 to 74 Years | 91 (11.4%) | 44 (4.5%) |
| 75 Years and over | 44 (6.6%) | 74 (13.1%) |
Technology Access in Falls County
Computing Device Access in Falls County
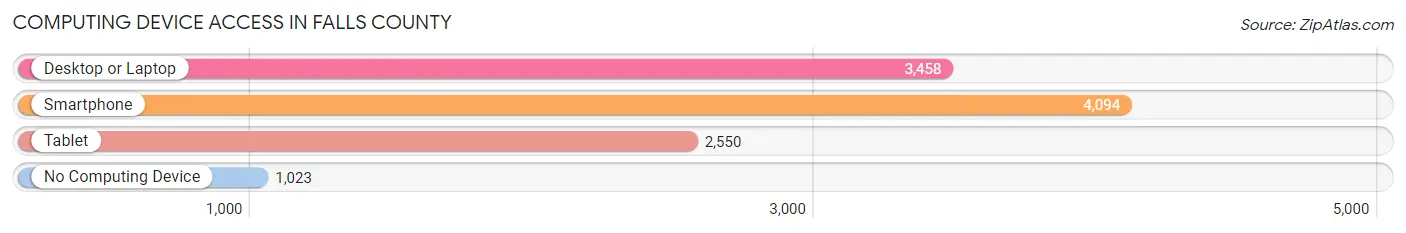
| Device Type | # Households | % Households |
| Desktop or Laptop | 3,458 | 62.9% |
| Smartphone | 4,094 | 74.5% |
| Tablet | 2,550 | 46.4% |
| No Computing Device | 1,023 | 18.6% |
| Total | 5,499 | 100.0% |
Internet Access in Falls County
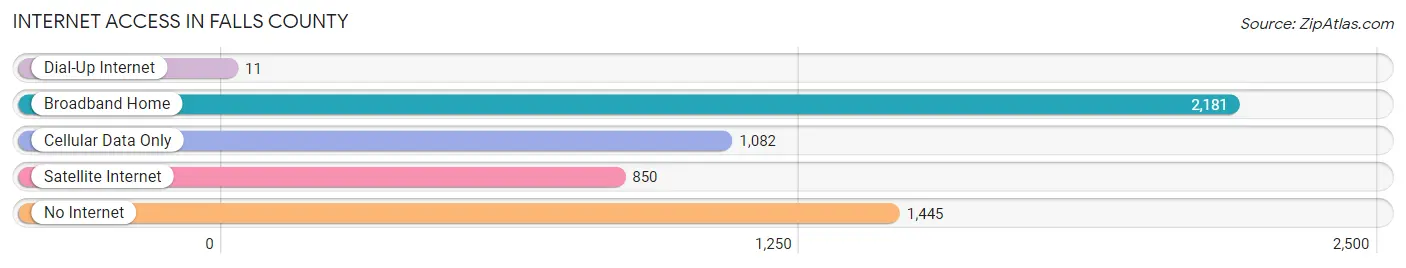
| Internet Type | # Households | % Households |
| Dial-Up Internet | 11 | 0.2% |
| Broadband Home | 2,181 | 39.7% |
| Cellular Data Only | 1,082 | 19.7% |
| Satellite Internet | 850 | 15.5% |
| No Internet | 1,445 | 26.3% |
| Total | 5,499 | 100.0% |
Falls County Summary
Falls County is located in Central Texas, in the Brazos River Valley. It is bordered by McLennan County to the north, Robertson County to the east, Milam County to the south, and Bell County to the west. The county seat is Marlin, and the largest city is Marlin. The county was named for the falls of the Brazos River, which is located in the county.
History
Falls County was established in 1850 from Limestone and Milam counties. The county was named for the falls of the Brazos River, which is located in the county. The first settlers in the area were Native Americans, who were later joined by European settlers in the early 19th century. The first county seat was established in 1851 in the town of Springfield. In 1853, the county seat was moved to Marlin, which is still the county seat today.
During the Civil War, Falls County was a Confederate stronghold. The county was home to several Confederate military units, including the Falls Rifles, the Falls Cavalry, and the Falls Artillery. After the war, the county experienced a period of economic growth, as the railroad was built through the county in 1881. This allowed for the development of the cotton industry, which was the main source of income for the county for many years.
Geography
Falls County is located in Central Texas, in the Brazos River Valley. It is bordered by McLennan County to the north, Robertson County to the east, Milam County to the south, and Bell County to the west. The county has a total area of 590 square miles, of which 588 square miles is land and 2 square miles is water. The terrain of the county is mostly flat, with some rolling hills in the western part of the county. The county is drained by the Brazos River, which flows through the county from north to south.
Economy
The economy of Falls County is largely based on agriculture. The main crops grown in the county are cotton, corn, wheat, and hay. Livestock production is also important to the county’s economy, with cattle, hogs, and poultry being the main livestock products. Manufacturing is also an important part of the county’s economy, with the main industries being food processing, metal fabrication, and wood products.
Demographics
As of the 2010 census, the population of Falls County was 17,866. The racial makeup of the county was 73.3% White, 17.2% Hispanic or Latino, 11.2% African American, 0.7% Native American, 0.3% Asian, and 0.2% Pacific Islander. The median household income was $37,945, and the median family income was $45,945. The per capita income was $17,945. The unemployment rate was 6.2%.
Falls County is a rural county with a small population. The county is home to several small towns, including Marlin, the county seat, and Rosebud, the largest town in the county. The county is served by the Marlin Independent School District, which serves the students of the county. The county is also home to several churches, including the First Baptist Church of Marlin, the First United Methodist Church of Marlin, and the Rosebud Baptist Church.
Common Questions
What is Per Capita Income in Falls County?
Per Capita income in Falls County is $29,183.
What is the Median Family Income in Falls County?
Median Family Income in Falls County is $64,278.
What is the Median Household income in Falls County?
Median Household Income in Falls County is $45,172.
What is Income or Wage Gap in Falls County?
Income or Wage Gap in Falls County is 8.0%.
Women in Falls County earn 92.0 cents for every dollar earned by a man.
What is Family Income Deficit in Falls County?
Family Income Deficit in Falls County is $10,856.
Families that are below poverty line in Falls County earn $10,856 less on average than the poverty threshold level.
What is Inequality or Gini Index in Falls County?
Inequality or Gini Index in Falls County is 0.50.
What is the Total Population of Falls County?
Total Population of Falls County is 17,013.
What is the Total Male Population of Falls County?
Total Male Population of Falls County is 8,065.
What is the Total Female Population of Falls County?
Total Female Population of Falls County is 8,948.
What is the Ratio of Males per 100 Females in Falls County?
There are 90.13 Males per 100 Females in Falls County.
What is the Ratio of Females per 100 Males in Falls County?
There are 110.95 Females per 100 Males in Falls County.
What is the Median Population Age in Falls County?
Median Population Age in Falls County is 40.0 Years.
What is the Average Family Size in Falls County
Average Family Size in Falls County is 3.7 People.
What is the Average Household Size in Falls County
Average Household Size in Falls County is 2.8 People.
How Large is the Labor Force in Falls County?
There are 6,753 People in the Labor Forcein in Falls County.
What is the Percentage of People in the Labor Force in Falls County?
48.9% of People are in the Labor Force in Falls County.
What is the Unemployment Rate in Falls County?
Unemployment Rate in Falls County is 7.4%.