Erath County, TX Map & Demographics
Erath County Map
Erath County Overview
$32,181
PER CAPITA INCOME
$82,379
AVG FAMILY INCOME
$59,654
AVG HOUSEHOLD INCOME
34.9%
WAGE / INCOME GAP [ % ]
65.1¢/ $1
WAGE / INCOME GAP [ $ ]
$11,076
FAMILY INCOME DEFICIT
0.49
INEQUALITY / GINI INDEX
42,788
TOTAL POPULATION
21,007
MALE POPULATION
21,781
FEMALE POPULATION
96.45
MALES / 100 FEMALES
103.68
FEMALES / 100 MALES
31.6
MEDIAN AGE
3.1
AVG FAMILY SIZE
2.5
AVG HOUSEHOLD SIZE
22,091
LABOR FORCE [ PEOPLE ]
63.2%
PERCENT IN LABOR FORCE
5.6%
UNEMPLOYMENT RATE
Erath County Area Codes
Income in Erath County
Income Overview in Erath County
Per Capita Income in Erath County is $32,181, while median incomes of families and households are $82,379 and $59,654 respectively.
| Characteristic | Number | Measure |
| Per Capita Income | 42,788 | $32,181 |
| Median Family Income | 10,018 | $82,379 |
| Mean Family Income | 10,018 | $103,323 |
| Median Household Income | 16,007 | $59,654 |
| Mean Household Income | 16,007 | $83,514 |
| Income Deficit | 10,018 | $11,076 |
| Wage / Income Gap (%) | 42,788 | 34.87% |
| Wage / Income Gap ($) | 42,788 | 65.13¢ per $1 |
| Gini / Inequality Index | 42,788 | 0.49 |
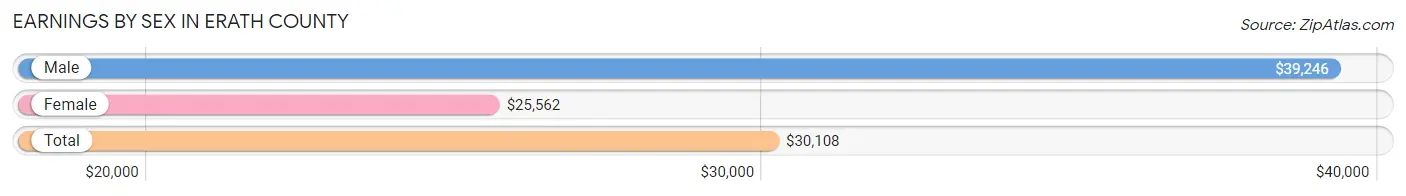
Earnings by Sex in Erath County
Average Earnings in Erath County are $30,108, $39,246 for men and $25,562 for women, a difference of 34.9%.
| Sex | Number | Average Earnings |
| Male | 12,796 (53.3%) | $39,246 |
| Female | 11,222 (46.7%) | $25,562 |
| Total | 24,018 (100.0%) | $30,108 |
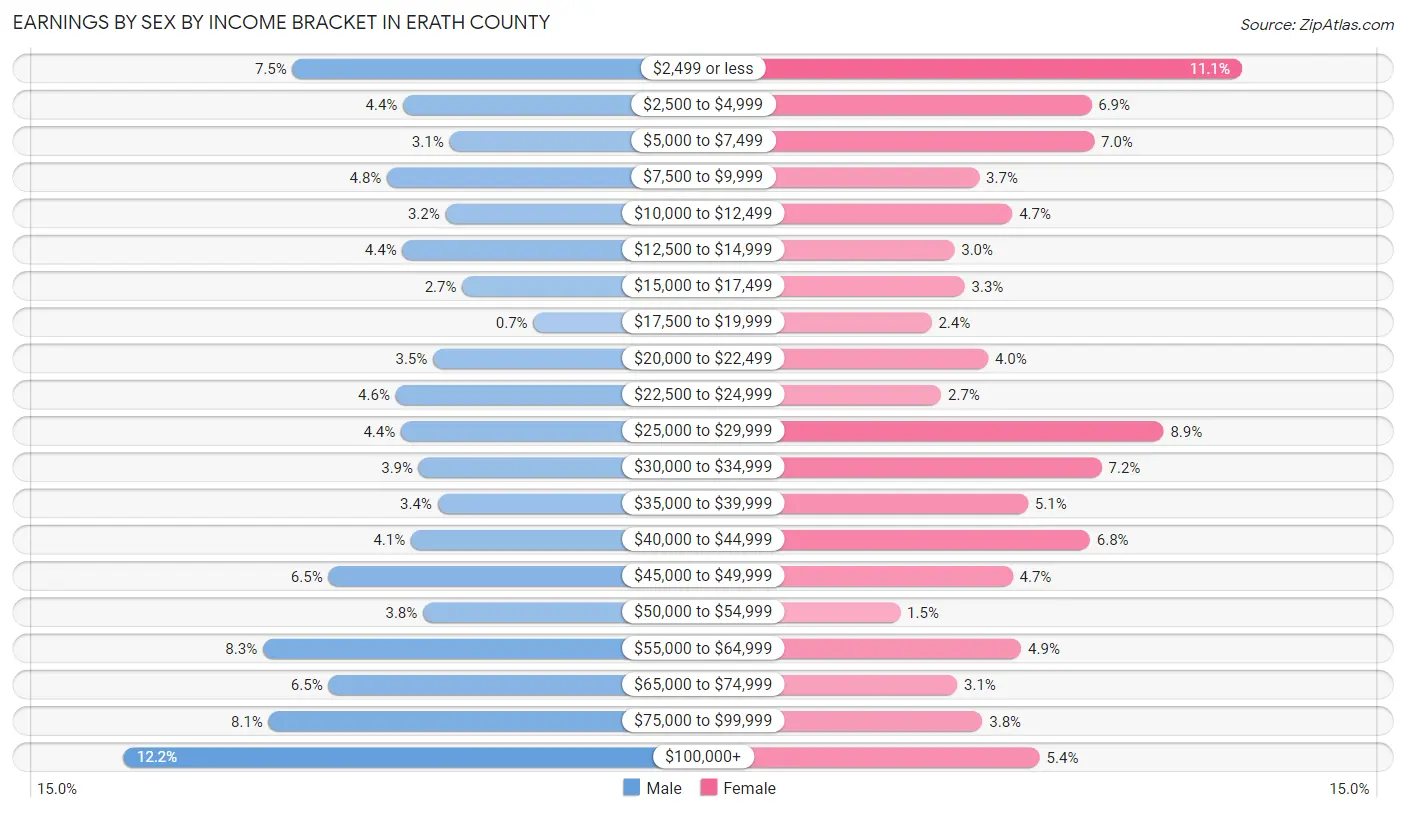
Earnings by Sex by Income Bracket in Erath County
The most common earnings brackets in Erath County are $100,000+ for men (1,563 | 12.2%) and $2,499 or less for women (1,246 | 11.1%).
| Income | Male | Female |
| $2,499 or less | 956 (7.5%) | 1,246 (11.1%) |
| $2,500 to $4,999 | 558 (4.4%) | 771 (6.9%) |
| $5,000 to $7,499 | 392 (3.1%) | 780 (7.0%) |
| $7,500 to $9,999 | 616 (4.8%) | 417 (3.7%) |
| $10,000 to $12,499 | 406 (3.2%) | 522 (4.6%) |
| $12,500 to $14,999 | 560 (4.4%) | 339 (3.0%) |
| $15,000 to $17,499 | 346 (2.7%) | 372 (3.3%) |
| $17,500 to $19,999 | 90 (0.7%) | 267 (2.4%) |
| $20,000 to $22,499 | 451 (3.5%) | 446 (4.0%) |
| $22,500 to $24,999 | 585 (4.6%) | 297 (2.6%) |
| $25,000 to $29,999 | 566 (4.4%) | 999 (8.9%) |
| $30,000 to $34,999 | 501 (3.9%) | 804 (7.2%) |
| $35,000 to $39,999 | 434 (3.4%) | 571 (5.1%) |
| $40,000 to $44,999 | 530 (4.1%) | 767 (6.8%) |
| $45,000 to $49,999 | 827 (6.5%) | 523 (4.7%) |
| $50,000 to $54,999 | 486 (3.8%) | 168 (1.5%) |
| $55,000 to $64,999 | 1,062 (8.3%) | 550 (4.9%) |
| $65,000 to $74,999 | 826 (6.5%) | 348 (3.1%) |
| $75,000 to $99,999 | 1,041 (8.1%) | 427 (3.8%) |
| $100,000+ | 1,563 (12.2%) | 608 (5.4%) |
| Total | 12,796 (100.0%) | 11,222 (100.0%) |
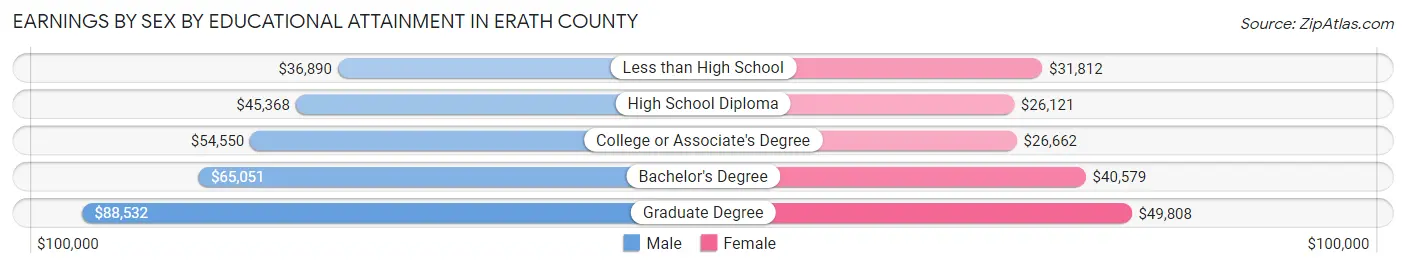
Earnings by Sex by Educational Attainment in Erath County
Average earnings in Erath County are $53,090 for men and $34,838 for women, a difference of 34.4%. Men with an educational attainment of graduate degree enjoy the highest average annual earnings of $88,532, while those with less than high school education earn the least with $36,890. Women with an educational attainment of graduate degree earn the most with the average annual earnings of $49,808, while those with high school diploma education have the smallest earnings of $26,121.
| Educational Attainment | Male Income | Female Income |
| Less than High School | $36,890 | $31,812 |
| High School Diploma | $45,368 | $26,121 |
| College or Associate's Degree | $54,550 | $26,662 |
| Bachelor's Degree | $65,051 | $40,579 |
| Graduate Degree | $88,532 | $49,808 |
| Total | $53,090 | $34,838 |
Family Income in Erath County
Family Income Brackets in Erath County
According to the Erath County family income data, there are 2,214 families falling into the $100,000 to $149,999 income range, which is the most common income bracket and makes up 22.1% of all families. Conversely, the $10,000 to $14,999 income bracket is the least frequent group with only 90 families (0.9%) belonging to this category.
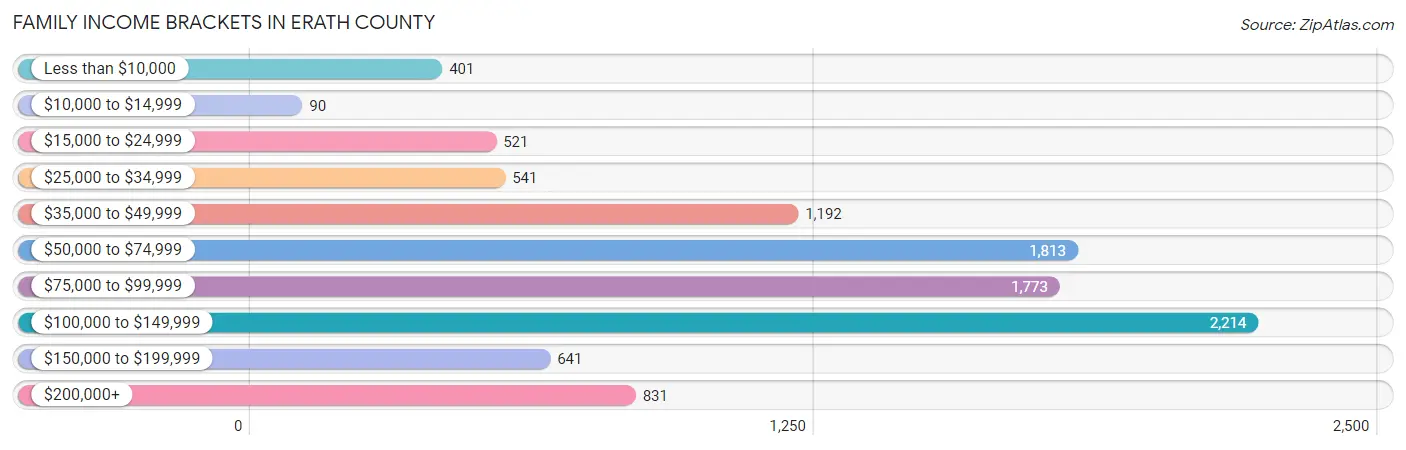
| Income Bracket | # Families | % Families |
| Less than $10,000 | 401 | 4.0% |
| $10,000 to $14,999 | 90 | 0.9% |
| $15,000 to $24,999 | 521 | 5.2% |
| $25,000 to $34,999 | 541 | 5.4% |
| $35,000 to $49,999 | 1,192 | 11.9% |
| $50,000 to $74,999 | 1,813 | 18.1% |
| $75,000 to $99,999 | 1,773 | 17.7% |
| $100,000 to $149,999 | 2,214 | 22.1% |
| $150,000 to $199,999 | 641 | 6.4% |
| $200,000+ | 831 | 8.3% |
Family Income by Famaliy Size in Erath County
7+ person families (177 | 1.8%) account for the highest median family income in Erath County with $116,180 per family, while 2-person families (4,630 | 46.2%) have the highest median income of $39,844 per family member.
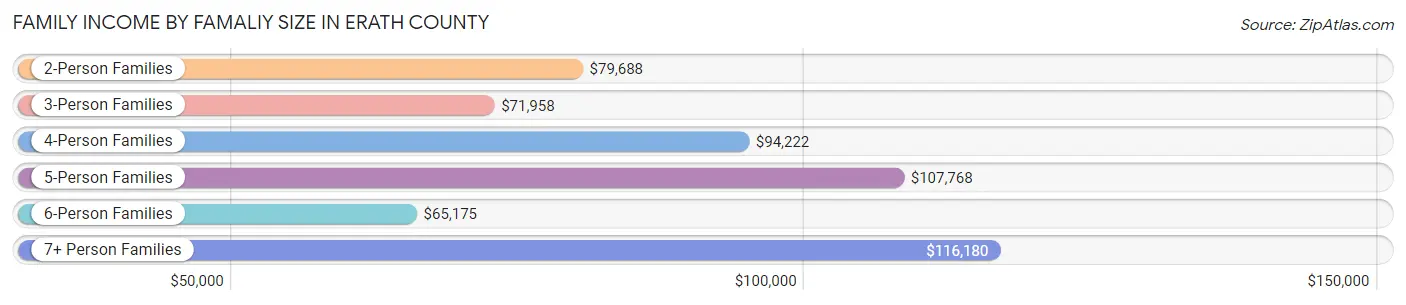
| Income Bracket | # Families | Median Income |
| 2-Person Families | 4,630 (46.2%) | $79,688 |
| 3-Person Families | 2,415 (24.1%) | $71,958 |
| 4-Person Families | 1,672 (16.7%) | $94,222 |
| 5-Person Families | 899 (9.0%) | $107,768 |
| 6-Person Families | 225 (2.2%) | $65,175 |
| 7+ Person Families | 177 (1.8%) | $116,180 |
| Total | 10,018 (100.0%) | $82,379 |
Family Income by Number of Earners in Erath County
The median family income in Erath County is $82,379, with families comprising 3+ earners (1,278) having the highest median family income of $113,100, while families with no earners (1,249) have the lowest median family income of $47,654, accounting for 12.8% and 12.5% of families, respectively.
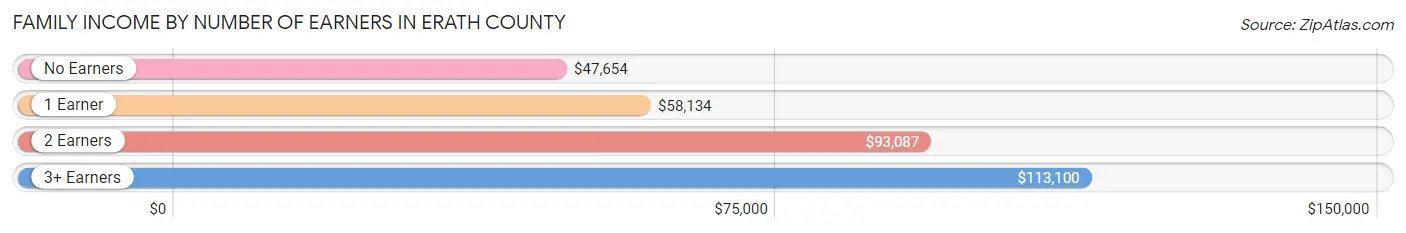
| Number of Earners | # Families | Median Income |
| No Earners | 1,249 (12.5%) | $47,654 |
| 1 Earner | 3,033 (30.3%) | $58,134 |
| 2 Earners | 4,458 (44.5%) | $93,087 |
| 3+ Earners | 1,278 (12.8%) | $113,100 |
| Total | 10,018 (100.0%) | $82,379 |
Household Income in Erath County
Household Income Brackets in Erath County
With 2,625 households falling in the category, the $50,000 to $74,999 income range is the most frequent in Erath County, accounting for 16.4% of all households. In contrast, only 640 households (4.0%) fall into the $10,000 to $14,999 income bracket, making it the least populous group.
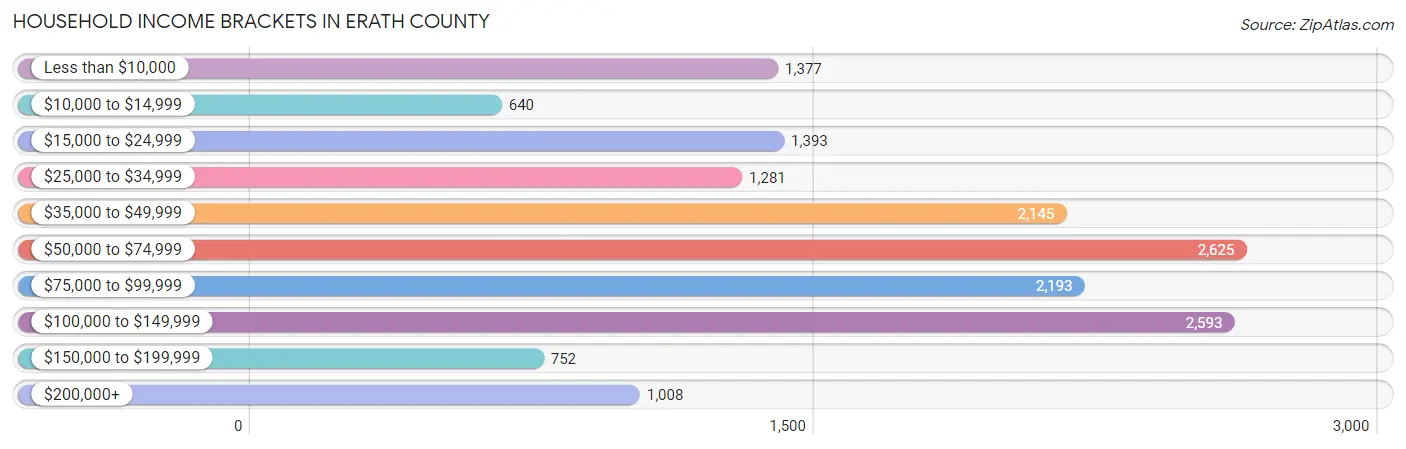
| Income Bracket | # Households | % Households |
| Less than $10,000 | 1,377 | 8.6% |
| $10,000 to $14,999 | 640 | 4.0% |
| $15,000 to $24,999 | 1,393 | 8.7% |
| $25,000 to $34,999 | 1,281 | 8.0% |
| $35,000 to $49,999 | 2,145 | 13.4% |
| $50,000 to $74,999 | 2,625 | 16.4% |
| $75,000 to $99,999 | 2,193 | 13.7% |
| $100,000 to $149,999 | 2,593 | 16.2% |
| $150,000 to $199,999 | 752 | 4.7% |
| $200,000+ | 1,008 | 6.3% |
Household Income by Householder Age in Erath County
The median household income in Erath County is $59,654, with the highest median household income of $77,825 found in the 45 to 64 years age bracket for the primary householder. A total of 4,900 households (30.6%) fall into this category. Meanwhile, the 15 to 24 years age bracket for the primary householder has the lowest median household income of $21,922, with 2,255 households (14.1%) in this group.
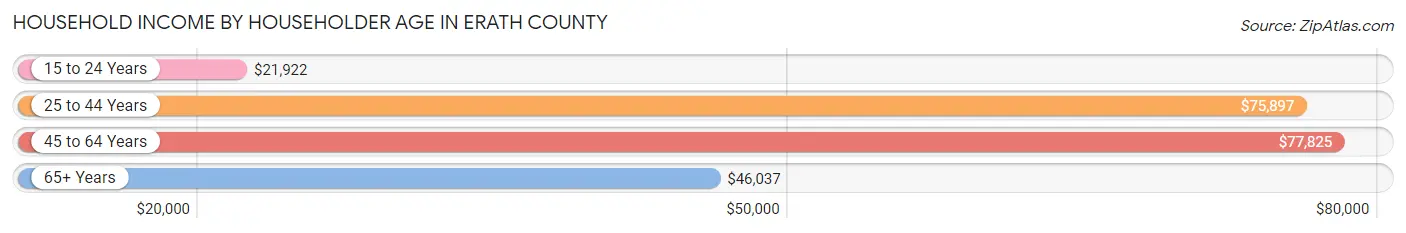
| Income Bracket | # Households | Median Income |
| 15 to 24 Years | 2,255 (14.1%) | $21,922 |
| 25 to 44 Years | 5,008 (31.3%) | $75,897 |
| 45 to 64 Years | 4,900 (30.6%) | $77,825 |
| 65+ Years | 3,844 (24.0%) | $46,037 |
| Total | 16,007 (100.0%) | $59,654 |
Poverty in Erath County
Income Below Poverty by Sex and Age in Erath County
With 18.0% poverty level for males and 15.1% for females among the residents of Erath County, 5 year old males and 18 to 24 year old females are the most vulnerable to poverty, with 81 males (45.3%) and 1,504 females (42.3%) in their respective age groups living below the poverty level.
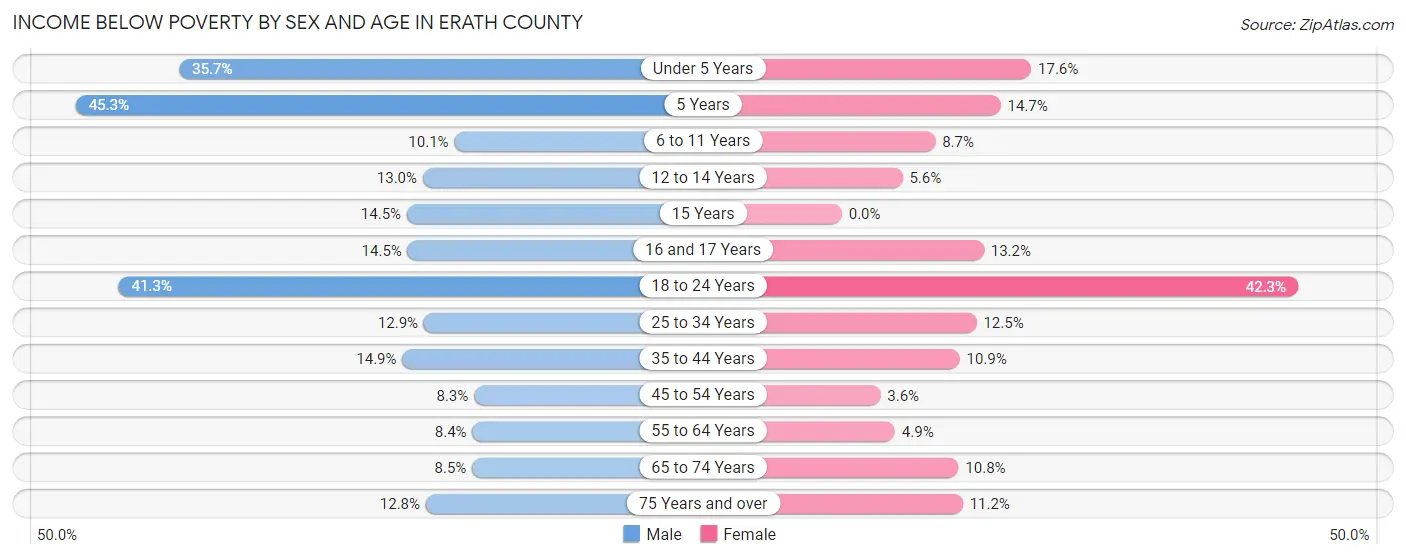
| Age Bracket | Male | Female |
| Under 5 Years | 449 (35.7%) | 210 (17.6%) |
| 5 Years | 81 (45.3%) | 23 (14.7%) |
| 6 to 11 Years | 163 (10.1%) | 111 (8.7%) |
| 12 to 14 Years | 91 (13.0%) | 50 (5.6%) |
| 15 Years | 45 (14.5%) | 0 (0.0%) |
| 16 and 17 Years | 61 (14.4%) | 70 (13.2%) |
| 18 to 24 Years | 1,345 (41.3%) | 1,504 (42.3%) |
| 25 to 34 Years | 359 (12.9%) | 331 (12.5%) |
| 35 to 44 Years | 354 (14.9%) | 249 (10.9%) |
| 45 to 54 Years | 169 (8.3%) | 77 (3.6%) |
| 55 to 64 Years | 201 (8.4%) | 117 (4.9%) |
| 65 to 74 Years | 140 (8.5%) | 201 (10.8%) |
| 75 Years and over | 125 (12.8%) | 141 (11.2%) |
| Total | 3,583 (18.0%) | 3,084 (15.1%) |
Income Above Poverty by Sex and Age in Erath County
According to the poverty statistics in Erath County, males aged 45 to 54 years and females aged 15 years are the age groups that are most secure financially, with 91.7% of males and 100.0% of females in these age groups living above the poverty line.
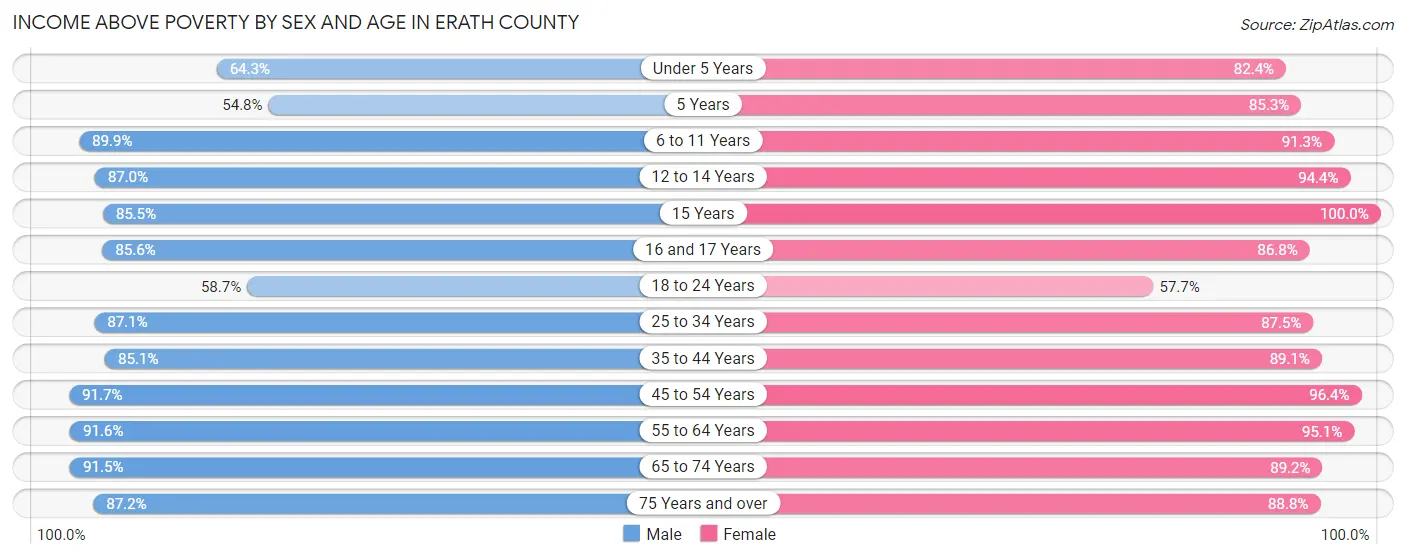
| Age Bracket | Male | Female |
| Under 5 Years | 810 (64.3%) | 985 (82.4%) |
| 5 Years | 98 (54.7%) | 133 (85.3%) |
| 6 to 11 Years | 1,450 (89.9%) | 1,169 (91.3%) |
| 12 to 14 Years | 607 (87.0%) | 838 (94.4%) |
| 15 Years | 265 (85.5%) | 197 (100.0%) |
| 16 and 17 Years | 361 (85.6%) | 461 (86.8%) |
| 18 to 24 Years | 1,913 (58.7%) | 2,050 (57.7%) |
| 25 to 34 Years | 2,415 (87.1%) | 2,316 (87.5%) |
| 35 to 44 Years | 2,016 (85.1%) | 2,029 (89.1%) |
| 45 to 54 Years | 1,872 (91.7%) | 2,074 (96.4%) |
| 55 to 64 Years | 2,181 (91.6%) | 2,256 (95.1%) |
| 65 to 74 Years | 1,515 (91.5%) | 1,656 (89.2%) |
| 75 Years and over | 855 (87.2%) | 1,116 (88.8%) |
| Total | 16,358 (82.0%) | 17,280 (84.9%) |
Income Below Poverty Among Married-Couple Families in Erath County
The poverty statistics for married-couple families in Erath County show that 5.0% or 409 of the total 8,169 families live below the poverty line. Families with 1 or 2 children have the highest poverty rate of 6.4%, comprising of 166 families. On the other hand, families with 5 or more children have the lowest poverty rate of 0.0%, which includes 0 families.
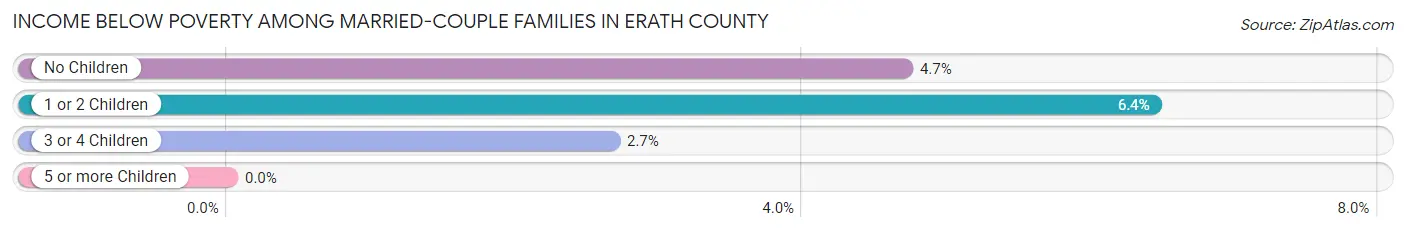
| Children | Above Poverty | Below Poverty |
| No Children | 4,503 (95.3%) | 222 (4.7%) |
| 1 or 2 Children | 2,414 (93.6%) | 166 (6.4%) |
| 3 or 4 Children | 767 (97.3%) | 21 (2.7%) |
| 5 or more Children | 76 (100.0%) | 0 (0.0%) |
| Total | 7,760 (95.0%) | 409 (5.0%) |
Income Below Poverty Among Single-Parent Households in Erath County
According to the poverty data in Erath County, 30.1% or 182 single-father households and 23.7% or 295 single-mother households are living below the poverty line. Among single-father households, those with 3 or 4 children have the highest poverty rate, with 90 households (78.3%) experiencing poverty. Likewise, among single-mother households, those with 5 or more children have the highest poverty rate, with 18 households (69.2%) falling below the poverty line.
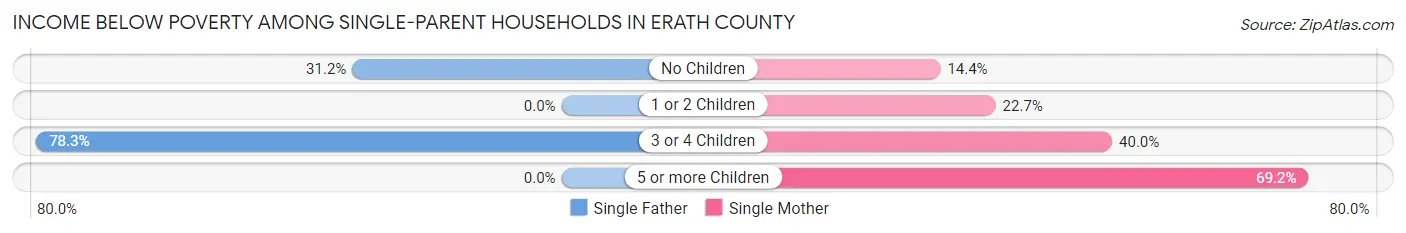
| Children | Single Father | Single Mother |
| No Children | 92 (31.2%) | 47 (14.4%) |
| 1 or 2 Children | 0 (0.0%) | 166 (22.7%) |
| 3 or 4 Children | 90 (78.3%) | 64 (40.0%) |
| 5 or more Children | 0 (0.0%) | 18 (69.2%) |
| Total | 182 (30.1%) | 295 (23.7%) |
Income Below Poverty Among Married-Couple vs Single-Parent Households in Erath County
The poverty data for Erath County shows that 409 of the married-couple family households (5.0%) and 477 of the single-parent households (25.8%) are living below the poverty level. Within the married-couple family households, those with 1 or 2 children have the highest poverty rate, with 166 households (6.4%) falling below the poverty line. Among the single-parent households, those with 5 or more children have the highest poverty rate, with 18 household (69.2%) living below poverty.
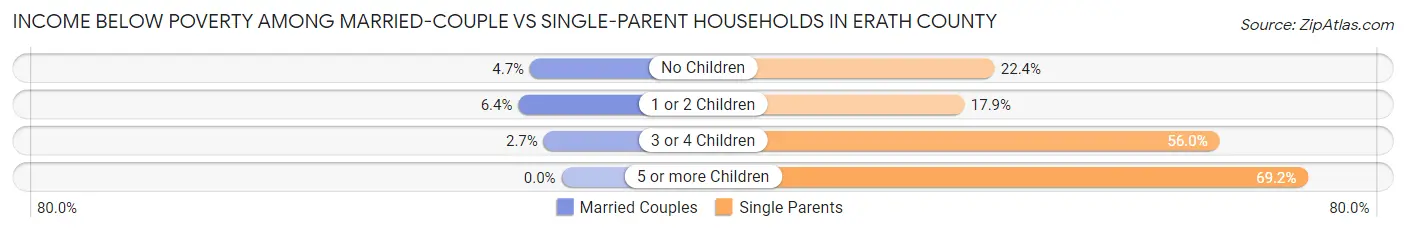
| Children | Married-Couple Families | Single-Parent Households |
| No Children | 222 (4.7%) | 139 (22.4%) |
| 1 or 2 Children | 166 (6.4%) | 166 (17.9%) |
| 3 or 4 Children | 21 (2.7%) | 154 (56.0%) |
| 5 or more Children | 0 (0.0%) | 18 (69.2%) |
| Total | 409 (5.0%) | 477 (25.8%) |
Race in Erath County
The most populous races in Erath County are White / Caucasian (35,153 | 82.2%), Hispanic or Latino (9,334 | 21.8%), and Two or more Races (3,310 | 7.7%).
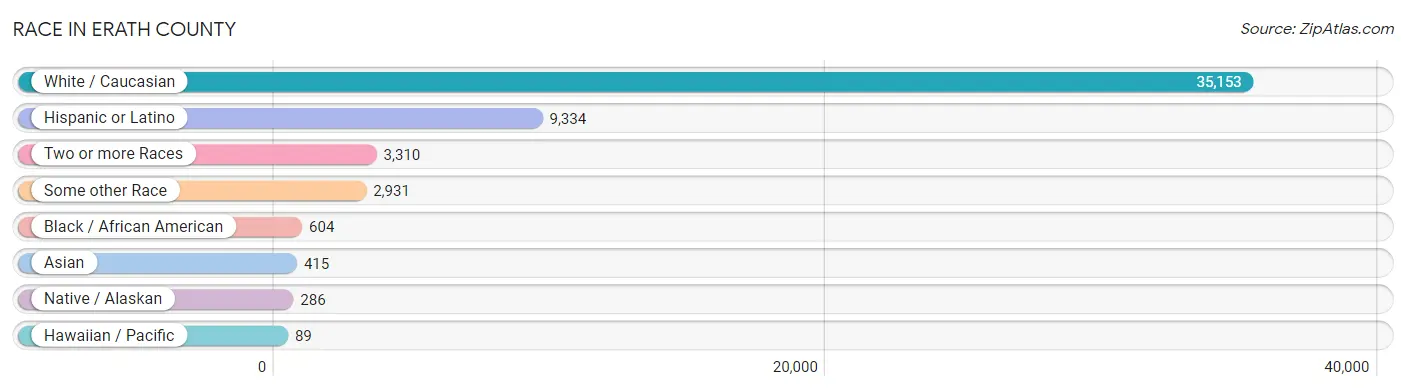
| Race | # Population | % Population |
| Asian | 415 | 1.0% |
| Black / African American | 604 | 1.4% |
| Hawaiian / Pacific | 89 | 0.2% |
| Hispanic or Latino | 9,334 | 21.8% |
| Native / Alaskan | 286 | 0.7% |
| White / Caucasian | 35,153 | 82.2% |
| Two or more Races | 3,310 | 7.7% |
| Some other Race | 2,931 | 6.9% |
| Total | 42,788 | 100.0% |
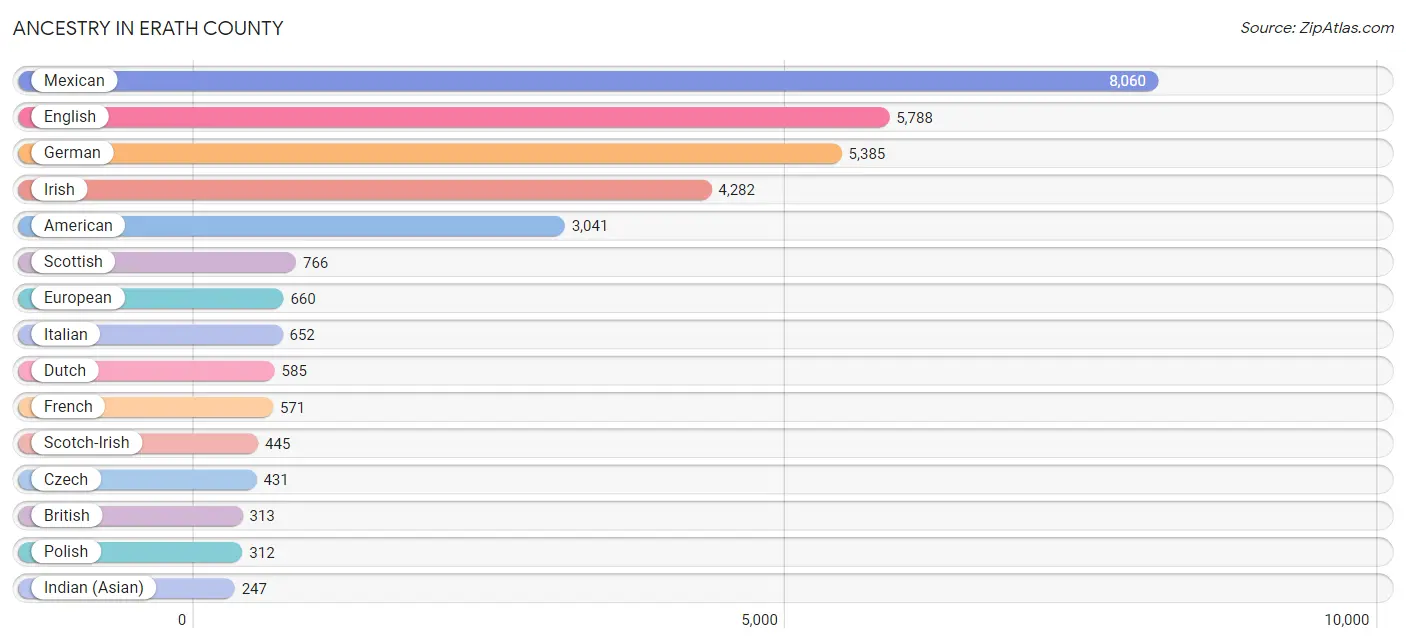
Ancestry in Erath County
The most populous ancestries reported in Erath County are Mexican (8,060 | 18.8%), English (5,788 | 13.5%), German (5,385 | 12.6%), Irish (4,282 | 10.0%), and American (3,041 | 7.1%), together accounting for 62.1% of all Erath County residents.
| Ancestry | # Population | % Population |
| African | 35 | 0.1% |
| Aleut | 11 | 0.0% |
| Alsatian | 19 | 0.0% |
| American | 3,041 | 7.1% |
| Apache | 11 | 0.0% |
| Arab | 71 | 0.2% |
| Austrian | 6 | 0.0% |
| Belgian | 19 | 0.0% |
| Bhutanese | 28 | 0.1% |
| Brazilian | 73 | 0.2% |
| British | 313 | 0.7% |
| British West Indian | 4 | 0.0% |
| Burmese | 31 | 0.1% |
| Canadian | 78 | 0.2% |
| Central American | 76 | 0.2% |
| Cherokee | 139 | 0.3% |
| Chickasaw | 5 | 0.0% |
| Choctaw | 36 | 0.1% |
| Colombian | 12 | 0.0% |
| Comanche | 19 | 0.0% |
| Costa Rican | 8 | 0.0% |
| Creek | 40 | 0.1% |
| Cuban | 13 | 0.0% |
| Czech | 431 | 1.0% |
| Czechoslovakian | 4 | 0.0% |
| Danish | 49 | 0.1% |
| Dutch | 585 | 1.4% |
| Eastern European | 50 | 0.1% |
| English | 5,788 | 13.5% |
| European | 660 | 1.5% |
| Filipino | 6 | 0.0% |
| French | 571 | 1.3% |
| French Canadian | 31 | 0.1% |
| German | 5,385 | 12.6% |
| Greek | 41 | 0.1% |
| Guamanian / Chamorro | 13 | 0.0% |
| Honduran | 4 | 0.0% |
| Hungarian | 35 | 0.1% |
| Indian (Asian) | 247 | 0.6% |
| Irish | 4,282 | 10.0% |
| Italian | 652 | 1.5% |
| Jordanian | 21 | 0.1% |
| Korean | 98 | 0.2% |
| Latvian | 10 | 0.0% |
| Lebanese | 50 | 0.1% |
| Lithuanian | 103 | 0.2% |
| Malaysian | 3 | 0.0% |
| Mexican | 8,060 | 18.8% |
| Mexican American Indian | 45 | 0.1% |
| Native Hawaiian | 58 | 0.1% |
| Nicaraguan | 23 | 0.1% |
| Nigerian | 14 | 0.0% |
| Northern European | 98 | 0.2% |
| Norwegian | 219 | 0.5% |
| Panamanian | 14 | 0.0% |
| Pennsylvania German | 11 | 0.0% |
| Peruvian | 18 | 0.0% |
| Polish | 312 | 0.7% |
| Portuguese | 85 | 0.2% |
| Pueblo | 87 | 0.2% |
| Puerto Rican | 218 | 0.5% |
| Romanian | 26 | 0.1% |
| Russian | 91 | 0.2% |
| Salvadoran | 27 | 0.1% |
| Samoan | 13 | 0.0% |
| Scandinavian | 183 | 0.4% |
| Scotch-Irish | 445 | 1.0% |
| Scottish | 766 | 1.8% |
| Senegalese | 56 | 0.1% |
| Sioux | 59 | 0.1% |
| Slovene | 36 | 0.1% |
| South African | 10 | 0.0% |
| South American | 30 | 0.1% |
| Spaniard | 136 | 0.3% |
| Spanish | 38 | 0.1% |
| Sri Lankan | 35 | 0.1% |
| Subsaharan African | 111 | 0.3% |
| Swedish | 67 | 0.2% |
| Swiss | 19 | 0.0% |
| Thai | 48 | 0.1% |
| Tongan | 89 | 0.2% |
| Welsh | 97 | 0.2% | View All 82 Rows |
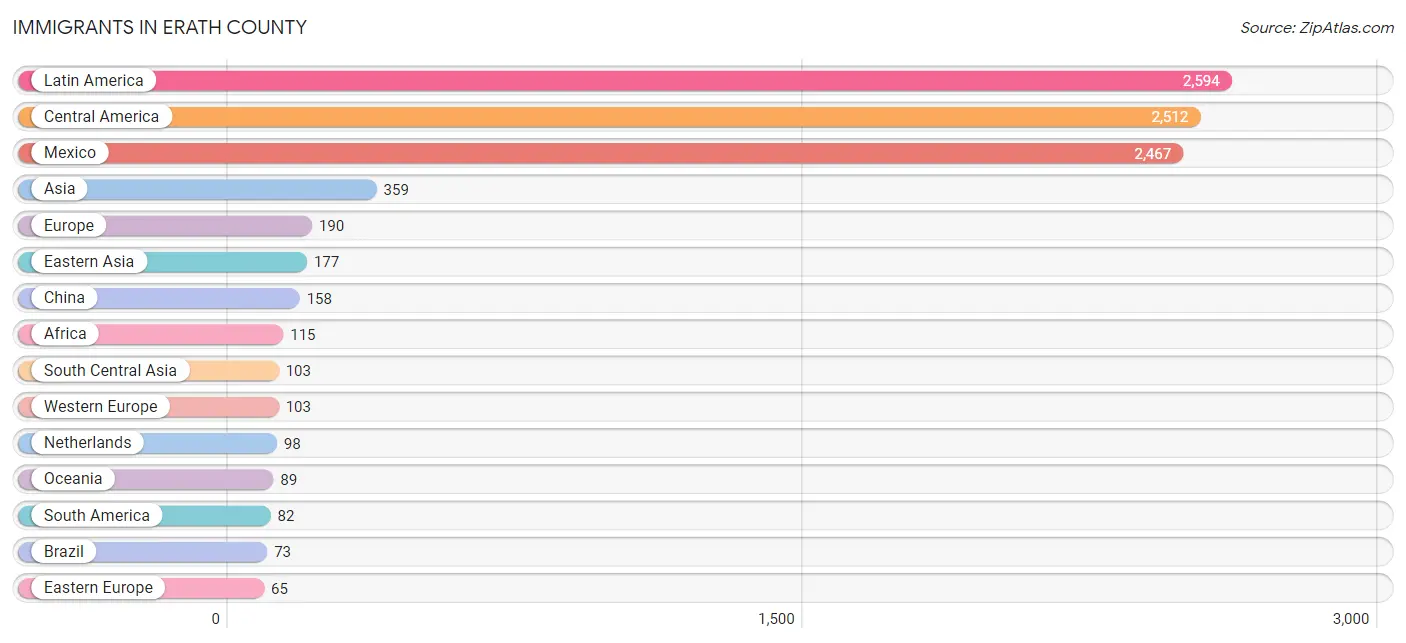
Immigrants in Erath County
The most numerous immigrant groups reported in Erath County came from Latin America (2,594 | 6.1%), Central America (2,512 | 5.9%), Mexico (2,467 | 5.8%), Asia (359 | 0.8%), and Europe (190 | 0.4%), together accounting for 19.0% of all Erath County residents.
| Immigration Origin | # Population | % Population |
| Africa | 115 | 0.3% |
| Asia | 359 | 0.8% |
| Brazil | 73 | 0.2% |
| Canada | 59 | 0.1% |
| Central America | 2,512 | 5.9% |
| China | 158 | 0.4% |
| Eastern Africa | 12 | 0.0% |
| Eastern Asia | 177 | 0.4% |
| Eastern Europe | 65 | 0.2% |
| El Salvador | 27 | 0.1% |
| England | 22 | 0.1% |
| Europe | 190 | 0.4% |
| France | 5 | 0.0% |
| Honduras | 4 | 0.0% |
| India | 44 | 0.1% |
| Japan | 11 | 0.0% |
| Korea | 8 | 0.0% |
| Kuwait | 21 | 0.1% |
| Laos | 3 | 0.0% |
| Latin America | 2,594 | 6.1% |
| Latvia | 10 | 0.0% |
| Malaysia | 6 | 0.0% |
| Mexico | 2,467 | 5.8% |
| Nepal | 59 | 0.1% |
| Netherlands | 98 | 0.2% |
| Nigeria | 4 | 0.0% |
| Northern Europe | 22 | 0.1% |
| Oceania | 89 | 0.2% |
| Panama | 14 | 0.0% |
| Peru | 5 | 0.0% |
| Philippines | 32 | 0.1% |
| Russia | 55 | 0.1% |
| Senegal | 56 | 0.1% |
| South Africa | 43 | 0.1% |
| South America | 82 | 0.2% |
| South Central Asia | 103 | 0.2% |
| South Eastern Asia | 58 | 0.1% |
| Thailand | 7 | 0.0% |
| Uruguay | 4 | 0.0% |
| Vietnam | 10 | 0.0% |
| Western Africa | 60 | 0.1% |
| Western Asia | 21 | 0.1% |
| Western Europe | 103 | 0.2% |
| Zimbabwe | 4 | 0.0% | View All 44 Rows |
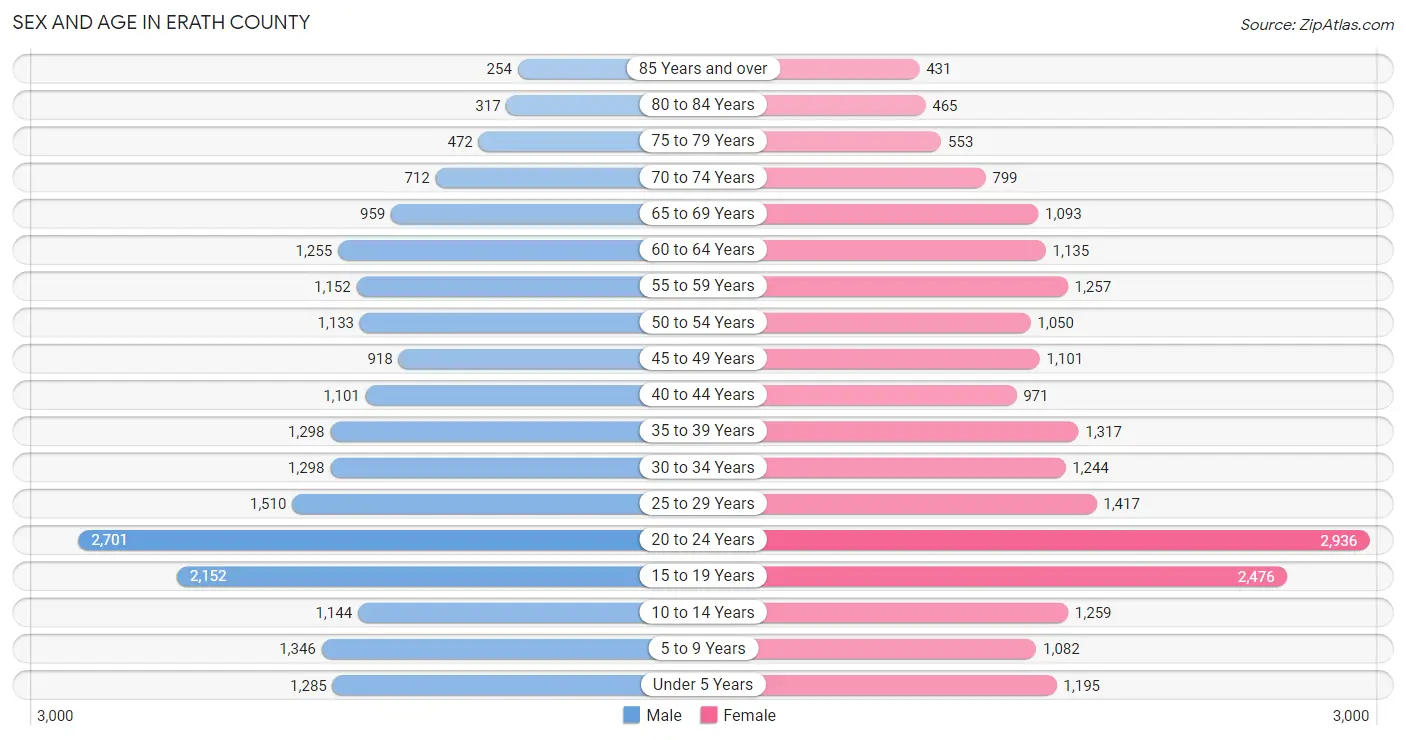
Sex and Age in Erath County
Sex and Age in Erath County
The most populous age groups in Erath County are 20 to 24 Years (2,701 | 12.9%) for men and 20 to 24 Years (2,936 | 13.5%) for women.
| Age Bracket | Male | Female |
| Under 5 Years | 1,285 (6.1%) | 1,195 (5.5%) |
| 5 to 9 Years | 1,346 (6.4%) | 1,082 (5.0%) |
| 10 to 14 Years | 1,144 (5.4%) | 1,259 (5.8%) |
| 15 to 19 Years | 2,152 (10.2%) | 2,476 (11.4%) |
| 20 to 24 Years | 2,701 (12.9%) | 2,936 (13.5%) |
| 25 to 29 Years | 1,510 (7.2%) | 1,417 (6.5%) |
| 30 to 34 Years | 1,298 (6.2%) | 1,244 (5.7%) |
| 35 to 39 Years | 1,298 (6.2%) | 1,317 (6.0%) |
| 40 to 44 Years | 1,101 (5.2%) | 971 (4.5%) |
| 45 to 49 Years | 918 (4.4%) | 1,101 (5.1%) |
| 50 to 54 Years | 1,133 (5.4%) | 1,050 (4.8%) |
| 55 to 59 Years | 1,152 (5.5%) | 1,257 (5.8%) |
| 60 to 64 Years | 1,255 (6.0%) | 1,135 (5.2%) |
| 65 to 69 Years | 959 (4.6%) | 1,093 (5.0%) |
| 70 to 74 Years | 712 (3.4%) | 799 (3.7%) |
| 75 to 79 Years | 472 (2.2%) | 553 (2.5%) |
| 80 to 84 Years | 317 (1.5%) | 465 (2.1%) |
| 85 Years and over | 254 (1.2%) | 431 (2.0%) |
| Total | 21,007 (100.0%) | 21,781 (100.0%) |
Families and Households in Erath County
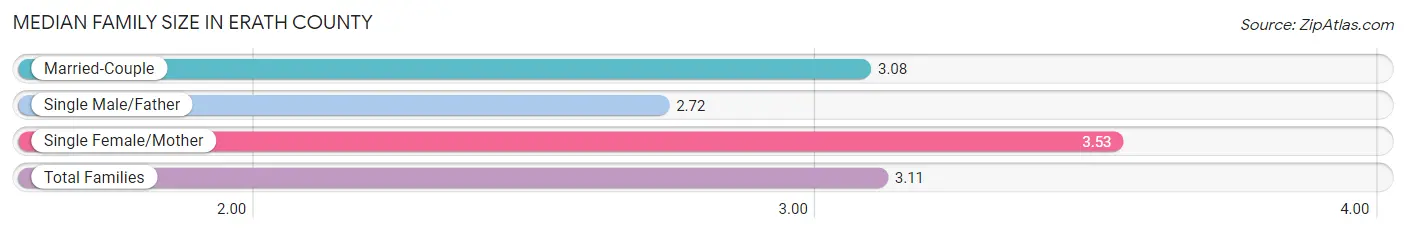
Median Family Size in Erath County
The median family size in Erath County is 3.11 persons per family, with single female/mother families (1,245 | 12.4%) accounting for the largest median family size of 3.53 persons per family. On the other hand, single male/father families (604 | 6.0%) represent the smallest median family size with 2.72 persons per family.
| Family Type | # Families | Family Size |
| Married-Couple | 8,169 (81.5%) | 3.08 |
| Single Male/Father | 604 (6.0%) | 2.72 |
| Single Female/Mother | 1,245 (12.4%) | 3.53 |
| Total Families | 10,018 (100.0%) | 3.11 |
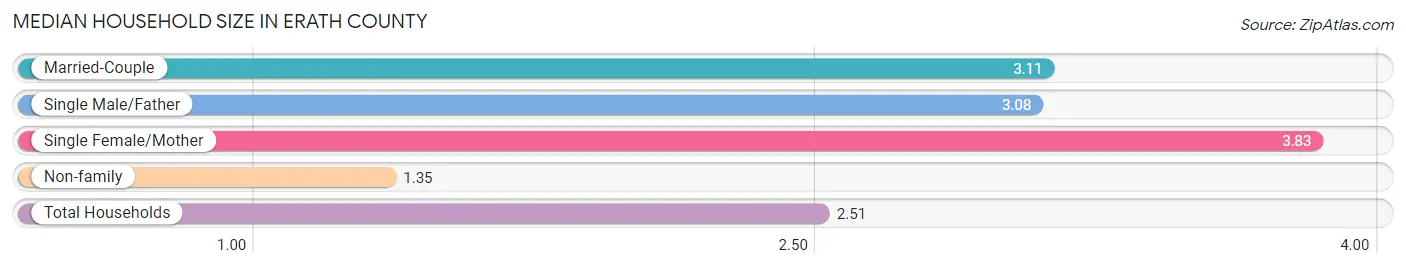
Median Household Size in Erath County
The median household size in Erath County is 2.51 persons per household, with single female/mother households (1,245 | 7.8%) accounting for the largest median household size of 3.83 persons per household. non-family households (5,989 | 37.4%) represent the smallest median household size with 1.35 persons per household.
| Household Type | # Households | Household Size |
| Married-Couple | 8,169 (51.0%) | 3.11 |
| Single Male/Father | 604 (3.8%) | 3.08 |
| Single Female/Mother | 1,245 (7.8%) | 3.83 |
| Non-family | 5,989 (37.4%) | 1.35 |
| Total Households | 16,007 (100.0%) | 2.51 |
Household Size by Marriage Status in Erath County
Out of a total of 16,007 households in Erath County, 10,018 (62.6%) are family households, while 5,989 (37.4%) are nonfamily households. The most numerous type of family households are 2-person households, comprising 4,393, and the most common type of nonfamily households are 1-person households, comprising 4,334.
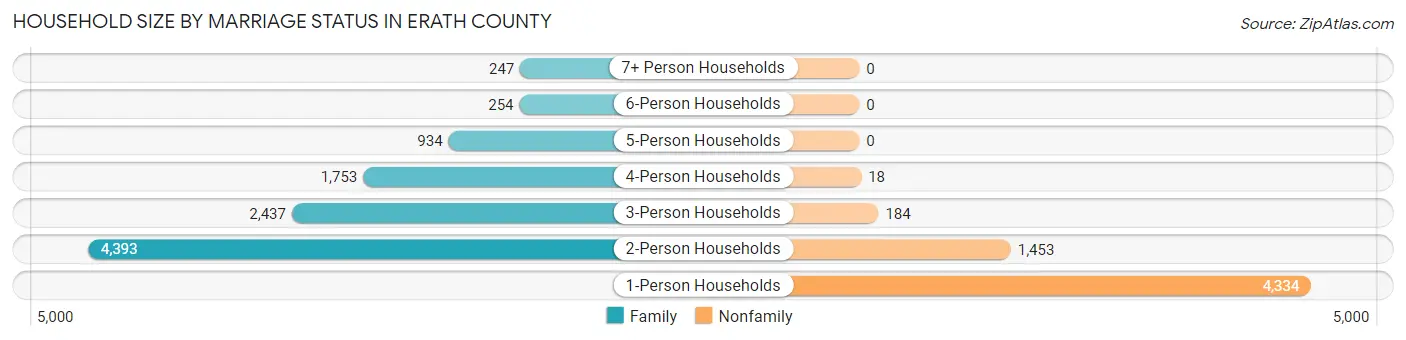
| Household Size | Family Households | Nonfamily Households |
| 1-Person Households | - | 4,334 (27.1%) |
| 2-Person Households | 4,393 (27.4%) | 1,453 (9.1%) |
| 3-Person Households | 2,437 (15.2%) | 184 (1.1%) |
| 4-Person Households | 1,753 (11.0%) | 18 (0.1%) |
| 5-Person Households | 934 (5.8%) | 0 (0.0%) |
| 6-Person Households | 254 (1.6%) | 0 (0.0%) |
| 7+ Person Households | 247 (1.5%) | 0 (0.0%) |
| Total | 10,018 (62.6%) | 5,989 (37.4%) |
Female Fertility in Erath County
Fertility by Age in Erath County
Average fertility rate in Erath County is 60.0 births per 1,000 women. Women in the age bracket of 20 to 34 years have the highest fertility rate with 82.0 births per 1,000 women. Women in the age bracket of 20 to 34 years acount for 65.8% of all women with births.
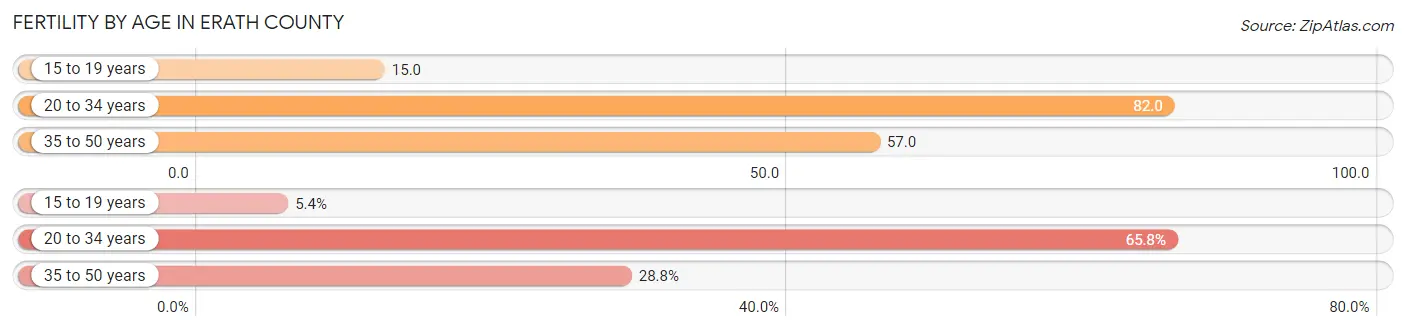
| Age Bracket | Women with Births | Births / 1,000 Women |
| 15 to 19 years | 38 (5.4%) | 15.0 |
| 20 to 34 years | 460 (65.8%) | 82.0 |
| 35 to 50 years | 201 (28.8%) | 57.0 |
| Total | 699 (100.0%) | 60.0 |
Fertility by Age by Marriage Status in Erath County
67.5% of women with births (699) in Erath County are married. The highest percentage of unmarried women with births falls into 15 to 19 years age bracket with 100.0% of them unmarried at the time of birth, while the lowest percentage of unmarried women with births belong to 35 to 50 years age bracket with 7.5% of them unmarried.
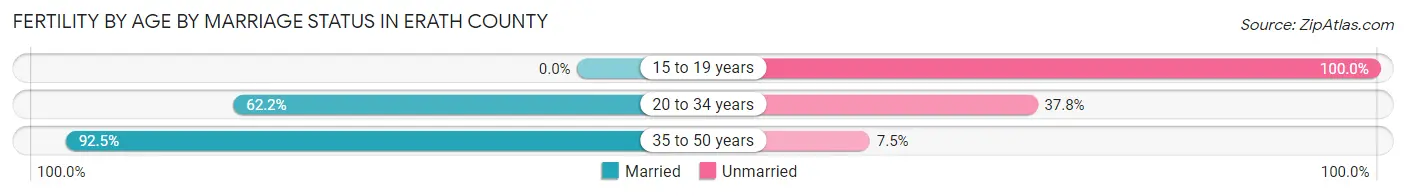
| Age Bracket | Married | Unmarried |
| 15 to 19 years | 0 (0.0%) | 38 (100.0%) |
| 20 to 34 years | 286 (62.2%) | 174 (37.8%) |
| 35 to 50 years | 186 (92.5%) | 15 (7.5%) |
| Total | 472 (67.5%) | 227 (32.5%) |
Fertility by Education in Erath County
Average fertility rate in Erath County is 60.0 births per 1,000 women. Women with the education attainment of graduate degree have the highest fertility rate of 140.0 births per 1,000 women, while women with the education attainment of less than high school have the lowest fertility at 23.0 births per 1,000 women. Women with the education attainment of high school diploma represent 37.2% of all women with births.
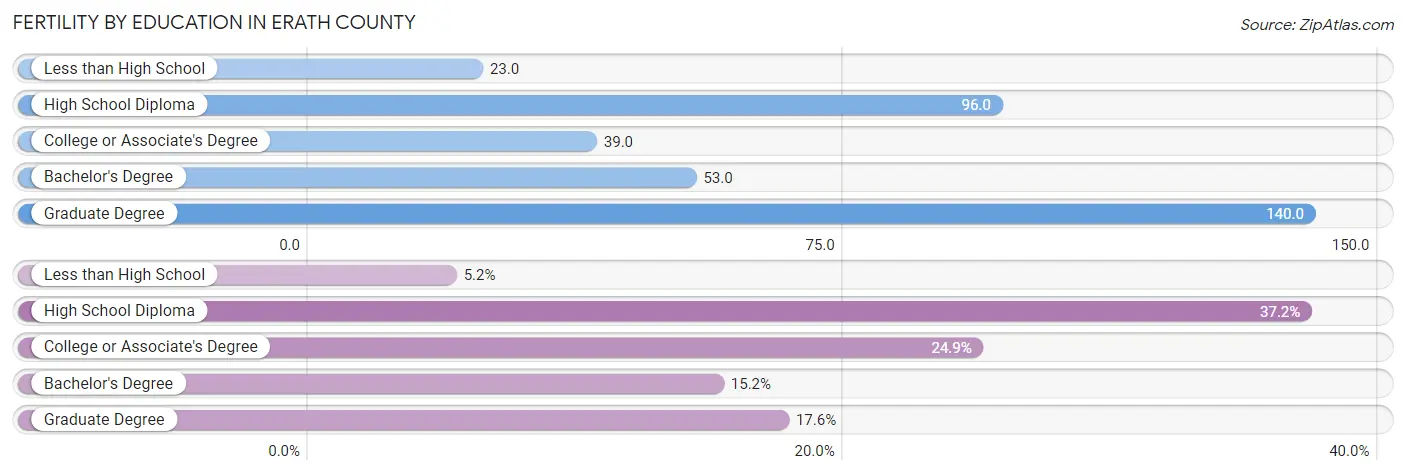
| Educational Attainment | Women with Births | Births / 1,000 Women |
| Less than High School | 36 (5.1%) | 23.0 |
| High School Diploma | 260 (37.2%) | 96.0 |
| College or Associate's Degree | 174 (24.9%) | 39.0 |
| Bachelor's Degree | 106 (15.2%) | 53.0 |
| Graduate Degree | 123 (17.6%) | 140.0 |
| Total | 699 (100.0%) | 60.0 |
Fertility by Education by Marriage Status in Erath County
32.5% of women with births in Erath County are unmarried. Women with the educational attainment of less than high school are most likely to be married with 100.0% of them married at childbirth, while women with the educational attainment of high school diploma are least likely to be married with 55.8% of them unmarried at childbirth.
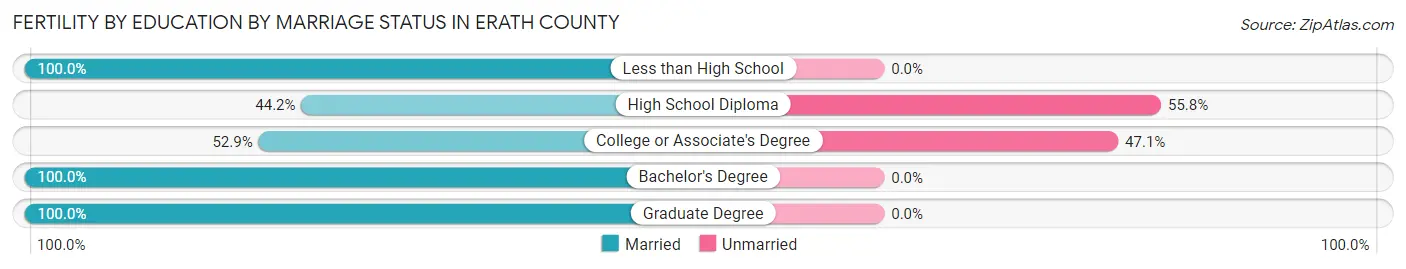
| Educational Attainment | Married | Unmarried |
| Less than High School | 36 (100.0%) | 0 (0.0%) |
| High School Diploma | 115 (44.2%) | 145 (55.8%) |
| College or Associate's Degree | 92 (52.9%) | 82 (47.1%) |
| Bachelor's Degree | 106 (100.0%) | 0 (0.0%) |
| Graduate Degree | 123 (100.0%) | 0 (0.0%) |
| Total | 472 (67.5%) | 227 (32.5%) |
Employment Characteristics in Erath County
Employment by Class of Employer in Erath County
Among the 20,446 employed individuals in Erath County, private company employees (13,210 | 64.6%), self-employed (not incorporated) (2,022 | 9.9%), and state government employees (1,591 | 7.8%) make up the most common classes of employment.
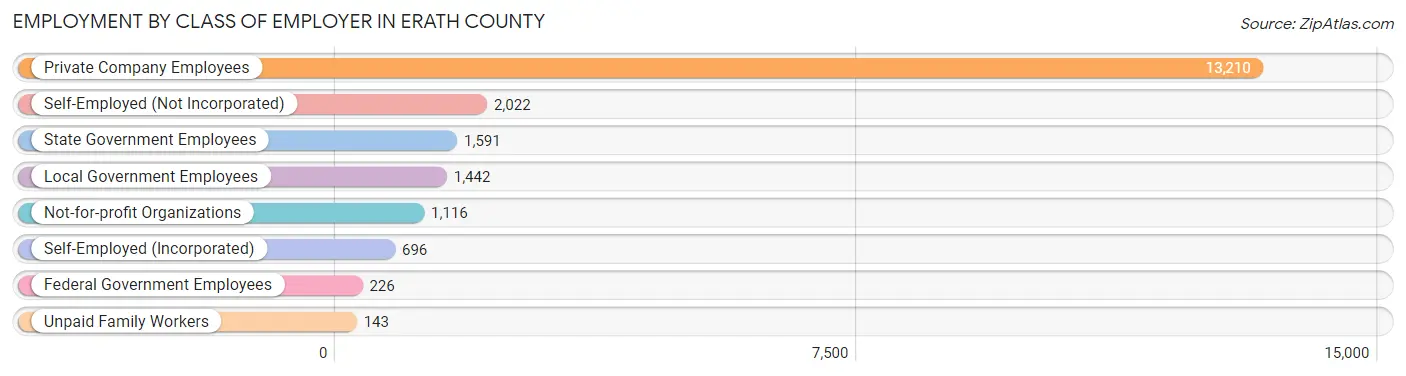
| Employer Class | # Employees | % Employees |
| Private Company Employees | 13,210 | 64.6% |
| Self-Employed (Incorporated) | 696 | 3.4% |
| Self-Employed (Not Incorporated) | 2,022 | 9.9% |
| Not-for-profit Organizations | 1,116 | 5.5% |
| Local Government Employees | 1,442 | 7.0% |
| State Government Employees | 1,591 | 7.8% |
| Federal Government Employees | 226 | 1.1% |
| Unpaid Family Workers | 143 | 0.7% |
| Total | 20,446 | 100.0% |
Employment Status by Age in Erath County
According to the labor force statistics for Erath County, out of the total population over 16 years of age (34,954), 63.2% or 22,091 individuals are in the labor force, with 5.6% or 1,237 of them unemployed. The age group with the highest labor force participation rate is 25 to 29 years, with 88.3% or 2,585 individuals in the labor force. Within the labor force, the 16 to 19 years age range has the highest percentage of unemployed individuals, with 14.1% or 241 of them being unemployed.
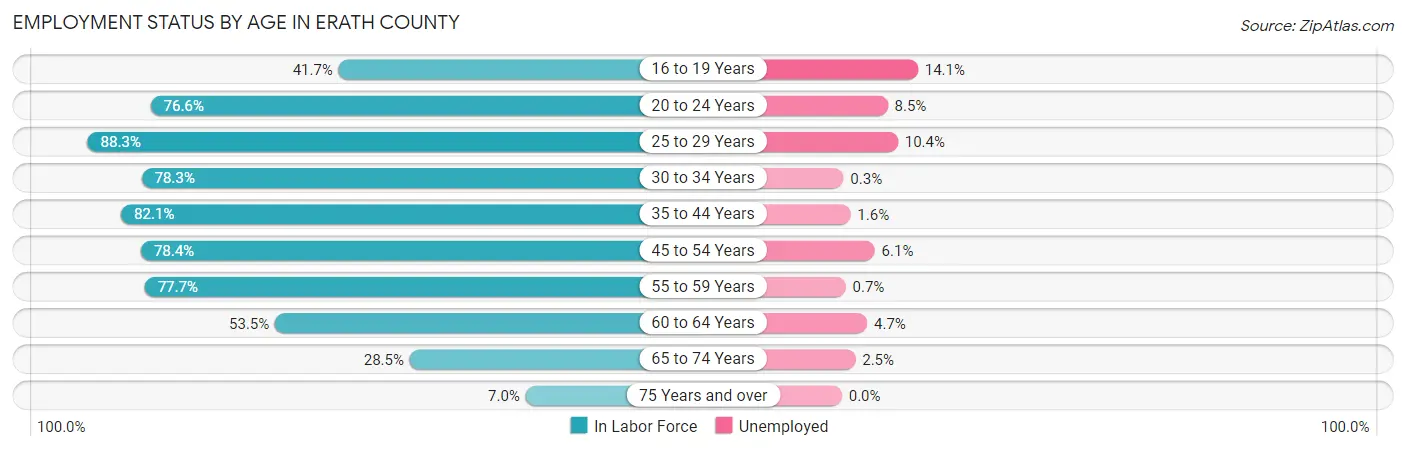
| Age Bracket | In Labor Force | Unemployed |
| 16 to 19 Years | 1,712 (41.7%) | 241 (14.1%) |
| 20 to 24 Years | 4,318 (76.6%) | 367 (8.5%) |
| 25 to 29 Years | 2,585 (88.3%) | 269 (10.4%) |
| 30 to 34 Years | 1,990 (78.3%) | 6 (0.3%) |
| 35 to 44 Years | 3,848 (82.1%) | 62 (1.6%) |
| 45 to 54 Years | 3,294 (78.4%) | 201 (6.1%) |
| 55 to 59 Years | 1,872 (77.7%) | 13 (0.7%) |
| 60 to 64 Years | 1,279 (53.5%) | 60 (4.7%) |
| 65 to 74 Years | 1,015 (28.5%) | 25 (2.5%) |
| 75 Years and over | 174 (7.0%) | 0 (0.0%) |
| Total | 22,091 (63.2%) | 1,237 (5.6%) |
Employment Status by Educational Attainment in Erath County
According to labor force statistics for Erath County, 77.6% of individuals (14,866) out of the total population between 25 and 64 years of age (19,157) are in the labor force, with 4.1% or 610 of them being unemployed. The group with the highest labor force participation rate are those with the educational attainment of bachelor's degree or higher, with 87.0% or 5,866 individuals in the labor force. Within the labor force, individuals with college / associate degree education have the highest percentage of unemployment, with 11.7% or 447 of them being unemployed.
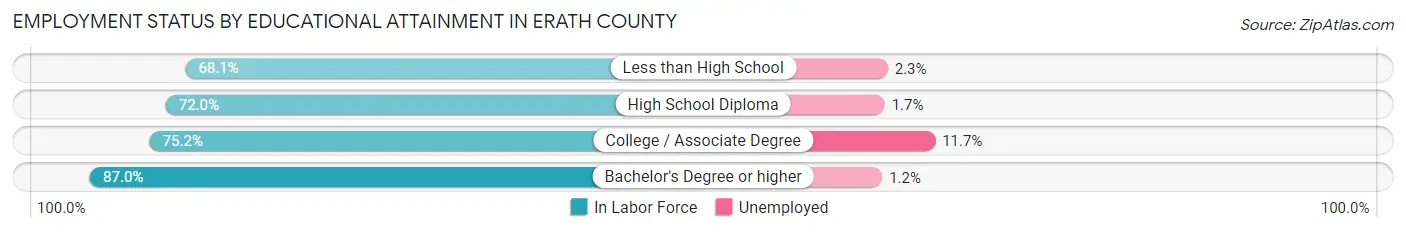
| Educational Attainment | In Labor Force | Unemployed |
| Less than High School | 1,674 (68.1%) | 57 (2.3%) |
| High School Diploma | 3,512 (72.0%) | 83 (1.7%) |
| College / Associate Degree | 3,819 (75.2%) | 594 (11.7%) |
| Bachelor's Degree or higher | 5,866 (87.0%) | 81 (1.2%) |
| Total | 14,866 (77.6%) | 785 (4.1%) |
Employment Occupations by Sex in Erath County
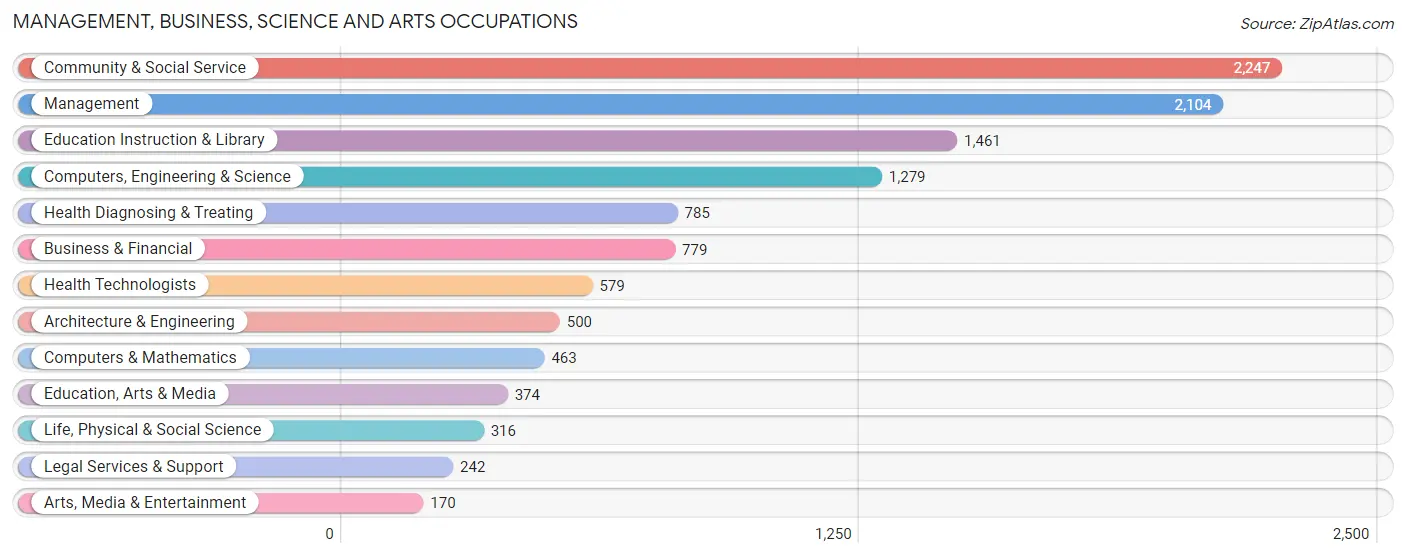
Management, Business, Science and Arts Occupations
The most common Management, Business, Science and Arts occupations in Erath County are Community & Social Service (2,247 | 10.8%), Management (2,104 | 10.1%), Education Instruction & Library (1,461 | 7.0%), Computers, Engineering & Science (1,279 | 6.1%), and Health Diagnosing & Treating (785 | 3.8%).
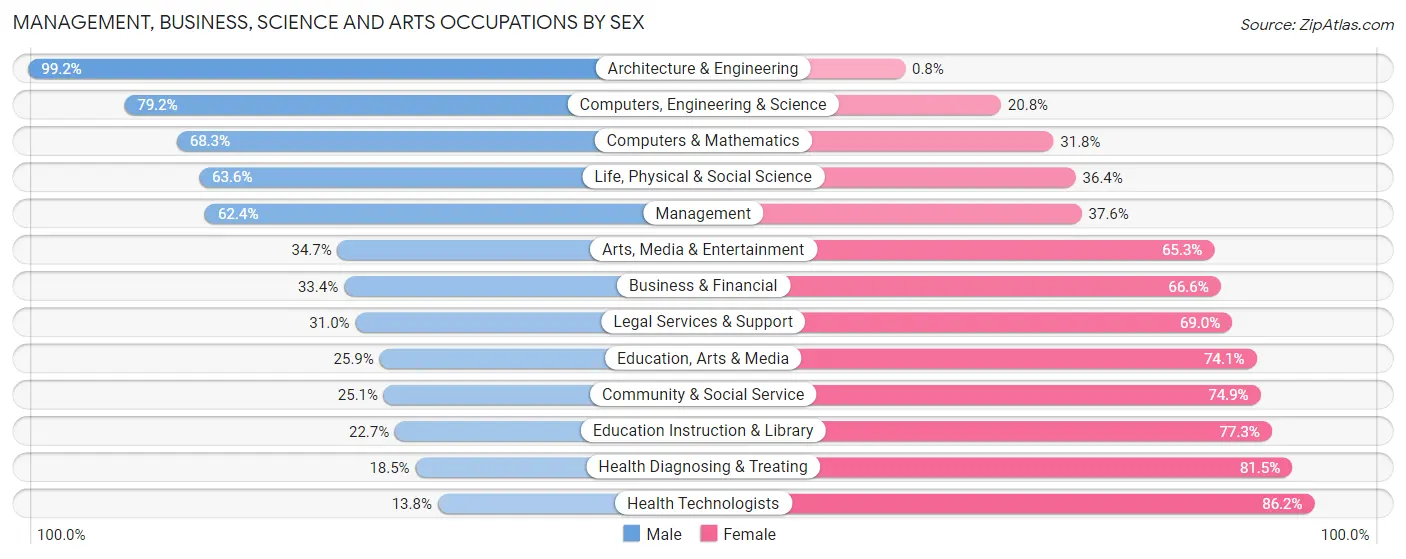
Management, Business, Science and Arts Occupations by Sex
Within the Management, Business, Science and Arts occupations in Erath County, the most male-oriented occupations are Architecture & Engineering (99.2%), Computers, Engineering & Science (79.2%), and Computers & Mathematics (68.2%), while the most female-oriented occupations are Health Technologists (86.2%), Health Diagnosing & Treating (81.5%), and Education Instruction & Library (77.3%).
| Occupation | Male | Female |
| Management | 1,312 (62.4%) | 792 (37.6%) |
| Business & Financial | 260 (33.4%) | 519 (66.6%) |
| Computers, Engineering & Science | 1,013 (79.2%) | 266 (20.8%) |
| Computers & Mathematics | 316 (68.2%) | 147 (31.8%) |
| Architecture & Engineering | 496 (99.2%) | 4 (0.8%) |
| Life, Physical & Social Science | 201 (63.6%) | 115 (36.4%) |
| Community & Social Service | 563 (25.1%) | 1,684 (74.9%) |
| Education, Arts & Media | 97 (25.9%) | 277 (74.1%) |
| Legal Services & Support | 75 (31.0%) | 167 (69.0%) |
| Education Instruction & Library | 332 (22.7%) | 1,129 (77.3%) |
| Arts, Media & Entertainment | 59 (34.7%) | 111 (65.3%) |
| Health Diagnosing & Treating | 145 (18.5%) | 640 (81.5%) |
| Health Technologists | 80 (13.8%) | 499 (86.2%) |
| Total (Category) | 3,293 (45.8%) | 3,901 (54.2%) |
| Total (Overall) | 11,252 (54.0%) | 9,581 (46.0%) |
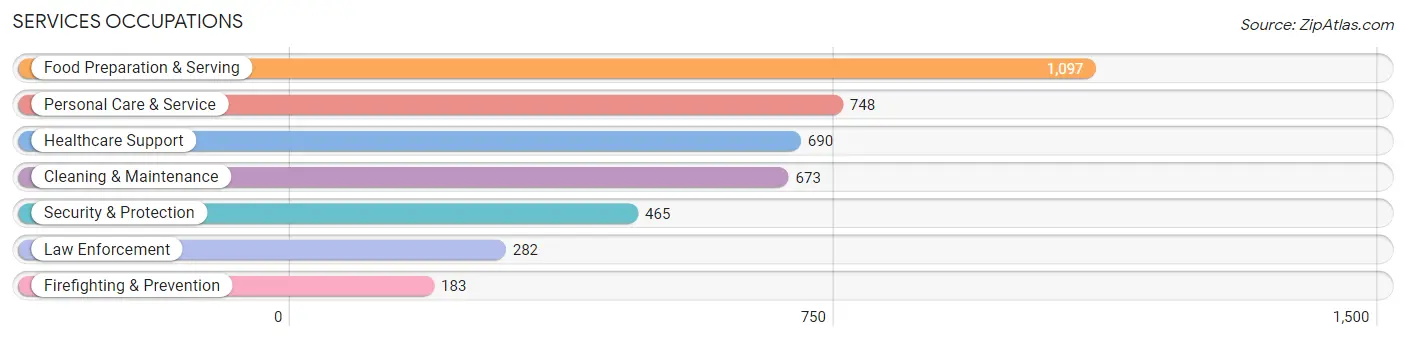
Services Occupations
The most common Services occupations in Erath County are Food Preparation & Serving (1,097 | 5.3%), Personal Care & Service (748 | 3.6%), Healthcare Support (690 | 3.3%), Cleaning & Maintenance (673 | 3.2%), and Security & Protection (465 | 2.2%).
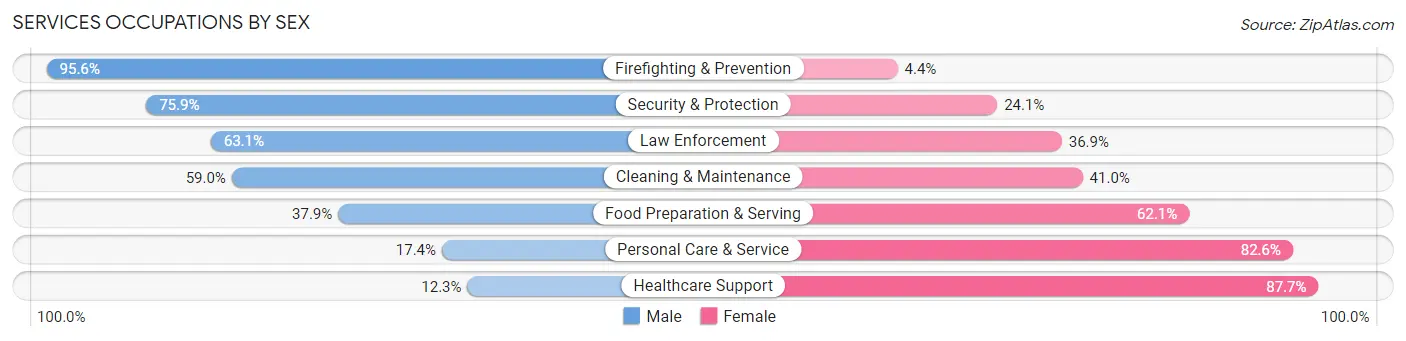
Services Occupations by Sex
Within the Services occupations in Erath County, the most male-oriented occupations are Firefighting & Prevention (95.6%), Security & Protection (75.9%), and Law Enforcement (63.1%), while the most female-oriented occupations are Healthcare Support (87.7%), Personal Care & Service (82.6%), and Food Preparation & Serving (62.1%).
| Occupation | Male | Female |
| Healthcare Support | 85 (12.3%) | 605 (87.7%) |
| Security & Protection | 353 (75.9%) | 112 (24.1%) |
| Firefighting & Prevention | 175 (95.6%) | 8 (4.4%) |
| Law Enforcement | 178 (63.1%) | 104 (36.9%) |
| Food Preparation & Serving | 416 (37.9%) | 681 (62.1%) |
| Cleaning & Maintenance | 397 (59.0%) | 276 (41.0%) |
| Personal Care & Service | 130 (17.4%) | 618 (82.6%) |
| Total (Category) | 1,381 (37.6%) | 2,292 (62.4%) |
| Total (Overall) | 11,252 (54.0%) | 9,581 (46.0%) |
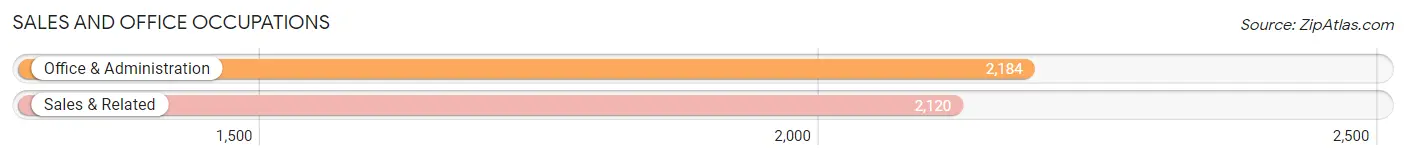
Sales and Office Occupations
The most common Sales and Office occupations in Erath County are Office & Administration (2,184 | 10.5%), and Sales & Related (2,120 | 10.2%).
Sales and Office Occupations by Sex
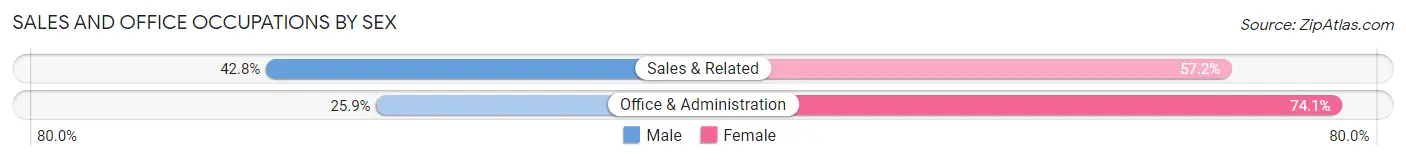
| Occupation | Male | Female |
| Sales & Related | 908 (42.8%) | 1,212 (57.2%) |
| Office & Administration | 565 (25.9%) | 1,619 (74.1%) |
| Total (Category) | 1,473 (34.2%) | 2,831 (65.8%) |
| Total (Overall) | 11,252 (54.0%) | 9,581 (46.0%) |
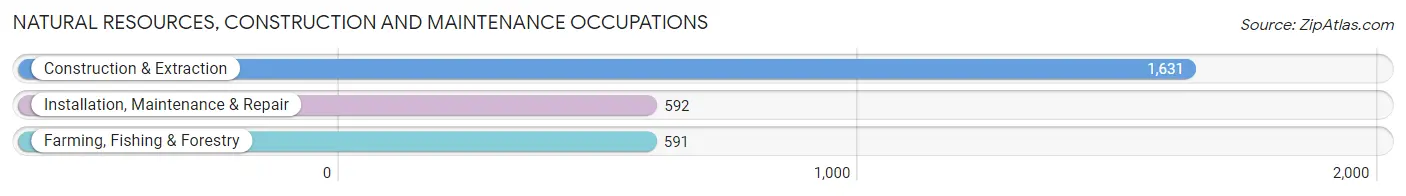
Natural Resources, Construction and Maintenance Occupations
The most common Natural Resources, Construction and Maintenance occupations in Erath County are Construction & Extraction (1,631 | 7.8%), Installation, Maintenance & Repair (592 | 2.8%), and Farming, Fishing & Forestry (591 | 2.8%).
Natural Resources, Construction and Maintenance Occupations by Sex
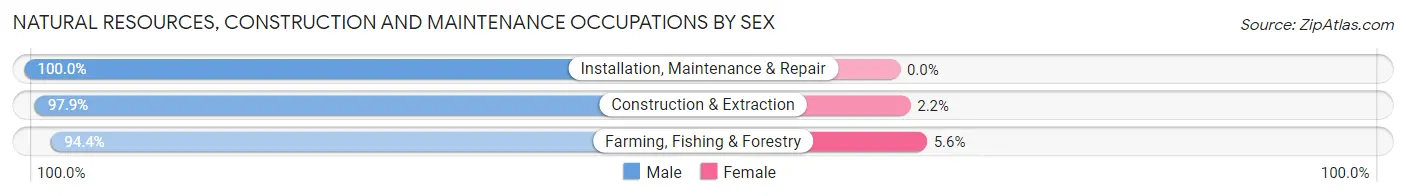
| Occupation | Male | Female |
| Farming, Fishing & Forestry | 558 (94.4%) | 33 (5.6%) |
| Construction & Extraction | 1,596 (97.9%) | 35 (2.1%) |
| Installation, Maintenance & Repair | 592 (100.0%) | 0 (0.0%) |
| Total (Category) | 2,746 (97.6%) | 68 (2.4%) |
| Total (Overall) | 11,252 (54.0%) | 9,581 (46.0%) |
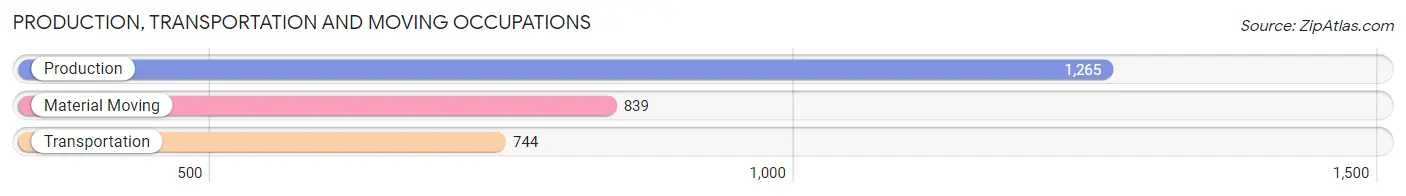
Production, Transportation and Moving Occupations
The most common Production, Transportation and Moving occupations in Erath County are Production (1,265 | 6.1%), Material Moving (839 | 4.0%), and Transportation (744 | 3.6%).
Production, Transportation and Moving Occupations by Sex
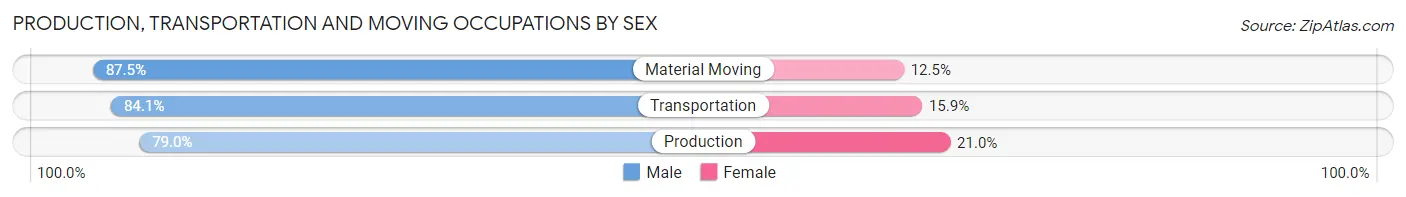
| Occupation | Male | Female |
| Production | 999 (79.0%) | 266 (21.0%) |
| Transportation | 626 (84.1%) | 118 (15.9%) |
| Material Moving | 734 (87.5%) | 105 (12.5%) |
| Total (Category) | 2,359 (82.8%) | 489 (17.2%) |
| Total (Overall) | 11,252 (54.0%) | 9,581 (46.0%) |
Employment Industries by Sex in Erath County
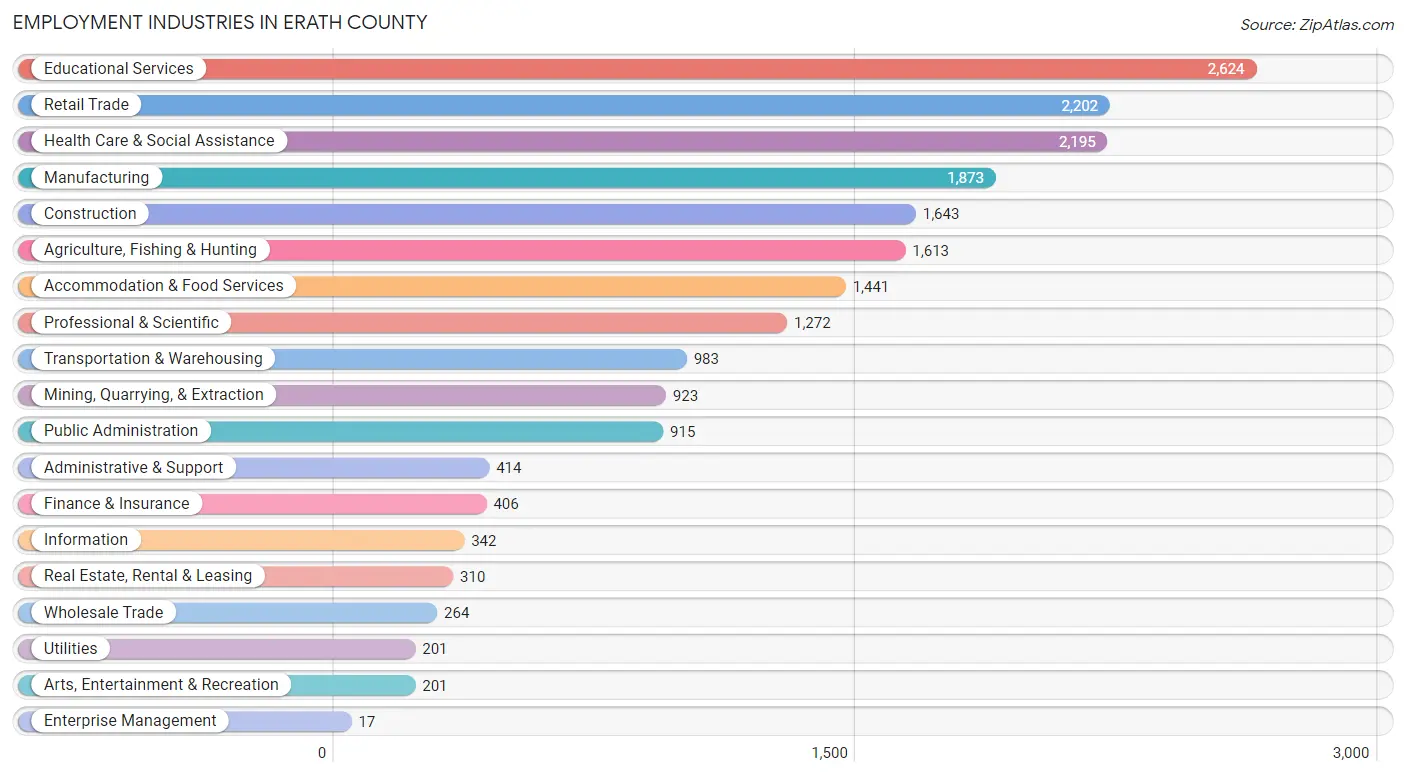
Employment Industries in Erath County
The major employment industries in Erath County include Educational Services (2,624 | 12.6%), Retail Trade (2,202 | 10.6%), Health Care & Social Assistance (2,195 | 10.5%), Manufacturing (1,873 | 9.0%), and Construction (1,643 | 7.9%).
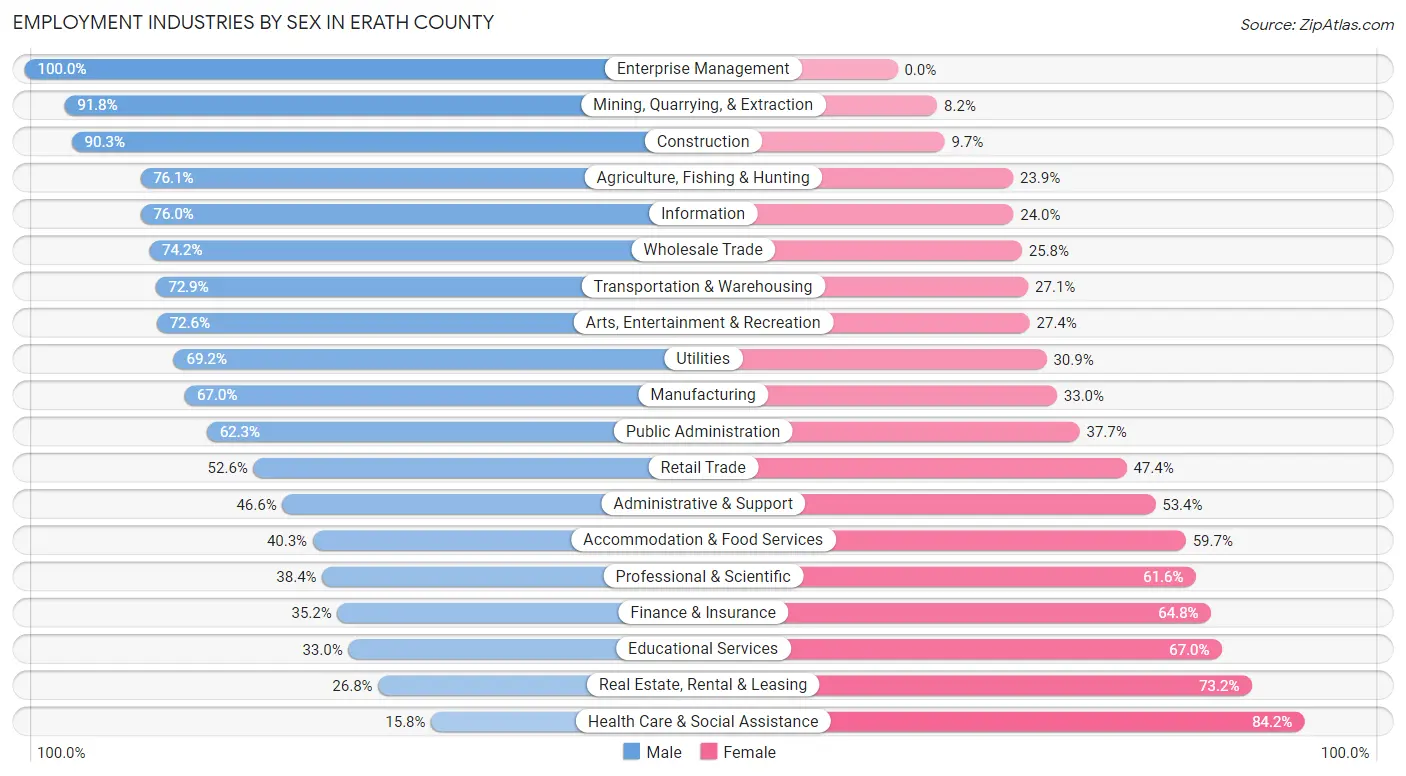
Employment Industries by Sex in Erath County
The Erath County industries that see more men than women are Enterprise Management (100.0%), Mining, Quarrying, & Extraction (91.8%), and Construction (90.3%), whereas the industries that tend to have a higher number of women are Health Care & Social Assistance (84.2%), Real Estate, Rental & Leasing (73.2%), and Educational Services (67.0%).
| Industry | Male | Female |
| Agriculture, Fishing & Hunting | 1,227 (76.1%) | 386 (23.9%) |
| Mining, Quarrying, & Extraction | 847 (91.8%) | 76 (8.2%) |
| Construction | 1,483 (90.3%) | 160 (9.7%) |
| Manufacturing | 1,255 (67.0%) | 618 (33.0%) |
| Wholesale Trade | 196 (74.2%) | 68 (25.8%) |
| Retail Trade | 1,158 (52.6%) | 1,044 (47.4%) |
| Transportation & Warehousing | 717 (72.9%) | 266 (27.1%) |
| Utilities | 139 (69.2%) | 62 (30.8%) |
| Information | 260 (76.0%) | 82 (24.0%) |
| Finance & Insurance | 143 (35.2%) | 263 (64.8%) |
| Real Estate, Rental & Leasing | 83 (26.8%) | 227 (73.2%) |
| Professional & Scientific | 488 (38.4%) | 784 (61.6%) |
| Enterprise Management | 17 (100.0%) | 0 (0.0%) |
| Administrative & Support | 193 (46.6%) | 221 (53.4%) |
| Educational Services | 865 (33.0%) | 1,759 (67.0%) |
| Health Care & Social Assistance | 347 (15.8%) | 1,848 (84.2%) |
| Arts, Entertainment & Recreation | 146 (72.6%) | 55 (27.4%) |
| Accommodation & Food Services | 581 (40.3%) | 860 (59.7%) |
| Public Administration | 570 (62.3%) | 345 (37.7%) |
| Total | 11,252 (54.0%) | 9,581 (46.0%) |
Education in Erath County
School Enrollment in Erath County
The most common levels of schooling among the 13,653 students in Erath County are college / undergraduate (6,225 | 45.6%), elementary school (2,159 | 15.8%), and high school (2,140 | 15.7%).
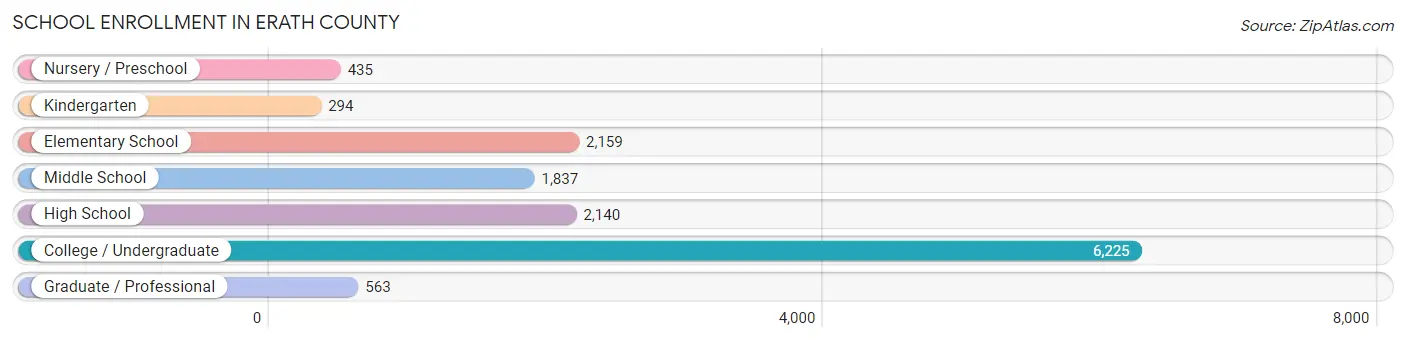
| School Level | # Students | % Students |
| Nursery / Preschool | 435 | 3.2% |
| Kindergarten | 294 | 2.1% |
| Elementary School | 2,159 | 15.8% |
| Middle School | 1,837 | 13.5% |
| High School | 2,140 | 15.7% |
| College / Undergraduate | 6,225 | 45.6% |
| Graduate / Professional | 563 | 4.1% |
| Total | 13,653 | 100.0% |
School Enrollment by Age by Funding Source in Erath County
Out of a total of 13,653 students who are enrolled in schools in Erath County, 915 (6.7%) attend a private institution, while the remaining 12,738 (93.3%) are enrolled in public schools. The age group of 3 to 4 year olds has the highest likelihood of being enrolled in private schools, with 121 (37.8% in the age bracket) enrolled. Conversely, the age group of 20 to 24 year olds has the lowest likelihood of being enrolled in a private school, with 3,679 (97.4% in the age bracket) attending a public institution.
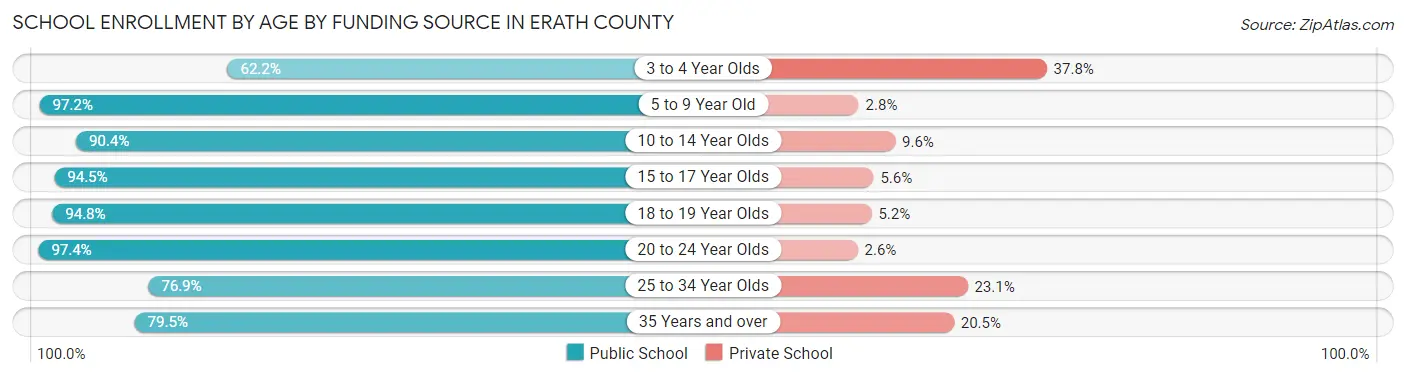
| Age Bracket | Public School | Private School |
| 3 to 4 Year Olds | 199 (62.2%) | 121 (37.8%) |
| 5 to 9 Year Old | 2,298 (97.2%) | 66 (2.8%) |
| 10 to 14 Year Olds | 1,991 (90.4%) | 211 (9.6%) |
| 15 to 17 Year Olds | 1,311 (94.5%) | 77 (5.6%) |
| 18 to 19 Year Olds | 2,581 (94.8%) | 141 (5.2%) |
| 20 to 24 Year Olds | 3,679 (97.4%) | 98 (2.6%) |
| 25 to 34 Year Olds | 437 (76.9%) | 131 (23.1%) |
| 35 Years and over | 248 (79.5%) | 64 (20.5%) |
| Total | 12,738 (93.3%) | 915 (6.7%) |
Educational Attainment by Field of Study in Erath County
Business (1,687 | 19.8%), bio, nature & agricultural (1,322 | 15.5%), education (1,274 | 14.9%), arts & humanities (685 | 8.0%), and science & technology (661 | 7.7%) are the most common fields of study among 8,533 individuals in Erath County who have obtained a bachelor's degree or higher.
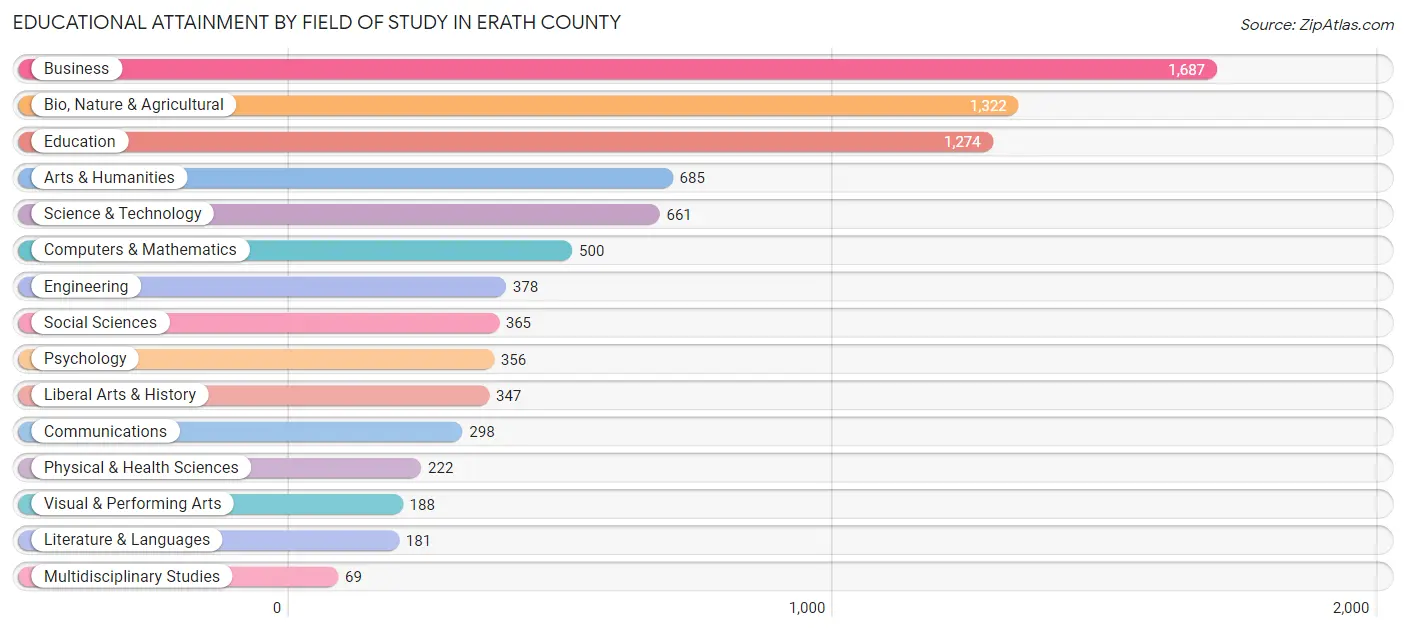
| Field of Study | # Graduates | % Graduates |
| Computers & Mathematics | 500 | 5.9% |
| Bio, Nature & Agricultural | 1,322 | 15.5% |
| Physical & Health Sciences | 222 | 2.6% |
| Psychology | 356 | 4.2% |
| Social Sciences | 365 | 4.3% |
| Engineering | 378 | 4.4% |
| Multidisciplinary Studies | 69 | 0.8% |
| Science & Technology | 661 | 7.7% |
| Business | 1,687 | 19.8% |
| Education | 1,274 | 14.9% |
| Literature & Languages | 181 | 2.1% |
| Liberal Arts & History | 347 | 4.1% |
| Visual & Performing Arts | 188 | 2.2% |
| Communications | 298 | 3.5% |
| Arts & Humanities | 685 | 8.0% |
| Total | 8,533 | 100.0% |
Transportation & Commute in Erath County
Vehicle Availability by Sex in Erath County
The most prevalent vehicle ownership categories in Erath County are males with 2 vehicles (4,781, accounting for 44.5%) and females with 2 vehicles (3,845, making up 54.1%).
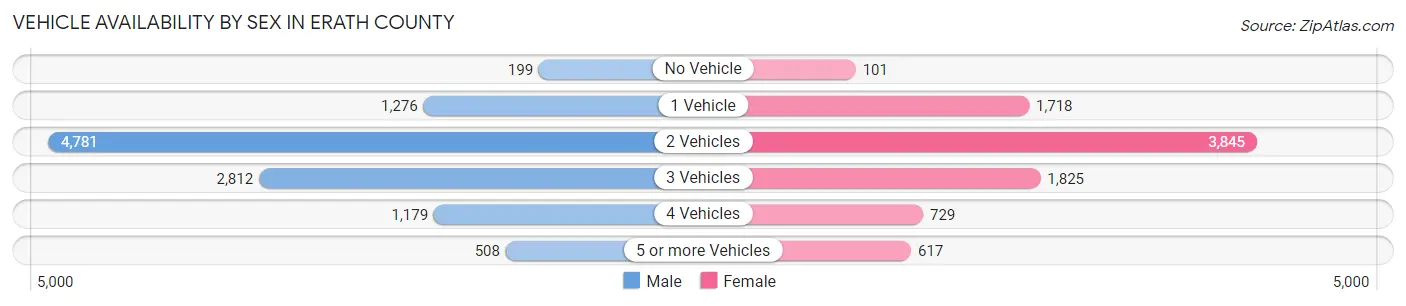
| Vehicles Available | Male | Female |
| No Vehicle | 199 (1.8%) | 101 (1.1%) |
| 1 Vehicle | 1,276 (11.9%) | 1,718 (19.5%) |
| 2 Vehicles | 4,781 (44.5%) | 3,845 (43.5%) |
| 3 Vehicles | 2,812 (26.2%) | 1,825 (20.7%) |
| 4 Vehicles | 1,179 (11.0%) | 729 (8.3%) |
| 5 or more Vehicles | 508 (4.7%) | 617 (7.0%) |
| Total | 10,755 (100.0%) | 8,835 (100.0%) |
Commute Time in Erath County
The most frequently occuring commute durations in Erath County are 10 to 14 minutes (4,643 commuters, 24.4%), 5 to 9 minutes (4,162 commuters, 21.9%), and 20 to 24 minutes (2,154 commuters, 11.3%).
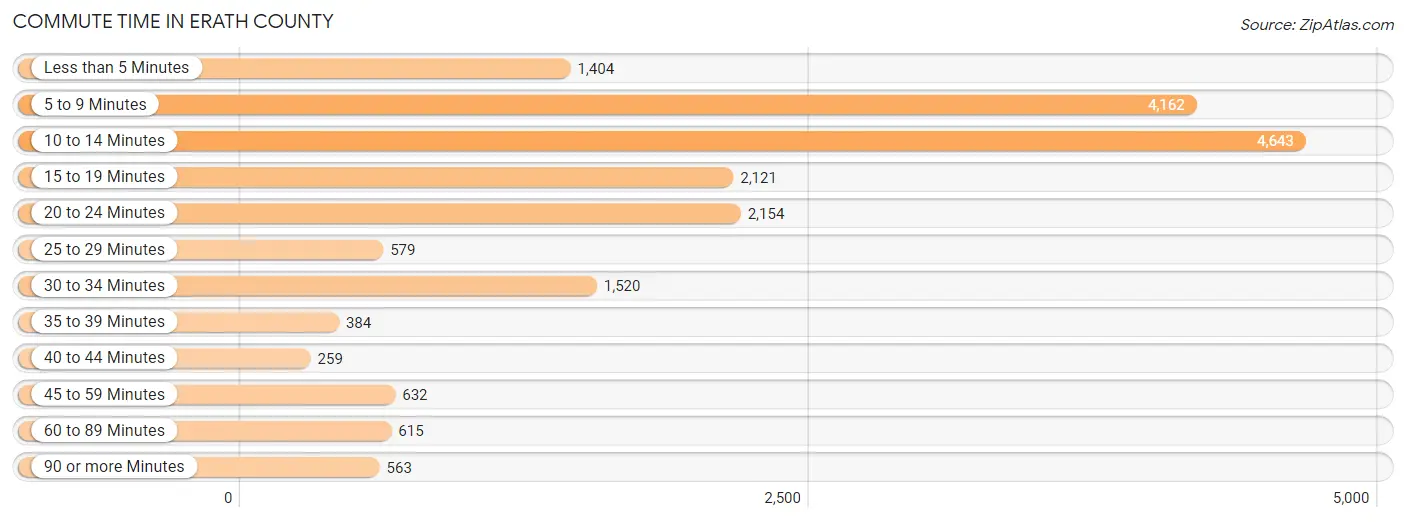
| Commute Time | # Commuters | % Commuters |
| Less than 5 Minutes | 1,404 | 7.4% |
| 5 to 9 Minutes | 4,162 | 21.9% |
| 10 to 14 Minutes | 4,643 | 24.4% |
| 15 to 19 Minutes | 2,121 | 11.1% |
| 20 to 24 Minutes | 2,154 | 11.3% |
| 25 to 29 Minutes | 579 | 3.0% |
| 30 to 34 Minutes | 1,520 | 8.0% |
| 35 to 39 Minutes | 384 | 2.0% |
| 40 to 44 Minutes | 259 | 1.4% |
| 45 to 59 Minutes | 632 | 3.3% |
| 60 to 89 Minutes | 615 | 3.2% |
| 90 or more Minutes | 563 | 3.0% |
Commute Time by Sex in Erath County
The most common commute times in Erath County are 10 to 14 minutes (2,720 commuters, 26.0%) for males and 5 to 9 minutes (2,092 commuters, 24.4%) for females.
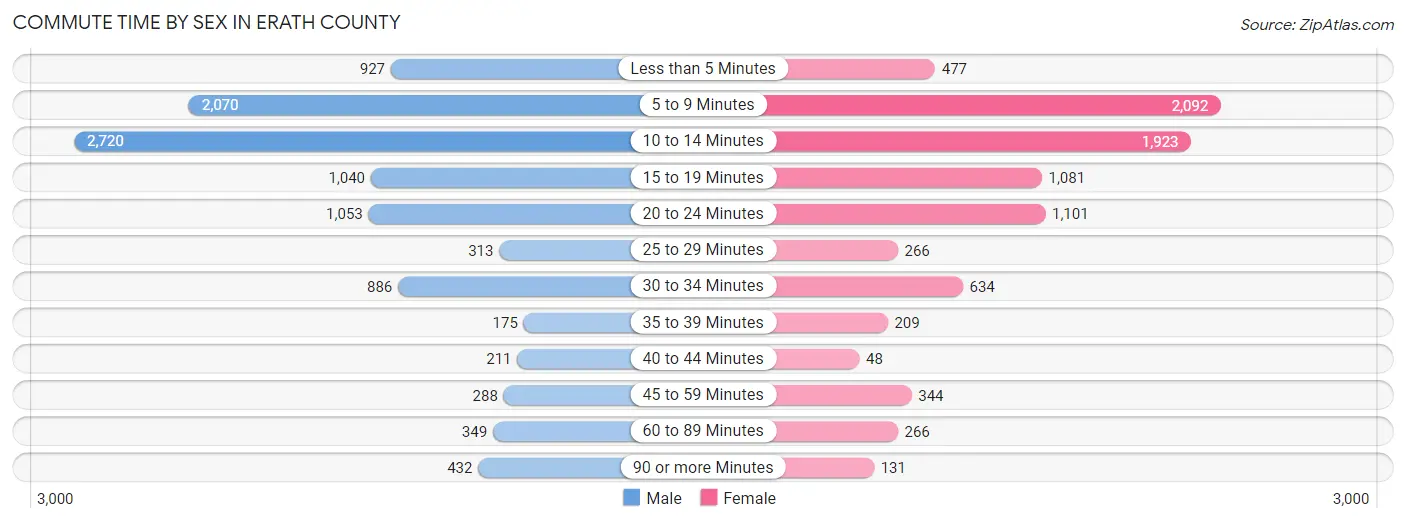
| Commute Time | Male | Female |
| Less than 5 Minutes | 927 (8.9%) | 477 (5.6%) |
| 5 to 9 Minutes | 2,070 (19.8%) | 2,092 (24.4%) |
| 10 to 14 Minutes | 2,720 (26.0%) | 1,923 (22.4%) |
| 15 to 19 Minutes | 1,040 (9.9%) | 1,081 (12.6%) |
| 20 to 24 Minutes | 1,053 (10.1%) | 1,101 (12.8%) |
| 25 to 29 Minutes | 313 (3.0%) | 266 (3.1%) |
| 30 to 34 Minutes | 886 (8.5%) | 634 (7.4%) |
| 35 to 39 Minutes | 175 (1.7%) | 209 (2.4%) |
| 40 to 44 Minutes | 211 (2.0%) | 48 (0.6%) |
| 45 to 59 Minutes | 288 (2.8%) | 344 (4.0%) |
| 60 to 89 Minutes | 349 (3.3%) | 266 (3.1%) |
| 90 or more Minutes | 432 (4.1%) | 131 (1.5%) |
Time of Departure to Work by Sex in Erath County
The most frequent times of departure to work in Erath County are 7:00 AM to 7:29 AM (1,299, 12.4%) for males and 7:30 AM to 7:59 AM (1,929, 22.5%) for females.
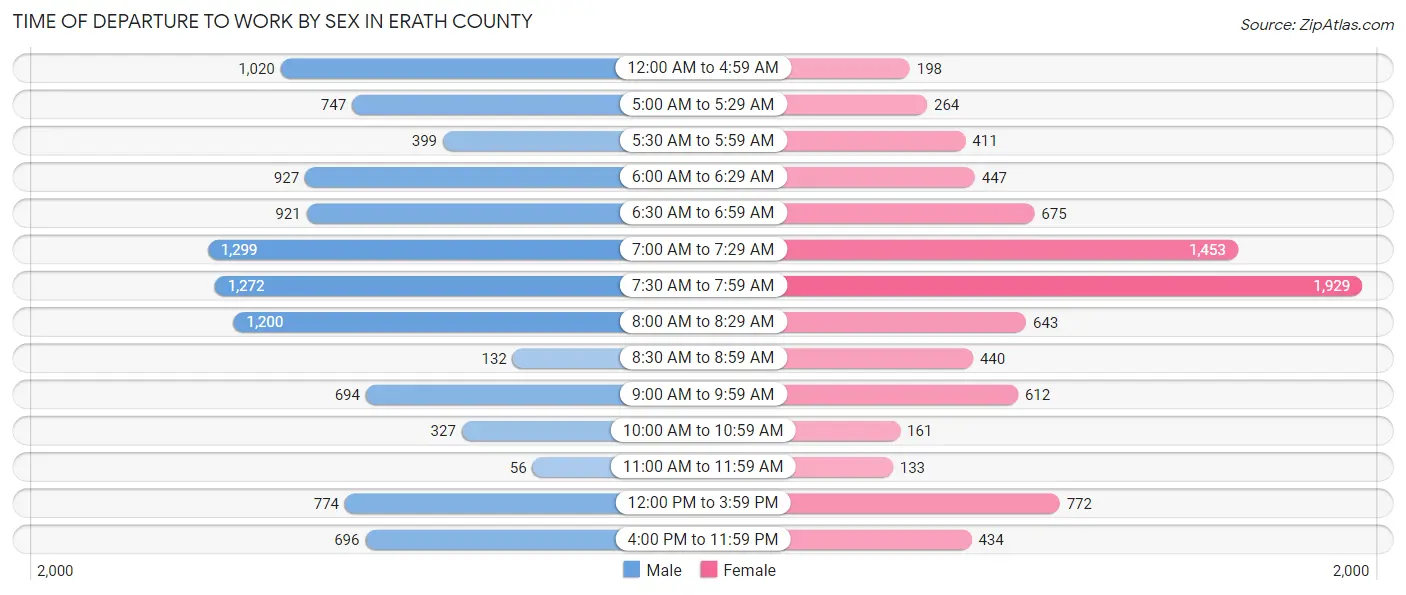
| Time of Departure | Male | Female |
| 12:00 AM to 4:59 AM | 1,020 (9.8%) | 198 (2.3%) |
| 5:00 AM to 5:29 AM | 747 (7.1%) | 264 (3.1%) |
| 5:30 AM to 5:59 AM | 399 (3.8%) | 411 (4.8%) |
| 6:00 AM to 6:29 AM | 927 (8.9%) | 447 (5.2%) |
| 6:30 AM to 6:59 AM | 921 (8.8%) | 675 (7.9%) |
| 7:00 AM to 7:29 AM | 1,299 (12.4%) | 1,453 (17.0%) |
| 7:30 AM to 7:59 AM | 1,272 (12.2%) | 1,929 (22.5%) |
| 8:00 AM to 8:29 AM | 1,200 (11.5%) | 643 (7.5%) |
| 8:30 AM to 8:59 AM | 132 (1.3%) | 440 (5.1%) |
| 9:00 AM to 9:59 AM | 694 (6.6%) | 612 (7.1%) |
| 10:00 AM to 10:59 AM | 327 (3.1%) | 161 (1.9%) |
| 11:00 AM to 11:59 AM | 56 (0.5%) | 133 (1.5%) |
| 12:00 PM to 3:59 PM | 774 (7.4%) | 772 (9.0%) |
| 4:00 PM to 11:59 PM | 696 (6.7%) | 434 (5.1%) |
| Total | 10,464 (100.0%) | 8,572 (100.0%) |
Housing Occupancy in Erath County
Occupancy by Ownership in Erath County
Of the total 16,007 dwellings in Erath County, owner-occupied units account for 10,124 (63.2%), while renter-occupied units make up 5,883 (36.7%).
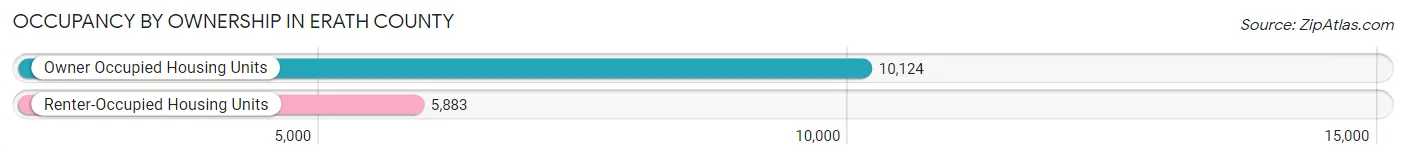
| Occupancy | # Housing Units | % Housing Units |
| Owner Occupied Housing Units | 10,124 | 63.2% |
| Renter-Occupied Housing Units | 5,883 | 36.7% |
| Total Occupied Housing Units | 16,007 | 100.0% |
Occupancy by Household Size in Erath County
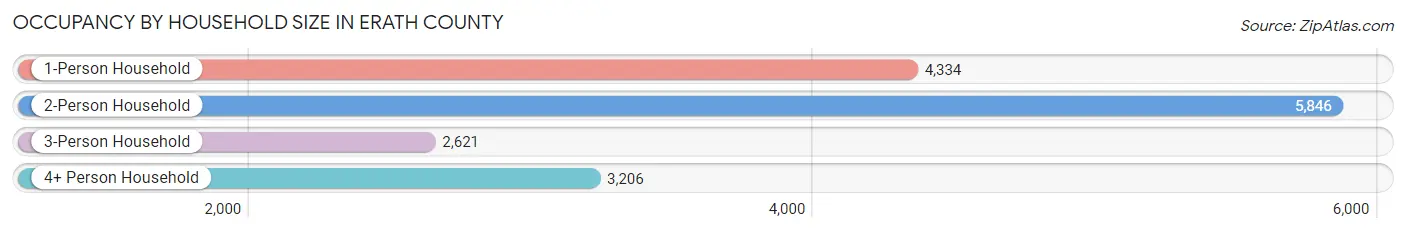
| Household Size | # Housing Units | % Housing Units |
| 1-Person Household | 4,334 | 27.1% |
| 2-Person Household | 5,846 | 36.5% |
| 3-Person Household | 2,621 | 16.4% |
| 4+ Person Household | 3,206 | 20.0% |
| Total Housing Units | 16,007 | 100.0% |
Occupancy by Ownership by Household Size in Erath County
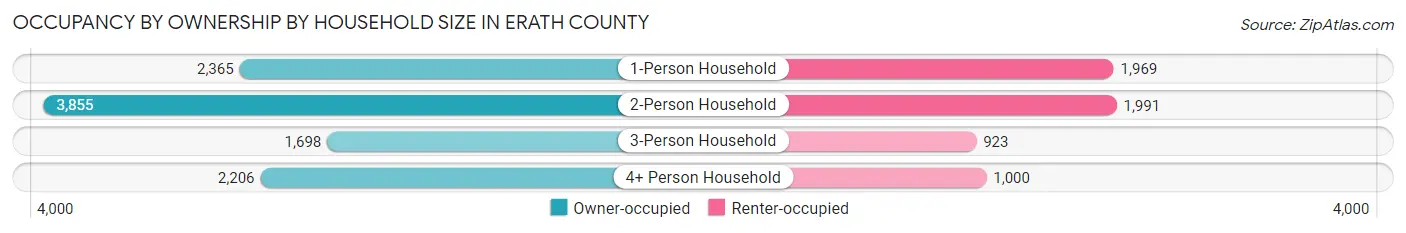
| Household Size | Owner-occupied | Renter-occupied |
| 1-Person Household | 2,365 (54.6%) | 1,969 (45.4%) |
| 2-Person Household | 3,855 (65.9%) | 1,991 (34.1%) |
| 3-Person Household | 1,698 (64.8%) | 923 (35.2%) |
| 4+ Person Household | 2,206 (68.8%) | 1,000 (31.2%) |
| Total Housing Units | 10,124 (63.2%) | 5,883 (36.7%) |
Occupancy by Educational Attainment in Erath County
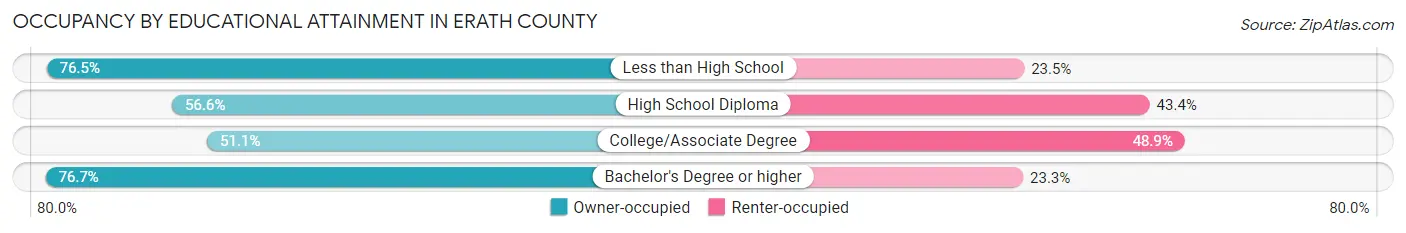
| Household Size | Owner-occupied | Renter-occupied |
| Less than High School | 1,310 (76.5%) | 402 (23.5%) |
| High School Diploma | 2,137 (56.6%) | 1,637 (43.4%) |
| College/Associate Degree | 2,772 (51.1%) | 2,657 (48.9%) |
| Bachelor's Degree or higher | 3,905 (76.7%) | 1,187 (23.3%) |
Occupancy by Age of Householder in Erath County
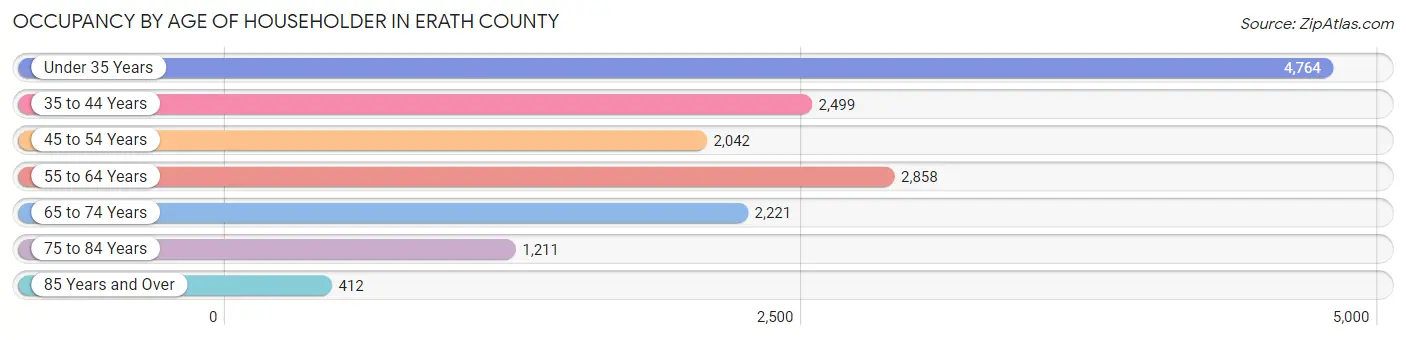
| Age Bracket | # Households | % Households |
| Under 35 Years | 4,764 | 29.8% |
| 35 to 44 Years | 2,499 | 15.6% |
| 45 to 54 Years | 2,042 | 12.8% |
| 55 to 64 Years | 2,858 | 17.8% |
| 65 to 74 Years | 2,221 | 13.9% |
| 75 to 84 Years | 1,211 | 7.6% |
| 85 Years and Over | 412 | 2.6% |
| Total | 16,007 | 100.0% |
Housing Finances in Erath County
Median Income by Occupancy in Erath County
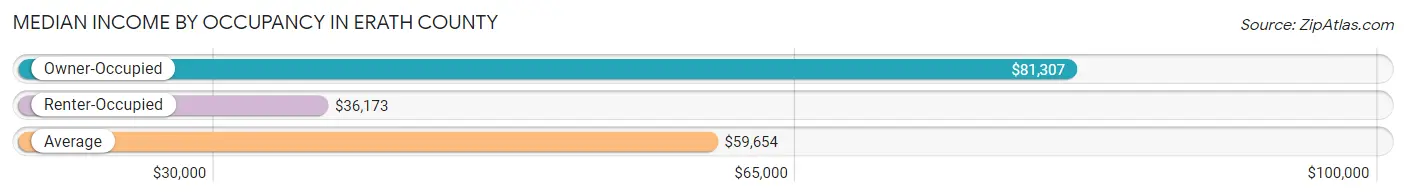
| Occupancy Type | # Households | Median Income |
| Owner-Occupied | 10,124 (63.2%) | $81,307 |
| Renter-Occupied | 5,883 (36.7%) | $36,173 |
| Average | 16,007 (100.0%) | $59,654 |
Occupancy by Householder Income Bracket in Erath County
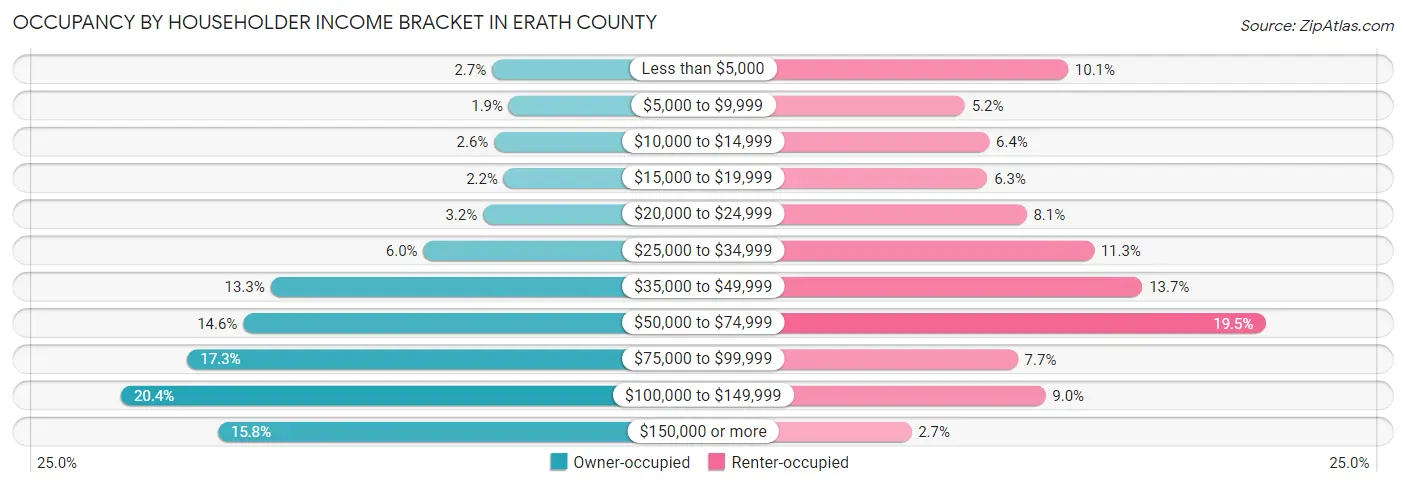
| Income Bracket | Owner-occupied | Renter-occupied |
| Less than $5,000 | 277 (2.7%) | 595 (10.1%) |
| $5,000 to $9,999 | 196 (1.9%) | 306 (5.2%) |
| $10,000 to $14,999 | 267 (2.6%) | 374 (6.4%) |
| $15,000 to $19,999 | 221 (2.2%) | 369 (6.3%) |
| $20,000 to $24,999 | 321 (3.2%) | 479 (8.1%) |
| $25,000 to $34,999 | 608 (6.0%) | 667 (11.3%) |
| $35,000 to $49,999 | 1,345 (13.3%) | 803 (13.7%) |
| $50,000 to $74,999 | 1,477 (14.6%) | 1,148 (19.5%) |
| $75,000 to $99,999 | 1,746 (17.2%) | 454 (7.7%) |
| $100,000 to $149,999 | 2,066 (20.4%) | 532 (9.0%) |
| $150,000 or more | 1,600 (15.8%) | 156 (2.6%) |
| Total | 10,124 (100.0%) | 5,883 (100.0%) |
Monthly Housing Cost Tiers in Erath County
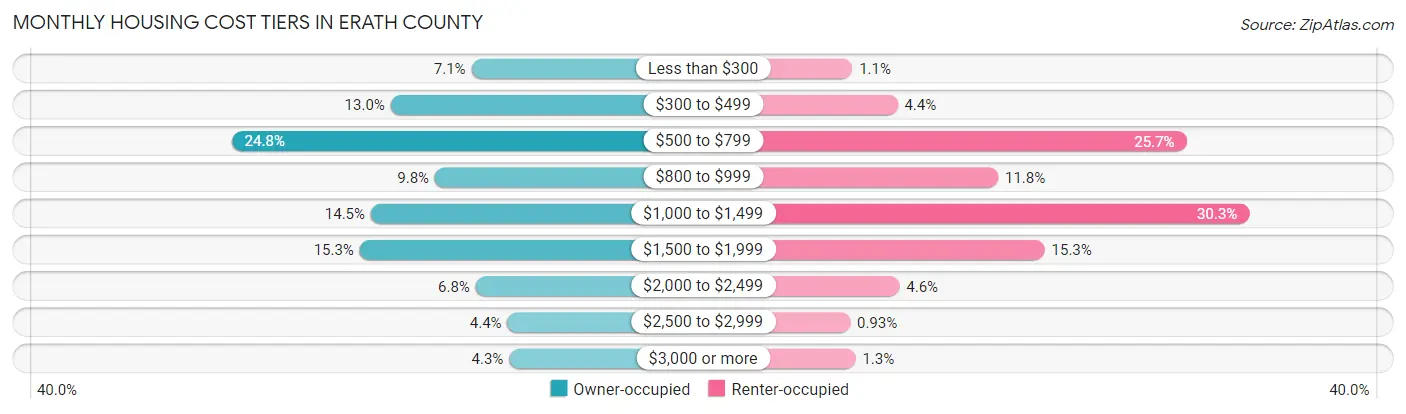
| Monthly Cost | Owner-occupied | Renter-occupied |
| Less than $300 | 718 (7.1%) | 64 (1.1%) |
| $300 to $499 | 1,320 (13.0%) | 260 (4.4%) |
| $500 to $799 | 2,506 (24.7%) | 1,512 (25.7%) |
| $800 to $999 | 990 (9.8%) | 696 (11.8%) |
| $1,000 to $1,499 | 1,468 (14.5%) | 1,784 (30.3%) |
| $1,500 to $1,999 | 1,551 (15.3%) | 898 (15.3%) |
| $2,000 to $2,499 | 686 (6.8%) | 268 (4.6%) |
| $2,500 to $2,999 | 449 (4.4%) | 55 (0.9%) |
| $3,000 or more | 436 (4.3%) | 78 (1.3%) |
| Total | 10,124 (100.0%) | 5,883 (100.0%) |
Physical Housing Characteristics in Erath County
Housing Structures in Erath County
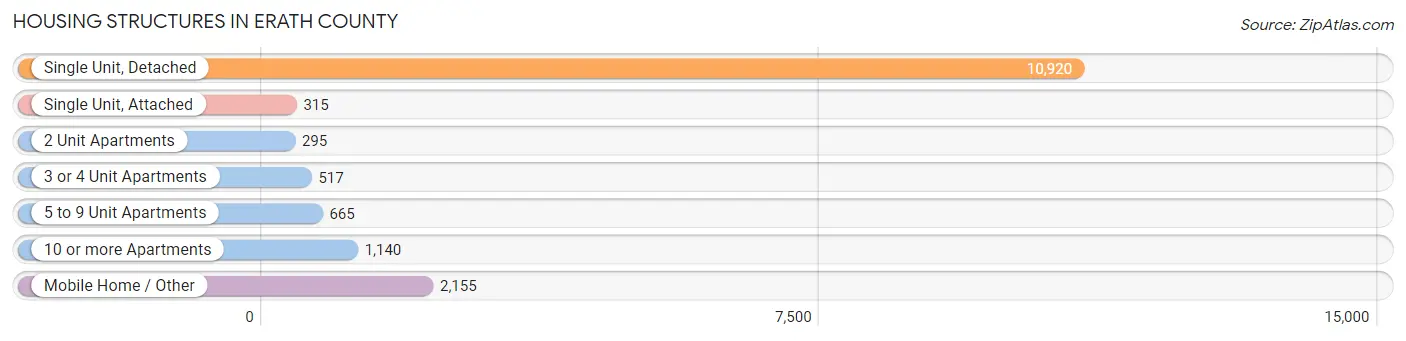
| Structure Type | # Housing Units | % Housing Units |
| Single Unit, Detached | 10,920 | 68.2% |
| Single Unit, Attached | 315 | 2.0% |
| 2 Unit Apartments | 295 | 1.8% |
| 3 or 4 Unit Apartments | 517 | 3.2% |
| 5 to 9 Unit Apartments | 665 | 4.2% |
| 10 or more Apartments | 1,140 | 7.1% |
| Mobile Home / Other | 2,155 | 13.5% |
| Total | 16,007 | 100.0% |
Housing Structures by Occupancy in Erath County
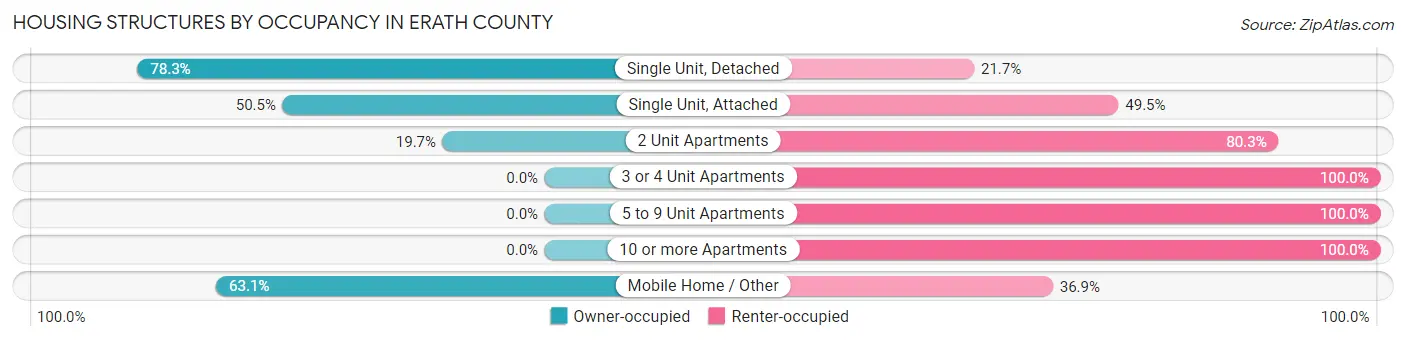
| Structure Type | Owner-occupied | Renter-occupied |
| Single Unit, Detached | 8,547 (78.3%) | 2,373 (21.7%) |
| Single Unit, Attached | 159 (50.5%) | 156 (49.5%) |
| 2 Unit Apartments | 58 (19.7%) | 237 (80.3%) |
| 3 or 4 Unit Apartments | 0 (0.0%) | 517 (100.0%) |
| 5 to 9 Unit Apartments | 0 (0.0%) | 665 (100.0%) |
| 10 or more Apartments | 0 (0.0%) | 1,140 (100.0%) |
| Mobile Home / Other | 1,360 (63.1%) | 795 (36.9%) |
| Total | 10,124 (63.2%) | 5,883 (36.7%) |
Housing Structures by Number of Rooms in Erath County
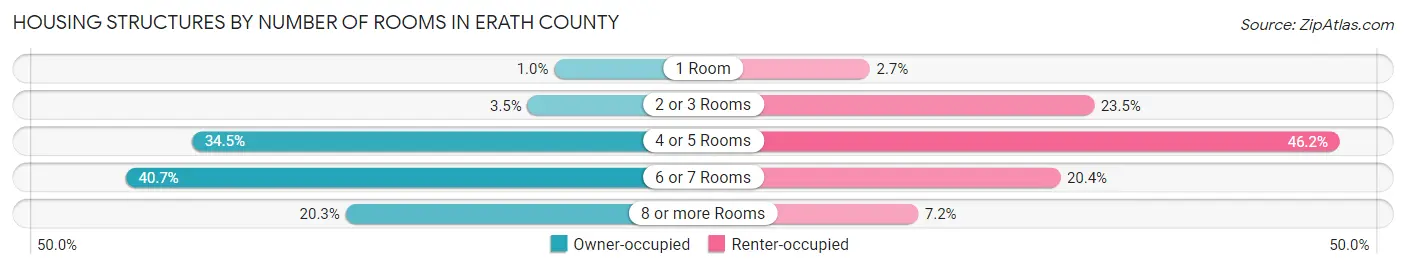
| Number of Rooms | Owner-occupied | Renter-occupied |
| 1 Room | 102 (1.0%) | 161 (2.7%) |
| 2 or 3 Rooms | 352 (3.5%) | 1,381 (23.5%) |
| 4 or 5 Rooms | 3,497 (34.5%) | 2,720 (46.2%) |
| 6 or 7 Rooms | 4,117 (40.7%) | 1,197 (20.3%) |
| 8 or more Rooms | 2,056 (20.3%) | 424 (7.2%) |
| Total | 10,124 (100.0%) | 5,883 (100.0%) |
Housing Structure by Heating Type in Erath County
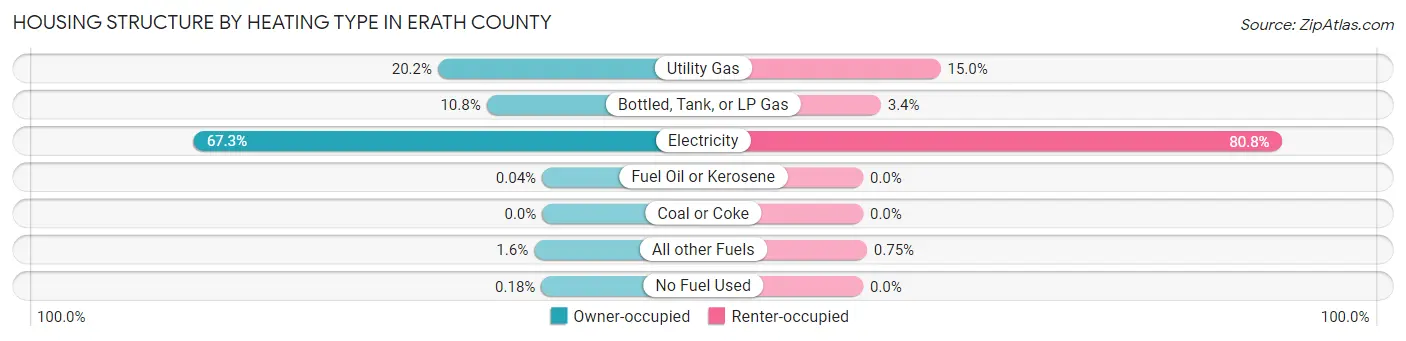
| Heating Type | Owner-occupied | Renter-occupied |
| Utility Gas | 2,041 (20.2%) | 881 (15.0%) |
| Bottled, Tank, or LP Gas | 1,088 (10.7%) | 202 (3.4%) |
| Electricity | 6,814 (67.3%) | 4,756 (80.8%) |
| Fuel Oil or Kerosene | 4 (0.0%) | 0 (0.0%) |
| Coal or Coke | 0 (0.0%) | 0 (0.0%) |
| All other Fuels | 159 (1.6%) | 44 (0.7%) |
| No Fuel Used | 18 (0.2%) | 0 (0.0%) |
| Total | 10,124 (100.0%) | 5,883 (100.0%) |
Household Vehicle Usage in Erath County
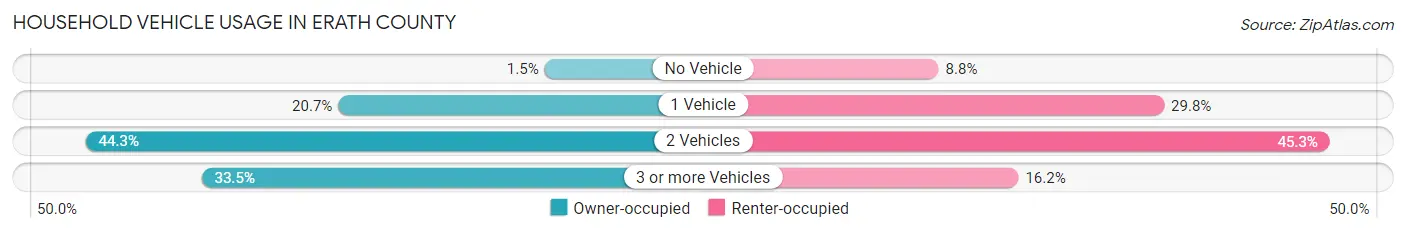
| Vehicles per Household | Owner-occupied | Renter-occupied |
| No Vehicle | 149 (1.5%) | 515 (8.7%) |
| 1 Vehicle | 2,099 (20.7%) | 1,753 (29.8%) |
| 2 Vehicles | 4,486 (44.3%) | 2,662 (45.3%) |
| 3 or more Vehicles | 3,390 (33.5%) | 953 (16.2%) |
| Total | 10,124 (100.0%) | 5,883 (100.0%) |
Real Estate & Mortgages in Erath County
Real Estate and Mortgage Overview in Erath County
| Characteristic | Without Mortgage | With Mortgage |
| Housing Units | 5,339 | 4,785 |
| Median Property Value | $205,500 | $237,500 |
| Median Household Income | $63,064 | $922 |
| Monthly Housing Costs | $590 | $423 |
| Real Estate Taxes | $2,351 | $252 |
Property Value by Mortgage Status in Erath County
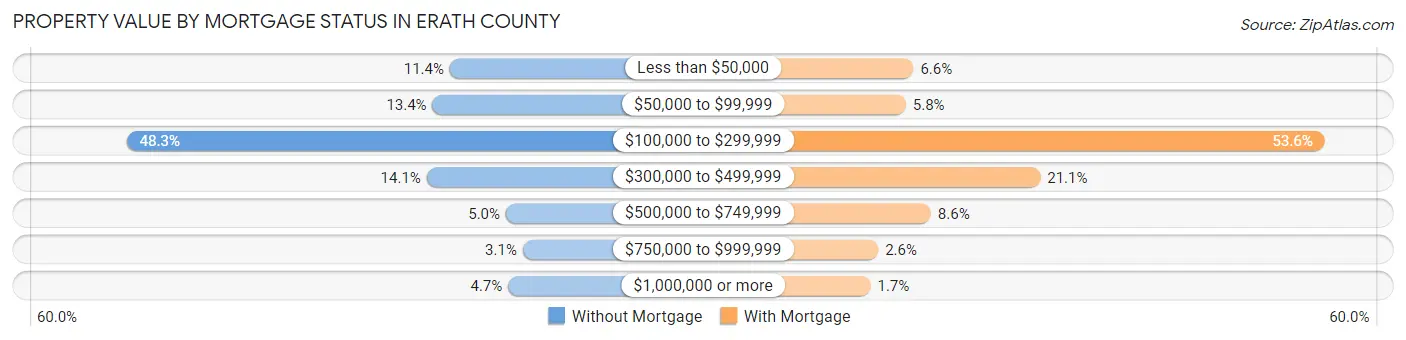
| Property Value | Without Mortgage | With Mortgage |
| Less than $50,000 | 609 (11.4%) | 317 (6.6%) |
| $50,000 to $99,999 | 715 (13.4%) | 275 (5.8%) |
| $100,000 to $299,999 | 2,581 (48.3%) | 2,565 (53.6%) |
| $300,000 to $499,999 | 750 (14.1%) | 1,010 (21.1%) |
| $500,000 to $749,999 | 267 (5.0%) | 412 (8.6%) |
| $750,000 to $999,999 | 164 (3.1%) | 124 (2.6%) |
| $1,000,000 or more | 253 (4.7%) | 82 (1.7%) |
| Total | 5,339 (100.0%) | 4,785 (100.0%) |
Household Income by Mortgage Status in Erath County
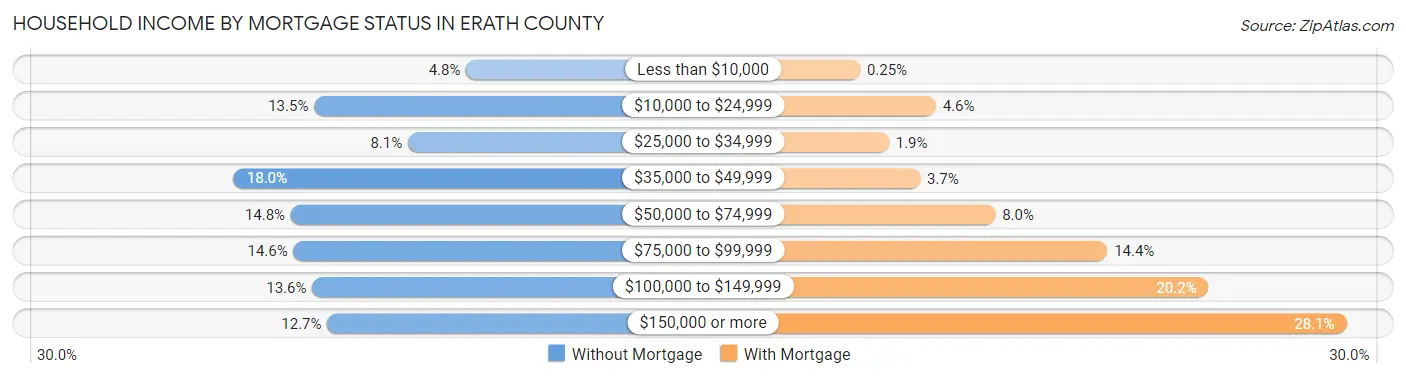
| Household Income | Without Mortgage | With Mortgage |
| Less than $10,000 | 254 (4.8%) | 12 (0.3%) |
| $10,000 to $24,999 | 718 (13.5%) | 219 (4.6%) |
| $25,000 to $34,999 | 432 (8.1%) | 91 (1.9%) |
| $35,000 to $49,999 | 963 (18.0%) | 176 (3.7%) |
| $50,000 to $74,999 | 789 (14.8%) | 382 (8.0%) |
| $75,000 to $99,999 | 781 (14.6%) | 688 (14.4%) |
| $100,000 to $149,999 | 724 (13.6%) | 965 (20.2%) |
| $150,000 or more | 678 (12.7%) | 1,342 (28.1%) |
| Total | 5,339 (100.0%) | 4,785 (100.0%) |
Property Value to Household Income Ratio in Erath County
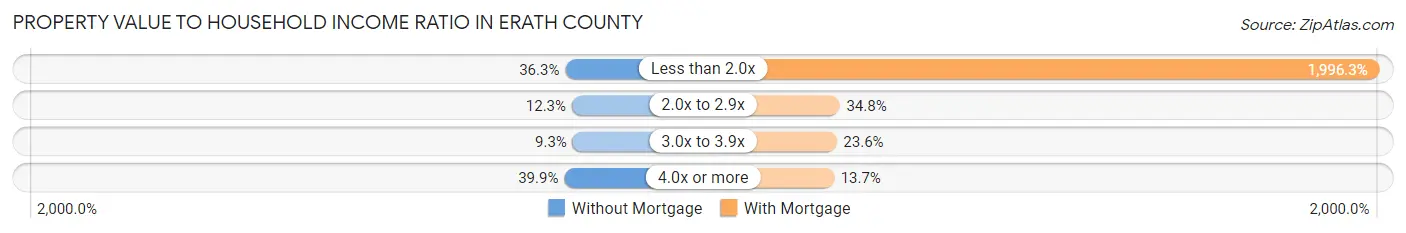
| Value-to-Income Ratio | Without Mortgage | With Mortgage |
| Less than 2.0x | 1,937 (36.3%) | 95,525 (1,996.3%) |
| 2.0x to 2.9x | 659 (12.3%) | 1,666 (34.8%) |
| 3.0x to 3.9x | 496 (9.3%) | 1,129 (23.6%) |
| 4.0x or more | 2,129 (39.9%) | 654 (13.7%) |
| Total | 5,339 (100.0%) | 4,785 (100.0%) |
Real Estate Taxes by Mortgage Status in Erath County
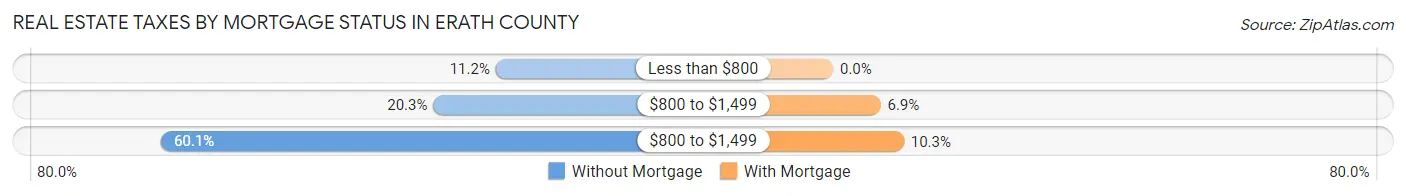
| Property Taxes | Without Mortgage | With Mortgage |
| Less than $800 | 596 (11.2%) | 0 (0.0%) |
| $800 to $1,499 | 1,083 (20.3%) | 332 (6.9%) |
| $800 to $1,499 | 3,207 (60.1%) | 495 (10.3%) |
| Total | 5,339 (100.0%) | 4,785 (100.0%) |
Health & Disability in Erath County
Health Insurance Coverage by Age in Erath County
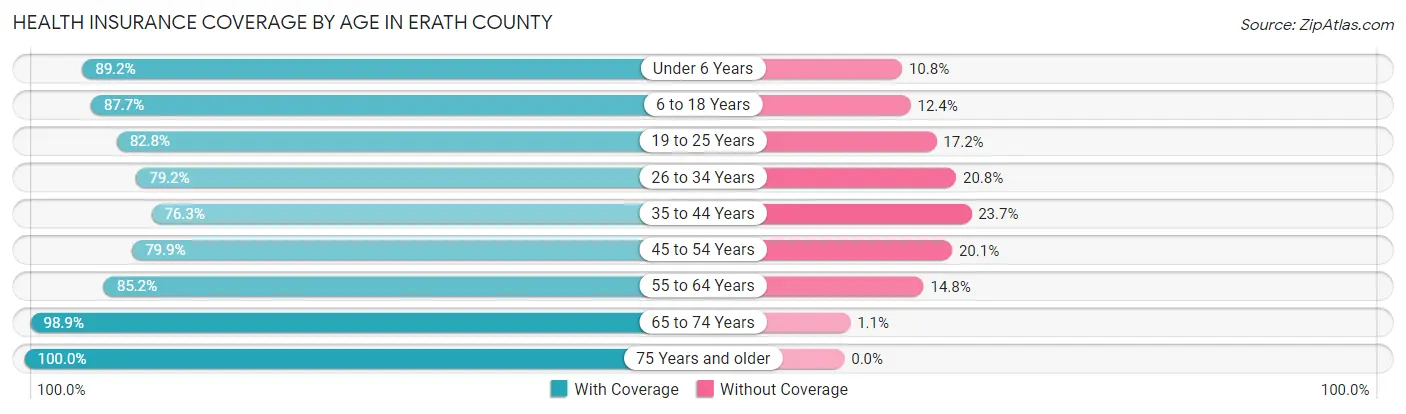
| Age Bracket | With Coverage | Without Coverage |
| Under 6 Years | 2,512 (89.2%) | 303 (10.8%) |
| 6 to 18 Years | 6,691 (87.6%) | 943 (12.3%) |
| 19 to 25 Years | 6,204 (82.8%) | 1,287 (17.2%) |
| 26 to 34 Years | 3,977 (79.2%) | 1,047 (20.8%) |
| 35 to 44 Years | 3,548 (76.3%) | 1,100 (23.7%) |
| 45 to 54 Years | 3,348 (79.9%) | 841 (20.1%) |
| 55 to 64 Years | 4,052 (85.2%) | 703 (14.8%) |
| 65 to 74 Years | 3,473 (98.9%) | 39 (1.1%) |
| 75 Years and older | 2,237 (100.0%) | 0 (0.0%) |
| Total | 36,042 (85.2%) | 6,263 (14.8%) |
Health Insurance Coverage by Citizenship Status in Erath County
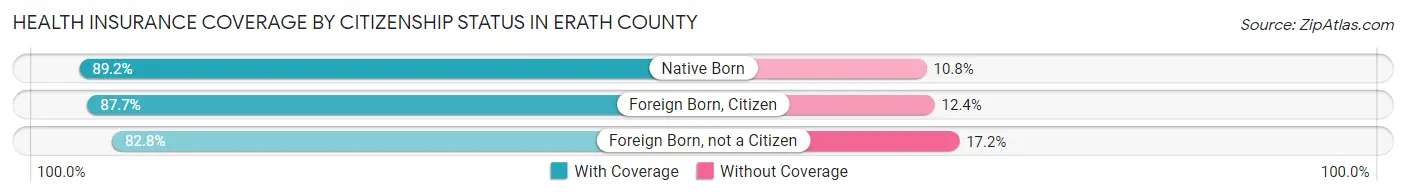
| Citizenship Status | With Coverage | Without Coverage |
| Native Born | 2,512 (89.2%) | 303 (10.8%) |
| Foreign Born, Citizen | 6,691 (87.6%) | 943 (12.3%) |
| Foreign Born, not a Citizen | 6,204 (82.8%) | 1,287 (17.2%) |
Health Insurance Coverage by Household Income in Erath County
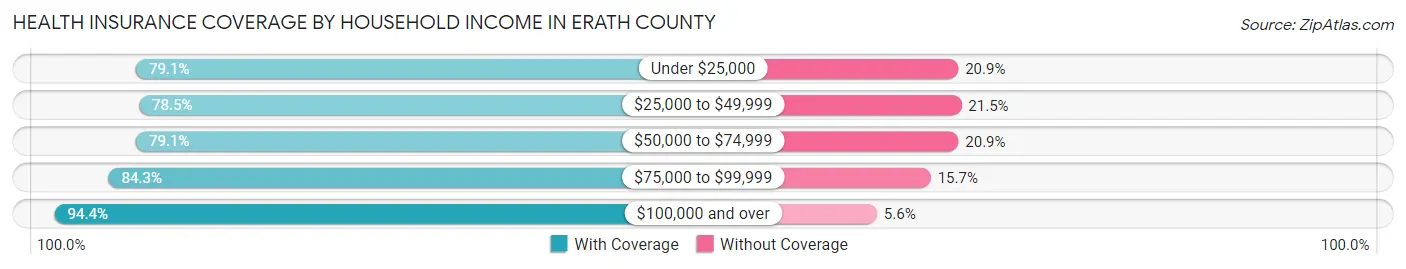
| Household Income | With Coverage | Without Coverage |
| Under $25,000 | 4,866 (79.1%) | 1,284 (20.9%) |
| $25,000 to $49,999 | 5,489 (78.5%) | 1,501 (21.5%) |
| $50,000 to $74,999 | 5,258 (79.1%) | 1,389 (20.9%) |
| $75,000 to $99,999 | 5,026 (84.3%) | 938 (15.7%) |
| $100,000 and over | 13,544 (94.4%) | 809 (5.6%) |
Public vs Private Health Insurance Coverage by Age in Erath County
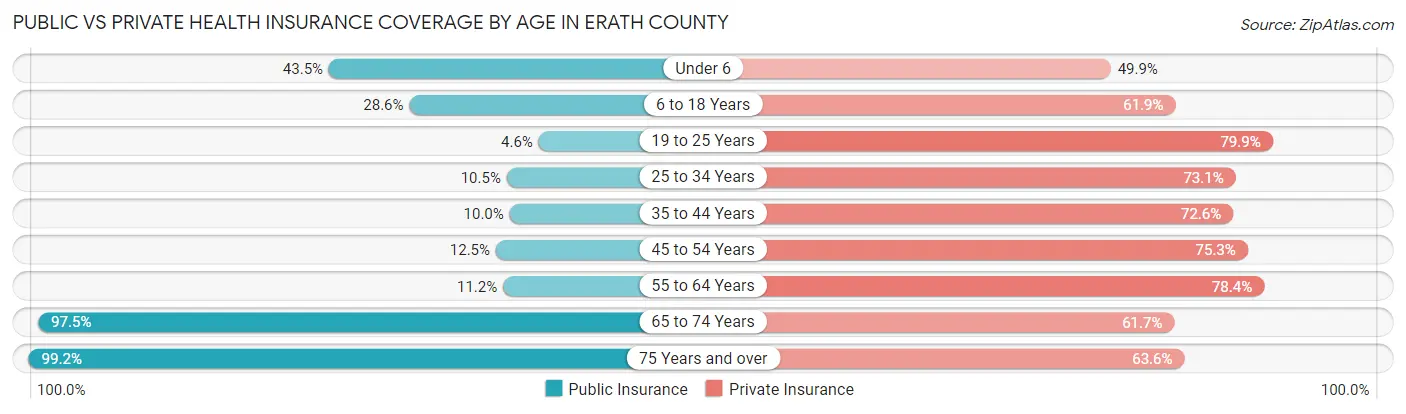
| Age Bracket | Public Insurance | Private Insurance |
| Under 6 | 1,225 (43.5%) | 1,405 (49.9%) |
| 6 to 18 Years | 2,182 (28.6%) | 4,726 (61.9%) |
| 19 to 25 Years | 343 (4.6%) | 5,988 (79.9%) |
| 25 to 34 Years | 528 (10.5%) | 3,671 (73.1%) |
| 35 to 44 Years | 464 (10.0%) | 3,375 (72.6%) |
| 45 to 54 Years | 525 (12.5%) | 3,155 (75.3%) |
| 55 to 64 Years | 532 (11.2%) | 3,726 (78.4%) |
| 65 to 74 Years | 3,424 (97.5%) | 2,167 (61.7%) |
| 75 Years and over | 2,220 (99.2%) | 1,422 (63.6%) |
| Total | 11,443 (27.1%) | 29,635 (70.1%) |
Disability Status by Sex by Age in Erath County
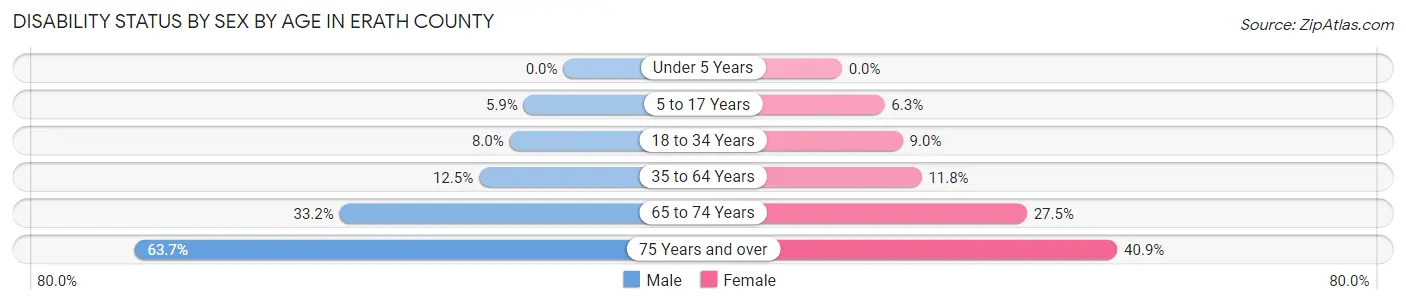
| Age Bracket | Male | Female |
| Under 5 Years | 0 (0.0%) | 0 (0.0%) |
| 5 to 17 Years | 190 (5.9%) | 194 (6.3%) |
| 18 to 34 Years | 549 (8.0%) | 662 (9.0%) |
| 35 to 64 Years | 852 (12.5%) | 804 (11.8%) |
| 65 to 74 Years | 550 (33.2%) | 510 (27.5%) |
| 75 Years and over | 624 (63.7%) | 514 (40.9%) |
Disability Class by Sex by Age in Erath County
Disability Class: Hearing Difficulty
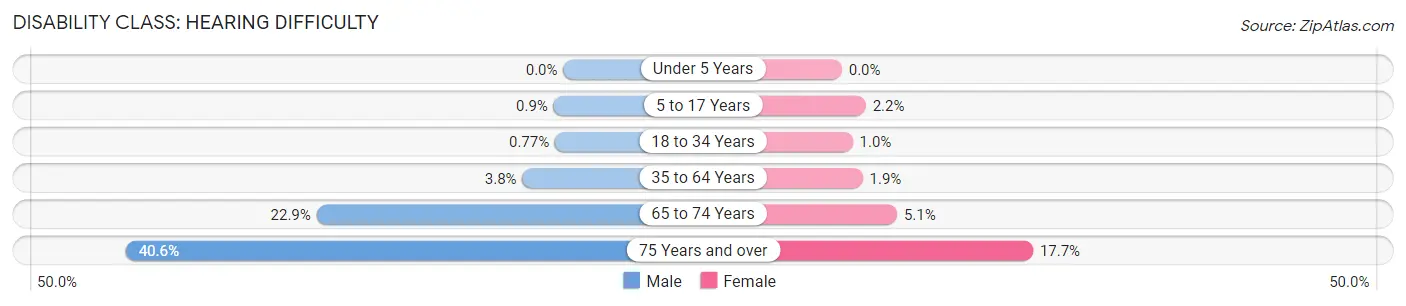
| Age Bracket | Male | Female |
| Under 5 Years | 0 (0.0%) | 0 (0.0%) |
| 5 to 17 Years | 29 (0.9%) | 68 (2.2%) |
| 18 to 34 Years | 53 (0.8%) | 73 (1.0%) |
| 35 to 64 Years | 258 (3.8%) | 131 (1.9%) |
| 65 to 74 Years | 379 (22.9%) | 95 (5.1%) |
| 75 Years and over | 398 (40.6%) | 223 (17.7%) |
Disability Class: Vision Difficulty
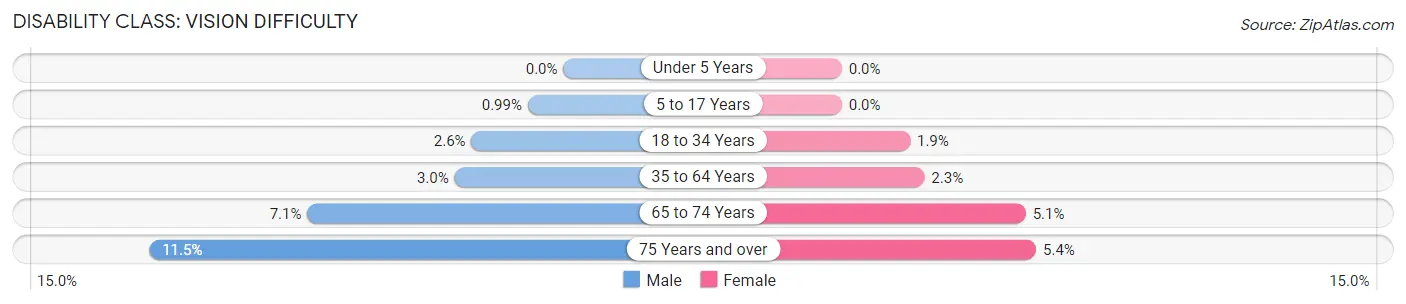
| Age Bracket | Male | Female |
| Under 5 Years | 0 (0.0%) | 0 (0.0%) |
| 5 to 17 Years | 32 (1.0%) | 0 (0.0%) |
| 18 to 34 Years | 176 (2.6%) | 139 (1.9%) |
| 35 to 64 Years | 206 (3.0%) | 156 (2.3%) |
| 65 to 74 Years | 118 (7.1%) | 95 (5.1%) |
| 75 Years and over | 113 (11.5%) | 68 (5.4%) |
Disability Class: Cognitive Difficulty
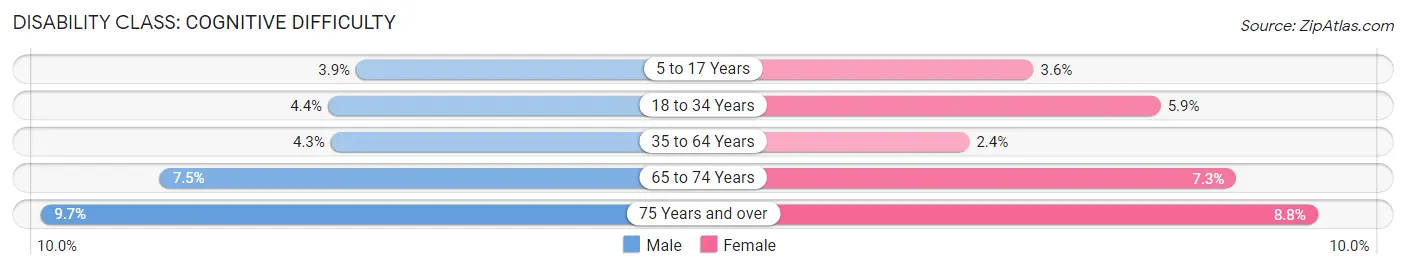
| Age Bracket | Male | Female |
| 5 to 17 Years | 124 (3.8%) | 109 (3.6%) |
| 18 to 34 Years | 300 (4.4%) | 434 (5.9%) |
| 35 to 64 Years | 294 (4.3%) | 161 (2.4%) |
| 65 to 74 Years | 124 (7.5%) | 136 (7.3%) |
| 75 Years and over | 95 (9.7%) | 111 (8.8%) |
Disability Class: Ambulatory Difficulty
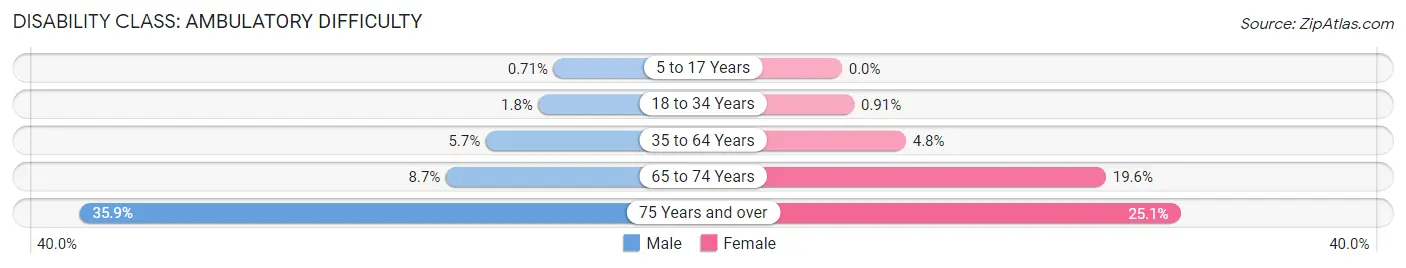
| Age Bracket | Male | Female |
| 5 to 17 Years | 23 (0.7%) | 0 (0.0%) |
| 18 to 34 Years | 126 (1.8%) | 67 (0.9%) |
| 35 to 64 Years | 390 (5.7%) | 323 (4.8%) |
| 65 to 74 Years | 144 (8.7%) | 364 (19.6%) |
| 75 Years and over | 352 (35.9%) | 316 (25.1%) |
Disability Class: Self-Care Difficulty
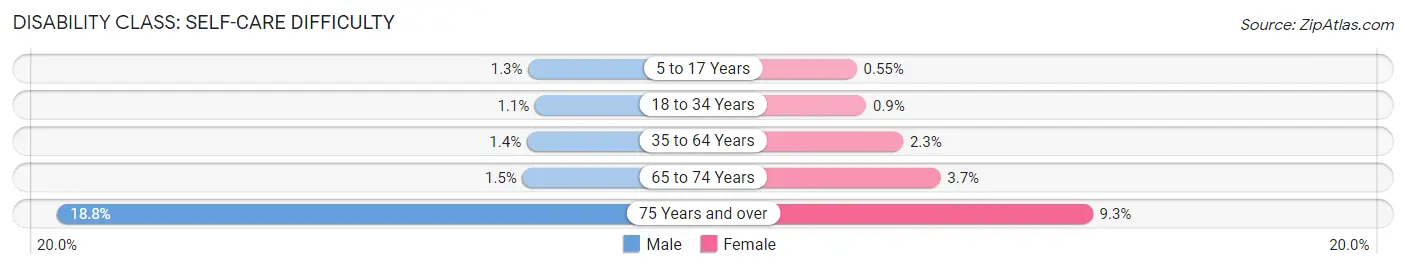
| Age Bracket | Male | Female |
| 5 to 17 Years | 42 (1.3%) | 17 (0.5%) |
| 18 to 34 Years | 72 (1.1%) | 66 (0.9%) |
| 35 to 64 Years | 92 (1.3%) | 154 (2.3%) |
| 65 to 74 Years | 25 (1.5%) | 68 (3.7%) |
| 75 Years and over | 184 (18.8%) | 117 (9.3%) |
Technology Access in Erath County
Computing Device Access in Erath County
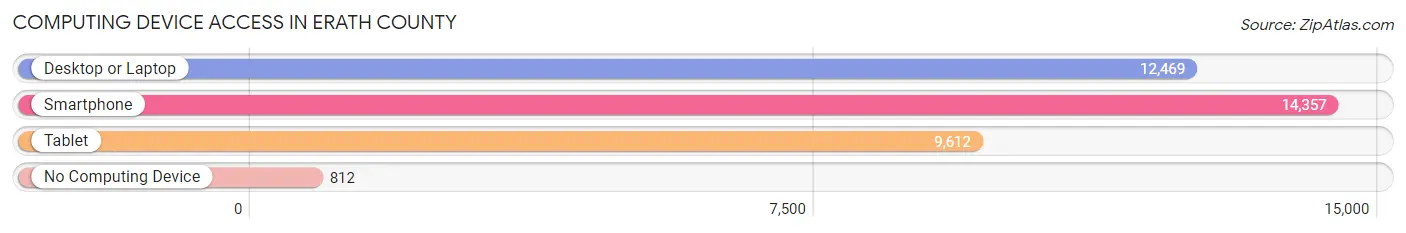
| Device Type | # Households | % Households |
| Desktop or Laptop | 12,469 | 77.9% |
| Smartphone | 14,357 | 89.7% |
| Tablet | 9,612 | 60.1% |
| No Computing Device | 812 | 5.1% |
| Total | 16,007 | 100.0% |
Internet Access in Erath County
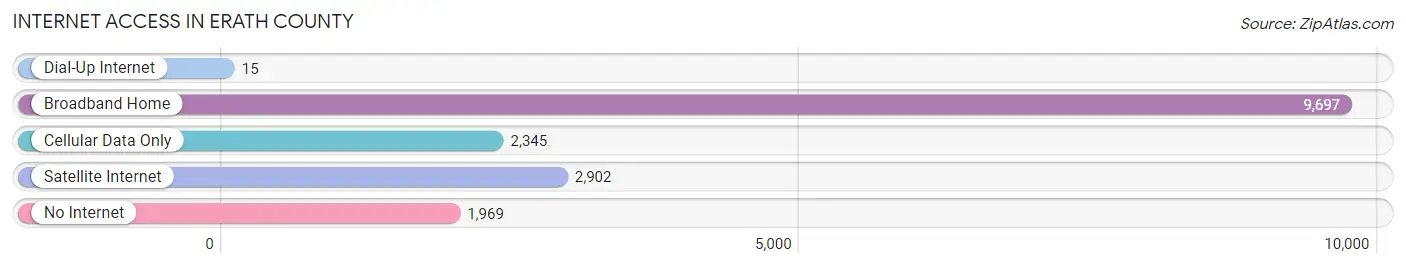
| Internet Type | # Households | % Households |
| Dial-Up Internet | 15 | 0.1% |
| Broadband Home | 9,697 | 60.6% |
| Cellular Data Only | 2,345 | 14.6% |
| Satellite Internet | 2,902 | 18.1% |
| No Internet | 1,969 | 12.3% |
| Total | 16,007 | 100.0% |
Erath County Summary
Erath County is located in the central part of Texas, in the United States. It is part of the Stephenville, Texas Metropolitan Statistical Area. The county was named after George Bernard Erath, a surveyor and early settler in the area. As of the 2010 census, the population of Erath County was 37,890.
Geography
Erath County is located in the central part of Texas, in the United States. It is part of the Stephenville, Texas Metropolitan Statistical Area. The county is bordered by Comanche County to the north, Hamilton County to the east, Bosque County to the south, and Hood and Somervell counties to the west. The county covers an area of 945 square miles, of which 943 square miles is land and 2 square miles is water. The terrain is mostly flat, with some rolling hills in the western part of the county. The county is drained by the Paluxy River and its tributaries.
The county is home to several state parks, including Dinosaur Valley State Park, which features dinosaur tracks, and Lake Proctor State Park, which offers camping, fishing, and boating.
Demographics
As of the 2010 census, there were 37,890 people, 14,845 households, and 10,717 families residing in the county. The population density was 40 people per square mile. The racial makeup of the county was 87.3% White, 5.2% Black or African American, 0.6% Native American, 0.4% Asian, 0.1% Pacific Islander, 4.7% from other races, and 1.7% from two or more races. 11.7% of the population were Hispanic or Latino of any race.
The median income for a household in the county was $41,945, and the median income for a family was $50,845. The per capita income for the county was $20,945. About 11.2% of families and 14.7% of the population were below the poverty line, including 19.2% of those under age 18 and 10.2% of those age 65 or over.
Economy
Erath County is largely rural and agricultural. The county is home to several large ranches, including the 6666 Ranch, which is one of the largest ranches in the United States. The county is also home to several oil and gas fields, including the Stephenville Field, which is one of the largest oil and gas fields in the state.
The county is home to several manufacturing companies, including a large poultry processing plant, a large dairy processing plant, and a large beef processing plant. The county is also home to several retail stores, including a Walmart Supercenter, a Lowe's Home Improvement store, and several restaurants.
The county is served by the Stephenville Independent School District, which includes seven elementary schools, two middle schools, and one high school. The county is also home to Tarleton State University, a public university located in Stephenville.
Conclusion
Erath County is a rural county located in the central part of Texas. The county is home to several large ranches, oil and gas fields, and manufacturing companies. The county is served by the Stephenville Independent School District and is home to Tarleton State University. The population of the county is largely white, with a small percentage of African Americans, Native Americans, Asians, and Hispanics. The median income for a household in the county is $41,945, and the per capita income is $20,945.
Common Questions
What is Per Capita Income in Erath County?
Per Capita income in Erath County is $32,181.
What is the Median Family Income in Erath County?
Median Family Income in Erath County is $82,379.
What is the Median Household income in Erath County?
Median Household Income in Erath County is $59,654.
What is Income or Wage Gap in Erath County?
Income or Wage Gap in Erath County is 34.9%.
Women in Erath County earn 65.1 cents for every dollar earned by a man.
What is Family Income Deficit in Erath County?
Family Income Deficit in Erath County is $11,076.
Families that are below poverty line in Erath County earn $11,076 less on average than the poverty threshold level.
What is Inequality or Gini Index in Erath County?
Inequality or Gini Index in Erath County is 0.49.
What is the Total Population of Erath County?
Total Population of Erath County is 42,788.
What is the Total Male Population of Erath County?
Total Male Population of Erath County is 21,007.
What is the Total Female Population of Erath County?
Total Female Population of Erath County is 21,781.
What is the Ratio of Males per 100 Females in Erath County?
There are 96.45 Males per 100 Females in Erath County.
What is the Ratio of Females per 100 Males in Erath County?
There are 103.68 Females per 100 Males in Erath County.
What is the Median Population Age in Erath County?
Median Population Age in Erath County is 31.6 Years.
What is the Average Family Size in Erath County
Average Family Size in Erath County is 3.1 People.
What is the Average Household Size in Erath County
Average Household Size in Erath County is 2.5 People.
How Large is the Labor Force in Erath County?
There are 22,091 People in the Labor Forcein in Erath County.
What is the Percentage of People in the Labor Force in Erath County?
63.2% of People are in the Labor Force in Erath County.
What is the Unemployment Rate in Erath County?
Unemployment Rate in Erath County is 5.6%.