Edwards County, TX Map & Demographics
Edwards County Map
Edwards County Overview
$25,218
PER CAPITA INCOME
$46,860
AVG FAMILY INCOME
$40,809
AVG HOUSEHOLD INCOME
37.1%
WAGE / INCOME GAP [ % ]
62.9¢/ $1
WAGE / INCOME GAP [ $ ]
0.48
INEQUALITY / GINI INDEX
1,380
TOTAL POPULATION
769
MALE POPULATION
611
FEMALE POPULATION
125.86
MALES / 100 FEMALES
79.45
FEMALES / 100 MALES
40.2
MEDIAN AGE
4.0
AVG FAMILY SIZE
2.6
AVG HOUSEHOLD SIZE
728
LABOR FORCE [ PEOPLE ]
65.6%
PERCENT IN LABOR FORCE
Edwards County Area Codes
Income in Edwards County
Income Overview in Edwards County
Per Capita Income in Edwards County is $25,218, while median incomes of families and households are $46,860 and $40,809 respectively.
| Characteristic | Number | Measure |
| Per Capita Income | 1,380 | $25,218 |
| Median Family Income | 259 | $46,860 |
| Mean Family Income | 259 | $80,665 |
| Median Household Income | 526 | $40,809 |
| Mean Household Income | 526 | $59,314 |
| Income Deficit | 259 | $0 |
| Wage / Income Gap (%) | 1,380 | 37.08% |
| Wage / Income Gap ($) | 1,380 | 62.92¢ per $1 |
| Gini / Inequality Index | 1,380 | 0.48 |
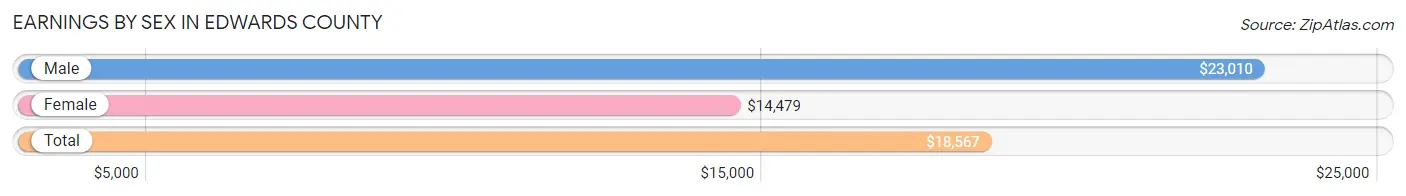
Earnings by Sex in Edwards County
Average Earnings in Edwards County are $18,567, $23,010 for men and $14,479 for women, a difference of 37.1%.
| Sex | Number | Average Earnings |
| Male | 484 (59.0%) | $23,010 |
| Female | 337 (41.0%) | $14,479 |
| Total | 821 (100.0%) | $18,567 |
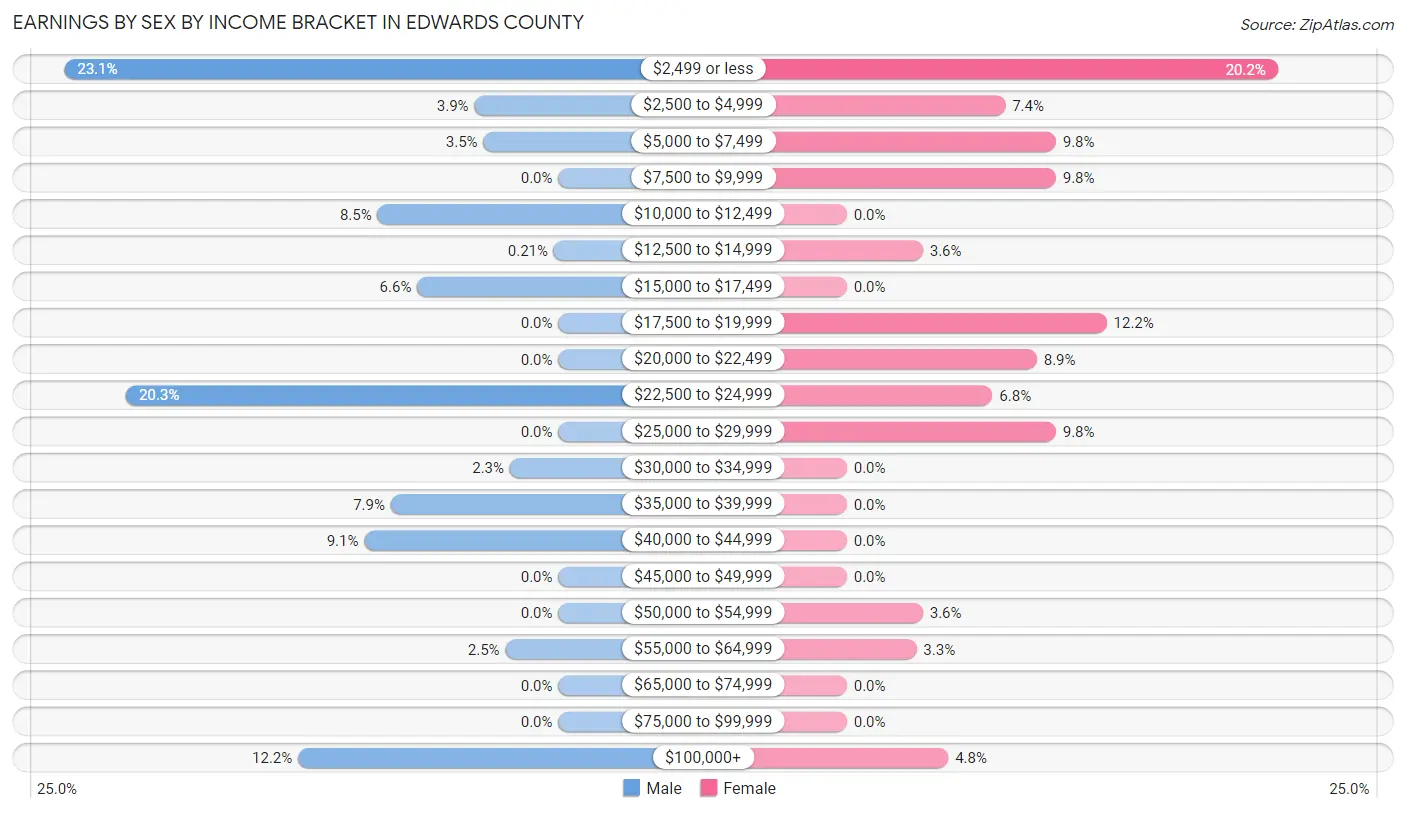
Earnings by Sex by Income Bracket in Edwards County
The most common earnings brackets in Edwards County are $2,499 or less for men (112 | 23.1%) and $2,499 or less for women (68 | 20.2%).
| Income | Male | Female |
| $2,499 or less | 112 (23.1%) | 68 (20.2%) |
| $2,500 to $4,999 | 19 (3.9%) | 25 (7.4%) |
| $5,000 to $7,499 | 17 (3.5%) | 33 (9.8%) |
| $7,500 to $9,999 | 0 (0.0%) | 33 (9.8%) |
| $10,000 to $12,499 | 41 (8.5%) | 0 (0.0%) |
| $12,500 to $14,999 | 1 (0.2%) | 12 (3.6%) |
| $15,000 to $17,499 | 32 (6.6%) | 0 (0.0%) |
| $17,500 to $19,999 | 0 (0.0%) | 41 (12.2%) |
| $20,000 to $22,499 | 0 (0.0%) | 30 (8.9%) |
| $22,500 to $24,999 | 98 (20.3%) | 23 (6.8%) |
| $25,000 to $29,999 | 0 (0.0%) | 33 (9.8%) |
| $30,000 to $34,999 | 11 (2.3%) | 0 (0.0%) |
| $35,000 to $39,999 | 38 (7.9%) | 0 (0.0%) |
| $40,000 to $44,999 | 44 (9.1%) | 0 (0.0%) |
| $45,000 to $49,999 | 0 (0.0%) | 0 (0.0%) |
| $50,000 to $54,999 | 0 (0.0%) | 12 (3.6%) |
| $55,000 to $64,999 | 12 (2.5%) | 11 (3.3%) |
| $65,000 to $74,999 | 0 (0.0%) | 0 (0.0%) |
| $75,000 to $99,999 | 0 (0.0%) | 0 (0.0%) |
| $100,000+ | 59 (12.2%) | 16 (4.8%) |
| Total | 484 (100.0%) | 337 (100.0%) |
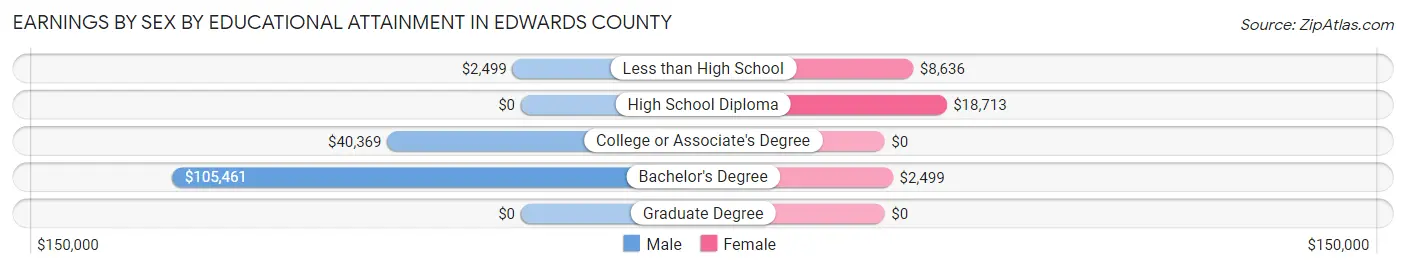
Earnings by Sex by Educational Attainment in Edwards County
Average earnings in Edwards County are $36,875 for men and $18,323 for women, a difference of 50.3%. Men with an educational attainment of bachelor's degree enjoy the highest average annual earnings of $105,461, while those with less than high school education earn the least with $2,499. Women with an educational attainment of high school diploma earn the most with the average annual earnings of $18,713, while those with bachelor's degree education have the smallest earnings of $2,499.
| Educational Attainment | Male Income | Female Income |
| Less than High School | $2,499 | $8,636 |
| High School Diploma | - | - |
| College or Associate's Degree | $40,369 | $0 |
| Bachelor's Degree | $105,461 | $2,499 |
| Graduate Degree | - | - |
| Total | $36,875 | $18,323 |
Family Income in Edwards County
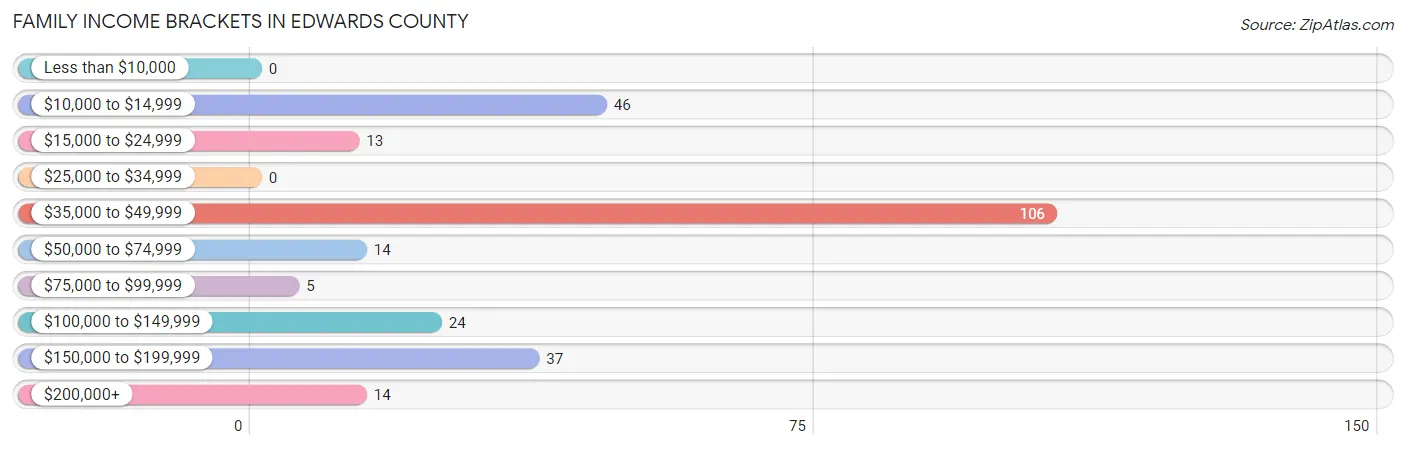
Family Income Brackets in Edwards County
According to the Edwards County family income data, there are 106 families falling into the $35,000 to $49,999 income range, which is the most common income bracket and makes up 40.9% of all families.
| Income Bracket | # Families | % Families |
| Less than $10,000 | 0 | 0.0% |
| $10,000 to $14,999 | 46 | 17.8% |
| $15,000 to $24,999 | 13 | 5.0% |
| $25,000 to $34,999 | 0 | 0.0% |
| $35,000 to $49,999 | 106 | 40.9% |
| $50,000 to $74,999 | 14 | 5.4% |
| $75,000 to $99,999 | 5 | 1.9% |
| $100,000 to $149,999 | 24 | 9.3% |
| $150,000 to $199,999 | 37 | 14.3% |
| $200,000+ | 14 | 5.4% |
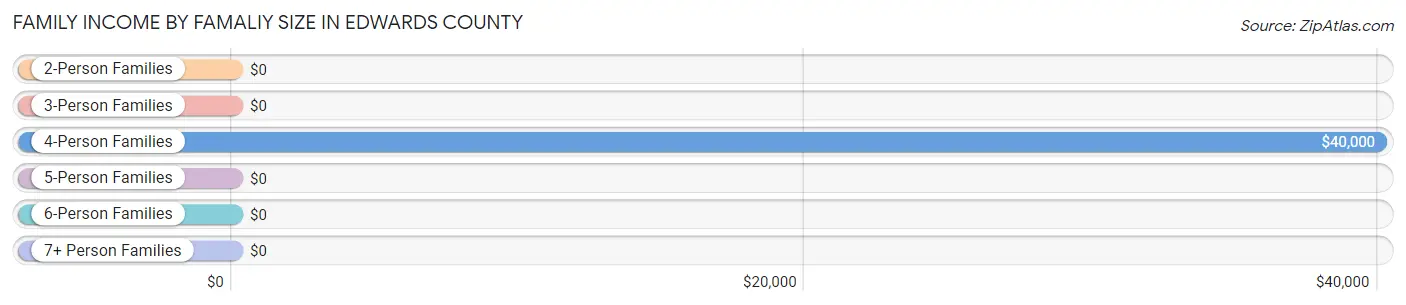
Family Income by Famaliy Size in Edwards County
4-person families (50 | 19.3%) account for the highest median family income in Edwards County with $40,000 per family, while 4-person families (50 | 19.3%) have the highest median income of $10,000 per family member.
| Income Bracket | # Families | Median Income |
| 2-Person Families | 143 (55.2%) | $0 |
| 3-Person Families | 38 (14.7%) | $0 |
| 4-Person Families | 50 (19.3%) | $40,000 |
| 5-Person Families | 28 (10.8%) | $0 |
| 6-Person Families | 0 (0.0%) | $0 |
| 7+ Person Families | 0 (0.0%) | $0 |
| Total | 259 (100.0%) | $46,860 |
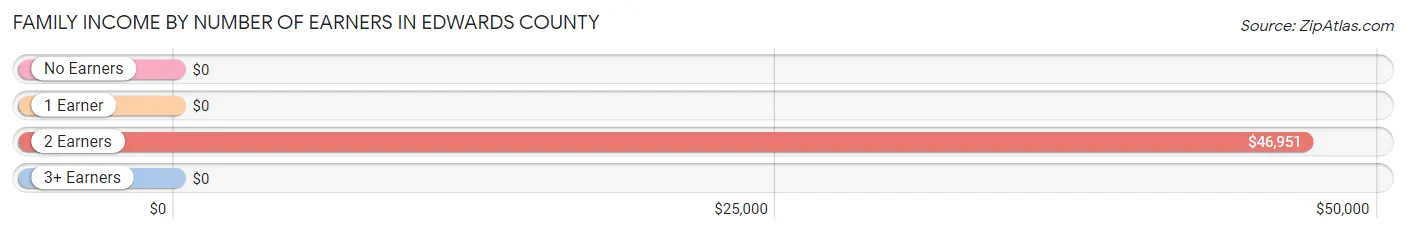
Family Income by Number of Earners in Edwards County
| Number of Earners | # Families | Median Income |
| No Earners | 62 (23.9%) | $0 |
| 1 Earner | 33 (12.7%) | $0 |
| 2 Earners | 126 (48.6%) | $46,951 |
| 3+ Earners | 38 (14.7%) | $0 |
| Total | 259 (100.0%) | $46,860 |
Household Income in Edwards County
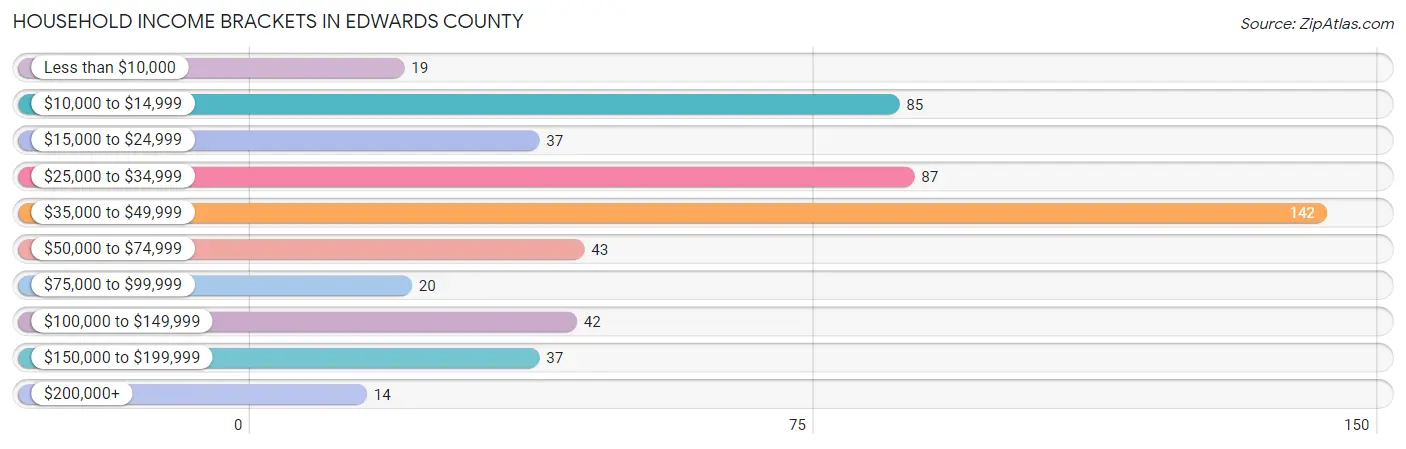
Household Income Brackets in Edwards County
With 142 households falling in the category, the $35,000 to $49,999 income range is the most frequent in Edwards County, accounting for 27.0% of all households. In contrast, only 14 households (2.7%) fall into the $200,000+ income bracket, making it the least populous group.
| Income Bracket | # Households | % Households |
| Less than $10,000 | 19 | 3.6% |
| $10,000 to $14,999 | 85 | 16.2% |
| $15,000 to $24,999 | 37 | 7.0% |
| $25,000 to $34,999 | 87 | 16.5% |
| $35,000 to $49,999 | 142 | 27.0% |
| $50,000 to $74,999 | 43 | 8.2% |
| $75,000 to $99,999 | 20 | 3.8% |
| $100,000 to $149,999 | 42 | 8.0% |
| $150,000 to $199,999 | 37 | 7.0% |
| $200,000+ | 14 | 2.7% |
Household Income by Householder Age in Edwards County
The median household income in Edwards County is $40,809, with the highest median household income of $53,750 found in the 45 to 64 years age bracket for the primary householder. A total of 194 households (36.9%) fall into this category.
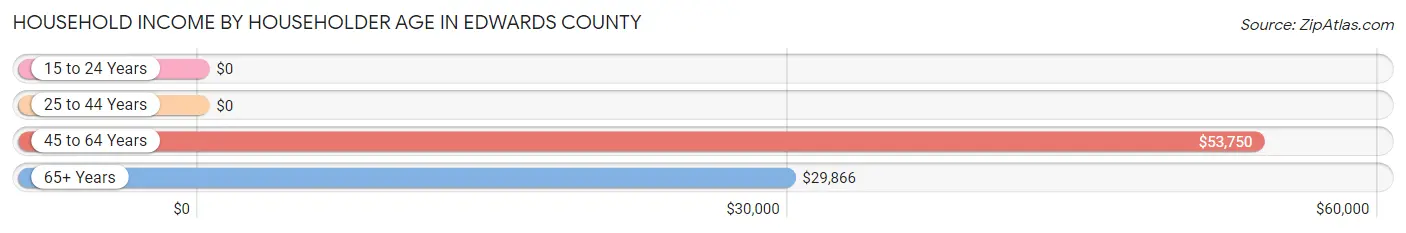
| Income Bracket | # Households | Median Income |
| 15 to 24 Years | 0 (0.0%) | $0 |
| 25 to 44 Years | 91 (17.3%) | $0 |
| 45 to 64 Years | 194 (36.9%) | $53,750 |
| 65+ Years | 241 (45.8%) | $29,866 |
| Total | 526 (100.0%) | $40,809 |
Poverty in Edwards County
Income Below Poverty by Sex and Age in Edwards County
With 25.5% poverty level for males and 20.9% for females among the residents of Edwards County, 15 year old males and 6 to 11 year old females are the most vulnerable to poverty, with 36 males (75.0%) and 25 females (55.6%) in their respective age groups living below the poverty level.
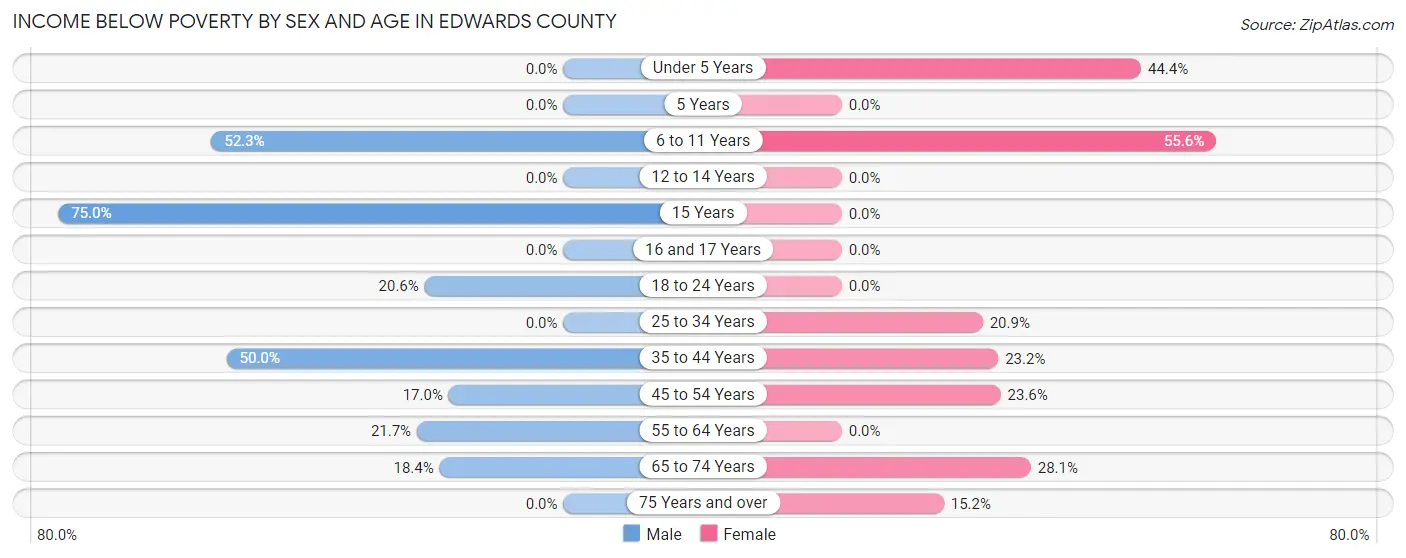
| Age Bracket | Male | Female |
| Under 5 Years | 0 (0.0%) | 20 (44.4%) |
| 5 Years | 0 (0.0%) | 0 (0.0%) |
| 6 to 11 Years | 23 (52.3%) | 25 (55.6%) |
| 12 to 14 Years | 0 (0.0%) | 0 (0.0%) |
| 15 Years | 36 (75.0%) | 0 (0.0%) |
| 16 and 17 Years | 0 (0.0%) | 0 (0.0%) |
| 18 to 24 Years | 48 (20.6%) | 0 (0.0%) |
| 25 to 34 Years | 0 (0.0%) | 9 (20.9%) |
| 35 to 44 Years | 30 (50.0%) | 23 (23.2%) |
| 45 to 54 Years | 16 (17.0%) | 29 (23.6%) |
| 55 to 64 Years | 10 (21.7%) | 0 (0.0%) |
| 65 to 74 Years | 25 (18.4%) | 16 (28.1%) |
| 75 Years and over | 0 (0.0%) | 5 (15.1%) |
| Total | 188 (25.5%) | 127 (20.9%) |
Income Above Poverty by Sex and Age in Edwards County
According to the poverty statistics in Edwards County, males aged 75 years and over and females aged 5 years are the age groups that are most secure financially, with 100.0% of males and 100.0% of females in these age groups living above the poverty line.
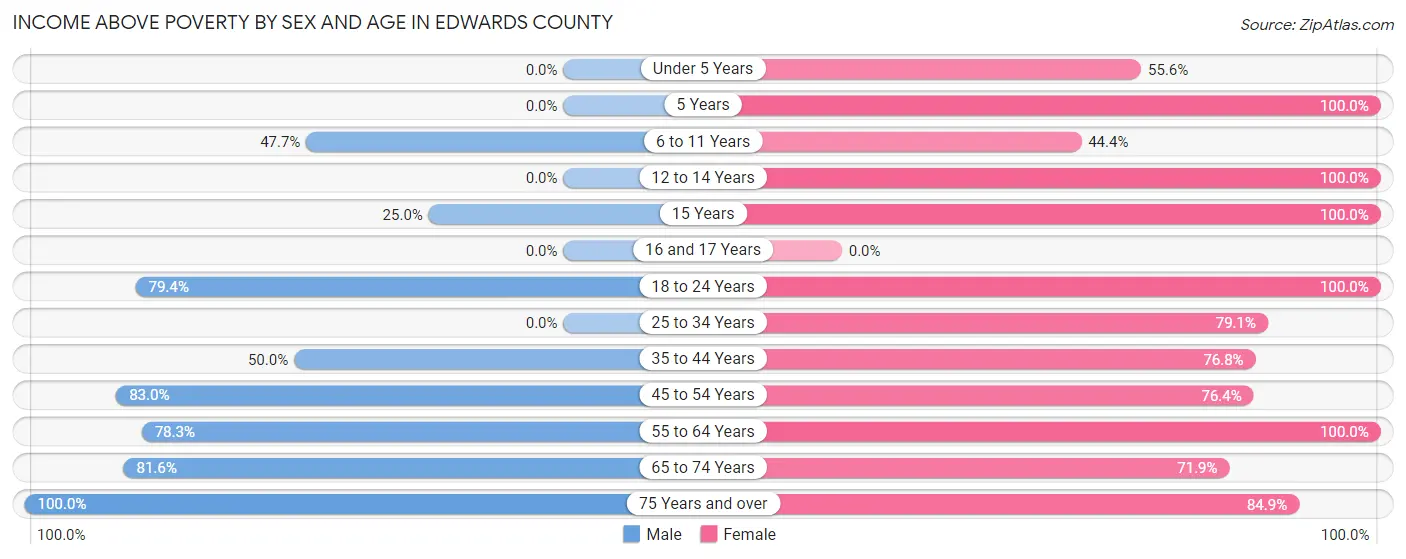
| Age Bracket | Male | Female |
| Under 5 Years | 0 (0.0%) | 25 (55.6%) |
| 5 Years | 0 (0.0%) | 26 (100.0%) |
| 6 to 11 Years | 21 (47.7%) | 20 (44.4%) |
| 12 to 14 Years | 0 (0.0%) | 28 (100.0%) |
| 15 Years | 12 (25.0%) | 34 (100.0%) |
| 16 and 17 Years | 0 (0.0%) | 0 (0.0%) |
| 18 to 24 Years | 185 (79.4%) | 32 (100.0%) |
| 25 to 34 Years | 0 (0.0%) | 34 (79.1%) |
| 35 to 44 Years | 30 (50.0%) | 76 (76.8%) |
| 45 to 54 Years | 78 (83.0%) | 94 (76.4%) |
| 55 to 64 Years | 36 (78.3%) | 43 (100.0%) |
| 65 to 74 Years | 111 (81.6%) | 41 (71.9%) |
| 75 Years and over | 77 (100.0%) | 28 (84.9%) |
| Total | 550 (74.5%) | 481 (79.1%) |
Income Below Poverty Among Married-Couple Families in Edwards County
The poverty statistics for married-couple families in Edwards County show that 16.8% or 26 of the total 155 families live below the poverty line. Families with 3 or 4 children have the highest poverty rate of 100.0%, comprising of 16 families. On the other hand, families with no children have the lowest poverty rate of 0.0%, which includes 0 families.
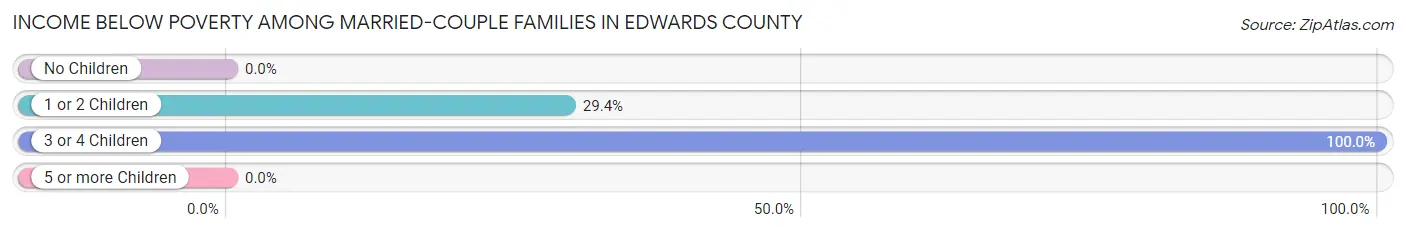
| Children | Above Poverty | Below Poverty |
| No Children | 105 (100.0%) | 0 (0.0%) |
| 1 or 2 Children | 24 (70.6%) | 10 (29.4%) |
| 3 or 4 Children | 0 (0.0%) | 16 (100.0%) |
| 5 or more Children | 0 (0.0%) | 0 (0.0%) |
| Total | 129 (83.2%) | 26 (16.8%) |
Income Below Poverty Among Single-Parent Households in Edwards County
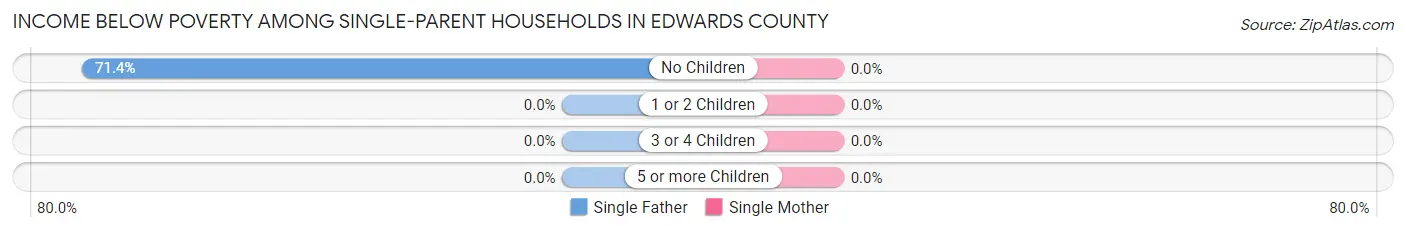
| Children | Single Father | Single Mother |
| No Children | 30 (71.4%) | 0 (0.0%) |
| 1 or 2 Children | 0 (0.0%) | 0 (0.0%) |
| 3 or 4 Children | 0 (0.0%) | 0 (0.0%) |
| 5 or more Children | 0 (0.0%) | 0 (0.0%) |
| Total | 30 (42.9%) | 0 (0.0%) |
Income Below Poverty Among Married-Couple vs Single-Parent Households in Edwards County
The poverty data for Edwards County shows that 26 of the married-couple family households (16.8%) and 30 of the single-parent households (28.8%) are living below the poverty level. Within the married-couple family households, those with 3 or 4 children have the highest poverty rate, with 16 households (100.0%) falling below the poverty line. Among the single-parent households, those with no children have the highest poverty rate, with 30 household (71.4%) living below poverty.
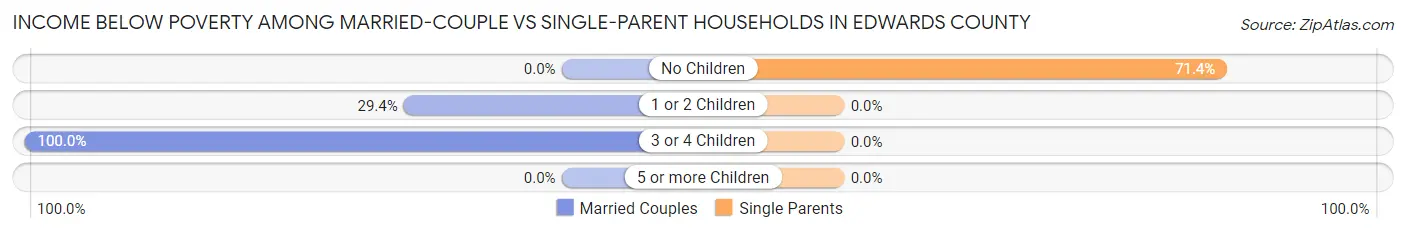
| Children | Married-Couple Families | Single-Parent Households |
| No Children | 0 (0.0%) | 30 (71.4%) |
| 1 or 2 Children | 10 (29.4%) | 0 (0.0%) |
| 3 or 4 Children | 16 (100.0%) | 0 (0.0%) |
| 5 or more Children | 0 (0.0%) | 0 (0.0%) |
| Total | 26 (16.8%) | 30 (28.8%) |
Race in Edwards County
The most populous races in Edwards County are White / Caucasian (1,226 | 88.8%), Hispanic or Latino (683 | 49.5%), and Some other Race (124 | 9.0%).
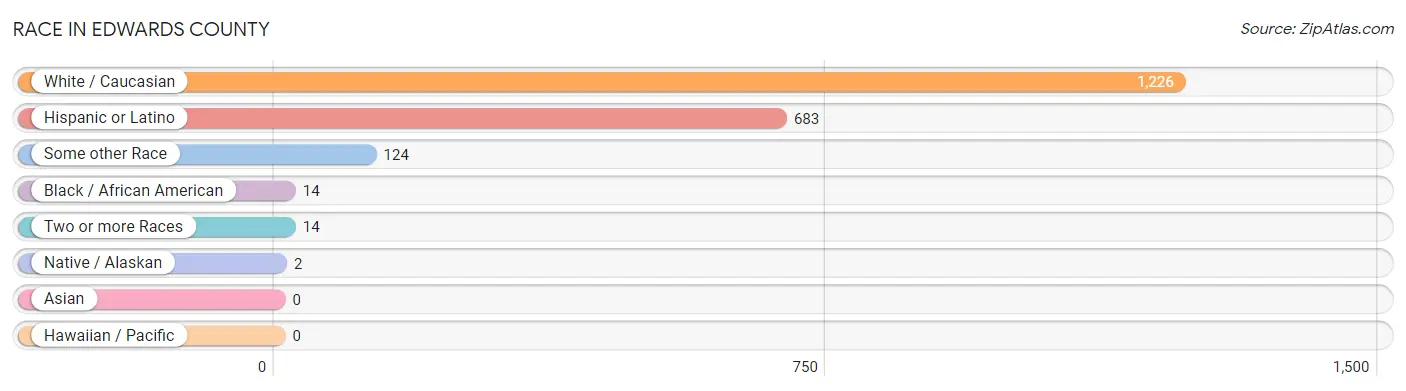
| Race | # Population | % Population |
| Asian | 0 | 0.0% |
| Black / African American | 14 | 1.0% |
| Hawaiian / Pacific | 0 | 0.0% |
| Hispanic or Latino | 683 | 49.5% |
| Native / Alaskan | 2 | 0.1% |
| White / Caucasian | 1,226 | 88.8% |
| Two or more Races | 14 | 1.0% |
| Some other Race | 124 | 9.0% |
| Total | 1,380 | 100.0% |
Ancestry in Edwards County
The most populous ancestries reported in Edwards County are Mexican (681 | 49.3%), German (166 | 12.0%), English (157 | 11.4%), French (107 | 7.7%), and Irish (74 | 5.4%), together accounting for 85.9% of all Edwards County residents.
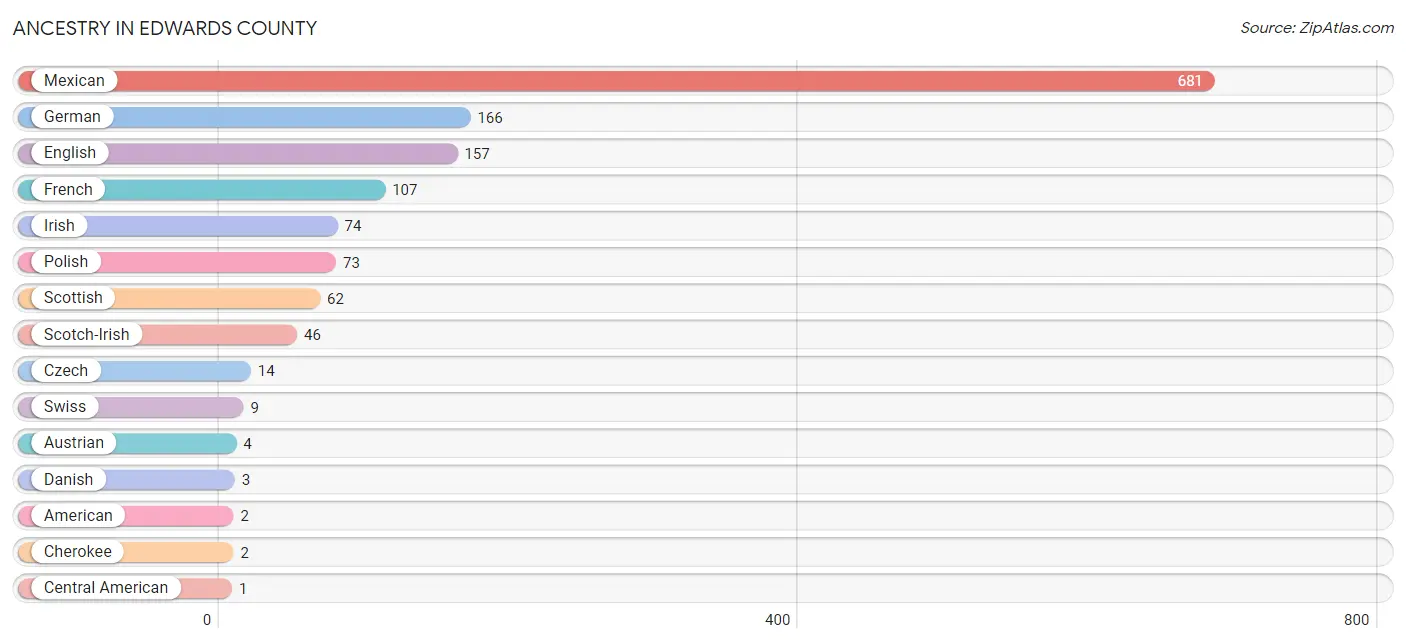
| Ancestry | # Population | % Population |
| American | 2 | 0.1% |
| Austrian | 4 | 0.3% |
| Central American | 1 | 0.1% |
| Cherokee | 2 | 0.1% |
| Czech | 14 | 1.0% |
| Danish | 3 | 0.2% |
| English | 157 | 11.4% |
| European | 1 | 0.1% |
| French | 107 | 7.7% |
| German | 166 | 12.0% |
| Honduran | 1 | 0.1% |
| Irish | 74 | 5.4% |
| Mexican | 681 | 49.3% |
| Polish | 73 | 5.3% |
| Puerto Rican | 1 | 0.1% |
| Scotch-Irish | 46 | 3.3% |
| Scottish | 62 | 4.5% |
| Swiss | 9 | 0.6% | View All 18 Rows |
Immigrants in Edwards County
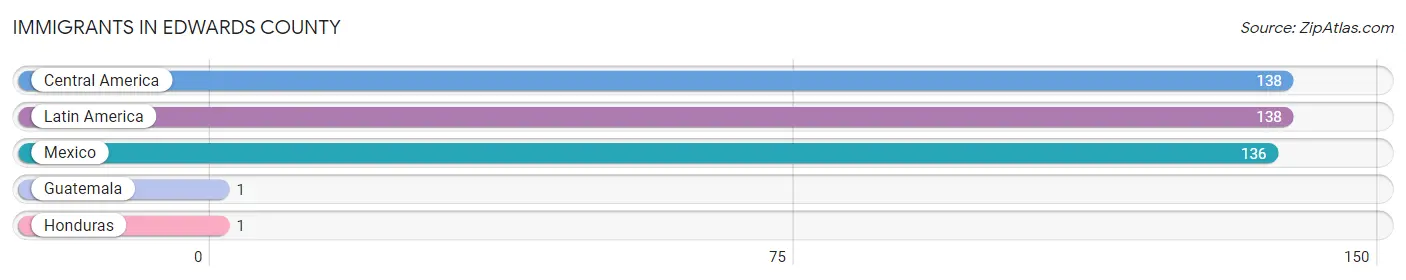
The most numerous immigrant groups reported in Edwards County came from Central America (138 | 10.0%), Latin America (138 | 10.0%), Mexico (136 | 9.9%), Guatemala (1 | 0.1%), and Honduras (1 | 0.1%), together accounting for 30.0% of all Edwards County residents.
| Immigration Origin | # Population | % Population |
| Central America | 138 | 10.0% |
| Guatemala | 1 | 0.1% |
| Honduras | 1 | 0.1% |
| Latin America | 138 | 10.0% |
| Mexico | 136 | 9.9% | View All 5 Rows |
Sex and Age in Edwards County
Sex and Age in Edwards County
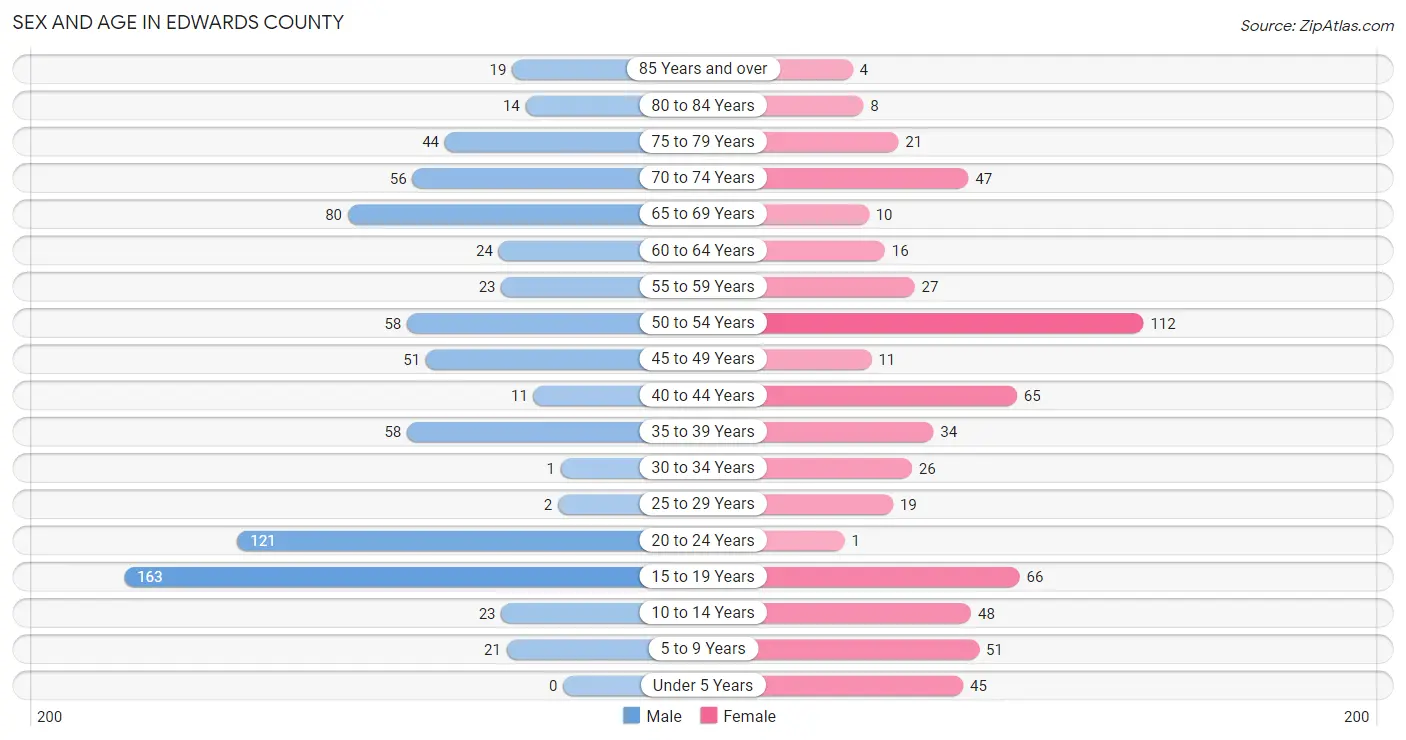
The most populous age groups in Edwards County are 15 to 19 Years (163 | 21.2%) for men and 50 to 54 Years (112 | 18.3%) for women.
| Age Bracket | Male | Female |
| Under 5 Years | 0 (0.0%) | 45 (7.4%) |
| 5 to 9 Years | 21 (2.7%) | 51 (8.4%) |
| 10 to 14 Years | 23 (3.0%) | 48 (7.9%) |
| 15 to 19 Years | 163 (21.2%) | 66 (10.8%) |
| 20 to 24 Years | 121 (15.7%) | 1 (0.2%) |
| 25 to 29 Years | 2 (0.3%) | 19 (3.1%) |
| 30 to 34 Years | 1 (0.1%) | 26 (4.3%) |
| 35 to 39 Years | 58 (7.5%) | 34 (5.6%) |
| 40 to 44 Years | 11 (1.4%) | 65 (10.6%) |
| 45 to 49 Years | 51 (6.6%) | 11 (1.8%) |
| 50 to 54 Years | 58 (7.5%) | 112 (18.3%) |
| 55 to 59 Years | 23 (3.0%) | 27 (4.4%) |
| 60 to 64 Years | 24 (3.1%) | 16 (2.6%) |
| 65 to 69 Years | 80 (10.4%) | 10 (1.6%) |
| 70 to 74 Years | 56 (7.3%) | 47 (7.7%) |
| 75 to 79 Years | 44 (5.7%) | 21 (3.4%) |
| 80 to 84 Years | 14 (1.8%) | 8 (1.3%) |
| 85 Years and over | 19 (2.5%) | 4 (0.6%) |
| Total | 769 (100.0%) | 611 (100.0%) |
Families and Households in Edwards County
Median Family Size in Edwards County
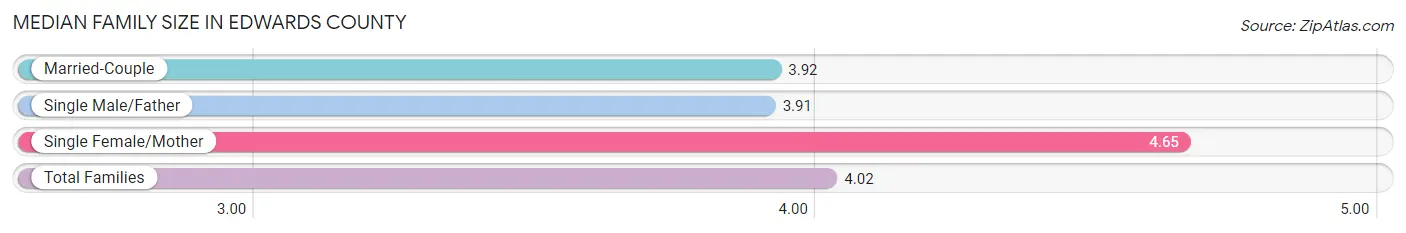
The median family size in Edwards County is 4.02 persons per family, with single female/mother families (34 | 13.1%) accounting for the largest median family size of 4.65 persons per family. On the other hand, single male/father families (70 | 27.0%) represent the smallest median family size with 3.91 persons per family.
| Family Type | # Families | Family Size |
| Married-Couple | 155 (59.9%) | 3.92 |
| Single Male/Father | 70 (27.0%) | 3.91 |
| Single Female/Mother | 34 (13.1%) | 4.65 |
| Total Families | 259 (100.0%) | 4.02 |
Median Household Size in Edwards County
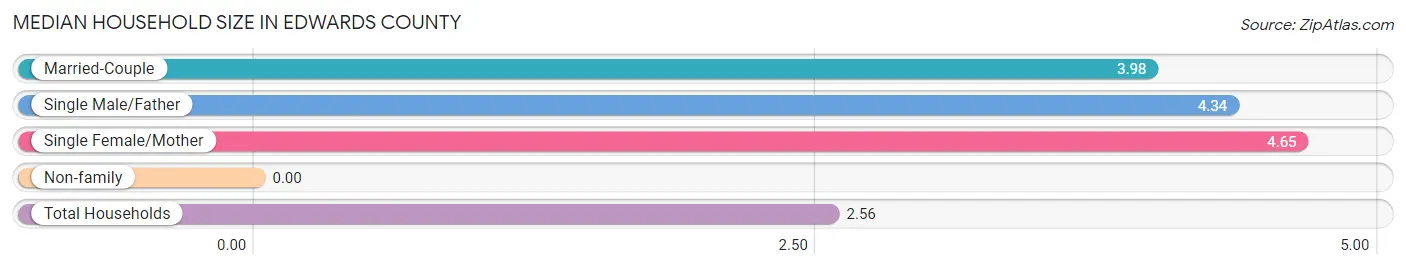
| Household Type | # Households | Household Size |
| Married-Couple | 155 (29.5%) | 3.98 |
| Single Male/Father | 70 (13.3%) | 4.34 |
| Single Female/Mother | 34 (6.5%) | 4.65 |
| Non-family | 267 (50.8%) | - |
| Total Households | 526 (100.0%) | 2.56 |
Household Size by Marriage Status in Edwards County
Out of a total of 526 households in Edwards County, 259 (49.2%) are family households, while 267 (50.8%) are nonfamily households. The most numerous type of family households are 2-person households, comprising 143, and the most common type of nonfamily households are 1-person households, comprising 267.
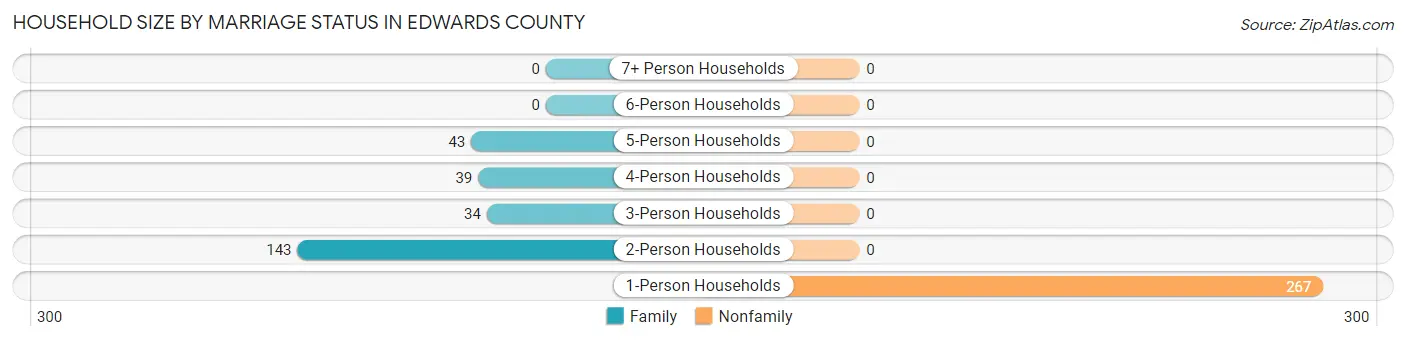
| Household Size | Family Households | Nonfamily Households |
| 1-Person Households | - | 267 (50.8%) |
| 2-Person Households | 143 (27.2%) | 0 (0.0%) |
| 3-Person Households | 34 (6.5%) | 0 (0.0%) |
| 4-Person Households | 39 (7.4%) | 0 (0.0%) |
| 5-Person Households | 43 (8.2%) | 0 (0.0%) |
| 6-Person Households | 0 (0.0%) | 0 (0.0%) |
| 7+ Person Households | 0 (0.0%) | 0 (0.0%) |
| Total | 259 (49.2%) | 267 (50.8%) |
Female Fertility in Edwards County
Fertility by Age in Edwards County
Average fertility rate in Edwards County is 103.0 births per 1,000 women. Women in the age bracket of 35 to 50 years have the highest fertility rate with 190.0 births per 1,000 women. Women in the age bracket of 35 to 50 years acount for 95.8% of all women with births.
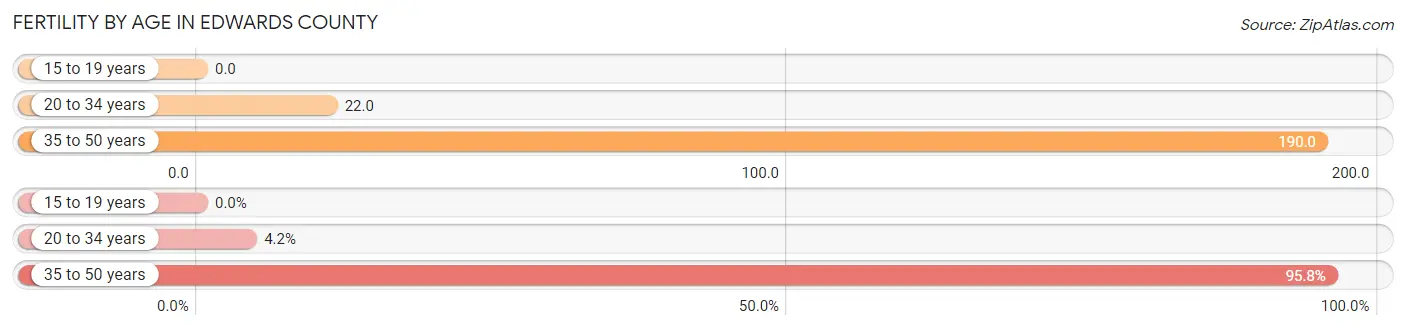
| Age Bracket | Women with Births | Births / 1,000 Women |
| 15 to 19 years | 0 (0.0%) | 0.0 |
| 20 to 34 years | 1 (4.2%) | 22.0 |
| 35 to 50 years | 23 (95.8%) | 190.0 |
| Total | 24 (100.0%) | 103.0 |
Fertility by Age by Marriage Status in Edwards County
95.8% of women with births (24) in Edwards County are married. The highest percentage of unmarried women with births falls into 20 to 34 years age bracket with 100.0% of them unmarried at the time of birth, while the lowest percentage of unmarried women with births belong to 35 to 50 years age bracket with 0.0% of them unmarried.
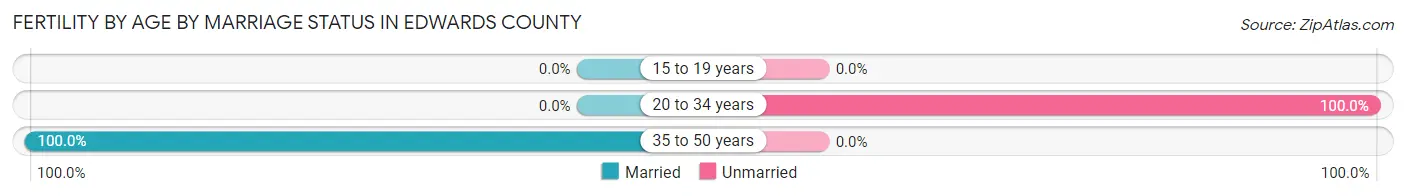
| Age Bracket | Married | Unmarried |
| 15 to 19 years | 0 (0.0%) | 0 (0.0%) |
| 20 to 34 years | 0 (0.0%) | 1 (100.0%) |
| 35 to 50 years | 23 (100.0%) | 0 (0.0%) |
| Total | 23 (95.8%) | 1 (4.2%) |
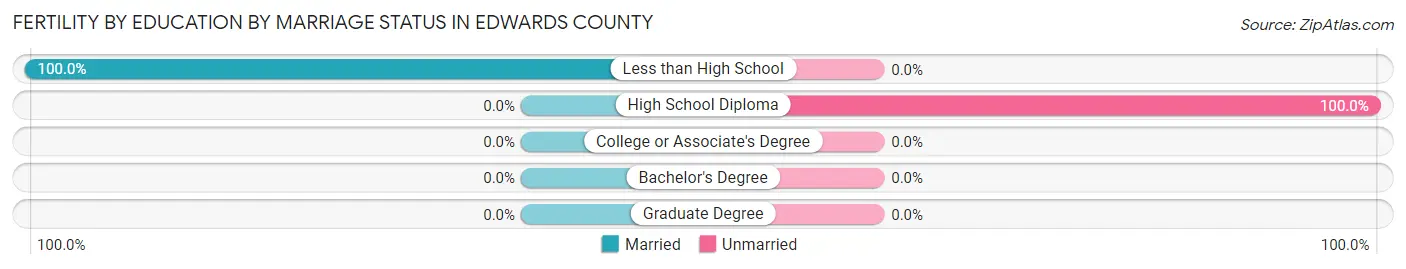
Fertility by Education in Edwards County
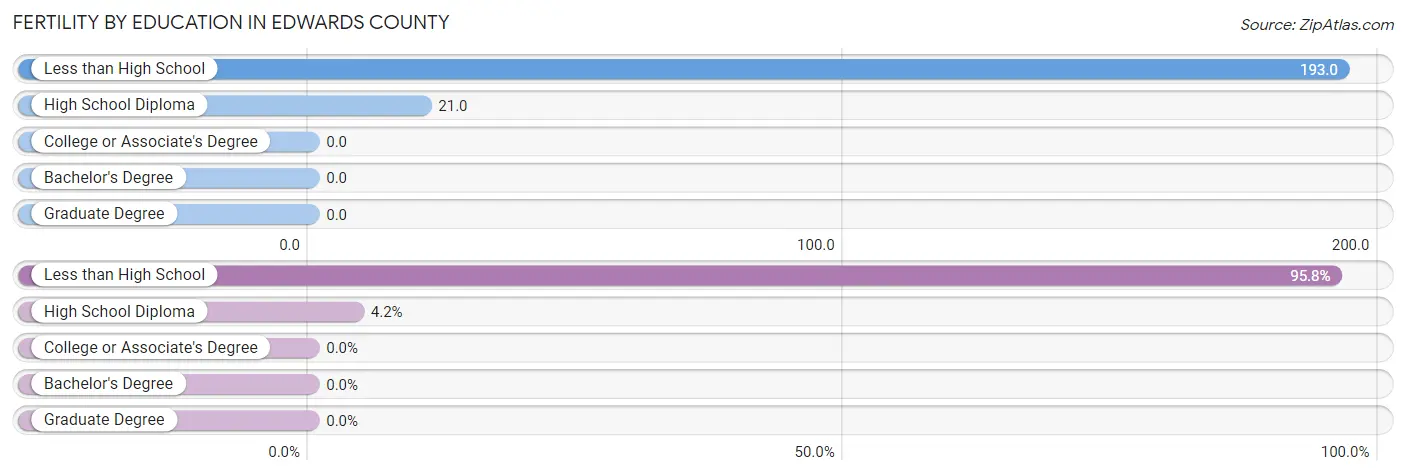
| Educational Attainment | Women with Births | Births / 1,000 Women |
| Less than High School | 23 (95.8%) | 193.0 |
| High School Diploma | 1 (4.2%) | 21.0 |
| College or Associate's Degree | 0 (0.0%) | 0.0 |
| Bachelor's Degree | 0 (0.0%) | 0.0 |
| Graduate Degree | 0 (0.0%) | 0.0 |
| Total | 24 (100.0%) | 103.0 |
Fertility by Education by Marriage Status in Edwards County
4.2% of women with births in Edwards County are unmarried. Women with the educational attainment of less than high school are most likely to be married with 100.0% of them married at childbirth, while women with the educational attainment of high school diploma are least likely to be married with 100.0% of them unmarried at childbirth.
| Educational Attainment | Married | Unmarried |
| Less than High School | 23 (100.0%) | 0 (0.0%) |
| High School Diploma | 0 (0.0%) | 1 (100.0%) |
| College or Associate's Degree | 0 (0.0%) | 0 (0.0%) |
| Bachelor's Degree | 0 (0.0%) | 0 (0.0%) |
| Graduate Degree | 0 (0.0%) | 0 (0.0%) |
| Total | 23 (95.8%) | 1 (4.2%) |
Employment Characteristics in Edwards County
Employment by Class of Employer in Edwards County
Among the 716 employed individuals in Edwards County, private company employees (433 | 60.5%), self-employed (not incorporated) (145 | 20.3%), and state government employees (46 | 6.4%) make up the most common classes of employment.
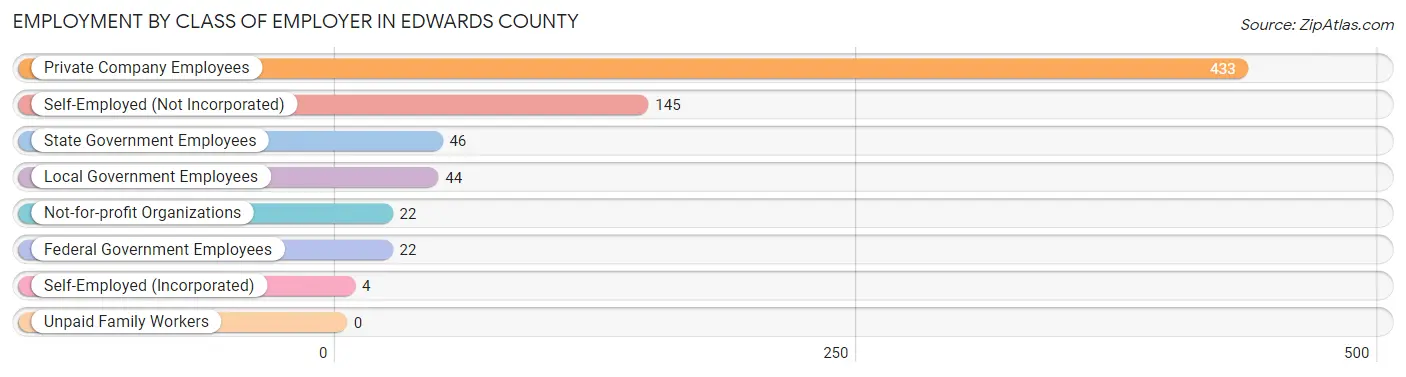
| Employer Class | # Employees | % Employees |
| Private Company Employees | 433 | 60.5% |
| Self-Employed (Incorporated) | 4 | 0.6% |
| Self-Employed (Not Incorporated) | 145 | 20.3% |
| Not-for-profit Organizations | 22 | 3.1% |
| Local Government Employees | 44 | 6.1% |
| State Government Employees | 46 | 6.4% |
| Federal Government Employees | 22 | 3.1% |
| Unpaid Family Workers | 0 | 0.0% |
| Total | 716 | 100.0% |
Employment Status by Age in Edwards County
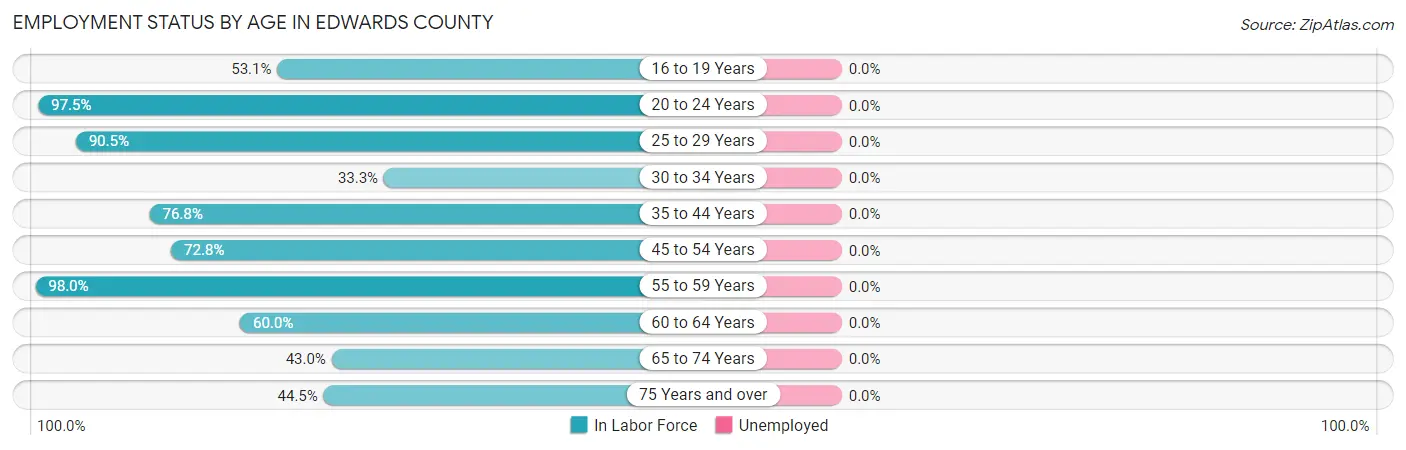
| Age Bracket | In Labor Force | Unemployed |
| 16 to 19 Years | 78 (53.1%) | 0 (0.0%) |
| 20 to 24 Years | 119 (97.5%) | 0 (0.0%) |
| 25 to 29 Years | 19 (90.5%) | 0 (0.0%) |
| 30 to 34 Years | 9 (33.3%) | 0 (0.0%) |
| 35 to 44 Years | 129 (76.8%) | 0 (0.0%) |
| 45 to 54 Years | 169 (72.8%) | 0 (0.0%) |
| 55 to 59 Years | 49 (98.0%) | 0 (0.0%) |
| 60 to 64 Years | 24 (60.0%) | 0 (0.0%) |
| 65 to 74 Years | 83 (43.0%) | 0 (0.0%) |
| 75 Years and over | 49 (44.5%) | 0 (0.0%) |
| Total | 728 (65.6%) | 0 (0.0%) |
Employment Status by Educational Attainment in Edwards County
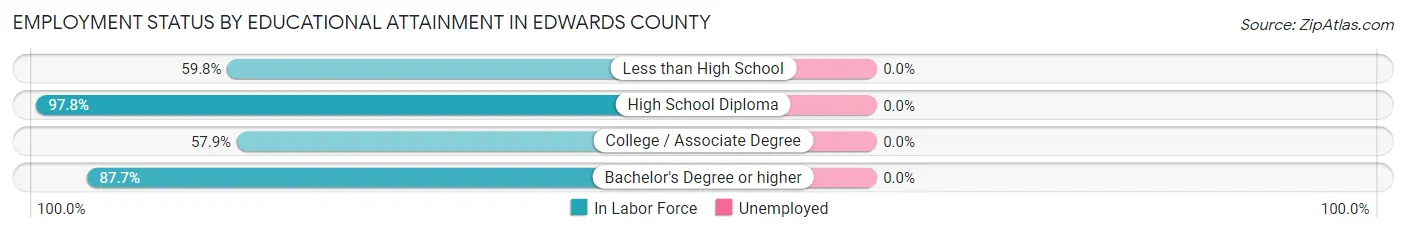
| Educational Attainment | In Labor Force | Unemployed |
| Less than High School | 76 (59.8%) | 0 (0.0%) |
| High School Diploma | 131 (97.8%) | 0 (0.0%) |
| College / Associate Degree | 99 (57.9%) | 0 (0.0%) |
| Bachelor's Degree or higher | 93 (87.7%) | 0 (0.0%) |
| Total | 399 (74.2%) | 0 (0.0%) |
Employment Occupations by Sex in Edwards County
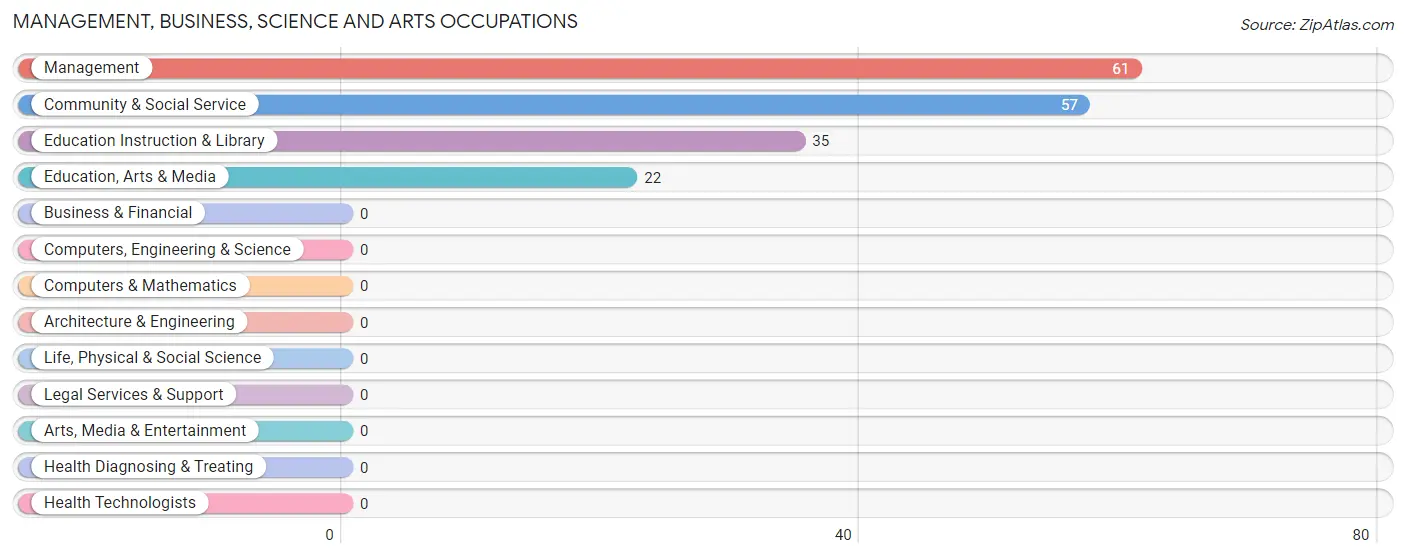
Management, Business, Science and Arts Occupations
The most common Management, Business, Science and Arts occupations in Edwards County are Management (61 | 8.4%), Community & Social Service (57 | 7.8%), Education Instruction & Library (35 | 4.8%), and Education, Arts & Media (22 | 3.0%).
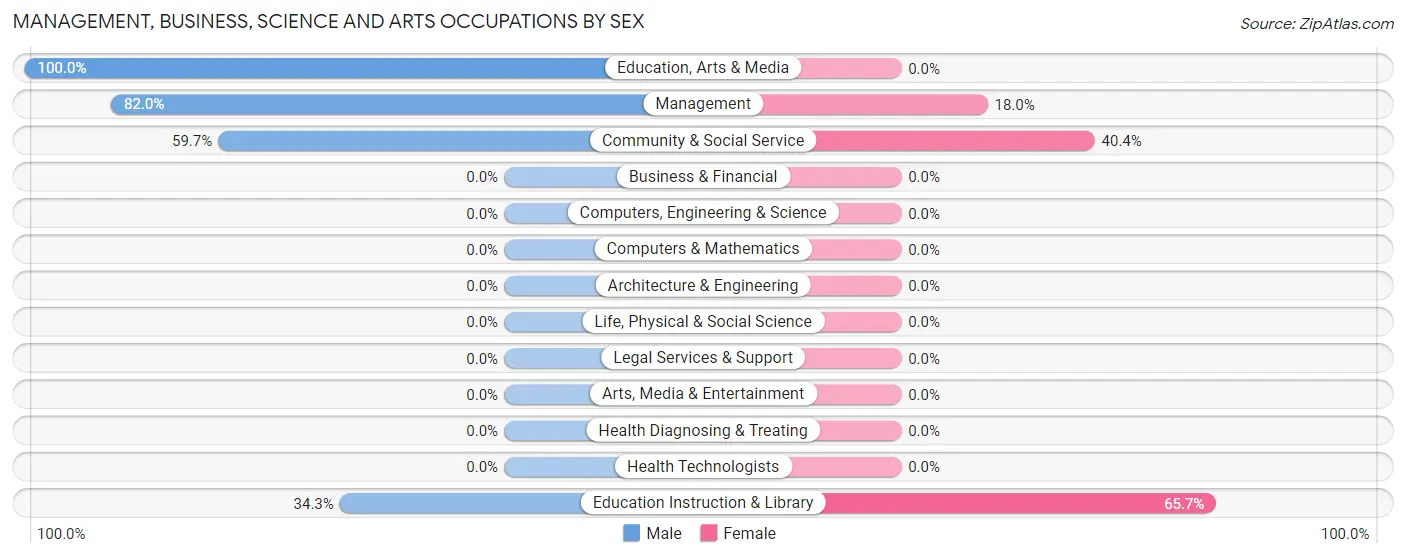
Management, Business, Science and Arts Occupations by Sex
Within the Management, Business, Science and Arts occupations in Edwards County, the most male-oriented occupations are Education, Arts & Media (100.0%), Management (82.0%), and Community & Social Service (59.7%), while the most female-oriented occupations are Education Instruction & Library (65.7%), Community & Social Service (40.4%), and Management (18.0%).
| Occupation | Male | Female |
| Management | 50 (82.0%) | 11 (18.0%) |
| Business & Financial | 0 (0.0%) | 0 (0.0%) |
| Computers, Engineering & Science | 0 (0.0%) | 0 (0.0%) |
| Computers & Mathematics | 0 (0.0%) | 0 (0.0%) |
| Architecture & Engineering | 0 (0.0%) | 0 (0.0%) |
| Life, Physical & Social Science | 0 (0.0%) | 0 (0.0%) |
| Community & Social Service | 34 (59.7%) | 23 (40.4%) |
| Education, Arts & Media | 22 (100.0%) | 0 (0.0%) |
| Legal Services & Support | 0 (0.0%) | 0 (0.0%) |
| Education Instruction & Library | 12 (34.3%) | 23 (65.7%) |
| Arts, Media & Entertainment | 0 (0.0%) | 0 (0.0%) |
| Health Diagnosing & Treating | 0 (0.0%) | 0 (0.0%) |
| Health Technologists | 0 (0.0%) | 0 (0.0%) |
| Total (Category) | 84 (71.2%) | 34 (28.8%) |
| Total (Overall) | 424 (58.2%) | 304 (41.8%) |
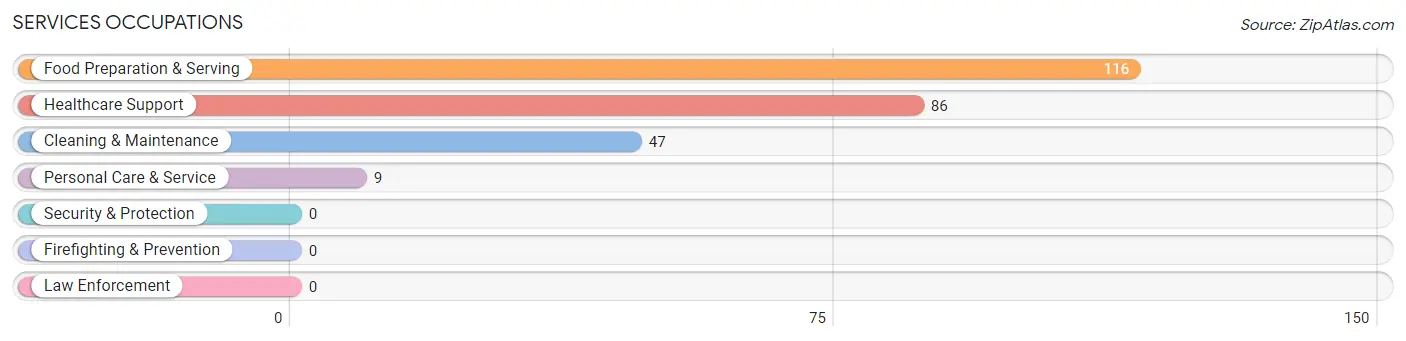
Services Occupations
The most common Services occupations in Edwards County are Food Preparation & Serving (116 | 15.9%), Healthcare Support (86 | 11.8%), Cleaning & Maintenance (47 | 6.5%), and Personal Care & Service (9 | 1.2%).
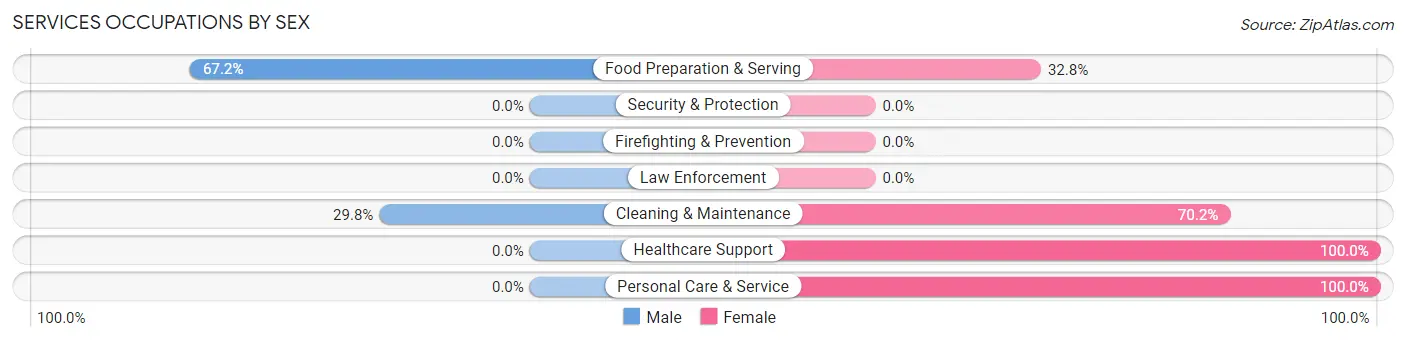
Services Occupations by Sex
Within the Services occupations in Edwards County, the most male-oriented occupations are Food Preparation & Serving (67.2%), and Cleaning & Maintenance (29.8%), while the most female-oriented occupations are Healthcare Support (100.0%), Personal Care & Service (100.0%), and Cleaning & Maintenance (70.2%).
| Occupation | Male | Female |
| Healthcare Support | 0 (0.0%) | 86 (100.0%) |
| Security & Protection | 0 (0.0%) | 0 (0.0%) |
| Firefighting & Prevention | 0 (0.0%) | 0 (0.0%) |
| Law Enforcement | 0 (0.0%) | 0 (0.0%) |
| Food Preparation & Serving | 78 (67.2%) | 38 (32.8%) |
| Cleaning & Maintenance | 14 (29.8%) | 33 (70.2%) |
| Personal Care & Service | 0 (0.0%) | 9 (100.0%) |
| Total (Category) | 92 (35.7%) | 166 (64.3%) |
| Total (Overall) | 424 (58.2%) | 304 (41.8%) |
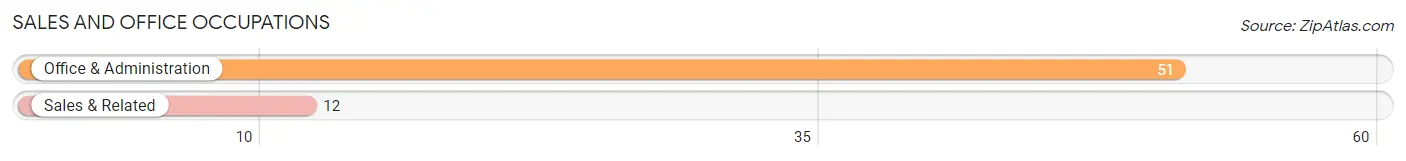
Sales and Office Occupations
The most common Sales and Office occupations in Edwards County are Office & Administration (51 | 7.0%), and Sales & Related (12 | 1.7%).
Sales and Office Occupations by Sex
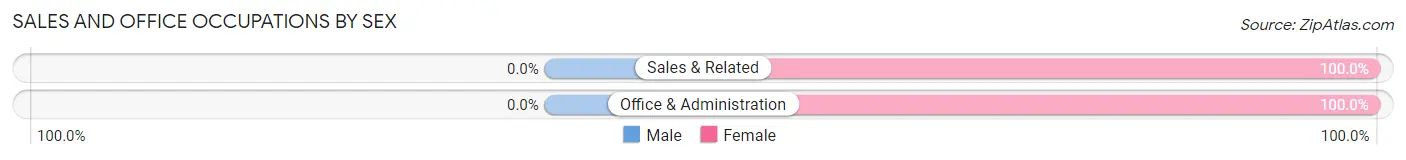
| Occupation | Male | Female |
| Sales & Related | 0 (0.0%) | 12 (100.0%) |
| Office & Administration | 0 (0.0%) | 51 (100.0%) |
| Total (Category) | 0 (0.0%) | 63 (100.0%) |
| Total (Overall) | 424 (58.2%) | 304 (41.8%) |
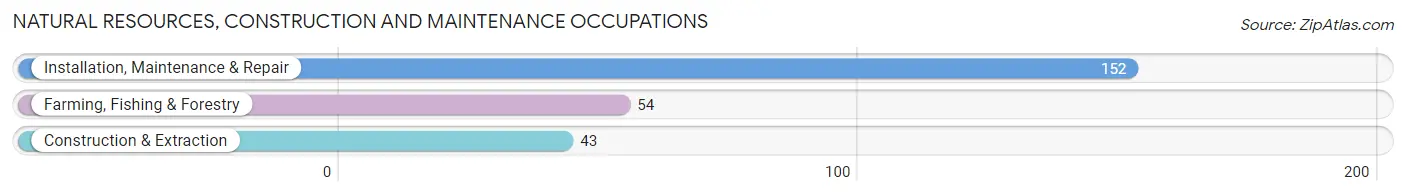
Natural Resources, Construction and Maintenance Occupations
The most common Natural Resources, Construction and Maintenance occupations in Edwards County are Installation, Maintenance & Repair (152 | 20.9%), Farming, Fishing & Forestry (54 | 7.4%), and Construction & Extraction (43 | 5.9%).
Natural Resources, Construction and Maintenance Occupations by Sex
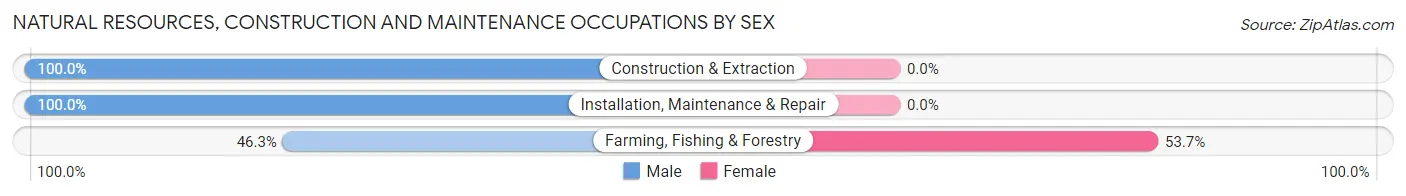
| Occupation | Male | Female |
| Farming, Fishing & Forestry | 25 (46.3%) | 29 (53.7%) |
| Construction & Extraction | 43 (100.0%) | 0 (0.0%) |
| Installation, Maintenance & Repair | 152 (100.0%) | 0 (0.0%) |
| Total (Category) | 220 (88.3%) | 29 (11.7%) |
| Total (Overall) | 424 (58.2%) | 304 (41.8%) |
Production, Transportation and Moving Occupations
The most common Production, Transportation and Moving occupations in Edwards County are Transportation (24 | 3.3%), and Material Moving (16 | 2.2%).
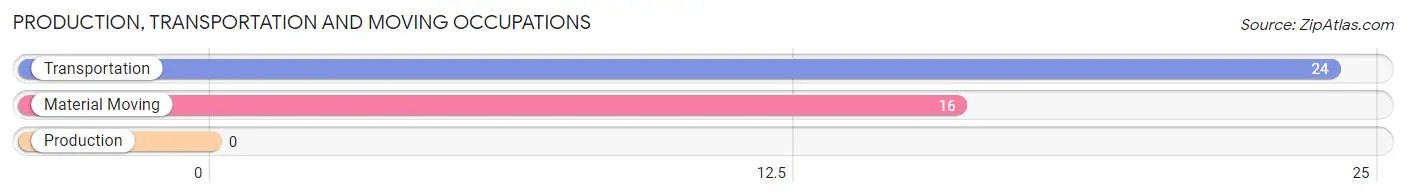
Production, Transportation and Moving Occupations by Sex
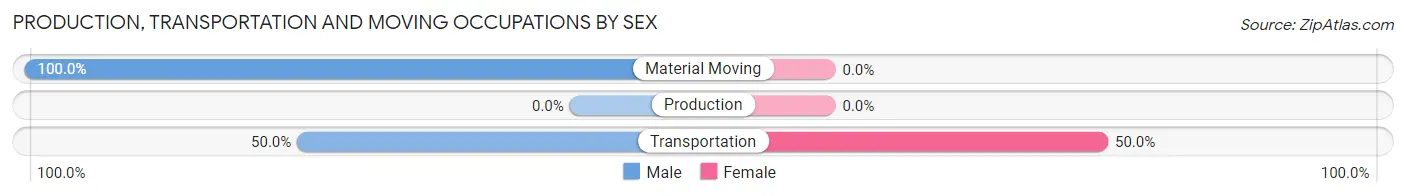
| Occupation | Male | Female |
| Production | 0 (0.0%) | 0 (0.0%) |
| Transportation | 12 (50.0%) | 12 (50.0%) |
| Material Moving | 16 (100.0%) | 0 (0.0%) |
| Total (Category) | 28 (70.0%) | 12 (30.0%) |
| Total (Overall) | 424 (58.2%) | 304 (41.8%) |
Employment Industries by Sex in Edwards County
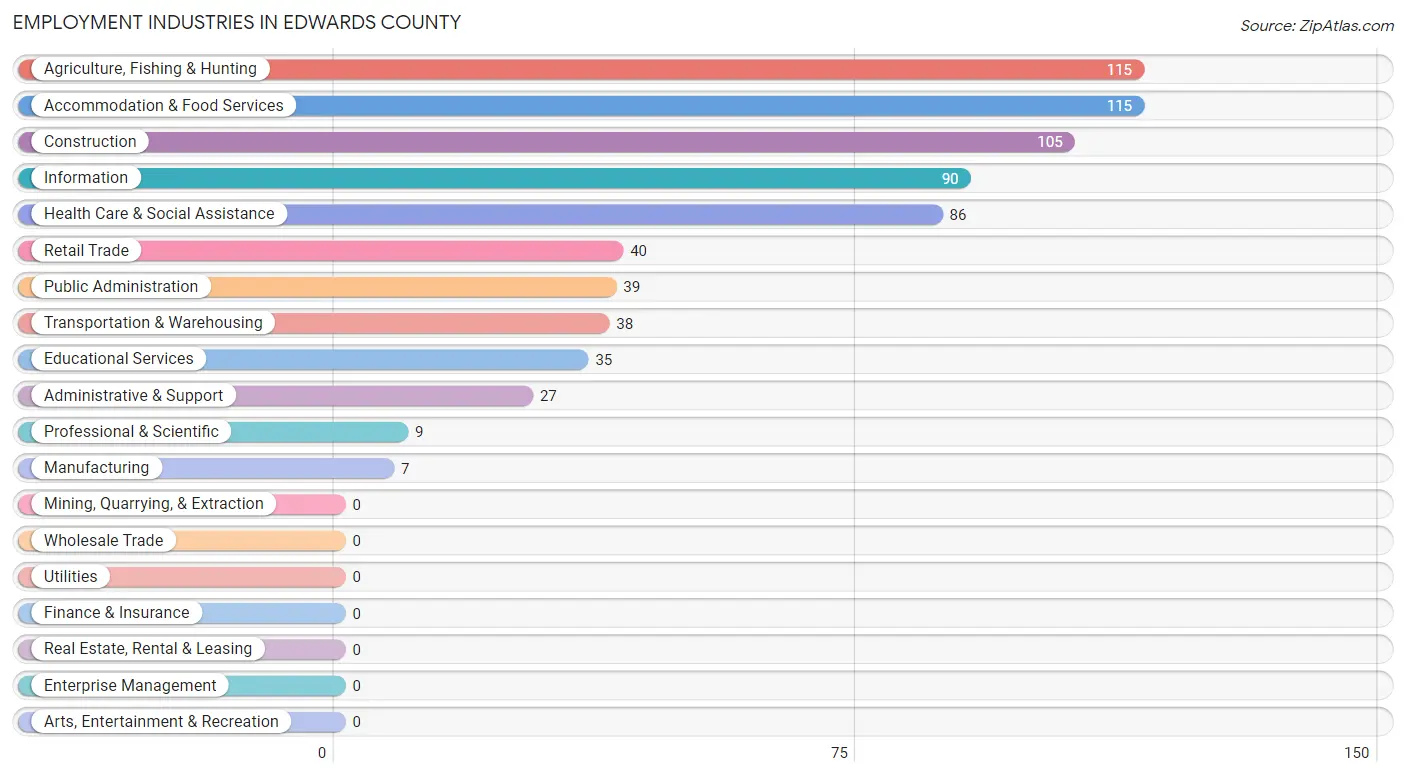
Employment Industries in Edwards County
The major employment industries in Edwards County include Agriculture, Fishing & Hunting (115 | 15.8%), Accommodation & Food Services (115 | 15.8%), Construction (105 | 14.4%), Information (90 | 12.4%), and Health Care & Social Assistance (86 | 11.8%).
Employment Industries by Sex in Edwards County
The Edwards County industries that see more men than women are Construction (100.0%), Information (100.0%), and Accommodation & Food Services (67.8%), whereas the industries that tend to have a higher number of women are Manufacturing (100.0%), Professional & Scientific (100.0%), and Health Care & Social Assistance (100.0%).
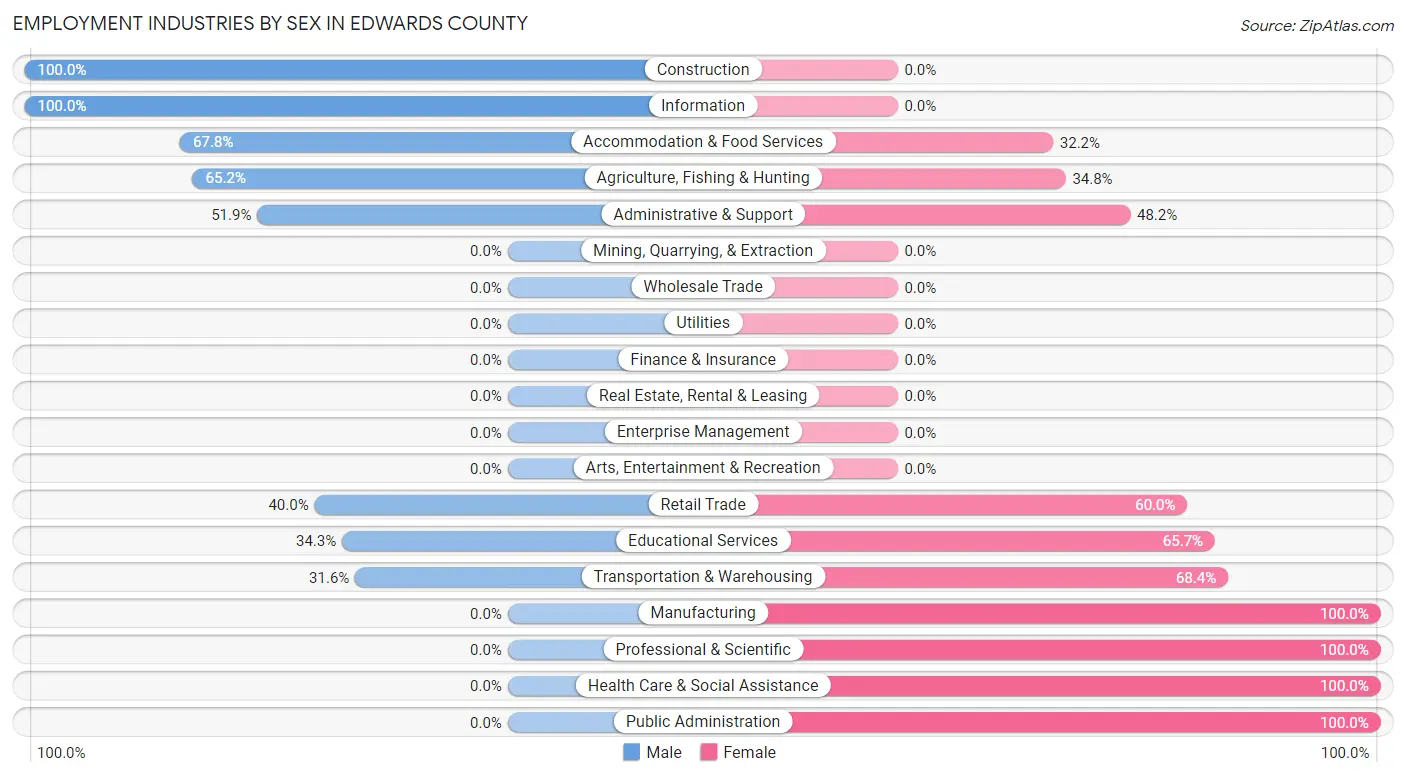
| Industry | Male | Female |
| Agriculture, Fishing & Hunting | 75 (65.2%) | 40 (34.8%) |
| Mining, Quarrying, & Extraction | 0 (0.0%) | 0 (0.0%) |
| Construction | 105 (100.0%) | 0 (0.0%) |
| Manufacturing | 0 (0.0%) | 7 (100.0%) |
| Wholesale Trade | 0 (0.0%) | 0 (0.0%) |
| Retail Trade | 16 (40.0%) | 24 (60.0%) |
| Transportation & Warehousing | 12 (31.6%) | 26 (68.4%) |
| Utilities | 0 (0.0%) | 0 (0.0%) |
| Information | 90 (100.0%) | 0 (0.0%) |
| Finance & Insurance | 0 (0.0%) | 0 (0.0%) |
| Real Estate, Rental & Leasing | 0 (0.0%) | 0 (0.0%) |
| Professional & Scientific | 0 (0.0%) | 9 (100.0%) |
| Enterprise Management | 0 (0.0%) | 0 (0.0%) |
| Administrative & Support | 14 (51.8%) | 13 (48.1%) |
| Educational Services | 12 (34.3%) | 23 (65.7%) |
| Health Care & Social Assistance | 0 (0.0%) | 86 (100.0%) |
| Arts, Entertainment & Recreation | 0 (0.0%) | 0 (0.0%) |
| Accommodation & Food Services | 78 (67.8%) | 37 (32.2%) |
| Public Administration | 0 (0.0%) | 39 (100.0%) |
| Total | 424 (58.2%) | 304 (41.8%) |
Education in Edwards County
School Enrollment in Edwards County
The most common levels of schooling among the 393 students in Edwards County are high school (212 | 53.9%), elementary school (69 | 17.6%), and nursery / preschool (51 | 13.0%).
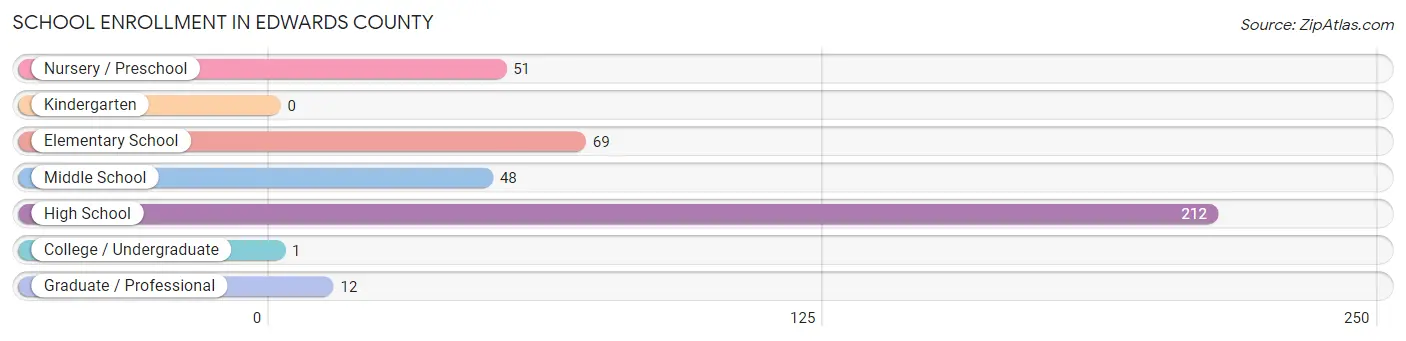
| School Level | # Students | % Students |
| Nursery / Preschool | 51 | 13.0% |
| Kindergarten | 0 | 0.0% |
| Elementary School | 69 | 17.6% |
| Middle School | 48 | 12.2% |
| High School | 212 | 53.9% |
| College / Undergraduate | 1 | 0.3% |
| Graduate / Professional | 12 | 3.0% |
| Total | 393 | 100.0% |
School Enrollment by Age by Funding Source in Edwards County
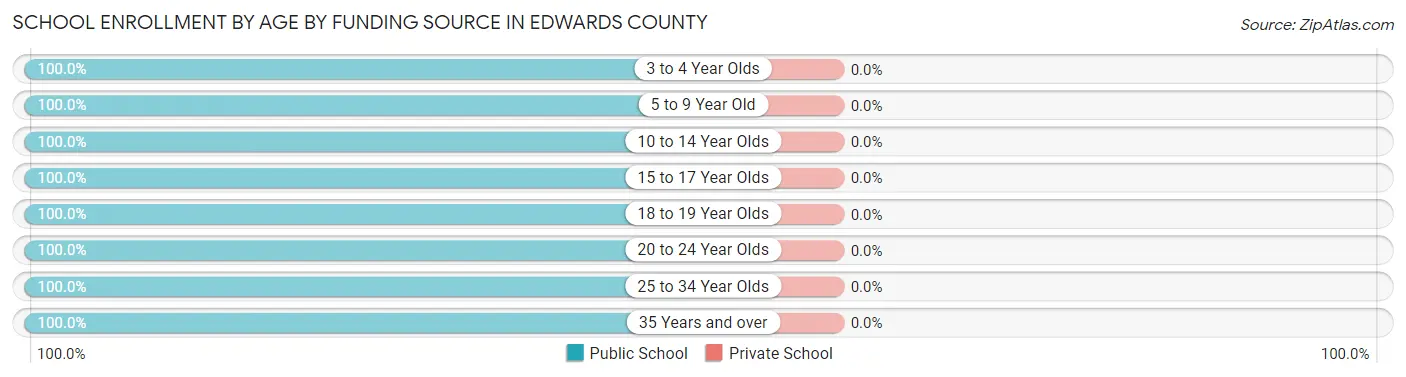
| Age Bracket | Public School | Private School |
| 3 to 4 Year Olds | 25 (100.0%) | 0 (0.0%) |
| 5 to 9 Year Old | 72 (100.0%) | 0 (0.0%) |
| 10 to 14 Year Olds | 71 (100.0%) | 0 (0.0%) |
| 15 to 17 Year Olds | 82 (100.0%) | 0 (0.0%) |
| 18 to 19 Year Olds | 129 (100.0%) | 0 (0.0%) |
| 20 to 24 Year Olds | 1 (100.0%) | 0 (0.0%) |
| 25 to 34 Year Olds | 1 (100.0%) | 0 (0.0%) |
| 35 Years and over | 12 (100.0%) | 0 (0.0%) |
| Total | 393 (100.0%) | 0 (0.0%) |
Educational Attainment by Field of Study in Edwards County
Bio, nature & agricultural (63 | 39.4%), education (36 | 22.5%), literature & languages (29 | 18.1%), engineering (10 | 6.2%), and business (10 | 6.2%) are the most common fields of study among 160 individuals in Edwards County who have obtained a bachelor's degree or higher.
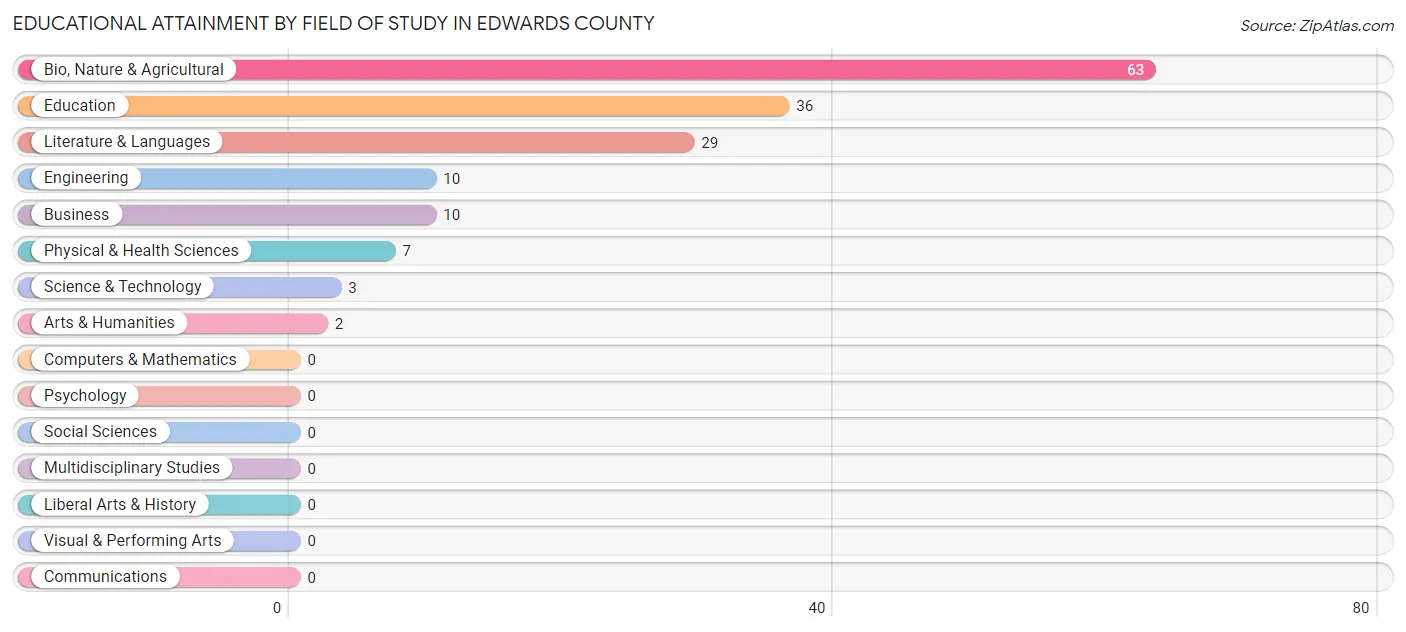
| Field of Study | # Graduates | % Graduates |
| Computers & Mathematics | 0 | 0.0% |
| Bio, Nature & Agricultural | 63 | 39.4% |
| Physical & Health Sciences | 7 | 4.4% |
| Psychology | 0 | 0.0% |
| Social Sciences | 0 | 0.0% |
| Engineering | 10 | 6.2% |
| Multidisciplinary Studies | 0 | 0.0% |
| Science & Technology | 3 | 1.9% |
| Business | 10 | 6.2% |
| Education | 36 | 22.5% |
| Literature & Languages | 29 | 18.1% |
| Liberal Arts & History | 0 | 0.0% |
| Visual & Performing Arts | 0 | 0.0% |
| Communications | 0 | 0.0% |
| Arts & Humanities | 2 | 1.3% |
| Total | 160 | 100.0% |
Transportation & Commute in Edwards County
Vehicle Availability by Sex in Edwards County
The most prevalent vehicle ownership categories in Edwards County are males with 2 vehicles (164, accounting for 38.7%) and females with 2 vehicles (51, making up 56.2%).
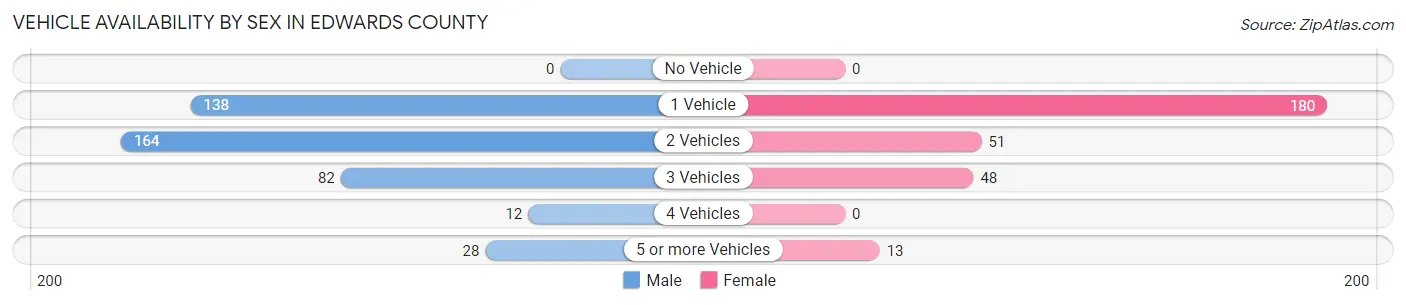
| Vehicles Available | Male | Female |
| No Vehicle | 0 (0.0%) | 0 (0.0%) |
| 1 Vehicle | 138 (32.6%) | 180 (61.6%) |
| 2 Vehicles | 164 (38.7%) | 51 (17.5%) |
| 3 Vehicles | 82 (19.3%) | 48 (16.4%) |
| 4 Vehicles | 12 (2.8%) | 0 (0.0%) |
| 5 or more Vehicles | 28 (6.6%) | 13 (4.4%) |
| Total | 424 (100.0%) | 292 (100.0%) |
Commute Time in Edwards County
The most frequently occuring commute durations in Edwards County are 5 to 9 minutes (189 commuters, 29.1%), less than 5 minutes (162 commuters, 25.0%), and 45 to 59 minutes (90 commuters, 13.9%).
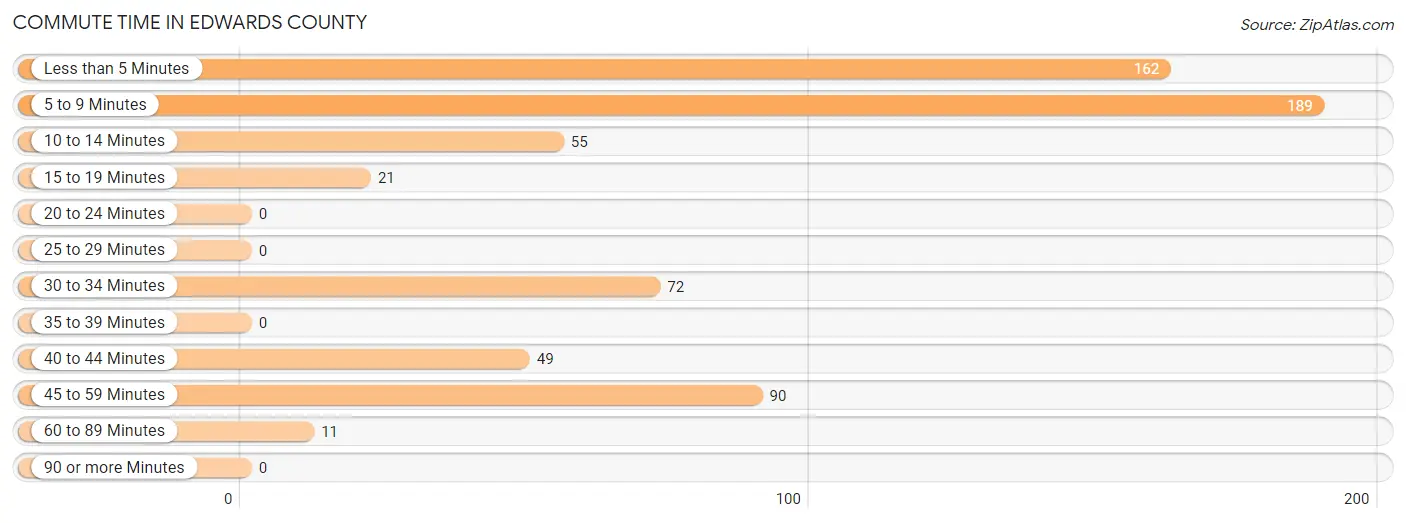
| Commute Time | # Commuters | % Commuters |
| Less than 5 Minutes | 162 | 25.0% |
| 5 to 9 Minutes | 189 | 29.1% |
| 10 to 14 Minutes | 55 | 8.5% |
| 15 to 19 Minutes | 21 | 3.2% |
| 20 to 24 Minutes | 0 | 0.0% |
| 25 to 29 Minutes | 0 | 0.0% |
| 30 to 34 Minutes | 72 | 11.1% |
| 35 to 39 Minutes | 0 | 0.0% |
| 40 to 44 Minutes | 49 | 7.5% |
| 45 to 59 Minutes | 90 | 13.9% |
| 60 to 89 Minutes | 11 | 1.7% |
| 90 or more Minutes | 0 | 0.0% |
Commute Time by Sex in Edwards County
The most common commute times in Edwards County are less than 5 minutes (107 commuters, 26.4%) for males and 5 to 9 minutes (114 commuters, 46.7%) for females.
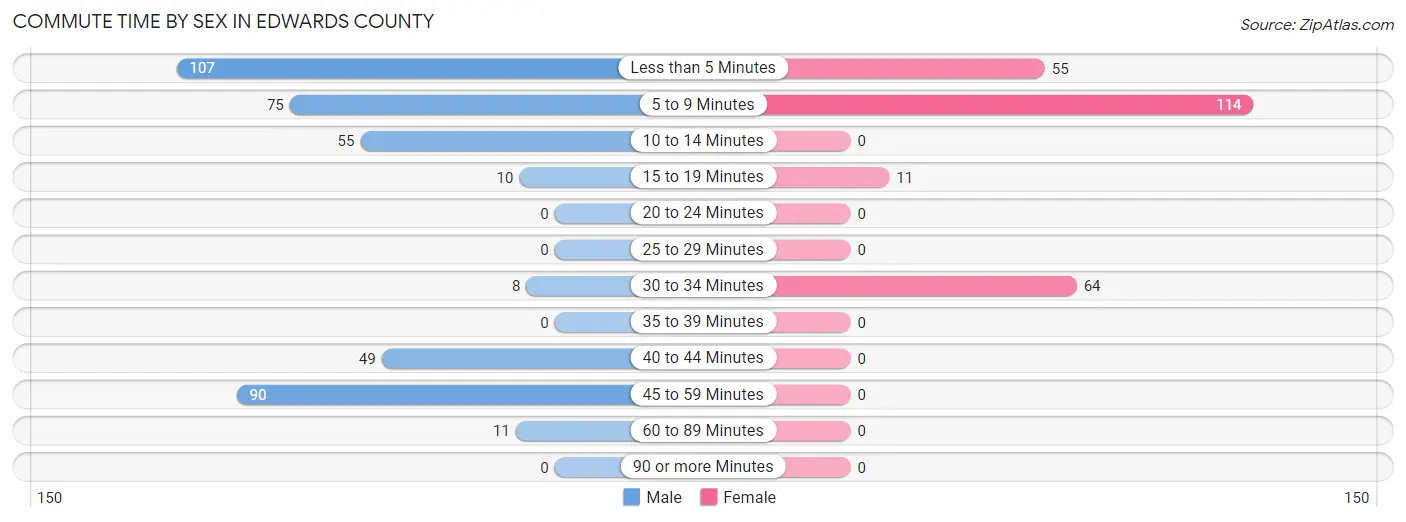
| Commute Time | Male | Female |
| Less than 5 Minutes | 107 (26.4%) | 55 (22.5%) |
| 5 to 9 Minutes | 75 (18.5%) | 114 (46.7%) |
| 10 to 14 Minutes | 55 (13.6%) | 0 (0.0%) |
| 15 to 19 Minutes | 10 (2.5%) | 11 (4.5%) |
| 20 to 24 Minutes | 0 (0.0%) | 0 (0.0%) |
| 25 to 29 Minutes | 0 (0.0%) | 0 (0.0%) |
| 30 to 34 Minutes | 8 (2.0%) | 64 (26.2%) |
| 35 to 39 Minutes | 0 (0.0%) | 0 (0.0%) |
| 40 to 44 Minutes | 49 (12.1%) | 0 (0.0%) |
| 45 to 59 Minutes | 90 (22.2%) | 0 (0.0%) |
| 60 to 89 Minutes | 11 (2.7%) | 0 (0.0%) |
| 90 or more Minutes | 0 (0.0%) | 0 (0.0%) |
Time of Departure to Work by Sex in Edwards County
The most frequent times of departure to work in Edwards County are 7:00 AM to 7:29 AM (130, 32.1%) for males and 12:00 AM to 4:59 AM (65, 26.6%) for females.
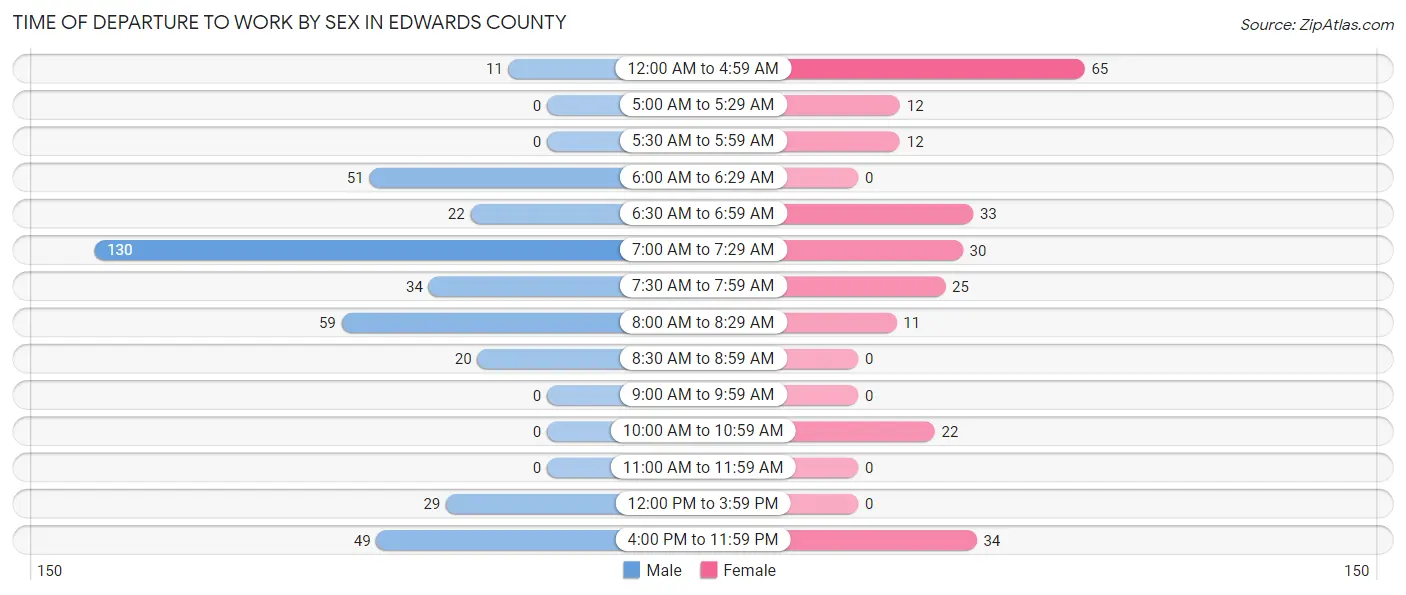
| Time of Departure | Male | Female |
| 12:00 AM to 4:59 AM | 11 (2.7%) | 65 (26.6%) |
| 5:00 AM to 5:29 AM | 0 (0.0%) | 12 (4.9%) |
| 5:30 AM to 5:59 AM | 0 (0.0%) | 12 (4.9%) |
| 6:00 AM to 6:29 AM | 51 (12.6%) | 0 (0.0%) |
| 6:30 AM to 6:59 AM | 22 (5.4%) | 33 (13.5%) |
| 7:00 AM to 7:29 AM | 130 (32.1%) | 30 (12.3%) |
| 7:30 AM to 7:59 AM | 34 (8.4%) | 25 (10.2%) |
| 8:00 AM to 8:29 AM | 59 (14.6%) | 11 (4.5%) |
| 8:30 AM to 8:59 AM | 20 (4.9%) | 0 (0.0%) |
| 9:00 AM to 9:59 AM | 0 (0.0%) | 0 (0.0%) |
| 10:00 AM to 10:59 AM | 0 (0.0%) | 22 (9.0%) |
| 11:00 AM to 11:59 AM | 0 (0.0%) | 0 (0.0%) |
| 12:00 PM to 3:59 PM | 29 (7.2%) | 0 (0.0%) |
| 4:00 PM to 11:59 PM | 49 (12.1%) | 34 (13.9%) |
| Total | 405 (100.0%) | 244 (100.0%) |
Housing Occupancy in Edwards County
Occupancy by Ownership in Edwards County
Of the total 526 dwellings in Edwards County, owner-occupied units account for 430 (81.8%), while renter-occupied units make up 96 (18.2%).
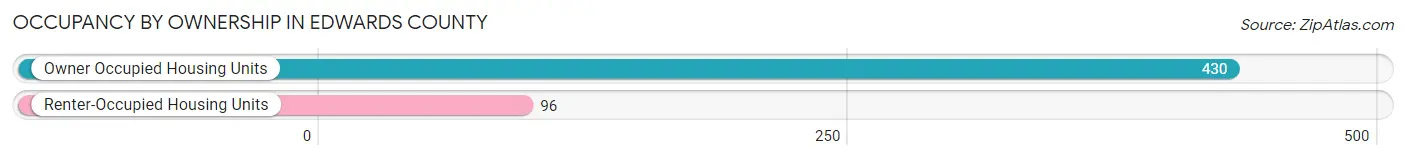
| Occupancy | # Housing Units | % Housing Units |
| Owner Occupied Housing Units | 430 | 81.8% |
| Renter-Occupied Housing Units | 96 | 18.2% |
| Total Occupied Housing Units | 526 | 100.0% |
Occupancy by Household Size in Edwards County
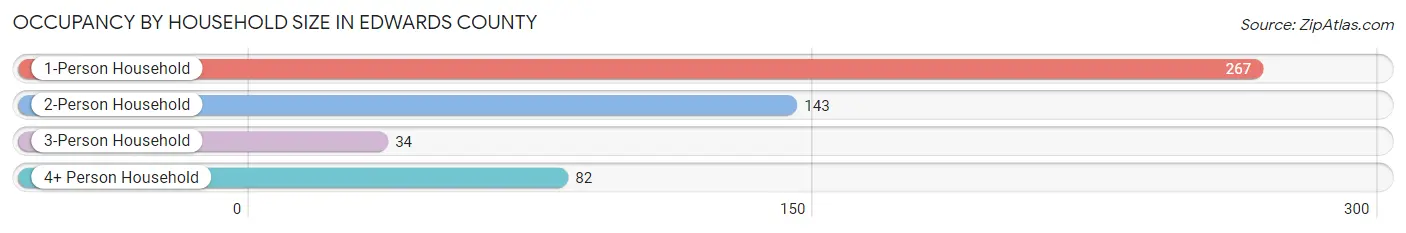
| Household Size | # Housing Units | % Housing Units |
| 1-Person Household | 267 | 50.8% |
| 2-Person Household | 143 | 27.2% |
| 3-Person Household | 34 | 6.5% |
| 4+ Person Household | 82 | 15.6% |
| Total Housing Units | 526 | 100.0% |
Occupancy by Ownership by Household Size in Edwards County
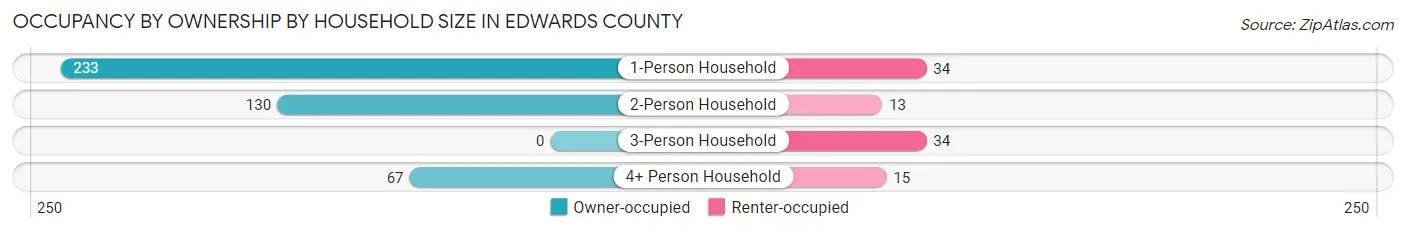
| Household Size | Owner-occupied | Renter-occupied |
| 1-Person Household | 233 (87.3%) | 34 (12.7%) |
| 2-Person Household | 130 (90.9%) | 13 (9.1%) |
| 3-Person Household | 0 (0.0%) | 34 (100.0%) |
| 4+ Person Household | 67 (81.7%) | 15 (18.3%) |
| Total Housing Units | 430 (81.8%) | 96 (18.2%) |
Occupancy by Educational Attainment in Edwards County
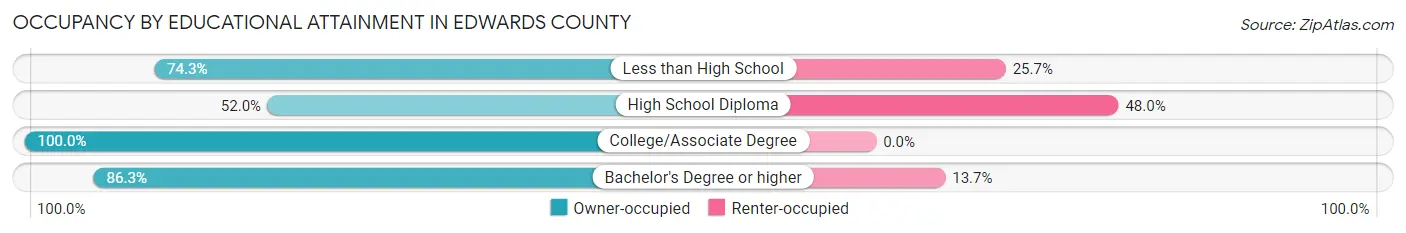
| Household Size | Owner-occupied | Renter-occupied |
| Less than High School | 107 (74.3%) | 37 (25.7%) |
| High School Diploma | 53 (52.0%) | 49 (48.0%) |
| College/Associate Degree | 207 (100.0%) | 0 (0.0%) |
| Bachelor's Degree or higher | 63 (86.3%) | 10 (13.7%) |
Occupancy by Age of Householder in Edwards County
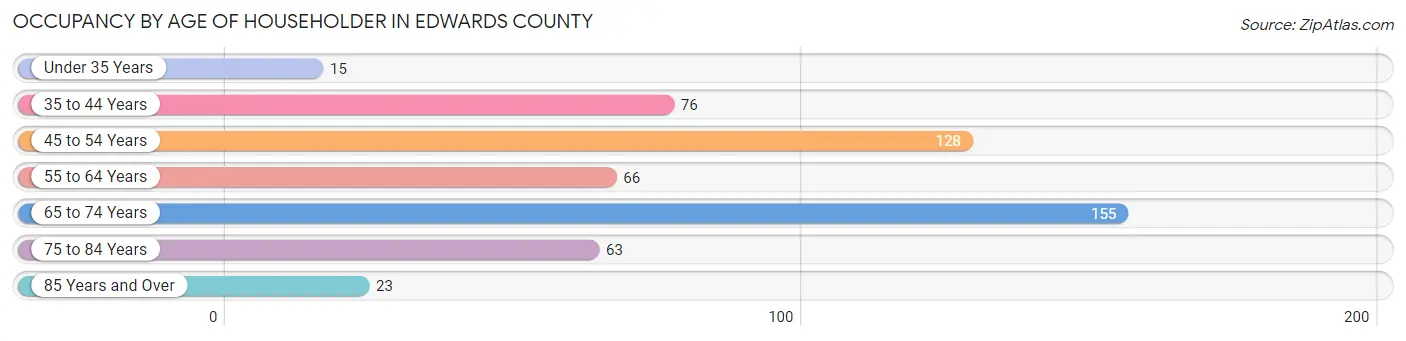
| Age Bracket | # Households | % Households |
| Under 35 Years | 15 | 2.9% |
| 35 to 44 Years | 76 | 14.4% |
| 45 to 54 Years | 128 | 24.3% |
| 55 to 64 Years | 66 | 12.6% |
| 65 to 74 Years | 155 | 29.5% |
| 75 to 84 Years | 63 | 12.0% |
| 85 Years and Over | 23 | 4.4% |
| Total | 526 | 100.0% |
Housing Finances in Edwards County
Median Income by Occupancy in Edwards County
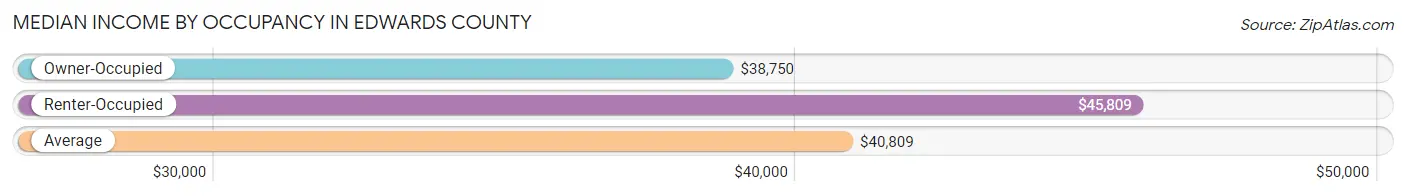
| Occupancy Type | # Households | Median Income |
| Owner-Occupied | 430 (81.8%) | $38,750 |
| Renter-Occupied | 96 (18.2%) | $45,809 |
| Average | 526 (100.0%) | $40,809 |
Occupancy by Householder Income Bracket in Edwards County
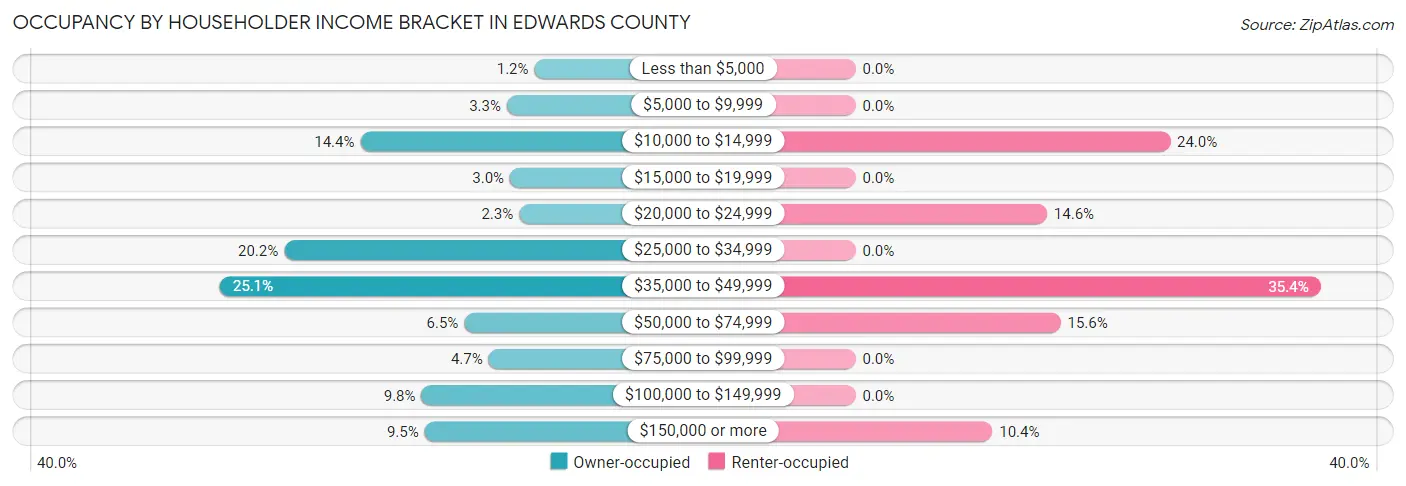
| Income Bracket | Owner-occupied | Renter-occupied |
| Less than $5,000 | 5 (1.2%) | 0 (0.0%) |
| $5,000 to $9,999 | 14 (3.3%) | 0 (0.0%) |
| $10,000 to $14,999 | 62 (14.4%) | 23 (24.0%) |
| $15,000 to $19,999 | 13 (3.0%) | 0 (0.0%) |
| $20,000 to $24,999 | 10 (2.3%) | 14 (14.6%) |
| $25,000 to $34,999 | 87 (20.2%) | 0 (0.0%) |
| $35,000 to $49,999 | 108 (25.1%) | 34 (35.4%) |
| $50,000 to $74,999 | 28 (6.5%) | 15 (15.6%) |
| $75,000 to $99,999 | 20 (4.6%) | 0 (0.0%) |
| $100,000 to $149,999 | 42 (9.8%) | 0 (0.0%) |
| $150,000 or more | 41 (9.5%) | 10 (10.4%) |
| Total | 430 (100.0%) | 96 (100.0%) |
Monthly Housing Cost Tiers in Edwards County
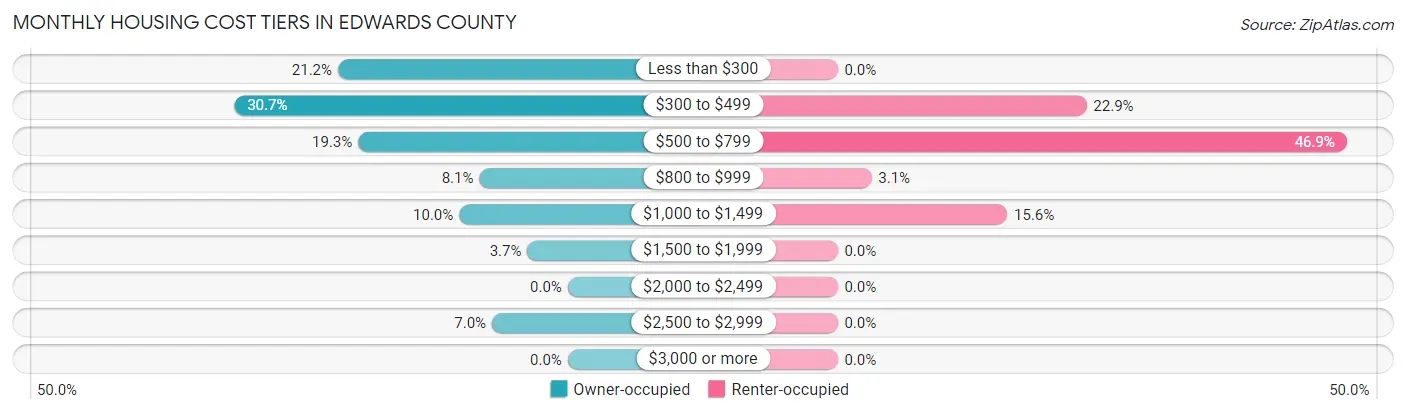
| Monthly Cost | Owner-occupied | Renter-occupied |
| Less than $300 | 91 (21.2%) | 0 (0.0%) |
| $300 to $499 | 132 (30.7%) | 22 (22.9%) |
| $500 to $799 | 83 (19.3%) | 45 (46.9%) |
| $800 to $999 | 35 (8.1%) | 3 (3.1%) |
| $1,000 to $1,499 | 43 (10.0%) | 15 (15.6%) |
| $1,500 to $1,999 | 16 (3.7%) | 0 (0.0%) |
| $2,000 to $2,499 | 0 (0.0%) | 0 (0.0%) |
| $2,500 to $2,999 | 30 (7.0%) | 0 (0.0%) |
| $3,000 or more | 0 (0.0%) | 0 (0.0%) |
| Total | 430 (100.0%) | 96 (100.0%) |
Physical Housing Characteristics in Edwards County
Housing Structures in Edwards County
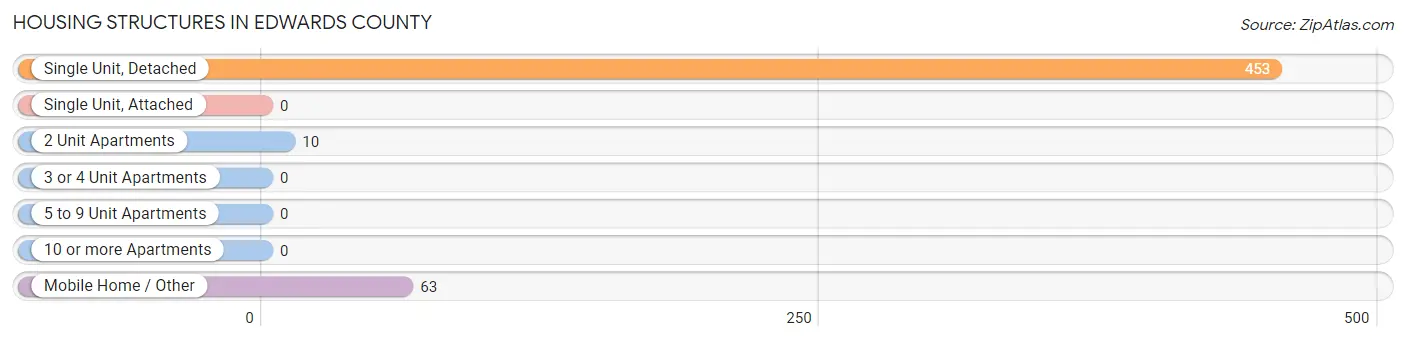
| Structure Type | # Housing Units | % Housing Units |
| Single Unit, Detached | 453 | 86.1% |
| Single Unit, Attached | 0 | 0.0% |
| 2 Unit Apartments | 10 | 1.9% |
| 3 or 4 Unit Apartments | 0 | 0.0% |
| 5 to 9 Unit Apartments | 0 | 0.0% |
| 10 or more Apartments | 0 | 0.0% |
| Mobile Home / Other | 63 | 12.0% |
| Total | 526 | 100.0% |
Housing Structures by Occupancy in Edwards County
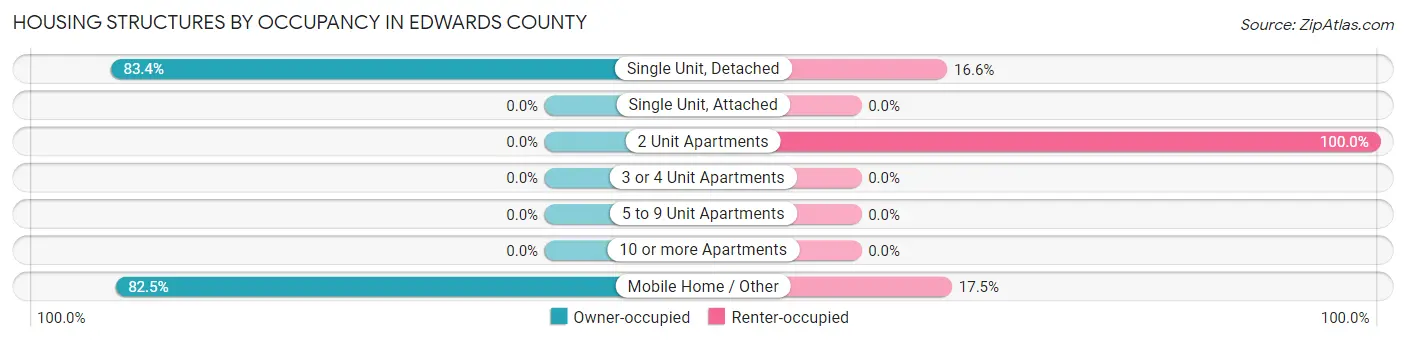
| Structure Type | Owner-occupied | Renter-occupied |
| Single Unit, Detached | 378 (83.4%) | 75 (16.6%) |
| Single Unit, Attached | 0 (0.0%) | 0 (0.0%) |
| 2 Unit Apartments | 0 (0.0%) | 10 (100.0%) |
| 3 or 4 Unit Apartments | 0 (0.0%) | 0 (0.0%) |
| 5 to 9 Unit Apartments | 0 (0.0%) | 0 (0.0%) |
| 10 or more Apartments | 0 (0.0%) | 0 (0.0%) |
| Mobile Home / Other | 52 (82.5%) | 11 (17.5%) |
| Total | 430 (81.8%) | 96 (18.2%) |
Housing Structures by Number of Rooms in Edwards County
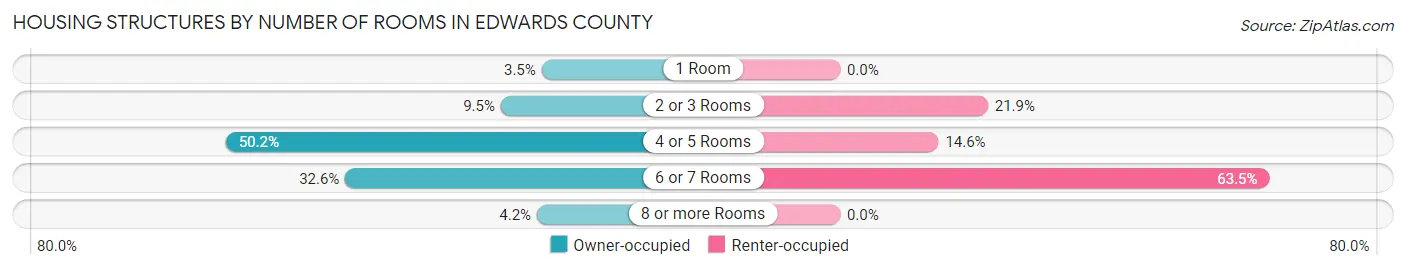
| Number of Rooms | Owner-occupied | Renter-occupied |
| 1 Room | 15 (3.5%) | 0 (0.0%) |
| 2 or 3 Rooms | 41 (9.5%) | 21 (21.9%) |
| 4 or 5 Rooms | 216 (50.2%) | 14 (14.6%) |
| 6 or 7 Rooms | 140 (32.6%) | 61 (63.5%) |
| 8 or more Rooms | 18 (4.2%) | 0 (0.0%) |
| Total | 430 (100.0%) | 96 (100.0%) |
Housing Structure by Heating Type in Edwards County
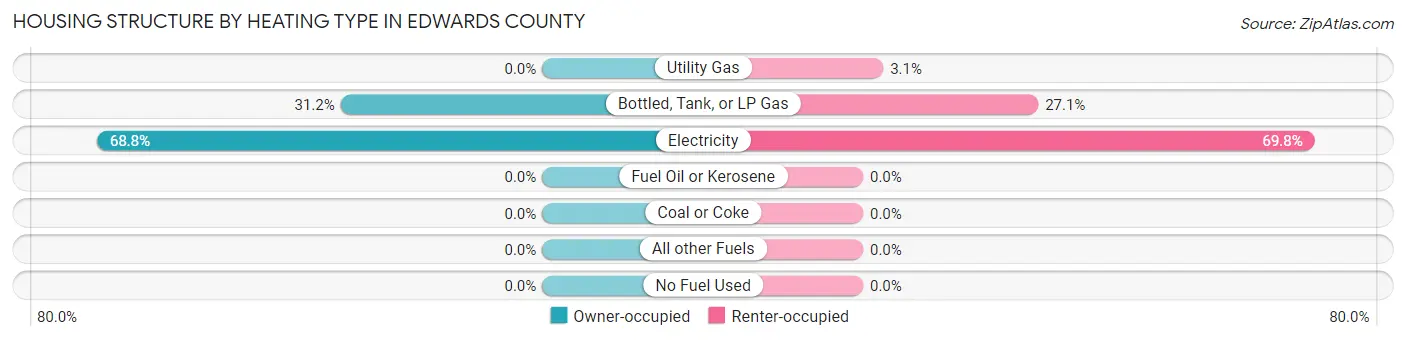
| Heating Type | Owner-occupied | Renter-occupied |
| Utility Gas | 0 (0.0%) | 3 (3.1%) |
| Bottled, Tank, or LP Gas | 134 (31.2%) | 26 (27.1%) |
| Electricity | 296 (68.8%) | 67 (69.8%) |
| Fuel Oil or Kerosene | 0 (0.0%) | 0 (0.0%) |
| Coal or Coke | 0 (0.0%) | 0 (0.0%) |
| All other Fuels | 0 (0.0%) | 0 (0.0%) |
| No Fuel Used | 0 (0.0%) | 0 (0.0%) |
| Total | 430 (100.0%) | 96 (100.0%) |
Household Vehicle Usage in Edwards County
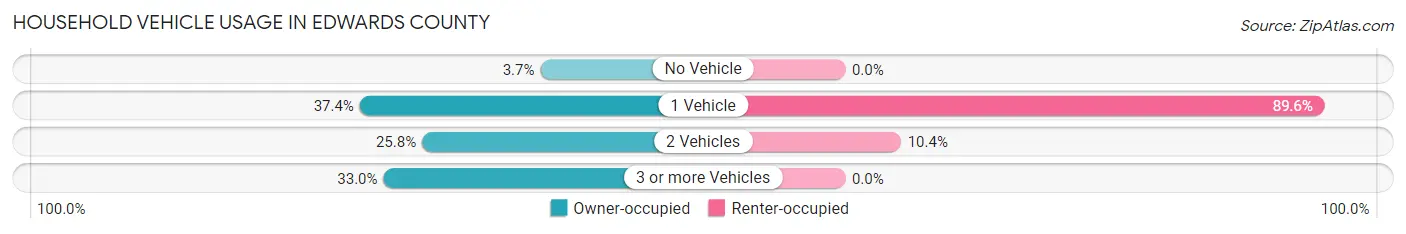
| Vehicles per Household | Owner-occupied | Renter-occupied |
| No Vehicle | 16 (3.7%) | 0 (0.0%) |
| 1 Vehicle | 161 (37.4%) | 86 (89.6%) |
| 2 Vehicles | 111 (25.8%) | 10 (10.4%) |
| 3 or more Vehicles | 142 (33.0%) | 0 (0.0%) |
| Total | 430 (100.0%) | 96 (100.0%) |
Real Estate & Mortgages in Edwards County
Real Estate and Mortgage Overview in Edwards County
| Characteristic | Without Mortgage | With Mortgage |
| Housing Units | 316 | 114 |
| Median Property Value | $54,500 | $0 |
| Median Household Income | $36,354 | $34 |
| Monthly Housing Costs | $381 | $0 |
| Real Estate Taxes | $743 | $0 |
Property Value by Mortgage Status in Edwards County
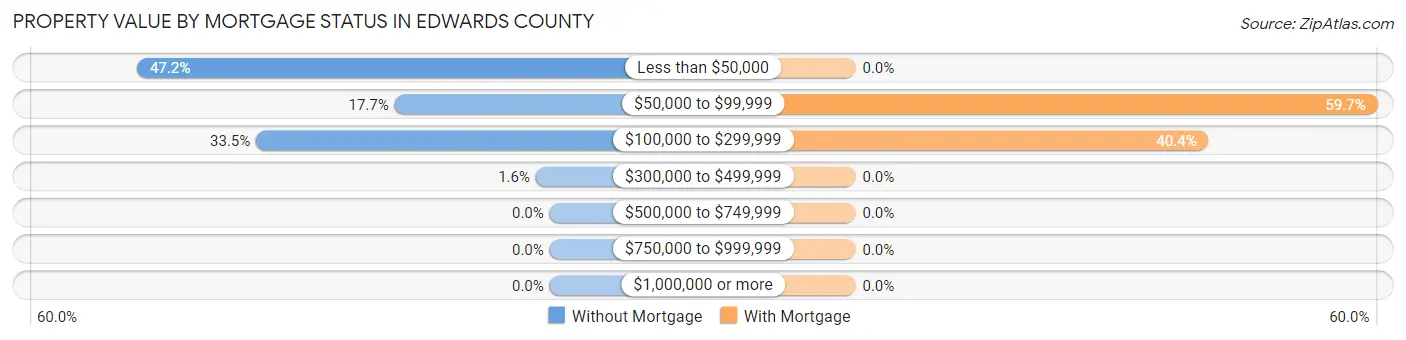
| Property Value | Without Mortgage | With Mortgage |
| Less than $50,000 | 149 (47.1%) | 0 (0.0%) |
| $50,000 to $99,999 | 56 (17.7%) | 68 (59.7%) |
| $100,000 to $299,999 | 106 (33.5%) | 46 (40.4%) |
| $300,000 to $499,999 | 5 (1.6%) | 0 (0.0%) |
| $500,000 to $749,999 | 0 (0.0%) | 0 (0.0%) |
| $750,000 to $999,999 | 0 (0.0%) | 0 (0.0%) |
| $1,000,000 or more | 0 (0.0%) | 0 (0.0%) |
| Total | 316 (100.0%) | 114 (100.0%) |
Household Income by Mortgage Status in Edwards County
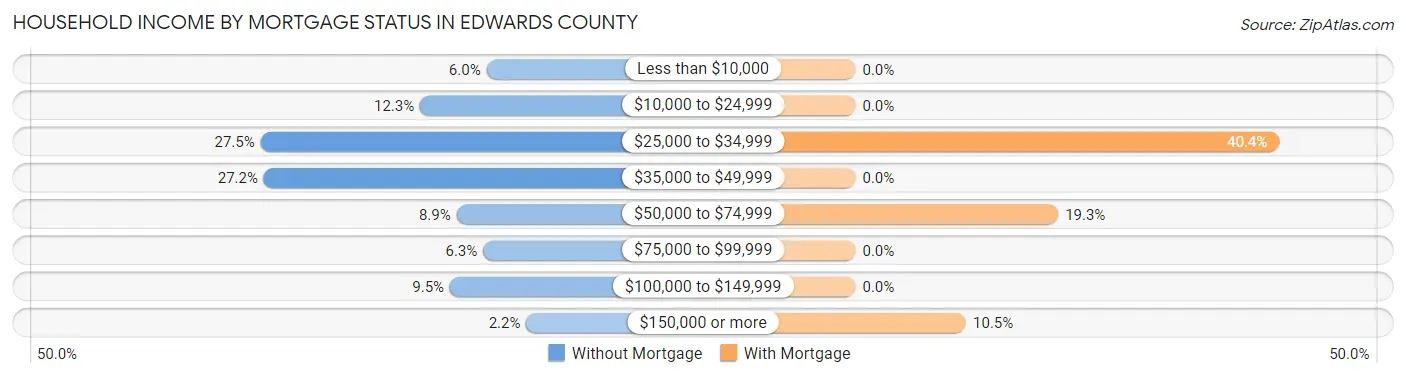
| Household Income | Without Mortgage | With Mortgage |
| Less than $10,000 | 19 (6.0%) | 0 (0.0%) |
| $10,000 to $24,999 | 39 (12.3%) | 0 (0.0%) |
| $25,000 to $34,999 | 87 (27.5%) | 46 (40.4%) |
| $35,000 to $49,999 | 86 (27.2%) | 0 (0.0%) |
| $50,000 to $74,999 | 28 (8.9%) | 22 (19.3%) |
| $75,000 to $99,999 | 20 (6.3%) | 0 (0.0%) |
| $100,000 to $149,999 | 30 (9.5%) | 0 (0.0%) |
| $150,000 or more | 7 (2.2%) | 12 (10.5%) |
| Total | 316 (100.0%) | 114 (100.0%) |
Property Value to Household Income Ratio in Edwards County
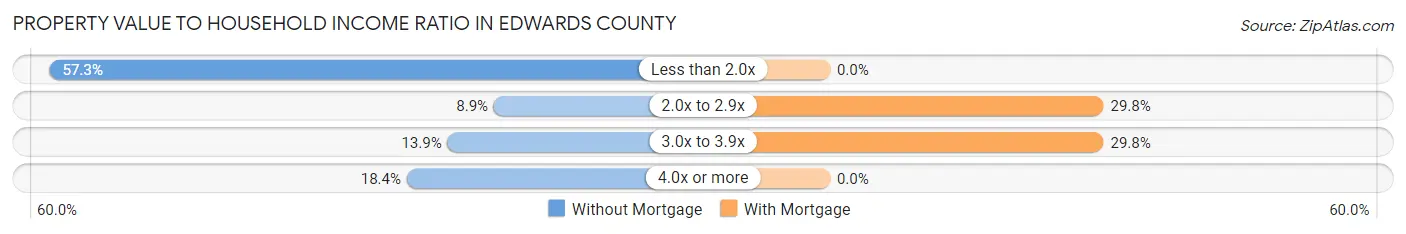
| Value-to-Income Ratio | Without Mortgage | With Mortgage |
| Less than 2.0x | 181 (57.3%) | 0 (0.0%) |
| 2.0x to 2.9x | 28 (8.9%) | 34 (29.8%) |
| 3.0x to 3.9x | 44 (13.9%) | 34 (29.8%) |
| 4.0x or more | 58 (18.3%) | 0 (0.0%) |
| Total | 316 (100.0%) | 114 (100.0%) |
Real Estate Taxes by Mortgage Status in Edwards County
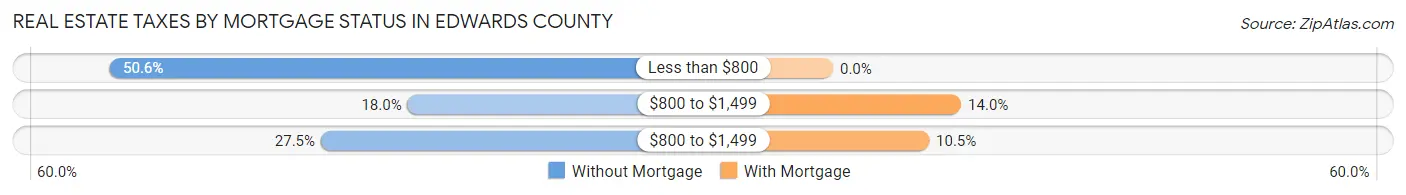
| Property Taxes | Without Mortgage | With Mortgage |
| Less than $800 | 160 (50.6%) | 0 (0.0%) |
| $800 to $1,499 | 57 (18.0%) | 16 (14.0%) |
| $800 to $1,499 | 87 (27.5%) | 12 (10.5%) |
| Total | 316 (100.0%) | 114 (100.0%) |
Health & Disability in Edwards County
Health Insurance Coverage by Age in Edwards County
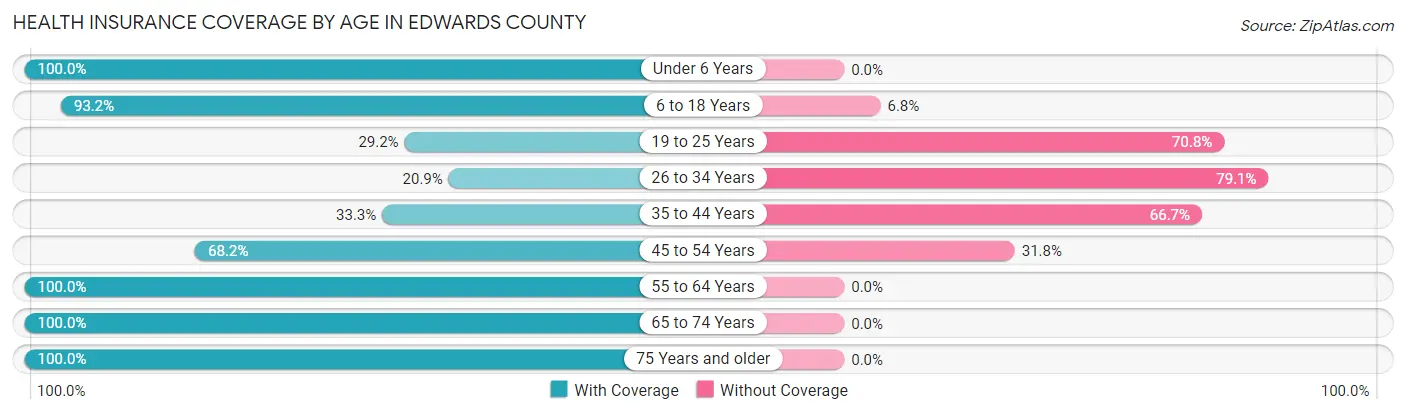
| Age Bracket | With Coverage | Without Coverage |
| Under 6 Years | 71 (100.0%) | 0 (0.0%) |
| 6 to 18 Years | 276 (93.2%) | 20 (6.8%) |
| 19 to 25 Years | 49 (29.2%) | 119 (70.8%) |
| 26 to 34 Years | 9 (20.9%) | 34 (79.1%) |
| 35 to 44 Years | 53 (33.3%) | 106 (66.7%) |
| 45 to 54 Years | 148 (68.2%) | 69 (31.8%) |
| 55 to 64 Years | 89 (100.0%) | 0 (0.0%) |
| 65 to 74 Years | 193 (100.0%) | 0 (0.0%) |
| 75 Years and older | 110 (100.0%) | 0 (0.0%) |
| Total | 998 (74.2%) | 348 (25.9%) |
Health Insurance Coverage by Citizenship Status in Edwards County
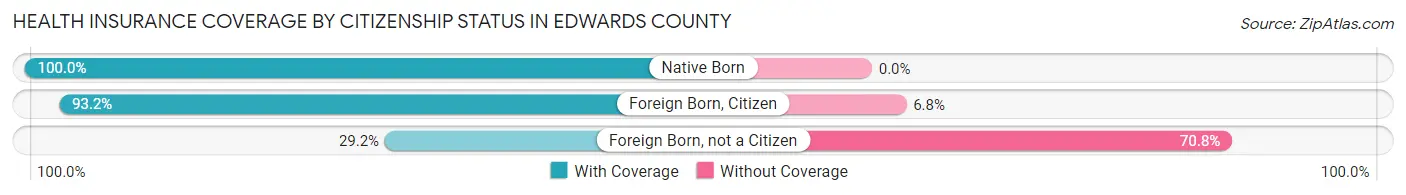
| Citizenship Status | With Coverage | Without Coverage |
| Native Born | 71 (100.0%) | 0 (0.0%) |
| Foreign Born, Citizen | 276 (93.2%) | 20 (6.8%) |
| Foreign Born, not a Citizen | 49 (29.2%) | 119 (70.8%) |
Health Insurance Coverage by Household Income in Edwards County
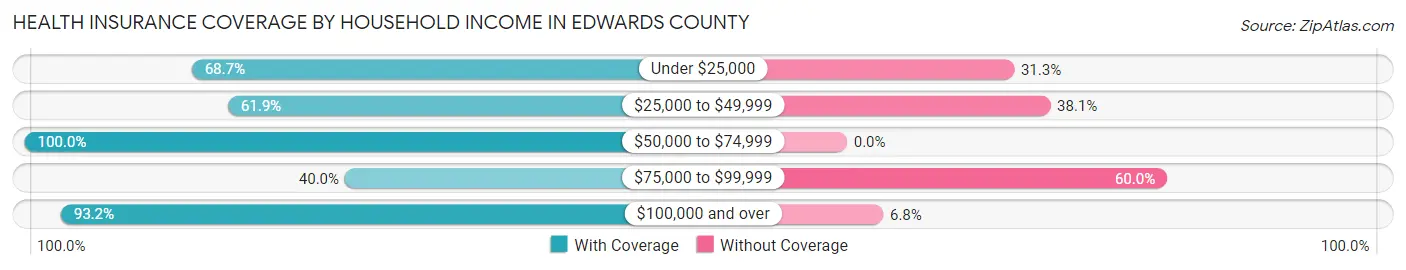
| Household Income | With Coverage | Without Coverage |
| Under $25,000 | 239 (68.7%) | 109 (31.3%) |
| $25,000 to $49,999 | 333 (61.9%) | 205 (38.1%) |
| $50,000 to $74,999 | 155 (100.0%) | 0 (0.0%) |
| $75,000 to $99,999 | 10 (40.0%) | 15 (60.0%) |
| $100,000 and over | 261 (93.2%) | 19 (6.8%) |
Public vs Private Health Insurance Coverage by Age in Edwards County
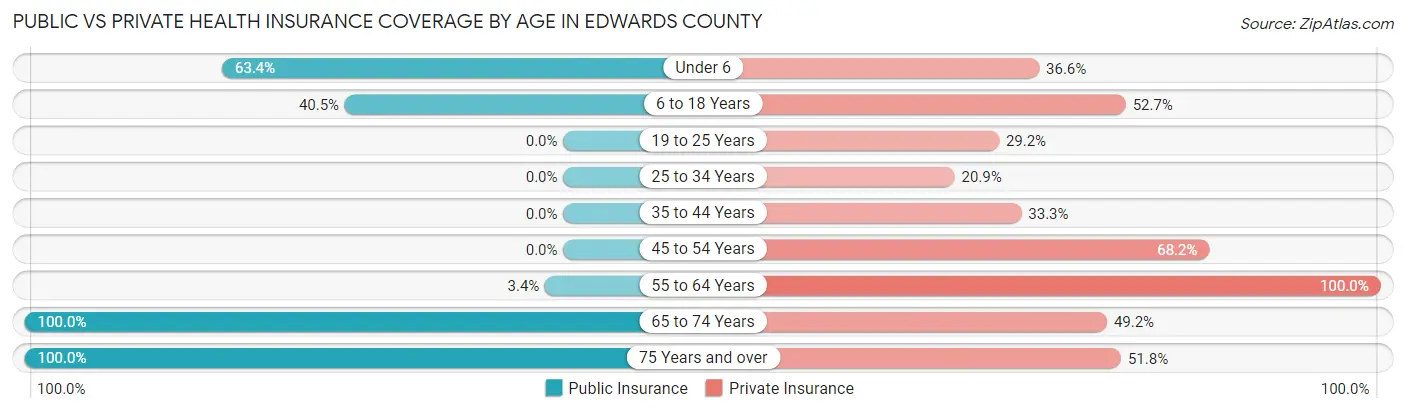
| Age Bracket | Public Insurance | Private Insurance |
| Under 6 | 45 (63.4%) | 26 (36.6%) |
| 6 to 18 Years | 120 (40.5%) | 156 (52.7%) |
| 19 to 25 Years | 0 (0.0%) | 49 (29.2%) |
| 25 to 34 Years | 0 (0.0%) | 9 (20.9%) |
| 35 to 44 Years | 0 (0.0%) | 53 (33.3%) |
| 45 to 54 Years | 0 (0.0%) | 148 (68.2%) |
| 55 to 64 Years | 3 (3.4%) | 89 (100.0%) |
| 65 to 74 Years | 193 (100.0%) | 95 (49.2%) |
| 75 Years and over | 110 (100.0%) | 57 (51.8%) |
| Total | 471 (35.0%) | 682 (50.7%) |
Disability Status by Sex by Age in Edwards County
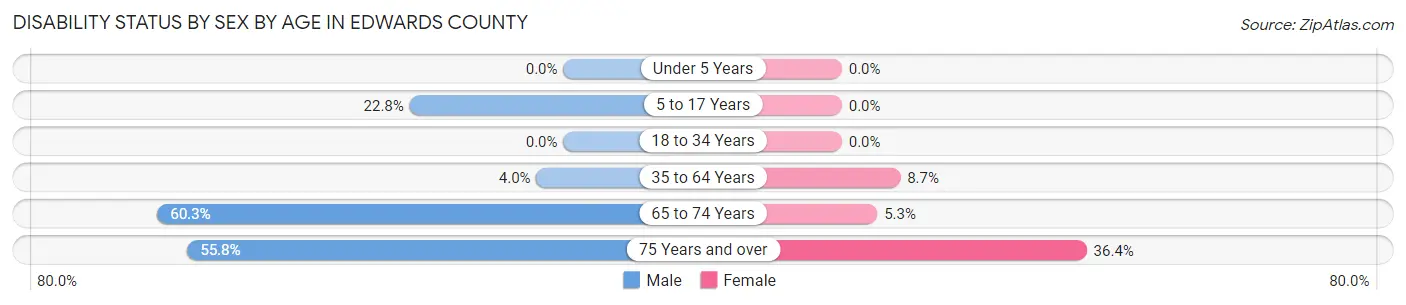
| Age Bracket | Male | Female |
| Under 5 Years | 0 (0.0%) | 0 (0.0%) |
| 5 to 17 Years | 21 (22.8%) | 0 (0.0%) |
| 18 to 34 Years | 0 (0.0%) | 0 (0.0%) |
| 35 to 64 Years | 8 (4.0%) | 23 (8.7%) |
| 65 to 74 Years | 82 (60.3%) | 3 (5.3%) |
| 75 Years and over | 43 (55.8%) | 12 (36.4%) |
Disability Class by Sex by Age in Edwards County
Disability Class: Hearing Difficulty
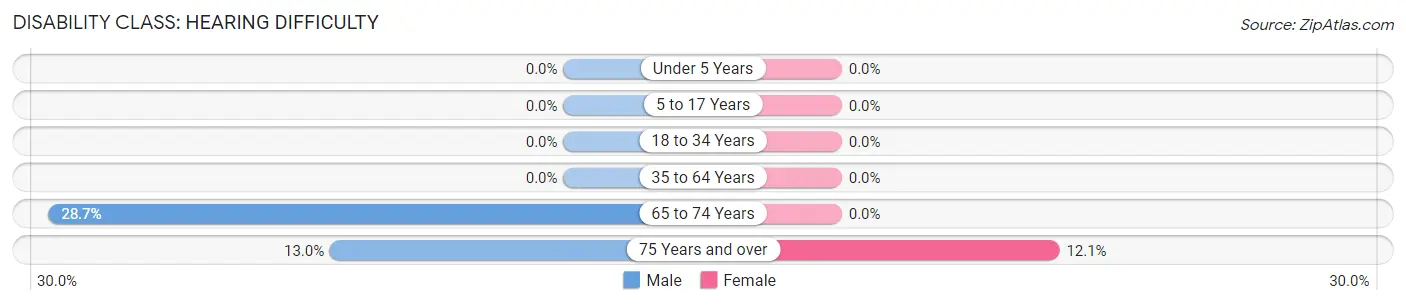
| Age Bracket | Male | Female |
| Under 5 Years | 0 (0.0%) | 0 (0.0%) |
| 5 to 17 Years | 0 (0.0%) | 0 (0.0%) |
| 18 to 34 Years | 0 (0.0%) | 0 (0.0%) |
| 35 to 64 Years | 0 (0.0%) | 0 (0.0%) |
| 65 to 74 Years | 39 (28.7%) | 0 (0.0%) |
| 75 Years and over | 10 (13.0%) | 4 (12.1%) |
Disability Class: Vision Difficulty
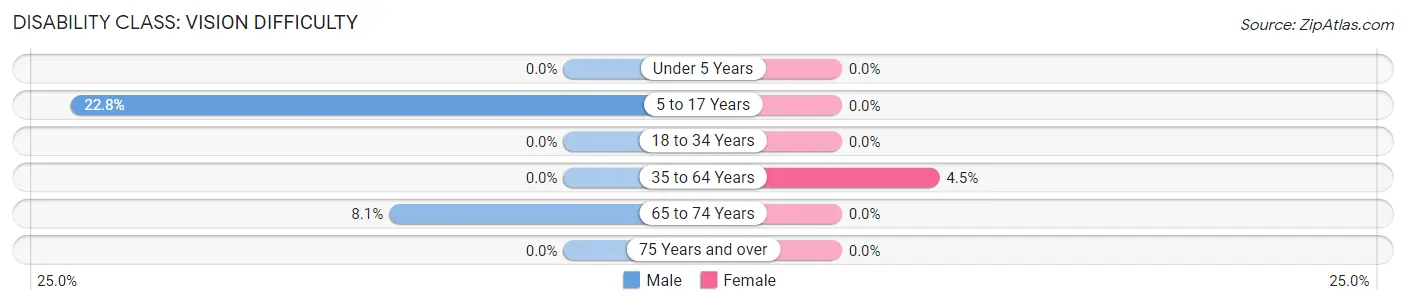
| Age Bracket | Male | Female |
| Under 5 Years | 0 (0.0%) | 0 (0.0%) |
| 5 to 17 Years | 21 (22.8%) | 0 (0.0%) |
| 18 to 34 Years | 0 (0.0%) | 0 (0.0%) |
| 35 to 64 Years | 0 (0.0%) | 12 (4.5%) |
| 65 to 74 Years | 11 (8.1%) | 0 (0.0%) |
| 75 Years and over | 0 (0.0%) | 0 (0.0%) |
Disability Class: Cognitive Difficulty
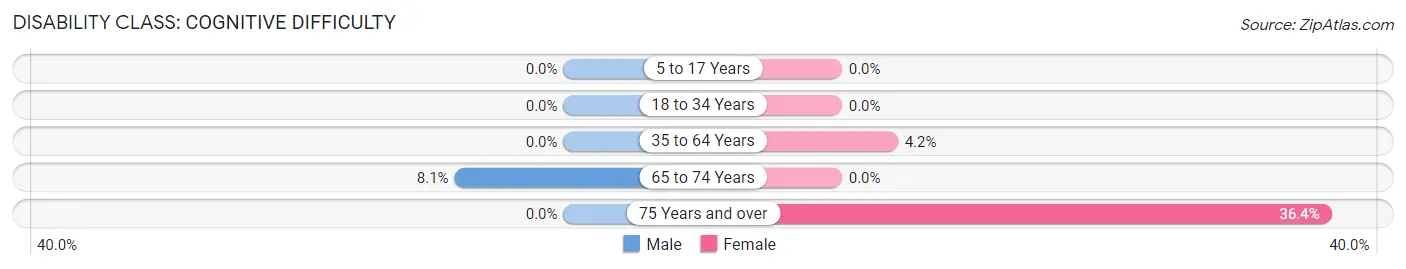
| Age Bracket | Male | Female |
| 5 to 17 Years | 0 (0.0%) | 0 (0.0%) |
| 18 to 34 Years | 0 (0.0%) | 0 (0.0%) |
| 35 to 64 Years | 0 (0.0%) | 11 (4.2%) |
| 65 to 74 Years | 11 (8.1%) | 0 (0.0%) |
| 75 Years and over | 0 (0.0%) | 12 (36.4%) |
Disability Class: Ambulatory Difficulty
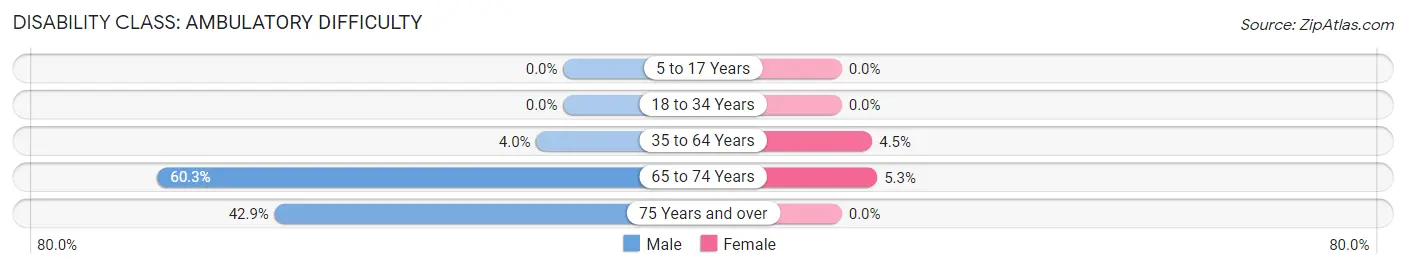
| Age Bracket | Male | Female |
| 5 to 17 Years | 0 (0.0%) | 0 (0.0%) |
| 18 to 34 Years | 0 (0.0%) | 0 (0.0%) |
| 35 to 64 Years | 8 (4.0%) | 12 (4.5%) |
| 65 to 74 Years | 82 (60.3%) | 3 (5.3%) |
| 75 Years and over | 33 (42.9%) | 0 (0.0%) |
Disability Class: Self-Care Difficulty
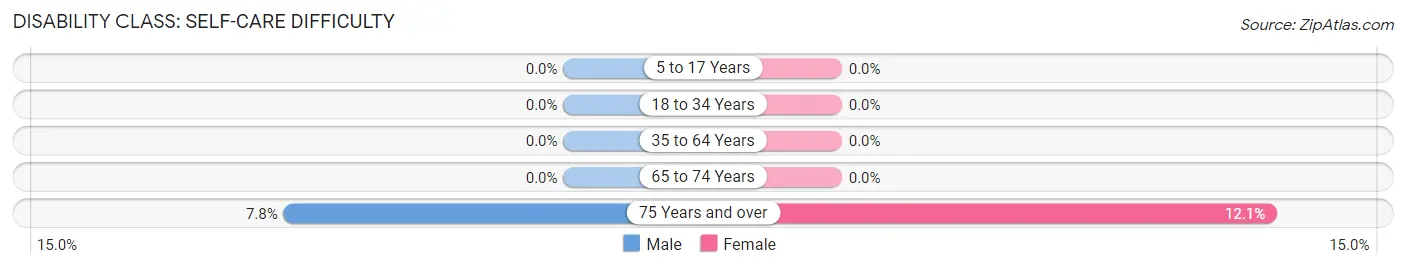
| Age Bracket | Male | Female |
| 5 to 17 Years | 0 (0.0%) | 0 (0.0%) |
| 18 to 34 Years | 0 (0.0%) | 0 (0.0%) |
| 35 to 64 Years | 0 (0.0%) | 0 (0.0%) |
| 65 to 74 Years | 0 (0.0%) | 0 (0.0%) |
| 75 Years and over | 6 (7.8%) | 4 (12.1%) |
Technology Access in Edwards County
Computing Device Access in Edwards County
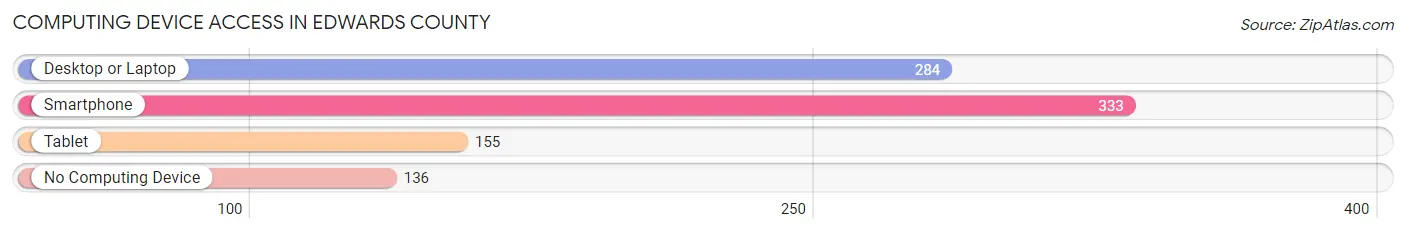
| Device Type | # Households | % Households |
| Desktop or Laptop | 284 | 54.0% |
| Smartphone | 333 | 63.3% |
| Tablet | 155 | 29.5% |
| No Computing Device | 136 | 25.9% |
| Total | 526 | 100.0% |
Internet Access in Edwards County
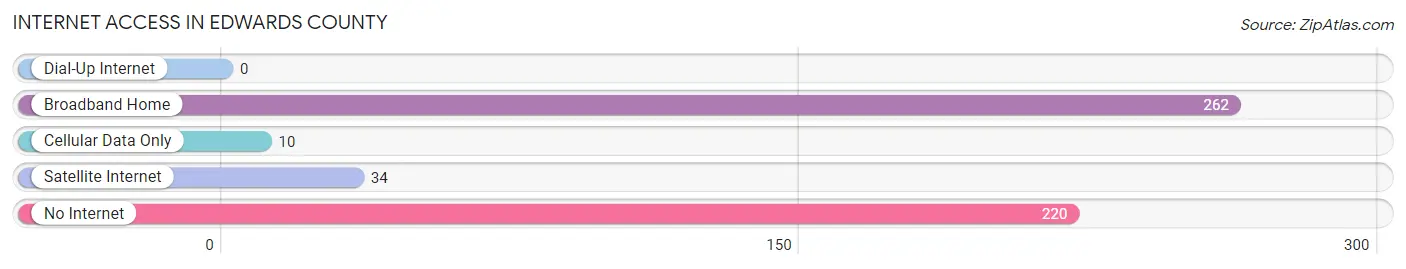
| Internet Type | # Households | % Households |
| Dial-Up Internet | 0 | 0.0% |
| Broadband Home | 262 | 49.8% |
| Cellular Data Only | 10 | 1.9% |
| Satellite Internet | 34 | 6.5% |
| No Internet | 220 | 41.8% |
| Total | 526 | 100.0% |
Edwards County Summary
Edwards County is located in the south-central region of Texas, and is part of the Edwards Plateau. It is bordered by Kinney County to the north, Uvalde County to the east, Real County to the south, and Val Verde County to the west. The county seat is Rocksprings, and the county has a total area of 1,878 square miles.
History
Edwards County was established in 1858 and named for Haden Edwards, a signer of the Texas Declaration of Independence. The county was originally part of Bexar County, but was later divided into its own county. The first settlers in the area were ranchers, who were attracted to the area by the abundance of water and grass. The first town in the county was Rocksprings, which was established in 1876.
Geography
Edwards County is located in the Edwards Plateau, which is a region of rolling hills and limestone outcroppings. The terrain is mostly flat, with some areas of rolling hills. The county is home to several rivers, including the Nueces, Frio, and San Saba. The climate is semi-arid, with hot summers and mild winters.
Economy
The economy of Edwards County is largely based on agriculture and ranching. The county is home to several large ranches, and the main crops grown in the area are cotton, corn, wheat, and sorghum. The county also has a thriving tourism industry, with visitors coming to the area to hunt, fish, and enjoy the natural beauty of the area.
Demographics
As of the 2010 census, the population of Edwards County was 2,002. The racial makeup of the county was 81.3% White, 0.7% African American, 0.3% Native American, 0.2% Asian, 0.1% Pacific Islander, 15.7% from other races, and 1.9% from two or more races. Hispanic or Latino of any race were 37.2% of the population.
The median income for a household in the county was $30,938, and the median income for a family was $35,938. The per capita income for the county was $15,938. About 17.2% of families and 21.2% of the population were below the poverty line, including 28.2% of those under age 18 and 15.2% of those age 65 or over.
Conclusion
Edwards County is a rural county located in the south-central region of Texas. It is home to several large ranches and is known for its abundance of water and grass. The economy of the county is largely based on agriculture and ranching, and the county also has a thriving tourism industry. The population of the county is largely white, with a significant Hispanic or Latino population. The median income for a household in the county is lower than the state average, and the poverty rate is higher than the state average.
Common Questions
What is Per Capita Income in Edwards County?
Per Capita income in Edwards County is $25,218.
What is the Median Family Income in Edwards County?
Median Family Income in Edwards County is $46,860.
What is the Median Household income in Edwards County?
Median Household Income in Edwards County is $40,809.
What is Income or Wage Gap in Edwards County?
Income or Wage Gap in Edwards County is 37.1%.
Women in Edwards County earn 62.9 cents for every dollar earned by a man.
What is Inequality or Gini Index in Edwards County?
Inequality or Gini Index in Edwards County is 0.48.
What is the Total Population of Edwards County?
Total Population of Edwards County is 1,380.
What is the Total Male Population of Edwards County?
Total Male Population of Edwards County is 769.
What is the Total Female Population of Edwards County?
Total Female Population of Edwards County is 611.
What is the Ratio of Males per 100 Females in Edwards County?
There are 125.86 Males per 100 Females in Edwards County.
What is the Ratio of Females per 100 Males in Edwards County?
There are 79.45 Females per 100 Males in Edwards County.
What is the Median Population Age in Edwards County?
Median Population Age in Edwards County is 40.2 Years.
What is the Average Family Size in Edwards County
Average Family Size in Edwards County is 4.0 People.
What is the Average Household Size in Edwards County
Average Household Size in Edwards County is 2.6 People.
How Large is the Labor Force in Edwards County?
There are 728 People in the Labor Forcein in Edwards County.
What is the Percentage of People in the Labor Force in Edwards County?
65.6% of People are in the Labor Force in Edwards County.