Eastland County, TX Map & Demographics
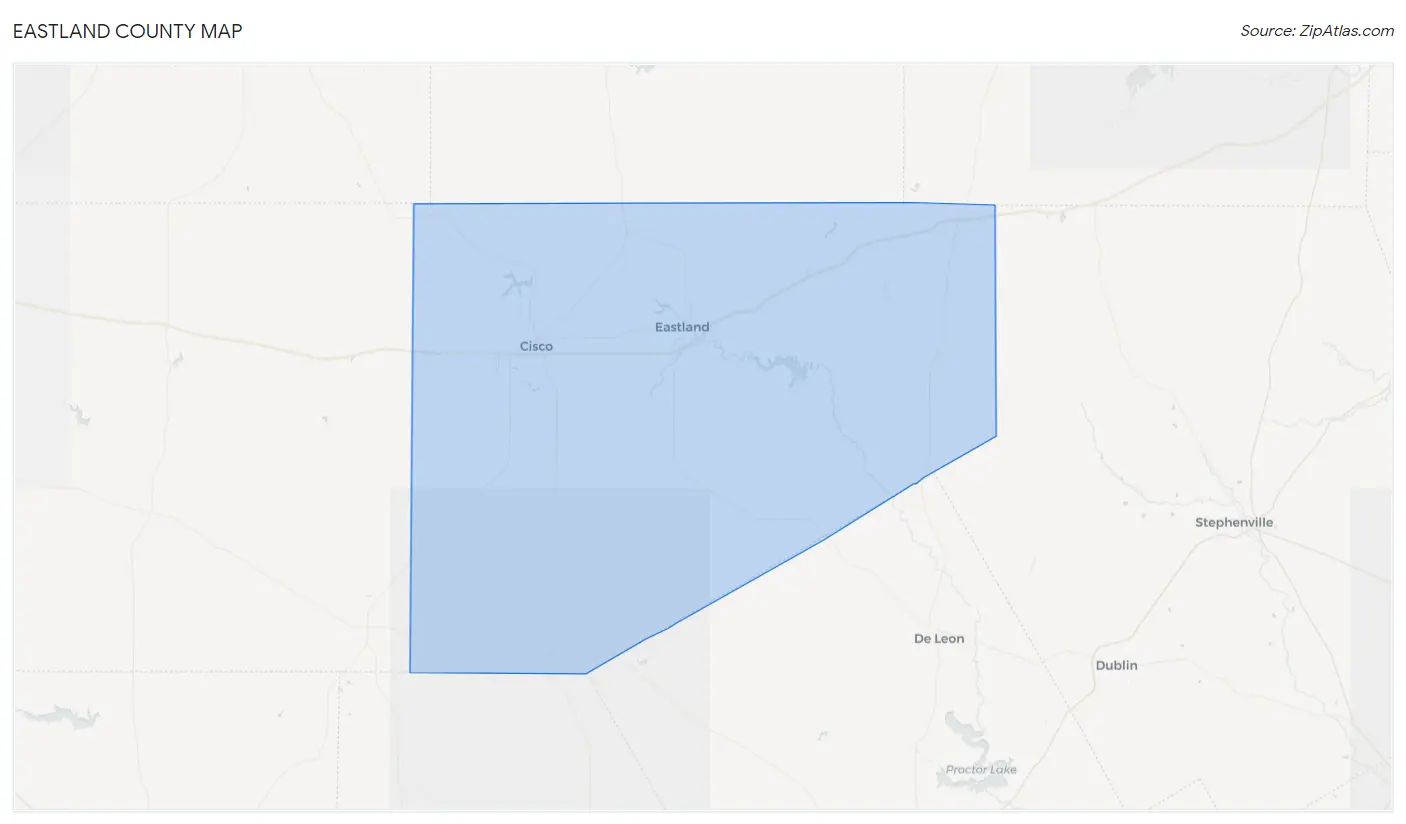
Eastland County Map
Eastland County Overview
$31,197
PER CAPITA INCOME
$70,806
AVG FAMILY INCOME
$52,902
AVG HOUSEHOLD INCOME
29.1%
WAGE / INCOME GAP [ % ]
70.9¢/ $1
WAGE / INCOME GAP [ $ ]
$10,584
FAMILY INCOME DEFICIT
0.48
INEQUALITY / GINI INDEX
17,812
TOTAL POPULATION
8,957
MALE POPULATION
8,855
FEMALE POPULATION
101.15
MALES / 100 FEMALES
98.86
FEMALES / 100 MALES
41.5
MEDIAN AGE
2.9
AVG FAMILY SIZE
2.4
AVG HOUSEHOLD SIZE
8,118
LABOR FORCE [ PEOPLE ]
56.1%
PERCENT IN LABOR FORCE
4.9%
UNEMPLOYMENT RATE
Income in Eastland County
Income Overview in Eastland County
Per Capita Income in Eastland County is $31,197, while median incomes of families and households are $70,806 and $52,902 respectively.
| Characteristic | Number | Measure |
| Per Capita Income | 17,812 | $31,197 |
| Median Family Income | 4,716 | $70,806 |
| Mean Family Income | 4,716 | $90,552 |
| Median Household Income | 7,083 | $52,902 |
| Mean Household Income | 7,083 | $75,893 |
| Income Deficit | 4,716 | $10,584 |
| Wage / Income Gap (%) | 17,812 | 29.10% |
| Wage / Income Gap ($) | 17,812 | 70.90¢ per $1 |
| Gini / Inequality Index | 17,812 | 0.48 |
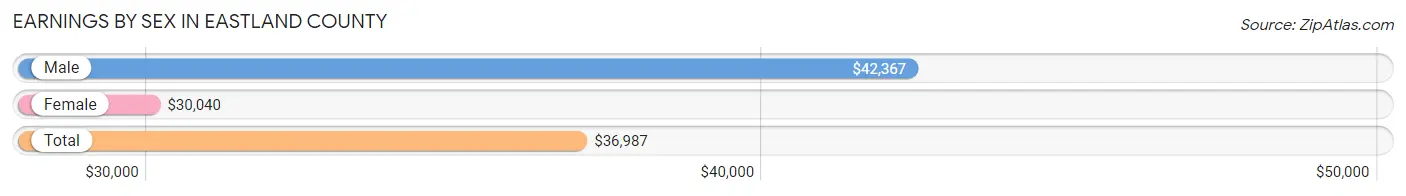
Earnings by Sex in Eastland County
Average Earnings in Eastland County are $36,987, $42,367 for men and $30,040 for women, a difference of 29.1%.
| Sex | Number | Average Earnings |
| Male | 5,078 (56.5%) | $42,367 |
| Female | 3,903 (43.5%) | $30,040 |
| Total | 8,981 (100.0%) | $36,987 |
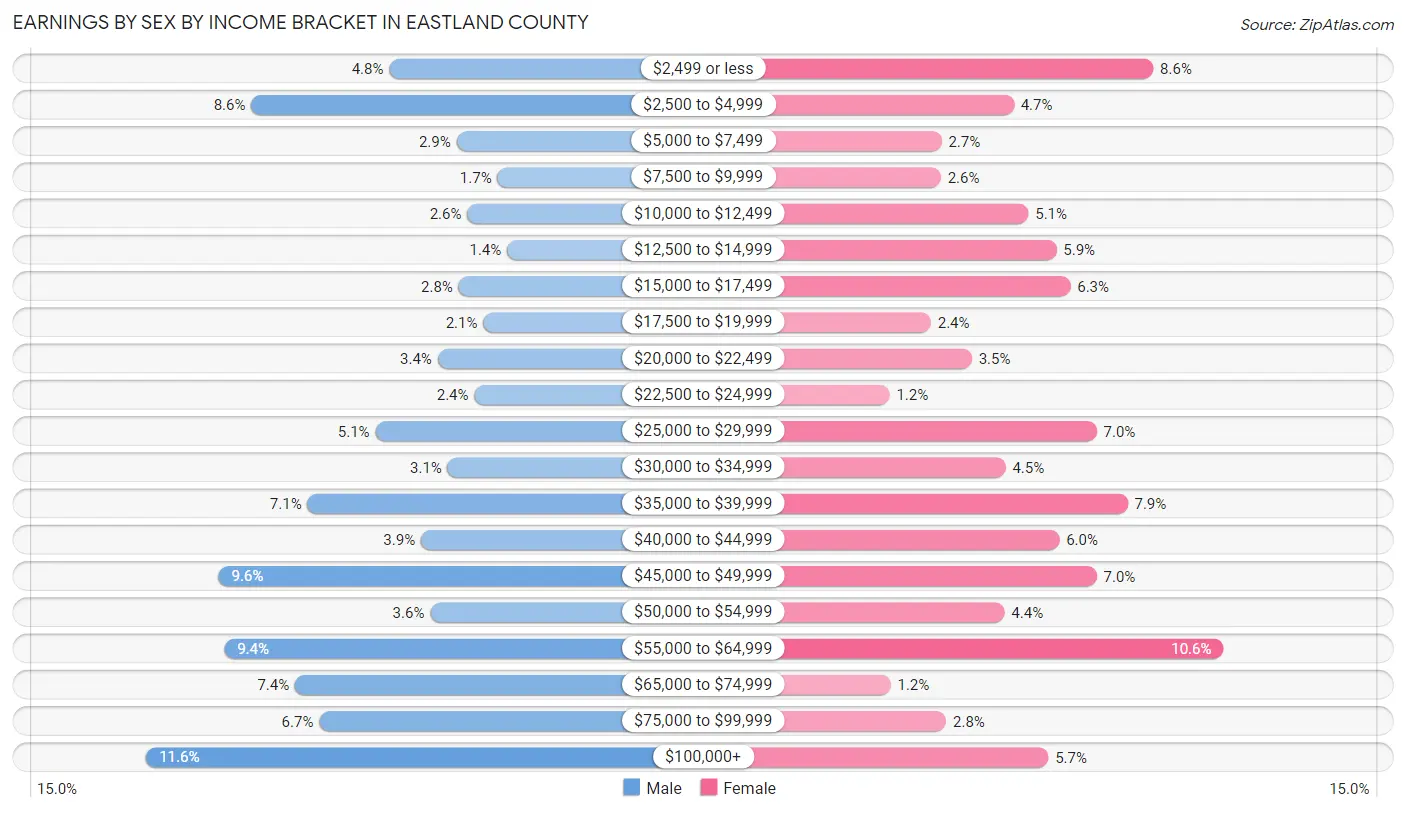
Earnings by Sex by Income Bracket in Eastland County
The most common earnings brackets in Eastland County are $100,000+ for men (588 | 11.6%) and $55,000 to $64,999 for women (413 | 10.6%).
| Income | Male | Female |
| $2,499 or less | 241 (4.8%) | 336 (8.6%) |
| $2,500 to $4,999 | 438 (8.6%) | 183 (4.7%) |
| $5,000 to $7,499 | 145 (2.9%) | 104 (2.7%) |
| $7,500 to $9,999 | 87 (1.7%) | 103 (2.6%) |
| $10,000 to $12,499 | 130 (2.6%) | 199 (5.1%) |
| $12,500 to $14,999 | 73 (1.4%) | 230 (5.9%) |
| $15,000 to $17,499 | 142 (2.8%) | 245 (6.3%) |
| $17,500 to $19,999 | 107 (2.1%) | 92 (2.4%) |
| $20,000 to $22,499 | 172 (3.4%) | 137 (3.5%) |
| $22,500 to $24,999 | 120 (2.4%) | 47 (1.2%) |
| $25,000 to $29,999 | 261 (5.1%) | 274 (7.0%) |
| $30,000 to $34,999 | 158 (3.1%) | 174 (4.5%) |
| $35,000 to $39,999 | 358 (7.0%) | 308 (7.9%) |
| $40,000 to $44,999 | 196 (3.9%) | 233 (6.0%) |
| $45,000 to $49,999 | 485 (9.6%) | 274 (7.0%) |
| $50,000 to $54,999 | 183 (3.6%) | 173 (4.4%) |
| $55,000 to $64,999 | 477 (9.4%) | 413 (10.6%) |
| $65,000 to $74,999 | 376 (7.4%) | 48 (1.2%) |
| $75,000 to $99,999 | 341 (6.7%) | 109 (2.8%) |
| $100,000+ | 588 (11.6%) | 221 (5.7%) |
| Total | 5,078 (100.0%) | 3,903 (100.0%) |
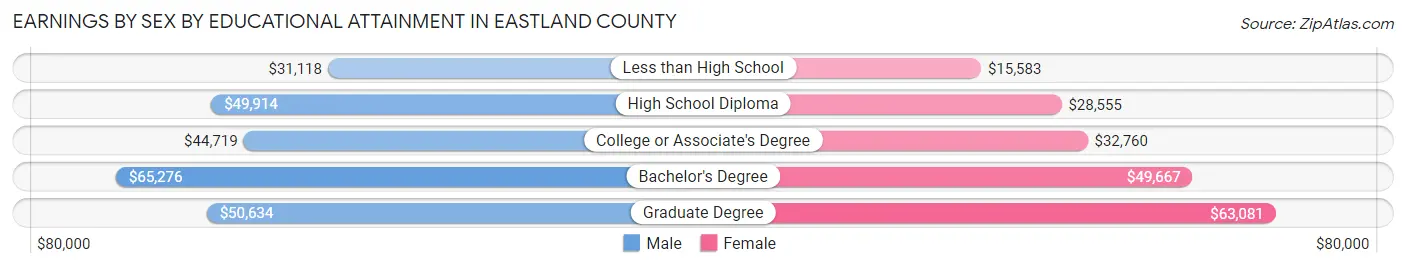
Earnings by Sex by Educational Attainment in Eastland County
Average earnings in Eastland County are $47,485 for men and $36,321 for women, a difference of 23.5%. Men with an educational attainment of bachelor's degree enjoy the highest average annual earnings of $65,276, while those with less than high school education earn the least with $31,118. Women with an educational attainment of graduate degree earn the most with the average annual earnings of $63,081, while those with less than high school education have the smallest earnings of $15,583.
| Educational Attainment | Male Income | Female Income |
| Less than High School | $31,118 | $15,583 |
| High School Diploma | $49,914 | $28,555 |
| College or Associate's Degree | $44,719 | $32,760 |
| Bachelor's Degree | $65,276 | $49,667 |
| Graduate Degree | $50,634 | $63,081 |
| Total | $47,485 | $36,321 |
Family Income in Eastland County
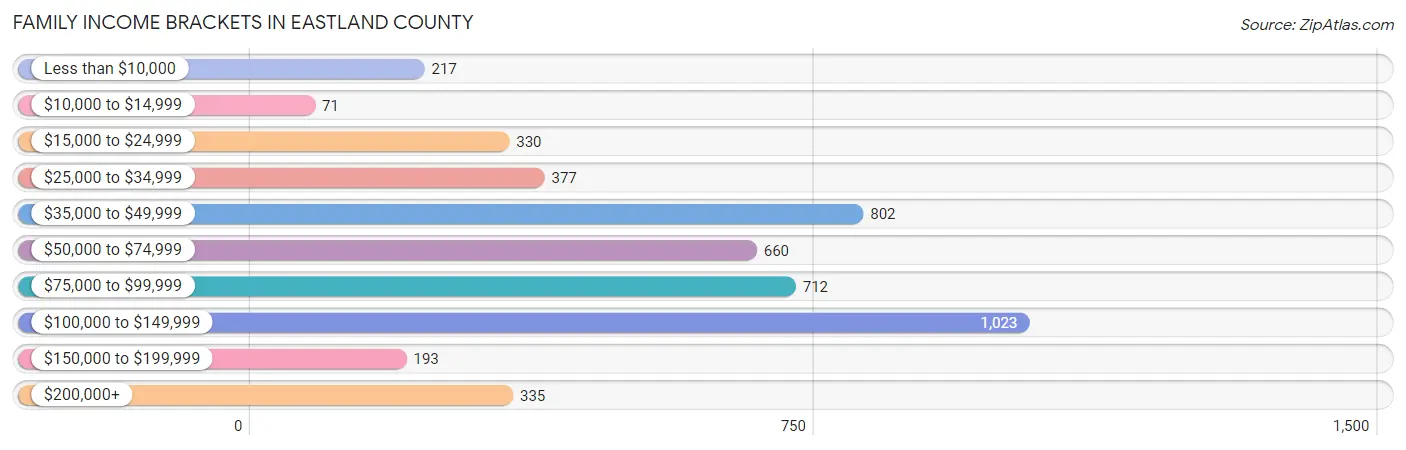
Family Income Brackets in Eastland County
According to the Eastland County family income data, there are 1,023 families falling into the $100,000 to $149,999 income range, which is the most common income bracket and makes up 21.7% of all families. Conversely, the $10,000 to $14,999 income bracket is the least frequent group with only 71 families (1.5%) belonging to this category.
| Income Bracket | # Families | % Families |
| Less than $10,000 | 217 | 4.6% |
| $10,000 to $14,999 | 71 | 1.5% |
| $15,000 to $24,999 | 330 | 7.0% |
| $25,000 to $34,999 | 377 | 8.0% |
| $35,000 to $49,999 | 802 | 17.0% |
| $50,000 to $74,999 | 660 | 14.0% |
| $75,000 to $99,999 | 712 | 15.1% |
| $100,000 to $149,999 | 1,023 | 21.7% |
| $150,000 to $199,999 | 193 | 4.1% |
| $200,000+ | 335 | 7.1% |
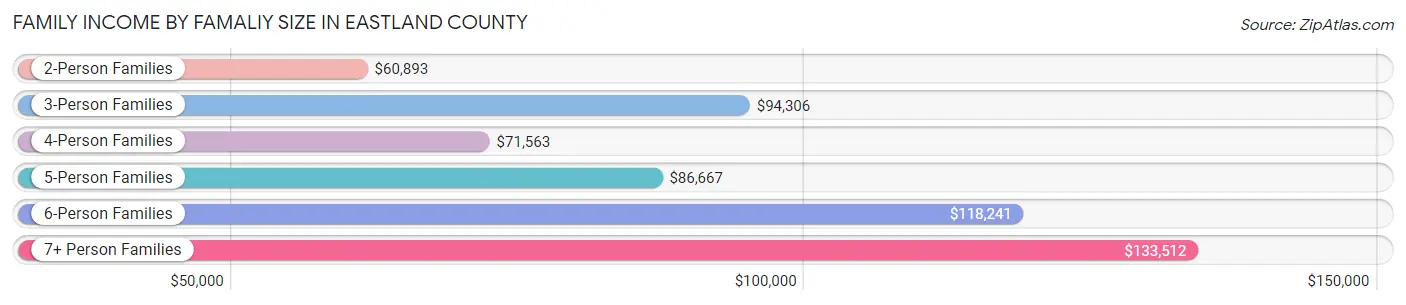
Family Income by Famaliy Size in Eastland County
7+ person families (50 | 1.1%) account for the highest median family income in Eastland County with $133,512 per family, while 3-person families (789 | 16.7%) have the highest median income of $31,435 per family member.
| Income Bracket | # Families | Median Income |
| 2-Person Families | 2,793 (59.2%) | $60,893 |
| 3-Person Families | 789 (16.7%) | $94,306 |
| 4-Person Families | 463 (9.8%) | $71,563 |
| 5-Person Families | 440 (9.3%) | $86,667 |
| 6-Person Families | 181 (3.8%) | $118,241 |
| 7+ Person Families | 50 (1.1%) | $133,512 |
| Total | 4,716 (100.0%) | $70,806 |
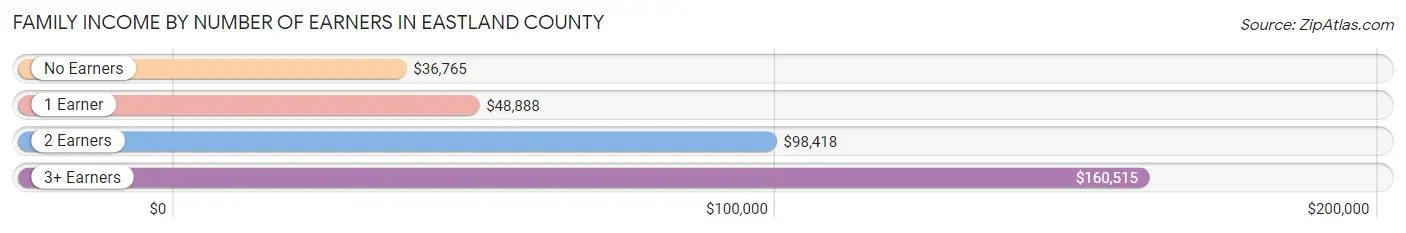
Family Income by Number of Earners in Eastland County
The median family income in Eastland County is $70,806, with families comprising 3+ earners (305) having the highest median family income of $160,515, while families with no earners (800) have the lowest median family income of $36,765, accounting for 6.5% and 17.0% of families, respectively.
| Number of Earners | # Families | Median Income |
| No Earners | 800 (17.0%) | $36,765 |
| 1 Earner | 1,503 (31.9%) | $48,888 |
| 2 Earners | 2,108 (44.7%) | $98,418 |
| 3+ Earners | 305 (6.5%) | $160,515 |
| Total | 4,716 (100.0%) | $70,806 |
Household Income in Eastland County
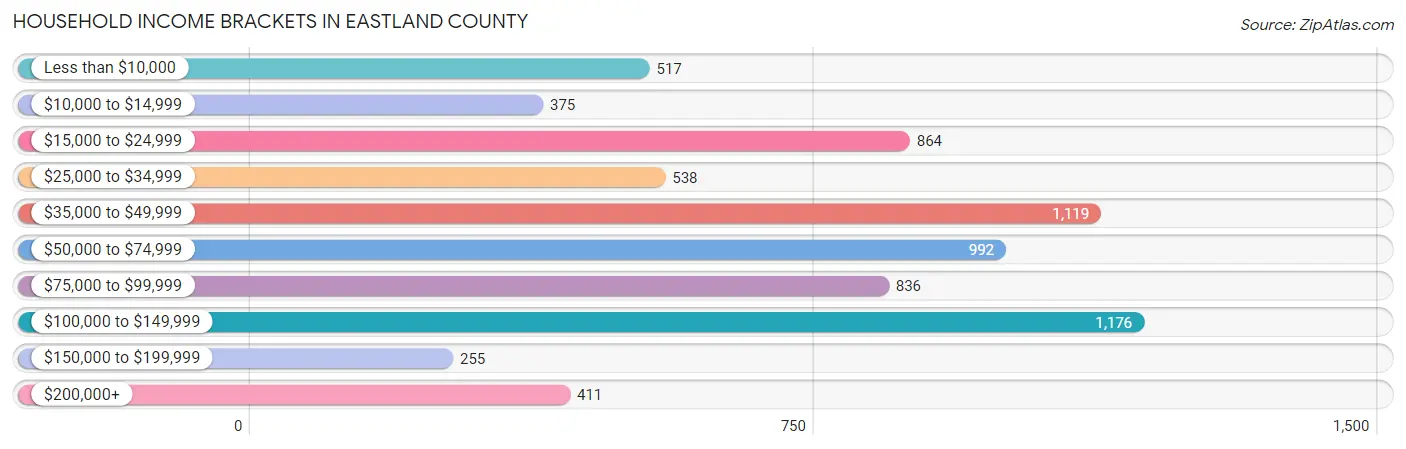
Household Income Brackets in Eastland County
With 1,176 households falling in the category, the $100,000 to $149,999 income range is the most frequent in Eastland County, accounting for 16.6% of all households. In contrast, only 255 households (3.6%) fall into the $150,000 to $199,999 income bracket, making it the least populous group.
| Income Bracket | # Households | % Households |
| Less than $10,000 | 517 | 7.3% |
| $10,000 to $14,999 | 375 | 5.3% |
| $15,000 to $24,999 | 864 | 12.2% |
| $25,000 to $34,999 | 538 | 7.6% |
| $35,000 to $49,999 | 1,119 | 15.8% |
| $50,000 to $74,999 | 992 | 14.0% |
| $75,000 to $99,999 | 836 | 11.8% |
| $100,000 to $149,999 | 1,176 | 16.6% |
| $150,000 to $199,999 | 255 | 3.6% |
| $200,000+ | 411 | 5.8% |
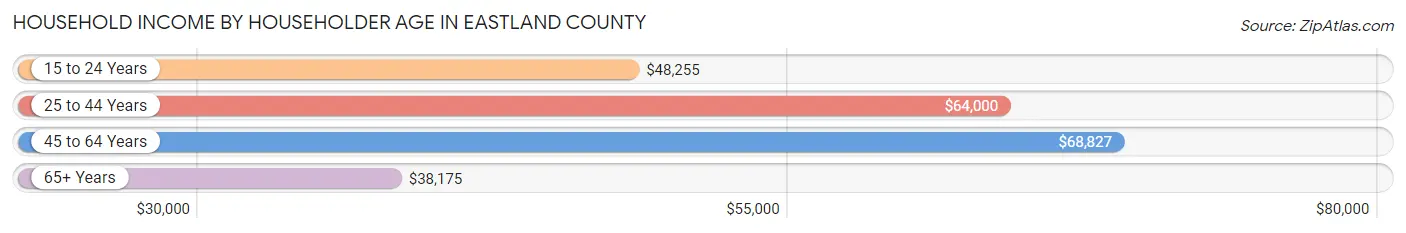
Household Income by Householder Age in Eastland County
The median household income in Eastland County is $52,902, with the highest median household income of $68,827 found in the 45 to 64 years age bracket for the primary householder. A total of 2,317 households (32.7%) fall into this category. Meanwhile, the 65+ years age bracket for the primary householder has the lowest median household income of $38,175, with 2,510 households (35.4%) in this group.
| Income Bracket | # Households | Median Income |
| 15 to 24 Years | 442 (6.2%) | $48,255 |
| 25 to 44 Years | 1,814 (25.6%) | $64,000 |
| 45 to 64 Years | 2,317 (32.7%) | $68,827 |
| 65+ Years | 2,510 (35.4%) | $38,175 |
| Total | 7,083 (100.0%) | $52,902 |
Poverty in Eastland County
Income Below Poverty by Sex and Age in Eastland County
With 15.5% poverty level for males and 16.9% for females among the residents of Eastland County, 18 to 24 year old males and 6 to 11 year old females are the most vulnerable to poverty, with 296 males (36.6%) and 142 females (26.9%) in their respective age groups living below the poverty level.
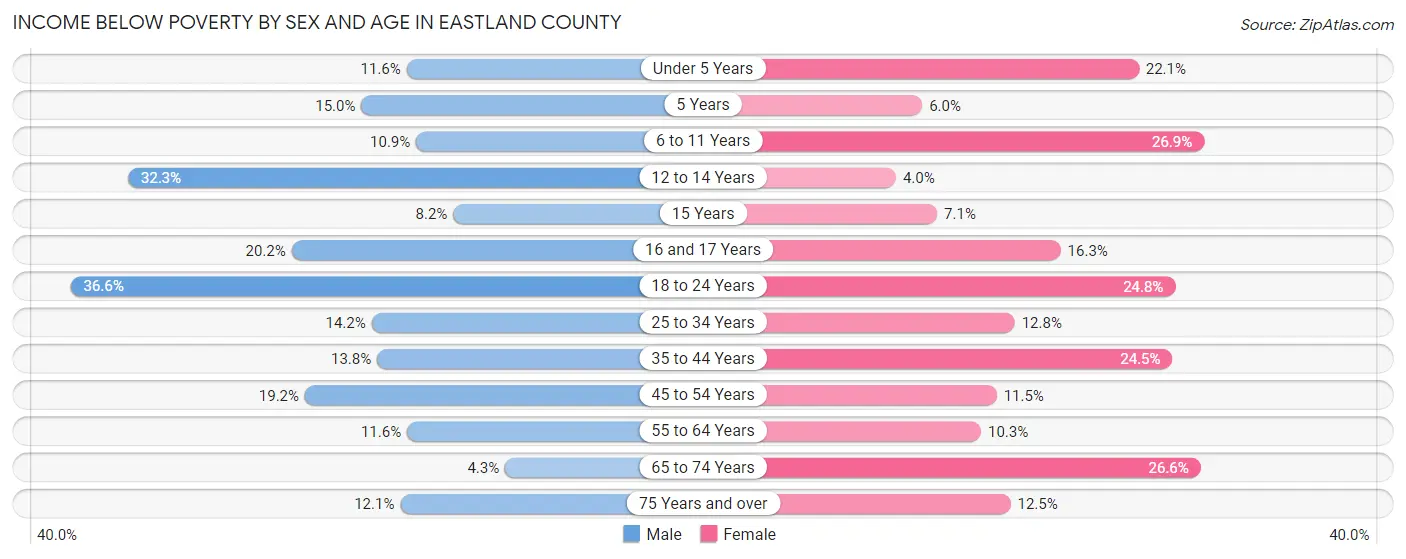
| Age Bracket | Male | Female |
| Under 5 Years | 54 (11.6%) | 112 (22.1%) |
| 5 Years | 24 (15.0%) | 8 (6.0%) |
| 6 to 11 Years | 53 (10.9%) | 142 (26.9%) |
| 12 to 14 Years | 107 (32.3%) | 14 (4.0%) |
| 15 Years | 9 (8.2%) | 17 (7.1%) |
| 16 and 17 Years | 45 (20.2%) | 26 (16.3%) |
| 18 to 24 Years | 296 (36.6%) | 123 (24.7%) |
| 25 to 34 Years | 122 (14.2%) | 124 (12.8%) |
| 35 to 44 Years | 144 (13.8%) | 229 (24.5%) |
| 45 to 54 Years | 175 (19.2%) | 112 (11.5%) |
| 55 to 64 Years | 154 (11.6%) | 126 (10.3%) |
| 65 to 74 Years | 46 (4.3%) | 284 (26.6%) |
| 75 Years and over | 85 (12.1%) | 107 (12.5%) |
| Total | 1,314 (15.5%) | 1,424 (16.9%) |
Income Above Poverty by Sex and Age in Eastland County
According to the poverty statistics in Eastland County, males aged 65 to 74 years and females aged 12 to 14 years are the age groups that are most secure financially, with 95.7% of males and 96.0% of females in these age groups living above the poverty line.
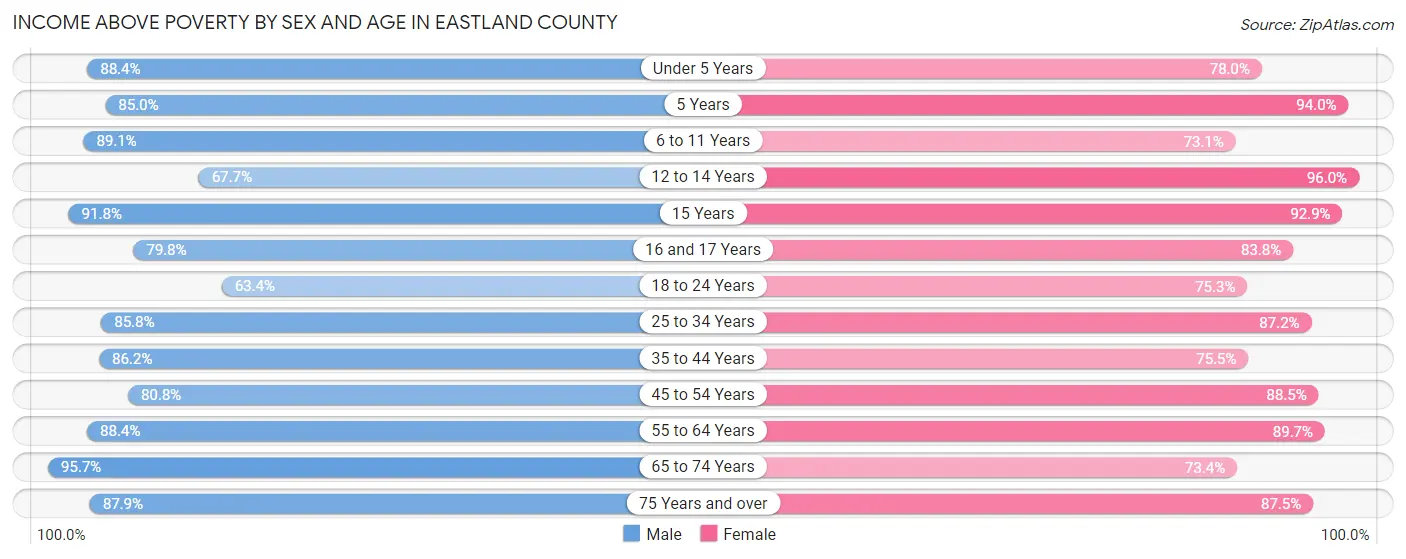
| Age Bracket | Male | Female |
| Under 5 Years | 410 (88.4%) | 396 (77.9%) |
| 5 Years | 136 (85.0%) | 126 (94.0%) |
| 6 to 11 Years | 432 (89.1%) | 386 (73.1%) |
| 12 to 14 Years | 224 (67.7%) | 334 (96.0%) |
| 15 Years | 101 (91.8%) | 223 (92.9%) |
| 16 and 17 Years | 178 (79.8%) | 134 (83.8%) |
| 18 to 24 Years | 513 (63.4%) | 374 (75.2%) |
| 25 to 34 Years | 735 (85.8%) | 842 (87.2%) |
| 35 to 44 Years | 897 (86.2%) | 704 (75.5%) |
| 45 to 54 Years | 737 (80.8%) | 862 (88.5%) |
| 55 to 64 Years | 1,172 (88.4%) | 1,093 (89.7%) |
| 65 to 74 Years | 1,017 (95.7%) | 782 (73.4%) |
| 75 Years and over | 617 (87.9%) | 747 (87.5%) |
| Total | 7,169 (84.5%) | 7,003 (83.1%) |
Income Below Poverty Among Married-Couple Families in Eastland County
The poverty statistics for married-couple families in Eastland County show that 6.3% or 228 of the total 3,622 families live below the poverty line. Families with 3 or 4 children have the highest poverty rate of 10.2%, comprising of 44 families. On the other hand, families with no children have the lowest poverty rate of 5.3%, which includes 127 families.
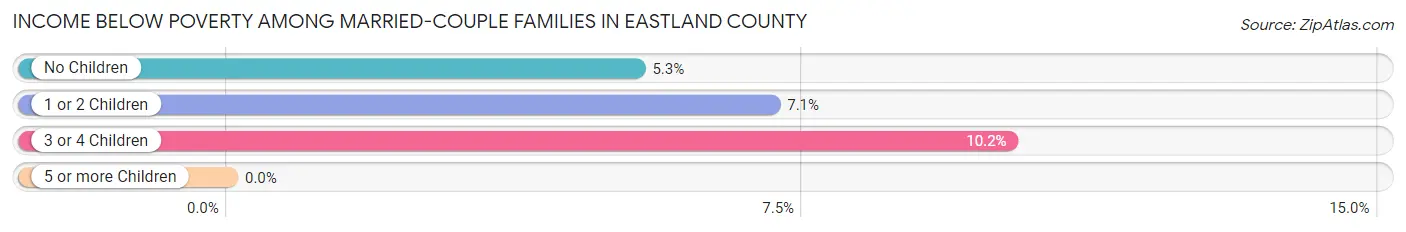
| Children | Above Poverty | Below Poverty |
| No Children | 2,258 (94.7%) | 127 (5.3%) |
| 1 or 2 Children | 748 (92.9%) | 57 (7.1%) |
| 3 or 4 Children | 388 (89.8%) | 44 (10.2%) |
| 5 or more Children | 0 (0.0%) | 0 (0.0%) |
| Total | 3,394 (93.7%) | 228 (6.3%) |
Income Below Poverty Among Single-Parent Households in Eastland County
According to the poverty data in Eastland County, 12.1% or 39 single-father households and 29.8% or 230 single-mother households are living below the poverty line. Among single-father households, those with 1 or 2 children have the highest poverty rate, with 18 households (23.4%) experiencing poverty. Likewise, among single-mother households, those with 1 or 2 children have the highest poverty rate, with 182 households (41.5%) falling below the poverty line.
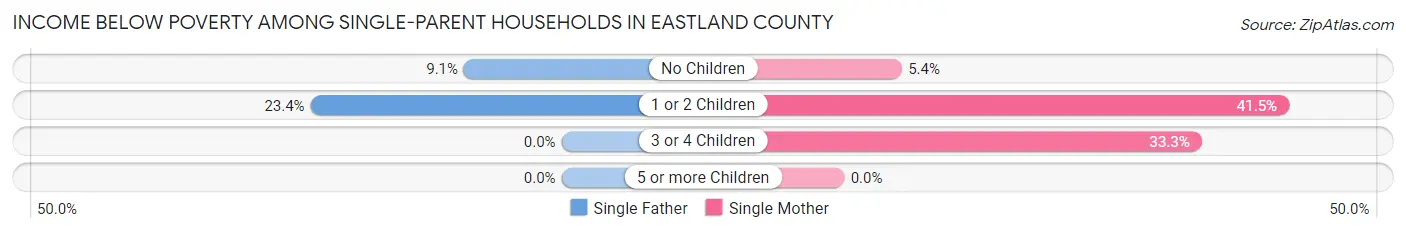
| Children | Single Father | Single Mother |
| No Children | 21 (9.1%) | 12 (5.4%) |
| 1 or 2 Children | 18 (23.4%) | 182 (41.5%) |
| 3 or 4 Children | 0 (0.0%) | 36 (33.3%) |
| 5 or more Children | 0 (0.0%) | 0 (0.0%) |
| Total | 39 (12.1%) | 230 (29.8%) |
Income Below Poverty Among Married-Couple vs Single-Parent Households in Eastland County
The poverty data for Eastland County shows that 228 of the married-couple family households (6.3%) and 269 of the single-parent households (24.6%) are living below the poverty level. Within the married-couple family households, those with 3 or 4 children have the highest poverty rate, with 44 households (10.2%) falling below the poverty line. Among the single-parent households, those with 1 or 2 children have the highest poverty rate, with 200 household (38.8%) living below poverty.
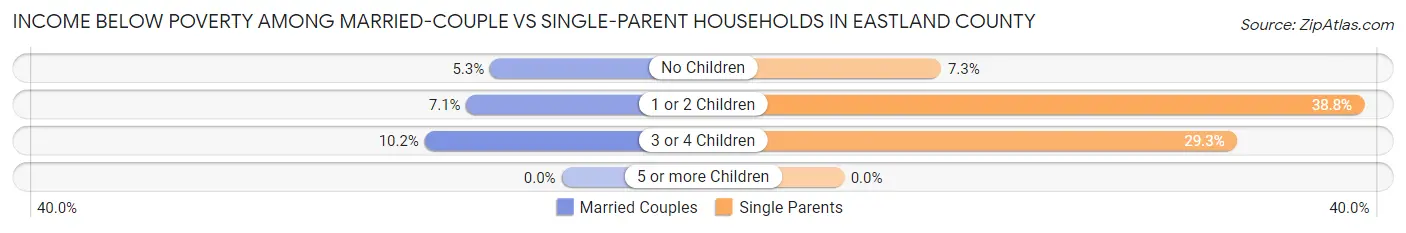
| Children | Married-Couple Families | Single-Parent Households |
| No Children | 127 (5.3%) | 33 (7.2%) |
| 1 or 2 Children | 57 (7.1%) | 200 (38.8%) |
| 3 or 4 Children | 44 (10.2%) | 36 (29.3%) |
| 5 or more Children | 0 (0.0%) | 0 (0.0%) |
| Total | 228 (6.3%) | 269 (24.6%) |
Race in Eastland County
The most populous races in Eastland County are White / Caucasian (15,351 | 86.2%), Hispanic or Latino (3,088 | 17.3%), and Two or more Races (1,649 | 9.3%).
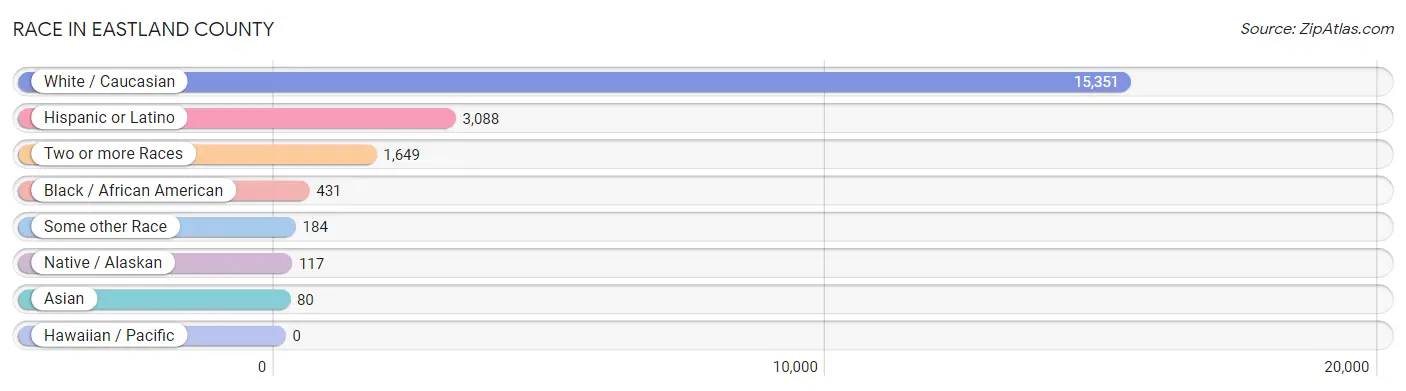
| Race | # Population | % Population |
| Asian | 80 | 0.4% |
| Black / African American | 431 | 2.4% |
| Hawaiian / Pacific | 0 | 0.0% |
| Hispanic or Latino | 3,088 | 17.3% |
| Native / Alaskan | 117 | 0.7% |
| White / Caucasian | 15,351 | 86.2% |
| Two or more Races | 1,649 | 9.3% |
| Some other Race | 184 | 1.0% |
| Total | 17,812 | 100.0% |
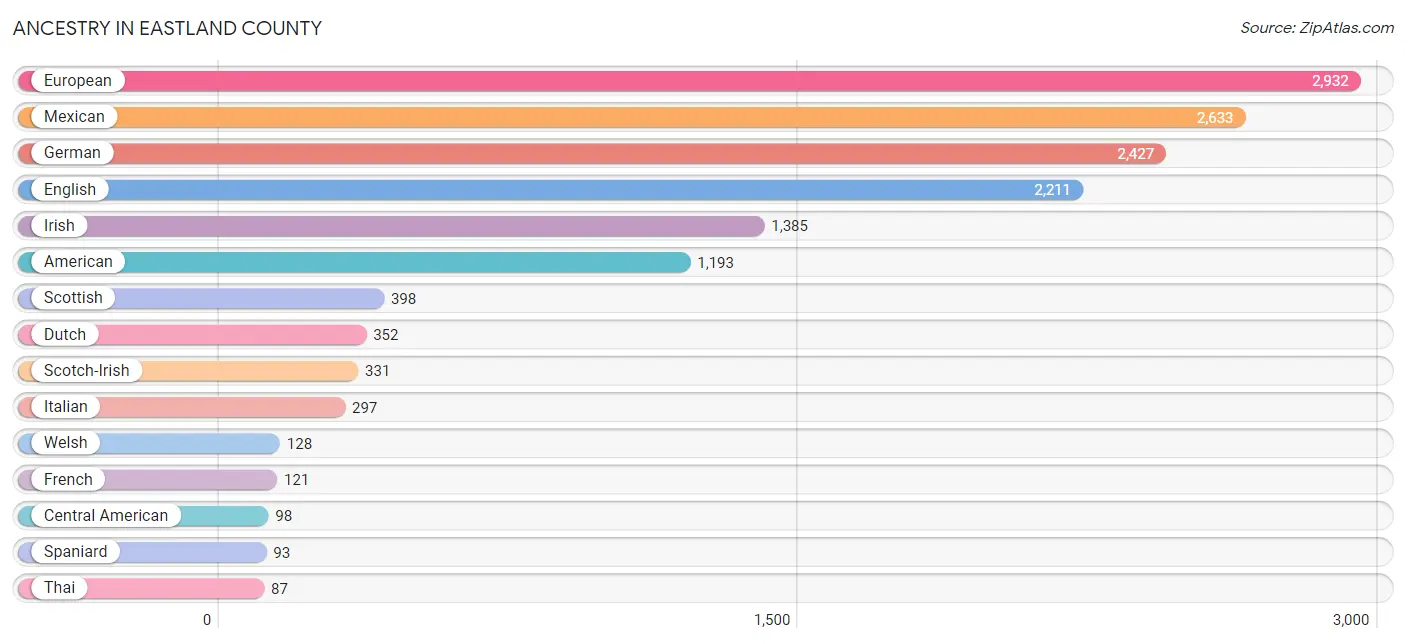
Ancestry in Eastland County
The most populous ancestries reported in Eastland County are European (2,932 | 16.5%), Mexican (2,633 | 14.8%), German (2,427 | 13.6%), English (2,211 | 12.4%), and Irish (1,385 | 7.8%), together accounting for 65.1% of all Eastland County residents.
| Ancestry | # Population | % Population |
| Afghan | 9 | 0.1% |
| African | 16 | 0.1% |
| American | 1,193 | 6.7% |
| Apache | 2 | 0.0% |
| Arab | 30 | 0.2% |
| Austrian | 4 | 0.0% |
| Belgian | 12 | 0.1% |
| Bhutanese | 22 | 0.1% |
| British | 77 | 0.4% |
| Burmese | 7 | 0.0% |
| Canadian | 3 | 0.0% |
| Central American | 98 | 0.5% |
| Cherokee | 47 | 0.3% |
| Chickasaw | 11 | 0.1% |
| Choctaw | 3 | 0.0% |
| Comanche | 5 | 0.0% |
| Cuban | 8 | 0.0% |
| Czech | 11 | 0.1% |
| Danish | 33 | 0.2% |
| Dutch | 352 | 2.0% |
| Dutch West Indian | 6 | 0.0% |
| Ecuadorian | 4 | 0.0% |
| English | 2,211 | 12.4% |
| European | 2,932 | 16.5% |
| Finnish | 13 | 0.1% |
| French | 121 | 0.7% |
| French Canadian | 30 | 0.2% |
| German | 2,427 | 13.6% |
| Guamanian / Chamorro | 5 | 0.0% |
| Guatemalan | 52 | 0.3% |
| Honduran | 46 | 0.3% |
| Hungarian | 69 | 0.4% |
| Indian (Asian) | 42 | 0.2% |
| Irish | 1,385 | 7.8% |
| Iroquois | 12 | 0.1% |
| Italian | 297 | 1.7% |
| Korean | 10 | 0.1% |
| Latvian | 5 | 0.0% |
| Mexican | 2,633 | 14.8% |
| Native Hawaiian | 2 | 0.0% |
| Nigerian | 8 | 0.0% |
| Northern European | 3 | 0.0% |
| Norwegian | 56 | 0.3% |
| Palestinian | 30 | 0.2% |
| Polish | 83 | 0.5% |
| Portuguese | 29 | 0.2% |
| Puerto Rican | 9 | 0.1% |
| Romanian | 7 | 0.0% |
| Russian | 27 | 0.2% |
| Samoan | 12 | 0.1% |
| Scandinavian | 2 | 0.0% |
| Scotch-Irish | 331 | 1.9% |
| Scottish | 398 | 2.2% |
| South American | 4 | 0.0% |
| Spaniard | 93 | 0.5% |
| Spanish | 69 | 0.4% |
| Sri Lankan | 8 | 0.0% |
| Subsaharan African | 24 | 0.1% |
| Swedish | 58 | 0.3% |
| Swiss | 19 | 0.1% |
| Thai | 87 | 0.5% |
| Ukrainian | 3 | 0.0% |
| Welsh | 128 | 0.7% | View All 63 Rows |
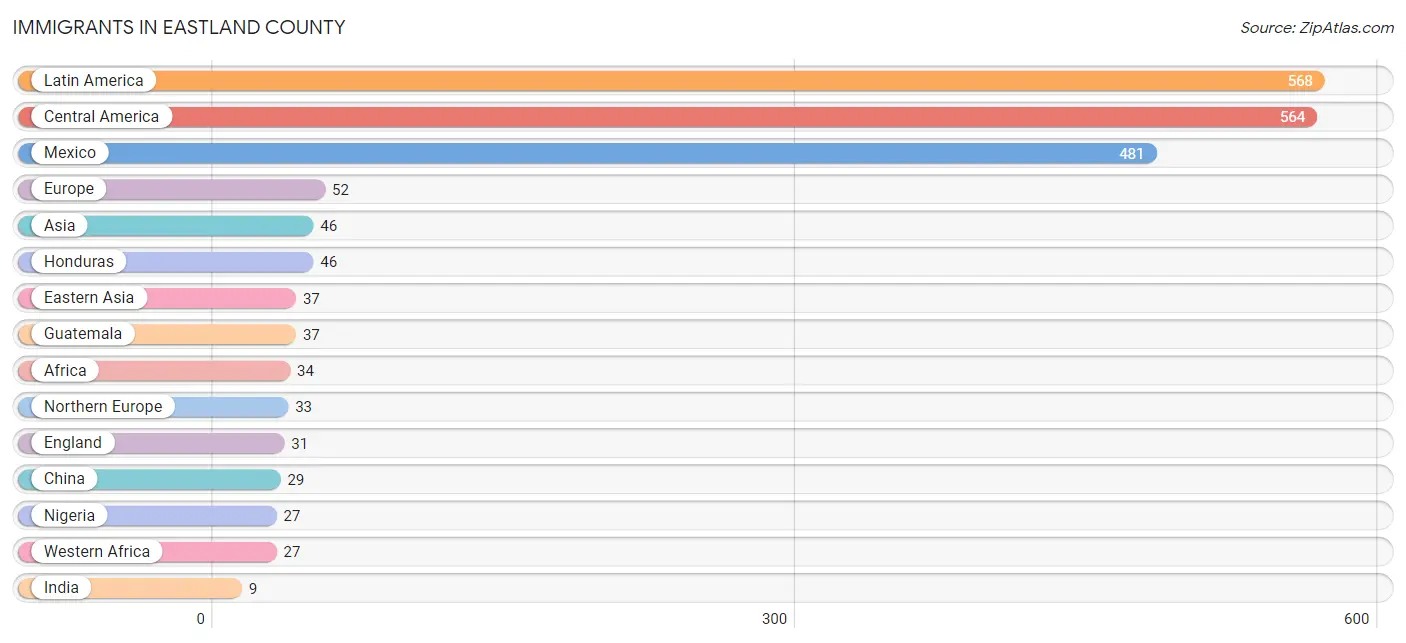
Immigrants in Eastland County
The most numerous immigrant groups reported in Eastland County came from Latin America (568 | 3.2%), Central America (564 | 3.2%), Mexico (481 | 2.7%), Europe (52 | 0.3%), and Asia (46 | 0.3%), together accounting for 9.6% of all Eastland County residents.
| Immigration Origin | # Population | % Population |
| Africa | 34 | 0.2% |
| Asia | 46 | 0.3% |
| Central America | 564 | 3.2% |
| China | 29 | 0.2% |
| Eastern Africa | 1 | 0.0% |
| Eastern Asia | 37 | 0.2% |
| Eastern Europe | 7 | 0.0% |
| Ecuador | 4 | 0.0% |
| England | 31 | 0.2% |
| Ethiopia | 1 | 0.0% |
| Europe | 52 | 0.3% |
| Guatemala | 37 | 0.2% |
| Honduras | 46 | 0.3% |
| India | 9 | 0.1% |
| Japan | 8 | 0.0% |
| Latin America | 568 | 3.2% |
| Mexico | 481 | 2.7% |
| Nigeria | 27 | 0.2% |
| Northern Europe | 33 | 0.2% |
| Romania | 7 | 0.0% |
| South Africa | 6 | 0.0% |
| South America | 4 | 0.0% |
| South Central Asia | 9 | 0.1% |
| Southern Europe | 9 | 0.1% |
| Spain | 9 | 0.1% |
| Western Africa | 27 | 0.2% | View All 26 Rows |
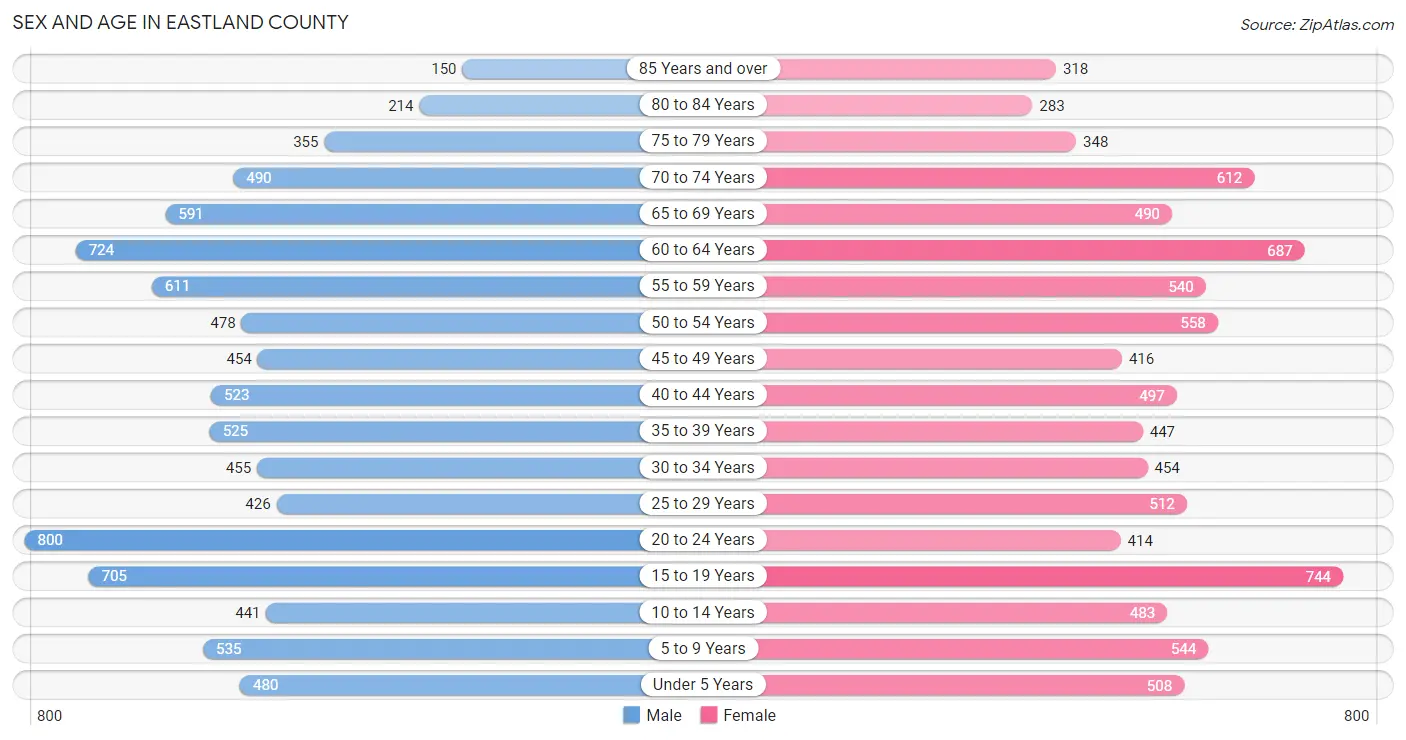
Sex and Age in Eastland County
Sex and Age in Eastland County
The most populous age groups in Eastland County are 20 to 24 Years (800 | 8.9%) for men and 15 to 19 Years (744 | 8.4%) for women.
| Age Bracket | Male | Female |
| Under 5 Years | 480 (5.4%) | 508 (5.7%) |
| 5 to 9 Years | 535 (6.0%) | 544 (6.1%) |
| 10 to 14 Years | 441 (4.9%) | 483 (5.4%) |
| 15 to 19 Years | 705 (7.9%) | 744 (8.4%) |
| 20 to 24 Years | 800 (8.9%) | 414 (4.7%) |
| 25 to 29 Years | 426 (4.8%) | 512 (5.8%) |
| 30 to 34 Years | 455 (5.1%) | 454 (5.1%) |
| 35 to 39 Years | 525 (5.9%) | 447 (5.1%) |
| 40 to 44 Years | 523 (5.8%) | 497 (5.6%) |
| 45 to 49 Years | 454 (5.1%) | 416 (4.7%) |
| 50 to 54 Years | 478 (5.3%) | 558 (6.3%) |
| 55 to 59 Years | 611 (6.8%) | 540 (6.1%) |
| 60 to 64 Years | 724 (8.1%) | 687 (7.8%) |
| 65 to 69 Years | 591 (6.6%) | 490 (5.5%) |
| 70 to 74 Years | 490 (5.5%) | 612 (6.9%) |
| 75 to 79 Years | 355 (4.0%) | 348 (3.9%) |
| 80 to 84 Years | 214 (2.4%) | 283 (3.2%) |
| 85 Years and over | 150 (1.7%) | 318 (3.6%) |
| Total | 8,957 (100.0%) | 8,855 (100.0%) |
Families and Households in Eastland County
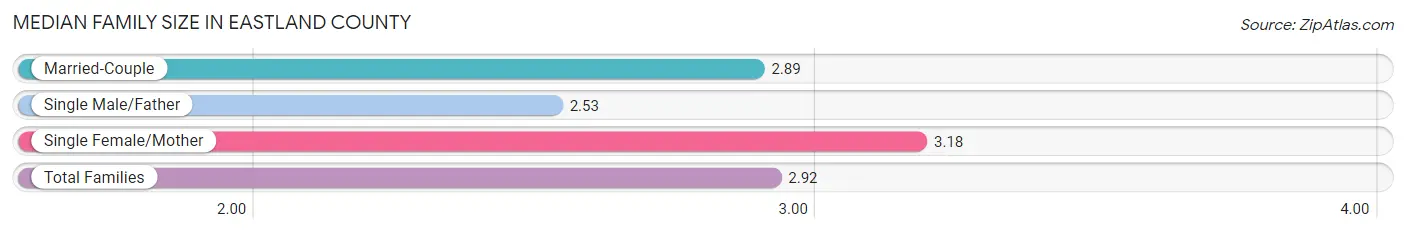
Median Family Size in Eastland County
The median family size in Eastland County is 2.92 persons per family, with single female/mother families (771 | 16.4%) accounting for the largest median family size of 3.18 persons per family. On the other hand, single male/father families (323 | 6.9%) represent the smallest median family size with 2.53 persons per family.
| Family Type | # Families | Family Size |
| Married-Couple | 3,622 (76.8%) | 2.89 |
| Single Male/Father | 323 (6.9%) | 2.53 |
| Single Female/Mother | 771 (16.4%) | 3.18 |
| Total Families | 4,716 (100.0%) | 2.92 |
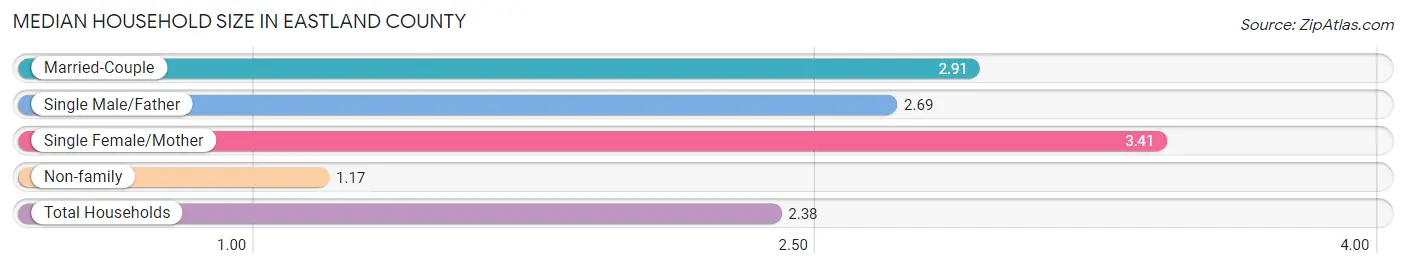
Median Household Size in Eastland County
The median household size in Eastland County is 2.38 persons per household, with single female/mother households (771 | 10.9%) accounting for the largest median household size of 3.41 persons per household. non-family households (2,367 | 33.4%) represent the smallest median household size with 1.17 persons per household.
| Household Type | # Households | Household Size |
| Married-Couple | 3,622 (51.1%) | 2.91 |
| Single Male/Father | 323 (4.6%) | 2.69 |
| Single Female/Mother | 771 (10.9%) | 3.41 |
| Non-family | 2,367 (33.4%) | 1.17 |
| Total Households | 7,083 (100.0%) | 2.38 |
Household Size by Marriage Status in Eastland County
Out of a total of 7,083 households in Eastland County, 4,716 (66.6%) are family households, while 2,367 (33.4%) are nonfamily households. The most numerous type of family households are 2-person households, comprising 2,624, and the most common type of nonfamily households are 1-person households, comprising 2,047.
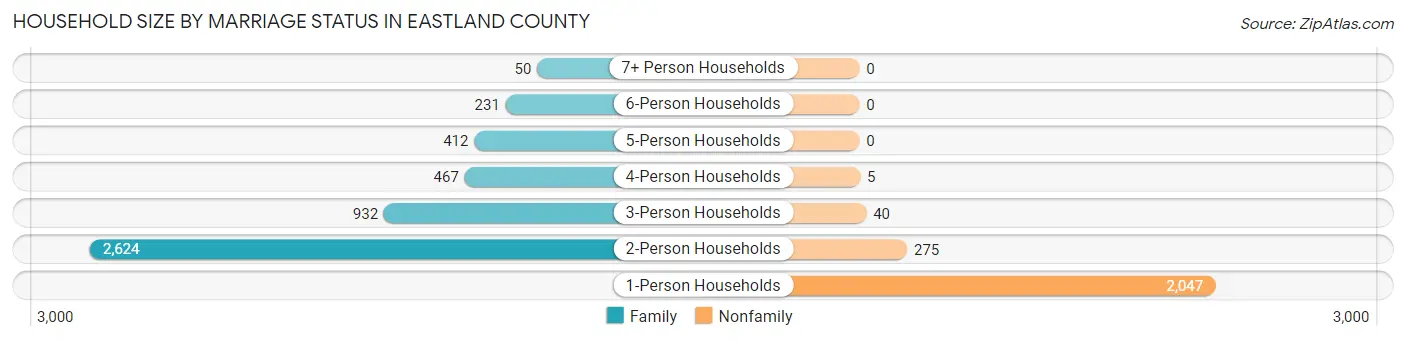
| Household Size | Family Households | Nonfamily Households |
| 1-Person Households | - | 2,047 (28.9%) |
| 2-Person Households | 2,624 (37.0%) | 275 (3.9%) |
| 3-Person Households | 932 (13.2%) | 40 (0.6%) |
| 4-Person Households | 467 (6.6%) | 5 (0.1%) |
| 5-Person Households | 412 (5.8%) | 0 (0.0%) |
| 6-Person Households | 231 (3.3%) | 0 (0.0%) |
| 7+ Person Households | 50 (0.7%) | 0 (0.0%) |
| Total | 4,716 (66.6%) | 2,367 (33.4%) |
Female Fertility in Eastland County
Fertility by Age in Eastland County
Average fertility rate in Eastland County is 81.0 births per 1,000 women. Women in the age bracket of 20 to 34 years have the highest fertility rate with 178.0 births per 1,000 women. Women in the age bracket of 20 to 34 years acount for 83.9% of all women with births.
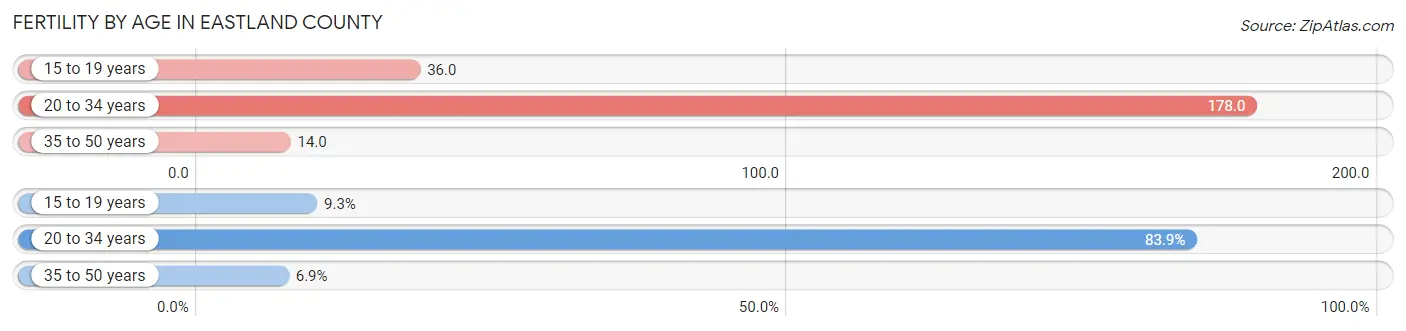
| Age Bracket | Women with Births | Births / 1,000 Women |
| 15 to 19 years | 27 (9.2%) | 36.0 |
| 20 to 34 years | 245 (83.9%) | 178.0 |
| 35 to 50 years | 20 (6.9%) | 14.0 |
| Total | 292 (100.0%) | 81.0 |
Fertility by Age by Marriage Status in Eastland County
77.1% of women with births (292) in Eastland County are married. The highest percentage of unmarried women with births falls into 20 to 34 years age bracket with 27.4% of them unmarried at the time of birth, while the lowest percentage of unmarried women with births belong to 15 to 19 years age bracket with 0.0% of them unmarried.
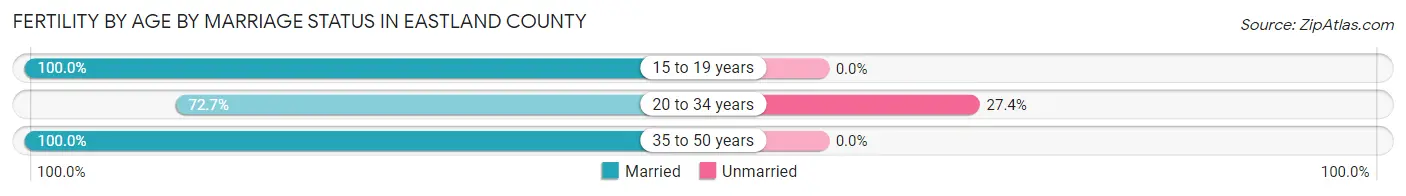
| Age Bracket | Married | Unmarried |
| 15 to 19 years | 27 (100.0%) | 0 (0.0%) |
| 20 to 34 years | 178 (72.7%) | 67 (27.4%) |
| 35 to 50 years | 20 (100.0%) | 0 (0.0%) |
| Total | 225 (77.0%) | 67 (23.0%) |
Fertility by Education in Eastland County
Average fertility rate in Eastland County is 81.0 births per 1,000 women. Women with the education attainment of high school diploma have the highest fertility rate of 141.0 births per 1,000 women, while women with the education attainment of less than high school have the lowest fertility at 11.0 births per 1,000 women. Women with the education attainment of high school diploma represent 51.7% of all women with births.
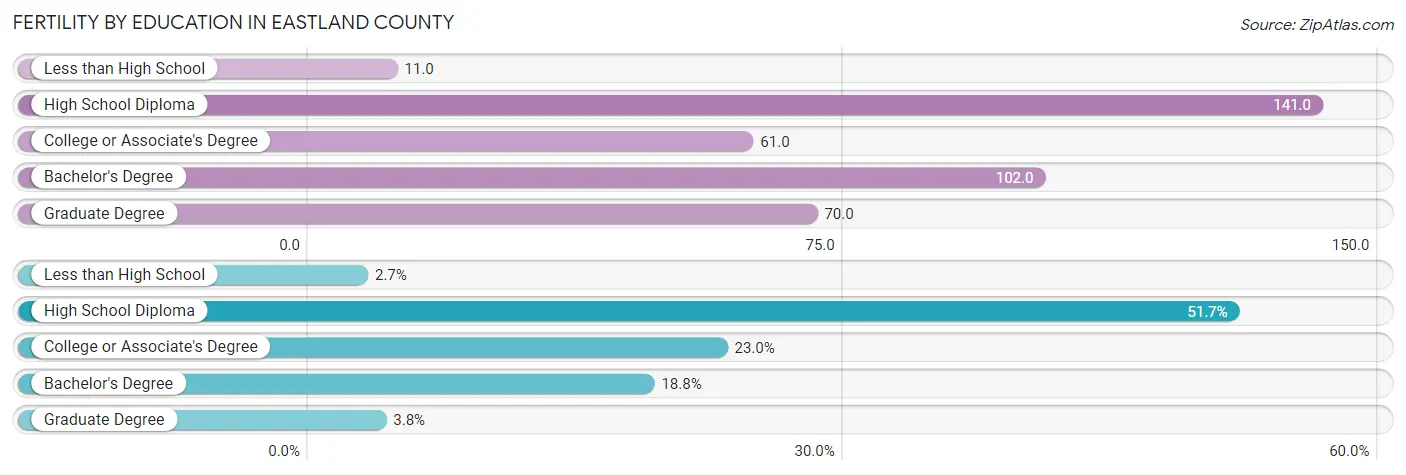
| Educational Attainment | Women with Births | Births / 1,000 Women |
| Less than High School | 8 (2.7%) | 11.0 |
| High School Diploma | 151 (51.7%) | 141.0 |
| College or Associate's Degree | 67 (23.0%) | 61.0 |
| Bachelor's Degree | 55 (18.8%) | 102.0 |
| Graduate Degree | 11 (3.8%) | 70.0 |
| Total | 292 (100.0%) | 81.0 |
Fertility by Education by Marriage Status in Eastland County
23.0% of women with births in Eastland County are unmarried. Women with the educational attainment of graduate degree are most likely to be married with 100.0% of them married at childbirth, while women with the educational attainment of less than high school are least likely to be married with 100.0% of them unmarried at childbirth.
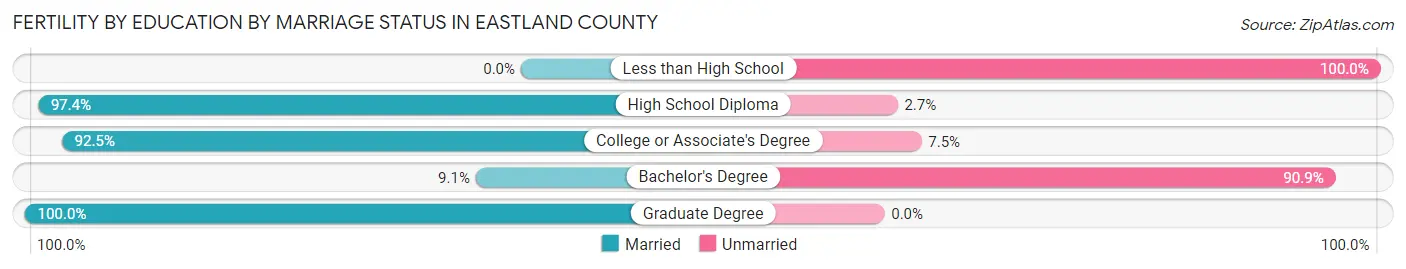
| Educational Attainment | Married | Unmarried |
| Less than High School | 0 (0.0%) | 8 (100.0%) |
| High School Diploma | 147 (97.4%) | 4 (2.6%) |
| College or Associate's Degree | 62 (92.5%) | 5 (7.5%) |
| Bachelor's Degree | 5 (9.1%) | 50 (90.9%) |
| Graduate Degree | 11 (100.0%) | 0 (0.0%) |
| Total | 225 (77.0%) | 67 (23.0%) |
Employment Characteristics in Eastland County
Employment by Class of Employer in Eastland County
Among the 7,573 employed individuals in Eastland County, private company employees (4,456 | 58.8%), local government employees (828 | 10.9%), and not-for-profit organizations (712 | 9.4%) make up the most common classes of employment.
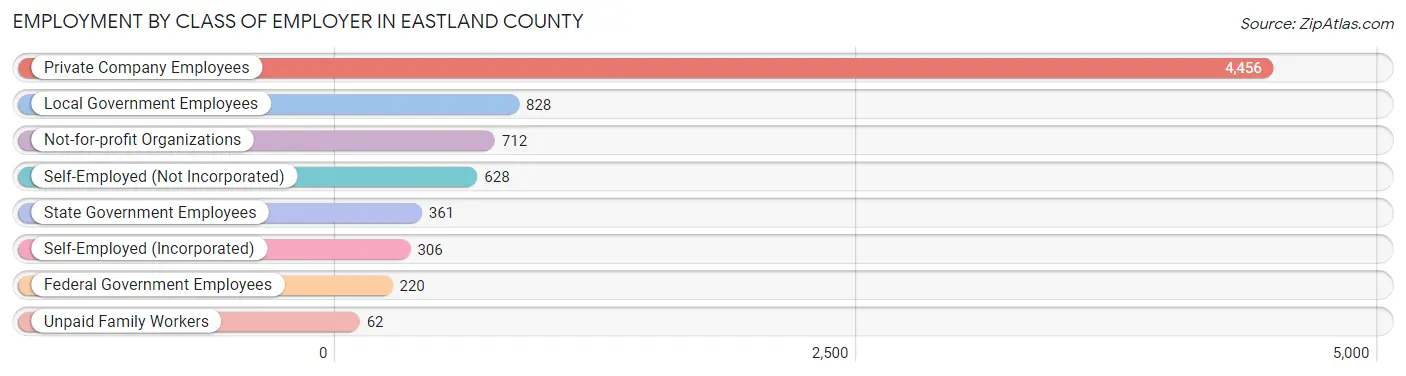
| Employer Class | # Employees | % Employees |
| Private Company Employees | 4,456 | 58.8% |
| Self-Employed (Incorporated) | 306 | 4.0% |
| Self-Employed (Not Incorporated) | 628 | 8.3% |
| Not-for-profit Organizations | 712 | 9.4% |
| Local Government Employees | 828 | 10.9% |
| State Government Employees | 361 | 4.8% |
| Federal Government Employees | 220 | 2.9% |
| Unpaid Family Workers | 62 | 0.8% |
| Total | 7,573 | 100.0% |
Employment Status by Age in Eastland County
According to the labor force statistics for Eastland County, out of the total population over 16 years of age (14,470), 56.1% or 8,118 individuals are in the labor force, with 4.9% or 398 of them unemployed. The age group with the highest labor force participation rate is 30 to 34 years, with 86.0% or 782 individuals in the labor force. Within the labor force, the 20 to 24 years age range has the highest percentage of unemployed individuals, with 16.9% or 173 of them being unemployed.
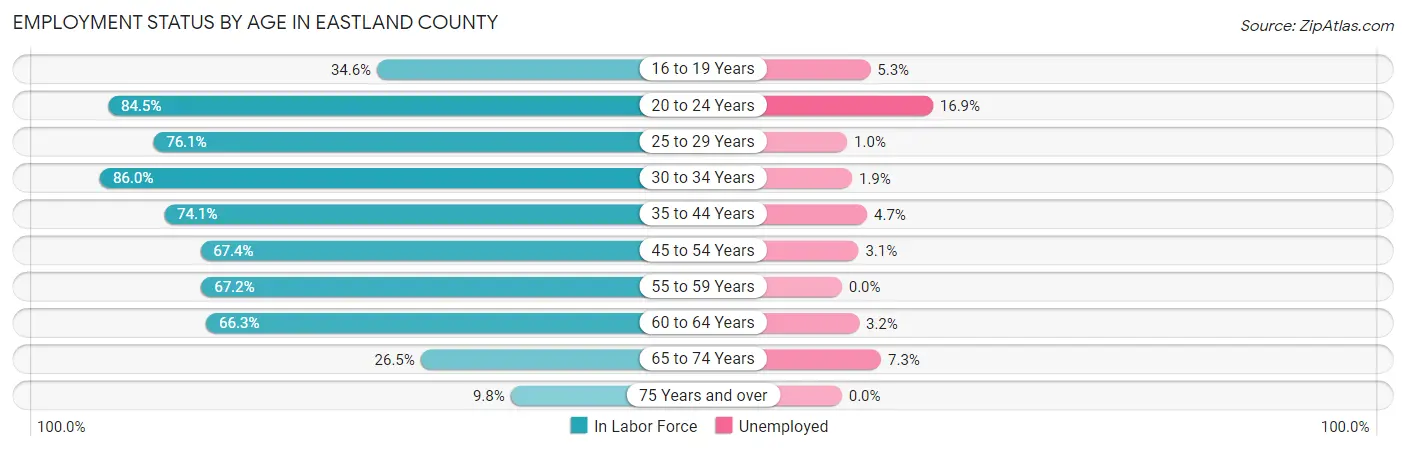
| Age Bracket | In Labor Force | Unemployed |
| 16 to 19 Years | 380 (34.6%) | 20 (5.3%) |
| 20 to 24 Years | 1,026 (84.5%) | 173 (16.9%) |
| 25 to 29 Years | 714 (76.1%) | 7 (1.0%) |
| 30 to 34 Years | 782 (86.0%) | 15 (1.9%) |
| 35 to 44 Years | 1,476 (74.1%) | 69 (4.7%) |
| 45 to 54 Years | 1,285 (67.4%) | 40 (3.1%) |
| 55 to 59 Years | 773 (67.2%) | 0 (0.0%) |
| 60 to 64 Years | 935 (66.3%) | 30 (3.2%) |
| 65 to 74 Years | 578 (26.5%) | 42 (7.3%) |
| 75 Years and over | 163 (9.8%) | 0 (0.0%) |
| Total | 8,118 (56.1%) | 398 (4.9%) |
Employment Status by Educational Attainment in Eastland County
According to labor force statistics for Eastland County, 71.8% of individuals (5,964) out of the total population between 25 and 64 years of age (8,307) are in the labor force, with 2.7% or 161 of them being unemployed. The group with the highest labor force participation rate are those with the educational attainment of bachelor's degree or higher, with 88.5% or 1,657 individuals in the labor force. Within the labor force, individuals with less than high school education have the highest percentage of unemployment, with 11.4% or 66 of them being unemployed.
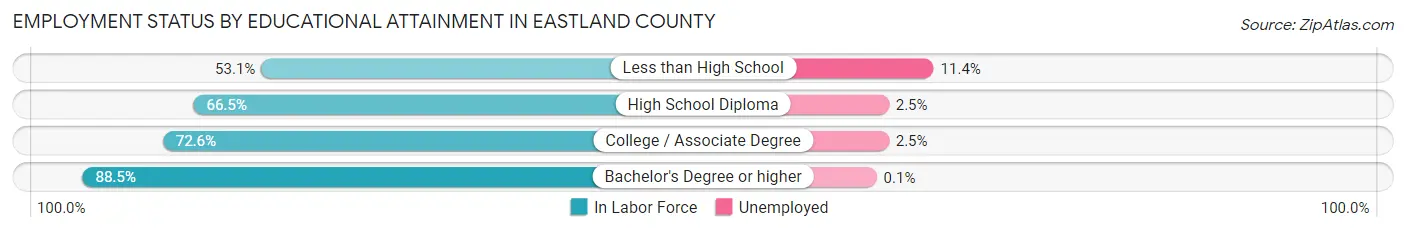
| Educational Attainment | In Labor Force | Unemployed |
| Less than High School | 578 (53.1%) | 124 (11.4%) |
| High School Diploma | 1,617 (66.5%) | 61 (2.5%) |
| College / Associate Degree | 2,116 (72.6%) | 73 (2.5%) |
| Bachelor's Degree or higher | 1,657 (88.5%) | 2 (0.1%) |
| Total | 5,964 (71.8%) | 224 (2.7%) |
Employment Occupations by Sex in Eastland County
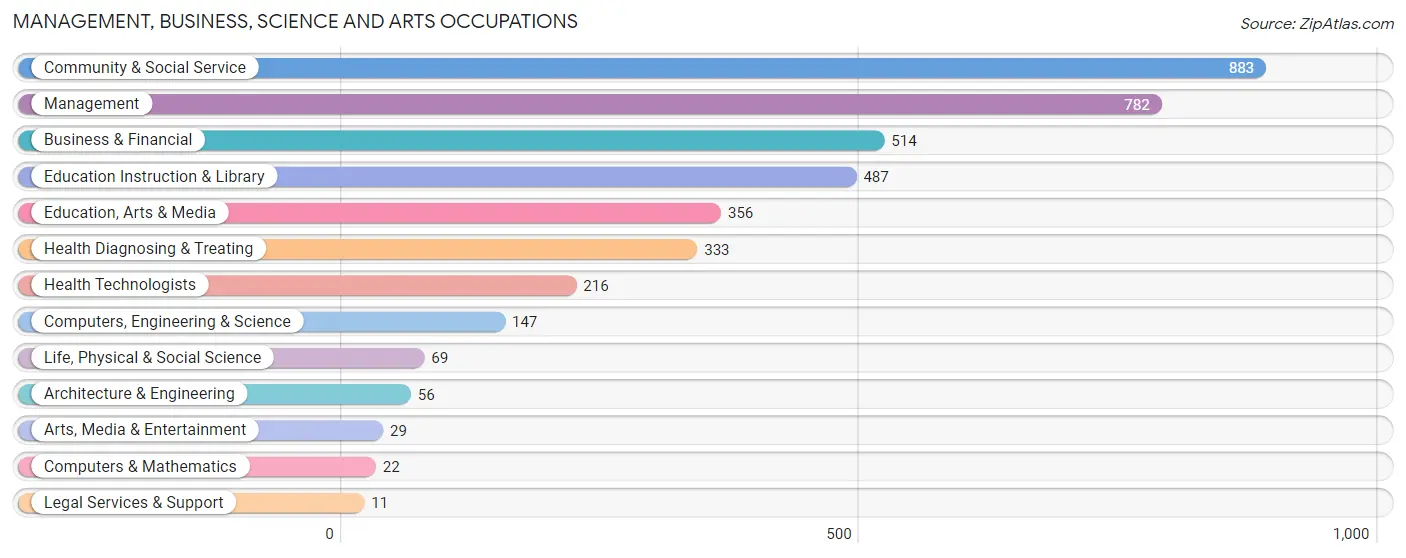
Management, Business, Science and Arts Occupations
The most common Management, Business, Science and Arts occupations in Eastland County are Community & Social Service (883 | 11.5%), Management (782 | 10.2%), Business & Financial (514 | 6.7%), Education Instruction & Library (487 | 6.3%), and Education, Arts & Media (356 | 4.6%).
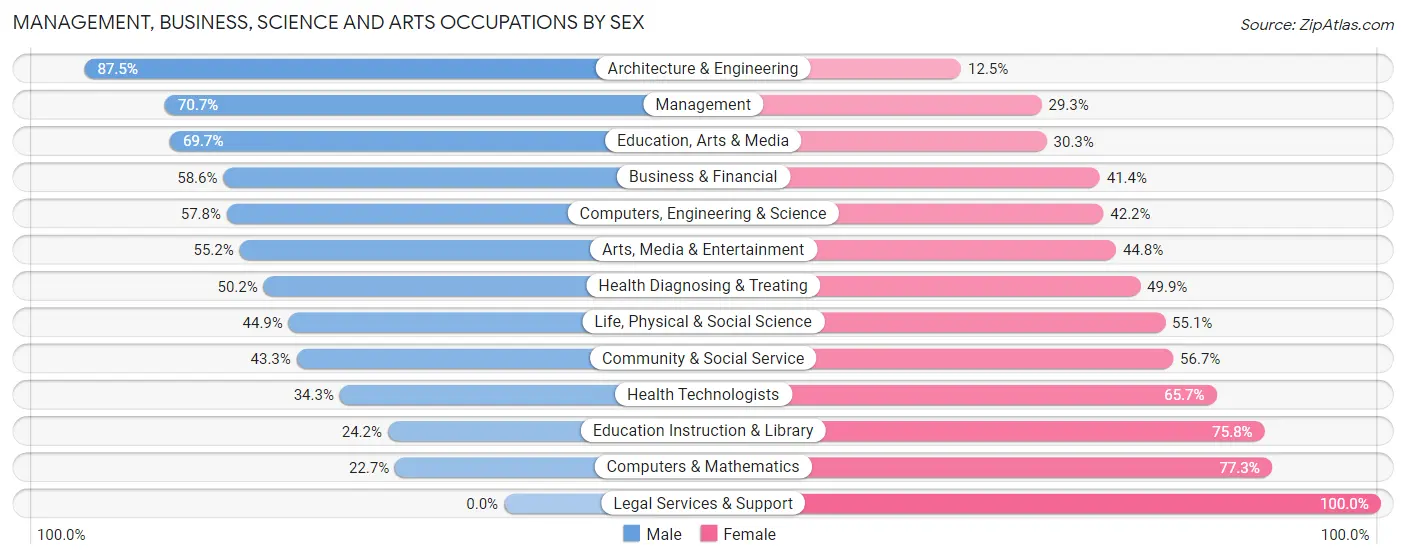
Management, Business, Science and Arts Occupations by Sex
Within the Management, Business, Science and Arts occupations in Eastland County, the most male-oriented occupations are Architecture & Engineering (87.5%), Management (70.7%), and Education, Arts & Media (69.7%), while the most female-oriented occupations are Legal Services & Support (100.0%), Computers & Mathematics (77.3%), and Education Instruction & Library (75.8%).
| Occupation | Male | Female |
| Management | 553 (70.7%) | 229 (29.3%) |
| Business & Financial | 301 (58.6%) | 213 (41.4%) |
| Computers, Engineering & Science | 85 (57.8%) | 62 (42.2%) |
| Computers & Mathematics | 5 (22.7%) | 17 (77.3%) |
| Architecture & Engineering | 49 (87.5%) | 7 (12.5%) |
| Life, Physical & Social Science | 31 (44.9%) | 38 (55.1%) |
| Community & Social Service | 382 (43.3%) | 501 (56.7%) |
| Education, Arts & Media | 248 (69.7%) | 108 (30.3%) |
| Legal Services & Support | 0 (0.0%) | 11 (100.0%) |
| Education Instruction & Library | 118 (24.2%) | 369 (75.8%) |
| Arts, Media & Entertainment | 16 (55.2%) | 13 (44.8%) |
| Health Diagnosing & Treating | 167 (50.1%) | 166 (49.8%) |
| Health Technologists | 74 (34.3%) | 142 (65.7%) |
| Total (Category) | 1,488 (56.0%) | 1,171 (44.0%) |
| Total (Overall) | 4,350 (56.5%) | 3,356 (43.5%) |
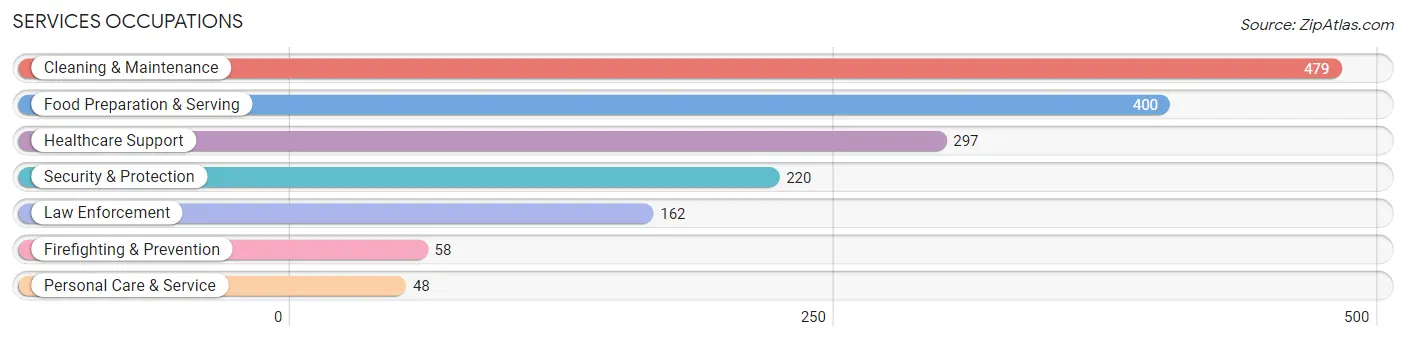
Services Occupations
The most common Services occupations in Eastland County are Cleaning & Maintenance (479 | 6.2%), Food Preparation & Serving (400 | 5.2%), Healthcare Support (297 | 3.8%), Security & Protection (220 | 2.9%), and Law Enforcement (162 | 2.1%).
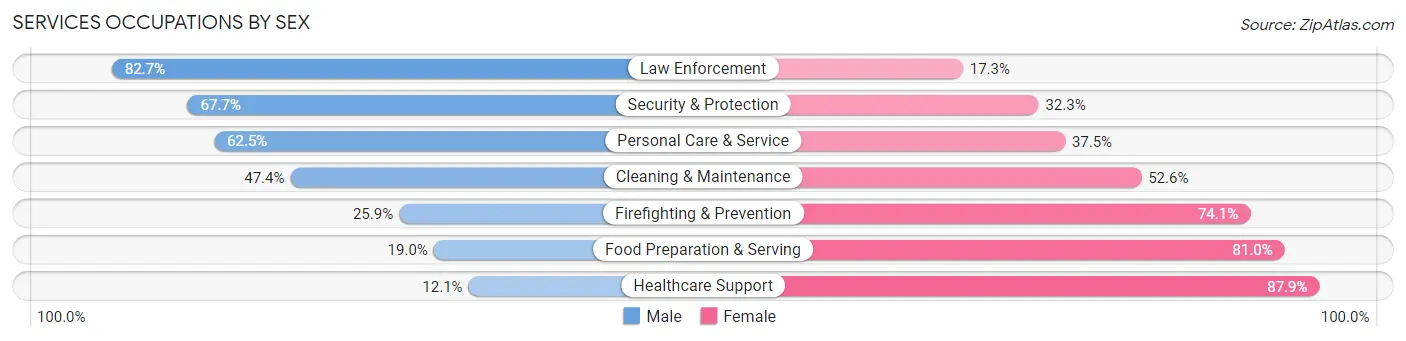
Services Occupations by Sex
Within the Services occupations in Eastland County, the most male-oriented occupations are Law Enforcement (82.7%), Security & Protection (67.7%), and Personal Care & Service (62.5%), while the most female-oriented occupations are Healthcare Support (87.9%), Food Preparation & Serving (81.0%), and Firefighting & Prevention (74.1%).
| Occupation | Male | Female |
| Healthcare Support | 36 (12.1%) | 261 (87.9%) |
| Security & Protection | 149 (67.7%) | 71 (32.3%) |
| Firefighting & Prevention | 15 (25.9%) | 43 (74.1%) |
| Law Enforcement | 134 (82.7%) | 28 (17.3%) |
| Food Preparation & Serving | 76 (19.0%) | 324 (81.0%) |
| Cleaning & Maintenance | 227 (47.4%) | 252 (52.6%) |
| Personal Care & Service | 30 (62.5%) | 18 (37.5%) |
| Total (Category) | 518 (35.9%) | 926 (64.1%) |
| Total (Overall) | 4,350 (56.5%) | 3,356 (43.5%) |
Sales and Office Occupations
The most common Sales and Office occupations in Eastland County are Office & Administration (856 | 11.1%), and Sales & Related (669 | 8.7%).
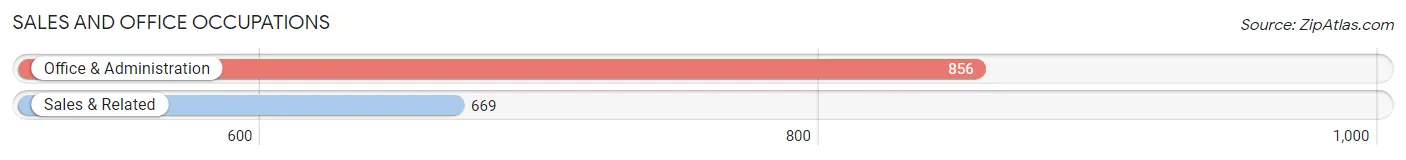
Sales and Office Occupations by Sex

| Occupation | Male | Female |
| Sales & Related | 358 (53.5%) | 311 (46.5%) |
| Office & Administration | 113 (13.2%) | 743 (86.8%) |
| Total (Category) | 471 (30.9%) | 1,054 (69.1%) |
| Total (Overall) | 4,350 (56.5%) | 3,356 (43.5%) |
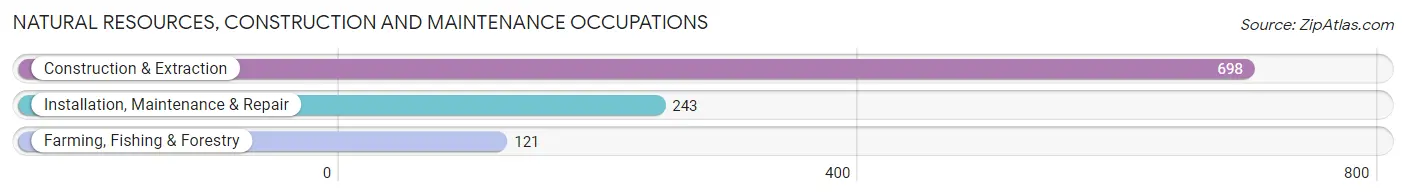
Natural Resources, Construction and Maintenance Occupations
The most common Natural Resources, Construction and Maintenance occupations in Eastland County are Construction & Extraction (698 | 9.1%), Installation, Maintenance & Repair (243 | 3.2%), and Farming, Fishing & Forestry (121 | 1.6%).
Natural Resources, Construction and Maintenance Occupations by Sex
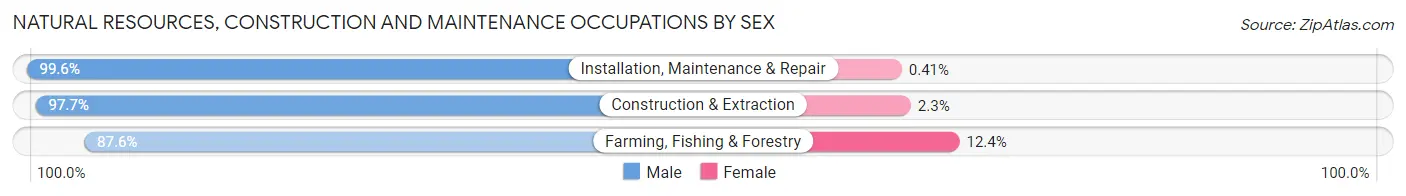
| Occupation | Male | Female |
| Farming, Fishing & Forestry | 106 (87.6%) | 15 (12.4%) |
| Construction & Extraction | 682 (97.7%) | 16 (2.3%) |
| Installation, Maintenance & Repair | 242 (99.6%) | 1 (0.4%) |
| Total (Category) | 1,030 (97.0%) | 32 (3.0%) |
| Total (Overall) | 4,350 (56.5%) | 3,356 (43.5%) |
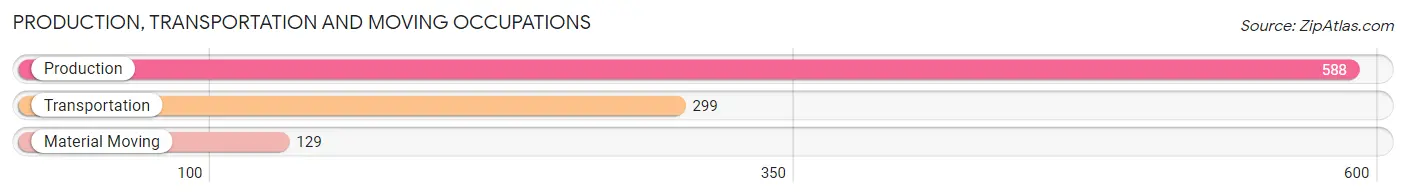
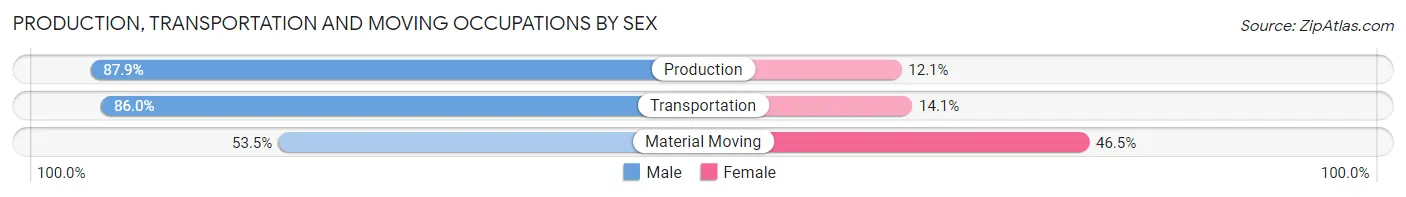
Production, Transportation and Moving Occupations
The most common Production, Transportation and Moving occupations in Eastland County are Production (588 | 7.6%), Transportation (299 | 3.9%), and Material Moving (129 | 1.7%).
Production, Transportation and Moving Occupations by Sex
| Occupation | Male | Female |
| Production | 517 (87.9%) | 71 (12.1%) |
| Transportation | 257 (86.0%) | 42 (14.1%) |
| Material Moving | 69 (53.5%) | 60 (46.5%) |
| Total (Category) | 843 (83.0%) | 173 (17.0%) |
| Total (Overall) | 4,350 (56.5%) | 3,356 (43.5%) |
Employment Industries by Sex in Eastland County
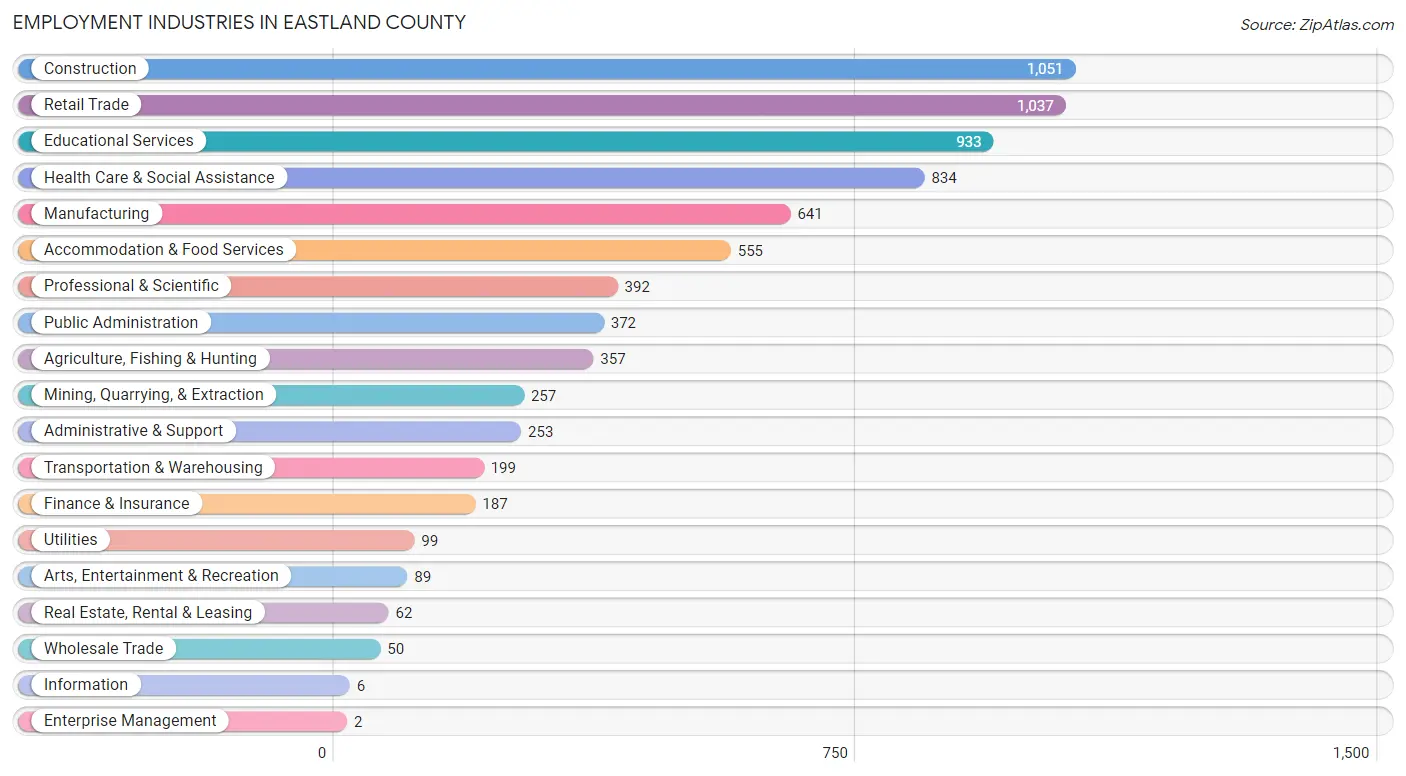
Employment Industries in Eastland County
The major employment industries in Eastland County include Construction (1,051 | 13.6%), Retail Trade (1,037 | 13.5%), Educational Services (933 | 12.1%), Health Care & Social Assistance (834 | 10.8%), and Manufacturing (641 | 8.3%).
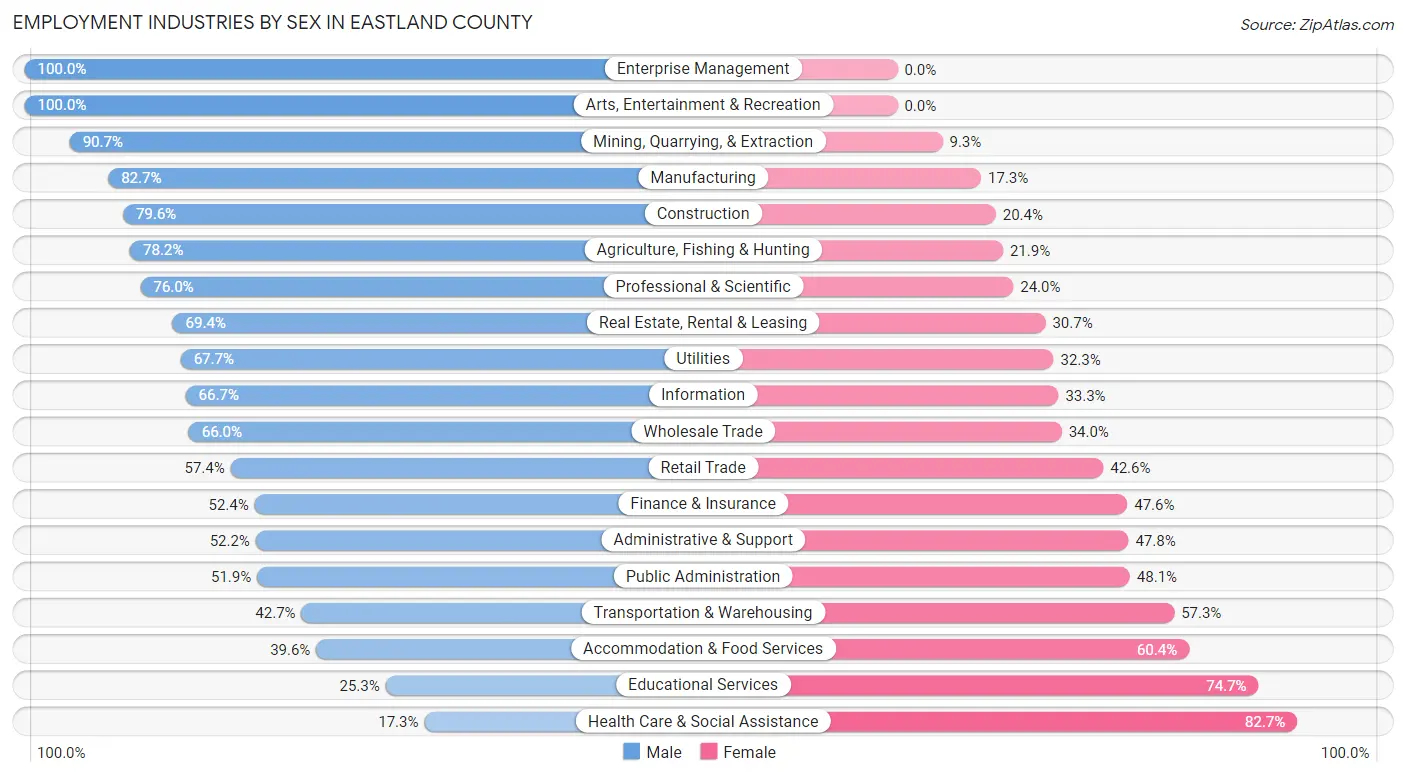
Employment Industries by Sex in Eastland County
The Eastland County industries that see more men than women are Enterprise Management (100.0%), Arts, Entertainment & Recreation (100.0%), and Mining, Quarrying, & Extraction (90.7%), whereas the industries that tend to have a higher number of women are Health Care & Social Assistance (82.7%), Educational Services (74.7%), and Accommodation & Food Services (60.4%).
| Industry | Male | Female |
| Agriculture, Fishing & Hunting | 279 (78.1%) | 78 (21.8%) |
| Mining, Quarrying, & Extraction | 233 (90.7%) | 24 (9.3%) |
| Construction | 837 (79.6%) | 214 (20.4%) |
| Manufacturing | 530 (82.7%) | 111 (17.3%) |
| Wholesale Trade | 33 (66.0%) | 17 (34.0%) |
| Retail Trade | 595 (57.4%) | 442 (42.6%) |
| Transportation & Warehousing | 85 (42.7%) | 114 (57.3%) |
| Utilities | 67 (67.7%) | 32 (32.3%) |
| Information | 4 (66.7%) | 2 (33.3%) |
| Finance & Insurance | 98 (52.4%) | 89 (47.6%) |
| Real Estate, Rental & Leasing | 43 (69.4%) | 19 (30.6%) |
| Professional & Scientific | 298 (76.0%) | 94 (24.0%) |
| Enterprise Management | 2 (100.0%) | 0 (0.0%) |
| Administrative & Support | 132 (52.2%) | 121 (47.8%) |
| Educational Services | 236 (25.3%) | 697 (74.7%) |
| Health Care & Social Assistance | 144 (17.3%) | 690 (82.7%) |
| Arts, Entertainment & Recreation | 89 (100.0%) | 0 (0.0%) |
| Accommodation & Food Services | 220 (39.6%) | 335 (60.4%) |
| Public Administration | 193 (51.9%) | 179 (48.1%) |
| Total | 4,350 (56.5%) | 3,356 (43.5%) |
Education in Eastland County
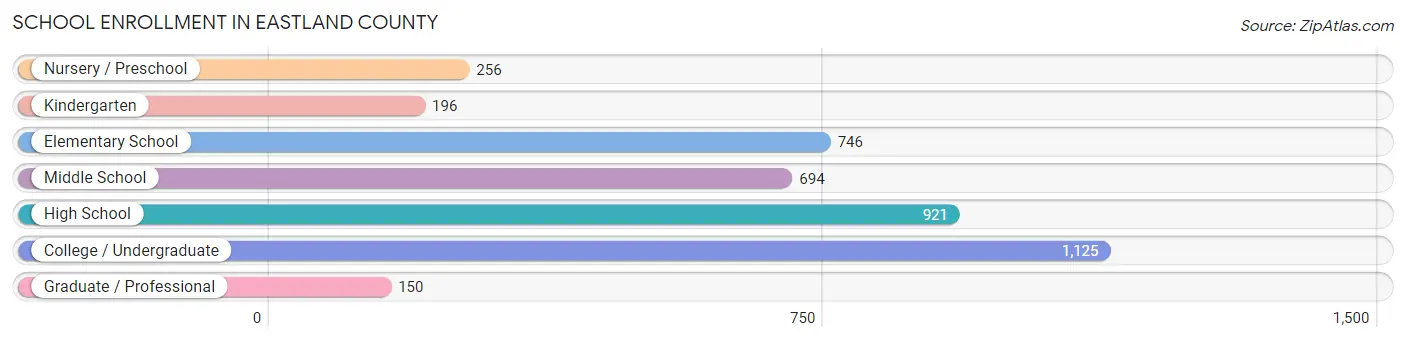
School Enrollment in Eastland County
The most common levels of schooling among the 4,088 students in Eastland County are college / undergraduate (1,125 | 27.5%), high school (921 | 22.5%), and elementary school (746 | 18.2%).
| School Level | # Students | % Students |
| Nursery / Preschool | 256 | 6.3% |
| Kindergarten | 196 | 4.8% |
| Elementary School | 746 | 18.2% |
| Middle School | 694 | 17.0% |
| High School | 921 | 22.5% |
| College / Undergraduate | 1,125 | 27.5% |
| Graduate / Professional | 150 | 3.7% |
| Total | 4,088 | 100.0% |
School Enrollment by Age by Funding Source in Eastland County
Out of a total of 4,088 students who are enrolled in schools in Eastland County, 421 (10.3%) attend a private institution, while the remaining 3,667 (89.7%) are enrolled in public schools. The age group of 3 to 4 year olds has the highest likelihood of being enrolled in private schools, with 94 (49.2% in the age bracket) enrolled. Conversely, the age group of 15 to 17 year olds has the lowest likelihood of being enrolled in a private school, with 693 (100.0% in the age bracket) attending a public institution.
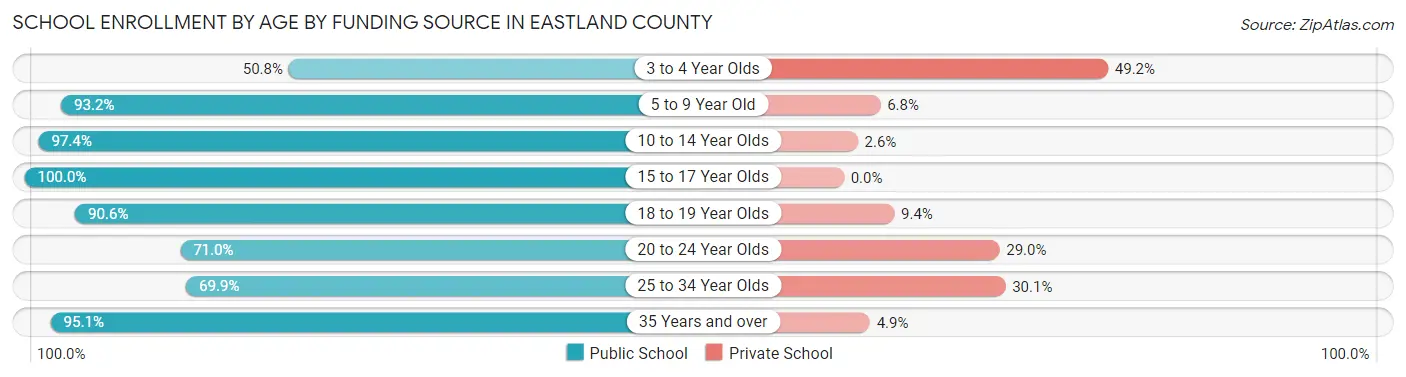
| Age Bracket | Public School | Private School |
| 3 to 4 Year Olds | 97 (50.8%) | 94 (49.2%) |
| 5 to 9 Year Old | 876 (93.2%) | 64 (6.8%) |
| 10 to 14 Year Olds | 900 (97.4%) | 24 (2.6%) |
| 15 to 17 Year Olds | 693 (100.0%) | 0 (0.0%) |
| 18 to 19 Year Olds | 501 (90.6%) | 52 (9.4%) |
| 20 to 24 Year Olds | 267 (71.0%) | 109 (29.0%) |
| 25 to 34 Year Olds | 158 (69.9%) | 68 (30.1%) |
| 35 Years and over | 176 (95.1%) | 9 (4.9%) |
| Total | 3,667 (89.7%) | 421 (10.3%) |
Educational Attainment by Field of Study in Eastland County
Education (514 | 17.8%), business (493 | 17.1%), science & technology (405 | 14.0%), computers & mathematics (216 | 7.5%), and engineering (189 | 6.6%) are the most common fields of study among 2,884 individuals in Eastland County who have obtained a bachelor's degree or higher.
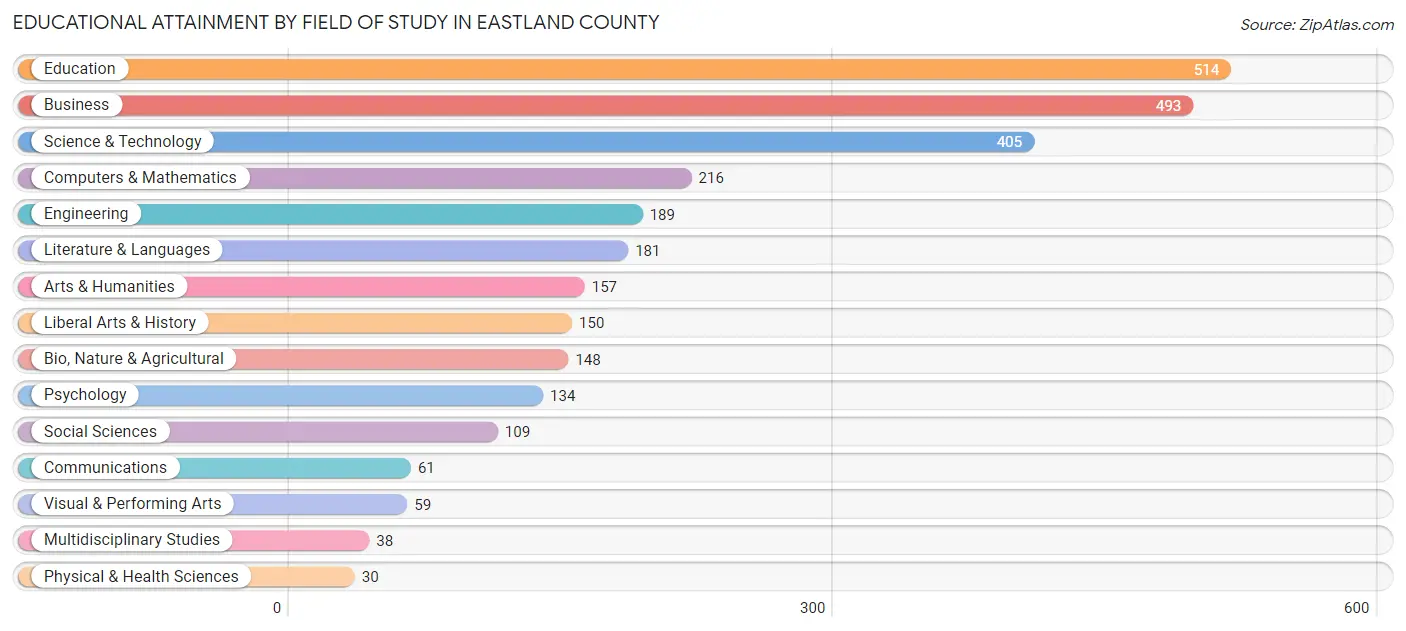
| Field of Study | # Graduates | % Graduates |
| Computers & Mathematics | 216 | 7.5% |
| Bio, Nature & Agricultural | 148 | 5.1% |
| Physical & Health Sciences | 30 | 1.0% |
| Psychology | 134 | 4.6% |
| Social Sciences | 109 | 3.8% |
| Engineering | 189 | 6.6% |
| Multidisciplinary Studies | 38 | 1.3% |
| Science & Technology | 405 | 14.0% |
| Business | 493 | 17.1% |
| Education | 514 | 17.8% |
| Literature & Languages | 181 | 6.3% |
| Liberal Arts & History | 150 | 5.2% |
| Visual & Performing Arts | 59 | 2.1% |
| Communications | 61 | 2.1% |
| Arts & Humanities | 157 | 5.4% |
| Total | 2,884 | 100.0% |
Transportation & Commute in Eastland County
Vehicle Availability by Sex in Eastland County
The most prevalent vehicle ownership categories in Eastland County are males with 2 vehicles (2,161, accounting for 51.4%) and females with 2 vehicles (1,567, making up 67.7%).
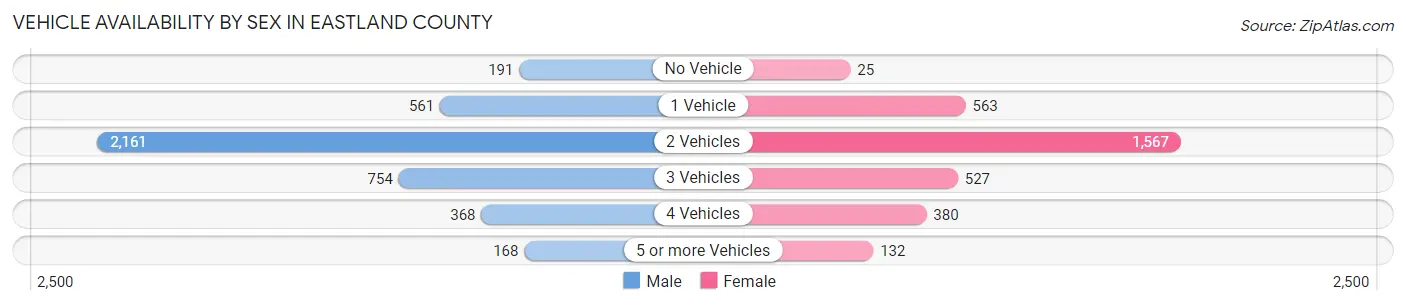
| Vehicles Available | Male | Female |
| No Vehicle | 191 (4.5%) | 25 (0.8%) |
| 1 Vehicle | 561 (13.4%) | 563 (17.6%) |
| 2 Vehicles | 2,161 (51.4%) | 1,567 (49.1%) |
| 3 Vehicles | 754 (17.9%) | 527 (16.5%) |
| 4 Vehicles | 368 (8.8%) | 380 (11.9%) |
| 5 or more Vehicles | 168 (4.0%) | 132 (4.1%) |
| Total | 4,203 (100.0%) | 3,194 (100.0%) |
Commute Time in Eastland County
The most frequently occuring commute durations in Eastland County are 5 to 9 minutes (1,534 commuters, 21.3%), 10 to 14 minutes (1,225 commuters, 17.0%), and less than 5 minutes (906 commuters, 12.6%).
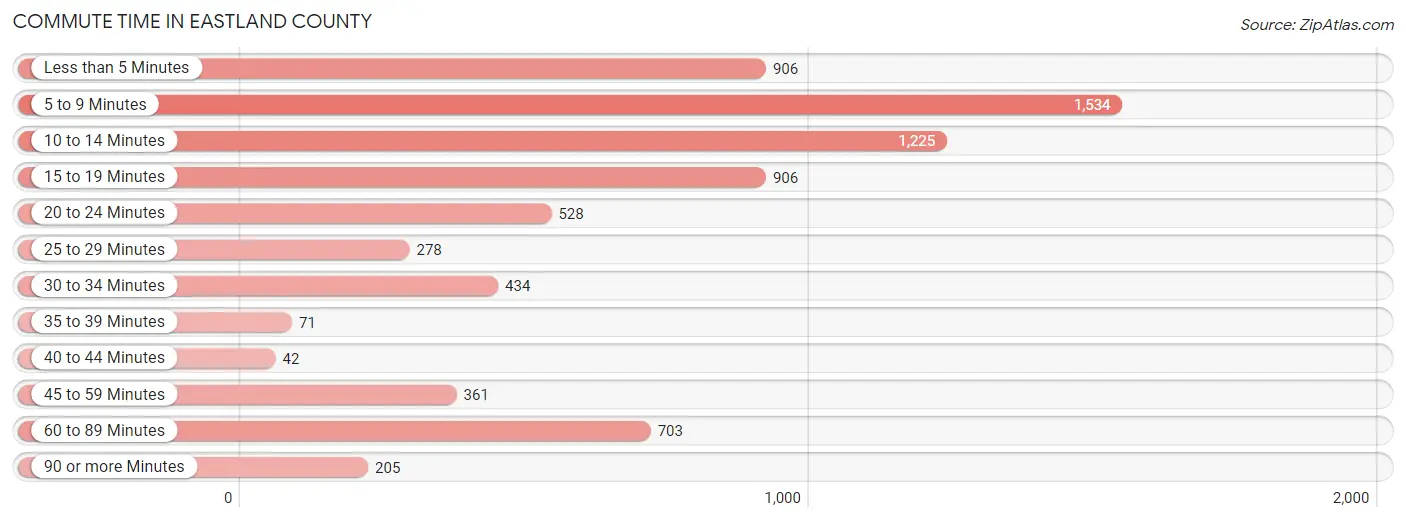
| Commute Time | # Commuters | % Commuters |
| Less than 5 Minutes | 906 | 12.6% |
| 5 to 9 Minutes | 1,534 | 21.3% |
| 10 to 14 Minutes | 1,225 | 17.0% |
| 15 to 19 Minutes | 906 | 12.6% |
| 20 to 24 Minutes | 528 | 7.3% |
| 25 to 29 Minutes | 278 | 3.9% |
| 30 to 34 Minutes | 434 | 6.0% |
| 35 to 39 Minutes | 71 | 1.0% |
| 40 to 44 Minutes | 42 | 0.6% |
| 45 to 59 Minutes | 361 | 5.0% |
| 60 to 89 Minutes | 703 | 9.8% |
| 90 or more Minutes | 205 | 2.9% |
Commute Time by Sex in Eastland County
The most common commute times in Eastland County are 5 to 9 minutes (879 commuters, 21.4%) for males and 5 to 9 minutes (655 commuters, 21.2%) for females.
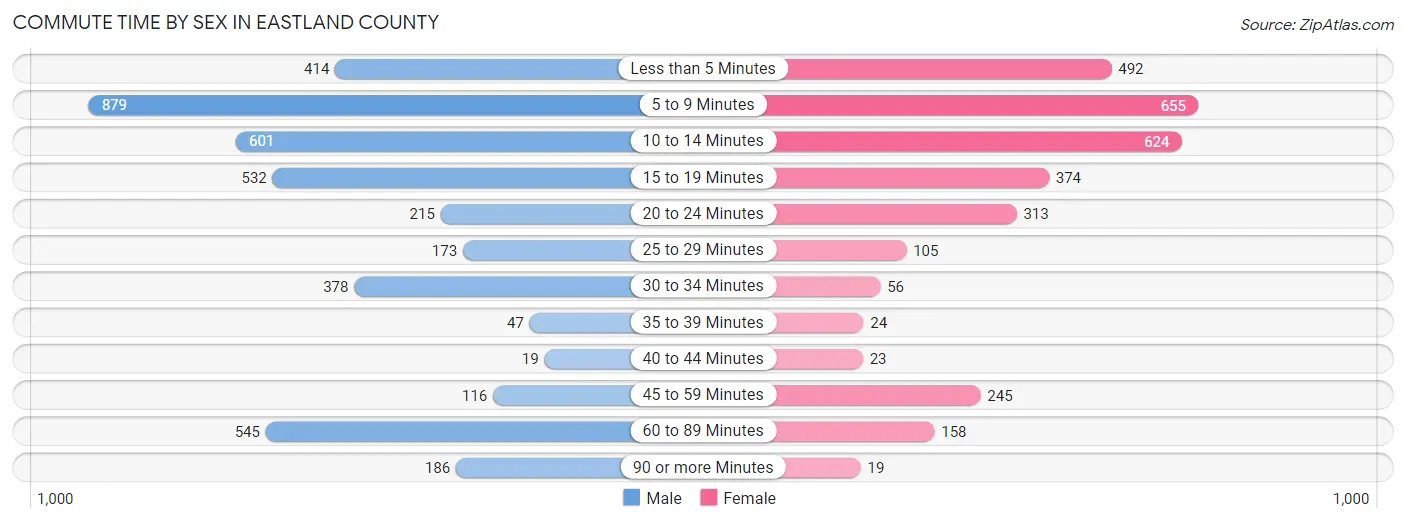
| Commute Time | Male | Female |
| Less than 5 Minutes | 414 (10.1%) | 492 (15.9%) |
| 5 to 9 Minutes | 879 (21.4%) | 655 (21.2%) |
| 10 to 14 Minutes | 601 (14.6%) | 624 (20.2%) |
| 15 to 19 Minutes | 532 (13.0%) | 374 (12.1%) |
| 20 to 24 Minutes | 215 (5.2%) | 313 (10.1%) |
| 25 to 29 Minutes | 173 (4.2%) | 105 (3.4%) |
| 30 to 34 Minutes | 378 (9.2%) | 56 (1.8%) |
| 35 to 39 Minutes | 47 (1.1%) | 24 (0.8%) |
| 40 to 44 Minutes | 19 (0.5%) | 23 (0.7%) |
| 45 to 59 Minutes | 116 (2.8%) | 245 (7.9%) |
| 60 to 89 Minutes | 545 (13.3%) | 158 (5.1%) |
| 90 or more Minutes | 186 (4.5%) | 19 (0.6%) |
Time of Departure to Work by Sex in Eastland County
The most frequent times of departure to work in Eastland County are 7:00 AM to 7:29 AM (753, 18.3%) for males and 7:00 AM to 7:29 AM (793, 25.7%) for females.
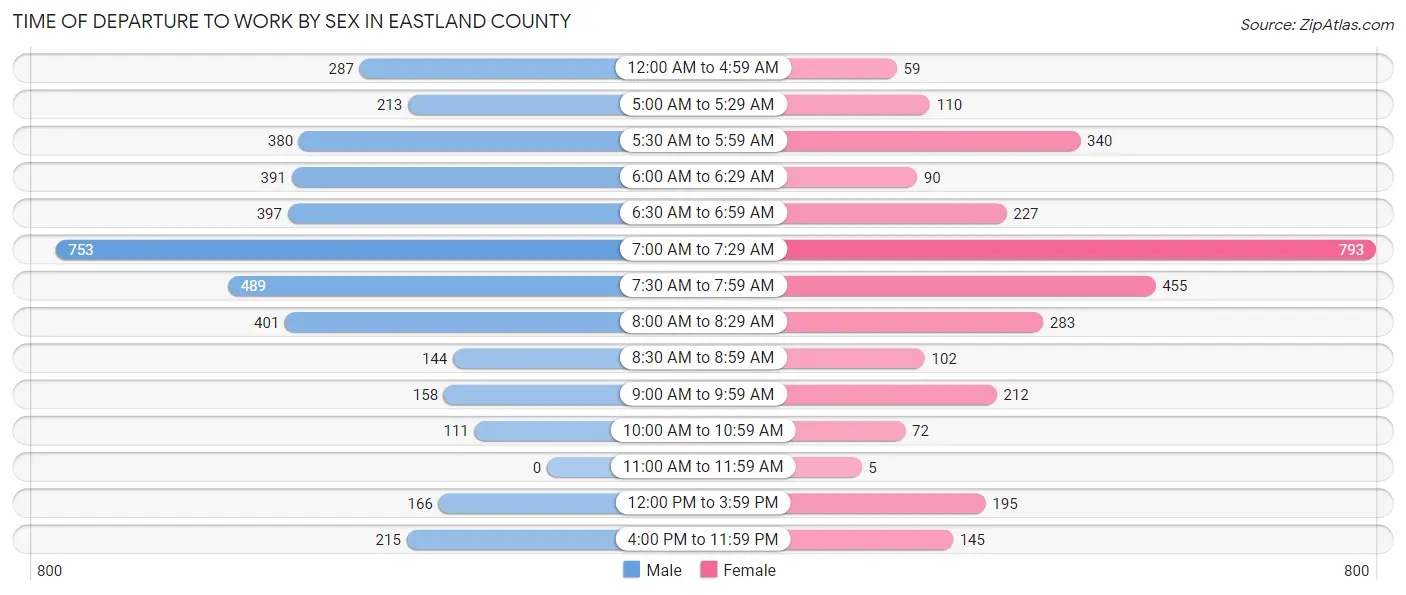
| Time of Departure | Male | Female |
| 12:00 AM to 4:59 AM | 287 (7.0%) | 59 (1.9%) |
| 5:00 AM to 5:29 AM | 213 (5.2%) | 110 (3.6%) |
| 5:30 AM to 5:59 AM | 380 (9.3%) | 340 (11.0%) |
| 6:00 AM to 6:29 AM | 391 (9.5%) | 90 (2.9%) |
| 6:30 AM to 6:59 AM | 397 (9.7%) | 227 (7.3%) |
| 7:00 AM to 7:29 AM | 753 (18.3%) | 793 (25.7%) |
| 7:30 AM to 7:59 AM | 489 (11.9%) | 455 (14.7%) |
| 8:00 AM to 8:29 AM | 401 (9.8%) | 283 (9.2%) |
| 8:30 AM to 8:59 AM | 144 (3.5%) | 102 (3.3%) |
| 9:00 AM to 9:59 AM | 158 (3.8%) | 212 (6.9%) |
| 10:00 AM to 10:59 AM | 111 (2.7%) | 72 (2.3%) |
| 11:00 AM to 11:59 AM | 0 (0.0%) | 5 (0.2%) |
| 12:00 PM to 3:59 PM | 166 (4.0%) | 195 (6.3%) |
| 4:00 PM to 11:59 PM | 215 (5.2%) | 145 (4.7%) |
| Total | 4,105 (100.0%) | 3,088 (100.0%) |
Housing Occupancy in Eastland County
Occupancy by Ownership in Eastland County
Of the total 7,083 dwellings in Eastland County, owner-occupied units account for 4,922 (69.5%), while renter-occupied units make up 2,161 (30.5%).
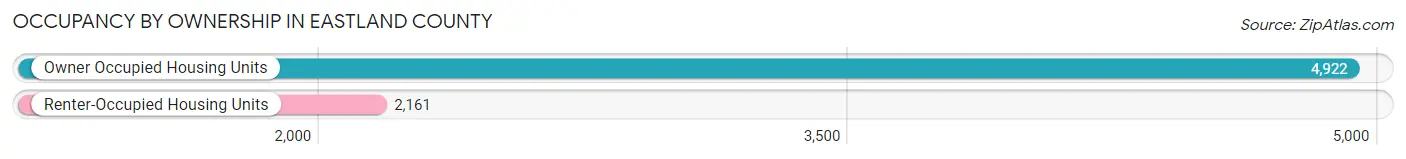
| Occupancy | # Housing Units | % Housing Units |
| Owner Occupied Housing Units | 4,922 | 69.5% |
| Renter-Occupied Housing Units | 2,161 | 30.5% |
| Total Occupied Housing Units | 7,083 | 100.0% |
Occupancy by Household Size in Eastland County
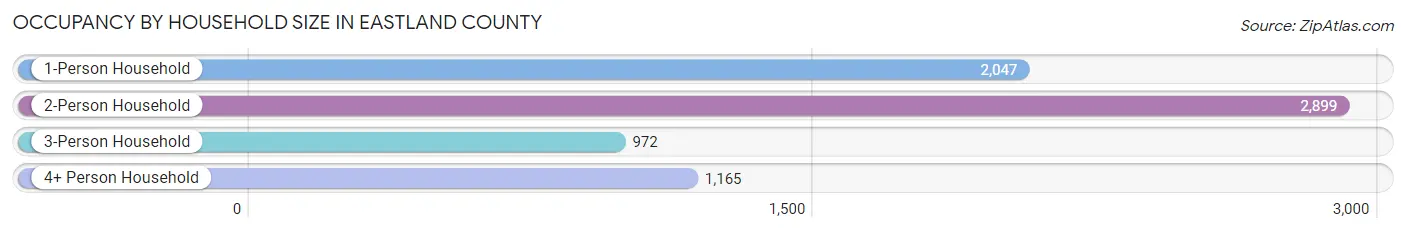
| Household Size | # Housing Units | % Housing Units |
| 1-Person Household | 2,047 | 28.9% |
| 2-Person Household | 2,899 | 40.9% |
| 3-Person Household | 972 | 13.7% |
| 4+ Person Household | 1,165 | 16.5% |
| Total Housing Units | 7,083 | 100.0% |
Occupancy by Ownership by Household Size in Eastland County
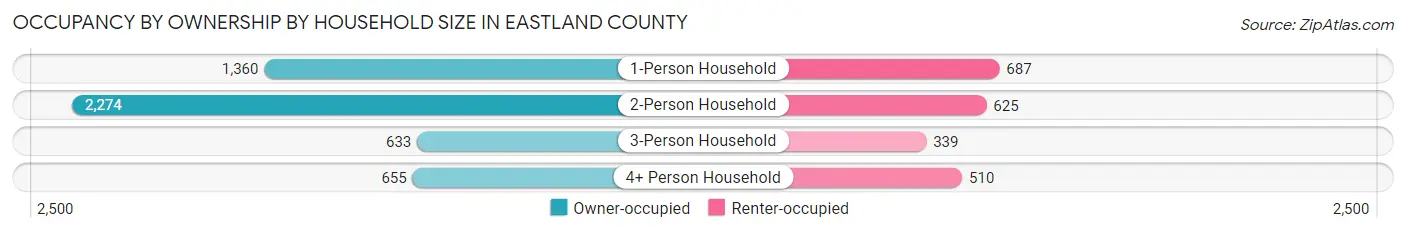
| Household Size | Owner-occupied | Renter-occupied |
| 1-Person Household | 1,360 (66.4%) | 687 (33.6%) |
| 2-Person Household | 2,274 (78.4%) | 625 (21.6%) |
| 3-Person Household | 633 (65.1%) | 339 (34.9%) |
| 4+ Person Household | 655 (56.2%) | 510 (43.8%) |
| Total Housing Units | 4,922 (69.5%) | 2,161 (30.5%) |
Occupancy by Educational Attainment in Eastland County
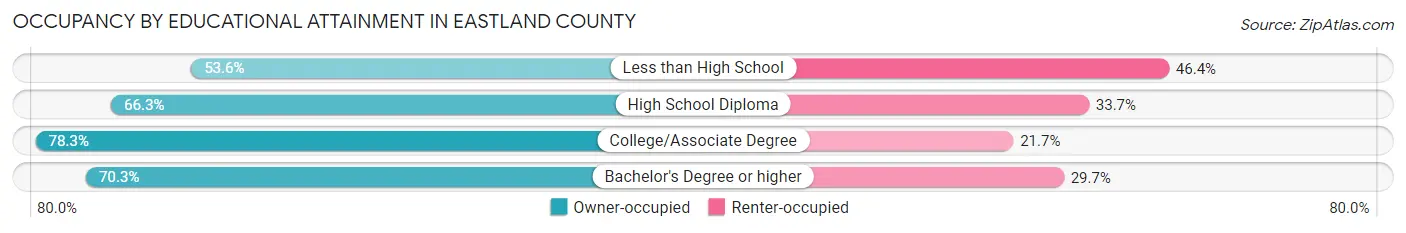
| Household Size | Owner-occupied | Renter-occupied |
| Less than High School | 570 (53.6%) | 494 (46.4%) |
| High School Diploma | 1,291 (66.3%) | 657 (33.7%) |
| College/Associate Degree | 1,965 (78.3%) | 546 (21.7%) |
| Bachelor's Degree or higher | 1,096 (70.3%) | 464 (29.7%) |
Occupancy by Age of Householder in Eastland County
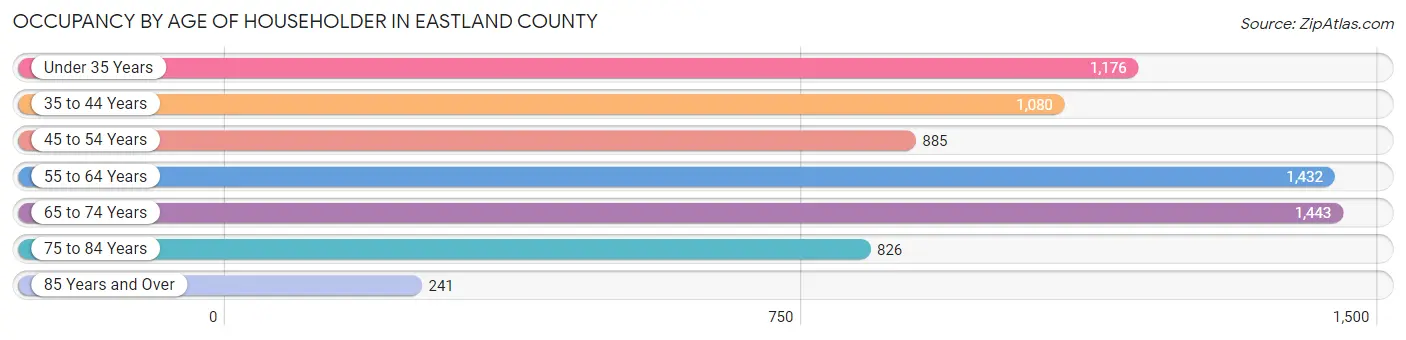
| Age Bracket | # Households | % Households |
| Under 35 Years | 1,176 | 16.6% |
| 35 to 44 Years | 1,080 | 15.2% |
| 45 to 54 Years | 885 | 12.5% |
| 55 to 64 Years | 1,432 | 20.2% |
| 65 to 74 Years | 1,443 | 20.4% |
| 75 to 84 Years | 826 | 11.7% |
| 85 Years and Over | 241 | 3.4% |
| Total | 7,083 | 100.0% |
Housing Finances in Eastland County
Median Income by Occupancy in Eastland County
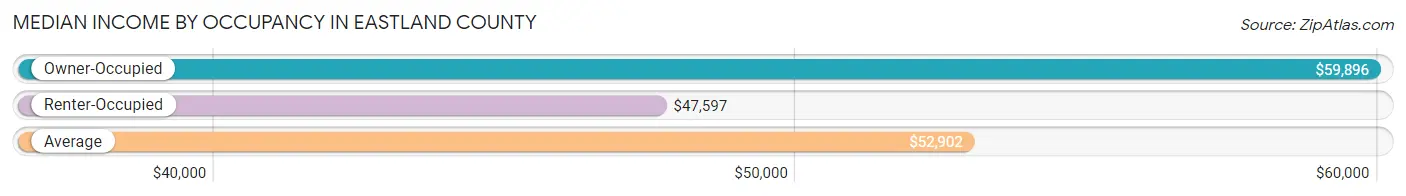
| Occupancy Type | # Households | Median Income |
| Owner-Occupied | 4,922 (69.5%) | $59,896 |
| Renter-Occupied | 2,161 (30.5%) | $47,597 |
| Average | 7,083 (100.0%) | $52,902 |
Occupancy by Householder Income Bracket in Eastland County
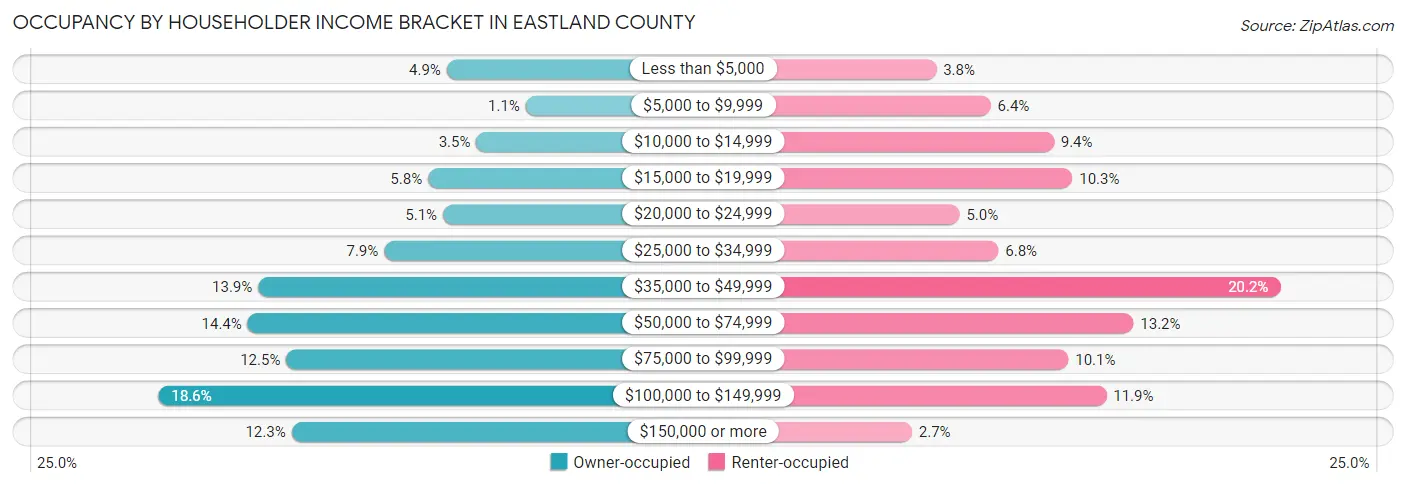
| Income Bracket | Owner-occupied | Renter-occupied |
| Less than $5,000 | 241 (4.9%) | 83 (3.8%) |
| $5,000 to $9,999 | 56 (1.1%) | 139 (6.4%) |
| $10,000 to $14,999 | 172 (3.5%) | 204 (9.4%) |
| $15,000 to $19,999 | 285 (5.8%) | 223 (10.3%) |
| $20,000 to $24,999 | 250 (5.1%) | 107 (5.0%) |
| $25,000 to $34,999 | 388 (7.9%) | 147 (6.8%) |
| $35,000 to $49,999 | 683 (13.9%) | 437 (20.2%) |
| $50,000 to $74,999 | 708 (14.4%) | 286 (13.2%) |
| $75,000 to $99,999 | 617 (12.5%) | 219 (10.1%) |
| $100,000 to $149,999 | 917 (18.6%) | 258 (11.9%) |
| $150,000 or more | 605 (12.3%) | 58 (2.7%) |
| Total | 4,922 (100.0%) | 2,161 (100.0%) |
Monthly Housing Cost Tiers in Eastland County
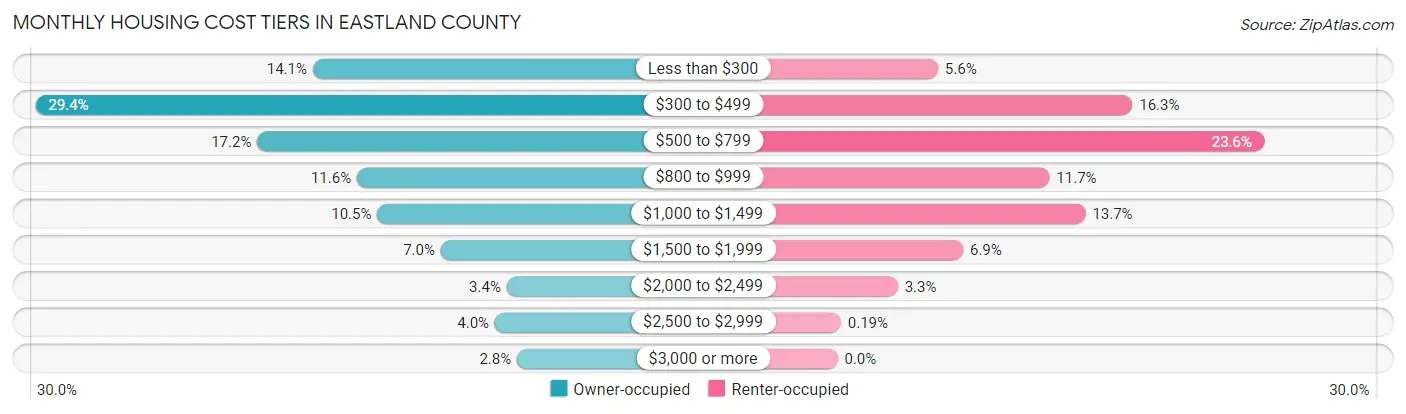
| Monthly Cost | Owner-occupied | Renter-occupied |
| Less than $300 | 693 (14.1%) | 120 (5.6%) |
| $300 to $499 | 1,447 (29.4%) | 352 (16.3%) |
| $500 to $799 | 844 (17.2%) | 509 (23.5%) |
| $800 to $999 | 573 (11.6%) | 253 (11.7%) |
| $1,000 to $1,499 | 518 (10.5%) | 296 (13.7%) |
| $1,500 to $1,999 | 345 (7.0%) | 150 (6.9%) |
| $2,000 to $2,499 | 166 (3.4%) | 72 (3.3%) |
| $2,500 to $2,999 | 198 (4.0%) | 4 (0.2%) |
| $3,000 or more | 138 (2.8%) | 0 (0.0%) |
| Total | 4,922 (100.0%) | 2,161 (100.0%) |
Physical Housing Characteristics in Eastland County
Housing Structures in Eastland County
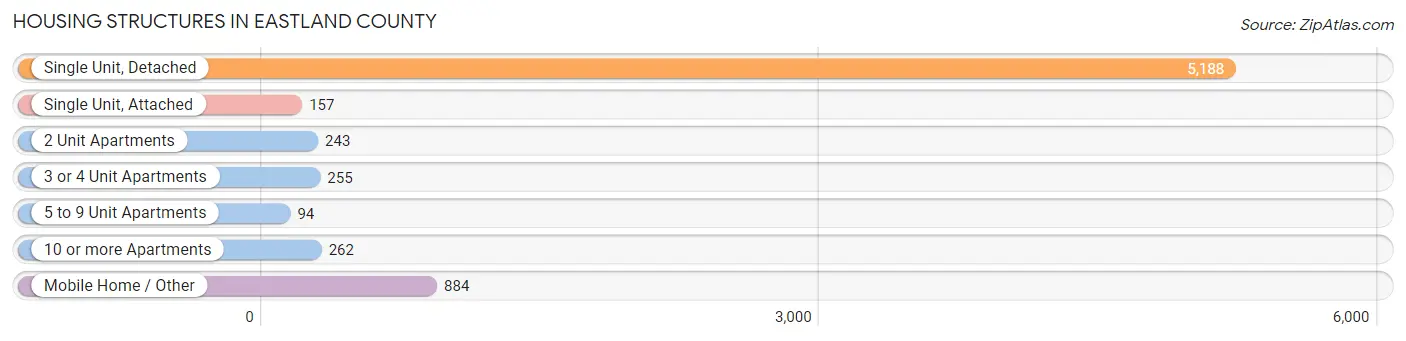
| Structure Type | # Housing Units | % Housing Units |
| Single Unit, Detached | 5,188 | 73.3% |
| Single Unit, Attached | 157 | 2.2% |
| 2 Unit Apartments | 243 | 3.4% |
| 3 or 4 Unit Apartments | 255 | 3.6% |
| 5 to 9 Unit Apartments | 94 | 1.3% |
| 10 or more Apartments | 262 | 3.7% |
| Mobile Home / Other | 884 | 12.5% |
| Total | 7,083 | 100.0% |
Housing Structures by Occupancy in Eastland County
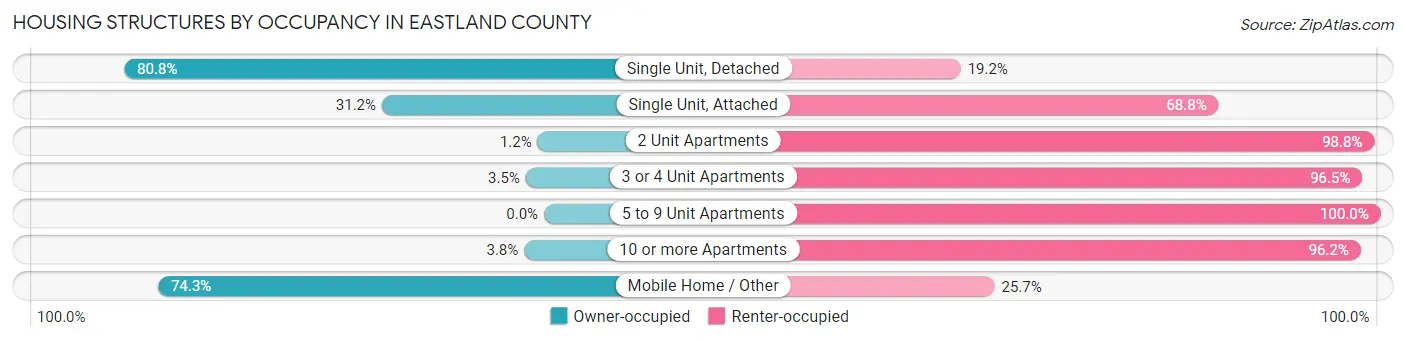
| Structure Type | Owner-occupied | Renter-occupied |
| Single Unit, Detached | 4,194 (80.8%) | 994 (19.2%) |
| Single Unit, Attached | 49 (31.2%) | 108 (68.8%) |
| 2 Unit Apartments | 3 (1.2%) | 240 (98.8%) |
| 3 or 4 Unit Apartments | 9 (3.5%) | 246 (96.5%) |
| 5 to 9 Unit Apartments | 0 (0.0%) | 94 (100.0%) |
| 10 or more Apartments | 10 (3.8%) | 252 (96.2%) |
| Mobile Home / Other | 657 (74.3%) | 227 (25.7%) |
| Total | 4,922 (69.5%) | 2,161 (30.5%) |
Housing Structures by Number of Rooms in Eastland County
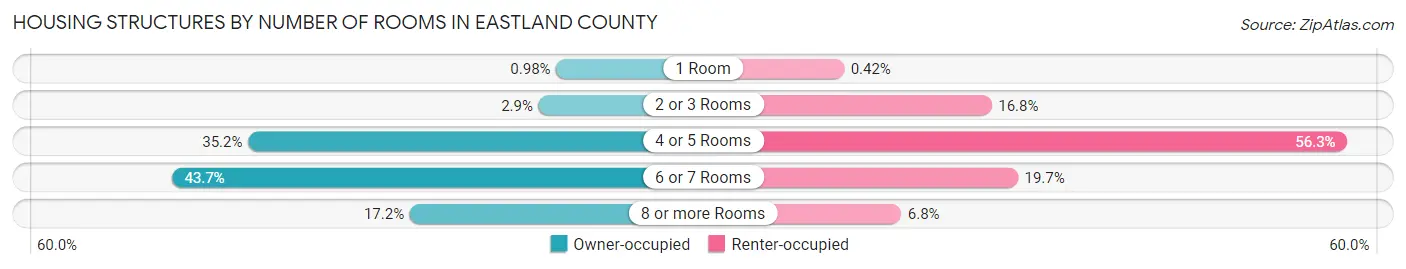
| Number of Rooms | Owner-occupied | Renter-occupied |
| 1 Room | 48 (1.0%) | 9 (0.4%) |
| 2 or 3 Rooms | 144 (2.9%) | 363 (16.8%) |
| 4 or 5 Rooms | 1,731 (35.2%) | 1,217 (56.3%) |
| 6 or 7 Rooms | 2,151 (43.7%) | 426 (19.7%) |
| 8 or more Rooms | 848 (17.2%) | 146 (6.8%) |
| Total | 4,922 (100.0%) | 2,161 (100.0%) |
Housing Structure by Heating Type in Eastland County
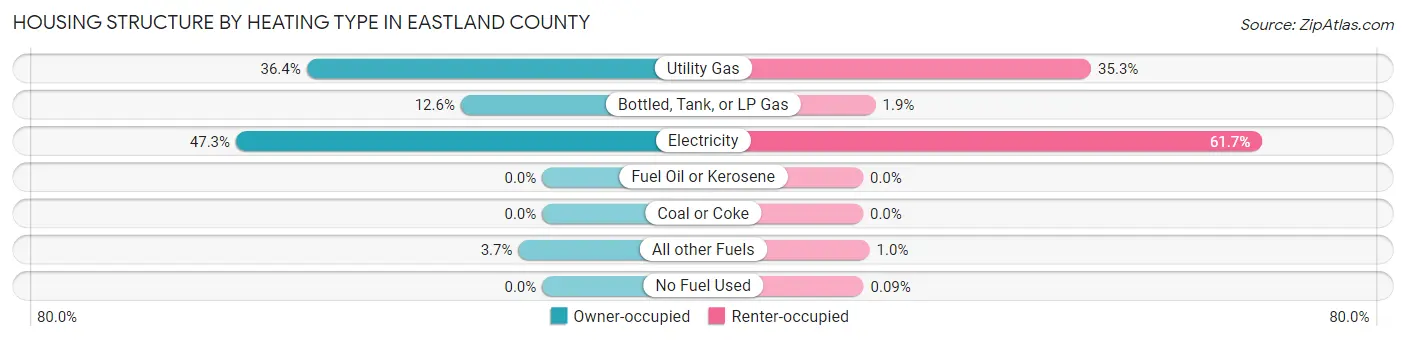
| Heating Type | Owner-occupied | Renter-occupied |
| Utility Gas | 1,792 (36.4%) | 762 (35.3%) |
| Bottled, Tank, or LP Gas | 619 (12.6%) | 42 (1.9%) |
| Electricity | 2,330 (47.3%) | 1,333 (61.7%) |
| Fuel Oil or Kerosene | 0 (0.0%) | 0 (0.0%) |
| Coal or Coke | 0 (0.0%) | 0 (0.0%) |
| All other Fuels | 181 (3.7%) | 22 (1.0%) |
| No Fuel Used | 0 (0.0%) | 2 (0.1%) |
| Total | 4,922 (100.0%) | 2,161 (100.0%) |
Household Vehicle Usage in Eastland County
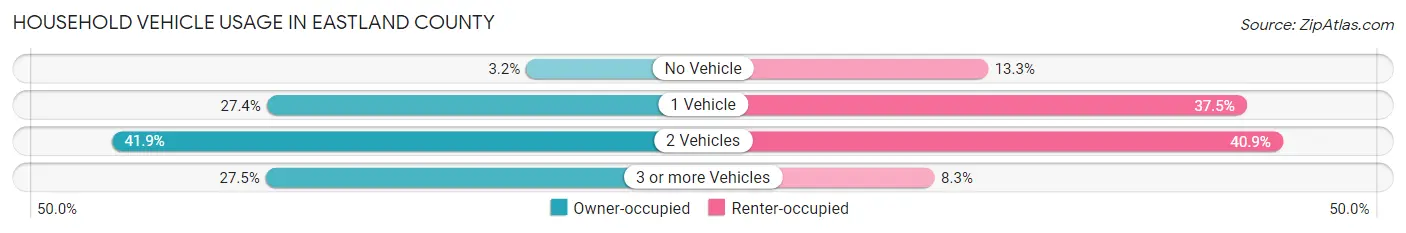
| Vehicles per Household | Owner-occupied | Renter-occupied |
| No Vehicle | 157 (3.2%) | 288 (13.3%) |
| 1 Vehicle | 1,349 (27.4%) | 810 (37.5%) |
| 2 Vehicles | 2,062 (41.9%) | 883 (40.9%) |
| 3 or more Vehicles | 1,354 (27.5%) | 180 (8.3%) |
| Total | 4,922 (100.0%) | 2,161 (100.0%) |
Real Estate & Mortgages in Eastland County
Real Estate and Mortgage Overview in Eastland County
| Characteristic | Without Mortgage | With Mortgage |
| Housing Units | 3,256 | 1,666 |
| Median Property Value | $88,500 | $156,400 |
| Median Household Income | $50,665 | $319 |
| Monthly Housing Costs | $415 | $128 |
| Real Estate Taxes | $1,098 | $19 |
Property Value by Mortgage Status in Eastland County
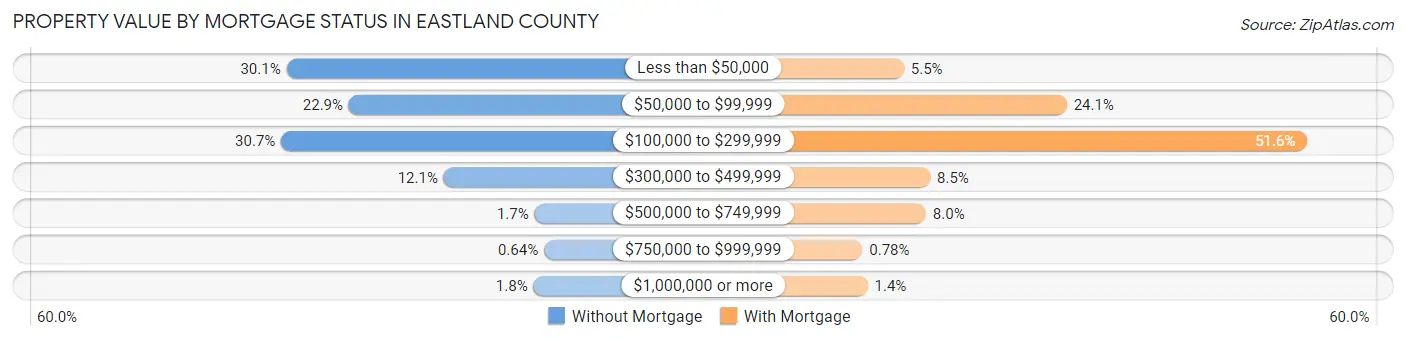
| Property Value | Without Mortgage | With Mortgage |
| Less than $50,000 | 979 (30.1%) | 92 (5.5%) |
| $50,000 to $99,999 | 747 (22.9%) | 402 (24.1%) |
| $100,000 to $299,999 | 999 (30.7%) | 860 (51.6%) |
| $300,000 to $499,999 | 394 (12.1%) | 142 (8.5%) |
| $500,000 to $749,999 | 56 (1.7%) | 134 (8.0%) |
| $750,000 to $999,999 | 21 (0.6%) | 13 (0.8%) |
| $1,000,000 or more | 60 (1.8%) | 23 (1.4%) |
| Total | 3,256 (100.0%) | 1,666 (100.0%) |
Household Income by Mortgage Status in Eastland County
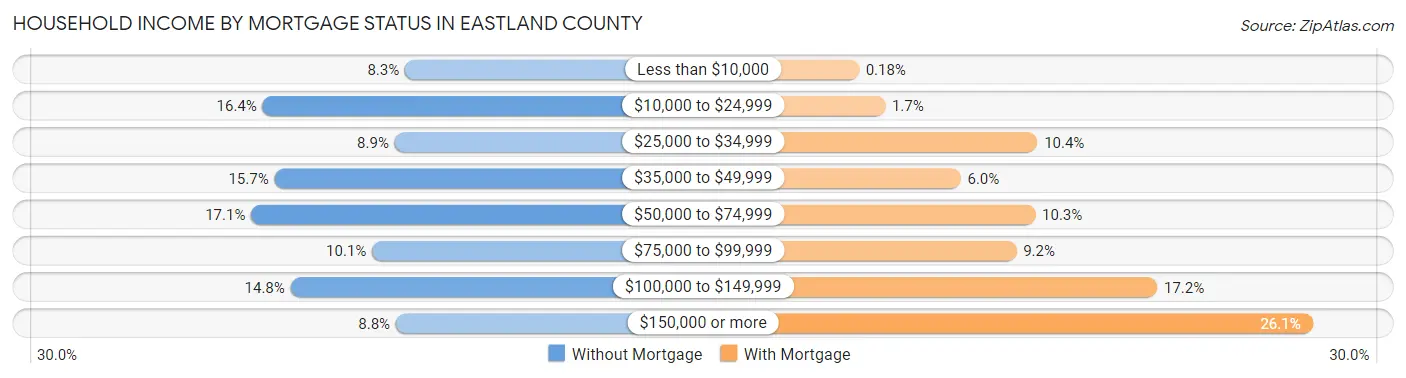
| Household Income | Without Mortgage | With Mortgage |
| Less than $10,000 | 269 (8.3%) | 3 (0.2%) |
| $10,000 to $24,999 | 534 (16.4%) | 28 (1.7%) |
| $25,000 to $34,999 | 288 (8.8%) | 173 (10.4%) |
| $35,000 to $49,999 | 512 (15.7%) | 100 (6.0%) |
| $50,000 to $74,999 | 555 (17.1%) | 171 (10.3%) |
| $75,000 to $99,999 | 330 (10.1%) | 153 (9.2%) |
| $100,000 to $149,999 | 482 (14.8%) | 287 (17.2%) |
| $150,000 or more | 286 (8.8%) | 435 (26.1%) |
| Total | 3,256 (100.0%) | 1,666 (100.0%) |
Property Value to Household Income Ratio in Eastland County
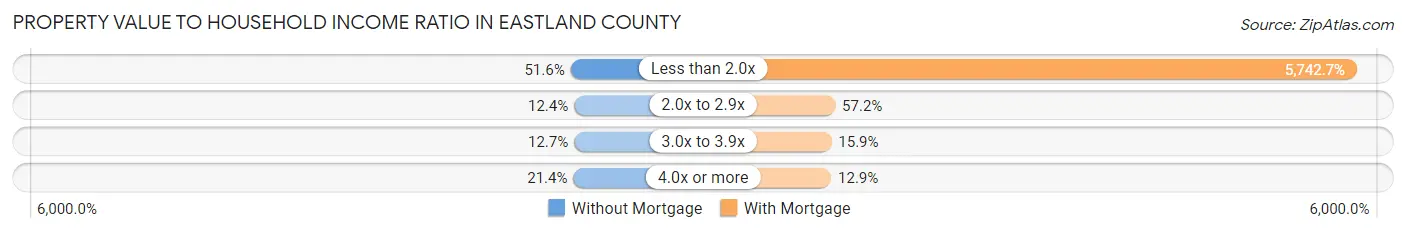
| Value-to-Income Ratio | Without Mortgage | With Mortgage |
| Less than 2.0x | 1,680 (51.6%) | 95,673 (5,742.7%) |
| 2.0x to 2.9x | 404 (12.4%) | 953 (57.2%) |
| 3.0x to 3.9x | 413 (12.7%) | 264 (15.9%) |
| 4.0x or more | 698 (21.4%) | 215 (12.9%) |
| Total | 3,256 (100.0%) | 1,666 (100.0%) |
Real Estate Taxes by Mortgage Status in Eastland County
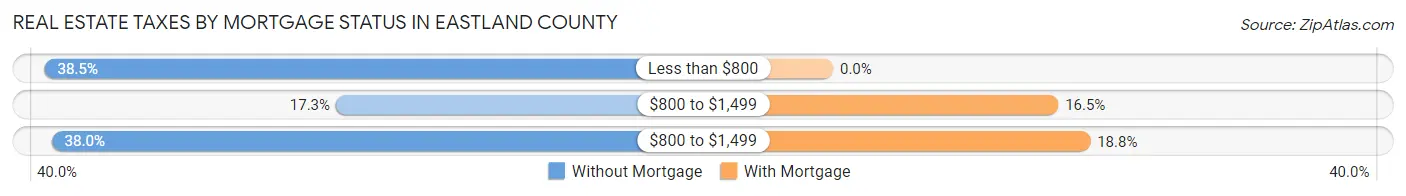
| Property Taxes | Without Mortgage | With Mortgage |
| Less than $800 | 1,255 (38.5%) | 0 (0.0%) |
| $800 to $1,499 | 562 (17.3%) | 274 (16.5%) |
| $800 to $1,499 | 1,238 (38.0%) | 313 (18.8%) |
| Total | 3,256 (100.0%) | 1,666 (100.0%) |
Health & Disability in Eastland County
Health Insurance Coverage by Age in Eastland County
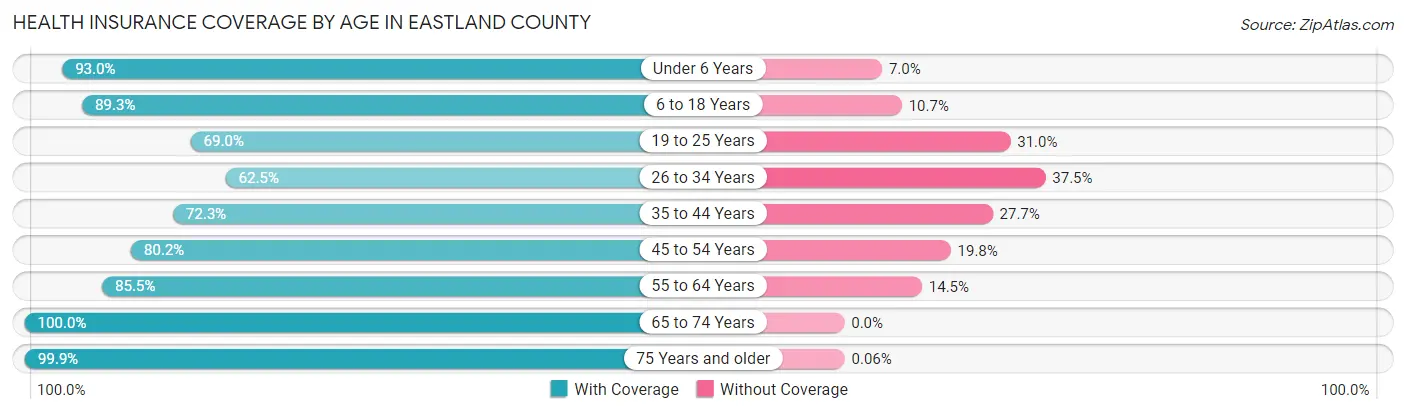
| Age Bracket | With Coverage | Without Coverage |
| Under 6 Years | 1,192 (93.0%) | 90 (7.0%) |
| 6 to 18 Years | 2,460 (89.3%) | 295 (10.7%) |
| 19 to 25 Years | 1,211 (69.0%) | 543 (31.0%) |
| 26 to 34 Years | 1,044 (62.5%) | 626 (37.5%) |
| 35 to 44 Years | 1,428 (72.3%) | 546 (27.7%) |
| 45 to 54 Years | 1,512 (80.2%) | 374 (19.8%) |
| 55 to 64 Years | 2,177 (85.5%) | 368 (14.5%) |
| 65 to 74 Years | 2,129 (100.0%) | 0 (0.0%) |
| 75 Years and older | 1,555 (99.9%) | 1 (0.1%) |
| Total | 14,708 (83.8%) | 2,843 (16.2%) |
Health Insurance Coverage by Citizenship Status in Eastland County
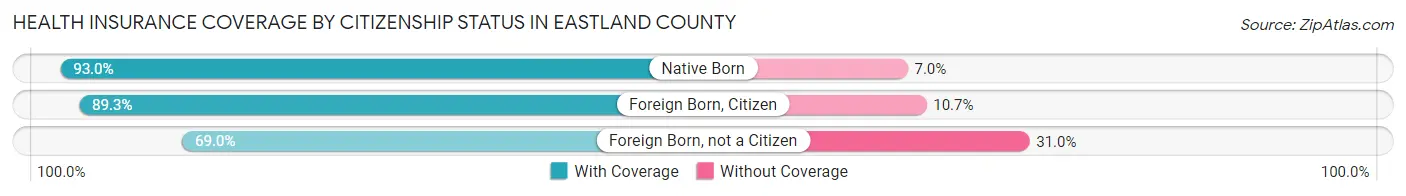
| Citizenship Status | With Coverage | Without Coverage |
| Native Born | 1,192 (93.0%) | 90 (7.0%) |
| Foreign Born, Citizen | 2,460 (89.3%) | 295 (10.7%) |
| Foreign Born, not a Citizen | 1,211 (69.0%) | 543 (31.0%) |
Health Insurance Coverage by Household Income in Eastland County
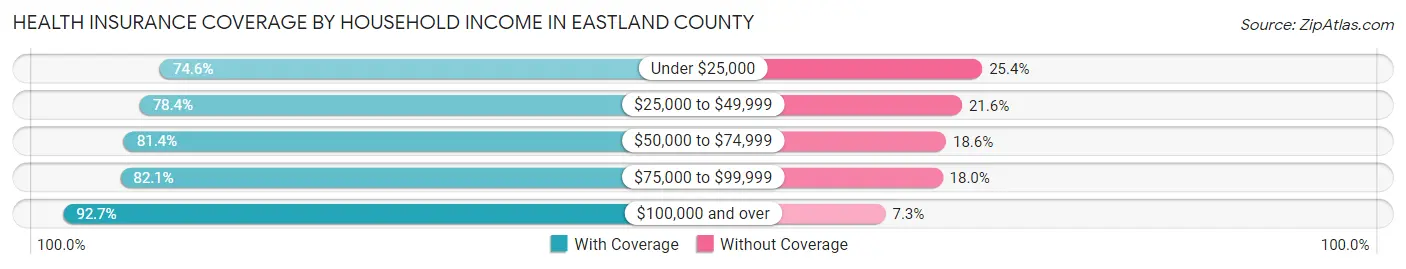
| Household Income | With Coverage | Without Coverage |
| Under $25,000 | 2,111 (74.6%) | 718 (25.4%) |
| $25,000 to $49,999 | 2,748 (78.4%) | 756 (21.6%) |
| $50,000 to $74,999 | 2,122 (81.4%) | 485 (18.6%) |
| $75,000 to $99,999 | 1,965 (82.1%) | 430 (17.9%) |
| $100,000 and over | 5,085 (92.7%) | 398 (7.3%) |
Public vs Private Health Insurance Coverage by Age in Eastland County
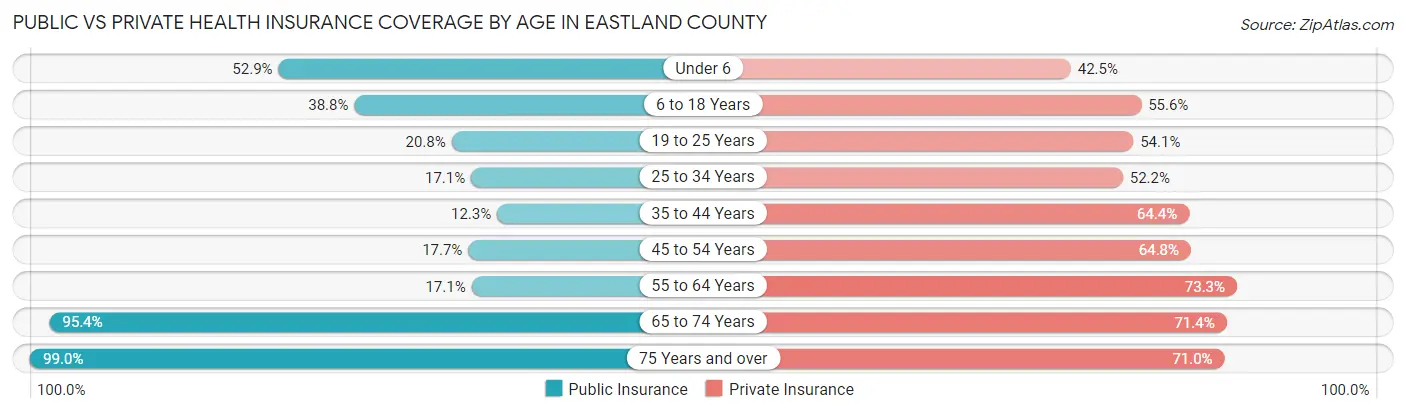
| Age Bracket | Public Insurance | Private Insurance |
| Under 6 | 678 (52.9%) | 545 (42.5%) |
| 6 to 18 Years | 1,069 (38.8%) | 1,531 (55.6%) |
| 19 to 25 Years | 364 (20.7%) | 949 (54.1%) |
| 25 to 34 Years | 286 (17.1%) | 871 (52.2%) |
| 35 to 44 Years | 243 (12.3%) | 1,272 (64.4%) |
| 45 to 54 Years | 333 (17.7%) | 1,222 (64.8%) |
| 55 to 64 Years | 434 (17.1%) | 1,866 (73.3%) |
| 65 to 74 Years | 2,031 (95.4%) | 1,520 (71.4%) |
| 75 Years and over | 1,540 (99.0%) | 1,105 (71.0%) |
| Total | 6,978 (39.8%) | 10,881 (62.0%) |
Disability Status by Sex by Age in Eastland County
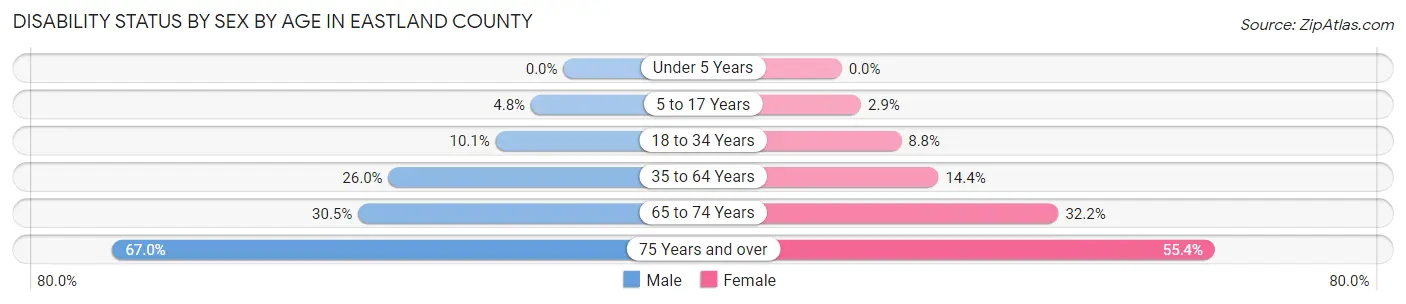
| Age Bracket | Male | Female |
| Under 5 Years | 0 (0.0%) | 0 (0.0%) |
| 5 to 17 Years | 63 (4.8%) | 41 (2.9%) |
| 18 to 34 Years | 203 (10.1%) | 152 (8.8%) |
| 35 to 64 Years | 852 (26.0%) | 449 (14.4%) |
| 65 to 74 Years | 324 (30.5%) | 343 (32.2%) |
| 75 Years and over | 470 (66.9%) | 473 (55.4%) |
Disability Class by Sex by Age in Eastland County
Disability Class: Hearing Difficulty
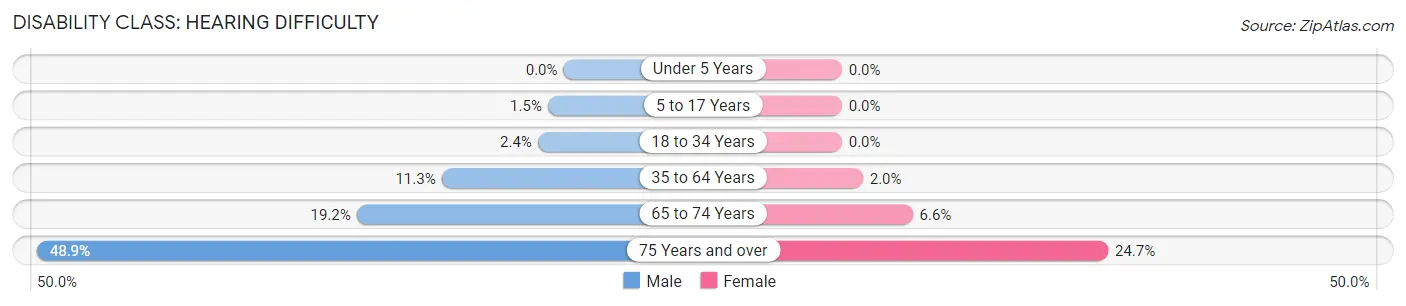
| Age Bracket | Male | Female |
| Under 5 Years | 0 (0.0%) | 0 (0.0%) |
| 5 to 17 Years | 19 (1.5%) | 0 (0.0%) |
| 18 to 34 Years | 48 (2.4%) | 0 (0.0%) |
| 35 to 64 Years | 371 (11.3%) | 61 (1.9%) |
| 65 to 74 Years | 204 (19.2%) | 70 (6.6%) |
| 75 Years and over | 343 (48.9%) | 211 (24.7%) |
Disability Class: Vision Difficulty
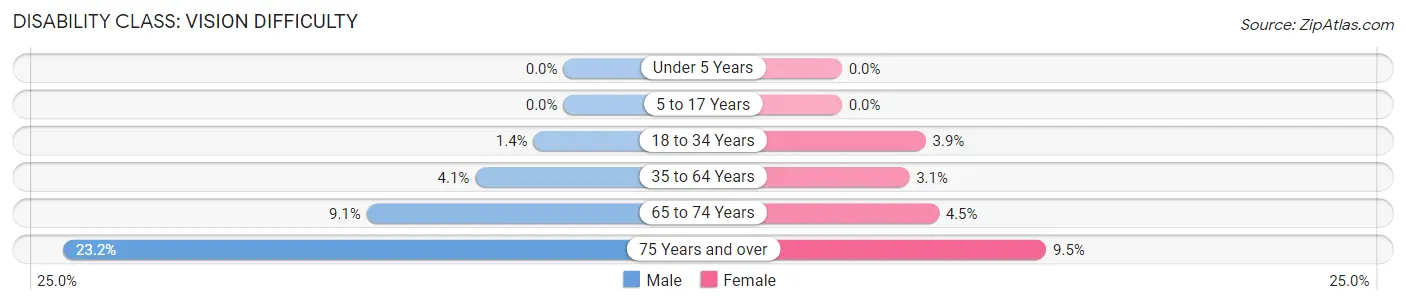
| Age Bracket | Male | Female |
| Under 5 Years | 0 (0.0%) | 0 (0.0%) |
| 5 to 17 Years | 0 (0.0%) | 0 (0.0%) |
| 18 to 34 Years | 28 (1.4%) | 67 (3.9%) |
| 35 to 64 Years | 134 (4.1%) | 98 (3.1%) |
| 65 to 74 Years | 97 (9.1%) | 48 (4.5%) |
| 75 Years and over | 163 (23.2%) | 81 (9.5%) |
Disability Class: Cognitive Difficulty
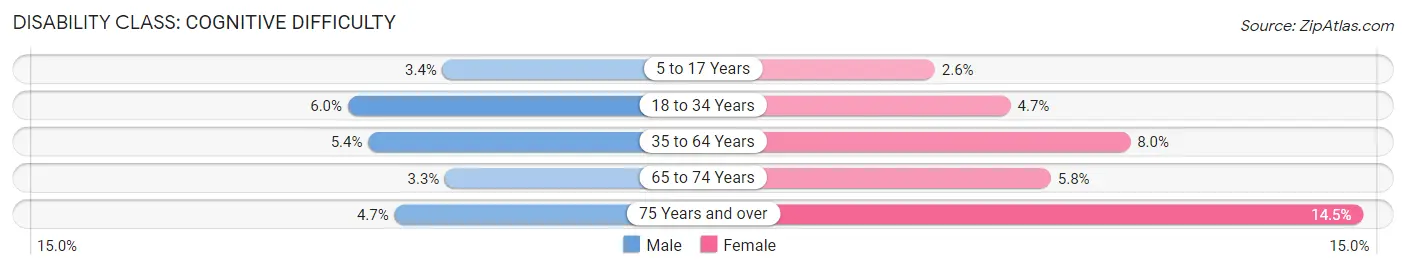
| Age Bracket | Male | Female |
| 5 to 17 Years | 44 (3.4%) | 37 (2.6%) |
| 18 to 34 Years | 121 (6.0%) | 81 (4.7%) |
| 35 to 64 Years | 178 (5.4%) | 251 (8.0%) |
| 65 to 74 Years | 35 (3.3%) | 62 (5.8%) |
| 75 Years and over | 33 (4.7%) | 124 (14.5%) |
Disability Class: Ambulatory Difficulty
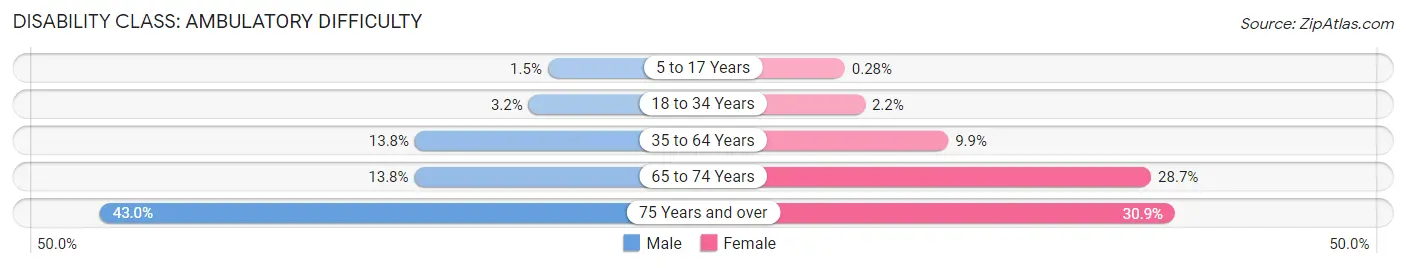
| Age Bracket | Male | Female |
| 5 to 17 Years | 19 (1.5%) | 4 (0.3%) |
| 18 to 34 Years | 65 (3.2%) | 37 (2.1%) |
| 35 to 64 Years | 452 (13.8%) | 309 (9.9%) |
| 65 to 74 Years | 147 (13.8%) | 306 (28.7%) |
| 75 Years and over | 302 (43.0%) | 264 (30.9%) |
Disability Class: Self-Care Difficulty

| Age Bracket | Male | Female |
| 5 to 17 Years | 30 (2.3%) | 0 (0.0%) |
| 18 to 34 Years | 41 (2.0%) | 0 (0.0%) |
| 35 to 64 Years | 164 (5.0%) | 158 (5.1%) |
| 65 to 74 Years | 74 (7.0%) | 184 (17.3%) |
| 75 Years and over | 105 (15.0%) | 49 (5.7%) |
Technology Access in Eastland County
Computing Device Access in Eastland County
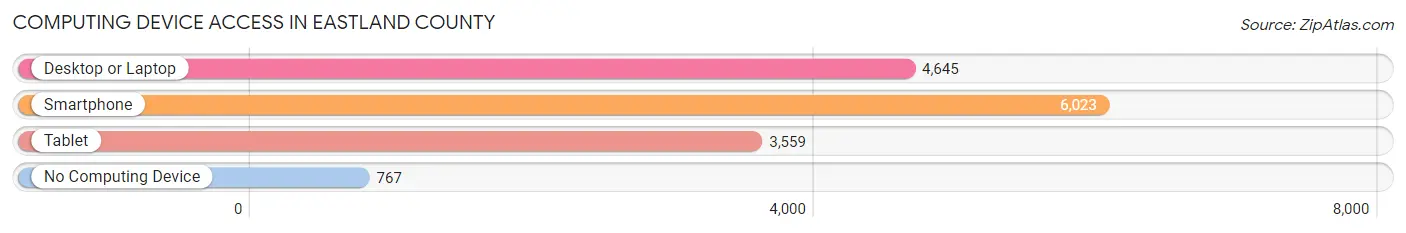
| Device Type | # Households | % Households |
| Desktop or Laptop | 4,645 | 65.6% |
| Smartphone | 6,023 | 85.0% |
| Tablet | 3,559 | 50.2% |
| No Computing Device | 767 | 10.8% |
| Total | 7,083 | 100.0% |
Internet Access in Eastland County
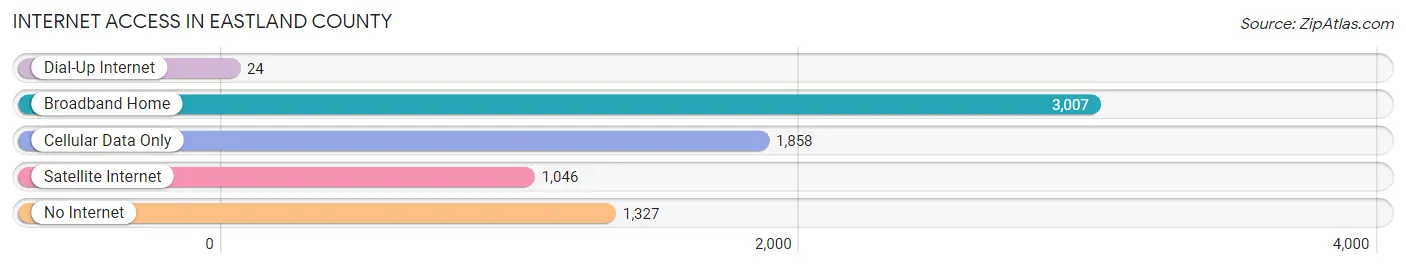
| Internet Type | # Households | % Households |
| Dial-Up Internet | 24 | 0.3% |
| Broadband Home | 3,007 | 42.4% |
| Cellular Data Only | 1,858 | 26.2% |
| Satellite Internet | 1,046 | 14.8% |
| No Internet | 1,327 | 18.7% |
| Total | 7,083 | 100.0% |
Eastland County Summary
Eastland County is located in the western part of the state of Texas, in the United States. It is part of the Abilene, Texas Metropolitan Statistical Area. The county was created in 1858 and is named for William Mosby Eastland, a soldier in the Texas Revolution. As of the 2010 census, the population was 18,583.
Geography
Eastland County is located in the western part of Texas, in the United States. It is part of the Abilene, Texas Metropolitan Statistical Area. The county is bordered by Stephens County to the north, Palo Pinto County to the east, Erath County to the south, and Callahan County to the west. The county covers an area of 919 square miles, of which 917 square miles is land and 2 square miles is water.
The terrain of Eastland County is generally flat to rolling, with some hills in the western part of the county. The county is drained by the Colorado River, which forms its western boundary. The county is home to several small lakes, including Lake Leon, Lake Cisco, and Lake Ranger.
History
Eastland County was created in 1858 from lands formerly part of Comanche County. It was named for William Mosby Eastland, a soldier in the Texas Revolution. The county seat was originally located in the town of Eastland, but was moved to Cisco in 1892.
The county was largely rural and agricultural until the discovery of oil in the 1920s. The oil boom brought an influx of people and money to the area, and the population of the county grew rapidly. The oil industry has remained an important part of the county's economy ever since.
Economy
Eastland County's economy is largely based on agriculture and oil production. The county is home to several large ranches, and the main crops grown in the area are cotton, wheat, and hay. The county is also home to several oil and gas fields, and oil production is an important part of the local economy.
In addition to agriculture and oil production, Eastland County is home to several manufacturing companies, including a steel mill and a paper mill. The county is also home to several retail stores, restaurants, and other businesses.
Demographics
As of the 2010 census, there were 18,583 people, 6,945 households, and 4,919 families living in Eastland County. The population density was 20.3 people per square mile. The racial makeup of the county was 84.3% White, 11.2% Hispanic or Latino, 1.2% African American, 0.7% Native American, 0.3% Asian, 0.1% Pacific Islander, and 2.4% from other races.
The median income for a household in Eastland County was $37,945, and the median income for a family was $45,945. The per capita income for the county was $18,945. About 14.3% of the population was below the poverty line.
Conclusion
Eastland County is located in the western part of Texas, in the United States. It was created in 1858 and is named for William Mosby Eastland, a soldier in the Texas Revolution. The county is largely rural and agricultural, with some oil production. The population of the county was 18,583 as of the 2010 census. The economy of Eastland County is largely based on agriculture and oil production, with some manufacturing and retail businesses. The median income for a household in Eastland County was $37,945, and the median income for a family was $45,945.
Common Questions
What is Per Capita Income in Eastland County?
Per Capita income in Eastland County is $31,197.
What is the Median Family Income in Eastland County?
Median Family Income in Eastland County is $70,806.
What is the Median Household income in Eastland County?
Median Household Income in Eastland County is $52,902.
What is Income or Wage Gap in Eastland County?
Income or Wage Gap in Eastland County is 29.1%.
Women in Eastland County earn 70.9 cents for every dollar earned by a man.
What is Family Income Deficit in Eastland County?
Family Income Deficit in Eastland County is $10,584.
Families that are below poverty line in Eastland County earn $10,584 less on average than the poverty threshold level.
What is Inequality or Gini Index in Eastland County?
Inequality or Gini Index in Eastland County is 0.48.
What is the Total Population of Eastland County?
Total Population of Eastland County is 17,812.
What is the Total Male Population of Eastland County?
Total Male Population of Eastland County is 8,957.
What is the Total Female Population of Eastland County?
Total Female Population of Eastland County is 8,855.
What is the Ratio of Males per 100 Females in Eastland County?
There are 101.15 Males per 100 Females in Eastland County.
What is the Ratio of Females per 100 Males in Eastland County?
There are 98.86 Females per 100 Males in Eastland County.
What is the Median Population Age in Eastland County?
Median Population Age in Eastland County is 41.5 Years.
What is the Average Family Size in Eastland County
Average Family Size in Eastland County is 2.9 People.
What is the Average Household Size in Eastland County
Average Household Size in Eastland County is 2.4 People.
How Large is the Labor Force in Eastland County?
There are 8,118 People in the Labor Forcein in Eastland County.
What is the Percentage of People in the Labor Force in Eastland County?
56.1% of People are in the Labor Force in Eastland County.
What is the Unemployment Rate in Eastland County?
Unemployment Rate in Eastland County is 4.9%.