Duval County, TX Map & Demographics
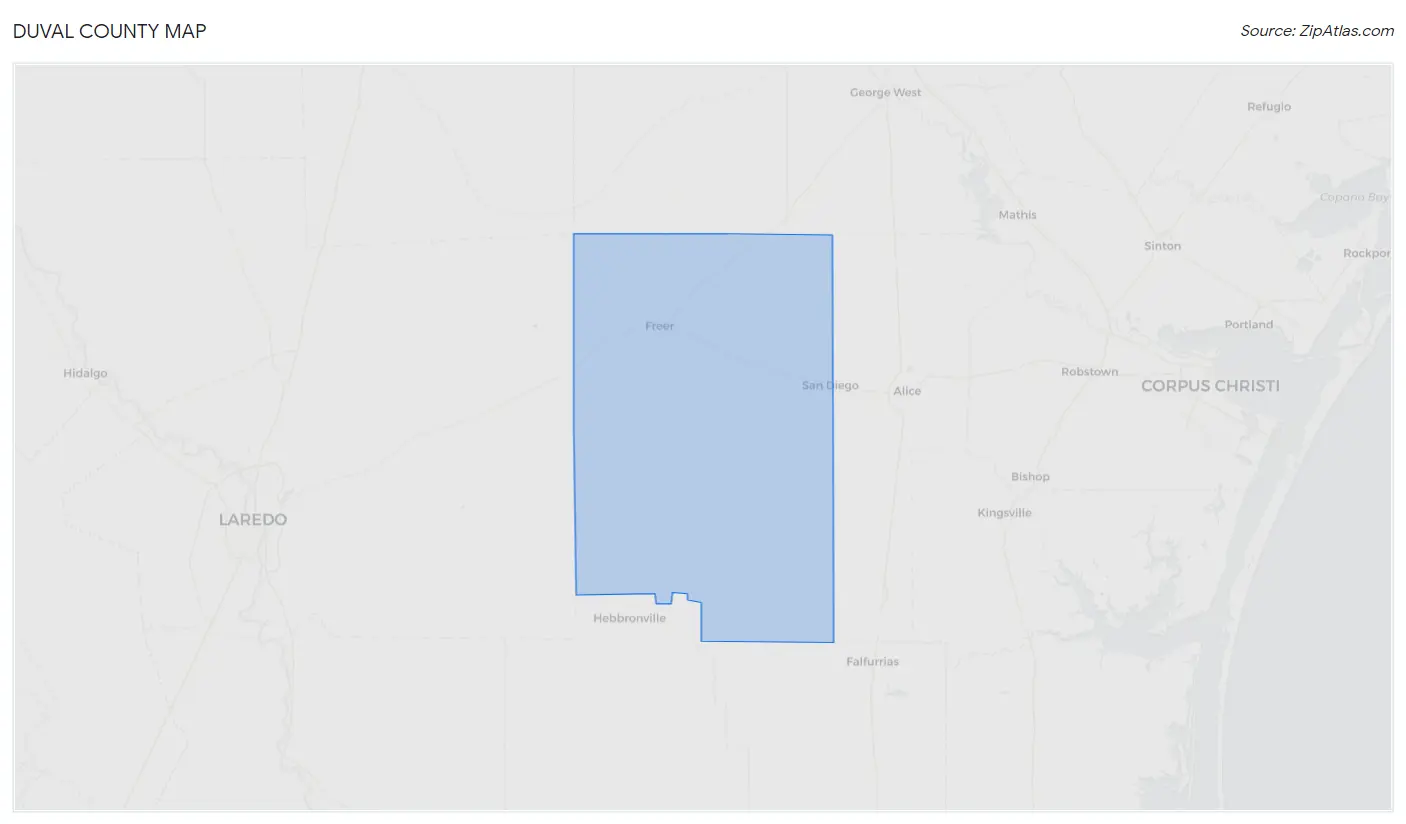
Duval County Map
Duval County Overview
$21,606
PER CAPITA INCOME
$64,274
AVG FAMILY INCOME
$50,697
AVG HOUSEHOLD INCOME
39.0%
WAGE / INCOME GAP [ % ]
61.0¢/ $1
WAGE / INCOME GAP [ $ ]
0.42
INEQUALITY / GINI INDEX
9,960
TOTAL POPULATION
5,097
MALE POPULATION
4,863
FEMALE POPULATION
104.81
MALES / 100 FEMALES
95.41
FEMALES / 100 MALES
35.5
MEDIAN AGE
4.4
AVG FAMILY SIZE
3.2
AVG HOUSEHOLD SIZE
3,976
LABOR FORCE [ PEOPLE ]
51.6%
PERCENT IN LABOR FORCE
8.4%
UNEMPLOYMENT RATE
Duval County Area Codes
Income in Duval County
Income Overview in Duval County
Per Capita Income in Duval County is $21,606, while median incomes of families and households are $64,274 and $50,697 respectively.
| Characteristic | Number | Measure |
| Per Capita Income | 9,960 | $21,606 |
| Median Family Income | 1,744 | $64,274 |
| Mean Family Income | 1,744 | $75,218 |
| Median Household Income | 2,892 | $50,697 |
| Mean Household Income | 2,892 | $61,341 |
| Income Deficit | 1,744 | $0 |
| Wage / Income Gap (%) | 9,960 | 39.04% |
| Wage / Income Gap ($) | 9,960 | 60.96¢ per $1 |
| Gini / Inequality Index | 9,960 | 0.42 |
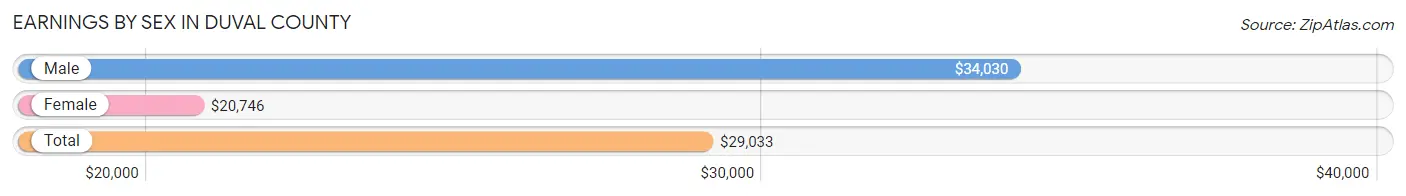
Earnings by Sex in Duval County
Average Earnings in Duval County are $29,033, $34,030 for men and $20,746 for women, a difference of 39.0%.
| Sex | Number | Average Earnings |
| Male | 2,716 (62.3%) | $34,030 |
| Female | 1,647 (37.8%) | $20,746 |
| Total | 4,363 (100.0%) | $29,033 |
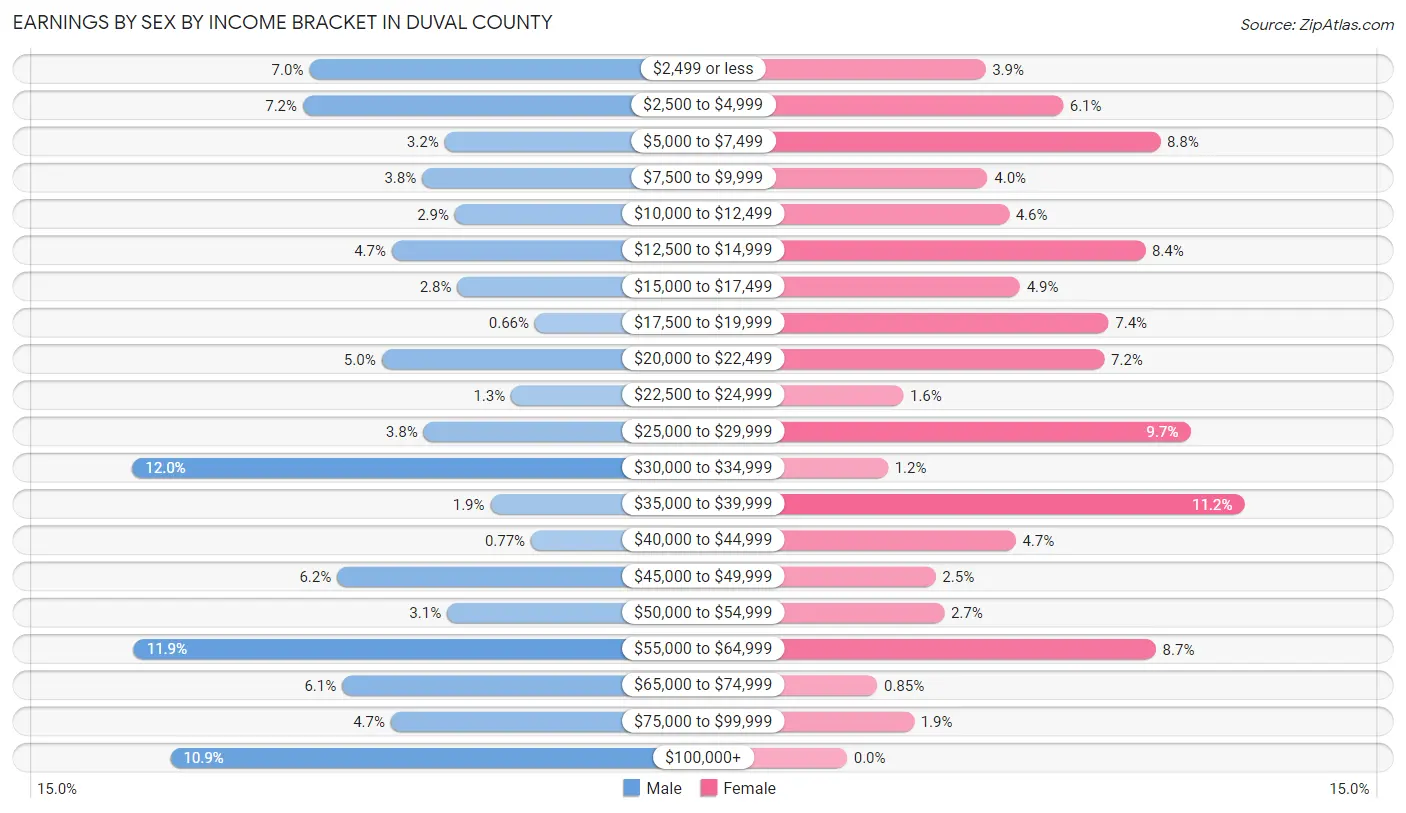
Earnings by Sex by Income Bracket in Duval County
The most common earnings brackets in Duval County are $30,000 to $34,999 for men (325 | 12.0%) and $35,000 to $39,999 for women (184 | 11.2%).
| Income | Male | Female |
| $2,499 or less | 190 (7.0%) | 64 (3.9%) |
| $2,500 to $4,999 | 195 (7.2%) | 100 (6.1%) |
| $5,000 to $7,499 | 87 (3.2%) | 145 (8.8%) |
| $7,500 to $9,999 | 104 (3.8%) | 65 (4.0%) |
| $10,000 to $12,499 | 79 (2.9%) | 75 (4.5%) |
| $12,500 to $14,999 | 127 (4.7%) | 138 (8.4%) |
| $15,000 to $17,499 | 77 (2.8%) | 80 (4.9%) |
| $17,500 to $19,999 | 18 (0.7%) | 121 (7.3%) |
| $20,000 to $22,499 | 135 (5.0%) | 119 (7.2%) |
| $22,500 to $24,999 | 36 (1.3%) | 26 (1.6%) |
| $25,000 to $29,999 | 103 (3.8%) | 159 (9.7%) |
| $30,000 to $34,999 | 325 (12.0%) | 19 (1.1%) |
| $35,000 to $39,999 | 52 (1.9%) | 184 (11.2%) |
| $40,000 to $44,999 | 21 (0.8%) | 78 (4.7%) |
| $45,000 to $49,999 | 169 (6.2%) | 41 (2.5%) |
| $50,000 to $54,999 | 85 (3.1%) | 45 (2.7%) |
| $55,000 to $64,999 | 324 (11.9%) | 143 (8.7%) |
| $65,000 to $74,999 | 165 (6.1%) | 14 (0.9%) |
| $75,000 to $99,999 | 128 (4.7%) | 31 (1.9%) |
| $100,000+ | 296 (10.9%) | 0 (0.0%) |
| Total | 2,716 (100.0%) | 1,647 (100.0%) |
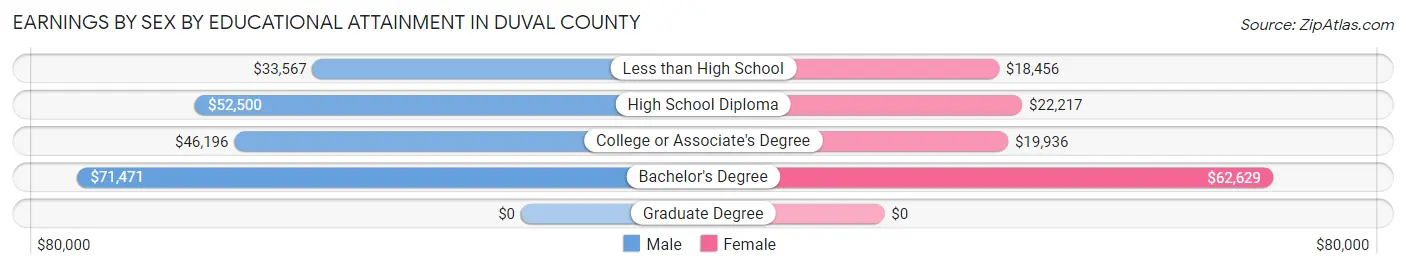
Earnings by Sex by Educational Attainment in Duval County
Average earnings in Duval County are $45,225 for men and $21,146 for women, a difference of 53.2%. Men with an educational attainment of bachelor's degree enjoy the highest average annual earnings of $71,471, while those with less than high school education earn the least with $33,567. Women with an educational attainment of bachelor's degree earn the most with the average annual earnings of $62,629, while those with less than high school education have the smallest earnings of $18,456.
| Educational Attainment | Male Income | Female Income |
| Less than High School | $33,567 | $18,456 |
| High School Diploma | $52,500 | $22,217 |
| College or Associate's Degree | $46,196 | $19,936 |
| Bachelor's Degree | $71,471 | $62,629 |
| Graduate Degree | - | - |
| Total | $45,225 | $21,146 |
Family Income in Duval County
Family Income Brackets in Duval County
According to the Duval County family income data, there are 445 families falling into the $50,000 to $74,999 income range, which is the most common income bracket and makes up 25.5% of all families. Conversely, the $10,000 to $14,999 income bracket is the least frequent group with only 17 families (1.0%) belonging to this category.
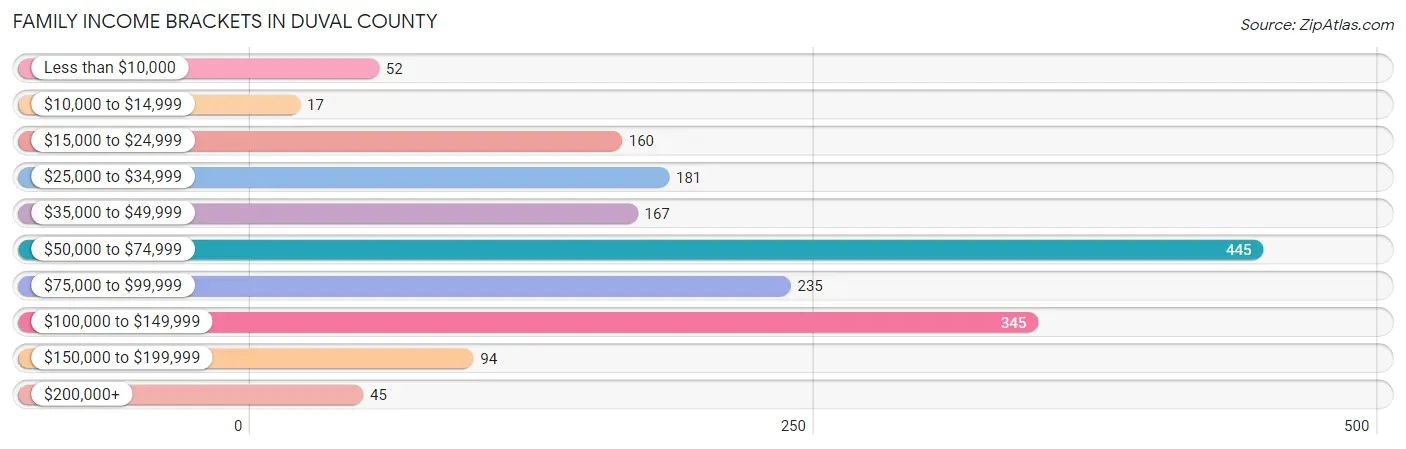
| Income Bracket | # Families | % Families |
| Less than $10,000 | 52 | 3.0% |
| $10,000 to $14,999 | 17 | 1.0% |
| $15,000 to $24,999 | 160 | 9.2% |
| $25,000 to $34,999 | 181 | 10.4% |
| $35,000 to $49,999 | 167 | 9.6% |
| $50,000 to $74,999 | 445 | 25.5% |
| $75,000 to $99,999 | 235 | 13.5% |
| $100,000 to $149,999 | 345 | 19.8% |
| $150,000 to $199,999 | 94 | 5.4% |
| $200,000+ | 45 | 2.6% |
Family Income by Famaliy Size in Duval County
4-person families (207 | 11.9%) account for the highest median family income in Duval County with $113,657 per family, while 2-person families (743 | 42.6%) have the highest median income of $30,755 per family member.
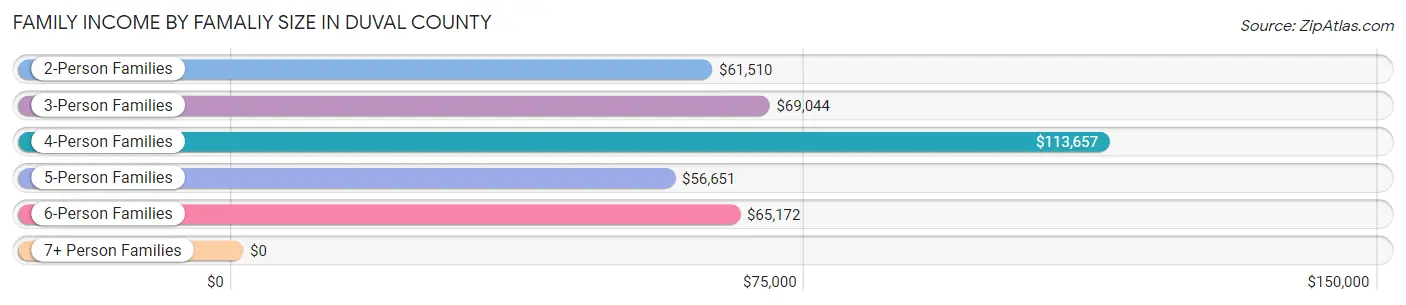
| Income Bracket | # Families | Median Income |
| 2-Person Families | 743 (42.6%) | $61,510 |
| 3-Person Families | 449 (25.8%) | $69,044 |
| 4-Person Families | 207 (11.9%) | $113,657 |
| 5-Person Families | 187 (10.7%) | $56,651 |
| 6-Person Families | 96 (5.5%) | $65,172 |
| 7+ Person Families | 62 (3.6%) | $0 |
| Total | 1,744 (100.0%) | $64,274 |
Family Income by Number of Earners in Duval County
The median family income in Duval County is $64,274, with families comprising 3+ earners (203) having the highest median family income of $107,279, while families with no earners (271) have the lowest median family income of $35,184, accounting for 11.6% and 15.5% of families, respectively.
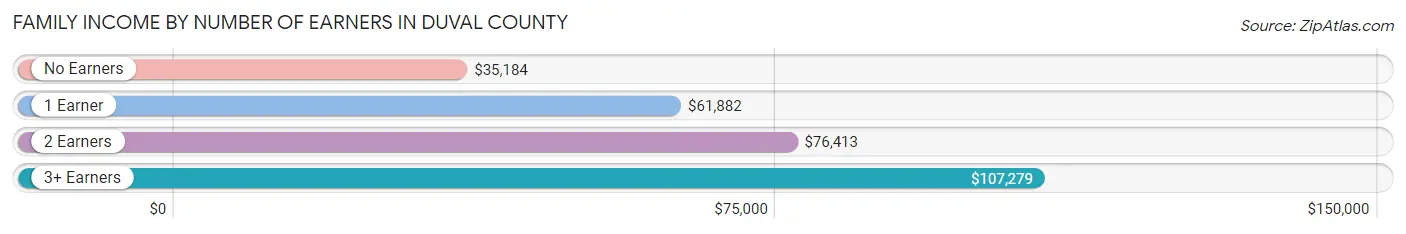
| Number of Earners | # Families | Median Income |
| No Earners | 271 (15.5%) | $35,184 |
| 1 Earner | 752 (43.1%) | $61,882 |
| 2 Earners | 518 (29.7%) | $76,413 |
| 3+ Earners | 203 (11.6%) | $107,279 |
| Total | 1,744 (100.0%) | $64,274 |
Household Income in Duval County
Household Income Brackets in Duval County
With 547 households falling in the category, the $50,000 to $74,999 income range is the most frequent in Duval County, accounting for 18.9% of all households. In contrast, only 81 households (2.8%) fall into the $200,000+ income bracket, making it the least populous group.
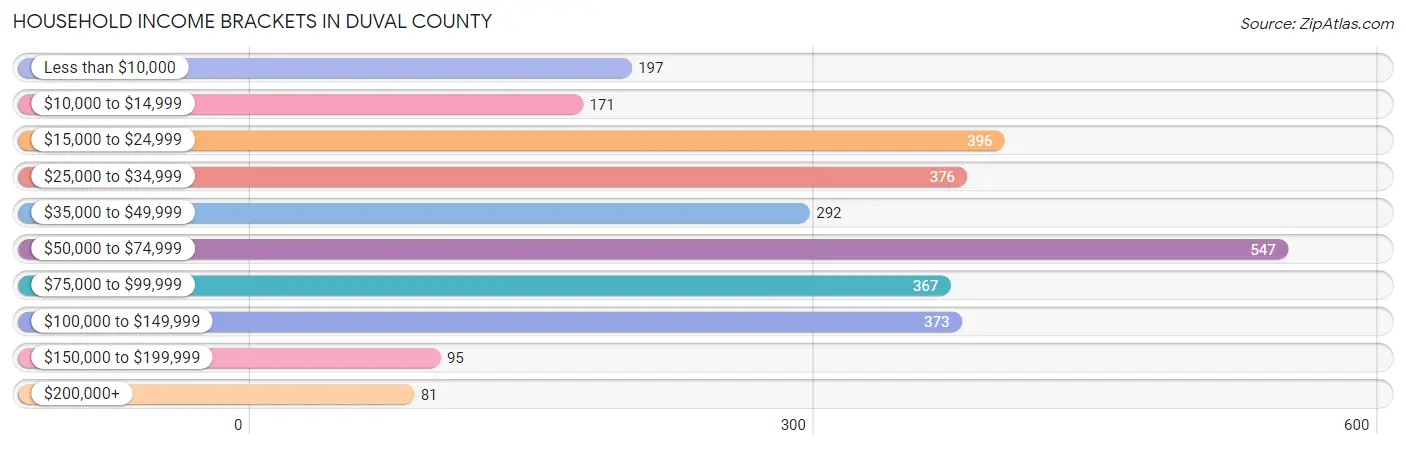
| Income Bracket | # Households | % Households |
| Less than $10,000 | 197 | 6.8% |
| $10,000 to $14,999 | 171 | 5.9% |
| $15,000 to $24,999 | 396 | 13.7% |
| $25,000 to $34,999 | 376 | 13.0% |
| $35,000 to $49,999 | 292 | 10.1% |
| $50,000 to $74,999 | 547 | 18.9% |
| $75,000 to $99,999 | 367 | 12.7% |
| $100,000 to $149,999 | 373 | 12.9% |
| $150,000 to $199,999 | 95 | 3.3% |
| $200,000+ | 81 | 2.8% |
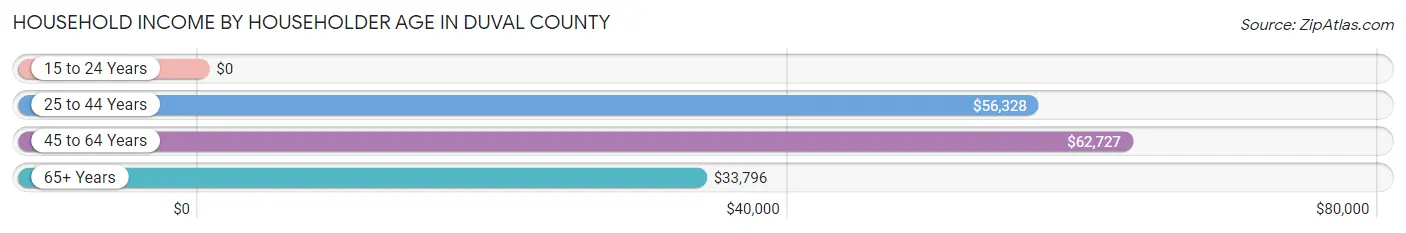
Household Income by Householder Age in Duval County
The median household income in Duval County is $50,697, with the highest median household income of $62,727 found in the 45 to 64 years age bracket for the primary householder. A total of 1,090 households (37.7%) fall into this category. Meanwhile, the 15 to 24 years age bracket for the primary householder has the lowest median household income of $0, with 43 households (1.5%) in this group.
| Income Bracket | # Households | Median Income |
| 15 to 24 Years | 43 (1.5%) | $0 |
| 25 to 44 Years | 823 (28.5%) | $56,328 |
| 45 to 64 Years | 1,090 (37.7%) | $62,727 |
| 65+ Years | 936 (32.4%) | $33,796 |
| Total | 2,892 (100.0%) | $50,697 |
Poverty in Duval County
Income Below Poverty by Sex and Age in Duval County
With 16.4% poverty level for males and 26.6% for females among the residents of Duval County, 5 year old males and 5 year old females are the most vulnerable to poverty, with 53 males (91.4%) and 68 females (100.0%) in their respective age groups living below the poverty level.
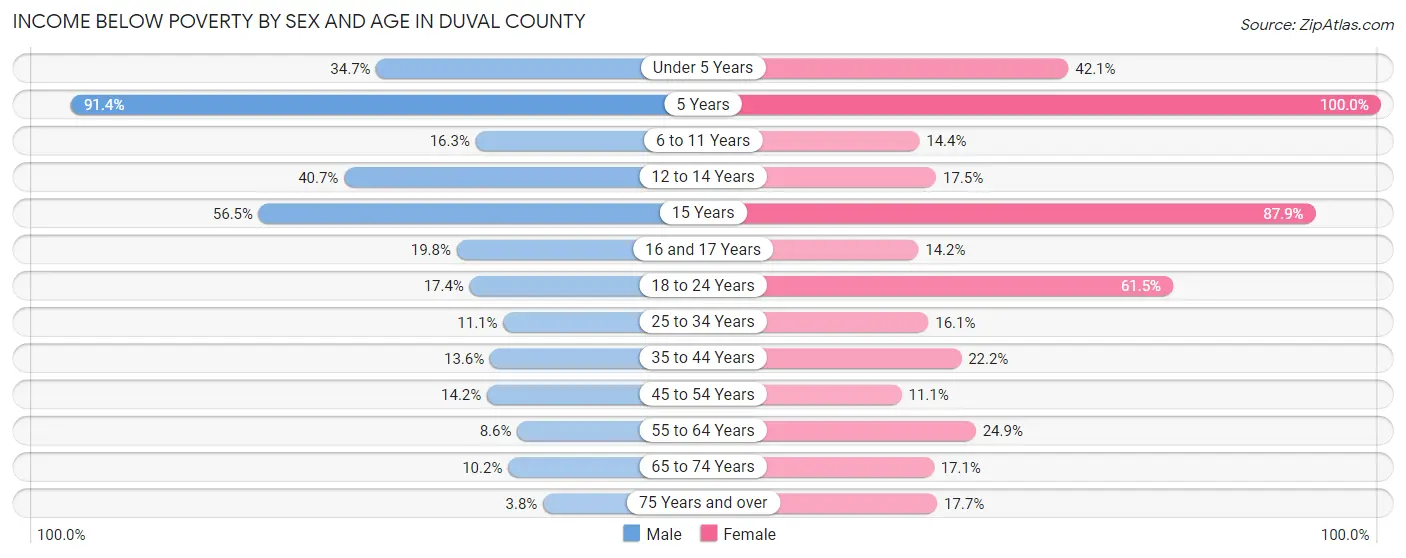
| Age Bracket | Male | Female |
| Under 5 Years | 110 (34.7%) | 148 (42.0%) |
| 5 Years | 53 (91.4%) | 68 (100.0%) |
| 6 to 11 Years | 74 (16.3%) | 61 (14.4%) |
| 12 to 14 Years | 72 (40.7%) | 35 (17.5%) |
| 15 Years | 26 (56.5%) | 80 (87.9%) |
| 16 and 17 Years | 18 (19.8%) | 25 (14.2%) |
| 18 to 24 Years | 93 (17.4%) | 311 (61.5%) |
| 25 to 34 Years | 76 (11.1%) | 80 (16.1%) |
| 35 to 44 Years | 71 (13.6%) | 121 (22.2%) |
| 45 to 54 Years | 60 (14.1%) | 61 (11.1%) |
| 55 to 64 Years | 49 (8.6%) | 131 (24.9%) |
| 65 to 74 Years | 40 (10.2%) | 72 (17.1%) |
| 75 Years and over | 12 (3.7%) | 70 (17.7%) |
| Total | 754 (16.4%) | 1,263 (26.6%) |
Income Above Poverty by Sex and Age in Duval County
According to the poverty statistics in Duval County, males aged 75 years and over and females aged 45 to 54 years are the age groups that are most secure financially, with 96.3% of males and 88.9% of females in these age groups living above the poverty line.
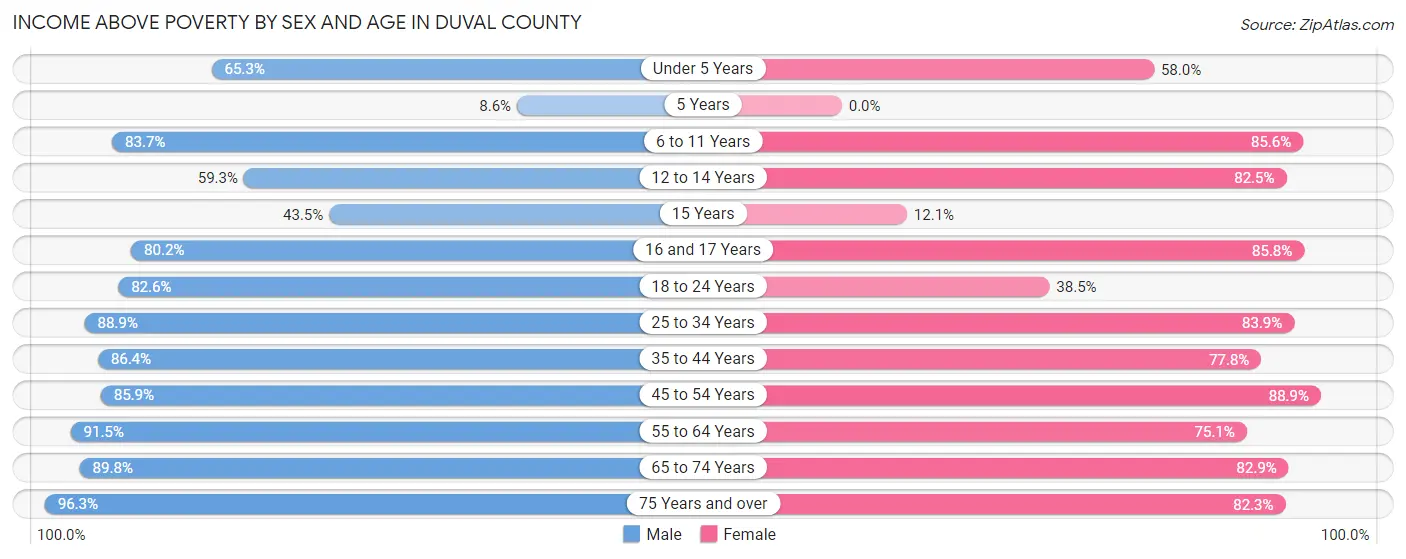
| Age Bracket | Male | Female |
| Under 5 Years | 207 (65.3%) | 204 (58.0%) |
| 5 Years | 5 (8.6%) | 0 (0.0%) |
| 6 to 11 Years | 381 (83.7%) | 363 (85.6%) |
| 12 to 14 Years | 105 (59.3%) | 165 (82.5%) |
| 15 Years | 20 (43.5%) | 11 (12.1%) |
| 16 and 17 Years | 73 (80.2%) | 151 (85.8%) |
| 18 to 24 Years | 442 (82.6%) | 195 (38.5%) |
| 25 to 34 Years | 606 (88.9%) | 418 (83.9%) |
| 35 to 44 Years | 451 (86.4%) | 425 (77.8%) |
| 45 to 54 Years | 364 (85.9%) | 489 (88.9%) |
| 55 to 64 Years | 524 (91.4%) | 396 (75.1%) |
| 65 to 74 Years | 351 (89.8%) | 350 (82.9%) |
| 75 Years and over | 308 (96.3%) | 326 (82.3%) |
| Total | 3,837 (83.6%) | 3,493 (73.4%) |
Income Below Poverty Among Married-Couple Families in Duval County
The poverty statistics for married-couple families in Duval County show that 8.0% or 99 of the total 1,235 families live below the poverty line. Families with 3 or 4 children have the highest poverty rate of 12.2%, comprising of 11 families. On the other hand, families with 5 or more children have the lowest poverty rate of 0.0%, which includes 0 families.
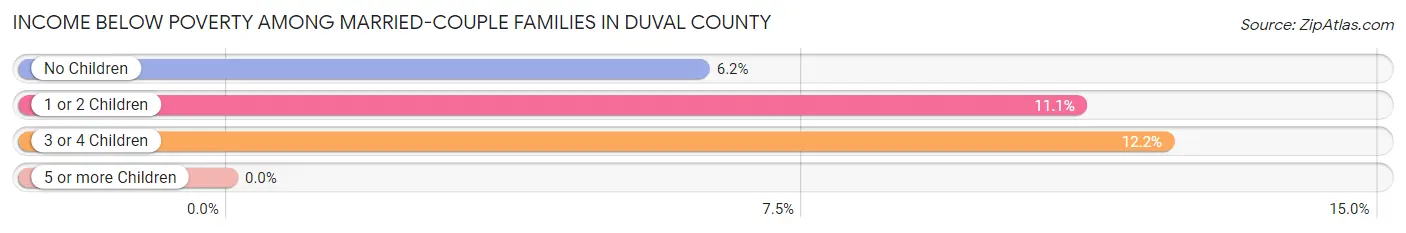
| Children | Above Poverty | Below Poverty |
| No Children | 731 (93.8%) | 48 (6.2%) |
| 1 or 2 Children | 321 (88.9%) | 40 (11.1%) |
| 3 or 4 Children | 79 (87.8%) | 11 (12.2%) |
| 5 or more Children | 5 (100.0%) | 0 (0.0%) |
| Total | 1,136 (92.0%) | 99 (8.0%) |
Income Below Poverty Among Single-Parent Households in Duval County
According to the poverty data in Duval County, 3.8% or 6 single-father households and 33.8% or 119 single-mother households are living below the poverty line. Among single-father households, those with 1 or 2 children have the highest poverty rate, with 6 households (7.1%) experiencing poverty. Likewise, among single-mother households, those with 3 or 4 children have the highest poverty rate, with 52 households (100.0%) falling below the poverty line.
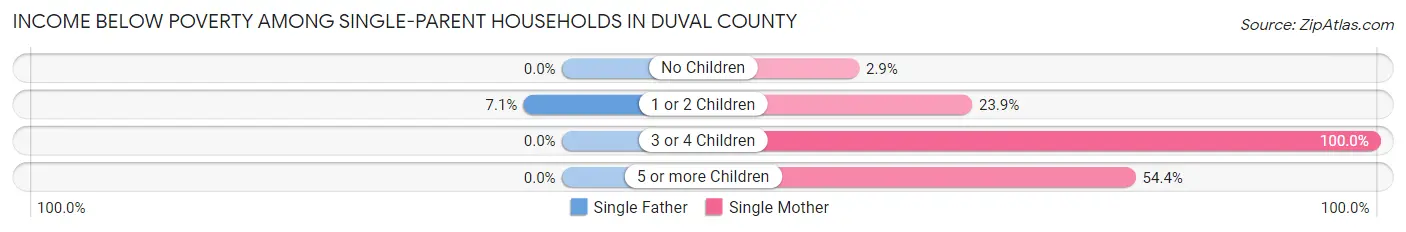
| Children | Single Father | Single Mother |
| No Children | 0 (0.0%) | 3 (2.9%) |
| 1 or 2 Children | 6 (7.1%) | 33 (23.9%) |
| 3 or 4 Children | 0 (0.0%) | 52 (100.0%) |
| 5 or more Children | 0 (0.0%) | 31 (54.4%) |
| Total | 6 (3.8%) | 119 (33.8%) |
Income Below Poverty Among Married-Couple vs Single-Parent Households in Duval County
The poverty data for Duval County shows that 99 of the married-couple family households (8.0%) and 125 of the single-parent households (24.6%) are living below the poverty level. Within the married-couple family households, those with 3 or 4 children have the highest poverty rate, with 11 households (12.2%) falling below the poverty line. Among the single-parent households, those with 3 or 4 children have the highest poverty rate, with 52 household (100.0%) living below poverty.
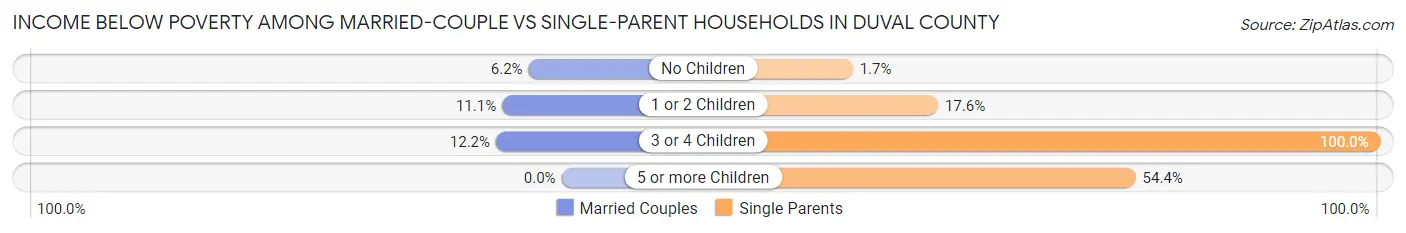
| Children | Married-Couple Families | Single-Parent Households |
| No Children | 48 (6.2%) | 3 (1.7%) |
| 1 or 2 Children | 40 (11.1%) | 39 (17.6%) |
| 3 or 4 Children | 11 (12.2%) | 52 (100.0%) |
| 5 or more Children | 0 (0.0%) | 31 (54.4%) |
| Total | 99 (8.0%) | 125 (24.6%) |
Race in Duval County
The most populous races in Duval County are Hispanic or Latino (8,834 | 88.7%), White / Caucasian (7,444 | 74.7%), and Two or more Races (2,302 | 23.1%).
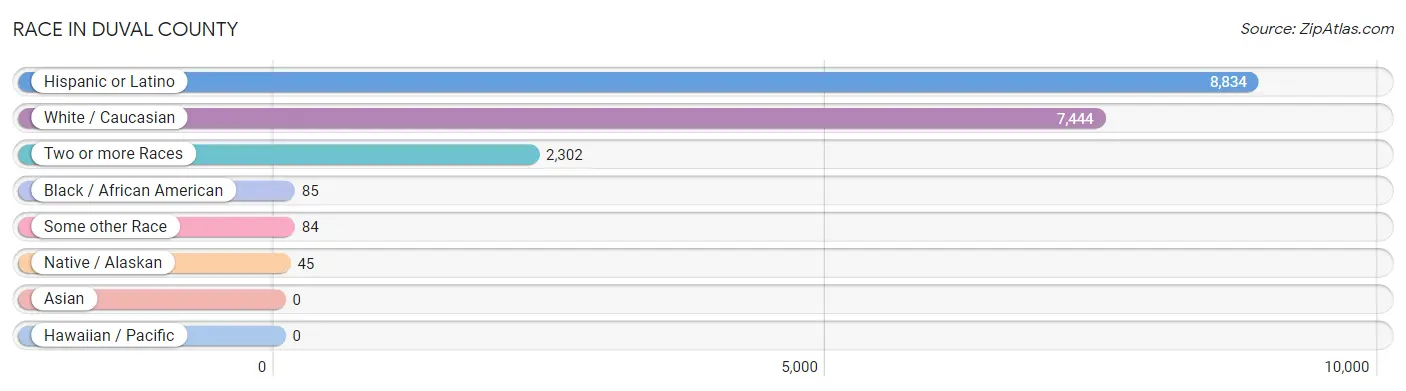
| Race | # Population | % Population |
| Asian | 0 | 0.0% |
| Black / African American | 85 | 0.9% |
| Hawaiian / Pacific | 0 | 0.0% |
| Hispanic or Latino | 8,834 | 88.7% |
| Native / Alaskan | 45 | 0.4% |
| White / Caucasian | 7,444 | 74.7% |
| Two or more Races | 2,302 | 23.1% |
| Some other Race | 84 | 0.8% |
| Total | 9,960 | 100.0% |
Ancestry in Duval County
The most populous ancestries reported in Duval County are Mexican (8,234 | 82.7%), American (318 | 3.2%), German (200 | 2.0%), Irish (123 | 1.2%), and English (119 | 1.2%), together accounting for 90.3% of all Duval County residents.
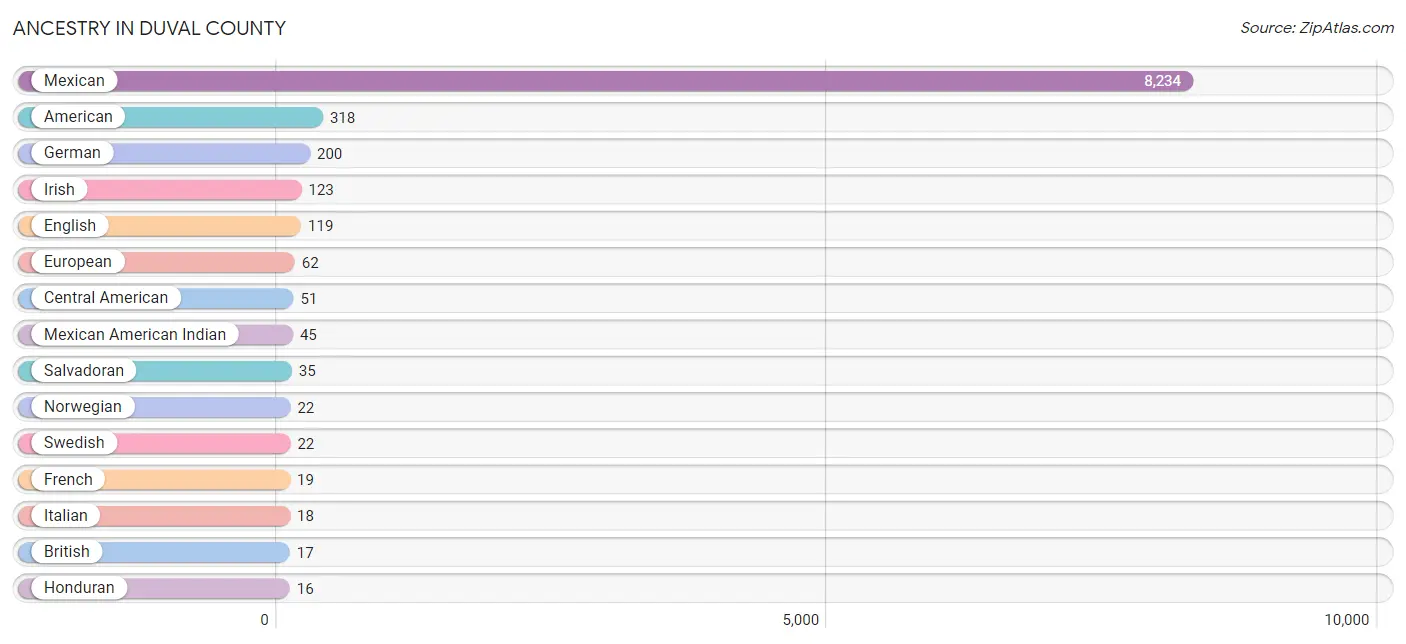
| Ancestry | # Population | % Population |
| American | 318 | 3.2% |
| British | 17 | 0.2% |
| Central American | 51 | 0.5% |
| English | 119 | 1.2% |
| European | 62 | 0.6% |
| French | 19 | 0.2% |
| German | 200 | 2.0% |
| Honduran | 16 | 0.2% |
| Irish | 123 | 1.2% |
| Italian | 18 | 0.2% |
| Mexican | 8,234 | 82.7% |
| Mexican American Indian | 45 | 0.4% |
| Norwegian | 22 | 0.2% |
| Puerto Rican | 8 | 0.1% |
| Salvadoran | 35 | 0.4% |
| Spaniard | 12 | 0.1% |
| Spanish | 9 | 0.1% |
| Swedish | 22 | 0.2% | View All 18 Rows |
Immigrants in Duval County
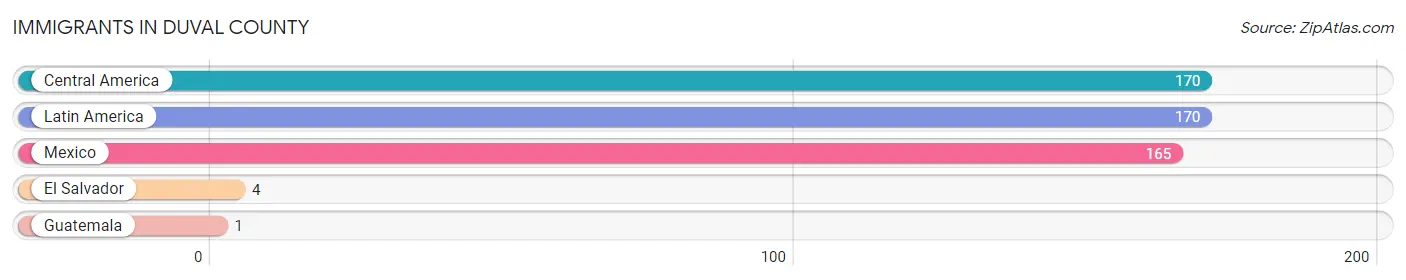
The most numerous immigrant groups reported in Duval County came from Central America (170 | 1.7%), Latin America (170 | 1.7%), Mexico (165 | 1.7%), El Salvador (4 | 0.0%), and Guatemala (1 | 0.0%), together accounting for 5.1% of all Duval County residents.
| Immigration Origin | # Population | % Population |
| Central America | 170 | 1.7% |
| El Salvador | 4 | 0.0% |
| Guatemala | 1 | 0.0% |
| Latin America | 170 | 1.7% |
| Mexico | 165 | 1.7% | View All 5 Rows |
Sex and Age in Duval County
Sex and Age in Duval County
The most populous age groups in Duval County are 55 to 59 Years (428 | 8.4%) for men and 15 to 19 Years (601 | 12.4%) for women.
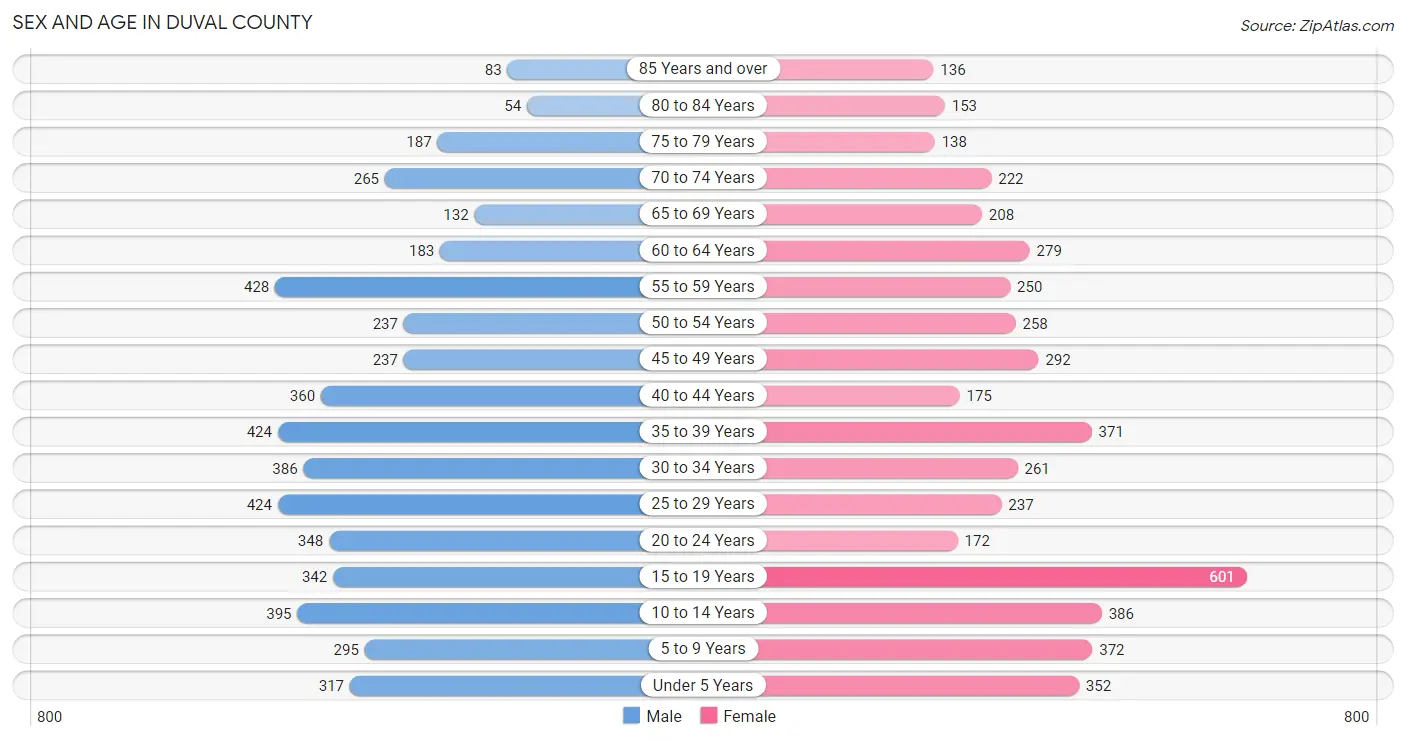
| Age Bracket | Male | Female |
| Under 5 Years | 317 (6.2%) | 352 (7.2%) |
| 5 to 9 Years | 295 (5.8%) | 372 (7.6%) |
| 10 to 14 Years | 395 (7.7%) | 386 (7.9%) |
| 15 to 19 Years | 342 (6.7%) | 601 (12.4%) |
| 20 to 24 Years | 348 (6.8%) | 172 (3.5%) |
| 25 to 29 Years | 424 (8.3%) | 237 (4.9%) |
| 30 to 34 Years | 386 (7.6%) | 261 (5.4%) |
| 35 to 39 Years | 424 (8.3%) | 371 (7.6%) |
| 40 to 44 Years | 360 (7.1%) | 175 (3.6%) |
| 45 to 49 Years | 237 (4.6%) | 292 (6.0%) |
| 50 to 54 Years | 237 (4.6%) | 258 (5.3%) |
| 55 to 59 Years | 428 (8.4%) | 250 (5.1%) |
| 60 to 64 Years | 183 (3.6%) | 279 (5.7%) |
| 65 to 69 Years | 132 (2.6%) | 208 (4.3%) |
| 70 to 74 Years | 265 (5.2%) | 222 (4.6%) |
| 75 to 79 Years | 187 (3.7%) | 138 (2.8%) |
| 80 to 84 Years | 54 (1.1%) | 153 (3.2%) |
| 85 Years and over | 83 (1.6%) | 136 (2.8%) |
| Total | 5,097 (100.0%) | 4,863 (100.0%) |
Families and Households in Duval County
Median Family Size in Duval County
The median family size in Duval County is 4.38 persons per family, with single female/mother families (352 | 20.2%) accounting for the largest median family size of 6.56 persons per family. On the other hand, single male/father families (157 | 9.0%) represent the smallest median family size with 2.39 persons per family.
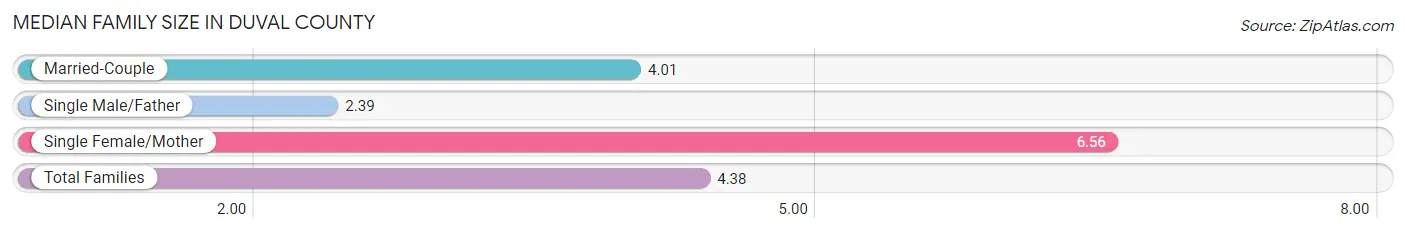
| Family Type | # Families | Family Size |
| Married-Couple | 1,235 (70.8%) | 4.01 |
| Single Male/Father | 157 (9.0%) | 2.39 |
| Single Female/Mother | 352 (20.2%) | 6.56 |
| Total Families | 1,744 (100.0%) | 4.38 |
Median Household Size in Duval County
The median household size in Duval County is 3.25 persons per household, with single female/mother households (352 | 12.2%) accounting for the largest median household size of 6.88 persons per household. non-family households (1,148 | 39.7%) represent the smallest median household size with 1.33 persons per household.
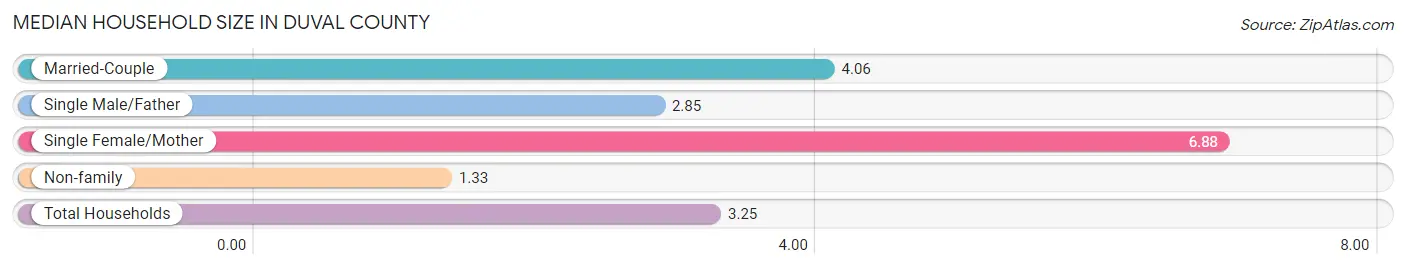
| Household Type | # Households | Household Size |
| Married-Couple | 1,235 (42.7%) | 4.06 |
| Single Male/Father | 157 (5.4%) | 2.85 |
| Single Female/Mother | 352 (12.2%) | 6.88 |
| Non-family | 1,148 (39.7%) | 1.33 |
| Total Households | 2,892 (100.0%) | 3.25 |
Household Size by Marriage Status in Duval County
Out of a total of 2,892 households in Duval County, 1,744 (60.3%) are family households, while 1,148 (39.7%) are nonfamily households. The most numerous type of family households are 3-person households, comprising 624, and the most common type of nonfamily households are 1-person households, comprising 1,010.
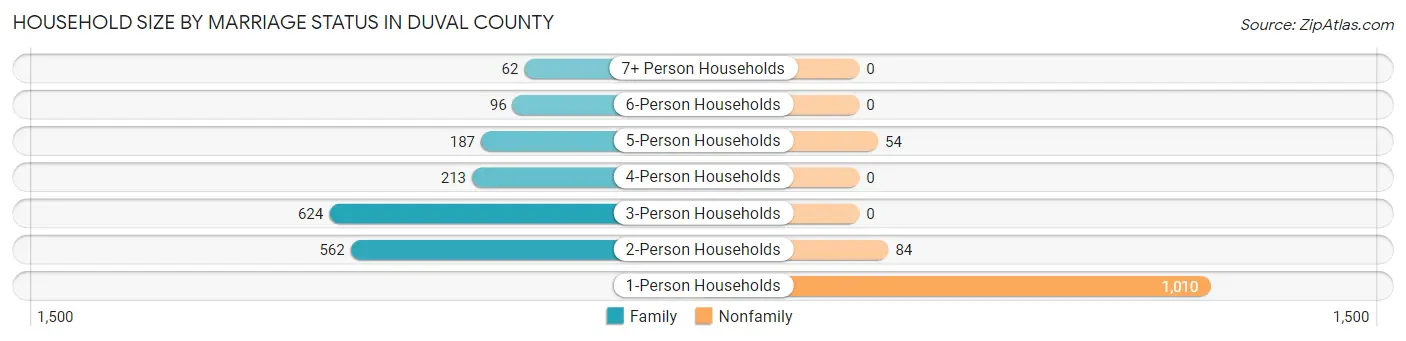
| Household Size | Family Households | Nonfamily Households |
| 1-Person Households | - | 1,010 (34.9%) |
| 2-Person Households | 562 (19.4%) | 84 (2.9%) |
| 3-Person Households | 624 (21.6%) | 0 (0.0%) |
| 4-Person Households | 213 (7.4%) | 0 (0.0%) |
| 5-Person Households | 187 (6.5%) | 54 (1.9%) |
| 6-Person Households | 96 (3.3%) | 0 (0.0%) |
| 7+ Person Households | 62 (2.1%) | 0 (0.0%) |
| Total | 1,744 (60.3%) | 1,148 (39.7%) |
Female Fertility in Duval County
Fertility by Age in Duval County
Average fertility rate in Duval County is 43.0 births per 1,000 women. Women in the age bracket of 20 to 34 years have the highest fertility rate with 137.0 births per 1,000 women. Women in the age bracket of 20 to 34 years acount for 98.9% of all women with births.
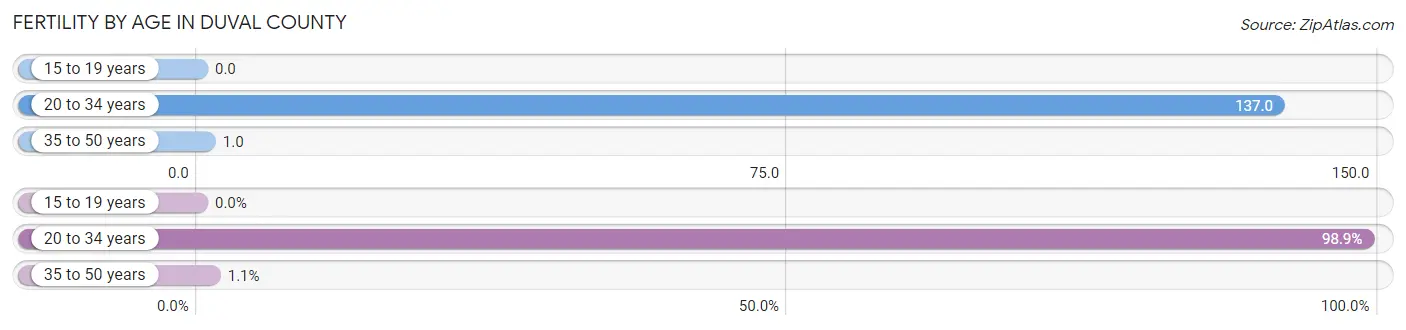
| Age Bracket | Women with Births | Births / 1,000 Women |
| 15 to 19 years | 0 (0.0%) | 0.0 |
| 20 to 34 years | 92 (98.9%) | 137.0 |
| 35 to 50 years | 1 (1.1%) | 1.0 |
| Total | 93 (100.0%) | 43.0 |
Fertility by Age by Marriage Status in Duval County
6.5% of women with births (93) in Duval County are married. The highest percentage of unmarried women with births falls into 20 to 34 years age bracket with 94.6% of them unmarried at the time of birth, while the lowest percentage of unmarried women with births belong to 35 to 50 years age bracket with 0.0% of them unmarried.
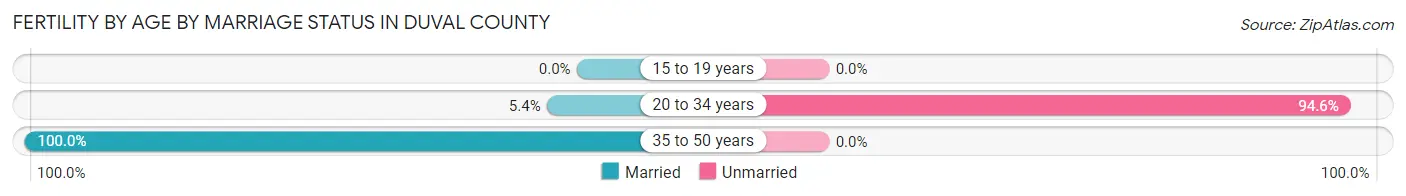
| Age Bracket | Married | Unmarried |
| 15 to 19 years | 0 (0.0%) | 0 (0.0%) |
| 20 to 34 years | 5 (5.4%) | 87 (94.6%) |
| 35 to 50 years | 1 (100.0%) | 0 (0.0%) |
| Total | 6 (6.5%) | 87 (93.5%) |
Fertility by Education in Duval County
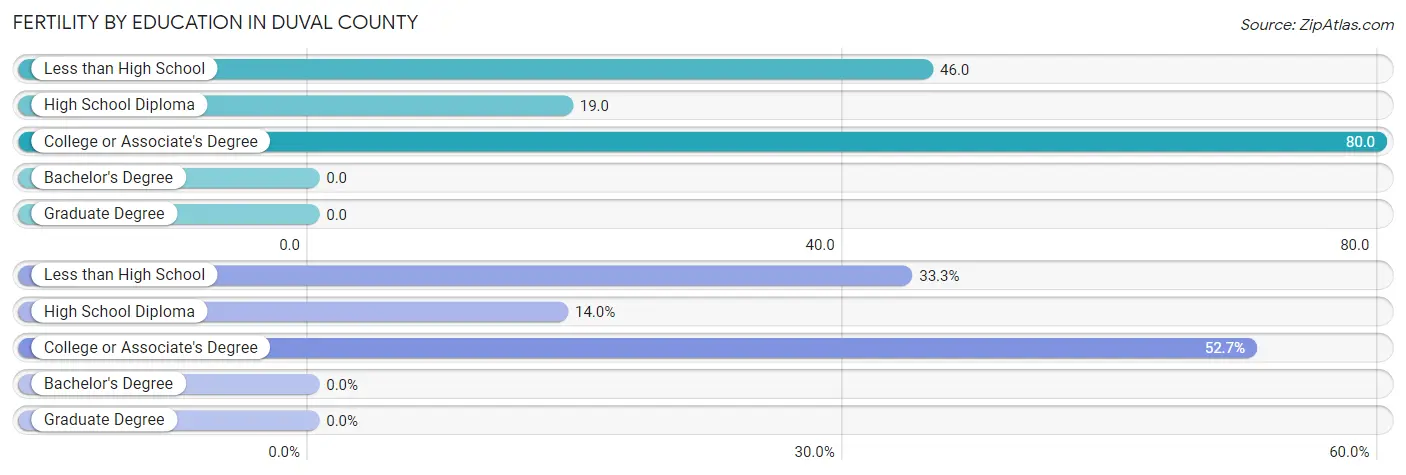
| Educational Attainment | Women with Births | Births / 1,000 Women |
| Less than High School | 31 (33.3%) | 46.0 |
| High School Diploma | 13 (14.0%) | 19.0 |
| College or Associate's Degree | 49 (52.7%) | 80.0 |
| Bachelor's Degree | 0 (0.0%) | 0.0 |
| Graduate Degree | 0 (0.0%) | 0.0 |
| Total | 93 (100.0%) | 43.0 |
Fertility by Education by Marriage Status in Duval County
93.5% of women with births in Duval County are unmarried. Women with the educational attainment of college or associate's degree are most likely to be married with 10.2% of them married at childbirth, while women with the educational attainment of less than high school are least likely to be married with 100.0% of them unmarried at childbirth.
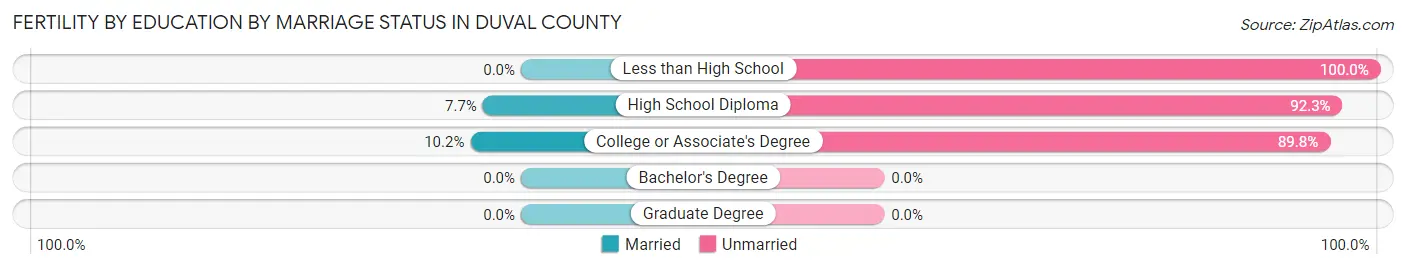
| Educational Attainment | Married | Unmarried |
| Less than High School | 0 (0.0%) | 31 (100.0%) |
| High School Diploma | 1 (7.7%) | 12 (92.3%) |
| College or Associate's Degree | 5 (10.2%) | 44 (89.8%) |
| Bachelor's Degree | 0 (0.0%) | 0 (0.0%) |
| Graduate Degree | 0 (0.0%) | 0 (0.0%) |
| Total | 6 (6.5%) | 87 (93.5%) |
Employment Characteristics in Duval County
Employment by Class of Employer in Duval County
Among the 3,590 employed individuals in Duval County, private company employees (2,669 | 74.4%), state government employees (360 | 10.0%), and not-for-profit organizations (176 | 4.9%) make up the most common classes of employment.
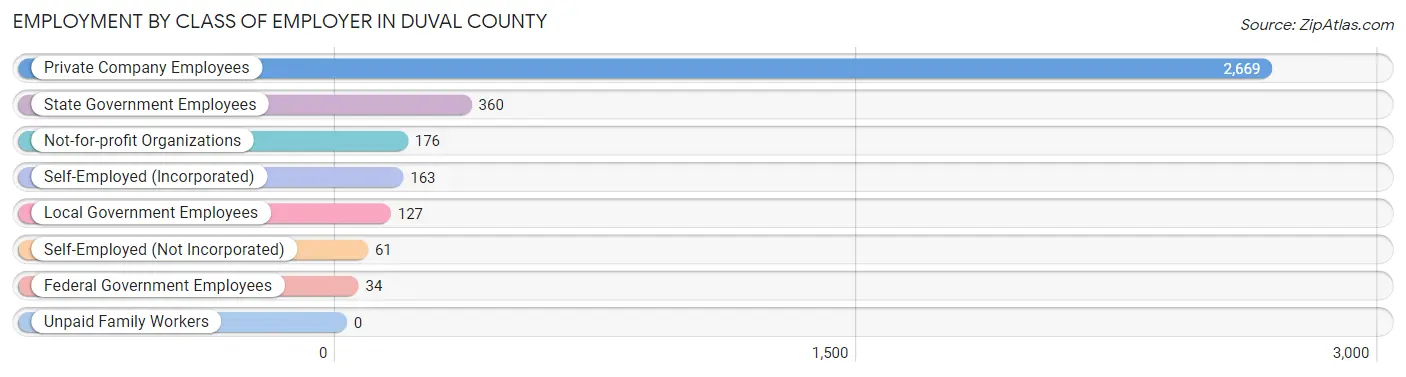
| Employer Class | # Employees | % Employees |
| Private Company Employees | 2,669 | 74.4% |
| Self-Employed (Incorporated) | 163 | 4.5% |
| Self-Employed (Not Incorporated) | 61 | 1.7% |
| Not-for-profit Organizations | 176 | 4.9% |
| Local Government Employees | 127 | 3.5% |
| State Government Employees | 360 | 10.0% |
| Federal Government Employees | 34 | 0.9% |
| Unpaid Family Workers | 0 | 0.0% |
| Total | 3,590 | 100.0% |
Employment Status by Age in Duval County
According to the labor force statistics for Duval County, out of the total population over 16 years of age (7,706), 51.6% or 3,976 individuals are in the labor force, with 8.4% or 334 of them unemployed. The age group with the highest labor force participation rate is 25 to 29 years, with 74.3% or 491 individuals in the labor force. Within the labor force, the 16 to 19 years age range has the highest percentage of unemployed individuals, with 34.7% or 92 of them being unemployed.
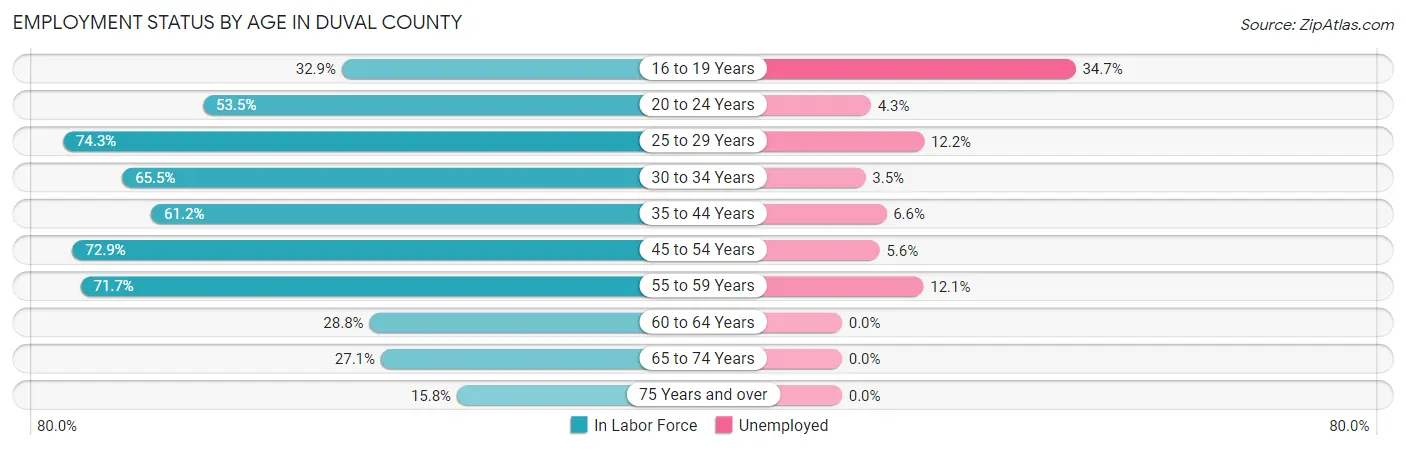
| Age Bracket | In Labor Force | Unemployed |
| 16 to 19 Years | 265 (32.9%) | 92 (34.7%) |
| 20 to 24 Years | 278 (53.5%) | 12 (4.3%) |
| 25 to 29 Years | 491 (74.3%) | 60 (12.2%) |
| 30 to 34 Years | 424 (65.5%) | 15 (3.5%) |
| 35 to 44 Years | 814 (61.2%) | 54 (6.6%) |
| 45 to 54 Years | 746 (72.9%) | 42 (5.6%) |
| 55 to 59 Years | 486 (71.7%) | 59 (12.1%) |
| 60 to 64 Years | 133 (28.8%) | 0 (0.0%) |
| 65 to 74 Years | 224 (27.1%) | 0 (0.0%) |
| 75 Years and over | 119 (15.8%) | 0 (0.0%) |
| Total | 3,976 (51.6%) | 334 (8.4%) |
Employment Status by Educational Attainment in Duval County
According to labor force statistics for Duval County, 64.4% of individuals (3,092) out of the total population between 25 and 64 years of age (4,802) are in the labor force, with 7.4% or 229 of them being unemployed. The group with the highest labor force participation rate are those with the educational attainment of bachelor's degree or higher, with 89.2% or 306 individuals in the labor force. Within the labor force, individuals with bachelor's degree or higher education have the highest percentage of unemployment, with 18.3% or 56 of them being unemployed.
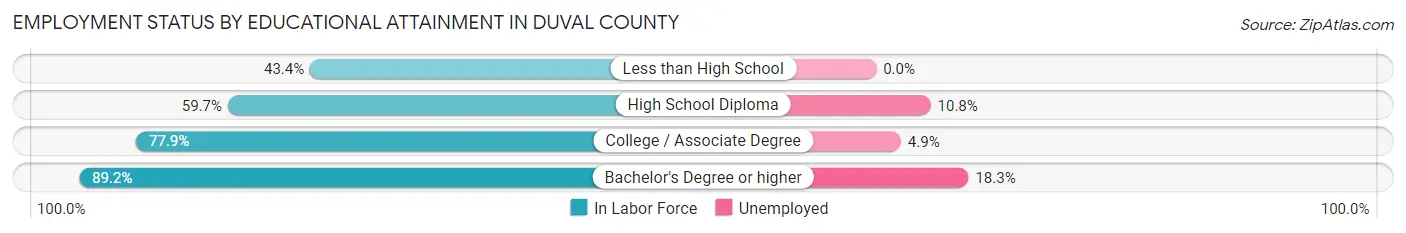
| Educational Attainment | In Labor Force | Unemployed |
| Less than High School | 469 (43.4%) | 0 (0.0%) |
| High School Diploma | 1,024 (59.7%) | 185 (10.8%) |
| College / Associate Degree | 1,295 (77.9%) | 81 (4.9%) |
| Bachelor's Degree or higher | 306 (89.2%) | 63 (18.3%) |
| Total | 3,092 (64.4%) | 355 (7.4%) |
Employment Occupations by Sex in Duval County
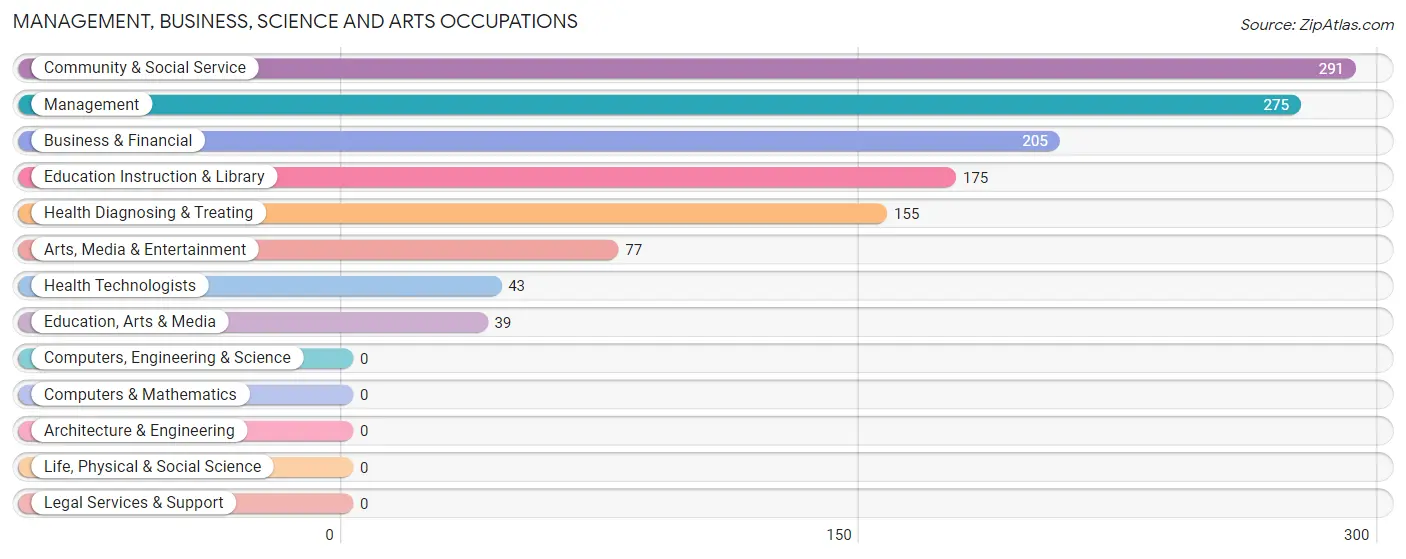
Management, Business, Science and Arts Occupations
The most common Management, Business, Science and Arts occupations in Duval County are Community & Social Service (291 | 8.0%), Management (275 | 7.5%), Business & Financial (205 | 5.6%), Education Instruction & Library (175 | 4.8%), and Health Diagnosing & Treating (155 | 4.3%).
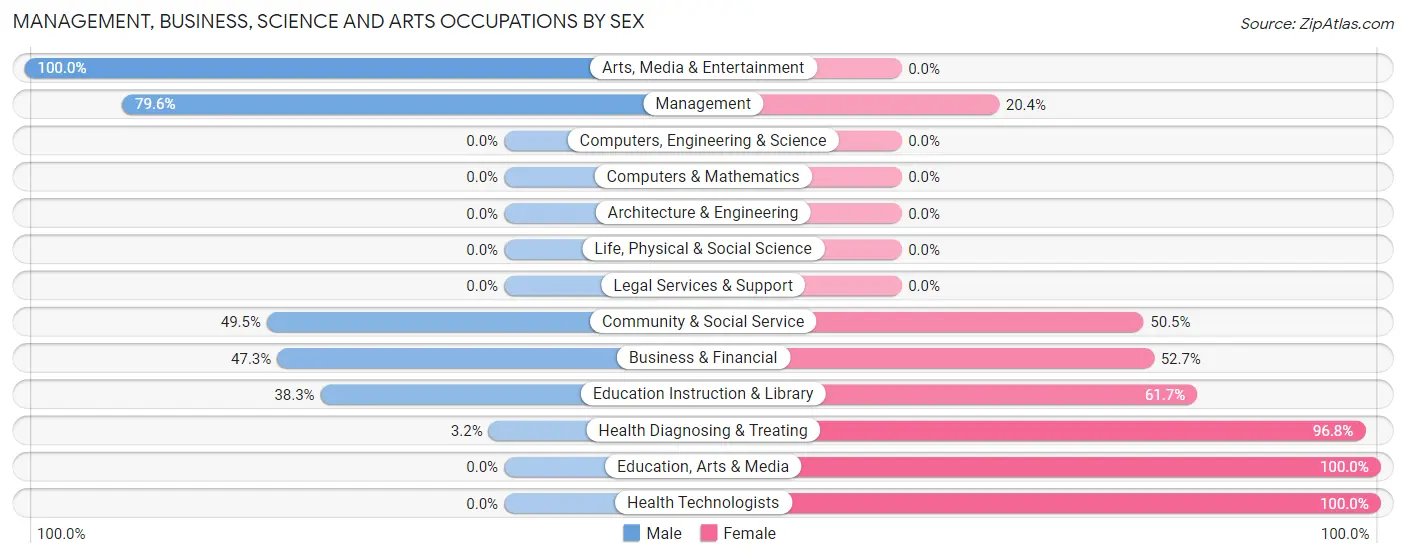
Management, Business, Science and Arts Occupations by Sex
Within the Management, Business, Science and Arts occupations in Duval County, the most male-oriented occupations are Arts, Media & Entertainment (100.0%), Management (79.6%), and Community & Social Service (49.5%), while the most female-oriented occupations are Education, Arts & Media (100.0%), Health Technologists (100.0%), and Health Diagnosing & Treating (96.8%).
| Occupation | Male | Female |
| Management | 219 (79.6%) | 56 (20.4%) |
| Business & Financial | 97 (47.3%) | 108 (52.7%) |
| Computers, Engineering & Science | 0 (0.0%) | 0 (0.0%) |
| Computers & Mathematics | 0 (0.0%) | 0 (0.0%) |
| Architecture & Engineering | 0 (0.0%) | 0 (0.0%) |
| Life, Physical & Social Science | 0 (0.0%) | 0 (0.0%) |
| Community & Social Service | 144 (49.5%) | 147 (50.5%) |
| Education, Arts & Media | 0 (0.0%) | 39 (100.0%) |
| Legal Services & Support | 0 (0.0%) | 0 (0.0%) |
| Education Instruction & Library | 67 (38.3%) | 108 (61.7%) |
| Arts, Media & Entertainment | 77 (100.0%) | 0 (0.0%) |
| Health Diagnosing & Treating | 5 (3.2%) | 150 (96.8%) |
| Health Technologists | 0 (0.0%) | 43 (100.0%) |
| Total (Category) | 465 (50.2%) | 461 (49.8%) |
| Total (Overall) | 2,246 (61.6%) | 1,400 (38.4%) |
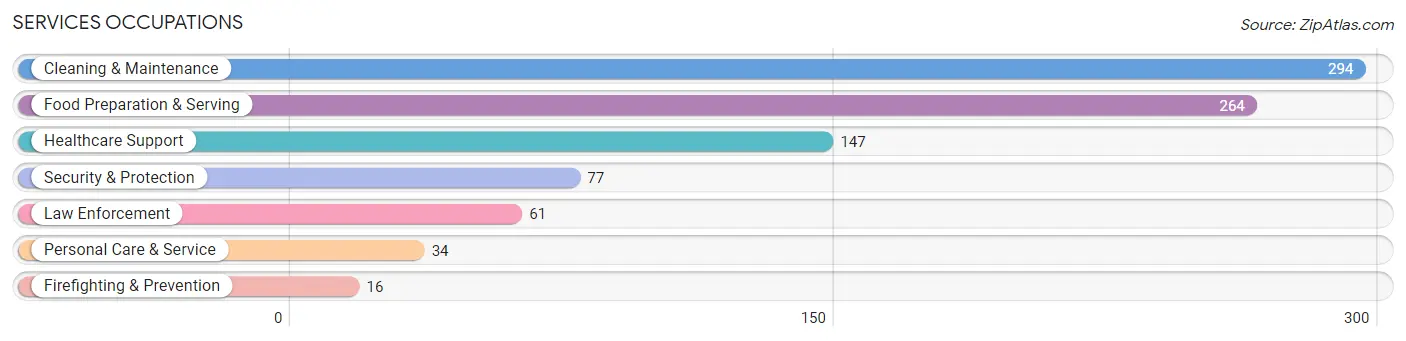
Services Occupations
The most common Services occupations in Duval County are Cleaning & Maintenance (294 | 8.1%), Food Preparation & Serving (264 | 7.2%), Healthcare Support (147 | 4.0%), Security & Protection (77 | 2.1%), and Law Enforcement (61 | 1.7%).
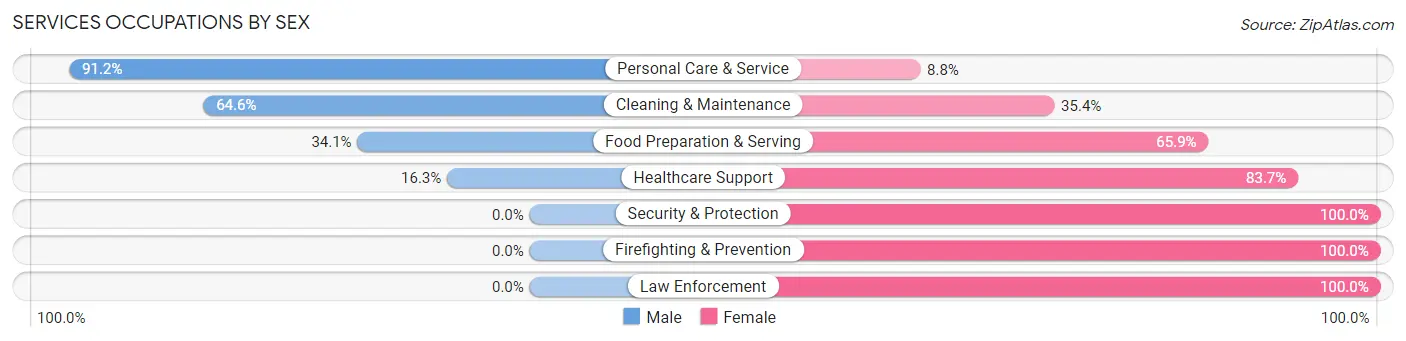
Services Occupations by Sex
Within the Services occupations in Duval County, the most male-oriented occupations are Personal Care & Service (91.2%), Cleaning & Maintenance (64.6%), and Food Preparation & Serving (34.1%), while the most female-oriented occupations are Security & Protection (100.0%), Firefighting & Prevention (100.0%), and Law Enforcement (100.0%).
| Occupation | Male | Female |
| Healthcare Support | 24 (16.3%) | 123 (83.7%) |
| Security & Protection | 0 (0.0%) | 77 (100.0%) |
| Firefighting & Prevention | 0 (0.0%) | 16 (100.0%) |
| Law Enforcement | 0 (0.0%) | 61 (100.0%) |
| Food Preparation & Serving | 90 (34.1%) | 174 (65.9%) |
| Cleaning & Maintenance | 190 (64.6%) | 104 (35.4%) |
| Personal Care & Service | 31 (91.2%) | 3 (8.8%) |
| Total (Category) | 335 (41.0%) | 481 (59.0%) |
| Total (Overall) | 2,246 (61.6%) | 1,400 (38.4%) |
Sales and Office Occupations
The most common Sales and Office occupations in Duval County are Office & Administration (318 | 8.7%), and Sales & Related (285 | 7.8%).

Sales and Office Occupations by Sex
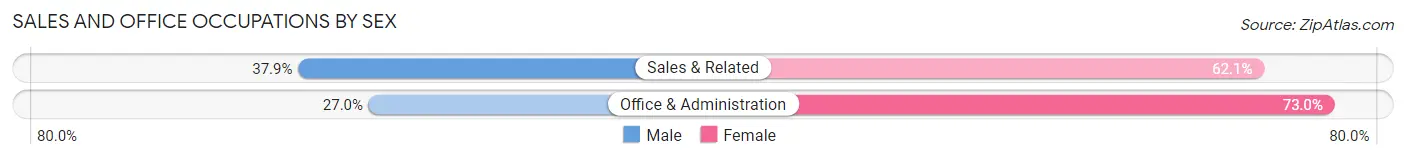
| Occupation | Male | Female |
| Sales & Related | 108 (37.9%) | 177 (62.1%) |
| Office & Administration | 86 (27.0%) | 232 (73.0%) |
| Total (Category) | 194 (32.2%) | 409 (67.8%) |
| Total (Overall) | 2,246 (61.6%) | 1,400 (38.4%) |
Natural Resources, Construction and Maintenance Occupations
The most common Natural Resources, Construction and Maintenance occupations in Duval County are Construction & Extraction (541 | 14.8%), Installation, Maintenance & Repair (290 | 8.0%), and Farming, Fishing & Forestry (64 | 1.8%).
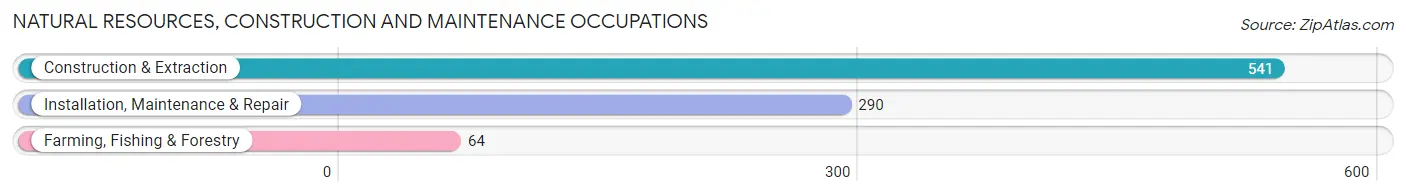
Natural Resources, Construction and Maintenance Occupations by Sex

| Occupation | Male | Female |
| Farming, Fishing & Forestry | 64 (100.0%) | 0 (0.0%) |
| Construction & Extraction | 541 (100.0%) | 0 (0.0%) |
| Installation, Maintenance & Repair | 253 (87.2%) | 37 (12.8%) |
| Total (Category) | 858 (95.9%) | 37 (4.1%) |
| Total (Overall) | 2,246 (61.6%) | 1,400 (38.4%) |
Production, Transportation and Moving Occupations
The most common Production, Transportation and Moving occupations in Duval County are Production (242 | 6.6%), Transportation (116 | 3.2%), and Material Moving (48 | 1.3%).
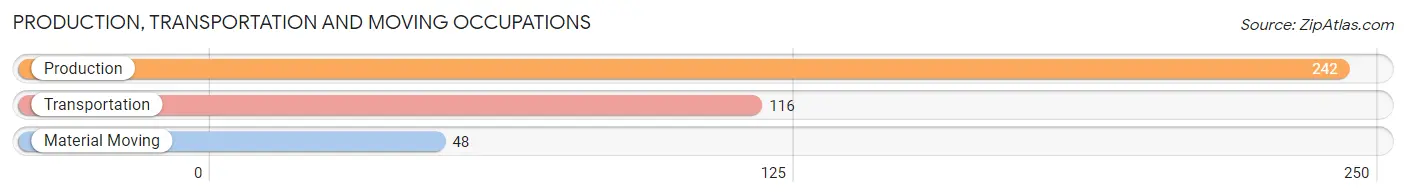
Production, Transportation and Moving Occupations by Sex
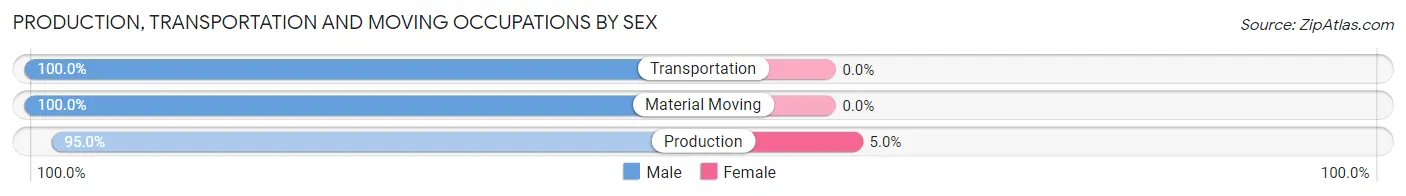
| Occupation | Male | Female |
| Production | 230 (95.0%) | 12 (5.0%) |
| Transportation | 116 (100.0%) | 0 (0.0%) |
| Material Moving | 48 (100.0%) | 0 (0.0%) |
| Total (Category) | 394 (97.0%) | 12 (3.0%) |
| Total (Overall) | 2,246 (61.6%) | 1,400 (38.4%) |
Employment Industries by Sex in Duval County
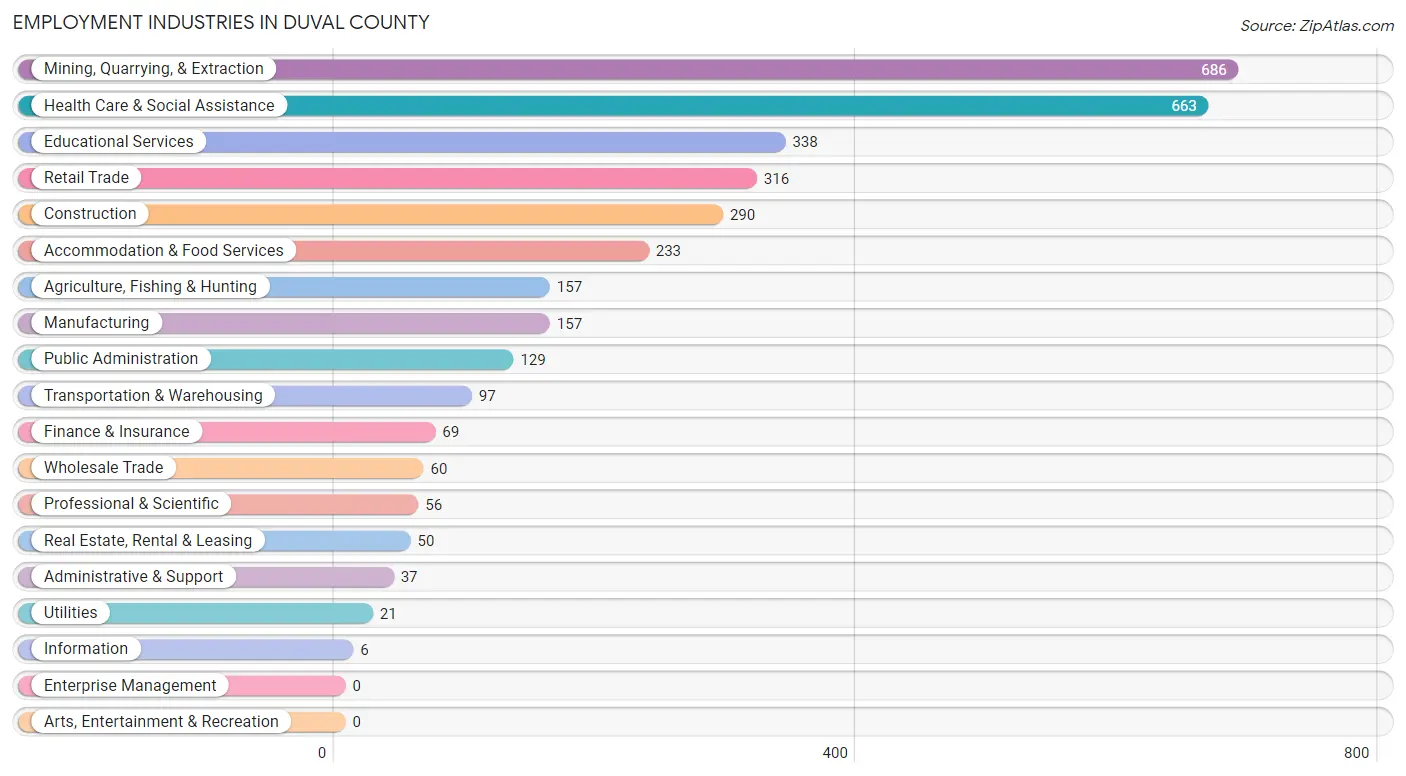
Employment Industries in Duval County
The major employment industries in Duval County include Mining, Quarrying, & Extraction (686 | 18.8%), Health Care & Social Assistance (663 | 18.2%), Educational Services (338 | 9.3%), Retail Trade (316 | 8.7%), and Construction (290 | 8.0%).
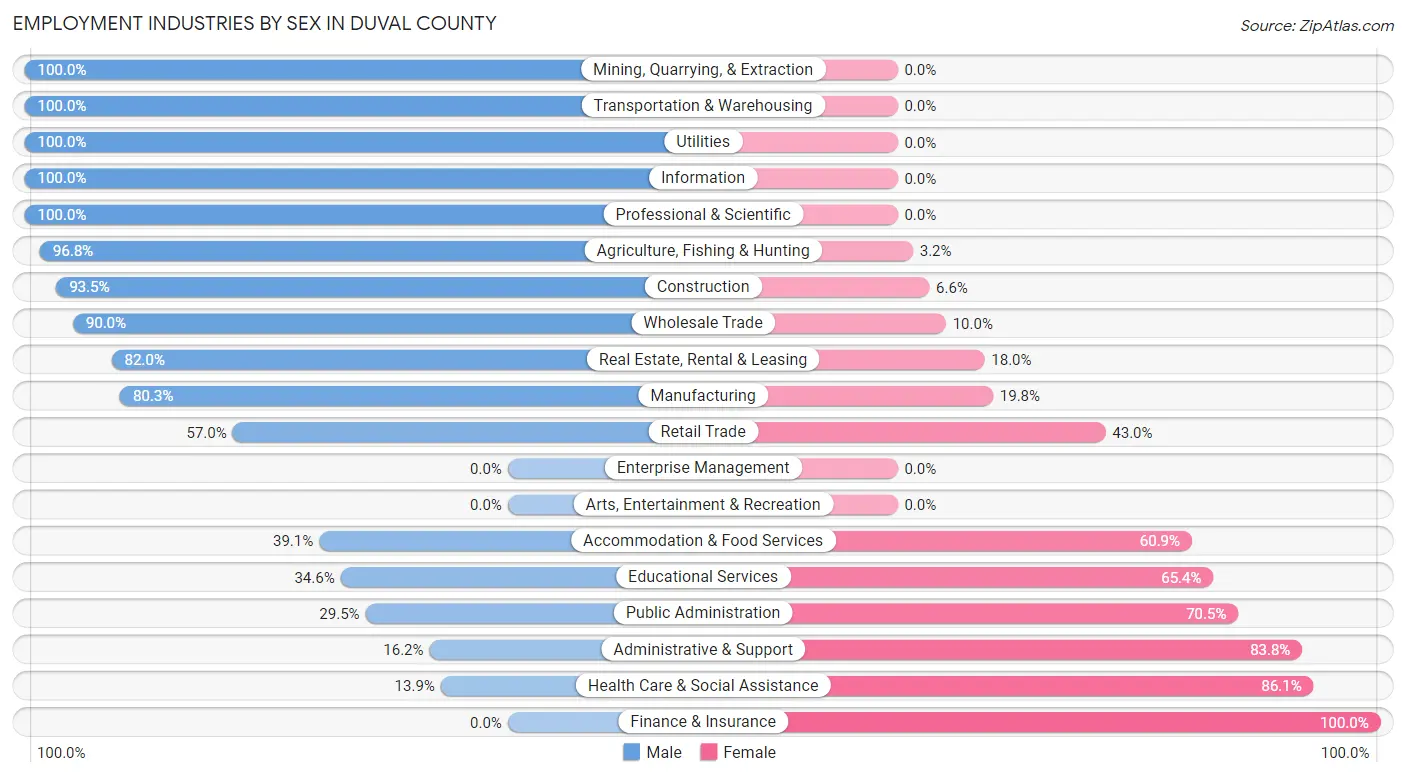
Employment Industries by Sex in Duval County
The Duval County industries that see more men than women are Mining, Quarrying, & Extraction (100.0%), Transportation & Warehousing (100.0%), and Utilities (100.0%), whereas the industries that tend to have a higher number of women are Finance & Insurance (100.0%), Health Care & Social Assistance (86.1%), and Administrative & Support (83.8%).
| Industry | Male | Female |
| Agriculture, Fishing & Hunting | 152 (96.8%) | 5 (3.2%) |
| Mining, Quarrying, & Extraction | 686 (100.0%) | 0 (0.0%) |
| Construction | 271 (93.4%) | 19 (6.6%) |
| Manufacturing | 126 (80.2%) | 31 (19.8%) |
| Wholesale Trade | 54 (90.0%) | 6 (10.0%) |
| Retail Trade | 180 (57.0%) | 136 (43.0%) |
| Transportation & Warehousing | 97 (100.0%) | 0 (0.0%) |
| Utilities | 21 (100.0%) | 0 (0.0%) |
| Information | 6 (100.0%) | 0 (0.0%) |
| Finance & Insurance | 0 (0.0%) | 69 (100.0%) |
| Real Estate, Rental & Leasing | 41 (82.0%) | 9 (18.0%) |
| Professional & Scientific | 56 (100.0%) | 0 (0.0%) |
| Enterprise Management | 0 (0.0%) | 0 (0.0%) |
| Administrative & Support | 6 (16.2%) | 31 (83.8%) |
| Educational Services | 117 (34.6%) | 221 (65.4%) |
| Health Care & Social Assistance | 92 (13.9%) | 571 (86.1%) |
| Arts, Entertainment & Recreation | 0 (0.0%) | 0 (0.0%) |
| Accommodation & Food Services | 91 (39.1%) | 142 (60.9%) |
| Public Administration | 38 (29.5%) | 91 (70.5%) |
| Total | 2,246 (61.6%) | 1,400 (38.4%) |
Education in Duval County
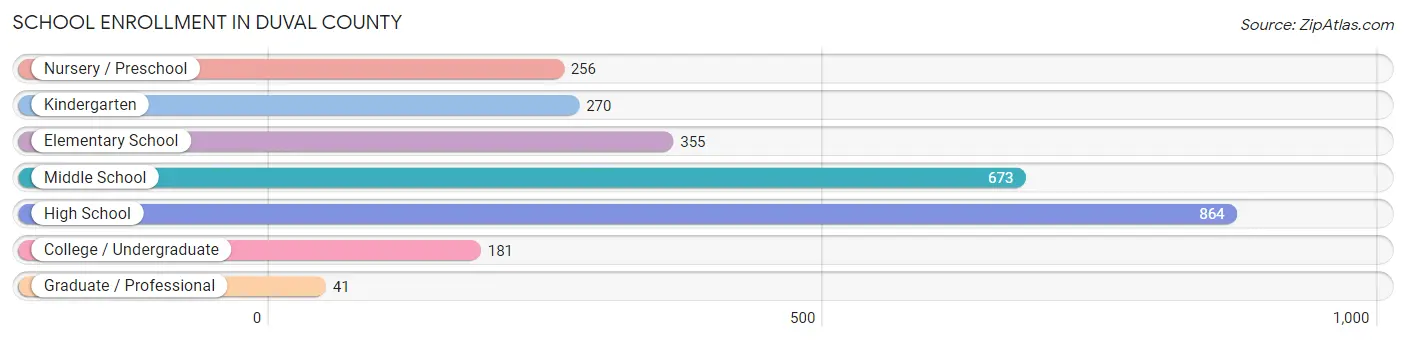
School Enrollment in Duval County
The most common levels of schooling among the 2,640 students in Duval County are high school (864 | 32.7%), middle school (673 | 25.5%), and elementary school (355 | 13.5%).
| School Level | # Students | % Students |
| Nursery / Preschool | 256 | 9.7% |
| Kindergarten | 270 | 10.2% |
| Elementary School | 355 | 13.5% |
| Middle School | 673 | 25.5% |
| High School | 864 | 32.7% |
| College / Undergraduate | 181 | 6.9% |
| Graduate / Professional | 41 | 1.5% |
| Total | 2,640 | 100.0% |
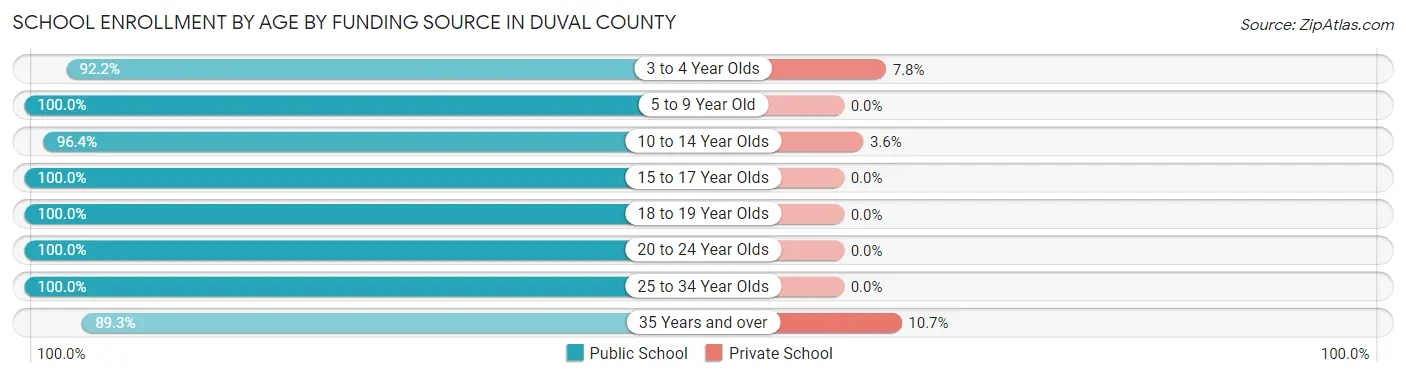
School Enrollment by Age by Funding Source in Duval County
Out of a total of 2,640 students who are enrolled in schools in Duval County, 61 (2.3%) attend a private institution, while the remaining 2,579 (97.7%) are enrolled in public schools. The age group of 35 years and over has the highest likelihood of being enrolled in private schools, with 13 (10.7% in the age bracket) enrolled. Conversely, the age group of 5 to 9 year old has the lowest likelihood of being enrolled in a private school, with 601 (100.0% in the age bracket) attending a public institution.
| Age Bracket | Public School | Private School |
| 3 to 4 Year Olds | 247 (92.2%) | 21 (7.8%) |
| 5 to 9 Year Old | 601 (100.0%) | 0 (0.0%) |
| 10 to 14 Year Olds | 753 (96.4%) | 28 (3.6%) |
| 15 to 17 Year Olds | 403 (100.0%) | 0 (0.0%) |
| 18 to 19 Year Olds | 318 (100.0%) | 0 (0.0%) |
| 20 to 24 Year Olds | 78 (100.0%) | 0 (0.0%) |
| 25 to 34 Year Olds | 70 (100.0%) | 0 (0.0%) |
| 35 Years and over | 108 (89.3%) | 13 (10.7%) |
| Total | 2,579 (97.7%) | 61 (2.3%) |
Educational Attainment by Field of Study in Duval County
Education (302 | 59.2%), bio, nature & agricultural (49 | 9.6%), arts & humanities (48 | 9.4%), physical & health sciences (35 | 6.9%), and computers & mathematics (20 | 3.9%) are the most common fields of study among 510 individuals in Duval County who have obtained a bachelor's degree or higher.
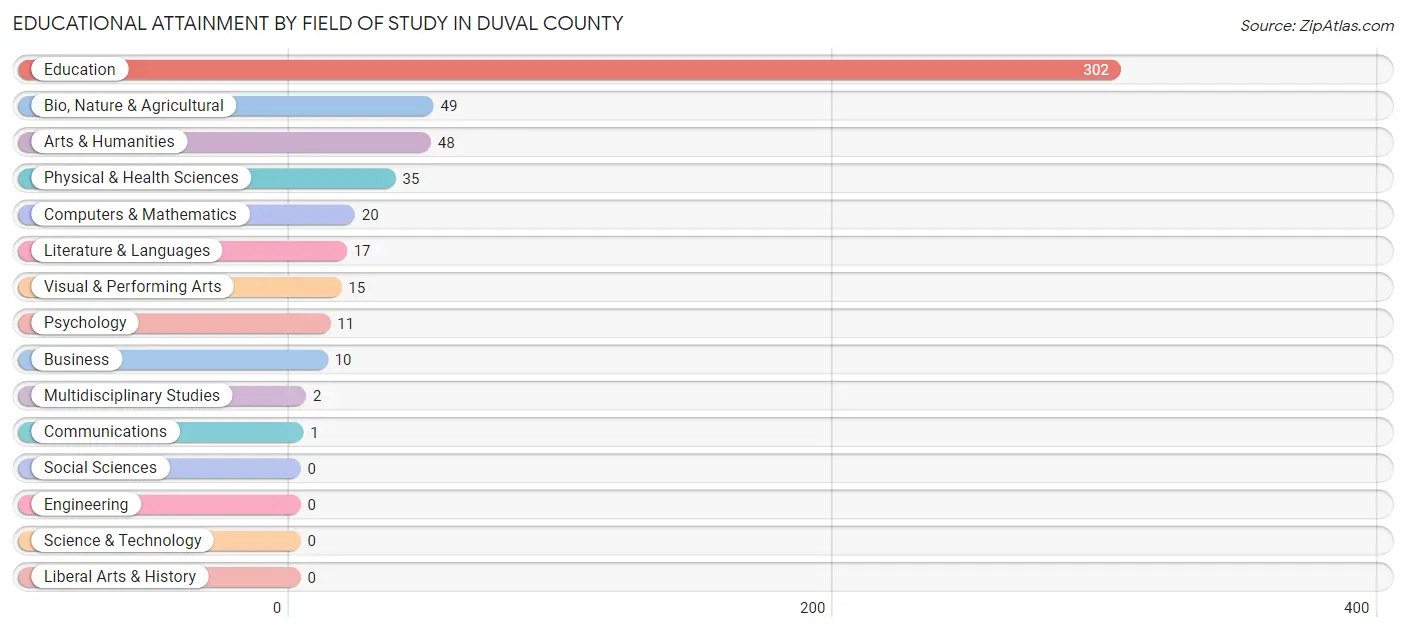
| Field of Study | # Graduates | % Graduates |
| Computers & Mathematics | 20 | 3.9% |
| Bio, Nature & Agricultural | 49 | 9.6% |
| Physical & Health Sciences | 35 | 6.9% |
| Psychology | 11 | 2.2% |
| Social Sciences | 0 | 0.0% |
| Engineering | 0 | 0.0% |
| Multidisciplinary Studies | 2 | 0.4% |
| Science & Technology | 0 | 0.0% |
| Business | 10 | 2.0% |
| Education | 302 | 59.2% |
| Literature & Languages | 17 | 3.3% |
| Liberal Arts & History | 0 | 0.0% |
| Visual & Performing Arts | 15 | 2.9% |
| Communications | 1 | 0.2% |
| Arts & Humanities | 48 | 9.4% |
| Total | 510 | 100.0% |
Transportation & Commute in Duval County
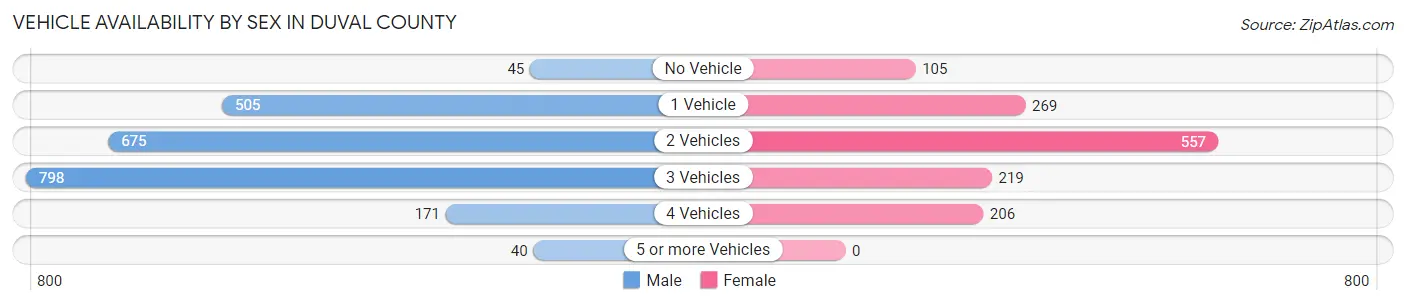
Vehicle Availability by Sex in Duval County
The most prevalent vehicle ownership categories in Duval County are males with 3 vehicles (798, accounting for 35.7%) and females with 3 vehicles (219, making up 58.9%).
| Vehicles Available | Male | Female |
| No Vehicle | 45 (2.0%) | 105 (7.7%) |
| 1 Vehicle | 505 (22.6%) | 269 (19.8%) |
| 2 Vehicles | 675 (30.2%) | 557 (41.1%) |
| 3 Vehicles | 798 (35.7%) | 219 (16.2%) |
| 4 Vehicles | 171 (7.6%) | 206 (15.2%) |
| 5 or more Vehicles | 40 (1.8%) | 0 (0.0%) |
| Total | 2,234 (100.0%) | 1,356 (100.0%) |
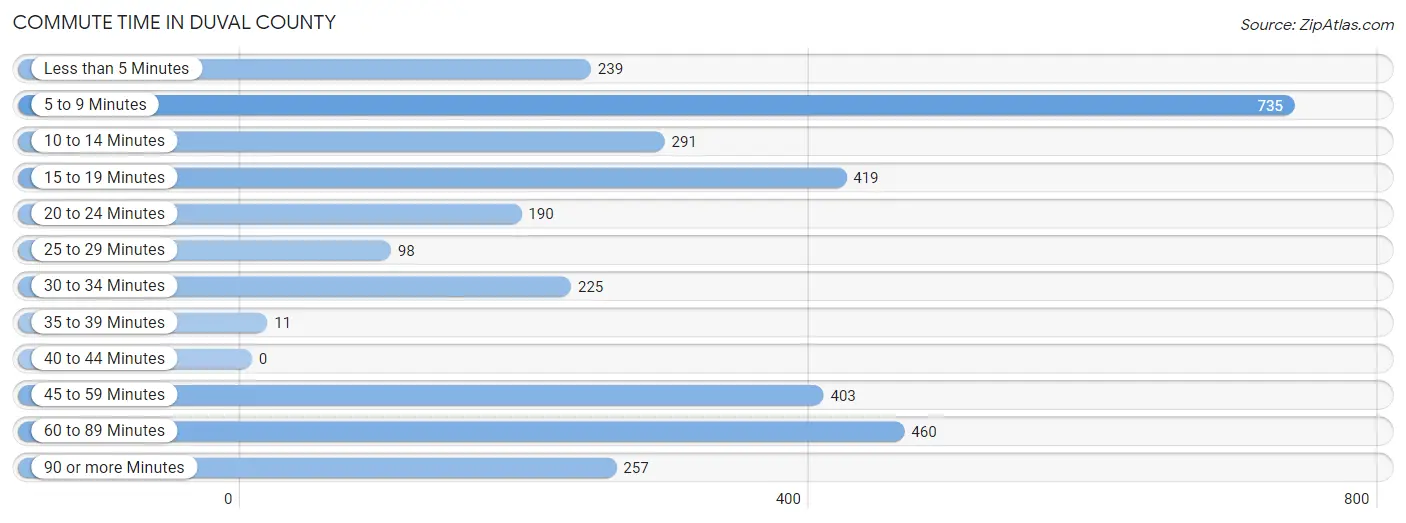
Commute Time in Duval County
The most frequently occuring commute durations in Duval County are 5 to 9 minutes (735 commuters, 22.1%), 60 to 89 minutes (460 commuters, 13.8%), and 15 to 19 minutes (419 commuters, 12.6%).
| Commute Time | # Commuters | % Commuters |
| Less than 5 Minutes | 239 | 7.2% |
| 5 to 9 Minutes | 735 | 22.1% |
| 10 to 14 Minutes | 291 | 8.7% |
| 15 to 19 Minutes | 419 | 12.6% |
| 20 to 24 Minutes | 190 | 5.7% |
| 25 to 29 Minutes | 98 | 2.9% |
| 30 to 34 Minutes | 225 | 6.8% |
| 35 to 39 Minutes | 11 | 0.3% |
| 40 to 44 Minutes | 0 | 0.0% |
| 45 to 59 Minutes | 403 | 12.1% |
| 60 to 89 Minutes | 460 | 13.8% |
| 90 or more Minutes | 257 | 7.7% |
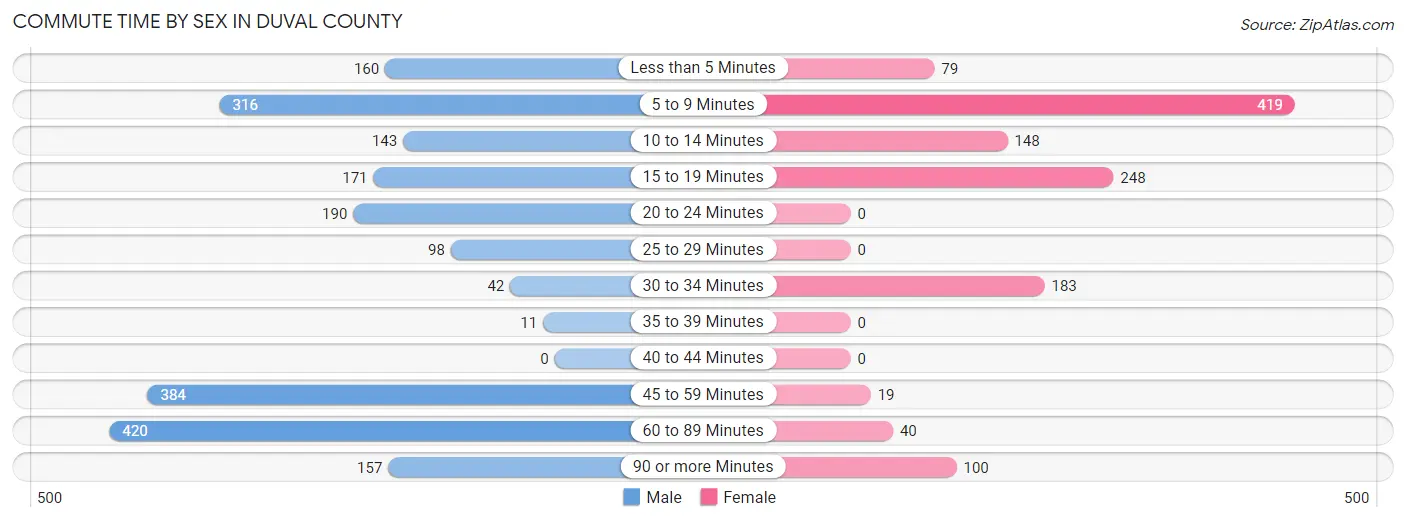
Commute Time by Sex in Duval County
The most common commute times in Duval County are 60 to 89 minutes (420 commuters, 20.1%) for males and 5 to 9 minutes (419 commuters, 33.9%) for females.
| Commute Time | Male | Female |
| Less than 5 Minutes | 160 (7.6%) | 79 (6.4%) |
| 5 to 9 Minutes | 316 (15.1%) | 419 (33.9%) |
| 10 to 14 Minutes | 143 (6.8%) | 148 (12.0%) |
| 15 to 19 Minutes | 171 (8.2%) | 248 (20.1%) |
| 20 to 24 Minutes | 190 (9.1%) | 0 (0.0%) |
| 25 to 29 Minutes | 98 (4.7%) | 0 (0.0%) |
| 30 to 34 Minutes | 42 (2.0%) | 183 (14.8%) |
| 35 to 39 Minutes | 11 (0.5%) | 0 (0.0%) |
| 40 to 44 Minutes | 0 (0.0%) | 0 (0.0%) |
| 45 to 59 Minutes | 384 (18.4%) | 19 (1.5%) |
| 60 to 89 Minutes | 420 (20.1%) | 40 (3.2%) |
| 90 or more Minutes | 157 (7.5%) | 100 (8.1%) |
Time of Departure to Work by Sex in Duval County
The most frequent times of departure to work in Duval County are 6:30 AM to 6:59 AM (442, 21.1%) for males and 7:30 AM to 7:59 AM (228, 18.4%) for females.
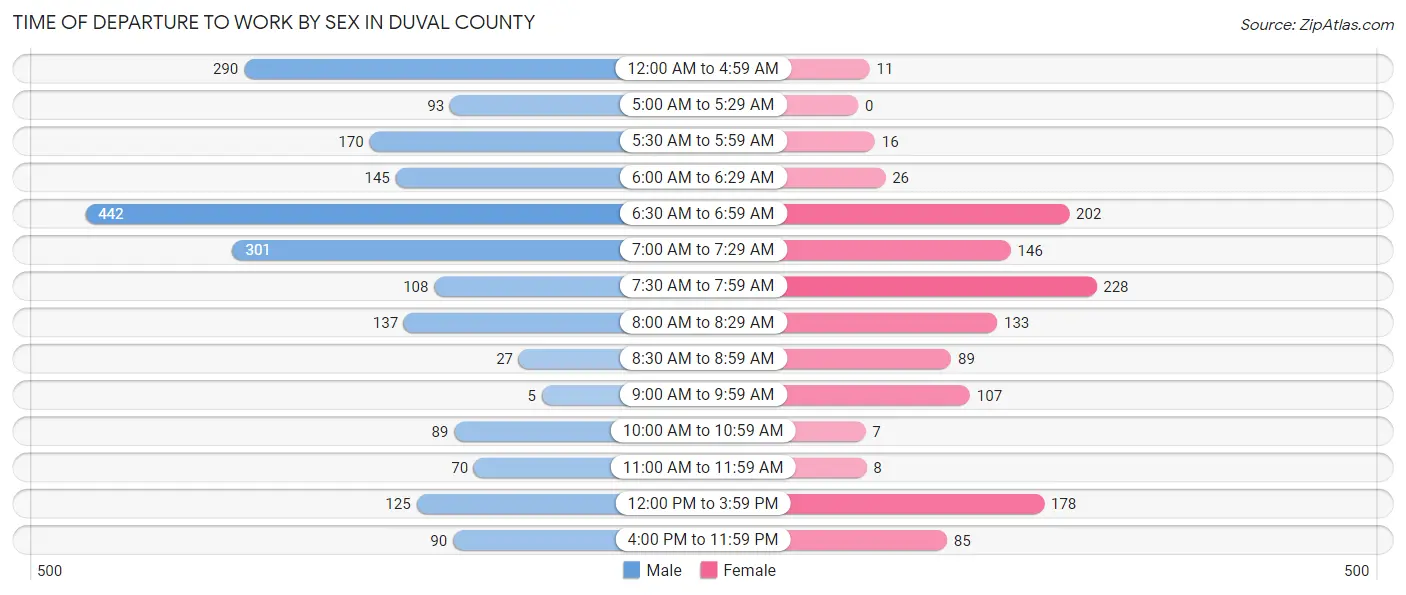
| Time of Departure | Male | Female |
| 12:00 AM to 4:59 AM | 290 (13.9%) | 11 (0.9%) |
| 5:00 AM to 5:29 AM | 93 (4.4%) | 0 (0.0%) |
| 5:30 AM to 5:59 AM | 170 (8.1%) | 16 (1.3%) |
| 6:00 AM to 6:29 AM | 145 (6.9%) | 26 (2.1%) |
| 6:30 AM to 6:59 AM | 442 (21.1%) | 202 (16.3%) |
| 7:00 AM to 7:29 AM | 301 (14.4%) | 146 (11.8%) |
| 7:30 AM to 7:59 AM | 108 (5.2%) | 228 (18.4%) |
| 8:00 AM to 8:29 AM | 137 (6.6%) | 133 (10.8%) |
| 8:30 AM to 8:59 AM | 27 (1.3%) | 89 (7.2%) |
| 9:00 AM to 9:59 AM | 5 (0.2%) | 107 (8.7%) |
| 10:00 AM to 10:59 AM | 89 (4.3%) | 7 (0.6%) |
| 11:00 AM to 11:59 AM | 70 (3.4%) | 8 (0.6%) |
| 12:00 PM to 3:59 PM | 125 (6.0%) | 178 (14.4%) |
| 4:00 PM to 11:59 PM | 90 (4.3%) | 85 (6.9%) |
| Total | 2,092 (100.0%) | 1,236 (100.0%) |
Housing Occupancy in Duval County
Occupancy by Ownership in Duval County
Of the total 2,892 dwellings in Duval County, owner-occupied units account for 2,062 (71.3%), while renter-occupied units make up 830 (28.7%).
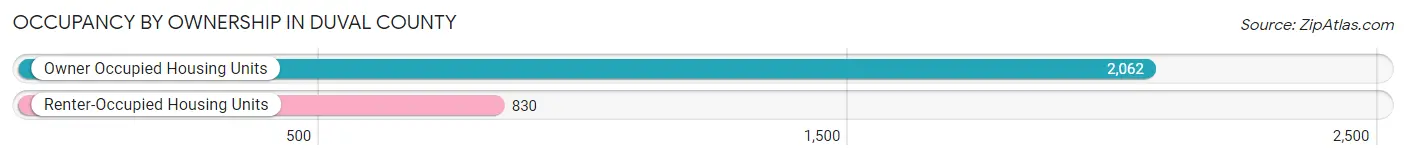
| Occupancy | # Housing Units | % Housing Units |
| Owner Occupied Housing Units | 2,062 | 71.3% |
| Renter-Occupied Housing Units | 830 | 28.7% |
| Total Occupied Housing Units | 2,892 | 100.0% |
Occupancy by Household Size in Duval County
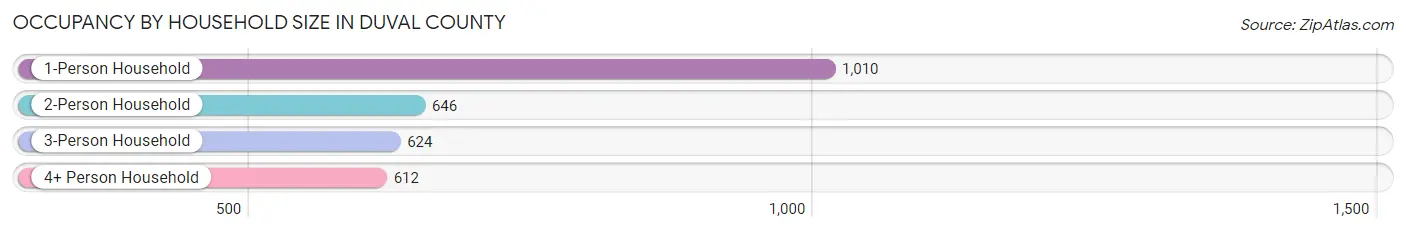
| Household Size | # Housing Units | % Housing Units |
| 1-Person Household | 1,010 | 34.9% |
| 2-Person Household | 646 | 22.3% |
| 3-Person Household | 624 | 21.6% |
| 4+ Person Household | 612 | 21.2% |
| Total Housing Units | 2,892 | 100.0% |
Occupancy by Ownership by Household Size in Duval County
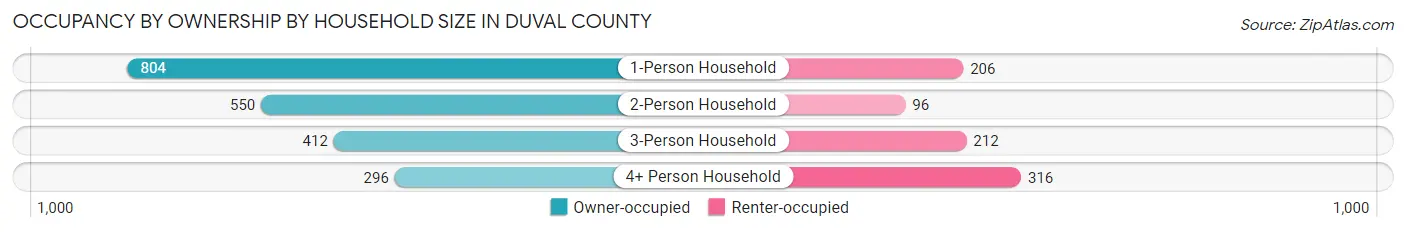
| Household Size | Owner-occupied | Renter-occupied |
| 1-Person Household | 804 (79.6%) | 206 (20.4%) |
| 2-Person Household | 550 (85.1%) | 96 (14.9%) |
| 3-Person Household | 412 (66.0%) | 212 (34.0%) |
| 4+ Person Household | 296 (48.4%) | 316 (51.6%) |
| Total Housing Units | 2,062 (71.3%) | 830 (28.7%) |
Occupancy by Educational Attainment in Duval County
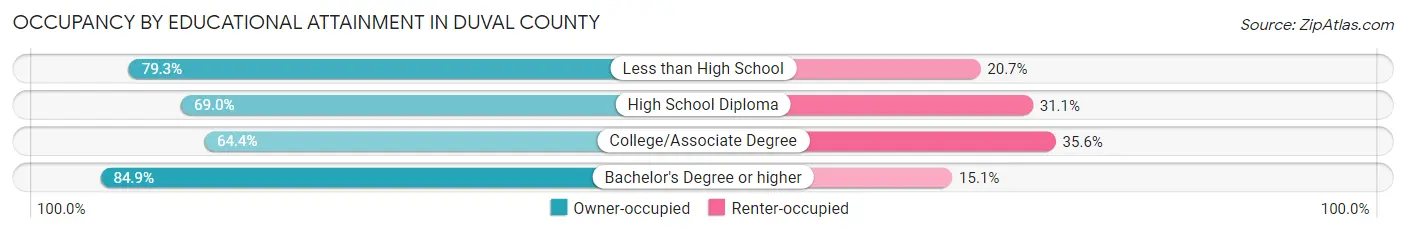
| Household Size | Owner-occupied | Renter-occupied |
| Less than High School | 576 (79.3%) | 150 (20.7%) |
| High School Diploma | 573 (69.0%) | 258 (31.0%) |
| College/Associate Degree | 693 (64.4%) | 383 (35.6%) |
| Bachelor's Degree or higher | 220 (84.9%) | 39 (15.1%) |
Occupancy by Age of Householder in Duval County
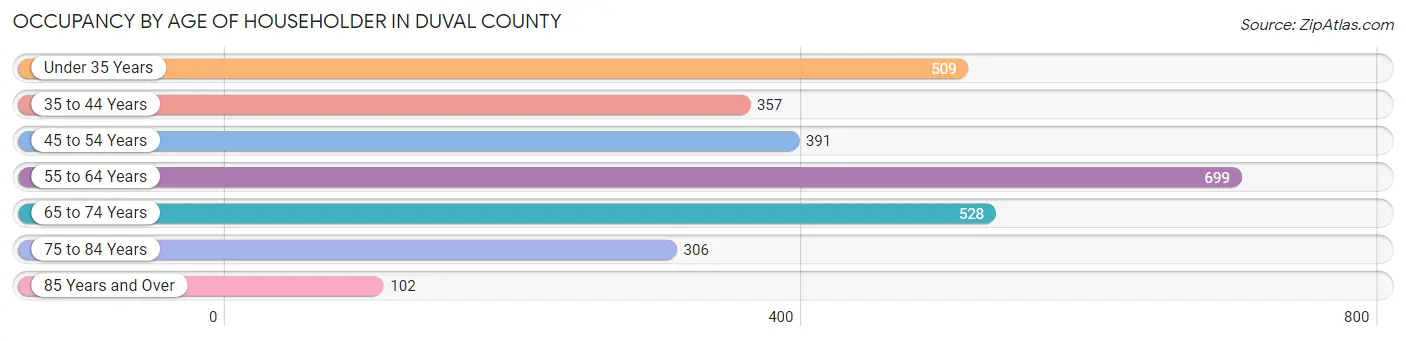
| Age Bracket | # Households | % Households |
| Under 35 Years | 509 | 17.6% |
| 35 to 44 Years | 357 | 12.3% |
| 45 to 54 Years | 391 | 13.5% |
| 55 to 64 Years | 699 | 24.2% |
| 65 to 74 Years | 528 | 18.3% |
| 75 to 84 Years | 306 | 10.6% |
| 85 Years and Over | 102 | 3.5% |
| Total | 2,892 | 100.0% |
Housing Finances in Duval County
Median Income by Occupancy in Duval County
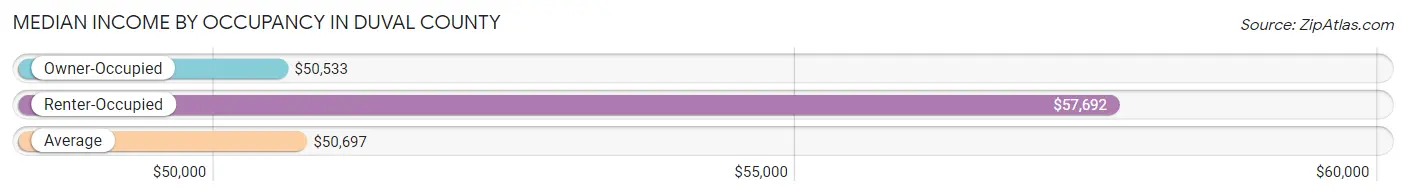
| Occupancy Type | # Households | Median Income |
| Owner-Occupied | 2,062 (71.3%) | $50,533 |
| Renter-Occupied | 830 (28.7%) | $57,692 |
| Average | 2,892 (100.0%) | $50,697 |
Occupancy by Householder Income Bracket in Duval County
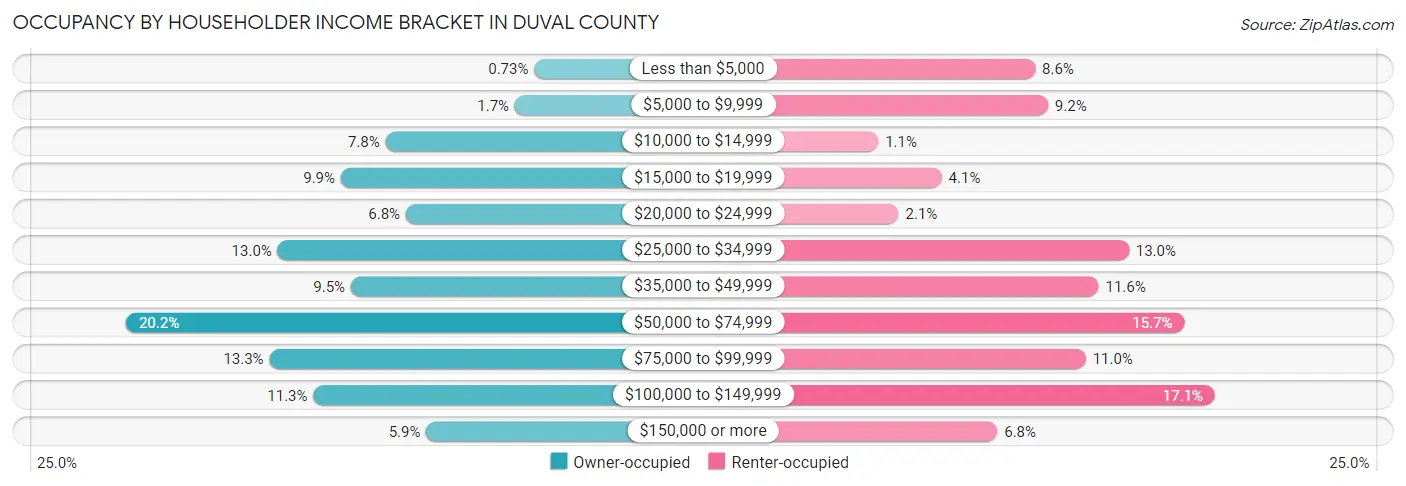
| Income Bracket | Owner-occupied | Renter-occupied |
| Less than $5,000 | 15 (0.7%) | 71 (8.6%) |
| $5,000 to $9,999 | 34 (1.7%) | 76 (9.2%) |
| $10,000 to $14,999 | 161 (7.8%) | 9 (1.1%) |
| $15,000 to $19,999 | 205 (9.9%) | 34 (4.1%) |
| $20,000 to $24,999 | 141 (6.8%) | 17 (2.1%) |
| $25,000 to $34,999 | 267 (13.0%) | 108 (13.0%) |
| $35,000 to $49,999 | 195 (9.5%) | 96 (11.6%) |
| $50,000 to $74,999 | 416 (20.2%) | 130 (15.7%) |
| $75,000 to $99,999 | 275 (13.3%) | 91 (11.0%) |
| $100,000 to $149,999 | 232 (11.3%) | 142 (17.1%) |
| $150,000 or more | 121 (5.9%) | 56 (6.8%) |
| Total | 2,062 (100.0%) | 830 (100.0%) |
Monthly Housing Cost Tiers in Duval County
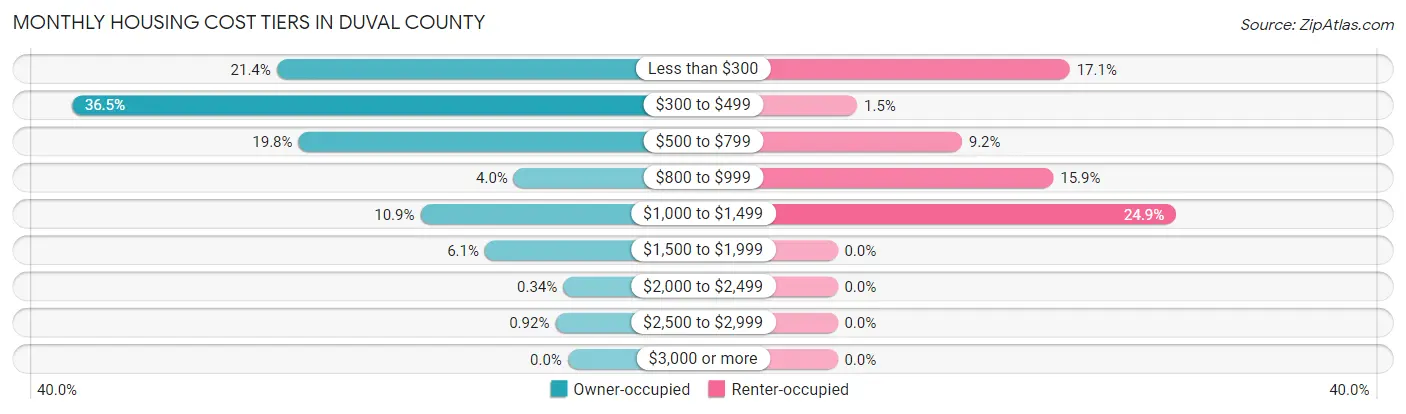
| Monthly Cost | Owner-occupied | Renter-occupied |
| Less than $300 | 442 (21.4%) | 142 (17.1%) |
| $300 to $499 | 753 (36.5%) | 12 (1.5%) |
| $500 to $799 | 409 (19.8%) | 76 (9.2%) |
| $800 to $999 | 82 (4.0%) | 132 (15.9%) |
| $1,000 to $1,499 | 224 (10.9%) | 207 (24.9%) |
| $1,500 to $1,999 | 126 (6.1%) | 0 (0.0%) |
| $2,000 to $2,499 | 7 (0.3%) | 0 (0.0%) |
| $2,500 to $2,999 | 19 (0.9%) | 0 (0.0%) |
| $3,000 or more | 0 (0.0%) | 0 (0.0%) |
| Total | 2,062 (100.0%) | 830 (100.0%) |
Physical Housing Characteristics in Duval County
Housing Structures in Duval County
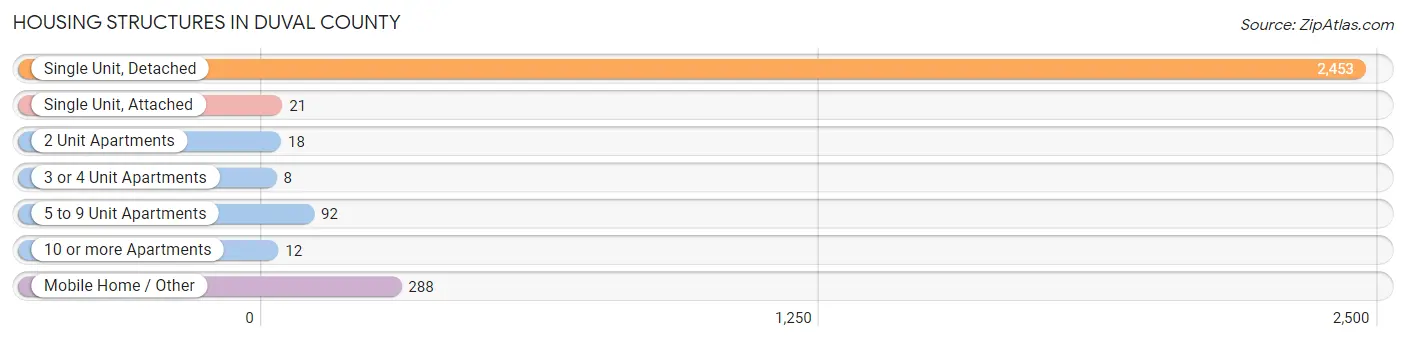
| Structure Type | # Housing Units | % Housing Units |
| Single Unit, Detached | 2,453 | 84.8% |
| Single Unit, Attached | 21 | 0.7% |
| 2 Unit Apartments | 18 | 0.6% |
| 3 or 4 Unit Apartments | 8 | 0.3% |
| 5 to 9 Unit Apartments | 92 | 3.2% |
| 10 or more Apartments | 12 | 0.4% |
| Mobile Home / Other | 288 | 10.0% |
| Total | 2,892 | 100.0% |
Housing Structures by Occupancy in Duval County
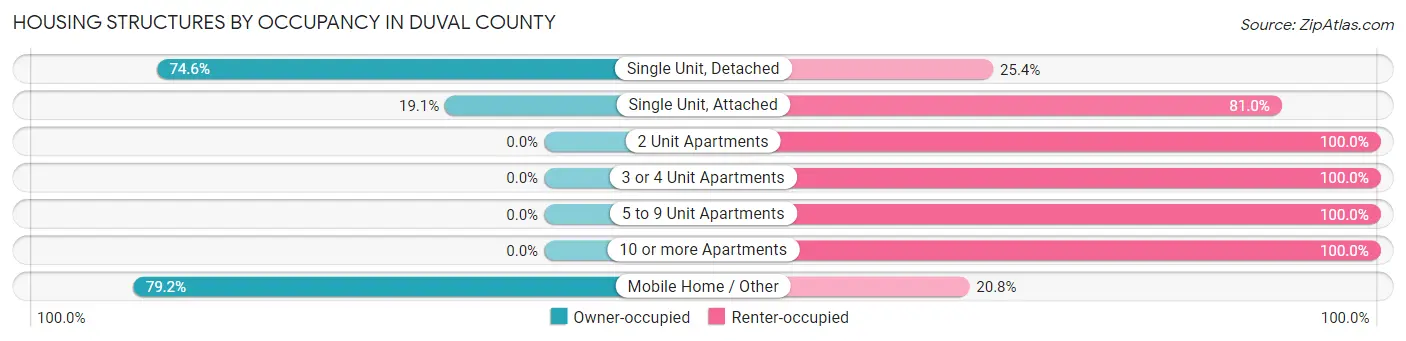
| Structure Type | Owner-occupied | Renter-occupied |
| Single Unit, Detached | 1,830 (74.6%) | 623 (25.4%) |
| Single Unit, Attached | 4 (19.1%) | 17 (80.9%) |
| 2 Unit Apartments | 0 (0.0%) | 18 (100.0%) |
| 3 or 4 Unit Apartments | 0 (0.0%) | 8 (100.0%) |
| 5 to 9 Unit Apartments | 0 (0.0%) | 92 (100.0%) |
| 10 or more Apartments | 0 (0.0%) | 12 (100.0%) |
| Mobile Home / Other | 228 (79.2%) | 60 (20.8%) |
| Total | 2,062 (71.3%) | 830 (28.7%) |
Housing Structures by Number of Rooms in Duval County
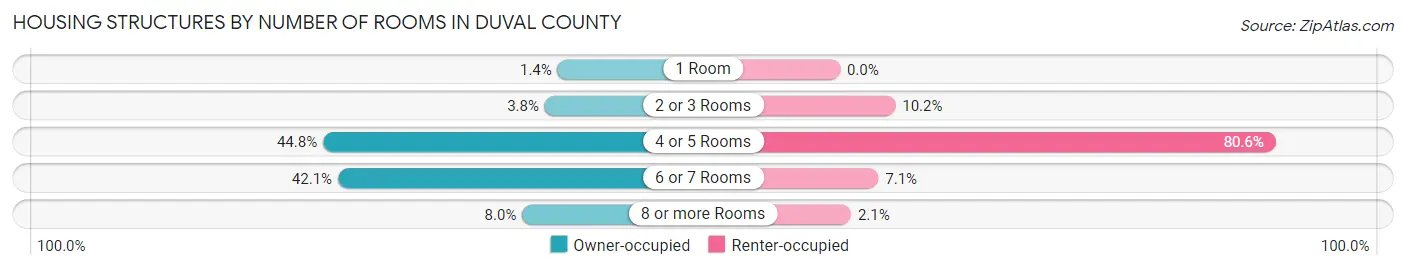
| Number of Rooms | Owner-occupied | Renter-occupied |
| 1 Room | 29 (1.4%) | 0 (0.0%) |
| 2 or 3 Rooms | 78 (3.8%) | 85 (10.2%) |
| 4 or 5 Rooms | 924 (44.8%) | 669 (80.6%) |
| 6 or 7 Rooms | 867 (42.0%) | 59 (7.1%) |
| 8 or more Rooms | 164 (8.0%) | 17 (2.1%) |
| Total | 2,062 (100.0%) | 830 (100.0%) |
Housing Structure by Heating Type in Duval County
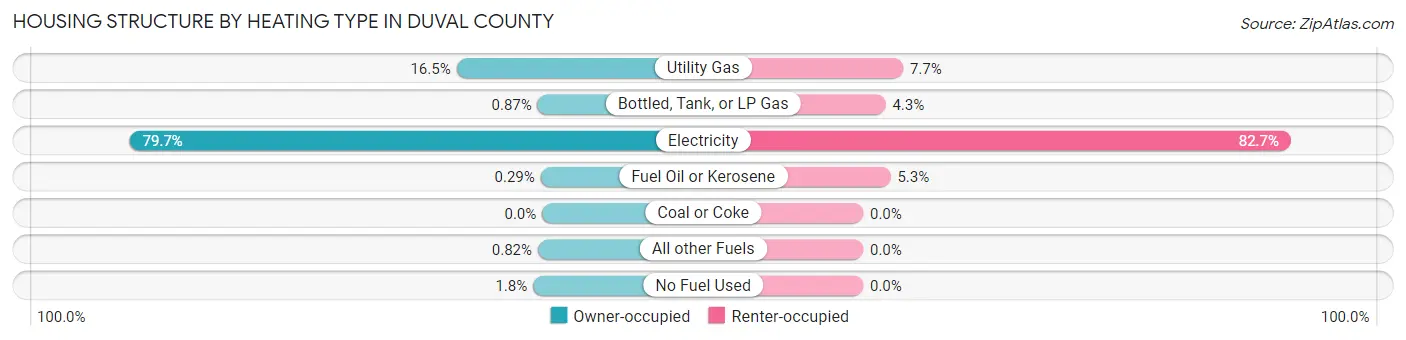
| Heating Type | Owner-occupied | Renter-occupied |
| Utility Gas | 341 (16.5%) | 64 (7.7%) |
| Bottled, Tank, or LP Gas | 18 (0.9%) | 36 (4.3%) |
| Electricity | 1,644 (79.7%) | 686 (82.7%) |
| Fuel Oil or Kerosene | 6 (0.3%) | 44 (5.3%) |
| Coal or Coke | 0 (0.0%) | 0 (0.0%) |
| All other Fuels | 17 (0.8%) | 0 (0.0%) |
| No Fuel Used | 36 (1.8%) | 0 (0.0%) |
| Total | 2,062 (100.0%) | 830 (100.0%) |
Household Vehicle Usage in Duval County
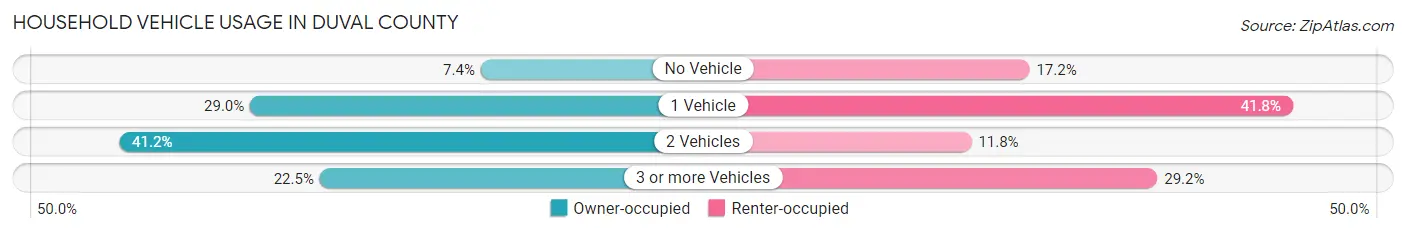
| Vehicles per Household | Owner-occupied | Renter-occupied |
| No Vehicle | 153 (7.4%) | 143 (17.2%) |
| 1 Vehicle | 597 (28.9%) | 347 (41.8%) |
| 2 Vehicles | 849 (41.2%) | 98 (11.8%) |
| 3 or more Vehicles | 463 (22.5%) | 242 (29.2%) |
| Total | 2,062 (100.0%) | 830 (100.0%) |
Real Estate & Mortgages in Duval County
Real Estate and Mortgage Overview in Duval County
| Characteristic | Without Mortgage | With Mortgage |
| Housing Units | 1,571 | 491 |
| Median Property Value | $63,100 | $136,300 |
| Median Household Income | $40,694 | $59 |
| Monthly Housing Costs | $401 | $0 |
| Real Estate Taxes | $563 | $12 |
Property Value by Mortgage Status in Duval County
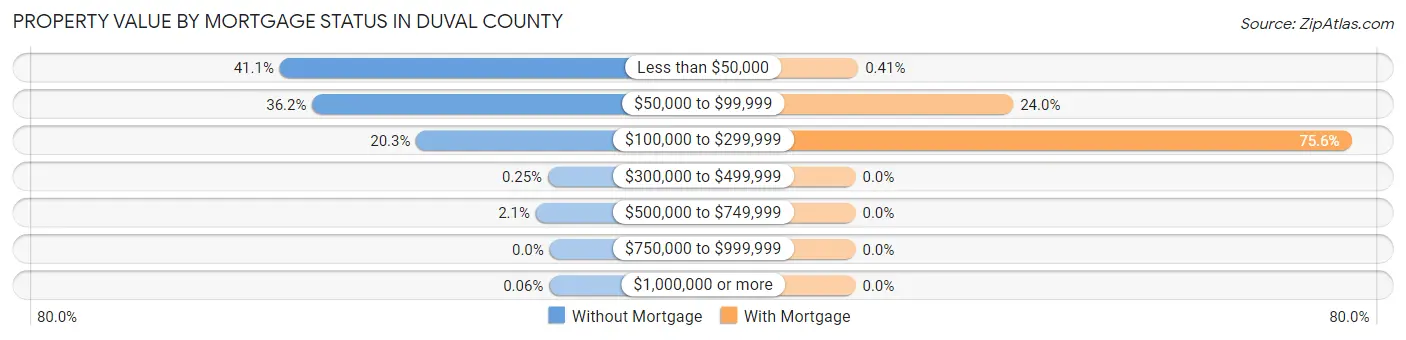
| Property Value | Without Mortgage | With Mortgage |
| Less than $50,000 | 646 (41.1%) | 2 (0.4%) |
| $50,000 to $99,999 | 568 (36.2%) | 118 (24.0%) |
| $100,000 to $299,999 | 319 (20.3%) | 371 (75.6%) |
| $300,000 to $499,999 | 4 (0.3%) | 0 (0.0%) |
| $500,000 to $749,999 | 33 (2.1%) | 0 (0.0%) |
| $750,000 to $999,999 | 0 (0.0%) | 0 (0.0%) |
| $1,000,000 or more | 1 (0.1%) | 0 (0.0%) |
| Total | 1,571 (100.0%) | 491 (100.0%) |
Household Income by Mortgage Status in Duval County
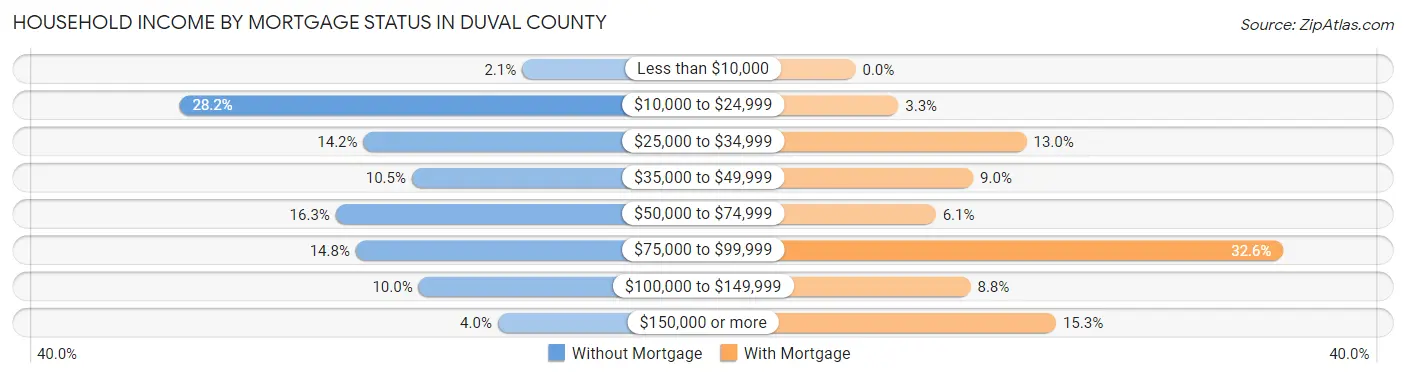
| Household Income | Without Mortgage | With Mortgage |
| Less than $10,000 | 33 (2.1%) | 0 (0.0%) |
| $10,000 to $24,999 | 443 (28.2%) | 16 (3.3%) |
| $25,000 to $34,999 | 223 (14.2%) | 64 (13.0%) |
| $35,000 to $49,999 | 165 (10.5%) | 44 (9.0%) |
| $50,000 to $74,999 | 256 (16.3%) | 30 (6.1%) |
| $75,000 to $99,999 | 232 (14.8%) | 160 (32.6%) |
| $100,000 to $149,999 | 157 (10.0%) | 43 (8.8%) |
| $150,000 or more | 62 (4.0%) | 75 (15.3%) |
| Total | 1,571 (100.0%) | 491 (100.0%) |
Property Value to Household Income Ratio in Duval County
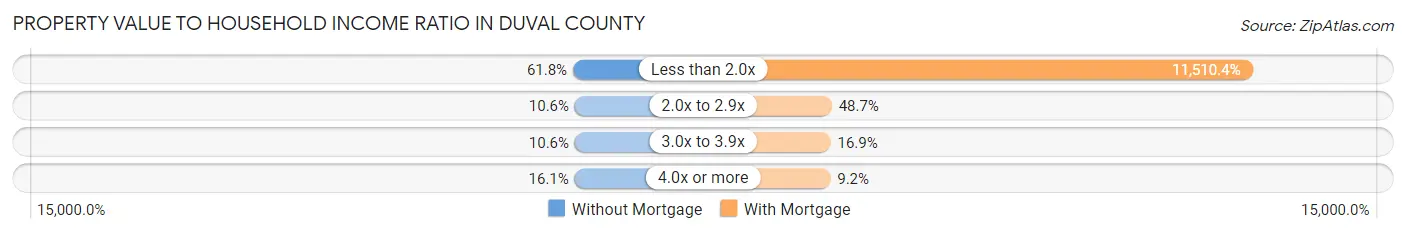
| Value-to-Income Ratio | Without Mortgage | With Mortgage |
| Less than 2.0x | 971 (61.8%) | 56,516 (11,510.4%) |
| 2.0x to 2.9x | 166 (10.6%) | 239 (48.7%) |
| 3.0x to 3.9x | 166 (10.6%) | 83 (16.9%) |
| 4.0x or more | 253 (16.1%) | 45 (9.2%) |
| Total | 1,571 (100.0%) | 491 (100.0%) |
Real Estate Taxes by Mortgage Status in Duval County
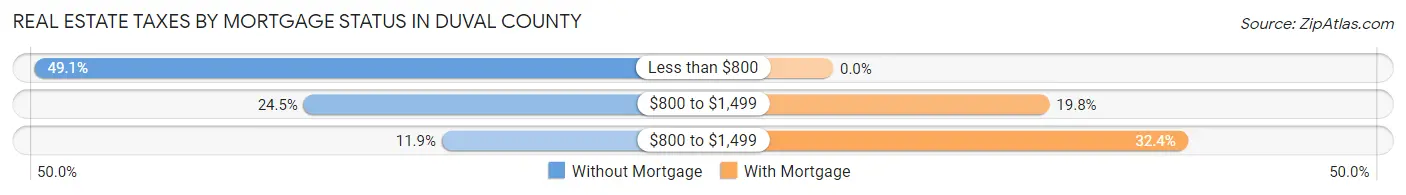
| Property Taxes | Without Mortgage | With Mortgage |
| Less than $800 | 771 (49.1%) | 0 (0.0%) |
| $800 to $1,499 | 385 (24.5%) | 97 (19.8%) |
| $800 to $1,499 | 187 (11.9%) | 159 (32.4%) |
| Total | 1,571 (100.0%) | 491 (100.0%) |
Health & Disability in Duval County
Health Insurance Coverage by Age in Duval County
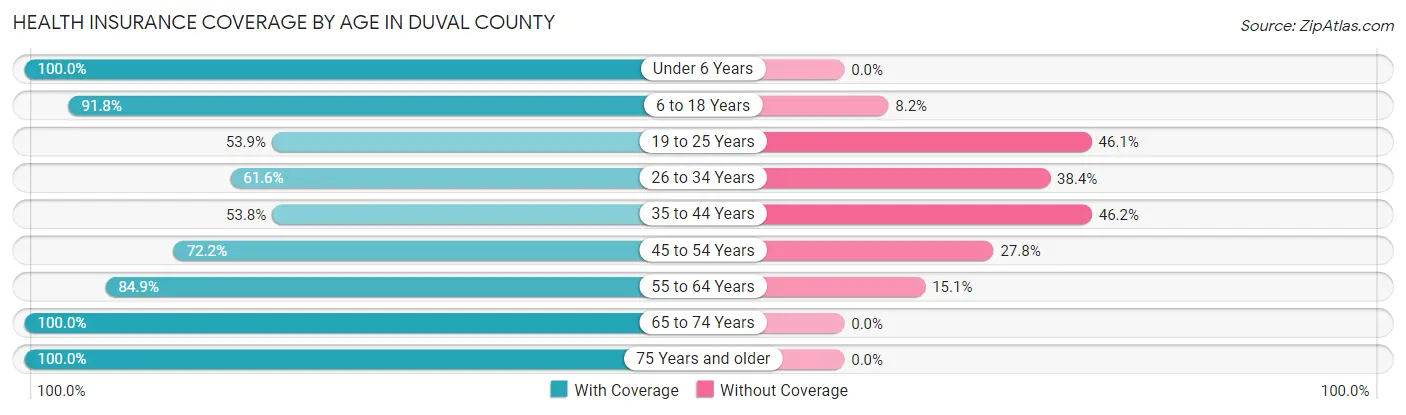
| Age Bracket | With Coverage | Without Coverage |
| Under 6 Years | 795 (100.0%) | 0 (0.0%) |
| 6 to 18 Years | 1,868 (91.8%) | 167 (8.2%) |
| 19 to 25 Years | 525 (53.9%) | 449 (46.1%) |
| 26 to 34 Years | 578 (61.6%) | 360 (38.4%) |
| 35 to 44 Years | 575 (53.8%) | 493 (46.2%) |
| 45 to 54 Years | 703 (72.2%) | 271 (27.8%) |
| 55 to 64 Years | 934 (84.9%) | 166 (15.1%) |
| 65 to 74 Years | 813 (100.0%) | 0 (0.0%) |
| 75 Years and older | 716 (100.0%) | 0 (0.0%) |
| Total | 7,507 (79.7%) | 1,906 (20.3%) |
Health Insurance Coverage by Citizenship Status in Duval County
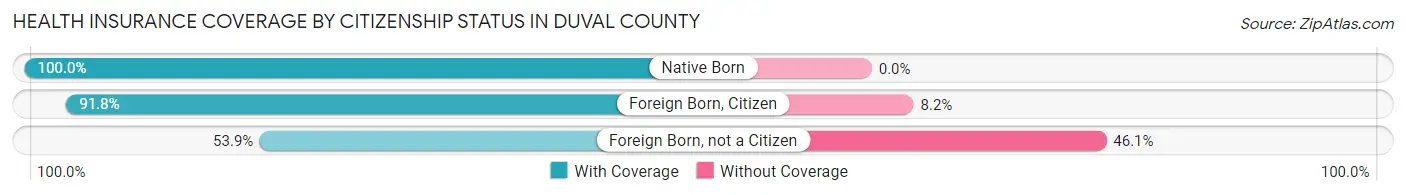
| Citizenship Status | With Coverage | Without Coverage |
| Native Born | 795 (100.0%) | 0 (0.0%) |
| Foreign Born, Citizen | 1,868 (91.8%) | 167 (8.2%) |
| Foreign Born, not a Citizen | 525 (53.9%) | 449 (46.1%) |
Health Insurance Coverage by Household Income in Duval County
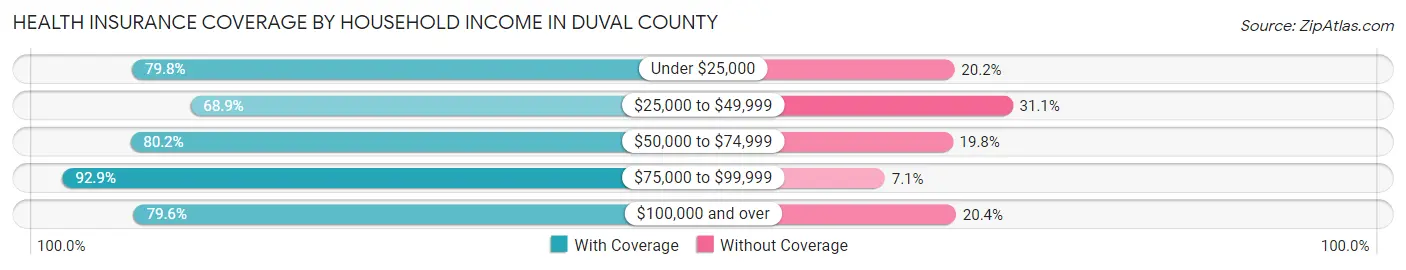
| Household Income | With Coverage | Without Coverage |
| Under $25,000 | 1,600 (79.8%) | 404 (20.2%) |
| $25,000 to $49,999 | 1,116 (68.9%) | 503 (31.1%) |
| $50,000 to $74,999 | 1,731 (80.2%) | 428 (19.8%) |
| $75,000 to $99,999 | 1,200 (92.9%) | 92 (7.1%) |
| $100,000 and over | 1,858 (79.6%) | 477 (20.4%) |
Public vs Private Health Insurance Coverage by Age in Duval County
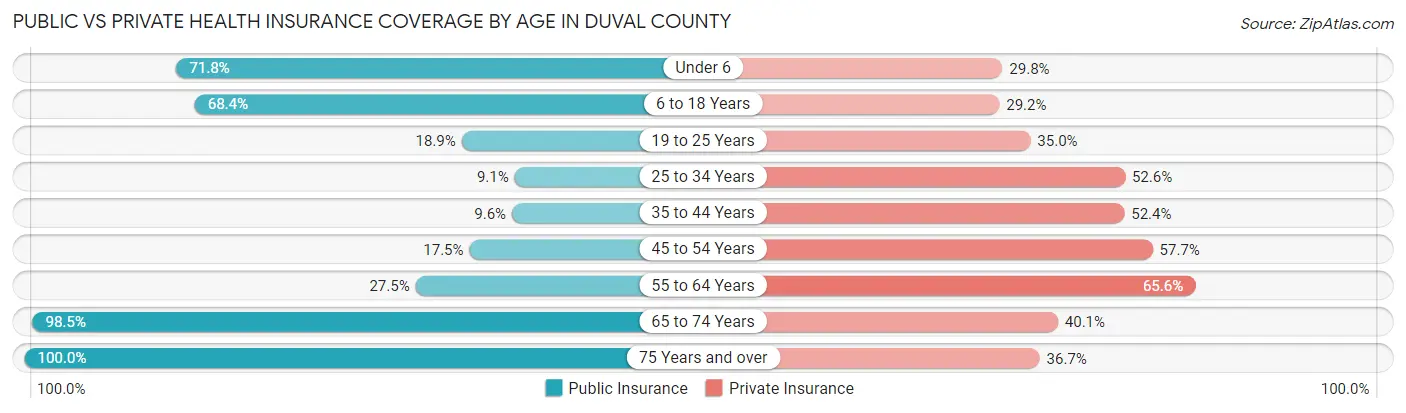
| Age Bracket | Public Insurance | Private Insurance |
| Under 6 | 571 (71.8%) | 237 (29.8%) |
| 6 to 18 Years | 1,392 (68.4%) | 595 (29.2%) |
| 19 to 25 Years | 184 (18.9%) | 341 (35.0%) |
| 25 to 34 Years | 85 (9.1%) | 493 (52.6%) |
| 35 to 44 Years | 102 (9.6%) | 560 (52.4%) |
| 45 to 54 Years | 170 (17.4%) | 562 (57.7%) |
| 55 to 64 Years | 302 (27.5%) | 721 (65.5%) |
| 65 to 74 Years | 801 (98.5%) | 326 (40.1%) |
| 75 Years and over | 716 (100.0%) | 263 (36.7%) |
| Total | 4,323 (45.9%) | 4,098 (43.5%) |
Disability Status by Sex by Age in Duval County
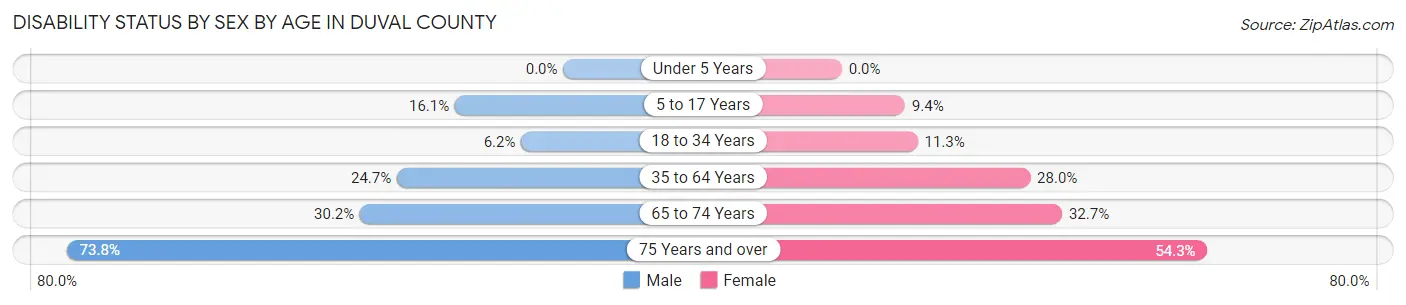
| Age Bracket | Male | Female |
| Under 5 Years | 0 (0.0%) | 0 (0.0%) |
| 5 to 17 Years | 133 (16.1%) | 96 (9.4%) |
| 18 to 34 Years | 76 (6.2%) | 113 (11.3%) |
| 35 to 64 Years | 375 (24.7%) | 454 (28.0%) |
| 65 to 74 Years | 118 (30.2%) | 138 (32.7%) |
| 75 Years and over | 236 (73.8%) | 215 (54.3%) |
Disability Class by Sex by Age in Duval County
Disability Class: Hearing Difficulty
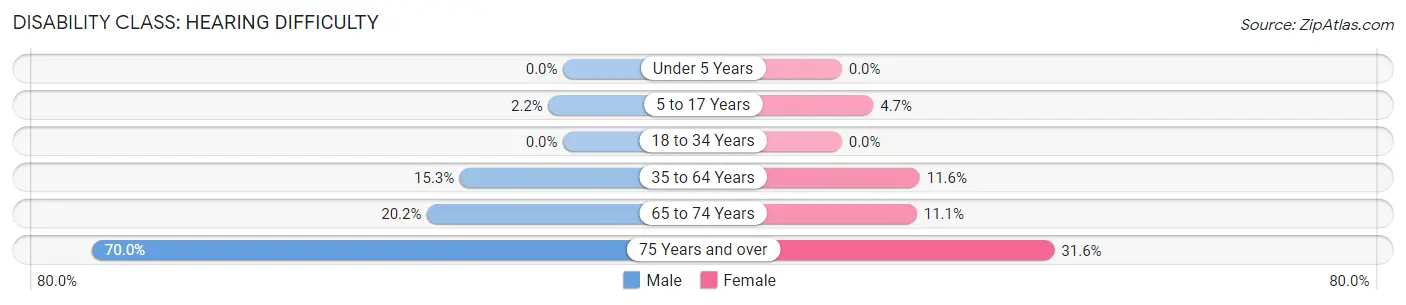
| Age Bracket | Male | Female |
| Under 5 Years | 0 (0.0%) | 0 (0.0%) |
| 5 to 17 Years | 18 (2.2%) | 48 (4.7%) |
| 18 to 34 Years | 0 (0.0%) | 0 (0.0%) |
| 35 to 64 Years | 233 (15.3%) | 188 (11.6%) |
| 65 to 74 Years | 79 (20.2%) | 47 (11.1%) |
| 75 Years and over | 224 (70.0%) | 125 (31.6%) |
Disability Class: Vision Difficulty
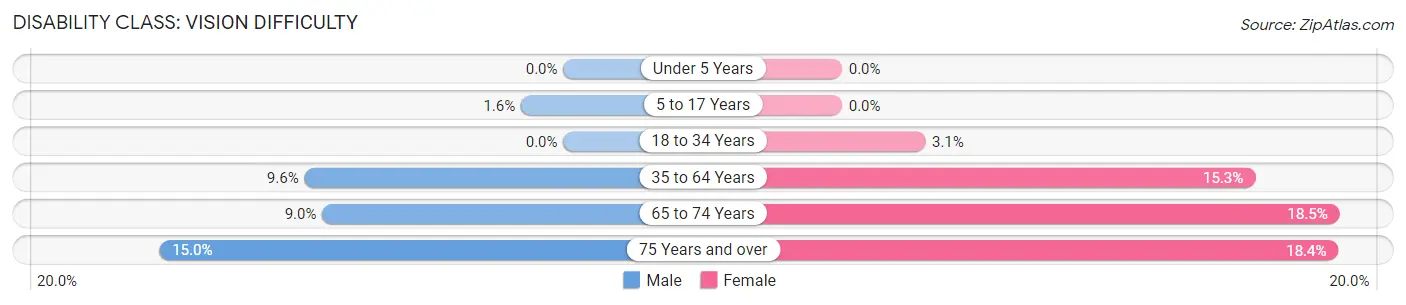
| Age Bracket | Male | Female |
| Under 5 Years | 0 (0.0%) | 0 (0.0%) |
| 5 to 17 Years | 13 (1.6%) | 0 (0.0%) |
| 18 to 34 Years | 0 (0.0%) | 31 (3.1%) |
| 35 to 64 Years | 146 (9.6%) | 249 (15.3%) |
| 65 to 74 Years | 35 (8.9%) | 78 (18.5%) |
| 75 Years and over | 48 (15.0%) | 73 (18.4%) |
Disability Class: Cognitive Difficulty
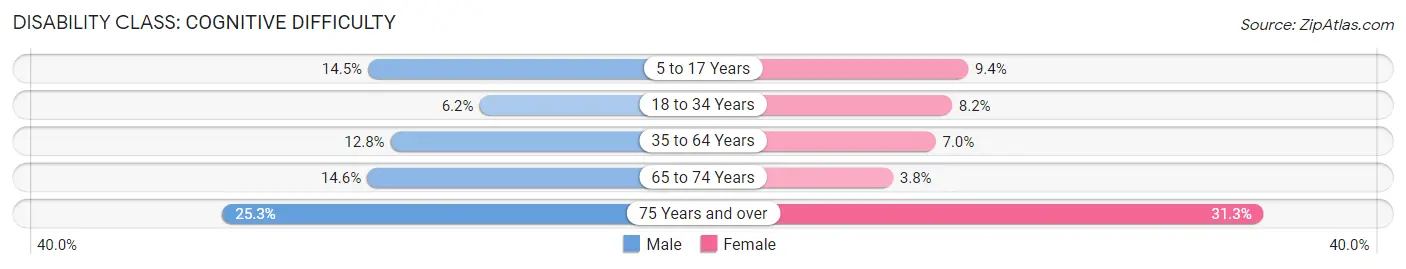
| Age Bracket | Male | Female |
| 5 to 17 Years | 120 (14.5%) | 96 (9.4%) |
| 18 to 34 Years | 76 (6.2%) | 82 (8.2%) |
| 35 to 64 Years | 195 (12.8%) | 113 (7.0%) |
| 65 to 74 Years | 57 (14.6%) | 16 (3.8%) |
| 75 Years and over | 81 (25.3%) | 124 (31.3%) |
Disability Class: Ambulatory Difficulty
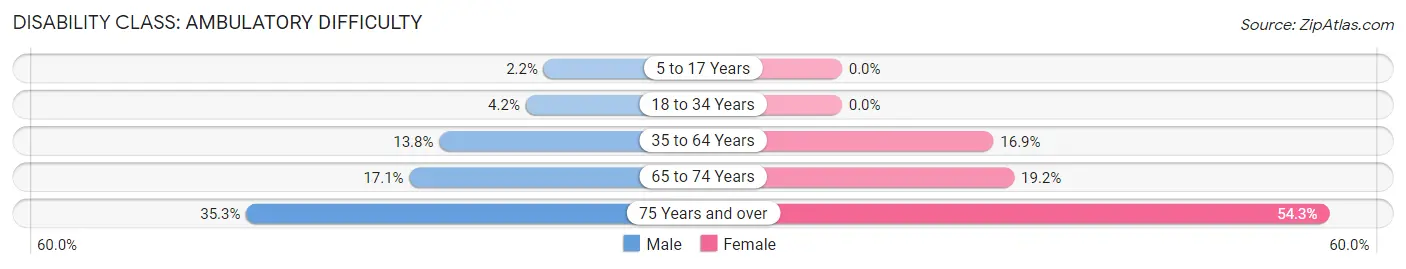
| Age Bracket | Male | Female |
| 5 to 17 Years | 18 (2.2%) | 0 (0.0%) |
| 18 to 34 Years | 51 (4.2%) | 0 (0.0%) |
| 35 to 64 Years | 210 (13.8%) | 274 (16.9%) |
| 65 to 74 Years | 67 (17.1%) | 81 (19.2%) |
| 75 Years and over | 113 (35.3%) | 215 (54.3%) |
Disability Class: Self-Care Difficulty
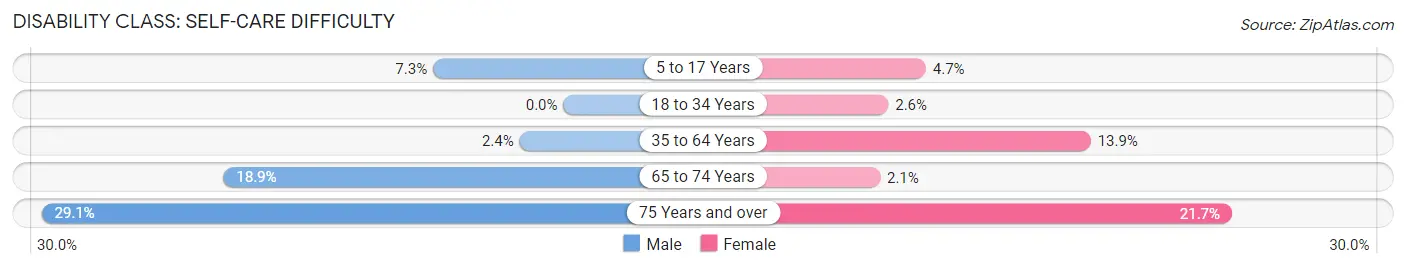
| Age Bracket | Male | Female |
| 5 to 17 Years | 60 (7.3%) | 48 (4.7%) |
| 18 to 34 Years | 0 (0.0%) | 26 (2.6%) |
| 35 to 64 Years | 37 (2.4%) | 225 (13.9%) |
| 65 to 74 Years | 74 (18.9%) | 9 (2.1%) |
| 75 Years and over | 93 (29.1%) | 86 (21.7%) |
Technology Access in Duval County
Computing Device Access in Duval County
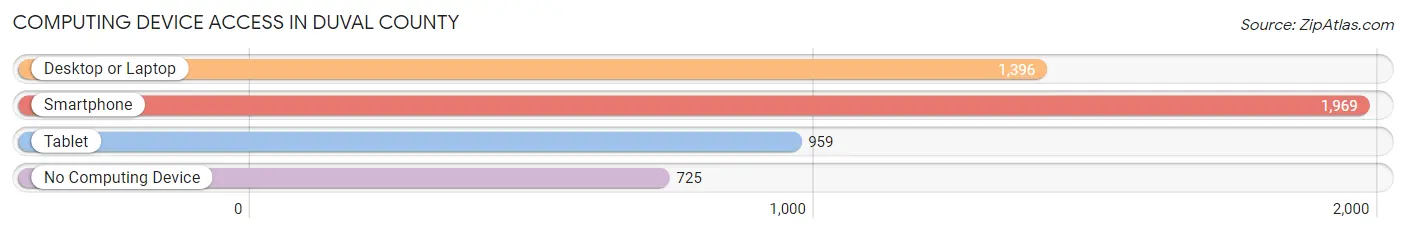
| Device Type | # Households | % Households |
| Desktop or Laptop | 1,396 | 48.3% |
| Smartphone | 1,969 | 68.1% |
| Tablet | 959 | 33.2% |
| No Computing Device | 725 | 25.1% |
| Total | 2,892 | 100.0% |
Internet Access in Duval County
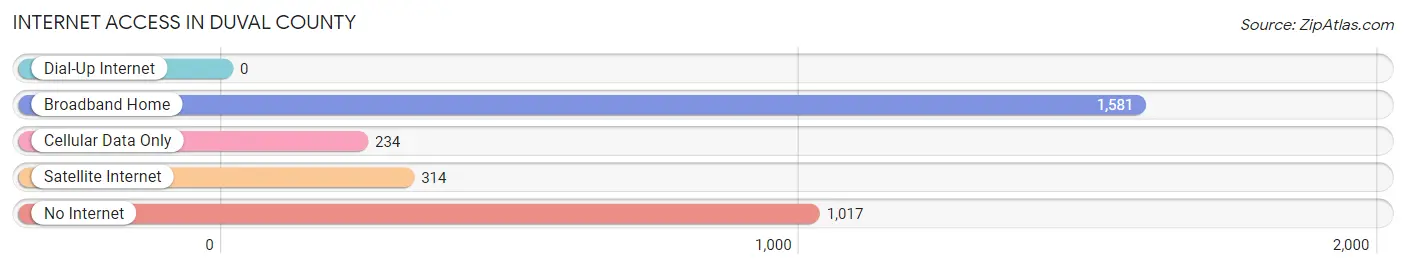
| Internet Type | # Households | % Households |
| Dial-Up Internet | 0 | 0.0% |
| Broadband Home | 1,581 | 54.7% |
| Cellular Data Only | 234 | 8.1% |
| Satellite Internet | 314 | 10.9% |
| No Internet | 1,017 | 35.2% |
| Total | 2,892 | 100.0% |
Duval County Summary
Duval County is located in the southern part of Texas, in the United States. It is bordered by Jim Hogg County to the north, Jim Wells County to the east, Brooks County to the south, and Starr County to the west. The county seat is San Diego, and the largest city is Freer. The county has a total area of 1,788 square miles, of which 1,788 square miles is land and 0.2 square miles is water.
History
Duval County was established in 1858 and named for Burr H. Duval, a soldier in the Texas Revolution. The county was originally part of San Patricio County, but was later divided into its own county. The county was organized in 1876 and the first county seat was San Diego. In 1882, the county seat was moved to Freer.
Geography
Duval County is located in the southern part of Texas, in the United States. It is bordered by Jim Hogg County to the north, Jim Wells County to the east, Brooks County to the south, and Starr County to the west. The county has a total area of 1,788 square miles, of which 1,788 square miles is land and 0.2 square miles is water. The terrain is mostly flat with some rolling hills. The climate is semi-arid with hot summers and mild winters.
Economy
The economy of Duval County is largely based on agriculture and oil and gas production. The county is home to several large ranches and farms, which produce a variety of crops, including cotton, corn, sorghum, and wheat. The county is also home to several oil and gas fields, which produce both crude oil and natural gas. Other industries in the county include manufacturing, construction, and tourism.
Demographics
As of the 2010 census, the population of Duval County was 11,782. The population density was 6.6 people per square mile. The racial makeup of the county was 75.3% White, 0.7% African American, 0.5% Native American, 0.2% Asian, 0.1% Pacific Islander, 21.7% from other races, and 1.5% from two or more races. Hispanic or Latino of any race were 81.2% of the population.
The median income for a household in the county was $25,938, and the median income for a family was $30,938. The per capita income for the county was $13,845. About 24.2% of the population was below the poverty line.
Common Questions
What is Per Capita Income in Duval County?
Per Capita income in Duval County is $21,606.
What is the Median Family Income in Duval County?
Median Family Income in Duval County is $64,274.
What is the Median Household income in Duval County?
Median Household Income in Duval County is $50,697.
What is Income or Wage Gap in Duval County?
Income or Wage Gap in Duval County is 39.0%.
Women in Duval County earn 61.0 cents for every dollar earned by a man.
What is Inequality or Gini Index in Duval County?
Inequality or Gini Index in Duval County is 0.42.
What is the Total Population of Duval County?
Total Population of Duval County is 9,960.
What is the Total Male Population of Duval County?
Total Male Population of Duval County is 5,097.
What is the Total Female Population of Duval County?
Total Female Population of Duval County is 4,863.
What is the Ratio of Males per 100 Females in Duval County?
There are 104.81 Males per 100 Females in Duval County.
What is the Ratio of Females per 100 Males in Duval County?
There are 95.41 Females per 100 Males in Duval County.
What is the Median Population Age in Duval County?
Median Population Age in Duval County is 35.5 Years.
What is the Average Family Size in Duval County
Average Family Size in Duval County is 4.4 People.
What is the Average Household Size in Duval County
Average Household Size in Duval County is 3.2 People.
How Large is the Labor Force in Duval County?
There are 3,976 People in the Labor Forcein in Duval County.
What is the Percentage of People in the Labor Force in Duval County?
51.6% of People are in the Labor Force in Duval County.
What is the Unemployment Rate in Duval County?
Unemployment Rate in Duval County is 8.4%.