Donley County, TX Map & Demographics
Donley County Map
Donley County Overview
$25,682
PER CAPITA INCOME
$73,352
AVG FAMILY INCOME
$51,711
AVG HOUSEHOLD INCOME
1.1%
WAGE / INCOME GAP [ % ]
98.9¢/ $1
WAGE / INCOME GAP [ $ ]
0.42
INEQUALITY / GINI INDEX
3,298
TOTAL POPULATION
1,666
MALE POPULATION
1,632
FEMALE POPULATION
102.08
MALES / 100 FEMALES
97.96
FEMALES / 100 MALES
40.3
MEDIAN AGE
3.2
AVG FAMILY SIZE
2.5
AVG HOUSEHOLD SIZE
1,385
LABOR FORCE [ PEOPLE ]
51.3%
PERCENT IN LABOR FORCE
Donley County Area Codes
Income in Donley County
Income Overview in Donley County
Per Capita Income in Donley County is $25,682, while median incomes of families and households are $73,352 and $51,711 respectively.
| Characteristic | Number | Measure |
| Per Capita Income | 3,298 | $25,682 |
| Median Family Income | 747 | $73,352 |
| Mean Family Income | 747 | $80,845 |
| Median Household Income | 1,198 | $51,711 |
| Mean Household Income | 1,198 | $64,460 |
| Income Deficit | 747 | $0 |
| Wage / Income Gap (%) | 3,298 | 1.08% |
| Wage / Income Gap ($) | 3,298 | 98.92¢ per $1 |
| Gini / Inequality Index | 3,298 | 0.42 |
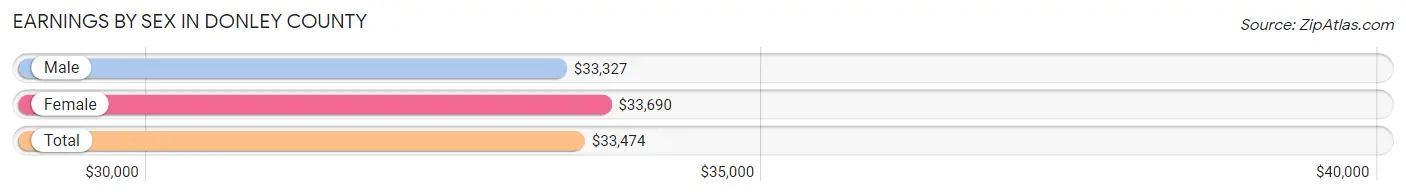
Earnings by Sex in Donley County
Average Earnings in Donley County are $33,474, $33,327 for men and $33,690 for women, a difference of 1.1%.
| Sex | Number | Average Earnings |
| Male | 823 (50.6%) | $33,327 |
| Female | 802 (49.3%) | $33,690 |
| Total | 1,625 (100.0%) | $33,474 |
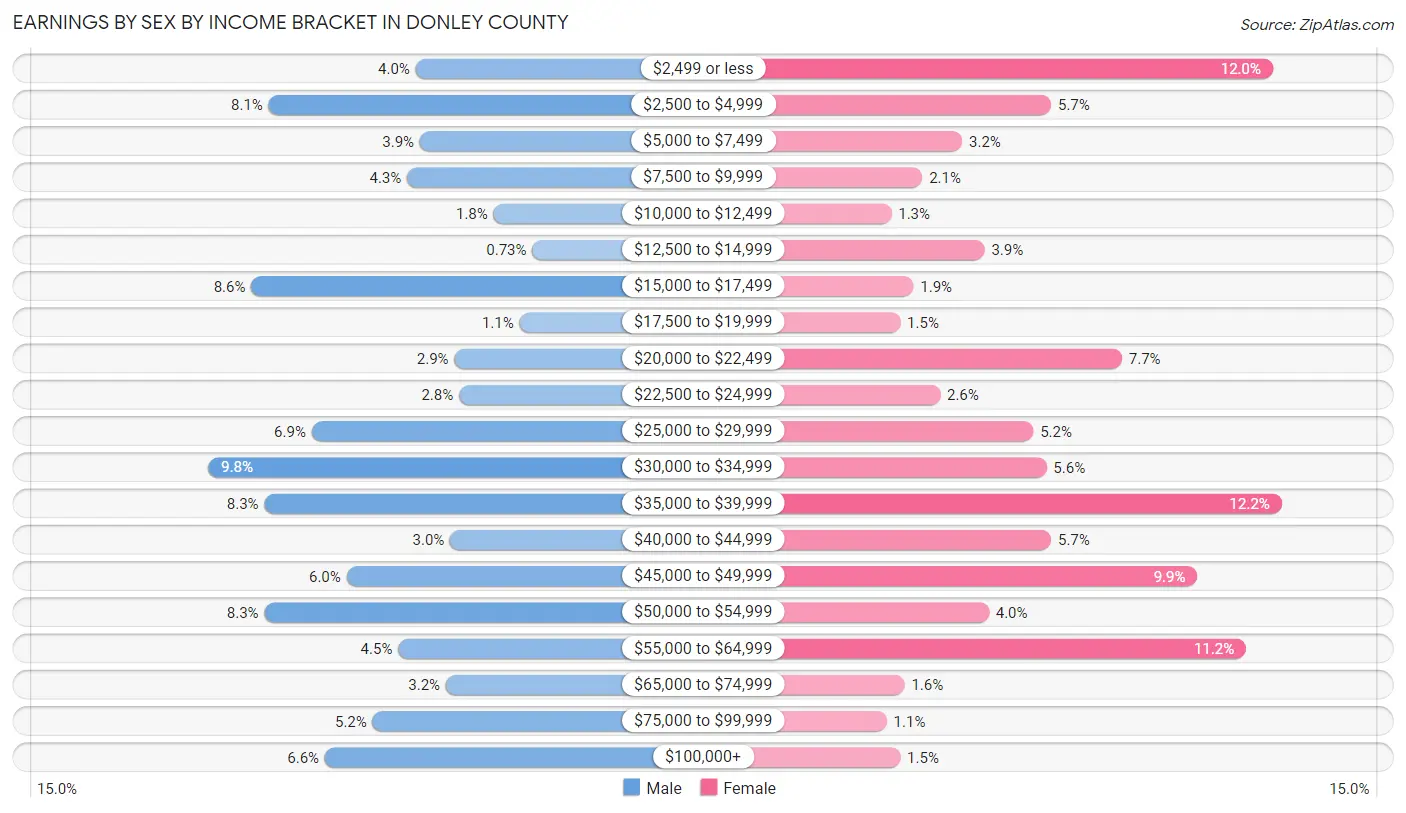
Earnings by Sex by Income Bracket in Donley County
The most common earnings brackets in Donley County are $30,000 to $34,999 for men (81 | 9.8%) and $35,000 to $39,999 for women (98 | 12.2%).
| Income | Male | Female |
| $2,499 or less | 33 (4.0%) | 96 (12.0%) |
| $2,500 to $4,999 | 67 (8.1%) | 46 (5.7%) |
| $5,000 to $7,499 | 32 (3.9%) | 26 (3.2%) |
| $7,500 to $9,999 | 35 (4.3%) | 17 (2.1%) |
| $10,000 to $12,499 | 15 (1.8%) | 10 (1.3%) |
| $12,500 to $14,999 | 6 (0.7%) | 31 (3.9%) |
| $15,000 to $17,499 | 71 (8.6%) | 15 (1.9%) |
| $17,500 to $19,999 | 9 (1.1%) | 12 (1.5%) |
| $20,000 to $22,499 | 24 (2.9%) | 62 (7.7%) |
| $22,500 to $24,999 | 23 (2.8%) | 21 (2.6%) |
| $25,000 to $29,999 | 57 (6.9%) | 42 (5.2%) |
| $30,000 to $34,999 | 81 (9.8%) | 45 (5.6%) |
| $35,000 to $39,999 | 68 (8.3%) | 98 (12.2%) |
| $40,000 to $44,999 | 25 (3.0%) | 46 (5.7%) |
| $45,000 to $49,999 | 49 (5.9%) | 79 (9.9%) |
| $50,000 to $54,999 | 68 (8.3%) | 32 (4.0%) |
| $55,000 to $64,999 | 37 (4.5%) | 90 (11.2%) |
| $65,000 to $74,999 | 26 (3.2%) | 13 (1.6%) |
| $75,000 to $99,999 | 43 (5.2%) | 9 (1.1%) |
| $100,000+ | 54 (6.6%) | 12 (1.5%) |
| Total | 823 (100.0%) | 802 (100.0%) |
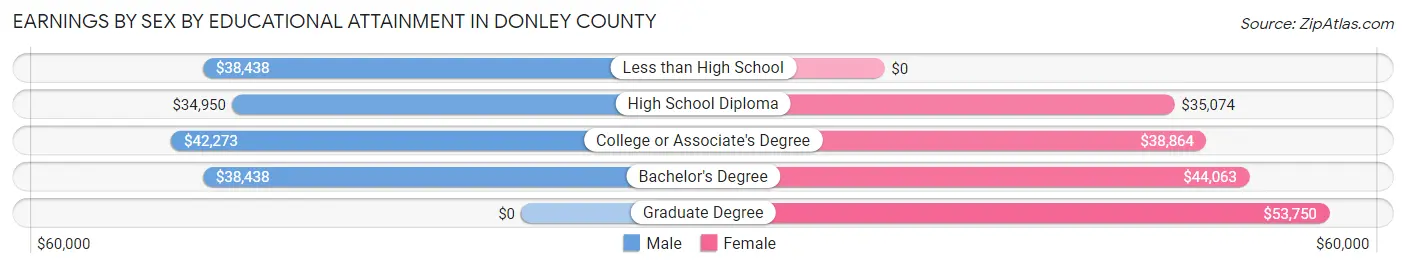
Earnings by Sex by Educational Attainment in Donley County
Average earnings in Donley County are $40,167 for men and $36,278 for women, a difference of 9.7%. Men with an educational attainment of college or associate's degree enjoy the highest average annual earnings of $42,273, while those with high school diploma education earn the least with $34,950. Women with an educational attainment of graduate degree earn the most with the average annual earnings of $53,750, while those with high school diploma education have the smallest earnings of $35,074.
| Educational Attainment | Male Income | Female Income |
| Less than High School | $38,438 | $0 |
| High School Diploma | $34,950 | $35,074 |
| College or Associate's Degree | $42,273 | $38,864 |
| Bachelor's Degree | $38,438 | $44,063 |
| Graduate Degree | - | - |
| Total | $40,167 | $36,278 |
Family Income in Donley County
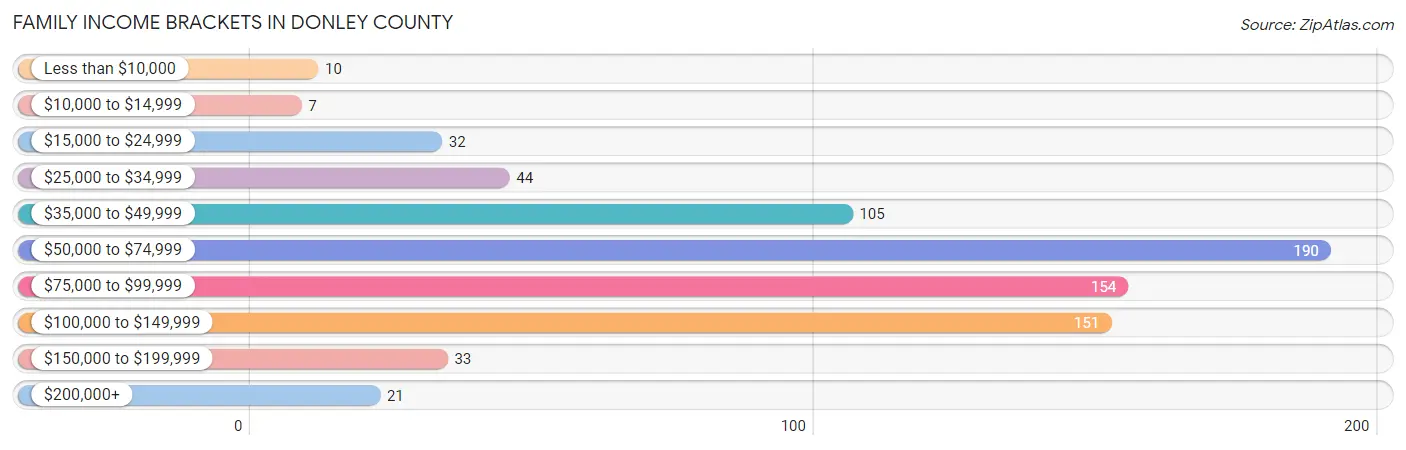
Family Income Brackets in Donley County
According to the Donley County family income data, there are 190 families falling into the $50,000 to $74,999 income range, which is the most common income bracket and makes up 25.4% of all families. Conversely, the $10,000 to $14,999 income bracket is the least frequent group with only 7 families (0.9%) belonging to this category.
| Income Bracket | # Families | % Families |
| Less than $10,000 | 10 | 1.3% |
| $10,000 to $14,999 | 7 | 0.9% |
| $15,000 to $24,999 | 32 | 4.3% |
| $25,000 to $34,999 | 44 | 5.9% |
| $35,000 to $49,999 | 105 | 14.1% |
| $50,000 to $74,999 | 190 | 25.4% |
| $75,000 to $99,999 | 154 | 20.6% |
| $100,000 to $149,999 | 151 | 20.2% |
| $150,000 to $199,999 | 33 | 4.4% |
| $200,000+ | 21 | 2.8% |
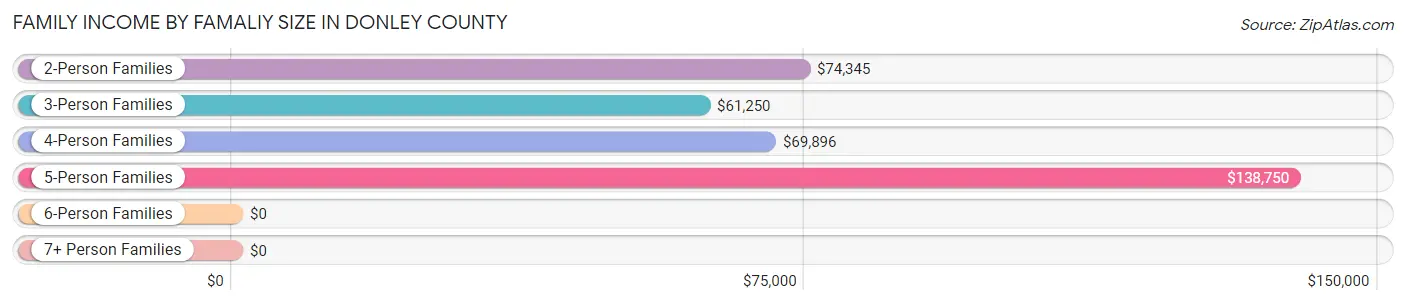
Family Income by Famaliy Size in Donley County
5-person families (32 | 4.3%) account for the highest median family income in Donley County with $138,750 per family, while 2-person families (505 | 67.6%) have the highest median income of $37,172 per family member.
| Income Bracket | # Families | Median Income |
| 2-Person Families | 505 (67.6%) | $74,345 |
| 3-Person Families | 92 (12.3%) | $61,250 |
| 4-Person Families | 81 (10.8%) | $69,896 |
| 5-Person Families | 32 (4.3%) | $138,750 |
| 6-Person Families | 19 (2.5%) | $0 |
| 7+ Person Families | 18 (2.4%) | $0 |
| Total | 747 (100.0%) | $73,352 |
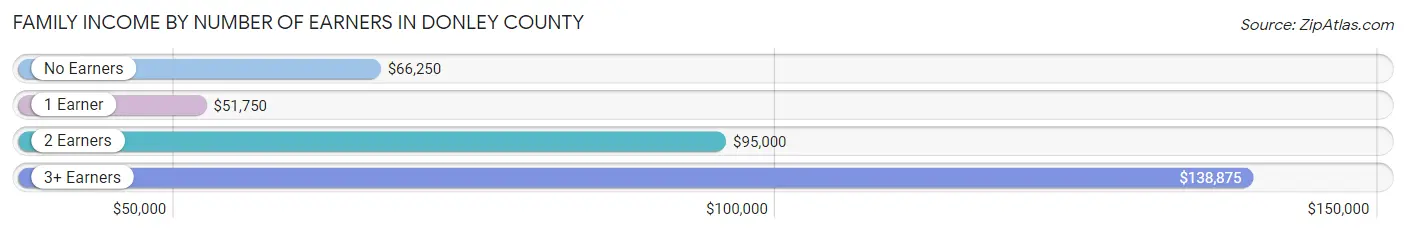
Family Income by Number of Earners in Donley County
The median family income in Donley County is $73,352, with families comprising 3+ earners (37) having the highest median family income of $138,875, while families with 1 earner (227) have the lowest median family income of $51,750, accounting for 5.0% and 30.4% of families, respectively.
| Number of Earners | # Families | Median Income |
| No Earners | 171 (22.9%) | $66,250 |
| 1 Earner | 227 (30.4%) | $51,750 |
| 2 Earners | 312 (41.8%) | $95,000 |
| 3+ Earners | 37 (5.0%) | $138,875 |
| Total | 747 (100.0%) | $73,352 |
Household Income in Donley County
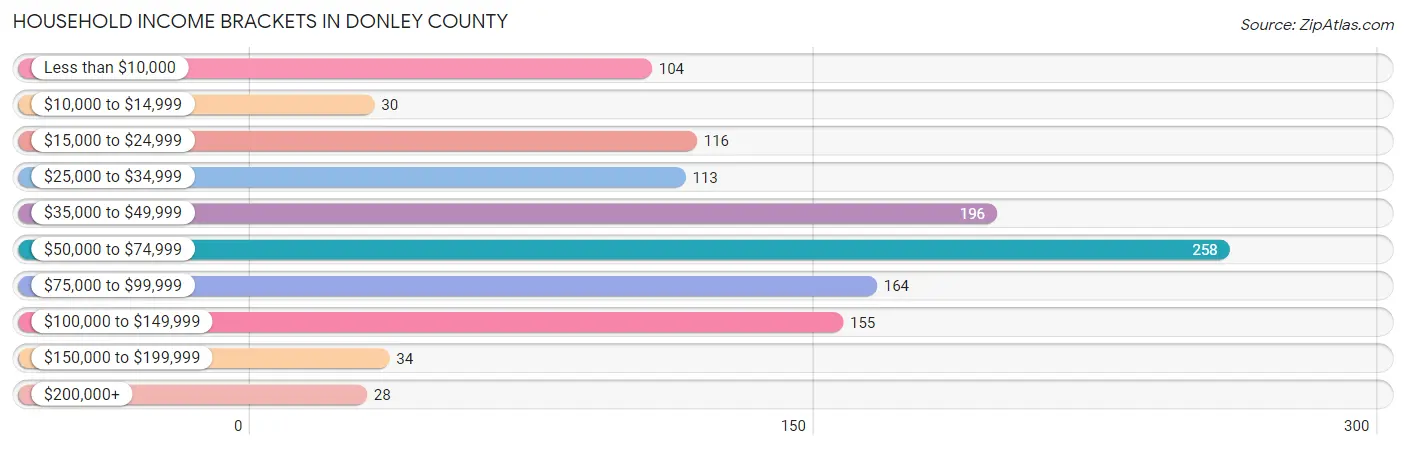
Household Income Brackets in Donley County
With 258 households falling in the category, the $50,000 to $74,999 income range is the most frequent in Donley County, accounting for 21.5% of all households. In contrast, only 28 households (2.3%) fall into the $200,000+ income bracket, making it the least populous group.
| Income Bracket | # Households | % Households |
| Less than $10,000 | 104 | 8.7% |
| $10,000 to $14,999 | 30 | 2.5% |
| $15,000 to $24,999 | 116 | 9.7% |
| $25,000 to $34,999 | 113 | 9.4% |
| $35,000 to $49,999 | 196 | 16.4% |
| $50,000 to $74,999 | 258 | 21.5% |
| $75,000 to $99,999 | 164 | 13.7% |
| $100,000 to $149,999 | 155 | 12.9% |
| $150,000 to $199,999 | 34 | 2.8% |
| $200,000+ | 28 | 2.3% |
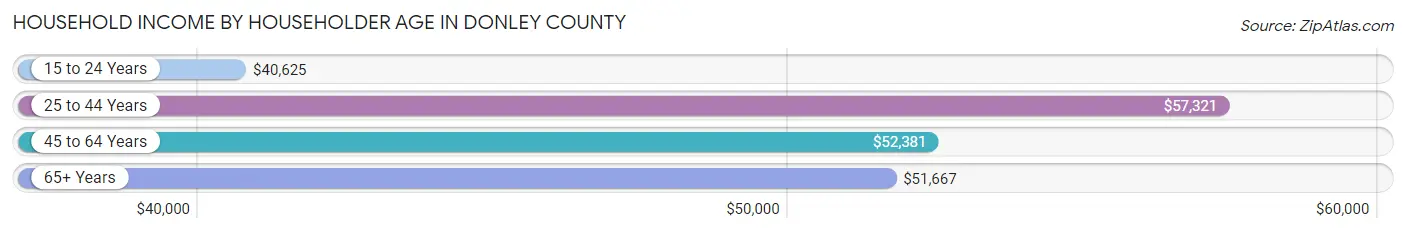
Household Income by Householder Age in Donley County
The median household income in Donley County is $51,711, with the highest median household income of $57,321 found in the 25 to 44 years age bracket for the primary householder. A total of 271 households (22.6%) fall into this category. Meanwhile, the 15 to 24 years age bracket for the primary householder has the lowest median household income of $40,625, with 55 households (4.6%) in this group.
| Income Bracket | # Households | Median Income |
| 15 to 24 Years | 55 (4.6%) | $40,625 |
| 25 to 44 Years | 271 (22.6%) | $57,321 |
| 45 to 64 Years | 414 (34.6%) | $52,381 |
| 65+ Years | 458 (38.2%) | $51,667 |
| Total | 1,198 (100.0%) | $51,711 |
Poverty in Donley County
Income Below Poverty by Sex and Age in Donley County
With 7.9% poverty level for males and 14.9% for females among the residents of Donley County, 5 year old males and 6 to 11 year old females are the most vulnerable to poverty, with 2 males (66.7%) and 39 females (42.9%) in their respective age groups living below the poverty level.
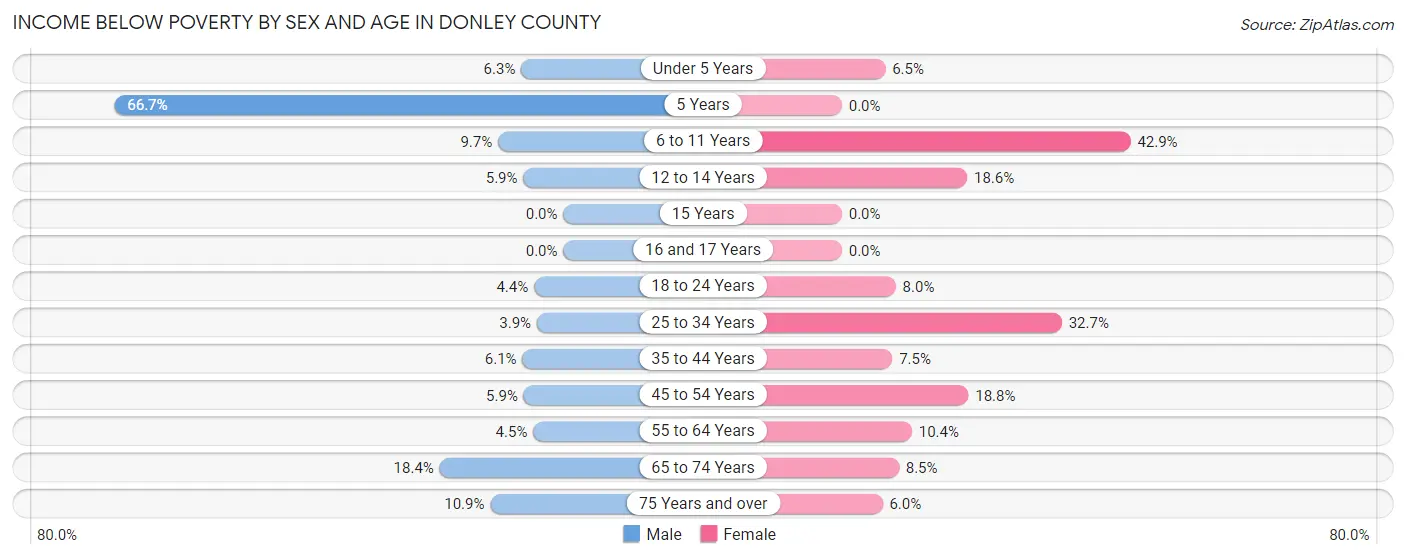
| Age Bracket | Male | Female |
| Under 5 Years | 6 (6.2%) | 2 (6.5%) |
| 5 Years | 2 (66.7%) | 0 (0.0%) |
| 6 to 11 Years | 16 (9.7%) | 39 (42.9%) |
| 12 to 14 Years | 6 (5.9%) | 8 (18.6%) |
| 15 Years | 0 (0.0%) | 0 (0.0%) |
| 16 and 17 Years | 0 (0.0%) | 0 (0.0%) |
| 18 to 24 Years | 7 (4.3%) | 8 (8.0%) |
| 25 to 34 Years | 2 (3.9%) | 65 (32.7%) |
| 35 to 44 Years | 9 (6.1%) | 14 (7.5%) |
| 45 to 54 Years | 9 (5.9%) | 31 (18.8%) |
| 55 to 64 Years | 11 (4.5%) | 18 (10.4%) |
| 65 to 74 Years | 36 (18.4%) | 22 (8.5%) |
| 75 Years and over | 14 (10.8%) | 9 (6.0%) |
| Total | 118 (7.9%) | 216 (14.9%) |
Income Above Poverty by Sex and Age in Donley County
According to the poverty statistics in Donley County, males aged 15 years and females aged 5 years are the age groups that are most secure financially, with 100.0% of males and 100.0% of females in these age groups living above the poverty line.
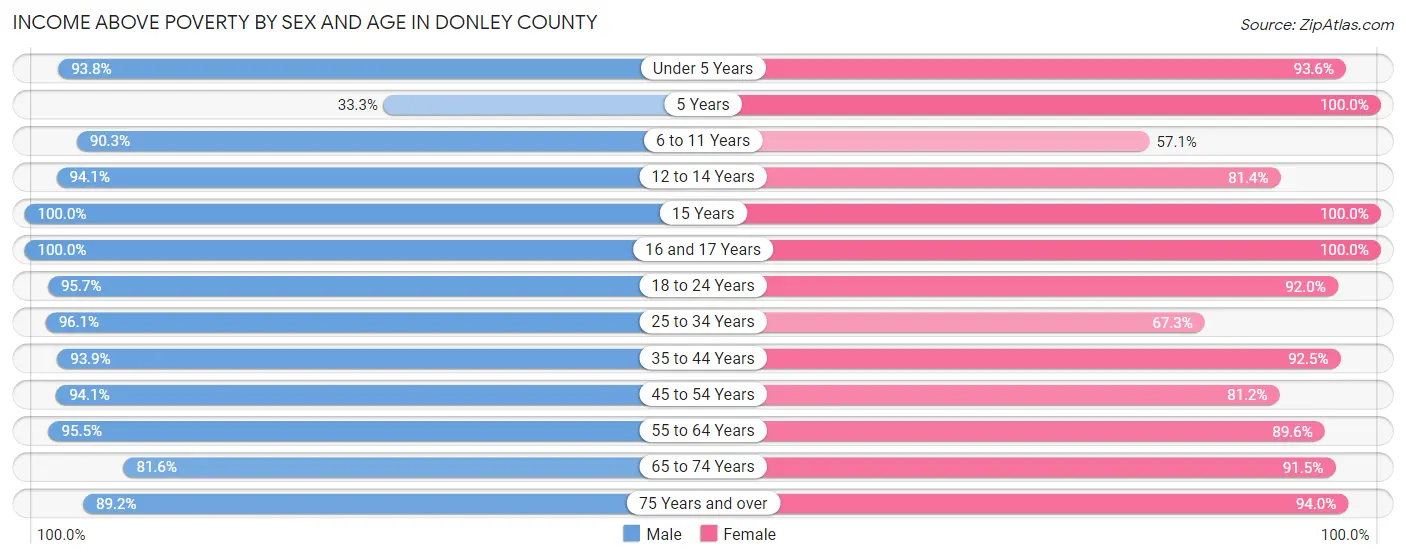
| Age Bracket | Male | Female |
| Under 5 Years | 90 (93.8%) | 29 (93.5%) |
| 5 Years | 1 (33.3%) | 22 (100.0%) |
| 6 to 11 Years | 149 (90.3%) | 52 (57.1%) |
| 12 to 14 Years | 95 (94.1%) | 35 (81.4%) |
| 15 Years | 32 (100.0%) | 14 (100.0%) |
| 16 and 17 Years | 18 (100.0%) | 20 (100.0%) |
| 18 to 24 Years | 154 (95.7%) | 92 (92.0%) |
| 25 to 34 Years | 49 (96.1%) | 134 (67.3%) |
| 35 to 44 Years | 139 (93.9%) | 173 (92.5%) |
| 45 to 54 Years | 144 (94.1%) | 134 (81.2%) |
| 55 to 64 Years | 235 (95.5%) | 155 (89.6%) |
| 65 to 74 Years | 160 (81.6%) | 238 (91.5%) |
| 75 Years and over | 115 (89.1%) | 140 (94.0%) |
| Total | 1,381 (92.1%) | 1,238 (85.1%) |
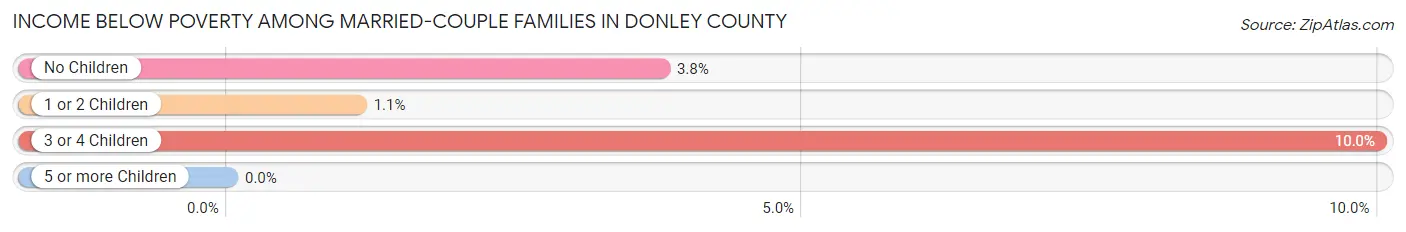
Income Below Poverty Among Married-Couple Families in Donley County
The poverty statistics for married-couple families in Donley County show that 3.6% or 22 of the total 606 families live below the poverty line. Families with 3 or 4 children have the highest poverty rate of 10.0%, comprising of 3 families. On the other hand, families with 5 or more children have the lowest poverty rate of 0.0%, which includes 0 families.
| Children | Above Poverty | Below Poverty |
| No Children | 461 (96.2%) | 18 (3.8%) |
| 1 or 2 Children | 88 (98.9%) | 1 (1.1%) |
| 3 or 4 Children | 27 (90.0%) | 3 (10.0%) |
| 5 or more Children | 8 (100.0%) | 0 (0.0%) |
| Total | 584 (96.4%) | 22 (3.6%) |
Income Below Poverty Among Single-Parent Households in Donley County
According to the poverty data in Donley County, 28.6% or 8 single-father households and 6.2% or 7 single-mother households are living below the poverty line. Among single-father households, those with 5 or more children have the highest poverty rate, with 8 households (100.0%) experiencing poverty. Likewise, among single-mother households, those with no children have the highest poverty rate, with 3 households (7.0%) falling below the poverty line.
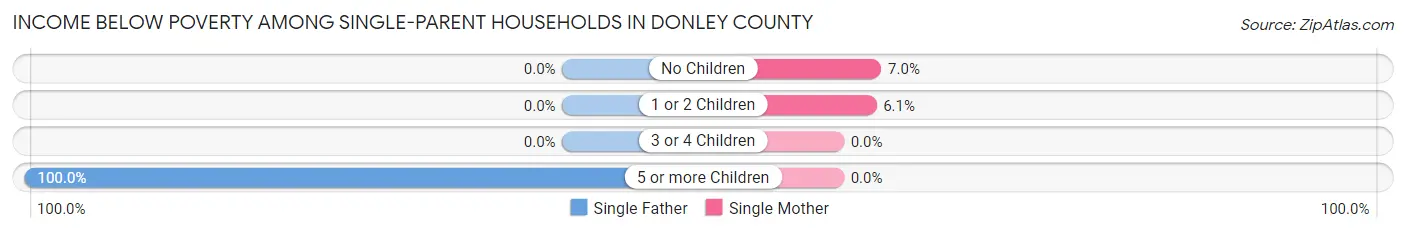
| Children | Single Father | Single Mother |
| No Children | 0 (0.0%) | 3 (7.0%) |
| 1 or 2 Children | 0 (0.0%) | 4 (6.1%) |
| 3 or 4 Children | 0 (0.0%) | 0 (0.0%) |
| 5 or more Children | 8 (100.0%) | 0 (0.0%) |
| Total | 8 (28.6%) | 7 (6.2%) |
Income Below Poverty Among Married-Couple vs Single-Parent Households in Donley County
The poverty data for Donley County shows that 22 of the married-couple family households (3.6%) and 15 of the single-parent households (10.6%) are living below the poverty level. Within the married-couple family households, those with 3 or 4 children have the highest poverty rate, with 3 households (10.0%) falling below the poverty line. Among the single-parent households, those with 5 or more children have the highest poverty rate, with 8 household (100.0%) living below poverty.
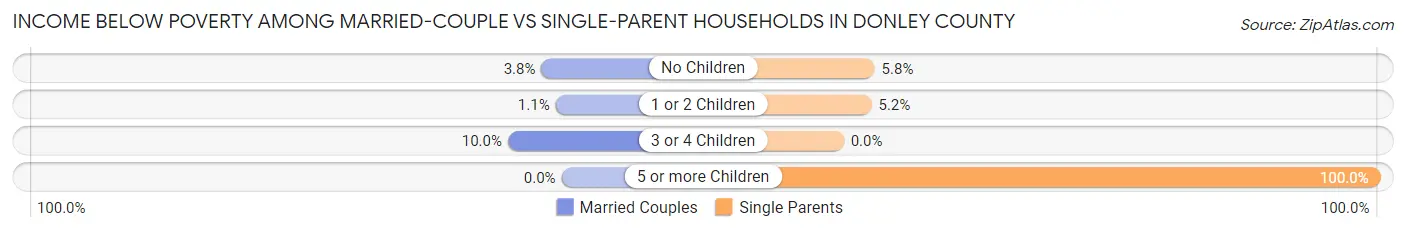
| Children | Married-Couple Families | Single-Parent Households |
| No Children | 18 (3.8%) | 3 (5.8%) |
| 1 or 2 Children | 1 (1.1%) | 4 (5.2%) |
| 3 or 4 Children | 3 (10.0%) | 0 (0.0%) |
| 5 or more Children | 0 (0.0%) | 8 (100.0%) |
| Total | 22 (3.6%) | 15 (10.6%) |
Race in Donley County
The most populous races in Donley County are White / Caucasian (2,765 | 83.8%), Hispanic or Latino (411 | 12.5%), and Black / African American (217 | 6.6%).
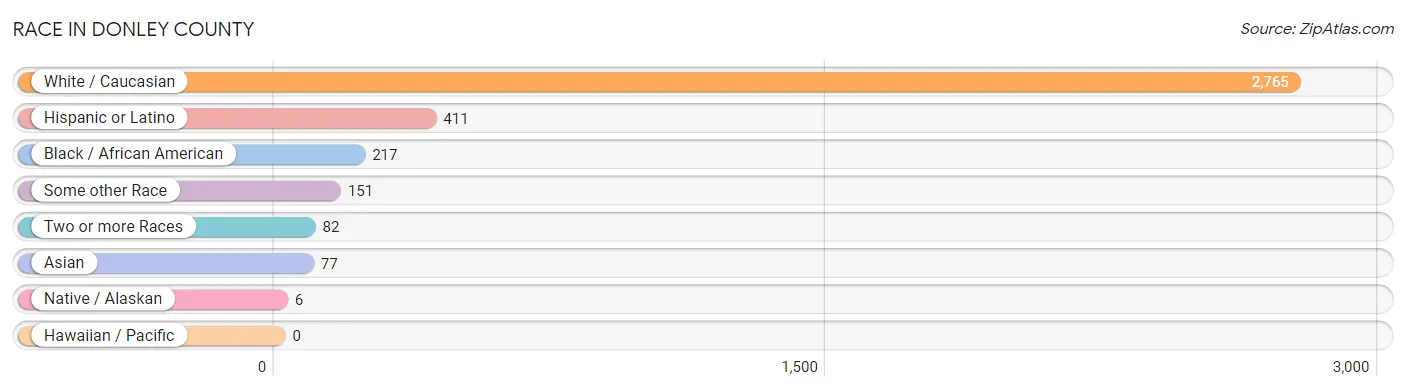
| Race | # Population | % Population |
| Asian | 77 | 2.3% |
| Black / African American | 217 | 6.6% |
| Hawaiian / Pacific | 0 | 0.0% |
| Hispanic or Latino | 411 | 12.5% |
| Native / Alaskan | 6 | 0.2% |
| White / Caucasian | 2,765 | 83.8% |
| Two or more Races | 82 | 2.5% |
| Some other Race | 151 | 4.6% |
| Total | 3,298 | 100.0% |
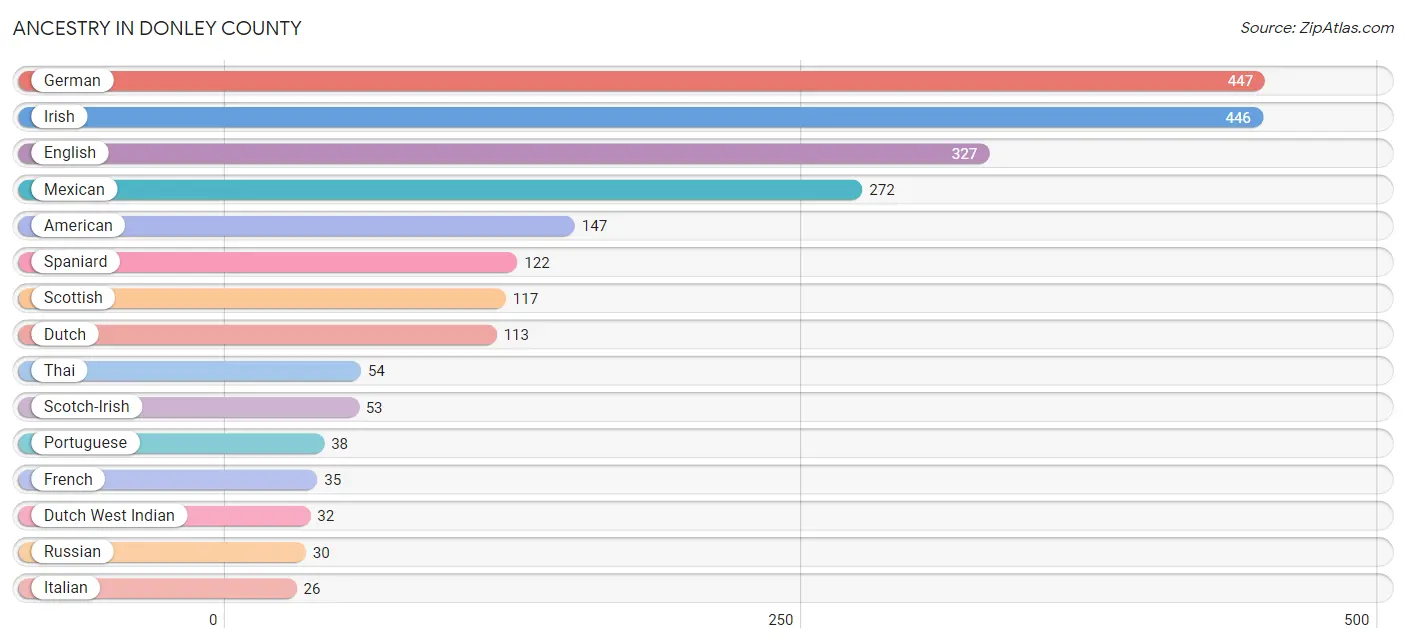
Ancestry in Donley County
The most populous ancestries reported in Donley County are German (447 | 13.6%), Irish (446 | 13.5%), English (327 | 9.9%), Mexican (272 | 8.3%), and American (147 | 4.5%), together accounting for 49.7% of all Donley County residents.
| Ancestry | # Population | % Population |
| African | 1 | 0.0% |
| American | 147 | 4.5% |
| Arab | 11 | 0.3% |
| Belgian | 3 | 0.1% |
| Bhutanese | 1 | 0.0% |
| Burmese | 2 | 0.1% |
| Cajun | 7 | 0.2% |
| Central American | 1 | 0.0% |
| Central American Indian | 2 | 0.1% |
| Cherokee | 11 | 0.3% |
| Choctaw | 1 | 0.0% |
| Danish | 1 | 0.0% |
| Dutch | 113 | 3.4% |
| Dutch West Indian | 32 | 1.0% |
| English | 327 | 9.9% |
| European | 15 | 0.4% |
| French | 35 | 1.1% |
| German | 447 | 13.6% |
| Irish | 446 | 13.5% |
| Italian | 26 | 0.8% |
| Korean | 2 | 0.1% |
| Lebanese | 11 | 0.3% |
| Macedonian | 1 | 0.0% |
| Malaysian | 20 | 0.6% |
| Mexican | 272 | 8.3% |
| Native Hawaiian | 2 | 0.1% |
| Navajo | 1 | 0.0% |
| Norwegian | 2 | 0.1% |
| Panamanian | 1 | 0.0% |
| Polish | 15 | 0.4% |
| Portuguese | 38 | 1.1% |
| Puerto Rican | 1 | 0.0% |
| Russian | 30 | 0.9% |
| Scotch-Irish | 53 | 1.6% |
| Scottish | 117 | 3.5% |
| Spaniard | 122 | 3.7% |
| Spanish | 2 | 0.1% |
| Subsaharan African | 1 | 0.0% |
| Thai | 54 | 1.6% |
| West Indian | 1 | 0.0% |
| Yaqui | 1 | 0.0% |
| Yugoslavian | 3 | 0.1% | View All 42 Rows |
Immigrants in Donley County
The most numerous immigrant groups reported in Donley County came from Central America (56 | 1.7%), Latin America (56 | 1.7%), Mexico (56 | 1.7%), Asia (51 | 1.5%), and India (28 | 0.9%), together accounting for 7.5% of all Donley County residents.
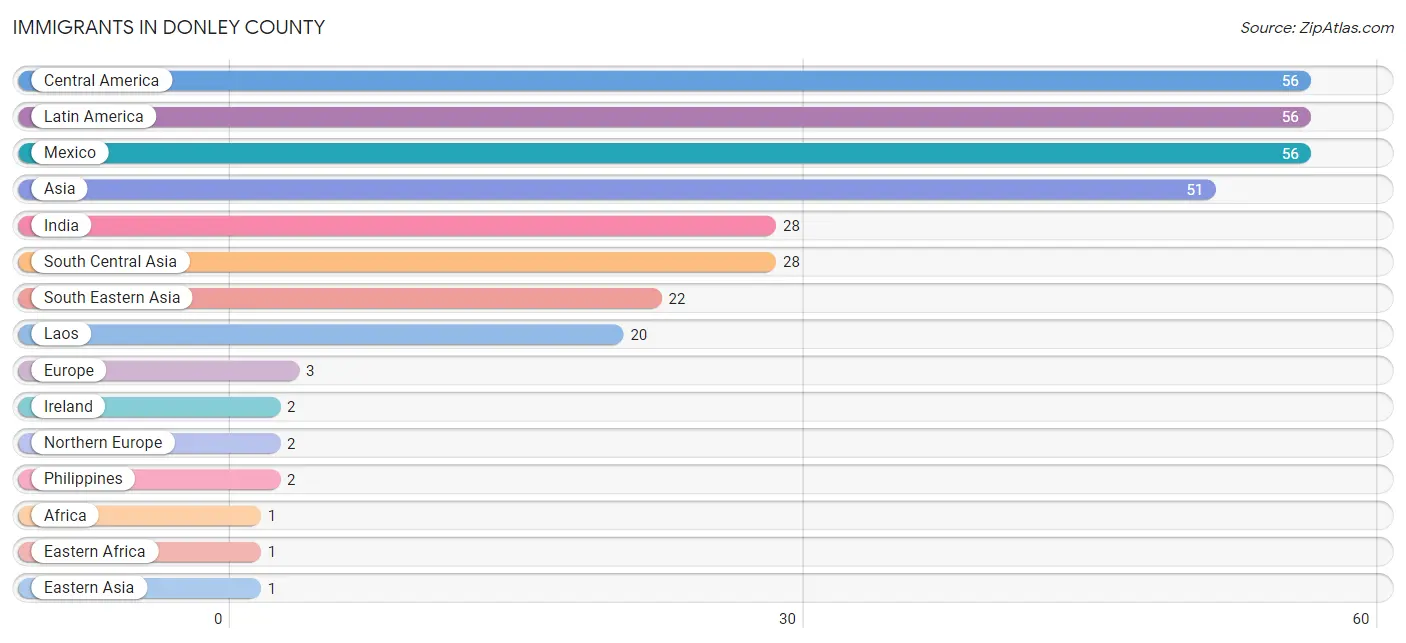
| Immigration Origin | # Population | % Population |
| Africa | 1 | 0.0% |
| Asia | 51 | 1.5% |
| Central America | 56 | 1.7% |
| Eastern Africa | 1 | 0.0% |
| Eastern Asia | 1 | 0.0% |
| Eastern Europe | 1 | 0.0% |
| Ethiopia | 1 | 0.0% |
| Europe | 3 | 0.1% |
| India | 28 | 0.9% |
| Ireland | 2 | 0.1% |
| Korea | 1 | 0.0% |
| Laos | 20 | 0.6% |
| Latin America | 56 | 1.7% |
| Mexico | 56 | 1.7% |
| North Macedonia | 1 | 0.0% |
| Northern Europe | 2 | 0.1% |
| Philippines | 2 | 0.1% |
| South Central Asia | 28 | 0.9% |
| South Eastern Asia | 22 | 0.7% | View All 19 Rows |
Sex and Age in Donley County
Sex and Age in Donley County
The most populous age groups in Donley County are 15 to 19 Years (250 | 15.0%) for men and 25 to 29 Years (166 | 10.2%) for women.
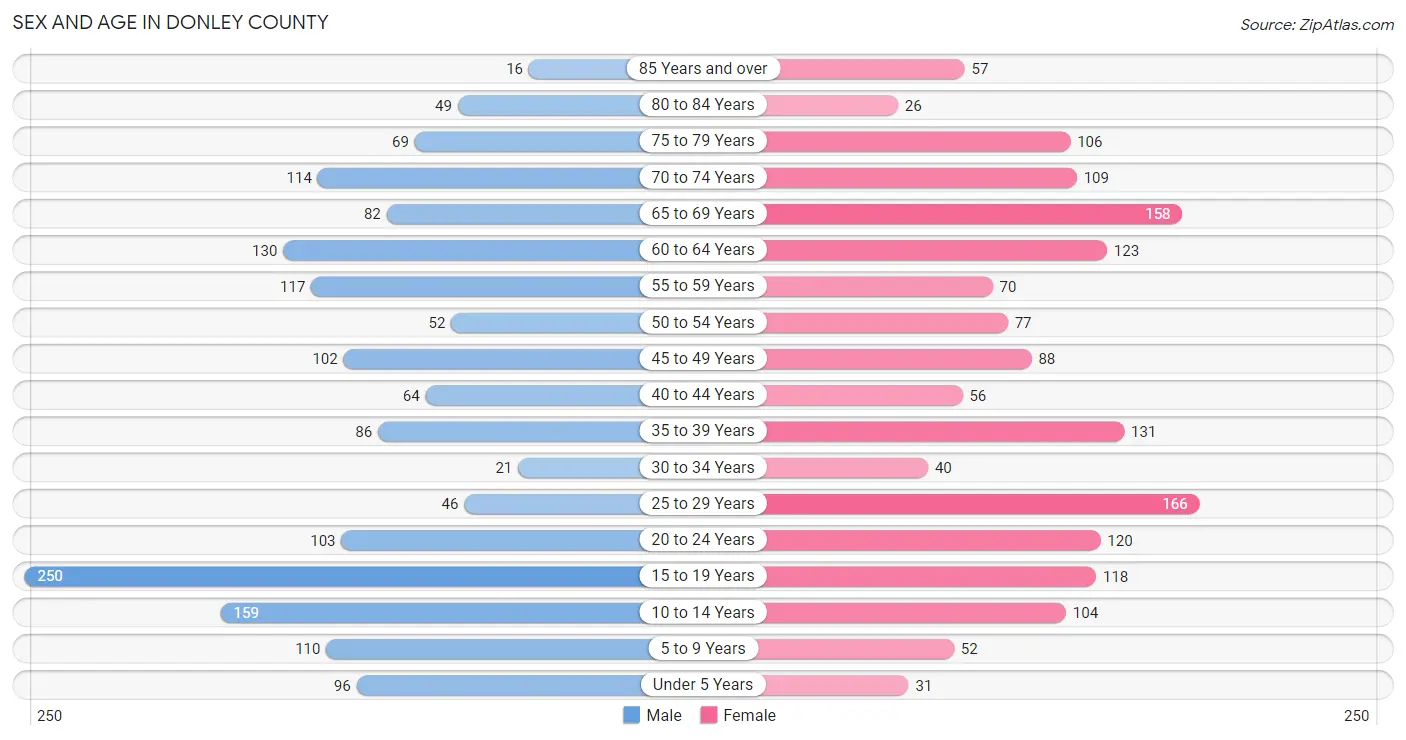
| Age Bracket | Male | Female |
| Under 5 Years | 96 (5.8%) | 31 (1.9%) |
| 5 to 9 Years | 110 (6.6%) | 52 (3.2%) |
| 10 to 14 Years | 159 (9.5%) | 104 (6.4%) |
| 15 to 19 Years | 250 (15.0%) | 118 (7.2%) |
| 20 to 24 Years | 103 (6.2%) | 120 (7.3%) |
| 25 to 29 Years | 46 (2.8%) | 166 (10.2%) |
| 30 to 34 Years | 21 (1.3%) | 40 (2.5%) |
| 35 to 39 Years | 86 (5.2%) | 131 (8.0%) |
| 40 to 44 Years | 64 (3.8%) | 56 (3.4%) |
| 45 to 49 Years | 102 (6.1%) | 88 (5.4%) |
| 50 to 54 Years | 52 (3.1%) | 77 (4.7%) |
| 55 to 59 Years | 117 (7.0%) | 70 (4.3%) |
| 60 to 64 Years | 130 (7.8%) | 123 (7.5%) |
| 65 to 69 Years | 82 (4.9%) | 158 (9.7%) |
| 70 to 74 Years | 114 (6.8%) | 109 (6.7%) |
| 75 to 79 Years | 69 (4.1%) | 106 (6.5%) |
| 80 to 84 Years | 49 (2.9%) | 26 (1.6%) |
| 85 Years and over | 16 (1.0%) | 57 (3.5%) |
| Total | 1,666 (100.0%) | 1,632 (100.0%) |
Families and Households in Donley County
Median Family Size in Donley County
The median family size in Donley County is 3.16 persons per family, with single male/father families (28 | 3.7%) accounting for the largest median family size of 5.21 persons per family. On the other hand, married-couple families (606 | 81.1%) represent the smallest median family size with 3.07 persons per family.
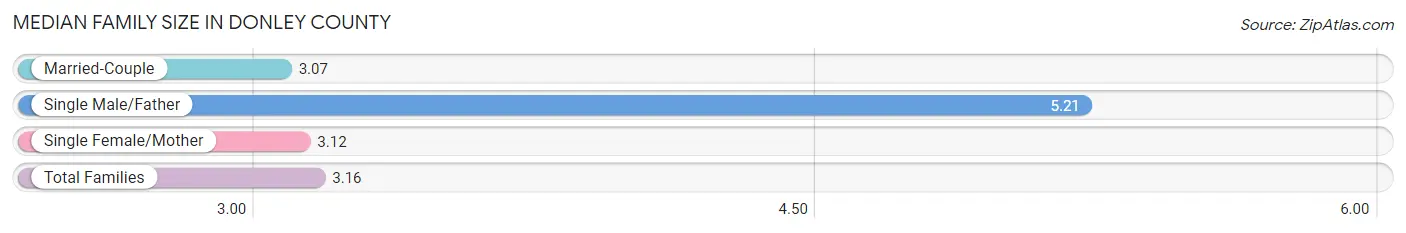
| Family Type | # Families | Family Size |
| Married-Couple | 606 (81.1%) | 3.07 |
| Single Male/Father | 28 (3.7%) | 5.21 |
| Single Female/Mother | 113 (15.1%) | 3.12 |
| Total Families | 747 (100.0%) | 3.16 |
Median Household Size in Donley County
The median household size in Donley County is 2.46 persons per household, with single male/father households (28 | 2.3%) accounting for the largest median household size of 5.82 persons per household. non-family households (451 | 37.7%) represent the smallest median household size with 1.25 persons per household.
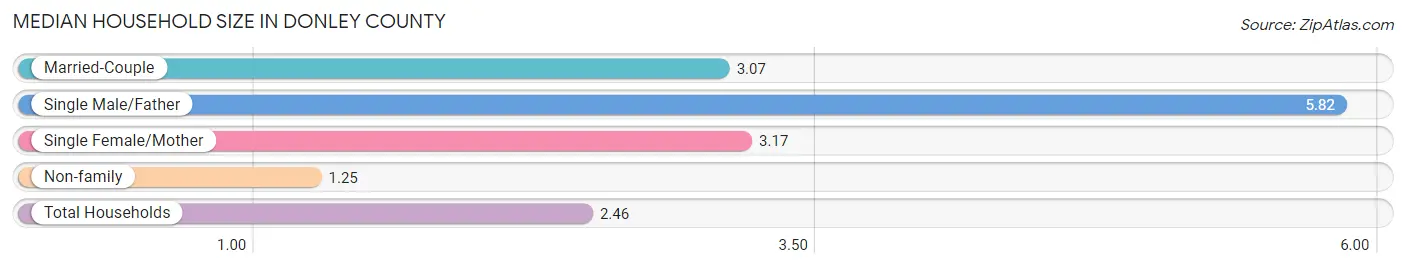
| Household Type | # Households | Household Size |
| Married-Couple | 606 (50.6%) | 3.07 |
| Single Male/Father | 28 (2.3%) | 5.82 |
| Single Female/Mother | 113 (9.4%) | 3.17 |
| Non-family | 451 (37.7%) | 1.25 |
| Total Households | 1,198 (100.0%) | 2.46 |
Household Size by Marriage Status in Donley County
Out of a total of 1,198 households in Donley County, 747 (62.4%) are family households, while 451 (37.7%) are nonfamily households. The most numerous type of family households are 2-person households, comprising 505, and the most common type of nonfamily households are 1-person households, comprising 383.
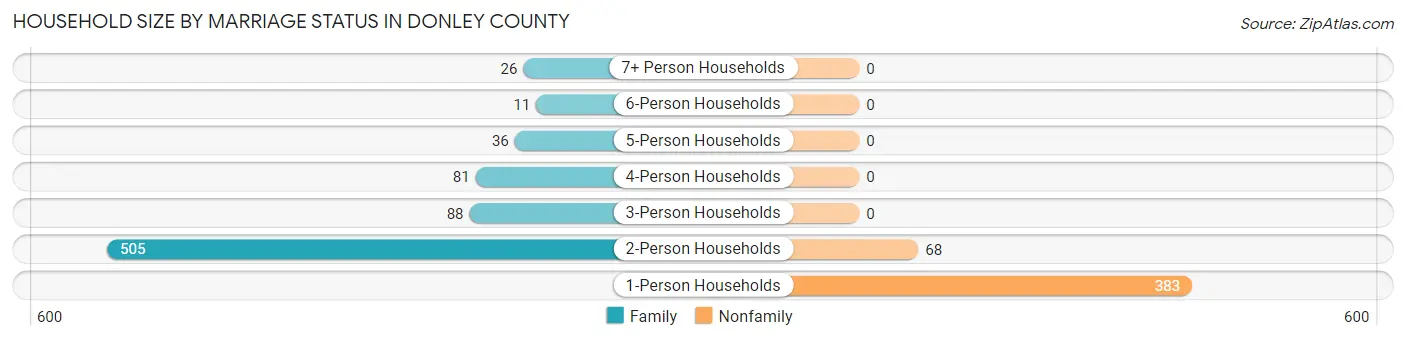
| Household Size | Family Households | Nonfamily Households |
| 1-Person Households | - | 383 (32.0%) |
| 2-Person Households | 505 (42.1%) | 68 (5.7%) |
| 3-Person Households | 88 (7.3%) | 0 (0.0%) |
| 4-Person Households | 81 (6.8%) | 0 (0.0%) |
| 5-Person Households | 36 (3.0%) | 0 (0.0%) |
| 6-Person Households | 11 (0.9%) | 0 (0.0%) |
| 7+ Person Households | 26 (2.2%) | 0 (0.0%) |
| Total | 747 (62.4%) | 451 (37.7%) |
Female Fertility in Donley County
Fertility by Age in Donley County
Average fertility rate in Donley County is 22.0 births per 1,000 women. Women in the age bracket of 35 to 50 years have the highest fertility rate with 27.0 births per 1,000 women. Women in the age bracket of 20 to 34 years acount for 50.0% of all women with births.
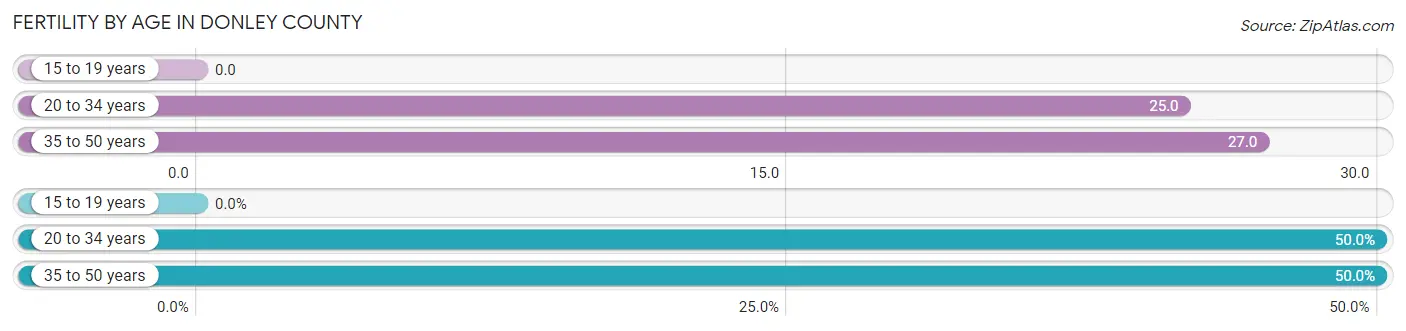
| Age Bracket | Women with Births | Births / 1,000 Women |
| 15 to 19 years | 0 (0.0%) | 0.0 |
| 20 to 34 years | 8 (50.0%) | 25.0 |
| 35 to 50 years | 8 (50.0%) | 27.0 |
| Total | 16 (100.0%) | 22.0 |
Fertility by Age by Marriage Status in Donley County
87.5% of women with births (16) in Donley County are married. The highest percentage of unmarried women with births falls into 20 to 34 years age bracket with 25.0% of them unmarried at the time of birth, while the lowest percentage of unmarried women with births belong to 35 to 50 years age bracket with 0.0% of them unmarried.
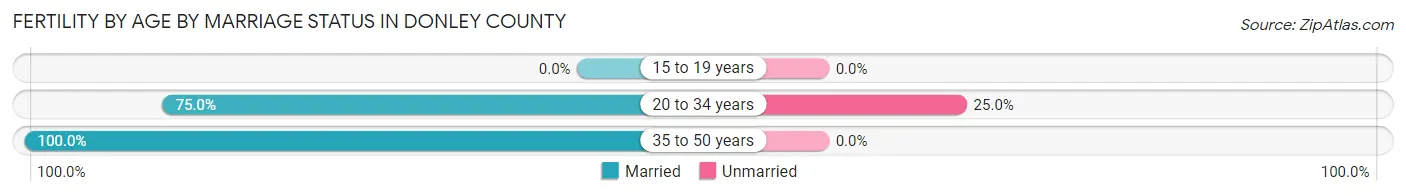
| Age Bracket | Married | Unmarried |
| 15 to 19 years | 0 (0.0%) | 0 (0.0%) |
| 20 to 34 years | 6 (75.0%) | 2 (25.0%) |
| 35 to 50 years | 8 (100.0%) | 0 (0.0%) |
| Total | 14 (87.5%) | 2 (12.5%) |
Fertility by Education in Donley County
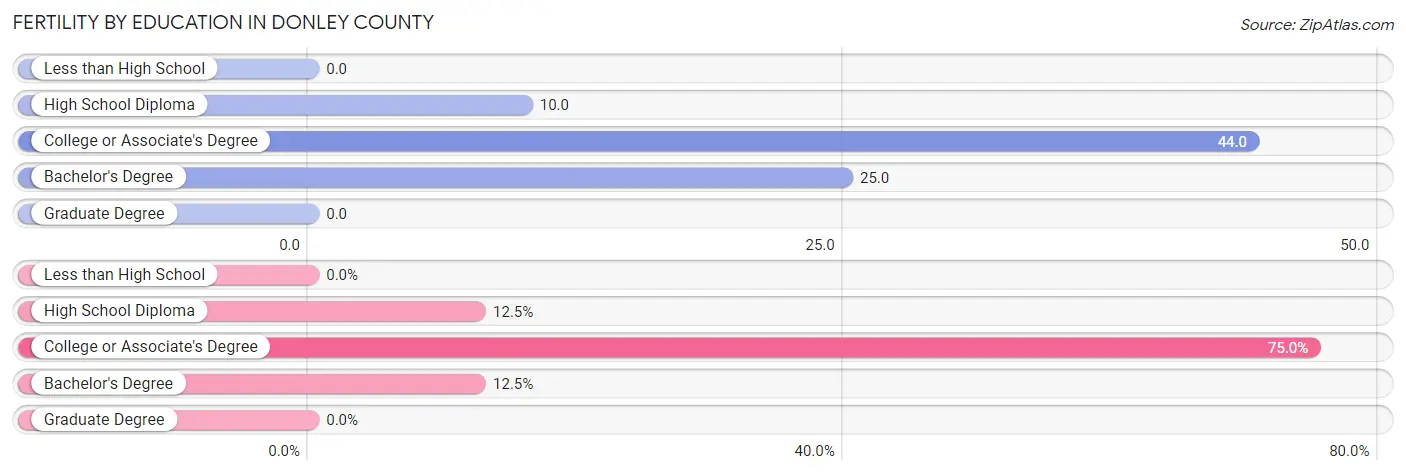
| Educational Attainment | Women with Births | Births / 1,000 Women |
| Less than High School | 0 (0.0%) | 0.0 |
| High School Diploma | 2 (12.5%) | 10.0 |
| College or Associate's Degree | 12 (75.0%) | 44.0 |
| Bachelor's Degree | 2 (12.5%) | 25.0 |
| Graduate Degree | 0 (0.0%) | 0.0 |
| Total | 16 (100.0%) | 22.0 |
Fertility by Education by Marriage Status in Donley County
12.5% of women with births in Donley County are unmarried. Women with the educational attainment of college or associate's degree are most likely to be married with 100.0% of them married at childbirth, while women with the educational attainment of high school diploma are least likely to be married with 100.0% of them unmarried at childbirth.
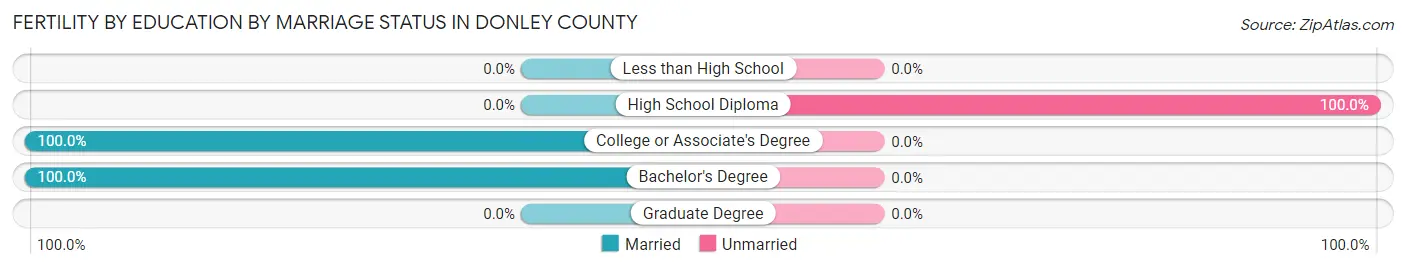
| Educational Attainment | Married | Unmarried |
| Less than High School | 0 (0.0%) | 0 (0.0%) |
| High School Diploma | 0 (0.0%) | 2 (100.0%) |
| College or Associate's Degree | 12 (100.0%) | 0 (0.0%) |
| Bachelor's Degree | 2 (100.0%) | 0 (0.0%) |
| Graduate Degree | 0 (0.0%) | 0 (0.0%) |
| Total | 14 (87.5%) | 2 (12.5%) |
Employment Characteristics in Donley County
Employment by Class of Employer in Donley County
Among the 1,383 employed individuals in Donley County, private company employees (696 | 50.3%), self-employed (not incorporated) (282 | 20.4%), and local government employees (142 | 10.3%) make up the most common classes of employment.
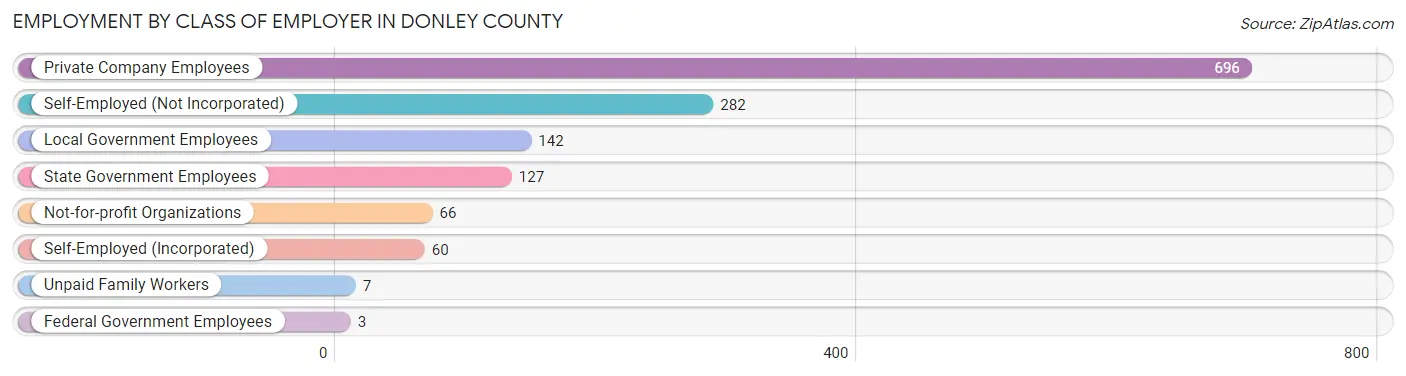
| Employer Class | # Employees | % Employees |
| Private Company Employees | 696 | 50.3% |
| Self-Employed (Incorporated) | 60 | 4.3% |
| Self-Employed (Not Incorporated) | 282 | 20.4% |
| Not-for-profit Organizations | 66 | 4.8% |
| Local Government Employees | 142 | 10.3% |
| State Government Employees | 127 | 9.2% |
| Federal Government Employees | 3 | 0.2% |
| Unpaid Family Workers | 7 | 0.5% |
| Total | 1,383 | 100.0% |
Employment Status by Age in Donley County
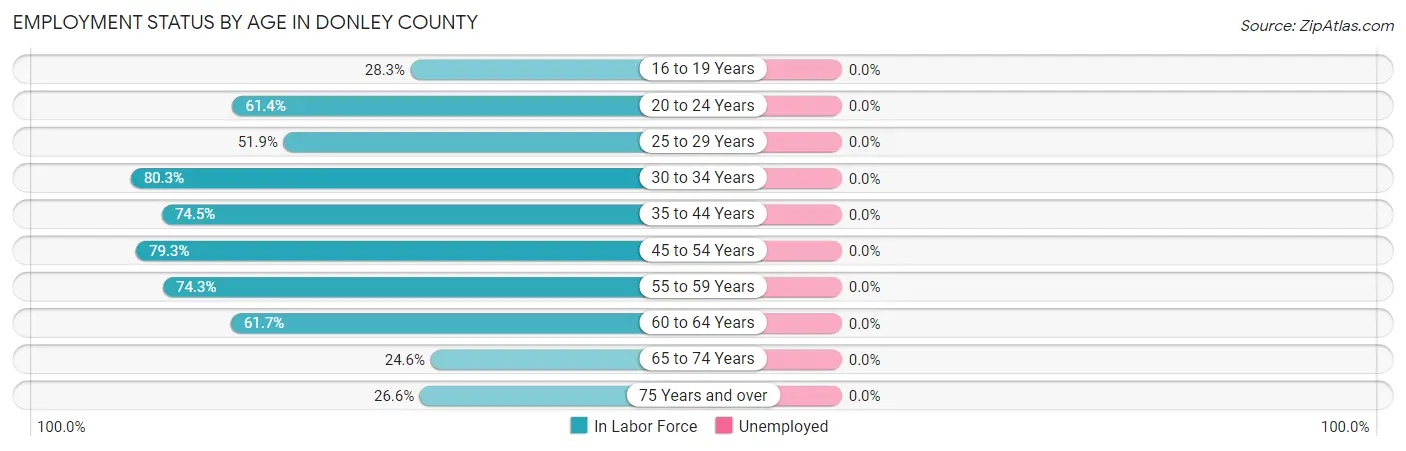
| Age Bracket | In Labor Force | Unemployed |
| 16 to 19 Years | 91 (28.3%) | 0 (0.0%) |
| 20 to 24 Years | 137 (61.4%) | 0 (0.0%) |
| 25 to 29 Years | 110 (51.9%) | 0 (0.0%) |
| 30 to 34 Years | 49 (80.3%) | 0 (0.0%) |
| 35 to 44 Years | 251 (74.5%) | 0 (0.0%) |
| 45 to 54 Years | 253 (79.3%) | 0 (0.0%) |
| 55 to 59 Years | 139 (74.3%) | 0 (0.0%) |
| 60 to 64 Years | 156 (61.7%) | 0 (0.0%) |
| 65 to 74 Years | 114 (24.6%) | 0 (0.0%) |
| 75 Years and over | 86 (26.6%) | 0 (0.0%) |
| Total | 1,385 (51.3%) | 0 (0.0%) |
Employment Status by Educational Attainment in Donley County
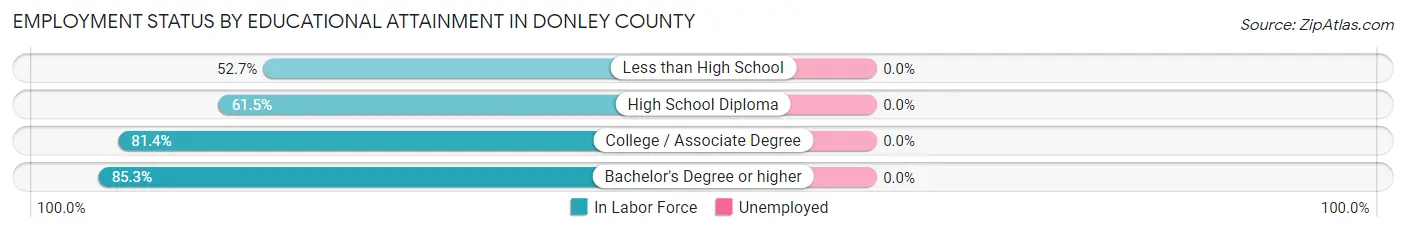
| Educational Attainment | In Labor Force | Unemployed |
| Less than High School | 109 (52.7%) | 0 (0.0%) |
| High School Diploma | 321 (61.5%) | 0 (0.0%) |
| College / Associate Degree | 377 (81.4%) | 0 (0.0%) |
| Bachelor's Degree or higher | 151 (85.3%) | 0 (0.0%) |
| Total | 958 (70.0%) | 0 (0.0%) |
Employment Occupations by Sex in Donley County
Management, Business, Science and Arts Occupations
The most common Management, Business, Science and Arts occupations in Donley County are Management (244 | 17.6%), Community & Social Service (138 | 10.0%), Education Instruction & Library (108 | 7.8%), Health Diagnosing & Treating (73 | 5.3%), and Health Technologists (23 | 1.7%).

Management, Business, Science and Arts Occupations by Sex
Within the Management, Business, Science and Arts occupations in Donley County, the most male-oriented occupations are Computers, Engineering & Science (100.0%), Computers & Mathematics (100.0%), and Architecture & Engineering (100.0%), while the most female-oriented occupations are Business & Financial (100.0%), Education, Arts & Media (100.0%), and Arts, Media & Entertainment (100.0%).
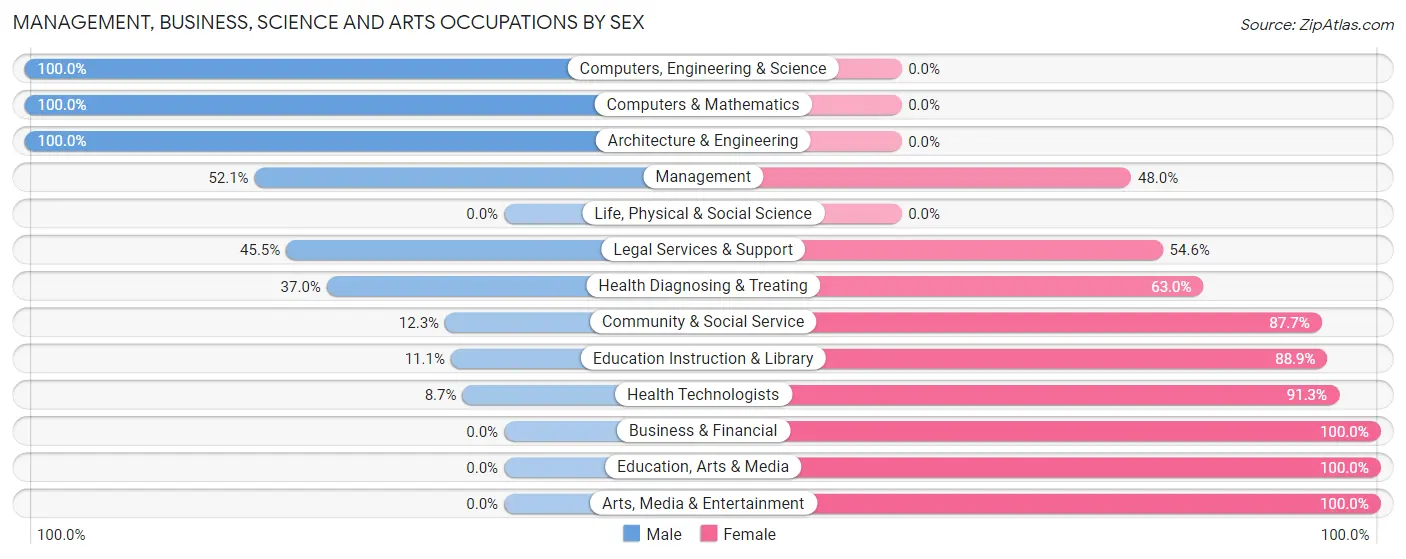
| Occupation | Male | Female |
| Management | 127 (52.0%) | 117 (47.9%) |
| Business & Financial | 0 (0.0%) | 4 (100.0%) |
| Computers, Engineering & Science | 14 (100.0%) | 0 (0.0%) |
| Computers & Mathematics | 3 (100.0%) | 0 (0.0%) |
| Architecture & Engineering | 11 (100.0%) | 0 (0.0%) |
| Life, Physical & Social Science | 0 (0.0%) | 0 (0.0%) |
| Community & Social Service | 17 (12.3%) | 121 (87.7%) |
| Education, Arts & Media | 0 (0.0%) | 11 (100.0%) |
| Legal Services & Support | 5 (45.5%) | 6 (54.5%) |
| Education Instruction & Library | 12 (11.1%) | 96 (88.9%) |
| Arts, Media & Entertainment | 0 (0.0%) | 8 (100.0%) |
| Health Diagnosing & Treating | 27 (37.0%) | 46 (63.0%) |
| Health Technologists | 2 (8.7%) | 21 (91.3%) |
| Total (Category) | 185 (39.1%) | 288 (60.9%) |
| Total (Overall) | 717 (51.7%) | 669 (48.3%) |
Services Occupations
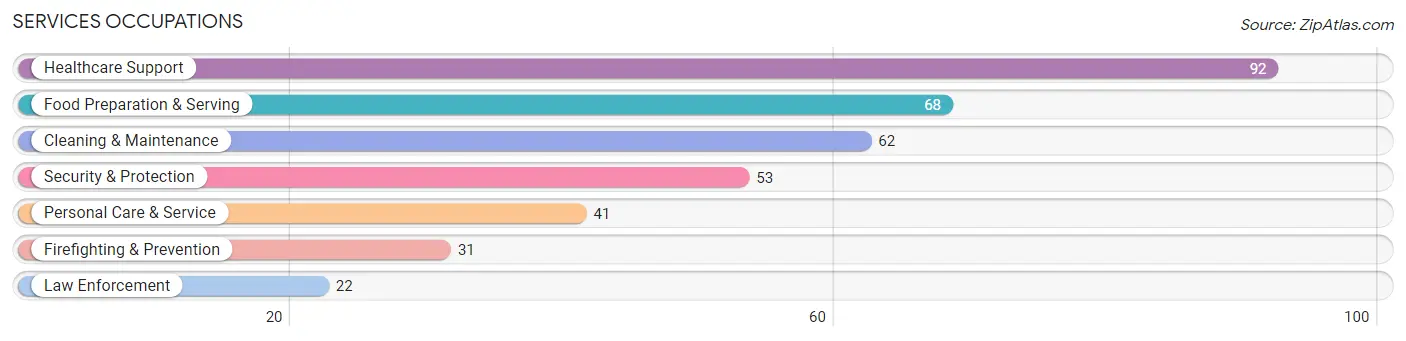
The most common Services occupations in Donley County are Healthcare Support (92 | 6.6%), Food Preparation & Serving (68 | 4.9%), Cleaning & Maintenance (62 | 4.5%), Security & Protection (53 | 3.8%), and Personal Care & Service (41 | 3.0%).
Services Occupations by Sex
Within the Services occupations in Donley County, the most male-oriented occupations are Law Enforcement (81.8%), Personal Care & Service (63.4%), and Food Preparation & Serving (58.8%), while the most female-oriented occupations are Firefighting & Prevention (100.0%), Cleaning & Maintenance (80.6%), and Healthcare Support (70.7%).
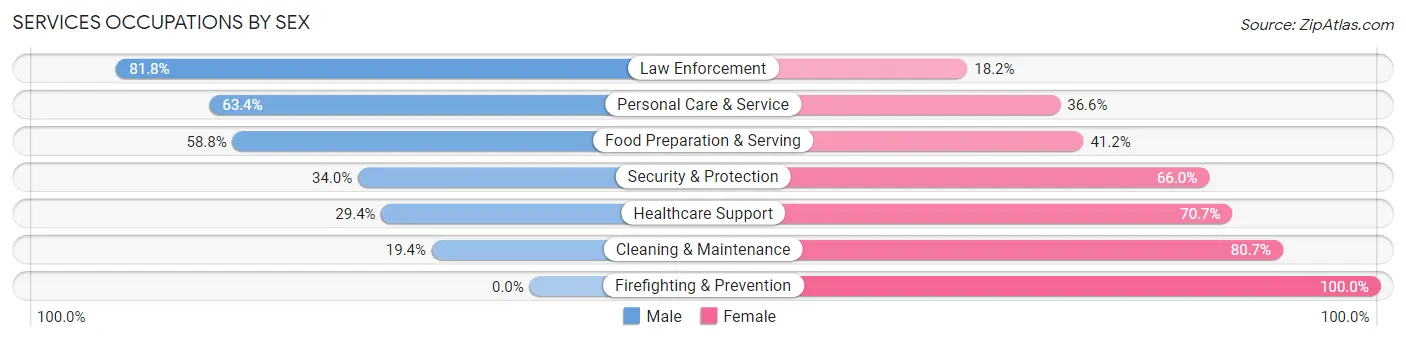
| Occupation | Male | Female |
| Healthcare Support | 27 (29.3%) | 65 (70.7%) |
| Security & Protection | 18 (34.0%) | 35 (66.0%) |
| Firefighting & Prevention | 0 (0.0%) | 31 (100.0%) |
| Law Enforcement | 18 (81.8%) | 4 (18.2%) |
| Food Preparation & Serving | 40 (58.8%) | 28 (41.2%) |
| Cleaning & Maintenance | 12 (19.4%) | 50 (80.6%) |
| Personal Care & Service | 26 (63.4%) | 15 (36.6%) |
| Total (Category) | 123 (38.9%) | 193 (61.1%) |
| Total (Overall) | 717 (51.7%) | 669 (48.3%) |
Sales and Office Occupations
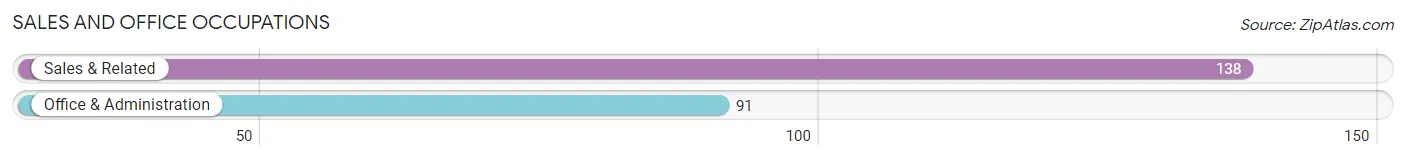
The most common Sales and Office occupations in Donley County are Sales & Related (138 | 10.0%), and Office & Administration (91 | 6.6%).
Sales and Office Occupations by Sex
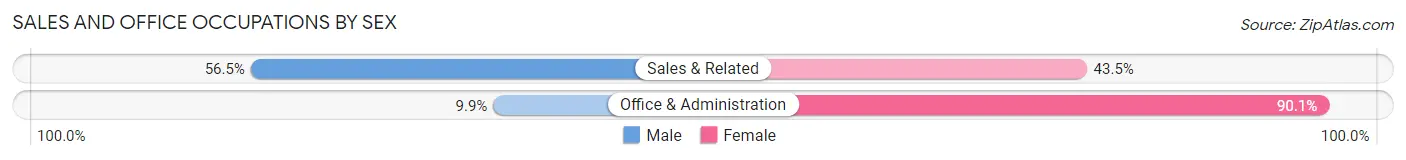
| Occupation | Male | Female |
| Sales & Related | 78 (56.5%) | 60 (43.5%) |
| Office & Administration | 9 (9.9%) | 82 (90.1%) |
| Total (Category) | 87 (38.0%) | 142 (62.0%) |
| Total (Overall) | 717 (51.7%) | 669 (48.3%) |
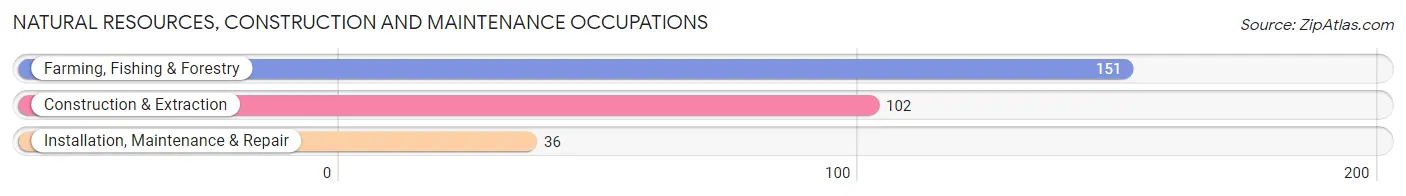
Natural Resources, Construction and Maintenance Occupations
The most common Natural Resources, Construction and Maintenance occupations in Donley County are Farming, Fishing & Forestry (151 | 10.9%), Construction & Extraction (102 | 7.4%), and Installation, Maintenance & Repair (36 | 2.6%).
Natural Resources, Construction and Maintenance Occupations by Sex
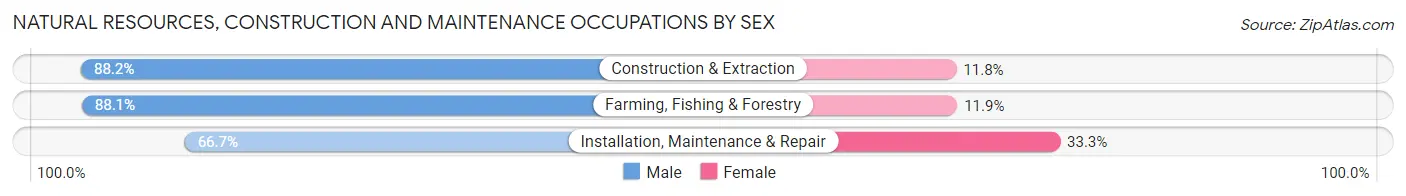
| Occupation | Male | Female |
| Farming, Fishing & Forestry | 133 (88.1%) | 18 (11.9%) |
| Construction & Extraction | 90 (88.2%) | 12 (11.8%) |
| Installation, Maintenance & Repair | 24 (66.7%) | 12 (33.3%) |
| Total (Category) | 247 (85.5%) | 42 (14.5%) |
| Total (Overall) | 717 (51.7%) | 669 (48.3%) |
Production, Transportation and Moving Occupations
The most common Production, Transportation and Moving occupations in Donley County are Production (30 | 2.2%), Transportation (30 | 2.2%), and Material Moving (19 | 1.4%).
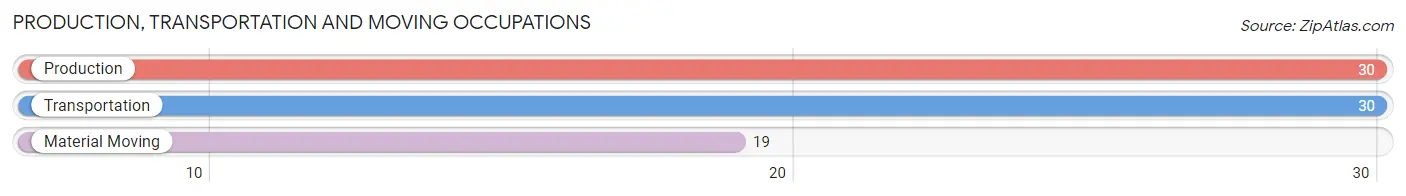
Production, Transportation and Moving Occupations by Sex
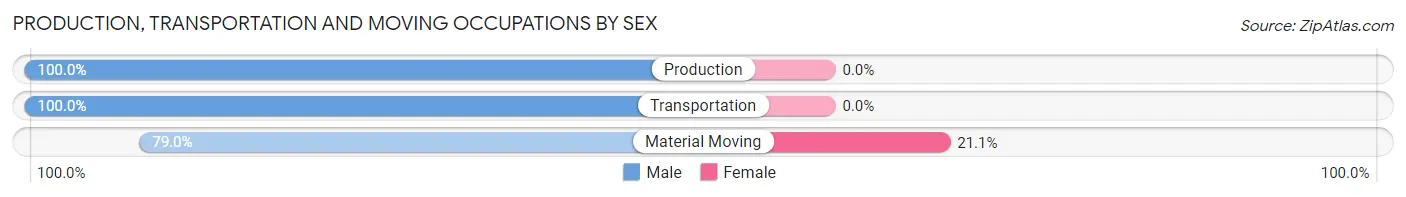
| Occupation | Male | Female |
| Production | 30 (100.0%) | 0 (0.0%) |
| Transportation | 30 (100.0%) | 0 (0.0%) |
| Material Moving | 15 (78.9%) | 4 (21.0%) |
| Total (Category) | 75 (94.9%) | 4 (5.1%) |
| Total (Overall) | 717 (51.7%) | 669 (48.3%) |
Employment Industries by Sex in Donley County
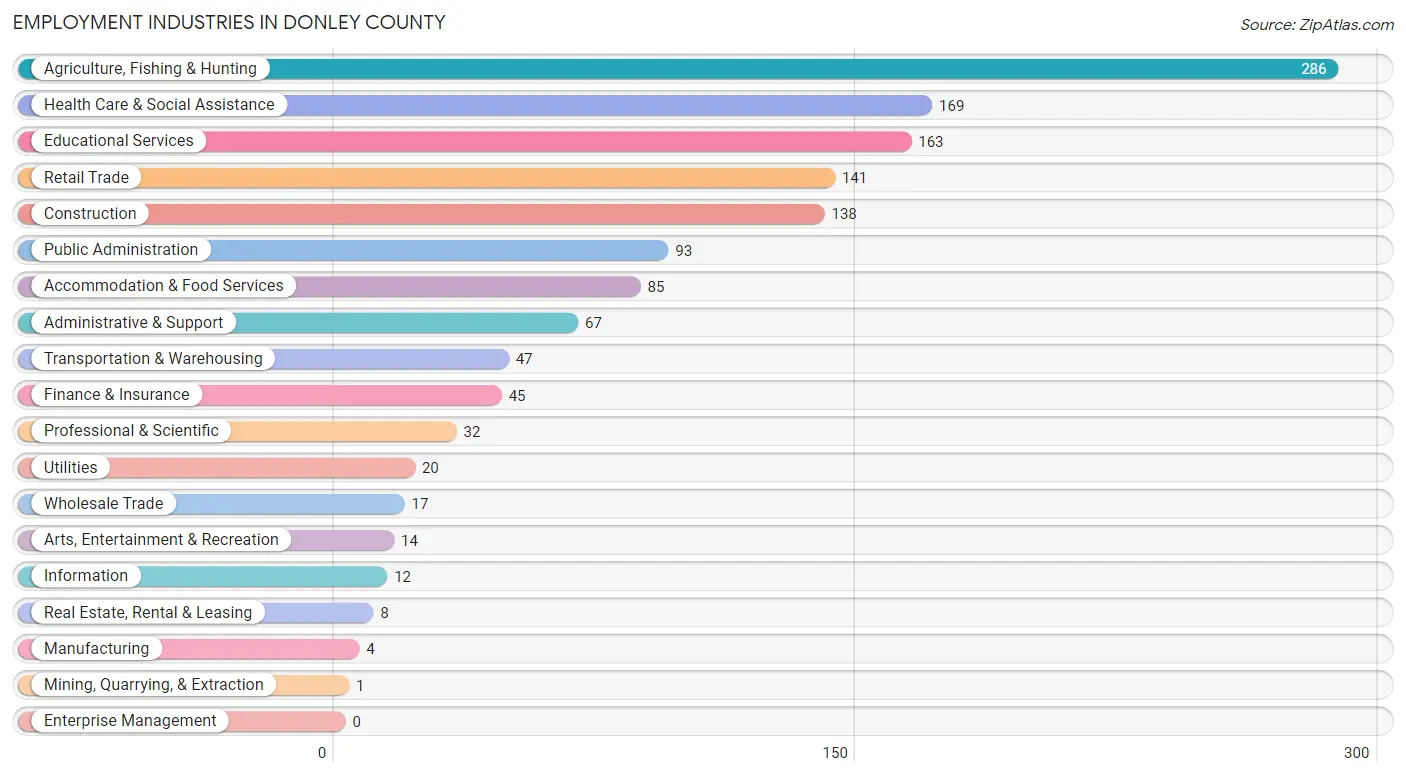
Employment Industries in Donley County
The major employment industries in Donley County include Agriculture, Fishing & Hunting (286 | 20.6%), Health Care & Social Assistance (169 | 12.2%), Educational Services (163 | 11.8%), Retail Trade (141 | 10.2%), and Construction (138 | 10.0%).
Employment Industries by Sex in Donley County
The Donley County industries that see more men than women are Mining, Quarrying, & Extraction (100.0%), Wholesale Trade (100.0%), and Utilities (100.0%), whereas the industries that tend to have a higher number of women are Educational Services (82.8%), Finance & Insurance (77.8%), and Public Administration (77.4%).
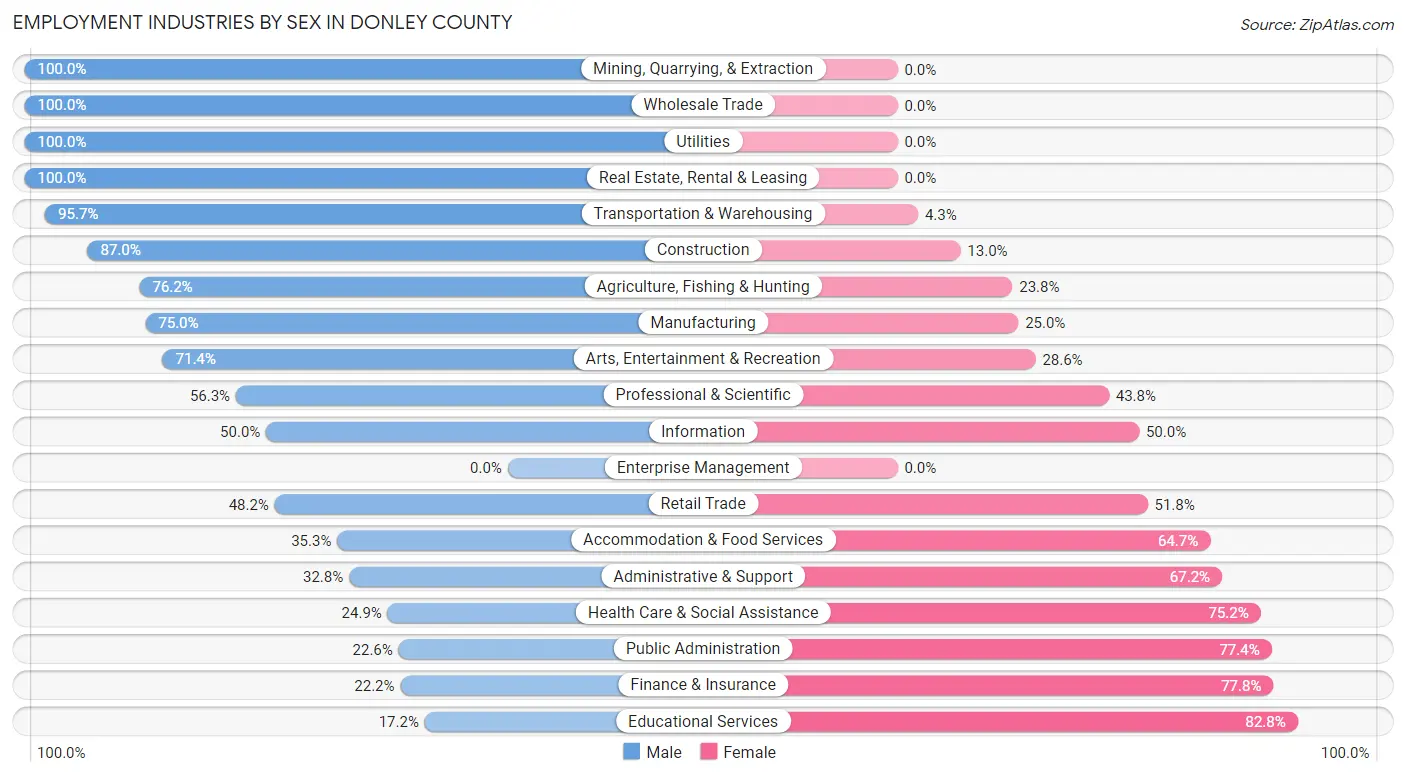
| Industry | Male | Female |
| Agriculture, Fishing & Hunting | 218 (76.2%) | 68 (23.8%) |
| Mining, Quarrying, & Extraction | 1 (100.0%) | 0 (0.0%) |
| Construction | 120 (87.0%) | 18 (13.0%) |
| Manufacturing | 3 (75.0%) | 1 (25.0%) |
| Wholesale Trade | 17 (100.0%) | 0 (0.0%) |
| Retail Trade | 68 (48.2%) | 73 (51.8%) |
| Transportation & Warehousing | 45 (95.7%) | 2 (4.3%) |
| Utilities | 20 (100.0%) | 0 (0.0%) |
| Information | 6 (50.0%) | 6 (50.0%) |
| Finance & Insurance | 10 (22.2%) | 35 (77.8%) |
| Real Estate, Rental & Leasing | 8 (100.0%) | 0 (0.0%) |
| Professional & Scientific | 18 (56.2%) | 14 (43.8%) |
| Enterprise Management | 0 (0.0%) | 0 (0.0%) |
| Administrative & Support | 22 (32.8%) | 45 (67.2%) |
| Educational Services | 28 (17.2%) | 135 (82.8%) |
| Health Care & Social Assistance | 42 (24.8%) | 127 (75.1%) |
| Arts, Entertainment & Recreation | 10 (71.4%) | 4 (28.6%) |
| Accommodation & Food Services | 30 (35.3%) | 55 (64.7%) |
| Public Administration | 21 (22.6%) | 72 (77.4%) |
| Total | 717 (51.7%) | 669 (48.3%) |
Education in Donley County
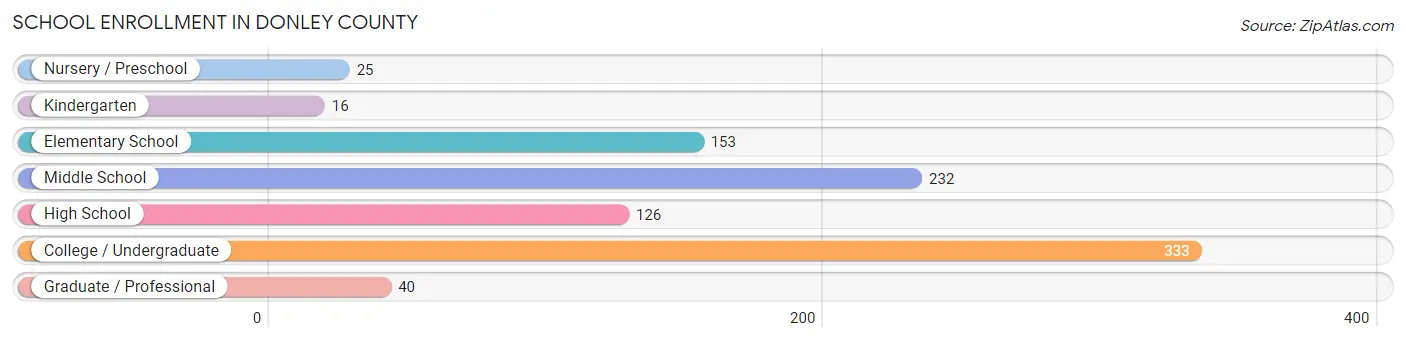
School Enrollment in Donley County
The most common levels of schooling among the 925 students in Donley County are college / undergraduate (333 | 36.0%), middle school (232 | 25.1%), and elementary school (153 | 16.5%).
| School Level | # Students | % Students |
| Nursery / Preschool | 25 | 2.7% |
| Kindergarten | 16 | 1.7% |
| Elementary School | 153 | 16.5% |
| Middle School | 232 | 25.1% |
| High School | 126 | 13.6% |
| College / Undergraduate | 333 | 36.0% |
| Graduate / Professional | 40 | 4.3% |
| Total | 925 | 100.0% |
School Enrollment by Age by Funding Source in Donley County
Out of a total of 925 students who are enrolled in schools in Donley County, 115 (12.4%) attend a private institution, while the remaining 810 (87.6%) are enrolled in public schools. The age group of 35 years and over has the highest likelihood of being enrolled in private schools, with 18 (100.0% in the age bracket) enrolled. Conversely, the age group of 3 to 4 year olds has the lowest likelihood of being enrolled in a private school, with 4 (100.0% in the age bracket) attending a public institution.
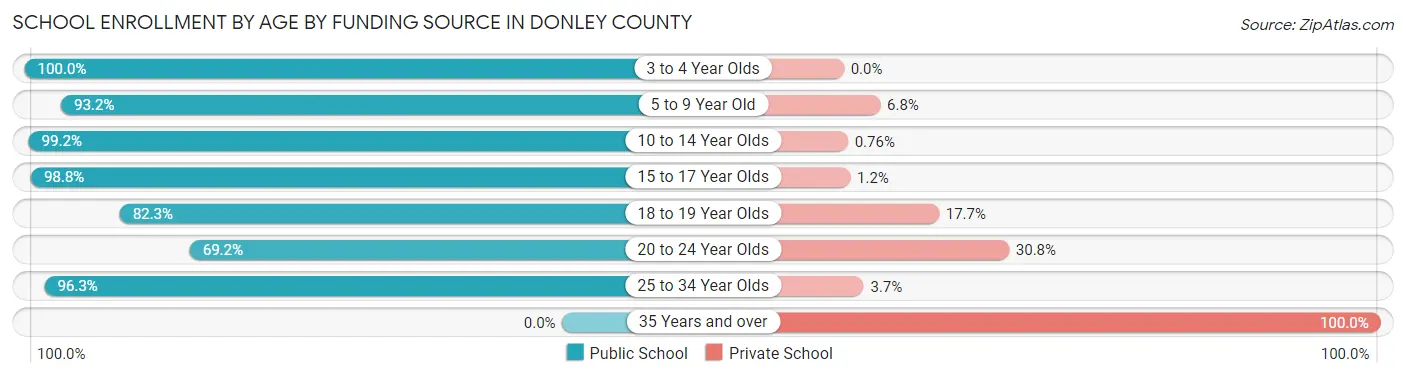
| Age Bracket | Public School | Private School |
| 3 to 4 Year Olds | 4 (100.0%) | 0 (0.0%) |
| 5 to 9 Year Old | 151 (93.2%) | 11 (6.8%) |
| 10 to 14 Year Olds | 261 (99.2%) | 2 (0.8%) |
| 15 to 17 Year Olds | 83 (98.8%) | 1 (1.2%) |
| 18 to 19 Year Olds | 195 (82.3%) | 42 (17.7%) |
| 20 to 24 Year Olds | 90 (69.2%) | 40 (30.8%) |
| 25 to 34 Year Olds | 26 (96.3%) | 1 (3.7%) |
| 35 Years and over | 0 (0.0%) | 18 (100.0%) |
| Total | 810 (87.6%) | 115 (12.4%) |
Educational Attainment by Field of Study in Donley County
Education (64 | 21.4%), business (52 | 17.4%), liberal arts & history (45 | 15.0%), arts & humanities (34 | 11.4%), and physical & health sciences (33 | 11.0%) are the most common fields of study among 299 individuals in Donley County who have obtained a bachelor's degree or higher.
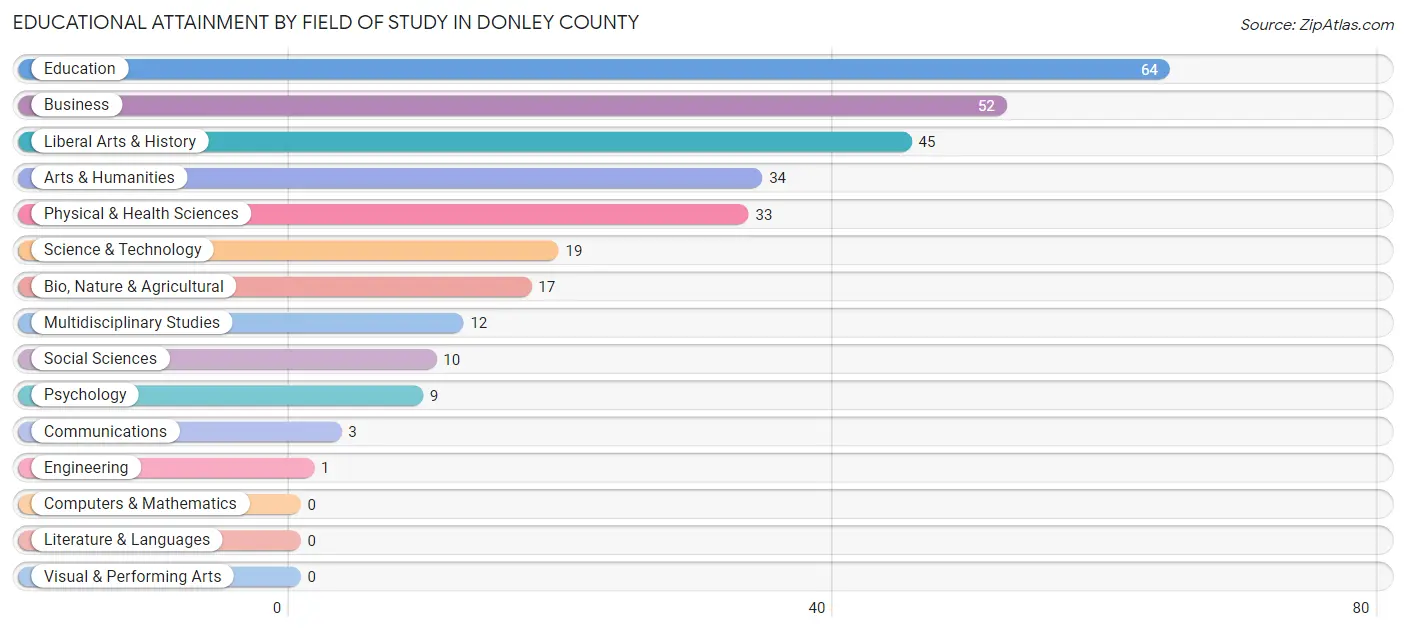
| Field of Study | # Graduates | % Graduates |
| Computers & Mathematics | 0 | 0.0% |
| Bio, Nature & Agricultural | 17 | 5.7% |
| Physical & Health Sciences | 33 | 11.0% |
| Psychology | 9 | 3.0% |
| Social Sciences | 10 | 3.3% |
| Engineering | 1 | 0.3% |
| Multidisciplinary Studies | 12 | 4.0% |
| Science & Technology | 19 | 6.4% |
| Business | 52 | 17.4% |
| Education | 64 | 21.4% |
| Literature & Languages | 0 | 0.0% |
| Liberal Arts & History | 45 | 15.0% |
| Visual & Performing Arts | 0 | 0.0% |
| Communications | 3 | 1.0% |
| Arts & Humanities | 34 | 11.4% |
| Total | 299 | 100.0% |
Transportation & Commute in Donley County
Vehicle Availability by Sex in Donley County
The most prevalent vehicle ownership categories in Donley County are males with 2 vehicles (273, accounting for 38.5%) and females with 2 vehicles (249, making up 44.1%).
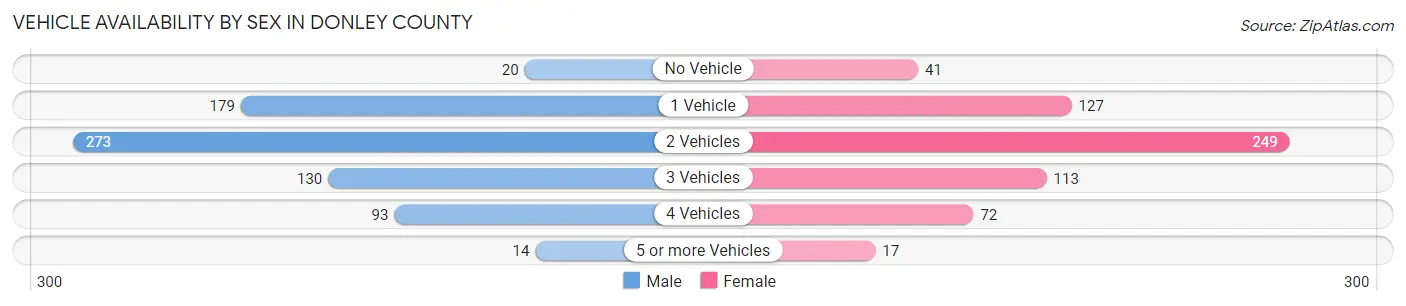
| Vehicles Available | Male | Female |
| No Vehicle | 20 (2.8%) | 41 (6.6%) |
| 1 Vehicle | 179 (25.3%) | 127 (20.5%) |
| 2 Vehicles | 273 (38.5%) | 249 (40.2%) |
| 3 Vehicles | 130 (18.3%) | 113 (18.3%) |
| 4 Vehicles | 93 (13.1%) | 72 (11.6%) |
| 5 or more Vehicles | 14 (2.0%) | 17 (2.8%) |
| Total | 709 (100.0%) | 619 (100.0%) |
Commute Time in Donley County
The most frequently occuring commute durations in Donley County are less than 5 minutes (364 commuters, 28.5%), 10 to 14 minutes (162 commuters, 12.7%), and 5 to 9 minutes (161 commuters, 12.6%).
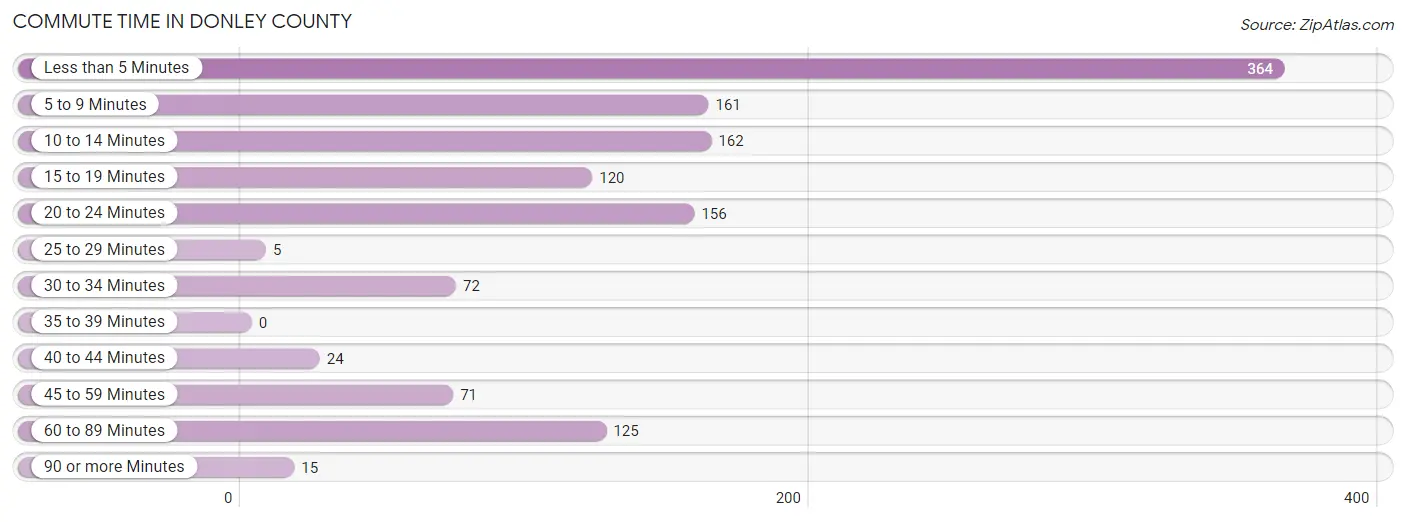
| Commute Time | # Commuters | % Commuters |
| Less than 5 Minutes | 364 | 28.5% |
| 5 to 9 Minutes | 161 | 12.6% |
| 10 to 14 Minutes | 162 | 12.7% |
| 15 to 19 Minutes | 120 | 9.4% |
| 20 to 24 Minutes | 156 | 12.2% |
| 25 to 29 Minutes | 5 | 0.4% |
| 30 to 34 Minutes | 72 | 5.7% |
| 35 to 39 Minutes | 0 | 0.0% |
| 40 to 44 Minutes | 24 | 1.9% |
| 45 to 59 Minutes | 71 | 5.6% |
| 60 to 89 Minutes | 125 | 9.8% |
| 90 or more Minutes | 15 | 1.2% |
Commute Time by Sex in Donley County
The most common commute times in Donley County are less than 5 minutes (166 commuters, 25.2%) for males and less than 5 minutes (198 commuters, 32.2%) for females.
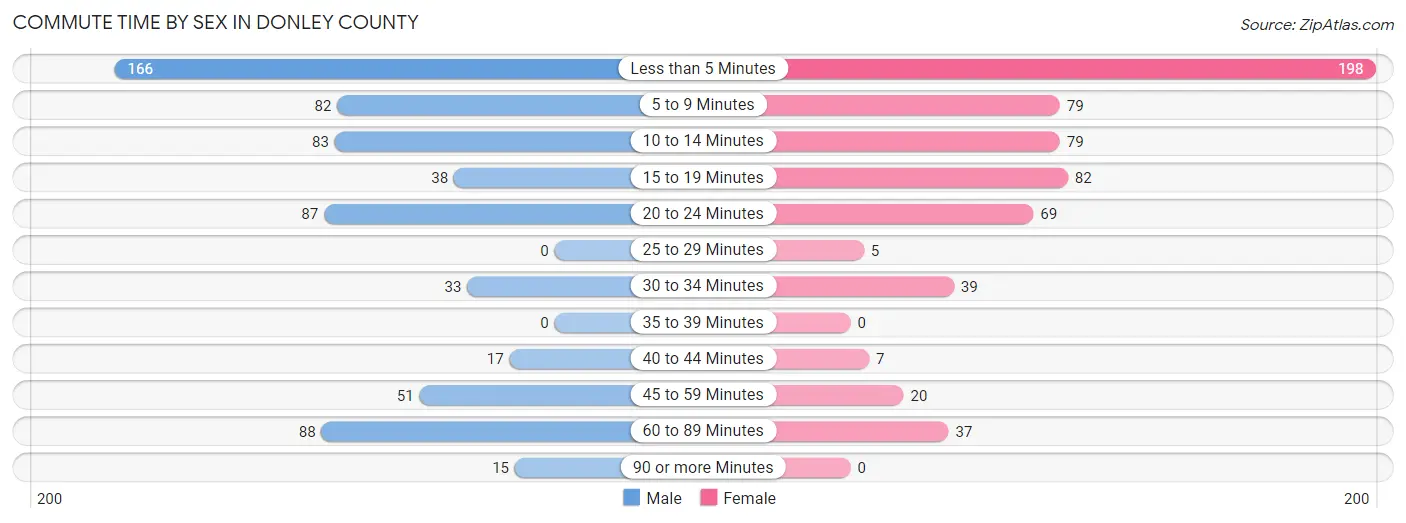
| Commute Time | Male | Female |
| Less than 5 Minutes | 166 (25.2%) | 198 (32.2%) |
| 5 to 9 Minutes | 82 (12.4%) | 79 (12.9%) |
| 10 to 14 Minutes | 83 (12.6%) | 79 (12.9%) |
| 15 to 19 Minutes | 38 (5.8%) | 82 (13.3%) |
| 20 to 24 Minutes | 87 (13.2%) | 69 (11.2%) |
| 25 to 29 Minutes | 0 (0.0%) | 5 (0.8%) |
| 30 to 34 Minutes | 33 (5.0%) | 39 (6.3%) |
| 35 to 39 Minutes | 0 (0.0%) | 0 (0.0%) |
| 40 to 44 Minutes | 17 (2.6%) | 7 (1.1%) |
| 45 to 59 Minutes | 51 (7.7%) | 20 (3.3%) |
| 60 to 89 Minutes | 88 (13.3%) | 37 (6.0%) |
| 90 or more Minutes | 15 (2.3%) | 0 (0.0%) |
Time of Departure to Work by Sex in Donley County
The most frequent times of departure to work in Donley County are 7:00 AM to 7:29 AM (182, 27.6%) for males and 7:00 AM to 7:29 AM (128, 20.8%) for females.
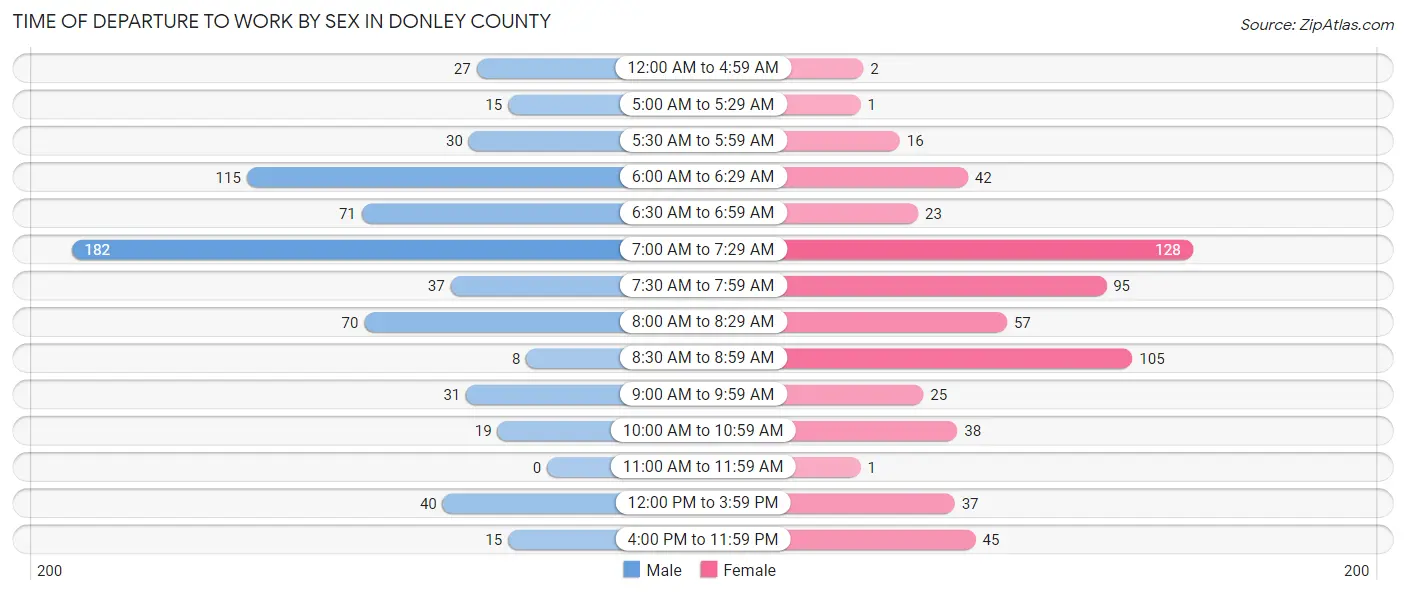
| Time of Departure | Male | Female |
| 12:00 AM to 4:59 AM | 27 (4.1%) | 2 (0.3%) |
| 5:00 AM to 5:29 AM | 15 (2.3%) | 1 (0.2%) |
| 5:30 AM to 5:59 AM | 30 (4.5%) | 16 (2.6%) |
| 6:00 AM to 6:29 AM | 115 (17.4%) | 42 (6.8%) |
| 6:30 AM to 6:59 AM | 71 (10.8%) | 23 (3.7%) |
| 7:00 AM to 7:29 AM | 182 (27.6%) | 128 (20.8%) |
| 7:30 AM to 7:59 AM | 37 (5.6%) | 95 (15.4%) |
| 8:00 AM to 8:29 AM | 70 (10.6%) | 57 (9.3%) |
| 8:30 AM to 8:59 AM | 8 (1.2%) | 105 (17.1%) |
| 9:00 AM to 9:59 AM | 31 (4.7%) | 25 (4.1%) |
| 10:00 AM to 10:59 AM | 19 (2.9%) | 38 (6.2%) |
| 11:00 AM to 11:59 AM | 0 (0.0%) | 1 (0.2%) |
| 12:00 PM to 3:59 PM | 40 (6.1%) | 37 (6.0%) |
| 4:00 PM to 11:59 PM | 15 (2.3%) | 45 (7.3%) |
| Total | 660 (100.0%) | 615 (100.0%) |
Housing Occupancy in Donley County
Occupancy by Ownership in Donley County
Of the total 1,198 dwellings in Donley County, owner-occupied units account for 870 (72.6%), while renter-occupied units make up 328 (27.4%).
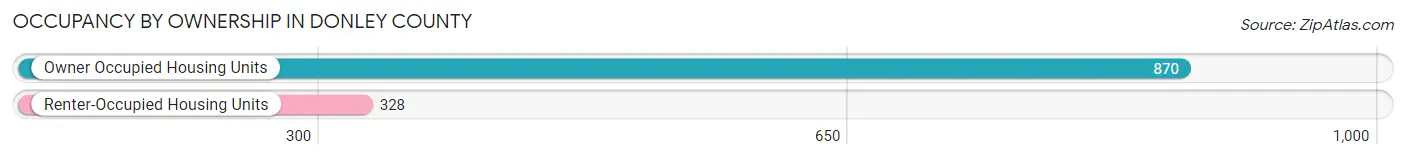
| Occupancy | # Housing Units | % Housing Units |
| Owner Occupied Housing Units | 870 | 72.6% |
| Renter-Occupied Housing Units | 328 | 27.4% |
| Total Occupied Housing Units | 1,198 | 100.0% |
Occupancy by Household Size in Donley County
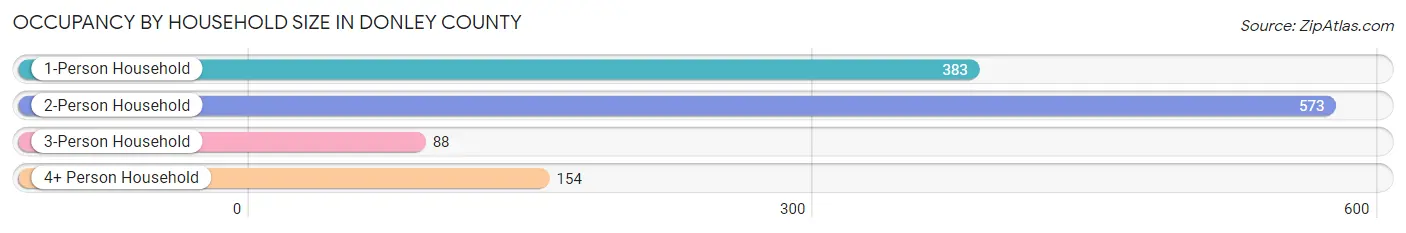
| Household Size | # Housing Units | % Housing Units |
| 1-Person Household | 383 | 32.0% |
| 2-Person Household | 573 | 47.8% |
| 3-Person Household | 88 | 7.3% |
| 4+ Person Household | 154 | 12.9% |
| Total Housing Units | 1,198 | 100.0% |
Occupancy by Ownership by Household Size in Donley County
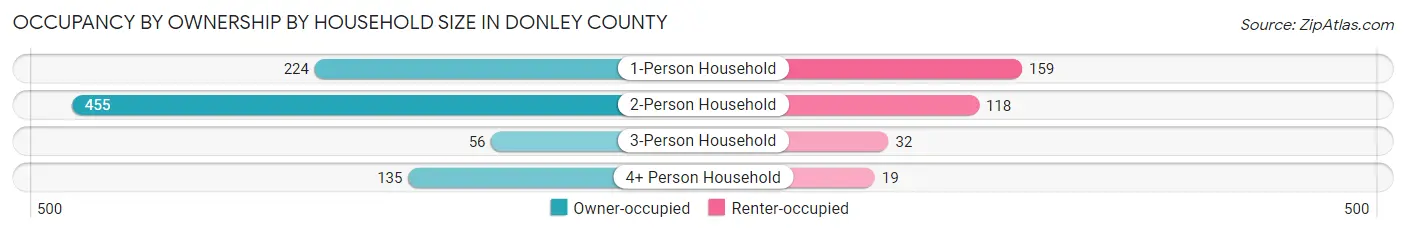
| Household Size | Owner-occupied | Renter-occupied |
| 1-Person Household | 224 (58.5%) | 159 (41.5%) |
| 2-Person Household | 455 (79.4%) | 118 (20.6%) |
| 3-Person Household | 56 (63.6%) | 32 (36.4%) |
| 4+ Person Household | 135 (87.7%) | 19 (12.3%) |
| Total Housing Units | 870 (72.6%) | 328 (27.4%) |
Occupancy by Educational Attainment in Donley County
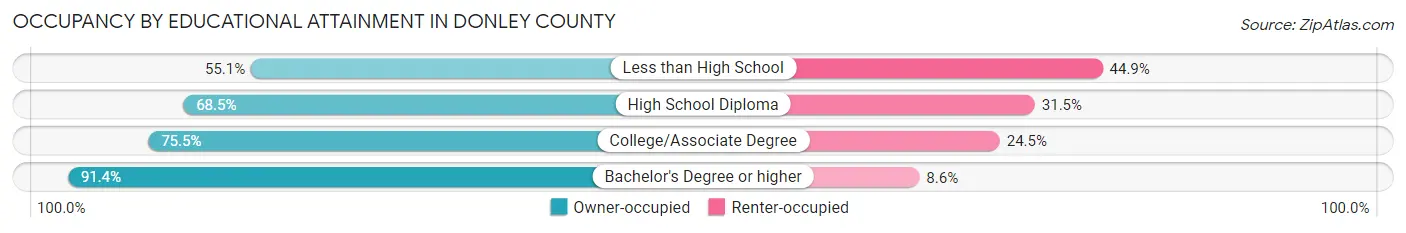
| Household Size | Owner-occupied | Renter-occupied |
| Less than High School | 108 (55.1%) | 88 (44.9%) |
| High School Diploma | 220 (68.5%) | 101 (31.5%) |
| College/Associate Degree | 382 (75.5%) | 124 (24.5%) |
| Bachelor's Degree or higher | 160 (91.4%) | 15 (8.6%) |
Occupancy by Age of Householder in Donley County
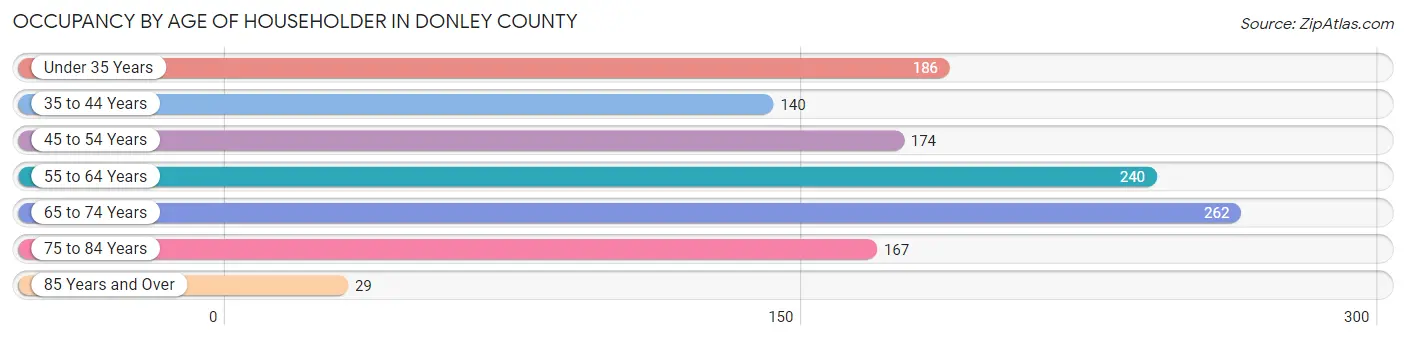
| Age Bracket | # Households | % Households |
| Under 35 Years | 186 | 15.5% |
| 35 to 44 Years | 140 | 11.7% |
| 45 to 54 Years | 174 | 14.5% |
| 55 to 64 Years | 240 | 20.0% |
| 65 to 74 Years | 262 | 21.9% |
| 75 to 84 Years | 167 | 13.9% |
| 85 Years and Over | 29 | 2.4% |
| Total | 1,198 | 100.0% |
Housing Finances in Donley County
Median Income by Occupancy in Donley County
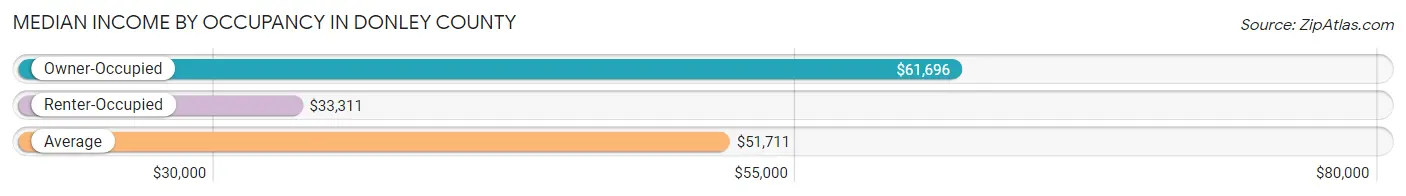
| Occupancy Type | # Households | Median Income |
| Owner-Occupied | 870 (72.6%) | $61,696 |
| Renter-Occupied | 328 (27.4%) | $33,311 |
| Average | 1,198 (100.0%) | $51,711 |
Occupancy by Householder Income Bracket in Donley County
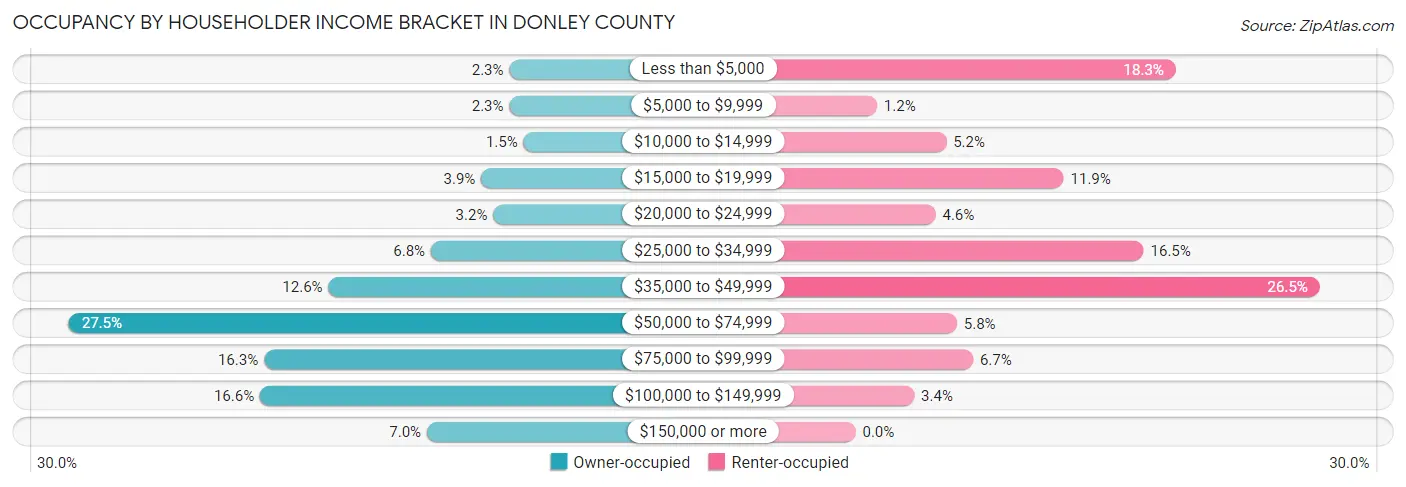
| Income Bracket | Owner-occupied | Renter-occupied |
| Less than $5,000 | 20 (2.3%) | 60 (18.3%) |
| $5,000 to $9,999 | 20 (2.3%) | 4 (1.2%) |
| $10,000 to $14,999 | 13 (1.5%) | 17 (5.2%) |
| $15,000 to $19,999 | 34 (3.9%) | 39 (11.9%) |
| $20,000 to $24,999 | 28 (3.2%) | 15 (4.6%) |
| $25,000 to $34,999 | 59 (6.8%) | 54 (16.5%) |
| $35,000 to $49,999 | 110 (12.6%) | 87 (26.5%) |
| $50,000 to $74,999 | 239 (27.5%) | 19 (5.8%) |
| $75,000 to $99,999 | 142 (16.3%) | 22 (6.7%) |
| $100,000 to $149,999 | 144 (16.6%) | 11 (3.4%) |
| $150,000 or more | 61 (7.0%) | 0 (0.0%) |
| Total | 870 (100.0%) | 328 (100.0%) |
Monthly Housing Cost Tiers in Donley County
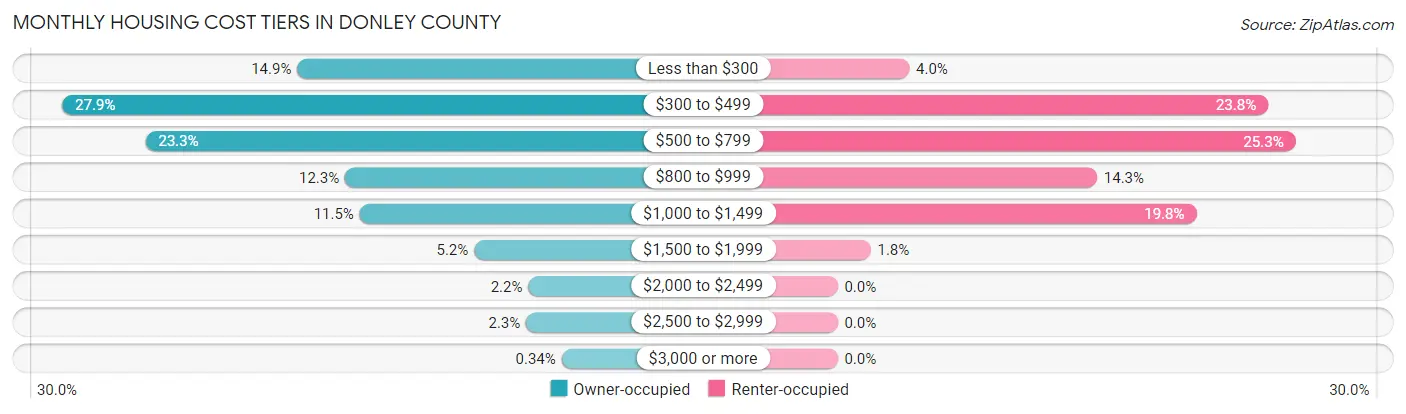
| Monthly Cost | Owner-occupied | Renter-occupied |
| Less than $300 | 130 (14.9%) | 13 (4.0%) |
| $300 to $499 | 243 (27.9%) | 78 (23.8%) |
| $500 to $799 | 203 (23.3%) | 83 (25.3%) |
| $800 to $999 | 107 (12.3%) | 47 (14.3%) |
| $1,000 to $1,499 | 100 (11.5%) | 65 (19.8%) |
| $1,500 to $1,999 | 45 (5.2%) | 6 (1.8%) |
| $2,000 to $2,499 | 19 (2.2%) | 0 (0.0%) |
| $2,500 to $2,999 | 20 (2.3%) | 0 (0.0%) |
| $3,000 or more | 3 (0.3%) | 0 (0.0%) |
| Total | 870 (100.0%) | 328 (100.0%) |
Physical Housing Characteristics in Donley County
Housing Structures in Donley County
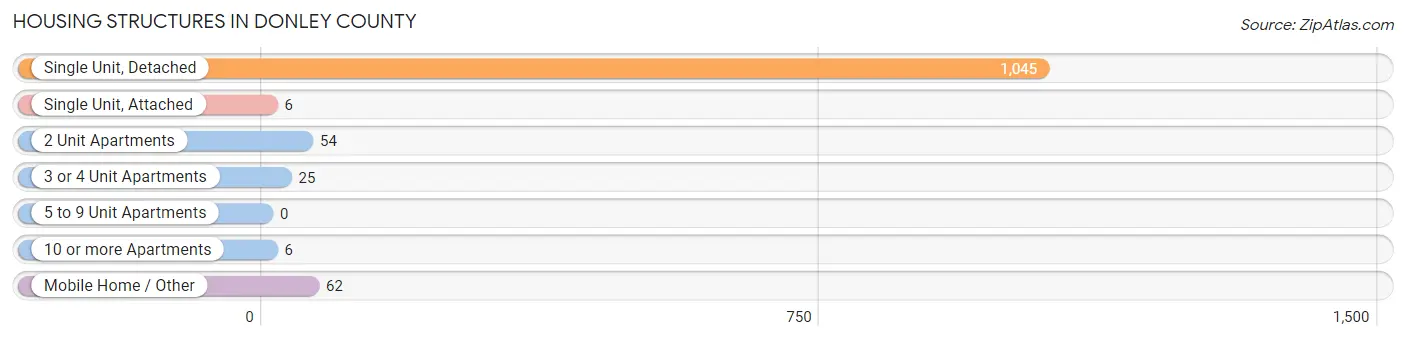
| Structure Type | # Housing Units | % Housing Units |
| Single Unit, Detached | 1,045 | 87.2% |
| Single Unit, Attached | 6 | 0.5% |
| 2 Unit Apartments | 54 | 4.5% |
| 3 or 4 Unit Apartments | 25 | 2.1% |
| 5 to 9 Unit Apartments | 0 | 0.0% |
| 10 or more Apartments | 6 | 0.5% |
| Mobile Home / Other | 62 | 5.2% |
| Total | 1,198 | 100.0% |
Housing Structures by Occupancy in Donley County
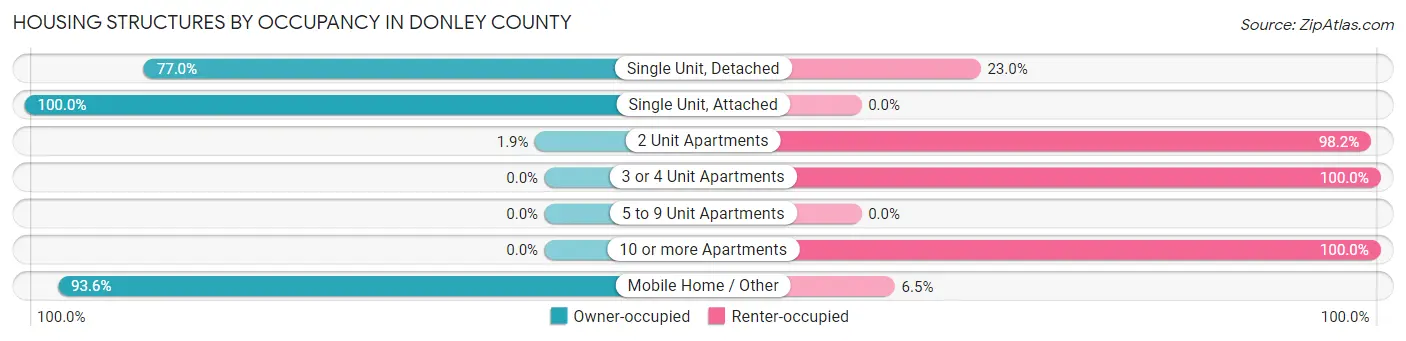
| Structure Type | Owner-occupied | Renter-occupied |
| Single Unit, Detached | 805 (77.0%) | 240 (23.0%) |
| Single Unit, Attached | 6 (100.0%) | 0 (0.0%) |
| 2 Unit Apartments | 1 (1.8%) | 53 (98.2%) |
| 3 or 4 Unit Apartments | 0 (0.0%) | 25 (100.0%) |
| 5 to 9 Unit Apartments | 0 (0.0%) | 0 (0.0%) |
| 10 or more Apartments | 0 (0.0%) | 6 (100.0%) |
| Mobile Home / Other | 58 (93.5%) | 4 (6.5%) |
| Total | 870 (72.6%) | 328 (27.4%) |
Housing Structures by Number of Rooms in Donley County
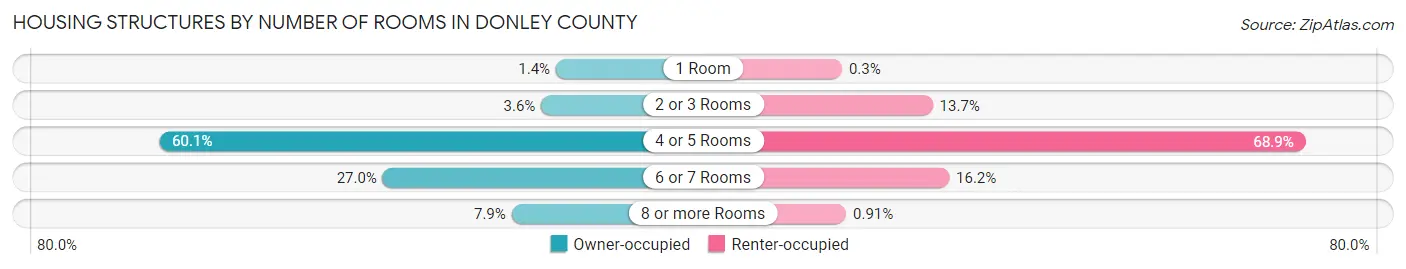
| Number of Rooms | Owner-occupied | Renter-occupied |
| 1 Room | 12 (1.4%) | 1 (0.3%) |
| 2 or 3 Rooms | 31 (3.6%) | 45 (13.7%) |
| 4 or 5 Rooms | 523 (60.1%) | 226 (68.9%) |
| 6 or 7 Rooms | 235 (27.0%) | 53 (16.2%) |
| 8 or more Rooms | 69 (7.9%) | 3 (0.9%) |
| Total | 870 (100.0%) | 328 (100.0%) |
Housing Structure by Heating Type in Donley County
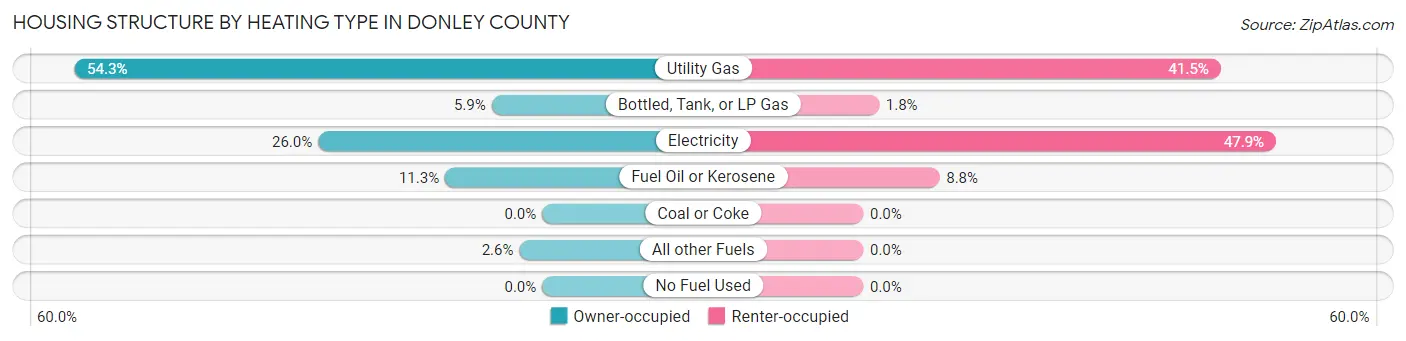
| Heating Type | Owner-occupied | Renter-occupied |
| Utility Gas | 472 (54.2%) | 136 (41.5%) |
| Bottled, Tank, or LP Gas | 51 (5.9%) | 6 (1.8%) |
| Electricity | 226 (26.0%) | 157 (47.9%) |
| Fuel Oil or Kerosene | 98 (11.3%) | 29 (8.8%) |
| Coal or Coke | 0 (0.0%) | 0 (0.0%) |
| All other Fuels | 23 (2.6%) | 0 (0.0%) |
| No Fuel Used | 0 (0.0%) | 0 (0.0%) |
| Total | 870 (100.0%) | 328 (100.0%) |
Household Vehicle Usage in Donley County
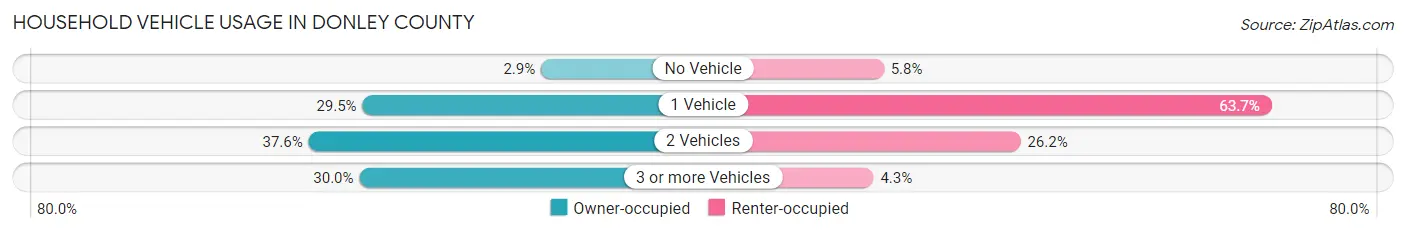
| Vehicles per Household | Owner-occupied | Renter-occupied |
| No Vehicle | 25 (2.9%) | 19 (5.8%) |
| 1 Vehicle | 257 (29.5%) | 209 (63.7%) |
| 2 Vehicles | 327 (37.6%) | 86 (26.2%) |
| 3 or more Vehicles | 261 (30.0%) | 14 (4.3%) |
| Total | 870 (100.0%) | 328 (100.0%) |
Real Estate & Mortgages in Donley County
Real Estate and Mortgage Overview in Donley County
| Characteristic | Without Mortgage | With Mortgage |
| Housing Units | 642 | 228 |
| Median Property Value | $84,200 | $130,400 |
| Median Household Income | $56,310 | $37 |
| Monthly Housing Costs | $476 | $3 |
| Real Estate Taxes | $960 | $7 |
Property Value by Mortgage Status in Donley County
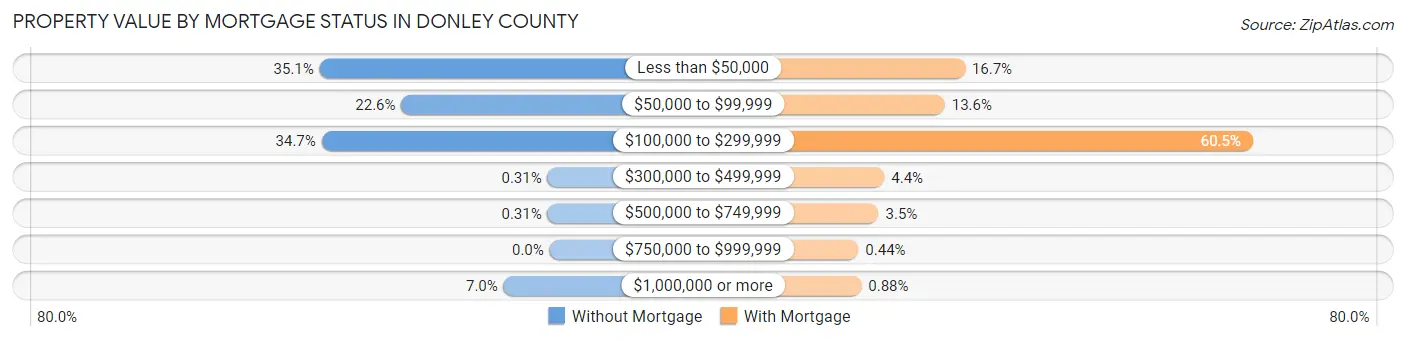
| Property Value | Without Mortgage | With Mortgage |
| Less than $50,000 | 225 (35.0%) | 38 (16.7%) |
| $50,000 to $99,999 | 145 (22.6%) | 31 (13.6%) |
| $100,000 to $299,999 | 223 (34.7%) | 138 (60.5%) |
| $300,000 to $499,999 | 2 (0.3%) | 10 (4.4%) |
| $500,000 to $749,999 | 2 (0.3%) | 8 (3.5%) |
| $750,000 to $999,999 | 0 (0.0%) | 1 (0.4%) |
| $1,000,000 or more | 45 (7.0%) | 2 (0.9%) |
| Total | 642 (100.0%) | 228 (100.0%) |
Household Income by Mortgage Status in Donley County
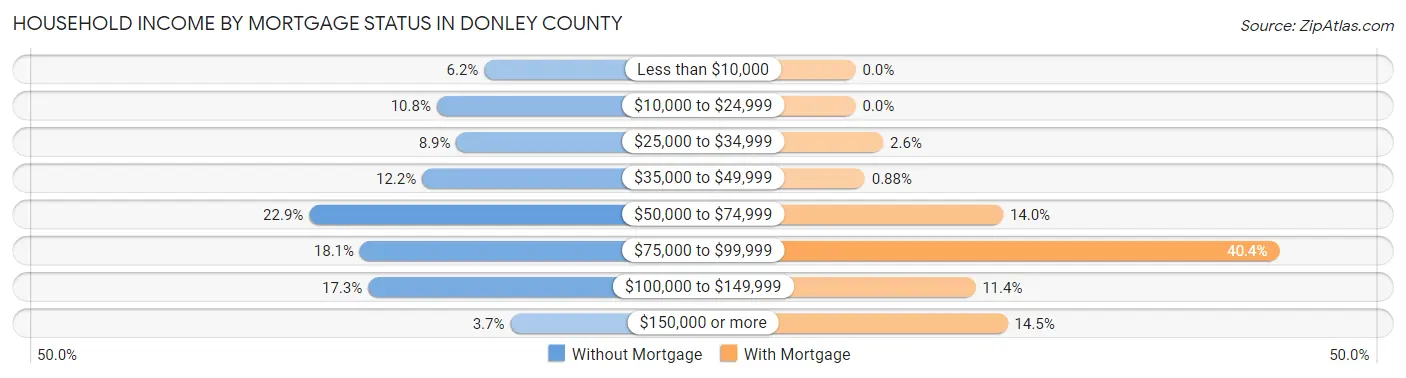
| Household Income | Without Mortgage | With Mortgage |
| Less than $10,000 | 40 (6.2%) | 0 (0.0%) |
| $10,000 to $24,999 | 69 (10.7%) | 0 (0.0%) |
| $25,000 to $34,999 | 57 (8.9%) | 6 (2.6%) |
| $35,000 to $49,999 | 78 (12.1%) | 2 (0.9%) |
| $50,000 to $74,999 | 147 (22.9%) | 32 (14.0%) |
| $75,000 to $99,999 | 116 (18.1%) | 92 (40.4%) |
| $100,000 to $149,999 | 111 (17.3%) | 26 (11.4%) |
| $150,000 or more | 24 (3.7%) | 33 (14.5%) |
| Total | 642 (100.0%) | 228 (100.0%) |
Property Value to Household Income Ratio in Donley County
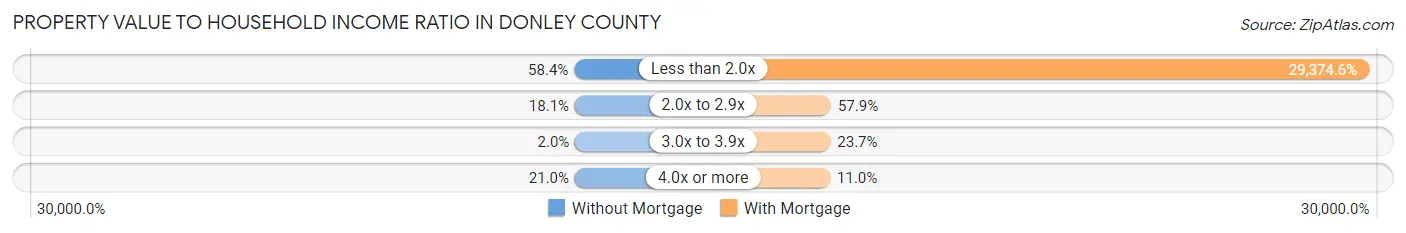
| Value-to-Income Ratio | Without Mortgage | With Mortgage |
| Less than 2.0x | 375 (58.4%) | 66,974 (29,374.6%) |
| 2.0x to 2.9x | 116 (18.1%) | 132 (57.9%) |
| 3.0x to 3.9x | 13 (2.0%) | 54 (23.7%) |
| 4.0x or more | 135 (21.0%) | 25 (11.0%) |
| Total | 642 (100.0%) | 228 (100.0%) |
Real Estate Taxes by Mortgage Status in Donley County
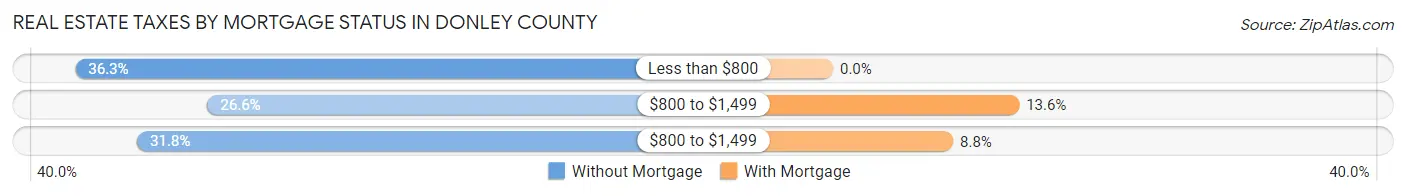
| Property Taxes | Without Mortgage | With Mortgage |
| Less than $800 | 233 (36.3%) | 0 (0.0%) |
| $800 to $1,499 | 171 (26.6%) | 31 (13.6%) |
| $800 to $1,499 | 204 (31.8%) | 20 (8.8%) |
| Total | 642 (100.0%) | 228 (100.0%) |
Health & Disability in Donley County
Health Insurance Coverage by Age in Donley County
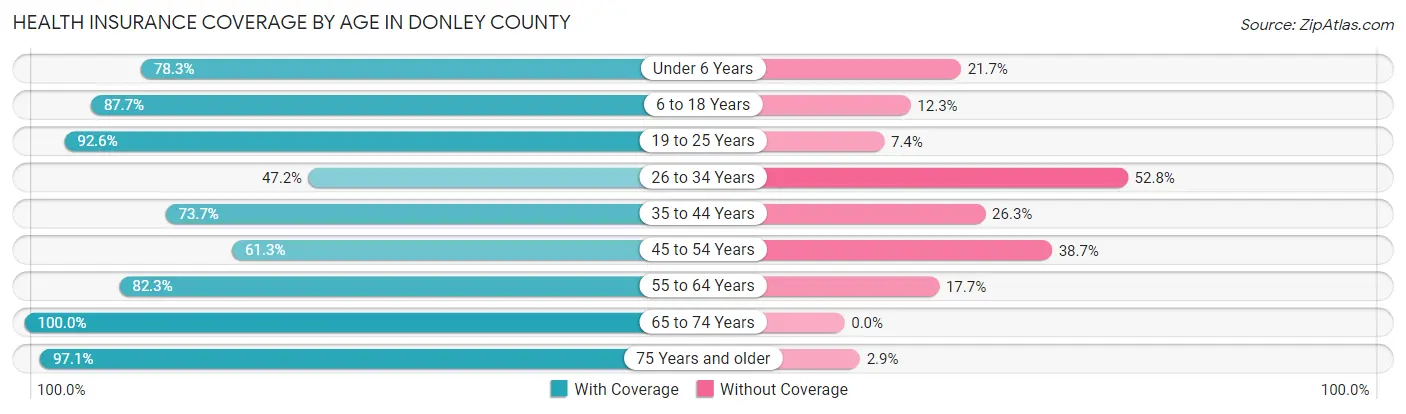
| Age Bracket | With Coverage | Without Coverage |
| Under 6 Years | 119 (78.3%) | 33 (21.7%) |
| 6 to 18 Years | 512 (87.7%) | 72 (12.3%) |
| 19 to 25 Years | 400 (92.6%) | 32 (7.4%) |
| 26 to 34 Years | 108 (47.2%) | 121 (52.8%) |
| 35 to 44 Years | 247 (73.7%) | 88 (26.3%) |
| 45 to 54 Years | 195 (61.3%) | 123 (38.7%) |
| 55 to 64 Years | 345 (82.3%) | 74 (17.7%) |
| 65 to 74 Years | 456 (100.0%) | 0 (0.0%) |
| 75 Years and older | 270 (97.1%) | 8 (2.9%) |
| Total | 2,652 (82.8%) | 551 (17.2%) |
Health Insurance Coverage by Citizenship Status in Donley County
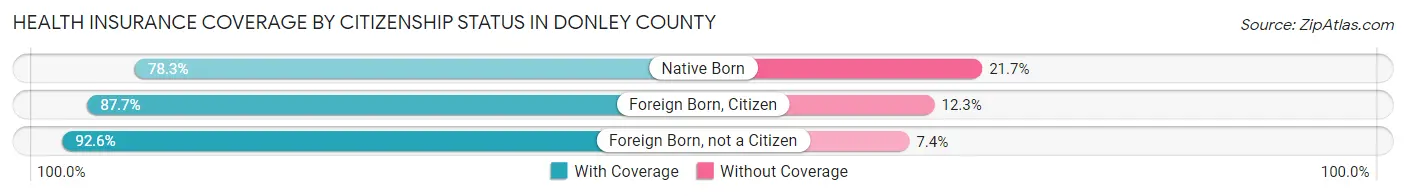
| Citizenship Status | With Coverage | Without Coverage |
| Native Born | 119 (78.3%) | 33 (21.7%) |
| Foreign Born, Citizen | 512 (87.7%) | 72 (12.3%) |
| Foreign Born, not a Citizen | 400 (92.6%) | 32 (7.4%) |
Health Insurance Coverage by Household Income in Donley County
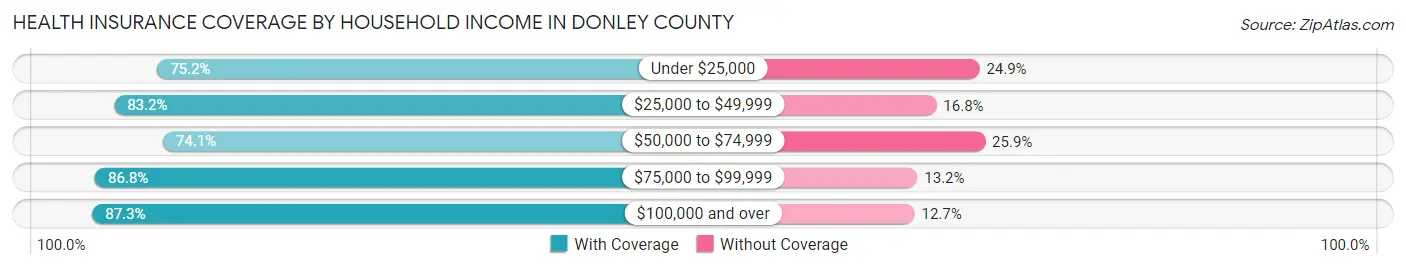
| Household Income | With Coverage | Without Coverage |
| Under $25,000 | 254 (75.1%) | 84 (24.8%) |
| $25,000 to $49,999 | 565 (83.2%) | 114 (16.8%) |
| $50,000 to $74,999 | 483 (74.1%) | 169 (25.9%) |
| $75,000 to $99,999 | 348 (86.8%) | 53 (13.2%) |
| $100,000 and over | 764 (87.3%) | 111 (12.7%) |
Public vs Private Health Insurance Coverage by Age in Donley County
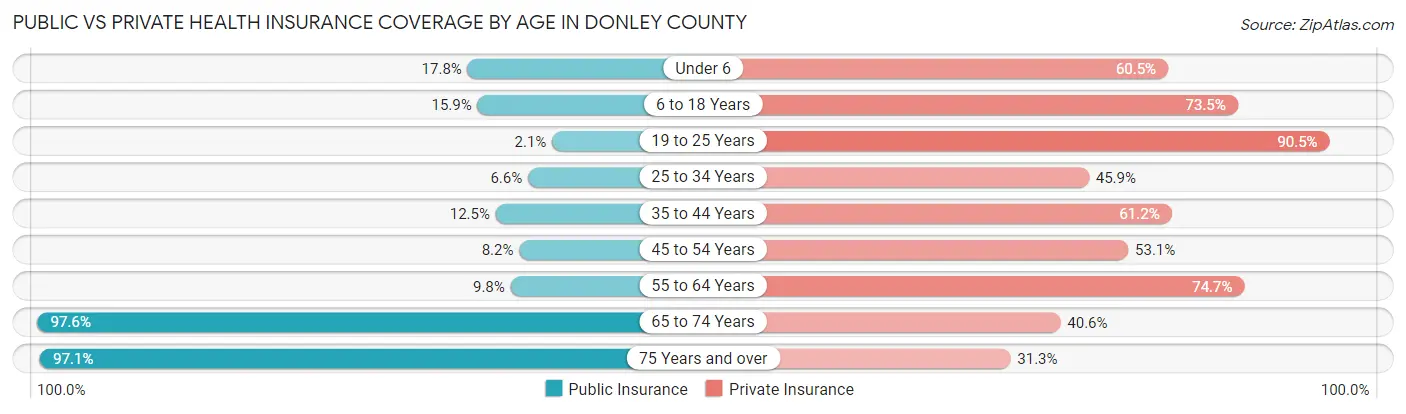
| Age Bracket | Public Insurance | Private Insurance |
| Under 6 | 27 (17.8%) | 92 (60.5%) |
| 6 to 18 Years | 93 (15.9%) | 429 (73.5%) |
| 19 to 25 Years | 9 (2.1%) | 391 (90.5%) |
| 25 to 34 Years | 15 (6.6%) | 105 (45.9%) |
| 35 to 44 Years | 42 (12.5%) | 205 (61.2%) |
| 45 to 54 Years | 26 (8.2%) | 169 (53.1%) |
| 55 to 64 Years | 41 (9.8%) | 313 (74.7%) |
| 65 to 74 Years | 445 (97.6%) | 185 (40.6%) |
| 75 Years and over | 270 (97.1%) | 87 (31.3%) |
| Total | 968 (30.2%) | 1,976 (61.7%) |
Disability Status by Sex by Age in Donley County
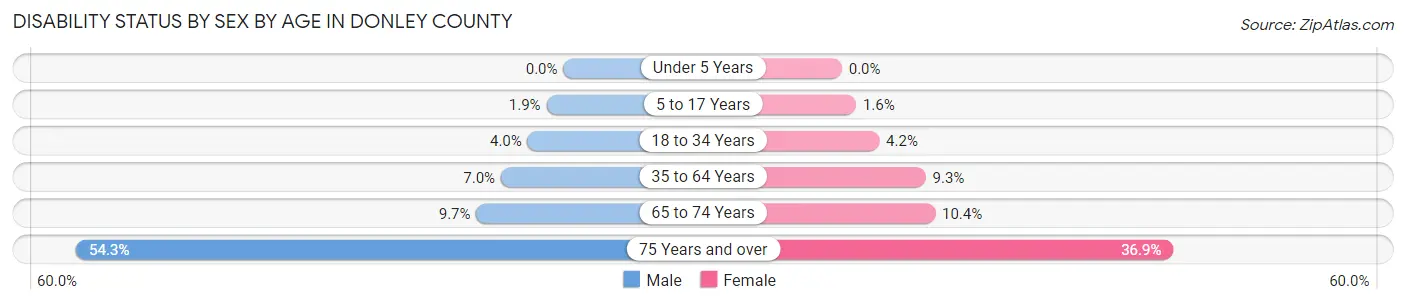
| Age Bracket | Male | Female |
| Under 5 Years | 0 (0.0%) | 0 (0.0%) |
| 5 to 17 Years | 6 (1.9%) | 3 (1.6%) |
| 18 to 34 Years | 14 (4.0%) | 17 (4.2%) |
| 35 to 64 Years | 38 (7.0%) | 49 (9.3%) |
| 65 to 74 Years | 19 (9.7%) | 27 (10.4%) |
| 75 Years and over | 70 (54.3%) | 55 (36.9%) |
Disability Class by Sex by Age in Donley County
Disability Class: Hearing Difficulty
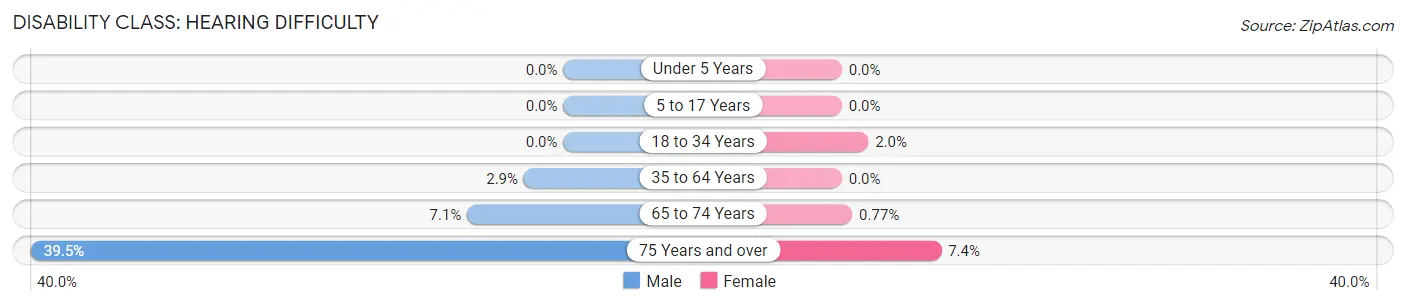
| Age Bracket | Male | Female |
| Under 5 Years | 0 (0.0%) | 0 (0.0%) |
| 5 to 17 Years | 0 (0.0%) | 0 (0.0%) |
| 18 to 34 Years | 0 (0.0%) | 8 (2.0%) |
| 35 to 64 Years | 16 (2.9%) | 0 (0.0%) |
| 65 to 74 Years | 14 (7.1%) | 2 (0.8%) |
| 75 Years and over | 51 (39.5%) | 11 (7.4%) |
Disability Class: Vision Difficulty
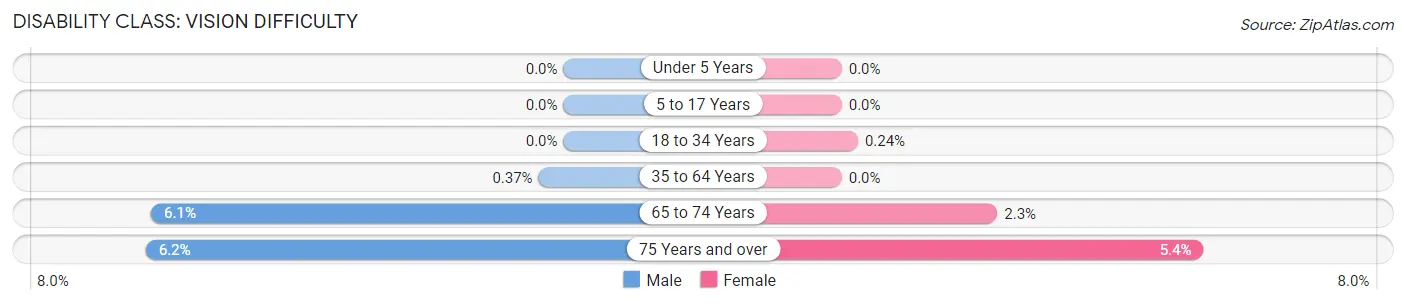
| Age Bracket | Male | Female |
| Under 5 Years | 0 (0.0%) | 0 (0.0%) |
| 5 to 17 Years | 0 (0.0%) | 0 (0.0%) |
| 18 to 34 Years | 0 (0.0%) | 1 (0.2%) |
| 35 to 64 Years | 2 (0.4%) | 0 (0.0%) |
| 65 to 74 Years | 12 (6.1%) | 6 (2.3%) |
| 75 Years and over | 8 (6.2%) | 8 (5.4%) |
Disability Class: Cognitive Difficulty
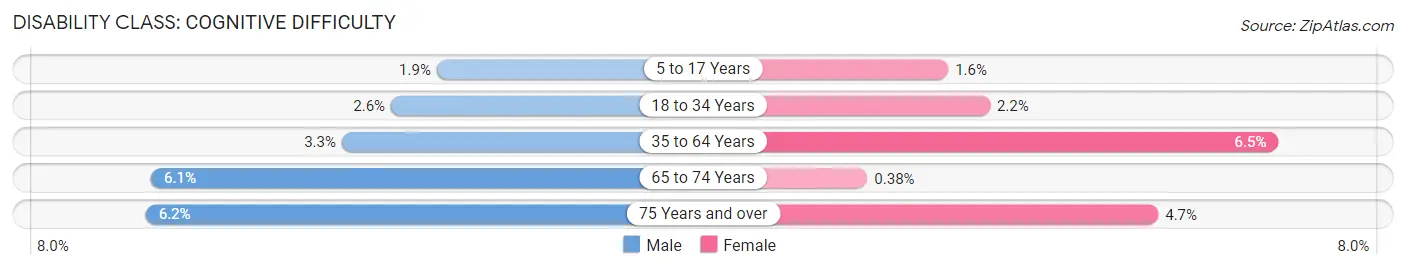
| Age Bracket | Male | Female |
| 5 to 17 Years | 6 (1.9%) | 3 (1.6%) |
| 18 to 34 Years | 9 (2.6%) | 9 (2.2%) |
| 35 to 64 Years | 18 (3.3%) | 34 (6.5%) |
| 65 to 74 Years | 12 (6.1%) | 1 (0.4%) |
| 75 Years and over | 8 (6.2%) | 7 (4.7%) |
Disability Class: Ambulatory Difficulty
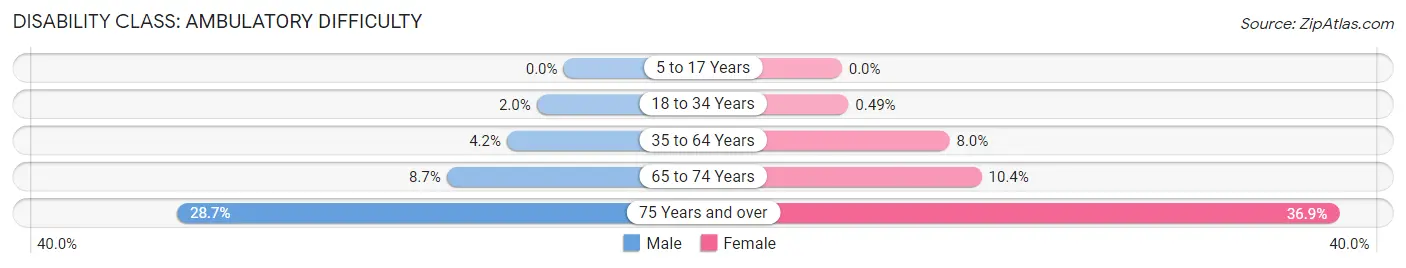
| Age Bracket | Male | Female |
| 5 to 17 Years | 0 (0.0%) | 0 (0.0%) |
| 18 to 34 Years | 7 (2.0%) | 2 (0.5%) |
| 35 to 64 Years | 23 (4.2%) | 42 (8.0%) |
| 65 to 74 Years | 17 (8.7%) | 27 (10.4%) |
| 75 Years and over | 37 (28.7%) | 55 (36.9%) |
Disability Class: Self-Care Difficulty
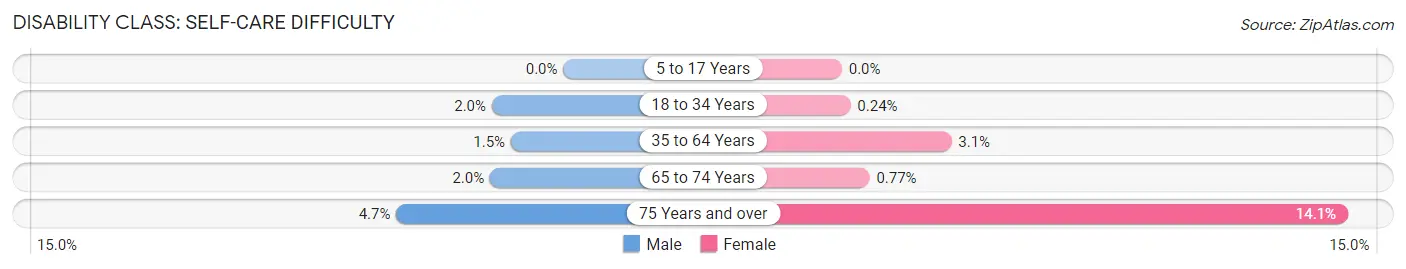
| Age Bracket | Male | Female |
| 5 to 17 Years | 0 (0.0%) | 0 (0.0%) |
| 18 to 34 Years | 7 (2.0%) | 1 (0.2%) |
| 35 to 64 Years | 8 (1.5%) | 16 (3.0%) |
| 65 to 74 Years | 4 (2.0%) | 2 (0.8%) |
| 75 Years and over | 6 (4.6%) | 21 (14.1%) |
Technology Access in Donley County
Computing Device Access in Donley County
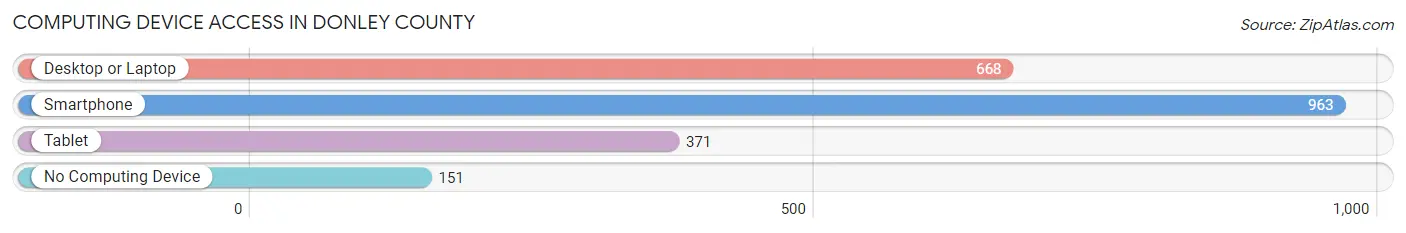
| Device Type | # Households | % Households |
| Desktop or Laptop | 668 | 55.8% |
| Smartphone | 963 | 80.4% |
| Tablet | 371 | 31.0% |
| No Computing Device | 151 | 12.6% |
| Total | 1,198 | 100.0% |
Internet Access in Donley County
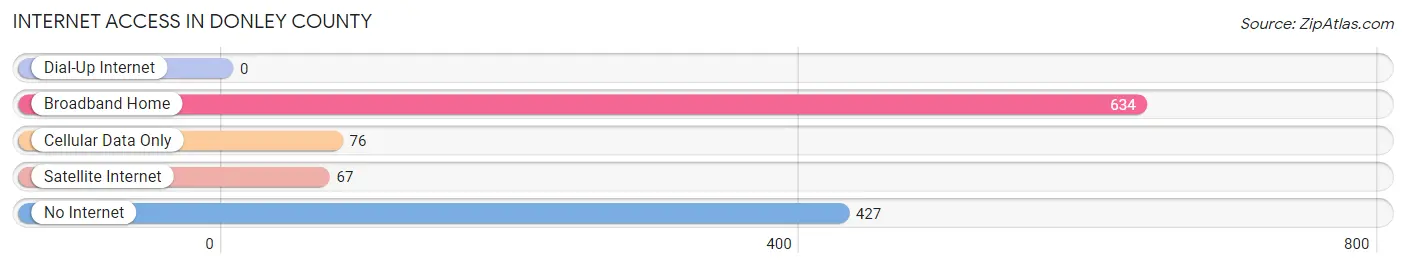
| Internet Type | # Households | % Households |
| Dial-Up Internet | 0 | 0.0% |
| Broadband Home | 634 | 52.9% |
| Cellular Data Only | 76 | 6.3% |
| Satellite Internet | 67 | 5.6% |
| No Internet | 427 | 35.6% |
| Total | 1,198 | 100.0% |
Donley County Summary
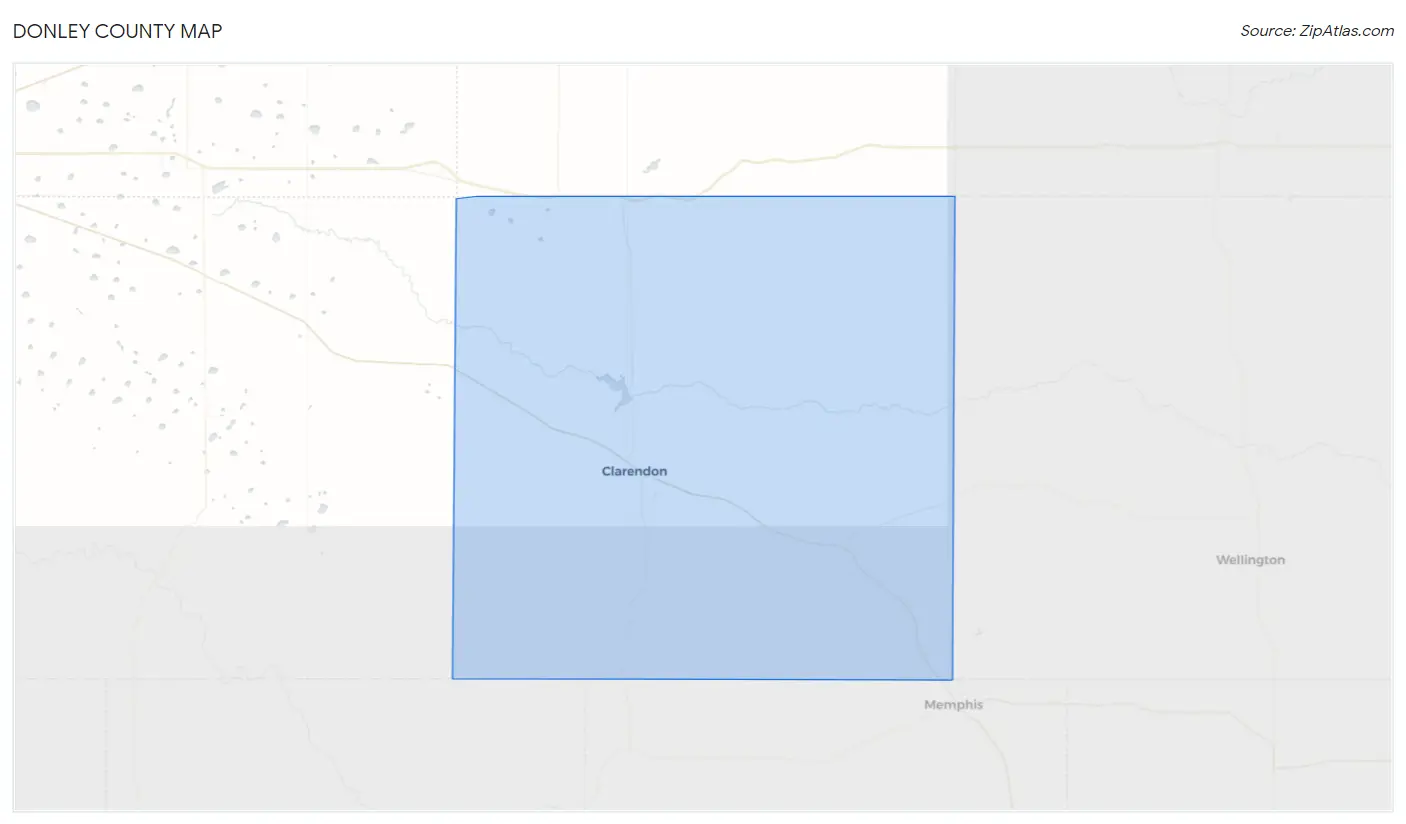
Donley County is located in the Texas Panhandle, in the northern part of the state. It is bordered by Collingsworth County to the north, Hall County to the east, Gray County to the south, and Armstrong County to the west. The county seat is Clarendon, and the largest city is Hedley.
History
Donley County was created in 1876 from the Bexar District of the Republic of Texas. It was named for Stockton P. Donley, a Texas state senator and Confederate veteran. The county was organized in 1882, and the first county seat was in Clarendon. In 1891, the county seat was moved to Howardwick, but it was moved back to Clarendon in 1895.
Geography
Donley County covers an area of 902 square miles, of which 899 square miles is land and 3 square miles is water. The county is located in the Texas Panhandle, and is mostly flat with some rolling hills. The Canadian River runs through the county, and there are several small lakes and reservoirs. The county is mostly covered in grassland, with some areas of mesquite and cedar trees.
Economy
The economy of Donley County is largely based on agriculture. The main crops grown in the county are wheat, sorghum, cotton, and hay. Cattle and sheep are also raised in the county. Oil and gas production is also an important part of the economy.
Demographics
As of the 2010 census, the population of Donley County was 3,677. The racial makeup of the county was 84.3% White, 0.7% African American, 0.7% Native American, 0.2% Asian, 11.7% from other races, and 2.4% from two or more races. Hispanic or Latino of any race were 24.3% of the population.
The median household income in Donley County was $37,917, and the median family income was $45,938. The per capita income was $17,945. About 16.2% of the population was below the poverty line.
The largest employers in Donley County are the school district, the county government, and the oil and gas industry. Other major employers include the agricultural industry, retail stores, and healthcare providers.
Common Questions
What is Per Capita Income in Donley County?
Per Capita income in Donley County is $25,682.
What is the Median Family Income in Donley County?
Median Family Income in Donley County is $73,352.
What is the Median Household income in Donley County?
Median Household Income in Donley County is $51,711.
What is Income or Wage Gap in Donley County?
Income or Wage Gap in Donley County is 1.1%.
Women in Donley County earn 98.9 cents for every dollar earned by a man.
What is Inequality or Gini Index in Donley County?
Inequality or Gini Index in Donley County is 0.42.
What is the Total Population of Donley County?
Total Population of Donley County is 3,298.
What is the Total Male Population of Donley County?
Total Male Population of Donley County is 1,666.
What is the Total Female Population of Donley County?
Total Female Population of Donley County is 1,632.
What is the Ratio of Males per 100 Females in Donley County?
There are 102.08 Males per 100 Females in Donley County.
What is the Ratio of Females per 100 Males in Donley County?
There are 97.96 Females per 100 Males in Donley County.
What is the Median Population Age in Donley County?
Median Population Age in Donley County is 40.3 Years.
What is the Average Family Size in Donley County
Average Family Size in Donley County is 3.2 People.
What is the Average Household Size in Donley County
Average Household Size in Donley County is 2.5 People.
How Large is the Labor Force in Donley County?
There are 1,385 People in the Labor Forcein in Donley County.
What is the Percentage of People in the Labor Force in Donley County?
51.3% of People are in the Labor Force in Donley County.