Dimmit County, TX Map & Demographics
Dimmit County Map
Dimmit County Overview
$19,505
PER CAPITA INCOME
$28,685
AVG FAMILY INCOME
$27,374
AVG HOUSEHOLD INCOME
53.1%
WAGE / INCOME GAP [ % ]
46.9¢/ $1
WAGE / INCOME GAP [ $ ]
$13,813
FAMILY INCOME DEFICIT
0.51
INEQUALITY / GINI INDEX
8,672
TOTAL POPULATION
4,349
MALE POPULATION
4,323
FEMALE POPULATION
100.60
MALES / 100 FEMALES
99.40
FEMALES / 100 MALES
36.4
MEDIAN AGE
3.5
AVG FAMILY SIZE
3.0
AVG HOUSEHOLD SIZE
2,469
LABOR FORCE [ PEOPLE ]
37.6%
PERCENT IN LABOR FORCE
4.7%
UNEMPLOYMENT RATE
Dimmit County Area Codes
Income in Dimmit County
Income Overview in Dimmit County
Per Capita Income in Dimmit County is $19,505, while median incomes of families and households are $28,685 and $27,374 respectively.
| Characteristic | Number | Measure |
| Per Capita Income | 8,672 | $19,505 |
| Median Family Income | 2,041 | $28,685 |
| Mean Family Income | 2,041 | $65,649 |
| Median Household Income | 2,808 | $27,374 |
| Mean Household Income | 2,808 | $58,081 |
| Income Deficit | 2,041 | $13,813 |
| Wage / Income Gap (%) | 8,672 | 53.10% |
| Wage / Income Gap ($) | 8,672 | 46.90¢ per $1 |
| Gini / Inequality Index | 8,672 | 0.51 |
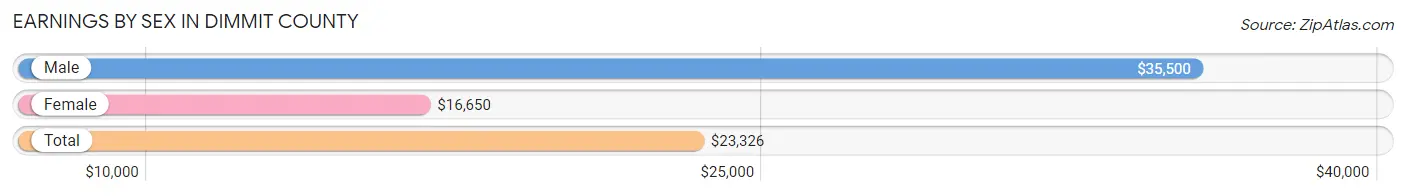
Earnings by Sex in Dimmit County
Average Earnings in Dimmit County are $23,326, $35,500 for men and $16,650 for women, a difference of 53.1%.
| Sex | Number | Average Earnings |
| Male | 1,806 (57.6%) | $35,500 |
| Female | 1,329 (42.4%) | $16,650 |
| Total | 3,135 (100.0%) | $23,326 |
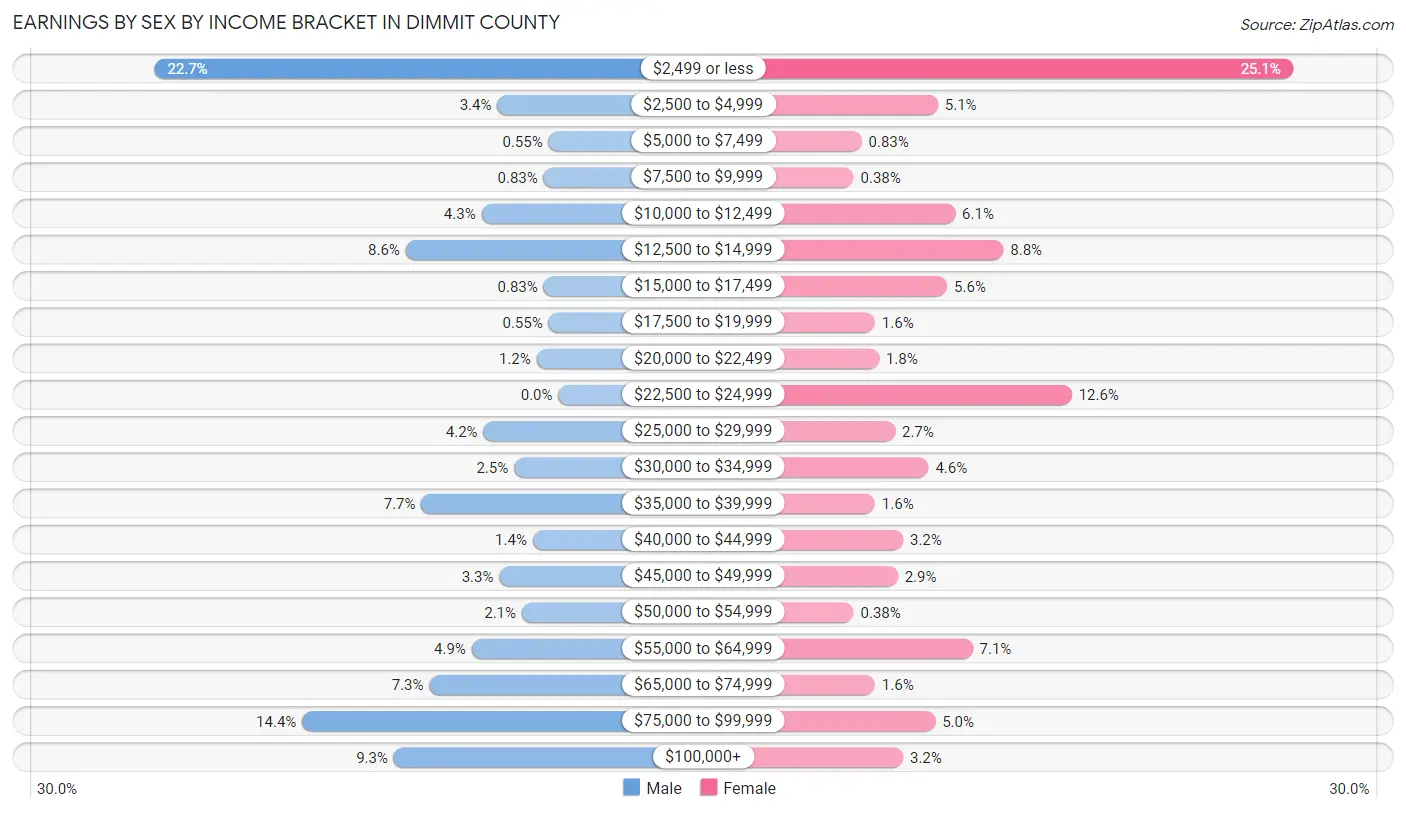
Earnings by Sex by Income Bracket in Dimmit County
The most common earnings brackets in Dimmit County are $2,499 or less for men (410 | 22.7%) and $2,499 or less for women (333 | 25.1%).
| Income | Male | Female |
| $2,499 or less | 410 (22.7%) | 333 (25.1%) |
| $2,500 to $4,999 | 62 (3.4%) | 68 (5.1%) |
| $5,000 to $7,499 | 10 (0.5%) | 11 (0.8%) |
| $7,500 to $9,999 | 15 (0.8%) | 5 (0.4%) |
| $10,000 to $12,499 | 78 (4.3%) | 81 (6.1%) |
| $12,500 to $14,999 | 155 (8.6%) | 117 (8.8%) |
| $15,000 to $17,499 | 15 (0.8%) | 75 (5.6%) |
| $17,500 to $19,999 | 10 (0.5%) | 21 (1.6%) |
| $20,000 to $22,499 | 22 (1.2%) | 24 (1.8%) |
| $22,500 to $24,999 | 0 (0.0%) | 168 (12.6%) |
| $25,000 to $29,999 | 76 (4.2%) | 36 (2.7%) |
| $30,000 to $34,999 | 45 (2.5%) | 61 (4.6%) |
| $35,000 to $39,999 | 139 (7.7%) | 21 (1.6%) |
| $40,000 to $44,999 | 26 (1.4%) | 42 (3.2%) |
| $45,000 to $49,999 | 60 (3.3%) | 38 (2.9%) |
| $50,000 to $54,999 | 37 (2.1%) | 5 (0.4%) |
| $55,000 to $64,999 | 88 (4.9%) | 94 (7.1%) |
| $65,000 to $74,999 | 131 (7.2%) | 21 (1.6%) |
| $75,000 to $99,999 | 260 (14.4%) | 66 (5.0%) |
| $100,000+ | 167 (9.2%) | 42 (3.2%) |
| Total | 1,806 (100.0%) | 1,329 (100.0%) |
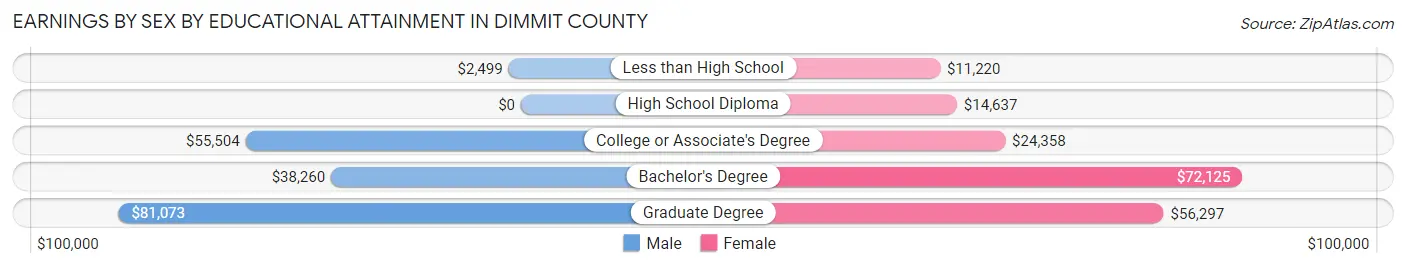
Earnings by Sex by Educational Attainment in Dimmit County
Average earnings in Dimmit County are $38,885 for men and $23,698 for women, a difference of 39.1%. Men with an educational attainment of graduate degree enjoy the highest average annual earnings of $81,073, while those with less than high school education earn the least with $2,499. Women with an educational attainment of bachelor's degree earn the most with the average annual earnings of $72,125, while those with less than high school education have the smallest earnings of $11,220.
| Educational Attainment | Male Income | Female Income |
| Less than High School | $2,499 | $11,220 |
| High School Diploma | - | - |
| College or Associate's Degree | $55,504 | $24,358 |
| Bachelor's Degree | $38,260 | $72,125 |
| Graduate Degree | $81,073 | $56,297 |
| Total | $38,885 | $23,698 |
Family Income in Dimmit County
Family Income Brackets in Dimmit County
According to the Dimmit County family income data, there are 541 families falling into the $15,000 to $24,999 income range, which is the most common income bracket and makes up 26.5% of all families. Conversely, the $200,000+ income bracket is the least frequent group with only 39 families (1.9%) belonging to this category.
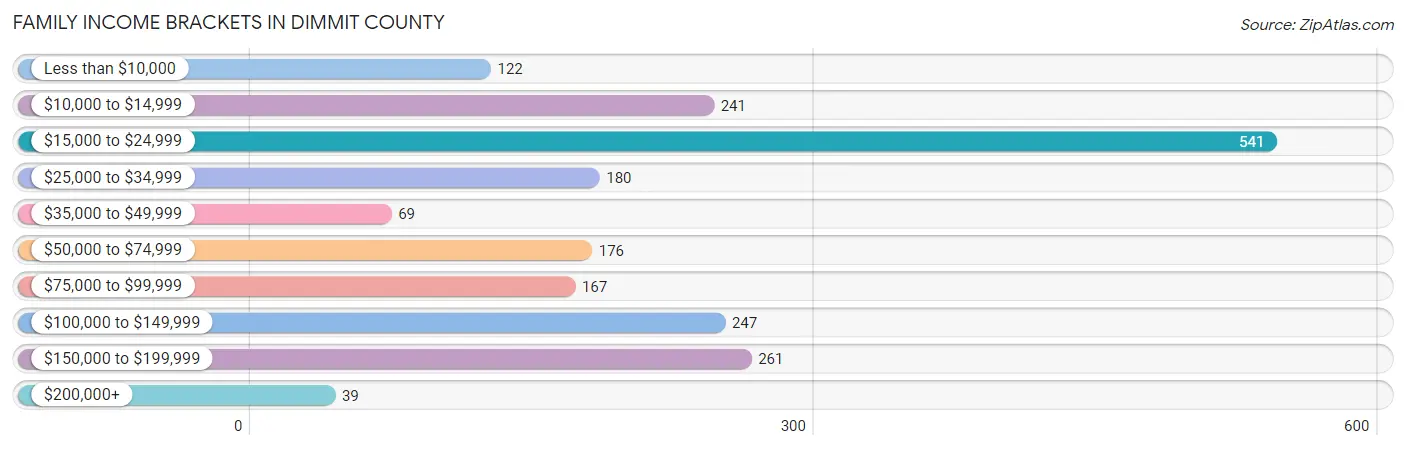
| Income Bracket | # Families | % Families |
| Less than $10,000 | 122 | 6.0% |
| $10,000 to $14,999 | 241 | 11.8% |
| $15,000 to $24,999 | 541 | 26.5% |
| $25,000 to $34,999 | 180 | 8.8% |
| $35,000 to $49,999 | 69 | 3.4% |
| $50,000 to $74,999 | 176 | 8.6% |
| $75,000 to $99,999 | 167 | 8.2% |
| $100,000 to $149,999 | 247 | 12.1% |
| $150,000 to $199,999 | 261 | 12.8% |
| $200,000+ | 39 | 1.9% |
Family Income by Famaliy Size in Dimmit County
5-person families (284 | 13.9%) account for the highest median family income in Dimmit County with $66,290 per family, while 5-person families (284 | 13.9%) have the highest median income of $13,258 per family member.
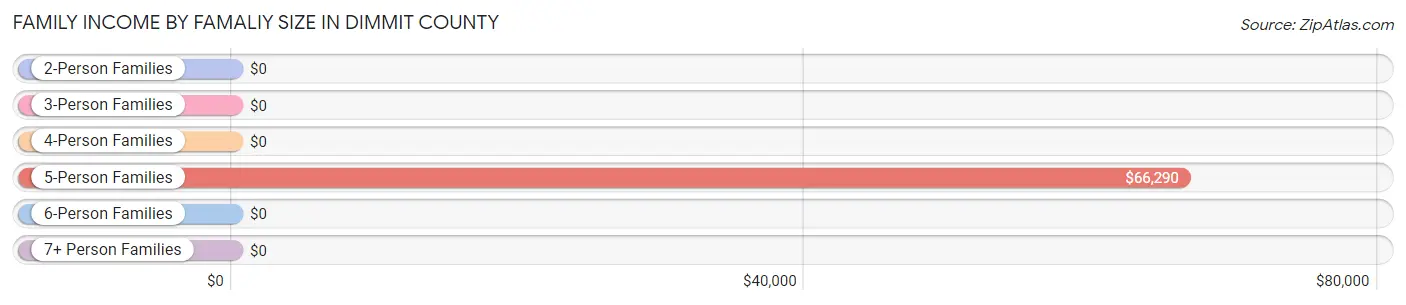
| Income Bracket | # Families | Median Income |
| 2-Person Families | 712 (34.9%) | $0 |
| 3-Person Families | 497 (24.3%) | $0 |
| 4-Person Families | 284 (13.9%) | $0 |
| 5-Person Families | 284 (13.9%) | $66,290 |
| 6-Person Families | 259 (12.7%) | $0 |
| 7+ Person Families | 5 (0.2%) | $0 |
| Total | 2,041 (100.0%) | $28,685 |
Family Income by Number of Earners in Dimmit County
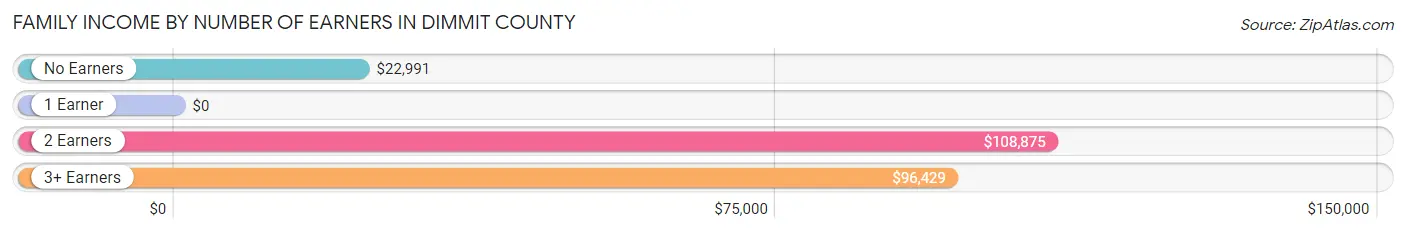
| Number of Earners | # Families | Median Income |
| No Earners | 689 (33.8%) | $22,991 |
| 1 Earner | 659 (32.3%) | $0 |
| 2 Earners | 649 (31.8%) | $108,875 |
| 3+ Earners | 44 (2.2%) | $96,429 |
| Total | 2,041 (100.0%) | $28,685 |
Household Income in Dimmit County
Household Income Brackets in Dimmit County
With 646 households falling in the category, the $15,000 to $24,999 income range is the most frequent in Dimmit County, accounting for 23.0% of all households. In contrast, only 39 households (1.4%) fall into the $200,000+ income bracket, making it the least populous group.
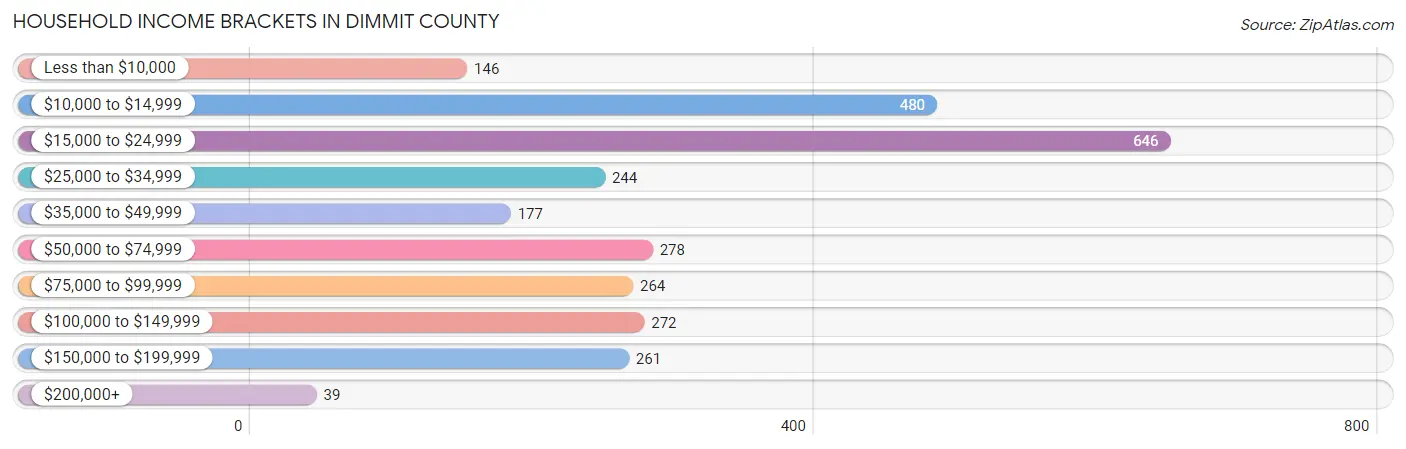
| Income Bracket | # Households | % Households |
| Less than $10,000 | 146 | 5.2% |
| $10,000 to $14,999 | 480 | 17.1% |
| $15,000 to $24,999 | 646 | 23.0% |
| $25,000 to $34,999 | 244 | 8.7% |
| $35,000 to $49,999 | 177 | 6.3% |
| $50,000 to $74,999 | 278 | 9.9% |
| $75,000 to $99,999 | 264 | 9.4% |
| $100,000 to $149,999 | 272 | 9.7% |
| $150,000 to $199,999 | 261 | 9.3% |
| $200,000+ | 39 | 1.4% |
Household Income by Householder Age in Dimmit County
The median household income in Dimmit County is $27,374, with the highest median household income of $66,008 found in the 45 to 64 years age bracket for the primary householder. A total of 917 households (32.7%) fall into this category. Meanwhile, the 25 to 44 years age bracket for the primary householder has the lowest median household income of $0, with 955 households (34.0%) in this group.
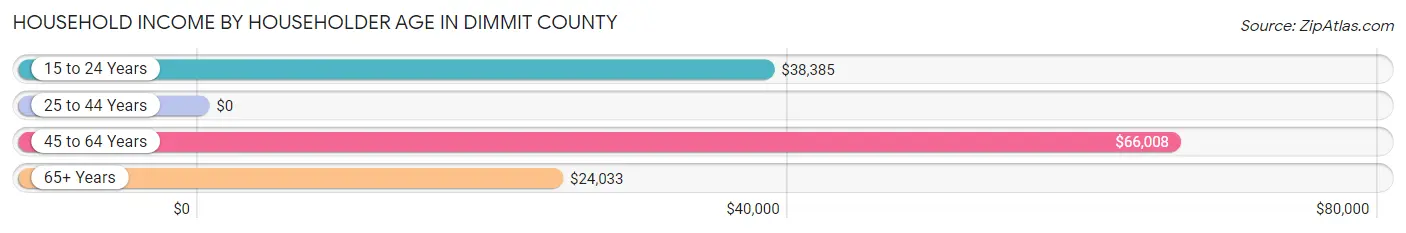
| Income Bracket | # Households | Median Income |
| 15 to 24 Years | 103 (3.7%) | $38,385 |
| 25 to 44 Years | 955 (34.0%) | $0 |
| 45 to 64 Years | 917 (32.7%) | $66,008 |
| 65+ Years | 833 (29.7%) | $24,033 |
| Total | 2,808 (100.0%) | $27,374 |
Poverty in Dimmit County
Income Below Poverty by Sex and Age in Dimmit County
With 41.4% poverty level for males and 45.8% for females among the residents of Dimmit County, under 5 year old males and 18 to 24 year old females are the most vulnerable to poverty, with 398 males (85.6%) and 369 females (69.4%) in their respective age groups living below the poverty level.
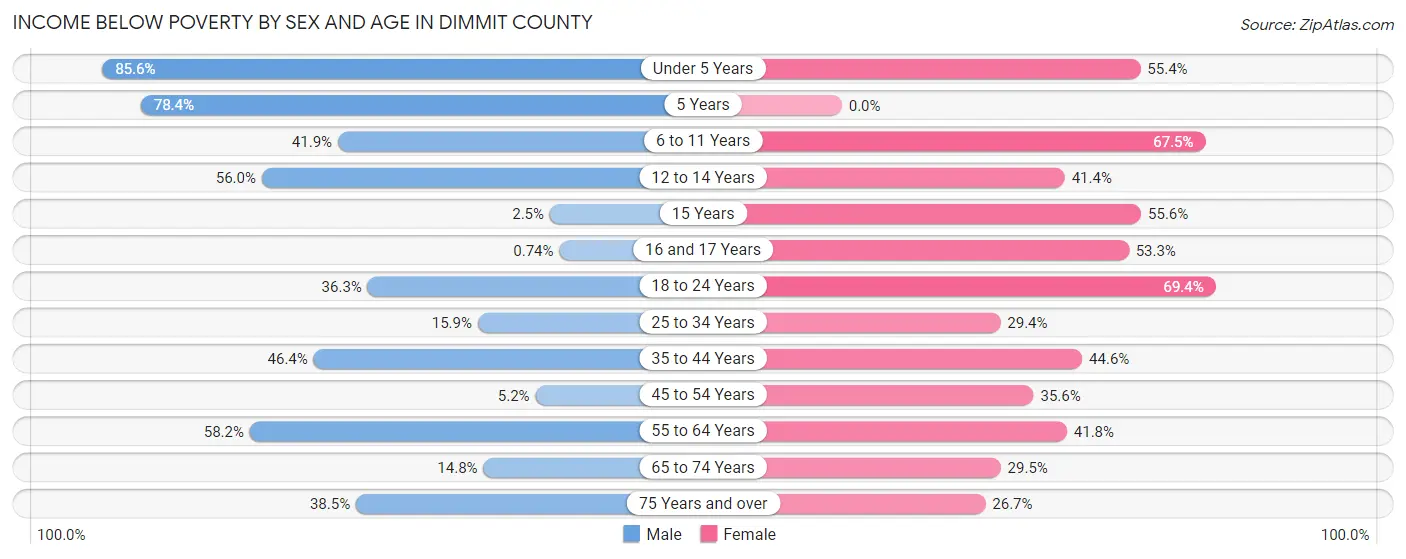
| Age Bracket | Male | Female |
| Under 5 Years | 398 (85.6%) | 51 (55.4%) |
| 5 Years | 120 (78.4%) | 0 (0.0%) |
| 6 to 11 Years | 113 (41.8%) | 388 (67.5%) |
| 12 to 14 Years | 145 (56.0%) | 84 (41.4%) |
| 15 Years | 2 (2.5%) | 5 (55.6%) |
| 16 and 17 Years | 1 (0.7%) | 90 (53.2%) |
| 18 to 24 Years | 146 (36.3%) | 369 (69.4%) |
| 25 to 34 Years | 54 (15.9%) | 113 (29.4%) |
| 35 to 44 Years | 362 (46.4%) | 327 (44.6%) |
| 45 to 54 Years | 17 (5.2%) | 121 (35.6%) |
| 55 to 64 Years | 259 (58.2%) | 183 (41.8%) |
| 65 to 74 Years | 54 (14.8%) | 138 (29.5%) |
| 75 Years and over | 97 (38.5%) | 89 (26.7%) |
| Total | 1,768 (41.4%) | 1,958 (45.8%) |
Income Above Poverty by Sex and Age in Dimmit County
According to the poverty statistics in Dimmit County, males aged 16 and 17 years and females aged 75 years and over are the age groups that are most secure financially, with 99.3% of males and 73.4% of females in these age groups living above the poverty line.
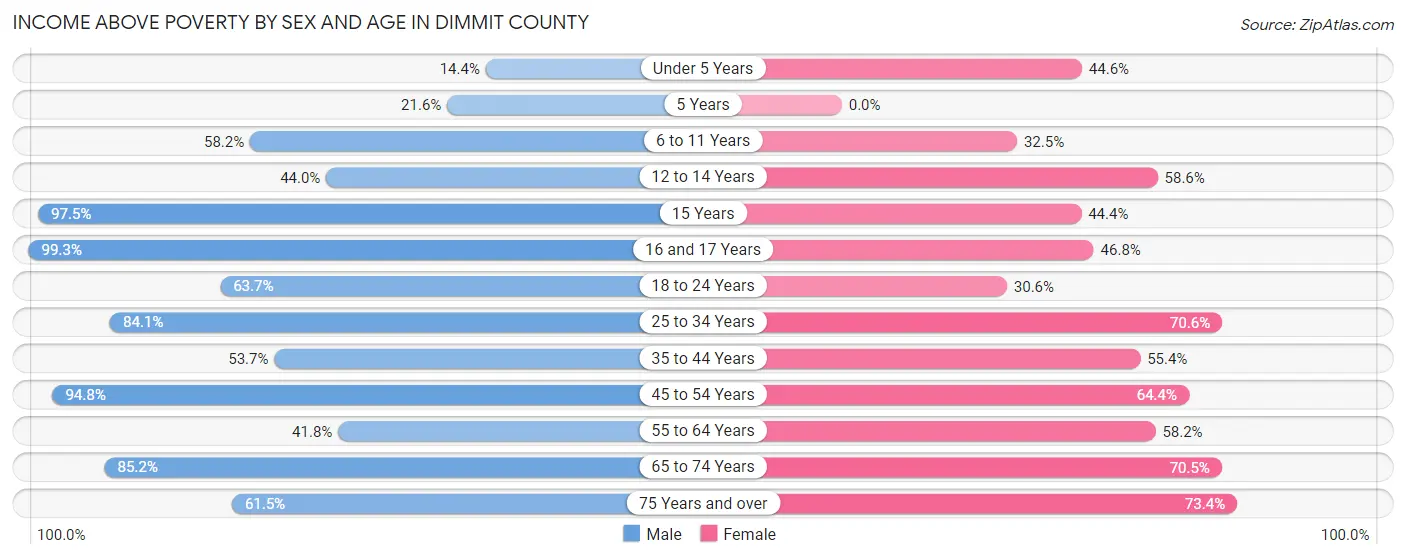
| Age Bracket | Male | Female |
| Under 5 Years | 67 (14.4%) | 41 (44.6%) |
| 5 Years | 33 (21.6%) | 0 (0.0%) |
| 6 to 11 Years | 157 (58.2%) | 187 (32.5%) |
| 12 to 14 Years | 114 (44.0%) | 119 (58.6%) |
| 15 Years | 78 (97.5%) | 4 (44.4%) |
| 16 and 17 Years | 135 (99.3%) | 79 (46.8%) |
| 18 to 24 Years | 256 (63.7%) | 163 (30.6%) |
| 25 to 34 Years | 286 (84.1%) | 271 (70.6%) |
| 35 to 44 Years | 419 (53.6%) | 406 (55.4%) |
| 45 to 54 Years | 311 (94.8%) | 219 (64.4%) |
| 55 to 64 Years | 186 (41.8%) | 255 (58.2%) |
| 65 to 74 Years | 310 (85.2%) | 330 (70.5%) |
| 75 Years and over | 155 (61.5%) | 245 (73.4%) |
| Total | 2,507 (58.6%) | 2,319 (54.2%) |
Income Below Poverty Among Married-Couple Families in Dimmit County
The poverty statistics for married-couple families in Dimmit County show that 9.6% or 107 of the total 1,113 families live below the poverty line. Families with no children have the highest poverty rate of 12.4%, comprising of 84 families. On the other hand, families with 3 or 4 children have the lowest poverty rate of 3.4%, which includes 5 families.
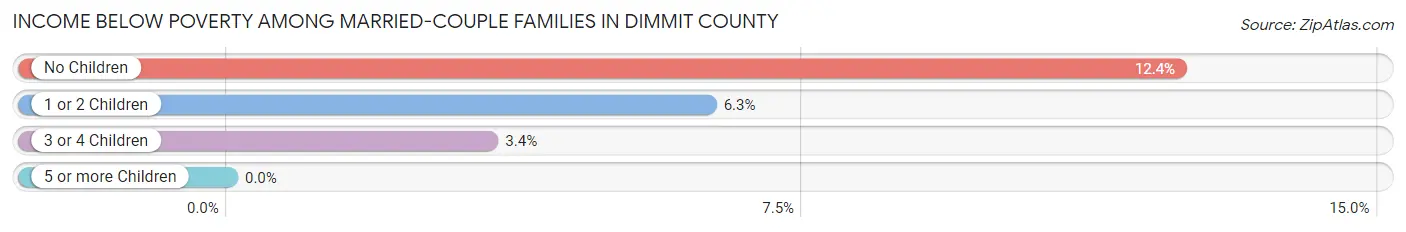
| Children | Above Poverty | Below Poverty |
| No Children | 594 (87.6%) | 84 (12.4%) |
| 1 or 2 Children | 270 (93.8%) | 18 (6.2%) |
| 3 or 4 Children | 142 (96.6%) | 5 (3.4%) |
| 5 or more Children | 0 (0.0%) | 0 (0.0%) |
| Total | 1,006 (90.4%) | 107 (9.6%) |
Income Below Poverty Among Single-Parent Households in Dimmit County
According to the poverty data in Dimmit County, 23.9% or 63 single-father households and 80.9% or 538 single-mother households are living below the poverty line. Among single-father households, those with 3 or 4 children have the highest poverty rate, with 22 households (66.7%) experiencing poverty. Likewise, among single-mother households, those with 3 or 4 children have the highest poverty rate, with 296 households (100.0%) falling below the poverty line.
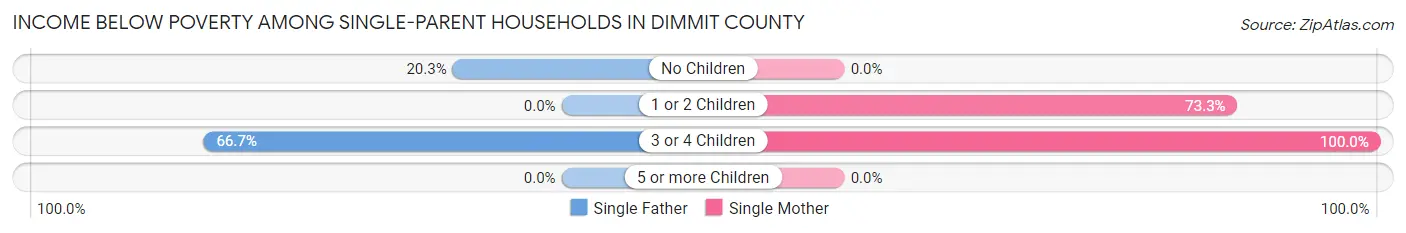
| Children | Single Father | Single Mother |
| No Children | 41 (20.3%) | 0 (0.0%) |
| 1 or 2 Children | 0 (0.0%) | 242 (73.3%) |
| 3 or 4 Children | 22 (66.7%) | 296 (100.0%) |
| 5 or more Children | 0 (0.0%) | 0 (0.0%) |
| Total | 63 (23.9%) | 538 (80.9%) |
Income Below Poverty Among Married-Couple vs Single-Parent Households in Dimmit County
The poverty data for Dimmit County shows that 107 of the married-couple family households (9.6%) and 601 of the single-parent households (64.8%) are living below the poverty level. Within the married-couple family households, those with no children have the highest poverty rate, with 84 households (12.4%) falling below the poverty line. Among the single-parent households, those with 3 or 4 children have the highest poverty rate, with 318 household (96.7%) living below poverty.
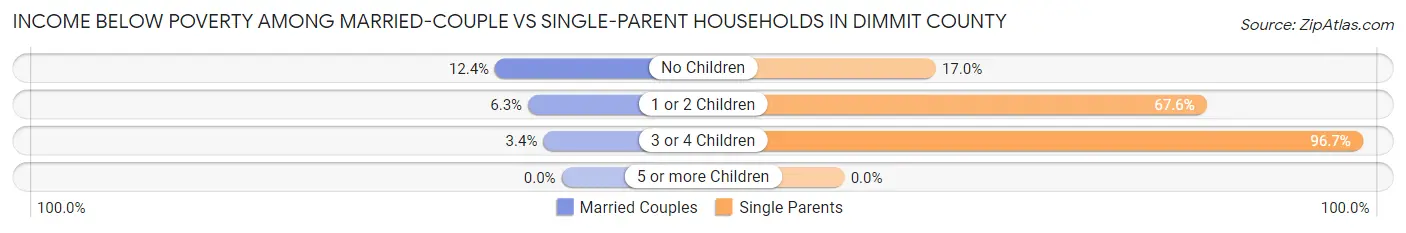
| Children | Married-Couple Families | Single-Parent Households |
| No Children | 84 (12.4%) | 41 (17.0%) |
| 1 or 2 Children | 18 (6.2%) | 242 (67.6%) |
| 3 or 4 Children | 5 (3.4%) | 318 (96.7%) |
| 5 or more Children | 0 (0.0%) | 0 (0.0%) |
| Total | 107 (9.6%) | 601 (64.8%) |
Race in Dimmit County
The most populous races in Dimmit County are Hispanic or Latino (7,628 | 88.0%), White / Caucasian (3,878 | 44.7%), and Two or more Races (3,805 | 43.9%).
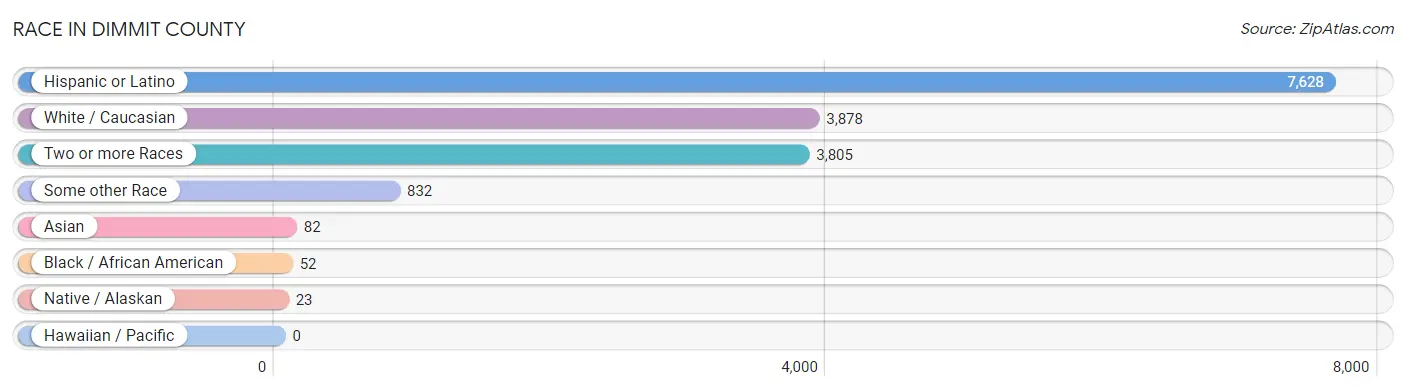
| Race | # Population | % Population |
| Asian | 82 | 0.9% |
| Black / African American | 52 | 0.6% |
| Hawaiian / Pacific | 0 | 0.0% |
| Hispanic or Latino | 7,628 | 88.0% |
| Native / Alaskan | 23 | 0.3% |
| White / Caucasian | 3,878 | 44.7% |
| Two or more Races | 3,805 | 43.9% |
| Some other Race | 832 | 9.6% |
| Total | 8,672 | 100.0% |
Ancestry in Dimmit County
The most populous ancestries reported in Dimmit County are Mexican (6,700 | 77.3%), Dominican (550 | 6.3%), Irish (234 | 2.7%), German (138 | 1.6%), and American (107 | 1.2%), together accounting for 89.1% of all Dimmit County residents.
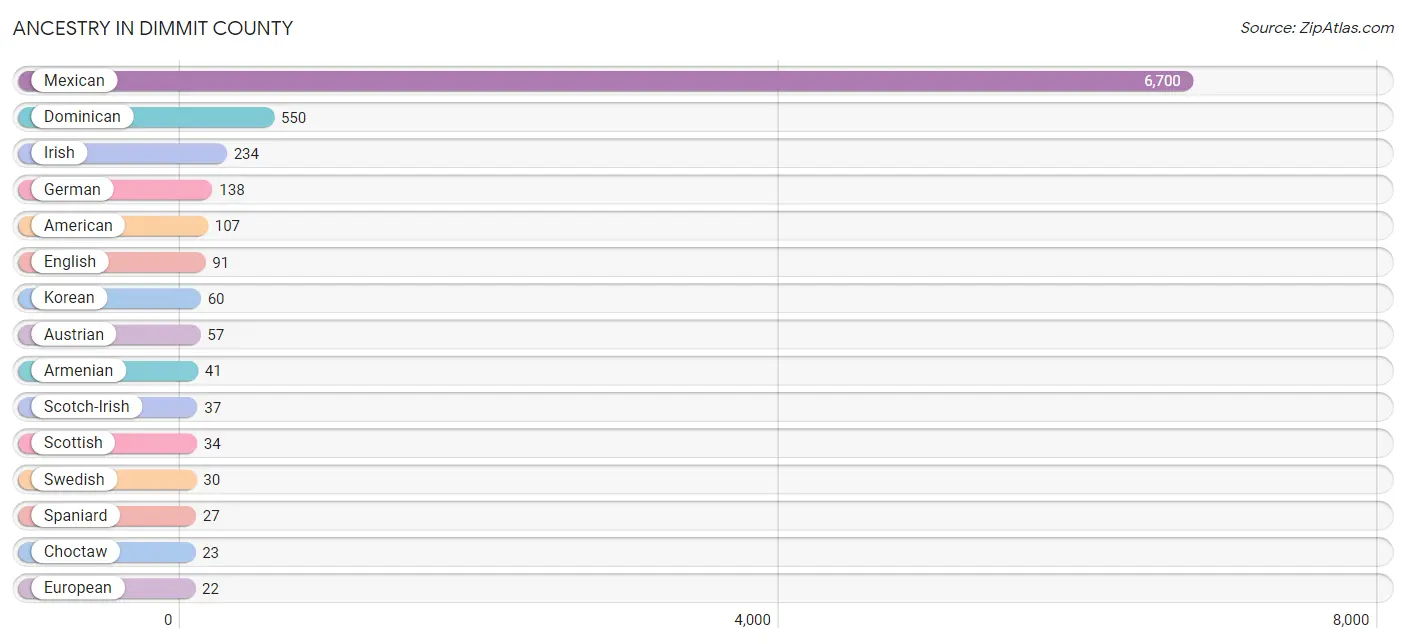
| Ancestry | # Population | % Population |
| American | 107 | 1.2% |
| Armenian | 41 | 0.5% |
| Austrian | 57 | 0.7% |
| Central American | 20 | 0.2% |
| Choctaw | 23 | 0.3% |
| Cuban | 4 | 0.1% |
| Czech | 4 | 0.1% |
| Czechoslovakian | 10 | 0.1% |
| Dominican | 550 | 6.3% |
| Dutch | 18 | 0.2% |
| Eastern European | 6 | 0.1% |
| English | 91 | 1.1% |
| European | 22 | 0.3% |
| German | 138 | 1.6% |
| Honduran | 18 | 0.2% |
| Irish | 234 | 2.7% |
| Korean | 60 | 0.7% |
| Mexican | 6,700 | 77.3% |
| Nicaraguan | 1 | 0.0% |
| Nigerian | 13 | 0.2% |
| Salvadoran | 1 | 0.0% |
| Scotch-Irish | 37 | 0.4% |
| Scottish | 34 | 0.4% |
| Spaniard | 27 | 0.3% |
| Sri Lankan | 13 | 0.2% |
| Subsaharan African | 13 | 0.2% |
| Swedish | 30 | 0.4% |
| Thai | 9 | 0.1% | View All 28 Rows |
Immigrants in Dimmit County
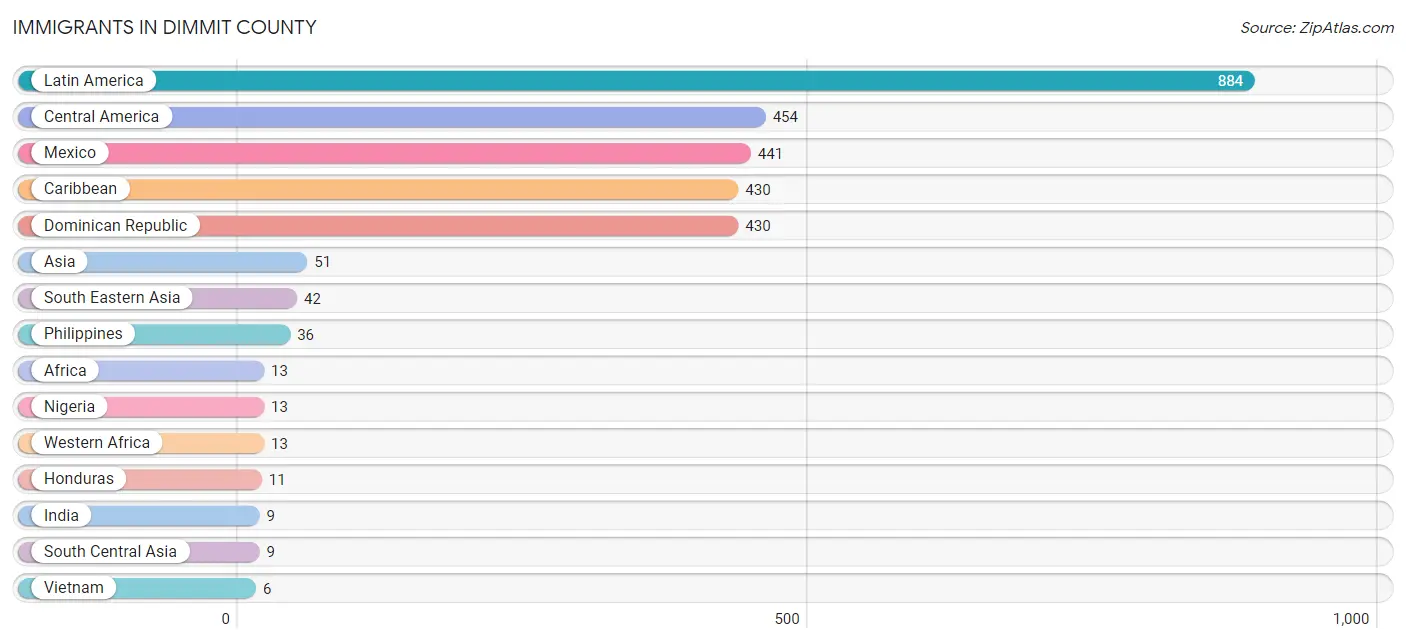
The most numerous immigrant groups reported in Dimmit County came from Latin America (884 | 10.2%), Central America (454 | 5.2%), Mexico (441 | 5.1%), Caribbean (430 | 5.0%), and Dominican Republic (430 | 5.0%), together accounting for 30.4% of all Dimmit County residents.
| Immigration Origin | # Population | % Population |
| Africa | 13 | 0.2% |
| Asia | 51 | 0.6% |
| Caribbean | 430 | 5.0% |
| Central America | 454 | 5.2% |
| Dominican Republic | 430 | 5.0% |
| El Salvador | 1 | 0.0% |
| Honduras | 11 | 0.1% |
| India | 9 | 0.1% |
| Latin America | 884 | 10.2% |
| Mexico | 441 | 5.1% |
| Nicaragua | 1 | 0.0% |
| Nigeria | 13 | 0.2% |
| Philippines | 36 | 0.4% |
| South Central Asia | 9 | 0.1% |
| South Eastern Asia | 42 | 0.5% |
| Vietnam | 6 | 0.1% |
| Western Africa | 13 | 0.2% | View All 17 Rows |
Sex and Age in Dimmit County
Sex and Age in Dimmit County
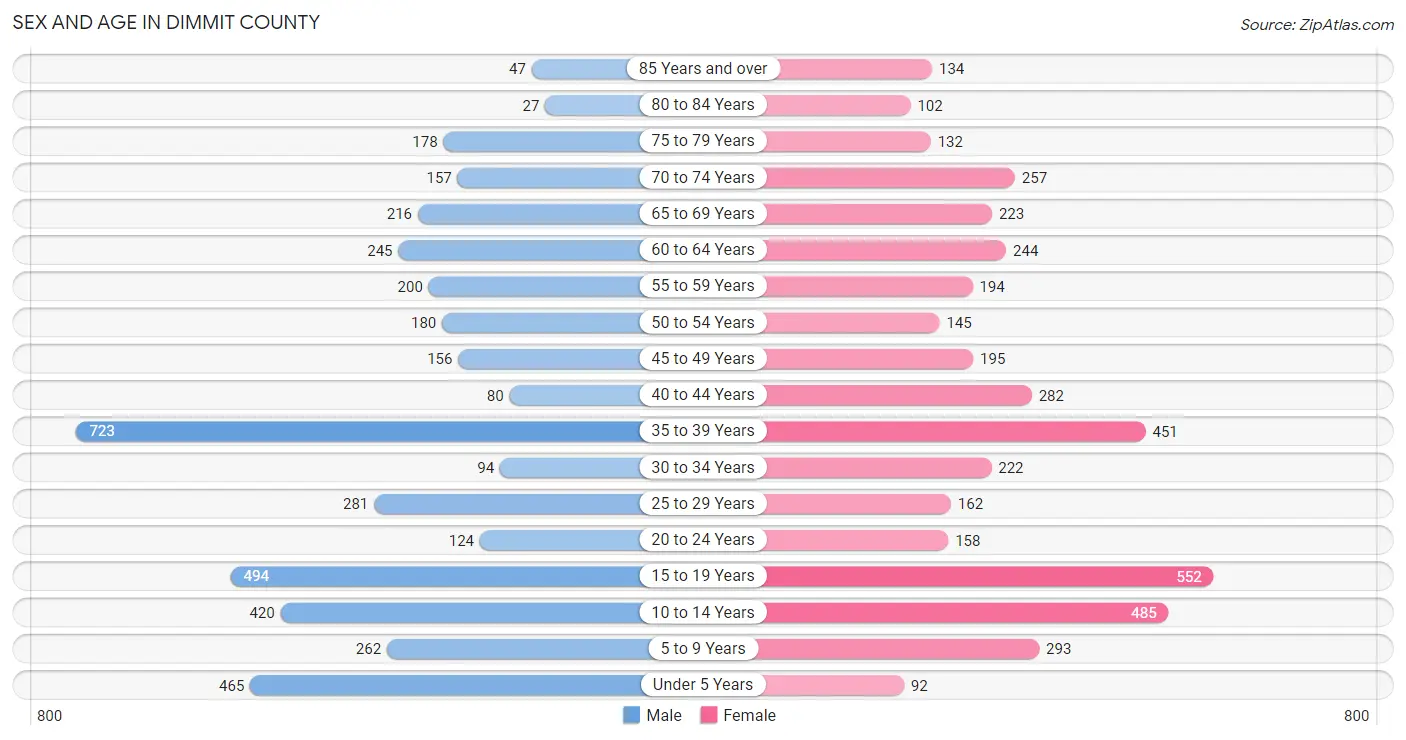
The most populous age groups in Dimmit County are 35 to 39 Years (723 | 16.6%) for men and 15 to 19 Years (552 | 12.8%) for women.
| Age Bracket | Male | Female |
| Under 5 Years | 465 (10.7%) | 92 (2.1%) |
| 5 to 9 Years | 262 (6.0%) | 293 (6.8%) |
| 10 to 14 Years | 420 (9.7%) | 485 (11.2%) |
| 15 to 19 Years | 494 (11.4%) | 552 (12.8%) |
| 20 to 24 Years | 124 (2.9%) | 158 (3.6%) |
| 25 to 29 Years | 281 (6.5%) | 162 (3.7%) |
| 30 to 34 Years | 94 (2.2%) | 222 (5.1%) |
| 35 to 39 Years | 723 (16.6%) | 451 (10.4%) |
| 40 to 44 Years | 80 (1.8%) | 282 (6.5%) |
| 45 to 49 Years | 156 (3.6%) | 195 (4.5%) |
| 50 to 54 Years | 180 (4.1%) | 145 (3.4%) |
| 55 to 59 Years | 200 (4.6%) | 194 (4.5%) |
| 60 to 64 Years | 245 (5.6%) | 244 (5.6%) |
| 65 to 69 Years | 216 (5.0%) | 223 (5.2%) |
| 70 to 74 Years | 157 (3.6%) | 257 (5.9%) |
| 75 to 79 Years | 178 (4.1%) | 132 (3.0%) |
| 80 to 84 Years | 27 (0.6%) | 102 (2.4%) |
| 85 Years and over | 47 (1.1%) | 134 (3.1%) |
| Total | 4,349 (100.0%) | 4,323 (100.0%) |
Families and Households in Dimmit County
Median Family Size in Dimmit County
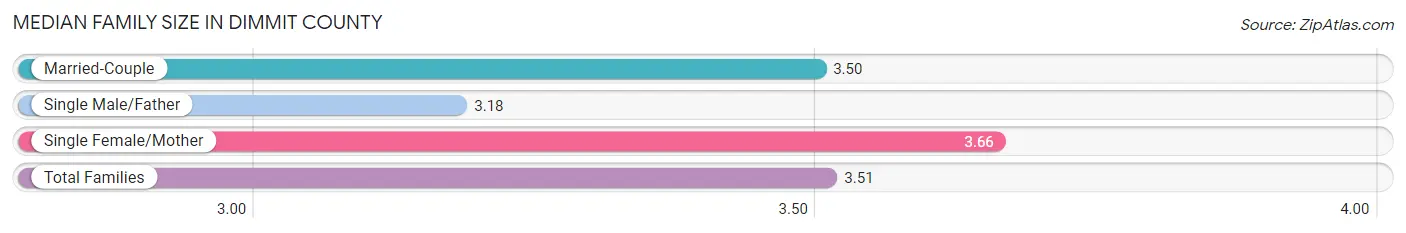
The median family size in Dimmit County is 3.51 persons per family, with single female/mother families (665 | 32.6%) accounting for the largest median family size of 3.66 persons per family. On the other hand, single male/father families (263 | 12.9%) represent the smallest median family size with 3.18 persons per family.
| Family Type | # Families | Family Size |
| Married-Couple | 1,113 (54.5%) | 3.50 |
| Single Male/Father | 263 (12.9%) | 3.18 |
| Single Female/Mother | 665 (32.6%) | 3.66 |
| Total Families | 2,041 (100.0%) | 3.51 |
Median Household Size in Dimmit County
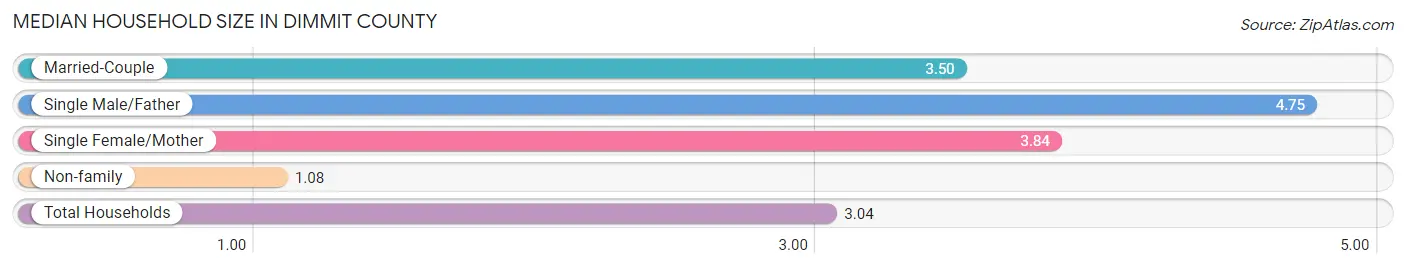
The median household size in Dimmit County is 3.04 persons per household, with single male/father households (263 | 9.4%) accounting for the largest median household size of 4.75 persons per household. non-family households (767 | 27.3%) represent the smallest median household size with 1.08 persons per household.
| Household Type | # Households | Household Size |
| Married-Couple | 1,113 (39.6%) | 3.50 |
| Single Male/Father | 263 (9.4%) | 4.75 |
| Single Female/Mother | 665 (23.7%) | 3.84 |
| Non-family | 767 (27.3%) | 1.08 |
| Total Households | 2,808 (100.0%) | 3.04 |
Household Size by Marriage Status in Dimmit County
Out of a total of 2,808 households in Dimmit County, 2,041 (72.7%) are family households, while 767 (27.3%) are nonfamily households. The most numerous type of family households are 3-person households, comprising 579, and the most common type of nonfamily households are 1-person households, comprising 740.
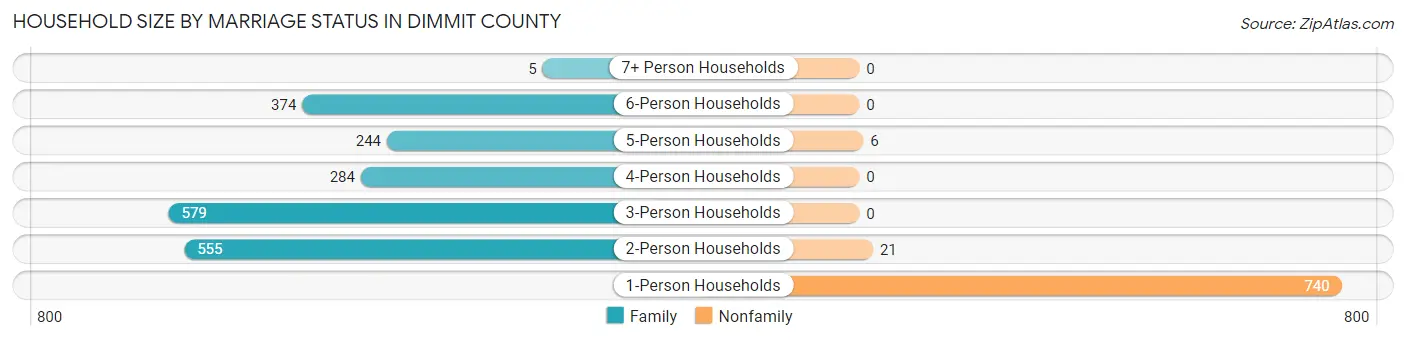
| Household Size | Family Households | Nonfamily Households |
| 1-Person Households | - | 740 (26.4%) |
| 2-Person Households | 555 (19.8%) | 21 (0.7%) |
| 3-Person Households | 579 (20.6%) | 0 (0.0%) |
| 4-Person Households | 284 (10.1%) | 0 (0.0%) |
| 5-Person Households | 244 (8.7%) | 6 (0.2%) |
| 6-Person Households | 374 (13.3%) | 0 (0.0%) |
| 7+ Person Households | 5 (0.2%) | 0 (0.0%) |
| Total | 2,041 (72.7%) | 767 (27.3%) |
Female Fertility in Dimmit County
Fertility by Age in Dimmit County
Average fertility rate in Dimmit County is 62.0 births per 1,000 women. Women in the age bracket of 20 to 34 years have the highest fertility rate with 199.0 births per 1,000 women. Women in the age bracket of 20 to 34 years acount for 83.1% of all women with births.
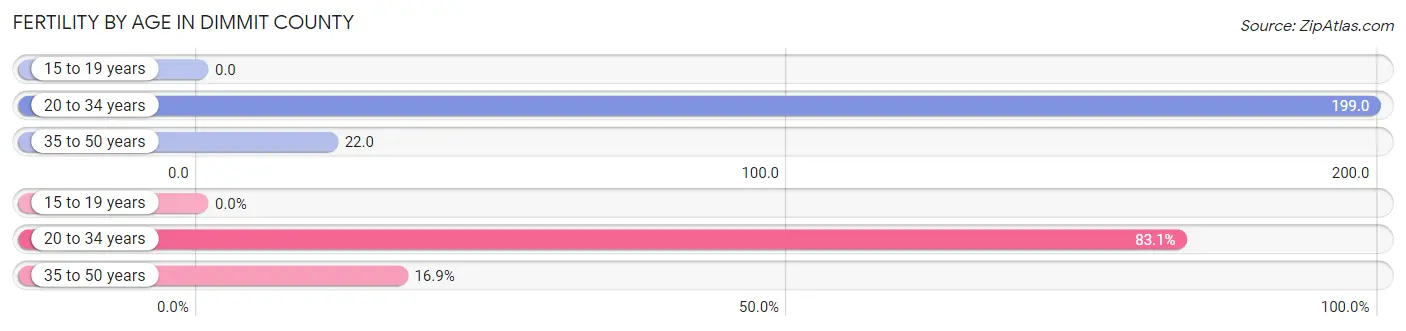
| Age Bracket | Women with Births | Births / 1,000 Women |
| 15 to 19 years | 0 (0.0%) | 0.0 |
| 20 to 34 years | 108 (83.1%) | 199.0 |
| 35 to 50 years | 22 (16.9%) | 22.0 |
| Total | 130 (100.0%) | 62.0 |
Fertility by Age by Marriage Status in Dimmit County
70.0% of women with births (130) in Dimmit County are married. The highest percentage of unmarried women with births falls into 20 to 34 years age bracket with 36.1% of them unmarried at the time of birth, while the lowest percentage of unmarried women with births belong to 35 to 50 years age bracket with 0.0% of them unmarried.
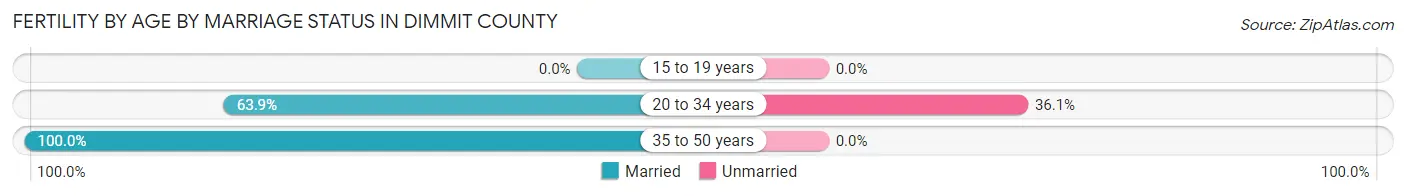
| Age Bracket | Married | Unmarried |
| 15 to 19 years | 0 (0.0%) | 0 (0.0%) |
| 20 to 34 years | 69 (63.9%) | 39 (36.1%) |
| 35 to 50 years | 22 (100.0%) | 0 (0.0%) |
| Total | 91 (70.0%) | 39 (30.0%) |
Fertility by Education in Dimmit County
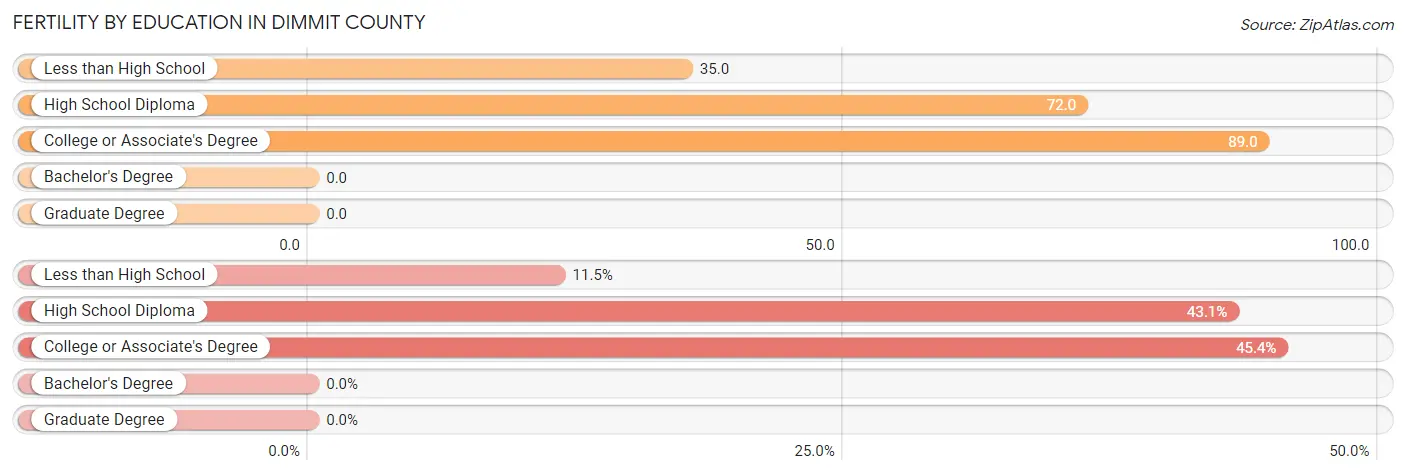
| Educational Attainment | Women with Births | Births / 1,000 Women |
| Less than High School | 15 (11.5%) | 35.0 |
| High School Diploma | 56 (43.1%) | 72.0 |
| College or Associate's Degree | 59 (45.4%) | 89.0 |
| Bachelor's Degree | 0 (0.0%) | 0.0 |
| Graduate Degree | 0 (0.0%) | 0.0 |
| Total | 130 (100.0%) | 62.0 |
Fertility by Education by Marriage Status in Dimmit County
30.0% of women with births in Dimmit County are unmarried. Women with the educational attainment of college or associate's degree are most likely to be married with 100.0% of them married at childbirth, while women with the educational attainment of high school diploma are least likely to be married with 60.7% of them unmarried at childbirth.
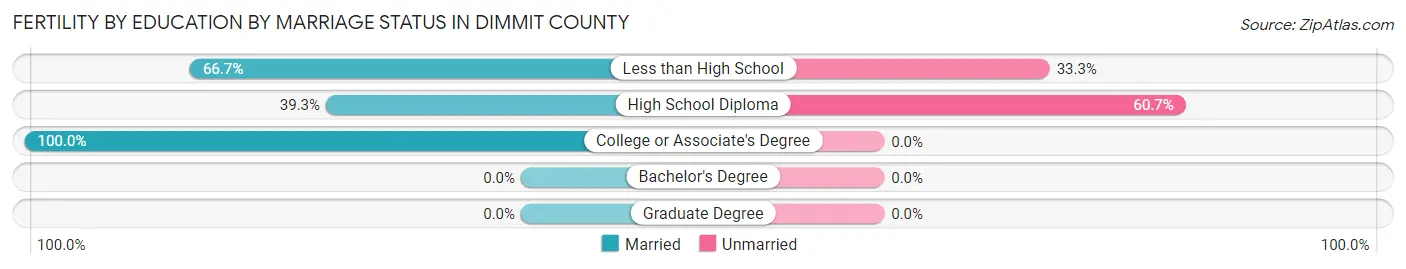
| Educational Attainment | Married | Unmarried |
| Less than High School | 10 (66.7%) | 5 (33.3%) |
| High School Diploma | 22 (39.3%) | 34 (60.7%) |
| College or Associate's Degree | 59 (100.0%) | 0 (0.0%) |
| Bachelor's Degree | 0 (0.0%) | 0 (0.0%) |
| Graduate Degree | 0 (0.0%) | 0 (0.0%) |
| Total | 91 (70.0%) | 39 (30.0%) |
Employment Characteristics in Dimmit County
Employment by Class of Employer in Dimmit County
Among the 2,352 employed individuals in Dimmit County, private company employees (1,681 | 71.5%), self-employed (not incorporated) (239 | 10.2%), and local government employees (159 | 6.8%) make up the most common classes of employment.
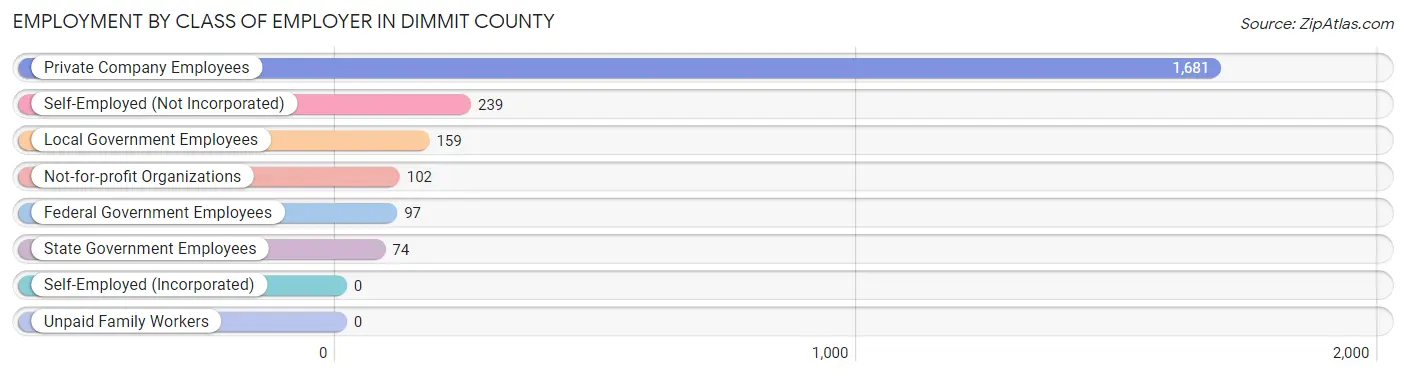
| Employer Class | # Employees | % Employees |
| Private Company Employees | 1,681 | 71.5% |
| Self-Employed (Incorporated) | 0 | 0.0% |
| Self-Employed (Not Incorporated) | 239 | 10.2% |
| Not-for-profit Organizations | 102 | 4.3% |
| Local Government Employees | 159 | 6.8% |
| State Government Employees | 74 | 3.2% |
| Federal Government Employees | 97 | 4.1% |
| Unpaid Family Workers | 0 | 0.0% |
| Total | 2,352 | 100.0% |
Employment Status by Age in Dimmit County
According to the labor force statistics for Dimmit County, out of the total population over 16 years of age (6,566), 37.6% or 2,469 individuals are in the labor force, with 4.7% or 116 of them unemployed. The age group with the highest labor force participation rate is 45 to 54 years, with 75.4% or 510 individuals in the labor force. Within the labor force, the 60 to 64 years age range has the highest percentage of unemployed individuals, with 50.0% or 21 of them being unemployed.
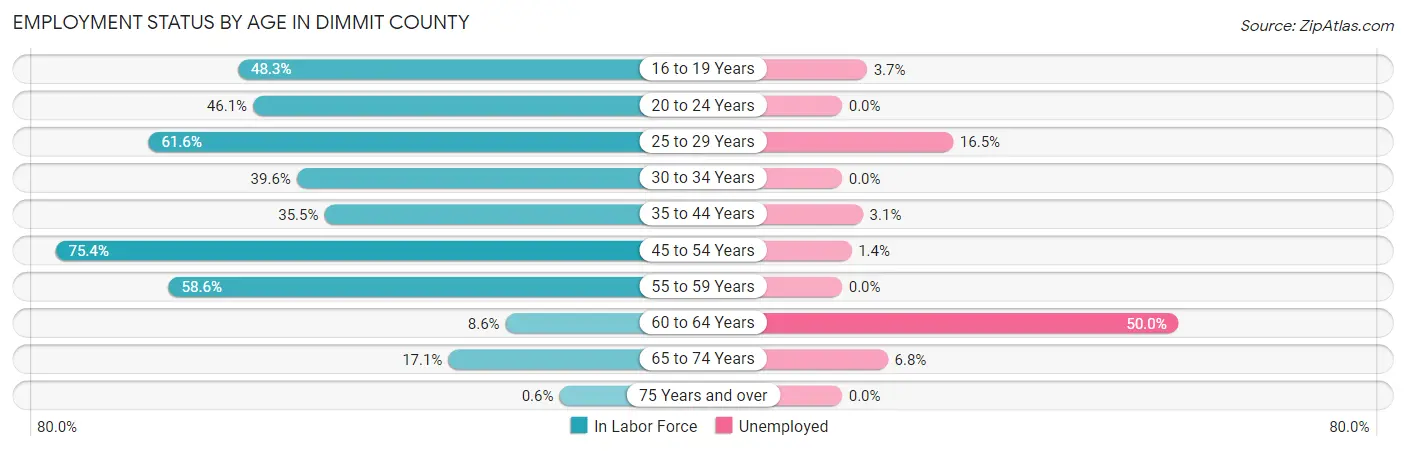
| Age Bracket | In Labor Force | Unemployed |
| 16 to 19 Years | 462 (48.3%) | 17 (3.7%) |
| 20 to 24 Years | 130 (46.1%) | 0 (0.0%) |
| 25 to 29 Years | 273 (61.6%) | 45 (16.5%) |
| 30 to 34 Years | 125 (39.6%) | 0 (0.0%) |
| 35 to 44 Years | 545 (35.5%) | 17 (3.1%) |
| 45 to 54 Years | 510 (75.4%) | 7 (1.4%) |
| 55 to 59 Years | 231 (58.6%) | 0 (0.0%) |
| 60 to 64 Years | 42 (8.6%) | 21 (50.0%) |
| 65 to 74 Years | 146 (17.1%) | 10 (6.8%) |
| 75 Years and over | 4 (0.6%) | 0 (0.0%) |
| Total | 2,469 (37.6%) | 116 (4.7%) |
Employment Status by Educational Attainment in Dimmit County
According to labor force statistics for Dimmit County, 44.8% of individuals (1,727) out of the total population between 25 and 64 years of age (3,854) are in the labor force, with 5.2% or 90 of them being unemployed. The group with the highest labor force participation rate are those with the educational attainment of bachelor's degree or higher, with 58.2% or 365 individuals in the labor force. Within the labor force, individuals with less than high school education have the highest percentage of unemployment, with 7.0% or 13 of them being unemployed.
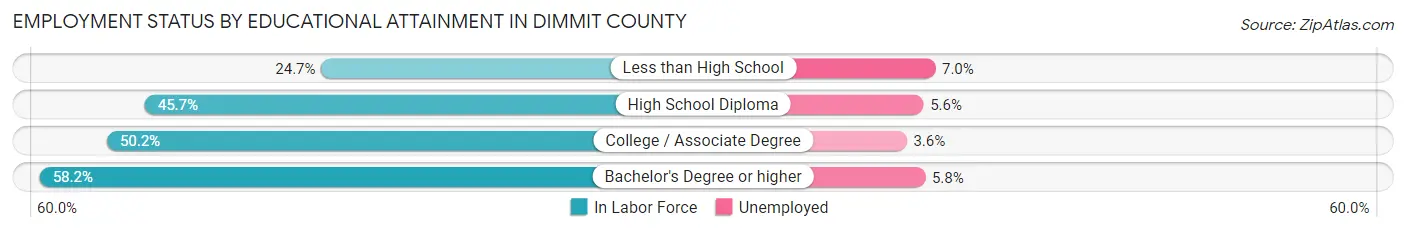
| Educational Attainment | In Labor Force | Unemployed |
| Less than High School | 185 (24.7%) | 52 (7.0%) |
| High School Diploma | 681 (45.7%) | 83 (5.6%) |
| College / Associate Degree | 496 (50.2%) | 36 (3.6%) |
| Bachelor's Degree or higher | 365 (58.2%) | 36 (5.8%) |
| Total | 1,727 (44.8%) | 200 (5.2%) |
Employment Occupations by Sex in Dimmit County
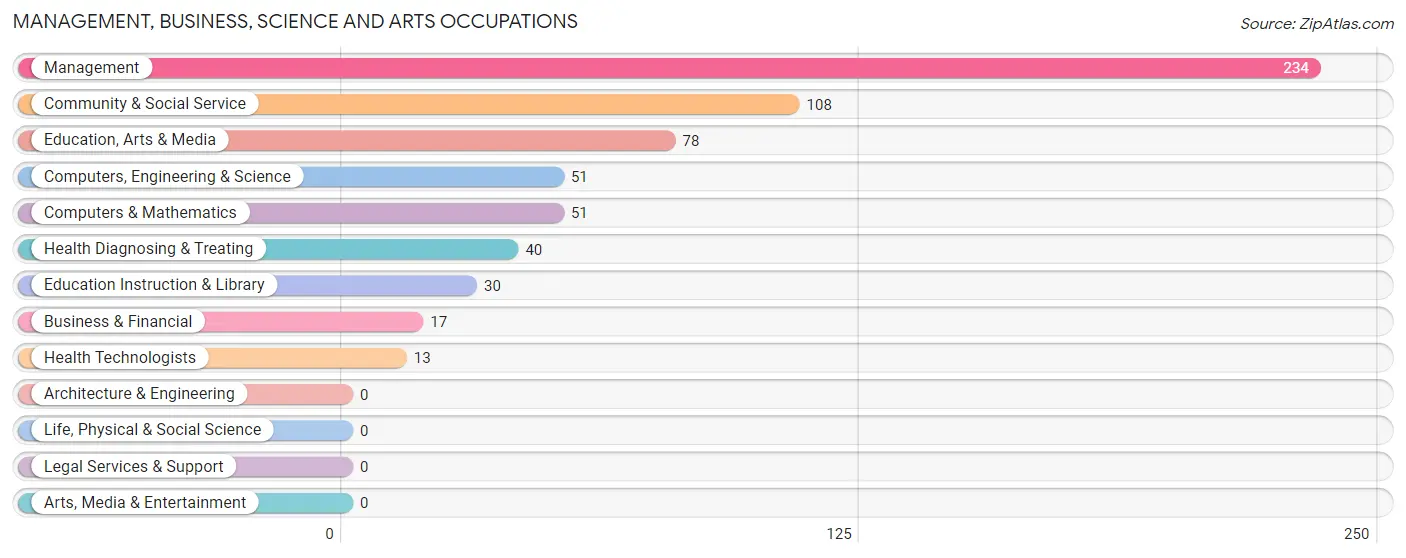
Management, Business, Science and Arts Occupations
The most common Management, Business, Science and Arts occupations in Dimmit County are Management (234 | 10.0%), Community & Social Service (108 | 4.6%), Education, Arts & Media (78 | 3.3%), Computers, Engineering & Science (51 | 2.2%), and Computers & Mathematics (51 | 2.2%).
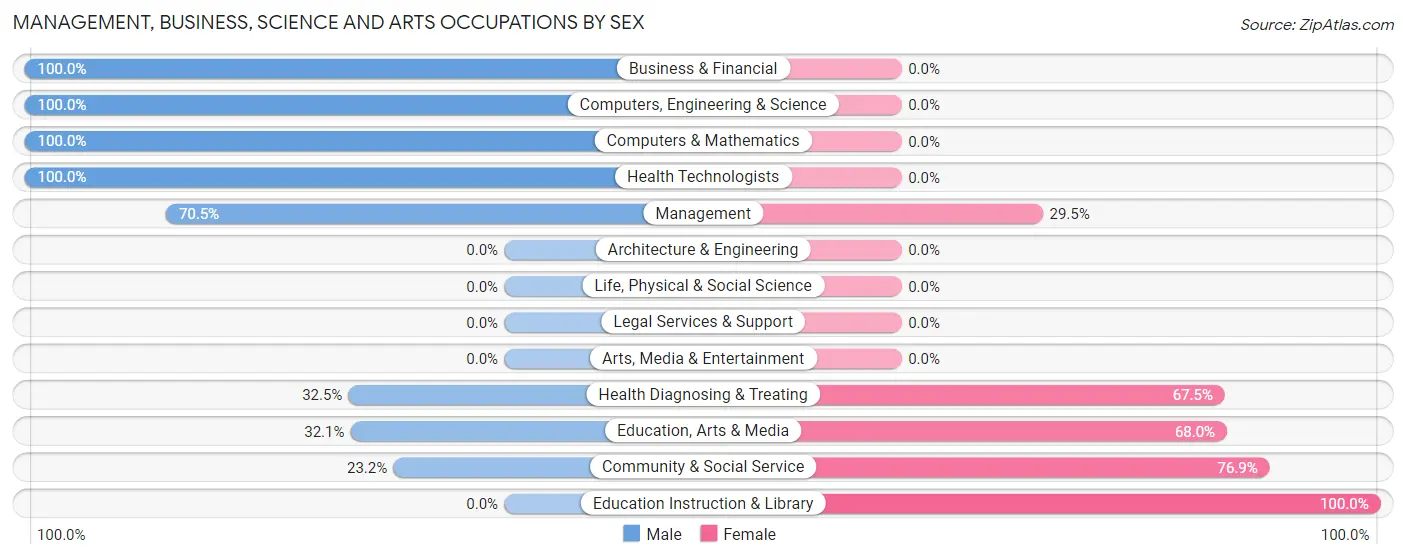
Management, Business, Science and Arts Occupations by Sex
Within the Management, Business, Science and Arts occupations in Dimmit County, the most male-oriented occupations are Business & Financial (100.0%), Computers, Engineering & Science (100.0%), and Computers & Mathematics (100.0%), while the most female-oriented occupations are Education Instruction & Library (100.0%), Community & Social Service (76.8%), and Education, Arts & Media (67.9%).
| Occupation | Male | Female |
| Management | 165 (70.5%) | 69 (29.5%) |
| Business & Financial | 17 (100.0%) | 0 (0.0%) |
| Computers, Engineering & Science | 51 (100.0%) | 0 (0.0%) |
| Computers & Mathematics | 51 (100.0%) | 0 (0.0%) |
| Architecture & Engineering | 0 (0.0%) | 0 (0.0%) |
| Life, Physical & Social Science | 0 (0.0%) | 0 (0.0%) |
| Community & Social Service | 25 (23.2%) | 83 (76.8%) |
| Education, Arts & Media | 25 (32.1%) | 53 (67.9%) |
| Legal Services & Support | 0 (0.0%) | 0 (0.0%) |
| Education Instruction & Library | 0 (0.0%) | 30 (100.0%) |
| Arts, Media & Entertainment | 0 (0.0%) | 0 (0.0%) |
| Health Diagnosing & Treating | 13 (32.5%) | 27 (67.5%) |
| Health Technologists | 13 (100.0%) | 0 (0.0%) |
| Total (Category) | 271 (60.2%) | 179 (39.8%) |
| Total (Overall) | 1,220 (51.9%) | 1,132 (48.1%) |
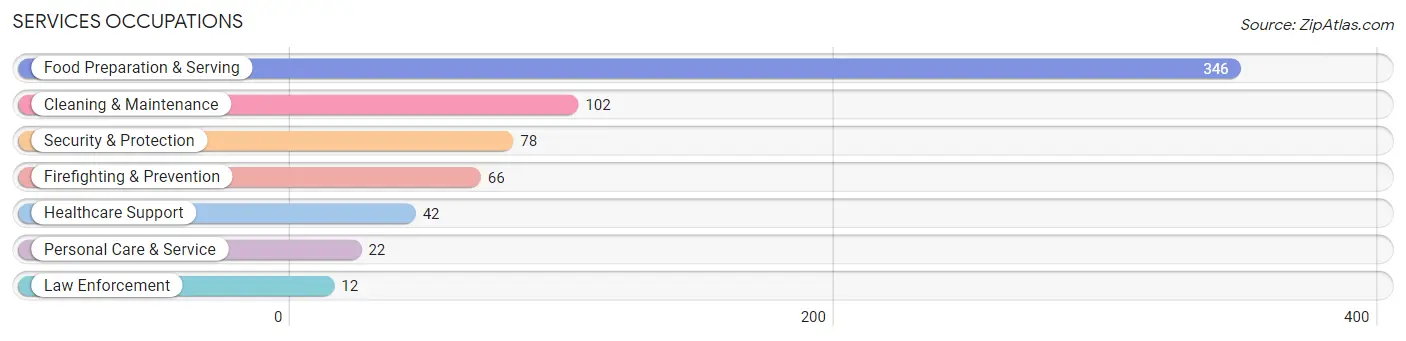
Services Occupations
The most common Services occupations in Dimmit County are Food Preparation & Serving (346 | 14.7%), Cleaning & Maintenance (102 | 4.3%), Security & Protection (78 | 3.3%), Firefighting & Prevention (66 | 2.8%), and Healthcare Support (42 | 1.8%).
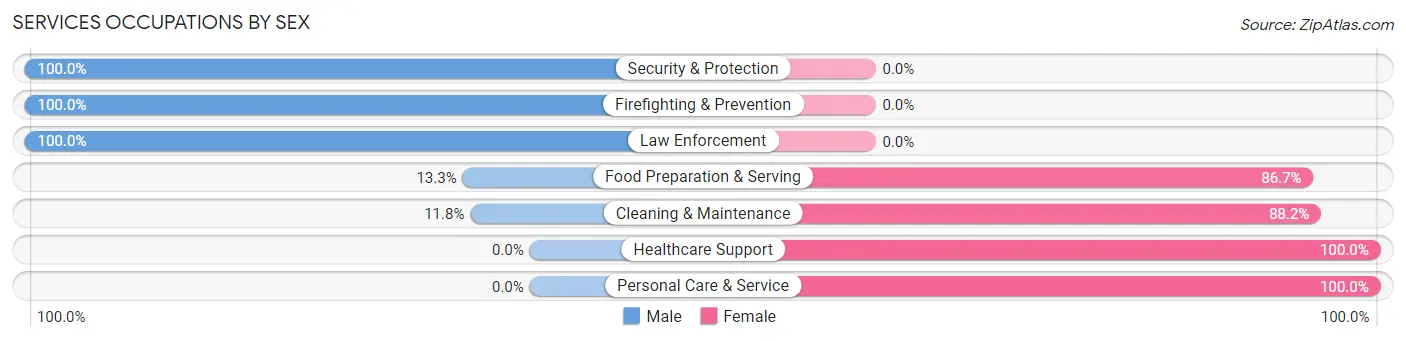
Services Occupations by Sex
Within the Services occupations in Dimmit County, the most male-oriented occupations are Security & Protection (100.0%), Firefighting & Prevention (100.0%), and Law Enforcement (100.0%), while the most female-oriented occupations are Healthcare Support (100.0%), Personal Care & Service (100.0%), and Cleaning & Maintenance (88.2%).
| Occupation | Male | Female |
| Healthcare Support | 0 (0.0%) | 42 (100.0%) |
| Security & Protection | 78 (100.0%) | 0 (0.0%) |
| Firefighting & Prevention | 66 (100.0%) | 0 (0.0%) |
| Law Enforcement | 12 (100.0%) | 0 (0.0%) |
| Food Preparation & Serving | 46 (13.3%) | 300 (86.7%) |
| Cleaning & Maintenance | 12 (11.8%) | 90 (88.2%) |
| Personal Care & Service | 0 (0.0%) | 22 (100.0%) |
| Total (Category) | 136 (23.1%) | 454 (76.9%) |
| Total (Overall) | 1,220 (51.9%) | 1,132 (48.1%) |
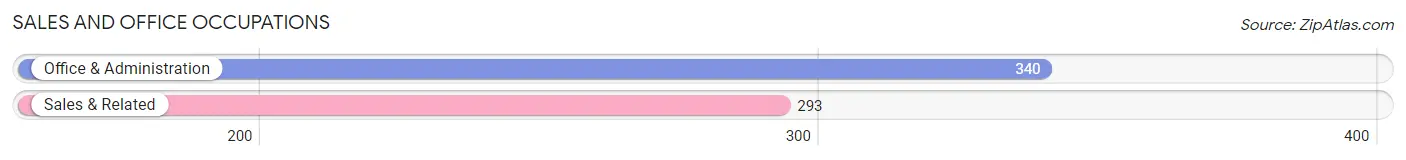
Sales and Office Occupations
The most common Sales and Office occupations in Dimmit County are Office & Administration (340 | 14.5%), and Sales & Related (293 | 12.5%).
Sales and Office Occupations by Sex
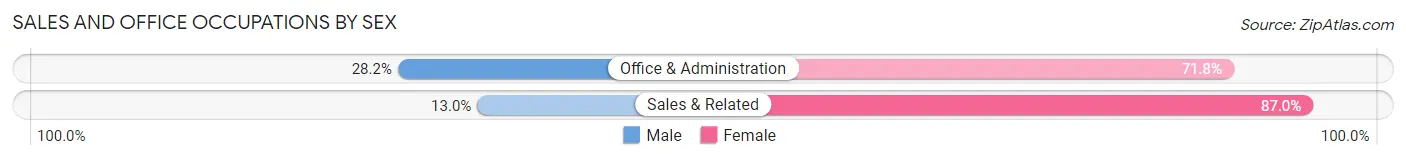
| Occupation | Male | Female |
| Sales & Related | 38 (13.0%) | 255 (87.0%) |
| Office & Administration | 96 (28.2%) | 244 (71.8%) |
| Total (Category) | 134 (21.2%) | 499 (78.8%) |
| Total (Overall) | 1,220 (51.9%) | 1,132 (48.1%) |
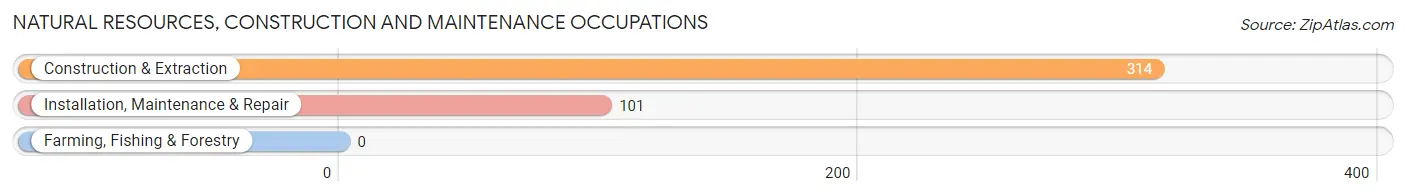
Natural Resources, Construction and Maintenance Occupations
The most common Natural Resources, Construction and Maintenance occupations in Dimmit County are Construction & Extraction (314 | 13.4%), and Installation, Maintenance & Repair (101 | 4.3%).
Natural Resources, Construction and Maintenance Occupations by Sex
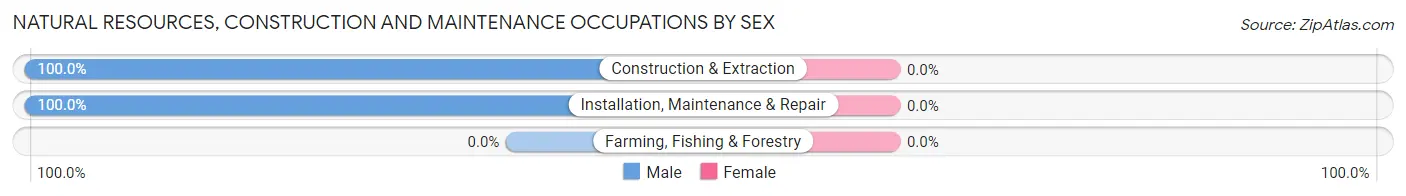
| Occupation | Male | Female |
| Farming, Fishing & Forestry | 0 (0.0%) | 0 (0.0%) |
| Construction & Extraction | 314 (100.0%) | 0 (0.0%) |
| Installation, Maintenance & Repair | 101 (100.0%) | 0 (0.0%) |
| Total (Category) | 415 (100.0%) | 0 (0.0%) |
| Total (Overall) | 1,220 (51.9%) | 1,132 (48.1%) |
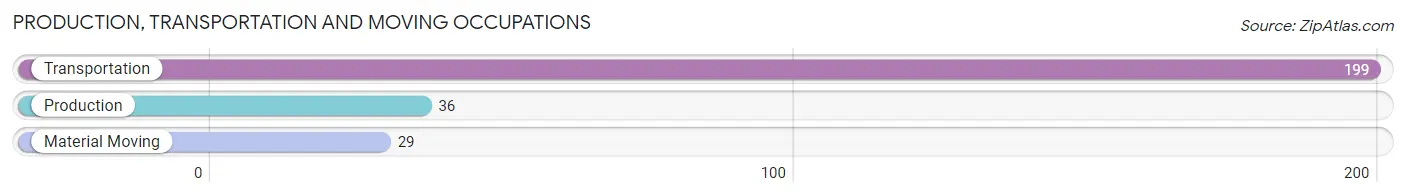
Production, Transportation and Moving Occupations
The most common Production, Transportation and Moving occupations in Dimmit County are Transportation (199 | 8.5%), Production (36 | 1.5%), and Material Moving (29 | 1.2%).
Production, Transportation and Moving Occupations by Sex
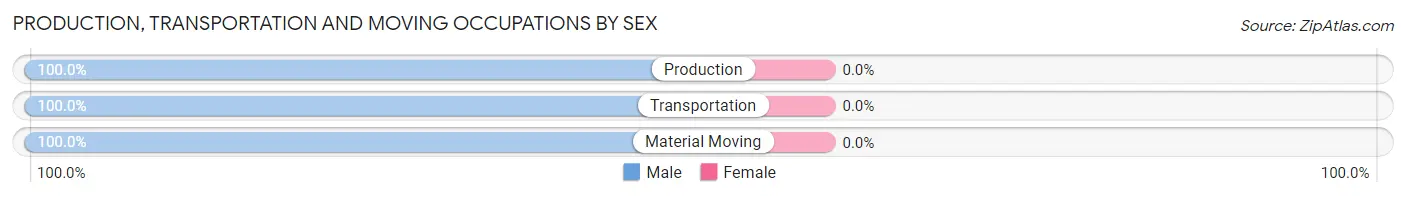
| Occupation | Male | Female |
| Production | 36 (100.0%) | 0 (0.0%) |
| Transportation | 199 (100.0%) | 0 (0.0%) |
| Material Moving | 29 (100.0%) | 0 (0.0%) |
| Total (Category) | 264 (100.0%) | 0 (0.0%) |
| Total (Overall) | 1,220 (51.9%) | 1,132 (48.1%) |
Employment Industries by Sex in Dimmit County
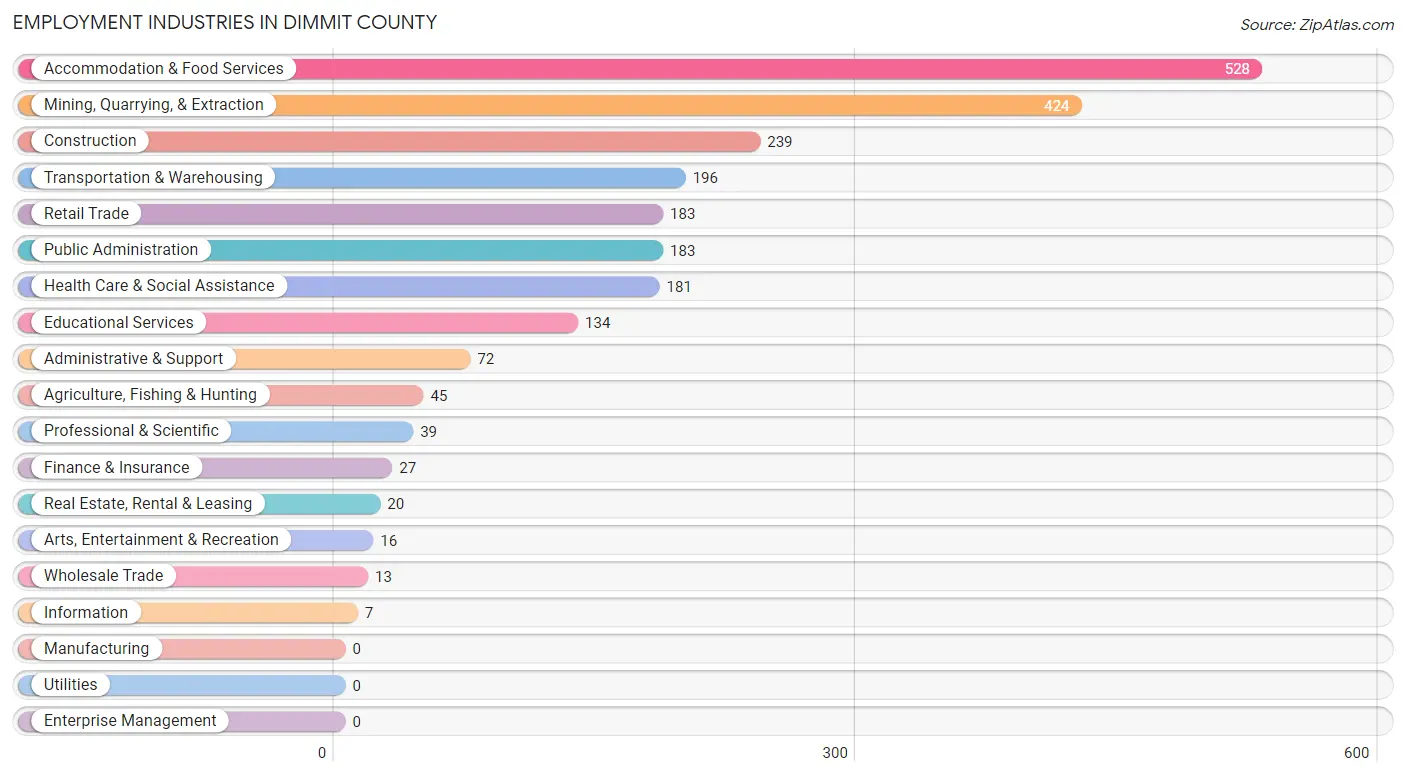
Employment Industries in Dimmit County
The major employment industries in Dimmit County include Accommodation & Food Services (528 | 22.5%), Mining, Quarrying, & Extraction (424 | 18.0%), Construction (239 | 10.2%), Transportation & Warehousing (196 | 8.3%), and Retail Trade (183 | 7.8%).
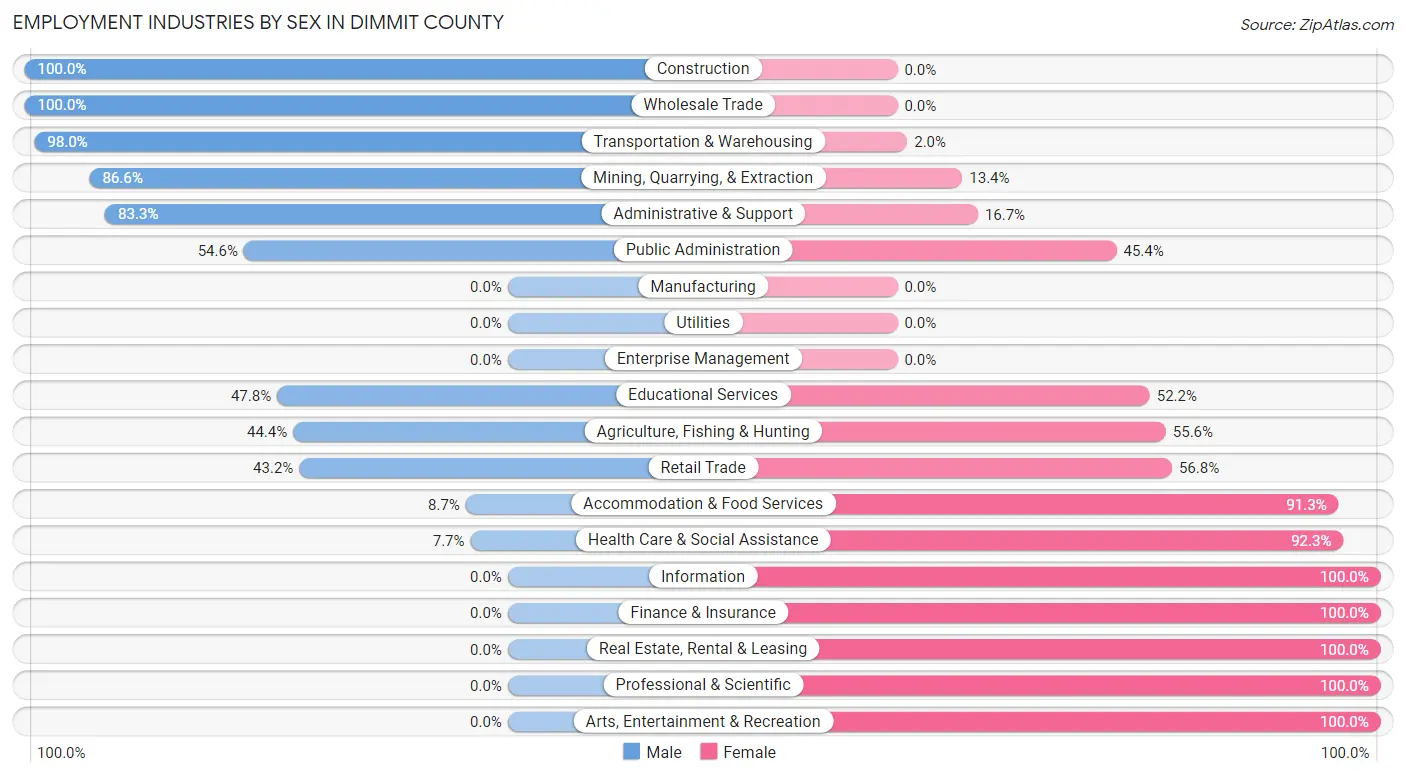
Employment Industries by Sex in Dimmit County
The Dimmit County industries that see more men than women are Construction (100.0%), Wholesale Trade (100.0%), and Transportation & Warehousing (98.0%), whereas the industries that tend to have a higher number of women are Information (100.0%), Finance & Insurance (100.0%), and Real Estate, Rental & Leasing (100.0%).
| Industry | Male | Female |
| Agriculture, Fishing & Hunting | 20 (44.4%) | 25 (55.6%) |
| Mining, Quarrying, & Extraction | 367 (86.6%) | 57 (13.4%) |
| Construction | 239 (100.0%) | 0 (0.0%) |
| Manufacturing | 0 (0.0%) | 0 (0.0%) |
| Wholesale Trade | 13 (100.0%) | 0 (0.0%) |
| Retail Trade | 79 (43.2%) | 104 (56.8%) |
| Transportation & Warehousing | 192 (98.0%) | 4 (2.0%) |
| Utilities | 0 (0.0%) | 0 (0.0%) |
| Information | 0 (0.0%) | 7 (100.0%) |
| Finance & Insurance | 0 (0.0%) | 27 (100.0%) |
| Real Estate, Rental & Leasing | 0 (0.0%) | 20 (100.0%) |
| Professional & Scientific | 0 (0.0%) | 39 (100.0%) |
| Enterprise Management | 0 (0.0%) | 0 (0.0%) |
| Administrative & Support | 60 (83.3%) | 12 (16.7%) |
| Educational Services | 64 (47.8%) | 70 (52.2%) |
| Health Care & Social Assistance | 14 (7.7%) | 167 (92.3%) |
| Arts, Entertainment & Recreation | 0 (0.0%) | 16 (100.0%) |
| Accommodation & Food Services | 46 (8.7%) | 482 (91.3%) |
| Public Administration | 100 (54.6%) | 83 (45.4%) |
| Total | 1,220 (51.9%) | 1,132 (48.1%) |
Education in Dimmit County
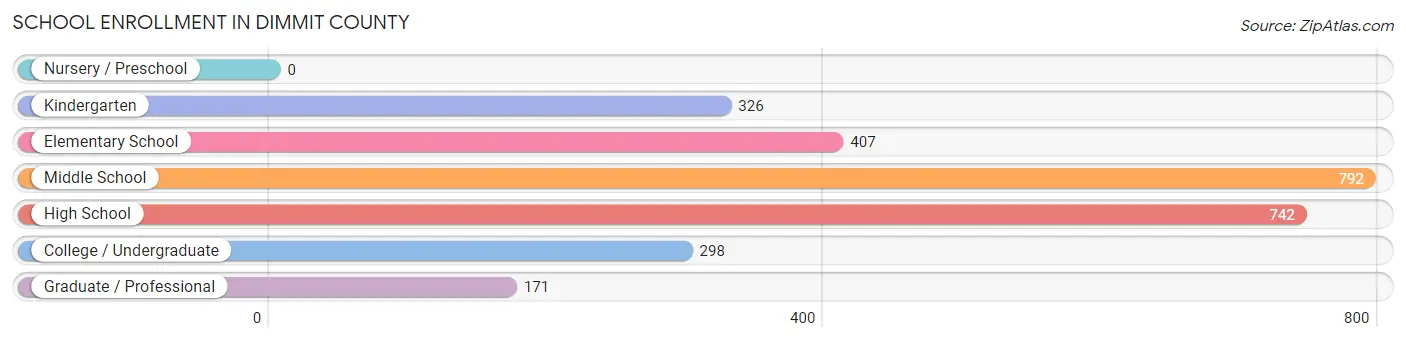
School Enrollment in Dimmit County
The most common levels of schooling among the 2,736 students in Dimmit County are middle school (792 | 28.9%), high school (742 | 27.1%), and elementary school (407 | 14.9%).
| School Level | # Students | % Students |
| Nursery / Preschool | 0 | 0.0% |
| Kindergarten | 326 | 11.9% |
| Elementary School | 407 | 14.9% |
| Middle School | 792 | 28.9% |
| High School | 742 | 27.1% |
| College / Undergraduate | 298 | 10.9% |
| Graduate / Professional | 171 | 6.2% |
| Total | 2,736 | 100.0% |
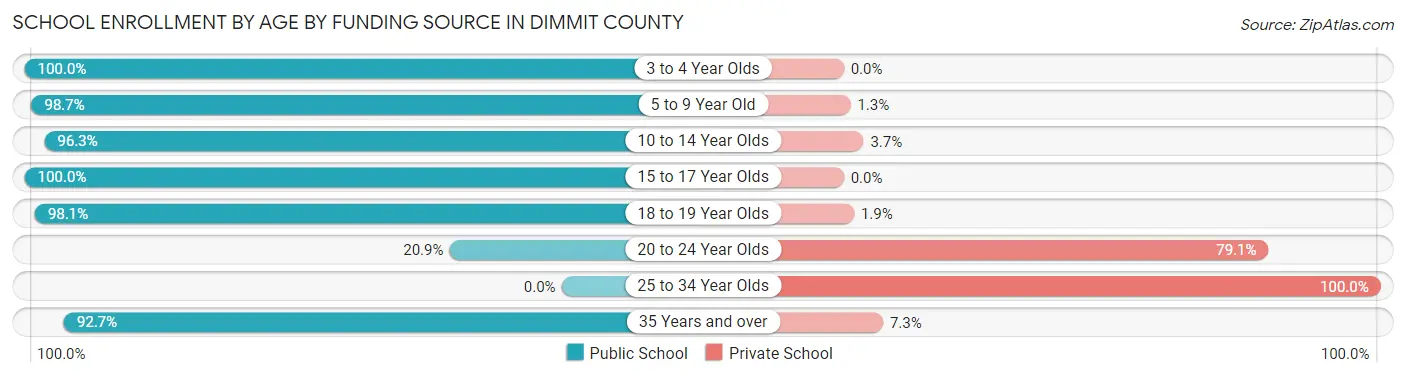
School Enrollment by Age by Funding Source in Dimmit County
Out of a total of 2,736 students who are enrolled in schools in Dimmit County, 219 (8.0%) attend a private institution, while the remaining 2,517 (92.0%) are enrolled in public schools. The age group of 25 to 34 year olds has the highest likelihood of being enrolled in private schools, with 51 (100.0% in the age bracket) enrolled. Conversely, the age group of 3 to 4 year olds has the lowest likelihood of being enrolled in a private school, with 162 (100.0% in the age bracket) attending a public institution.
| Age Bracket | Public School | Private School |
| 3 to 4 Year Olds | 162 (100.0%) | 0 (0.0%) |
| 5 to 9 Year Old | 548 (98.7%) | 7 (1.3%) |
| 10 to 14 Year Olds | 861 (96.3%) | 33 (3.7%) |
| 15 to 17 Year Olds | 371 (100.0%) | 0 (0.0%) |
| 18 to 19 Year Olds | 357 (98.1%) | 7 (1.9%) |
| 20 to 24 Year Olds | 28 (20.9%) | 106 (79.1%) |
| 25 to 34 Year Olds | 0 (0.0%) | 51 (100.0%) |
| 35 Years and over | 190 (92.7%) | 15 (7.3%) |
| Total | 2,517 (92.0%) | 219 (8.0%) |
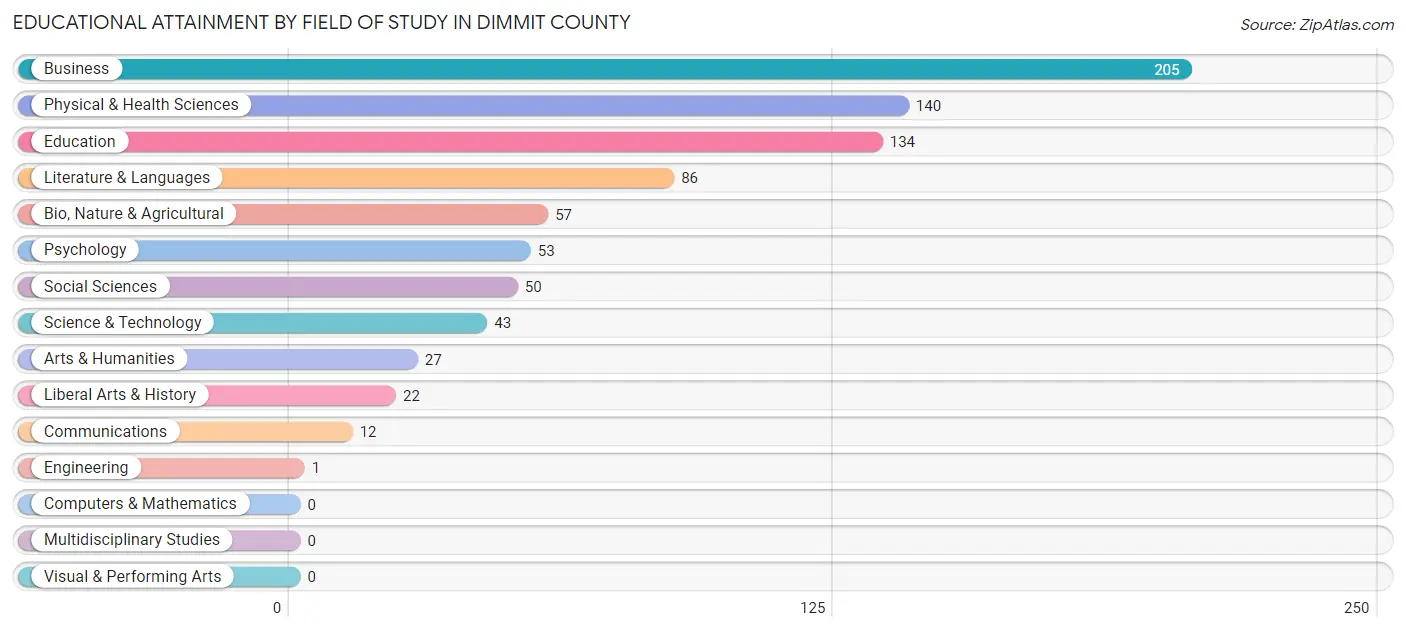
Educational Attainment by Field of Study in Dimmit County
Business (205 | 24.7%), physical & health sciences (140 | 16.9%), education (134 | 16.1%), literature & languages (86 | 10.4%), and bio, nature & agricultural (57 | 6.9%) are the most common fields of study among 830 individuals in Dimmit County who have obtained a bachelor's degree or higher.
| Field of Study | # Graduates | % Graduates |
| Computers & Mathematics | 0 | 0.0% |
| Bio, Nature & Agricultural | 57 | 6.9% |
| Physical & Health Sciences | 140 | 16.9% |
| Psychology | 53 | 6.4% |
| Social Sciences | 50 | 6.0% |
| Engineering | 1 | 0.1% |
| Multidisciplinary Studies | 0 | 0.0% |
| Science & Technology | 43 | 5.2% |
| Business | 205 | 24.7% |
| Education | 134 | 16.1% |
| Literature & Languages | 86 | 10.4% |
| Liberal Arts & History | 22 | 2.6% |
| Visual & Performing Arts | 0 | 0.0% |
| Communications | 12 | 1.5% |
| Arts & Humanities | 27 | 3.3% |
| Total | 830 | 100.0% |
Transportation & Commute in Dimmit County
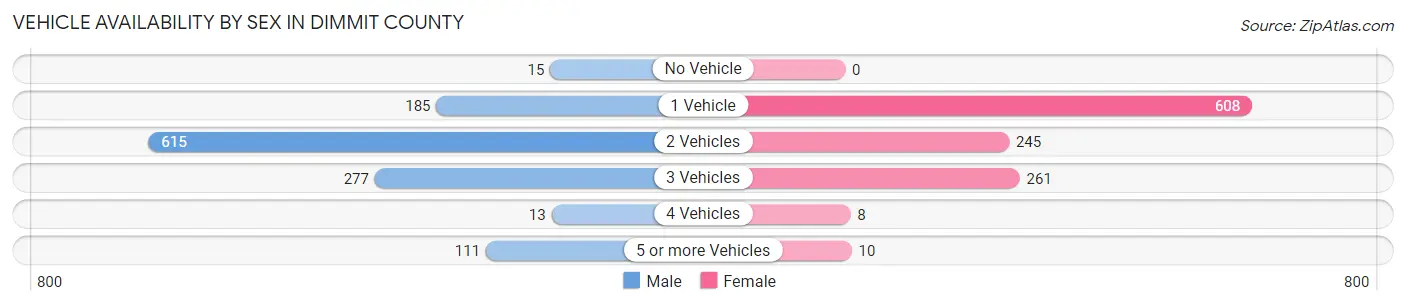
Vehicle Availability by Sex in Dimmit County
The most prevalent vehicle ownership categories in Dimmit County are males with 2 vehicles (615, accounting for 50.6%) and females with 2 vehicles (245, making up 54.3%).
| Vehicles Available | Male | Female |
| No Vehicle | 15 (1.2%) | 0 (0.0%) |
| 1 Vehicle | 185 (15.2%) | 608 (53.7%) |
| 2 Vehicles | 615 (50.6%) | 245 (21.6%) |
| 3 Vehicles | 277 (22.8%) | 261 (23.1%) |
| 4 Vehicles | 13 (1.1%) | 8 (0.7%) |
| 5 or more Vehicles | 111 (9.1%) | 10 (0.9%) |
| Total | 1,216 (100.0%) | 1,132 (100.0%) |
Commute Time in Dimmit County
The most frequently occuring commute durations in Dimmit County are 5 to 9 minutes (570 commuters, 26.1%), 15 to 19 minutes (366 commuters, 16.7%), and 60 to 89 minutes (257 commuters, 11.7%).
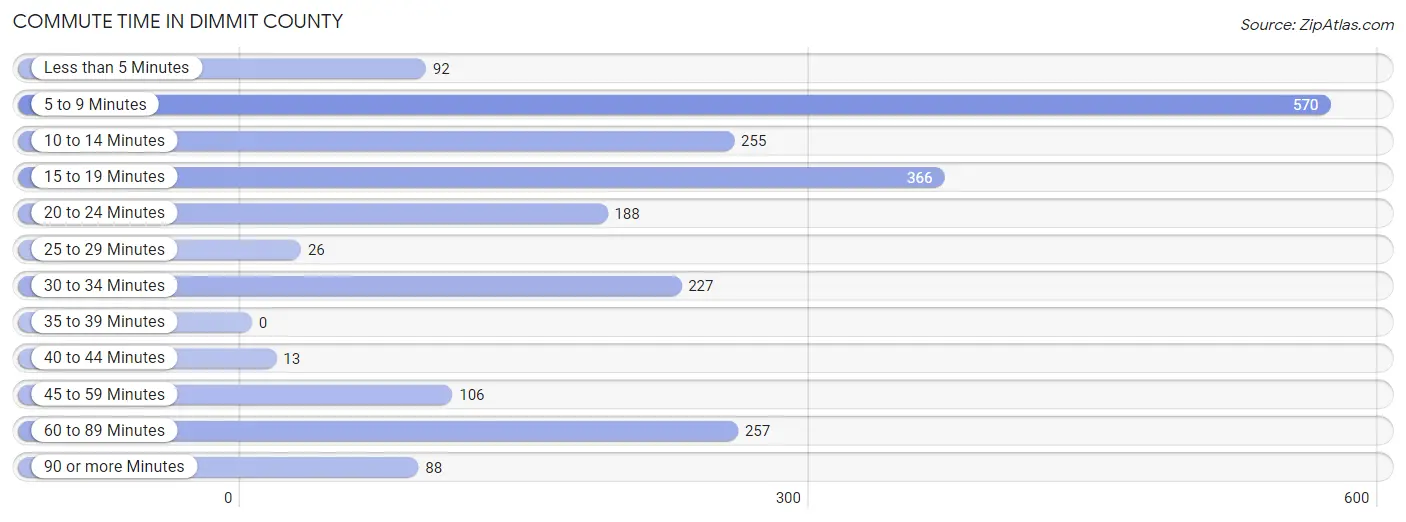
| Commute Time | # Commuters | % Commuters |
| Less than 5 Minutes | 92 | 4.2% |
| 5 to 9 Minutes | 570 | 26.1% |
| 10 to 14 Minutes | 255 | 11.7% |
| 15 to 19 Minutes | 366 | 16.7% |
| 20 to 24 Minutes | 188 | 8.6% |
| 25 to 29 Minutes | 26 | 1.2% |
| 30 to 34 Minutes | 227 | 10.4% |
| 35 to 39 Minutes | 0 | 0.0% |
| 40 to 44 Minutes | 13 | 0.6% |
| 45 to 59 Minutes | 106 | 4.8% |
| 60 to 89 Minutes | 257 | 11.7% |
| 90 or more Minutes | 88 | 4.0% |
Commute Time by Sex in Dimmit County
The most common commute times in Dimmit County are 30 to 34 minutes (210 commuters, 17.6%) for males and 5 to 9 minutes (370 commuters, 37.1%) for females.
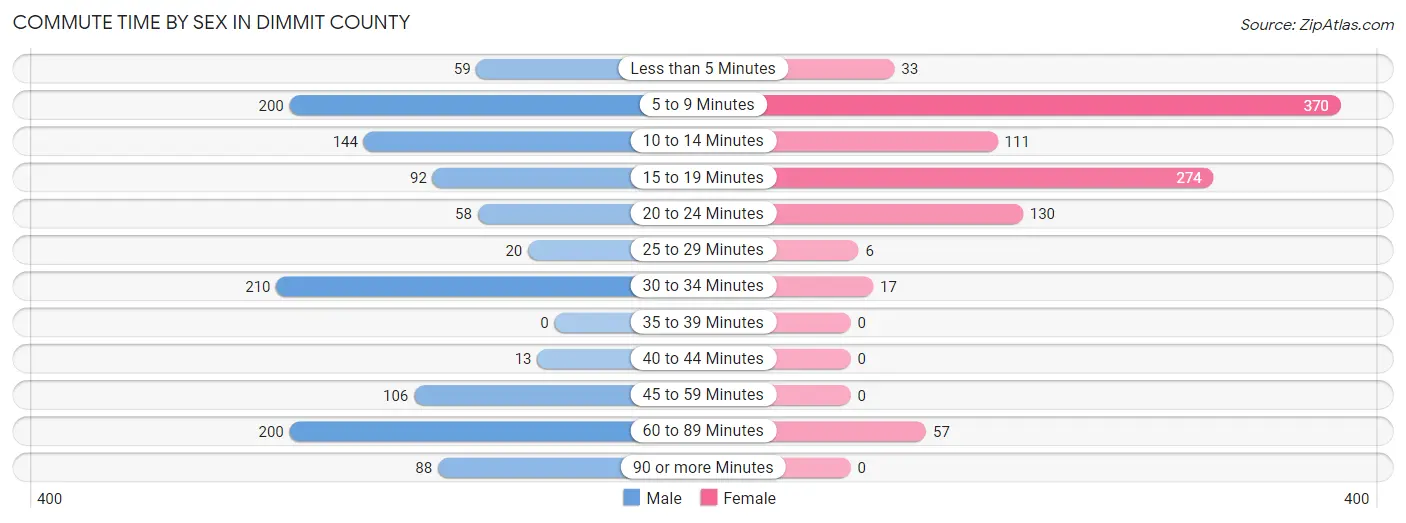
| Commute Time | Male | Female |
| Less than 5 Minutes | 59 (5.0%) | 33 (3.3%) |
| 5 to 9 Minutes | 200 (16.8%) | 370 (37.1%) |
| 10 to 14 Minutes | 144 (12.1%) | 111 (11.1%) |
| 15 to 19 Minutes | 92 (7.7%) | 274 (27.5%) |
| 20 to 24 Minutes | 58 (4.9%) | 130 (13.0%) |
| 25 to 29 Minutes | 20 (1.7%) | 6 (0.6%) |
| 30 to 34 Minutes | 210 (17.6%) | 17 (1.7%) |
| 35 to 39 Minutes | 0 (0.0%) | 0 (0.0%) |
| 40 to 44 Minutes | 13 (1.1%) | 0 (0.0%) |
| 45 to 59 Minutes | 106 (8.9%) | 0 (0.0%) |
| 60 to 89 Minutes | 200 (16.8%) | 57 (5.7%) |
| 90 or more Minutes | 88 (7.4%) | 0 (0.0%) |
Time of Departure to Work by Sex in Dimmit County
The most frequent times of departure to work in Dimmit County are 6:00 AM to 6:29 AM (341, 28.7%) for males and 4:00 PM to 11:59 PM (279, 28.0%) for females.
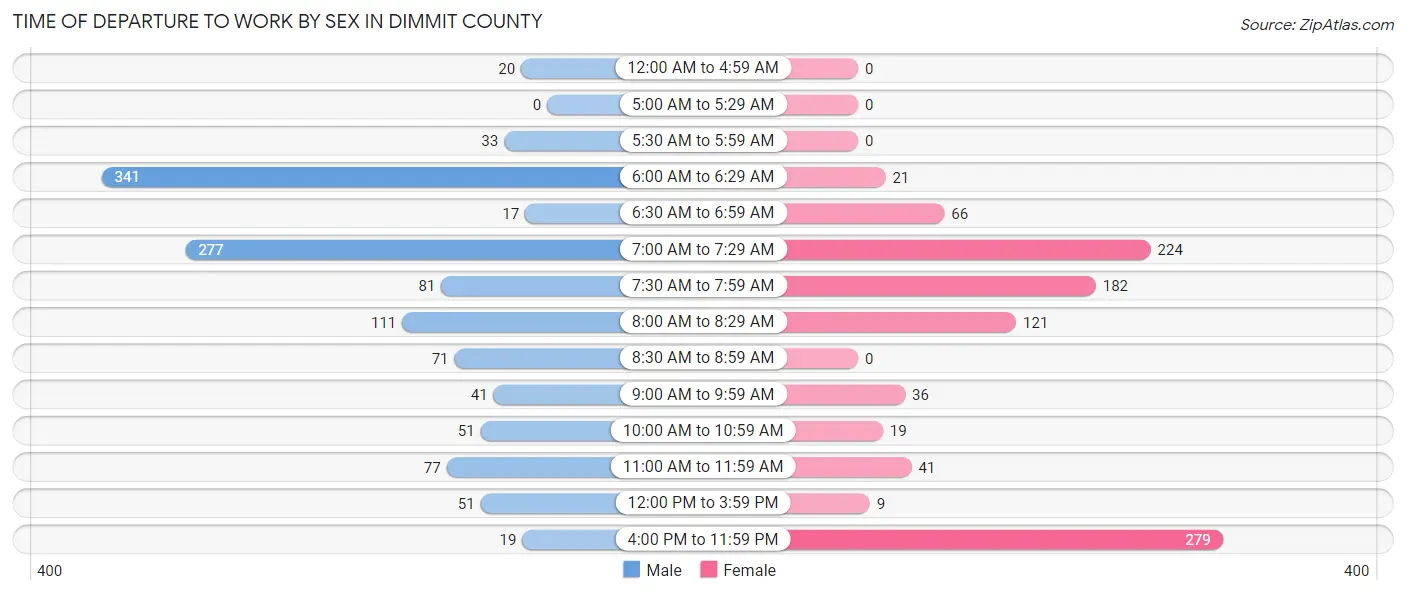
| Time of Departure | Male | Female |
| 12:00 AM to 4:59 AM | 20 (1.7%) | 0 (0.0%) |
| 5:00 AM to 5:29 AM | 0 (0.0%) | 0 (0.0%) |
| 5:30 AM to 5:59 AM | 33 (2.8%) | 0 (0.0%) |
| 6:00 AM to 6:29 AM | 341 (28.7%) | 21 (2.1%) |
| 6:30 AM to 6:59 AM | 17 (1.4%) | 66 (6.6%) |
| 7:00 AM to 7:29 AM | 277 (23.3%) | 224 (22.4%) |
| 7:30 AM to 7:59 AM | 81 (6.8%) | 182 (18.2%) |
| 8:00 AM to 8:29 AM | 111 (9.3%) | 121 (12.1%) |
| 8:30 AM to 8:59 AM | 71 (6.0%) | 0 (0.0%) |
| 9:00 AM to 9:59 AM | 41 (3.5%) | 36 (3.6%) |
| 10:00 AM to 10:59 AM | 51 (4.3%) | 19 (1.9%) |
| 11:00 AM to 11:59 AM | 77 (6.5%) | 41 (4.1%) |
| 12:00 PM to 3:59 PM | 51 (4.3%) | 9 (0.9%) |
| 4:00 PM to 11:59 PM | 19 (1.6%) | 279 (28.0%) |
| Total | 1,190 (100.0%) | 998 (100.0%) |
Housing Occupancy in Dimmit County
Occupancy by Ownership in Dimmit County
Of the total 2,808 dwellings in Dimmit County, owner-occupied units account for 1,825 (65.0%), while renter-occupied units make up 983 (35.0%).
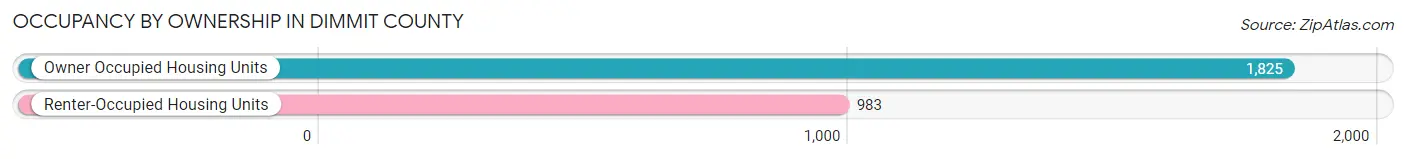
| Occupancy | # Housing Units | % Housing Units |
| Owner Occupied Housing Units | 1,825 | 65.0% |
| Renter-Occupied Housing Units | 983 | 35.0% |
| Total Occupied Housing Units | 2,808 | 100.0% |
Occupancy by Household Size in Dimmit County
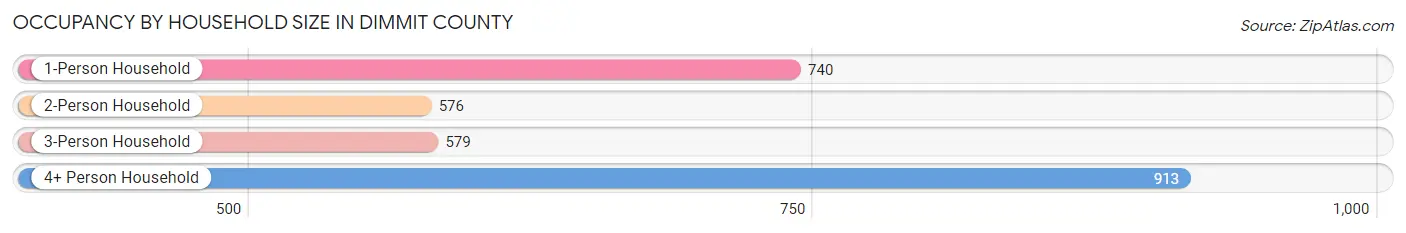
| Household Size | # Housing Units | % Housing Units |
| 1-Person Household | 740 | 26.4% |
| 2-Person Household | 576 | 20.5% |
| 3-Person Household | 579 | 20.6% |
| 4+ Person Household | 913 | 32.5% |
| Total Housing Units | 2,808 | 100.0% |
Occupancy by Ownership by Household Size in Dimmit County
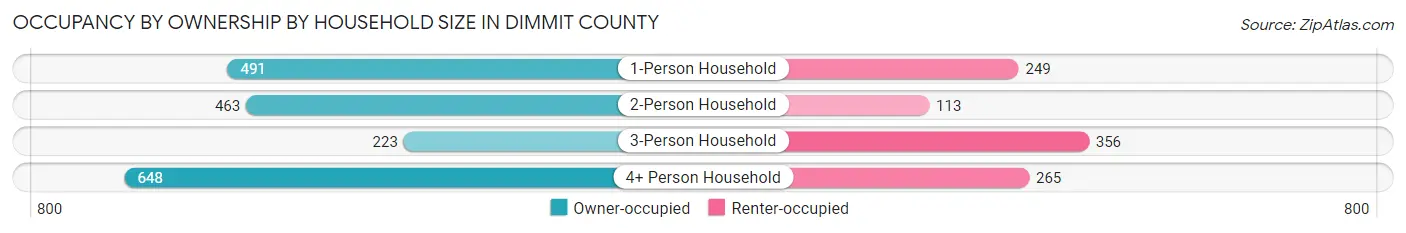
| Household Size | Owner-occupied | Renter-occupied |
| 1-Person Household | 491 (66.3%) | 249 (33.7%) |
| 2-Person Household | 463 (80.4%) | 113 (19.6%) |
| 3-Person Household | 223 (38.5%) | 356 (61.5%) |
| 4+ Person Household | 648 (71.0%) | 265 (29.0%) |
| Total Housing Units | 1,825 (65.0%) | 983 (35.0%) |
Occupancy by Educational Attainment in Dimmit County
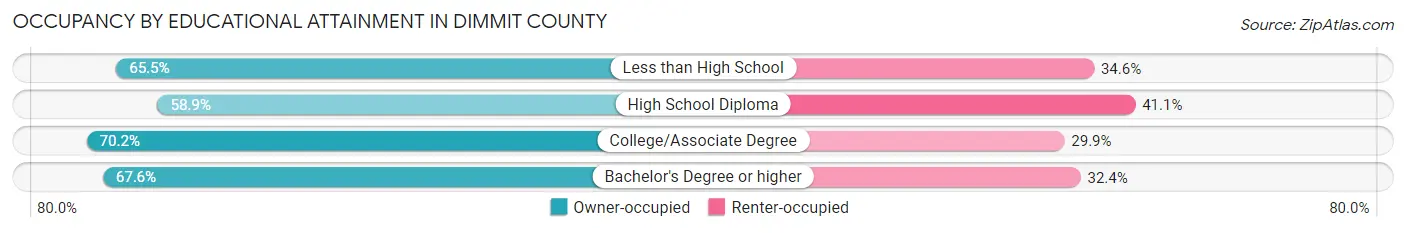
| Household Size | Owner-occupied | Renter-occupied |
| Less than High School | 447 (65.4%) | 236 (34.5%) |
| High School Diploma | 542 (58.9%) | 378 (41.1%) |
| College/Associate Degree | 590 (70.2%) | 251 (29.8%) |
| Bachelor's Degree or higher | 246 (67.6%) | 118 (32.4%) |
Occupancy by Age of Householder in Dimmit County
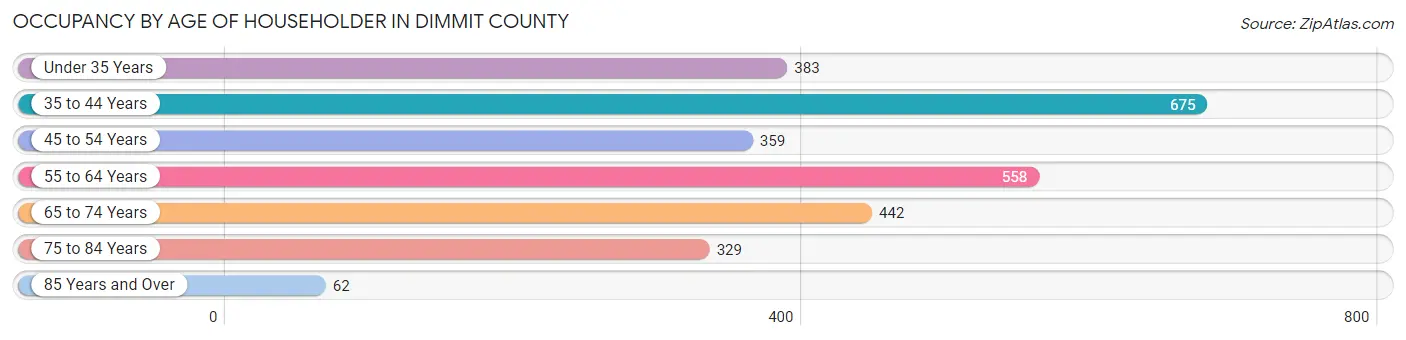
| Age Bracket | # Households | % Households |
| Under 35 Years | 383 | 13.6% |
| 35 to 44 Years | 675 | 24.0% |
| 45 to 54 Years | 359 | 12.8% |
| 55 to 64 Years | 558 | 19.9% |
| 65 to 74 Years | 442 | 15.7% |
| 75 to 84 Years | 329 | 11.7% |
| 85 Years and Over | 62 | 2.2% |
| Total | 2,808 | 100.0% |
Housing Finances in Dimmit County
Median Income by Occupancy in Dimmit County
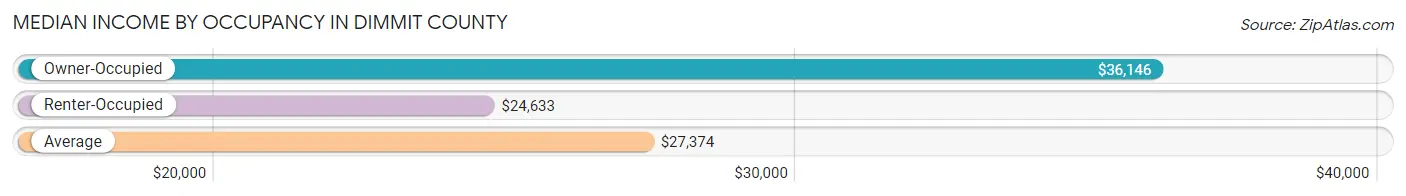
| Occupancy Type | # Households | Median Income |
| Owner-Occupied | 1,825 (65.0%) | $36,146 |
| Renter-Occupied | 983 (35.0%) | $24,633 |
| Average | 2,808 (100.0%) | $27,374 |
Occupancy by Householder Income Bracket in Dimmit County
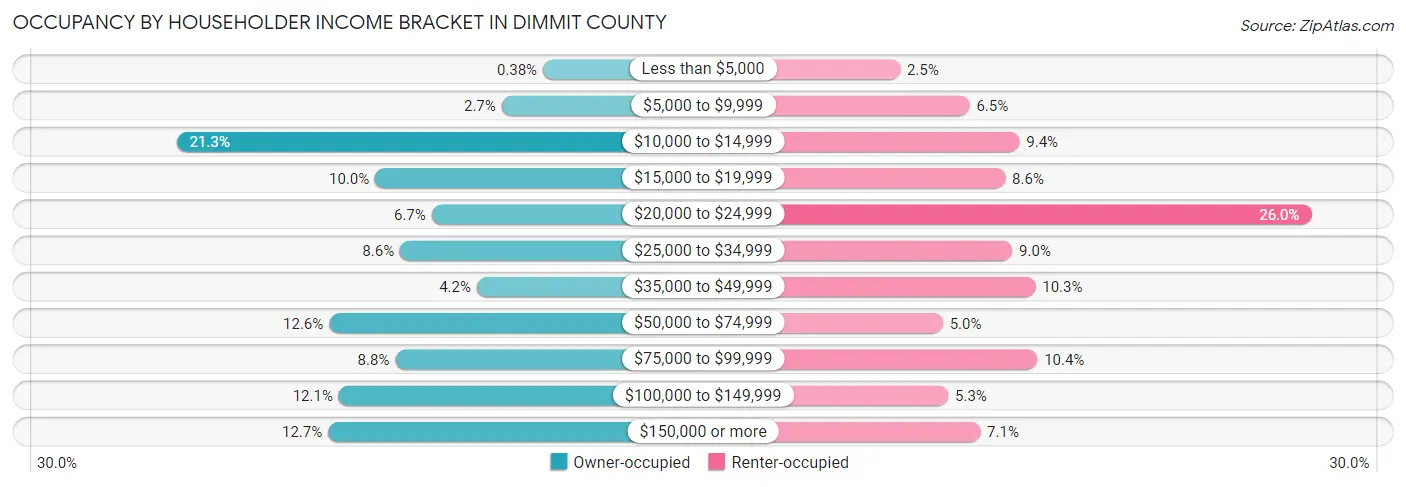
| Income Bracket | Owner-occupied | Renter-occupied |
| Less than $5,000 | 7 (0.4%) | 25 (2.5%) |
| $5,000 to $9,999 | 50 (2.7%) | 64 (6.5%) |
| $10,000 to $14,999 | 389 (21.3%) | 92 (9.4%) |
| $15,000 to $19,999 | 182 (10.0%) | 84 (8.6%) |
| $20,000 to $24,999 | 123 (6.7%) | 256 (26.0%) |
| $25,000 to $34,999 | 156 (8.6%) | 88 (8.9%) |
| $35,000 to $49,999 | 76 (4.2%) | 101 (10.3%) |
| $50,000 to $74,999 | 230 (12.6%) | 49 (5.0%) |
| $75,000 to $99,999 | 161 (8.8%) | 102 (10.4%) |
| $100,000 to $149,999 | 220 (12.0%) | 52 (5.3%) |
| $150,000 or more | 231 (12.7%) | 70 (7.1%) |
| Total | 1,825 (100.0%) | 983 (100.0%) |
Monthly Housing Cost Tiers in Dimmit County
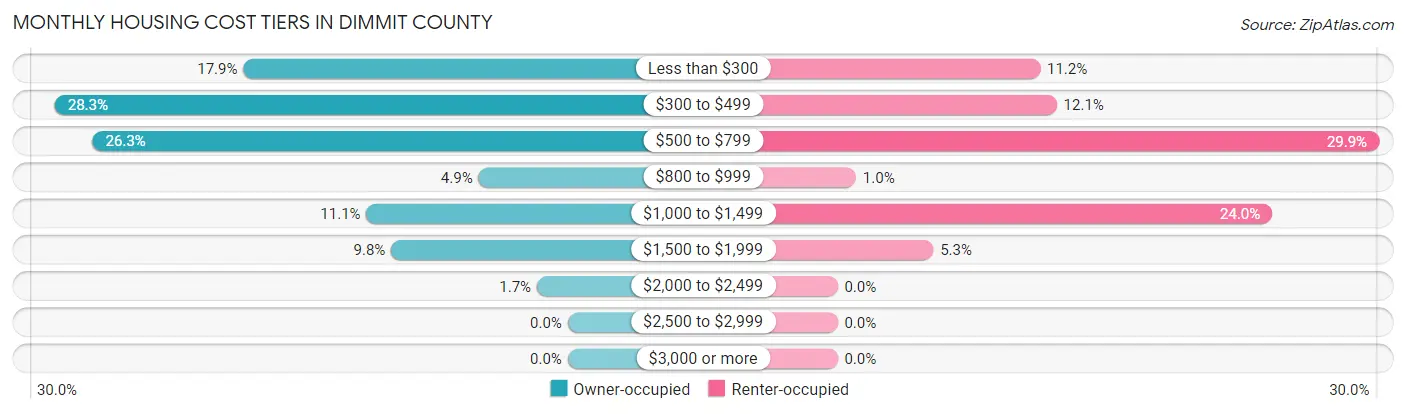
| Monthly Cost | Owner-occupied | Renter-occupied |
| Less than $300 | 327 (17.9%) | 110 (11.2%) |
| $300 to $499 | 517 (28.3%) | 119 (12.1%) |
| $500 to $799 | 479 (26.3%) | 294 (29.9%) |
| $800 to $999 | 90 (4.9%) | 10 (1.0%) |
| $1,000 to $1,499 | 203 (11.1%) | 236 (24.0%) |
| $1,500 to $1,999 | 178 (9.8%) | 52 (5.3%) |
| $2,000 to $2,499 | 31 (1.7%) | 0 (0.0%) |
| $2,500 to $2,999 | 0 (0.0%) | 0 (0.0%) |
| $3,000 or more | 0 (0.0%) | 0 (0.0%) |
| Total | 1,825 (100.0%) | 983 (100.0%) |
Physical Housing Characteristics in Dimmit County
Housing Structures in Dimmit County
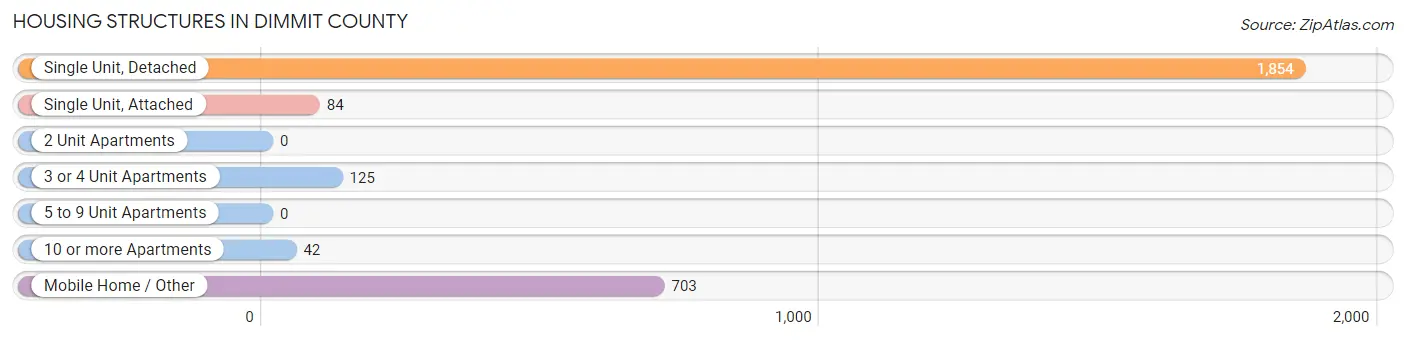
| Structure Type | # Housing Units | % Housing Units |
| Single Unit, Detached | 1,854 | 66.0% |
| Single Unit, Attached | 84 | 3.0% |
| 2 Unit Apartments | 0 | 0.0% |
| 3 or 4 Unit Apartments | 125 | 4.4% |
| 5 to 9 Unit Apartments | 0 | 0.0% |
| 10 or more Apartments | 42 | 1.5% |
| Mobile Home / Other | 703 | 25.0% |
| Total | 2,808 | 100.0% |
Housing Structures by Occupancy in Dimmit County
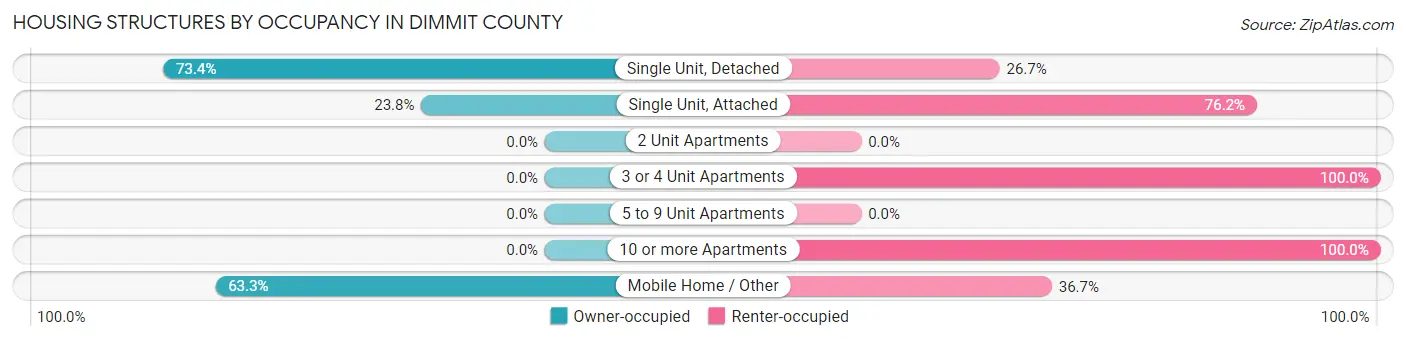
| Structure Type | Owner-occupied | Renter-occupied |
| Single Unit, Detached | 1,360 (73.4%) | 494 (26.7%) |
| Single Unit, Attached | 20 (23.8%) | 64 (76.2%) |
| 2 Unit Apartments | 0 (0.0%) | 0 (0.0%) |
| 3 or 4 Unit Apartments | 0 (0.0%) | 125 (100.0%) |
| 5 to 9 Unit Apartments | 0 (0.0%) | 0 (0.0%) |
| 10 or more Apartments | 0 (0.0%) | 42 (100.0%) |
| Mobile Home / Other | 445 (63.3%) | 258 (36.7%) |
| Total | 1,825 (65.0%) | 983 (35.0%) |
Housing Structures by Number of Rooms in Dimmit County
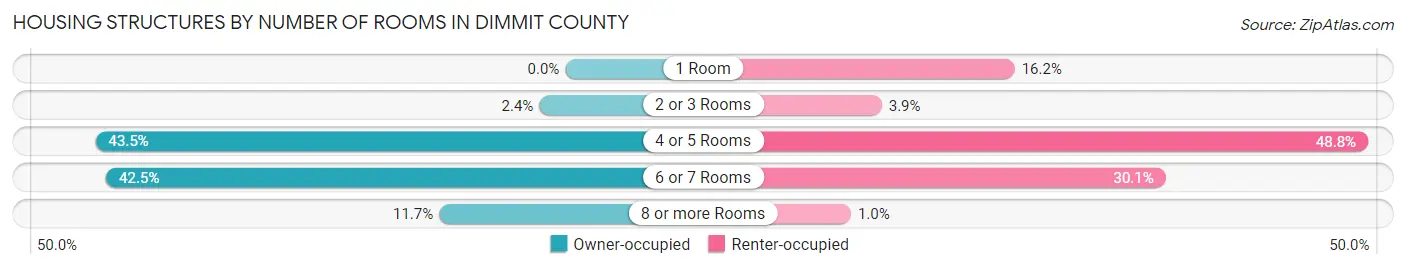
| Number of Rooms | Owner-occupied | Renter-occupied |
| 1 Room | 0 (0.0%) | 159 (16.2%) |
| 2 or 3 Rooms | 44 (2.4%) | 38 (3.9%) |
| 4 or 5 Rooms | 793 (43.4%) | 480 (48.8%) |
| 6 or 7 Rooms | 775 (42.5%) | 296 (30.1%) |
| 8 or more Rooms | 213 (11.7%) | 10 (1.0%) |
| Total | 1,825 (100.0%) | 983 (100.0%) |
Housing Structure by Heating Type in Dimmit County
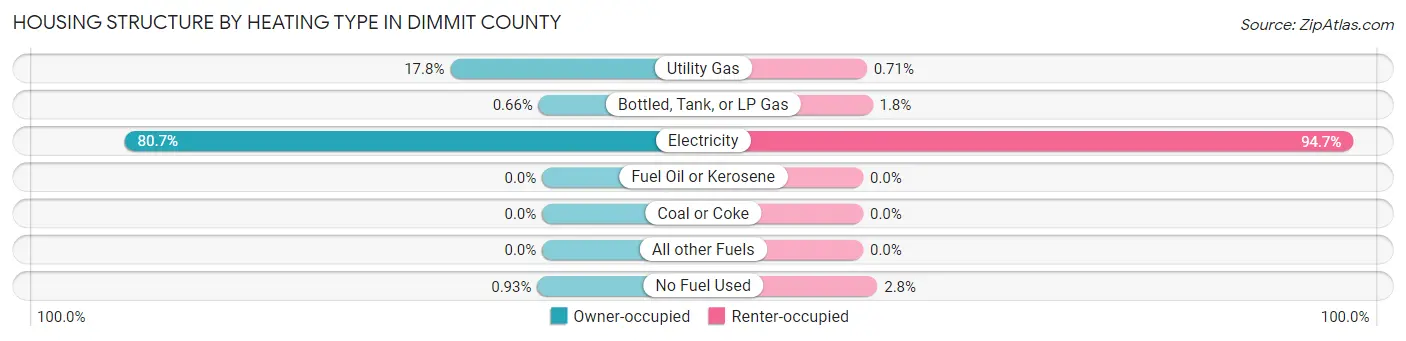
| Heating Type | Owner-occupied | Renter-occupied |
| Utility Gas | 324 (17.7%) | 7 (0.7%) |
| Bottled, Tank, or LP Gas | 12 (0.7%) | 18 (1.8%) |
| Electricity | 1,472 (80.7%) | 931 (94.7%) |
| Fuel Oil or Kerosene | 0 (0.0%) | 0 (0.0%) |
| Coal or Coke | 0 (0.0%) | 0 (0.0%) |
| All other Fuels | 0 (0.0%) | 0 (0.0%) |
| No Fuel Used | 17 (0.9%) | 27 (2.8%) |
| Total | 1,825 (100.0%) | 983 (100.0%) |
Household Vehicle Usage in Dimmit County
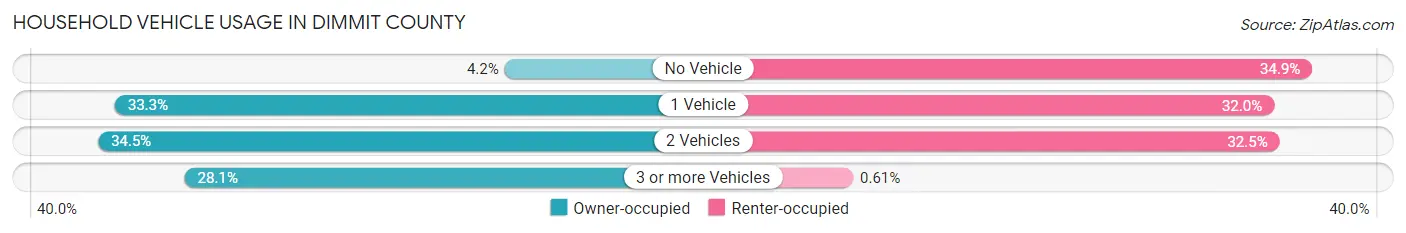
| Vehicles per Household | Owner-occupied | Renter-occupied |
| No Vehicle | 76 (4.2%) | 343 (34.9%) |
| 1 Vehicle | 607 (33.3%) | 315 (32.0%) |
| 2 Vehicles | 630 (34.5%) | 319 (32.5%) |
| 3 or more Vehicles | 512 (28.1%) | 6 (0.6%) |
| Total | 1,825 (100.0%) | 983 (100.0%) |
Real Estate & Mortgages in Dimmit County
Real Estate and Mortgage Overview in Dimmit County
| Characteristic | Without Mortgage | With Mortgage |
| Housing Units | 1,201 | 624 |
| Median Property Value | $57,200 | $110,700 |
| Median Household Income | $35,313 | $90 |
| Monthly Housing Costs | $417 | $0 |
| Real Estate Taxes | $745 | $11 |
Property Value by Mortgage Status in Dimmit County
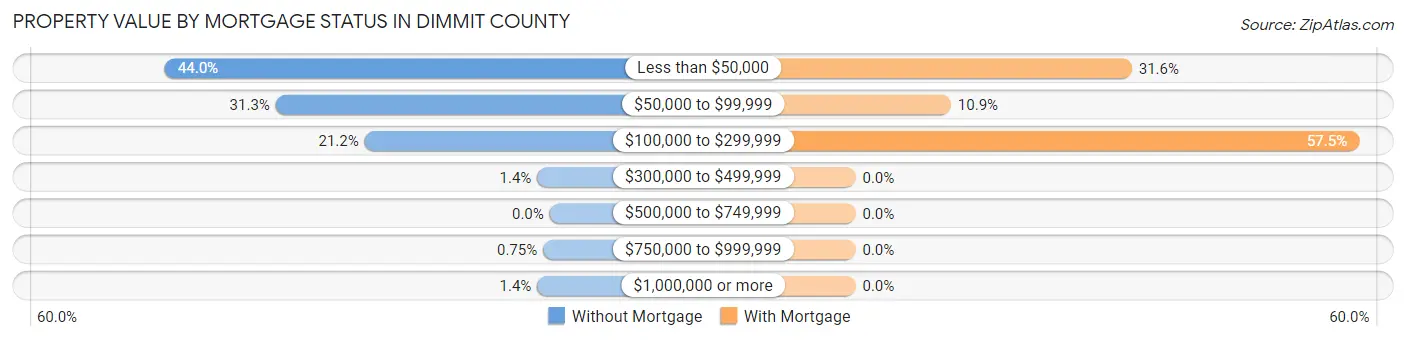
| Property Value | Without Mortgage | With Mortgage |
| Less than $50,000 | 528 (44.0%) | 197 (31.6%) |
| $50,000 to $99,999 | 376 (31.3%) | 68 (10.9%) |
| $100,000 to $299,999 | 254 (21.1%) | 359 (57.5%) |
| $300,000 to $499,999 | 17 (1.4%) | 0 (0.0%) |
| $500,000 to $749,999 | 0 (0.0%) | 0 (0.0%) |
| $750,000 to $999,999 | 9 (0.7%) | 0 (0.0%) |
| $1,000,000 or more | 17 (1.4%) | 0 (0.0%) |
| Total | 1,201 (100.0%) | 624 (100.0%) |
Household Income by Mortgage Status in Dimmit County
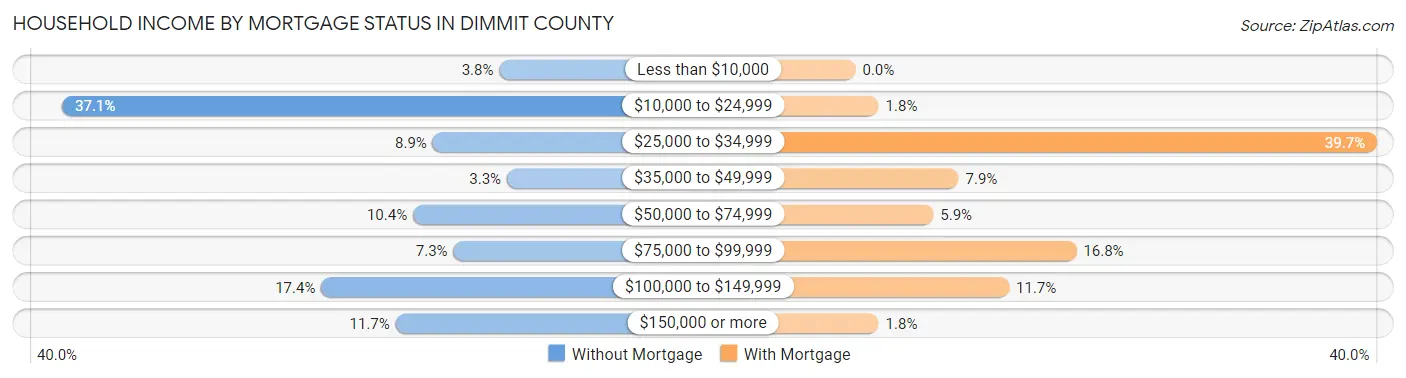
| Household Income | Without Mortgage | With Mortgage |
| Less than $10,000 | 46 (3.8%) | 0 (0.0%) |
| $10,000 to $24,999 | 446 (37.1%) | 11 (1.8%) |
| $25,000 to $34,999 | 107 (8.9%) | 248 (39.7%) |
| $35,000 to $49,999 | 39 (3.3%) | 49 (7.9%) |
| $50,000 to $74,999 | 125 (10.4%) | 37 (5.9%) |
| $75,000 to $99,999 | 88 (7.3%) | 105 (16.8%) |
| $100,000 to $149,999 | 209 (17.4%) | 73 (11.7%) |
| $150,000 or more | 141 (11.7%) | 11 (1.8%) |
| Total | 1,201 (100.0%) | 624 (100.0%) |
Property Value to Household Income Ratio in Dimmit County
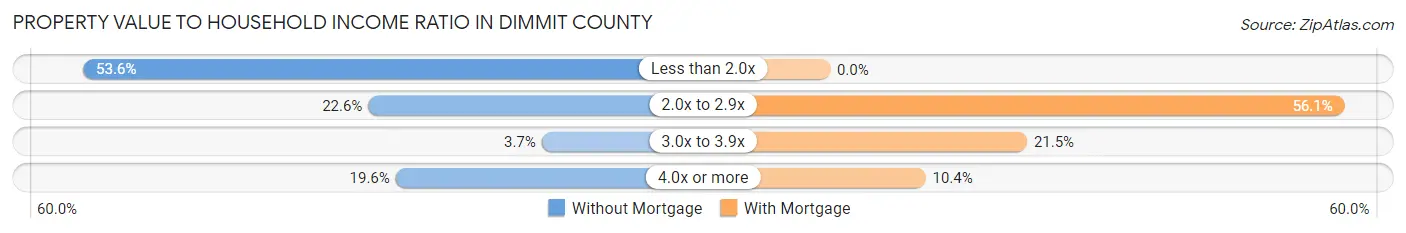
| Value-to-Income Ratio | Without Mortgage | With Mortgage |
| Less than 2.0x | 644 (53.6%) | 0 (0.0%) |
| 2.0x to 2.9x | 271 (22.6%) | 350 (56.1%) |
| 3.0x to 3.9x | 44 (3.7%) | 134 (21.5%) |
| 4.0x or more | 235 (19.6%) | 65 (10.4%) |
| Total | 1,201 (100.0%) | 624 (100.0%) |
Real Estate Taxes by Mortgage Status in Dimmit County

| Property Taxes | Without Mortgage | With Mortgage |
| Less than $800 | 646 (53.8%) | 0 (0.0%) |
| $800 to $1,499 | 249 (20.7%) | 202 (32.4%) |
| $800 to $1,499 | 284 (23.6%) | 171 (27.4%) |
| Total | 1,201 (100.0%) | 624 (100.0%) |
Health & Disability in Dimmit County
Health Insurance Coverage by Age in Dimmit County
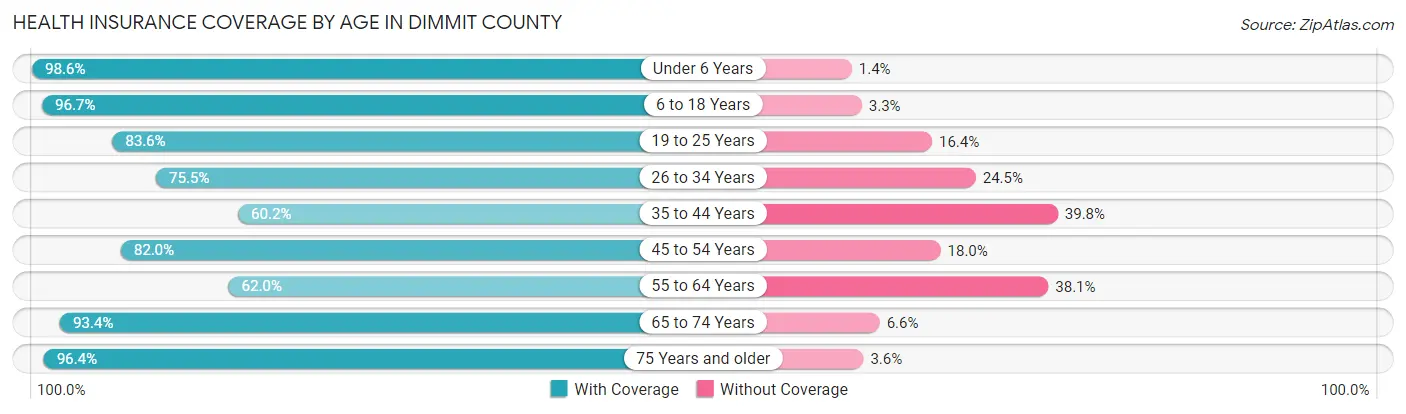
| Age Bracket | With Coverage | Without Coverage |
| Under 6 Years | 700 (98.6%) | 10 (1.4%) |
| 6 to 18 Years | 1,982 (96.7%) | 67 (3.3%) |
| 19 to 25 Years | 567 (83.6%) | 111 (16.4%) |
| 26 to 34 Years | 477 (75.5%) | 155 (24.5%) |
| 35 to 44 Years | 911 (60.2%) | 603 (39.8%) |
| 45 to 54 Years | 548 (82.0%) | 120 (18.0%) |
| 55 to 64 Years | 547 (62.0%) | 336 (38.1%) |
| 65 to 74 Years | 777 (93.4%) | 55 (6.6%) |
| 75 Years and older | 565 (96.4%) | 21 (3.6%) |
| Total | 7,074 (82.7%) | 1,478 (17.3%) |
Health Insurance Coverage by Citizenship Status in Dimmit County
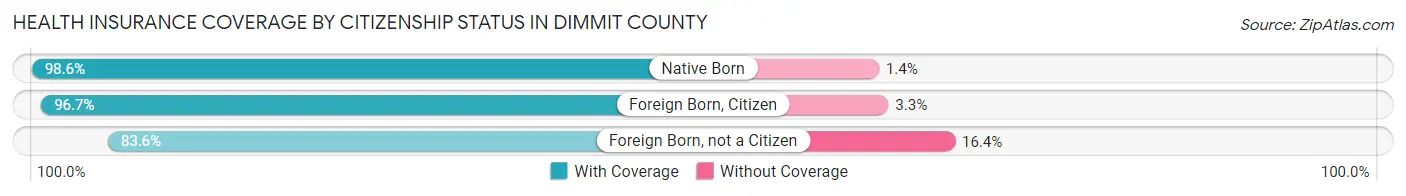
| Citizenship Status | With Coverage | Without Coverage |
| Native Born | 700 (98.6%) | 10 (1.4%) |
| Foreign Born, Citizen | 1,982 (96.7%) | 67 (3.3%) |
| Foreign Born, not a Citizen | 567 (83.6%) | 111 (16.4%) |
Health Insurance Coverage by Household Income in Dimmit County

| Household Income | With Coverage | Without Coverage |
| Under $25,000 | 2,633 (87.9%) | 362 (12.1%) |
| $25,000 to $49,999 | 1,213 (81.5%) | 275 (18.5%) |
| $50,000 to $74,999 | 708 (79.3%) | 185 (20.7%) |
| $75,000 to $99,999 | 993 (97.0%) | 31 (3.0%) |
| $100,000 and over | 1,523 (71.6%) | 603 (28.4%) |
Public vs Private Health Insurance Coverage by Age in Dimmit County
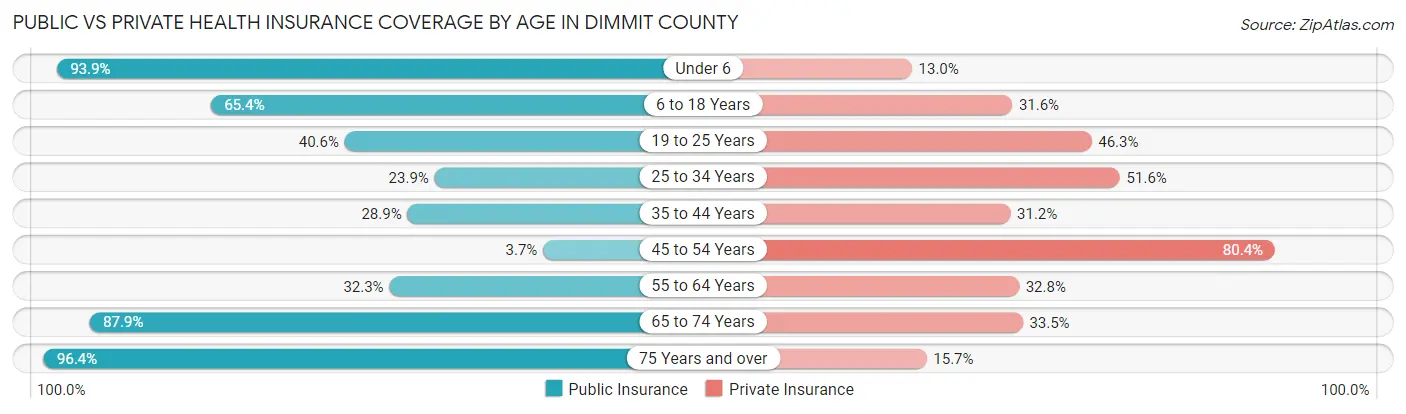
| Age Bracket | Public Insurance | Private Insurance |
| Under 6 | 667 (93.9%) | 92 (13.0%) |
| 6 to 18 Years | 1,339 (65.3%) | 647 (31.6%) |
| 19 to 25 Years | 275 (40.6%) | 314 (46.3%) |
| 25 to 34 Years | 151 (23.9%) | 326 (51.6%) |
| 35 to 44 Years | 438 (28.9%) | 473 (31.2%) |
| 45 to 54 Years | 25 (3.7%) | 537 (80.4%) |
| 55 to 64 Years | 285 (32.3%) | 290 (32.8%) |
| 65 to 74 Years | 731 (87.9%) | 279 (33.5%) |
| 75 Years and over | 565 (96.4%) | 92 (15.7%) |
| Total | 4,476 (52.3%) | 3,050 (35.7%) |
Disability Status by Sex by Age in Dimmit County
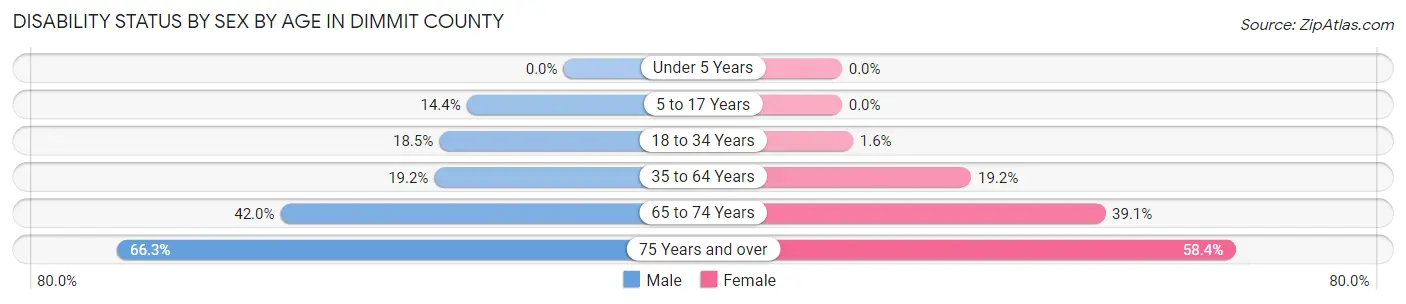
| Age Bracket | Male | Female |
| Under 5 Years | 0 (0.0%) | 0 (0.0%) |
| 5 to 17 Years | 129 (14.4%) | 0 (0.0%) |
| 18 to 34 Years | 137 (18.5%) | 15 (1.6%) |
| 35 to 64 Years | 298 (19.2%) | 290 (19.2%) |
| 65 to 74 Years | 153 (42.0%) | 183 (39.1%) |
| 75 Years and over | 167 (66.3%) | 195 (58.4%) |
Disability Class by Sex by Age in Dimmit County
Disability Class: Hearing Difficulty
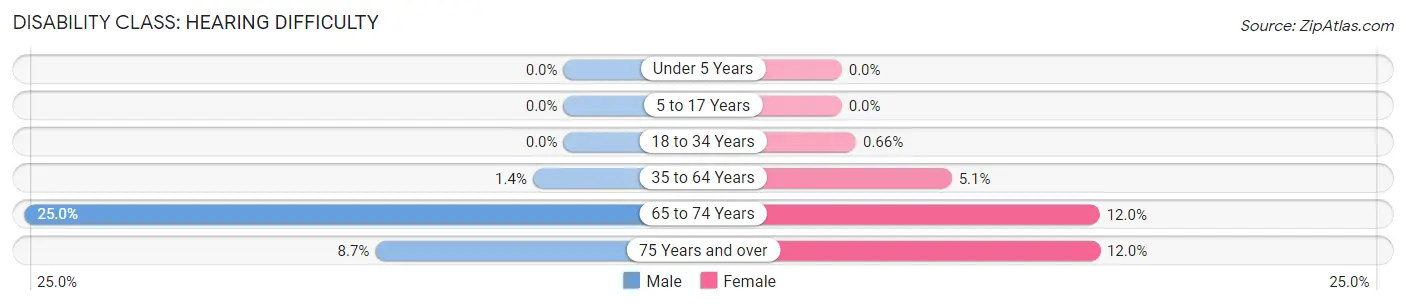
| Age Bracket | Male | Female |
| Under 5 Years | 0 (0.0%) | 0 (0.0%) |
| 5 to 17 Years | 0 (0.0%) | 0 (0.0%) |
| 18 to 34 Years | 0 (0.0%) | 6 (0.7%) |
| 35 to 64 Years | 22 (1.4%) | 77 (5.1%) |
| 65 to 74 Years | 91 (25.0%) | 56 (12.0%) |
| 75 Years and over | 22 (8.7%) | 40 (12.0%) |
Disability Class: Vision Difficulty
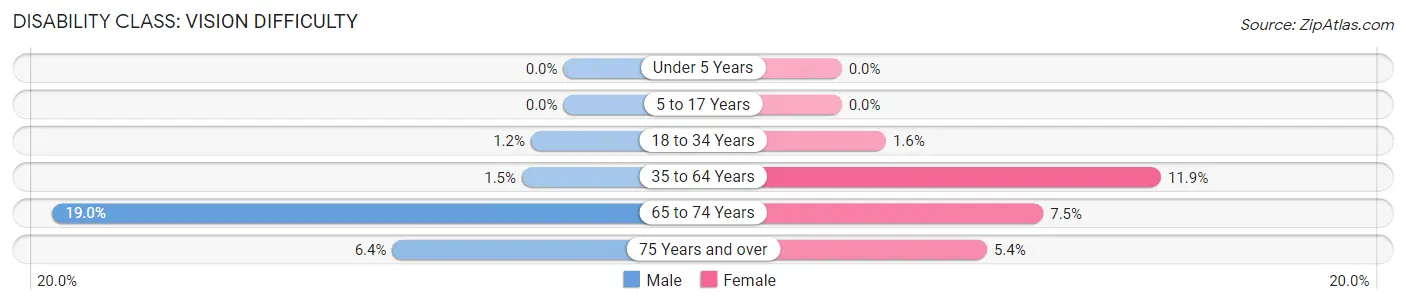
| Age Bracket | Male | Female |
| Under 5 Years | 0 (0.0%) | 0 (0.0%) |
| 5 to 17 Years | 0 (0.0%) | 0 (0.0%) |
| 18 to 34 Years | 9 (1.2%) | 15 (1.6%) |
| 35 to 64 Years | 24 (1.5%) | 179 (11.8%) |
| 65 to 74 Years | 69 (19.0%) | 35 (7.5%) |
| 75 Years and over | 16 (6.4%) | 18 (5.4%) |
Disability Class: Cognitive Difficulty
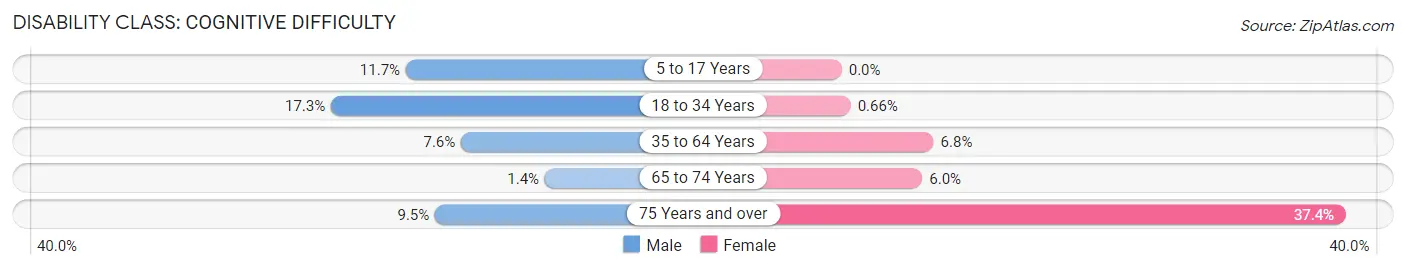
| Age Bracket | Male | Female |
| 5 to 17 Years | 105 (11.7%) | 0 (0.0%) |
| 18 to 34 Years | 128 (17.2%) | 6 (0.7%) |
| 35 to 64 Years | 118 (7.6%) | 103 (6.8%) |
| 65 to 74 Years | 5 (1.4%) | 28 (6.0%) |
| 75 Years and over | 24 (9.5%) | 125 (37.4%) |
Disability Class: Ambulatory Difficulty
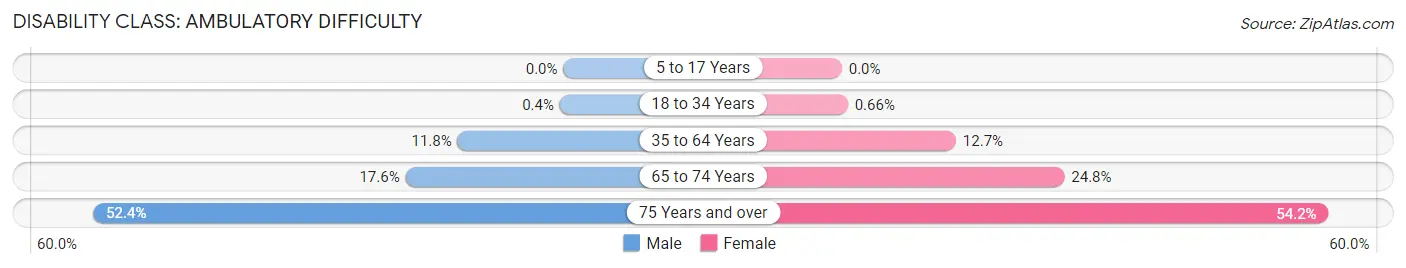
| Age Bracket | Male | Female |
| 5 to 17 Years | 0 (0.0%) | 0 (0.0%) |
| 18 to 34 Years | 3 (0.4%) | 6 (0.7%) |
| 35 to 64 Years | 183 (11.8%) | 192 (12.7%) |
| 65 to 74 Years | 64 (17.6%) | 116 (24.8%) |
| 75 Years and over | 132 (52.4%) | 181 (54.2%) |
Disability Class: Self-Care Difficulty
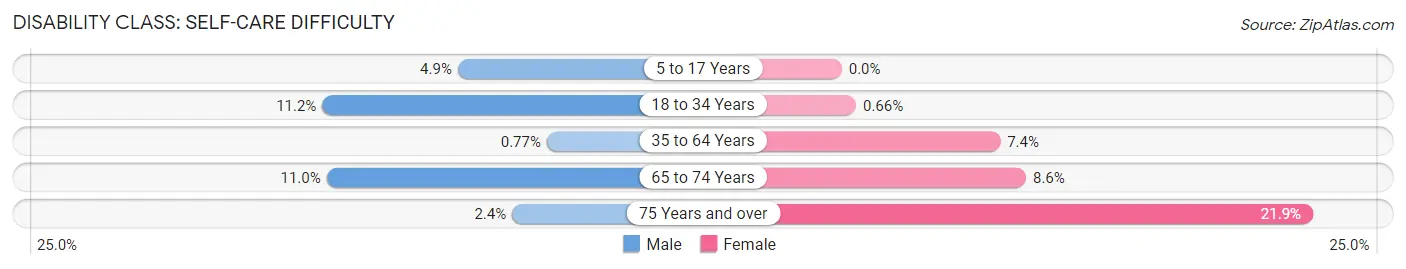
| Age Bracket | Male | Female |
| 5 to 17 Years | 44 (4.9%) | 0 (0.0%) |
| 18 to 34 Years | 83 (11.2%) | 6 (0.7%) |
| 35 to 64 Years | 12 (0.8%) | 111 (7.3%) |
| 65 to 74 Years | 40 (11.0%) | 40 (8.6%) |
| 75 Years and over | 6 (2.4%) | 73 (21.9%) |
Technology Access in Dimmit County
Computing Device Access in Dimmit County
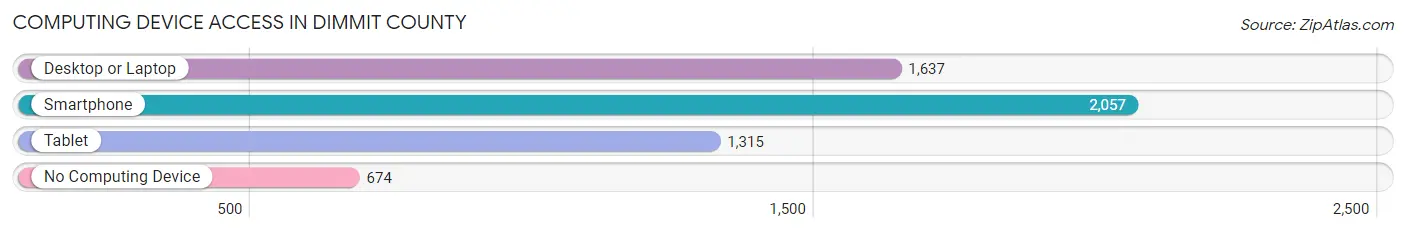
| Device Type | # Households | % Households |
| Desktop or Laptop | 1,637 | 58.3% |
| Smartphone | 2,057 | 73.3% |
| Tablet | 1,315 | 46.8% |
| No Computing Device | 674 | 24.0% |
| Total | 2,808 | 100.0% |
Internet Access in Dimmit County
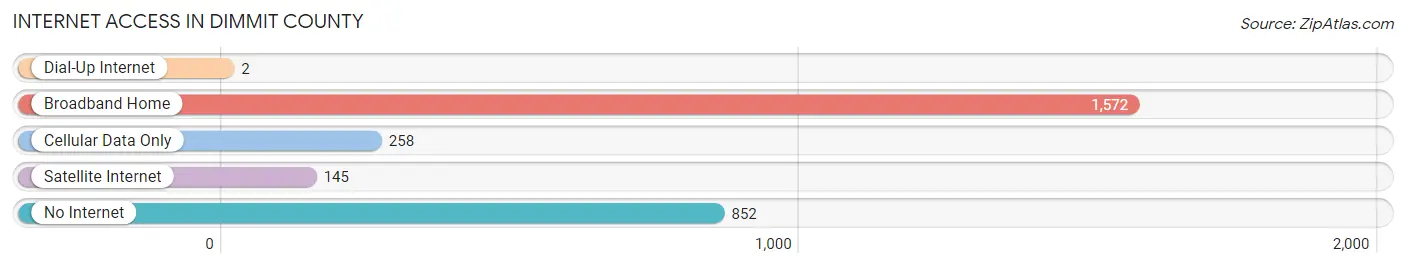
| Internet Type | # Households | % Households |
| Dial-Up Internet | 2 | 0.1% |
| Broadband Home | 1,572 | 56.0% |
| Cellular Data Only | 258 | 9.2% |
| Satellite Internet | 145 | 5.2% |
| No Internet | 852 | 30.3% |
| Total | 2,808 | 100.0% |
Dimmit County Summary
Dimmit County is located in the southern part of Texas, in the United States. It is bordered by La Salle County to the north, Webb County to the east, Maverick County to the south, and Zavala County to the west. The county seat is Carrizo Springs, and the largest city is Asherton. The county was created in 1858 and is named for Philip Dimmitt, a soldier in the Texas Revolution.
Geography
Dimmit County covers an area of 1,334 square miles, making it the second-largest county in Texas. The terrain is mostly flat, with some rolling hills in the northern part of the county. The county is located in the Edwards Plateau region of Texas, and is part of the South Texas Plains ecoregion. The climate is semi-arid, with hot summers and mild winters. The average annual precipitation is 22 inches.
The county is home to several rivers and creeks, including the Nueces River, Frio River, and Las Moras Creek. The Nueces River forms the northern boundary of the county, and the Frio River forms the eastern boundary. The Las Moras Creek runs through the center of the county.
Economy
The economy of Dimmit County is largely based on agriculture and oil and gas production. The county is one of the top producers of cotton in the state, and other crops grown in the county include corn, sorghum, wheat, and hay. The county is also home to several oil and gas fields, and oil and gas production is a major contributor to the local economy.
In addition to agriculture and oil and gas production, Dimmit County is home to several manufacturing companies. The county is home to a large number of food processing plants, as well as several metal fabrication and machine shops. The county is also home to several retail stores, restaurants, and other businesses.
Demographics
As of the 2010 census, the population of Dimmit County was 9,996. The population is largely Hispanic, with over 90% of the population identifying as Hispanic or Latino. The median household income in the county is $31,945, and the median age is 30.
The county is home to several small towns and communities, including Carrizo Springs, Asherton, Big Wells, Catarina, and La Pryor. The county seat is Carrizo Springs, which is the largest city in the county with a population of 5,368.
Conclusion
Dimmit County is a large county in the southern part of Texas. The county is home to several rivers and creeks, and the economy is largely based on agriculture and oil and gas production. The population is largely Hispanic, and the median household income is $31,945. The county is home to several small towns and communities, and the largest city is Carrizo Springs.
Common Questions
What is Per Capita Income in Dimmit County?
Per Capita income in Dimmit County is $19,505.
What is the Median Family Income in Dimmit County?
Median Family Income in Dimmit County is $28,685.
What is the Median Household income in Dimmit County?
Median Household Income in Dimmit County is $27,374.
What is Income or Wage Gap in Dimmit County?
Income or Wage Gap in Dimmit County is 53.1%.
Women in Dimmit County earn 46.9 cents for every dollar earned by a man.
What is Family Income Deficit in Dimmit County?
Family Income Deficit in Dimmit County is $13,813.
Families that are below poverty line in Dimmit County earn $13,813 less on average than the poverty threshold level.
What is Inequality or Gini Index in Dimmit County?
Inequality or Gini Index in Dimmit County is 0.51.
What is the Total Population of Dimmit County?
Total Population of Dimmit County is 8,672.
What is the Total Male Population of Dimmit County?
Total Male Population of Dimmit County is 4,349.
What is the Total Female Population of Dimmit County?
Total Female Population of Dimmit County is 4,323.
What is the Ratio of Males per 100 Females in Dimmit County?
There are 100.60 Males per 100 Females in Dimmit County.
What is the Ratio of Females per 100 Males in Dimmit County?
There are 99.40 Females per 100 Males in Dimmit County.
What is the Median Population Age in Dimmit County?
Median Population Age in Dimmit County is 36.4 Years.
What is the Average Family Size in Dimmit County
Average Family Size in Dimmit County is 3.5 People.
What is the Average Household Size in Dimmit County
Average Household Size in Dimmit County is 3.0 People.
How Large is the Labor Force in Dimmit County?
There are 2,469 People in the Labor Forcein in Dimmit County.
What is the Percentage of People in the Labor Force in Dimmit County?
37.6% of People are in the Labor Force in Dimmit County.
What is the Unemployment Rate in Dimmit County?
Unemployment Rate in Dimmit County is 4.7%.