Dickens County, TX Map & Demographics
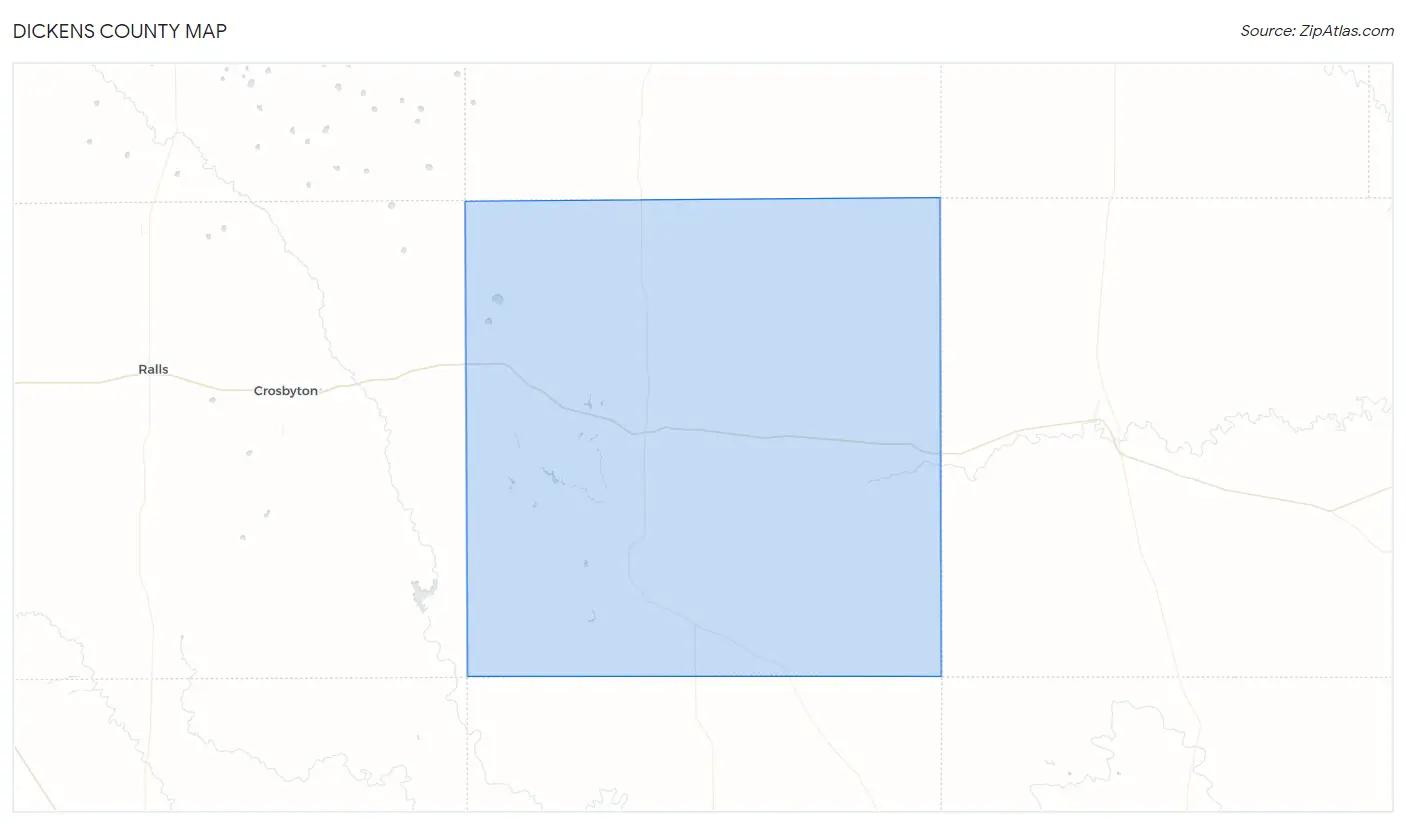
Dickens County Map
Dickens County Overview
$28,798
PER CAPITA INCOME
$64,464
AVG FAMILY INCOME
$46,638
AVG HOUSEHOLD INCOME
14.4%
WAGE / INCOME GAP [ % ]
85.6¢/ $1
WAGE / INCOME GAP [ $ ]
0.45
INEQUALITY / GINI INDEX
1,570
TOTAL POPULATION
739
MALE POPULATION
831
FEMALE POPULATION
88.93
MALES / 100 FEMALES
112.45
FEMALES / 100 MALES
47.9
MEDIAN AGE
3.1
AVG FAMILY SIZE
2.3
AVG HOUSEHOLD SIZE
652
LABOR FORCE [ PEOPLE ]
49.4%
PERCENT IN LABOR FORCE
9.7%
UNEMPLOYMENT RATE
Dickens County Area Codes
Income in Dickens County
Income Overview in Dickens County
Per Capita Income in Dickens County is $28,798, while median incomes of families and households are $64,464 and $46,638 respectively.
| Characteristic | Number | Measure |
| Per Capita Income | 1,570 | $28,798 |
| Median Family Income | 391 | $64,464 |
| Mean Family Income | 391 | $89,902 |
| Median Household Income | 638 | $46,638 |
| Mean Household Income | 638 | $68,840 |
| Income Deficit | 391 | $0 |
| Wage / Income Gap (%) | 1,570 | 14.40% |
| Wage / Income Gap ($) | 1,570 | 85.60¢ per $1 |
| Gini / Inequality Index | 1,570 | 0.45 |
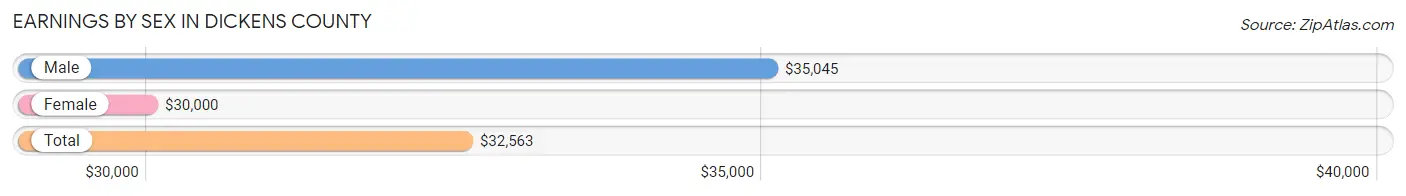
Earnings by Sex in Dickens County
Average Earnings in Dickens County are $32,563, $35,045 for men and $30,000 for women, a difference of 14.4%.
| Sex | Number | Average Earnings |
| Male | 405 (56.6%) | $35,045 |
| Female | 310 (43.4%) | $30,000 |
| Total | 715 (100.0%) | $32,563 |
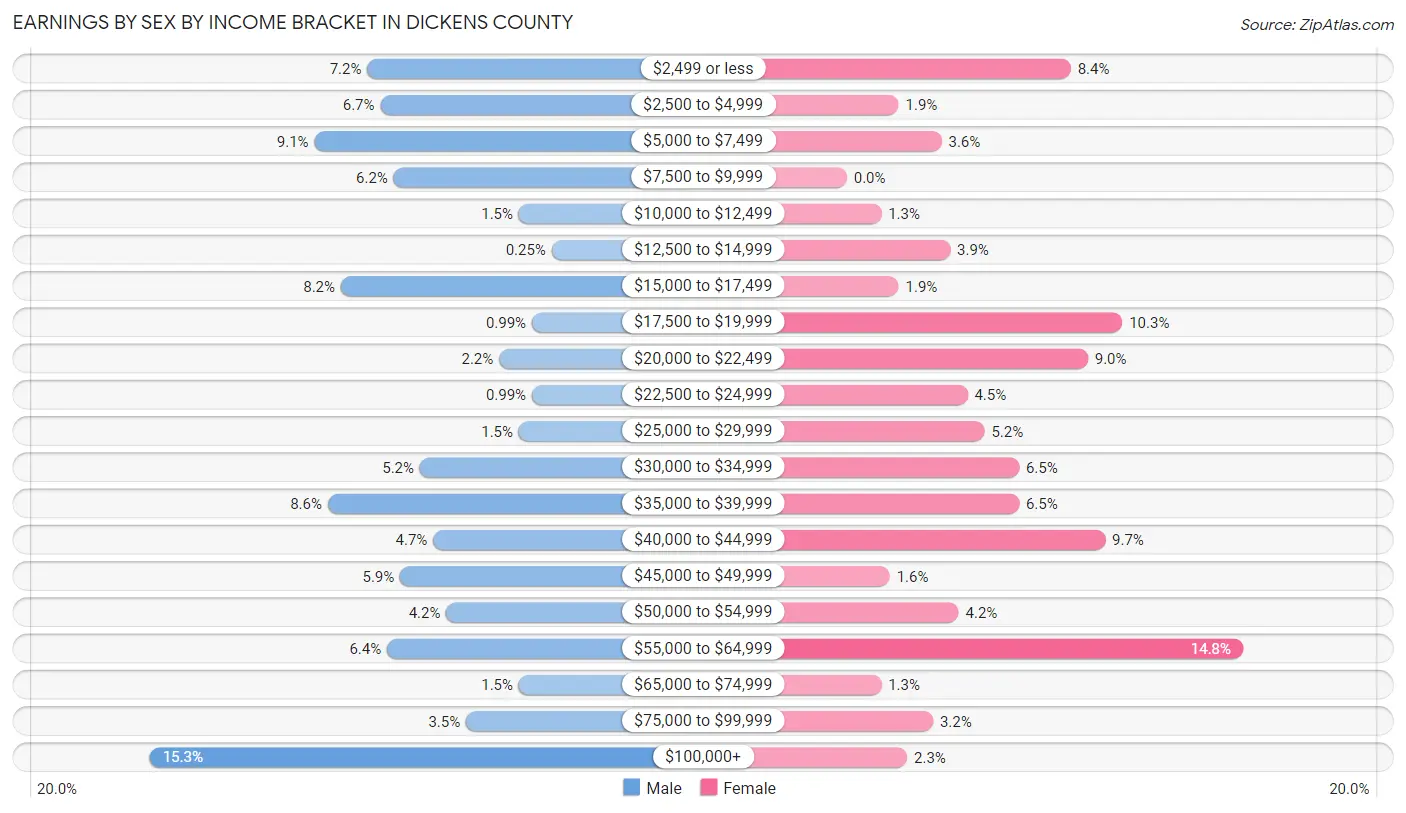
Earnings by Sex by Income Bracket in Dickens County
The most common earnings brackets in Dickens County are $100,000+ for men (62 | 15.3%) and $55,000 to $64,999 for women (46 | 14.8%).
| Income | Male | Female |
| $2,499 or less | 29 (7.2%) | 26 (8.4%) |
| $2,500 to $4,999 | 27 (6.7%) | 6 (1.9%) |
| $5,000 to $7,499 | 37 (9.1%) | 11 (3.5%) |
| $7,500 to $9,999 | 25 (6.2%) | 0 (0.0%) |
| $10,000 to $12,499 | 6 (1.5%) | 4 (1.3%) |
| $12,500 to $14,999 | 1 (0.3%) | 12 (3.9%) |
| $15,000 to $17,499 | 33 (8.2%) | 6 (1.9%) |
| $17,500 to $19,999 | 4 (1.0%) | 32 (10.3%) |
| $20,000 to $22,499 | 9 (2.2%) | 28 (9.0%) |
| $22,500 to $24,999 | 4 (1.0%) | 14 (4.5%) |
| $25,000 to $29,999 | 6 (1.5%) | 16 (5.2%) |
| $30,000 to $34,999 | 21 (5.2%) | 20 (6.5%) |
| $35,000 to $39,999 | 35 (8.6%) | 20 (6.5%) |
| $40,000 to $44,999 | 19 (4.7%) | 30 (9.7%) |
| $45,000 to $49,999 | 24 (5.9%) | 5 (1.6%) |
| $50,000 to $54,999 | 17 (4.2%) | 13 (4.2%) |
| $55,000 to $64,999 | 26 (6.4%) | 46 (14.8%) |
| $65,000 to $74,999 | 6 (1.5%) | 4 (1.3%) |
| $75,000 to $99,999 | 14 (3.5%) | 10 (3.2%) |
| $100,000+ | 62 (15.3%) | 7 (2.3%) |
| Total | 405 (100.0%) | 310 (100.0%) |
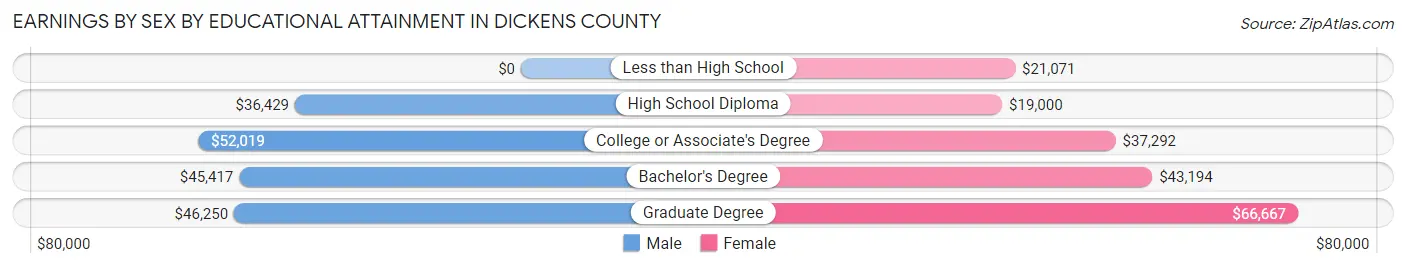
Earnings by Sex by Educational Attainment in Dickens County
Average earnings in Dickens County are $41,484 for men and $32,857 for women, a difference of 20.8%. Men with an educational attainment of college or associate's degree enjoy the highest average annual earnings of $52,019, while those with high school diploma education earn the least with $36,429. Women with an educational attainment of graduate degree earn the most with the average annual earnings of $66,667, while those with high school diploma education have the smallest earnings of $19,000.
| Educational Attainment | Male Income | Female Income |
| Less than High School | - | - |
| High School Diploma | $36,429 | $19,000 |
| College or Associate's Degree | $52,019 | $37,292 |
| Bachelor's Degree | $45,417 | $43,194 |
| Graduate Degree | $46,250 | $66,667 |
| Total | $41,484 | $32,857 |
Family Income in Dickens County
Family Income Brackets in Dickens County
According to the Dickens County family income data, there are 88 families falling into the $35,000 to $49,999 income range, which is the most common income bracket and makes up 22.5% of all families. Conversely, the $10,000 to $14,999 income bracket is the least frequent group with only 5 families (1.3%) belonging to this category.
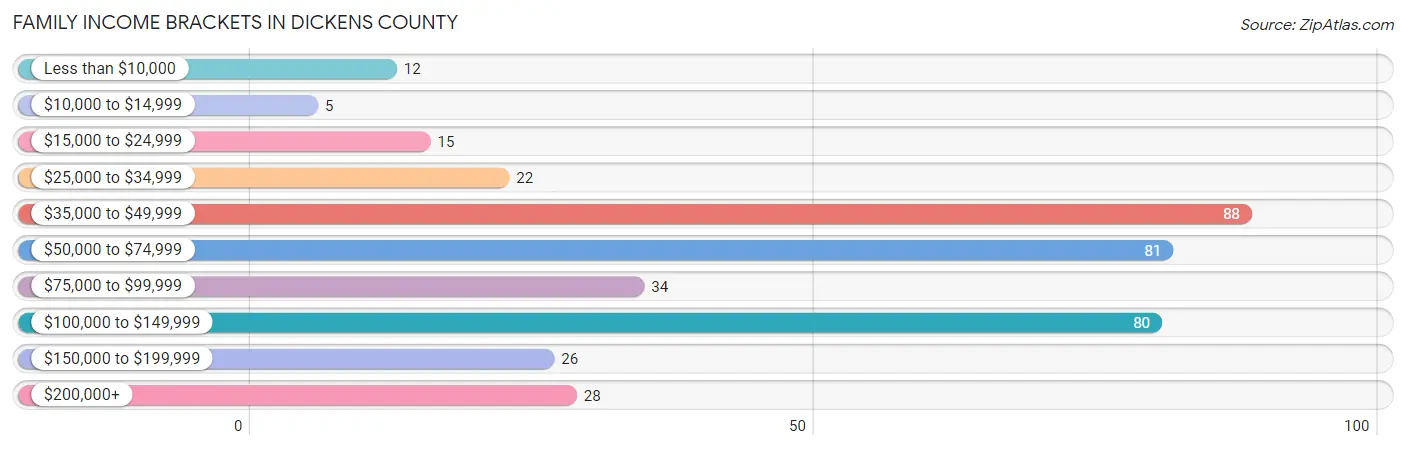
| Income Bracket | # Families | % Families |
| Less than $10,000 | 12 | 3.1% |
| $10,000 to $14,999 | 5 | 1.3% |
| $15,000 to $24,999 | 15 | 3.8% |
| $25,000 to $34,999 | 22 | 5.6% |
| $35,000 to $49,999 | 88 | 22.5% |
| $50,000 to $74,999 | 81 | 20.7% |
| $75,000 to $99,999 | 34 | 8.7% |
| $100,000 to $149,999 | 80 | 20.5% |
| $150,000 to $199,999 | 26 | 6.6% |
| $200,000+ | 28 | 7.2% |
Family Income by Famaliy Size in Dickens County
5-person families (36 | 9.2%) account for the highest median family income in Dickens County with $135,833 per family, while 2-person families (256 | 65.5%) have the highest median income of $29,808 per family member.
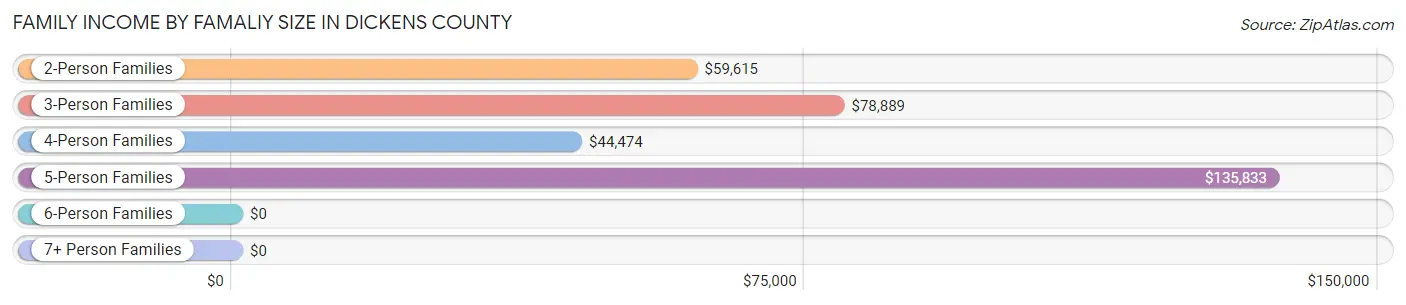
| Income Bracket | # Families | Median Income |
| 2-Person Families | 256 (65.5%) | $59,615 |
| 3-Person Families | 54 (13.8%) | $78,889 |
| 4-Person Families | 36 (9.2%) | $44,474 |
| 5-Person Families | 36 (9.2%) | $135,833 |
| 6-Person Families | 4 (1.0%) | $0 |
| 7+ Person Families | 5 (1.3%) | $0 |
| Total | 391 (100.0%) | $64,464 |
Family Income by Number of Earners in Dickens County
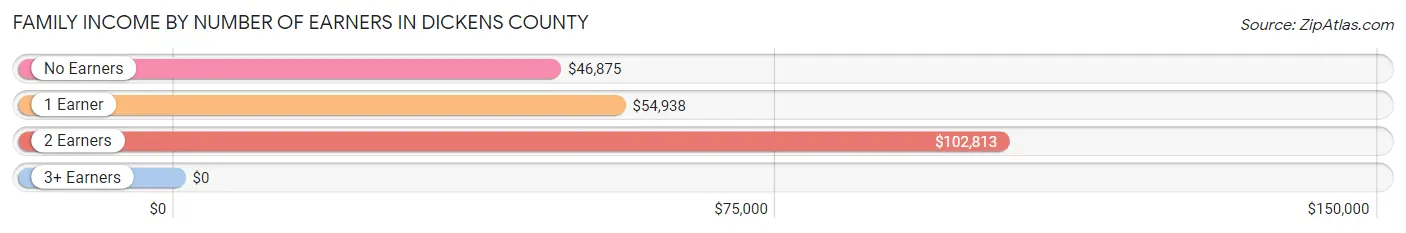
| Number of Earners | # Families | Median Income |
| No Earners | 99 (25.3%) | $46,875 |
| 1 Earner | 141 (36.1%) | $54,938 |
| 2 Earners | 125 (32.0%) | $102,813 |
| 3+ Earners | 26 (6.7%) | $0 |
| Total | 391 (100.0%) | $64,464 |
Household Income in Dickens County
Household Income Brackets in Dickens County
With 147 households falling in the category, the $35,000 to $49,999 income range is the most frequent in Dickens County, accounting for 23.0% of all households. In contrast, only 28 households (4.4%) fall into the $150,000 to $199,999 income bracket, making it the least populous group.
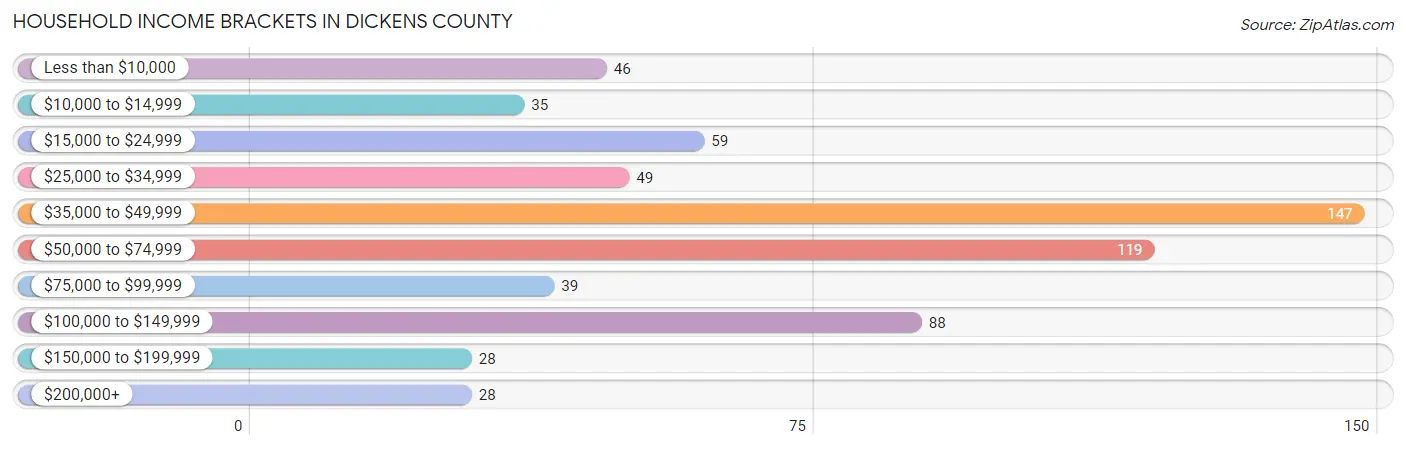
| Income Bracket | # Households | % Households |
| Less than $10,000 | 46 | 7.2% |
| $10,000 to $14,999 | 35 | 5.5% |
| $15,000 to $24,999 | 59 | 9.2% |
| $25,000 to $34,999 | 49 | 7.7% |
| $35,000 to $49,999 | 147 | 23.0% |
| $50,000 to $74,999 | 119 | 18.7% |
| $75,000 to $99,999 | 39 | 6.1% |
| $100,000 to $149,999 | 88 | 13.8% |
| $150,000 to $199,999 | 28 | 4.4% |
| $200,000+ | 28 | 4.4% |
Household Income by Householder Age in Dickens County
The median household income in Dickens County is $46,638, with the highest median household income of $61,563 found in the 25 to 44 years age bracket for the primary householder. A total of 125 households (19.6%) fall into this category. Meanwhile, the 15 to 24 years age bracket for the primary householder has the lowest median household income of $0, with 29 households (4.5%) in this group.
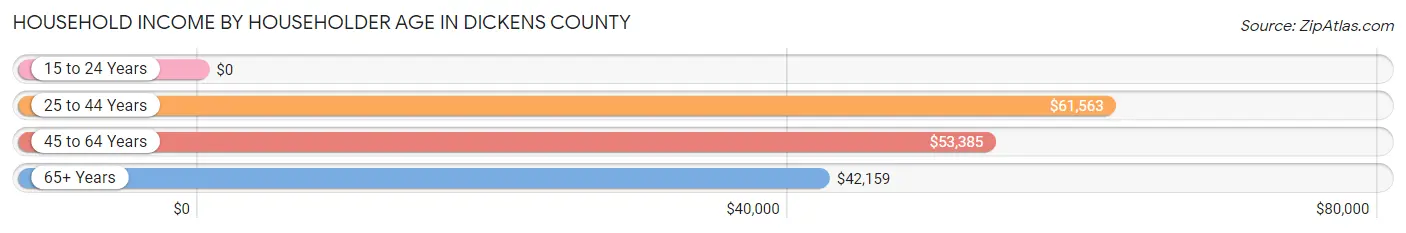
| Income Bracket | # Households | Median Income |
| 15 to 24 Years | 29 (4.5%) | $0 |
| 25 to 44 Years | 125 (19.6%) | $61,563 |
| 45 to 64 Years | 249 (39.0%) | $53,385 |
| 65+ Years | 235 (36.8%) | $42,159 |
| Total | 638 (100.0%) | $46,638 |
Poverty in Dickens County
Income Below Poverty by Sex and Age in Dickens County
With 11.3% poverty level for males and 13.1% for females among the residents of Dickens County, 12 to 14 year old males and 75 year old and over females are the most vulnerable to poverty, with 7 males (36.8%) and 30 females (25.9%) in their respective age groups living below the poverty level.
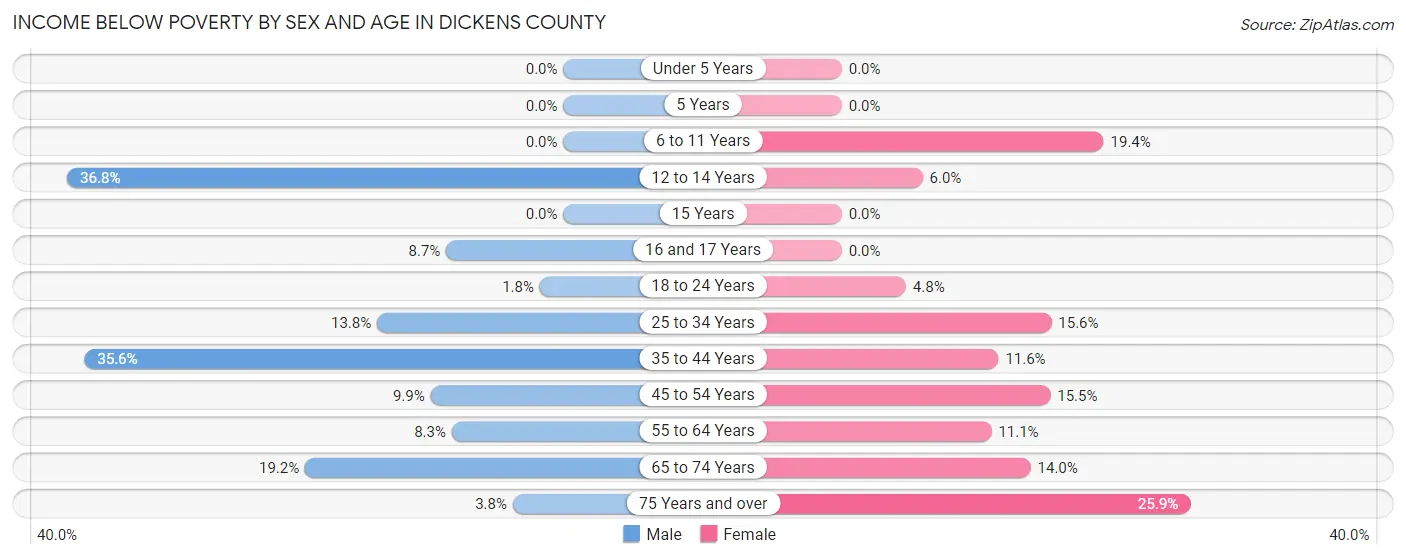
| Age Bracket | Male | Female |
| Under 5 Years | 0 (0.0%) | 0 (0.0%) |
| 5 Years | 0 (0.0%) | 0 (0.0%) |
| 6 to 11 Years | 0 (0.0%) | 7 (19.4%) |
| 12 to 14 Years | 7 (36.8%) | 3 (6.0%) |
| 15 Years | 0 (0.0%) | 0 (0.0%) |
| 16 and 17 Years | 4 (8.7%) | 0 (0.0%) |
| 18 to 24 Years | 1 (1.8%) | 1 (4.8%) |
| 25 to 34 Years | 13 (13.8%) | 14 (15.6%) |
| 35 to 44 Years | 16 (35.6%) | 10 (11.6%) |
| 45 to 54 Years | 7 (9.9%) | 13 (15.5%) |
| 55 to 64 Years | 13 (8.3%) | 12 (11.1%) |
| 65 to 74 Years | 14 (19.2%) | 15 (14.0%) |
| 75 Years and over | 3 (3.7%) | 30 (25.9%) |
| Total | 78 (11.3%) | 105 (13.1%) |
Income Above Poverty by Sex and Age in Dickens County
According to the poverty statistics in Dickens County, males aged under 5 years and females aged under 5 years are the age groups that are most secure financially, with 100.0% of males and 100.0% of females in these age groups living above the poverty line.
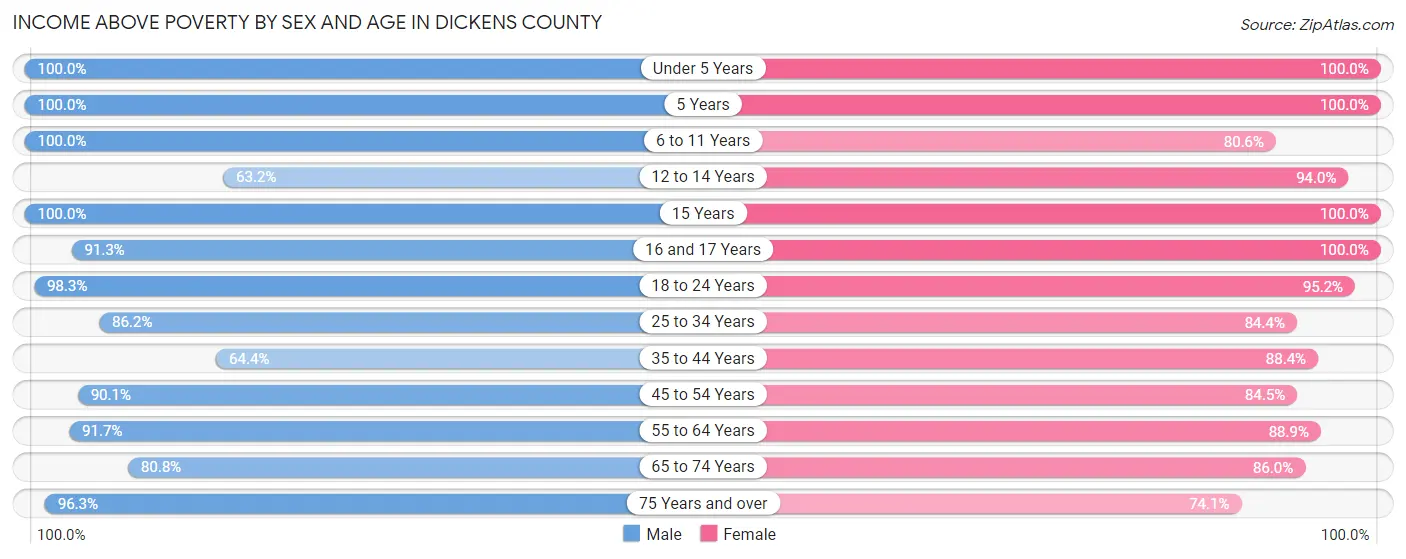
| Age Bracket | Male | Female |
| Under 5 Years | 25 (100.0%) | 76 (100.0%) |
| 5 Years | 5 (100.0%) | 11 (100.0%) |
| 6 to 11 Years | 8 (100.0%) | 29 (80.6%) |
| 12 to 14 Years | 12 (63.2%) | 47 (94.0%) |
| 15 Years | 11 (100.0%) | 2 (100.0%) |
| 16 and 17 Years | 42 (91.3%) | 13 (100.0%) |
| 18 to 24 Years | 56 (98.3%) | 20 (95.2%) |
| 25 to 34 Years | 81 (86.2%) | 76 (84.4%) |
| 35 to 44 Years | 29 (64.4%) | 76 (88.4%) |
| 45 to 54 Years | 64 (90.1%) | 71 (84.5%) |
| 55 to 64 Years | 144 (91.7%) | 96 (88.9%) |
| 65 to 74 Years | 59 (80.8%) | 92 (86.0%) |
| 75 Years and over | 77 (96.3%) | 86 (74.1%) |
| Total | 613 (88.7%) | 695 (86.9%) |
Income Below Poverty Among Married-Couple Families in Dickens County
The poverty statistics for married-couple families in Dickens County show that 3.5% or 11 of the total 317 families live below the poverty line. Families with 3 or 4 children have the highest poverty rate of 9.7%, comprising of 3 families. On the other hand, families with 1 or 2 children have the lowest poverty rate of 0.0%, which includes 0 families.
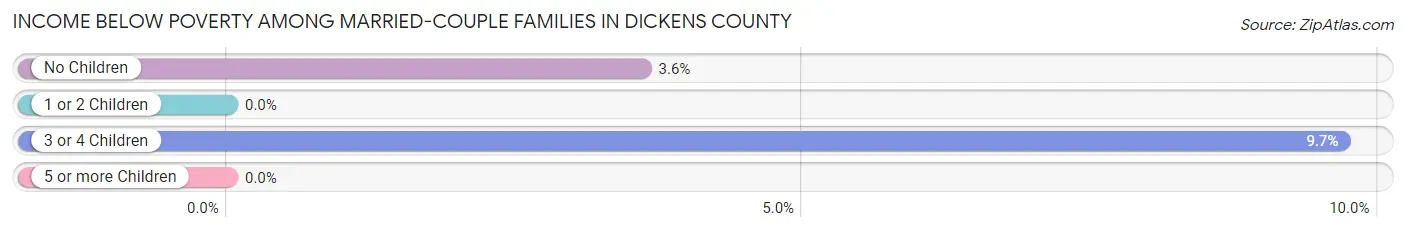
| Children | Above Poverty | Below Poverty |
| No Children | 214 (96.4%) | 8 (3.6%) |
| 1 or 2 Children | 62 (100.0%) | 0 (0.0%) |
| 3 or 4 Children | 28 (90.3%) | 3 (9.7%) |
| 5 or more Children | 2 (100.0%) | 0 (0.0%) |
| Total | 306 (96.5%) | 11 (3.5%) |
Income Below Poverty Among Single-Parent Households in Dickens County
According to the poverty data in Dickens County, 20.0% or 5 single-father households and 24.5% or 12 single-mother households are living below the poverty line. Among single-father households, those with no children have the highest poverty rate, with 5 households (38.5%) experiencing poverty. Likewise, among single-mother households, those with no children have the highest poverty rate, with 4 households (26.7%) falling below the poverty line.
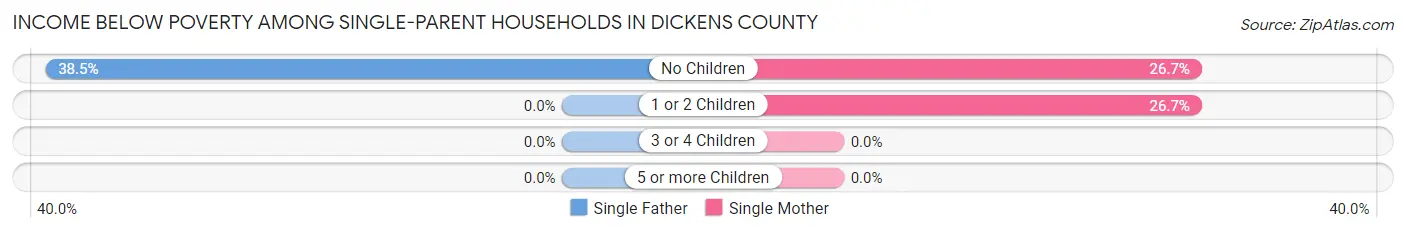
| Children | Single Father | Single Mother |
| No Children | 5 (38.5%) | 4 (26.7%) |
| 1 or 2 Children | 0 (0.0%) | 8 (26.7%) |
| 3 or 4 Children | 0 (0.0%) | 0 (0.0%) |
| 5 or more Children | 0 (0.0%) | 0 (0.0%) |
| Total | 5 (20.0%) | 12 (24.5%) |
Income Below Poverty Among Married-Couple vs Single-Parent Households in Dickens County
The poverty data for Dickens County shows that 11 of the married-couple family households (3.5%) and 17 of the single-parent households (23.0%) are living below the poverty level. Within the married-couple family households, those with 3 or 4 children have the highest poverty rate, with 3 households (9.7%) falling below the poverty line. Among the single-parent households, those with no children have the highest poverty rate, with 9 household (32.1%) living below poverty.
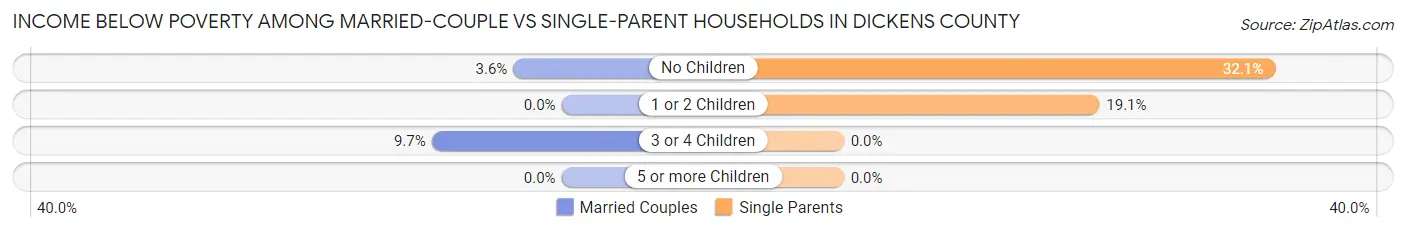
| Children | Married-Couple Families | Single-Parent Households |
| No Children | 8 (3.6%) | 9 (32.1%) |
| 1 or 2 Children | 0 (0.0%) | 8 (19.1%) |
| 3 or 4 Children | 3 (9.7%) | 0 (0.0%) |
| 5 or more Children | 0 (0.0%) | 0 (0.0%) |
| Total | 11 (3.5%) | 17 (23.0%) |
Race in Dickens County
The most populous races in Dickens County are White / Caucasian (1,275 | 81.2%), Hispanic or Latino (599 | 38.2%), and Some other Race (174 | 11.1%).
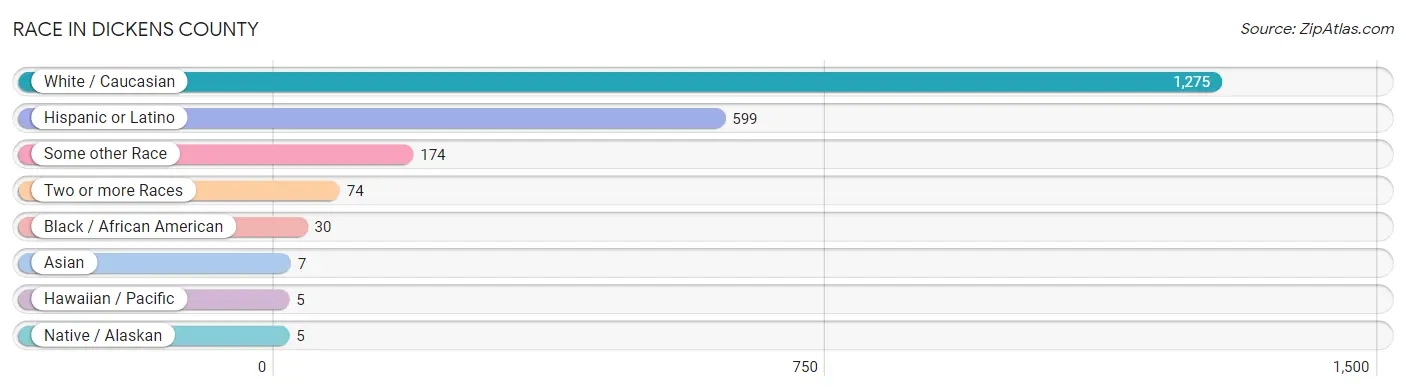
| Race | # Population | % Population |
| Asian | 7 | 0.4% |
| Black / African American | 30 | 1.9% |
| Hawaiian / Pacific | 5 | 0.3% |
| Hispanic or Latino | 599 | 38.2% |
| Native / Alaskan | 5 | 0.3% |
| White / Caucasian | 1,275 | 81.2% |
| Two or more Races | 74 | 4.7% |
| Some other Race | 174 | 11.1% |
| Total | 1,570 | 100.0% |
Ancestry in Dickens County
The most populous ancestries reported in Dickens County are Mexican (455 | 29.0%), English (146 | 9.3%), Irish (119 | 7.6%), American (90 | 5.7%), and German (72 | 4.6%), together accounting for 56.2% of all Dickens County residents.
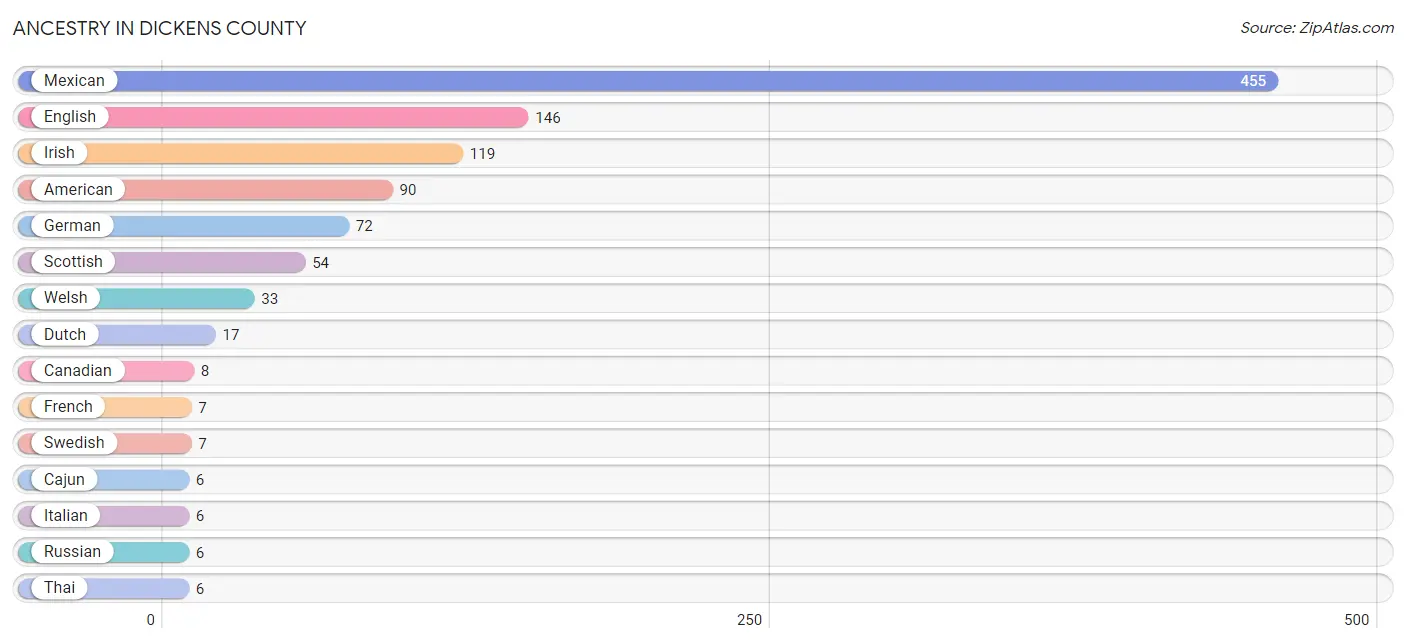
| Ancestry | # Population | % Population |
| American | 90 | 5.7% |
| British | 4 | 0.3% |
| Cajun | 6 | 0.4% |
| Canadian | 8 | 0.5% |
| Cherokee | 1 | 0.1% |
| Czech | 1 | 0.1% |
| Dutch | 17 | 1.1% |
| English | 146 | 9.3% |
| European | 2 | 0.1% |
| French | 7 | 0.4% |
| French Canadian | 3 | 0.2% |
| German | 72 | 4.6% |
| Greek | 5 | 0.3% |
| Guamanian / Chamorro | 5 | 0.3% |
| Icelander | 5 | 0.3% |
| Irish | 119 | 7.6% |
| Italian | 6 | 0.4% |
| Korean | 1 | 0.1% |
| Mexican | 455 | 29.0% |
| Norwegian | 3 | 0.2% |
| Russian | 6 | 0.4% |
| Scandinavian | 2 | 0.1% |
| Scotch-Irish | 4 | 0.3% |
| Scottish | 54 | 3.4% |
| Sioux | 3 | 0.2% |
| South American | 3 | 0.2% |
| Spanish | 4 | 0.3% |
| Swedish | 7 | 0.4% |
| Thai | 6 | 0.4% |
| Venezuelan | 3 | 0.2% |
| Welsh | 33 | 2.1% | View All 31 Rows |
Immigrants in Dickens County
The most numerous immigrant groups reported in Dickens County came from Latin America (58 | 3.7%), Central America (55 | 3.5%), Mexico (44 | 2.8%), Europe (14 | 0.9%), and El Salvador (7 | 0.4%), together accounting for 11.3% of all Dickens County residents.
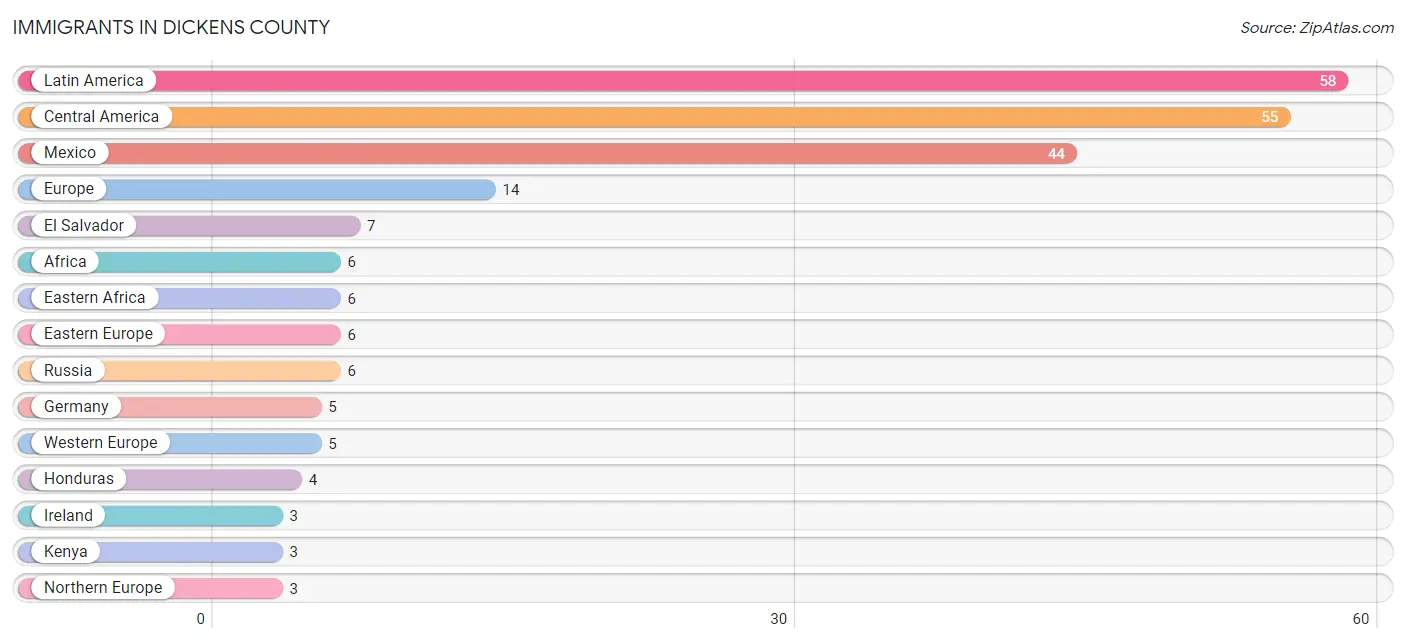
| Immigration Origin | # Population | % Population |
| Africa | 6 | 0.4% |
| Asia | 1 | 0.1% |
| Central America | 55 | 3.5% |
| Eastern Africa | 6 | 0.4% |
| Eastern Europe | 6 | 0.4% |
| El Salvador | 7 | 0.4% |
| Europe | 14 | 0.9% |
| Germany | 5 | 0.3% |
| Honduras | 4 | 0.3% |
| Ireland | 3 | 0.2% |
| Kenya | 3 | 0.2% |
| Latin America | 58 | 3.7% |
| Mexico | 44 | 2.8% |
| Northern Europe | 3 | 0.2% |
| Philippines | 1 | 0.1% |
| Russia | 6 | 0.4% |
| South America | 3 | 0.2% |
| South Eastern Asia | 1 | 0.1% |
| Uganda | 3 | 0.2% |
| Venezuela | 3 | 0.2% |
| Western Europe | 5 | 0.3% | View All 21 Rows |
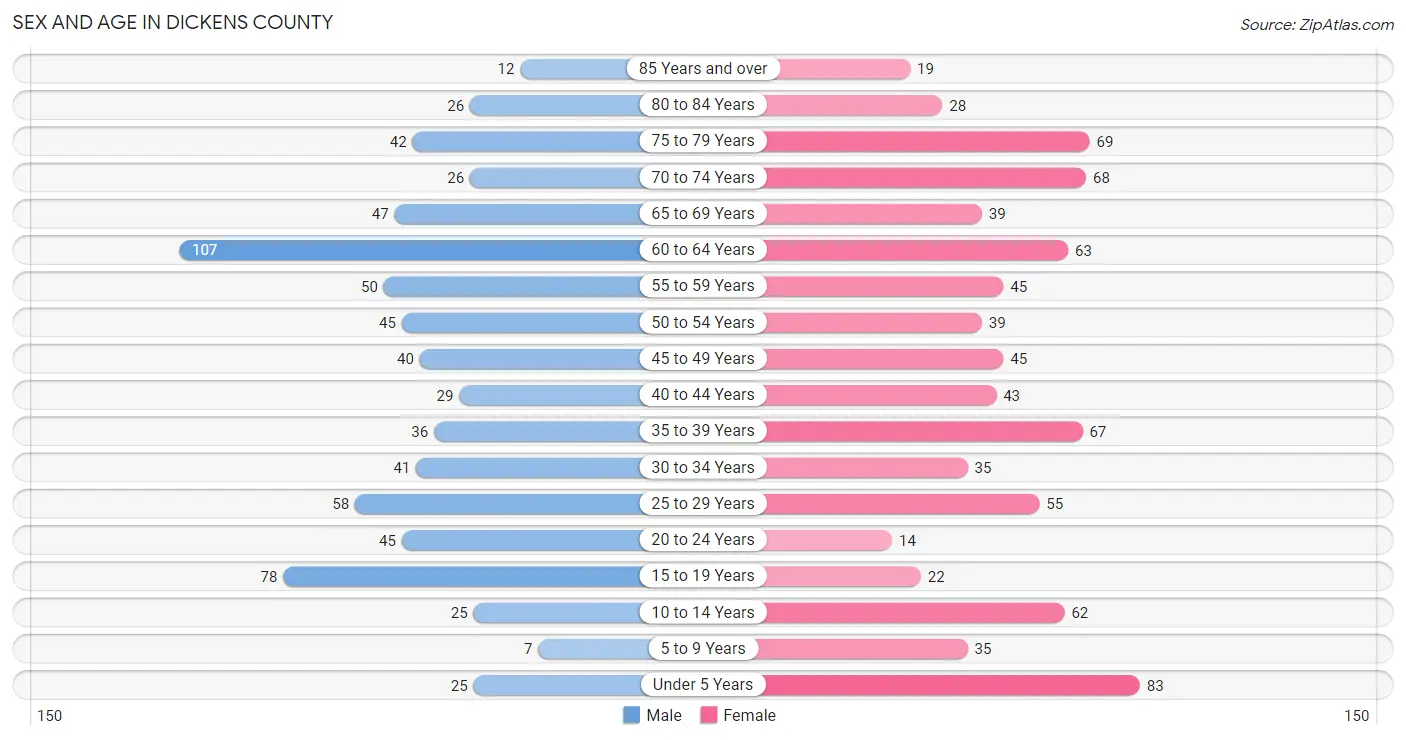
Sex and Age in Dickens County
Sex and Age in Dickens County
The most populous age groups in Dickens County are 60 to 64 Years (107 | 14.5%) for men and Under 5 Years (83 | 10.0%) for women.
| Age Bracket | Male | Female |
| Under 5 Years | 25 (3.4%) | 83 (10.0%) |
| 5 to 9 Years | 7 (0.9%) | 35 (4.2%) |
| 10 to 14 Years | 25 (3.4%) | 62 (7.5%) |
| 15 to 19 Years | 78 (10.5%) | 22 (2.6%) |
| 20 to 24 Years | 45 (6.1%) | 14 (1.7%) |
| 25 to 29 Years | 58 (7.9%) | 55 (6.6%) |
| 30 to 34 Years | 41 (5.6%) | 35 (4.2%) |
| 35 to 39 Years | 36 (4.9%) | 67 (8.1%) |
| 40 to 44 Years | 29 (3.9%) | 43 (5.2%) |
| 45 to 49 Years | 40 (5.4%) | 45 (5.4%) |
| 50 to 54 Years | 45 (6.1%) | 39 (4.7%) |
| 55 to 59 Years | 50 (6.8%) | 45 (5.4%) |
| 60 to 64 Years | 107 (14.5%) | 63 (7.6%) |
| 65 to 69 Years | 47 (6.4%) | 39 (4.7%) |
| 70 to 74 Years | 26 (3.5%) | 68 (8.2%) |
| 75 to 79 Years | 42 (5.7%) | 69 (8.3%) |
| 80 to 84 Years | 26 (3.5%) | 28 (3.4%) |
| 85 Years and over | 12 (1.6%) | 19 (2.3%) |
| Total | 739 (100.0%) | 831 (100.0%) |
Families and Households in Dickens County
Median Family Size in Dickens County
The median family size in Dickens County is 3.12 persons per family, with single male/father families (25 | 6.4%) accounting for the largest median family size of 3.64 persons per family. On the other hand, married-couple families (317 | 81.1%) represent the smallest median family size with 3.04 persons per family.
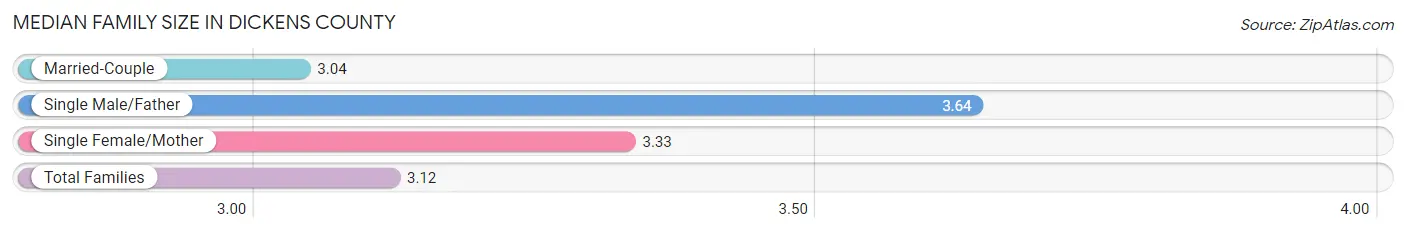
| Family Type | # Families | Family Size |
| Married-Couple | 317 (81.1%) | 3.04 |
| Single Male/Father | 25 (6.4%) | 3.64 |
| Single Female/Mother | 49 (12.5%) | 3.33 |
| Total Families | 391 (100.0%) | 3.12 |
Median Household Size in Dickens County
The median household size in Dickens County is 2.34 persons per household, with single male/father households (25 | 3.9%) accounting for the largest median household size of 4.04 persons per household. non-family households (247 | 38.7%) represent the smallest median household size with 1.05 persons per household.
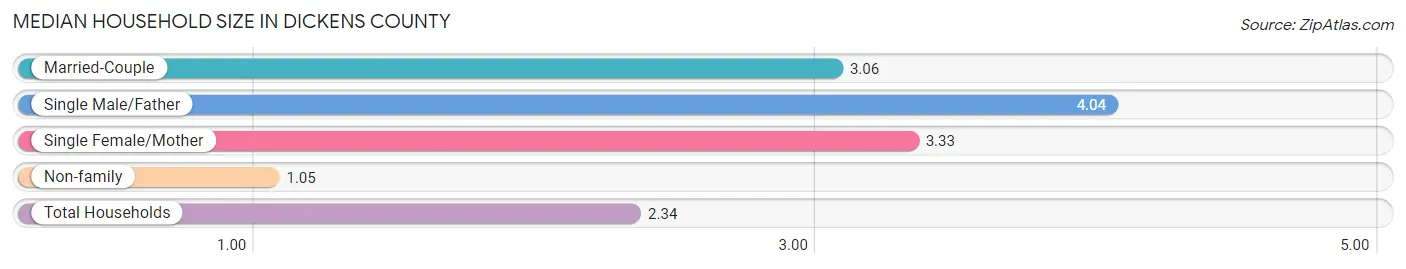
| Household Type | # Households | Household Size |
| Married-Couple | 317 (49.7%) | 3.06 |
| Single Male/Father | 25 (3.9%) | 4.04 |
| Single Female/Mother | 49 (7.7%) | 3.33 |
| Non-family | 247 (38.7%) | 1.05 |
| Total Households | 638 (100.0%) | 2.34 |
Household Size by Marriage Status in Dickens County
Out of a total of 638 households in Dickens County, 391 (61.3%) are family households, while 247 (38.7%) are nonfamily households. The most numerous type of family households are 2-person households, comprising 244, and the most common type of nonfamily households are 1-person households, comprising 230.
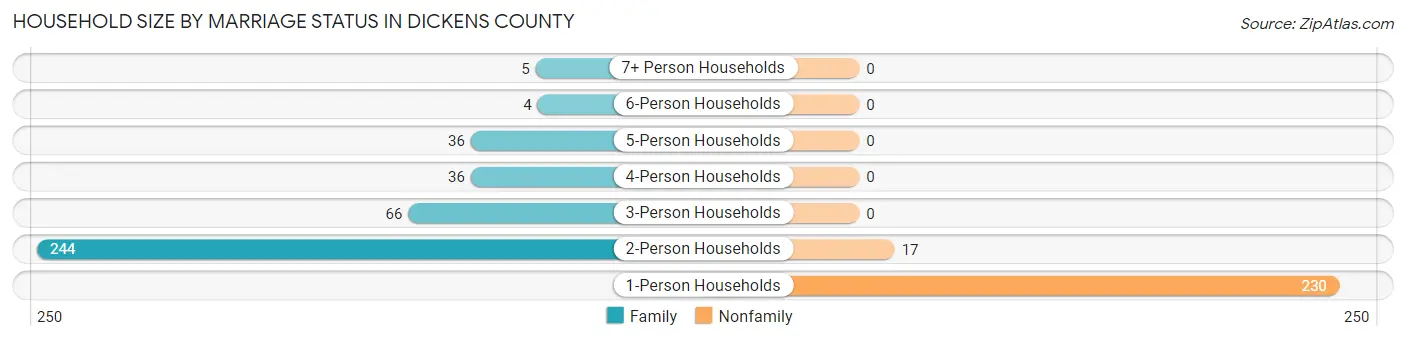
| Household Size | Family Households | Nonfamily Households |
| 1-Person Households | - | 230 (36.0%) |
| 2-Person Households | 244 (38.2%) | 17 (2.7%) |
| 3-Person Households | 66 (10.3%) | 0 (0.0%) |
| 4-Person Households | 36 (5.6%) | 0 (0.0%) |
| 5-Person Households | 36 (5.6%) | 0 (0.0%) |
| 6-Person Households | 4 (0.6%) | 0 (0.0%) |
| 7+ Person Households | 5 (0.8%) | 0 (0.0%) |
| Total | 391 (61.3%) | 247 (38.7%) |
Female Fertility in Dickens County
Fertility by Age in Dickens County
Average fertility rate in Dickens County is 202.0 births per 1,000 women. Women in the age bracket of 20 to 34 years have the highest fertility rate with 500.0 births per 1,000 women. Women in the age bracket of 20 to 34 years acount for 88.1% of all women with births.
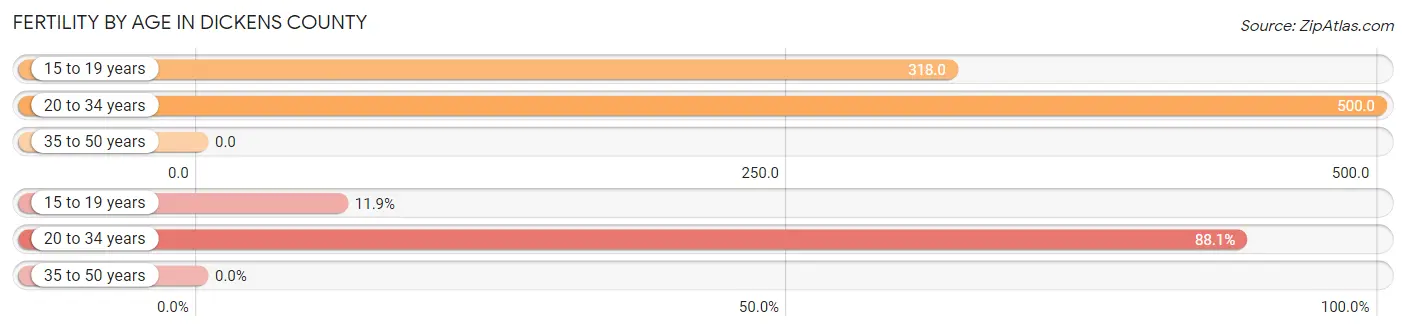
| Age Bracket | Women with Births | Births / 1,000 Women |
| 15 to 19 years | 7 (11.9%) | 318.0 |
| 20 to 34 years | 52 (88.1%) | 500.0 |
| 35 to 50 years | 0 (0.0%) | 0.0 |
| Total | 59 (100.0%) | 202.0 |
Fertility by Age by Marriage Status in Dickens County
88.1% of women with births (59) in Dickens County are married. The highest percentage of unmarried women with births falls into 15 to 19 years age bracket with 100.0% of them unmarried at the time of birth, while the lowest percentage of unmarried women with births belong to 20 to 34 years age bracket with 0.0% of them unmarried.
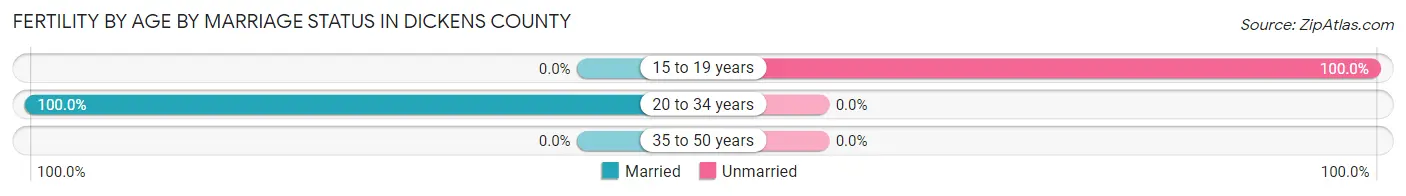
| Age Bracket | Married | Unmarried |
| 15 to 19 years | 0 (0.0%) | 7 (100.0%) |
| 20 to 34 years | 52 (100.0%) | 0 (0.0%) |
| 35 to 50 years | 0 (0.0%) | 0 (0.0%) |
| Total | 52 (88.1%) | 7 (11.9%) |
Fertility by Education in Dickens County
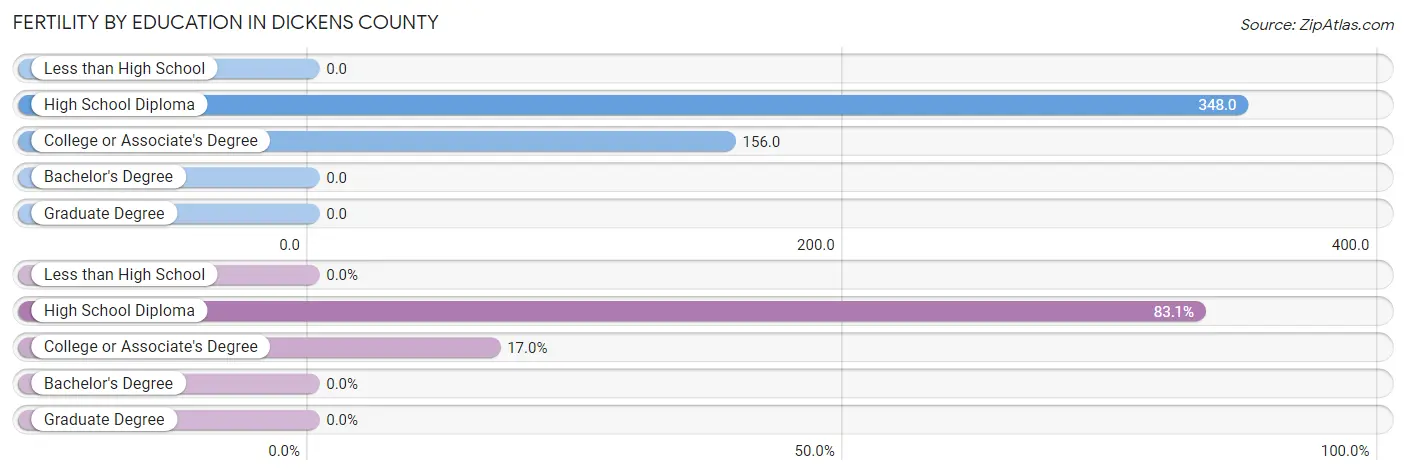
| Educational Attainment | Women with Births | Births / 1,000 Women |
| Less than High School | 0 (0.0%) | 0.0 |
| High School Diploma | 49 (83.1%) | 348.0 |
| College or Associate's Degree | 10 (17.0%) | 156.0 |
| Bachelor's Degree | 0 (0.0%) | 0.0 |
| Graduate Degree | 0 (0.0%) | 0.0 |
| Total | 59 (100.0%) | 202.0 |
Fertility by Education by Marriage Status in Dickens County
11.9% of women with births in Dickens County are unmarried. Women with the educational attainment of high school diploma are most likely to be married with 100.0% of them married at childbirth, while women with the educational attainment of college or associate's degree are least likely to be married with 70.0% of them unmarried at childbirth.
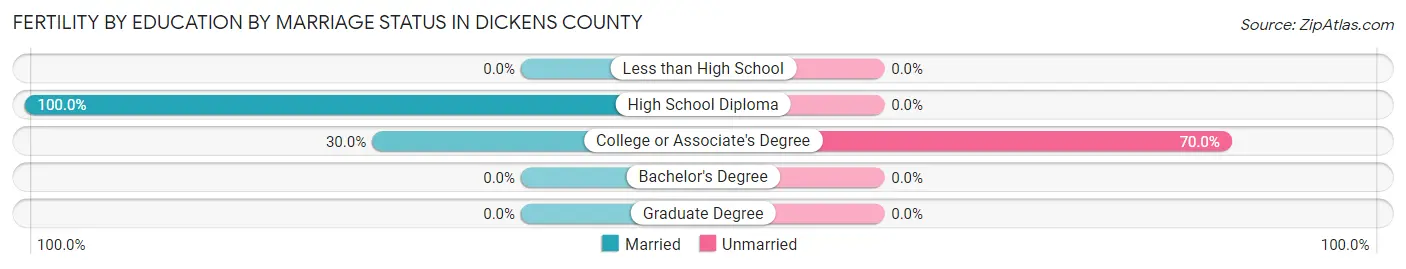
| Educational Attainment | Married | Unmarried |
| Less than High School | 0 (0.0%) | 0 (0.0%) |
| High School Diploma | 49 (100.0%) | 0 (0.0%) |
| College or Associate's Degree | 3 (30.0%) | 7 (70.0%) |
| Bachelor's Degree | 0 (0.0%) | 0 (0.0%) |
| Graduate Degree | 0 (0.0%) | 0 (0.0%) |
| Total | 52 (88.1%) | 7 (11.9%) |
Employment Characteristics in Dickens County
Employment by Class of Employer in Dickens County
Among the 589 employed individuals in Dickens County, private company employees (295 | 50.1%), local government employees (81 | 13.8%), and state government employees (65 | 11.0%) make up the most common classes of employment.
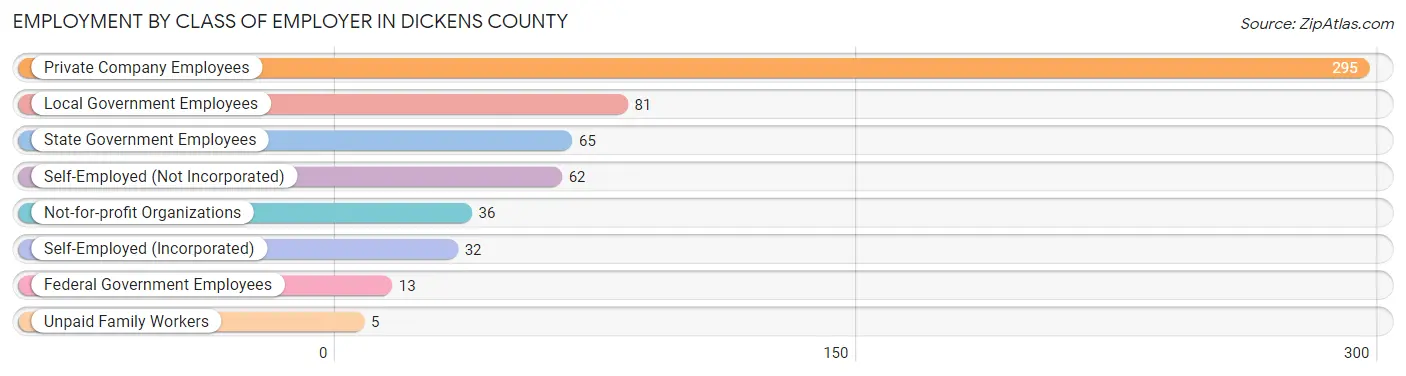
| Employer Class | # Employees | % Employees |
| Private Company Employees | 295 | 50.1% |
| Self-Employed (Incorporated) | 32 | 5.4% |
| Self-Employed (Not Incorporated) | 62 | 10.5% |
| Not-for-profit Organizations | 36 | 6.1% |
| Local Government Employees | 81 | 13.8% |
| State Government Employees | 65 | 11.0% |
| Federal Government Employees | 13 | 2.2% |
| Unpaid Family Workers | 5 | 0.9% |
| Total | 589 | 100.0% |
Employment Status by Age in Dickens County
According to the labor force statistics for Dickens County, out of the total population over 16 years of age (1,320), 49.4% or 652 individuals are in the labor force, with 9.7% or 63 of them unemployed. The age group with the highest labor force participation rate is 20 to 24 years, with 81.4% or 48 individuals in the labor force. Within the labor force, the 20 to 24 years age range has the highest percentage of unemployed individuals, with 29.2% or 14 of them being unemployed.
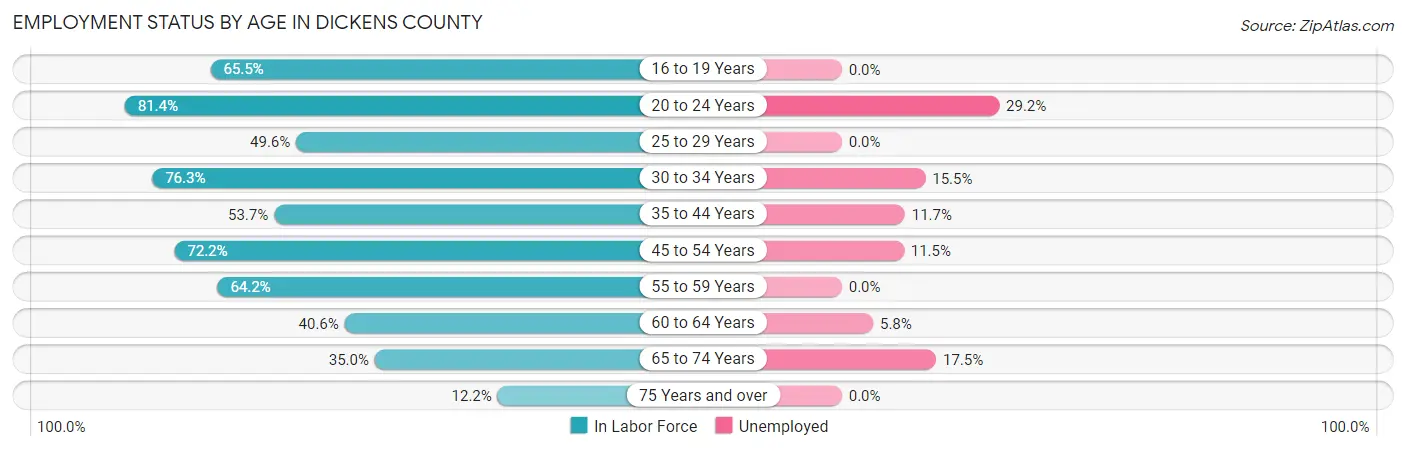
| Age Bracket | In Labor Force | Unemployed |
| 16 to 19 Years | 57 (65.5%) | 0 (0.0%) |
| 20 to 24 Years | 48 (81.4%) | 14 (29.2%) |
| 25 to 29 Years | 56 (49.6%) | 0 (0.0%) |
| 30 to 34 Years | 58 (76.3%) | 9 (15.5%) |
| 35 to 44 Years | 94 (53.7%) | 11 (11.7%) |
| 45 to 54 Years | 122 (72.2%) | 14 (11.5%) |
| 55 to 59 Years | 61 (64.2%) | 0 (0.0%) |
| 60 to 64 Years | 69 (40.6%) | 4 (5.8%) |
| 65 to 74 Years | 63 (35.0%) | 11 (17.5%) |
| 75 Years and over | 24 (12.2%) | 0 (0.0%) |
| Total | 652 (49.4%) | 63 (9.7%) |
Employment Status by Educational Attainment in Dickens County
According to labor force statistics for Dickens County, 57.6% of individuals (460) out of the total population between 25 and 64 years of age (798) are in the labor force, with 8.3% or 38 of them being unemployed. The group with the highest labor force participation rate are those with the educational attainment of bachelor's degree or higher, with 75.7% or 87 individuals in the labor force. Within the labor force, individuals with less than high school education have the highest percentage of unemployment, with 28.1% or 16 of them being unemployed.
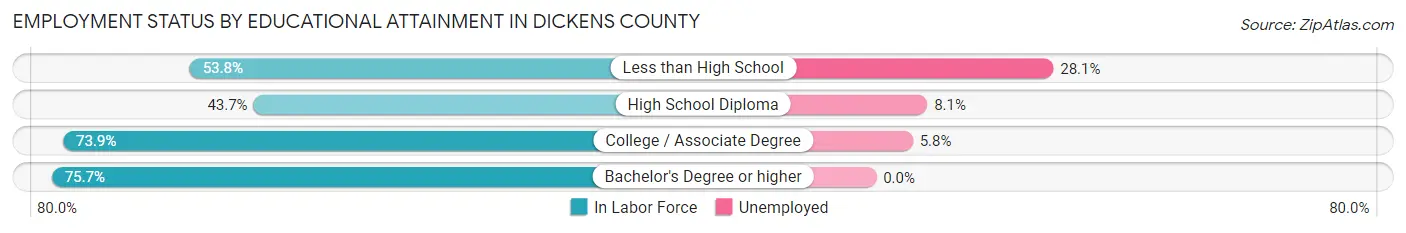
| Educational Attainment | In Labor Force | Unemployed |
| Less than High School | 57 (53.8%) | 30 (28.1%) |
| High School Diploma | 160 (43.7%) | 30 (8.1%) |
| College / Associate Degree | 156 (73.9%) | 12 (5.8%) |
| Bachelor's Degree or higher | 87 (75.7%) | 0 (0.0%) |
| Total | 460 (57.6%) | 66 (8.3%) |
Employment Occupations by Sex in Dickens County
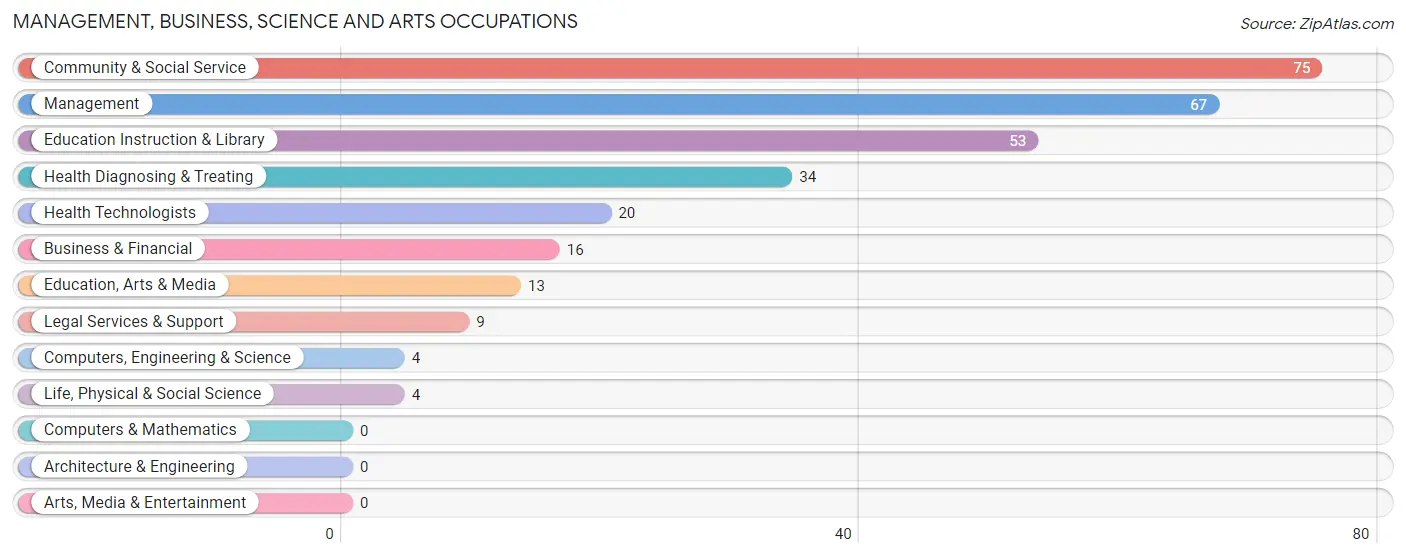
Management, Business, Science and Arts Occupations
The most common Management, Business, Science and Arts occupations in Dickens County are Community & Social Service (75 | 12.7%), Management (67 | 11.4%), Education Instruction & Library (53 | 9.0%), Health Diagnosing & Treating (34 | 5.8%), and Health Technologists (20 | 3.4%).
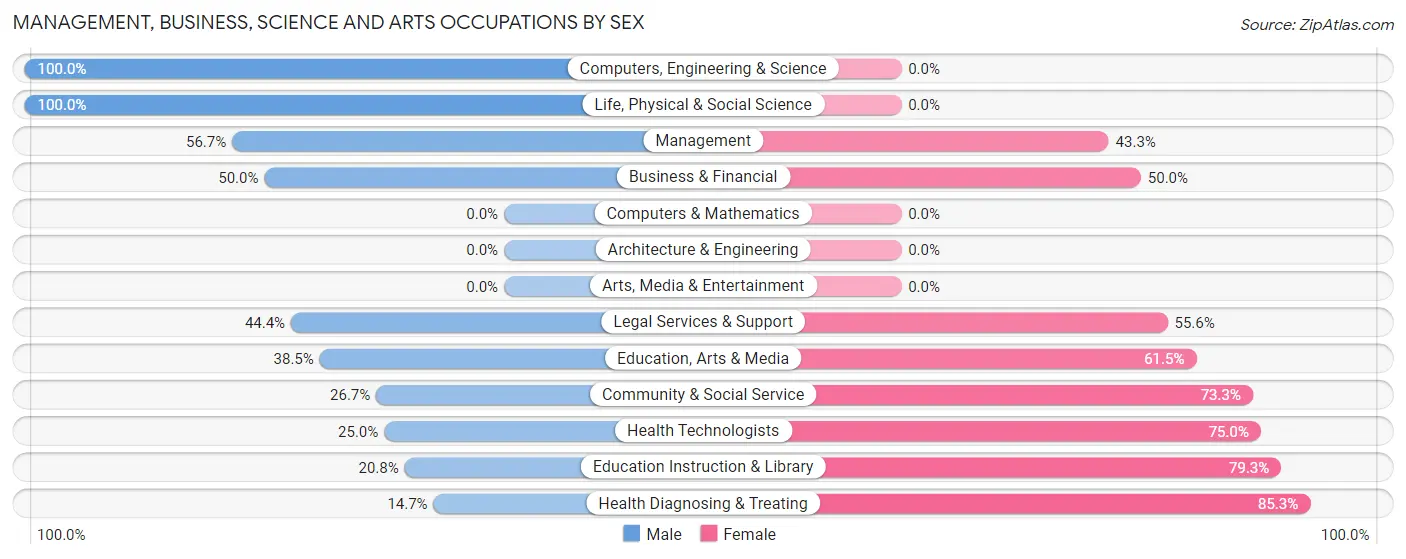
Management, Business, Science and Arts Occupations by Sex
Within the Management, Business, Science and Arts occupations in Dickens County, the most male-oriented occupations are Computers, Engineering & Science (100.0%), Life, Physical & Social Science (100.0%), and Management (56.7%), while the most female-oriented occupations are Health Diagnosing & Treating (85.3%), Education Instruction & Library (79.2%), and Health Technologists (75.0%).
| Occupation | Male | Female |
| Management | 38 (56.7%) | 29 (43.3%) |
| Business & Financial | 8 (50.0%) | 8 (50.0%) |
| Computers, Engineering & Science | 4 (100.0%) | 0 (0.0%) |
| Computers & Mathematics | 0 (0.0%) | 0 (0.0%) |
| Architecture & Engineering | 0 (0.0%) | 0 (0.0%) |
| Life, Physical & Social Science | 4 (100.0%) | 0 (0.0%) |
| Community & Social Service | 20 (26.7%) | 55 (73.3%) |
| Education, Arts & Media | 5 (38.5%) | 8 (61.5%) |
| Legal Services & Support | 4 (44.4%) | 5 (55.6%) |
| Education Instruction & Library | 11 (20.7%) | 42 (79.2%) |
| Arts, Media & Entertainment | 0 (0.0%) | 0 (0.0%) |
| Health Diagnosing & Treating | 5 (14.7%) | 29 (85.3%) |
| Health Technologists | 5 (25.0%) | 15 (75.0%) |
| Total (Category) | 75 (38.3%) | 121 (61.7%) |
| Total (Overall) | 347 (58.9%) | 242 (41.1%) |
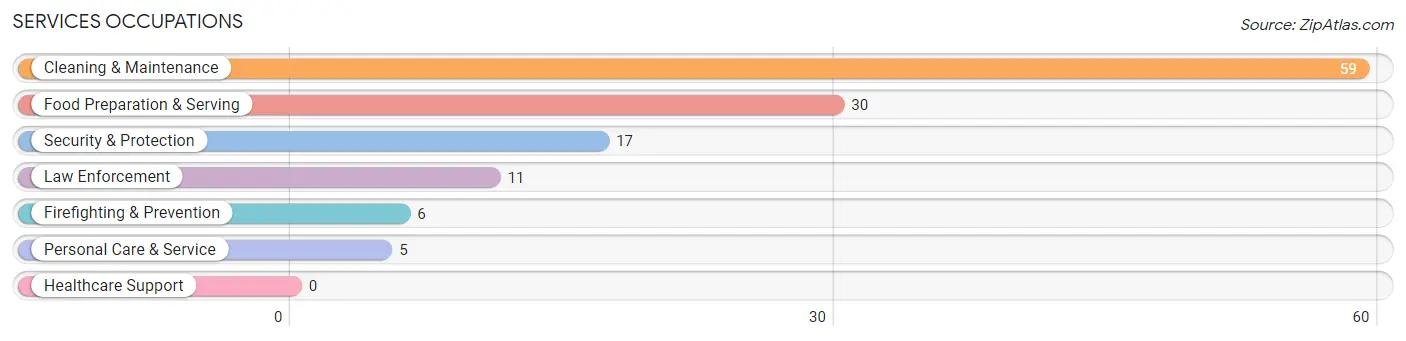
Services Occupations
The most common Services occupations in Dickens County are Cleaning & Maintenance (59 | 10.0%), Food Preparation & Serving (30 | 5.1%), Security & Protection (17 | 2.9%), Law Enforcement (11 | 1.9%), and Firefighting & Prevention (6 | 1.0%).
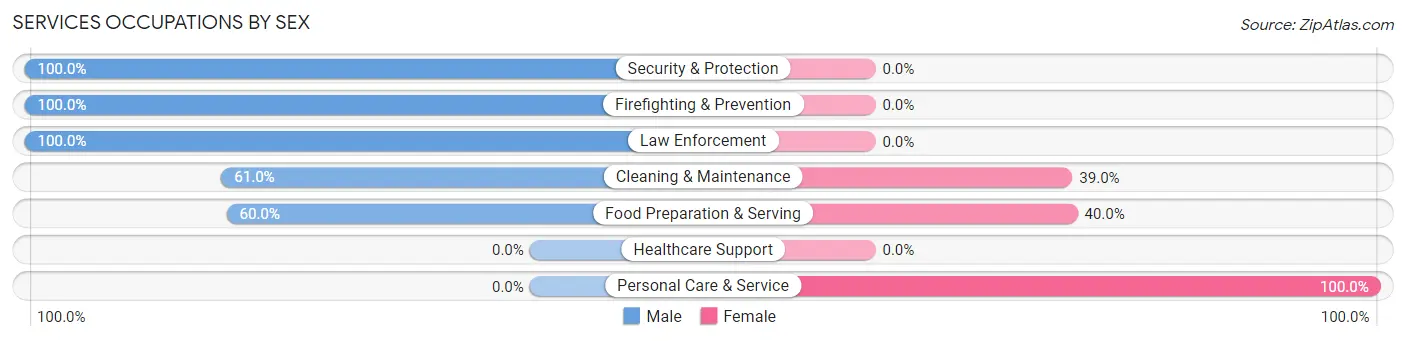
Services Occupations by Sex
Within the Services occupations in Dickens County, the most male-oriented occupations are Security & Protection (100.0%), Firefighting & Prevention (100.0%), and Law Enforcement (100.0%), while the most female-oriented occupations are Personal Care & Service (100.0%), Food Preparation & Serving (40.0%), and Cleaning & Maintenance (39.0%).
| Occupation | Male | Female |
| Healthcare Support | 0 (0.0%) | 0 (0.0%) |
| Security & Protection | 17 (100.0%) | 0 (0.0%) |
| Firefighting & Prevention | 6 (100.0%) | 0 (0.0%) |
| Law Enforcement | 11 (100.0%) | 0 (0.0%) |
| Food Preparation & Serving | 18 (60.0%) | 12 (40.0%) |
| Cleaning & Maintenance | 36 (61.0%) | 23 (39.0%) |
| Personal Care & Service | 0 (0.0%) | 5 (100.0%) |
| Total (Category) | 71 (64.0%) | 40 (36.0%) |
| Total (Overall) | 347 (58.9%) | 242 (41.1%) |
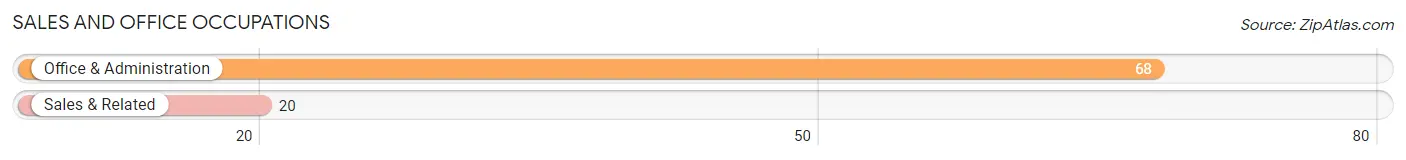
Sales and Office Occupations
The most common Sales and Office occupations in Dickens County are Office & Administration (68 | 11.5%), and Sales & Related (20 | 3.4%).
Sales and Office Occupations by Sex
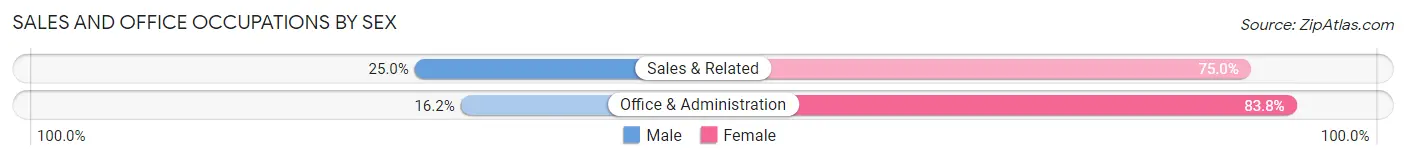
| Occupation | Male | Female |
| Sales & Related | 5 (25.0%) | 15 (75.0%) |
| Office & Administration | 11 (16.2%) | 57 (83.8%) |
| Total (Category) | 16 (18.2%) | 72 (81.8%) |
| Total (Overall) | 347 (58.9%) | 242 (41.1%) |
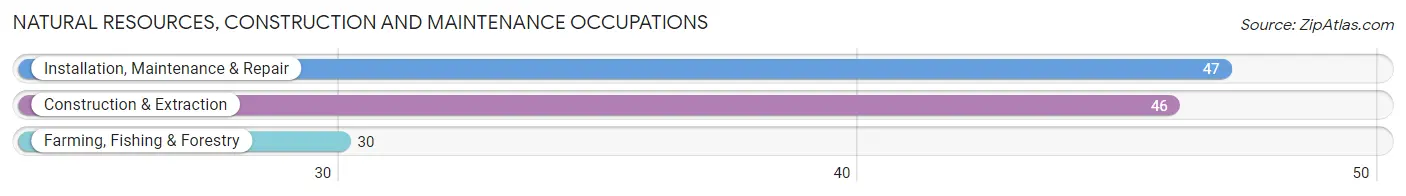
Natural Resources, Construction and Maintenance Occupations
The most common Natural Resources, Construction and Maintenance occupations in Dickens County are Installation, Maintenance & Repair (47 | 8.0%), Construction & Extraction (46 | 7.8%), and Farming, Fishing & Forestry (30 | 5.1%).
Natural Resources, Construction and Maintenance Occupations by Sex
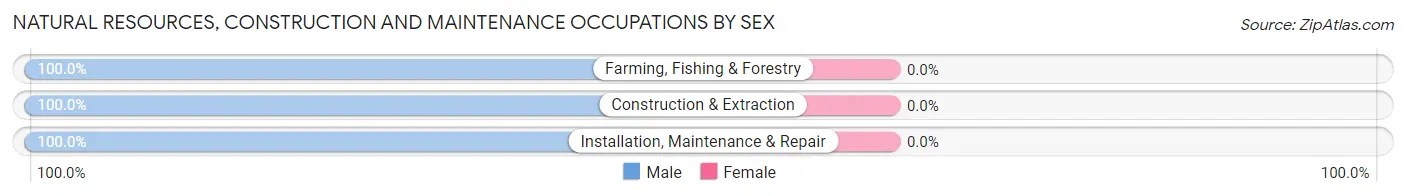
| Occupation | Male | Female |
| Farming, Fishing & Forestry | 30 (100.0%) | 0 (0.0%) |
| Construction & Extraction | 46 (100.0%) | 0 (0.0%) |
| Installation, Maintenance & Repair | 47 (100.0%) | 0 (0.0%) |
| Total (Category) | 123 (100.0%) | 0 (0.0%) |
| Total (Overall) | 347 (58.9%) | 242 (41.1%) |
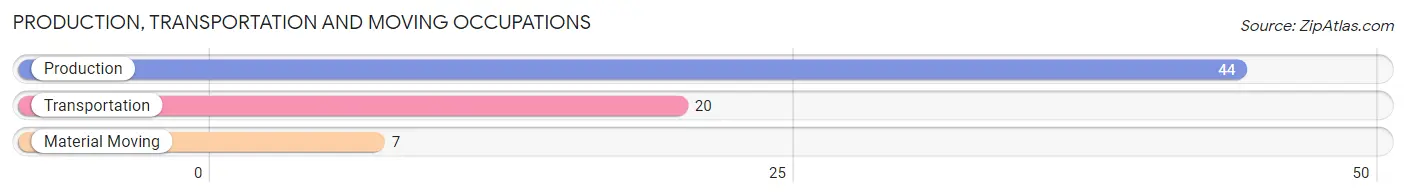
Production, Transportation and Moving Occupations
The most common Production, Transportation and Moving occupations in Dickens County are Production (44 | 7.5%), Transportation (20 | 3.4%), and Material Moving (7 | 1.2%).
Production, Transportation and Moving Occupations by Sex
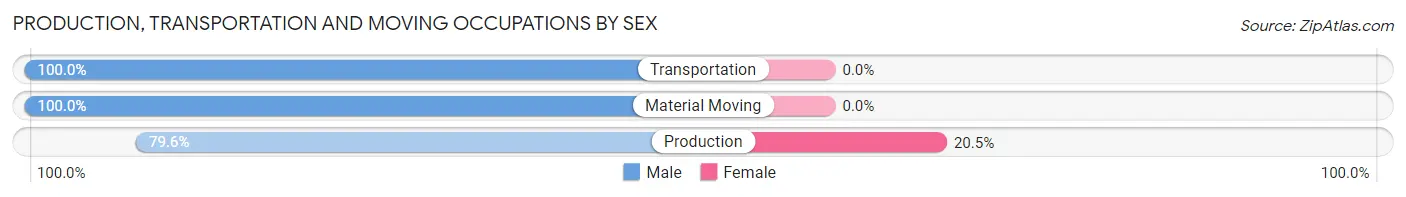
| Occupation | Male | Female |
| Production | 35 (79.5%) | 9 (20.4%) |
| Transportation | 20 (100.0%) | 0 (0.0%) |
| Material Moving | 7 (100.0%) | 0 (0.0%) |
| Total (Category) | 62 (87.3%) | 9 (12.7%) |
| Total (Overall) | 347 (58.9%) | 242 (41.1%) |
Employment Industries by Sex in Dickens County
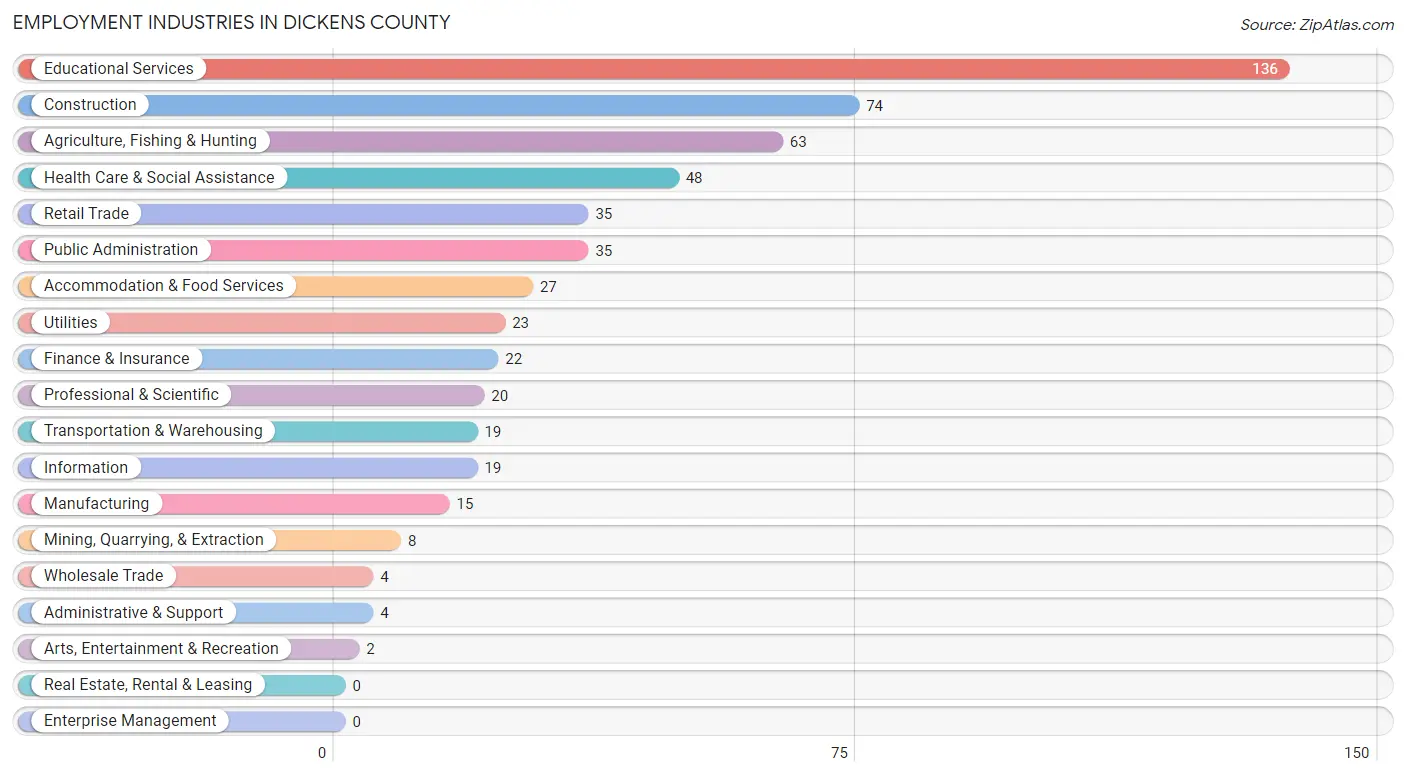
Employment Industries in Dickens County
The major employment industries in Dickens County include Educational Services (136 | 23.1%), Construction (74 | 12.6%), Agriculture, Fishing & Hunting (63 | 10.7%), Health Care & Social Assistance (48 | 8.2%), and Retail Trade (35 | 5.9%).
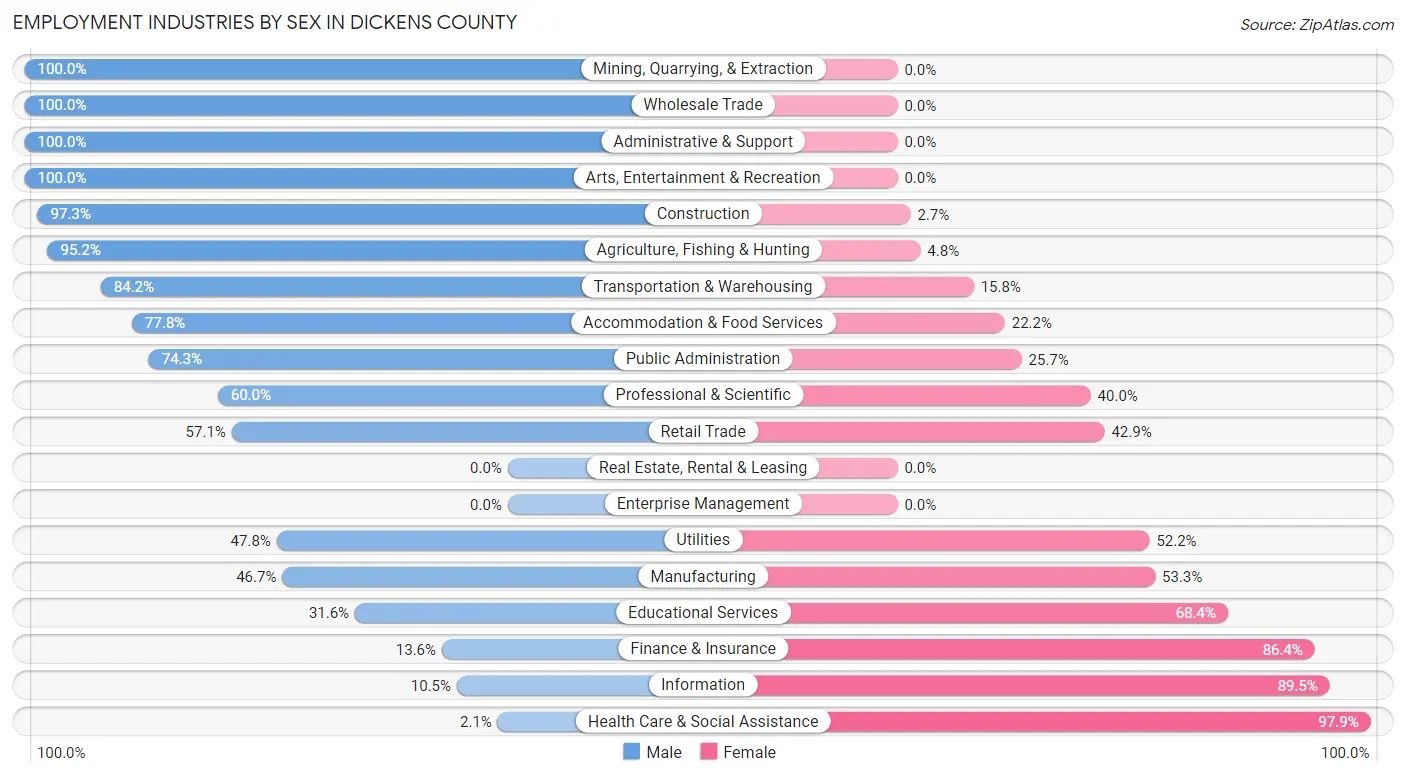
Employment Industries by Sex in Dickens County
The Dickens County industries that see more men than women are Mining, Quarrying, & Extraction (100.0%), Wholesale Trade (100.0%), and Administrative & Support (100.0%), whereas the industries that tend to have a higher number of women are Health Care & Social Assistance (97.9%), Information (89.5%), and Finance & Insurance (86.4%).
| Industry | Male | Female |
| Agriculture, Fishing & Hunting | 60 (95.2%) | 3 (4.8%) |
| Mining, Quarrying, & Extraction | 8 (100.0%) | 0 (0.0%) |
| Construction | 72 (97.3%) | 2 (2.7%) |
| Manufacturing | 7 (46.7%) | 8 (53.3%) |
| Wholesale Trade | 4 (100.0%) | 0 (0.0%) |
| Retail Trade | 20 (57.1%) | 15 (42.9%) |
| Transportation & Warehousing | 16 (84.2%) | 3 (15.8%) |
| Utilities | 11 (47.8%) | 12 (52.2%) |
| Information | 2 (10.5%) | 17 (89.5%) |
| Finance & Insurance | 3 (13.6%) | 19 (86.4%) |
| Real Estate, Rental & Leasing | 0 (0.0%) | 0 (0.0%) |
| Professional & Scientific | 12 (60.0%) | 8 (40.0%) |
| Enterprise Management | 0 (0.0%) | 0 (0.0%) |
| Administrative & Support | 4 (100.0%) | 0 (0.0%) |
| Educational Services | 43 (31.6%) | 93 (68.4%) |
| Health Care & Social Assistance | 1 (2.1%) | 47 (97.9%) |
| Arts, Entertainment & Recreation | 2 (100.0%) | 0 (0.0%) |
| Accommodation & Food Services | 21 (77.8%) | 6 (22.2%) |
| Public Administration | 26 (74.3%) | 9 (25.7%) |
| Total | 347 (58.9%) | 242 (41.1%) |
Education in Dickens County
School Enrollment in Dickens County
The most common levels of schooling among the 235 students in Dickens County are high school (79 | 33.6%), middle school (75 | 31.9%), and elementary school (31 | 13.2%).
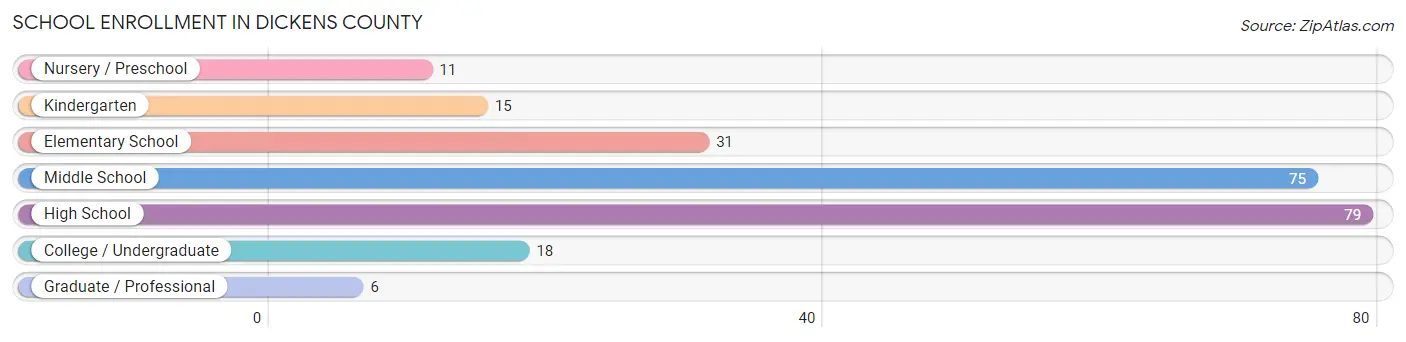
| School Level | # Students | % Students |
| Nursery / Preschool | 11 | 4.7% |
| Kindergarten | 15 | 6.4% |
| Elementary School | 31 | 13.2% |
| Middle School | 75 | 31.9% |
| High School | 79 | 33.6% |
| College / Undergraduate | 18 | 7.7% |
| Graduate / Professional | 6 | 2.5% |
| Total | 235 | 100.0% |
School Enrollment by Age by Funding Source in Dickens County
Out of a total of 235 students who are enrolled in schools in Dickens County, 24 (10.2%) attend a private institution, while the remaining 211 (89.8%) are enrolled in public schools. The age group of 25 to 34 year olds has the highest likelihood of being enrolled in private schools, with 2 (100.0% in the age bracket) enrolled. Conversely, the age group of 3 to 4 year olds has the lowest likelihood of being enrolled in a private school, with 10 (100.0% in the age bracket) attending a public institution.
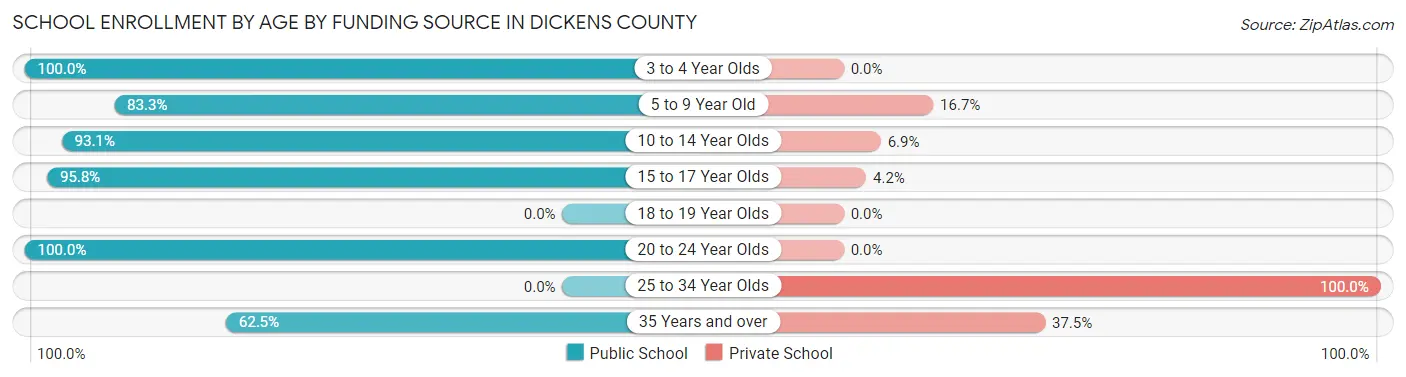
| Age Bracket | Public School | Private School |
| 3 to 4 Year Olds | 10 (100.0%) | 0 (0.0%) |
| 5 to 9 Year Old | 35 (83.3%) | 7 (16.7%) |
| 10 to 14 Year Olds | 81 (93.1%) | 6 (6.9%) |
| 15 to 17 Year Olds | 69 (95.8%) | 3 (4.2%) |
| 18 to 19 Year Olds | 0 (0.0%) | 0 (0.0%) |
| 20 to 24 Year Olds | 6 (100.0%) | 0 (0.0%) |
| 25 to 34 Year Olds | 0 (0.0%) | 2 (100.0%) |
| 35 Years and over | 10 (62.5%) | 6 (37.5%) |
| Total | 211 (89.8%) | 24 (10.2%) |
Educational Attainment by Field of Study in Dickens County
Education (78 | 32.2%), bio, nature & agricultural (65 | 26.9%), business (37 | 15.3%), arts & humanities (21 | 8.7%), and engineering (8 | 3.3%) are the most common fields of study among 242 individuals in Dickens County who have obtained a bachelor's degree or higher.
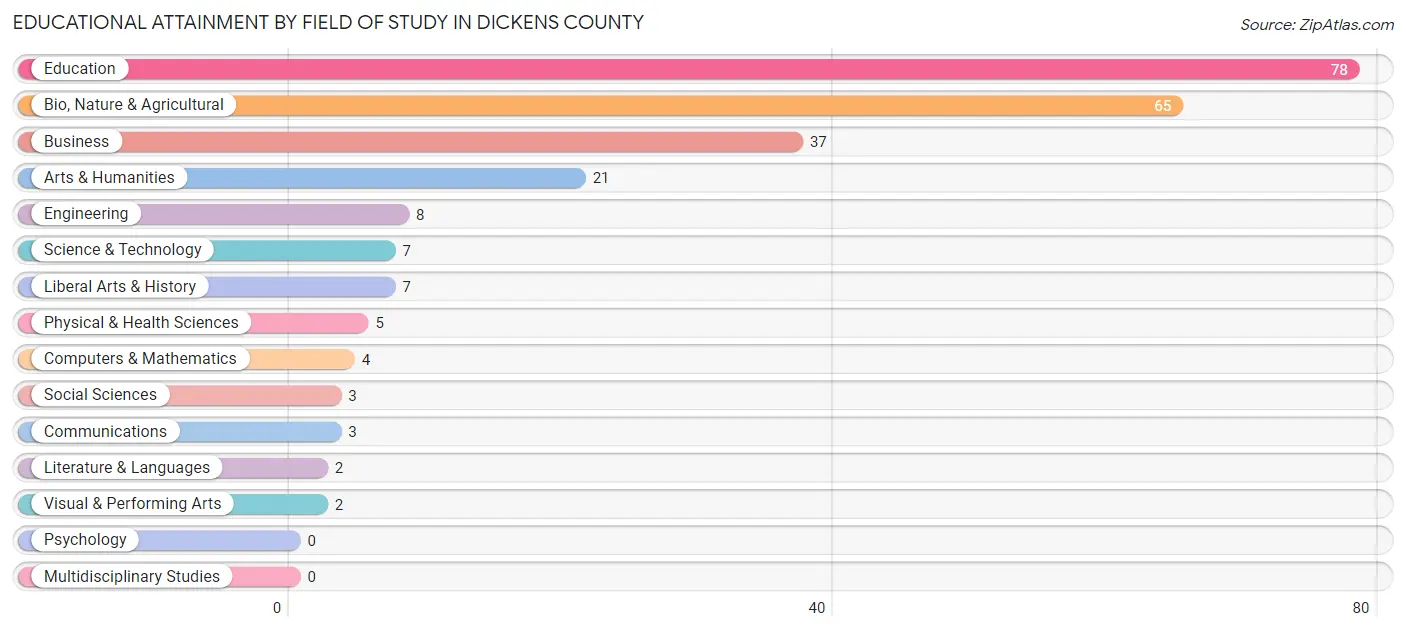
| Field of Study | # Graduates | % Graduates |
| Computers & Mathematics | 4 | 1.7% |
| Bio, Nature & Agricultural | 65 | 26.9% |
| Physical & Health Sciences | 5 | 2.1% |
| Psychology | 0 | 0.0% |
| Social Sciences | 3 | 1.2% |
| Engineering | 8 | 3.3% |
| Multidisciplinary Studies | 0 | 0.0% |
| Science & Technology | 7 | 2.9% |
| Business | 37 | 15.3% |
| Education | 78 | 32.2% |
| Literature & Languages | 2 | 0.8% |
| Liberal Arts & History | 7 | 2.9% |
| Visual & Performing Arts | 2 | 0.8% |
| Communications | 3 | 1.2% |
| Arts & Humanities | 21 | 8.7% |
| Total | 242 | 100.0% |
Transportation & Commute in Dickens County
Vehicle Availability by Sex in Dickens County
The most prevalent vehicle ownership categories in Dickens County are males with 2 vehicles (109, accounting for 31.4%) and females with 2 vehicles (73, making up 45.0%).
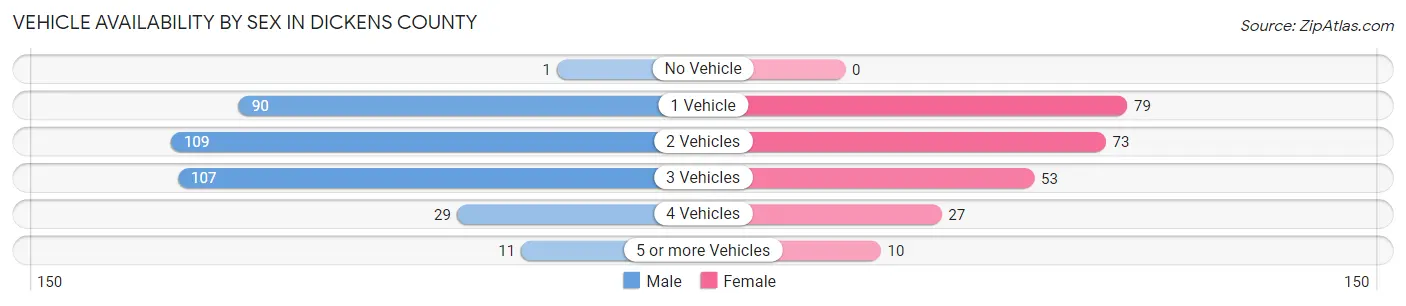
| Vehicles Available | Male | Female |
| No Vehicle | 1 (0.3%) | 0 (0.0%) |
| 1 Vehicle | 90 (25.9%) | 79 (32.6%) |
| 2 Vehicles | 109 (31.4%) | 73 (30.2%) |
| 3 Vehicles | 107 (30.8%) | 53 (21.9%) |
| 4 Vehicles | 29 (8.4%) | 27 (11.2%) |
| 5 or more Vehicles | 11 (3.2%) | 10 (4.1%) |
| Total | 347 (100.0%) | 242 (100.0%) |
Commute Time in Dickens County
The most frequently occuring commute durations in Dickens County are 5 to 9 minutes (138 commuters, 23.9%), 60 to 89 minutes (97 commuters, 16.8%), and less than 5 minutes (79 commuters, 13.7%).
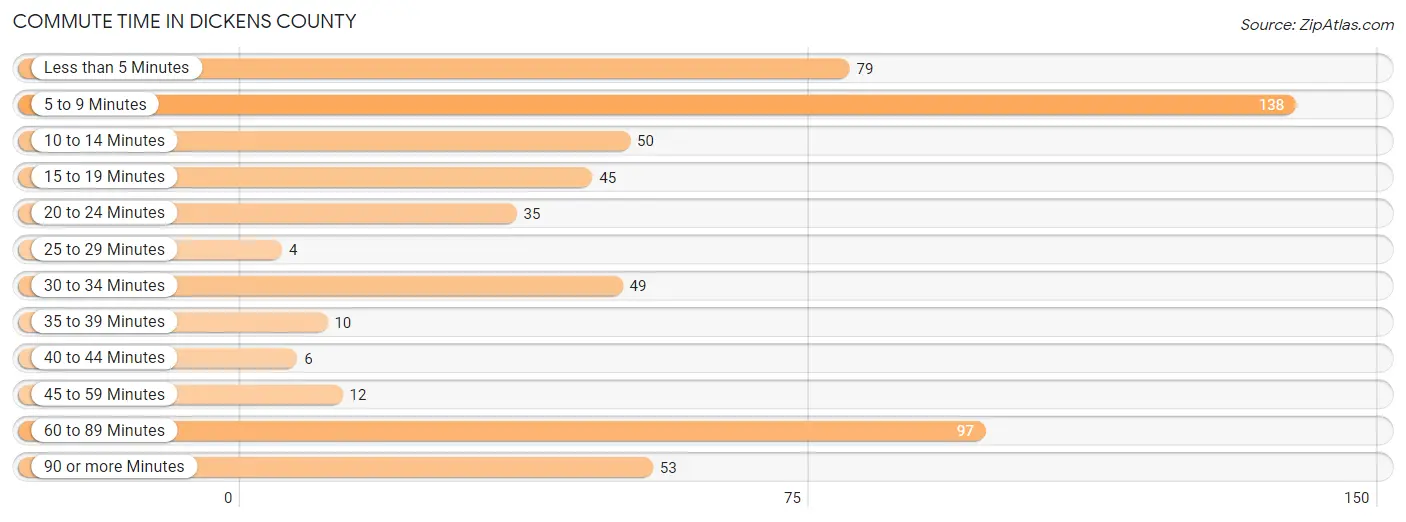
| Commute Time | # Commuters | % Commuters |
| Less than 5 Minutes | 79 | 13.7% |
| 5 to 9 Minutes | 138 | 23.9% |
| 10 to 14 Minutes | 50 | 8.6% |
| 15 to 19 Minutes | 45 | 7.8% |
| 20 to 24 Minutes | 35 | 6.1% |
| 25 to 29 Minutes | 4 | 0.7% |
| 30 to 34 Minutes | 49 | 8.5% |
| 35 to 39 Minutes | 10 | 1.7% |
| 40 to 44 Minutes | 6 | 1.0% |
| 45 to 59 Minutes | 12 | 2.1% |
| 60 to 89 Minutes | 97 | 16.8% |
| 90 or more Minutes | 53 | 9.2% |
Commute Time by Sex in Dickens County
The most common commute times in Dickens County are 5 to 9 minutes (104 commuters, 30.8%) for males and 60 to 89 minutes (52 commuters, 21.7%) for females.
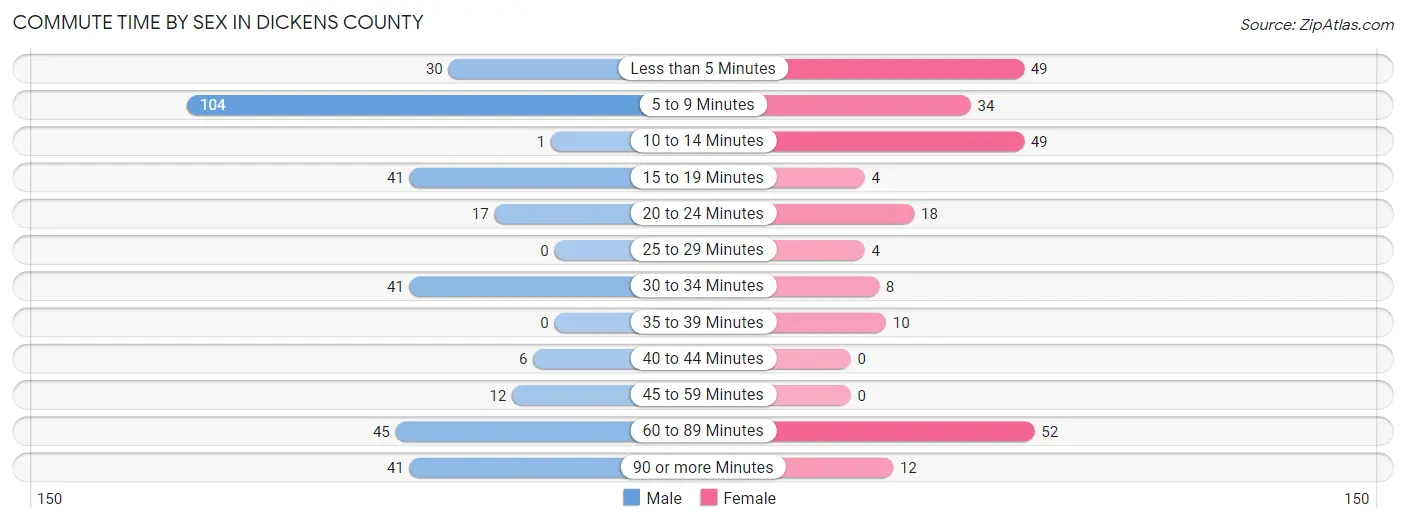
| Commute Time | Male | Female |
| Less than 5 Minutes | 30 (8.9%) | 49 (20.4%) |
| 5 to 9 Minutes | 104 (30.8%) | 34 (14.2%) |
| 10 to 14 Minutes | 1 (0.3%) | 49 (20.4%) |
| 15 to 19 Minutes | 41 (12.1%) | 4 (1.7%) |
| 20 to 24 Minutes | 17 (5.0%) | 18 (7.5%) |
| 25 to 29 Minutes | 0 (0.0%) | 4 (1.7%) |
| 30 to 34 Minutes | 41 (12.1%) | 8 (3.3%) |
| 35 to 39 Minutes | 0 (0.0%) | 10 (4.2%) |
| 40 to 44 Minutes | 6 (1.8%) | 0 (0.0%) |
| 45 to 59 Minutes | 12 (3.5%) | 0 (0.0%) |
| 60 to 89 Minutes | 45 (13.3%) | 52 (21.7%) |
| 90 or more Minutes | 41 (12.1%) | 12 (5.0%) |
Time of Departure to Work by Sex in Dickens County
The most frequent times of departure to work in Dickens County are 8:00 AM to 8:29 AM (97, 28.7%) for males and 7:30 AM to 7:59 AM (84, 35.0%) for females.
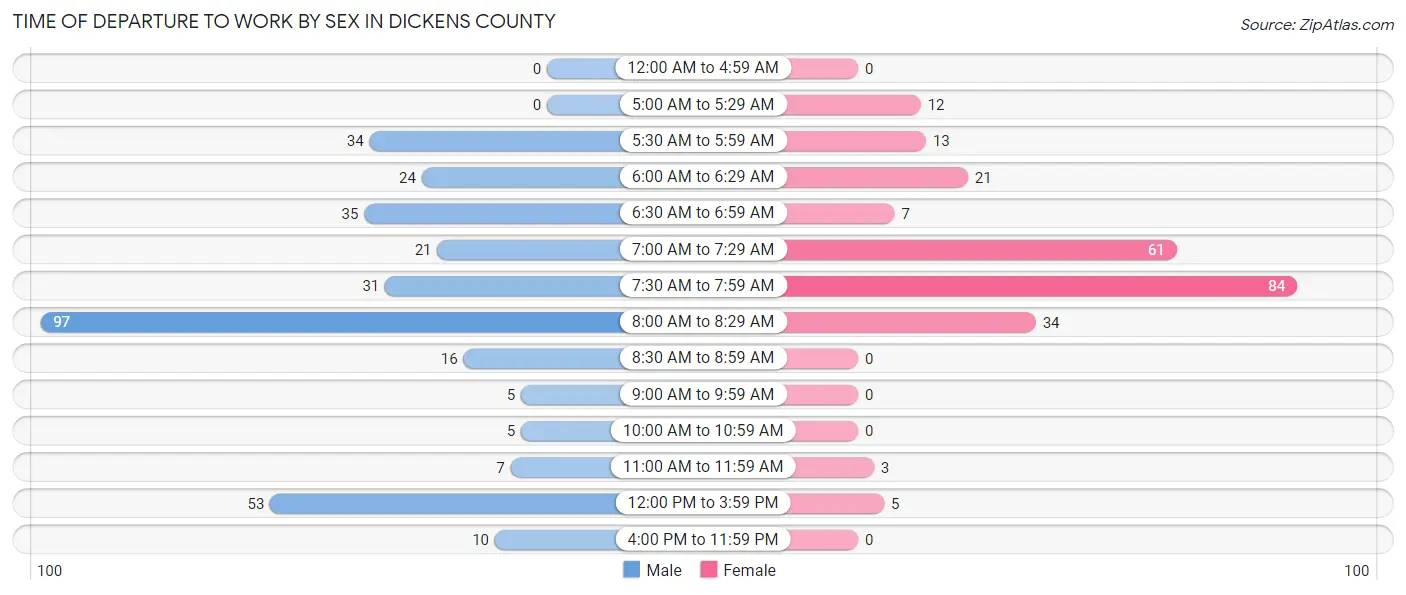
| Time of Departure | Male | Female |
| 12:00 AM to 4:59 AM | 0 (0.0%) | 0 (0.0%) |
| 5:00 AM to 5:29 AM | 0 (0.0%) | 12 (5.0%) |
| 5:30 AM to 5:59 AM | 34 (10.1%) | 13 (5.4%) |
| 6:00 AM to 6:29 AM | 24 (7.1%) | 21 (8.7%) |
| 6:30 AM to 6:59 AM | 35 (10.4%) | 7 (2.9%) |
| 7:00 AM to 7:29 AM | 21 (6.2%) | 61 (25.4%) |
| 7:30 AM to 7:59 AM | 31 (9.2%) | 84 (35.0%) |
| 8:00 AM to 8:29 AM | 97 (28.7%) | 34 (14.2%) |
| 8:30 AM to 8:59 AM | 16 (4.7%) | 0 (0.0%) |
| 9:00 AM to 9:59 AM | 5 (1.5%) | 0 (0.0%) |
| 10:00 AM to 10:59 AM | 5 (1.5%) | 0 (0.0%) |
| 11:00 AM to 11:59 AM | 7 (2.1%) | 3 (1.3%) |
| 12:00 PM to 3:59 PM | 53 (15.7%) | 5 (2.1%) |
| 4:00 PM to 11:59 PM | 10 (3.0%) | 0 (0.0%) |
| Total | 338 (100.0%) | 240 (100.0%) |
Housing Occupancy in Dickens County
Occupancy by Ownership in Dickens County
Of the total 638 dwellings in Dickens County, owner-occupied units account for 529 (82.9%), while renter-occupied units make up 109 (17.1%).
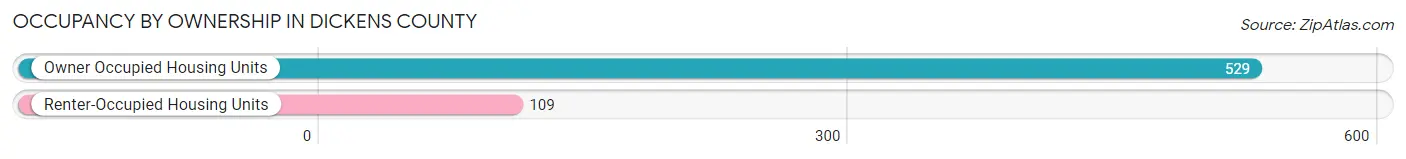
| Occupancy | # Housing Units | % Housing Units |
| Owner Occupied Housing Units | 529 | 82.9% |
| Renter-Occupied Housing Units | 109 | 17.1% |
| Total Occupied Housing Units | 638 | 100.0% |
Occupancy by Household Size in Dickens County
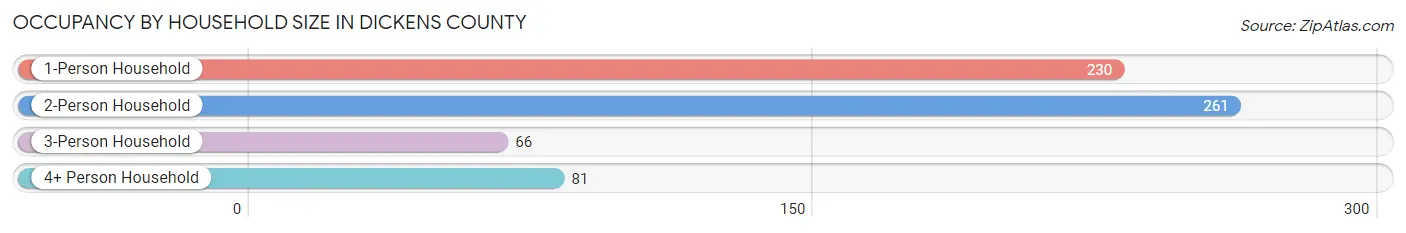
| Household Size | # Housing Units | % Housing Units |
| 1-Person Household | 230 | 36.0% |
| 2-Person Household | 261 | 40.9% |
| 3-Person Household | 66 | 10.3% |
| 4+ Person Household | 81 | 12.7% |
| Total Housing Units | 638 | 100.0% |
Occupancy by Ownership by Household Size in Dickens County
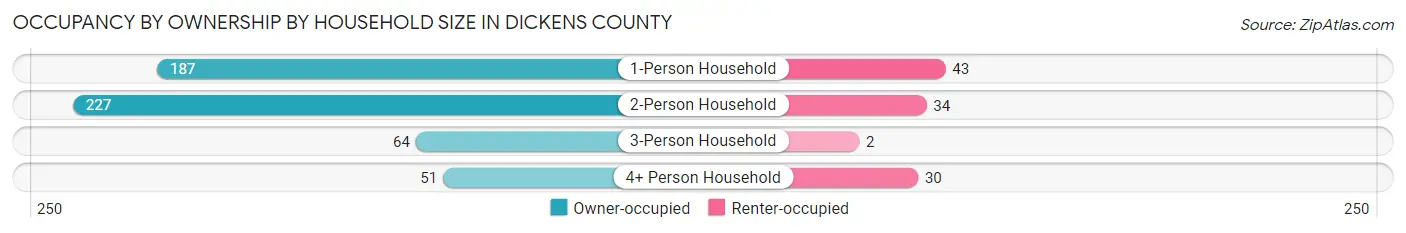
| Household Size | Owner-occupied | Renter-occupied |
| 1-Person Household | 187 (81.3%) | 43 (18.7%) |
| 2-Person Household | 227 (87.0%) | 34 (13.0%) |
| 3-Person Household | 64 (97.0%) | 2 (3.0%) |
| 4+ Person Household | 51 (63.0%) | 30 (37.0%) |
| Total Housing Units | 529 (82.9%) | 109 (17.1%) |
Occupancy by Educational Attainment in Dickens County
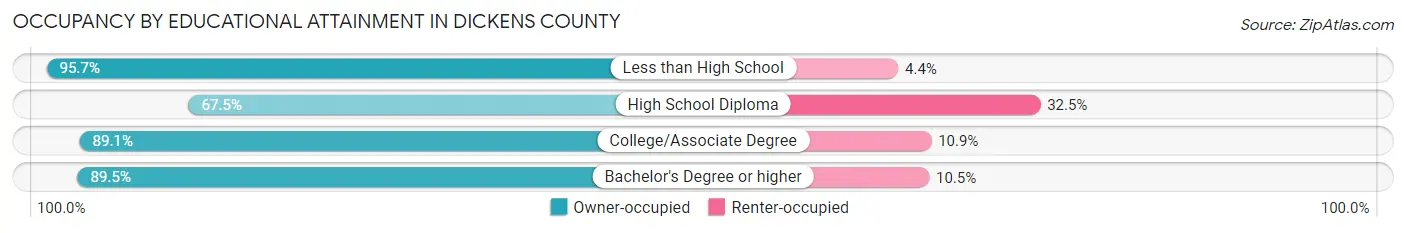
| Household Size | Owner-occupied | Renter-occupied |
| Less than High School | 66 (95.7%) | 3 (4.3%) |
| High School Diploma | 139 (67.5%) | 67 (32.5%) |
| College/Associate Degree | 196 (89.1%) | 24 (10.9%) |
| Bachelor's Degree or higher | 128 (89.5%) | 15 (10.5%) |
Occupancy by Age of Householder in Dickens County
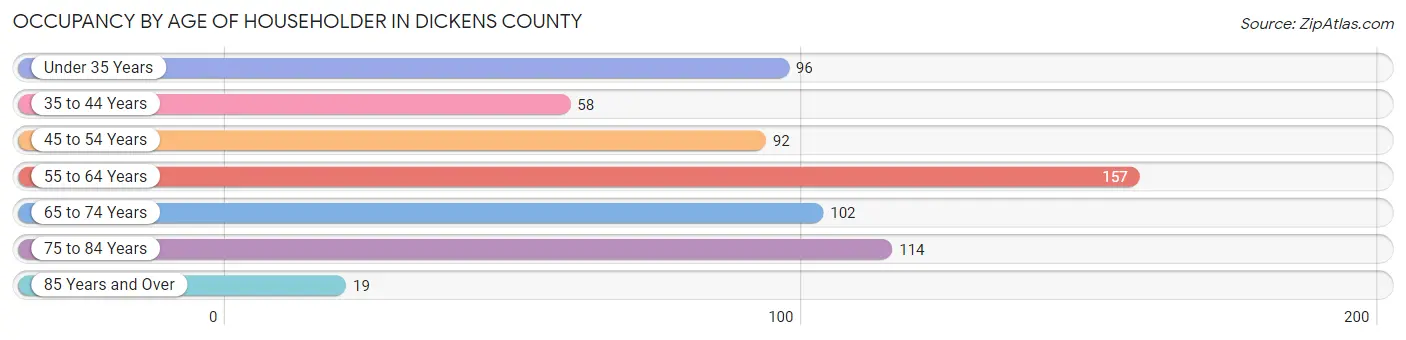
| Age Bracket | # Households | % Households |
| Under 35 Years | 96 | 15.0% |
| 35 to 44 Years | 58 | 9.1% |
| 45 to 54 Years | 92 | 14.4% |
| 55 to 64 Years | 157 | 24.6% |
| 65 to 74 Years | 102 | 16.0% |
| 75 to 84 Years | 114 | 17.9% |
| 85 Years and Over | 19 | 3.0% |
| Total | 638 | 100.0% |
Housing Finances in Dickens County
Median Income by Occupancy in Dickens County
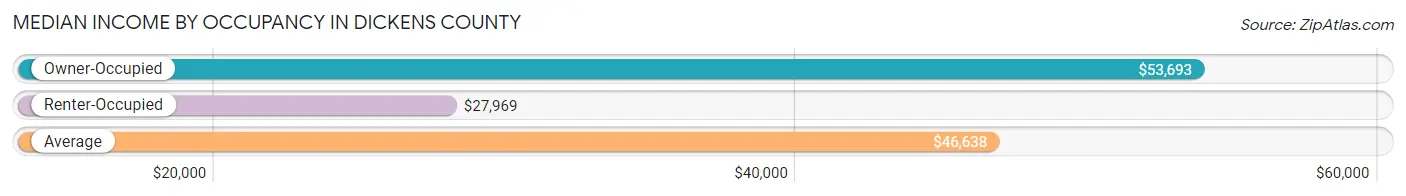
| Occupancy Type | # Households | Median Income |
| Owner-Occupied | 529 (82.9%) | $53,693 |
| Renter-Occupied | 109 (17.1%) | $27,969 |
| Average | 638 (100.0%) | $46,638 |
Occupancy by Householder Income Bracket in Dickens County
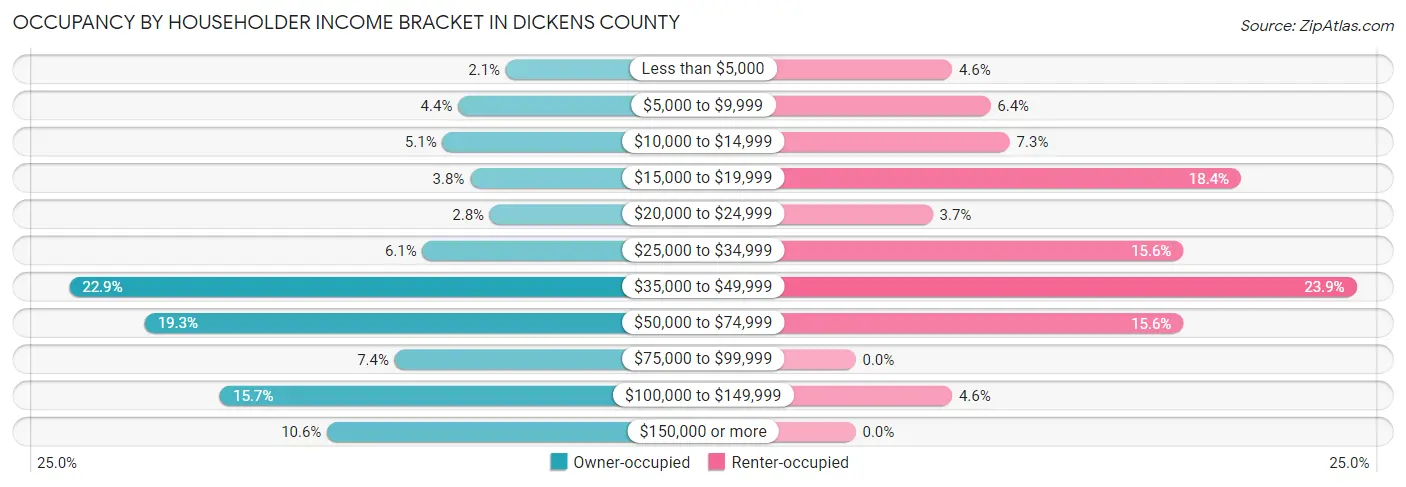
| Income Bracket | Owner-occupied | Renter-occupied |
| Less than $5,000 | 11 (2.1%) | 5 (4.6%) |
| $5,000 to $9,999 | 23 (4.3%) | 7 (6.4%) |
| $10,000 to $14,999 | 27 (5.1%) | 8 (7.3%) |
| $15,000 to $19,999 | 20 (3.8%) | 20 (18.3%) |
| $20,000 to $24,999 | 15 (2.8%) | 4 (3.7%) |
| $25,000 to $34,999 | 32 (6.0%) | 17 (15.6%) |
| $35,000 to $49,999 | 121 (22.9%) | 26 (23.8%) |
| $50,000 to $74,999 | 102 (19.3%) | 17 (15.6%) |
| $75,000 to $99,999 | 39 (7.4%) | 0 (0.0%) |
| $100,000 to $149,999 | 83 (15.7%) | 5 (4.6%) |
| $150,000 or more | 56 (10.6%) | 0 (0.0%) |
| Total | 529 (100.0%) | 109 (100.0%) |
Monthly Housing Cost Tiers in Dickens County
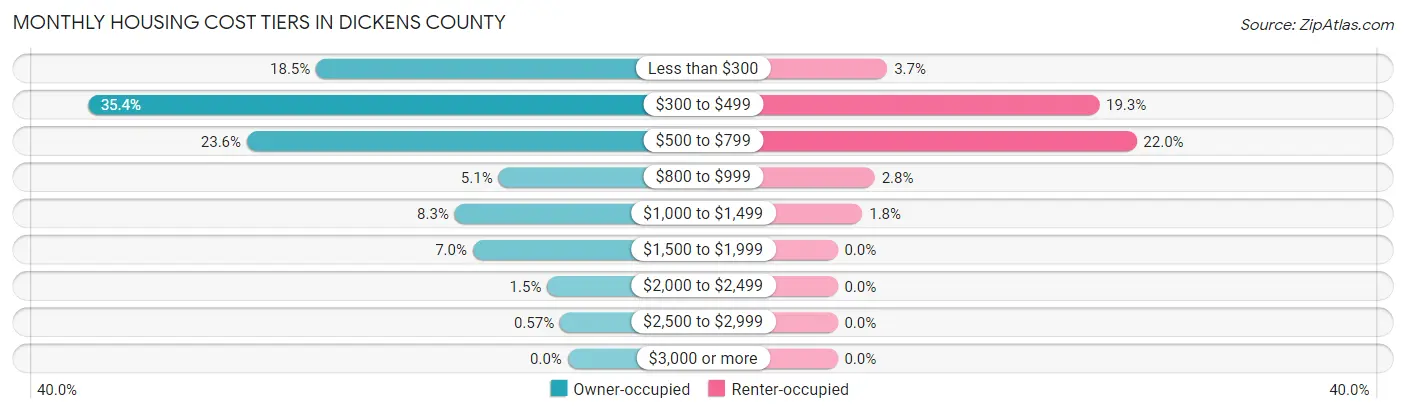
| Monthly Cost | Owner-occupied | Renter-occupied |
| Less than $300 | 98 (18.5%) | 4 (3.7%) |
| $300 to $499 | 187 (35.3%) | 21 (19.3%) |
| $500 to $799 | 125 (23.6%) | 24 (22.0%) |
| $800 to $999 | 27 (5.1%) | 3 (2.8%) |
| $1,000 to $1,499 | 44 (8.3%) | 2 (1.8%) |
| $1,500 to $1,999 | 37 (7.0%) | 0 (0.0%) |
| $2,000 to $2,499 | 8 (1.5%) | 0 (0.0%) |
| $2,500 to $2,999 | 3 (0.6%) | 0 (0.0%) |
| $3,000 or more | 0 (0.0%) | 0 (0.0%) |
| Total | 529 (100.0%) | 109 (100.0%) |
Physical Housing Characteristics in Dickens County
Housing Structures in Dickens County
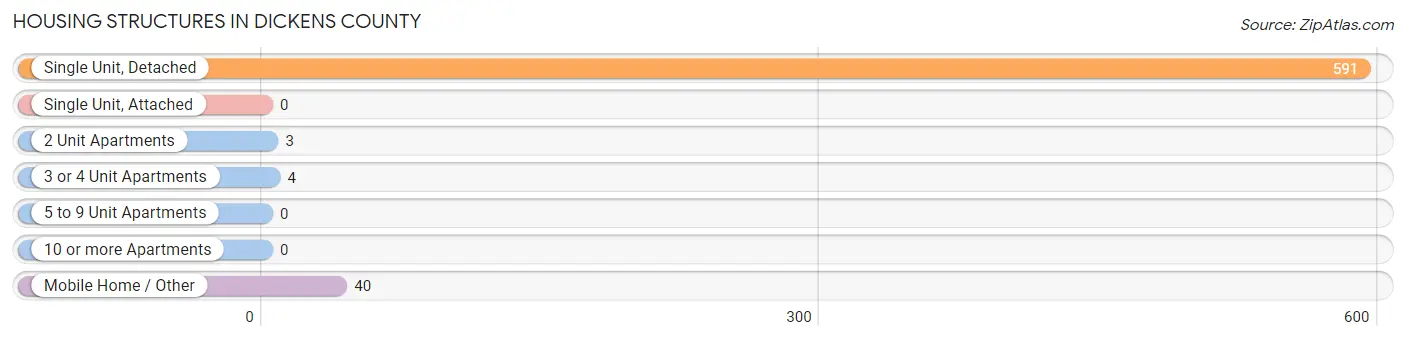
| Structure Type | # Housing Units | % Housing Units |
| Single Unit, Detached | 591 | 92.6% |
| Single Unit, Attached | 0 | 0.0% |
| 2 Unit Apartments | 3 | 0.5% |
| 3 or 4 Unit Apartments | 4 | 0.6% |
| 5 to 9 Unit Apartments | 0 | 0.0% |
| 10 or more Apartments | 0 | 0.0% |
| Mobile Home / Other | 40 | 6.3% |
| Total | 638 | 100.0% |
Housing Structures by Occupancy in Dickens County
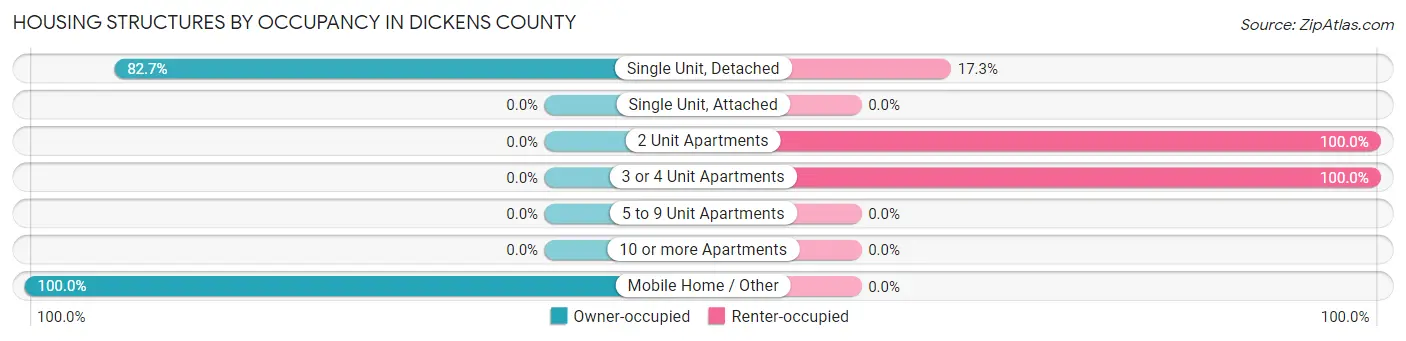
| Structure Type | Owner-occupied | Renter-occupied |
| Single Unit, Detached | 489 (82.7%) | 102 (17.3%) |
| Single Unit, Attached | 0 (0.0%) | 0 (0.0%) |
| 2 Unit Apartments | 0 (0.0%) | 3 (100.0%) |
| 3 or 4 Unit Apartments | 0 (0.0%) | 4 (100.0%) |
| 5 to 9 Unit Apartments | 0 (0.0%) | 0 (0.0%) |
| 10 or more Apartments | 0 (0.0%) | 0 (0.0%) |
| Mobile Home / Other | 40 (100.0%) | 0 (0.0%) |
| Total | 529 (82.9%) | 109 (17.1%) |
Housing Structures by Number of Rooms in Dickens County
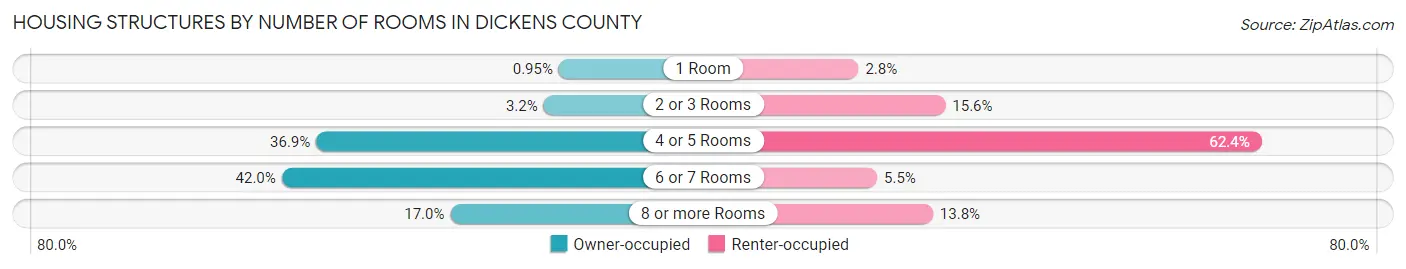
| Number of Rooms | Owner-occupied | Renter-occupied |
| 1 Room | 5 (0.9%) | 3 (2.8%) |
| 2 or 3 Rooms | 17 (3.2%) | 17 (15.6%) |
| 4 or 5 Rooms | 195 (36.9%) | 68 (62.4%) |
| 6 or 7 Rooms | 222 (42.0%) | 6 (5.5%) |
| 8 or more Rooms | 90 (17.0%) | 15 (13.8%) |
| Total | 529 (100.0%) | 109 (100.0%) |
Housing Structure by Heating Type in Dickens County
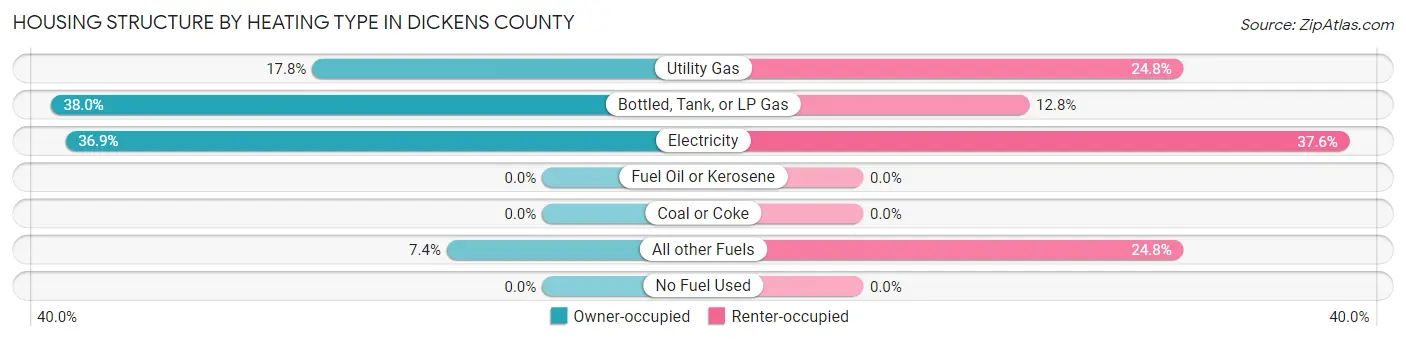
| Heating Type | Owner-occupied | Renter-occupied |
| Utility Gas | 94 (17.8%) | 27 (24.8%) |
| Bottled, Tank, or LP Gas | 201 (38.0%) | 14 (12.8%) |
| Electricity | 195 (36.9%) | 41 (37.6%) |
| Fuel Oil or Kerosene | 0 (0.0%) | 0 (0.0%) |
| Coal or Coke | 0 (0.0%) | 0 (0.0%) |
| All other Fuels | 39 (7.4%) | 27 (24.8%) |
| No Fuel Used | 0 (0.0%) | 0 (0.0%) |
| Total | 529 (100.0%) | 109 (100.0%) |
Household Vehicle Usage in Dickens County
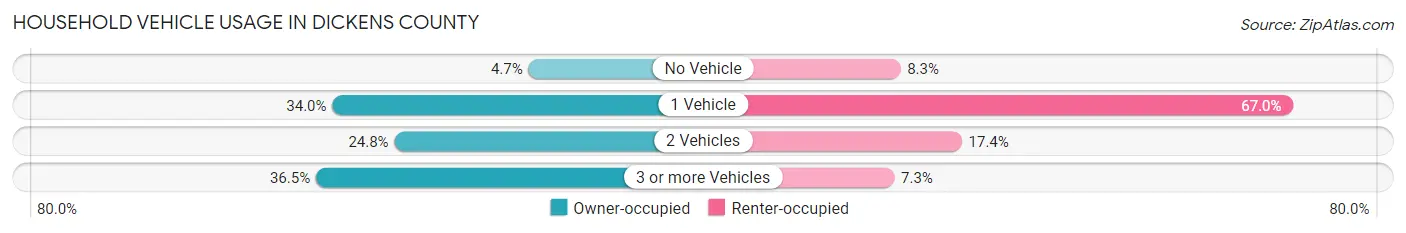
| Vehicles per Household | Owner-occupied | Renter-occupied |
| No Vehicle | 25 (4.7%) | 9 (8.3%) |
| 1 Vehicle | 180 (34.0%) | 73 (67.0%) |
| 2 Vehicles | 131 (24.8%) | 19 (17.4%) |
| 3 or more Vehicles | 193 (36.5%) | 8 (7.3%) |
| Total | 529 (100.0%) | 109 (100.0%) |
Real Estate & Mortgages in Dickens County
Real Estate and Mortgage Overview in Dickens County
| Characteristic | Without Mortgage | With Mortgage |
| Housing Units | 442 | 87 |
| Median Property Value | $56,700 | $140,500 |
| Median Household Income | $49,643 | $27 |
| Monthly Housing Costs | $417 | $0 |
| Real Estate Taxes | $587 | $0 |
Property Value by Mortgage Status in Dickens County
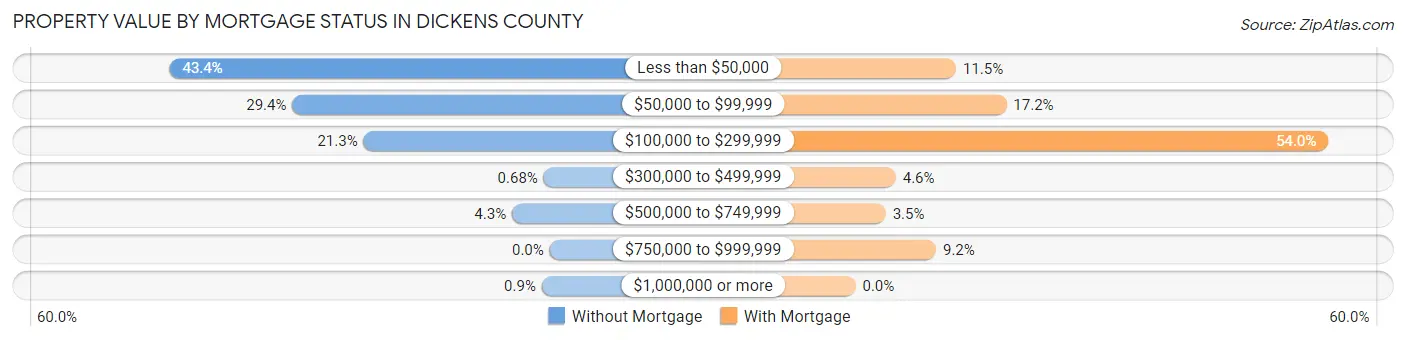
| Property Value | Without Mortgage | With Mortgage |
| Less than $50,000 | 192 (43.4%) | 10 (11.5%) |
| $50,000 to $99,999 | 130 (29.4%) | 15 (17.2%) |
| $100,000 to $299,999 | 94 (21.3%) | 47 (54.0%) |
| $300,000 to $499,999 | 3 (0.7%) | 4 (4.6%) |
| $500,000 to $749,999 | 19 (4.3%) | 3 (3.5%) |
| $750,000 to $999,999 | 0 (0.0%) | 8 (9.2%) |
| $1,000,000 or more | 4 (0.9%) | 0 (0.0%) |
| Total | 442 (100.0%) | 87 (100.0%) |
Household Income by Mortgage Status in Dickens County
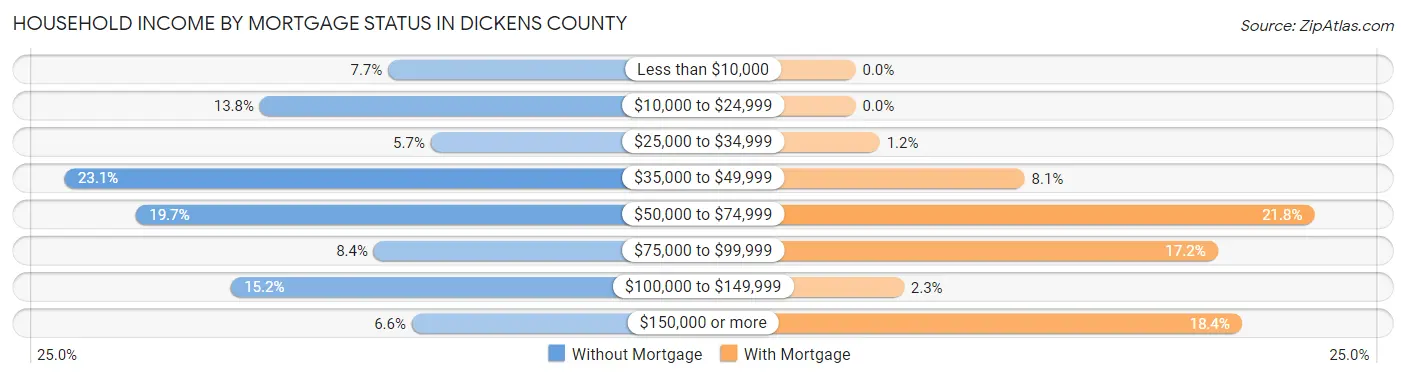
| Household Income | Without Mortgage | With Mortgage |
| Less than $10,000 | 34 (7.7%) | 0 (0.0%) |
| $10,000 to $24,999 | 61 (13.8%) | 0 (0.0%) |
| $25,000 to $34,999 | 25 (5.7%) | 1 (1.1%) |
| $35,000 to $49,999 | 102 (23.1%) | 7 (8.1%) |
| $50,000 to $74,999 | 87 (19.7%) | 19 (21.8%) |
| $75,000 to $99,999 | 37 (8.4%) | 15 (17.2%) |
| $100,000 to $149,999 | 67 (15.2%) | 2 (2.3%) |
| $150,000 or more | 29 (6.6%) | 16 (18.4%) |
| Total | 442 (100.0%) | 87 (100.0%) |
Property Value to Household Income Ratio in Dickens County
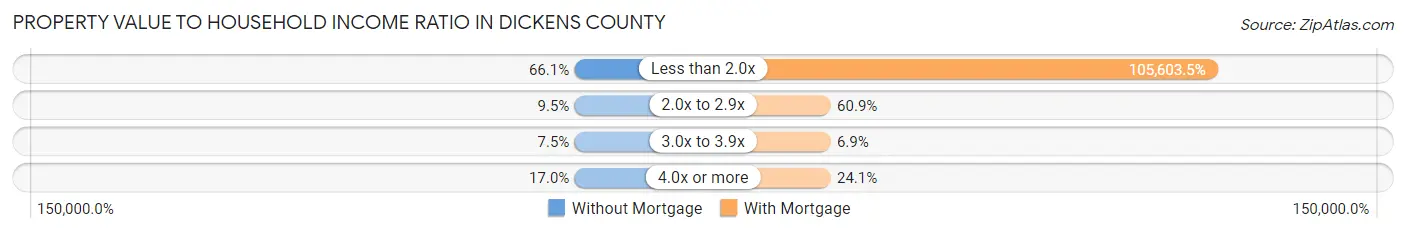
| Value-to-Income Ratio | Without Mortgage | With Mortgage |
| Less than 2.0x | 292 (66.1%) | 91,875 (105,603.4%) |
| 2.0x to 2.9x | 42 (9.5%) | 53 (60.9%) |
| 3.0x to 3.9x | 33 (7.5%) | 6 (6.9%) |
| 4.0x or more | 75 (17.0%) | 21 (24.1%) |
| Total | 442 (100.0%) | 87 (100.0%) |
Real Estate Taxes by Mortgage Status in Dickens County
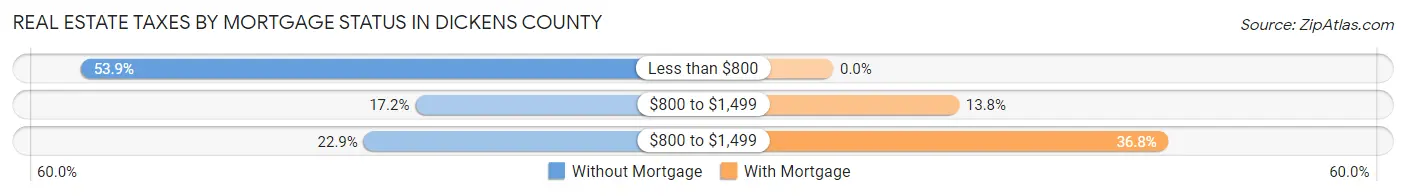
| Property Taxes | Without Mortgage | With Mortgage |
| Less than $800 | 238 (53.8%) | 0 (0.0%) |
| $800 to $1,499 | 76 (17.2%) | 12 (13.8%) |
| $800 to $1,499 | 101 (22.9%) | 32 (36.8%) |
| Total | 442 (100.0%) | 87 (100.0%) |
Health & Disability in Dickens County
Health Insurance Coverage by Age in Dickens County
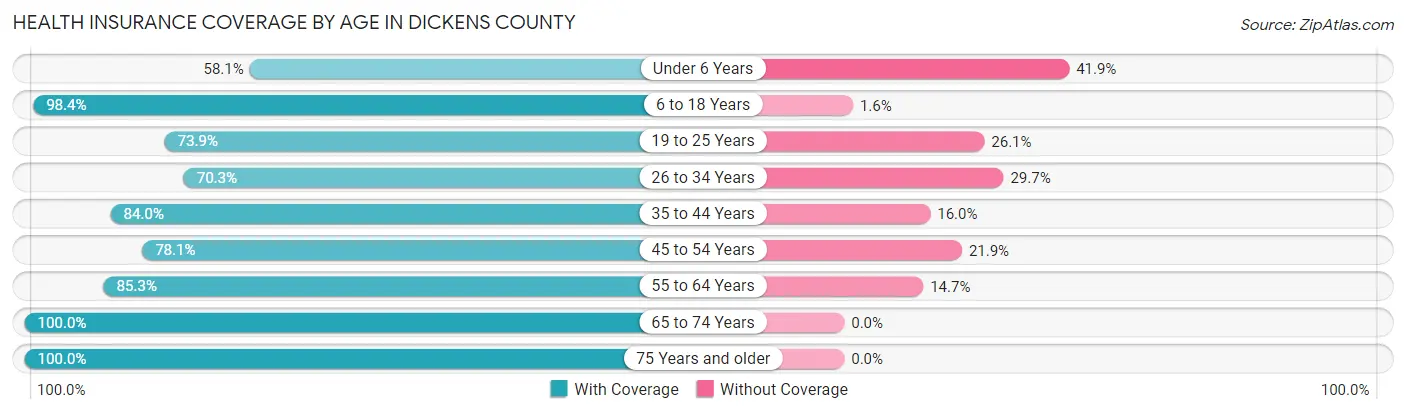
| Age Bracket | With Coverage | Without Coverage |
| Under 6 Years | 72 (58.1%) | 52 (41.9%) |
| 6 to 18 Years | 182 (98.4%) | 3 (1.6%) |
| 19 to 25 Years | 99 (73.9%) | 35 (26.1%) |
| 26 to 34 Years | 90 (70.3%) | 38 (29.7%) |
| 35 to 44 Years | 110 (84.0%) | 21 (16.0%) |
| 45 to 54 Years | 121 (78.1%) | 34 (21.9%) |
| 55 to 64 Years | 226 (85.3%) | 39 (14.7%) |
| 65 to 74 Years | 180 (100.0%) | 0 (0.0%) |
| 75 Years and older | 196 (100.0%) | 0 (0.0%) |
| Total | 1,276 (85.2%) | 222 (14.8%) |
Health Insurance Coverage by Citizenship Status in Dickens County
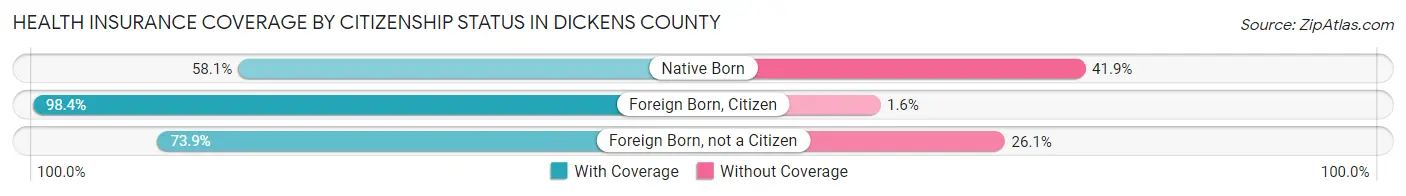
| Citizenship Status | With Coverage | Without Coverage |
| Native Born | 72 (58.1%) | 52 (41.9%) |
| Foreign Born, Citizen | 182 (98.4%) | 3 (1.6%) |
| Foreign Born, not a Citizen | 99 (73.9%) | 35 (26.1%) |
Health Insurance Coverage by Household Income in Dickens County
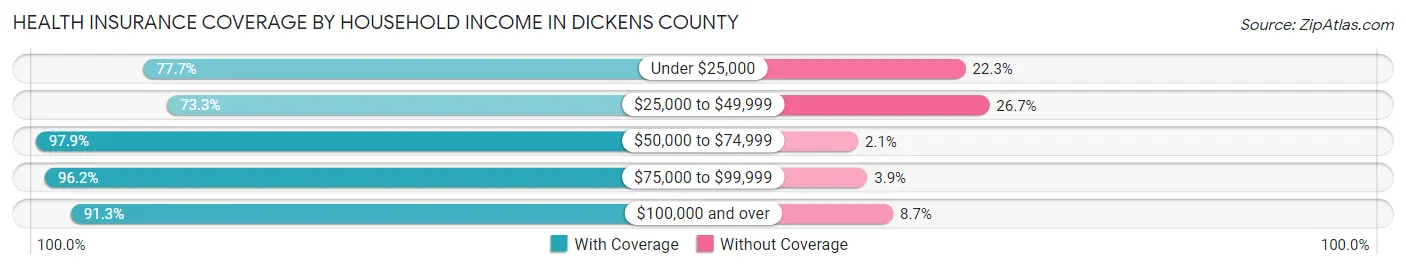
| Household Income | With Coverage | Without Coverage |
| Under $25,000 | 171 (77.7%) | 49 (22.3%) |
| $25,000 to $49,999 | 340 (73.3%) | 124 (26.7%) |
| $50,000 to $74,999 | 277 (97.9%) | 6 (2.1%) |
| $75,000 to $99,999 | 75 (96.2%) | 3 (3.8%) |
| $100,000 and over | 411 (91.3%) | 39 (8.7%) |
Public vs Private Health Insurance Coverage by Age in Dickens County
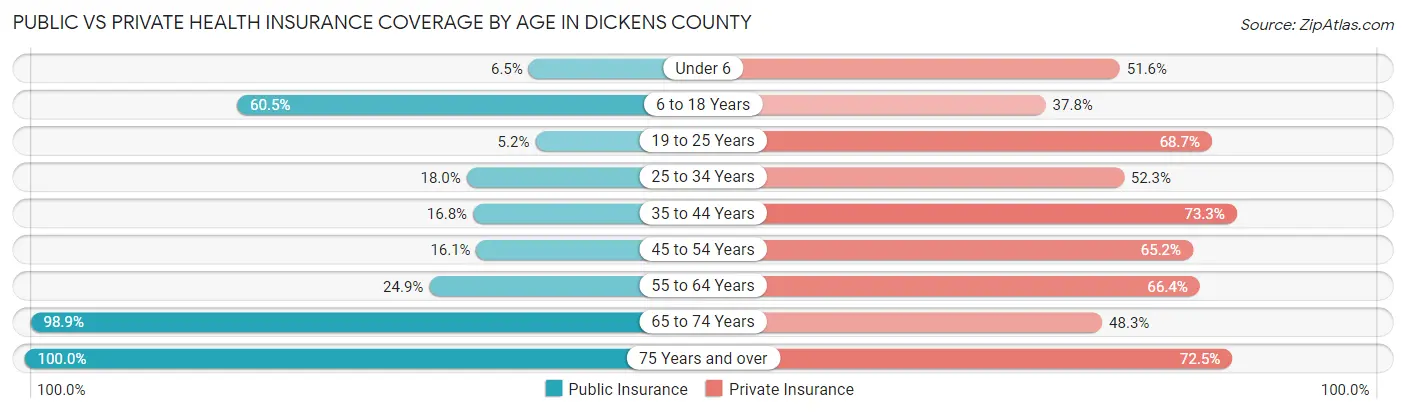
| Age Bracket | Public Insurance | Private Insurance |
| Under 6 | 8 (6.5%) | 64 (51.6%) |
| 6 to 18 Years | 112 (60.5%) | 70 (37.8%) |
| 19 to 25 Years | 7 (5.2%) | 92 (68.7%) |
| 25 to 34 Years | 23 (18.0%) | 67 (52.3%) |
| 35 to 44 Years | 22 (16.8%) | 96 (73.3%) |
| 45 to 54 Years | 25 (16.1%) | 101 (65.2%) |
| 55 to 64 Years | 66 (24.9%) | 176 (66.4%) |
| 65 to 74 Years | 178 (98.9%) | 87 (48.3%) |
| 75 Years and over | 196 (100.0%) | 142 (72.5%) |
| Total | 637 (42.5%) | 895 (59.8%) |
Disability Status by Sex by Age in Dickens County
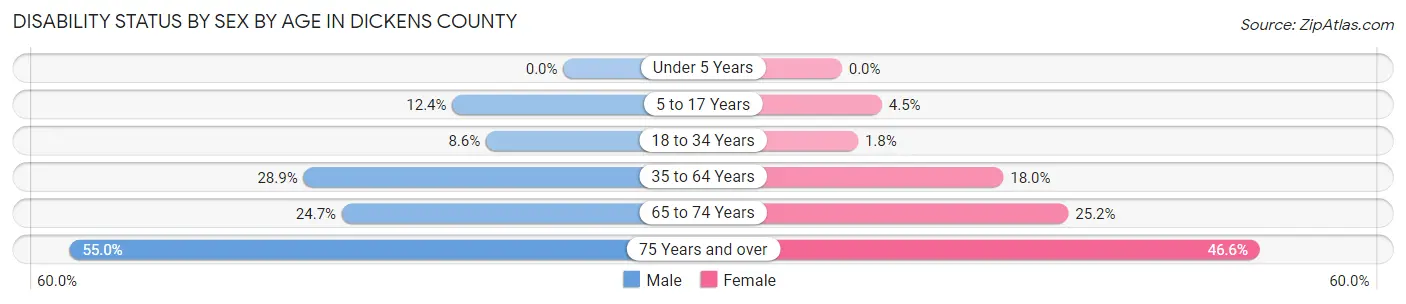
| Age Bracket | Male | Female |
| Under 5 Years | 0 (0.0%) | 0 (0.0%) |
| 5 to 17 Years | 11 (12.4%) | 5 (4.5%) |
| 18 to 34 Years | 13 (8.6%) | 2 (1.8%) |
| 35 to 64 Years | 79 (28.9%) | 50 (18.0%) |
| 65 to 74 Years | 18 (24.7%) | 27 (25.2%) |
| 75 Years and over | 44 (55.0%) | 54 (46.6%) |
Disability Class by Sex by Age in Dickens County
Disability Class: Hearing Difficulty
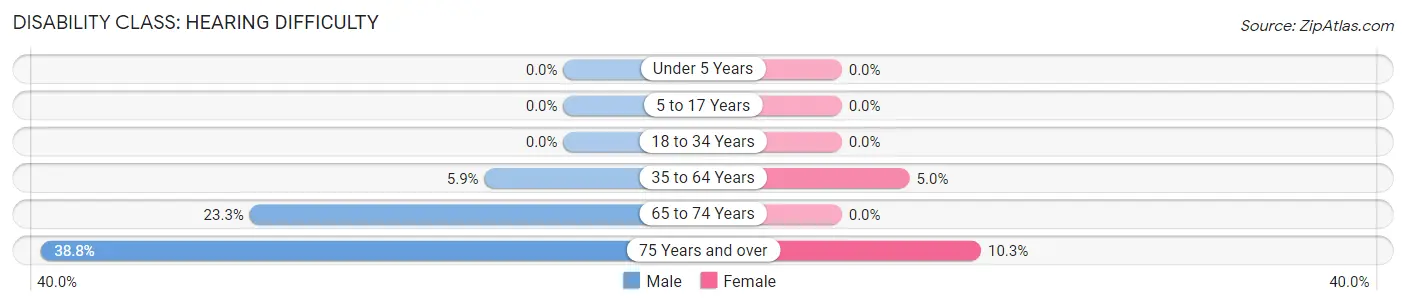
| Age Bracket | Male | Female |
| Under 5 Years | 0 (0.0%) | 0 (0.0%) |
| 5 to 17 Years | 0 (0.0%) | 0 (0.0%) |
| 18 to 34 Years | 0 (0.0%) | 0 (0.0%) |
| 35 to 64 Years | 16 (5.9%) | 14 (5.0%) |
| 65 to 74 Years | 17 (23.3%) | 0 (0.0%) |
| 75 Years and over | 31 (38.8%) | 12 (10.3%) |
Disability Class: Vision Difficulty
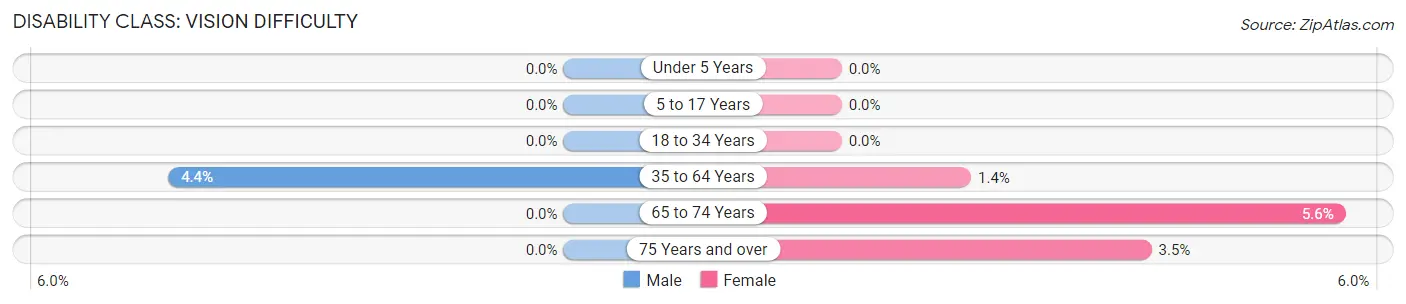
| Age Bracket | Male | Female |
| Under 5 Years | 0 (0.0%) | 0 (0.0%) |
| 5 to 17 Years | 0 (0.0%) | 0 (0.0%) |
| 18 to 34 Years | 0 (0.0%) | 0 (0.0%) |
| 35 to 64 Years | 12 (4.4%) | 4 (1.4%) |
| 65 to 74 Years | 0 (0.0%) | 6 (5.6%) |
| 75 Years and over | 0 (0.0%) | 4 (3.5%) |
Disability Class: Cognitive Difficulty
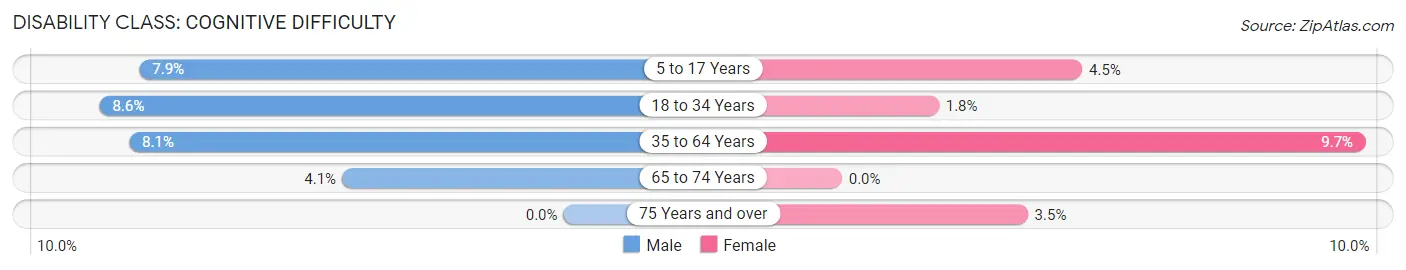
| Age Bracket | Male | Female |
| 5 to 17 Years | 7 (7.9%) | 5 (4.5%) |
| 18 to 34 Years | 13 (8.6%) | 2 (1.8%) |
| 35 to 64 Years | 22 (8.1%) | 27 (9.7%) |
| 65 to 74 Years | 3 (4.1%) | 0 (0.0%) |
| 75 Years and over | 0 (0.0%) | 4 (3.5%) |
Disability Class: Ambulatory Difficulty
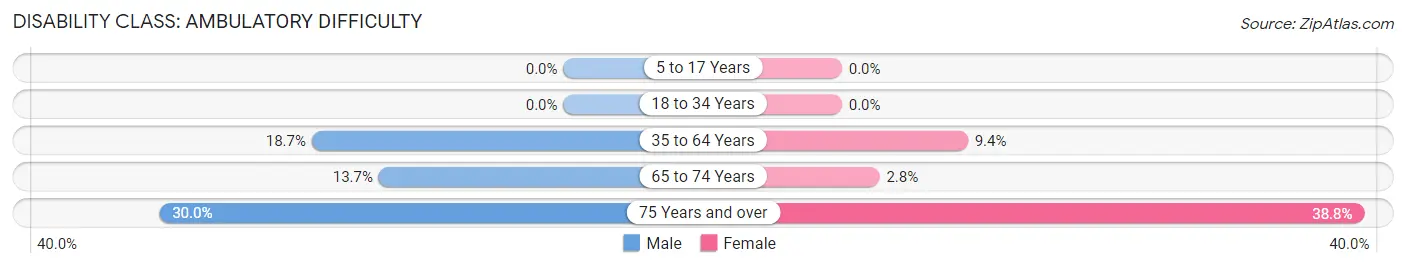
| Age Bracket | Male | Female |
| 5 to 17 Years | 0 (0.0%) | 0 (0.0%) |
| 18 to 34 Years | 0 (0.0%) | 0 (0.0%) |
| 35 to 64 Years | 51 (18.7%) | 26 (9.3%) |
| 65 to 74 Years | 10 (13.7%) | 3 (2.8%) |
| 75 Years and over | 24 (30.0%) | 45 (38.8%) |
Disability Class: Self-Care Difficulty
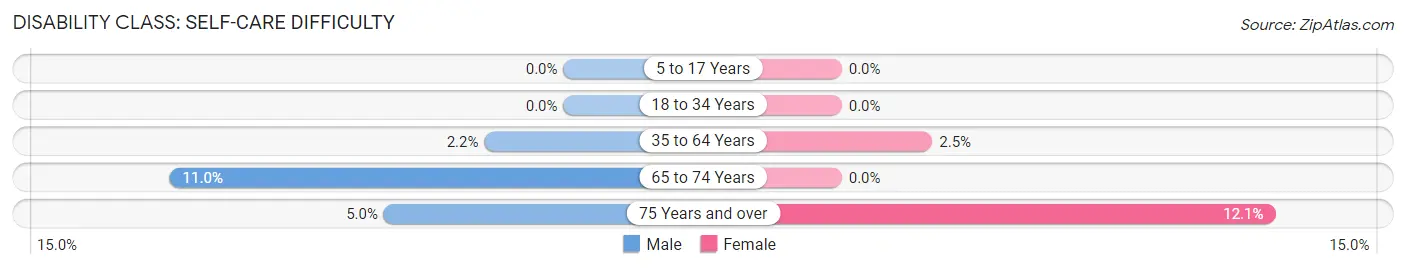
| Age Bracket | Male | Female |
| 5 to 17 Years | 0 (0.0%) | 0 (0.0%) |
| 18 to 34 Years | 0 (0.0%) | 0 (0.0%) |
| 35 to 64 Years | 6 (2.2%) | 7 (2.5%) |
| 65 to 74 Years | 8 (11.0%) | 0 (0.0%) |
| 75 Years and over | 4 (5.0%) | 14 (12.1%) |
Technology Access in Dickens County
Computing Device Access in Dickens County
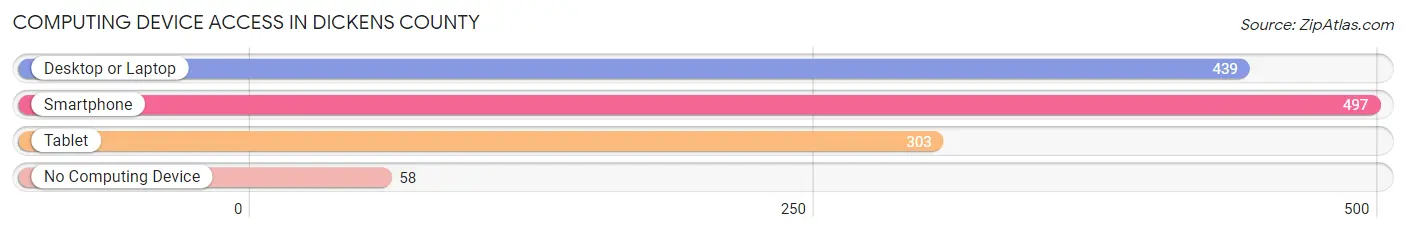
| Device Type | # Households | % Households |
| Desktop or Laptop | 439 | 68.8% |
| Smartphone | 497 | 77.9% |
| Tablet | 303 | 47.5% |
| No Computing Device | 58 | 9.1% |
| Total | 638 | 100.0% |
Internet Access in Dickens County
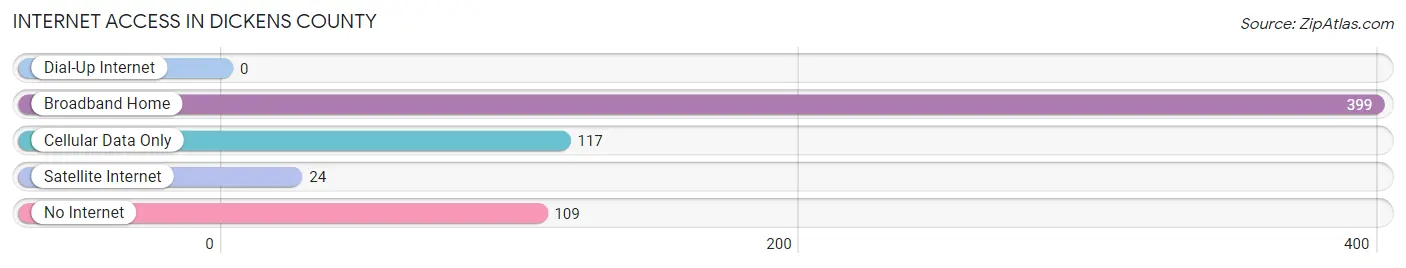
| Internet Type | # Households | % Households |
| Dial-Up Internet | 0 | 0.0% |
| Broadband Home | 399 | 62.5% |
| Cellular Data Only | 117 | 18.3% |
| Satellite Internet | 24 | 3.8% |
| No Internet | 109 | 17.1% |
| Total | 638 | 100.0% |
Dickens County Summary
Dickens County is located in the Texas Panhandle, in the northwest corner of the state. It is bordered by King County to the north, Motley County to the east, Crosby County to the south, and Floyd County to the west. The county seat is Spur, and the largest city is Dickens.
History
Dickens County was created in 1876 from portions of Bexar and Young counties. It was named for J. Dickens, a Texas Ranger who fought in the Battle of Plum Creek. The county was organized in 1891, and Spur was chosen as the county seat.
The first settlers in the area were ranchers, who brought their cattle to the area in the late 1800s. The first towns in the county were Spur and Dickens, which were established in the early 1900s.
Geography
Dickens County covers an area of 902 square miles. The terrain is mostly flat, with some rolling hills in the western part of the county. The county is drained by the Salt Fork of the Brazos River, which flows through the center of the county.
The climate is semi-arid, with hot summers and mild winters. The average annual precipitation is about 20 inches.
Economy
Agriculture is the main economic activity in Dickens County. The main crops are wheat, sorghum, cotton, and hay. Cattle ranching is also an important part of the economy.
Oil and gas production is also an important part of the economy. There are several oil and gas fields in the county, including the Spur Field, the Dickens Field, and the Salt Fork Field.
Demographics
As of the 2010 census, the population of Dickens County was 2,444. The racial makeup of the county was 84.3% White, 0.7% African American, 0.7% Native American, 0.2% Asian, 11.7% from other races, and 2.4% from two or more races. Hispanic or Latino of any race were 22.2% of the population.
The median household income was $31,250, and the median family income was $37,500. The per capita income was $15,945. About 17.2% of the population was below the poverty line.
The largest employers in the county are the school district, the county government, and the oil and gas industry. The largest private employers are the local grocery stores and the local restaurants.
Common Questions
What is Per Capita Income in Dickens County?
Per Capita income in Dickens County is $28,798.
What is the Median Family Income in Dickens County?
Median Family Income in Dickens County is $64,464.
What is the Median Household income in Dickens County?
Median Household Income in Dickens County is $46,638.
What is Income or Wage Gap in Dickens County?
Income or Wage Gap in Dickens County is 14.4%.
Women in Dickens County earn 85.6 cents for every dollar earned by a man.
What is Inequality or Gini Index in Dickens County?
Inequality or Gini Index in Dickens County is 0.45.
What is the Total Population of Dickens County?
Total Population of Dickens County is 1,570.
What is the Total Male Population of Dickens County?
Total Male Population of Dickens County is 739.
What is the Total Female Population of Dickens County?
Total Female Population of Dickens County is 831.
What is the Ratio of Males per 100 Females in Dickens County?
There are 88.93 Males per 100 Females in Dickens County.
What is the Ratio of Females per 100 Males in Dickens County?
There are 112.45 Females per 100 Males in Dickens County.
What is the Median Population Age in Dickens County?
Median Population Age in Dickens County is 47.9 Years.
What is the Average Family Size in Dickens County
Average Family Size in Dickens County is 3.1 People.
What is the Average Household Size in Dickens County
Average Household Size in Dickens County is 2.3 People.
How Large is the Labor Force in Dickens County?
There are 652 People in the Labor Forcein in Dickens County.
What is the Percentage of People in the Labor Force in Dickens County?
49.4% of People are in the Labor Force in Dickens County.
What is the Unemployment Rate in Dickens County?
Unemployment Rate in Dickens County is 9.7%.