DeWitt County, TX Map & Demographics
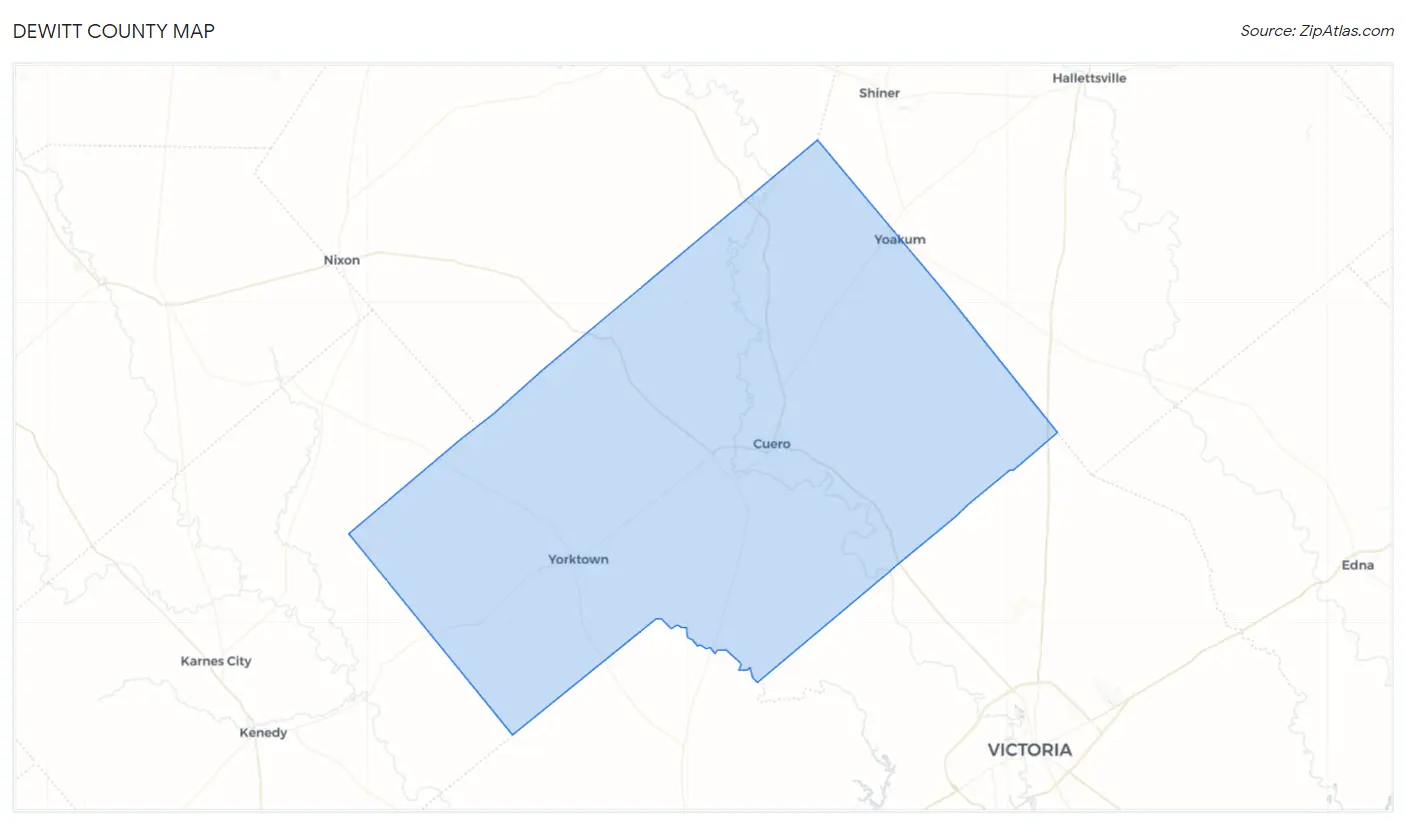
DeWitt County Map
DeWitt County Overview
$29,359
PER CAPITA INCOME
$69,614
AVG FAMILY INCOME
$61,100
AVG HOUSEHOLD INCOME
38.1%
WAGE / INCOME GAP [ % ]
61.9¢/ $1
WAGE / INCOME GAP [ $ ]
$9,212
FAMILY INCOME DEFICIT
0.49
INEQUALITY / GINI INDEX
19,826
TOTAL POPULATION
10,433
MALE POPULATION
9,393
FEMALE POPULATION
111.07
MALES / 100 FEMALES
90.03
FEMALES / 100 MALES
41.7
MEDIAN AGE
3.4
AVG FAMILY SIZE
2.7
AVG HOUSEHOLD SIZE
7,956
LABOR FORCE [ PEOPLE ]
50.2%
PERCENT IN LABOR FORCE
5.2%
UNEMPLOYMENT RATE
Income in DeWitt County
Income Overview in DeWitt County
Per Capita Income in DeWitt County is $29,359, while median incomes of families and households are $69,614 and $61,100 respectively.
| Characteristic | Number | Measure |
| Per Capita Income | 19,826 | $29,359 |
| Median Family Income | 4,385 | $69,614 |
| Mean Family Income | 4,385 | $95,079 |
| Median Household Income | 6,586 | $61,100 |
| Mean Household Income | 6,586 | $82,939 |
| Income Deficit | 4,385 | $9,212 |
| Wage / Income Gap (%) | 19,826 | 38.06% |
| Wage / Income Gap ($) | 19,826 | 61.94¢ per $1 |
| Gini / Inequality Index | 19,826 | 0.49 |
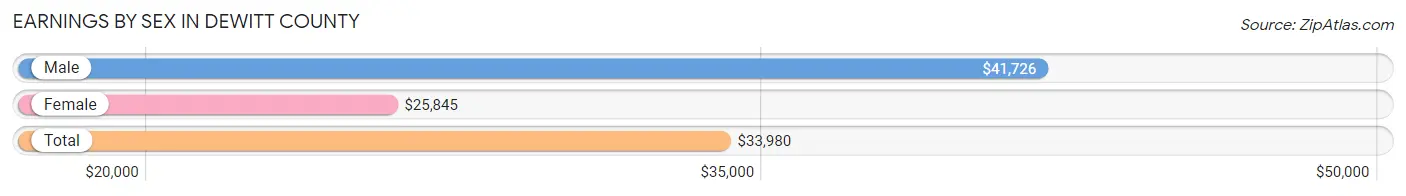
Earnings by Sex in DeWitt County
Average Earnings in DeWitt County are $33,980, $41,726 for men and $25,845 for women, a difference of 38.1%.
| Sex | Number | Average Earnings |
| Male | 4,222 (51.6%) | $41,726 |
| Female | 3,967 (48.4%) | $25,845 |
| Total | 8,189 (100.0%) | $33,980 |
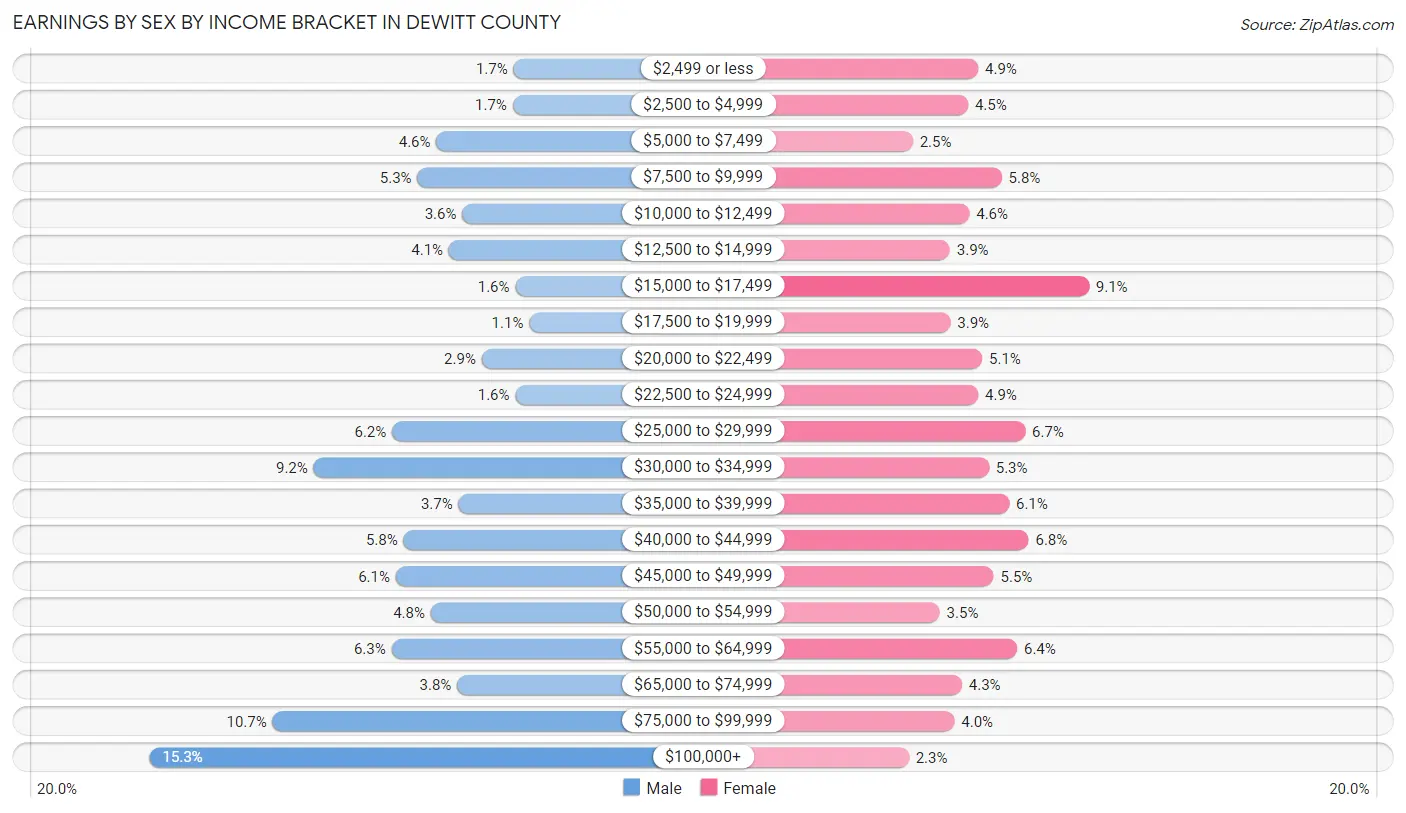
Earnings by Sex by Income Bracket in DeWitt County
The most common earnings brackets in DeWitt County are $100,000+ for men (647 | 15.3%) and $15,000 to $17,499 for women (360 | 9.1%).
| Income | Male | Female |
| $2,499 or less | 71 (1.7%) | 195 (4.9%) |
| $2,500 to $4,999 | 72 (1.7%) | 180 (4.5%) |
| $5,000 to $7,499 | 193 (4.6%) | 98 (2.5%) |
| $7,500 to $9,999 | 223 (5.3%) | 230 (5.8%) |
| $10,000 to $12,499 | 152 (3.6%) | 182 (4.6%) |
| $12,500 to $14,999 | 173 (4.1%) | 153 (3.9%) |
| $15,000 to $17,499 | 68 (1.6%) | 360 (9.1%) |
| $17,500 to $19,999 | 46 (1.1%) | 154 (3.9%) |
| $20,000 to $22,499 | 121 (2.9%) | 201 (5.1%) |
| $22,500 to $24,999 | 68 (1.6%) | 195 (4.9%) |
| $25,000 to $29,999 | 263 (6.2%) | 265 (6.7%) |
| $30,000 to $34,999 | 387 (9.2%) | 211 (5.3%) |
| $35,000 to $39,999 | 158 (3.7%) | 241 (6.1%) |
| $40,000 to $44,999 | 245 (5.8%) | 270 (6.8%) |
| $45,000 to $49,999 | 257 (6.1%) | 218 (5.5%) |
| $50,000 to $54,999 | 202 (4.8%) | 138 (3.5%) |
| $55,000 to $64,999 | 264 (6.2%) | 253 (6.4%) |
| $65,000 to $74,999 | 160 (3.8%) | 171 (4.3%) |
| $75,000 to $99,999 | 452 (10.7%) | 160 (4.0%) |
| $100,000+ | 647 (15.3%) | 92 (2.3%) |
| Total | 4,222 (100.0%) | 3,967 (100.0%) |
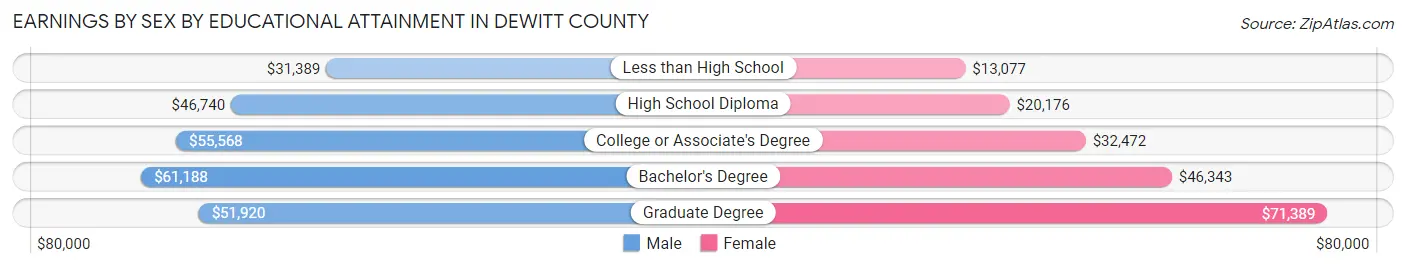
Earnings by Sex by Educational Attainment in DeWitt County
Average earnings in DeWitt County are $47,252 for men and $29,265 for women, a difference of 38.1%. Men with an educational attainment of bachelor's degree enjoy the highest average annual earnings of $61,188, while those with less than high school education earn the least with $31,389. Women with an educational attainment of graduate degree earn the most with the average annual earnings of $71,389, while those with less than high school education have the smallest earnings of $13,077.
| Educational Attainment | Male Income | Female Income |
| Less than High School | $31,389 | $13,077 |
| High School Diploma | $46,740 | $20,176 |
| College or Associate's Degree | $55,568 | $32,472 |
| Bachelor's Degree | $61,188 | $46,343 |
| Graduate Degree | $51,920 | $71,389 |
| Total | $47,252 | $29,265 |
Family Income in DeWitt County
Family Income Brackets in DeWitt County
According to the DeWitt County family income data, there are 899 families falling into the $50,000 to $74,999 income range, which is the most common income bracket and makes up 20.5% of all families. Conversely, the less than $10,000 income bracket is the least frequent group with only 127 families (2.9%) belonging to this category.
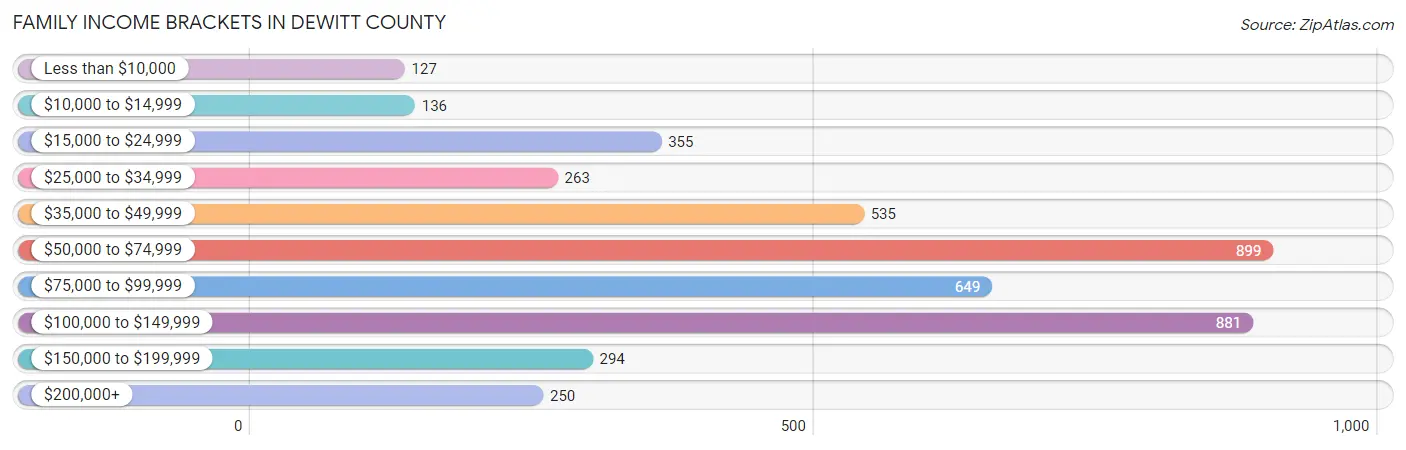
| Income Bracket | # Families | % Families |
| Less than $10,000 | 127 | 2.9% |
| $10,000 to $14,999 | 136 | 3.1% |
| $15,000 to $24,999 | 355 | 8.1% |
| $25,000 to $34,999 | 263 | 6.0% |
| $35,000 to $49,999 | 535 | 12.2% |
| $50,000 to $74,999 | 899 | 20.5% |
| $75,000 to $99,999 | 649 | 14.8% |
| $100,000 to $149,999 | 881 | 20.1% |
| $150,000 to $199,999 | 294 | 6.7% |
| $200,000+ | 250 | 5.7% |
Family Income by Famaliy Size in DeWitt County
5-person families (321 | 7.3%) account for the highest median family income in DeWitt County with $97,708 per family, while 2-person families (2,370 | 54.0%) have the highest median income of $31,030 per family member.
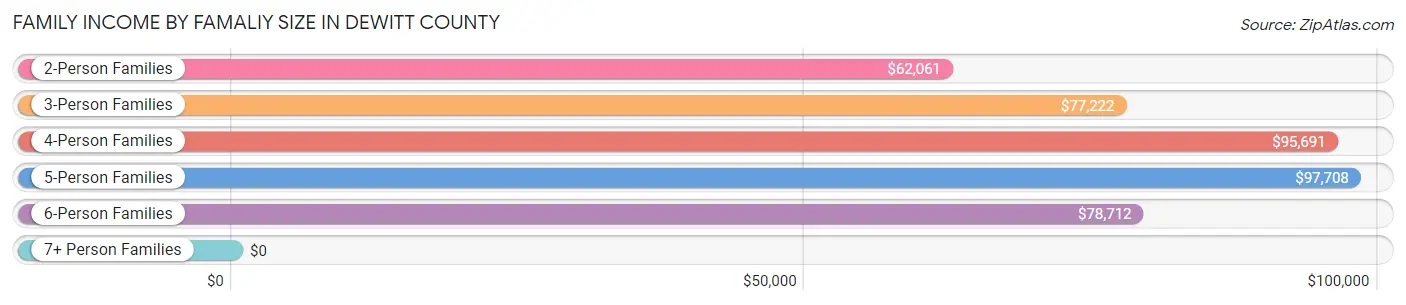
| Income Bracket | # Families | Median Income |
| 2-Person Families | 2,370 (54.0%) | $62,061 |
| 3-Person Families | 716 (16.3%) | $77,222 |
| 4-Person Families | 771 (17.6%) | $95,691 |
| 5-Person Families | 321 (7.3%) | $97,708 |
| 6-Person Families | 176 (4.0%) | $78,712 |
| 7+ Person Families | 31 (0.7%) | $0 |
| Total | 4,385 (100.0%) | $69,614 |
Family Income by Number of Earners in DeWitt County
The median family income in DeWitt County is $69,614, with families comprising 3+ earners (235) having the highest median family income of $115,134, while families with no earners (954) have the lowest median family income of $38,917, accounting for 5.4% and 21.8% of families, respectively.
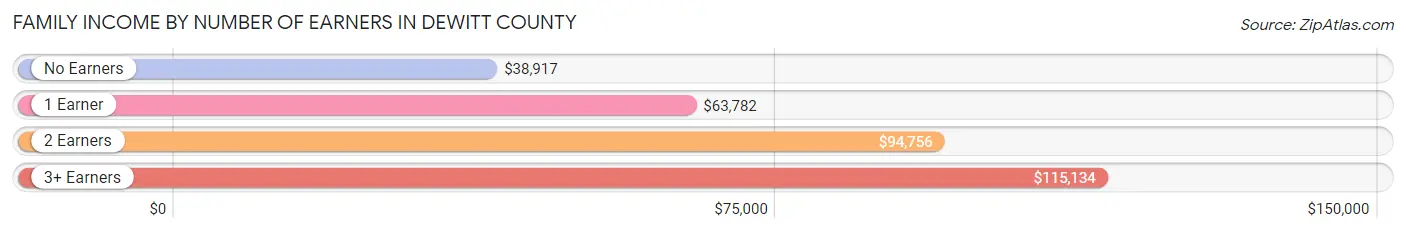
| Number of Earners | # Families | Median Income |
| No Earners | 954 (21.8%) | $38,917 |
| 1 Earner | 1,268 (28.9%) | $63,782 |
| 2 Earners | 1,928 (44.0%) | $94,756 |
| 3+ Earners | 235 (5.4%) | $115,134 |
| Total | 4,385 (100.0%) | $69,614 |
Household Income in DeWitt County
Household Income Brackets in DeWitt County
With 1,120 households falling in the category, the $50,000 to $74,999 income range is the most frequent in DeWitt County, accounting for 17.0% of all households. In contrast, only 290 households (4.4%) fall into the $200,000+ income bracket, making it the least populous group.
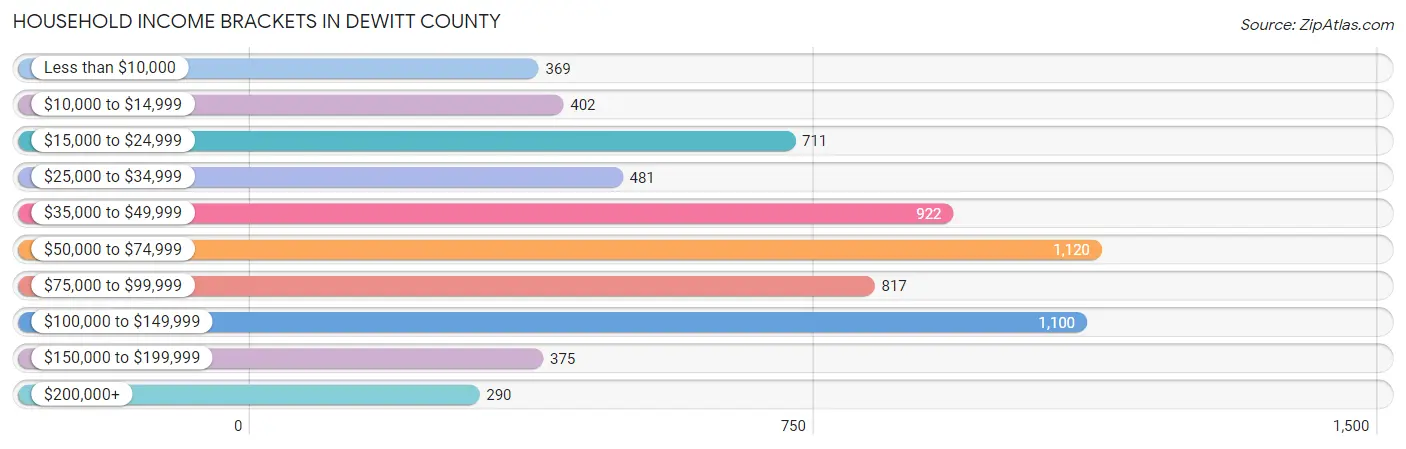
| Income Bracket | # Households | % Households |
| Less than $10,000 | 369 | 5.6% |
| $10,000 to $14,999 | 402 | 6.1% |
| $15,000 to $24,999 | 711 | 10.8% |
| $25,000 to $34,999 | 481 | 7.3% |
| $35,000 to $49,999 | 922 | 14.0% |
| $50,000 to $74,999 | 1,120 | 17.0% |
| $75,000 to $99,999 | 817 | 12.4% |
| $100,000 to $149,999 | 1,100 | 16.7% |
| $150,000 to $199,999 | 375 | 5.7% |
| $200,000+ | 290 | 4.4% |
Household Income by Householder Age in DeWitt County
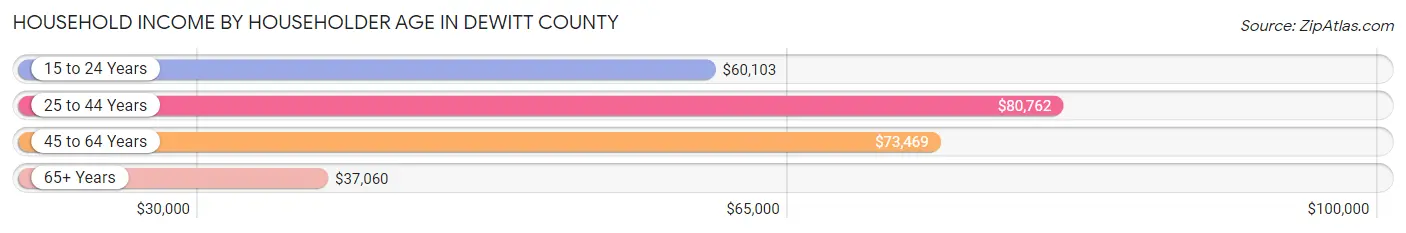
The median household income in DeWitt County is $61,100, with the highest median household income of $80,762 found in the 25 to 44 years age bracket for the primary householder. A total of 1,711 households (26.0%) fall into this category. Meanwhile, the 65+ years age bracket for the primary householder has the lowest median household income of $37,060, with 2,264 households (34.4%) in this group.
| Income Bracket | # Households | Median Income |
| 15 to 24 Years | 254 (3.9%) | $60,103 |
| 25 to 44 Years | 1,711 (26.0%) | $80,762 |
| 45 to 64 Years | 2,357 (35.8%) | $73,469 |
| 65+ Years | 2,264 (34.4%) | $37,060 |
| Total | 6,586 (100.0%) | $61,100 |
Poverty in DeWitt County
Income Below Poverty by Sex and Age in DeWitt County
With 14.5% poverty level for males and 18.5% for females among the residents of DeWitt County, under 5 year old males and 5 year old females are the most vulnerable to poverty, with 208 males (32.1%) and 122 females (65.2%) in their respective age groups living below the poverty level.
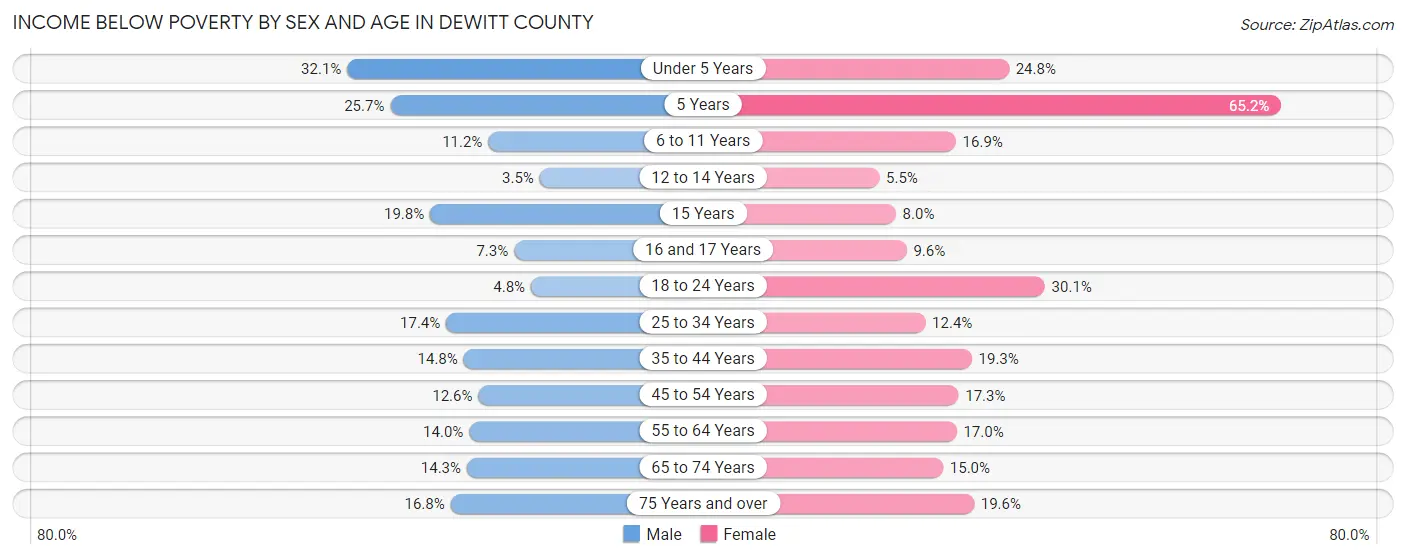
| Age Bracket | Male | Female |
| Under 5 Years | 208 (32.1%) | 147 (24.8%) |
| 5 Years | 45 (25.7%) | 122 (65.2%) |
| 6 to 11 Years | 81 (11.2%) | 117 (16.9%) |
| 12 to 14 Years | 12 (3.5%) | 18 (5.5%) |
| 15 Years | 19 (19.8%) | 12 (8.0%) |
| 16 and 17 Years | 18 (7.3%) | 19 (9.6%) |
| 18 to 24 Years | 38 (4.8%) | 197 (30.1%) |
| 25 to 34 Years | 136 (17.4%) | 116 (12.4%) |
| 35 to 44 Years | 172 (14.8%) | 194 (19.3%) |
| 45 to 54 Years | 120 (12.6%) | 195 (17.3%) |
| 55 to 64 Years | 176 (14.0%) | 220 (17.0%) |
| 65 to 74 Years | 143 (14.3%) | 171 (15.0%) |
| 75 Years and over | 98 (16.8%) | 165 (19.6%) |
| Total | 1,266 (14.5%) | 1,693 (18.5%) |
Income Above Poverty by Sex and Age in DeWitt County
According to the poverty statistics in DeWitt County, males aged 12 to 14 years and females aged 12 to 14 years are the age groups that are most secure financially, with 96.5% of males and 94.5% of females in these age groups living above the poverty line.
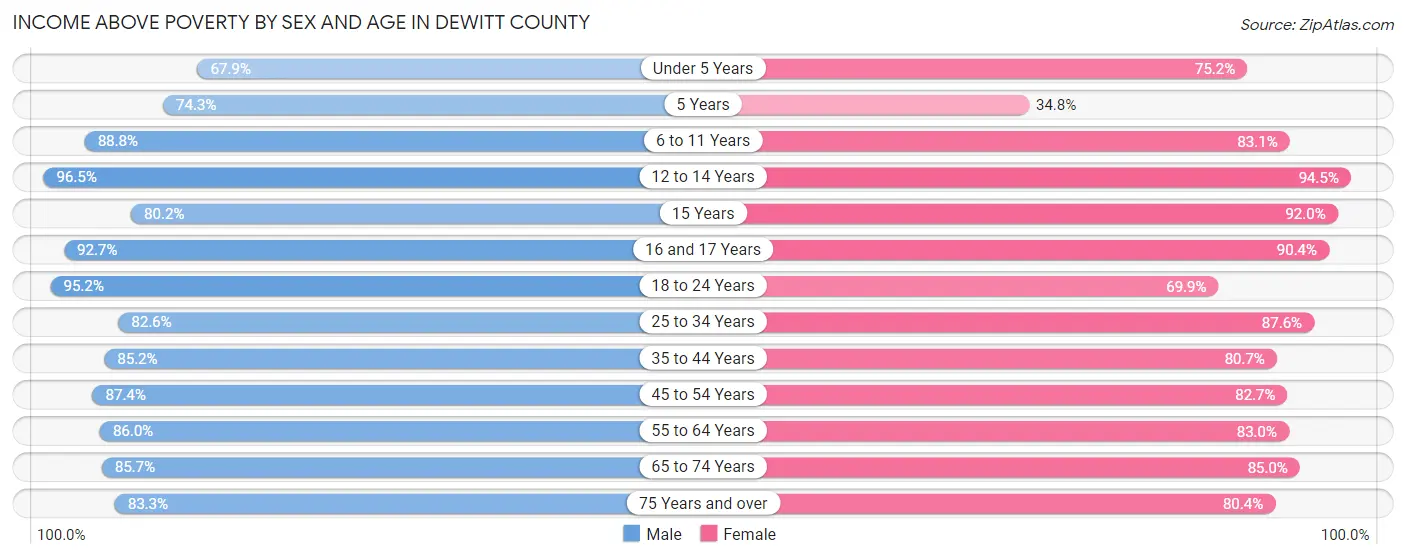
| Age Bracket | Male | Female |
| Under 5 Years | 440 (67.9%) | 446 (75.2%) |
| 5 Years | 130 (74.3%) | 65 (34.8%) |
| 6 to 11 Years | 645 (88.8%) | 575 (83.1%) |
| 12 to 14 Years | 330 (96.5%) | 307 (94.5%) |
| 15 Years | 77 (80.2%) | 138 (92.0%) |
| 16 and 17 Years | 228 (92.7%) | 179 (90.4%) |
| 18 to 24 Years | 750 (95.2%) | 457 (69.9%) |
| 25 to 34 Years | 645 (82.6%) | 821 (87.6%) |
| 35 to 44 Years | 989 (85.2%) | 812 (80.7%) |
| 45 to 54 Years | 830 (87.4%) | 932 (82.7%) |
| 55 to 64 Years | 1,082 (86.0%) | 1,072 (83.0%) |
| 65 to 74 Years | 855 (85.7%) | 968 (85.0%) |
| 75 Years and over | 487 (83.3%) | 677 (80.4%) |
| Total | 7,488 (85.5%) | 7,449 (81.5%) |
Income Below Poverty Among Married-Couple Families in DeWitt County
The poverty statistics for married-couple families in DeWitt County show that 6.7% or 224 of the total 3,330 families live below the poverty line. Families with 3 or 4 children have the highest poverty rate of 23.0%, comprising of 96 families. On the other hand, families with 5 or more children have the lowest poverty rate of 0.0%, which includes 0 families.
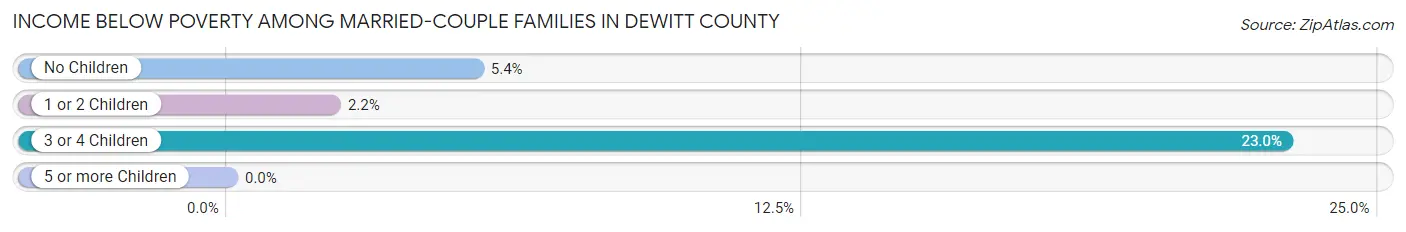
| Children | Above Poverty | Below Poverty |
| No Children | 1,910 (94.7%) | 108 (5.3%) |
| 1 or 2 Children | 871 (97.8%) | 20 (2.2%) |
| 3 or 4 Children | 322 (77.0%) | 96 (23.0%) |
| 5 or more Children | 3 (100.0%) | 0 (0.0%) |
| Total | 3,106 (93.3%) | 224 (6.7%) |
Income Below Poverty Among Single-Parent Households in DeWitt County
According to the poverty data in DeWitt County, 10.8% or 28 single-father households and 37.3% or 297 single-mother households are living below the poverty line. Among single-father households, those with 3 or 4 children have the highest poverty rate, with 11 households (78.6%) experiencing poverty. Likewise, among single-mother households, those with 5 or more children have the highest poverty rate, with 11 households (100.0%) falling below the poverty line.
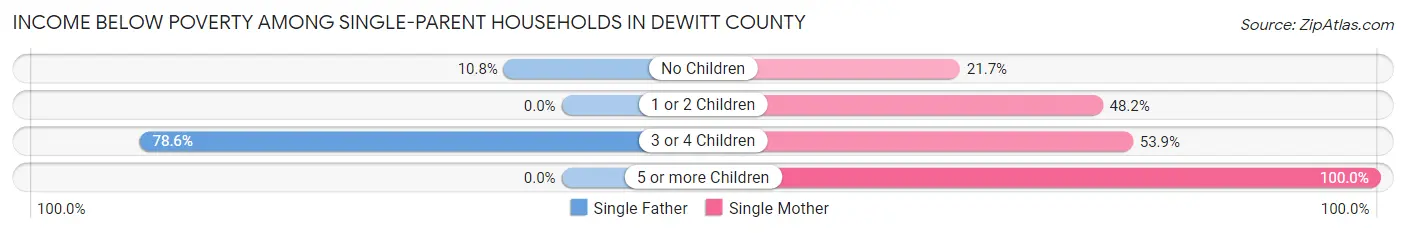
| Children | Single Father | Single Mother |
| No Children | 17 (10.8%) | 76 (21.6%) |
| 1 or 2 Children | 0 (0.0%) | 203 (48.2%) |
| 3 or 4 Children | 11 (78.6%) | 7 (53.8%) |
| 5 or more Children | 0 (0.0%) | 11 (100.0%) |
| Total | 28 (10.8%) | 297 (37.3%) |
Income Below Poverty Among Married-Couple vs Single-Parent Households in DeWitt County
The poverty data for DeWitt County shows that 224 of the married-couple family households (6.7%) and 325 of the single-parent households (30.8%) are living below the poverty level. Within the married-couple family households, those with 3 or 4 children have the highest poverty rate, with 96 households (23.0%) falling below the poverty line. Among the single-parent households, those with 5 or more children have the highest poverty rate, with 11 household (100.0%) living below poverty.
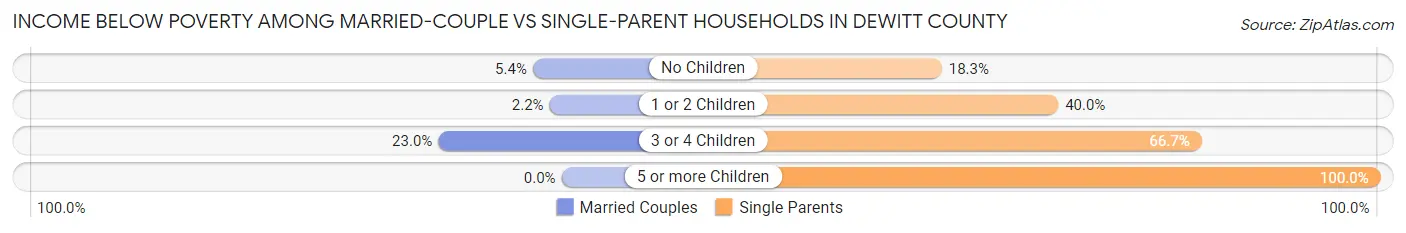
| Children | Married-Couple Families | Single-Parent Households |
| No Children | 108 (5.3%) | 93 (18.3%) |
| 1 or 2 Children | 20 (2.2%) | 203 (40.0%) |
| 3 or 4 Children | 96 (23.0%) | 18 (66.7%) |
| 5 or more Children | 0 (0.0%) | 11 (100.0%) |
| Total | 224 (6.7%) | 325 (30.8%) |
Race in DeWitt County
The most populous races in DeWitt County are White / Caucasian (12,035 | 60.7%), Hispanic or Latino (7,210 | 36.4%), and Some other Race (4,571 | 23.1%).
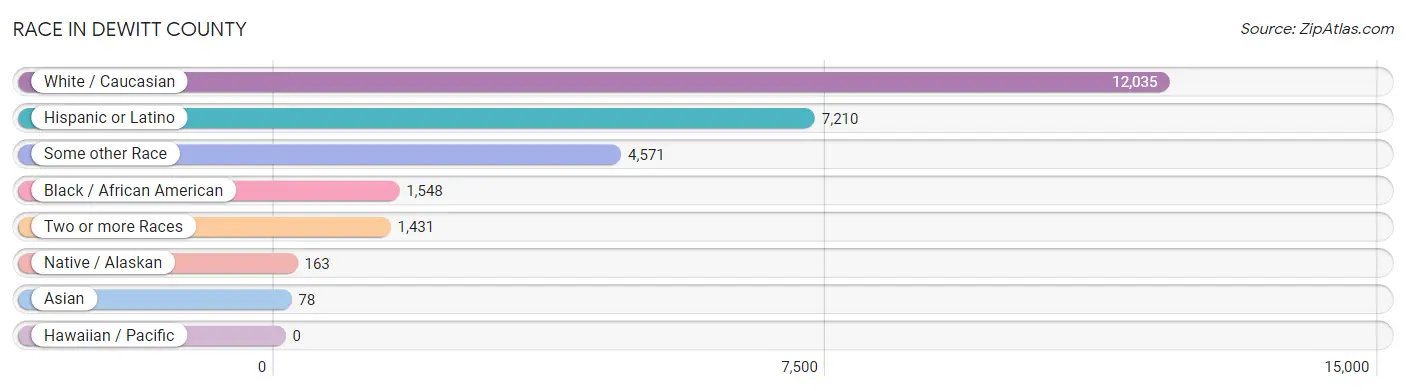
| Race | # Population | % Population |
| Asian | 78 | 0.4% |
| Black / African American | 1,548 | 7.8% |
| Hawaiian / Pacific | 0 | 0.0% |
| Hispanic or Latino | 7,210 | 36.4% |
| Native / Alaskan | 163 | 0.8% |
| White / Caucasian | 12,035 | 60.7% |
| Two or more Races | 1,431 | 7.2% |
| Some other Race | 4,571 | 23.1% |
| Total | 19,826 | 100.0% |
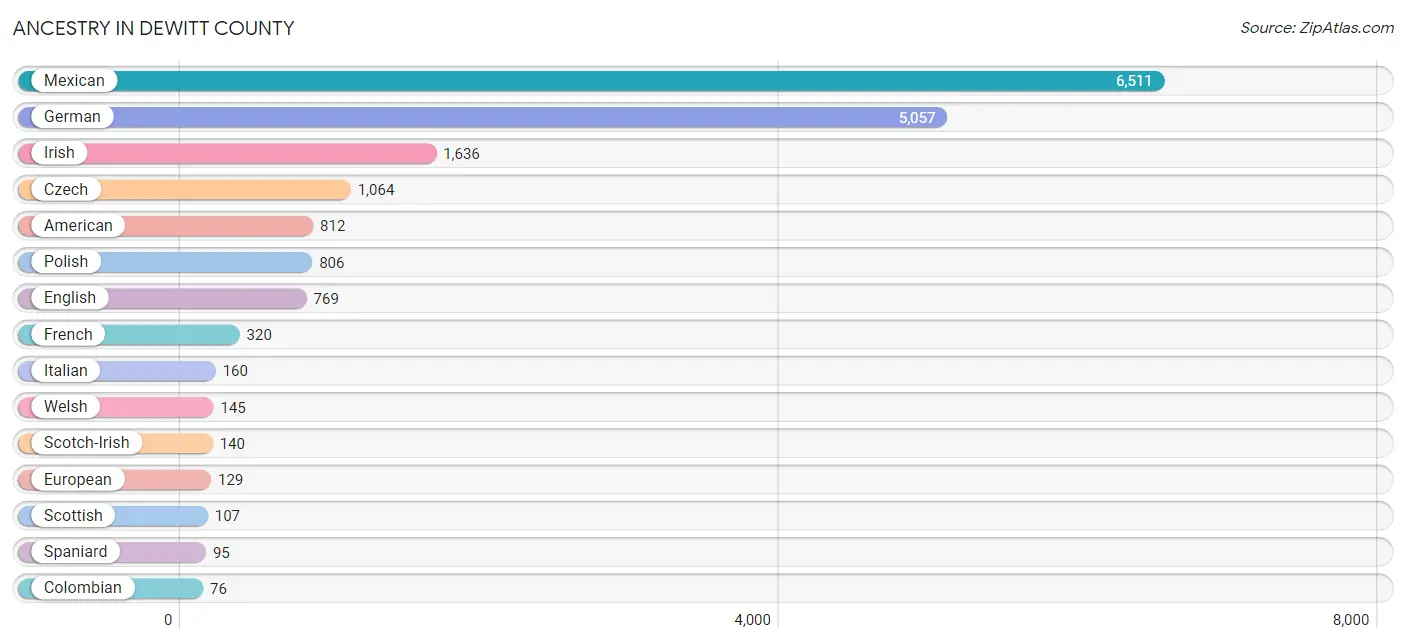
Ancestry in DeWitt County
The most populous ancestries reported in DeWitt County are Mexican (6,511 | 32.8%), German (5,057 | 25.5%), Irish (1,636 | 8.3%), Czech (1,064 | 5.4%), and American (812 | 4.1%), together accounting for 76.1% of all DeWitt County residents.
| Ancestry | # Population | % Population |
| African | 57 | 0.3% |
| American | 812 | 4.1% |
| Arab | 10 | 0.1% |
| Austrian | 9 | 0.1% |
| Belgian | 12 | 0.1% |
| Bhutanese | 45 | 0.2% |
| Blackfeet | 13 | 0.1% |
| British | 12 | 0.1% |
| Cajun | 3 | 0.0% |
| Canadian | 6 | 0.0% |
| Central American | 63 | 0.3% |
| Cherokee | 45 | 0.2% |
| Choctaw | 30 | 0.2% |
| Colombian | 76 | 0.4% |
| Comanche | 4 | 0.0% |
| Creek | 2 | 0.0% |
| Cuban | 20 | 0.1% |
| Czech | 1,064 | 5.4% |
| Czechoslovakian | 20 | 0.1% |
| Danish | 5 | 0.0% |
| Dutch | 53 | 0.3% |
| Dutch West Indian | 48 | 0.2% |
| Eastern European | 25 | 0.1% |
| English | 769 | 3.9% |
| European | 129 | 0.6% |
| Finnish | 3 | 0.0% |
| French | 320 | 1.6% |
| French Canadian | 1 | 0.0% |
| German | 5,057 | 25.5% |
| Greek | 5 | 0.0% |
| Guatemalan | 63 | 0.3% |
| Irish | 1,636 | 8.3% |
| Italian | 160 | 0.8% |
| Korean | 17 | 0.1% |
| Lithuanian | 10 | 0.1% |
| Mexican | 6,511 | 32.8% |
| Mexican American Indian | 49 | 0.3% |
| Norwegian | 40 | 0.2% |
| Pennsylvania German | 15 | 0.1% |
| Polish | 806 | 4.1% |
| Puerto Rican | 54 | 0.3% |
| Romanian | 3 | 0.0% |
| Scandinavian | 14 | 0.1% |
| Scotch-Irish | 140 | 0.7% |
| Scottish | 107 | 0.5% |
| Sioux | 7 | 0.0% |
| Slovak | 8 | 0.0% |
| South American | 76 | 0.4% |
| Spaniard | 95 | 0.5% |
| Spanish | 58 | 0.3% |
| Sri Lankan | 67 | 0.3% |
| Subsaharan African | 57 | 0.3% |
| Swedish | 51 | 0.3% |
| Swiss | 12 | 0.1% |
| Syrian | 10 | 0.1% |
| Thai | 2 | 0.0% |
| Trinidadian and Tobagonian | 60 | 0.3% |
| Turkish | 13 | 0.1% |
| Welsh | 145 | 0.7% | View All 59 Rows |
Immigrants in DeWitt County
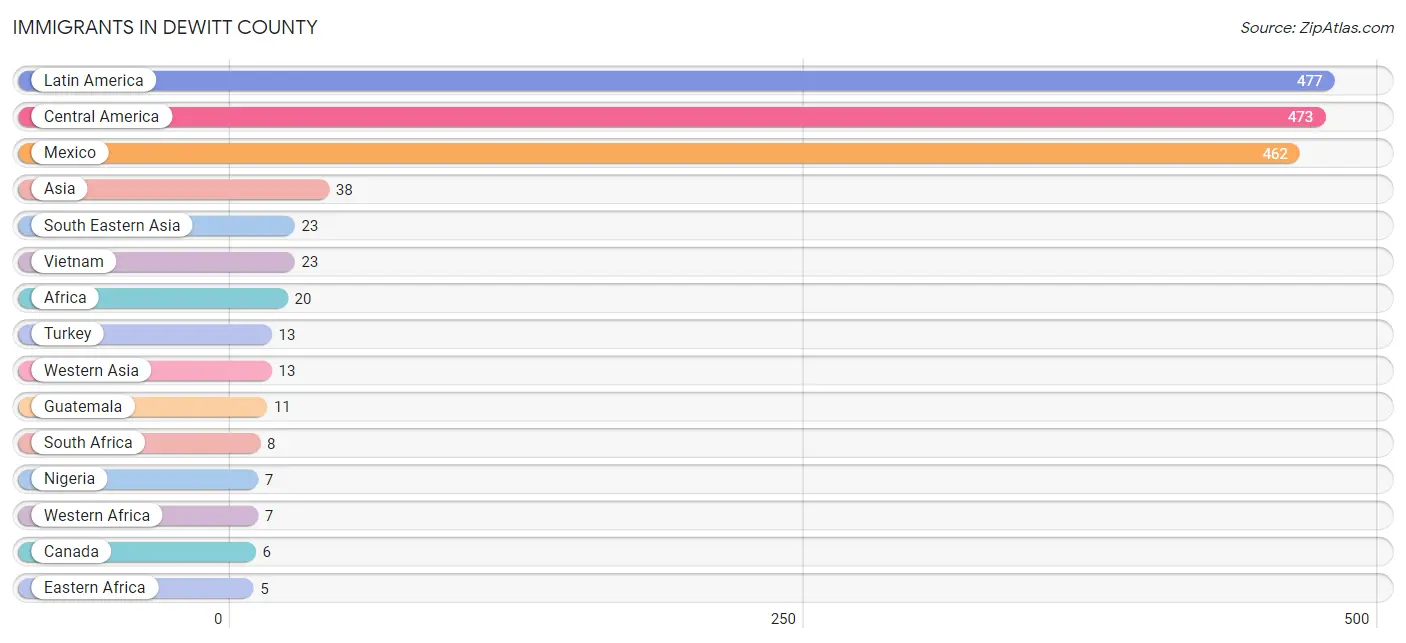
The most numerous immigrant groups reported in DeWitt County came from Latin America (477 | 2.4%), Central America (473 | 2.4%), Mexico (462 | 2.3%), Asia (38 | 0.2%), and South Eastern Asia (23 | 0.1%), together accounting for 7.4% of all DeWitt County residents.
| Immigration Origin | # Population | % Population |
| Africa | 20 | 0.1% |
| Asia | 38 | 0.2% |
| Canada | 6 | 0.0% |
| Central America | 473 | 2.4% |
| Colombia | 4 | 0.0% |
| Eastern Africa | 5 | 0.0% |
| Guatemala | 11 | 0.1% |
| India | 2 | 0.0% |
| Latin America | 477 | 2.4% |
| Mexico | 462 | 2.3% |
| Nigeria | 7 | 0.0% |
| South Africa | 8 | 0.0% |
| South America | 4 | 0.0% |
| South Central Asia | 2 | 0.0% |
| South Eastern Asia | 23 | 0.1% |
| Turkey | 13 | 0.1% |
| Uganda | 5 | 0.0% |
| Vietnam | 23 | 0.1% |
| Western Africa | 7 | 0.0% |
| Western Asia | 13 | 0.1% | View All 20 Rows |
Sex and Age in DeWitt County
Sex and Age in DeWitt County
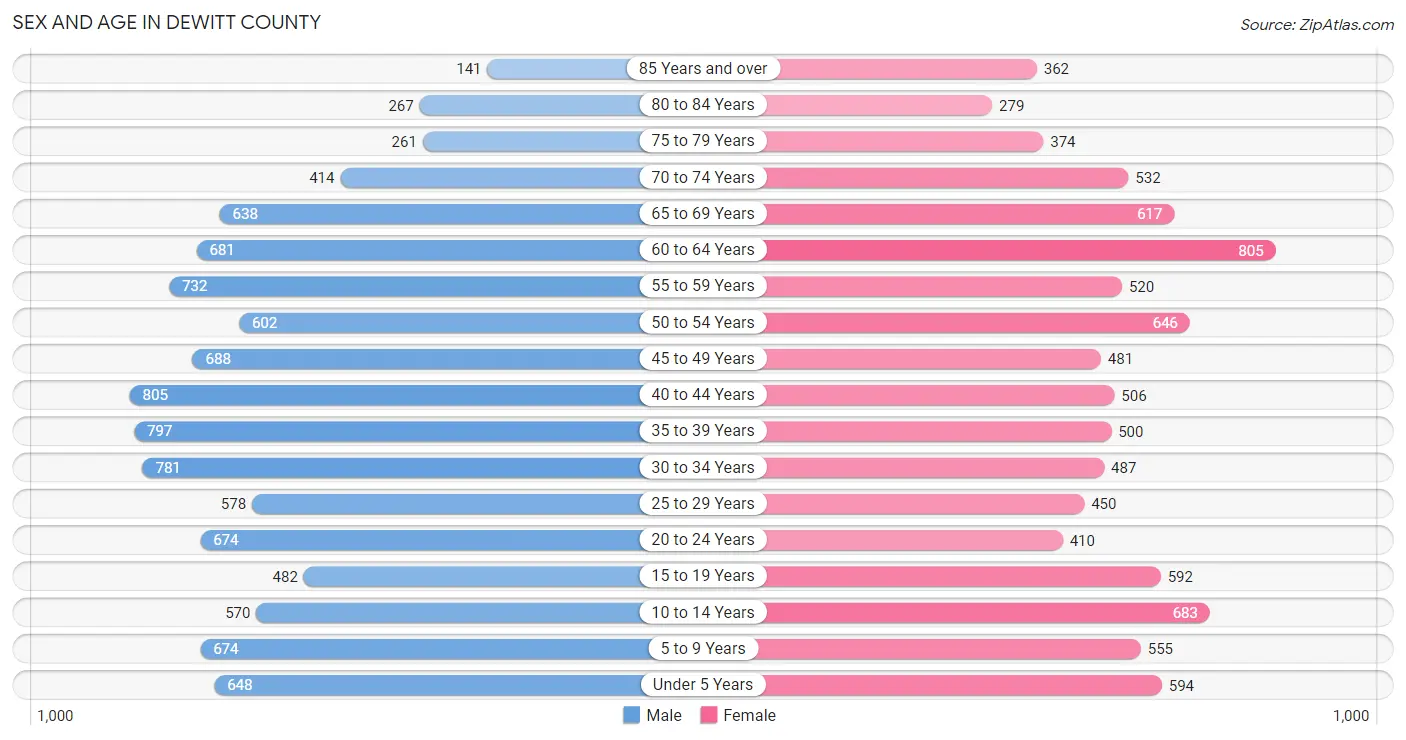
The most populous age groups in DeWitt County are 40 to 44 Years (805 | 7.7%) for men and 60 to 64 Years (805 | 8.6%) for women.
| Age Bracket | Male | Female |
| Under 5 Years | 648 (6.2%) | 594 (6.3%) |
| 5 to 9 Years | 674 (6.5%) | 555 (5.9%) |
| 10 to 14 Years | 570 (5.5%) | 683 (7.3%) |
| 15 to 19 Years | 482 (4.6%) | 592 (6.3%) |
| 20 to 24 Years | 674 (6.5%) | 410 (4.4%) |
| 25 to 29 Years | 578 (5.5%) | 450 (4.8%) |
| 30 to 34 Years | 781 (7.5%) | 487 (5.2%) |
| 35 to 39 Years | 797 (7.6%) | 500 (5.3%) |
| 40 to 44 Years | 805 (7.7%) | 506 (5.4%) |
| 45 to 49 Years | 688 (6.6%) | 481 (5.1%) |
| 50 to 54 Years | 602 (5.8%) | 646 (6.9%) |
| 55 to 59 Years | 732 (7.0%) | 520 (5.5%) |
| 60 to 64 Years | 681 (6.5%) | 805 (8.6%) |
| 65 to 69 Years | 638 (6.1%) | 617 (6.6%) |
| 70 to 74 Years | 414 (4.0%) | 532 (5.7%) |
| 75 to 79 Years | 261 (2.5%) | 374 (4.0%) |
| 80 to 84 Years | 267 (2.6%) | 279 (3.0%) |
| 85 Years and over | 141 (1.3%) | 362 (3.8%) |
| Total | 10,433 (100.0%) | 9,393 (100.0%) |
Families and Households in DeWitt County
Median Family Size in DeWitt County
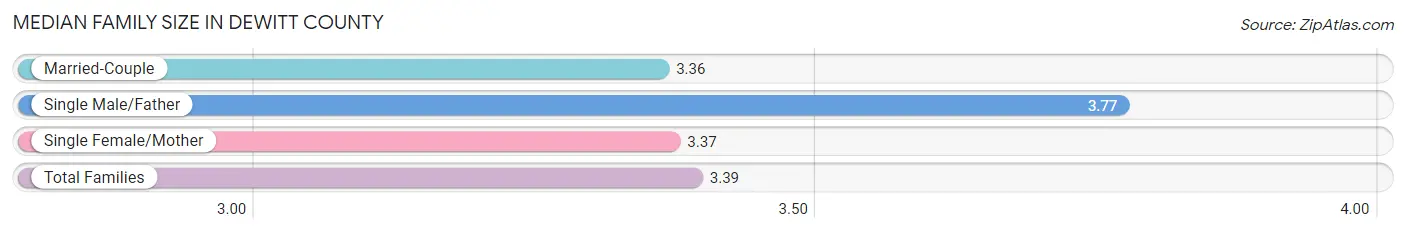
The median family size in DeWitt County is 3.39 persons per family, with single male/father families (259 | 5.9%) accounting for the largest median family size of 3.77 persons per family. On the other hand, married-couple families (3,330 | 75.9%) represent the smallest median family size with 3.36 persons per family.
| Family Type | # Families | Family Size |
| Married-Couple | 3,330 (75.9%) | 3.36 |
| Single Male/Father | 259 (5.9%) | 3.77 |
| Single Female/Mother | 796 (18.1%) | 3.37 |
| Total Families | 4,385 (100.0%) | 3.39 |
Median Household Size in DeWitt County
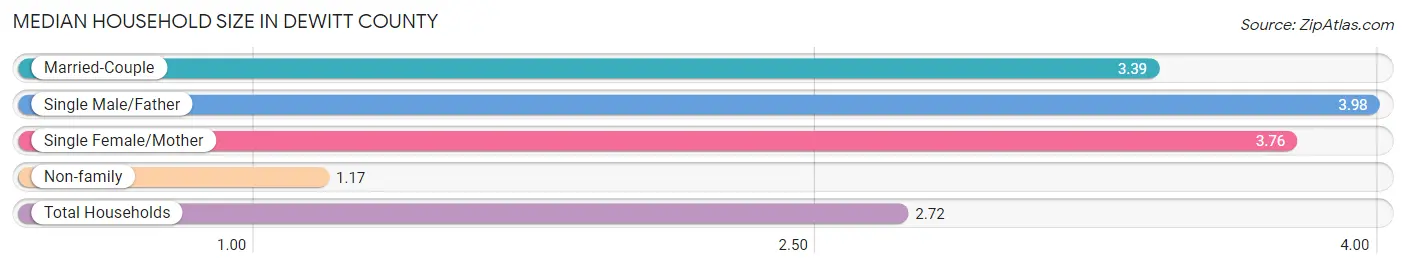
The median household size in DeWitt County is 2.72 persons per household, with single male/father households (259 | 3.9%) accounting for the largest median household size of 3.98 persons per household. non-family households (2,201 | 33.4%) represent the smallest median household size with 1.17 persons per household.
| Household Type | # Households | Household Size |
| Married-Couple | 3,330 (50.6%) | 3.39 |
| Single Male/Father | 259 (3.9%) | 3.98 |
| Single Female/Mother | 796 (12.1%) | 3.76 |
| Non-family | 2,201 (33.4%) | 1.17 |
| Total Households | 6,586 (100.0%) | 2.72 |
Household Size by Marriage Status in DeWitt County
Out of a total of 6,586 households in DeWitt County, 4,385 (66.6%) are family households, while 2,201 (33.4%) are nonfamily households. The most numerous type of family households are 2-person households, comprising 2,100, and the most common type of nonfamily households are 1-person households, comprising 1,996.
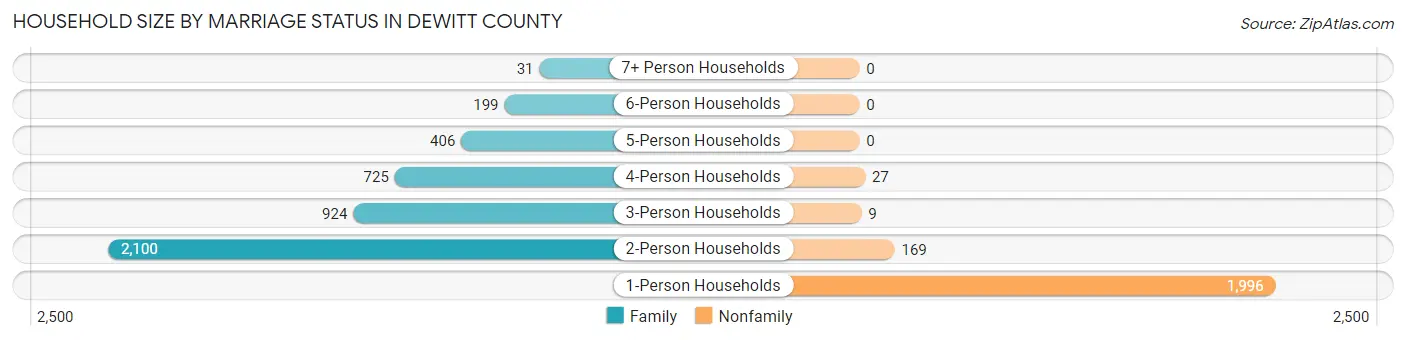
| Household Size | Family Households | Nonfamily Households |
| 1-Person Households | - | 1,996 (30.3%) |
| 2-Person Households | 2,100 (31.9%) | 169 (2.6%) |
| 3-Person Households | 924 (14.0%) | 9 (0.1%) |
| 4-Person Households | 725 (11.0%) | 27 (0.4%) |
| 5-Person Households | 406 (6.2%) | 0 (0.0%) |
| 6-Person Households | 199 (3.0%) | 0 (0.0%) |
| 7+ Person Households | 31 (0.5%) | 0 (0.0%) |
| Total | 4,385 (66.6%) | 2,201 (33.4%) |
Female Fertility in DeWitt County
Fertility by Age in DeWitt County
Average fertility rate in DeWitt County is 54.0 births per 1,000 women. Women in the age bracket of 20 to 34 years have the highest fertility rate with 111.0 births per 1,000 women. Women in the age bracket of 20 to 34 years acount for 78.4% of all women with births.
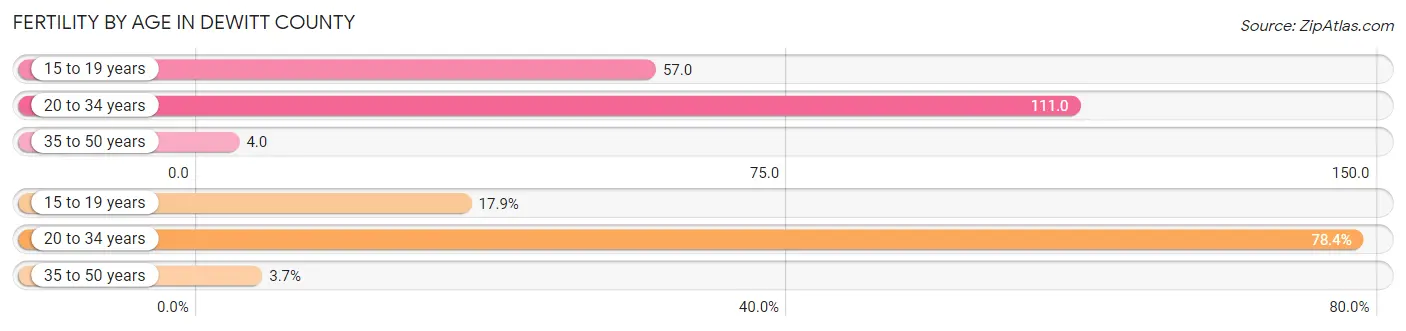
| Age Bracket | Women with Births | Births / 1,000 Women |
| 15 to 19 years | 34 (17.9%) | 57.0 |
| 20 to 34 years | 149 (78.4%) | 111.0 |
| 35 to 50 years | 7 (3.7%) | 4.0 |
| Total | 190 (100.0%) | 54.0 |
Fertility by Age by Marriage Status in DeWitt County
93.7% of women with births (190) in DeWitt County are married. The highest percentage of unmarried women with births falls into 15 to 19 years age bracket with 35.3% of them unmarried at the time of birth, while the lowest percentage of unmarried women with births belong to 20 to 34 years age bracket with 0.0% of them unmarried.
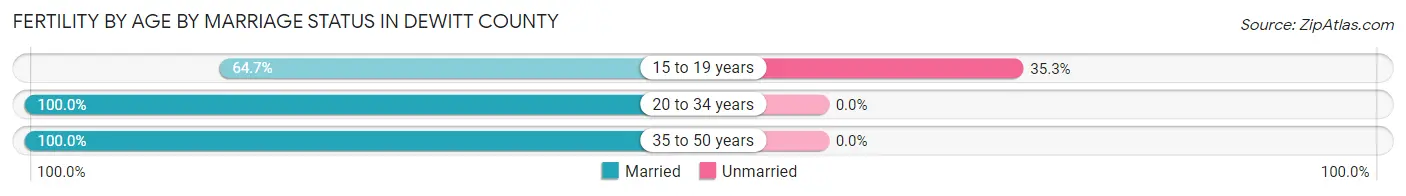
| Age Bracket | Married | Unmarried |
| 15 to 19 years | 22 (64.7%) | 12 (35.3%) |
| 20 to 34 years | 149 (100.0%) | 0 (0.0%) |
| 35 to 50 years | 7 (100.0%) | 0 (0.0%) |
| Total | 178 (93.7%) | 12 (6.3%) |
Fertility by Education in DeWitt County
Average fertility rate in DeWitt County is 54.0 births per 1,000 women. Women with the education attainment of graduate degree have the highest fertility rate of 352.0 births per 1,000 women, while women with the education attainment of college or associate's degree have the lowest fertility at 11.0 births per 1,000 women. Women with the education attainment of high school diploma represent 48.4% of all women with births.
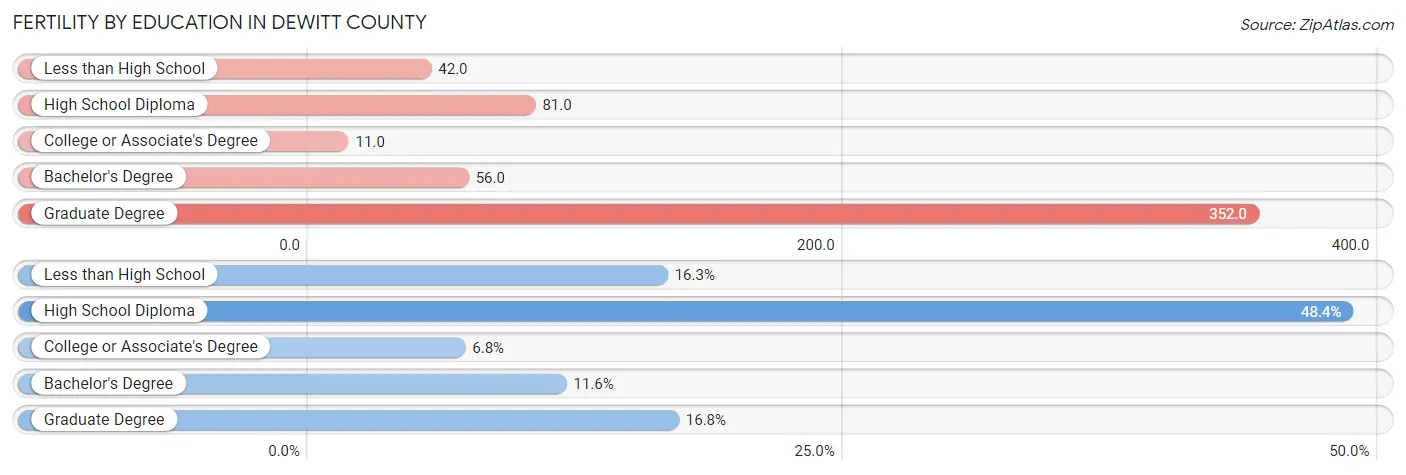
| Educational Attainment | Women with Births | Births / 1,000 Women |
| Less than High School | 31 (16.3%) | 42.0 |
| High School Diploma | 92 (48.4%) | 81.0 |
| College or Associate's Degree | 13 (6.8%) | 11.0 |
| Bachelor's Degree | 22 (11.6%) | 56.0 |
| Graduate Degree | 32 (16.8%) | 352.0 |
| Total | 190 (100.0%) | 54.0 |
Fertility by Education by Marriage Status in DeWitt County
6.3% of women with births in DeWitt County are unmarried. Women with the educational attainment of high school diploma are most likely to be married with 100.0% of them married at childbirth, while women with the educational attainment of less than high school are least likely to be married with 38.7% of them unmarried at childbirth.
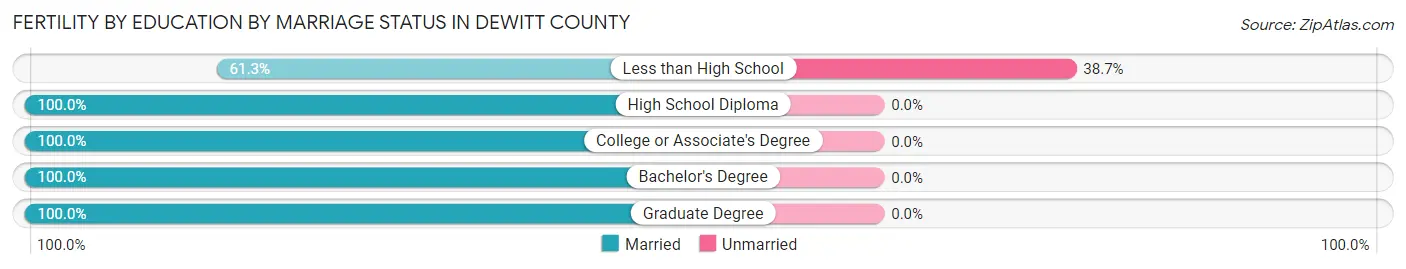
| Educational Attainment | Married | Unmarried |
| Less than High School | 19 (61.3%) | 12 (38.7%) |
| High School Diploma | 92 (100.0%) | 0 (0.0%) |
| College or Associate's Degree | 13 (100.0%) | 0 (0.0%) |
| Bachelor's Degree | 22 (100.0%) | 0 (0.0%) |
| Graduate Degree | 32 (100.0%) | 0 (0.0%) |
| Total | 178 (93.7%) | 12 (6.3%) |
Employment Characteristics in DeWitt County
Employment by Class of Employer in DeWitt County
Among the 7,490 employed individuals in DeWitt County, private company employees (5,158 | 68.9%), local government employees (949 | 12.7%), and not-for-profit organizations (394 | 5.3%) make up the most common classes of employment.
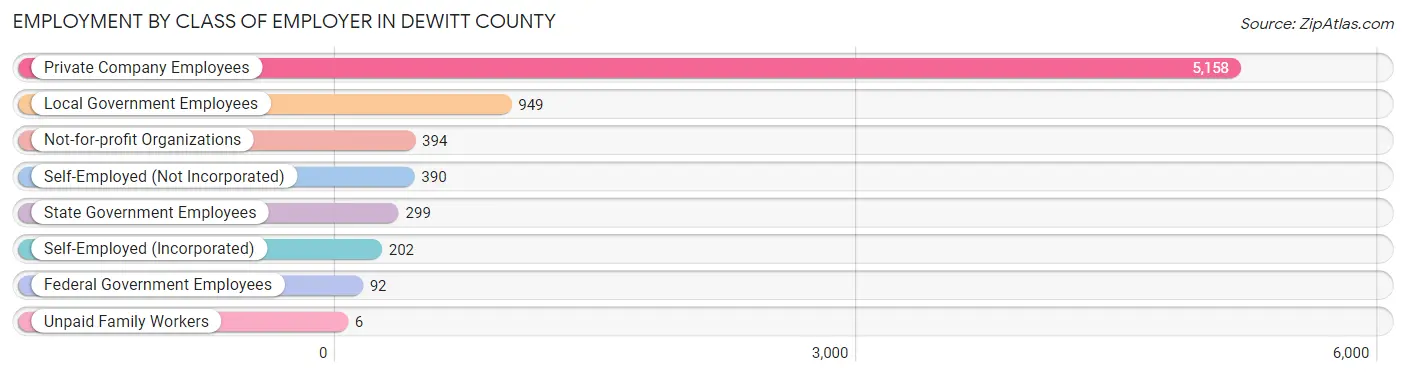
| Employer Class | # Employees | % Employees |
| Private Company Employees | 5,158 | 68.9% |
| Self-Employed (Incorporated) | 202 | 2.7% |
| Self-Employed (Not Incorporated) | 390 | 5.2% |
| Not-for-profit Organizations | 394 | 5.3% |
| Local Government Employees | 949 | 12.7% |
| State Government Employees | 299 | 4.0% |
| Federal Government Employees | 92 | 1.2% |
| Unpaid Family Workers | 6 | 0.1% |
| Total | 7,490 | 100.0% |
Employment Status by Age in DeWitt County
According to the labor force statistics for DeWitt County, out of the total population over 16 years of age (15,849), 50.2% or 7,956 individuals are in the labor force, with 5.2% or 414 of them unemployed. The age group with the highest labor force participation rate is 20 to 24 years, with 83.2% or 902 individuals in the labor force. Within the labor force, the 16 to 19 years age range has the highest percentage of unemployed individuals, with 20.7% or 47 of them being unemployed.
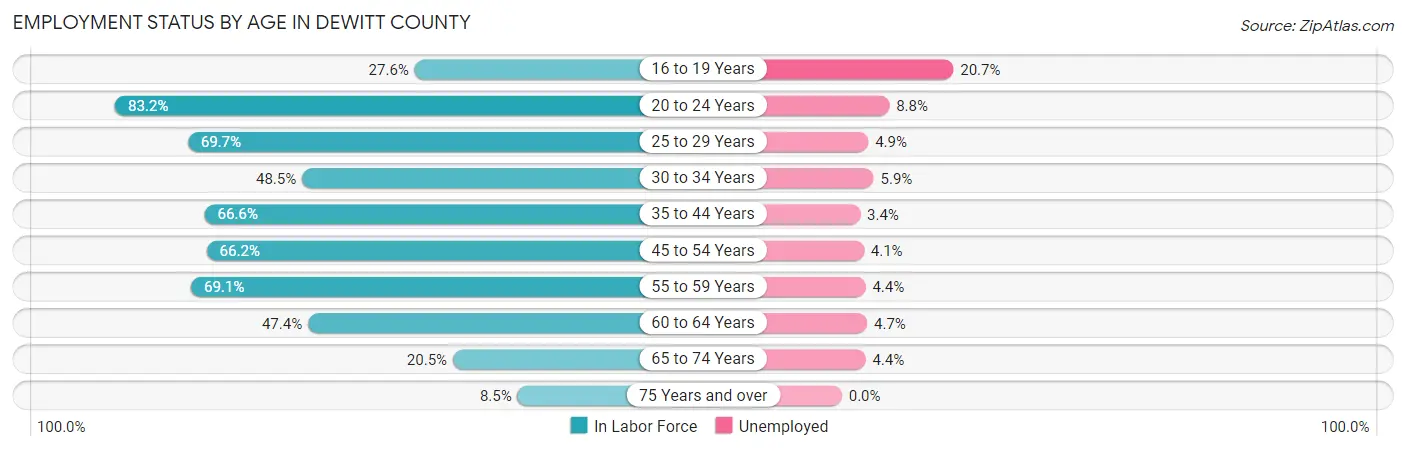
| Age Bracket | In Labor Force | Unemployed |
| 16 to 19 Years | 227 (27.6%) | 47 (20.7%) |
| 20 to 24 Years | 902 (83.2%) | 79 (8.8%) |
| 25 to 29 Years | 717 (69.7%) | 35 (4.9%) |
| 30 to 34 Years | 615 (48.5%) | 36 (5.9%) |
| 35 to 44 Years | 1,737 (66.6%) | 59 (3.4%) |
| 45 to 54 Years | 1,600 (66.2%) | 66 (4.1%) |
| 55 to 59 Years | 865 (69.1%) | 38 (4.4%) |
| 60 to 64 Years | 704 (47.4%) | 33 (4.7%) |
| 65 to 74 Years | 451 (20.5%) | 20 (4.4%) |
| 75 Years and over | 143 (8.5%) | 0 (0.0%) |
| Total | 7,956 (50.2%) | 414 (5.2%) |
Employment Status by Educational Attainment in DeWitt County
According to labor force statistics for DeWitt County, 62.0% of individuals (6,237) out of the total population between 25 and 64 years of age (10,059) are in the labor force, with 4.3% or 268 of them being unemployed. The group with the highest labor force participation rate are those with the educational attainment of bachelor's degree or higher, with 79.3% or 1,135 individuals in the labor force. Within the labor force, individuals with less than high school education have the highest percentage of unemployment, with 11.5% or 68 of them being unemployed.
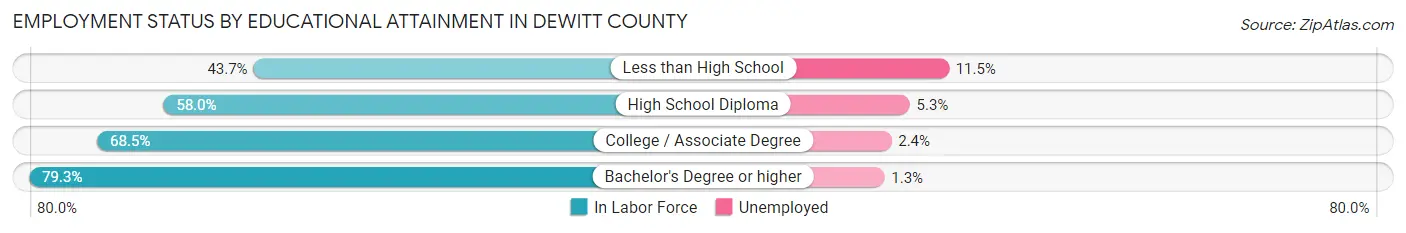
| Educational Attainment | In Labor Force | Unemployed |
| Less than High School | 593 (43.7%) | 156 (11.5%) |
| High School Diploma | 2,604 (58.0%) | 238 (5.3%) |
| College / Associate Degree | 1,905 (68.5%) | 67 (2.4%) |
| Bachelor's Degree or higher | 1,135 (79.3%) | 19 (1.3%) |
| Total | 6,237 (62.0%) | 433 (4.3%) |
Employment Occupations by Sex in DeWitt County
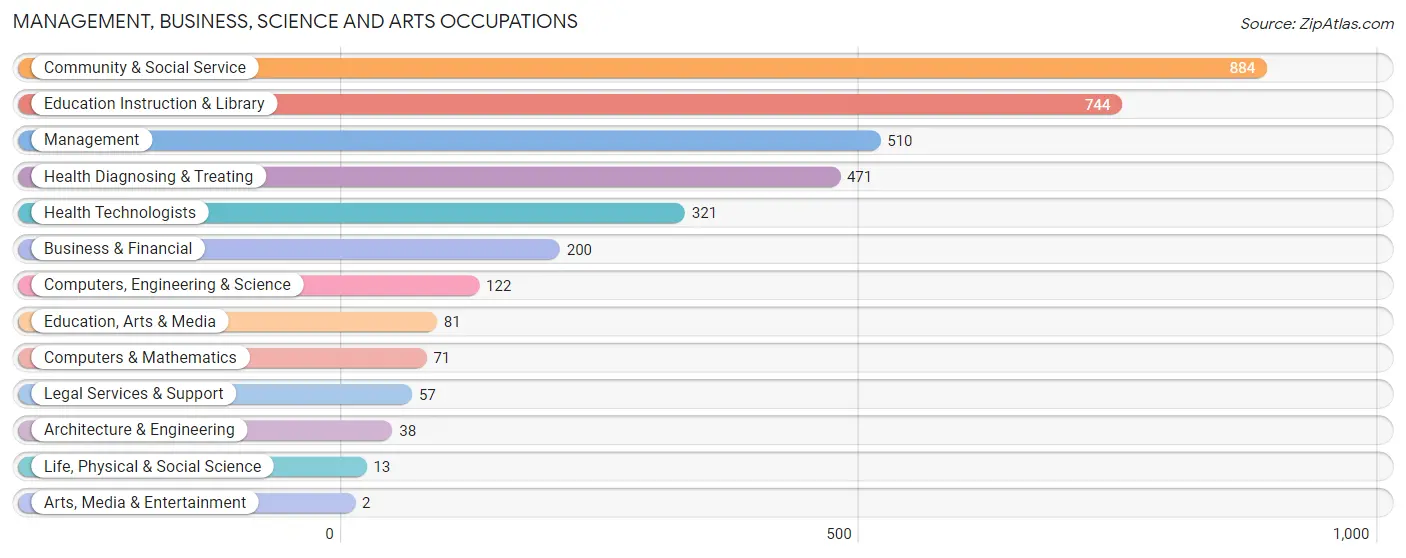
Management, Business, Science and Arts Occupations
The most common Management, Business, Science and Arts occupations in DeWitt County are Community & Social Service (884 | 11.7%), Education Instruction & Library (744 | 9.9%), Management (510 | 6.8%), Health Diagnosing & Treating (471 | 6.2%), and Health Technologists (321 | 4.3%).
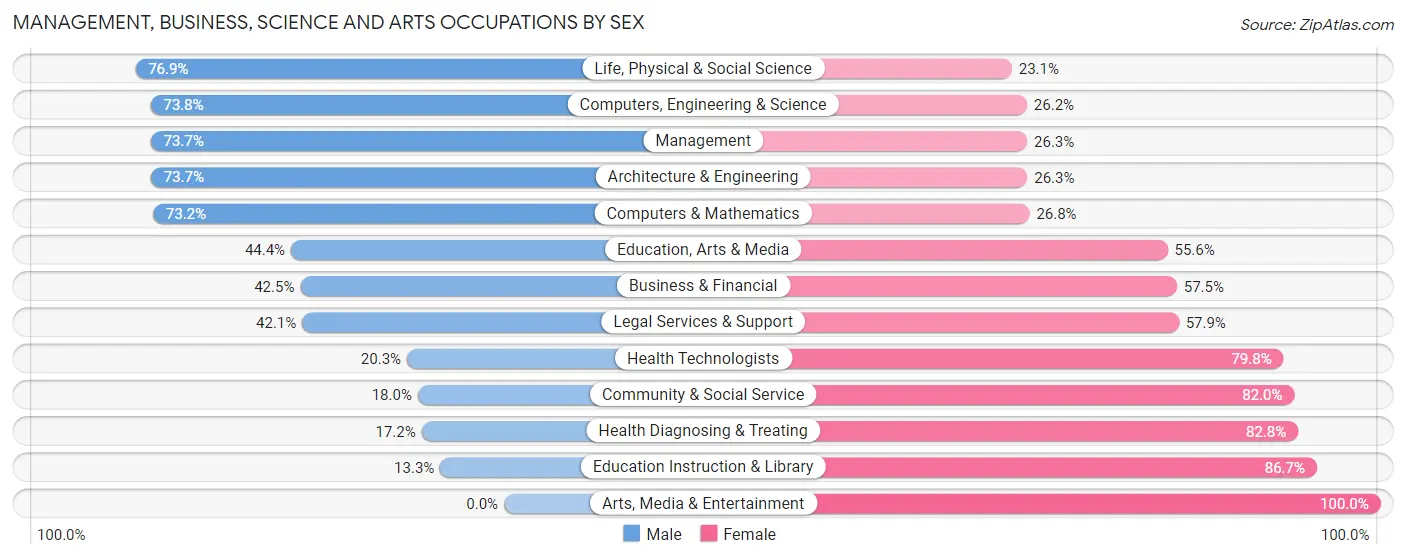
Management, Business, Science and Arts Occupations by Sex
Within the Management, Business, Science and Arts occupations in DeWitt County, the most male-oriented occupations are Life, Physical & Social Science (76.9%), Computers, Engineering & Science (73.8%), and Management (73.7%), while the most female-oriented occupations are Arts, Media & Entertainment (100.0%), Education Instruction & Library (86.7%), and Health Diagnosing & Treating (82.8%).
| Occupation | Male | Female |
| Management | 376 (73.7%) | 134 (26.3%) |
| Business & Financial | 85 (42.5%) | 115 (57.5%) |
| Computers, Engineering & Science | 90 (73.8%) | 32 (26.2%) |
| Computers & Mathematics | 52 (73.2%) | 19 (26.8%) |
| Architecture & Engineering | 28 (73.7%) | 10 (26.3%) |
| Life, Physical & Social Science | 10 (76.9%) | 3 (23.1%) |
| Community & Social Service | 159 (18.0%) | 725 (82.0%) |
| Education, Arts & Media | 36 (44.4%) | 45 (55.6%) |
| Legal Services & Support | 24 (42.1%) | 33 (57.9%) |
| Education Instruction & Library | 99 (13.3%) | 645 (86.7%) |
| Arts, Media & Entertainment | 0 (0.0%) | 2 (100.0%) |
| Health Diagnosing & Treating | 81 (17.2%) | 390 (82.8%) |
| Health Technologists | 65 (20.3%) | 256 (79.7%) |
| Total (Category) | 791 (36.2%) | 1,396 (63.8%) |
| Total (Overall) | 3,960 (52.5%) | 3,579 (47.5%) |
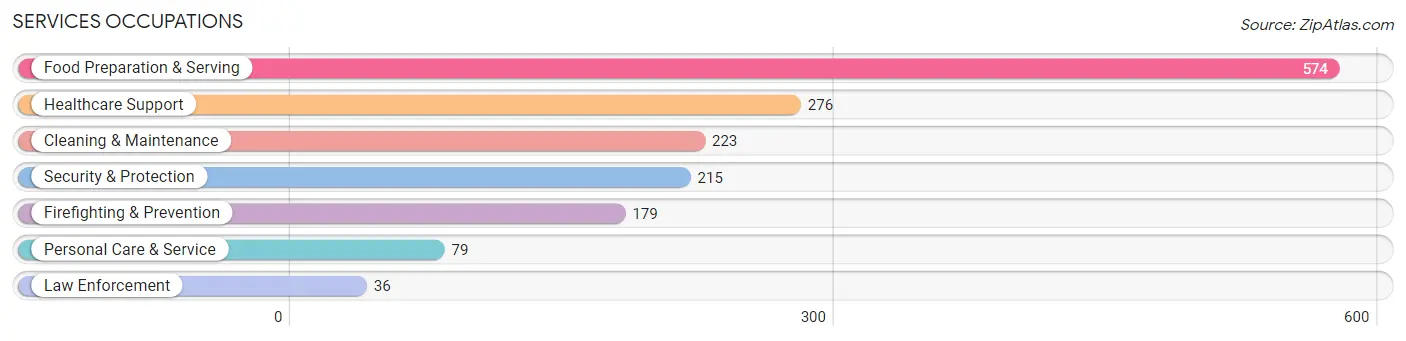
Services Occupations
The most common Services occupations in DeWitt County are Food Preparation & Serving (574 | 7.6%), Healthcare Support (276 | 3.7%), Cleaning & Maintenance (223 | 3.0%), Security & Protection (215 | 2.9%), and Firefighting & Prevention (179 | 2.4%).
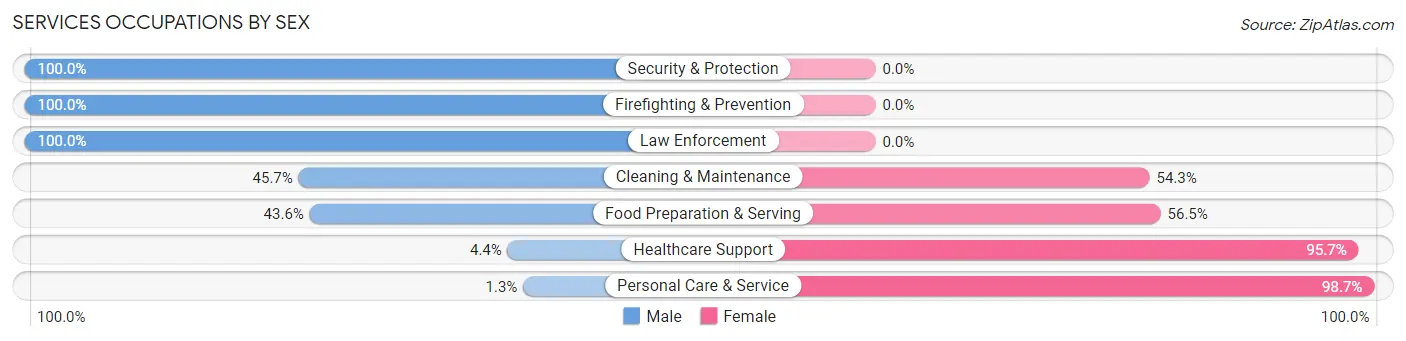
Services Occupations by Sex
Within the Services occupations in DeWitt County, the most male-oriented occupations are Security & Protection (100.0%), Firefighting & Prevention (100.0%), and Law Enforcement (100.0%), while the most female-oriented occupations are Personal Care & Service (98.7%), Healthcare Support (95.7%), and Food Preparation & Serving (56.5%).
| Occupation | Male | Female |
| Healthcare Support | 12 (4.3%) | 264 (95.7%) |
| Security & Protection | 215 (100.0%) | 0 (0.0%) |
| Firefighting & Prevention | 179 (100.0%) | 0 (0.0%) |
| Law Enforcement | 36 (100.0%) | 0 (0.0%) |
| Food Preparation & Serving | 250 (43.5%) | 324 (56.5%) |
| Cleaning & Maintenance | 102 (45.7%) | 121 (54.3%) |
| Personal Care & Service | 1 (1.3%) | 78 (98.7%) |
| Total (Category) | 580 (42.4%) | 787 (57.6%) |
| Total (Overall) | 3,960 (52.5%) | 3,579 (47.5%) |
Sales and Office Occupations
The most common Sales and Office occupations in DeWitt County are Office & Administration (948 | 12.6%), and Sales & Related (686 | 9.1%).
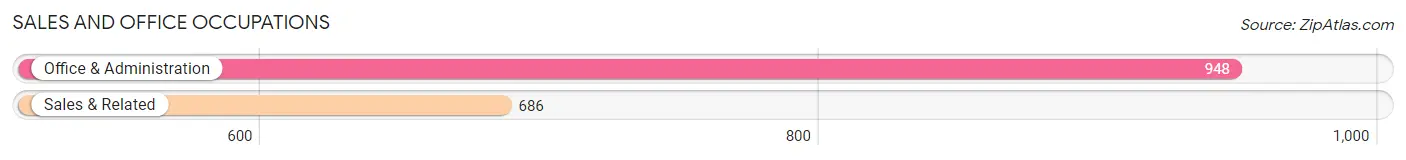
Sales and Office Occupations by Sex
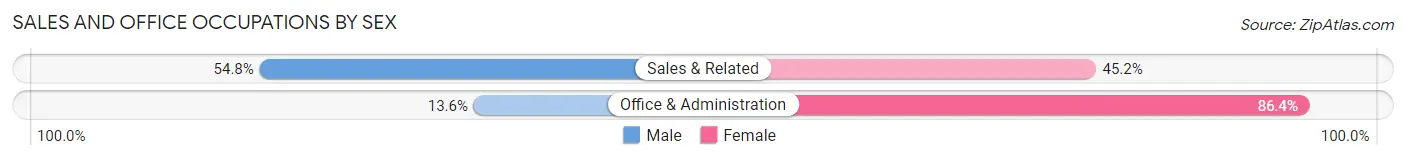
| Occupation | Male | Female |
| Sales & Related | 376 (54.8%) | 310 (45.2%) |
| Office & Administration | 129 (13.6%) | 819 (86.4%) |
| Total (Category) | 505 (30.9%) | 1,129 (69.1%) |
| Total (Overall) | 3,960 (52.5%) | 3,579 (47.5%) |
Natural Resources, Construction and Maintenance Occupations
The most common Natural Resources, Construction and Maintenance occupations in DeWitt County are Construction & Extraction (671 | 8.9%), Installation, Maintenance & Repair (293 | 3.9%), and Farming, Fishing & Forestry (51 | 0.7%).
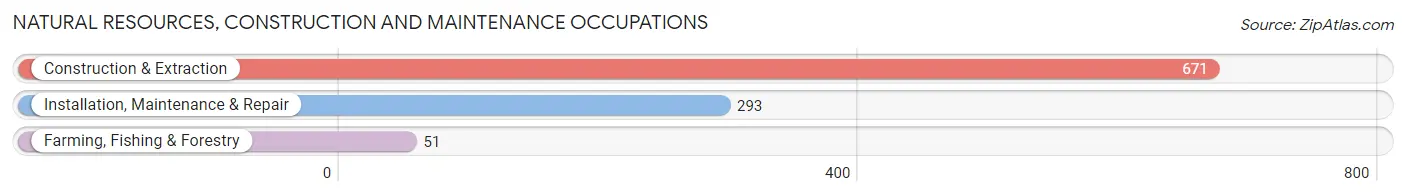
Natural Resources, Construction and Maintenance Occupations by Sex
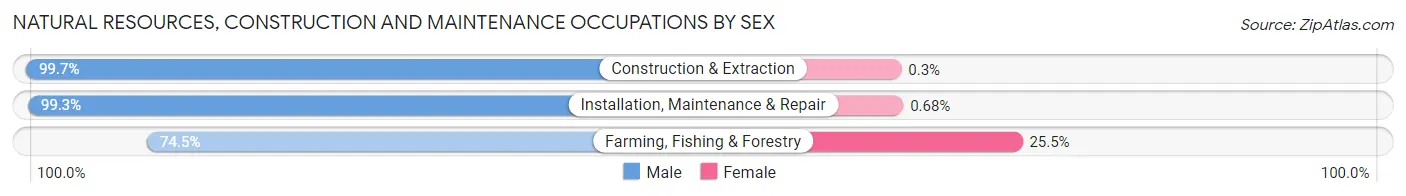
| Occupation | Male | Female |
| Farming, Fishing & Forestry | 38 (74.5%) | 13 (25.5%) |
| Construction & Extraction | 669 (99.7%) | 2 (0.3%) |
| Installation, Maintenance & Repair | 291 (99.3%) | 2 (0.7%) |
| Total (Category) | 998 (98.3%) | 17 (1.7%) |
| Total (Overall) | 3,960 (52.5%) | 3,579 (47.5%) |
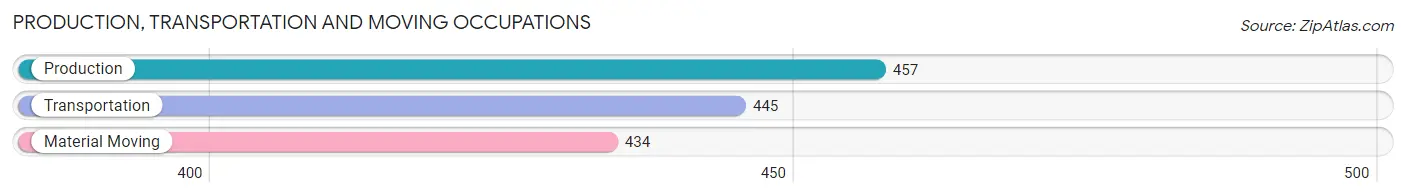
Production, Transportation and Moving Occupations
The most common Production, Transportation and Moving occupations in DeWitt County are Production (457 | 6.1%), Transportation (445 | 5.9%), and Material Moving (434 | 5.8%).
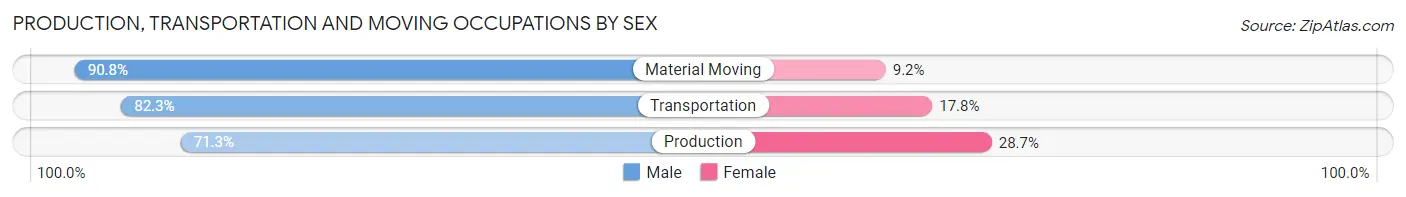
Production, Transportation and Moving Occupations by Sex
| Occupation | Male | Female |
| Production | 326 (71.3%) | 131 (28.7%) |
| Transportation | 366 (82.3%) | 79 (17.7%) |
| Material Moving | 394 (90.8%) | 40 (9.2%) |
| Total (Category) | 1,086 (81.3%) | 250 (18.7%) |
| Total (Overall) | 3,960 (52.5%) | 3,579 (47.5%) |
Employment Industries by Sex in DeWitt County
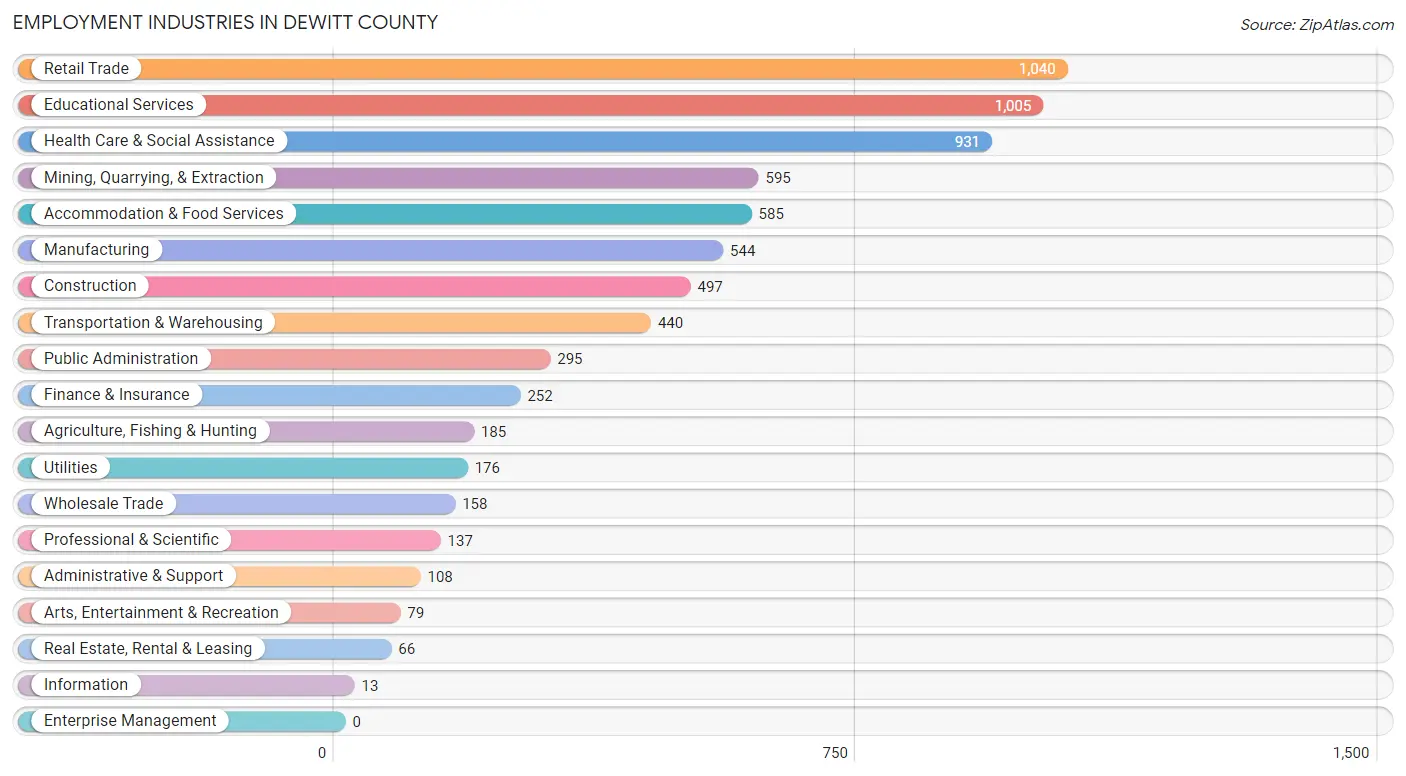
Employment Industries in DeWitt County
The major employment industries in DeWitt County include Retail Trade (1,040 | 13.8%), Educational Services (1,005 | 13.3%), Health Care & Social Assistance (931 | 12.3%), Mining, Quarrying, & Extraction (595 | 7.9%), and Accommodation & Food Services (585 | 7.8%).
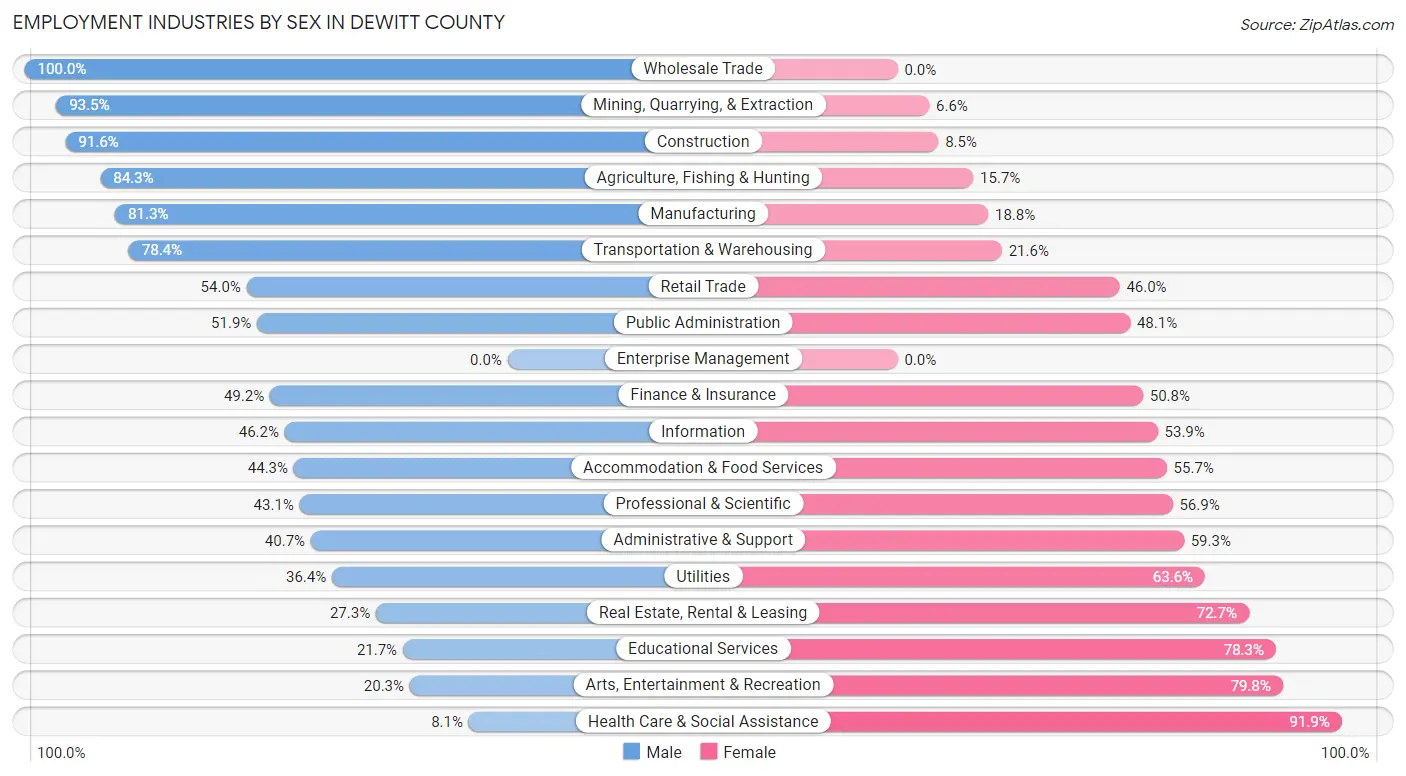
Employment Industries by Sex in DeWitt County
The DeWitt County industries that see more men than women are Wholesale Trade (100.0%), Mining, Quarrying, & Extraction (93.4%), and Construction (91.5%), whereas the industries that tend to have a higher number of women are Health Care & Social Assistance (91.9%), Arts, Entertainment & Recreation (79.7%), and Educational Services (78.3%).
| Industry | Male | Female |
| Agriculture, Fishing & Hunting | 156 (84.3%) | 29 (15.7%) |
| Mining, Quarrying, & Extraction | 556 (93.4%) | 39 (6.6%) |
| Construction | 455 (91.5%) | 42 (8.5%) |
| Manufacturing | 442 (81.2%) | 102 (18.8%) |
| Wholesale Trade | 158 (100.0%) | 0 (0.0%) |
| Retail Trade | 562 (54.0%) | 478 (46.0%) |
| Transportation & Warehousing | 345 (78.4%) | 95 (21.6%) |
| Utilities | 64 (36.4%) | 112 (63.6%) |
| Information | 6 (46.2%) | 7 (53.8%) |
| Finance & Insurance | 124 (49.2%) | 128 (50.8%) |
| Real Estate, Rental & Leasing | 18 (27.3%) | 48 (72.7%) |
| Professional & Scientific | 59 (43.1%) | 78 (56.9%) |
| Enterprise Management | 0 (0.0%) | 0 (0.0%) |
| Administrative & Support | 44 (40.7%) | 64 (59.3%) |
| Educational Services | 218 (21.7%) | 787 (78.3%) |
| Health Care & Social Assistance | 75 (8.1%) | 856 (91.9%) |
| Arts, Entertainment & Recreation | 16 (20.3%) | 63 (79.7%) |
| Accommodation & Food Services | 259 (44.3%) | 326 (55.7%) |
| Public Administration | 153 (51.9%) | 142 (48.1%) |
| Total | 3,960 (52.5%) | 3,579 (47.5%) |
Education in DeWitt County
School Enrollment in DeWitt County
The most common levels of schooling among the 4,007 students in DeWitt County are middle school (995 | 24.8%), elementary school (925 | 23.1%), and high school (844 | 21.1%).
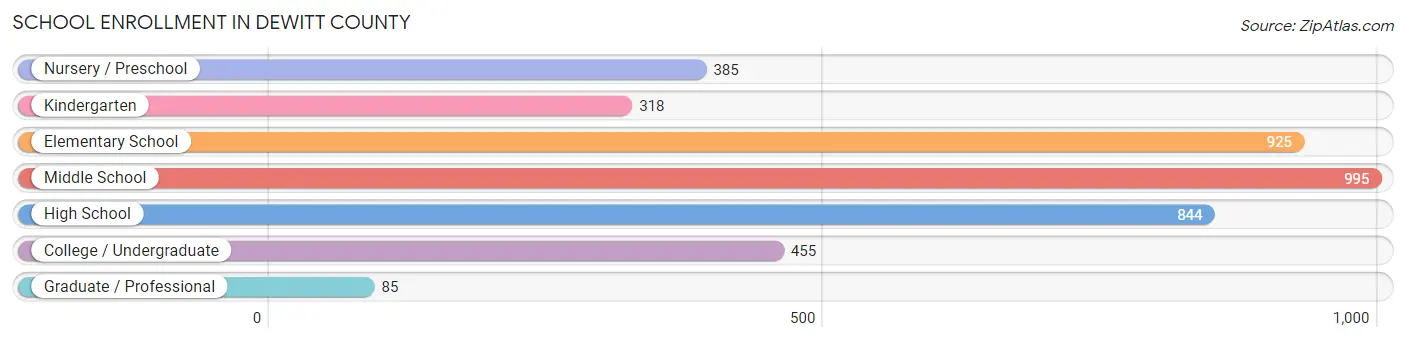
| School Level | # Students | % Students |
| Nursery / Preschool | 385 | 9.6% |
| Kindergarten | 318 | 7.9% |
| Elementary School | 925 | 23.1% |
| Middle School | 995 | 24.8% |
| High School | 844 | 21.1% |
| College / Undergraduate | 455 | 11.4% |
| Graduate / Professional | 85 | 2.1% |
| Total | 4,007 | 100.0% |
School Enrollment by Age by Funding Source in DeWitt County
Out of a total of 4,007 students who are enrolled in schools in DeWitt County, 309 (7.7%) attend a private institution, while the remaining 3,698 (92.3%) are enrolled in public schools. The age group of 3 to 4 year olds has the highest likelihood of being enrolled in private schools, with 86 (39.5% in the age bracket) enrolled. Conversely, the age group of 20 to 24 year olds has the lowest likelihood of being enrolled in a private school, with 139 (100.0% in the age bracket) attending a public institution.
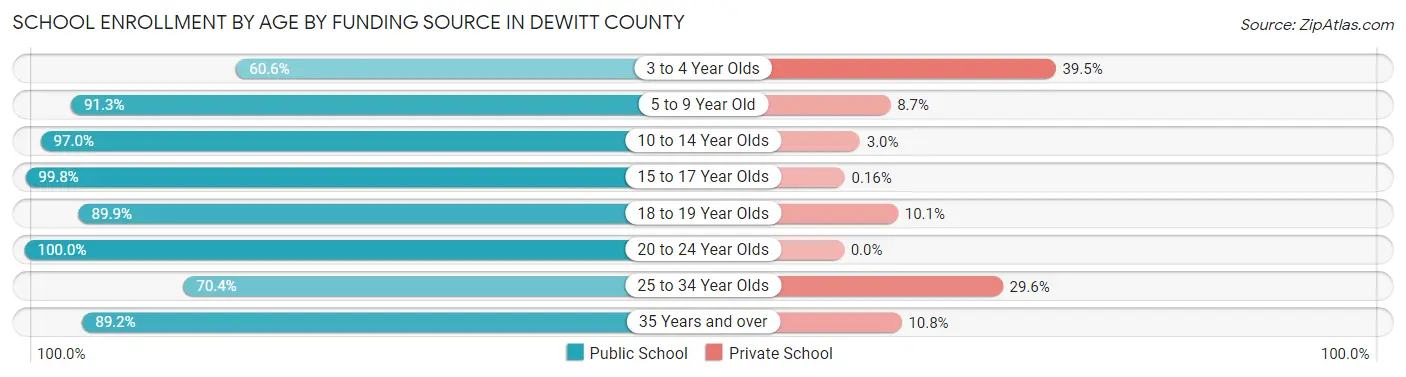
| Age Bracket | Public School | Private School |
| 3 to 4 Year Olds | 132 (60.6%) | 86 (39.5%) |
| 5 to 9 Year Old | 1,117 (91.3%) | 106 (8.7%) |
| 10 to 14 Year Olds | 1,197 (97.0%) | 37 (3.0%) |
| 15 to 17 Year Olds | 623 (99.8%) | 1 (0.2%) |
| 18 to 19 Year Olds | 223 (89.9%) | 25 (10.1%) |
| 20 to 24 Year Olds | 139 (100.0%) | 0 (0.0%) |
| 25 to 34 Year Olds | 69 (70.4%) | 29 (29.6%) |
| 35 Years and over | 199 (89.2%) | 24 (10.8%) |
| Total | 3,698 (92.3%) | 309 (7.7%) |
Educational Attainment by Field of Study in DeWitt County
Education (535 | 26.2%), business (319 | 15.6%), science & technology (191 | 9.3%), arts & humanities (159 | 7.8%), and bio, nature & agricultural (135 | 6.6%) are the most common fields of study among 2,042 individuals in DeWitt County who have obtained a bachelor's degree or higher.
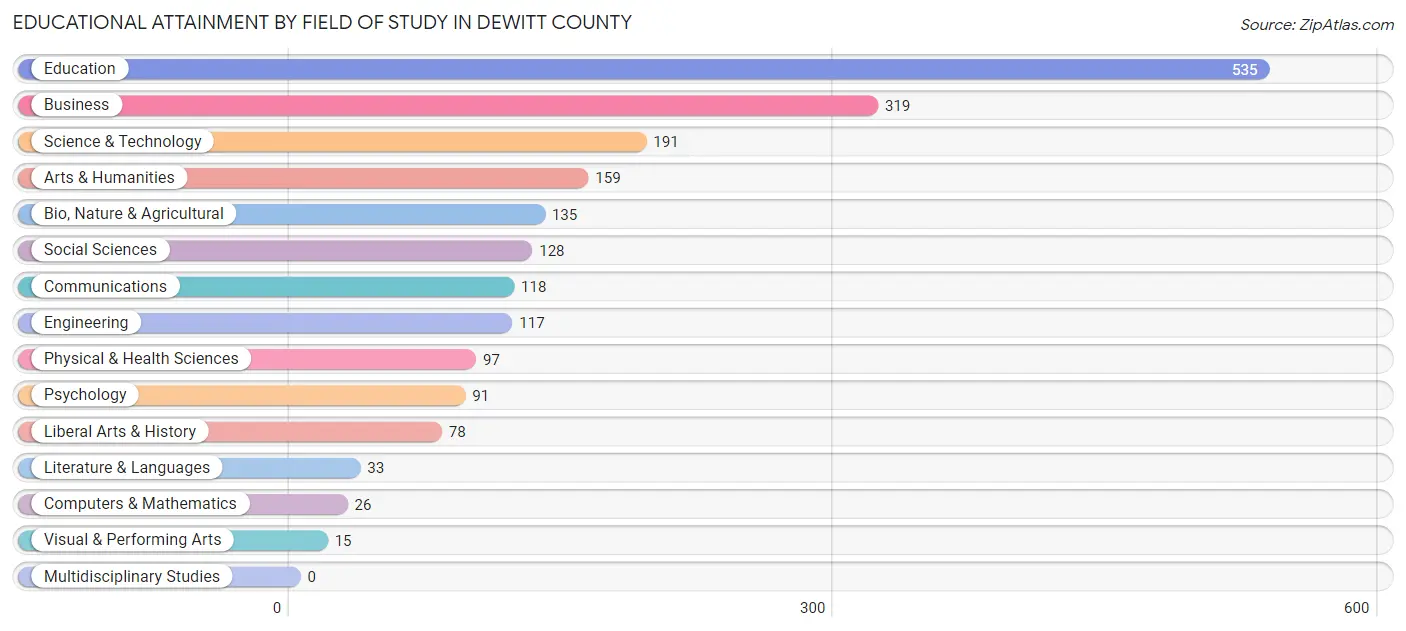
| Field of Study | # Graduates | % Graduates |
| Computers & Mathematics | 26 | 1.3% |
| Bio, Nature & Agricultural | 135 | 6.6% |
| Physical & Health Sciences | 97 | 4.8% |
| Psychology | 91 | 4.5% |
| Social Sciences | 128 | 6.3% |
| Engineering | 117 | 5.7% |
| Multidisciplinary Studies | 0 | 0.0% |
| Science & Technology | 191 | 9.3% |
| Business | 319 | 15.6% |
| Education | 535 | 26.2% |
| Literature & Languages | 33 | 1.6% |
| Liberal Arts & History | 78 | 3.8% |
| Visual & Performing Arts | 15 | 0.7% |
| Communications | 118 | 5.8% |
| Arts & Humanities | 159 | 7.8% |
| Total | 2,042 | 100.0% |
Transportation & Commute in DeWitt County
Vehicle Availability by Sex in DeWitt County
The most prevalent vehicle ownership categories in DeWitt County are males with 2 vehicles (1,617, accounting for 41.2%) and females with 2 vehicles (1,421, making up 45.5%).
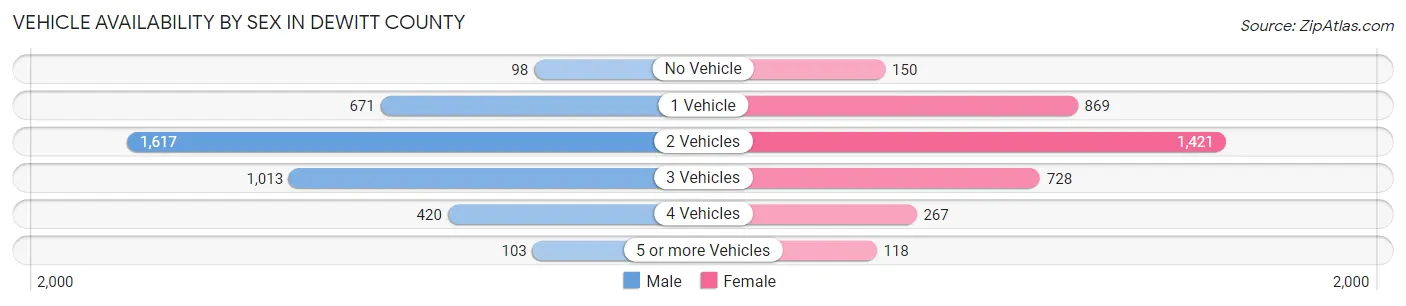
| Vehicles Available | Male | Female |
| No Vehicle | 98 (2.5%) | 150 (4.2%) |
| 1 Vehicle | 671 (17.1%) | 869 (24.5%) |
| 2 Vehicles | 1,617 (41.2%) | 1,421 (40.0%) |
| 3 Vehicles | 1,013 (25.8%) | 728 (20.5%) |
| 4 Vehicles | 420 (10.7%) | 267 (7.5%) |
| 5 or more Vehicles | 103 (2.6%) | 118 (3.3%) |
| Total | 3,922 (100.0%) | 3,553 (100.0%) |
Commute Time in DeWitt County
The most frequently occuring commute durations in DeWitt County are 5 to 9 minutes (1,710 commuters, 23.8%), 10 to 14 minutes (973 commuters, 13.5%), and 15 to 19 minutes (932 commuters, 13.0%).
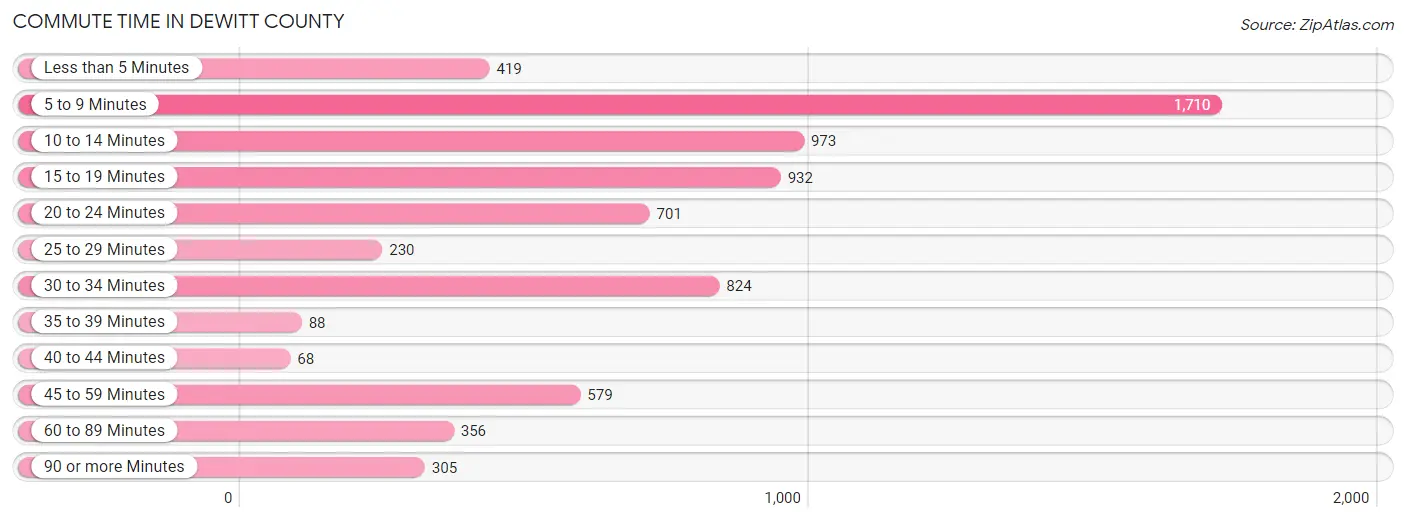
| Commute Time | # Commuters | % Commuters |
| Less than 5 Minutes | 419 | 5.8% |
| 5 to 9 Minutes | 1,710 | 23.8% |
| 10 to 14 Minutes | 973 | 13.5% |
| 15 to 19 Minutes | 932 | 13.0% |
| 20 to 24 Minutes | 701 | 9.8% |
| 25 to 29 Minutes | 230 | 3.2% |
| 30 to 34 Minutes | 824 | 11.5% |
| 35 to 39 Minutes | 88 | 1.2% |
| 40 to 44 Minutes | 68 | 0.9% |
| 45 to 59 Minutes | 579 | 8.1% |
| 60 to 89 Minutes | 356 | 5.0% |
| 90 or more Minutes | 305 | 4.2% |
Commute Time by Sex in DeWitt County
The most common commute times in DeWitt County are 5 to 9 minutes (834 commuters, 22.0%) for males and 5 to 9 minutes (876 commuters, 25.8%) for females.
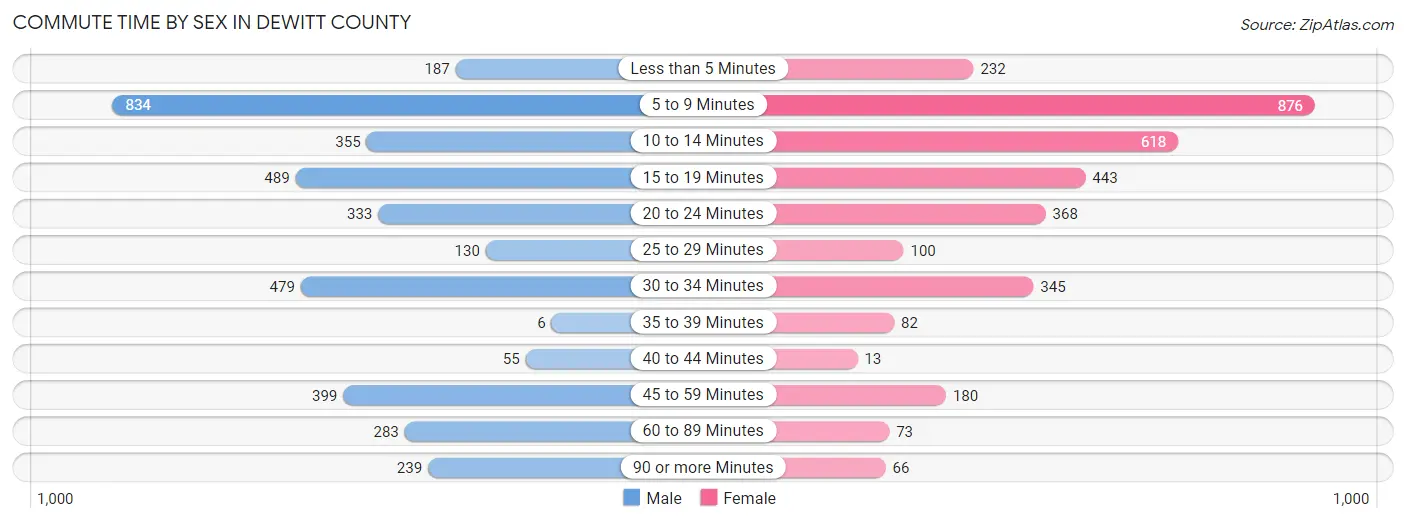
| Commute Time | Male | Female |
| Less than 5 Minutes | 187 (4.9%) | 232 (6.8%) |
| 5 to 9 Minutes | 834 (22.0%) | 876 (25.8%) |
| 10 to 14 Minutes | 355 (9.4%) | 618 (18.2%) |
| 15 to 19 Minutes | 489 (12.9%) | 443 (13.0%) |
| 20 to 24 Minutes | 333 (8.8%) | 368 (10.8%) |
| 25 to 29 Minutes | 130 (3.4%) | 100 (2.9%) |
| 30 to 34 Minutes | 479 (12.6%) | 345 (10.2%) |
| 35 to 39 Minutes | 6 (0.2%) | 82 (2.4%) |
| 40 to 44 Minutes | 55 (1.5%) | 13 (0.4%) |
| 45 to 59 Minutes | 399 (10.5%) | 180 (5.3%) |
| 60 to 89 Minutes | 283 (7.5%) | 73 (2.1%) |
| 90 or more Minutes | 239 (6.3%) | 66 (1.9%) |
Time of Departure to Work by Sex in DeWitt County
The most frequent times of departure to work in DeWitt County are 7:00 AM to 7:29 AM (634, 16.7%) for males and 7:30 AM to 7:59 AM (876, 25.8%) for females.
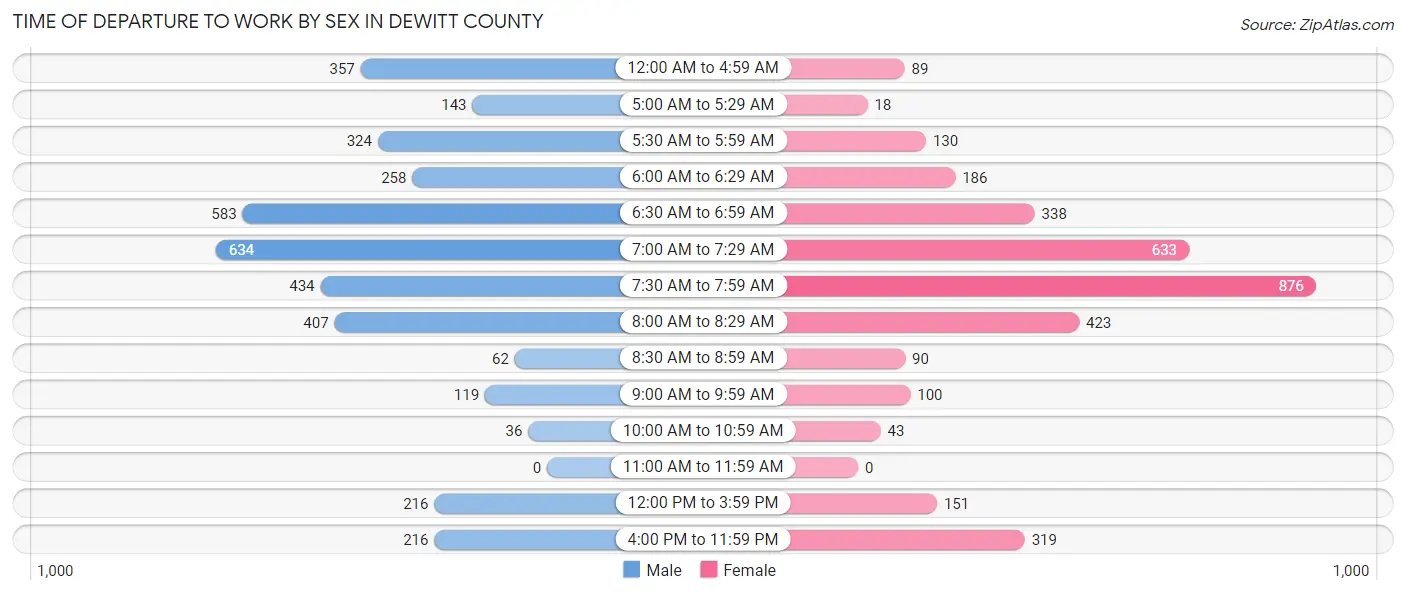
| Time of Departure | Male | Female |
| 12:00 AM to 4:59 AM | 357 (9.4%) | 89 (2.6%) |
| 5:00 AM to 5:29 AM | 143 (3.8%) | 18 (0.5%) |
| 5:30 AM to 5:59 AM | 324 (8.6%) | 130 (3.8%) |
| 6:00 AM to 6:29 AM | 258 (6.8%) | 186 (5.5%) |
| 6:30 AM to 6:59 AM | 583 (15.4%) | 338 (10.0%) |
| 7:00 AM to 7:29 AM | 634 (16.7%) | 633 (18.6%) |
| 7:30 AM to 7:59 AM | 434 (11.5%) | 876 (25.8%) |
| 8:00 AM to 8:29 AM | 407 (10.7%) | 423 (12.5%) |
| 8:30 AM to 8:59 AM | 62 (1.6%) | 90 (2.6%) |
| 9:00 AM to 9:59 AM | 119 (3.1%) | 100 (2.9%) |
| 10:00 AM to 10:59 AM | 36 (0.9%) | 43 (1.3%) |
| 11:00 AM to 11:59 AM | 0 (0.0%) | 0 (0.0%) |
| 12:00 PM to 3:59 PM | 216 (5.7%) | 151 (4.4%) |
| 4:00 PM to 11:59 PM | 216 (5.7%) | 319 (9.4%) |
| Total | 3,789 (100.0%) | 3,396 (100.0%) |
Housing Occupancy in DeWitt County
Occupancy by Ownership in DeWitt County
Of the total 6,586 dwellings in DeWitt County, owner-occupied units account for 4,655 (70.7%), while renter-occupied units make up 1,931 (29.3%).
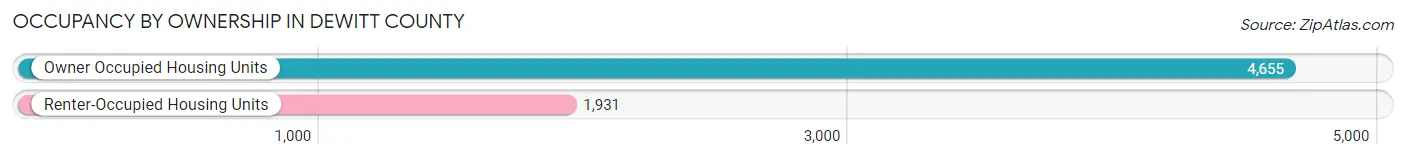
| Occupancy | # Housing Units | % Housing Units |
| Owner Occupied Housing Units | 4,655 | 70.7% |
| Renter-Occupied Housing Units | 1,931 | 29.3% |
| Total Occupied Housing Units | 6,586 | 100.0% |
Occupancy by Household Size in DeWitt County
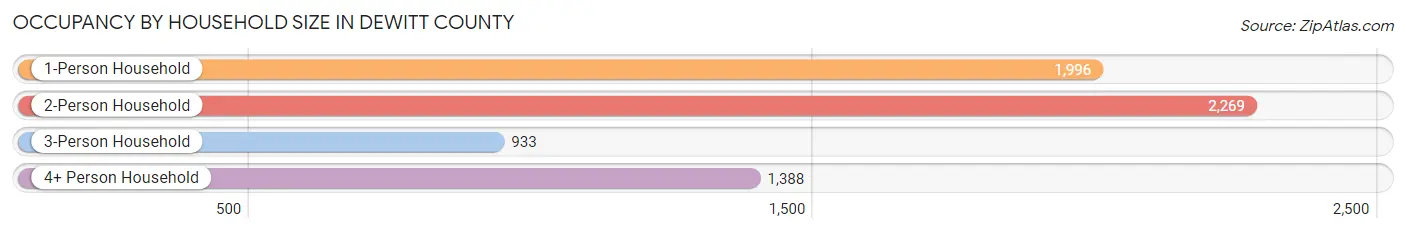
| Household Size | # Housing Units | % Housing Units |
| 1-Person Household | 1,996 | 30.3% |
| 2-Person Household | 2,269 | 34.4% |
| 3-Person Household | 933 | 14.2% |
| 4+ Person Household | 1,388 | 21.1% |
| Total Housing Units | 6,586 | 100.0% |
Occupancy by Ownership by Household Size in DeWitt County
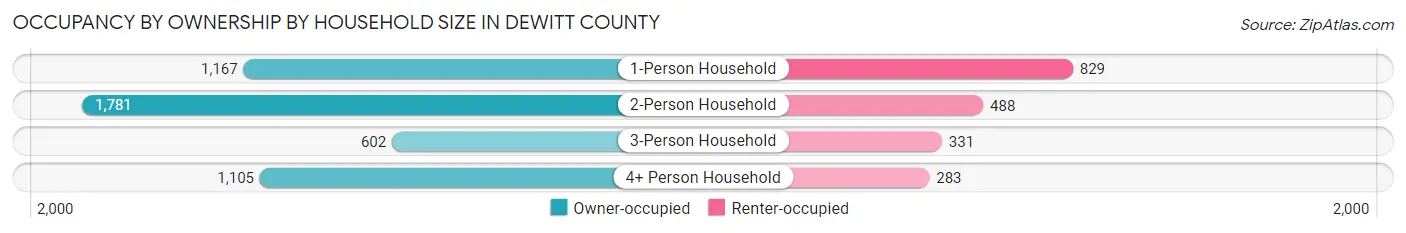
| Household Size | Owner-occupied | Renter-occupied |
| 1-Person Household | 1,167 (58.5%) | 829 (41.5%) |
| 2-Person Household | 1,781 (78.5%) | 488 (21.5%) |
| 3-Person Household | 602 (64.5%) | 331 (35.5%) |
| 4+ Person Household | 1,105 (79.6%) | 283 (20.4%) |
| Total Housing Units | 4,655 (70.7%) | 1,931 (29.3%) |
Occupancy by Educational Attainment in DeWitt County
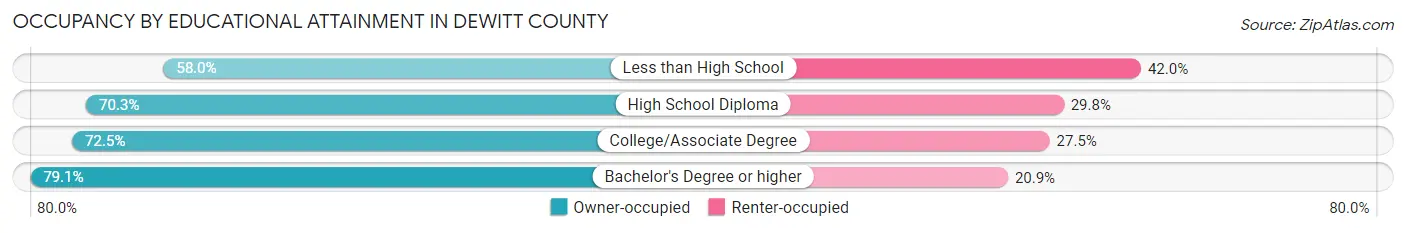
| Household Size | Owner-occupied | Renter-occupied |
| Less than High School | 500 (58.0%) | 362 (42.0%) |
| High School Diploma | 1,799 (70.3%) | 762 (29.7%) |
| College/Associate Degree | 1,599 (72.5%) | 607 (27.5%) |
| Bachelor's Degree or higher | 757 (79.1%) | 200 (20.9%) |
Occupancy by Age of Householder in DeWitt County
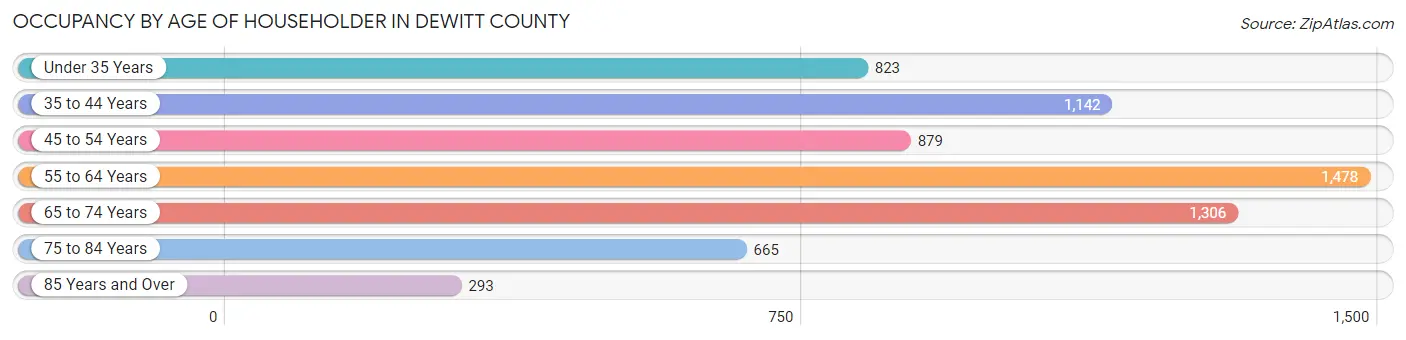
| Age Bracket | # Households | % Households |
| Under 35 Years | 823 | 12.5% |
| 35 to 44 Years | 1,142 | 17.3% |
| 45 to 54 Years | 879 | 13.4% |
| 55 to 64 Years | 1,478 | 22.4% |
| 65 to 74 Years | 1,306 | 19.8% |
| 75 to 84 Years | 665 | 10.1% |
| 85 Years and Over | 293 | 4.4% |
| Total | 6,586 | 100.0% |
Housing Finances in DeWitt County
Median Income by Occupancy in DeWitt County
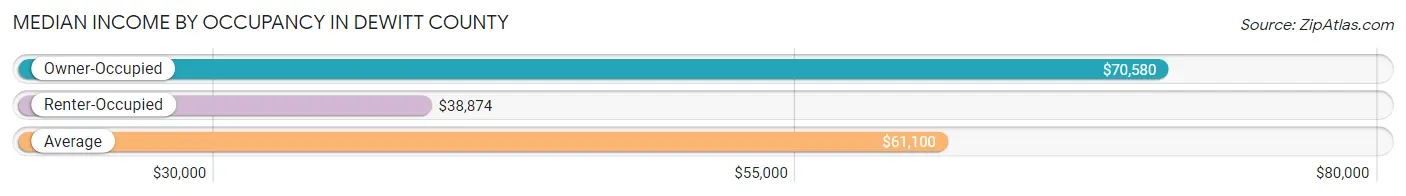
| Occupancy Type | # Households | Median Income |
| Owner-Occupied | 4,655 (70.7%) | $70,580 |
| Renter-Occupied | 1,931 (29.3%) | $38,874 |
| Average | 6,586 (100.0%) | $61,100 |
Occupancy by Householder Income Bracket in DeWitt County
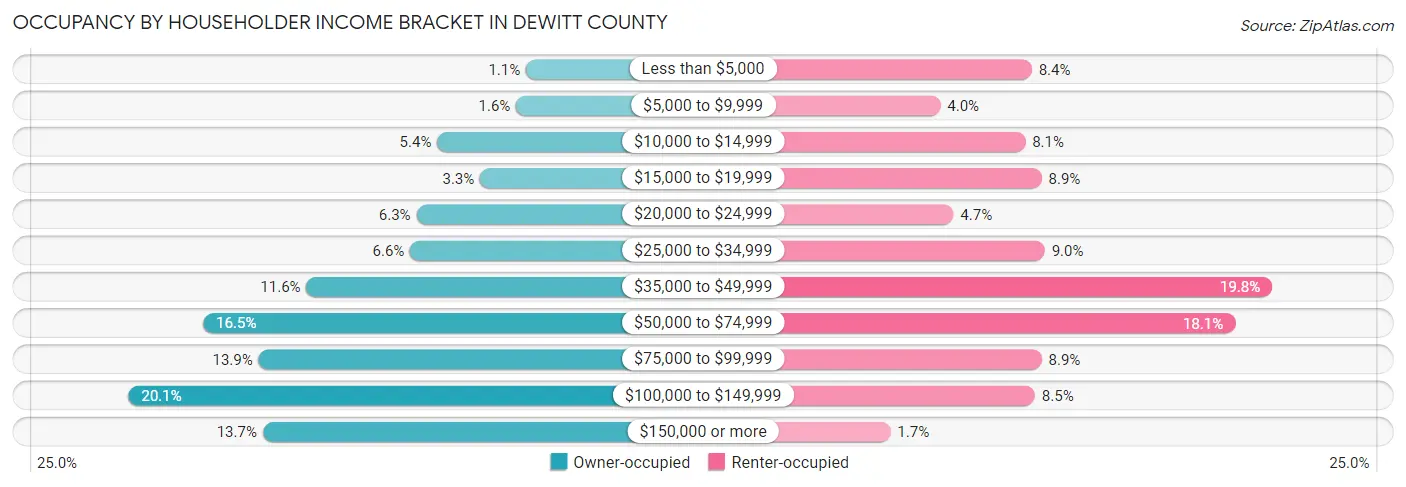
| Income Bracket | Owner-occupied | Renter-occupied |
| Less than $5,000 | 52 (1.1%) | 162 (8.4%) |
| $5,000 to $9,999 | 74 (1.6%) | 78 (4.0%) |
| $10,000 to $14,999 | 249 (5.3%) | 156 (8.1%) |
| $15,000 to $19,999 | 154 (3.3%) | 171 (8.9%) |
| $20,000 to $24,999 | 295 (6.3%) | 90 (4.7%) |
| $25,000 to $34,999 | 309 (6.6%) | 174 (9.0%) |
| $35,000 to $49,999 | 539 (11.6%) | 383 (19.8%) |
| $50,000 to $74,999 | 768 (16.5%) | 349 (18.1%) |
| $75,000 to $99,999 | 645 (13.9%) | 171 (8.9%) |
| $100,000 to $149,999 | 934 (20.1%) | 165 (8.5%) |
| $150,000 or more | 636 (13.7%) | 32 (1.7%) |
| Total | 4,655 (100.0%) | 1,931 (100.0%) |
Monthly Housing Cost Tiers in DeWitt County
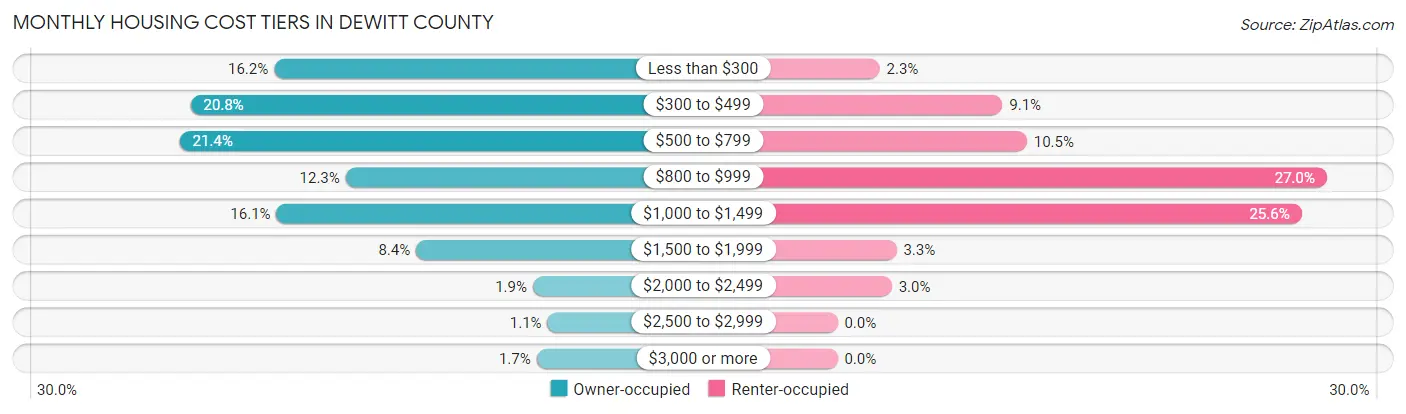
| Monthly Cost | Owner-occupied | Renter-occupied |
| Less than $300 | 755 (16.2%) | 45 (2.3%) |
| $300 to $499 | 970 (20.8%) | 176 (9.1%) |
| $500 to $799 | 998 (21.4%) | 202 (10.5%) |
| $800 to $999 | 571 (12.3%) | 522 (27.0%) |
| $1,000 to $1,499 | 749 (16.1%) | 495 (25.6%) |
| $1,500 to $1,999 | 390 (8.4%) | 63 (3.3%) |
| $2,000 to $2,499 | 90 (1.9%) | 58 (3.0%) |
| $2,500 to $2,999 | 52 (1.1%) | 0 (0.0%) |
| $3,000 or more | 80 (1.7%) | 0 (0.0%) |
| Total | 4,655 (100.0%) | 1,931 (100.0%) |
Physical Housing Characteristics in DeWitt County
Housing Structures in DeWitt County
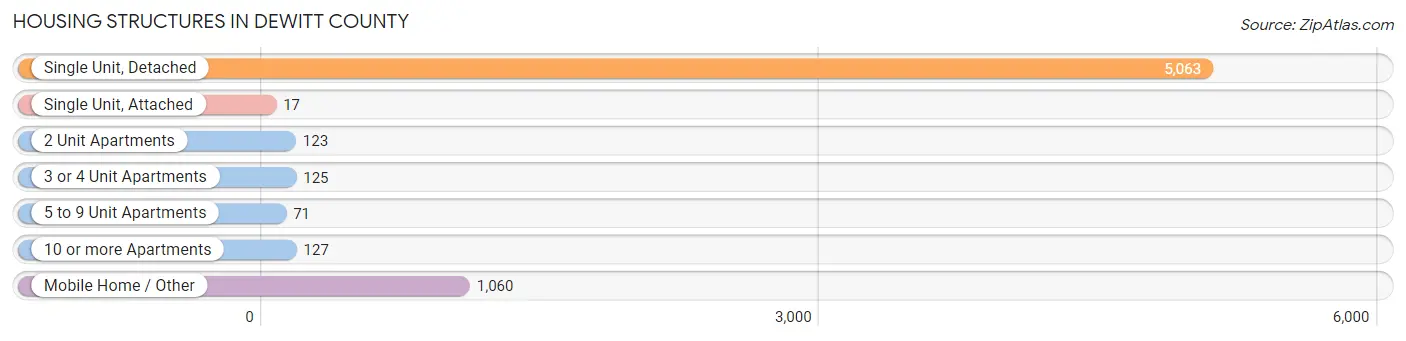
| Structure Type | # Housing Units | % Housing Units |
| Single Unit, Detached | 5,063 | 76.9% |
| Single Unit, Attached | 17 | 0.3% |
| 2 Unit Apartments | 123 | 1.9% |
| 3 or 4 Unit Apartments | 125 | 1.9% |
| 5 to 9 Unit Apartments | 71 | 1.1% |
| 10 or more Apartments | 127 | 1.9% |
| Mobile Home / Other | 1,060 | 16.1% |
| Total | 6,586 | 100.0% |
Housing Structures by Occupancy in DeWitt County
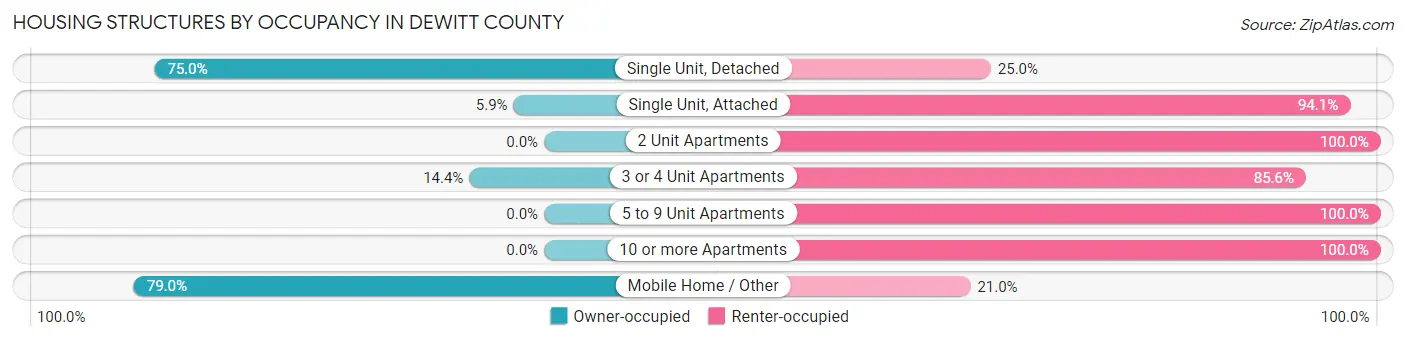
| Structure Type | Owner-occupied | Renter-occupied |
| Single Unit, Detached | 3,799 (75.0%) | 1,264 (25.0%) |
| Single Unit, Attached | 1 (5.9%) | 16 (94.1%) |
| 2 Unit Apartments | 0 (0.0%) | 123 (100.0%) |
| 3 or 4 Unit Apartments | 18 (14.4%) | 107 (85.6%) |
| 5 to 9 Unit Apartments | 0 (0.0%) | 71 (100.0%) |
| 10 or more Apartments | 0 (0.0%) | 127 (100.0%) |
| Mobile Home / Other | 837 (79.0%) | 223 (21.0%) |
| Total | 4,655 (70.7%) | 1,931 (29.3%) |
Housing Structures by Number of Rooms in DeWitt County
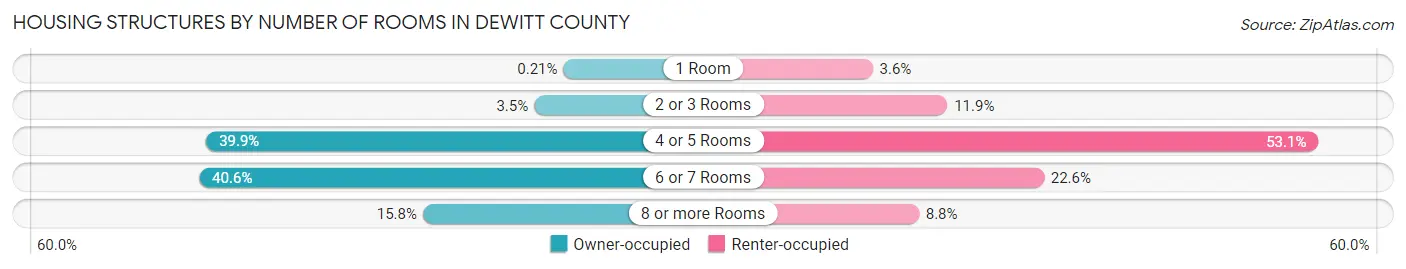
| Number of Rooms | Owner-occupied | Renter-occupied |
| 1 Room | 10 (0.2%) | 70 (3.6%) |
| 2 or 3 Rooms | 161 (3.5%) | 230 (11.9%) |
| 4 or 5 Rooms | 1,856 (39.9%) | 1,025 (53.1%) |
| 6 or 7 Rooms | 1,892 (40.6%) | 437 (22.6%) |
| 8 or more Rooms | 736 (15.8%) | 169 (8.7%) |
| Total | 4,655 (100.0%) | 1,931 (100.0%) |
Housing Structure by Heating Type in DeWitt County
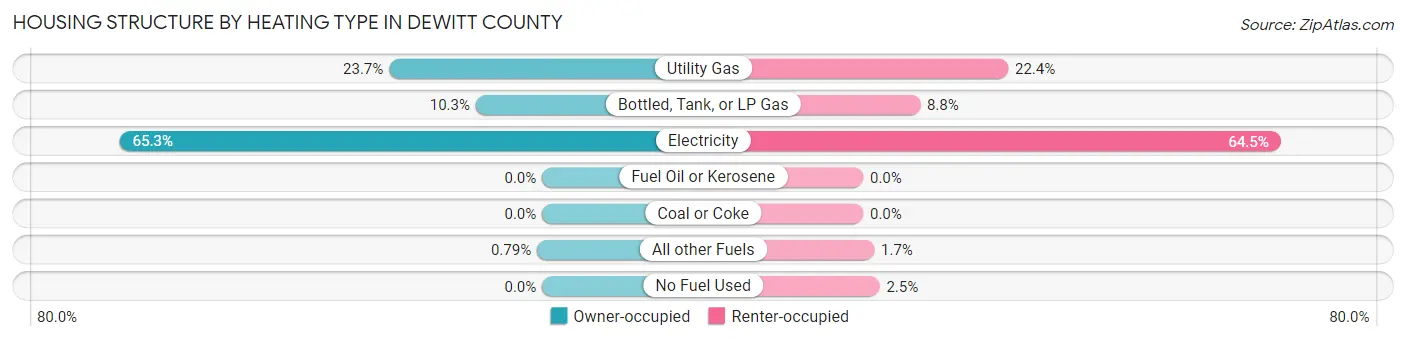
| Heating Type | Owner-occupied | Renter-occupied |
| Utility Gas | 1,101 (23.6%) | 433 (22.4%) |
| Bottled, Tank, or LP Gas | 477 (10.2%) | 170 (8.8%) |
| Electricity | 3,040 (65.3%) | 1,246 (64.5%) |
| Fuel Oil or Kerosene | 0 (0.0%) | 0 (0.0%) |
| Coal or Coke | 0 (0.0%) | 0 (0.0%) |
| All other Fuels | 37 (0.8%) | 33 (1.7%) |
| No Fuel Used | 0 (0.0%) | 49 (2.5%) |
| Total | 4,655 (100.0%) | 1,931 (100.0%) |
Household Vehicle Usage in DeWitt County
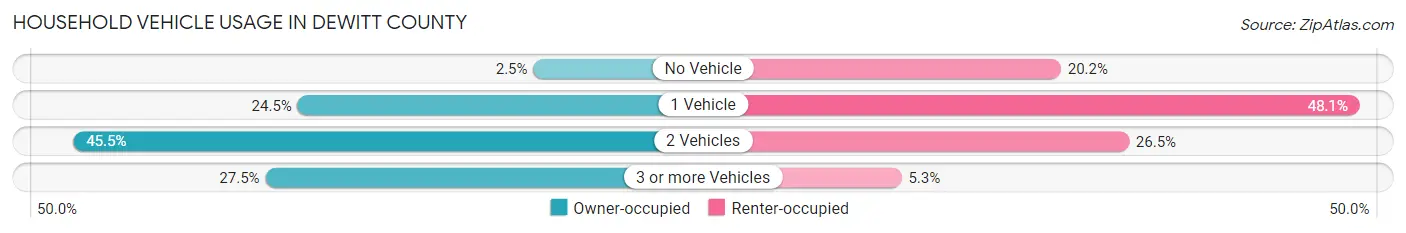
| Vehicles per Household | Owner-occupied | Renter-occupied |
| No Vehicle | 117 (2.5%) | 389 (20.2%) |
| 1 Vehicle | 1,141 (24.5%) | 928 (48.1%) |
| 2 Vehicles | 2,116 (45.5%) | 512 (26.5%) |
| 3 or more Vehicles | 1,281 (27.5%) | 102 (5.3%) |
| Total | 4,655 (100.0%) | 1,931 (100.0%) |
Real Estate & Mortgages in DeWitt County
Real Estate and Mortgage Overview in DeWitt County
| Characteristic | Without Mortgage | With Mortgage |
| Housing Units | 3,324 | 1,331 |
| Median Property Value | $149,000 | $179,500 |
| Median Household Income | $61,786 | $224 |
| Monthly Housing Costs | $489 | $80 |
| Real Estate Taxes | $1,275 | $88 |
Property Value by Mortgage Status in DeWitt County
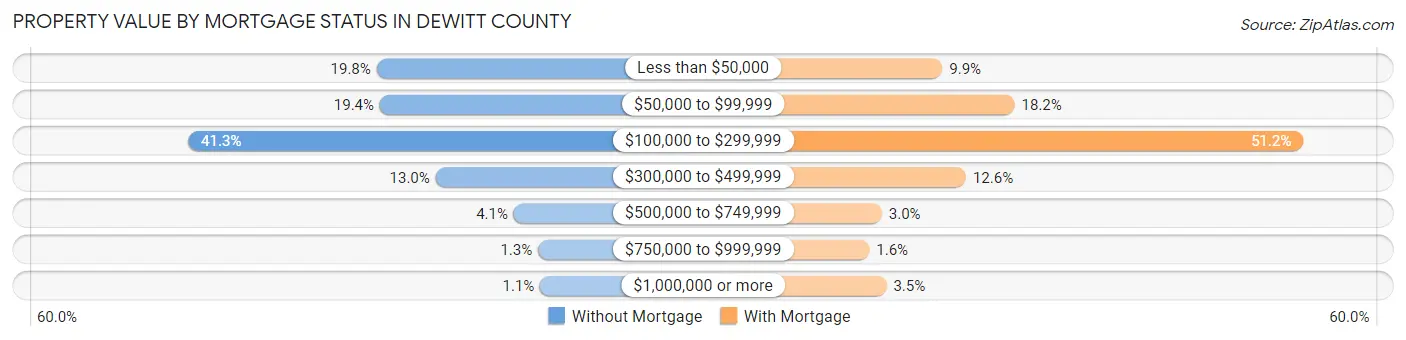
| Property Value | Without Mortgage | With Mortgage |
| Less than $50,000 | 657 (19.8%) | 132 (9.9%) |
| $50,000 to $99,999 | 645 (19.4%) | 242 (18.2%) |
| $100,000 to $299,999 | 1,373 (41.3%) | 681 (51.2%) |
| $300,000 to $499,999 | 433 (13.0%) | 168 (12.6%) |
| $500,000 to $749,999 | 136 (4.1%) | 40 (3.0%) |
| $750,000 to $999,999 | 44 (1.3%) | 21 (1.6%) |
| $1,000,000 or more | 36 (1.1%) | 47 (3.5%) |
| Total | 3,324 (100.0%) | 1,331 (100.0%) |
Household Income by Mortgage Status in DeWitt County
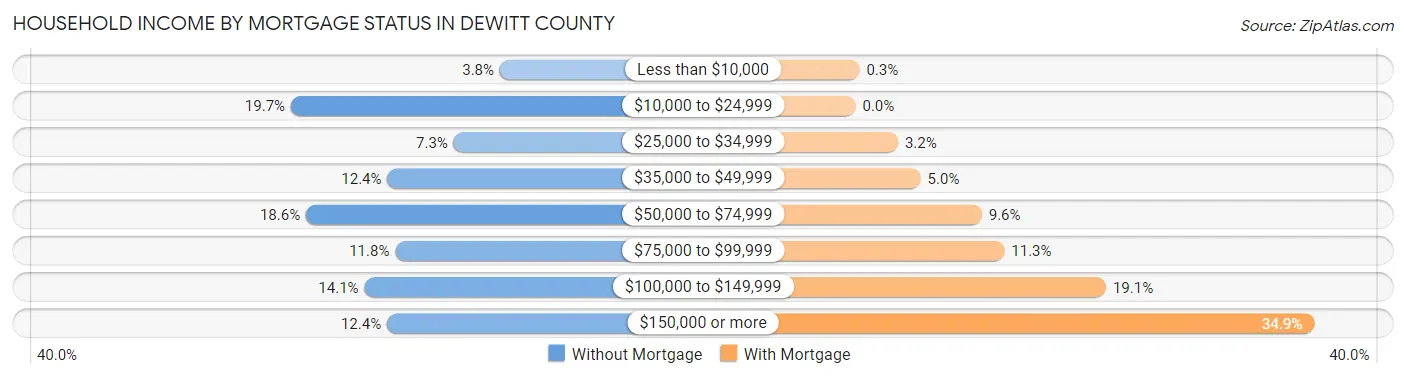
| Household Income | Without Mortgage | With Mortgage |
| Less than $10,000 | 126 (3.8%) | 4 (0.3%) |
| $10,000 to $24,999 | 655 (19.7%) | 0 (0.0%) |
| $25,000 to $34,999 | 243 (7.3%) | 43 (3.2%) |
| $35,000 to $49,999 | 411 (12.4%) | 66 (5.0%) |
| $50,000 to $74,999 | 617 (18.6%) | 128 (9.6%) |
| $75,000 to $99,999 | 391 (11.8%) | 151 (11.3%) |
| $100,000 to $149,999 | 469 (14.1%) | 254 (19.1%) |
| $150,000 or more | 412 (12.4%) | 465 (34.9%) |
| Total | 3,324 (100.0%) | 1,331 (100.0%) |
Property Value to Household Income Ratio in DeWitt County
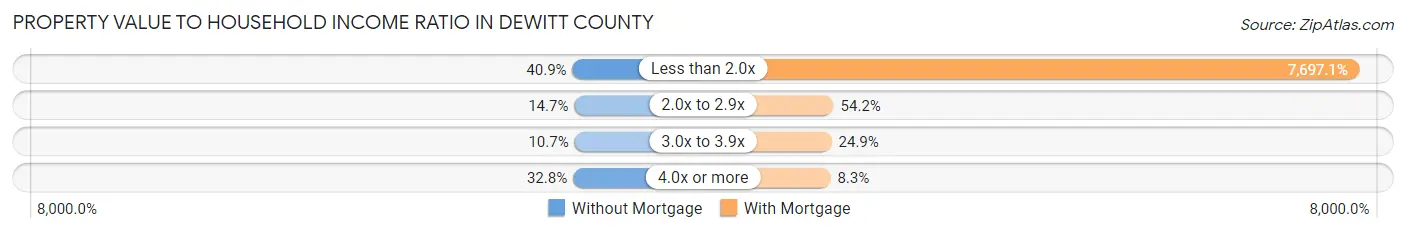
| Value-to-Income Ratio | Without Mortgage | With Mortgage |
| Less than 2.0x | 1,361 (40.9%) | 102,448 (7,697.1%) |
| 2.0x to 2.9x | 488 (14.7%) | 722 (54.2%) |
| 3.0x to 3.9x | 357 (10.7%) | 331 (24.9%) |
| 4.0x or more | 1,090 (32.8%) | 111 (8.3%) |
| Total | 3,324 (100.0%) | 1,331 (100.0%) |
Real Estate Taxes by Mortgage Status in DeWitt County
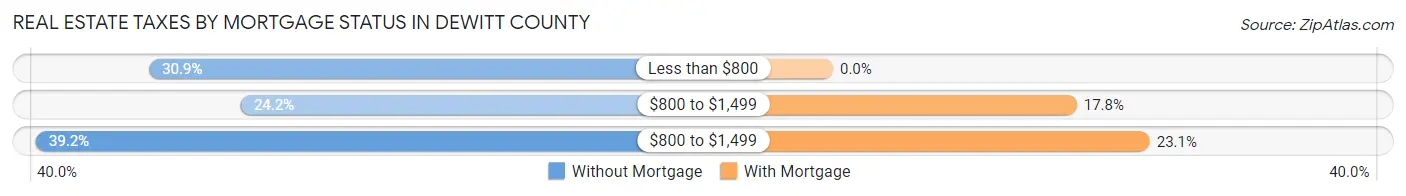
| Property Taxes | Without Mortgage | With Mortgage |
| Less than $800 | 1,027 (30.9%) | 0 (0.0%) |
| $800 to $1,499 | 804 (24.2%) | 237 (17.8%) |
| $800 to $1,499 | 1,302 (39.2%) | 308 (23.1%) |
| Total | 3,324 (100.0%) | 1,331 (100.0%) |
Health & Disability in DeWitt County
Health Insurance Coverage by Age in DeWitt County
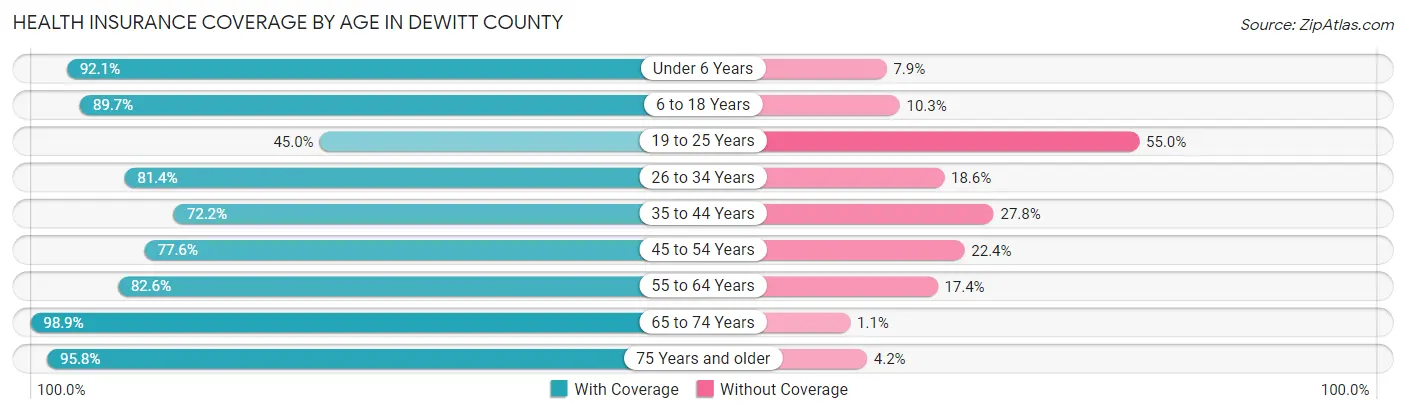
| Age Bracket | With Coverage | Without Coverage |
| Under 6 Years | 1,489 (92.1%) | 127 (7.9%) |
| 6 to 18 Years | 2,627 (89.7%) | 302 (10.3%) |
| 19 to 25 Years | 642 (45.0%) | 784 (55.0%) |
| 26 to 34 Years | 1,304 (81.4%) | 298 (18.6%) |
| 35 to 44 Years | 1,558 (72.2%) | 601 (27.8%) |
| 45 to 54 Years | 1,612 (77.6%) | 465 (22.4%) |
| 55 to 64 Years | 2,107 (82.6%) | 443 (17.4%) |
| 65 to 74 Years | 2,114 (98.9%) | 23 (1.1%) |
| 75 Years and older | 1,367 (95.8%) | 60 (4.2%) |
| Total | 14,820 (82.7%) | 3,103 (17.3%) |
Health Insurance Coverage by Citizenship Status in DeWitt County
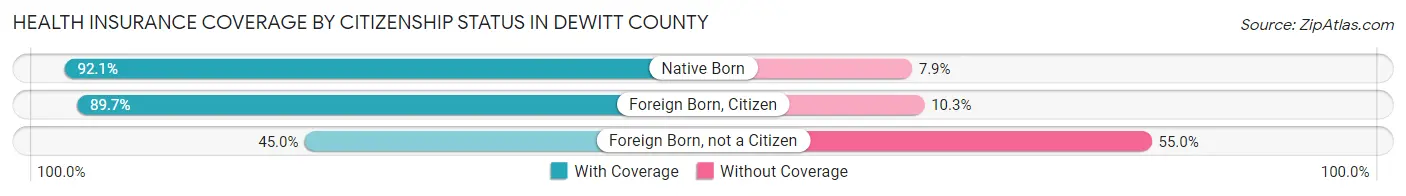
| Citizenship Status | With Coverage | Without Coverage |
| Native Born | 1,489 (92.1%) | 127 (7.9%) |
| Foreign Born, Citizen | 2,627 (89.7%) | 302 (10.3%) |
| Foreign Born, not a Citizen | 642 (45.0%) | 784 (55.0%) |
Health Insurance Coverage by Household Income in DeWitt County
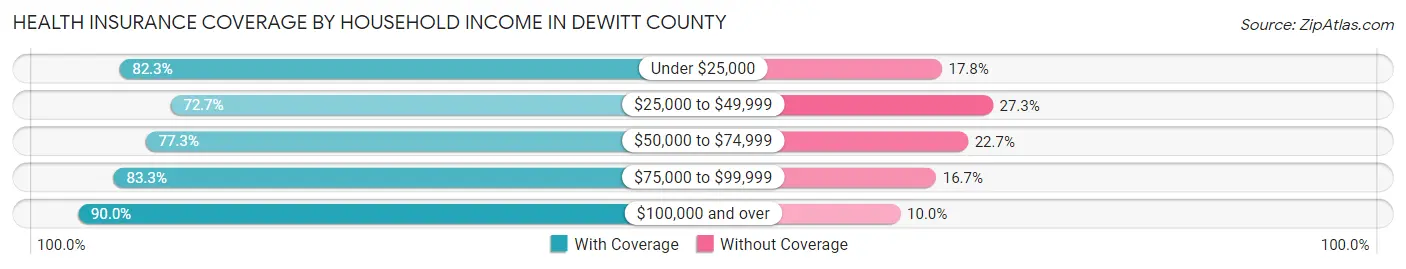
| Household Income | With Coverage | Without Coverage |
| Under $25,000 | 2,154 (82.3%) | 465 (17.7%) |
| $25,000 to $49,999 | 2,306 (72.7%) | 866 (27.3%) |
| $50,000 to $74,999 | 2,358 (77.3%) | 691 (22.7%) |
| $75,000 to $99,999 | 2,210 (83.3%) | 442 (16.7%) |
| $100,000 and over | 5,760 (90.0%) | 639 (10.0%) |
Public vs Private Health Insurance Coverage by Age in DeWitt County
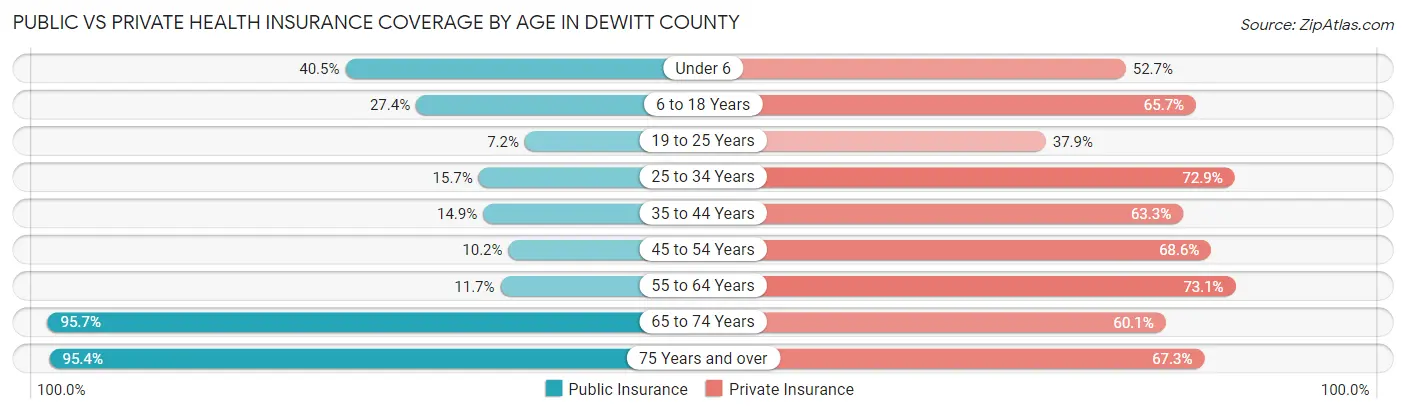
| Age Bracket | Public Insurance | Private Insurance |
| Under 6 | 654 (40.5%) | 852 (52.7%) |
| 6 to 18 Years | 801 (27.4%) | 1,925 (65.7%) |
| 19 to 25 Years | 102 (7.1%) | 540 (37.9%) |
| 25 to 34 Years | 252 (15.7%) | 1,168 (72.9%) |
| 35 to 44 Years | 322 (14.9%) | 1,367 (63.3%) |
| 45 to 54 Years | 212 (10.2%) | 1,424 (68.6%) |
| 55 to 64 Years | 298 (11.7%) | 1,863 (73.1%) |
| 65 to 74 Years | 2,046 (95.7%) | 1,284 (60.1%) |
| 75 Years and over | 1,361 (95.4%) | 960 (67.3%) |
| Total | 6,048 (33.7%) | 11,383 (63.5%) |
Disability Status by Sex by Age in DeWitt County
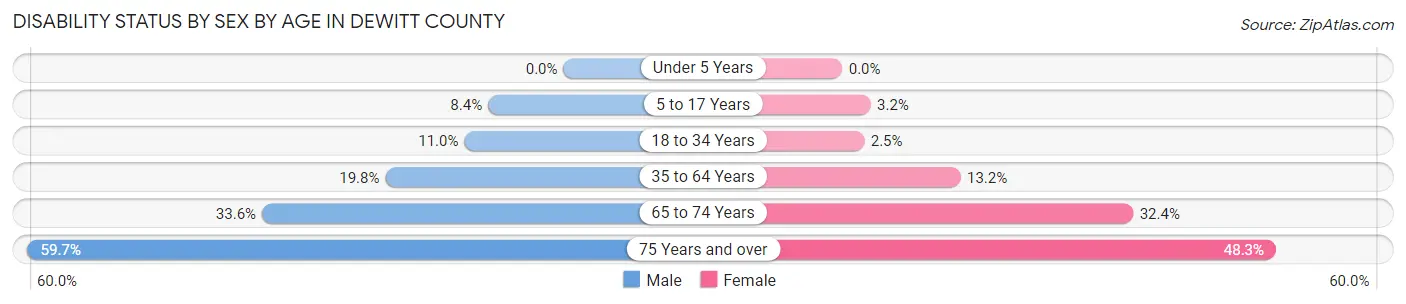
| Age Bracket | Male | Female |
| Under 5 Years | 0 (0.0%) | 0 (0.0%) |
| 5 to 17 Years | 133 (8.4%) | 50 (3.2%) |
| 18 to 34 Years | 173 (11.0%) | 39 (2.5%) |
| 35 to 64 Years | 668 (19.8%) | 450 (13.2%) |
| 65 to 74 Years | 335 (33.6%) | 369 (32.4%) |
| 75 Years and over | 349 (59.7%) | 407 (48.3%) |
Disability Class by Sex by Age in DeWitt County
Disability Class: Hearing Difficulty
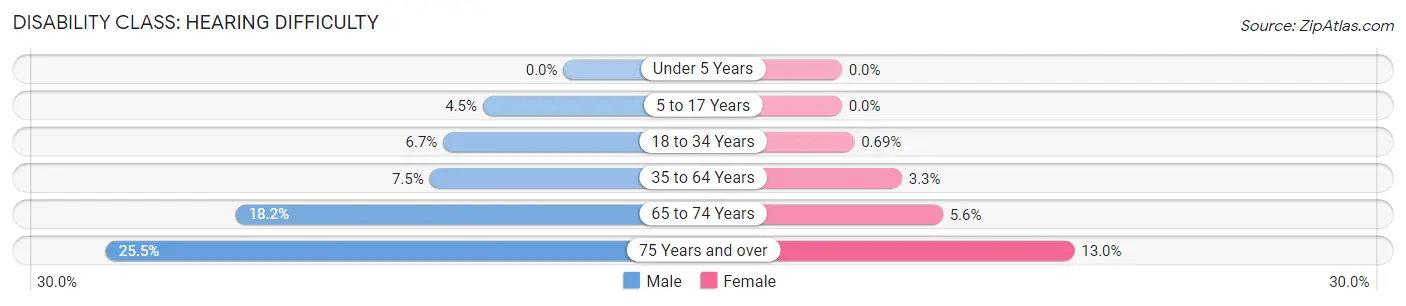
| Age Bracket | Male | Female |
| Under 5 Years | 0 (0.0%) | 0 (0.0%) |
| 5 to 17 Years | 71 (4.5%) | 0 (0.0%) |
| 18 to 34 Years | 105 (6.7%) | 11 (0.7%) |
| 35 to 64 Years | 251 (7.4%) | 114 (3.3%) |
| 65 to 74 Years | 182 (18.2%) | 64 (5.6%) |
| 75 Years and over | 149 (25.5%) | 109 (13.0%) |
Disability Class: Vision Difficulty
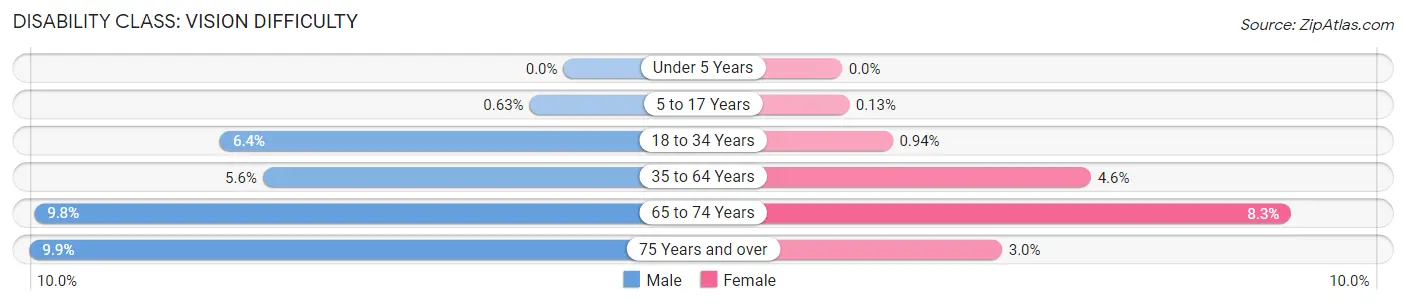
| Age Bracket | Male | Female |
| Under 5 Years | 0 (0.0%) | 0 (0.0%) |
| 5 to 17 Years | 10 (0.6%) | 2 (0.1%) |
| 18 to 34 Years | 100 (6.4%) | 15 (0.9%) |
| 35 to 64 Years | 188 (5.6%) | 158 (4.6%) |
| 65 to 74 Years | 98 (9.8%) | 95 (8.3%) |
| 75 Years and over | 58 (9.9%) | 25 (3.0%) |
Disability Class: Cognitive Difficulty
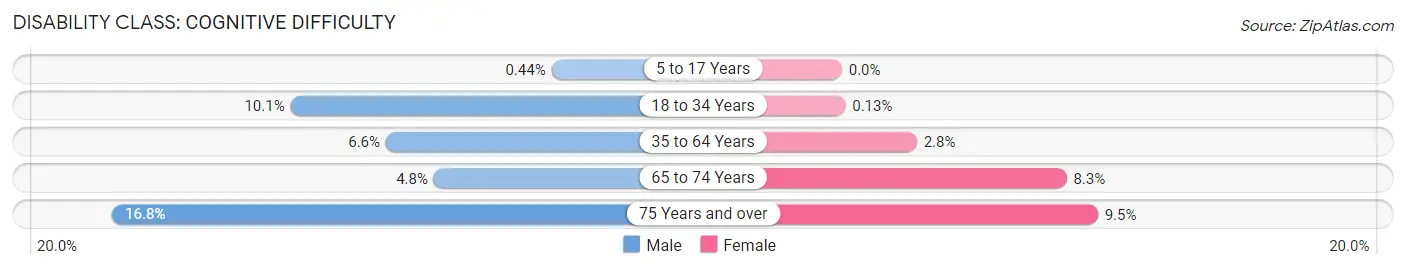
| Age Bracket | Male | Female |
| 5 to 17 Years | 7 (0.4%) | 0 (0.0%) |
| 18 to 34 Years | 159 (10.1%) | 2 (0.1%) |
| 35 to 64 Years | 222 (6.6%) | 95 (2.8%) |
| 65 to 74 Years | 48 (4.8%) | 95 (8.3%) |
| 75 Years and over | 98 (16.8%) | 80 (9.5%) |
Disability Class: Ambulatory Difficulty
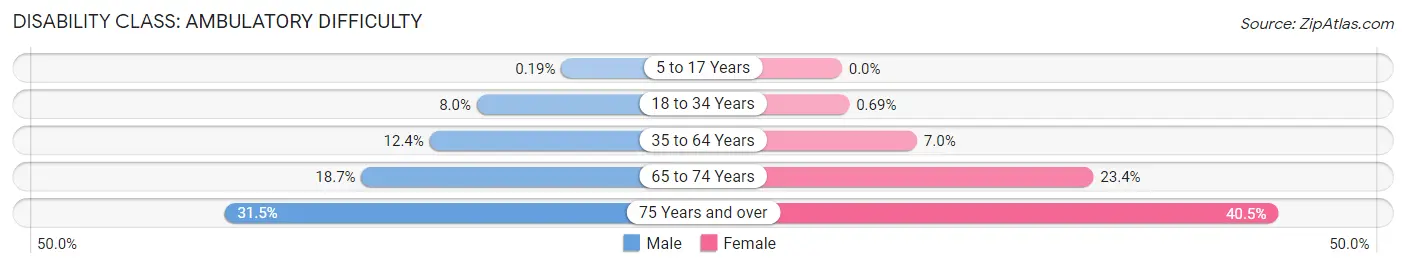
| Age Bracket | Male | Female |
| 5 to 17 Years | 3 (0.2%) | 0 (0.0%) |
| 18 to 34 Years | 126 (8.0%) | 11 (0.7%) |
| 35 to 64 Years | 418 (12.4%) | 238 (7.0%) |
| 65 to 74 Years | 187 (18.7%) | 266 (23.4%) |
| 75 Years and over | 184 (31.5%) | 341 (40.5%) |
Disability Class: Self-Care Difficulty
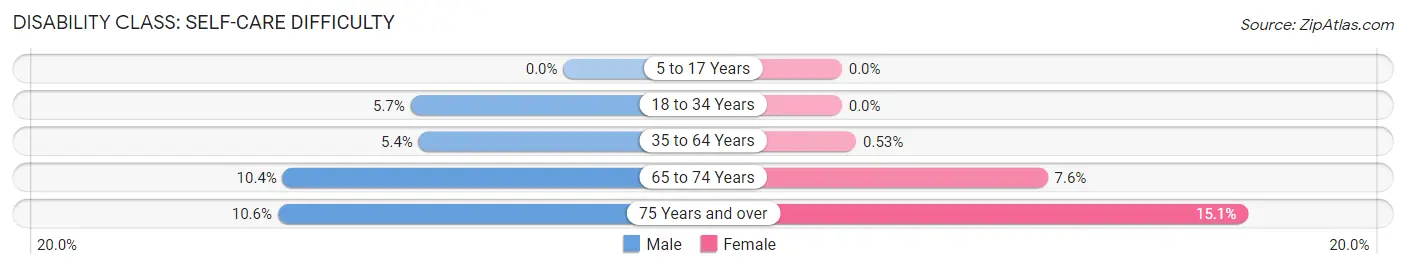
| Age Bracket | Male | Female |
| 5 to 17 Years | 0 (0.0%) | 0 (0.0%) |
| 18 to 34 Years | 89 (5.7%) | 0 (0.0%) |
| 35 to 64 Years | 181 (5.4%) | 18 (0.5%) |
| 65 to 74 Years | 104 (10.4%) | 87 (7.6%) |
| 75 Years and over | 62 (10.6%) | 127 (15.1%) |
Technology Access in DeWitt County
Computing Device Access in DeWitt County
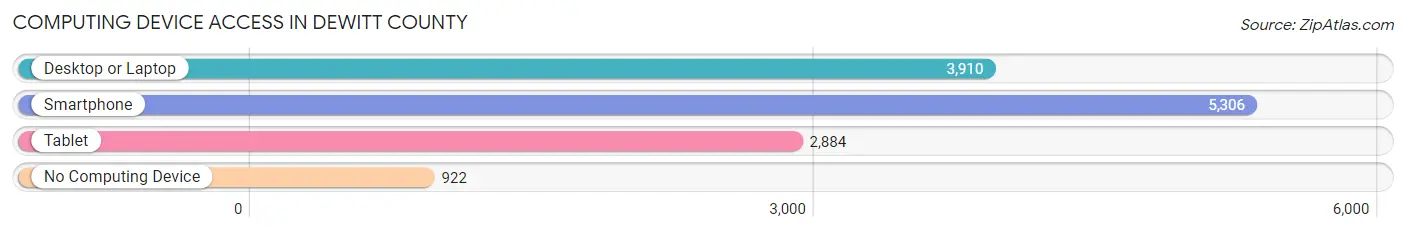
| Device Type | # Households | % Households |
| Desktop or Laptop | 3,910 | 59.4% |
| Smartphone | 5,306 | 80.6% |
| Tablet | 2,884 | 43.8% |
| No Computing Device | 922 | 14.0% |
| Total | 6,586 | 100.0% |
Internet Access in DeWitt County
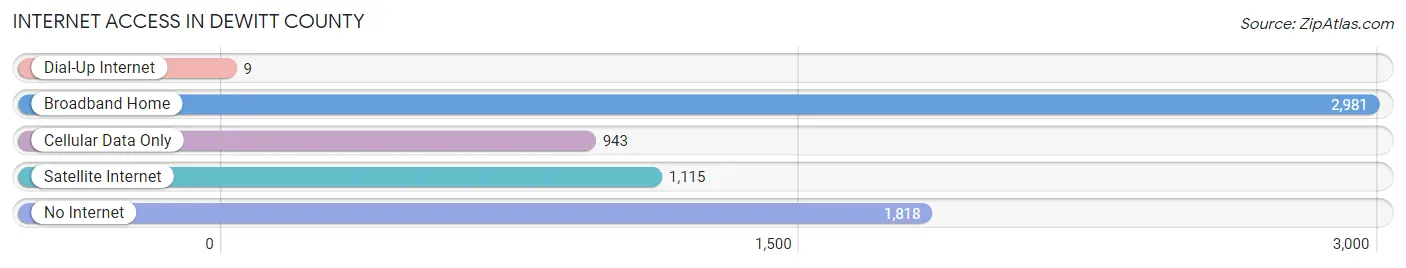
| Internet Type | # Households | % Households |
| Dial-Up Internet | 9 | 0.1% |
| Broadband Home | 2,981 | 45.3% |
| Cellular Data Only | 943 | 14.3% |
| Satellite Internet | 1,115 | 16.9% |
| No Internet | 1,818 | 27.6% |
| Total | 6,586 | 100.0% |
DeWitt County Summary
Dewitt County is located in the south-central region of Texas, and is part of the Coastal Bend region. It is bordered by Gonzales County to the north, Lavaca County to the east, Karnes County to the south, and Goliad County to the west. The county seat is Cuero, and the county has a total area of 890 square miles.
History
Dewitt County was established in 1846 and named after Green DeWitt, a settler who had been granted a league of land in the area in 1825. The county was originally part of Gonzales County, but was later divided into its own county. The first settlers in the area were mostly German immigrants, who established farms and ranches in the area.
In the late 19th century, the county experienced a period of growth and development, with the establishment of several towns, including Cuero, Yorktown, and Nordheim. The county also saw the development of the railroad, which connected the towns and allowed for the transportation of goods and people.
Geography
Dewitt County is located in the south-central region of Texas, and is part of the Coastal Bend region. It is bordered by Gonzales County to the north, Lavaca County to the east, Karnes County to the south, and Goliad County to the west. The county has a total area of 890 square miles, and is mostly flat, with some rolling hills. The terrain is mostly covered in grasslands, with some areas of woodlands. The county is home to several rivers, including the Guadalupe, San Antonio, and Navidad Rivers.
Economy
The economy of Dewitt County is largely based on agriculture, with the main crops being cotton, corn, and sorghum. The county is also home to several oil and gas fields, which provide jobs and revenue for the county. In addition, the county is home to several manufacturing companies, including a steel mill and a paper mill.
Demographics
As of the 2010 census, the population of Dewitt County was 20,097. The population is mostly white (83.3%), with a small Hispanic population (14.2%). The median household income is $45,845, and the median age is 38.7. The county has a low unemployment rate of 3.7%.
Conclusion
Dewitt County is a rural county located in the south-central region of Texas. It has a long history, and is home to a diverse population. The economy of the county is largely based on agriculture, with some oil and gas production, and manufacturing. The county has a low unemployment rate, and a median household income of $45,845.
Common Questions
What is Per Capita Income in DeWitt County?
Per Capita income in DeWitt County is $29,359.
What is the Median Family Income in DeWitt County?
Median Family Income in DeWitt County is $69,614.
What is the Median Household income in DeWitt County?
Median Household Income in DeWitt County is $61,100.
What is Income or Wage Gap in DeWitt County?
Income or Wage Gap in DeWitt County is 38.1%.
Women in DeWitt County earn 61.9 cents for every dollar earned by a man.
What is Family Income Deficit in DeWitt County?
Family Income Deficit in DeWitt County is $9,212.
Families that are below poverty line in DeWitt County earn $9,212 less on average than the poverty threshold level.
What is Inequality or Gini Index in DeWitt County?
Inequality or Gini Index in DeWitt County is 0.49.
What is the Total Population of DeWitt County?
Total Population of DeWitt County is 19,826.
What is the Total Male Population of DeWitt County?
Total Male Population of DeWitt County is 10,433.
What is the Total Female Population of DeWitt County?
Total Female Population of DeWitt County is 9,393.
What is the Ratio of Males per 100 Females in DeWitt County?
There are 111.07 Males per 100 Females in DeWitt County.
What is the Ratio of Females per 100 Males in DeWitt County?
There are 90.03 Females per 100 Males in DeWitt County.
What is the Median Population Age in DeWitt County?
Median Population Age in DeWitt County is 41.7 Years.
What is the Average Family Size in DeWitt County
Average Family Size in DeWitt County is 3.4 People.
What is the Average Household Size in DeWitt County
Average Household Size in DeWitt County is 2.7 People.
How Large is the Labor Force in DeWitt County?
There are 7,956 People in the Labor Forcein in DeWitt County.
What is the Percentage of People in the Labor Force in DeWitt County?
50.2% of People are in the Labor Force in DeWitt County.
What is the Unemployment Rate in DeWitt County?
Unemployment Rate in DeWitt County is 5.2%.