Delta County, TX Map & Demographics
Delta County Map
Delta County Overview
$34,345
PER CAPITA INCOME
$82,679
AVG FAMILY INCOME
$68,491
AVG HOUSEHOLD INCOME
7.9%
WAGE / INCOME GAP [ % ]
92.1¢/ $1
WAGE / INCOME GAP [ $ ]
0.45
INEQUALITY / GINI INDEX
5,278
TOTAL POPULATION
2,406
MALE POPULATION
2,872
FEMALE POPULATION
83.77
MALES / 100 FEMALES
119.37
FEMALES / 100 MALES
40.6
MEDIAN AGE
2.8
AVG FAMILY SIZE
2.5
AVG HOUSEHOLD SIZE
2,466
LABOR FORCE [ PEOPLE ]
59.0%
PERCENT IN LABOR FORCE
6.4%
UNEMPLOYMENT RATE
Delta County Area Codes
Income in Delta County
Income Overview in Delta County
Per Capita Income in Delta County is $34,345, while median incomes of families and households are $82,679 and $68,491 respectively.
| Characteristic | Number | Measure |
| Per Capita Income | 5,278 | $34,345 |
| Median Family Income | 1,560 | $82,679 |
| Mean Family Income | 1,560 | $102,564 |
| Median Household Income | 2,106 | $68,491 |
| Mean Household Income | 2,106 | $87,624 |
| Income Deficit | 1,560 | $0 |
| Wage / Income Gap (%) | 5,278 | 7.91% |
| Wage / Income Gap ($) | 5,278 | 92.09¢ per $1 |
| Gini / Inequality Index | 5,278 | 0.45 |
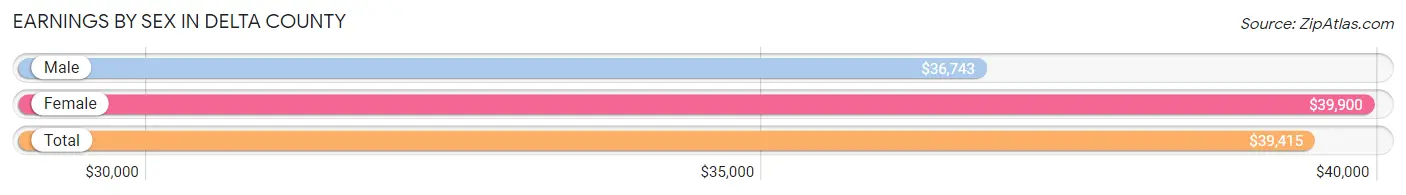
Earnings by Sex in Delta County
Average Earnings in Delta County are $39,415, $36,743 for men and $39,900 for women, a difference of 7.9%.
| Sex | Number | Average Earnings |
| Male | 1,427 (53.9%) | $36,743 |
| Female | 1,218 (46.1%) | $39,900 |
| Total | 2,645 (100.0%) | $39,415 |
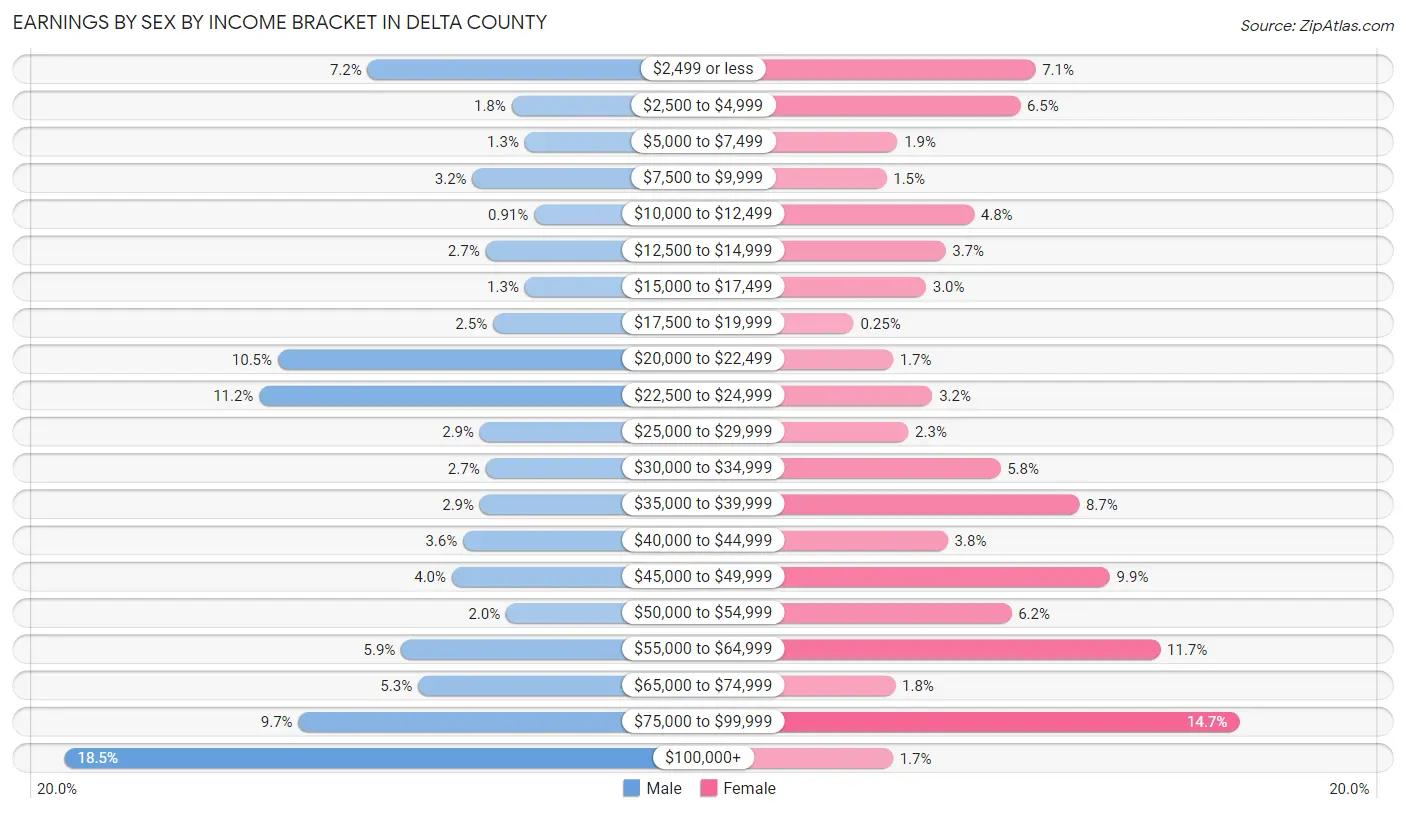
Earnings by Sex by Income Bracket in Delta County
The most common earnings brackets in Delta County are $100,000+ for men (264 | 18.5%) and $75,000 to $99,999 for women (179 | 14.7%).
| Income | Male | Female |
| $2,499 or less | 102 (7.1%) | 86 (7.1%) |
| $2,500 to $4,999 | 25 (1.8%) | 79 (6.5%) |
| $5,000 to $7,499 | 18 (1.3%) | 23 (1.9%) |
| $7,500 to $9,999 | 46 (3.2%) | 18 (1.5%) |
| $10,000 to $12,499 | 13 (0.9%) | 58 (4.8%) |
| $12,500 to $14,999 | 39 (2.7%) | 45 (3.7%) |
| $15,000 to $17,499 | 18 (1.3%) | 36 (3.0%) |
| $17,500 to $19,999 | 35 (2.5%) | 3 (0.3%) |
| $20,000 to $22,499 | 150 (10.5%) | 21 (1.7%) |
| $22,500 to $24,999 | 160 (11.2%) | 39 (3.2%) |
| $25,000 to $29,999 | 42 (2.9%) | 28 (2.3%) |
| $30,000 to $34,999 | 39 (2.7%) | 70 (5.8%) |
| $35,000 to $39,999 | 42 (2.9%) | 106 (8.7%) |
| $40,000 to $44,999 | 51 (3.6%) | 46 (3.8%) |
| $45,000 to $49,999 | 57 (4.0%) | 120 (9.9%) |
| $50,000 to $54,999 | 28 (2.0%) | 75 (6.2%) |
| $55,000 to $64,999 | 84 (5.9%) | 143 (11.7%) |
| $65,000 to $74,999 | 75 (5.3%) | 22 (1.8%) |
| $75,000 to $99,999 | 139 (9.7%) | 179 (14.7%) |
| $100,000+ | 264 (18.5%) | 21 (1.7%) |
| Total | 1,427 (100.0%) | 1,218 (100.0%) |
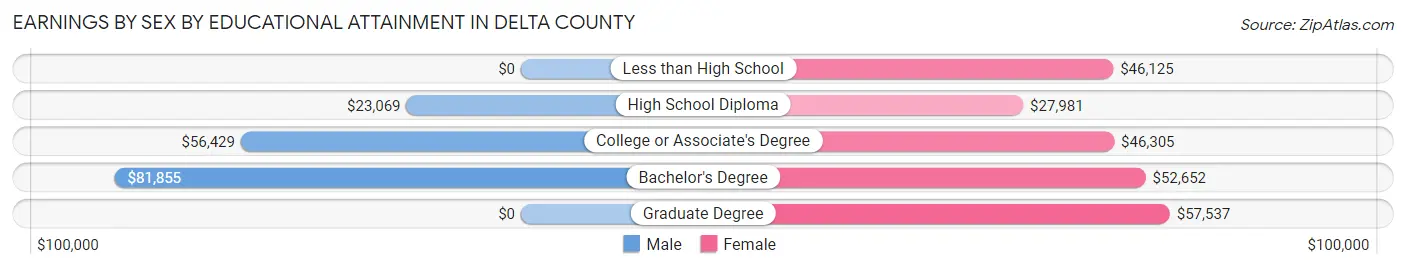
Earnings by Sex by Educational Attainment in Delta County
Average earnings in Delta County are $43,209 for men and $45,521 for women, a difference of 5.1%. Men with an educational attainment of bachelor's degree enjoy the highest average annual earnings of $81,855, while those with high school diploma education earn the least with $23,069. Women with an educational attainment of graduate degree earn the most with the average annual earnings of $57,537, while those with high school diploma education have the smallest earnings of $27,981.
| Educational Attainment | Male Income | Female Income |
| Less than High School | - | - |
| High School Diploma | $23,069 | $27,981 |
| College or Associate's Degree | $56,429 | $46,305 |
| Bachelor's Degree | $81,855 | $52,652 |
| Graduate Degree | - | - |
| Total | $43,209 | $45,521 |
Family Income in Delta County
Family Income Brackets in Delta County
According to the Delta County family income data, there are 388 families falling into the $100,000 to $149,999 income range, which is the most common income bracket and makes up 24.9% of all families. Conversely, the $10,000 to $14,999 income bracket is the least frequent group with only 25 families (1.6%) belonging to this category.
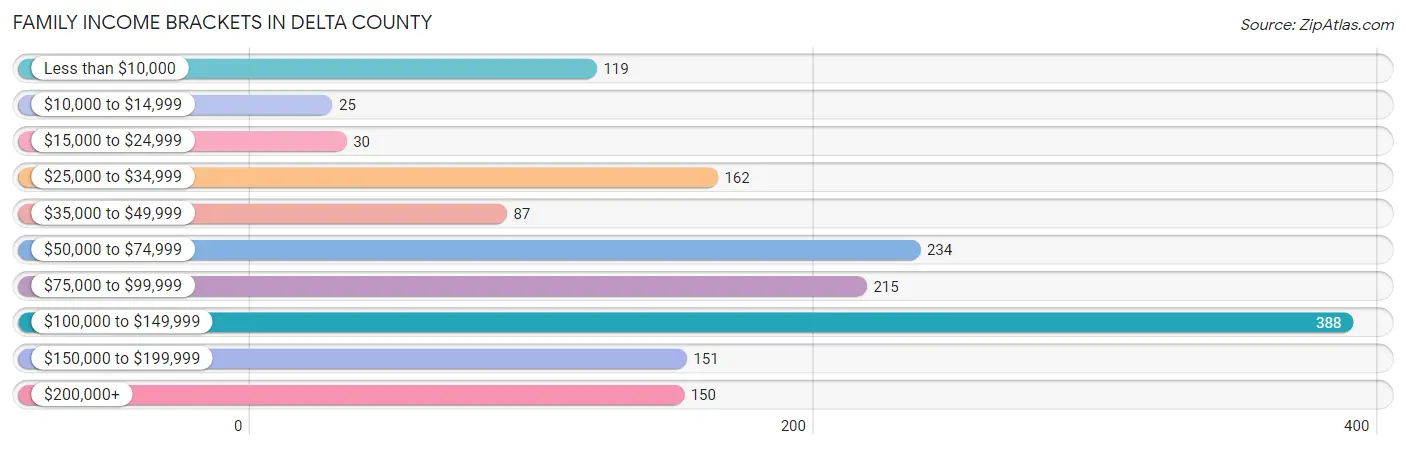
| Income Bracket | # Families | % Families |
| Less than $10,000 | 119 | 7.6% |
| $10,000 to $14,999 | 25 | 1.6% |
| $15,000 to $24,999 | 30 | 1.9% |
| $25,000 to $34,999 | 162 | 10.4% |
| $35,000 to $49,999 | 87 | 5.6% |
| $50,000 to $74,999 | 234 | 15.0% |
| $75,000 to $99,999 | 215 | 13.8% |
| $100,000 to $149,999 | 388 | 24.9% |
| $150,000 to $199,999 | 151 | 9.7% |
| $200,000+ | 150 | 9.6% |
Family Income by Famaliy Size in Delta County
6-person families (56 | 3.6%) account for the highest median family income in Delta County with $211,643 per family, while 6-person families (56 | 3.6%) have the highest median income of $35,274 per family member.
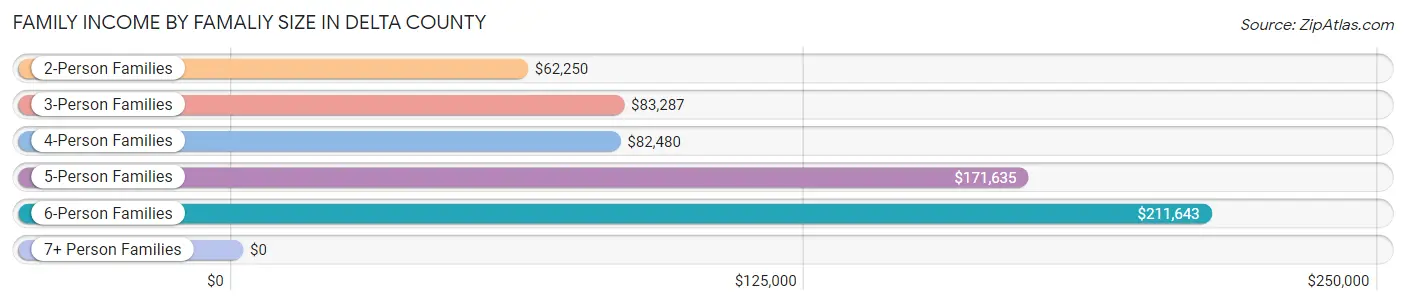
| Income Bracket | # Families | Median Income |
| 2-Person Families | 817 (52.4%) | $62,250 |
| 3-Person Families | 261 (16.7%) | $83,287 |
| 4-Person Families | 283 (18.1%) | $82,480 |
| 5-Person Families | 125 (8.0%) | $171,635 |
| 6-Person Families | 56 (3.6%) | $211,643 |
| 7+ Person Families | 18 (1.1%) | $0 |
| Total | 1,560 (100.0%) | $82,679 |
Family Income by Number of Earners in Delta County
The median family income in Delta County is $82,679, with families comprising 3+ earners (170) having the highest median family income of $134,231, while families with no earners (285) have the lowest median family income of $29,596, accounting for 10.9% and 18.3% of families, respectively.
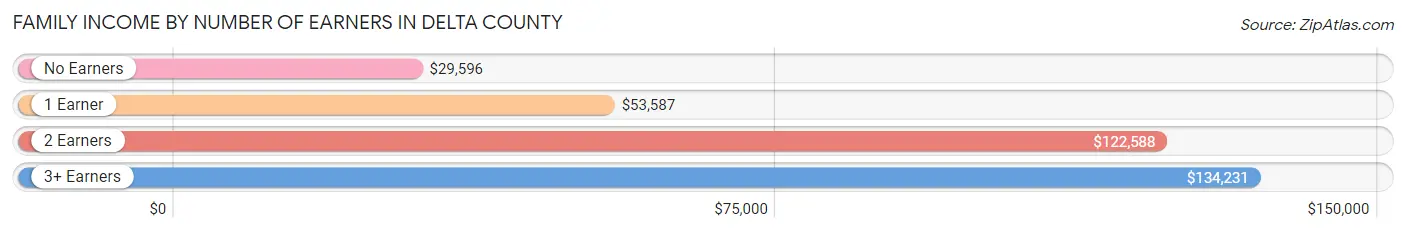
| Number of Earners | # Families | Median Income |
| No Earners | 285 (18.3%) | $29,596 |
| 1 Earner | 402 (25.8%) | $53,587 |
| 2 Earners | 703 (45.1%) | $122,588 |
| 3+ Earners | 170 (10.9%) | $134,231 |
| Total | 1,560 (100.0%) | $82,679 |
Household Income in Delta County
Household Income Brackets in Delta County
With 459 households falling in the category, the $100,000 to $149,999 income range is the most frequent in Delta County, accounting for 21.8% of all households. In contrast, only 57 households (2.7%) fall into the $10,000 to $14,999 income bracket, making it the least populous group.
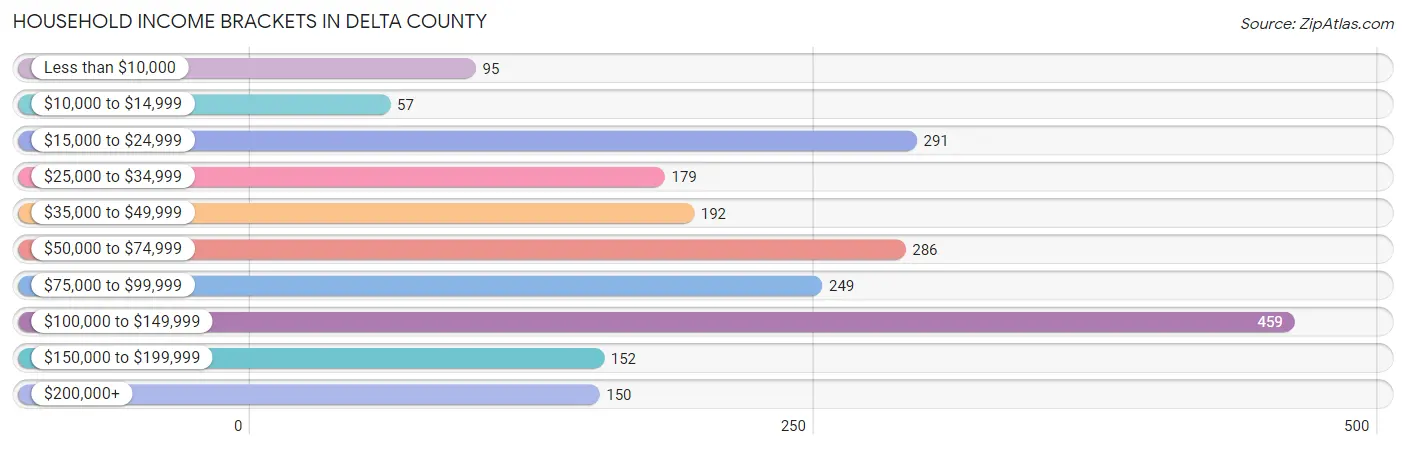
| Income Bracket | # Households | % Households |
| Less than $10,000 | 95 | 4.5% |
| $10,000 to $14,999 | 57 | 2.7% |
| $15,000 to $24,999 | 291 | 13.8% |
| $25,000 to $34,999 | 179 | 8.5% |
| $35,000 to $49,999 | 192 | 9.1% |
| $50,000 to $74,999 | 286 | 13.6% |
| $75,000 to $99,999 | 249 | 11.8% |
| $100,000 to $149,999 | 459 | 21.8% |
| $150,000 to $199,999 | 152 | 7.2% |
| $200,000+ | 150 | 7.1% |
Household Income by Householder Age in Delta County
The median household income in Delta County is $68,491, with the highest median household income of $103,750 found in the 45 to 64 years age bracket for the primary householder. A total of 669 households (31.8%) fall into this category. Meanwhile, the 15 to 24 years age bracket for the primary householder has the lowest median household income of $0, with 80 households (3.8%) in this group.
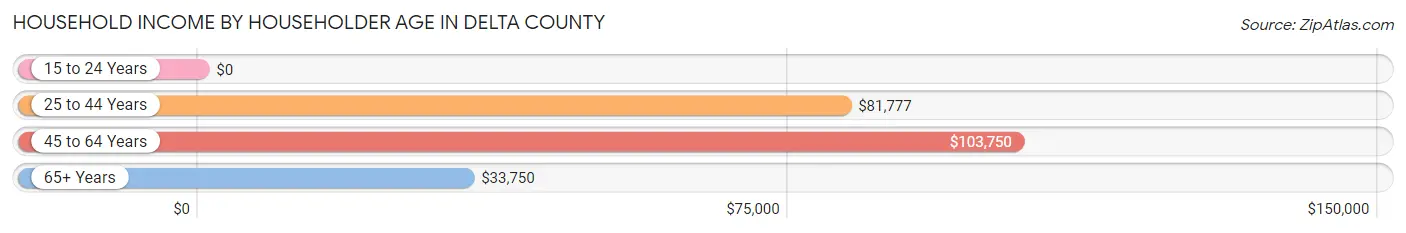
| Income Bracket | # Households | Median Income |
| 15 to 24 Years | 80 (3.8%) | $0 |
| 25 to 44 Years | 695 (33.0%) | $81,777 |
| 45 to 64 Years | 669 (31.8%) | $103,750 |
| 65+ Years | 662 (31.4%) | $33,750 |
| Total | 2,106 (100.0%) | $68,491 |
Poverty in Delta County
Income Below Poverty by Sex and Age in Delta County
With 11.9% poverty level for males and 16.0% for females among the residents of Delta County, 6 to 11 year old males and under 5 year old females are the most vulnerable to poverty, with 63 males (31.2%) and 121 females (43.7%) in their respective age groups living below the poverty level.
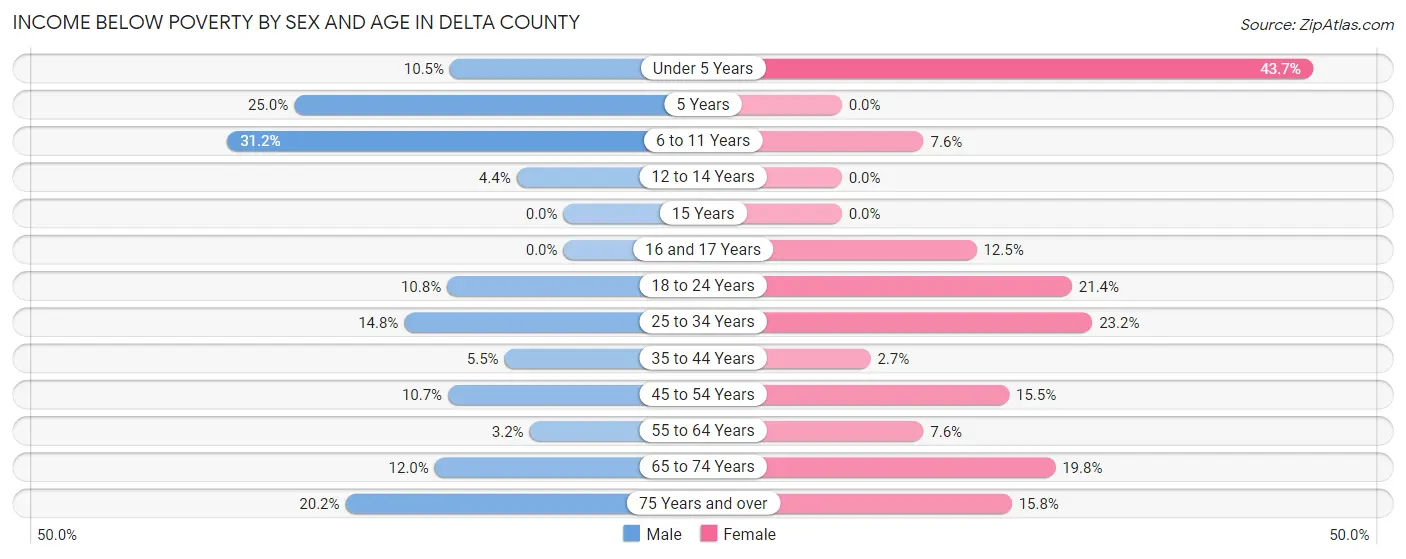
| Age Bracket | Male | Female |
| Under 5 Years | 12 (10.5%) | 121 (43.7%) |
| 5 Years | 3 (25.0%) | 0 (0.0%) |
| 6 to 11 Years | 63 (31.2%) | 12 (7.6%) |
| 12 to 14 Years | 3 (4.3%) | 0 (0.0%) |
| 15 Years | 0 (0.0%) | 0 (0.0%) |
| 16 and 17 Years | 0 (0.0%) | 10 (12.5%) |
| 18 to 24 Years | 23 (10.8%) | 38 (21.3%) |
| 25 to 34 Years | 48 (14.8%) | 96 (23.2%) |
| 35 to 44 Years | 15 (5.5%) | 8 (2.7%) |
| 45 to 54 Years | 33 (10.7%) | 43 (15.5%) |
| 55 to 64 Years | 11 (3.2%) | 28 (7.6%) |
| 65 to 74 Years | 35 (11.9%) | 64 (19.8%) |
| 75 Years and over | 35 (20.2%) | 35 (15.8%) |
| Total | 281 (11.9%) | 455 (16.0%) |
Income Above Poverty by Sex and Age in Delta County
According to the poverty statistics in Delta County, males aged 15 years and females aged 5 years are the age groups that are most secure financially, with 100.0% of males and 100.0% of females in these age groups living above the poverty line.
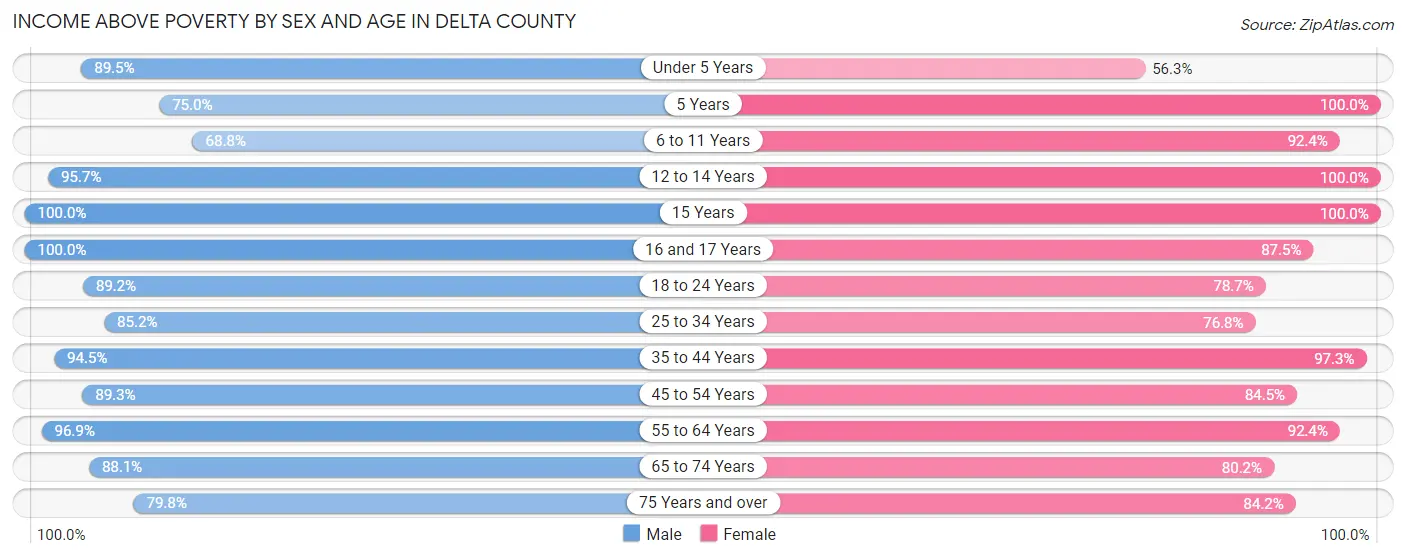
| Age Bracket | Male | Female |
| Under 5 Years | 102 (89.5%) | 156 (56.3%) |
| 5 Years | 9 (75.0%) | 30 (100.0%) |
| 6 to 11 Years | 139 (68.8%) | 146 (92.4%) |
| 12 to 14 Years | 66 (95.7%) | 134 (100.0%) |
| 15 Years | 20 (100.0%) | 83 (100.0%) |
| 16 and 17 Years | 17 (100.0%) | 70 (87.5%) |
| 18 to 24 Years | 190 (89.2%) | 140 (78.6%) |
| 25 to 34 Years | 277 (85.2%) | 317 (76.8%) |
| 35 to 44 Years | 259 (94.5%) | 293 (97.3%) |
| 45 to 54 Years | 275 (89.3%) | 234 (84.5%) |
| 55 to 64 Years | 338 (96.9%) | 342 (92.4%) |
| 65 to 74 Years | 258 (88.0%) | 259 (80.2%) |
| 75 Years and over | 138 (79.8%) | 187 (84.2%) |
| Total | 2,088 (88.1%) | 2,391 (84.0%) |
Income Below Poverty Among Married-Couple Families in Delta County
The poverty statistics for married-couple families in Delta County show that 4.0% or 50 of the total 1,259 families live below the poverty line. Families with no children have the highest poverty rate of 4.8%, comprising of 39 families. On the other hand, families with 1 or 2 children have the lowest poverty rate of 2.2%, which includes 7 families.
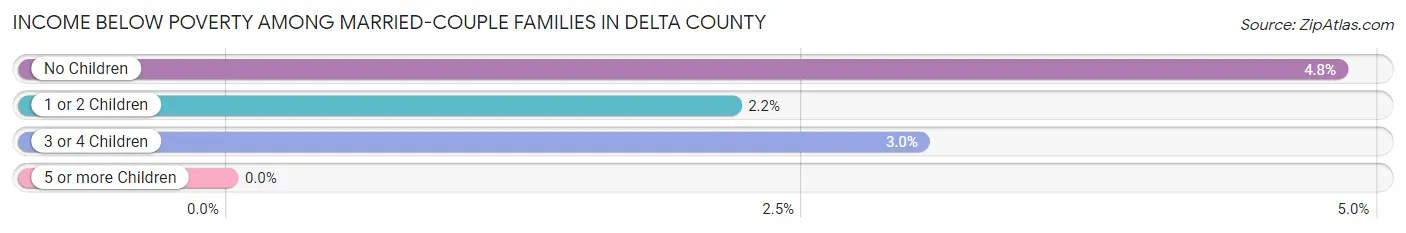
| Children | Above Poverty | Below Poverty |
| No Children | 768 (95.2%) | 39 (4.8%) |
| 1 or 2 Children | 312 (97.8%) | 7 (2.2%) |
| 3 or 4 Children | 129 (97.0%) | 4 (3.0%) |
| 5 or more Children | 0 (0.0%) | 0 (0.0%) |
| Total | 1,209 (96.0%) | 50 (4.0%) |
Income Below Poverty Among Single-Parent Households in Delta County
According to the poverty data in Delta County, 30.2% or 42 single-father households and 42.0% or 68 single-mother households are living below the poverty line. Among single-father households, those with 1 or 2 children have the highest poverty rate, with 37 households (38.5%) experiencing poverty. Likewise, among single-mother households, those with 3 or 4 children have the highest poverty rate, with 12 households (100.0%) falling below the poverty line.
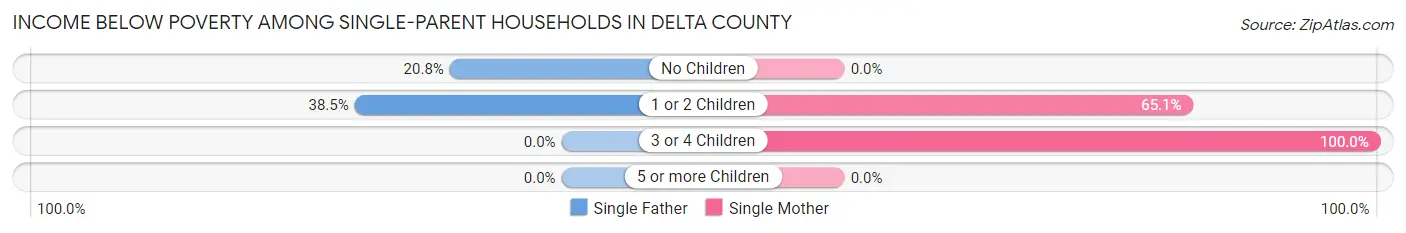
| Children | Single Father | Single Mother |
| No Children | 5 (20.8%) | 0 (0.0%) |
| 1 or 2 Children | 37 (38.5%) | 56 (65.1%) |
| 3 or 4 Children | 0 (0.0%) | 12 (100.0%) |
| 5 or more Children | 0 (0.0%) | 0 (0.0%) |
| Total | 42 (30.2%) | 68 (42.0%) |
Income Below Poverty Among Married-Couple vs Single-Parent Households in Delta County
The poverty data for Delta County shows that 50 of the married-couple family households (4.0%) and 110 of the single-parent households (36.5%) are living below the poverty level. Within the married-couple family households, those with no children have the highest poverty rate, with 39 households (4.8%) falling below the poverty line. Among the single-parent households, those with 1 or 2 children have the highest poverty rate, with 93 household (51.1%) living below poverty.
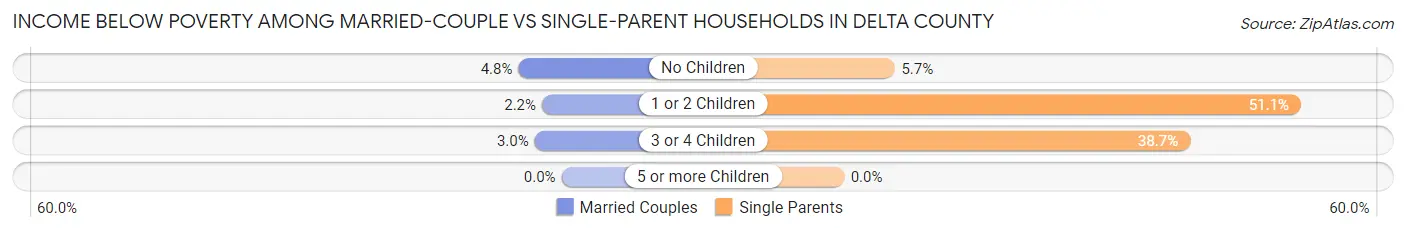
| Children | Married-Couple Families | Single-Parent Households |
| No Children | 39 (4.8%) | 5 (5.7%) |
| 1 or 2 Children | 7 (2.2%) | 93 (51.1%) |
| 3 or 4 Children | 4 (3.0%) | 12 (38.7%) |
| 5 or more Children | 0 (0.0%) | 0 (0.0%) |
| Total | 50 (4.0%) | 110 (36.5%) |
Race in Delta County
The most populous races in Delta County are White / Caucasian (4,370 | 82.8%), Hispanic or Latino (499 | 9.5%), and Black / African American (462 | 8.7%).
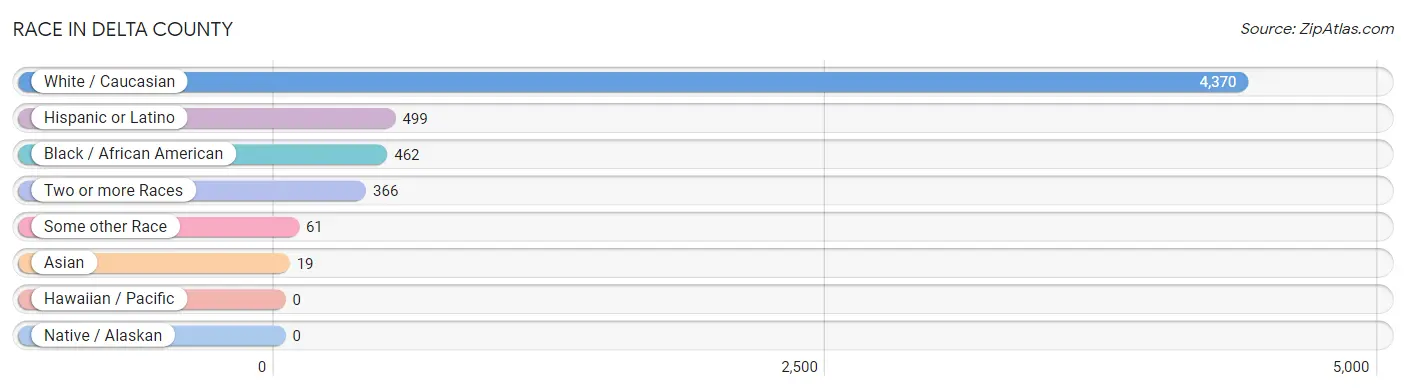
| Race | # Population | % Population |
| Asian | 19 | 0.4% |
| Black / African American | 462 | 8.7% |
| Hawaiian / Pacific | 0 | 0.0% |
| Hispanic or Latino | 499 | 9.5% |
| Native / Alaskan | 0 | 0.0% |
| White / Caucasian | 4,370 | 82.8% |
| Two or more Races | 366 | 6.9% |
| Some other Race | 61 | 1.2% |
| Total | 5,278 | 100.0% |
Ancestry in Delta County
The most populous ancestries reported in Delta County are Irish (534 | 10.1%), American (509 | 9.6%), Mexican (491 | 9.3%), English (426 | 8.1%), and German (375 | 7.1%), together accounting for 44.2% of all Delta County residents.
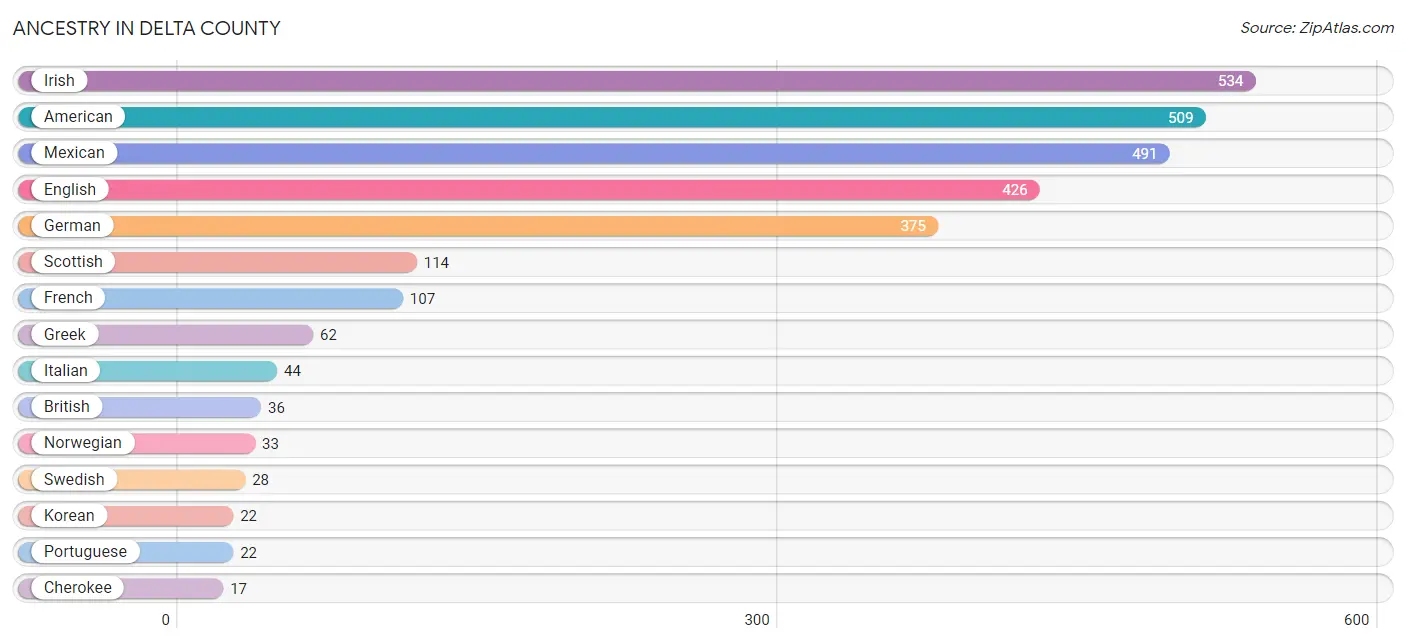
| Ancestry | # Population | % Population |
| American | 509 | 9.6% |
| British | 36 | 0.7% |
| Cherokee | 17 | 0.3% |
| Choctaw | 6 | 0.1% |
| Czech | 4 | 0.1% |
| Dutch | 11 | 0.2% |
| Eastern European | 9 | 0.2% |
| English | 426 | 8.1% |
| European | 13 | 0.3% |
| French | 107 | 2.0% |
| German | 375 | 7.1% |
| Greek | 62 | 1.2% |
| Irish | 534 | 10.1% |
| Italian | 44 | 0.8% |
| Japanese | 6 | 0.1% |
| Korean | 22 | 0.4% |
| Latvian | 14 | 0.3% |
| Mexican | 491 | 9.3% |
| Norwegian | 33 | 0.6% |
| Polish | 4 | 0.1% |
| Portuguese | 22 | 0.4% |
| Puerto Rican | 8 | 0.2% |
| Scotch-Irish | 13 | 0.3% |
| Scottish | 114 | 2.2% |
| Swedish | 28 | 0.5% |
| Welsh | 16 | 0.3% | View All 26 Rows |
Immigrants in Delta County
The most numerous immigrant groups reported in Delta County came from Central America (47 | 0.9%), Latin America (47 | 0.9%), Mexico (47 | 0.9%), Asia (19 | 0.4%), and South Eastern Asia (19 | 0.4%), together accounting for 3.4% of all Delta County residents.
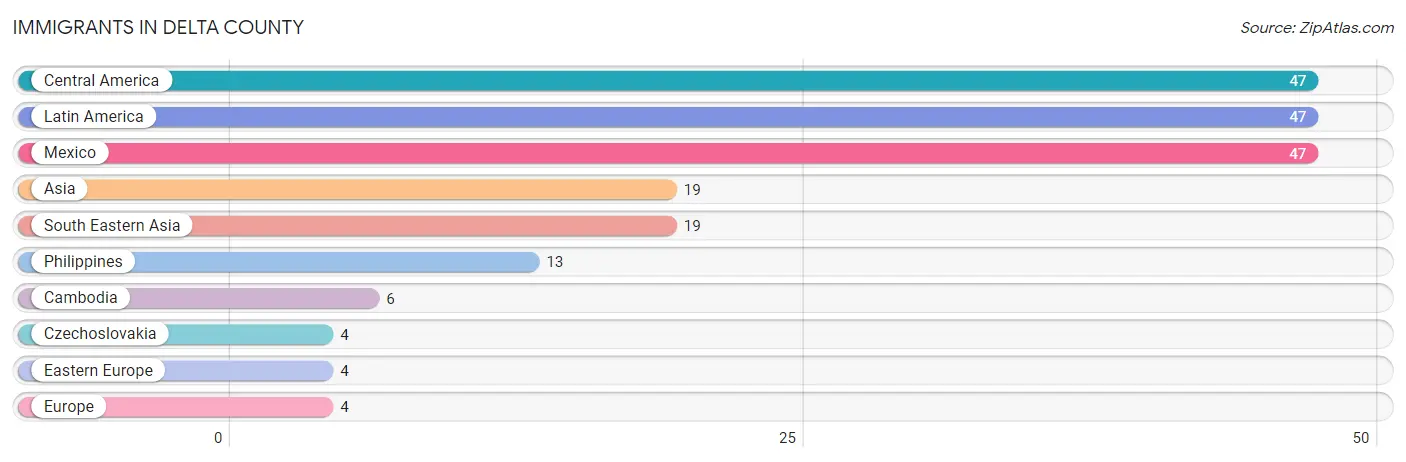
| Immigration Origin | # Population | % Population |
| Asia | 19 | 0.4% |
| Cambodia | 6 | 0.1% |
| Central America | 47 | 0.9% |
| Czechoslovakia | 4 | 0.1% |
| Eastern Europe | 4 | 0.1% |
| Europe | 4 | 0.1% |
| Latin America | 47 | 0.9% |
| Mexico | 47 | 0.9% |
| Philippines | 13 | 0.3% |
| South Eastern Asia | 19 | 0.4% | View All 10 Rows |
Sex and Age in Delta County
Sex and Age in Delta County
The most populous age groups in Delta County are 30 to 34 Years (251 | 10.4%) for men and Under 5 Years (277 | 9.6%) for women.
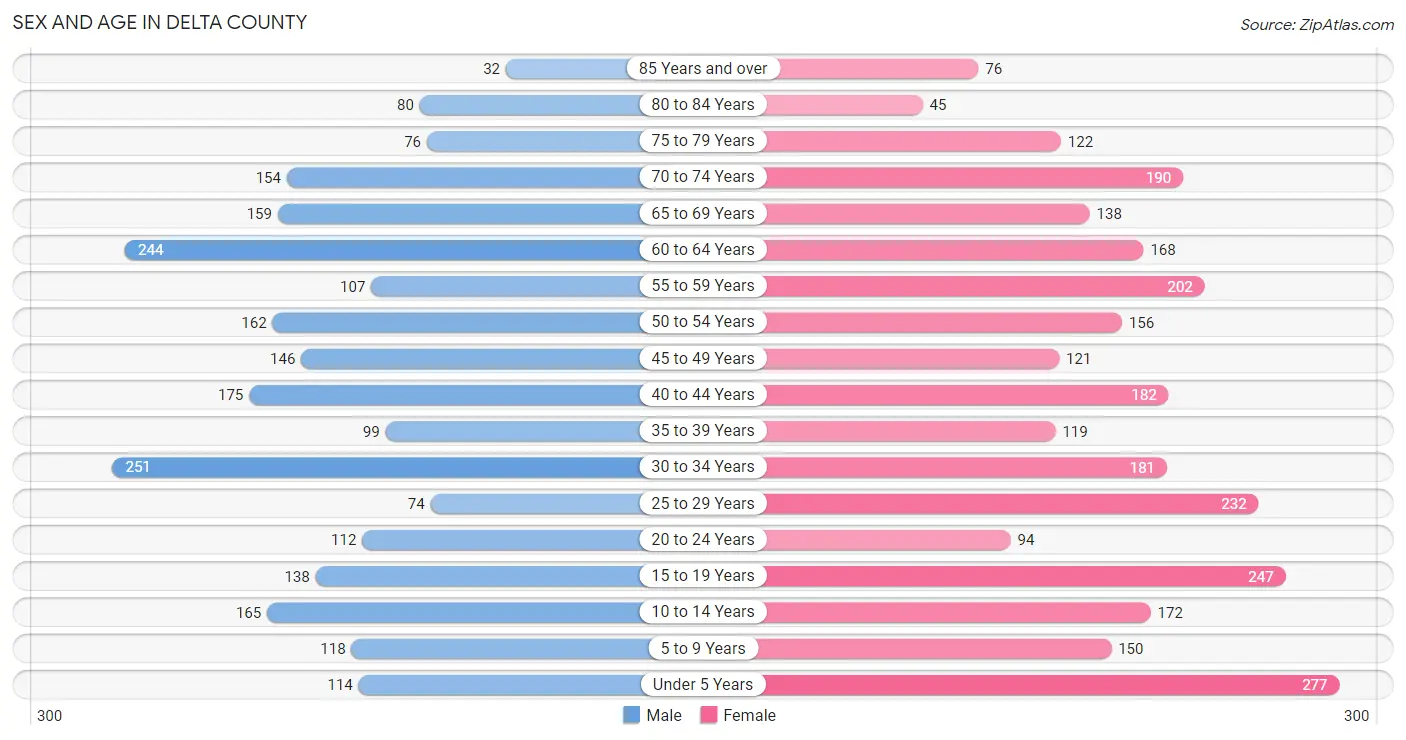
| Age Bracket | Male | Female |
| Under 5 Years | 114 (4.7%) | 277 (9.6%) |
| 5 to 9 Years | 118 (4.9%) | 150 (5.2%) |
| 10 to 14 Years | 165 (6.9%) | 172 (6.0%) |
| 15 to 19 Years | 138 (5.7%) | 247 (8.6%) |
| 20 to 24 Years | 112 (4.7%) | 94 (3.3%) |
| 25 to 29 Years | 74 (3.1%) | 232 (8.1%) |
| 30 to 34 Years | 251 (10.4%) | 181 (6.3%) |
| 35 to 39 Years | 99 (4.1%) | 119 (4.1%) |
| 40 to 44 Years | 175 (7.3%) | 182 (6.3%) |
| 45 to 49 Years | 146 (6.1%) | 121 (4.2%) |
| 50 to 54 Years | 162 (6.7%) | 156 (5.4%) |
| 55 to 59 Years | 107 (4.4%) | 202 (7.0%) |
| 60 to 64 Years | 244 (10.1%) | 168 (5.9%) |
| 65 to 69 Years | 159 (6.6%) | 138 (4.8%) |
| 70 to 74 Years | 154 (6.4%) | 190 (6.6%) |
| 75 to 79 Years | 76 (3.2%) | 122 (4.3%) |
| 80 to 84 Years | 80 (3.3%) | 45 (1.6%) |
| 85 Years and over | 32 (1.3%) | 76 (2.6%) |
| Total | 2,406 (100.0%) | 2,872 (100.0%) |
Families and Households in Delta County
Median Family Size in Delta County
The median family size in Delta County is 2.82 persons per family, with married-couple families (1,259 | 80.7%) accounting for the largest median family size of 2.88 persons per family. On the other hand, single male/father families (139 | 8.9%) represent the smallest median family size with 2.43 persons per family.
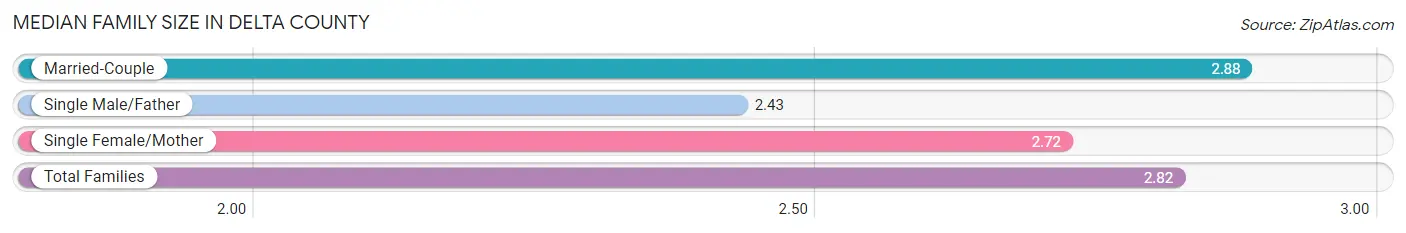
| Family Type | # Families | Family Size |
| Married-Couple | 1,259 (80.7%) | 2.88 |
| Single Male/Father | 139 (8.9%) | 2.43 |
| Single Female/Mother | 162 (10.4%) | 2.72 |
| Total Families | 1,560 (100.0%) | 2.82 |
Median Household Size in Delta County
The median household size in Delta County is 2.48 persons per household, with single female/mother households (162 | 7.7%) accounting for the largest median household size of 3.12 persons per household. non-family households (546 | 25.9%) represent the smallest median household size with 1.20 persons per household.
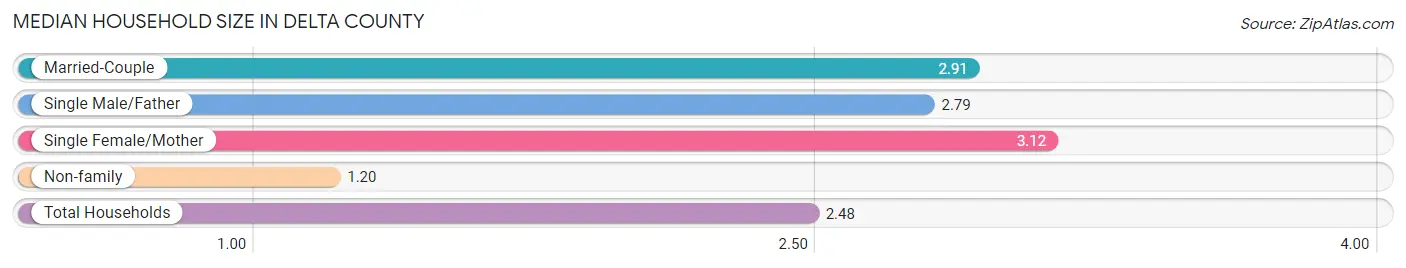
| Household Type | # Households | Household Size |
| Married-Couple | 1,259 (59.8%) | 2.91 |
| Single Male/Father | 139 (6.6%) | 2.79 |
| Single Female/Mother | 162 (7.7%) | 3.12 |
| Non-family | 546 (25.9%) | 1.20 |
| Total Households | 2,106 (100.0%) | 2.48 |
Household Size by Marriage Status in Delta County
Out of a total of 2,106 households in Delta County, 1,560 (74.1%) are family households, while 546 (25.9%) are nonfamily households. The most numerous type of family households are 2-person households, comprising 775, and the most common type of nonfamily households are 1-person households, comprising 430.
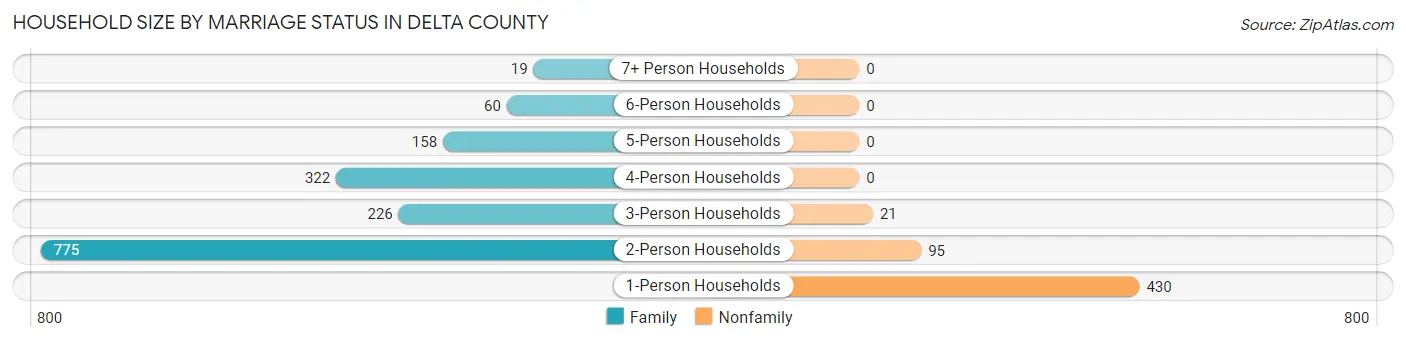
| Household Size | Family Households | Nonfamily Households |
| 1-Person Households | - | 430 (20.4%) |
| 2-Person Households | 775 (36.8%) | 95 (4.5%) |
| 3-Person Households | 226 (10.7%) | 21 (1.0%) |
| 4-Person Households | 322 (15.3%) | 0 (0.0%) |
| 5-Person Households | 158 (7.5%) | 0 (0.0%) |
| 6-Person Households | 60 (2.9%) | 0 (0.0%) |
| 7+ Person Households | 19 (0.9%) | 0 (0.0%) |
| Total | 1,560 (74.1%) | 546 (25.9%) |
Female Fertility in Delta County
Fertility by Age in Delta County
Average fertility rate in Delta County is 25.0 births per 1,000 women. Women in the age bracket of 20 to 34 years have the highest fertility rate with 57.0 births per 1,000 women. Women in the age bracket of 20 to 34 years acount for 96.7% of all women with births.
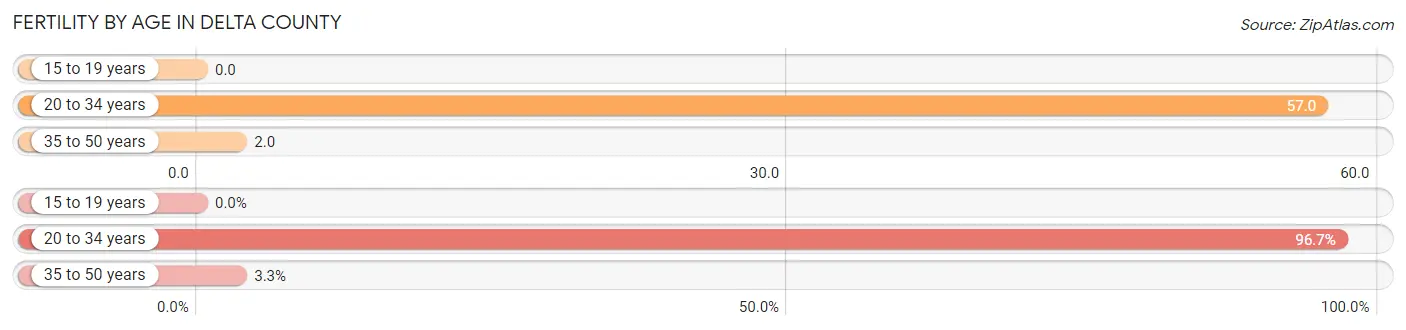
| Age Bracket | Women with Births | Births / 1,000 Women |
| 15 to 19 years | 0 (0.0%) | 0.0 |
| 20 to 34 years | 29 (96.7%) | 57.0 |
| 35 to 50 years | 1 (3.3%) | 2.0 |
| Total | 30 (100.0%) | 25.0 |
Fertility by Age by Marriage Status in Delta County
60.0% of women with births (30) in Delta County are married. The highest percentage of unmarried women with births falls into 35 to 50 years age bracket with 100.0% of them unmarried at the time of birth, while the lowest percentage of unmarried women with births belong to 20 to 34 years age bracket with 37.9% of them unmarried.
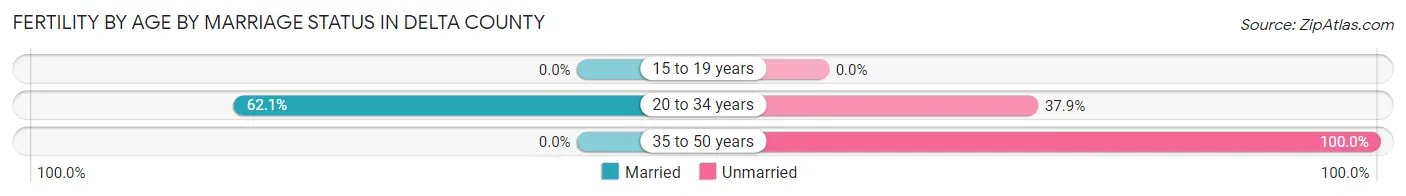
| Age Bracket | Married | Unmarried |
| 15 to 19 years | 0 (0.0%) | 0 (0.0%) |
| 20 to 34 years | 18 (62.1%) | 11 (37.9%) |
| 35 to 50 years | 0 (0.0%) | 1 (100.0%) |
| Total | 18 (60.0%) | 12 (40.0%) |
Fertility by Education in Delta County
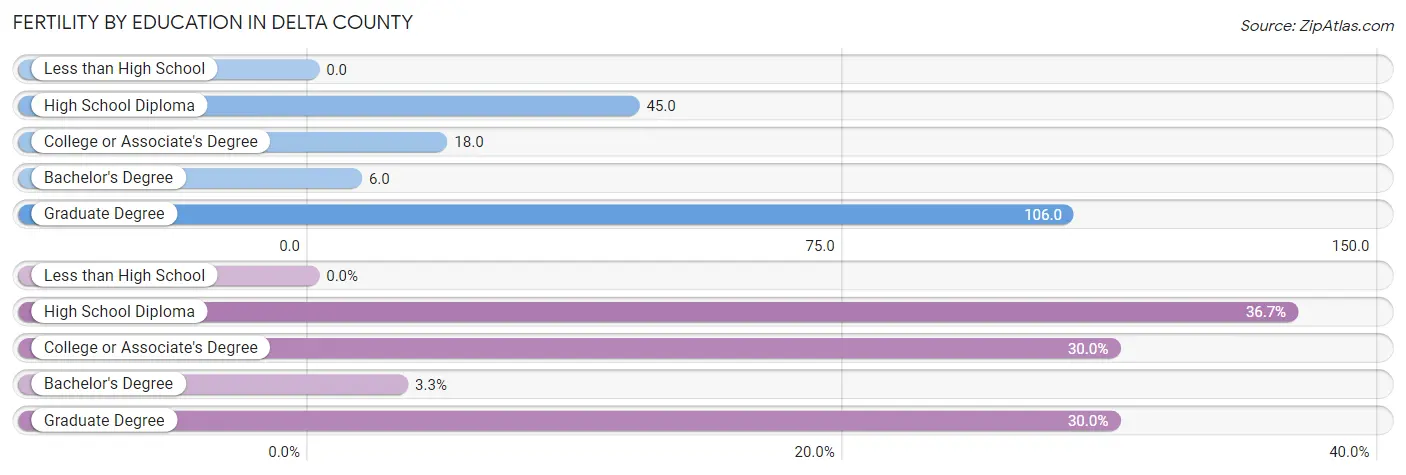
| Educational Attainment | Women with Births | Births / 1,000 Women |
| Less than High School | 0 (0.0%) | 0.0 |
| High School Diploma | 11 (36.7%) | 45.0 |
| College or Associate's Degree | 9 (30.0%) | 18.0 |
| Bachelor's Degree | 1 (3.3%) | 6.0 |
| Graduate Degree | 9 (30.0%) | 106.0 |
| Total | 30 (100.0%) | 25.0 |
Fertility by Education by Marriage Status in Delta County
40.0% of women with births in Delta County are unmarried. Women with the educational attainment of college or associate's degree are most likely to be married with 100.0% of them married at childbirth, while women with the educational attainment of high school diploma are least likely to be married with 100.0% of them unmarried at childbirth.
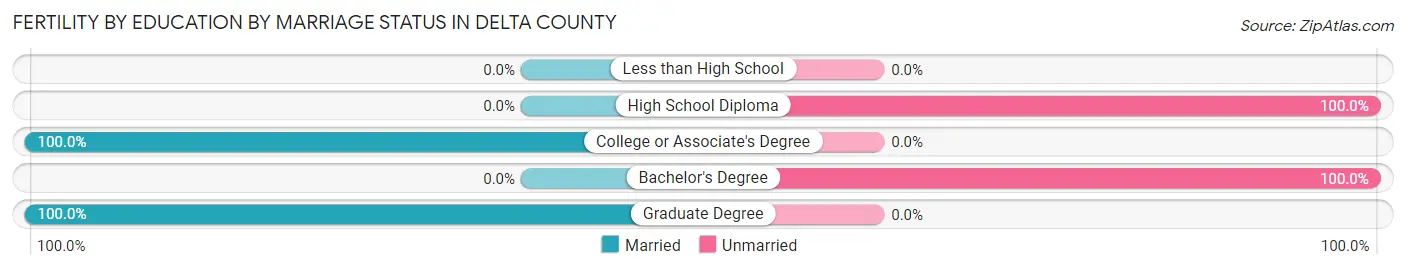
| Educational Attainment | Married | Unmarried |
| Less than High School | 0 (0.0%) | 0 (0.0%) |
| High School Diploma | 0 (0.0%) | 11 (100.0%) |
| College or Associate's Degree | 9 (100.0%) | 0 (0.0%) |
| Bachelor's Degree | 0 (0.0%) | 1 (100.0%) |
| Graduate Degree | 9 (100.0%) | 0 (0.0%) |
| Total | 18 (60.0%) | 12 (40.0%) |
Employment Characteristics in Delta County
Employment by Class of Employer in Delta County
Among the 2,279 employed individuals in Delta County, private company employees (1,348 | 59.2%), local government employees (237 | 10.4%), and self-employed (not incorporated) (221 | 9.7%) make up the most common classes of employment.
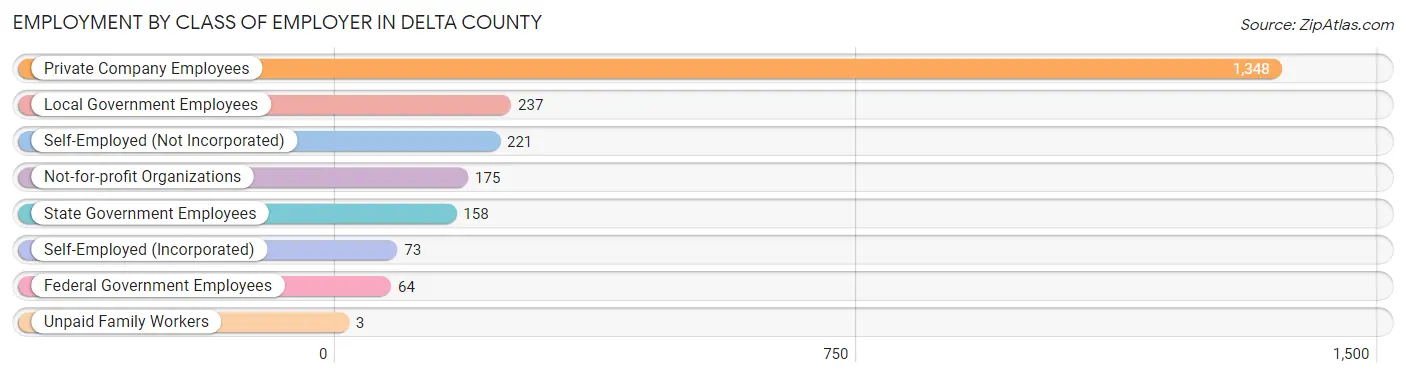
| Employer Class | # Employees | % Employees |
| Private Company Employees | 1,348 | 59.2% |
| Self-Employed (Incorporated) | 73 | 3.2% |
| Self-Employed (Not Incorporated) | 221 | 9.7% |
| Not-for-profit Organizations | 175 | 7.7% |
| Local Government Employees | 237 | 10.4% |
| State Government Employees | 158 | 6.9% |
| Federal Government Employees | 64 | 2.8% |
| Unpaid Family Workers | 3 | 0.1% |
| Total | 2,279 | 100.0% |
Employment Status by Age in Delta County
According to the labor force statistics for Delta County, out of the total population over 16 years of age (4,179), 59.0% or 2,466 individuals are in the labor force, with 6.4% or 158 of them unemployed. The age group with the highest labor force participation rate is 35 to 44 years, with 94.8% or 545 individuals in the labor force. Within the labor force, the 30 to 34 years age range has the highest percentage of unemployed individuals, with 33.3% or 123 of them being unemployed.
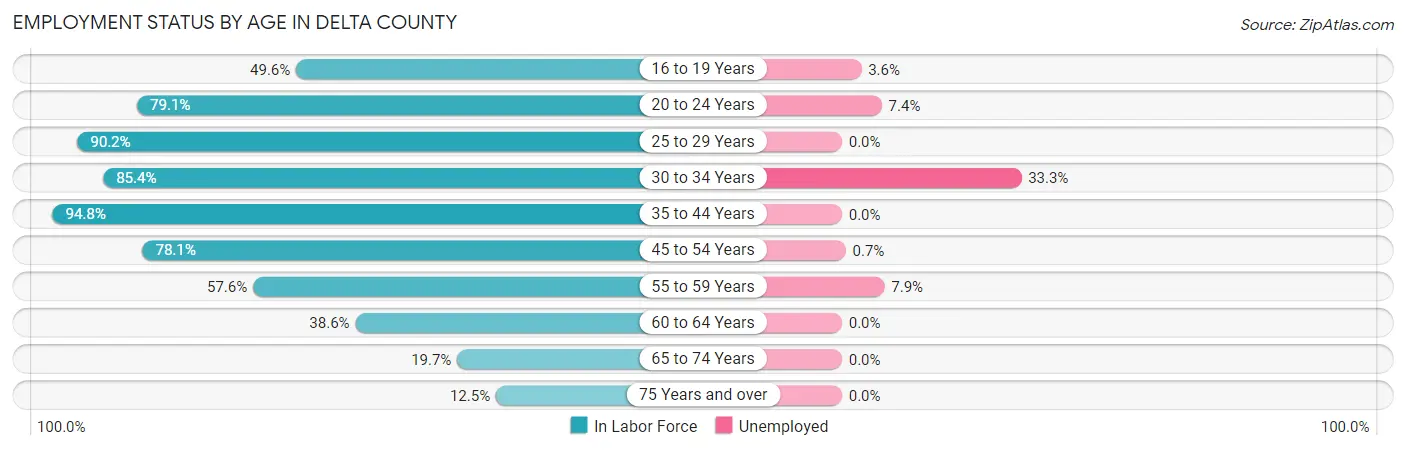
| Age Bracket | In Labor Force | Unemployed |
| 16 to 19 Years | 140 (49.6%) | 5 (3.6%) |
| 20 to 24 Years | 163 (79.1%) | 12 (7.4%) |
| 25 to 29 Years | 276 (90.2%) | 0 (0.0%) |
| 30 to 34 Years | 369 (85.4%) | 123 (33.3%) |
| 35 to 44 Years | 545 (94.8%) | 0 (0.0%) |
| 45 to 54 Years | 457 (78.1%) | 3 (0.7%) |
| 55 to 59 Years | 178 (57.6%) | 14 (7.9%) |
| 60 to 64 Years | 159 (38.6%) | 0 (0.0%) |
| 65 to 74 Years | 126 (19.7%) | 0 (0.0%) |
| 75 Years and over | 54 (12.5%) | 0 (0.0%) |
| Total | 2,466 (59.0%) | 158 (6.4%) |
Employment Status by Educational Attainment in Delta County
According to labor force statistics for Delta County, 75.8% of individuals (1,985) out of the total population between 25 and 64 years of age (2,619) are in the labor force, with 7.1% or 141 of them being unemployed. The group with the highest labor force participation rate are those with the educational attainment of bachelor's degree or higher, with 86.7% or 517 individuals in the labor force. Within the labor force, individuals with high school diploma education have the highest percentage of unemployment, with 23.3% or 123 of them being unemployed.

| Educational Attainment | In Labor Force | Unemployed |
| Less than High School | 168 (83.6%) | 0 (0.0%) |
| High School Diploma | 528 (60.1%) | 205 (23.3%) |
| College / Associate Degree | 771 (81.8%) | 21 (2.2%) |
| Bachelor's Degree or higher | 517 (86.7%) | 0 (0.0%) |
| Total | 1,985 (75.8%) | 186 (7.1%) |
Employment Occupations by Sex in Delta County
Management, Business, Science and Arts Occupations
The most common Management, Business, Science and Arts occupations in Delta County are Management (299 | 12.9%), Community & Social Service (242 | 10.5%), Health Diagnosing & Treating (210 | 9.1%), Health Technologists (180 | 7.8%), and Education Instruction & Library (175 | 7.6%).
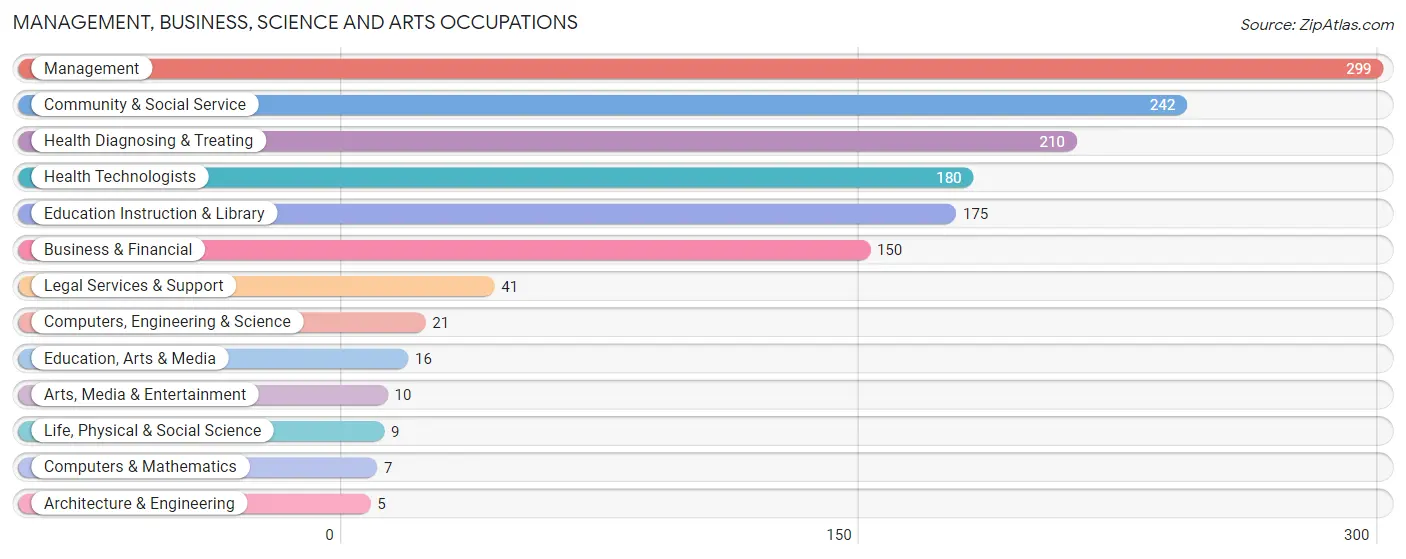
Management, Business, Science and Arts Occupations by Sex
Within the Management, Business, Science and Arts occupations in Delta County, the most male-oriented occupations are Architecture & Engineering (100.0%), Computers & Mathematics (71.4%), and Management (67.9%), while the most female-oriented occupations are Life, Physical & Social Science (100.0%), Arts, Media & Entertainment (100.0%), and Health Technologists (100.0%).
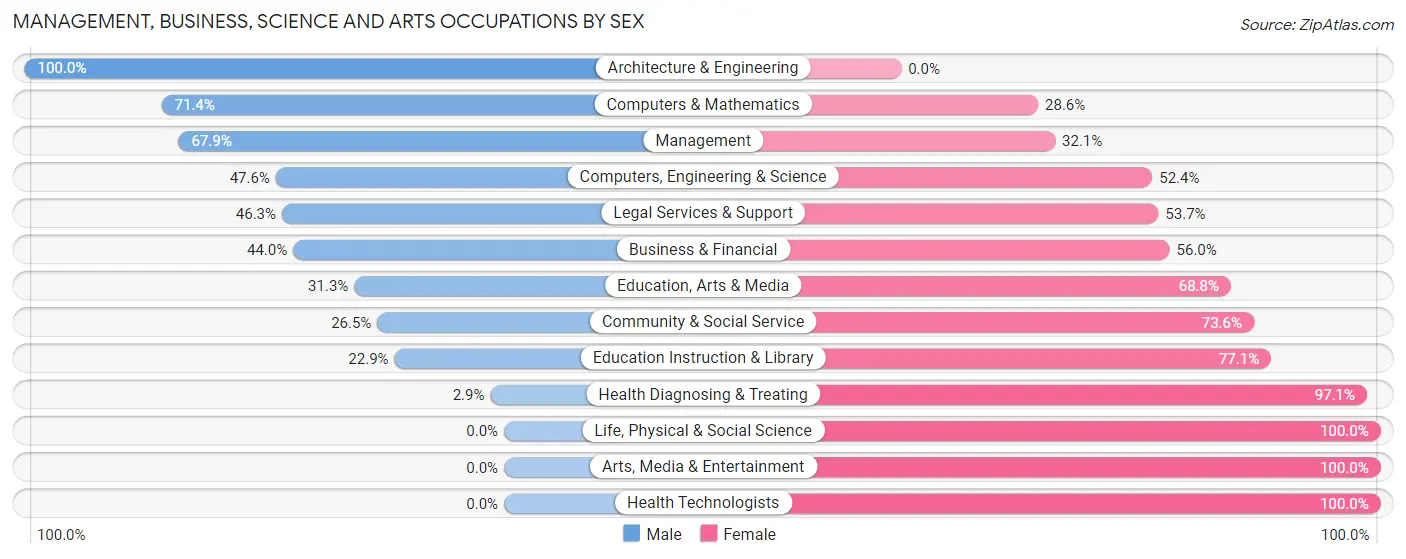
| Occupation | Male | Female |
| Management | 203 (67.9%) | 96 (32.1%) |
| Business & Financial | 66 (44.0%) | 84 (56.0%) |
| Computers, Engineering & Science | 10 (47.6%) | 11 (52.4%) |
| Computers & Mathematics | 5 (71.4%) | 2 (28.6%) |
| Architecture & Engineering | 5 (100.0%) | 0 (0.0%) |
| Life, Physical & Social Science | 0 (0.0%) | 9 (100.0%) |
| Community & Social Service | 64 (26.5%) | 178 (73.6%) |
| Education, Arts & Media | 5 (31.2%) | 11 (68.8%) |
| Legal Services & Support | 19 (46.3%) | 22 (53.7%) |
| Education Instruction & Library | 40 (22.9%) | 135 (77.1%) |
| Arts, Media & Entertainment | 0 (0.0%) | 10 (100.0%) |
| Health Diagnosing & Treating | 6 (2.9%) | 204 (97.1%) |
| Health Technologists | 0 (0.0%) | 180 (100.0%) |
| Total (Category) | 349 (37.9%) | 573 (62.2%) |
| Total (Overall) | 1,176 (50.9%) | 1,134 (49.1%) |
Services Occupations
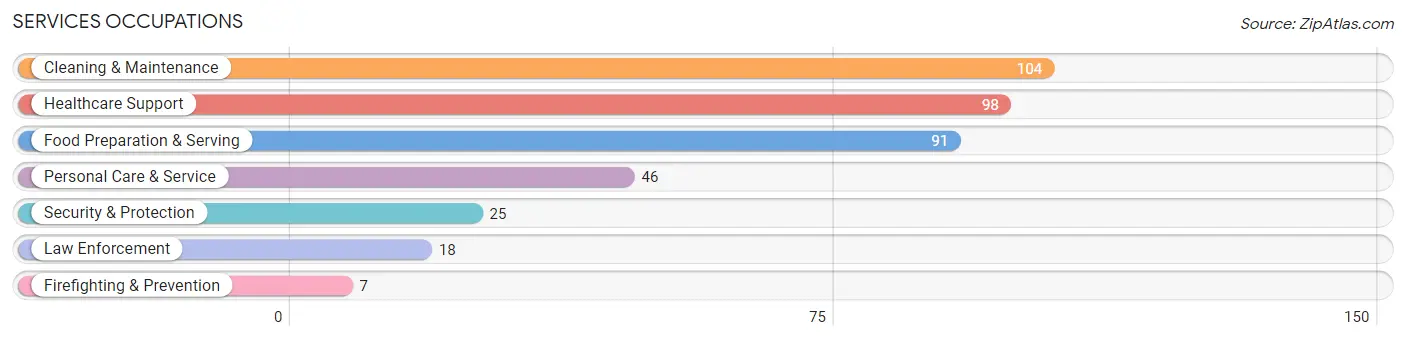
The most common Services occupations in Delta County are Cleaning & Maintenance (104 | 4.5%), Healthcare Support (98 | 4.2%), Food Preparation & Serving (91 | 3.9%), Personal Care & Service (46 | 2.0%), and Security & Protection (25 | 1.1%).
Services Occupations by Sex
Within the Services occupations in Delta County, the most male-oriented occupations are Firefighting & Prevention (100.0%), Cleaning & Maintenance (62.5%), and Healthcare Support (52.0%), while the most female-oriented occupations are Law Enforcement (77.8%), Food Preparation & Serving (60.4%), and Security & Protection (56.0%).
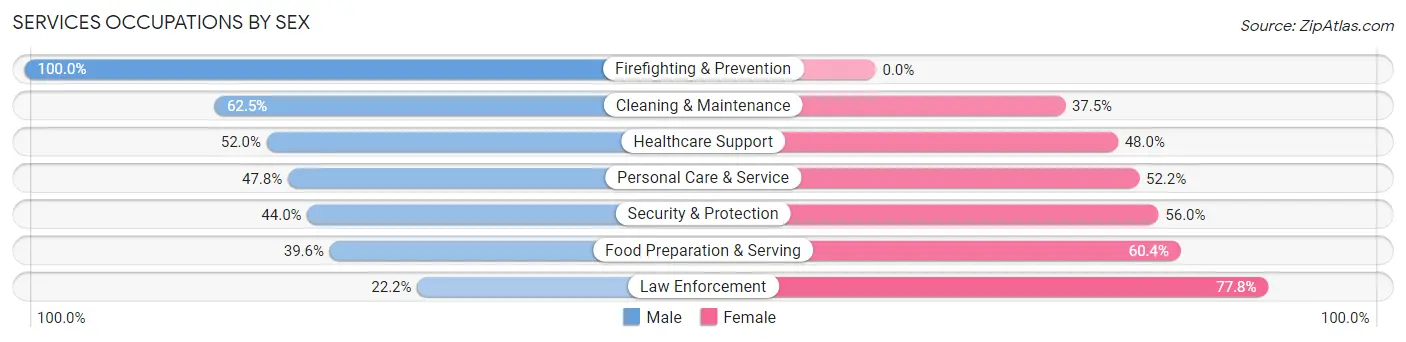
| Occupation | Male | Female |
| Healthcare Support | 51 (52.0%) | 47 (48.0%) |
| Security & Protection | 11 (44.0%) | 14 (56.0%) |
| Firefighting & Prevention | 7 (100.0%) | 0 (0.0%) |
| Law Enforcement | 4 (22.2%) | 14 (77.8%) |
| Food Preparation & Serving | 36 (39.6%) | 55 (60.4%) |
| Cleaning & Maintenance | 65 (62.5%) | 39 (37.5%) |
| Personal Care & Service | 22 (47.8%) | 24 (52.2%) |
| Total (Category) | 185 (50.8%) | 179 (49.2%) |
| Total (Overall) | 1,176 (50.9%) | 1,134 (49.1%) |
Sales and Office Occupations
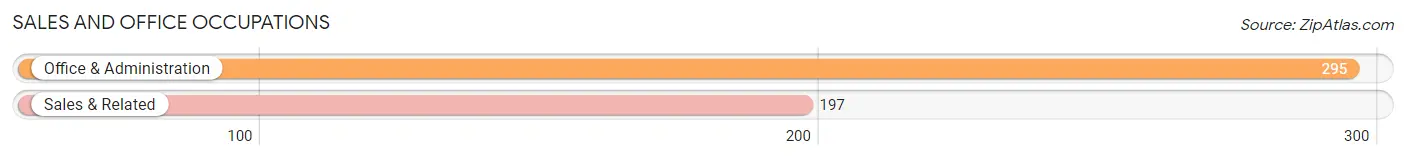
The most common Sales and Office occupations in Delta County are Office & Administration (295 | 12.8%), and Sales & Related (197 | 8.5%).
Sales and Office Occupations by Sex

| Occupation | Male | Female |
| Sales & Related | 74 (37.6%) | 123 (62.4%) |
| Office & Administration | 58 (19.7%) | 237 (80.3%) |
| Total (Category) | 132 (26.8%) | 360 (73.2%) |
| Total (Overall) | 1,176 (50.9%) | 1,134 (49.1%) |
Natural Resources, Construction and Maintenance Occupations
The most common Natural Resources, Construction and Maintenance occupations in Delta County are Installation, Maintenance & Repair (160 | 6.9%), Construction & Extraction (83 | 3.6%), and Farming, Fishing & Forestry (18 | 0.8%).

Natural Resources, Construction and Maintenance Occupations by Sex

| Occupation | Male | Female |
| Farming, Fishing & Forestry | 18 (100.0%) | 0 (0.0%) |
| Construction & Extraction | 83 (100.0%) | 0 (0.0%) |
| Installation, Maintenance & Repair | 160 (100.0%) | 0 (0.0%) |
| Total (Category) | 261 (100.0%) | 0 (0.0%) |
| Total (Overall) | 1,176 (50.9%) | 1,134 (49.1%) |
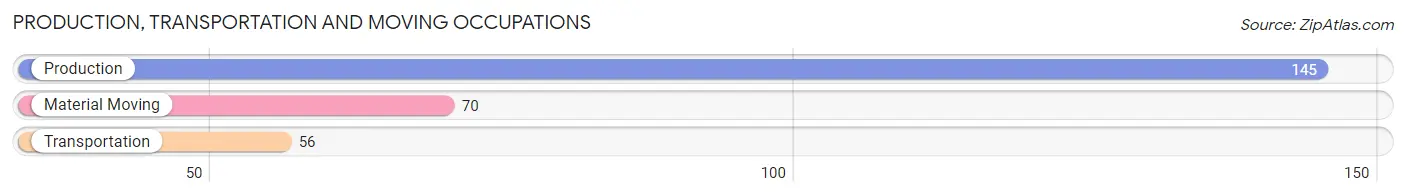
Production, Transportation and Moving Occupations
The most common Production, Transportation and Moving occupations in Delta County are Production (145 | 6.3%), Material Moving (70 | 3.0%), and Transportation (56 | 2.4%).
Production, Transportation and Moving Occupations by Sex
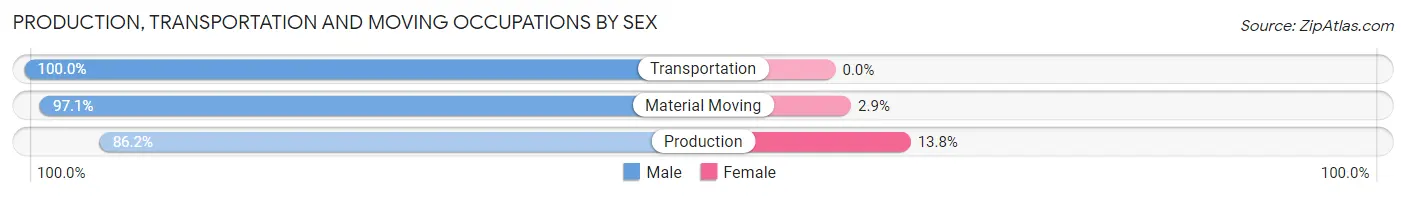
| Occupation | Male | Female |
| Production | 125 (86.2%) | 20 (13.8%) |
| Transportation | 56 (100.0%) | 0 (0.0%) |
| Material Moving | 68 (97.1%) | 2 (2.9%) |
| Total (Category) | 249 (91.9%) | 22 (8.1%) |
| Total (Overall) | 1,176 (50.9%) | 1,134 (49.1%) |
Employment Industries by Sex in Delta County
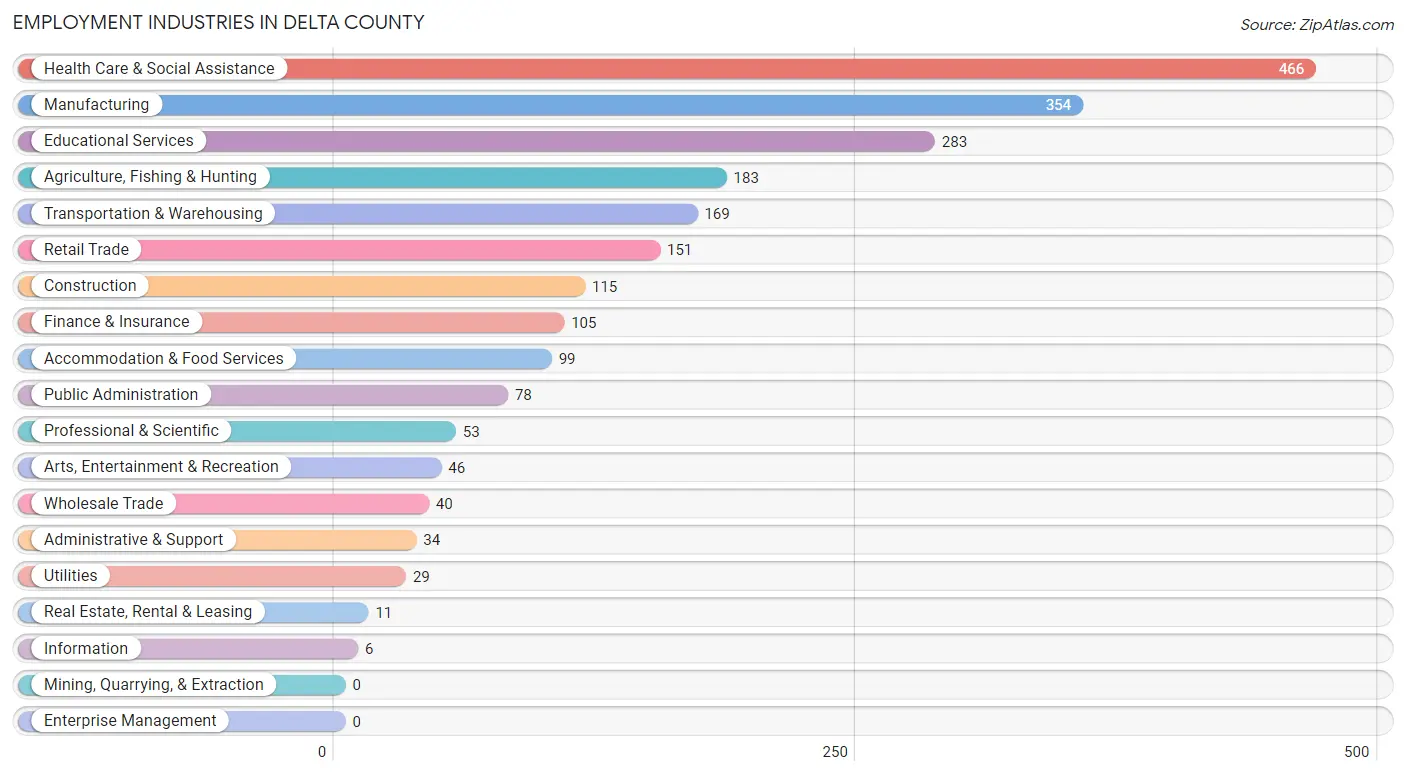
Employment Industries in Delta County
The major employment industries in Delta County include Health Care & Social Assistance (466 | 20.2%), Manufacturing (354 | 15.3%), Educational Services (283 | 12.2%), Agriculture, Fishing & Hunting (183 | 7.9%), and Transportation & Warehousing (169 | 7.3%).
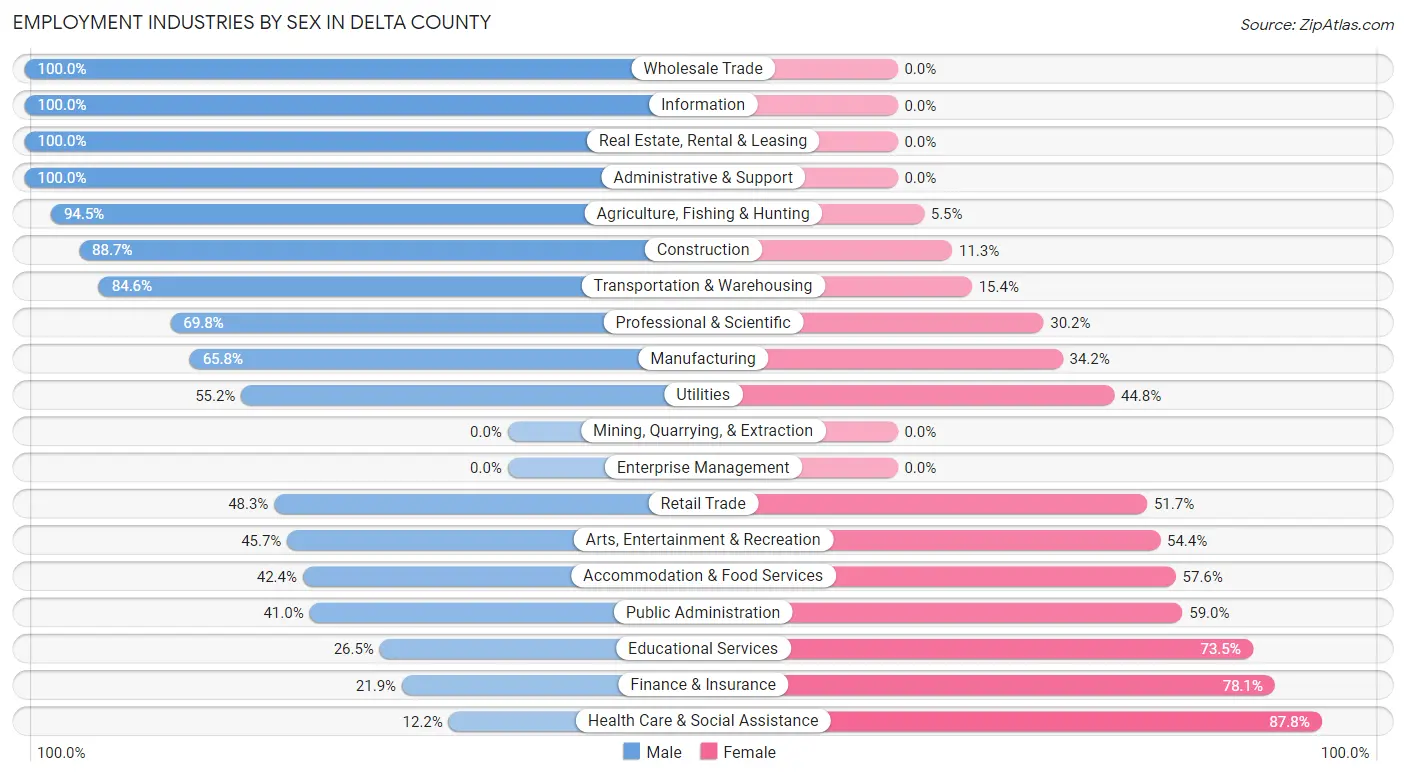
Employment Industries by Sex in Delta County
The Delta County industries that see more men than women are Wholesale Trade (100.0%), Information (100.0%), and Real Estate, Rental & Leasing (100.0%), whereas the industries that tend to have a higher number of women are Health Care & Social Assistance (87.8%), Finance & Insurance (78.1%), and Educational Services (73.5%).
| Industry | Male | Female |
| Agriculture, Fishing & Hunting | 173 (94.5%) | 10 (5.5%) |
| Mining, Quarrying, & Extraction | 0 (0.0%) | 0 (0.0%) |
| Construction | 102 (88.7%) | 13 (11.3%) |
| Manufacturing | 233 (65.8%) | 121 (34.2%) |
| Wholesale Trade | 40 (100.0%) | 0 (0.0%) |
| Retail Trade | 73 (48.3%) | 78 (51.7%) |
| Transportation & Warehousing | 143 (84.6%) | 26 (15.4%) |
| Utilities | 16 (55.2%) | 13 (44.8%) |
| Information | 6 (100.0%) | 0 (0.0%) |
| Finance & Insurance | 23 (21.9%) | 82 (78.1%) |
| Real Estate, Rental & Leasing | 11 (100.0%) | 0 (0.0%) |
| Professional & Scientific | 37 (69.8%) | 16 (30.2%) |
| Enterprise Management | 0 (0.0%) | 0 (0.0%) |
| Administrative & Support | 34 (100.0%) | 0 (0.0%) |
| Educational Services | 75 (26.5%) | 208 (73.5%) |
| Health Care & Social Assistance | 57 (12.2%) | 409 (87.8%) |
| Arts, Entertainment & Recreation | 21 (45.7%) | 25 (54.3%) |
| Accommodation & Food Services | 42 (42.4%) | 57 (57.6%) |
| Public Administration | 32 (41.0%) | 46 (59.0%) |
| Total | 1,176 (50.9%) | 1,134 (49.1%) |
Education in Delta County
School Enrollment in Delta County
The most common levels of schooling among the 1,078 students in Delta County are middle school (271 | 25.1%), high school (261 | 24.2%), and elementary school (248 | 23.0%).
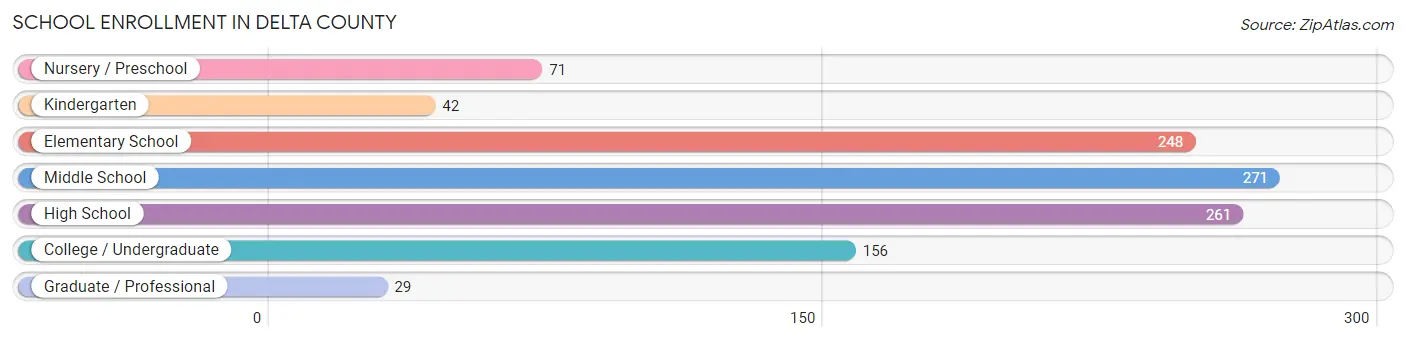
| School Level | # Students | % Students |
| Nursery / Preschool | 71 | 6.6% |
| Kindergarten | 42 | 3.9% |
| Elementary School | 248 | 23.0% |
| Middle School | 271 | 25.1% |
| High School | 261 | 24.2% |
| College / Undergraduate | 156 | 14.5% |
| Graduate / Professional | 29 | 2.7% |
| Total | 1,078 | 100.0% |
School Enrollment by Age by Funding Source in Delta County
Out of a total of 1,078 students who are enrolled in schools in Delta County, 132 (12.2%) attend a private institution, while the remaining 946 (87.8%) are enrolled in public schools. The age group of 3 to 4 year olds has the highest likelihood of being enrolled in private schools, with 48 (76.2% in the age bracket) enrolled. Conversely, the age group of 20 to 24 year olds has the lowest likelihood of being enrolled in a private school, with 43 (100.0% in the age bracket) attending a public institution.
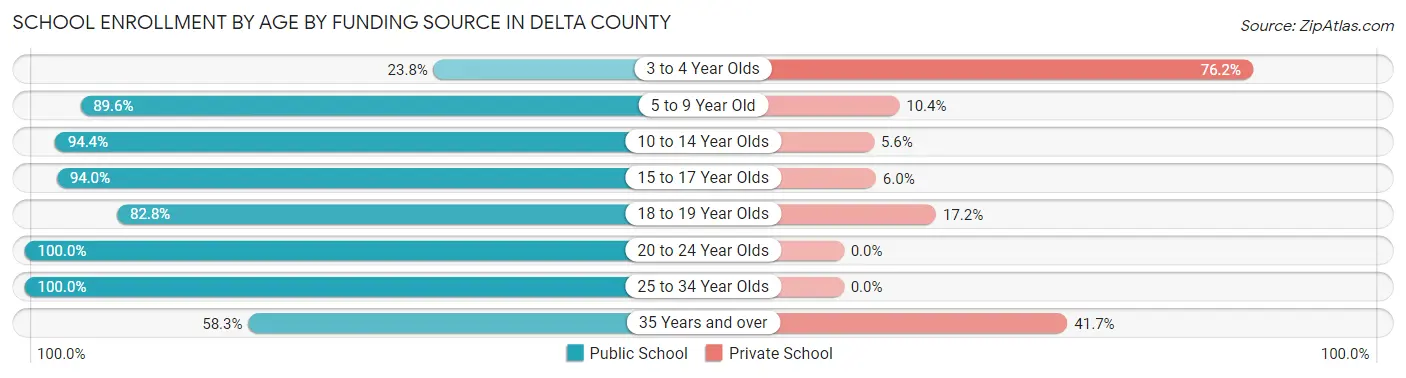
| Age Bracket | Public School | Private School |
| 3 to 4 Year Olds | 15 (23.8%) | 48 (76.2%) |
| 5 to 9 Year Old | 225 (89.6%) | 26 (10.4%) |
| 10 to 14 Year Olds | 318 (94.4%) | 19 (5.6%) |
| 15 to 17 Year Olds | 188 (94.0%) | 12 (6.0%) |
| 18 to 19 Year Olds | 101 (82.8%) | 21 (17.2%) |
| 20 to 24 Year Olds | 43 (100.0%) | 0 (0.0%) |
| 25 to 34 Year Olds | 50 (100.0%) | 0 (0.0%) |
| 35 Years and over | 7 (58.3%) | 5 (41.7%) |
| Total | 946 (87.8%) | 132 (12.2%) |
Educational Attainment by Field of Study in Delta County
Education (205 | 21.7%), business (177 | 18.7%), science & technology (120 | 12.7%), bio, nature & agricultural (86 | 9.1%), and literature & languages (62 | 6.6%) are the most common fields of study among 945 individuals in Delta County who have obtained a bachelor's degree or higher.
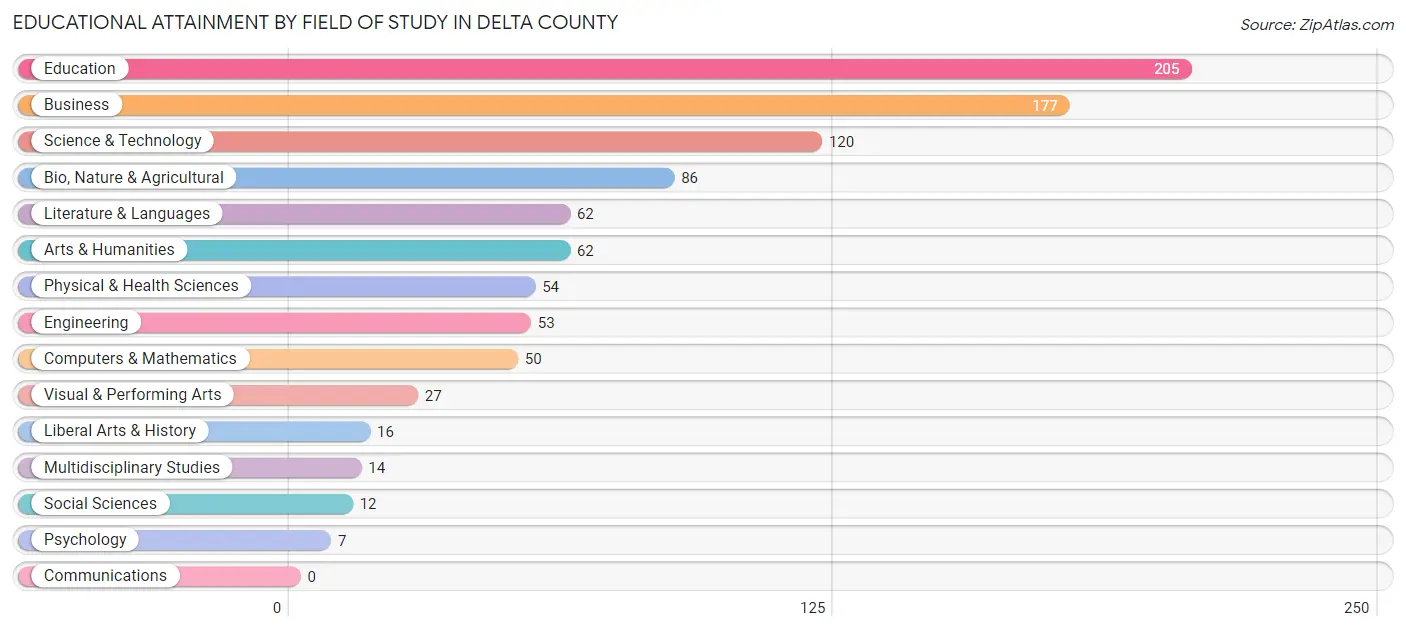
| Field of Study | # Graduates | % Graduates |
| Computers & Mathematics | 50 | 5.3% |
| Bio, Nature & Agricultural | 86 | 9.1% |
| Physical & Health Sciences | 54 | 5.7% |
| Psychology | 7 | 0.7% |
| Social Sciences | 12 | 1.3% |
| Engineering | 53 | 5.6% |
| Multidisciplinary Studies | 14 | 1.5% |
| Science & Technology | 120 | 12.7% |
| Business | 177 | 18.7% |
| Education | 205 | 21.7% |
| Literature & Languages | 62 | 6.6% |
| Liberal Arts & History | 16 | 1.7% |
| Visual & Performing Arts | 27 | 2.9% |
| Communications | 0 | 0.0% |
| Arts & Humanities | 62 | 6.6% |
| Total | 945 | 100.0% |
Transportation & Commute in Delta County
Vehicle Availability by Sex in Delta County
The most prevalent vehicle ownership categories in Delta County are males with 2 vehicles (506, accounting for 43.8%) and females with 2 vehicles (481, making up 45.1%).
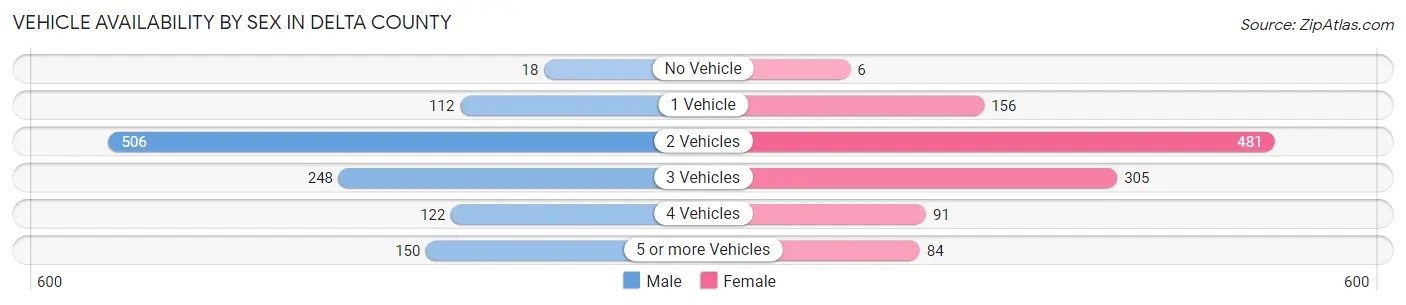
| Vehicles Available | Male | Female |
| No Vehicle | 18 (1.6%) | 6 (0.5%) |
| 1 Vehicle | 112 (9.7%) | 156 (13.9%) |
| 2 Vehicles | 506 (43.8%) | 481 (42.8%) |
| 3 Vehicles | 248 (21.4%) | 305 (27.2%) |
| 4 Vehicles | 122 (10.5%) | 91 (8.1%) |
| 5 or more Vehicles | 150 (13.0%) | 84 (7.5%) |
| Total | 1,156 (100.0%) | 1,123 (100.0%) |
Commute Time in Delta County
The most frequently occuring commute durations in Delta County are 20 to 24 minutes (297 commuters, 14.2%), 30 to 34 minutes (287 commuters, 13.7%), and 15 to 19 minutes (259 commuters, 12.4%).
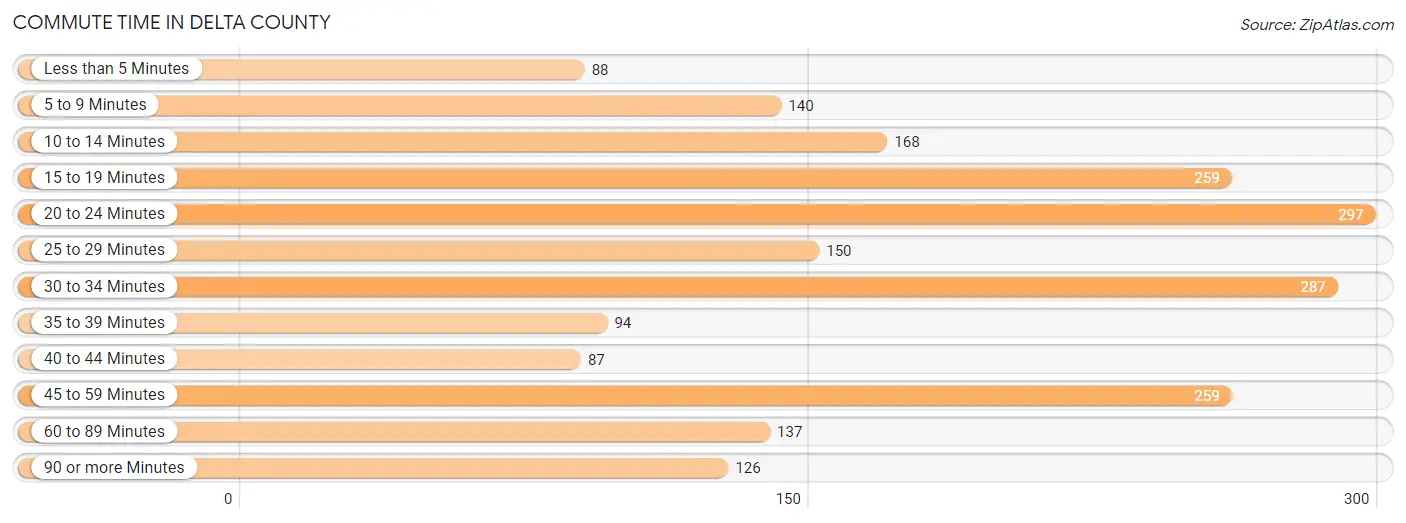
| Commute Time | # Commuters | % Commuters |
| Less than 5 Minutes | 88 | 4.2% |
| 5 to 9 Minutes | 140 | 6.7% |
| 10 to 14 Minutes | 168 | 8.0% |
| 15 to 19 Minutes | 259 | 12.4% |
| 20 to 24 Minutes | 297 | 14.2% |
| 25 to 29 Minutes | 150 | 7.2% |
| 30 to 34 Minutes | 287 | 13.7% |
| 35 to 39 Minutes | 94 | 4.5% |
| 40 to 44 Minutes | 87 | 4.2% |
| 45 to 59 Minutes | 259 | 12.4% |
| 60 to 89 Minutes | 137 | 6.6% |
| 90 or more Minutes | 126 | 6.0% |
Commute Time by Sex in Delta County
The most common commute times in Delta County are 45 to 59 minutes (179 commuters, 16.8%) for males and 20 to 24 minutes (220 commuters, 21.4%) for females.
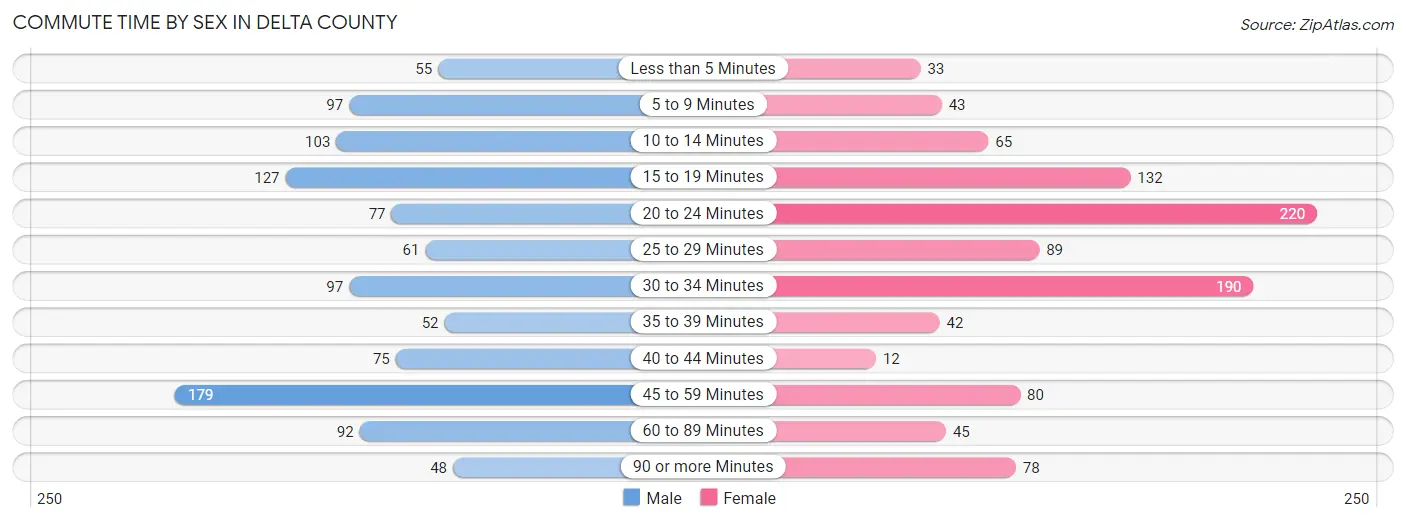
| Commute Time | Male | Female |
| Less than 5 Minutes | 55 (5.2%) | 33 (3.2%) |
| 5 to 9 Minutes | 97 (9.1%) | 43 (4.2%) |
| 10 to 14 Minutes | 103 (9.7%) | 65 (6.3%) |
| 15 to 19 Minutes | 127 (11.9%) | 132 (12.8%) |
| 20 to 24 Minutes | 77 (7.2%) | 220 (21.4%) |
| 25 to 29 Minutes | 61 (5.7%) | 89 (8.6%) |
| 30 to 34 Minutes | 97 (9.1%) | 190 (18.5%) |
| 35 to 39 Minutes | 52 (4.9%) | 42 (4.1%) |
| 40 to 44 Minutes | 75 (7.1%) | 12 (1.2%) |
| 45 to 59 Minutes | 179 (16.8%) | 80 (7.8%) |
| 60 to 89 Minutes | 92 (8.6%) | 45 (4.4%) |
| 90 or more Minutes | 48 (4.5%) | 78 (7.6%) |
Time of Departure to Work by Sex in Delta County
The most frequent times of departure to work in Delta County are 6:00 AM to 6:29 AM (220, 20.7%) for males and 7:30 AM to 7:59 AM (262, 25.5%) for females.
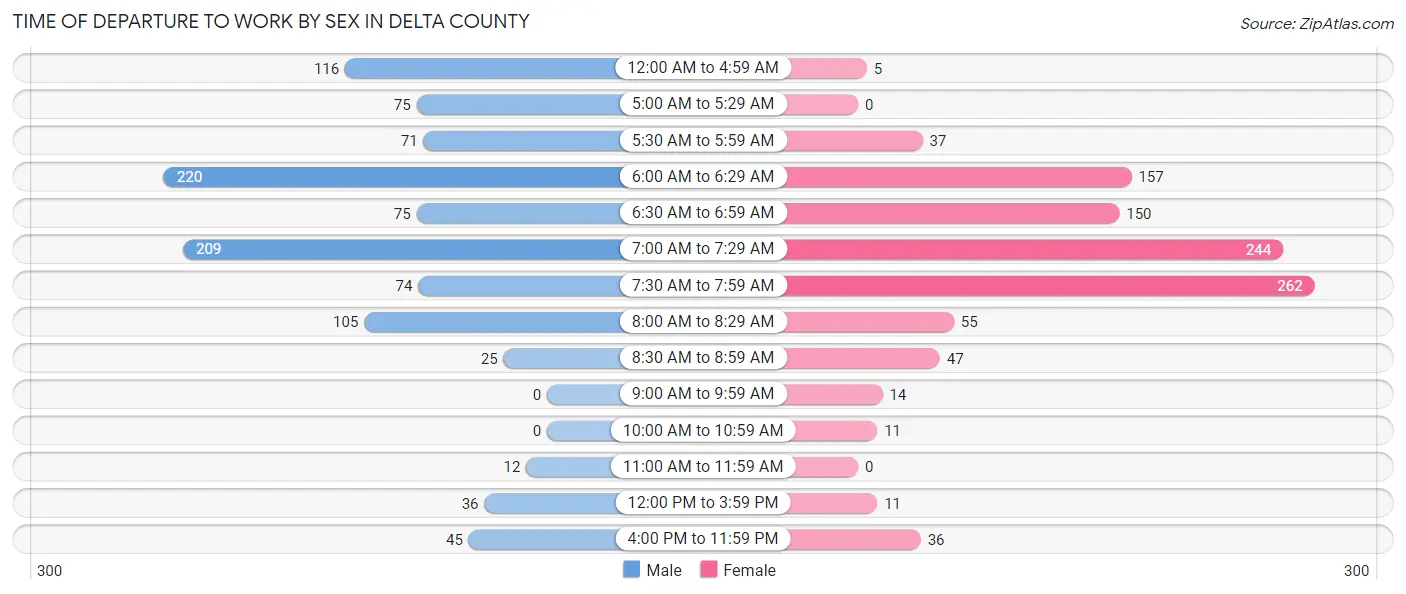
| Time of Departure | Male | Female |
| 12:00 AM to 4:59 AM | 116 (10.9%) | 5 (0.5%) |
| 5:00 AM to 5:29 AM | 75 (7.1%) | 0 (0.0%) |
| 5:30 AM to 5:59 AM | 71 (6.7%) | 37 (3.6%) |
| 6:00 AM to 6:29 AM | 220 (20.7%) | 157 (15.3%) |
| 6:30 AM to 6:59 AM | 75 (7.1%) | 150 (14.6%) |
| 7:00 AM to 7:29 AM | 209 (19.7%) | 244 (23.7%) |
| 7:30 AM to 7:59 AM | 74 (7.0%) | 262 (25.5%) |
| 8:00 AM to 8:29 AM | 105 (9.9%) | 55 (5.3%) |
| 8:30 AM to 8:59 AM | 25 (2.4%) | 47 (4.6%) |
| 9:00 AM to 9:59 AM | 0 (0.0%) | 14 (1.4%) |
| 10:00 AM to 10:59 AM | 0 (0.0%) | 11 (1.1%) |
| 11:00 AM to 11:59 AM | 12 (1.1%) | 0 (0.0%) |
| 12:00 PM to 3:59 PM | 36 (3.4%) | 11 (1.1%) |
| 4:00 PM to 11:59 PM | 45 (4.2%) | 36 (3.5%) |
| Total | 1,063 (100.0%) | 1,029 (100.0%) |
Housing Occupancy in Delta County
Occupancy by Ownership in Delta County
Of the total 2,106 dwellings in Delta County, owner-occupied units account for 1,691 (80.3%), while renter-occupied units make up 415 (19.7%).
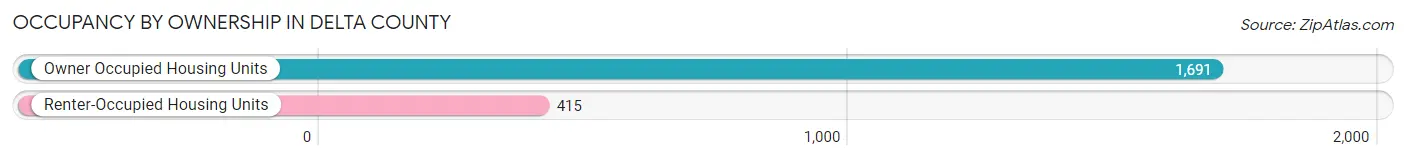
| Occupancy | # Housing Units | % Housing Units |
| Owner Occupied Housing Units | 1,691 | 80.3% |
| Renter-Occupied Housing Units | 415 | 19.7% |
| Total Occupied Housing Units | 2,106 | 100.0% |
Occupancy by Household Size in Delta County
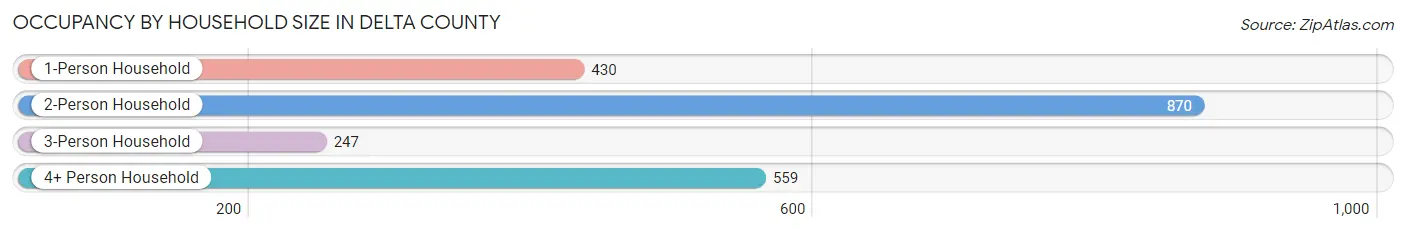
| Household Size | # Housing Units | % Housing Units |
| 1-Person Household | 430 | 20.4% |
| 2-Person Household | 870 | 41.3% |
| 3-Person Household | 247 | 11.7% |
| 4+ Person Household | 559 | 26.5% |
| Total Housing Units | 2,106 | 100.0% |
Occupancy by Ownership by Household Size in Delta County
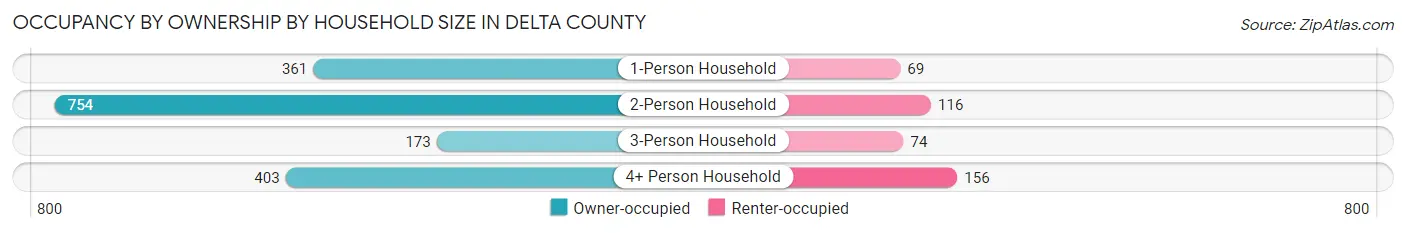
| Household Size | Owner-occupied | Renter-occupied |
| 1-Person Household | 361 (84.0%) | 69 (16.1%) |
| 2-Person Household | 754 (86.7%) | 116 (13.3%) |
| 3-Person Household | 173 (70.0%) | 74 (30.0%) |
| 4+ Person Household | 403 (72.1%) | 156 (27.9%) |
| Total Housing Units | 1,691 (80.3%) | 415 (19.7%) |
Occupancy by Educational Attainment in Delta County
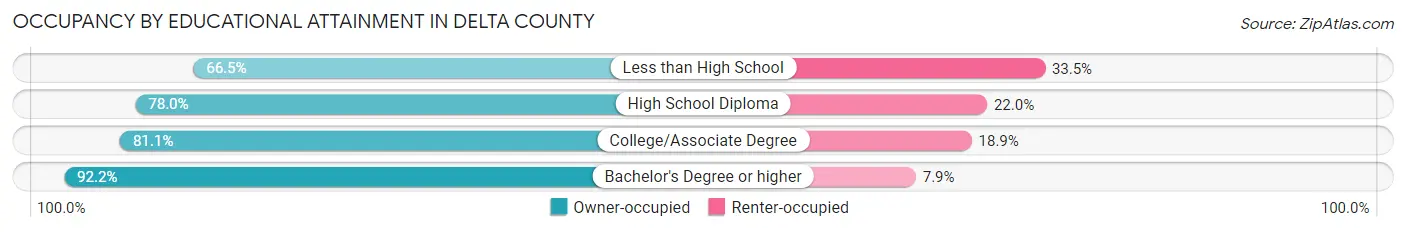
| Household Size | Owner-occupied | Renter-occupied |
| Less than High School | 177 (66.5%) | 89 (33.5%) |
| High School Diploma | 515 (78.0%) | 145 (22.0%) |
| College/Associate Degree | 647 (81.1%) | 151 (18.9%) |
| Bachelor's Degree or higher | 352 (92.1%) | 30 (7.9%) |
Occupancy by Age of Householder in Delta County
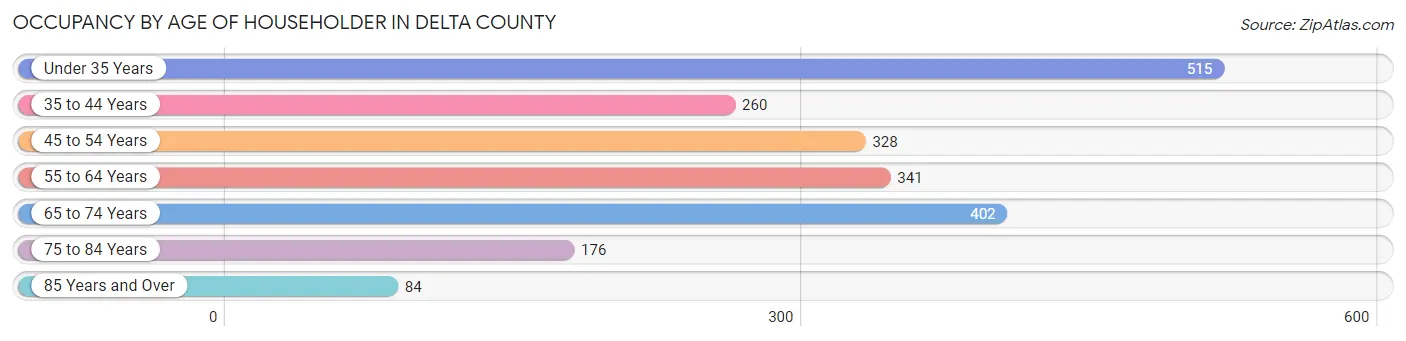
| Age Bracket | # Households | % Households |
| Under 35 Years | 515 | 24.4% |
| 35 to 44 Years | 260 | 12.3% |
| 45 to 54 Years | 328 | 15.6% |
| 55 to 64 Years | 341 | 16.2% |
| 65 to 74 Years | 402 | 19.1% |
| 75 to 84 Years | 176 | 8.4% |
| 85 Years and Over | 84 | 4.0% |
| Total | 2,106 | 100.0% |
Housing Finances in Delta County
Median Income by Occupancy in Delta County
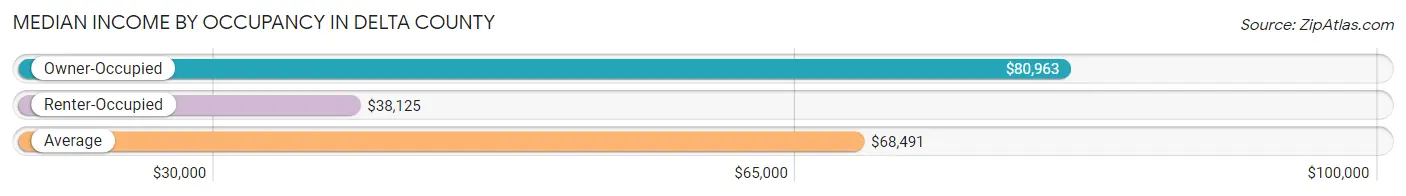
| Occupancy Type | # Households | Median Income |
| Owner-Occupied | 1,691 (80.3%) | $80,963 |
| Renter-Occupied | 415 (19.7%) | $38,125 |
| Average | 2,106 (100.0%) | $68,491 |
Occupancy by Householder Income Bracket in Delta County
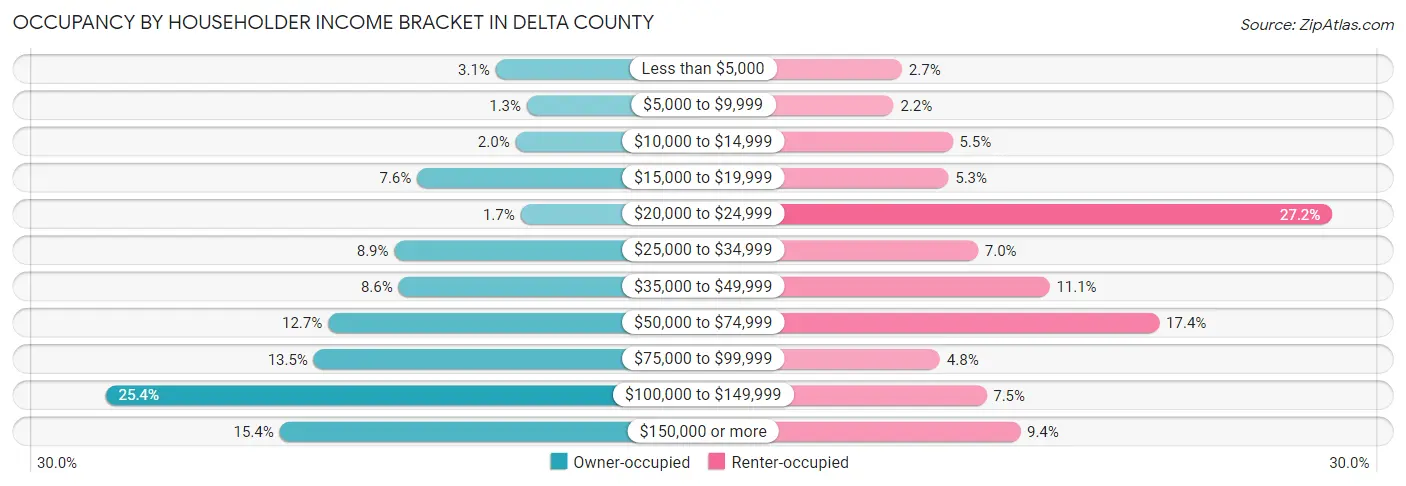
| Income Bracket | Owner-occupied | Renter-occupied |
| Less than $5,000 | 52 (3.1%) | 11 (2.6%) |
| $5,000 to $9,999 | 22 (1.3%) | 9 (2.2%) |
| $10,000 to $14,999 | 33 (1.9%) | 23 (5.5%) |
| $15,000 to $19,999 | 128 (7.6%) | 22 (5.3%) |
| $20,000 to $24,999 | 28 (1.7%) | 113 (27.2%) |
| $25,000 to $34,999 | 150 (8.9%) | 29 (7.0%) |
| $35,000 to $49,999 | 146 (8.6%) | 46 (11.1%) |
| $50,000 to $74,999 | 214 (12.7%) | 72 (17.3%) |
| $75,000 to $99,999 | 228 (13.5%) | 20 (4.8%) |
| $100,000 to $149,999 | 429 (25.4%) | 31 (7.5%) |
| $150,000 or more | 261 (15.4%) | 39 (9.4%) |
| Total | 1,691 (100.0%) | 415 (100.0%) |
Monthly Housing Cost Tiers in Delta County
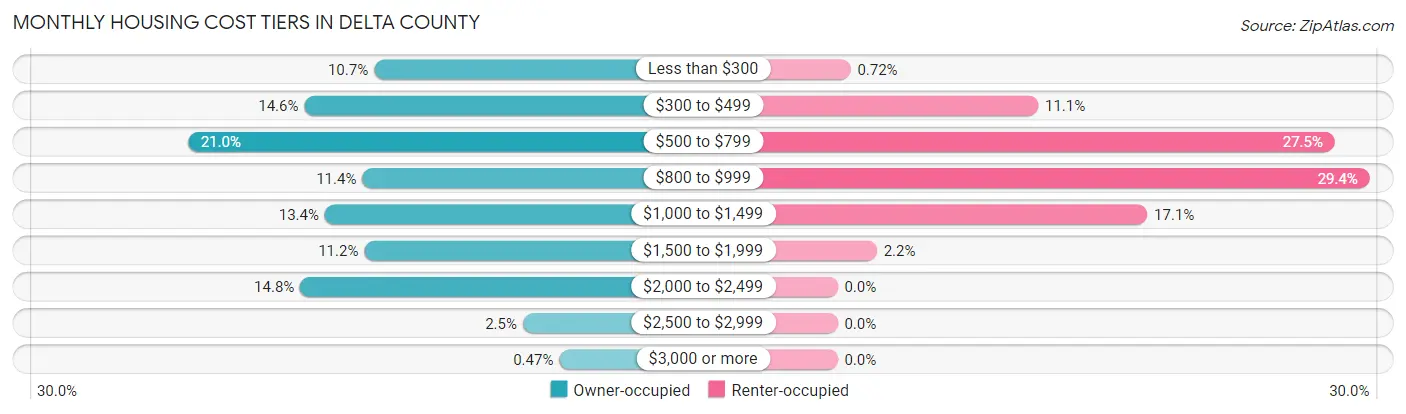
| Monthly Cost | Owner-occupied | Renter-occupied |
| Less than $300 | 181 (10.7%) | 3 (0.7%) |
| $300 to $499 | 246 (14.5%) | 46 (11.1%) |
| $500 to $799 | 355 (21.0%) | 114 (27.5%) |
| $800 to $999 | 192 (11.4%) | 122 (29.4%) |
| $1,000 to $1,499 | 227 (13.4%) | 71 (17.1%) |
| $1,500 to $1,999 | 190 (11.2%) | 9 (2.2%) |
| $2,000 to $2,499 | 250 (14.8%) | 0 (0.0%) |
| $2,500 to $2,999 | 42 (2.5%) | 0 (0.0%) |
| $3,000 or more | 8 (0.5%) | 0 (0.0%) |
| Total | 1,691 (100.0%) | 415 (100.0%) |
Physical Housing Characteristics in Delta County
Housing Structures in Delta County
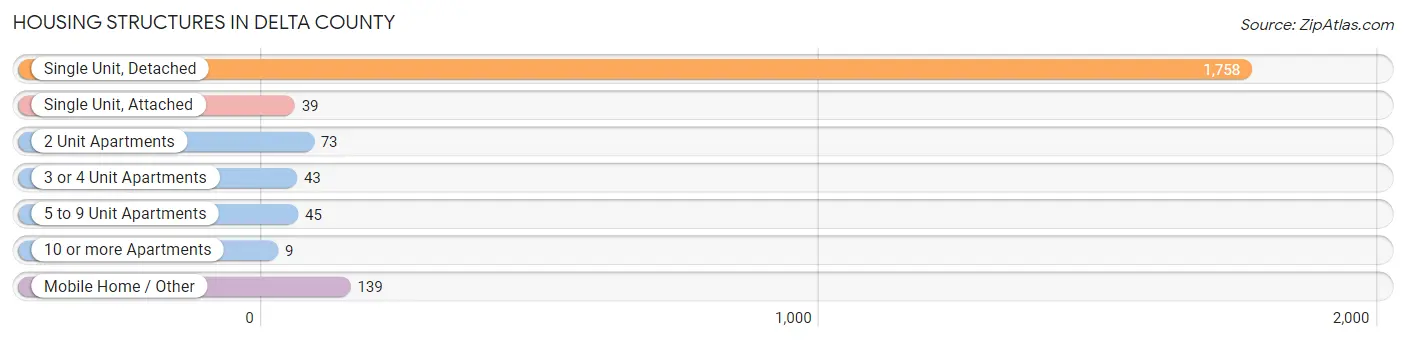
| Structure Type | # Housing Units | % Housing Units |
| Single Unit, Detached | 1,758 | 83.5% |
| Single Unit, Attached | 39 | 1.8% |
| 2 Unit Apartments | 73 | 3.5% |
| 3 or 4 Unit Apartments | 43 | 2.0% |
| 5 to 9 Unit Apartments | 45 | 2.1% |
| 10 or more Apartments | 9 | 0.4% |
| Mobile Home / Other | 139 | 6.6% |
| Total | 2,106 | 100.0% |
Housing Structures by Occupancy in Delta County
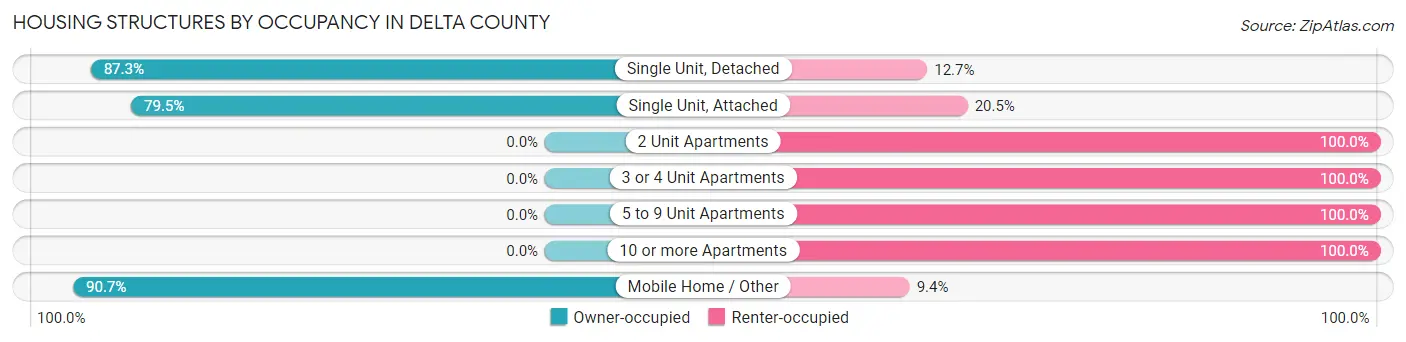
| Structure Type | Owner-occupied | Renter-occupied |
| Single Unit, Detached | 1,534 (87.3%) | 224 (12.7%) |
| Single Unit, Attached | 31 (79.5%) | 8 (20.5%) |
| 2 Unit Apartments | 0 (0.0%) | 73 (100.0%) |
| 3 or 4 Unit Apartments | 0 (0.0%) | 43 (100.0%) |
| 5 to 9 Unit Apartments | 0 (0.0%) | 45 (100.0%) |
| 10 or more Apartments | 0 (0.0%) | 9 (100.0%) |
| Mobile Home / Other | 126 (90.6%) | 13 (9.3%) |
| Total | 1,691 (80.3%) | 415 (19.7%) |
Housing Structures by Number of Rooms in Delta County
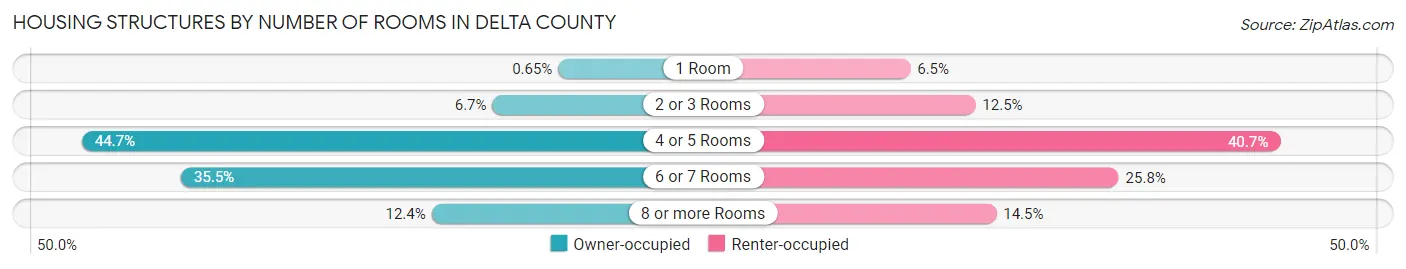
| Number of Rooms | Owner-occupied | Renter-occupied |
| 1 Room | 11 (0.6%) | 27 (6.5%) |
| 2 or 3 Rooms | 114 (6.7%) | 52 (12.5%) |
| 4 or 5 Rooms | 756 (44.7%) | 169 (40.7%) |
| 6 or 7 Rooms | 601 (35.5%) | 107 (25.8%) |
| 8 or more Rooms | 209 (12.4%) | 60 (14.5%) |
| Total | 1,691 (100.0%) | 415 (100.0%) |
Housing Structure by Heating Type in Delta County
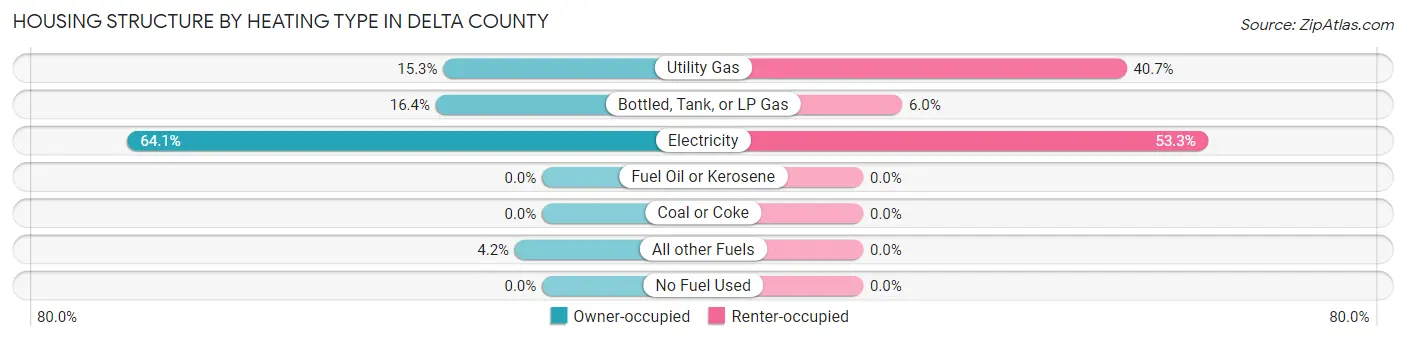
| Heating Type | Owner-occupied | Renter-occupied |
| Utility Gas | 258 (15.3%) | 169 (40.7%) |
| Bottled, Tank, or LP Gas | 278 (16.4%) | 25 (6.0%) |
| Electricity | 1,084 (64.1%) | 221 (53.2%) |
| Fuel Oil or Kerosene | 0 (0.0%) | 0 (0.0%) |
| Coal or Coke | 0 (0.0%) | 0 (0.0%) |
| All other Fuels | 71 (4.2%) | 0 (0.0%) |
| No Fuel Used | 0 (0.0%) | 0 (0.0%) |
| Total | 1,691 (100.0%) | 415 (100.0%) |
Household Vehicle Usage in Delta County
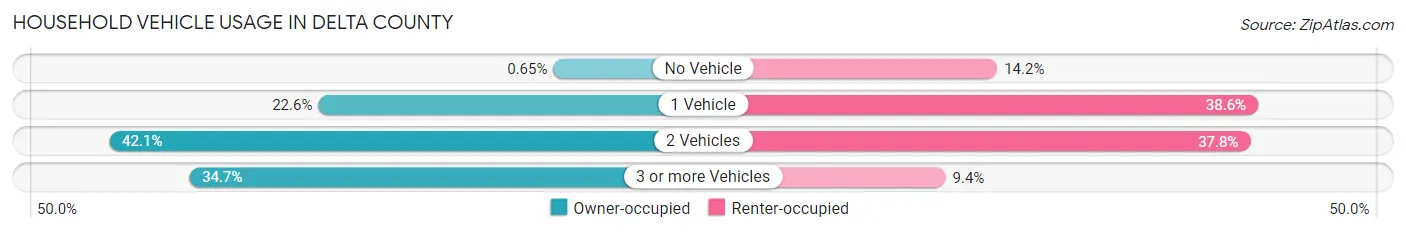
| Vehicles per Household | Owner-occupied | Renter-occupied |
| No Vehicle | 11 (0.6%) | 59 (14.2%) |
| 1 Vehicle | 382 (22.6%) | 160 (38.6%) |
| 2 Vehicles | 712 (42.1%) | 157 (37.8%) |
| 3 or more Vehicles | 586 (34.6%) | 39 (9.4%) |
| Total | 1,691 (100.0%) | 415 (100.0%) |
Real Estate & Mortgages in Delta County
Real Estate and Mortgage Overview in Delta County
| Characteristic | Without Mortgage | With Mortgage |
| Housing Units | 819 | 872 |
| Median Property Value | $124,000 | $211,400 |
| Median Household Income | $55,069 | $228 |
| Monthly Housing Costs | $487 | $8 |
| Real Estate Taxes | $1,021 | $19 |
Property Value by Mortgage Status in Delta County
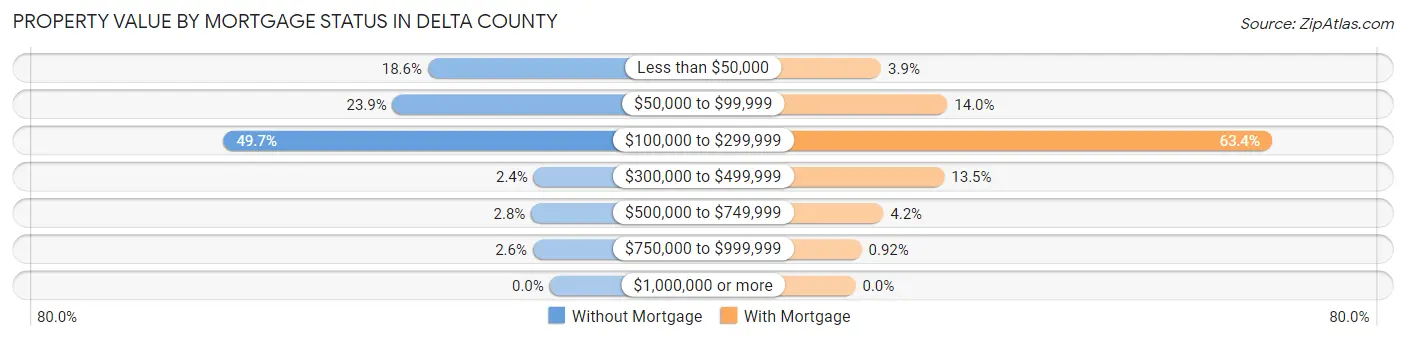
| Property Value | Without Mortgage | With Mortgage |
| Less than $50,000 | 152 (18.6%) | 34 (3.9%) |
| $50,000 to $99,999 | 196 (23.9%) | 122 (14.0%) |
| $100,000 to $299,999 | 407 (49.7%) | 553 (63.4%) |
| $300,000 to $499,999 | 20 (2.4%) | 118 (13.5%) |
| $500,000 to $749,999 | 23 (2.8%) | 37 (4.2%) |
| $750,000 to $999,999 | 21 (2.6%) | 8 (0.9%) |
| $1,000,000 or more | 0 (0.0%) | 0 (0.0%) |
| Total | 819 (100.0%) | 872 (100.0%) |
Household Income by Mortgage Status in Delta County
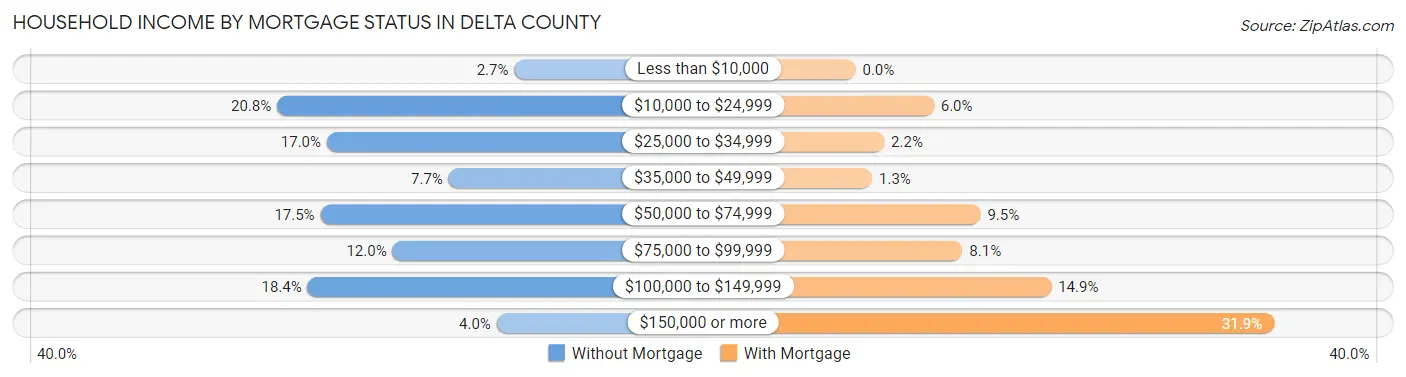
| Household Income | Without Mortgage | With Mortgage |
| Less than $10,000 | 22 (2.7%) | 0 (0.0%) |
| $10,000 to $24,999 | 170 (20.8%) | 52 (6.0%) |
| $25,000 to $34,999 | 139 (17.0%) | 19 (2.2%) |
| $35,000 to $49,999 | 63 (7.7%) | 11 (1.3%) |
| $50,000 to $74,999 | 143 (17.5%) | 83 (9.5%) |
| $75,000 to $99,999 | 98 (12.0%) | 71 (8.1%) |
| $100,000 to $149,999 | 151 (18.4%) | 130 (14.9%) |
| $150,000 or more | 33 (4.0%) | 278 (31.9%) |
| Total | 819 (100.0%) | 872 (100.0%) |
Property Value to Household Income Ratio in Delta County
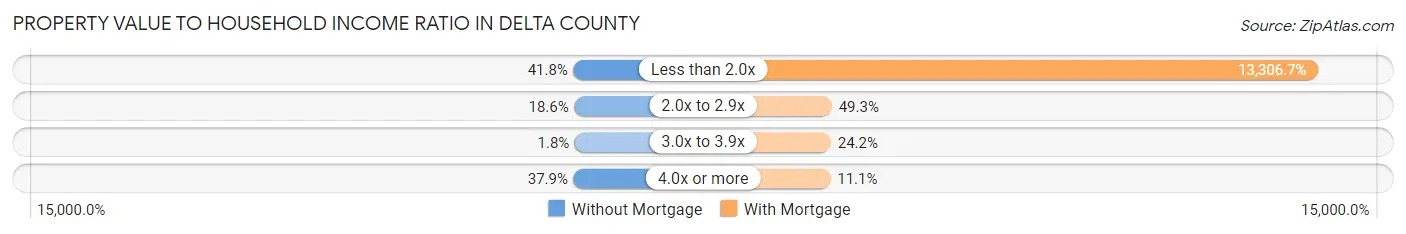
| Value-to-Income Ratio | Without Mortgage | With Mortgage |
| Less than 2.0x | 342 (41.8%) | 116,034 (13,306.6%) |
| 2.0x to 2.9x | 152 (18.6%) | 430 (49.3%) |
| 3.0x to 3.9x | 15 (1.8%) | 211 (24.2%) |
| 4.0x or more | 310 (37.9%) | 97 (11.1%) |
| Total | 819 (100.0%) | 872 (100.0%) |
Real Estate Taxes by Mortgage Status in Delta County
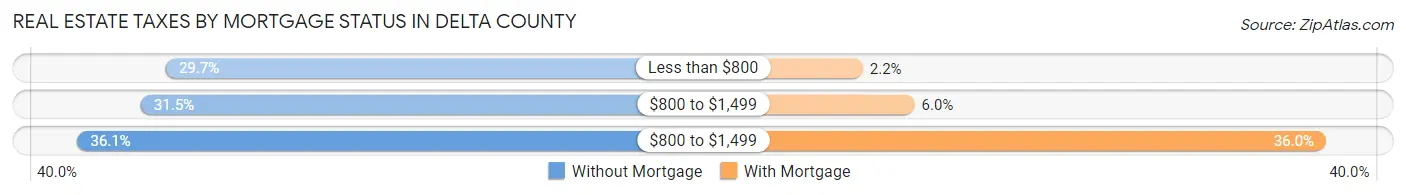
| Property Taxes | Without Mortgage | With Mortgage |
| Less than $800 | 243 (29.7%) | 19 (2.2%) |
| $800 to $1,499 | 258 (31.5%) | 52 (6.0%) |
| $800 to $1,499 | 296 (36.1%) | 314 (36.0%) |
| Total | 819 (100.0%) | 872 (100.0%) |
Health & Disability in Delta County
Health Insurance Coverage by Age in Delta County
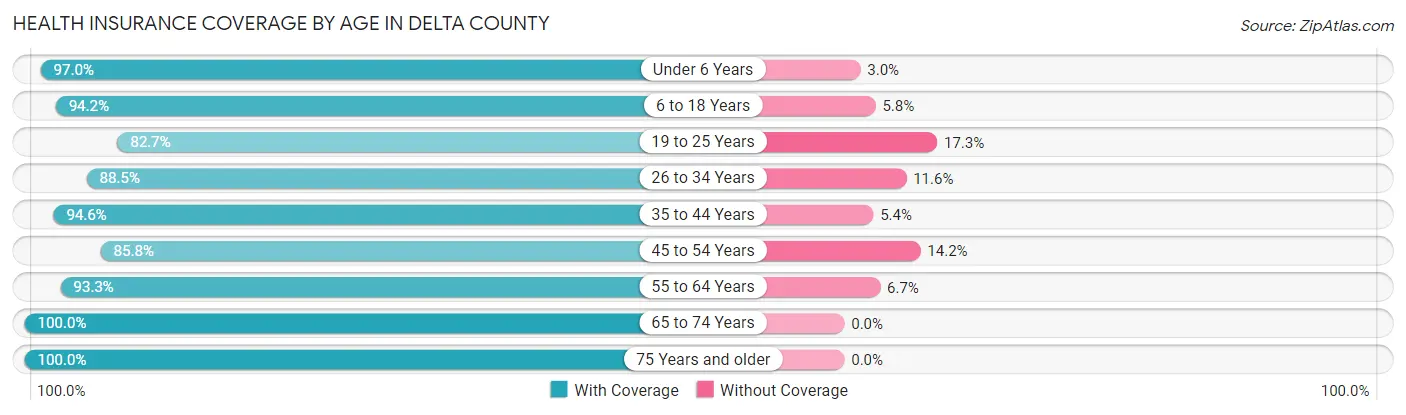
| Age Bracket | With Coverage | Without Coverage |
| Under 6 Years | 420 (97.0%) | 13 (3.0%) |
| 6 to 18 Years | 795 (94.2%) | 49 (5.8%) |
| 19 to 25 Years | 287 (82.7%) | 60 (17.3%) |
| 26 to 34 Years | 620 (88.4%) | 81 (11.6%) |
| 35 to 44 Years | 544 (94.6%) | 31 (5.4%) |
| 45 to 54 Years | 502 (85.8%) | 83 (14.2%) |
| 55 to 64 Years | 671 (93.3%) | 48 (6.7%) |
| 65 to 74 Years | 616 (100.0%) | 0 (0.0%) |
| 75 Years and older | 395 (100.0%) | 0 (0.0%) |
| Total | 4,850 (93.0%) | 365 (7.0%) |
Health Insurance Coverage by Citizenship Status in Delta County
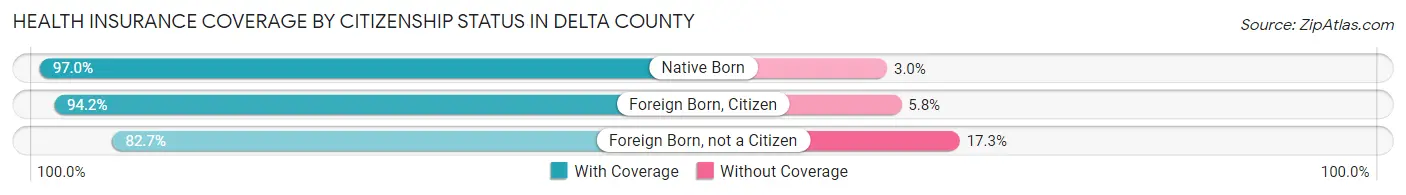
| Citizenship Status | With Coverage | Without Coverage |
| Native Born | 420 (97.0%) | 13 (3.0%) |
| Foreign Born, Citizen | 795 (94.2%) | 49 (5.8%) |
| Foreign Born, not a Citizen | 287 (82.7%) | 60 (17.3%) |
Health Insurance Coverage by Household Income in Delta County
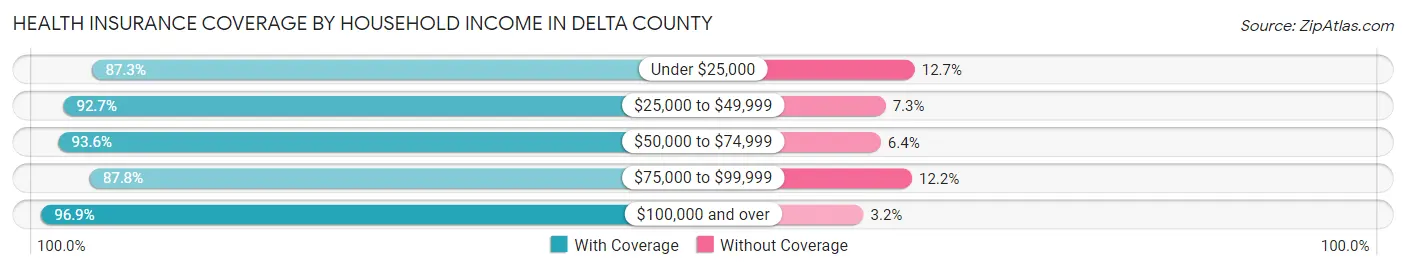
| Household Income | With Coverage | Without Coverage |
| Under $25,000 | 685 (87.3%) | 100 (12.7%) |
| $25,000 to $49,999 | 698 (92.7%) | 55 (7.3%) |
| $50,000 to $74,999 | 659 (93.6%) | 45 (6.4%) |
| $75,000 to $99,999 | 689 (87.8%) | 96 (12.2%) |
| $100,000 and over | 2,119 (96.9%) | 69 (3.2%) |
Public vs Private Health Insurance Coverage by Age in Delta County
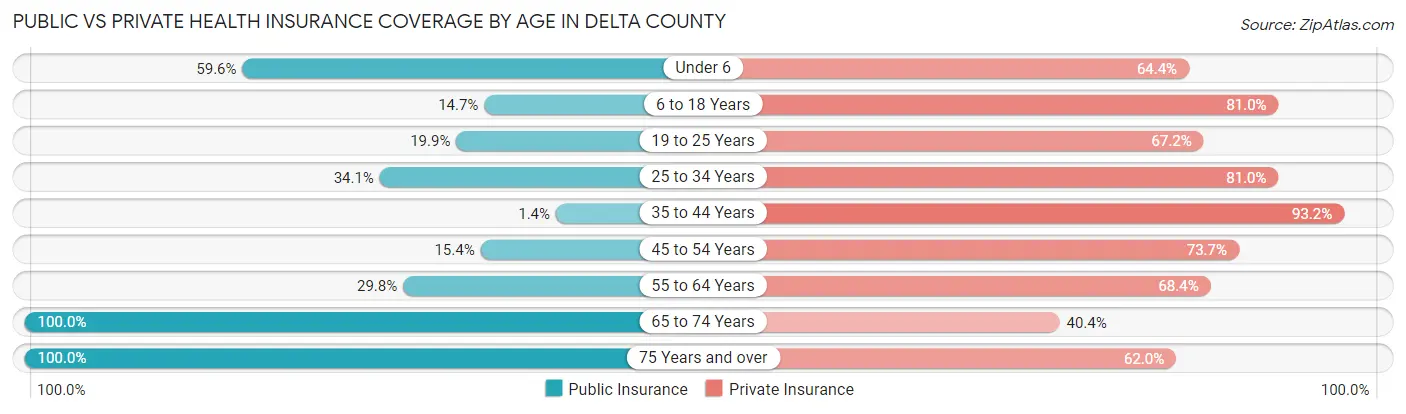
| Age Bracket | Public Insurance | Private Insurance |
| Under 6 | 258 (59.6%) | 279 (64.4%) |
| 6 to 18 Years | 124 (14.7%) | 684 (81.0%) |
| 19 to 25 Years | 69 (19.9%) | 233 (67.1%) |
| 25 to 34 Years | 239 (34.1%) | 568 (81.0%) |
| 35 to 44 Years | 8 (1.4%) | 536 (93.2%) |
| 45 to 54 Years | 90 (15.4%) | 431 (73.7%) |
| 55 to 64 Years | 214 (29.8%) | 492 (68.4%) |
| 65 to 74 Years | 616 (100.0%) | 249 (40.4%) |
| 75 Years and over | 395 (100.0%) | 245 (62.0%) |
| Total | 2,013 (38.6%) | 3,717 (71.3%) |
Disability Status by Sex by Age in Delta County
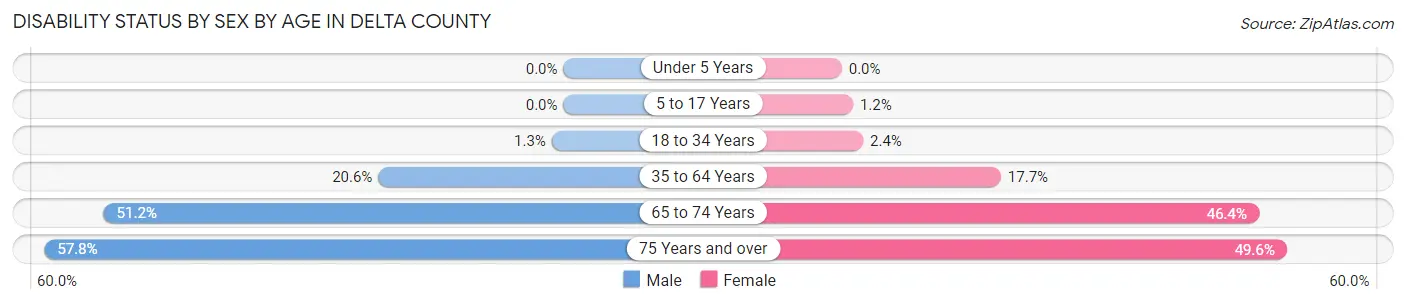
| Age Bracket | Male | Female |
| Under 5 Years | 0 (0.0%) | 0 (0.0%) |
| 5 to 17 Years | 0 (0.0%) | 6 (1.2%) |
| 18 to 34 Years | 7 (1.3%) | 14 (2.4%) |
| 35 to 64 Years | 192 (20.6%) | 168 (17.7%) |
| 65 to 74 Years | 150 (51.2%) | 150 (46.4%) |
| 75 Years and over | 100 (57.8%) | 110 (49.5%) |
Disability Class by Sex by Age in Delta County
Disability Class: Hearing Difficulty
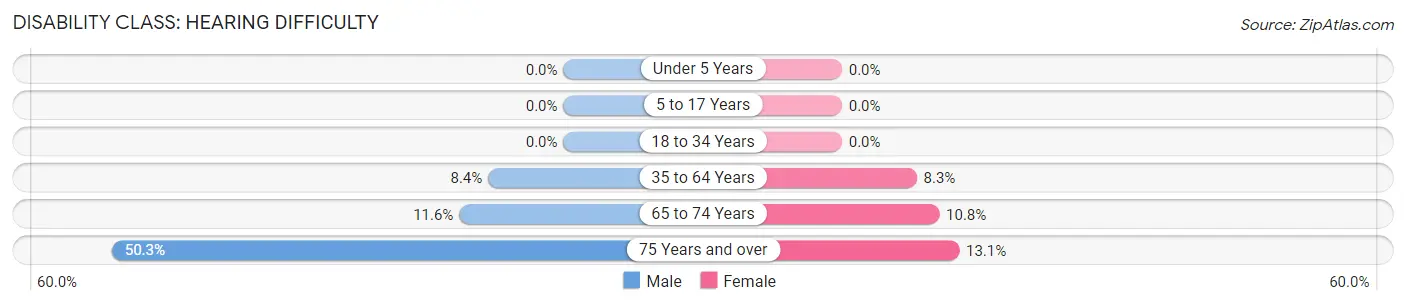
| Age Bracket | Male | Female |
| Under 5 Years | 0 (0.0%) | 0 (0.0%) |
| 5 to 17 Years | 0 (0.0%) | 0 (0.0%) |
| 18 to 34 Years | 0 (0.0%) | 0 (0.0%) |
| 35 to 64 Years | 78 (8.4%) | 79 (8.3%) |
| 65 to 74 Years | 34 (11.6%) | 35 (10.8%) |
| 75 Years and over | 87 (50.3%) | 29 (13.1%) |
Disability Class: Vision Difficulty
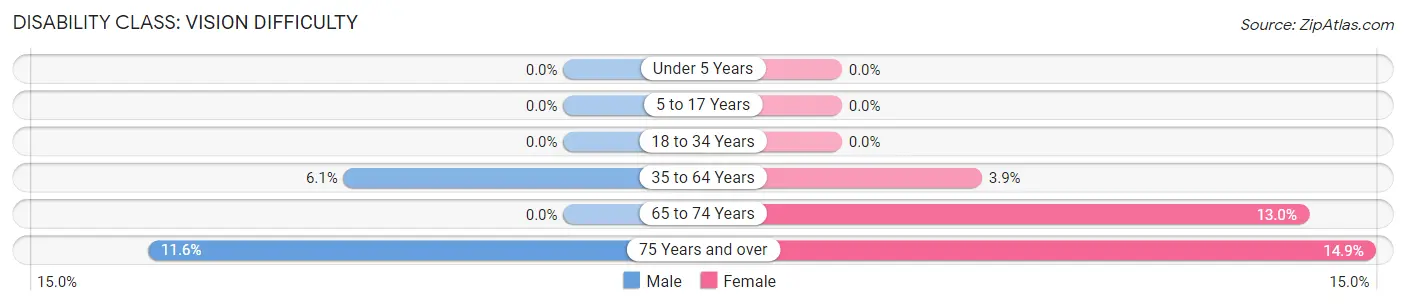
| Age Bracket | Male | Female |
| Under 5 Years | 0 (0.0%) | 0 (0.0%) |
| 5 to 17 Years | 0 (0.0%) | 0 (0.0%) |
| 18 to 34 Years | 0 (0.0%) | 0 (0.0%) |
| 35 to 64 Years | 57 (6.1%) | 37 (3.9%) |
| 65 to 74 Years | 0 (0.0%) | 42 (13.0%) |
| 75 Years and over | 20 (11.6%) | 33 (14.9%) |
Disability Class: Cognitive Difficulty
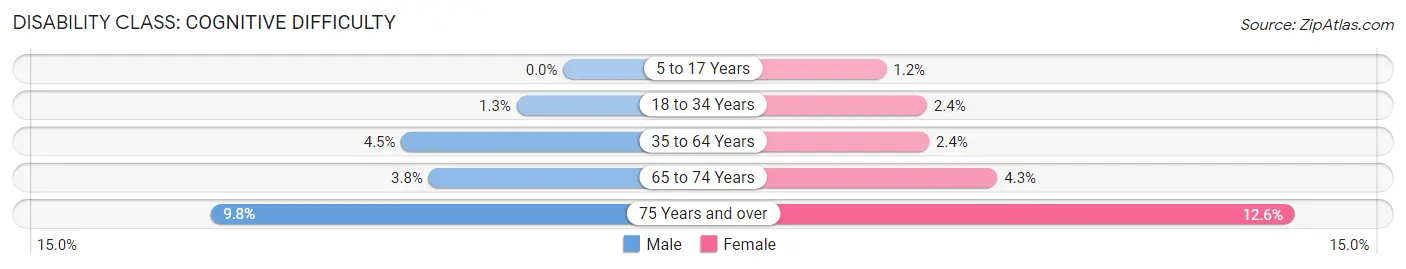
| Age Bracket | Male | Female |
| 5 to 17 Years | 0 (0.0%) | 6 (1.2%) |
| 18 to 34 Years | 7 (1.3%) | 14 (2.4%) |
| 35 to 64 Years | 42 (4.5%) | 23 (2.4%) |
| 65 to 74 Years | 11 (3.7%) | 14 (4.3%) |
| 75 Years and over | 17 (9.8%) | 28 (12.6%) |
Disability Class: Ambulatory Difficulty
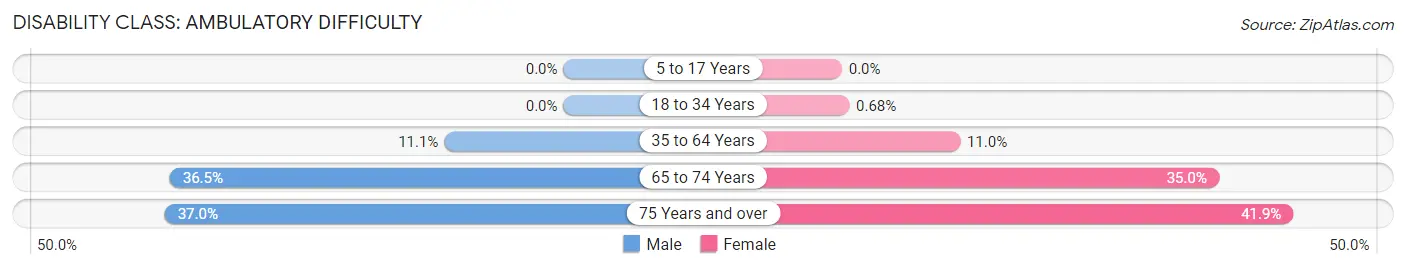
| Age Bracket | Male | Female |
| 5 to 17 Years | 0 (0.0%) | 0 (0.0%) |
| 18 to 34 Years | 0 (0.0%) | 4 (0.7%) |
| 35 to 64 Years | 103 (11.1%) | 104 (11.0%) |
| 65 to 74 Years | 107 (36.5%) | 113 (35.0%) |
| 75 Years and over | 64 (37.0%) | 93 (41.9%) |
Disability Class: Self-Care Difficulty
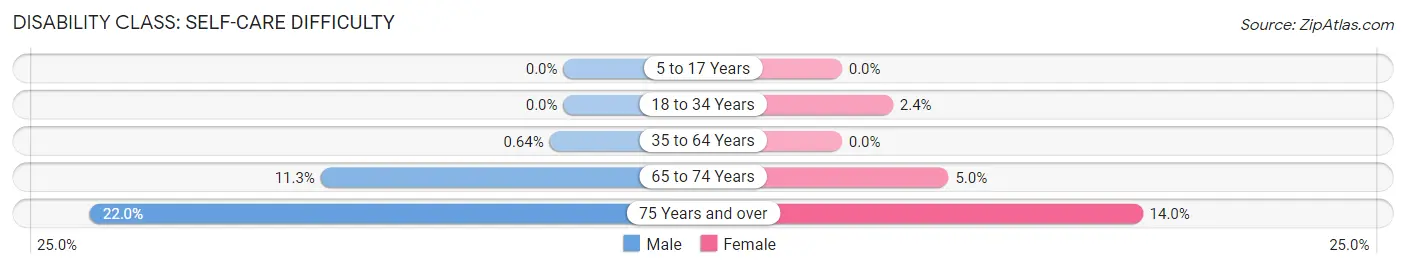
| Age Bracket | Male | Female |
| 5 to 17 Years | 0 (0.0%) | 0 (0.0%) |
| 18 to 34 Years | 0 (0.0%) | 14 (2.4%) |
| 35 to 64 Years | 6 (0.6%) | 0 (0.0%) |
| 65 to 74 Years | 33 (11.3%) | 16 (5.0%) |
| 75 Years and over | 38 (22.0%) | 31 (14.0%) |
Technology Access in Delta County
Computing Device Access in Delta County
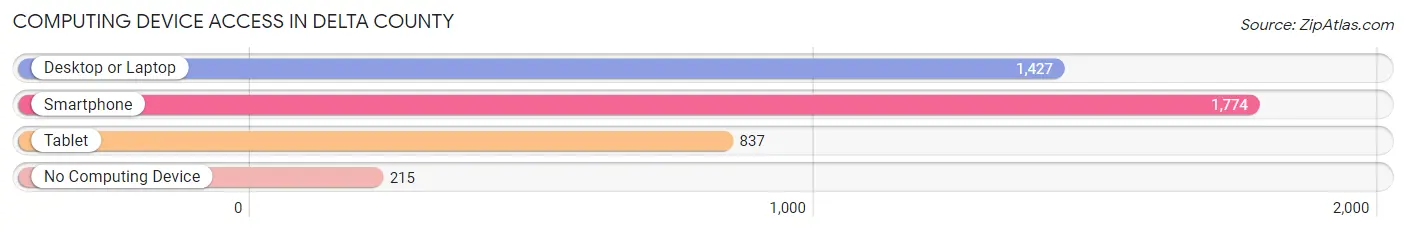
| Device Type | # Households | % Households |
| Desktop or Laptop | 1,427 | 67.8% |
| Smartphone | 1,774 | 84.2% |
| Tablet | 837 | 39.7% |
| No Computing Device | 215 | 10.2% |
| Total | 2,106 | 100.0% |
Internet Access in Delta County
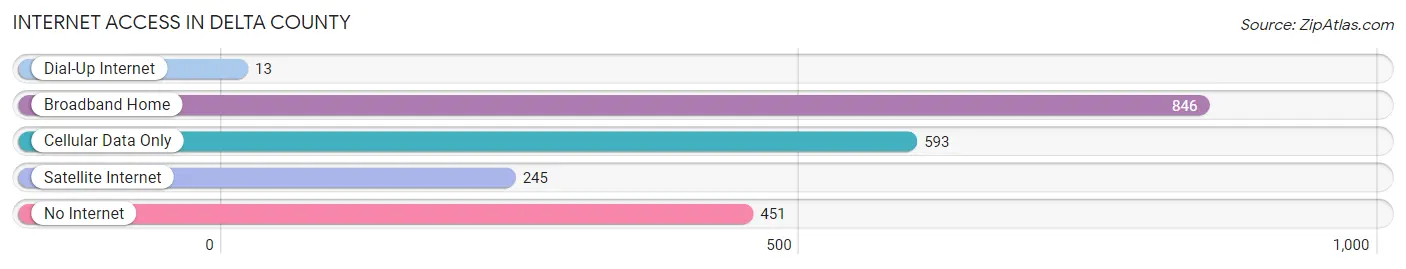
| Internet Type | # Households | % Households |
| Dial-Up Internet | 13 | 0.6% |
| Broadband Home | 846 | 40.2% |
| Cellular Data Only | 593 | 28.2% |
| Satellite Internet | 245 | 11.6% |
| No Internet | 451 | 21.4% |
| Total | 2,106 | 100.0% |
Delta County Summary
County History
Delta County is located in the northeastern corner of Texas and is part of the Texoma region. The county was created in 1870 from parts of Hopkins and Lamar counties and was named for the fourth letter of the Greek alphabet, delta, which is also the name of the county seat. The area was originally inhabited by the Caddo Indians, who were later displaced by the Comanche and Kiowa tribes.
The first settlers in the area were ranchers and farmers who arrived in the late 1800s. The county was officially organized in 1876 and the first county seat was established in the town of Delta. The county was largely agricultural, with cotton and corn being the main crops.
In the early 1900s, the county began to experience an economic boom due to the discovery of oil and natural gas. This led to the development of several oil and gas fields, which provided jobs and economic growth to the area.
The county also experienced a population boom during this time, as people moved to the area to take advantage of the economic opportunities. The population continued to grow throughout the 20th century, reaching a peak of over 20,000 in the 1970s.
Geography
Delta County is located in the northeastern corner of Texas and is bordered by Lamar County to the north, Hopkins County to the east, Franklin County to the south, and Fannin County to the west. The county covers an area of 545 square miles and is mostly rural, with only a few small towns and villages.
The terrain of the county is mostly flat, with some rolling hills in the western part of the county. The county is drained by the Sulphur River, which flows through the county from north to south. The county is also home to several small lakes, including Lake Crockett, Lake O’ the Pines, and Lake Bob Sandlin.
Economy
The economy of Delta County is largely based on agriculture and oil and gas production. The county is home to several large farms, which produce cotton, corn, soybeans, and other crops. The county is also home to several oil and gas fields, which provide jobs and economic growth to the area.
In addition to agriculture and oil and gas production, the county is also home to several manufacturing companies, including a paper mill and a plastics plant. The county is also home to several retail stores, restaurants, and other businesses.
Demographics
As of the 2010 census, the population of Delta County was 17,945. The population is mostly white (83.3%), with small percentages of African Americans (7.7%), Hispanics (6.2%), and other races (2.8%). The median household income in the county is $41,945, and the median age is 41.
The county is home to several small towns and villages, including the county seat of Delta, which has a population of 1,845. Other towns in the county include Cooper, which has a population of 1,072, and Ben Franklin, which has a population of 845.
Conclusion
Delta County is located in the northeastern corner of Texas and is part of the Texoma region. The county was created in 1870 and is home to several small towns and villages. The economy of the county is largely based on agriculture and oil and gas production, and the population is mostly white. The county is home to several large farms, oil and gas fields, manufacturing companies, and other businesses.
Common Questions
What is Per Capita Income in Delta County?
Per Capita income in Delta County is $34,345.
What is the Median Family Income in Delta County?
Median Family Income in Delta County is $82,679.
What is the Median Household income in Delta County?
Median Household Income in Delta County is $68,491.
What is Income or Wage Gap in Delta County?
Income or Wage Gap in Delta County is 7.9%.
Women in Delta County earn 92.1 cents for every dollar earned by a man.
What is Inequality or Gini Index in Delta County?
Inequality or Gini Index in Delta County is 0.45.
What is the Total Population of Delta County?
Total Population of Delta County is 5,278.
What is the Total Male Population of Delta County?
Total Male Population of Delta County is 2,406.
What is the Total Female Population of Delta County?
Total Female Population of Delta County is 2,872.
What is the Ratio of Males per 100 Females in Delta County?
There are 83.77 Males per 100 Females in Delta County.
What is the Ratio of Females per 100 Males in Delta County?
There are 119.37 Females per 100 Males in Delta County.
What is the Median Population Age in Delta County?
Median Population Age in Delta County is 40.6 Years.
What is the Average Family Size in Delta County
Average Family Size in Delta County is 2.8 People.
What is the Average Household Size in Delta County
Average Household Size in Delta County is 2.5 People.
How Large is the Labor Force in Delta County?
There are 2,466 People in the Labor Forcein in Delta County.
What is the Percentage of People in the Labor Force in Delta County?
59.0% of People are in the Labor Force in Delta County.
What is the Unemployment Rate in Delta County?
Unemployment Rate in Delta County is 6.4%.