Deaf Smith County, TX Map & Demographics
Deaf Smith County Map
Deaf Smith County Overview
$23,310
PER CAPITA INCOME
$54,307
AVG FAMILY INCOME
$51,942
AVG HOUSEHOLD INCOME
33.5%
WAGE / INCOME GAP [ % ]
66.5¢/ $1
WAGE / INCOME GAP [ $ ]
$12,312
FAMILY INCOME DEFICIT
0.41
INEQUALITY / GINI INDEX
18,585
TOTAL POPULATION
9,357
MALE POPULATION
9,228
FEMALE POPULATION
101.40
MALES / 100 FEMALES
98.62
FEMALES / 100 MALES
32.0
MEDIAN AGE
3.5
AVG FAMILY SIZE
3.0
AVG HOUSEHOLD SIZE
8,608
LABOR FORCE [ PEOPLE ]
64.0%
PERCENT IN LABOR FORCE
2.1%
UNEMPLOYMENT RATE
Deaf Smith County Area Codes
Income in Deaf Smith County
Income Overview in Deaf Smith County
Per Capita Income in Deaf Smith County is $23,310, while median incomes of families and households are $54,307 and $51,942 respectively.
| Characteristic | Number | Measure |
| Per Capita Income | 18,585 | $23,310 |
| Median Family Income | 4,648 | $54,307 |
| Mean Family Income | 4,648 | $76,269 |
| Median Household Income | 6,022 | $51,942 |
| Mean Household Income | 6,022 | $70,209 |
| Income Deficit | 4,648 | $12,312 |
| Wage / Income Gap (%) | 18,585 | 33.47% |
| Wage / Income Gap ($) | 18,585 | 66.53¢ per $1 |
| Gini / Inequality Index | 18,585 | 0.41 |
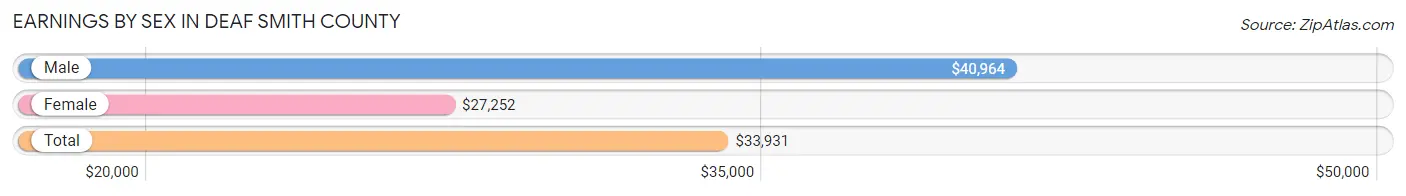
Earnings by Sex in Deaf Smith County
Average Earnings in Deaf Smith County are $33,931, $40,964 for men and $27,252 for women, a difference of 33.5%.
| Sex | Number | Average Earnings |
| Male | 5,292 (59.6%) | $40,964 |
| Female | 3,588 (40.4%) | $27,252 |
| Total | 8,880 (100.0%) | $33,931 |
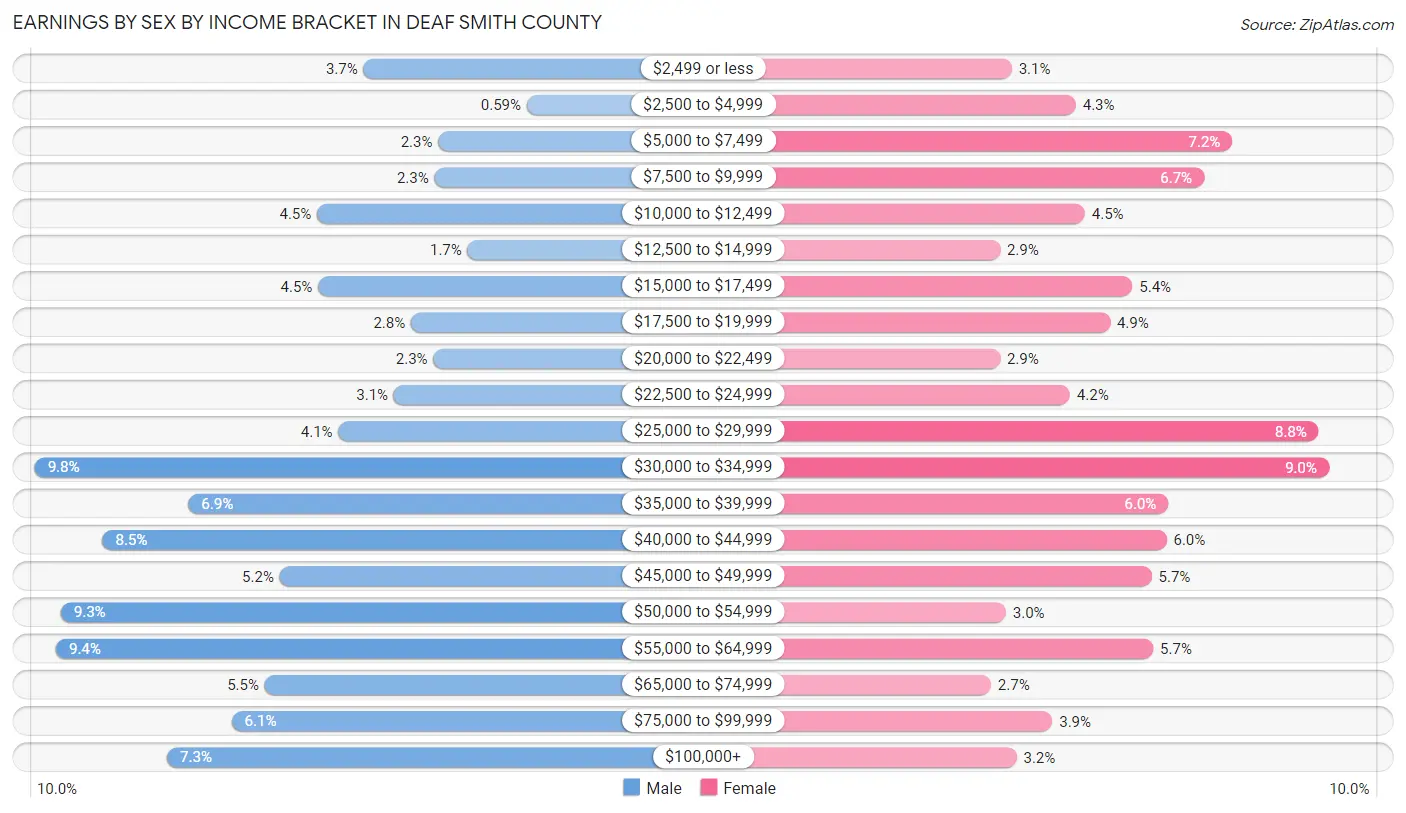
Earnings by Sex by Income Bracket in Deaf Smith County
The most common earnings brackets in Deaf Smith County are $30,000 to $34,999 for men (519 | 9.8%) and $30,000 to $34,999 for women (324 | 9.0%).
| Income | Male | Female |
| $2,499 or less | 193 (3.6%) | 111 (3.1%) |
| $2,500 to $4,999 | 31 (0.6%) | 154 (4.3%) |
| $5,000 to $7,499 | 119 (2.2%) | 259 (7.2%) |
| $7,500 to $9,999 | 123 (2.3%) | 240 (6.7%) |
| $10,000 to $12,499 | 239 (4.5%) | 160 (4.5%) |
| $12,500 to $14,999 | 90 (1.7%) | 103 (2.9%) |
| $15,000 to $17,499 | 238 (4.5%) | 192 (5.3%) |
| $17,500 to $19,999 | 146 (2.8%) | 177 (4.9%) |
| $20,000 to $22,499 | 124 (2.3%) | 103 (2.9%) |
| $22,500 to $24,999 | 163 (3.1%) | 150 (4.2%) |
| $25,000 to $29,999 | 218 (4.1%) | 317 (8.8%) |
| $30,000 to $34,999 | 519 (9.8%) | 324 (9.0%) |
| $35,000 to $39,999 | 367 (6.9%) | 216 (6.0%) |
| $40,000 to $44,999 | 452 (8.5%) | 215 (6.0%) |
| $45,000 to $49,999 | 276 (5.2%) | 205 (5.7%) |
| $50,000 to $54,999 | 493 (9.3%) | 107 (3.0%) |
| $55,000 to $64,999 | 498 (9.4%) | 206 (5.7%) |
| $65,000 to $74,999 | 291 (5.5%) | 97 (2.7%) |
| $75,000 to $99,999 | 324 (6.1%) | 138 (3.8%) |
| $100,000+ | 388 (7.3%) | 114 (3.2%) |
| Total | 5,292 (100.0%) | 3,588 (100.0%) |
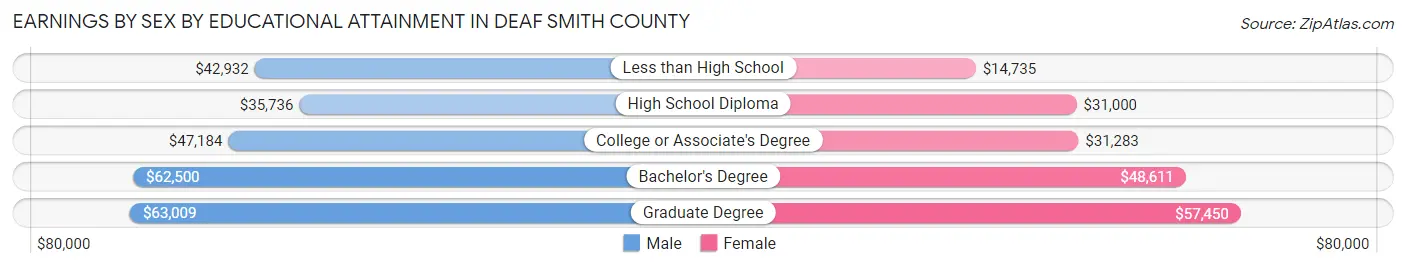
Earnings by Sex by Educational Attainment in Deaf Smith County
Average earnings in Deaf Smith County are $44,510 for men and $31,006 for women, a difference of 30.3%. Men with an educational attainment of graduate degree enjoy the highest average annual earnings of $63,009, while those with high school diploma education earn the least with $35,736. Women with an educational attainment of graduate degree earn the most with the average annual earnings of $57,450, while those with less than high school education have the smallest earnings of $14,735.
| Educational Attainment | Male Income | Female Income |
| Less than High School | $42,932 | $14,735 |
| High School Diploma | $35,736 | $31,000 |
| College or Associate's Degree | $47,184 | $31,283 |
| Bachelor's Degree | $62,500 | $48,611 |
| Graduate Degree | $63,009 | $57,450 |
| Total | $44,510 | $31,006 |
Family Income in Deaf Smith County
Family Income Brackets in Deaf Smith County
According to the Deaf Smith County family income data, there are 897 families falling into the $50,000 to $74,999 income range, which is the most common income bracket and makes up 19.3% of all families. Conversely, the $15,000 to $24,999 income bracket is the least frequent group with only 195 families (4.2%) belonging to this category.
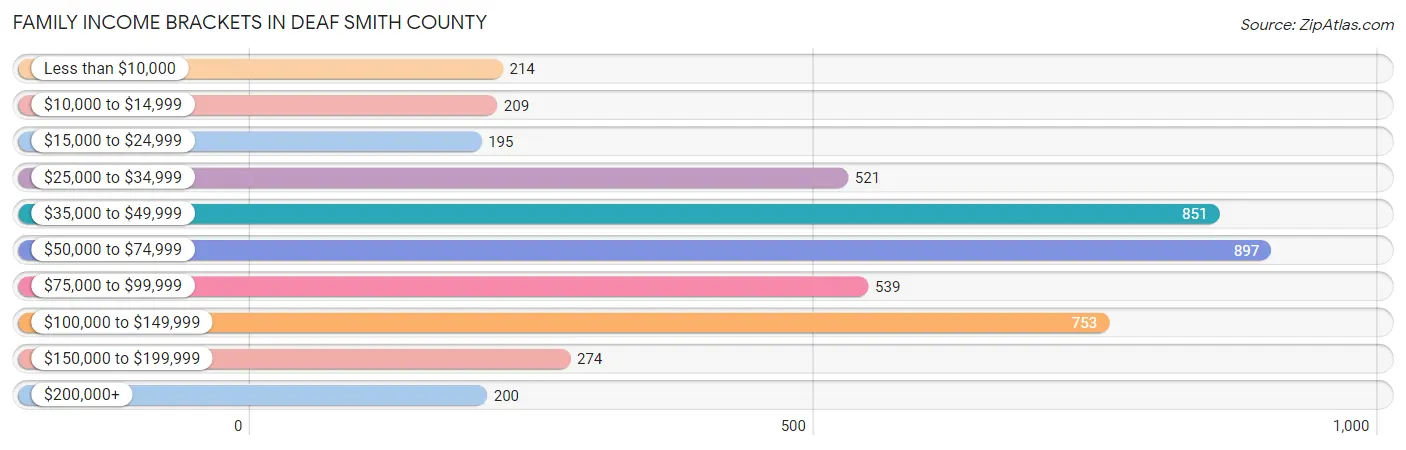
| Income Bracket | # Families | % Families |
| Less than $10,000 | 214 | 4.6% |
| $10,000 to $14,999 | 209 | 4.5% |
| $15,000 to $24,999 | 195 | 4.2% |
| $25,000 to $34,999 | 521 | 11.2% |
| $35,000 to $49,999 | 851 | 18.3% |
| $50,000 to $74,999 | 897 | 19.3% |
| $75,000 to $99,999 | 539 | 11.6% |
| $100,000 to $149,999 | 753 | 16.2% |
| $150,000 to $199,999 | 274 | 5.9% |
| $200,000+ | 200 | 4.3% |
Family Income by Famaliy Size in Deaf Smith County
6-person families (317 | 6.8%) account for the highest median family income in Deaf Smith County with $136,103 per family, while 3-person families (910 | 19.6%) have the highest median income of $23,611 per family member.
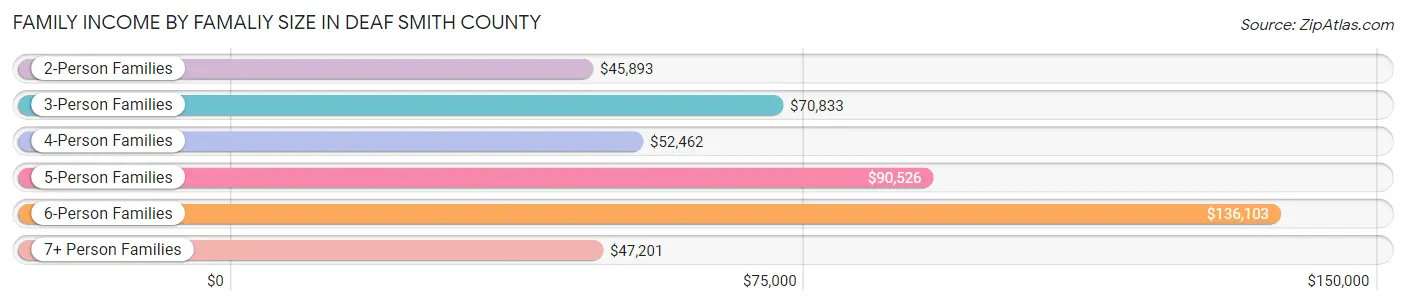
| Income Bracket | # Families | Median Income |
| 2-Person Families | 2,098 (45.1%) | $45,893 |
| 3-Person Families | 910 (19.6%) | $70,833 |
| 4-Person Families | 720 (15.5%) | $52,462 |
| 5-Person Families | 336 (7.2%) | $90,526 |
| 6-Person Families | 317 (6.8%) | $136,103 |
| 7+ Person Families | 267 (5.7%) | $47,201 |
| Total | 4,648 (100.0%) | $54,307 |
Family Income by Number of Earners in Deaf Smith County
The median family income in Deaf Smith County is $54,307, with families comprising 3+ earners (543) having the highest median family income of $135,662, while families with no earners (464) have the lowest median family income of $27,863, accounting for 11.7% and 10.0% of families, respectively.
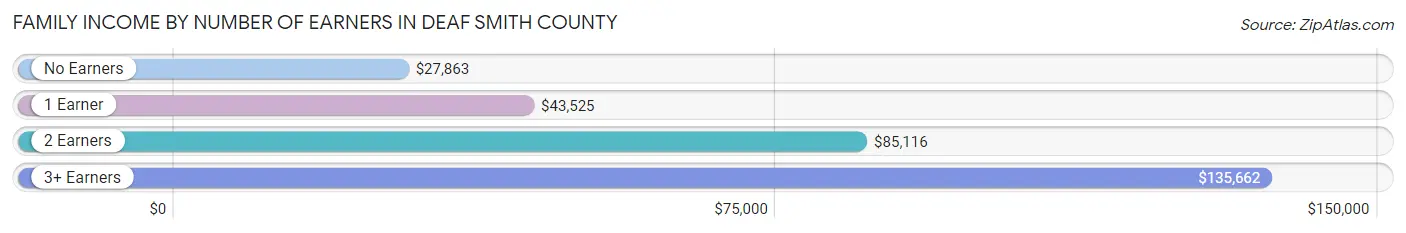
| Number of Earners | # Families | Median Income |
| No Earners | 464 (10.0%) | $27,863 |
| 1 Earner | 1,843 (39.7%) | $43,525 |
| 2 Earners | 1,798 (38.7%) | $85,116 |
| 3+ Earners | 543 (11.7%) | $135,662 |
| Total | 4,648 (100.0%) | $54,307 |
Household Income in Deaf Smith County
Household Income Brackets in Deaf Smith County
With 1,247 households falling in the category, the $35,000 to $49,999 income range is the most frequent in Deaf Smith County, accounting for 20.7% of all households. In contrast, only 199 households (3.3%) fall into the $200,000+ income bracket, making it the least populous group.
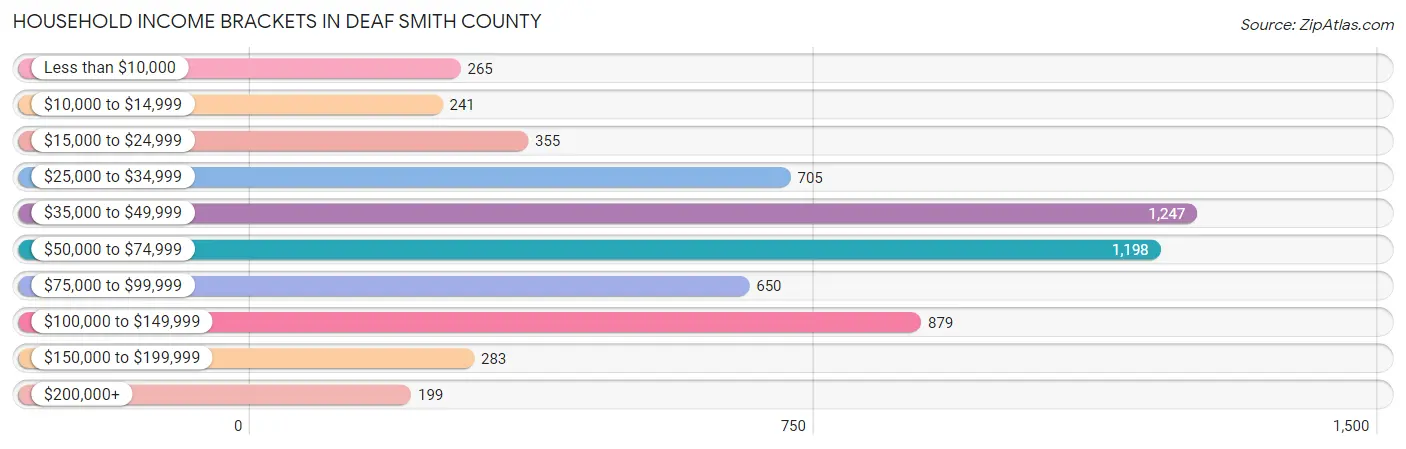
| Income Bracket | # Households | % Households |
| Less than $10,000 | 265 | 4.4% |
| $10,000 to $14,999 | 241 | 4.0% |
| $15,000 to $24,999 | 355 | 5.9% |
| $25,000 to $34,999 | 705 | 11.7% |
| $35,000 to $49,999 | 1,247 | 20.7% |
| $50,000 to $74,999 | 1,198 | 19.9% |
| $75,000 to $99,999 | 650 | 10.8% |
| $100,000 to $149,999 | 879 | 14.6% |
| $150,000 to $199,999 | 283 | 4.7% |
| $200,000+ | 199 | 3.3% |
Household Income by Householder Age in Deaf Smith County
The median household income in Deaf Smith County is $51,942, with the highest median household income of $56,304 found in the 25 to 44 years age bracket for the primary householder. A total of 1,984 households (33.0%) fall into this category. Meanwhile, the 65+ years age bracket for the primary householder has the lowest median household income of $35,986, with 1,373 households (22.8%) in this group.
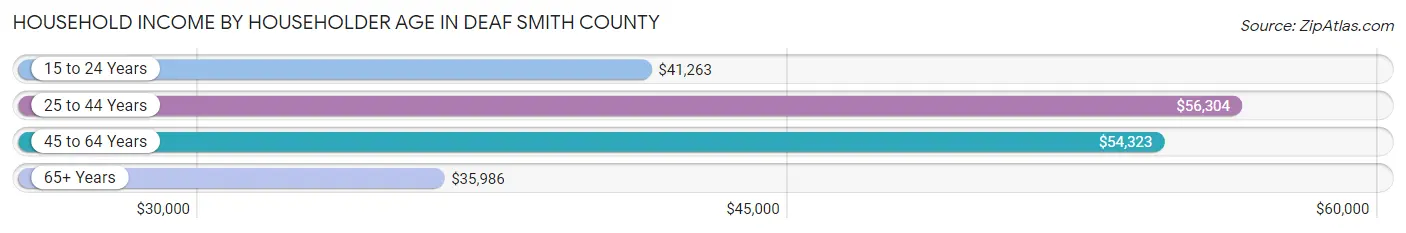
| Income Bracket | # Households | Median Income |
| 15 to 24 Years | 400 (6.6%) | $41,263 |
| 25 to 44 Years | 1,984 (33.0%) | $56,304 |
| 45 to 64 Years | 2,265 (37.6%) | $54,323 |
| 65+ Years | 1,373 (22.8%) | $35,986 |
| Total | 6,022 (100.0%) | $51,942 |
Poverty in Deaf Smith County
Income Below Poverty by Sex and Age in Deaf Smith County
With 13.7% poverty level for males and 18.0% for females among the residents of Deaf Smith County, 12 to 14 year old males and 5 year old females are the most vulnerable to poverty, with 161 males (29.2%) and 70 females (63.6%) in their respective age groups living below the poverty level.
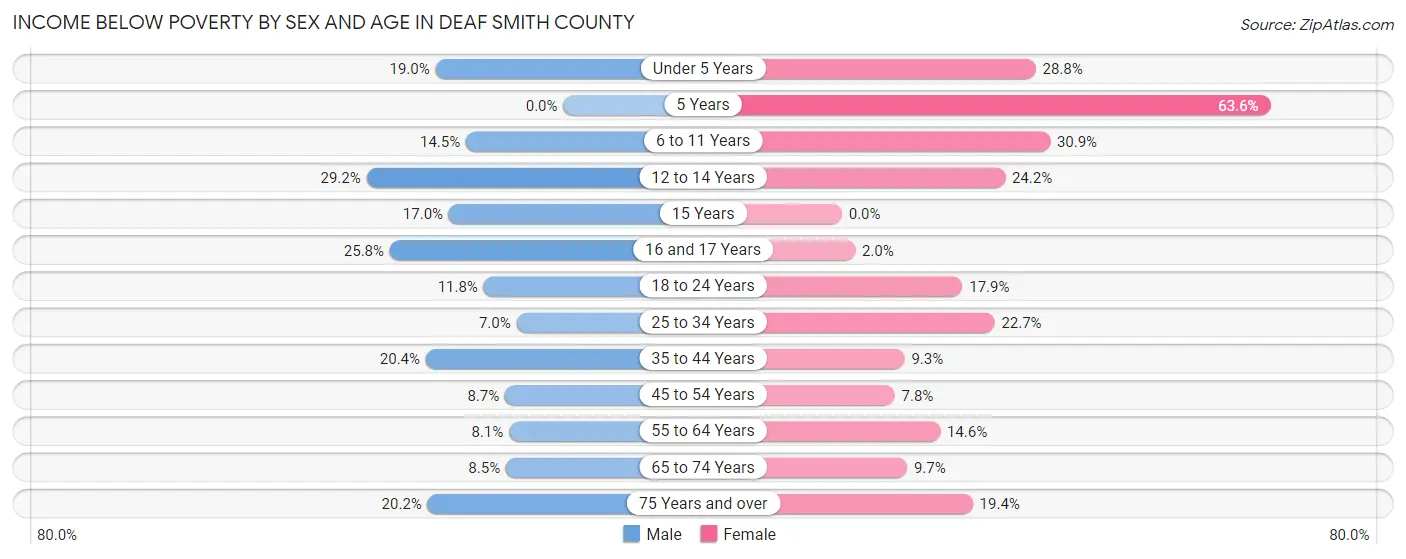
| Age Bracket | Male | Female |
| Under 5 Years | 156 (19.0%) | 212 (28.8%) |
| 5 Years | 0 (0.0%) | 70 (63.6%) |
| 6 to 11 Years | 122 (14.4%) | 293 (30.9%) |
| 12 to 14 Years | 161 (29.2%) | 133 (24.2%) |
| 15 Years | 35 (17.0%) | 0 (0.0%) |
| 16 and 17 Years | 59 (25.8%) | 7 (1.9%) |
| 18 to 24 Years | 128 (11.8%) | 169 (17.9%) |
| 25 to 34 Years | 87 (7.0%) | 275 (22.7%) |
| 35 to 44 Years | 224 (20.4%) | 95 (9.3%) |
| 45 to 54 Years | 82 (8.7%) | 76 (7.8%) |
| 55 to 64 Years | 75 (8.1%) | 135 (14.6%) |
| 65 to 74 Years | 57 (8.5%) | 70 (9.7%) |
| 75 Years and over | 83 (20.2%) | 95 (19.4%) |
| Total | 1,269 (13.7%) | 1,630 (18.0%) |
Income Above Poverty by Sex and Age in Deaf Smith County
According to the poverty statistics in Deaf Smith County, males aged 5 years and females aged 15 years are the age groups that are most secure financially, with 100.0% of males and 100.0% of females in these age groups living above the poverty line.
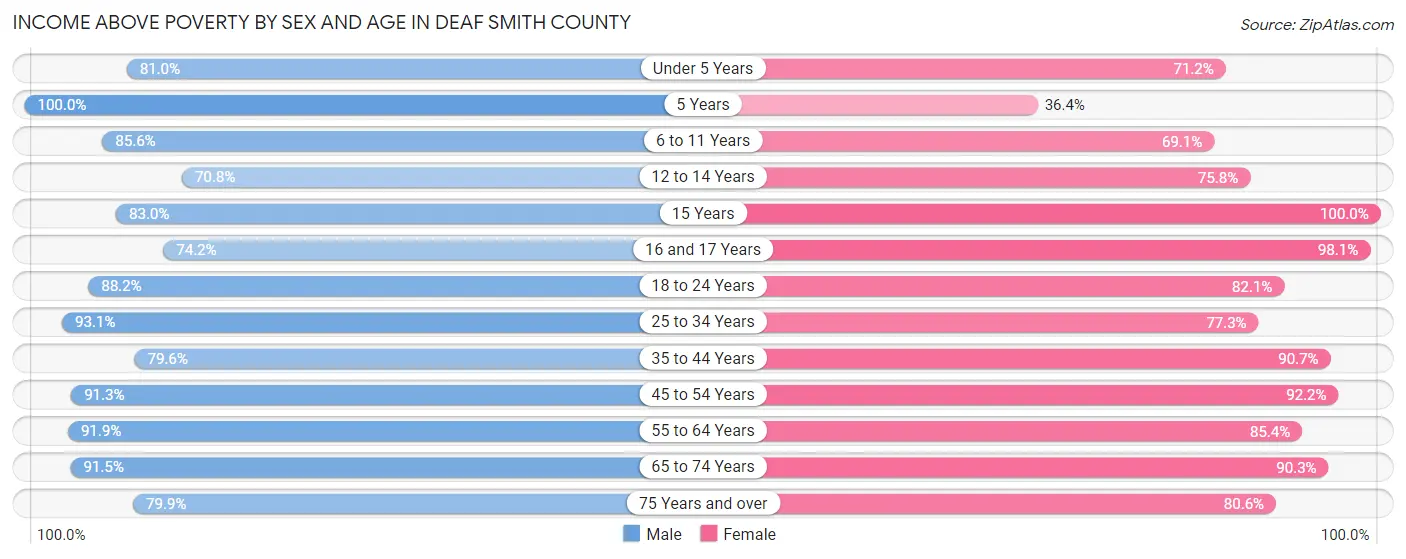
| Age Bracket | Male | Female |
| Under 5 Years | 666 (81.0%) | 525 (71.2%) |
| 5 Years | 202 (100.0%) | 40 (36.4%) |
| 6 to 11 Years | 722 (85.6%) | 655 (69.1%) |
| 12 to 14 Years | 390 (70.8%) | 416 (75.8%) |
| 15 Years | 171 (83.0%) | 68 (100.0%) |
| 16 and 17 Years | 170 (74.2%) | 352 (98.1%) |
| 18 to 24 Years | 954 (88.2%) | 775 (82.1%) |
| 25 to 34 Years | 1,165 (93.0%) | 938 (77.3%) |
| 35 to 44 Years | 873 (79.6%) | 925 (90.7%) |
| 45 to 54 Years | 865 (91.3%) | 893 (92.2%) |
| 55 to 64 Years | 856 (91.9%) | 791 (85.4%) |
| 65 to 74 Years | 612 (91.5%) | 653 (90.3%) |
| 75 Years and over | 329 (79.8%) | 394 (80.6%) |
| Total | 7,975 (86.3%) | 7,425 (82.0%) |
Income Below Poverty Among Married-Couple Families in Deaf Smith County
The poverty statistics for married-couple families in Deaf Smith County show that 5.8% or 190 of the total 3,280 families live below the poverty line. Families with 5 or more children have the highest poverty rate of 43.2%, comprising of 57 families. On the other hand, families with 1 or 2 children have the lowest poverty rate of 0.5%, which includes 5 families.
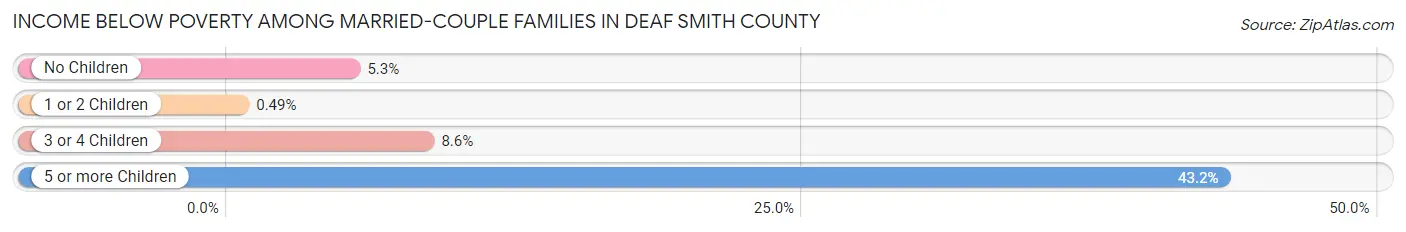
| Children | Above Poverty | Below Poverty |
| No Children | 1,582 (94.7%) | 89 (5.3%) |
| 1 or 2 Children | 1,016 (99.5%) | 5 (0.5%) |
| 3 or 4 Children | 417 (91.4%) | 39 (8.6%) |
| 5 or more Children | 75 (56.8%) | 57 (43.2%) |
| Total | 3,090 (94.2%) | 190 (5.8%) |
Income Below Poverty Among Single-Parent Households in Deaf Smith County
According to the poverty data in Deaf Smith County, 24.3% or 132 single-father households and 29.8% or 246 single-mother households are living below the poverty line. Among single-father households, those with no children have the highest poverty rate, with 83 households (30.0%) experiencing poverty. Likewise, among single-mother households, those with 3 or 4 children have the highest poverty rate, with 61 households (45.9%) falling below the poverty line.
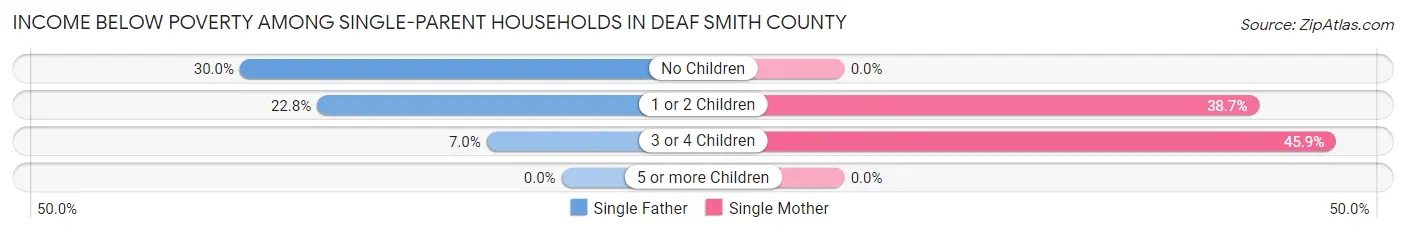
| Children | Single Father | Single Mother |
| No Children | 83 (30.0%) | 0 (0.0%) |
| 1 or 2 Children | 46 (22.8%) | 185 (38.7%) |
| 3 or 4 Children | 3 (7.0%) | 61 (45.9%) |
| 5 or more Children | 0 (0.0%) | 0 (0.0%) |
| Total | 132 (24.3%) | 246 (29.8%) |
Income Below Poverty Among Married-Couple vs Single-Parent Households in Deaf Smith County
The poverty data for Deaf Smith County shows that 190 of the married-couple family households (5.8%) and 378 of the single-parent households (27.6%) are living below the poverty level. Within the married-couple family households, those with 5 or more children have the highest poverty rate, with 57 households (43.2%) falling below the poverty line. Among the single-parent households, those with 3 or 4 children have the highest poverty rate, with 64 household (36.4%) living below poverty.
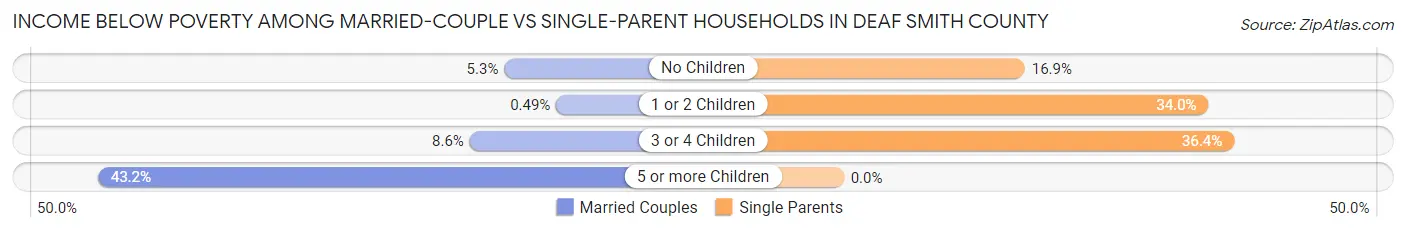
| Children | Married-Couple Families | Single-Parent Households |
| No Children | 89 (5.3%) | 83 (16.9%) |
| 1 or 2 Children | 5 (0.5%) | 231 (34.0%) |
| 3 or 4 Children | 39 (8.6%) | 64 (36.4%) |
| 5 or more Children | 57 (43.2%) | 0 (0.0%) |
| Total | 190 (5.8%) | 378 (27.6%) |
Race in Deaf Smith County
The most populous races in Deaf Smith County are Hispanic or Latino (14,010 | 75.4%), White / Caucasian (11,550 | 62.2%), and Two or more Races (4,843 | 26.1%).
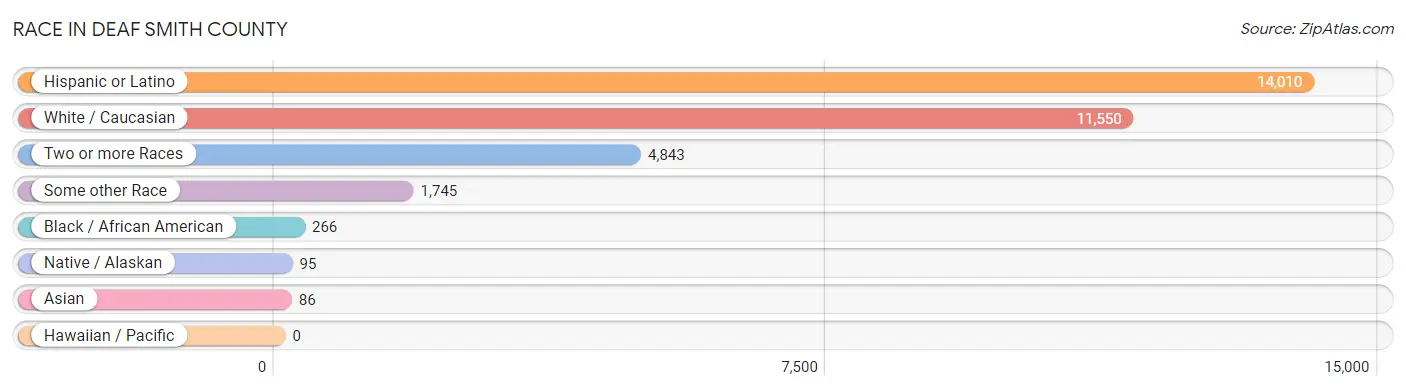
| Race | # Population | % Population |
| Asian | 86 | 0.5% |
| Black / African American | 266 | 1.4% |
| Hawaiian / Pacific | 0 | 0.0% |
| Hispanic or Latino | 14,010 | 75.4% |
| Native / Alaskan | 95 | 0.5% |
| White / Caucasian | 11,550 | 62.2% |
| Two or more Races | 4,843 | 26.1% |
| Some other Race | 1,745 | 9.4% |
| Total | 18,585 | 100.0% |
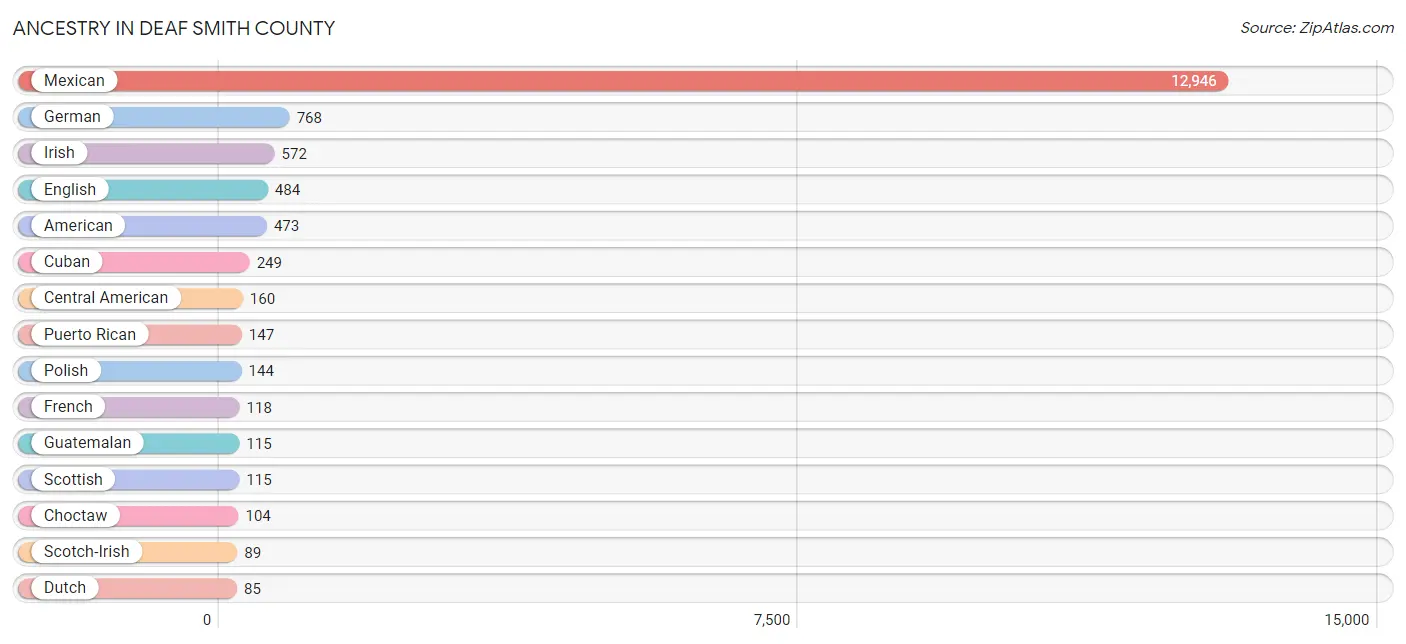
Ancestry in Deaf Smith County
The most populous ancestries reported in Deaf Smith County are Mexican (12,946 | 69.7%), German (768 | 4.1%), Irish (572 | 3.1%), English (484 | 2.6%), and American (473 | 2.5%), together accounting for 82.0% of all Deaf Smith County residents.
| Ancestry | # Population | % Population |
| African | 78 | 0.4% |
| American | 473 | 2.5% |
| Apache | 80 | 0.4% |
| British | 43 | 0.2% |
| Burmese | 77 | 0.4% |
| Central American | 160 | 0.9% |
| Central American Indian | 21 | 0.1% |
| Cherokee | 76 | 0.4% |
| Choctaw | 104 | 0.6% |
| Cuban | 249 | 1.3% |
| Czech | 19 | 0.1% |
| Dutch | 85 | 0.5% |
| Eastern European | 25 | 0.1% |
| English | 484 | 2.6% |
| European | 85 | 0.5% |
| Finnish | 42 | 0.2% |
| French | 118 | 0.6% |
| German | 768 | 4.1% |
| Guatemalan | 115 | 0.6% |
| Irish | 572 | 3.1% |
| Italian | 34 | 0.2% |
| Mexican | 12,946 | 69.7% |
| Nicaraguan | 45 | 0.2% |
| Norwegian | 38 | 0.2% |
| Polish | 144 | 0.8% |
| Puerto Rican | 147 | 0.8% |
| Scandinavian | 30 | 0.2% |
| Scotch-Irish | 89 | 0.5% |
| Scottish | 115 | 0.6% |
| Seminole | 18 | 0.1% |
| Sioux | 31 | 0.2% |
| Slovak | 10 | 0.1% |
| Slovene | 1 | 0.0% |
| Spaniard | 10 | 0.1% |
| Sri Lankan | 9 | 0.1% |
| Subsaharan African | 78 | 0.4% |
| Swedish | 40 | 0.2% |
| Swiss | 28 | 0.2% |
| Ukrainian | 1 | 0.0% |
| Welsh | 44 | 0.2% | View All 40 Rows |
Immigrants in Deaf Smith County
The most numerous immigrant groups reported in Deaf Smith County came from Latin America (3,053 | 16.4%), Central America (2,804 | 15.1%), Mexico (2,677 | 14.4%), Caribbean (249 | 1.3%), and Cuba (249 | 1.3%), together accounting for 48.6% of all Deaf Smith County residents.
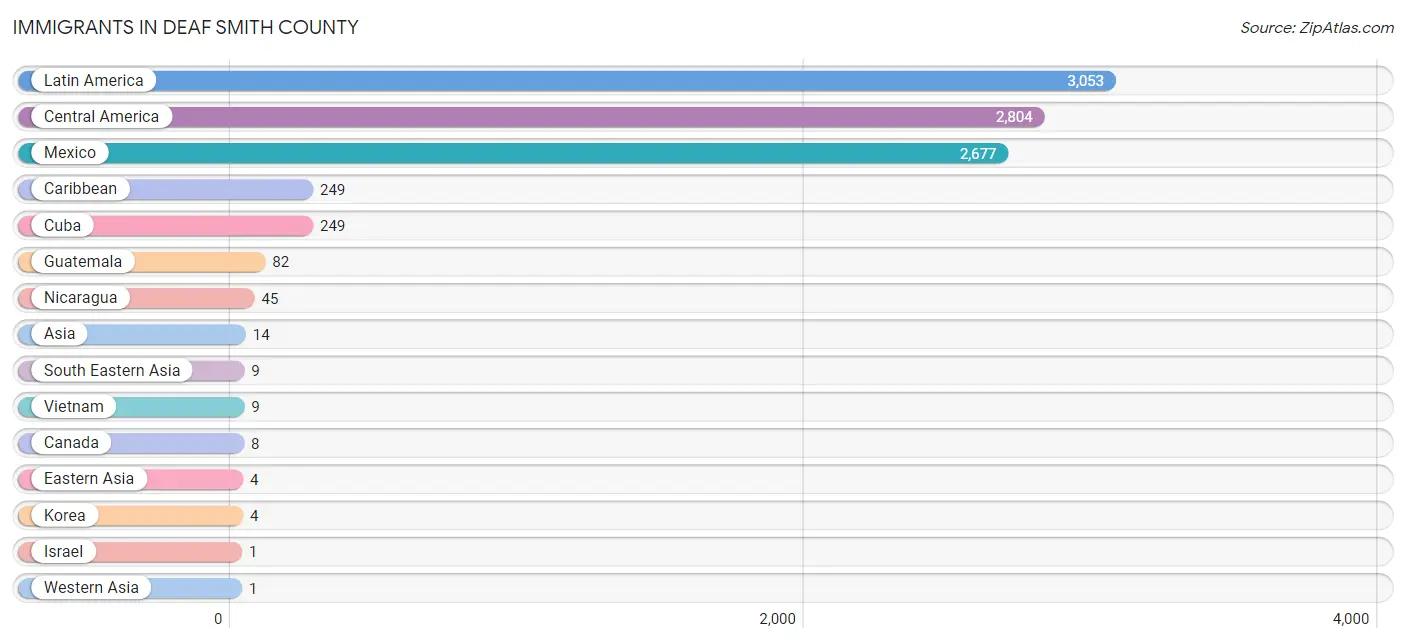
| Immigration Origin | # Population | % Population |
| Asia | 14 | 0.1% |
| Canada | 8 | 0.0% |
| Caribbean | 249 | 1.3% |
| Central America | 2,804 | 15.1% |
| Cuba | 249 | 1.3% |
| Eastern Asia | 4 | 0.0% |
| Guatemala | 82 | 0.4% |
| Israel | 1 | 0.0% |
| Korea | 4 | 0.0% |
| Latin America | 3,053 | 16.4% |
| Mexico | 2,677 | 14.4% |
| Nicaragua | 45 | 0.2% |
| South Eastern Asia | 9 | 0.1% |
| Vietnam | 9 | 0.1% |
| Western Asia | 1 | 0.0% | View All 15 Rows |
Sex and Age in Deaf Smith County
Sex and Age in Deaf Smith County
The most populous age groups in Deaf Smith County are 5 to 9 Years (833 | 8.9%) for men and 10 to 14 Years (852 | 9.2%) for women.
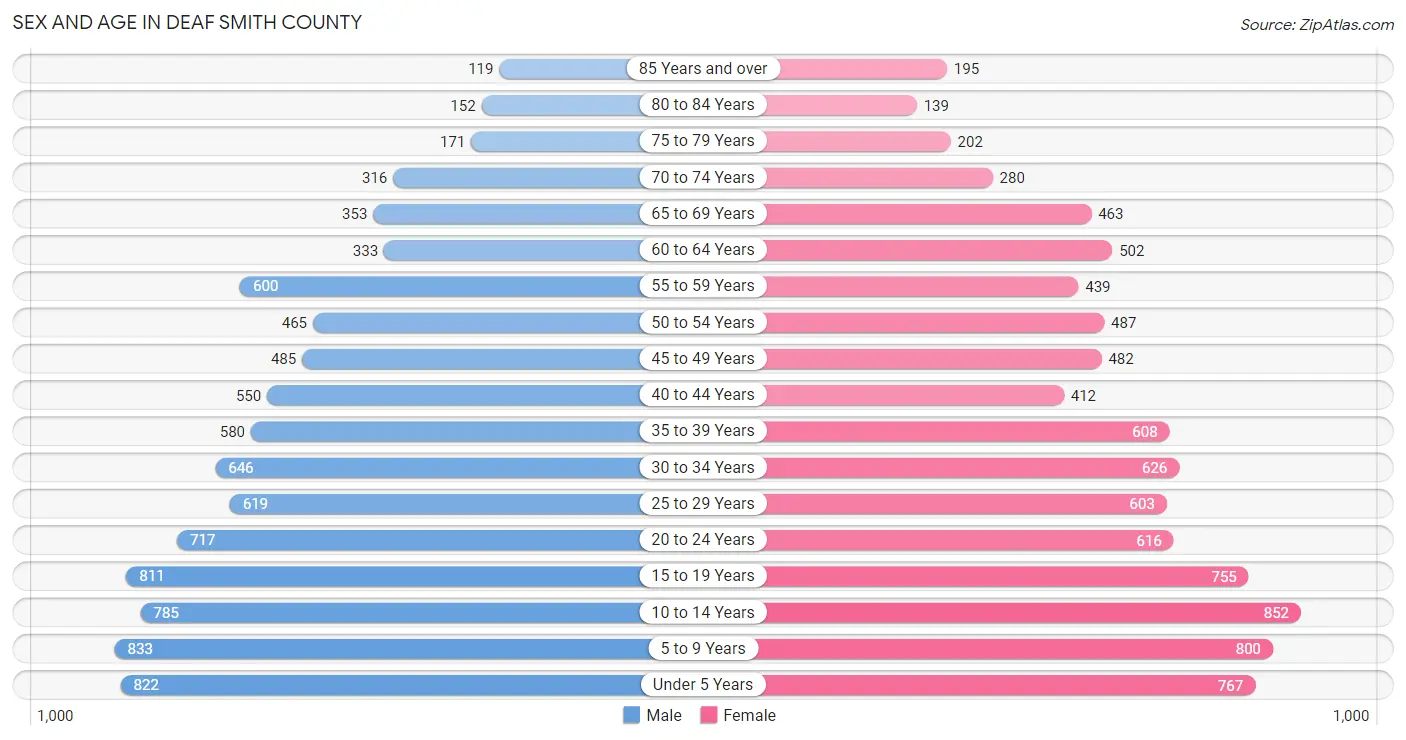
| Age Bracket | Male | Female |
| Under 5 Years | 822 (8.8%) | 767 (8.3%) |
| 5 to 9 Years | 833 (8.9%) | 800 (8.7%) |
| 10 to 14 Years | 785 (8.4%) | 852 (9.2%) |
| 15 to 19 Years | 811 (8.7%) | 755 (8.2%) |
| 20 to 24 Years | 717 (7.7%) | 616 (6.7%) |
| 25 to 29 Years | 619 (6.6%) | 603 (6.5%) |
| 30 to 34 Years | 646 (6.9%) | 626 (6.8%) |
| 35 to 39 Years | 580 (6.2%) | 608 (6.6%) |
| 40 to 44 Years | 550 (5.9%) | 412 (4.5%) |
| 45 to 49 Years | 485 (5.2%) | 482 (5.2%) |
| 50 to 54 Years | 465 (5.0%) | 487 (5.3%) |
| 55 to 59 Years | 600 (6.4%) | 439 (4.8%) |
| 60 to 64 Years | 333 (3.6%) | 502 (5.4%) |
| 65 to 69 Years | 353 (3.8%) | 463 (5.0%) |
| 70 to 74 Years | 316 (3.4%) | 280 (3.0%) |
| 75 to 79 Years | 171 (1.8%) | 202 (2.2%) |
| 80 to 84 Years | 152 (1.6%) | 139 (1.5%) |
| 85 Years and over | 119 (1.3%) | 195 (2.1%) |
| Total | 9,357 (100.0%) | 9,228 (100.0%) |
Families and Households in Deaf Smith County
Median Family Size in Deaf Smith County
The median family size in Deaf Smith County is 3.49 persons per family, with married-couple families (3,280 | 70.6%) accounting for the largest median family size of 3.66 persons per family. On the other hand, single male/father families (542 | 11.7%) represent the smallest median family size with 2.71 persons per family.
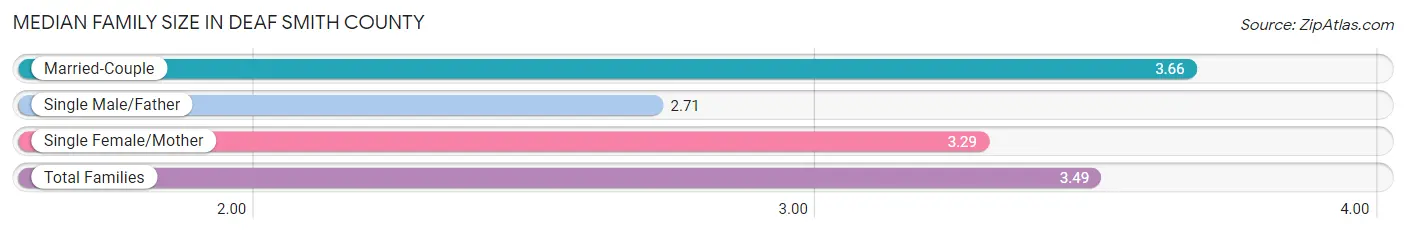
| Family Type | # Families | Family Size |
| Married-Couple | 3,280 (70.6%) | 3.66 |
| Single Male/Father | 542 (11.7%) | 2.71 |
| Single Female/Mother | 826 (17.8%) | 3.29 |
| Total Families | 4,648 (100.0%) | 3.49 |
Median Household Size in Deaf Smith County
The median household size in Deaf Smith County is 3.05 persons per household, with single female/mother households (826 | 13.7%) accounting for the largest median household size of 3.69 persons per household. non-family households (1,374 | 22.8%) represent the smallest median household size with 1.22 persons per household.
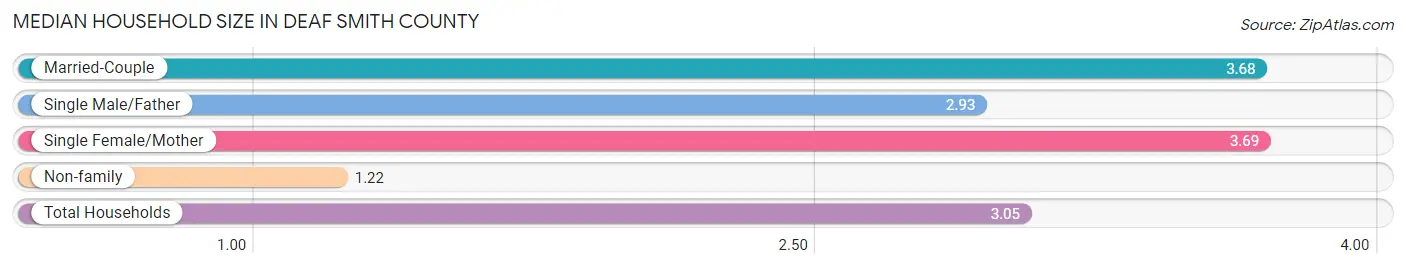
| Household Type | # Households | Household Size |
| Married-Couple | 3,280 (54.5%) | 3.68 |
| Single Male/Father | 542 (9.0%) | 2.93 |
| Single Female/Mother | 826 (13.7%) | 3.69 |
| Non-family | 1,374 (22.8%) | 1.22 |
| Total Households | 6,022 (100.0%) | 3.05 |
Household Size by Marriage Status in Deaf Smith County
Out of a total of 6,022 households in Deaf Smith County, 4,648 (77.2%) are family households, while 1,374 (22.8%) are nonfamily households. The most numerous type of family households are 2-person households, comprising 1,991, and the most common type of nonfamily households are 1-person households, comprising 1,155.
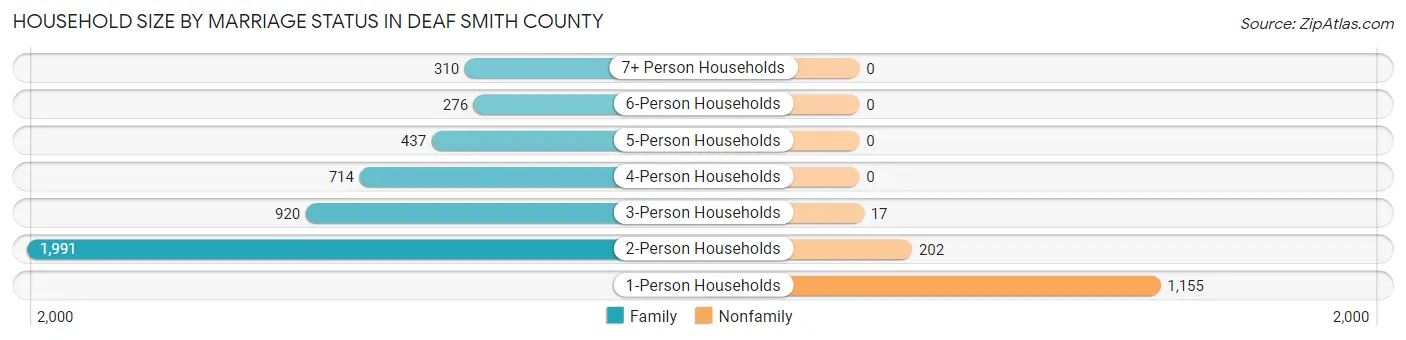
| Household Size | Family Households | Nonfamily Households |
| 1-Person Households | - | 1,155 (19.2%) |
| 2-Person Households | 1,991 (33.1%) | 202 (3.4%) |
| 3-Person Households | 920 (15.3%) | 17 (0.3%) |
| 4-Person Households | 714 (11.9%) | 0 (0.0%) |
| 5-Person Households | 437 (7.3%) | 0 (0.0%) |
| 6-Person Households | 276 (4.6%) | 0 (0.0%) |
| 7+ Person Households | 310 (5.1%) | 0 (0.0%) |
| Total | 4,648 (77.2%) | 1,374 (22.8%) |
Female Fertility in Deaf Smith County
Fertility by Age in Deaf Smith County
Average fertility rate in Deaf Smith County is 52.0 births per 1,000 women. Women in the age bracket of 20 to 34 years have the highest fertility rate with 95.0 births per 1,000 women. Women in the age bracket of 20 to 34 years acount for 81.1% of all women with births.
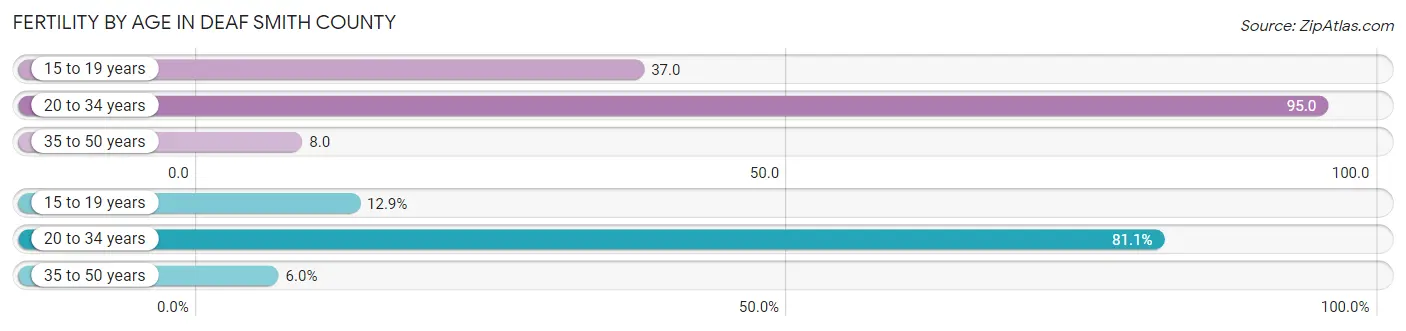
| Age Bracket | Women with Births | Births / 1,000 Women |
| 15 to 19 years | 28 (12.9%) | 37.0 |
| 20 to 34 years | 176 (81.1%) | 95.0 |
| 35 to 50 years | 13 (6.0%) | 8.0 |
| Total | 217 (100.0%) | 52.0 |
Fertility by Age by Marriage Status in Deaf Smith County
58.5% of women with births (217) in Deaf Smith County are married. The highest percentage of unmarried women with births falls into 15 to 19 years age bracket with 100.0% of them unmarried at the time of birth, while the lowest percentage of unmarried women with births belong to 35 to 50 years age bracket with 0.0% of them unmarried.
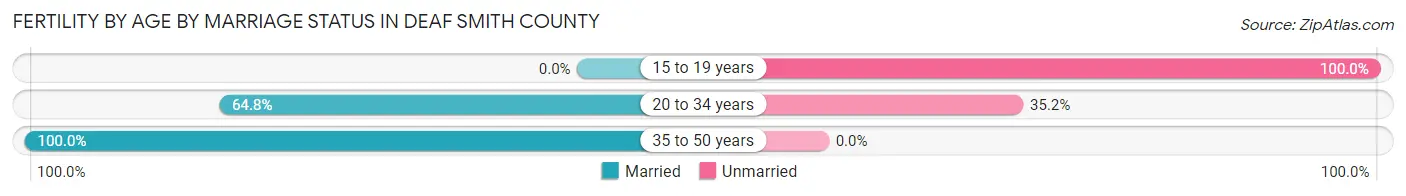
| Age Bracket | Married | Unmarried |
| 15 to 19 years | 0 (0.0%) | 28 (100.0%) |
| 20 to 34 years | 114 (64.8%) | 62 (35.2%) |
| 35 to 50 years | 13 (100.0%) | 0 (0.0%) |
| Total | 127 (58.5%) | 90 (41.5%) |
Fertility by Education in Deaf Smith County
Average fertility rate in Deaf Smith County is 52.0 births per 1,000 women. Women with the education attainment of graduate degree have the highest fertility rate of 135.0 births per 1,000 women, while women with the education attainment of less than high school have the lowest fertility at 30.0 births per 1,000 women. Women with the education attainment of high school diploma represent 35.9% of all women with births.
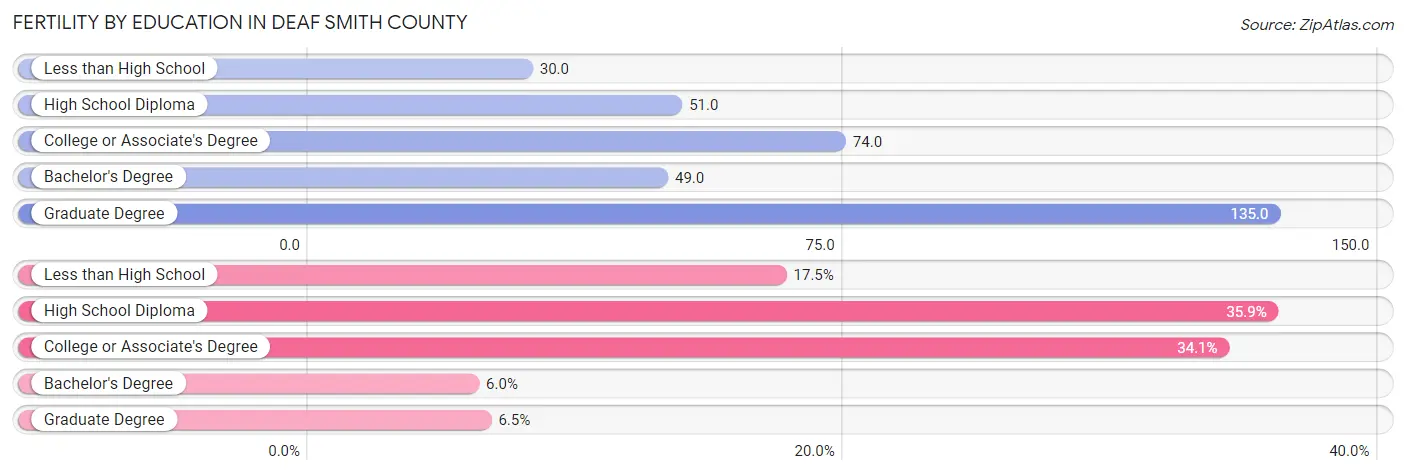
| Educational Attainment | Women with Births | Births / 1,000 Women |
| Less than High School | 38 (17.5%) | 30.0 |
| High School Diploma | 78 (35.9%) | 51.0 |
| College or Associate's Degree | 74 (34.1%) | 74.0 |
| Bachelor's Degree | 13 (6.0%) | 49.0 |
| Graduate Degree | 14 (6.5%) | 135.0 |
| Total | 217 (100.0%) | 52.0 |
Fertility by Education by Marriage Status in Deaf Smith County
41.5% of women with births in Deaf Smith County are unmarried. Women with the educational attainment of bachelor's degree are most likely to be married with 100.0% of them married at childbirth, while women with the educational attainment of less than high school are least likely to be married with 100.0% of them unmarried at childbirth.
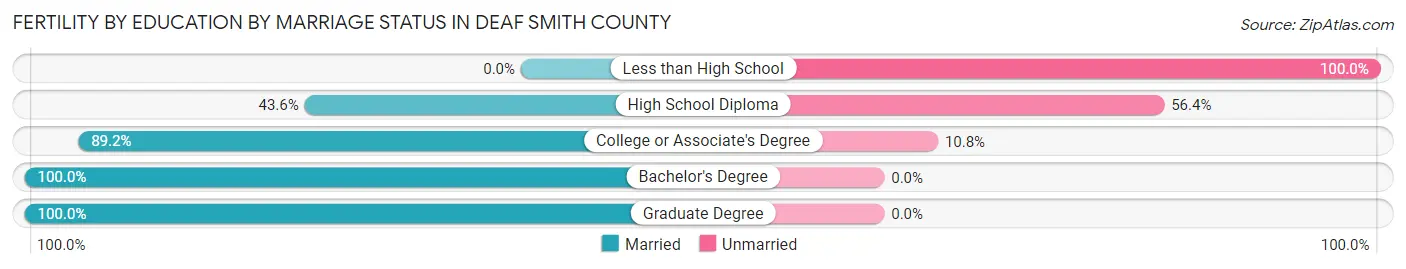
| Educational Attainment | Married | Unmarried |
| Less than High School | 0 (0.0%) | 38 (100.0%) |
| High School Diploma | 34 (43.6%) | 44 (56.4%) |
| College or Associate's Degree | 66 (89.2%) | 8 (10.8%) |
| Bachelor's Degree | 13 (100.0%) | 0 (0.0%) |
| Graduate Degree | 14 (100.0%) | 0 (0.0%) |
| Total | 127 (58.5%) | 90 (41.5%) |
Employment Characteristics in Deaf Smith County
Employment by Class of Employer in Deaf Smith County
Among the 8,286 employed individuals in Deaf Smith County, private company employees (5,966 | 72.0%), local government employees (738 | 8.9%), and self-employed (not incorporated) (592 | 7.1%) make up the most common classes of employment.
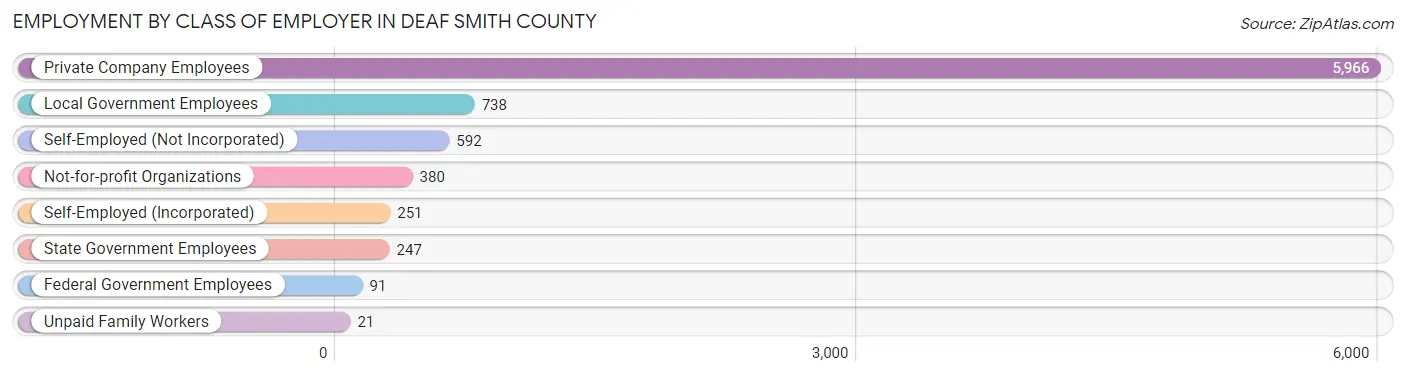
| Employer Class | # Employees | % Employees |
| Private Company Employees | 5,966 | 72.0% |
| Self-Employed (Incorporated) | 251 | 3.0% |
| Self-Employed (Not Incorporated) | 592 | 7.1% |
| Not-for-profit Organizations | 380 | 4.6% |
| Local Government Employees | 738 | 8.9% |
| State Government Employees | 247 | 3.0% |
| Federal Government Employees | 91 | 1.1% |
| Unpaid Family Workers | 21 | 0.3% |
| Total | 8,286 | 100.0% |
Employment Status by Age in Deaf Smith County
According to the labor force statistics for Deaf Smith County, out of the total population over 16 years of age (13,450), 64.0% or 8,608 individuals are in the labor force, with 2.1% or 181 of them unemployed. The age group with the highest labor force participation rate is 25 to 29 years, with 81.8% or 1,000 individuals in the labor force. Within the labor force, the 16 to 19 years age range has the highest percentage of unemployed individuals, with 6.1% or 39 of them being unemployed.
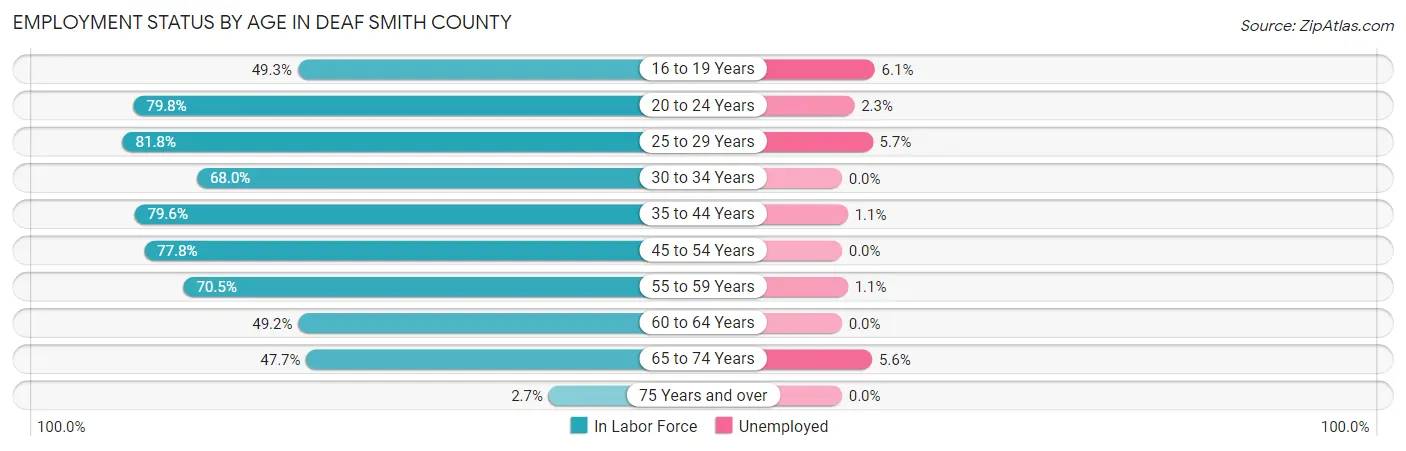
| Age Bracket | In Labor Force | Unemployed |
| 16 to 19 Years | 636 (49.3%) | 39 (6.1%) |
| 20 to 24 Years | 1,064 (79.8%) | 24 (2.3%) |
| 25 to 29 Years | 1,000 (81.8%) | 57 (5.7%) |
| 30 to 34 Years | 865 (68.0%) | 0 (0.0%) |
| 35 to 44 Years | 1,711 (79.6%) | 19 (1.1%) |
| 45 to 54 Years | 1,493 (77.8%) | 0 (0.0%) |
| 55 to 59 Years | 732 (70.5%) | 8 (1.1%) |
| 60 to 64 Years | 411 (49.2%) | 0 (0.0%) |
| 65 to 74 Years | 674 (47.7%) | 38 (5.6%) |
| 75 Years and over | 26 (2.7%) | 0 (0.0%) |
| Total | 8,608 (64.0%) | 181 (2.1%) |
Employment Status by Educational Attainment in Deaf Smith County
According to labor force statistics for Deaf Smith County, 73.6% of individuals (6,210) out of the total population between 25 and 64 years of age (8,437) are in the labor force, with 1.3% or 81 of them being unemployed. The group with the highest labor force participation rate are those with the educational attainment of college / associate degree, with 86.6% or 1,472 individuals in the labor force. Within the labor force, individuals with high school diploma education have the highest percentage of unemployment, with 2.4% or 66 of them being unemployed.
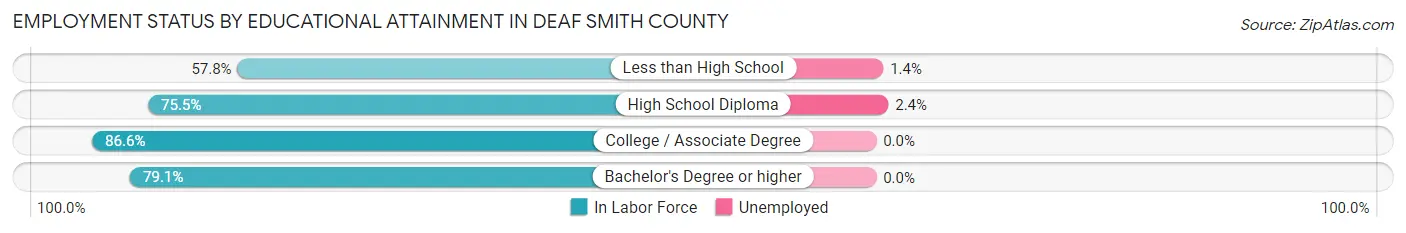
| Educational Attainment | In Labor Force | Unemployed |
| Less than High School | 1,248 (57.8%) | 30 (1.4%) |
| High School Diploma | 2,733 (75.5%) | 87 (2.4%) |
| College / Associate Degree | 1,472 (86.6%) | 0 (0.0%) |
| Bachelor's Degree or higher | 757 (79.1%) | 0 (0.0%) |
| Total | 6,210 (73.6%) | 110 (1.3%) |
Employment Occupations by Sex in Deaf Smith County
Management, Business, Science and Arts Occupations
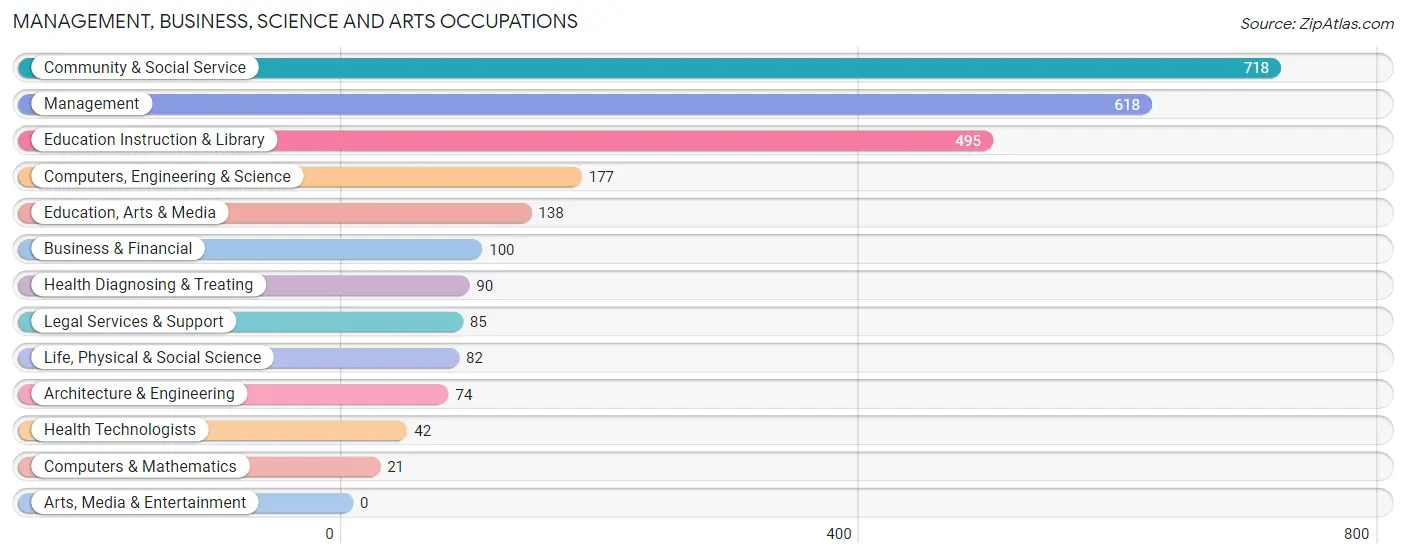
The most common Management, Business, Science and Arts occupations in Deaf Smith County are Community & Social Service (718 | 8.5%), Management (618 | 7.3%), Education Instruction & Library (495 | 5.9%), Computers, Engineering & Science (177 | 2.1%), and Education, Arts & Media (138 | 1.6%).
Management, Business, Science and Arts Occupations by Sex
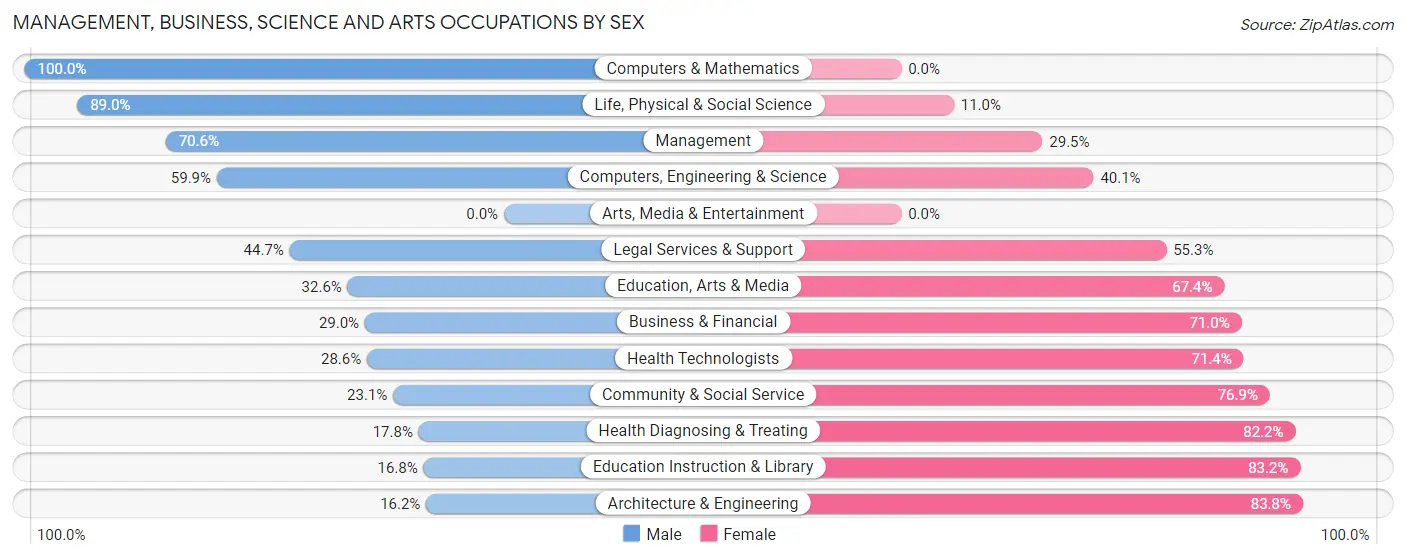
Within the Management, Business, Science and Arts occupations in Deaf Smith County, the most male-oriented occupations are Computers & Mathematics (100.0%), Life, Physical & Social Science (89.0%), and Management (70.6%), while the most female-oriented occupations are Architecture & Engineering (83.8%), Education Instruction & Library (83.2%), and Health Diagnosing & Treating (82.2%).
| Occupation | Male | Female |
| Management | 436 (70.6%) | 182 (29.4%) |
| Business & Financial | 29 (29.0%) | 71 (71.0%) |
| Computers, Engineering & Science | 106 (59.9%) | 71 (40.1%) |
| Computers & Mathematics | 21 (100.0%) | 0 (0.0%) |
| Architecture & Engineering | 12 (16.2%) | 62 (83.8%) |
| Life, Physical & Social Science | 73 (89.0%) | 9 (11.0%) |
| Community & Social Service | 166 (23.1%) | 552 (76.9%) |
| Education, Arts & Media | 45 (32.6%) | 93 (67.4%) |
| Legal Services & Support | 38 (44.7%) | 47 (55.3%) |
| Education Instruction & Library | 83 (16.8%) | 412 (83.2%) |
| Arts, Media & Entertainment | 0 (0.0%) | 0 (0.0%) |
| Health Diagnosing & Treating | 16 (17.8%) | 74 (82.2%) |
| Health Technologists | 12 (28.6%) | 30 (71.4%) |
| Total (Category) | 753 (44.2%) | 950 (55.8%) |
| Total (Overall) | 5,112 (60.7%) | 3,316 (39.4%) |
Services Occupations
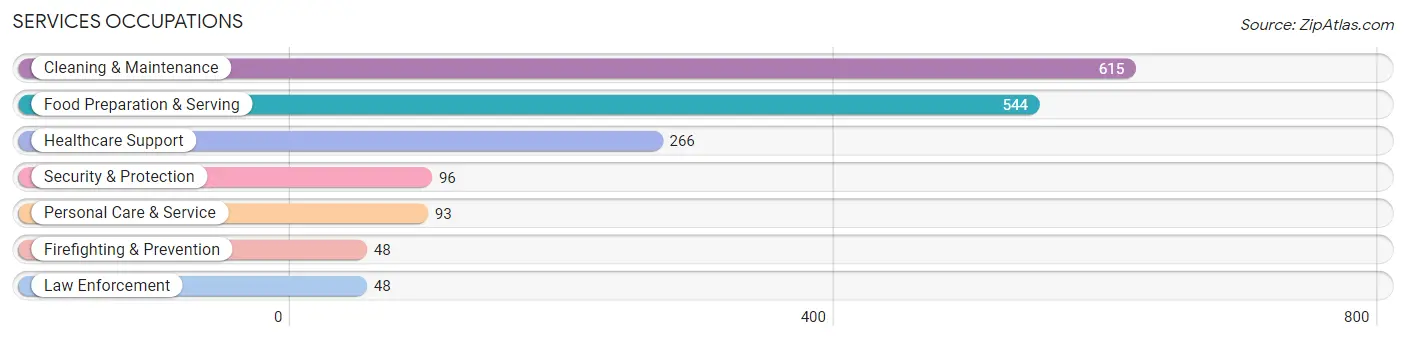
The most common Services occupations in Deaf Smith County are Cleaning & Maintenance (615 | 7.3%), Food Preparation & Serving (544 | 6.5%), Healthcare Support (266 | 3.2%), Security & Protection (96 | 1.1%), and Personal Care & Service (93 | 1.1%).
Services Occupations by Sex
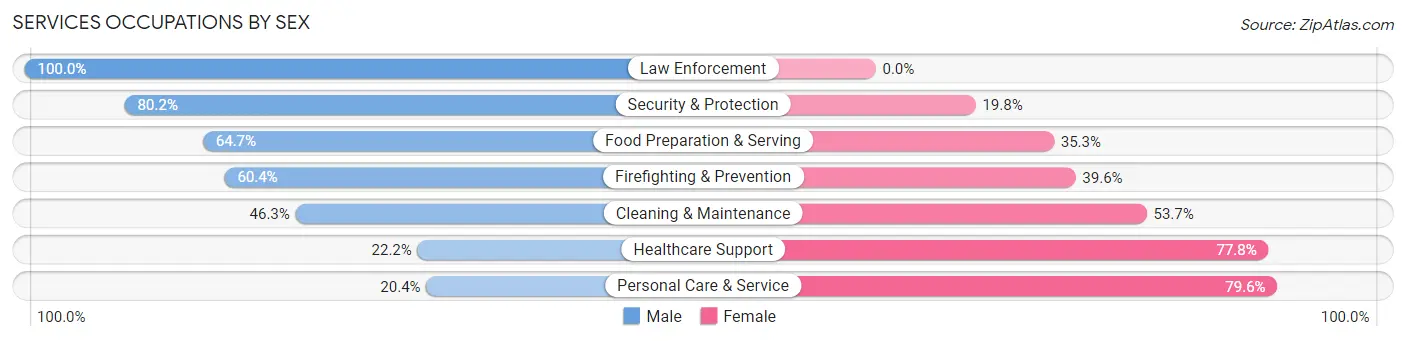
Within the Services occupations in Deaf Smith County, the most male-oriented occupations are Law Enforcement (100.0%), Security & Protection (80.2%), and Food Preparation & Serving (64.7%), while the most female-oriented occupations are Personal Care & Service (79.6%), Healthcare Support (77.8%), and Cleaning & Maintenance (53.7%).
| Occupation | Male | Female |
| Healthcare Support | 59 (22.2%) | 207 (77.8%) |
| Security & Protection | 77 (80.2%) | 19 (19.8%) |
| Firefighting & Prevention | 29 (60.4%) | 19 (39.6%) |
| Law Enforcement | 48 (100.0%) | 0 (0.0%) |
| Food Preparation & Serving | 352 (64.7%) | 192 (35.3%) |
| Cleaning & Maintenance | 285 (46.3%) | 330 (53.7%) |
| Personal Care & Service | 19 (20.4%) | 74 (79.6%) |
| Total (Category) | 792 (49.1%) | 822 (50.9%) |
| Total (Overall) | 5,112 (60.7%) | 3,316 (39.4%) |
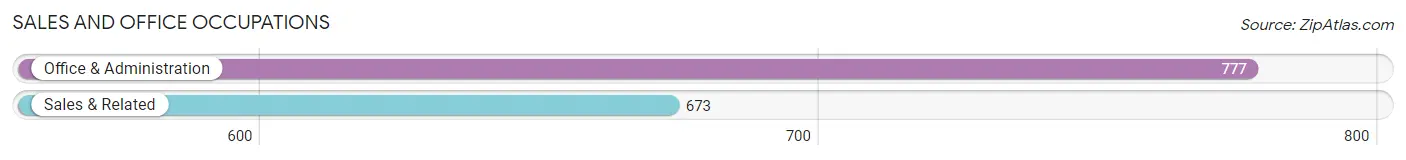
Sales and Office Occupations
The most common Sales and Office occupations in Deaf Smith County are Office & Administration (777 | 9.2%), and Sales & Related (673 | 8.0%).
Sales and Office Occupations by Sex
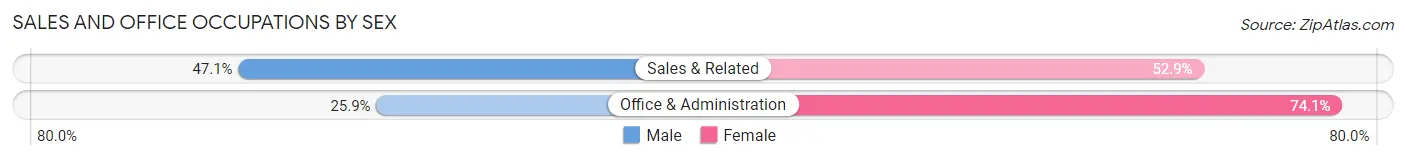
| Occupation | Male | Female |
| Sales & Related | 317 (47.1%) | 356 (52.9%) |
| Office & Administration | 201 (25.9%) | 576 (74.1%) |
| Total (Category) | 518 (35.7%) | 932 (64.3%) |
| Total (Overall) | 5,112 (60.7%) | 3,316 (39.4%) |
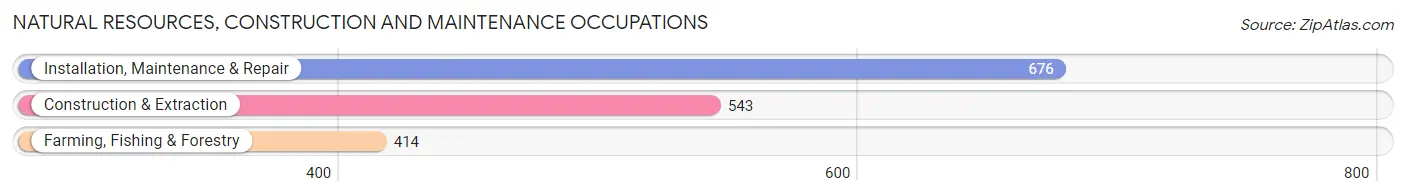
Natural Resources, Construction and Maintenance Occupations
The most common Natural Resources, Construction and Maintenance occupations in Deaf Smith County are Installation, Maintenance & Repair (676 | 8.0%), Construction & Extraction (543 | 6.4%), and Farming, Fishing & Forestry (414 | 4.9%).
Natural Resources, Construction and Maintenance Occupations by Sex
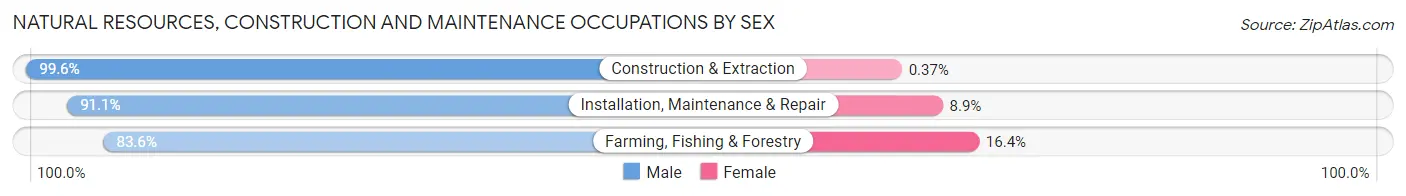
| Occupation | Male | Female |
| Farming, Fishing & Forestry | 346 (83.6%) | 68 (16.4%) |
| Construction & Extraction | 541 (99.6%) | 2 (0.4%) |
| Installation, Maintenance & Repair | 616 (91.1%) | 60 (8.9%) |
| Total (Category) | 1,503 (92.0%) | 130 (8.0%) |
| Total (Overall) | 5,112 (60.7%) | 3,316 (39.4%) |
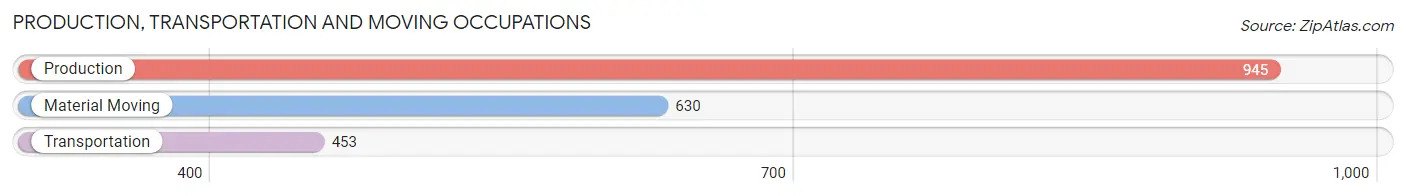
Production, Transportation and Moving Occupations
The most common Production, Transportation and Moving occupations in Deaf Smith County are Production (945 | 11.2%), Material Moving (630 | 7.5%), and Transportation (453 | 5.4%).
Production, Transportation and Moving Occupations by Sex
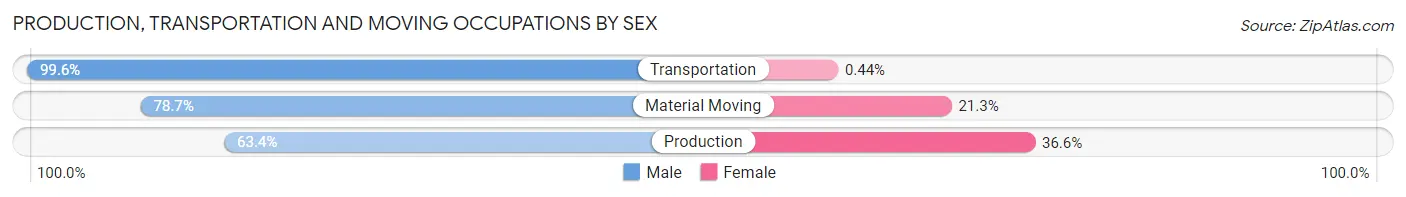
| Occupation | Male | Female |
| Production | 599 (63.4%) | 346 (36.6%) |
| Transportation | 451 (99.6%) | 2 (0.4%) |
| Material Moving | 496 (78.7%) | 134 (21.3%) |
| Total (Category) | 1,546 (76.2%) | 482 (23.8%) |
| Total (Overall) | 5,112 (60.7%) | 3,316 (39.4%) |
Employment Industries by Sex in Deaf Smith County
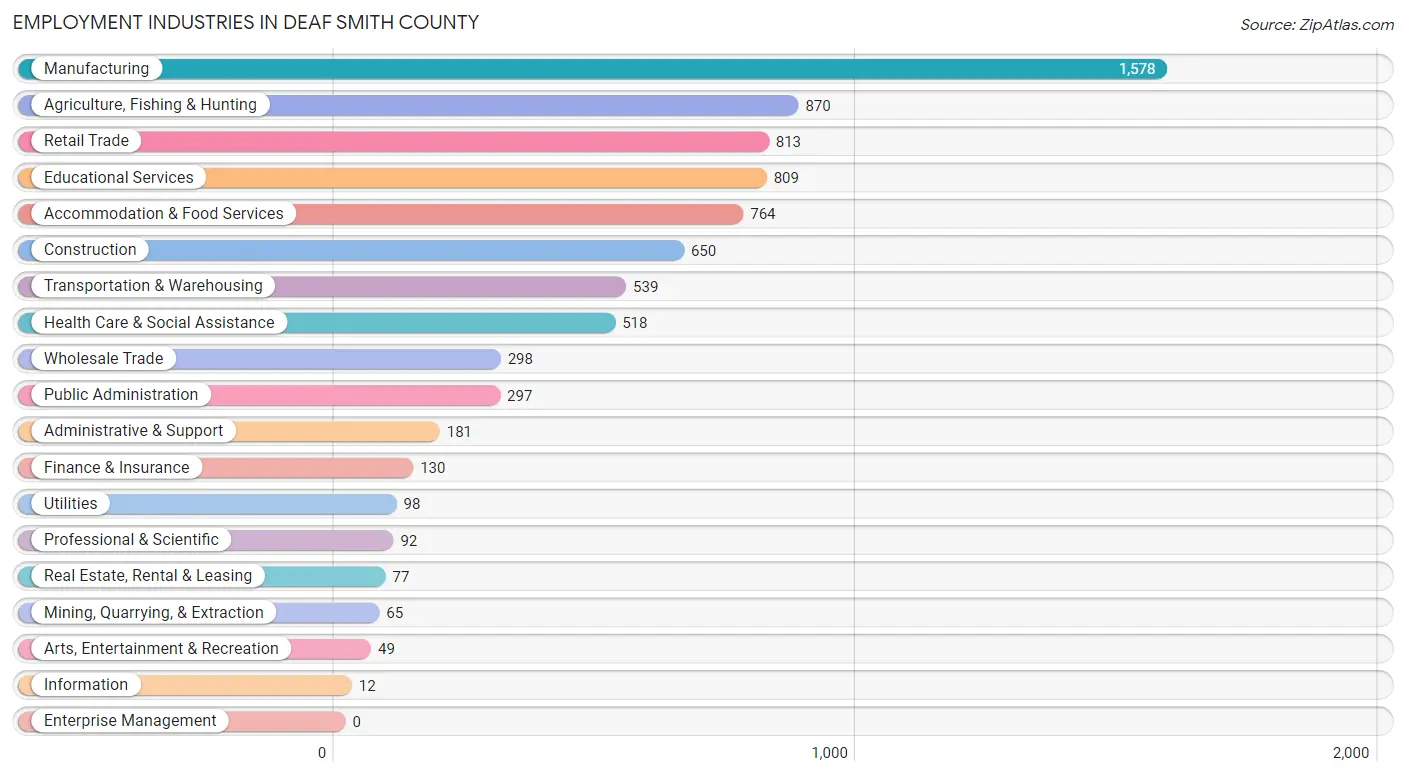
Employment Industries in Deaf Smith County
The major employment industries in Deaf Smith County include Manufacturing (1,578 | 18.7%), Agriculture, Fishing & Hunting (870 | 10.3%), Retail Trade (813 | 9.7%), Educational Services (809 | 9.6%), and Accommodation & Food Services (764 | 9.1%).
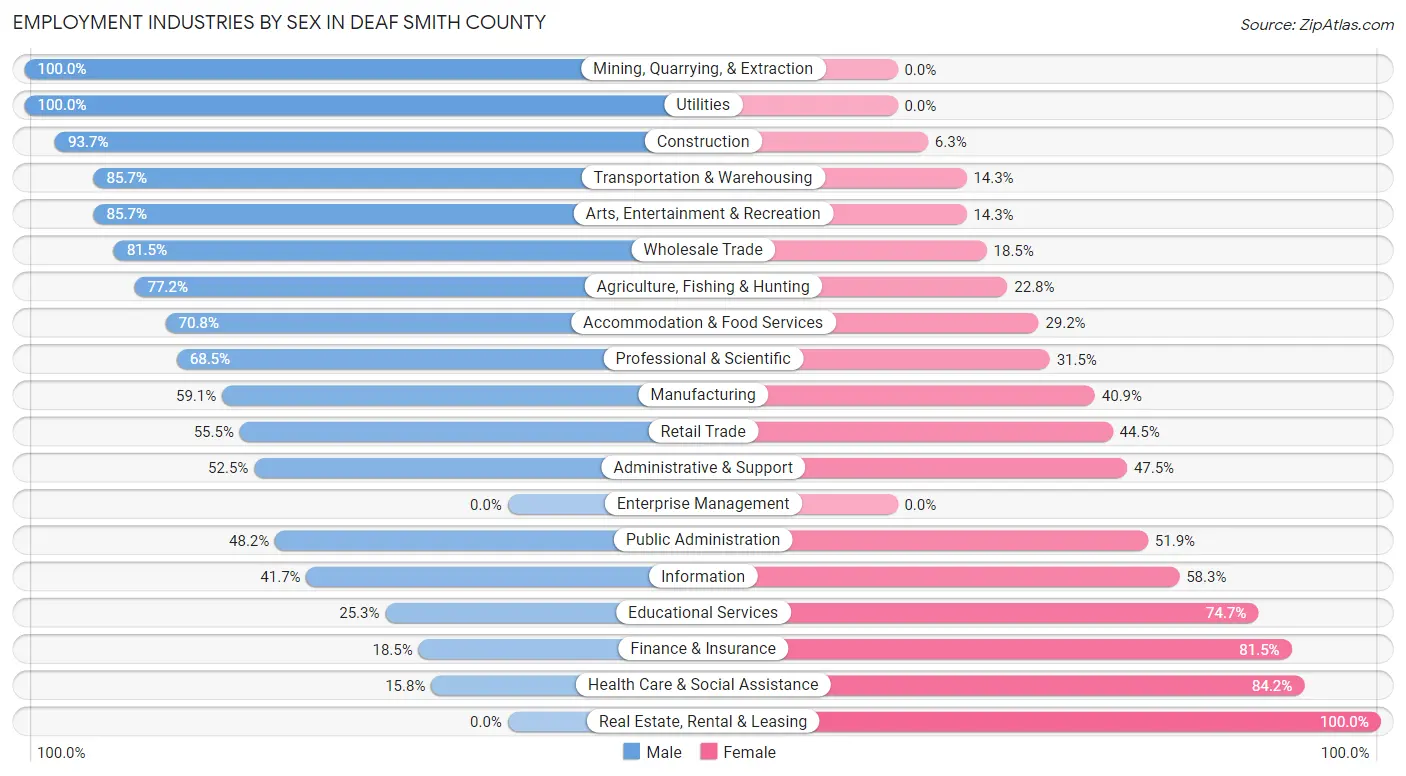
Employment Industries by Sex in Deaf Smith County
The Deaf Smith County industries that see more men than women are Mining, Quarrying, & Extraction (100.0%), Utilities (100.0%), and Construction (93.7%), whereas the industries that tend to have a higher number of women are Real Estate, Rental & Leasing (100.0%), Health Care & Social Assistance (84.2%), and Finance & Insurance (81.5%).
| Industry | Male | Female |
| Agriculture, Fishing & Hunting | 672 (77.2%) | 198 (22.8%) |
| Mining, Quarrying, & Extraction | 65 (100.0%) | 0 (0.0%) |
| Construction | 609 (93.7%) | 41 (6.3%) |
| Manufacturing | 933 (59.1%) | 645 (40.9%) |
| Wholesale Trade | 243 (81.5%) | 55 (18.5%) |
| Retail Trade | 451 (55.5%) | 362 (44.5%) |
| Transportation & Warehousing | 462 (85.7%) | 77 (14.3%) |
| Utilities | 98 (100.0%) | 0 (0.0%) |
| Information | 5 (41.7%) | 7 (58.3%) |
| Finance & Insurance | 24 (18.5%) | 106 (81.5%) |
| Real Estate, Rental & Leasing | 0 (0.0%) | 77 (100.0%) |
| Professional & Scientific | 63 (68.5%) | 29 (31.5%) |
| Enterprise Management | 0 (0.0%) | 0 (0.0%) |
| Administrative & Support | 95 (52.5%) | 86 (47.5%) |
| Educational Services | 205 (25.3%) | 604 (74.7%) |
| Health Care & Social Assistance | 82 (15.8%) | 436 (84.2%) |
| Arts, Entertainment & Recreation | 42 (85.7%) | 7 (14.3%) |
| Accommodation & Food Services | 541 (70.8%) | 223 (29.2%) |
| Public Administration | 143 (48.1%) | 154 (51.8%) |
| Total | 5,112 (60.7%) | 3,316 (39.4%) |
Education in Deaf Smith County
School Enrollment in Deaf Smith County
The most common levels of schooling among the 5,013 students in Deaf Smith County are elementary school (1,254 | 25.0%), high school (1,247 | 24.9%), and middle school (1,237 | 24.7%).
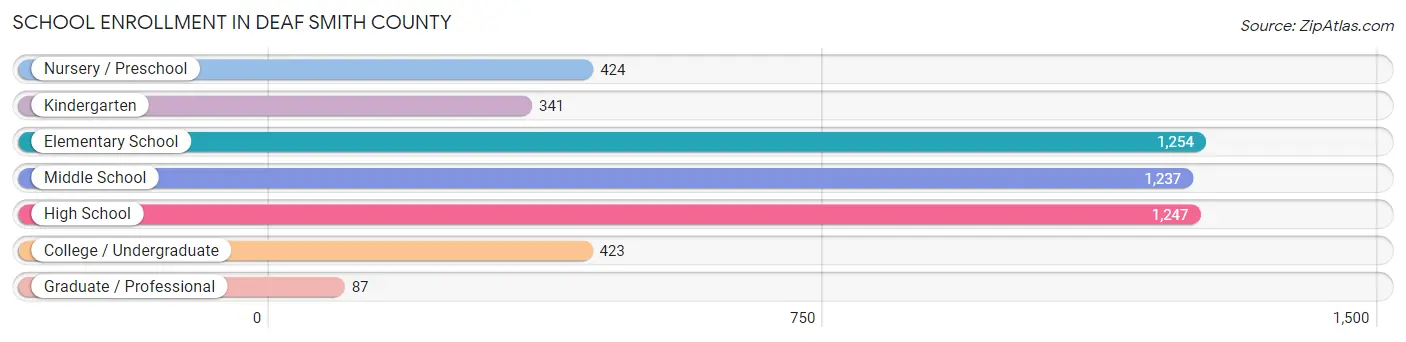
| School Level | # Students | % Students |
| Nursery / Preschool | 424 | 8.5% |
| Kindergarten | 341 | 6.8% |
| Elementary School | 1,254 | 25.0% |
| Middle School | 1,237 | 24.7% |
| High School | 1,247 | 24.9% |
| College / Undergraduate | 423 | 8.4% |
| Graduate / Professional | 87 | 1.7% |
| Total | 5,013 | 100.0% |
School Enrollment by Age by Funding Source in Deaf Smith County
Out of a total of 5,013 students who are enrolled in schools in Deaf Smith County, 261 (5.2%) attend a private institution, while the remaining 4,752 (94.8%) are enrolled in public schools. The age group of 20 to 24 year olds has the highest likelihood of being enrolled in private schools, with 73 (24.0% in the age bracket) enrolled. Conversely, the age group of 18 to 19 year olds has the lowest likelihood of being enrolled in a private school, with 406 (100.0% in the age bracket) attending a public institution.
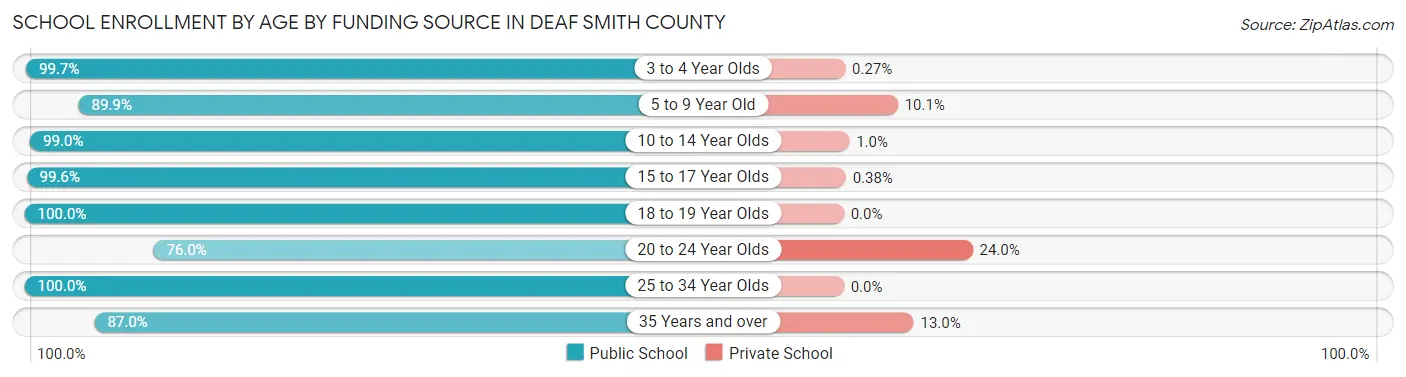
| Age Bracket | Public School | Private School |
| 3 to 4 Year Olds | 364 (99.7%) | 1 (0.3%) |
| 5 to 9 Year Old | 1,296 (89.9%) | 145 (10.1%) |
| 10 to 14 Year Olds | 1,448 (99.0%) | 15 (1.0%) |
| 15 to 17 Year Olds | 786 (99.6%) | 3 (0.4%) |
| 18 to 19 Year Olds | 406 (100.0%) | 0 (0.0%) |
| 20 to 24 Year Olds | 231 (76.0%) | 73 (24.0%) |
| 25 to 34 Year Olds | 76 (100.0%) | 0 (0.0%) |
| 35 Years and over | 147 (87.0%) | 22 (13.0%) |
| Total | 4,752 (94.8%) | 261 (5.2%) |
Educational Attainment by Field of Study in Deaf Smith County
Education (413 | 29.2%), bio, nature & agricultural (209 | 14.8%), business (180 | 12.7%), liberal arts & history (125 | 8.8%), and arts & humanities (110 | 7.8%) are the most common fields of study among 1,414 individuals in Deaf Smith County who have obtained a bachelor's degree or higher.
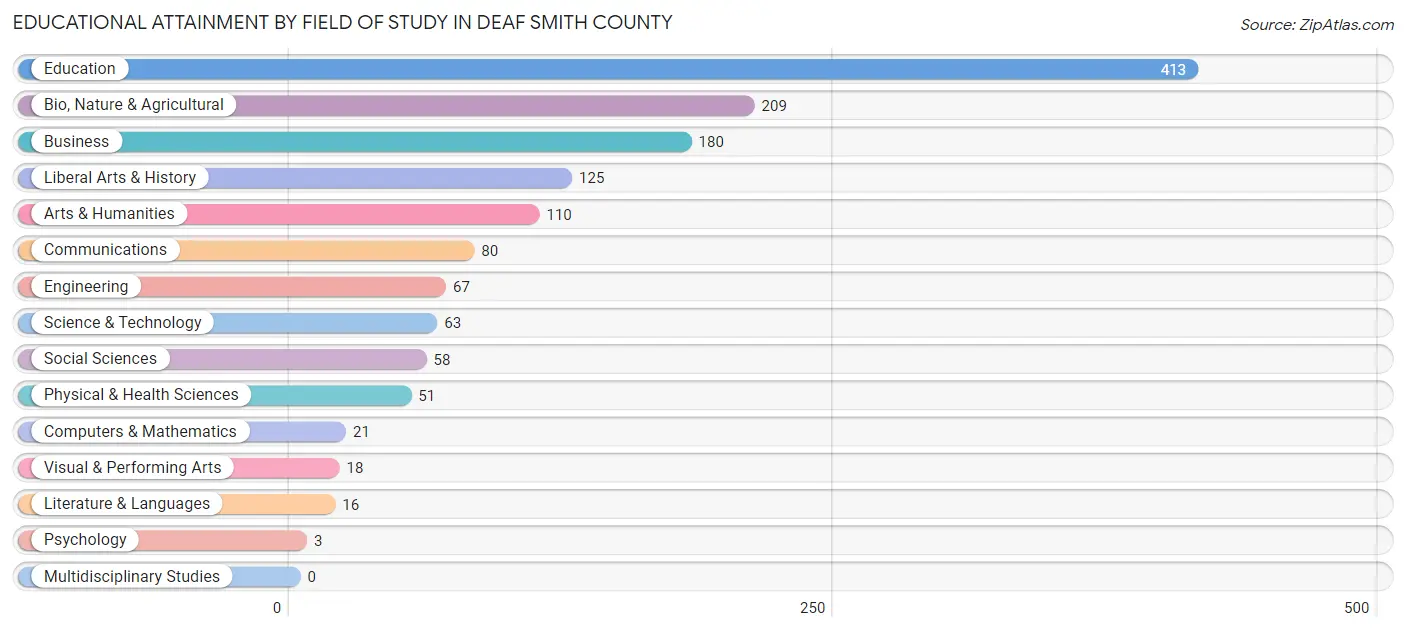
| Field of Study | # Graduates | % Graduates |
| Computers & Mathematics | 21 | 1.5% |
| Bio, Nature & Agricultural | 209 | 14.8% |
| Physical & Health Sciences | 51 | 3.6% |
| Psychology | 3 | 0.2% |
| Social Sciences | 58 | 4.1% |
| Engineering | 67 | 4.7% |
| Multidisciplinary Studies | 0 | 0.0% |
| Science & Technology | 63 | 4.5% |
| Business | 180 | 12.7% |
| Education | 413 | 29.2% |
| Literature & Languages | 16 | 1.1% |
| Liberal Arts & History | 125 | 8.8% |
| Visual & Performing Arts | 18 | 1.3% |
| Communications | 80 | 5.7% |
| Arts & Humanities | 110 | 7.8% |
| Total | 1,414 | 100.0% |
Transportation & Commute in Deaf Smith County
Vehicle Availability by Sex in Deaf Smith County
The most prevalent vehicle ownership categories in Deaf Smith County are males with 2 vehicles (2,254, accounting for 45.0%) and females with 2 vehicles (1,263, making up 68.9%).
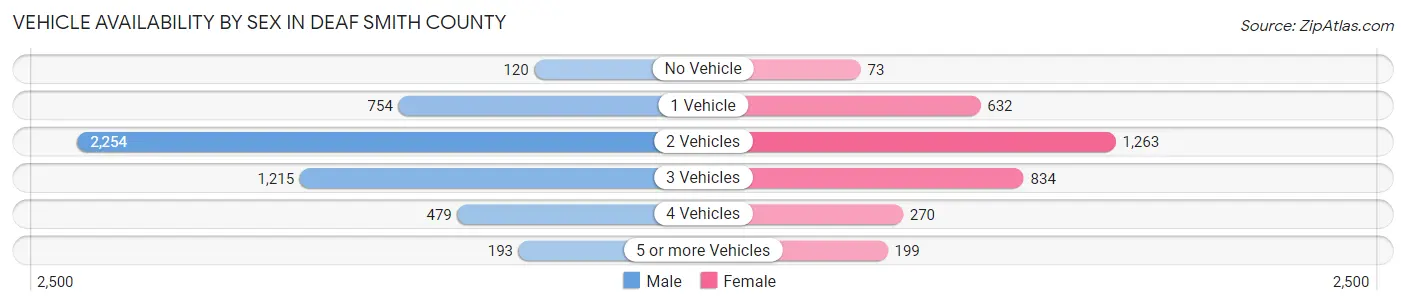
| Vehicles Available | Male | Female |
| No Vehicle | 120 (2.4%) | 73 (2.2%) |
| 1 Vehicle | 754 (15.0%) | 632 (19.3%) |
| 2 Vehicles | 2,254 (45.0%) | 1,263 (38.6%) |
| 3 Vehicles | 1,215 (24.2%) | 834 (25.5%) |
| 4 Vehicles | 479 (9.6%) | 270 (8.3%) |
| 5 or more Vehicles | 193 (3.8%) | 199 (6.1%) |
| Total | 5,015 (100.0%) | 3,271 (100.0%) |
Commute Time in Deaf Smith County
The most frequently occuring commute durations in Deaf Smith County are 5 to 9 minutes (2,046 commuters, 25.4%), 10 to 14 minutes (1,895 commuters, 23.6%), and 15 to 19 minutes (1,518 commuters, 18.9%).
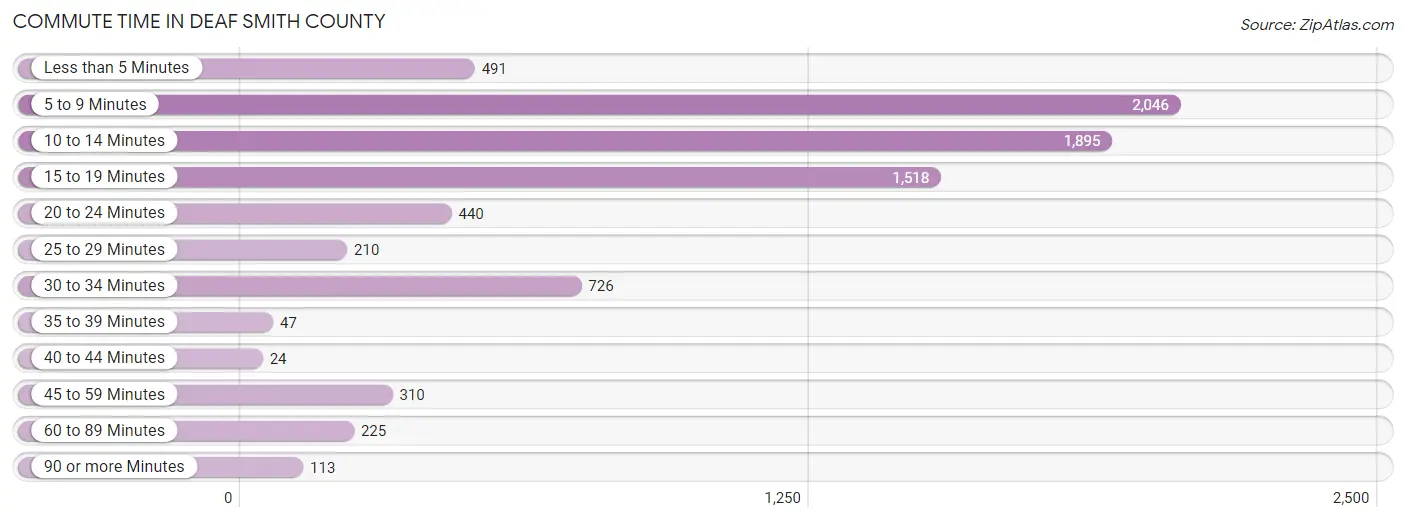
| Commute Time | # Commuters | % Commuters |
| Less than 5 Minutes | 491 | 6.1% |
| 5 to 9 Minutes | 2,046 | 25.4% |
| 10 to 14 Minutes | 1,895 | 23.6% |
| 15 to 19 Minutes | 1,518 | 18.9% |
| 20 to 24 Minutes | 440 | 5.5% |
| 25 to 29 Minutes | 210 | 2.6% |
| 30 to 34 Minutes | 726 | 9.0% |
| 35 to 39 Minutes | 47 | 0.6% |
| 40 to 44 Minutes | 24 | 0.3% |
| 45 to 59 Minutes | 310 | 3.8% |
| 60 to 89 Minutes | 225 | 2.8% |
| 90 or more Minutes | 113 | 1.4% |
Commute Time by Sex in Deaf Smith County
The most common commute times in Deaf Smith County are 10 to 14 minutes (1,294 commuters, 26.5%) for males and 5 to 9 minutes (1,056 commuters, 33.5%) for females.
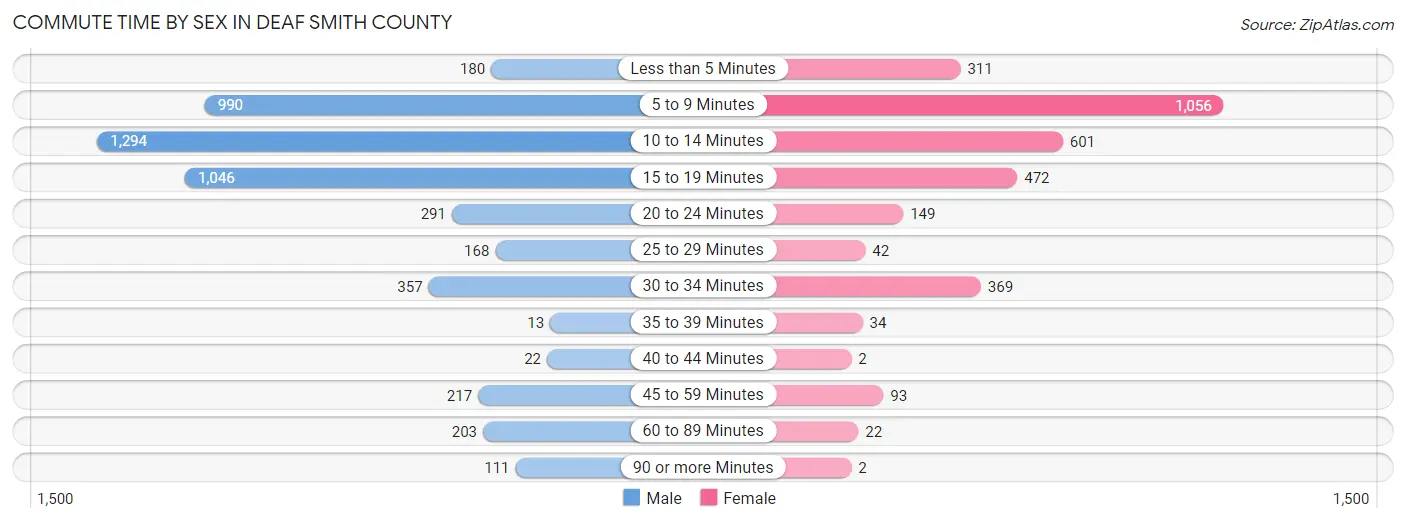
| Commute Time | Male | Female |
| Less than 5 Minutes | 180 (3.7%) | 311 (9.9%) |
| 5 to 9 Minutes | 990 (20.2%) | 1,056 (33.5%) |
| 10 to 14 Minutes | 1,294 (26.5%) | 601 (19.1%) |
| 15 to 19 Minutes | 1,046 (21.4%) | 472 (15.0%) |
| 20 to 24 Minutes | 291 (5.9%) | 149 (4.7%) |
| 25 to 29 Minutes | 168 (3.4%) | 42 (1.3%) |
| 30 to 34 Minutes | 357 (7.3%) | 369 (11.7%) |
| 35 to 39 Minutes | 13 (0.3%) | 34 (1.1%) |
| 40 to 44 Minutes | 22 (0.4%) | 2 (0.1%) |
| 45 to 59 Minutes | 217 (4.4%) | 93 (2.9%) |
| 60 to 89 Minutes | 203 (4.2%) | 22 (0.7%) |
| 90 or more Minutes | 111 (2.3%) | 2 (0.1%) |
Time of Departure to Work by Sex in Deaf Smith County
The most frequent times of departure to work in Deaf Smith County are 6:00 AM to 6:29 AM (785, 16.1%) for males and 7:30 AM to 7:59 AM (873, 27.7%) for females.
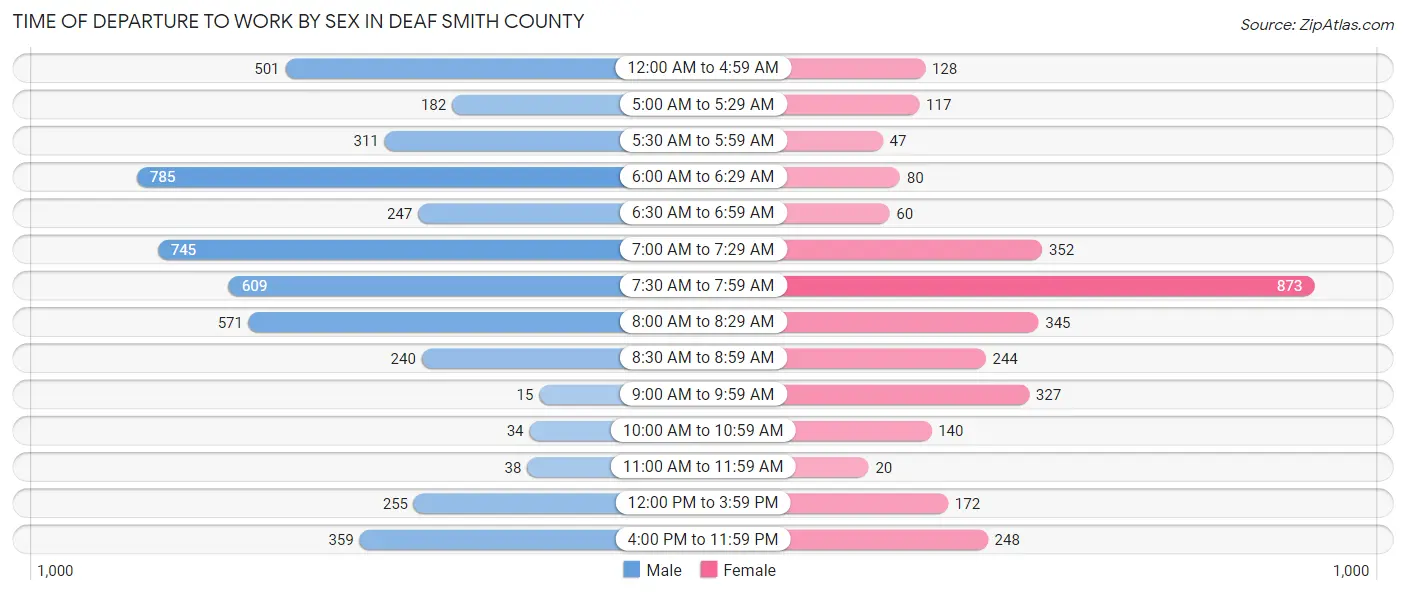
| Time of Departure | Male | Female |
| 12:00 AM to 4:59 AM | 501 (10.2%) | 128 (4.1%) |
| 5:00 AM to 5:29 AM | 182 (3.7%) | 117 (3.7%) |
| 5:30 AM to 5:59 AM | 311 (6.4%) | 47 (1.5%) |
| 6:00 AM to 6:29 AM | 785 (16.1%) | 80 (2.5%) |
| 6:30 AM to 6:59 AM | 247 (5.1%) | 60 (1.9%) |
| 7:00 AM to 7:29 AM | 745 (15.2%) | 352 (11.2%) |
| 7:30 AM to 7:59 AM | 609 (12.4%) | 873 (27.7%) |
| 8:00 AM to 8:29 AM | 571 (11.7%) | 345 (10.9%) |
| 8:30 AM to 8:59 AM | 240 (4.9%) | 244 (7.7%) |
| 9:00 AM to 9:59 AM | 15 (0.3%) | 327 (10.4%) |
| 10:00 AM to 10:59 AM | 34 (0.7%) | 140 (4.4%) |
| 11:00 AM to 11:59 AM | 38 (0.8%) | 20 (0.6%) |
| 12:00 PM to 3:59 PM | 255 (5.2%) | 172 (5.5%) |
| 4:00 PM to 11:59 PM | 359 (7.3%) | 248 (7.9%) |
| Total | 4,892 (100.0%) | 3,153 (100.0%) |
Housing Occupancy in Deaf Smith County
Occupancy by Ownership in Deaf Smith County
Of the total 6,022 dwellings in Deaf Smith County, owner-occupied units account for 3,881 (64.4%), while renter-occupied units make up 2,141 (35.5%).
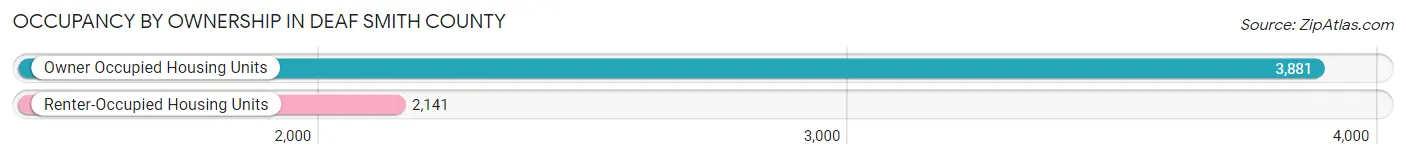
| Occupancy | # Housing Units | % Housing Units |
| Owner Occupied Housing Units | 3,881 | 64.4% |
| Renter-Occupied Housing Units | 2,141 | 35.5% |
| Total Occupied Housing Units | 6,022 | 100.0% |
Occupancy by Household Size in Deaf Smith County
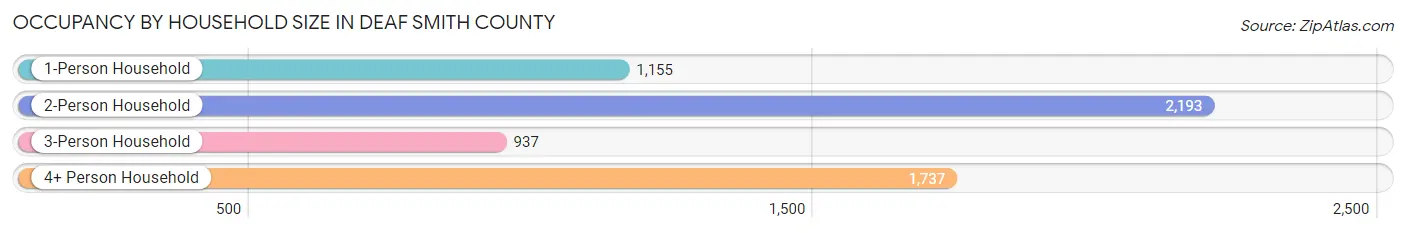
| Household Size | # Housing Units | % Housing Units |
| 1-Person Household | 1,155 | 19.2% |
| 2-Person Household | 2,193 | 36.4% |
| 3-Person Household | 937 | 15.6% |
| 4+ Person Household | 1,737 | 28.8% |
| Total Housing Units | 6,022 | 100.0% |
Occupancy by Ownership by Household Size in Deaf Smith County
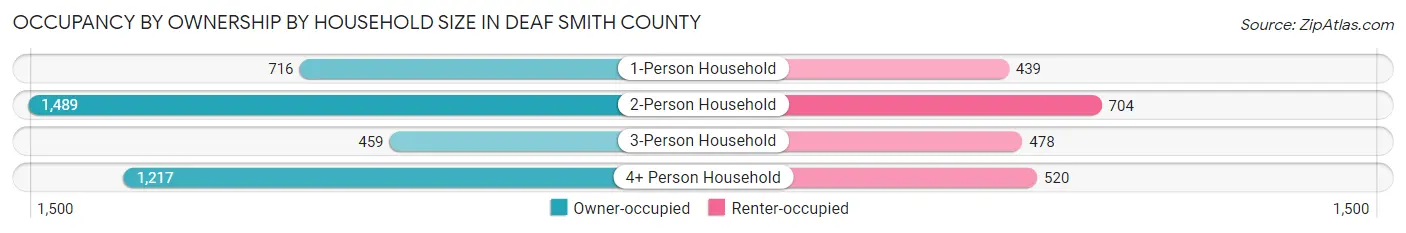
| Household Size | Owner-occupied | Renter-occupied |
| 1-Person Household | 716 (62.0%) | 439 (38.0%) |
| 2-Person Household | 1,489 (67.9%) | 704 (32.1%) |
| 3-Person Household | 459 (49.0%) | 478 (51.0%) |
| 4+ Person Household | 1,217 (70.1%) | 520 (29.9%) |
| Total Housing Units | 3,881 (64.4%) | 2,141 (35.5%) |
Occupancy by Educational Attainment in Deaf Smith County
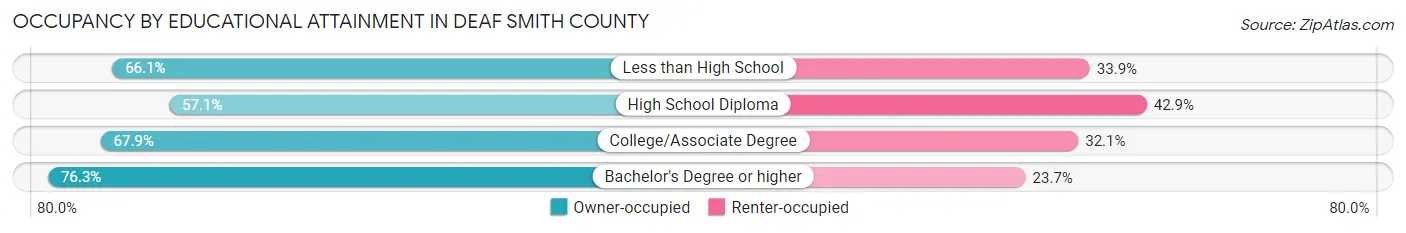
| Household Size | Owner-occupied | Renter-occupied |
| Less than High School | 1,059 (66.1%) | 543 (33.9%) |
| High School Diploma | 1,340 (57.1%) | 1,008 (42.9%) |
| College/Associate Degree | 803 (67.9%) | 379 (32.1%) |
| Bachelor's Degree or higher | 679 (76.3%) | 211 (23.7%) |
Occupancy by Age of Householder in Deaf Smith County
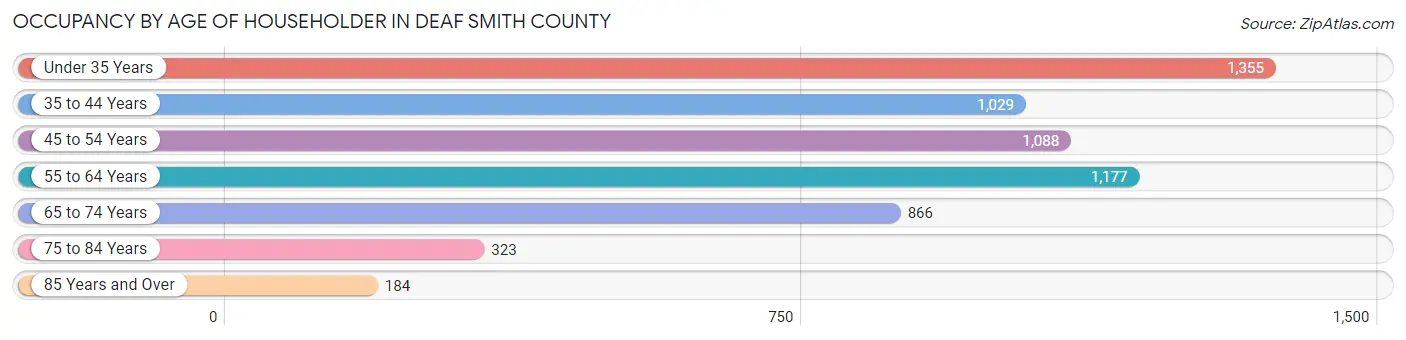
| Age Bracket | # Households | % Households |
| Under 35 Years | 1,355 | 22.5% |
| 35 to 44 Years | 1,029 | 17.1% |
| 45 to 54 Years | 1,088 | 18.1% |
| 55 to 64 Years | 1,177 | 19.6% |
| 65 to 74 Years | 866 | 14.4% |
| 75 to 84 Years | 323 | 5.4% |
| 85 Years and Over | 184 | 3.1% |
| Total | 6,022 | 100.0% |
Housing Finances in Deaf Smith County
Median Income by Occupancy in Deaf Smith County
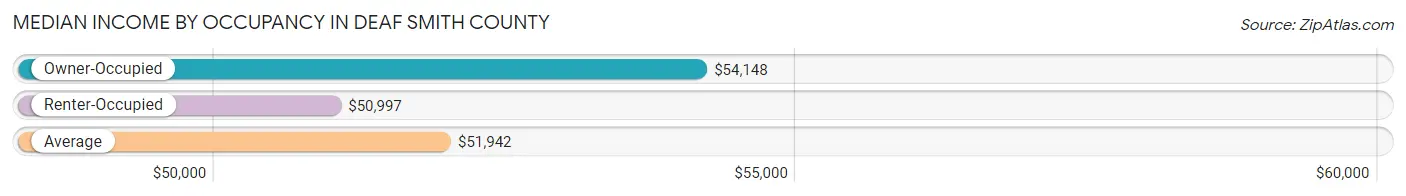
| Occupancy Type | # Households | Median Income |
| Owner-Occupied | 3,881 (64.4%) | $54,148 |
| Renter-Occupied | 2,141 (35.5%) | $50,997 |
| Average | 6,022 (100.0%) | $51,942 |
Occupancy by Householder Income Bracket in Deaf Smith County
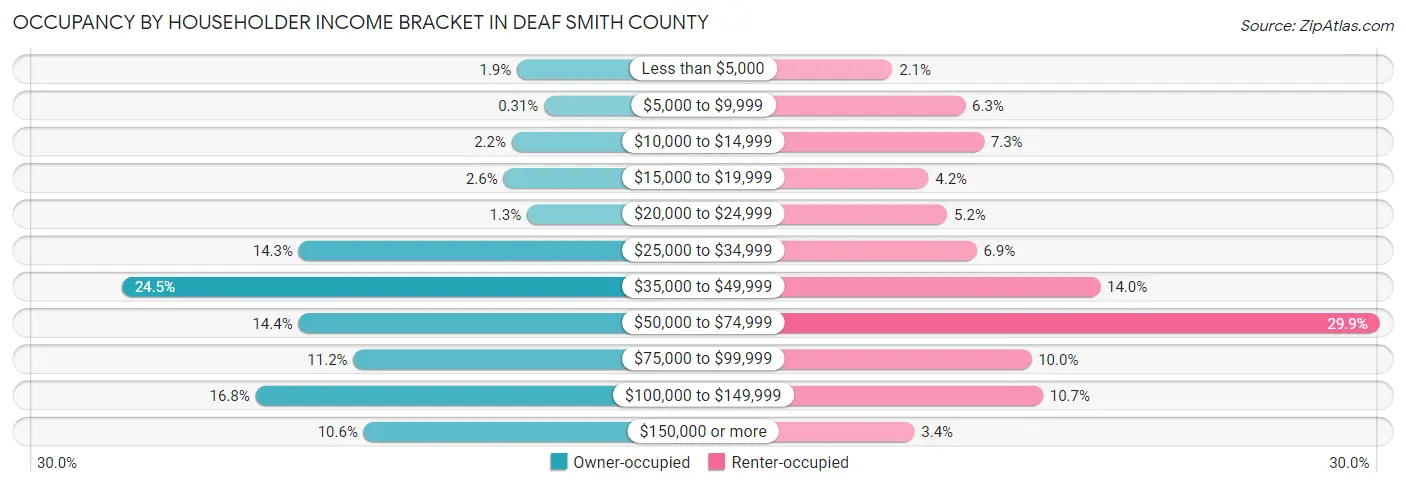
| Income Bracket | Owner-occupied | Renter-occupied |
| Less than $5,000 | 72 (1.9%) | 45 (2.1%) |
| $5,000 to $9,999 | 12 (0.3%) | 134 (6.3%) |
| $10,000 to $14,999 | 84 (2.2%) | 157 (7.3%) |
| $15,000 to $19,999 | 102 (2.6%) | 89 (4.2%) |
| $20,000 to $24,999 | 50 (1.3%) | 112 (5.2%) |
| $25,000 to $34,999 | 556 (14.3%) | 148 (6.9%) |
| $35,000 to $49,999 | 949 (24.4%) | 299 (14.0%) |
| $50,000 to $74,999 | 557 (14.3%) | 641 (29.9%) |
| $75,000 to $99,999 | 435 (11.2%) | 215 (10.0%) |
| $100,000 to $149,999 | 652 (16.8%) | 229 (10.7%) |
| $150,000 or more | 412 (10.6%) | 72 (3.4%) |
| Total | 3,881 (100.0%) | 2,141 (100.0%) |
Monthly Housing Cost Tiers in Deaf Smith County
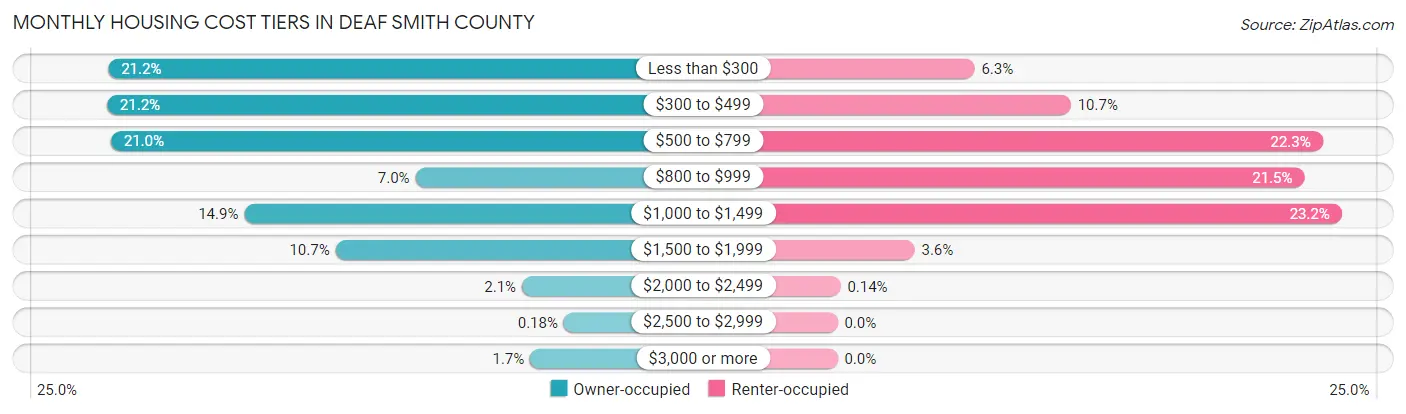
| Monthly Cost | Owner-occupied | Renter-occupied |
| Less than $300 | 821 (21.1%) | 135 (6.3%) |
| $300 to $499 | 823 (21.2%) | 230 (10.7%) |
| $500 to $799 | 816 (21.0%) | 478 (22.3%) |
| $800 to $999 | 272 (7.0%) | 460 (21.5%) |
| $1,000 to $1,499 | 578 (14.9%) | 497 (23.2%) |
| $1,500 to $1,999 | 415 (10.7%) | 76 (3.5%) |
| $2,000 to $2,499 | 82 (2.1%) | 3 (0.1%) |
| $2,500 to $2,999 | 7 (0.2%) | 0 (0.0%) |
| $3,000 or more | 67 (1.7%) | 0 (0.0%) |
| Total | 3,881 (100.0%) | 2,141 (100.0%) |
Physical Housing Characteristics in Deaf Smith County
Housing Structures in Deaf Smith County
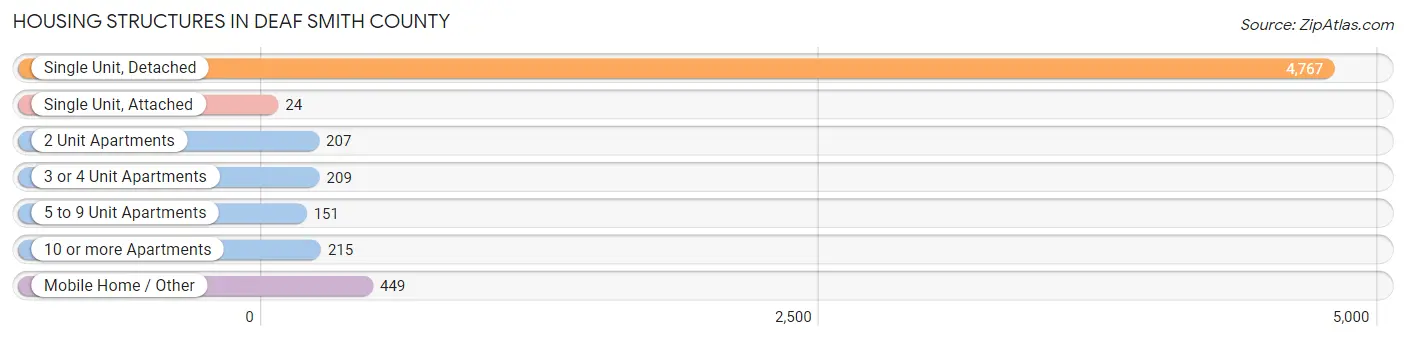
| Structure Type | # Housing Units | % Housing Units |
| Single Unit, Detached | 4,767 | 79.2% |
| Single Unit, Attached | 24 | 0.4% |
| 2 Unit Apartments | 207 | 3.4% |
| 3 or 4 Unit Apartments | 209 | 3.5% |
| 5 to 9 Unit Apartments | 151 | 2.5% |
| 10 or more Apartments | 215 | 3.6% |
| Mobile Home / Other | 449 | 7.5% |
| Total | 6,022 | 100.0% |
Housing Structures by Occupancy in Deaf Smith County
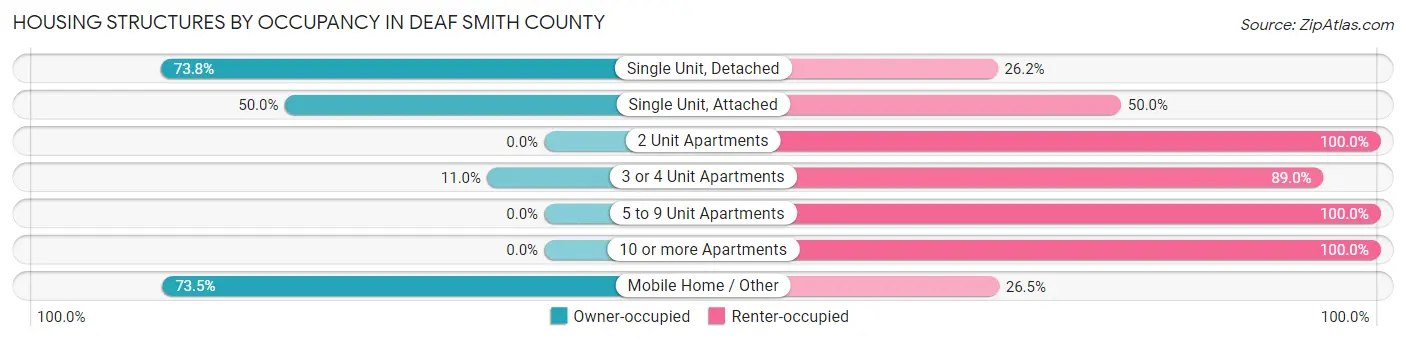
| Structure Type | Owner-occupied | Renter-occupied |
| Single Unit, Detached | 3,516 (73.8%) | 1,251 (26.2%) |
| Single Unit, Attached | 12 (50.0%) | 12 (50.0%) |
| 2 Unit Apartments | 0 (0.0%) | 207 (100.0%) |
| 3 or 4 Unit Apartments | 23 (11.0%) | 186 (89.0%) |
| 5 to 9 Unit Apartments | 0 (0.0%) | 151 (100.0%) |
| 10 or more Apartments | 0 (0.0%) | 215 (100.0%) |
| Mobile Home / Other | 330 (73.5%) | 119 (26.5%) |
| Total | 3,881 (64.4%) | 2,141 (35.5%) |
Housing Structures by Number of Rooms in Deaf Smith County
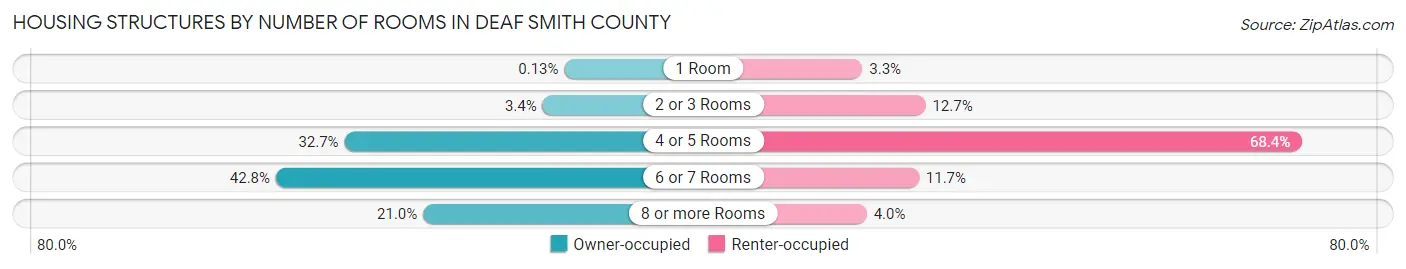
| Number of Rooms | Owner-occupied | Renter-occupied |
| 1 Room | 5 (0.1%) | 71 (3.3%) |
| 2 or 3 Rooms | 130 (3.4%) | 271 (12.7%) |
| 4 or 5 Rooms | 1,268 (32.7%) | 1,464 (68.4%) |
| 6 or 7 Rooms | 1,662 (42.8%) | 250 (11.7%) |
| 8 or more Rooms | 816 (21.0%) | 85 (4.0%) |
| Total | 3,881 (100.0%) | 2,141 (100.0%) |
Housing Structure by Heating Type in Deaf Smith County
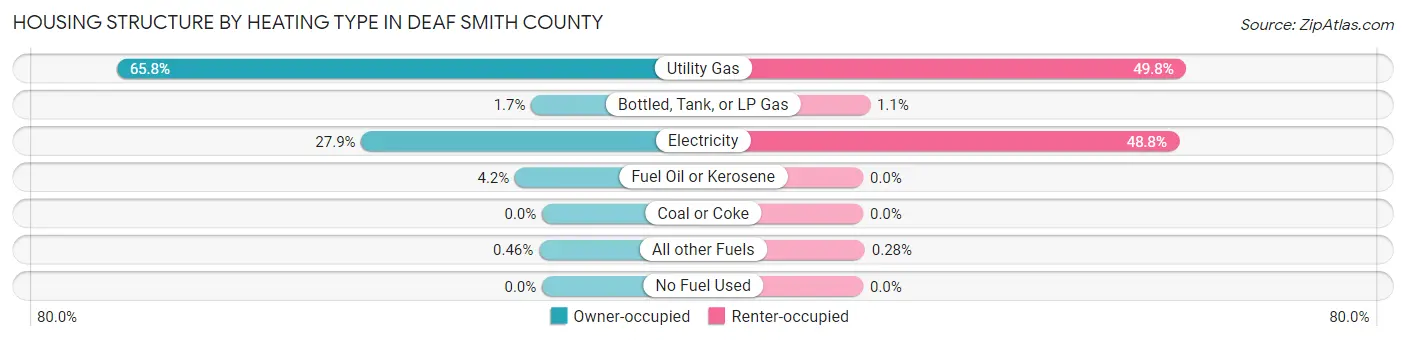
| Heating Type | Owner-occupied | Renter-occupied |
| Utility Gas | 2,552 (65.8%) | 1,067 (49.8%) |
| Bottled, Tank, or LP Gas | 65 (1.7%) | 23 (1.1%) |
| Electricity | 1,084 (27.9%) | 1,045 (48.8%) |
| Fuel Oil or Kerosene | 162 (4.2%) | 0 (0.0%) |
| Coal or Coke | 0 (0.0%) | 0 (0.0%) |
| All other Fuels | 18 (0.5%) | 6 (0.3%) |
| No Fuel Used | 0 (0.0%) | 0 (0.0%) |
| Total | 3,881 (100.0%) | 2,141 (100.0%) |
Household Vehicle Usage in Deaf Smith County
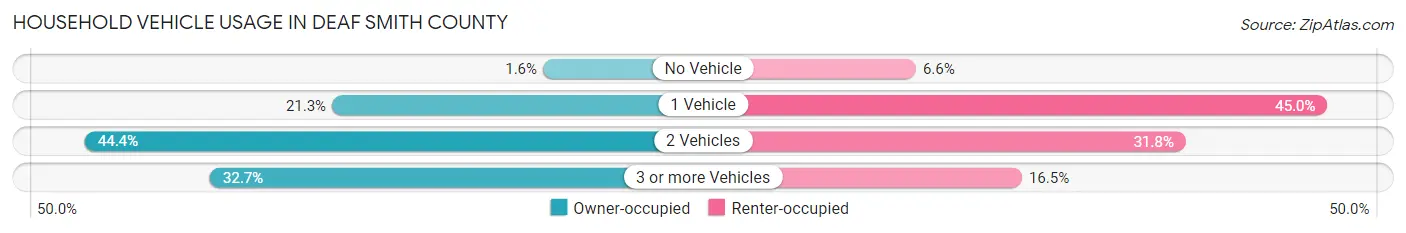
| Vehicles per Household | Owner-occupied | Renter-occupied |
| No Vehicle | 63 (1.6%) | 142 (6.6%) |
| 1 Vehicle | 827 (21.3%) | 964 (45.0%) |
| 2 Vehicles | 1,722 (44.4%) | 681 (31.8%) |
| 3 or more Vehicles | 1,269 (32.7%) | 354 (16.5%) |
| Total | 3,881 (100.0%) | 2,141 (100.0%) |
Real Estate & Mortgages in Deaf Smith County
Real Estate and Mortgage Overview in Deaf Smith County
| Characteristic | Without Mortgage | With Mortgage |
| Housing Units | 2,405 | 1,476 |
| Median Property Value | $82,200 | $146,400 |
| Median Household Income | $43,308 | $168 |
| Monthly Housing Costs | $412 | $67 |
| Real Estate Taxes | $1,165 | $50 |
Property Value by Mortgage Status in Deaf Smith County
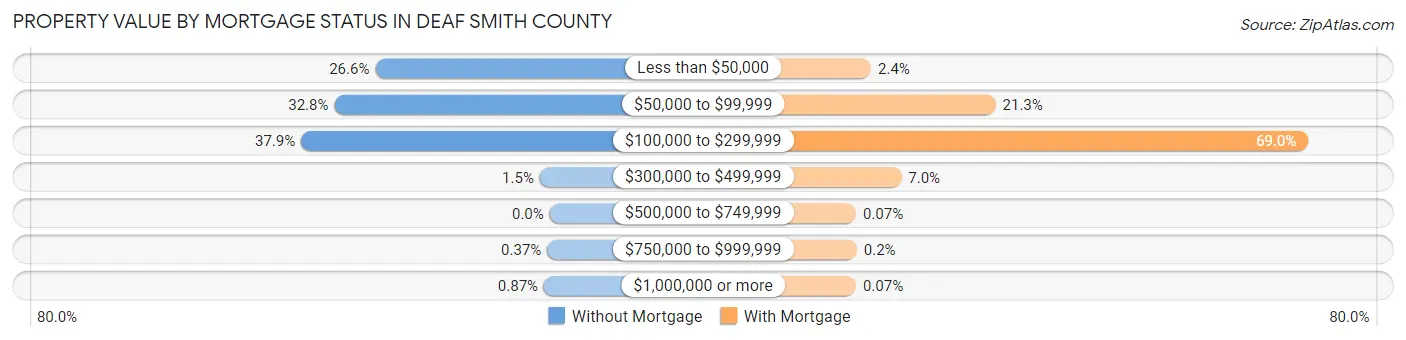
| Property Value | Without Mortgage | With Mortgage |
| Less than $50,000 | 639 (26.6%) | 35 (2.4%) |
| $50,000 to $99,999 | 789 (32.8%) | 315 (21.3%) |
| $100,000 to $299,999 | 911 (37.9%) | 1,018 (69.0%) |
| $300,000 to $499,999 | 36 (1.5%) | 103 (7.0%) |
| $500,000 to $749,999 | 0 (0.0%) | 1 (0.1%) |
| $750,000 to $999,999 | 9 (0.4%) | 3 (0.2%) |
| $1,000,000 or more | 21 (0.9%) | 1 (0.1%) |
| Total | 2,405 (100.0%) | 1,476 (100.0%) |
Household Income by Mortgage Status in Deaf Smith County
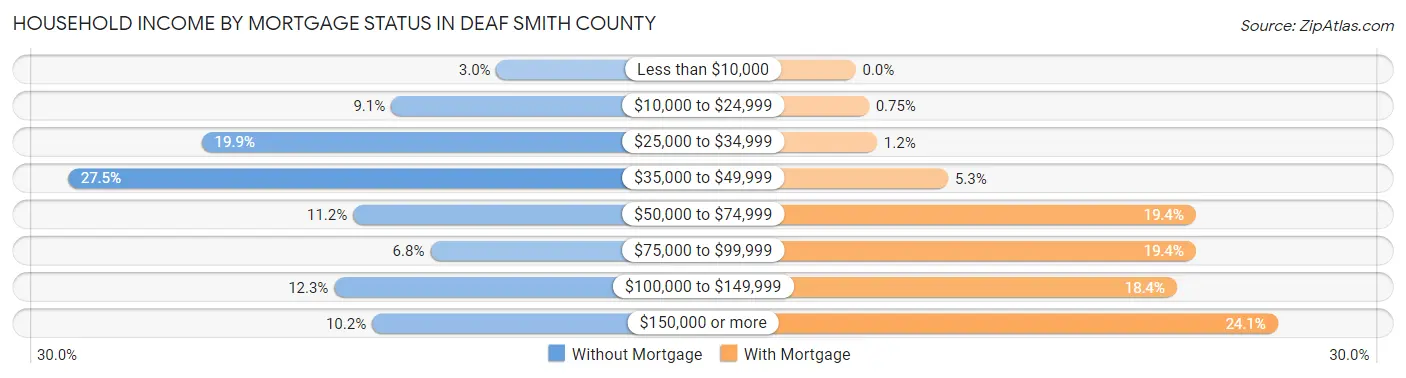
| Household Income | Without Mortgage | With Mortgage |
| Less than $10,000 | 73 (3.0%) | 0 (0.0%) |
| $10,000 to $24,999 | 218 (9.1%) | 11 (0.7%) |
| $25,000 to $34,999 | 478 (19.9%) | 18 (1.2%) |
| $35,000 to $49,999 | 662 (27.5%) | 78 (5.3%) |
| $50,000 to $74,999 | 270 (11.2%) | 287 (19.4%) |
| $75,000 to $99,999 | 164 (6.8%) | 287 (19.4%) |
| $100,000 to $149,999 | 296 (12.3%) | 271 (18.4%) |
| $150,000 or more | 244 (10.2%) | 356 (24.1%) |
| Total | 2,405 (100.0%) | 1,476 (100.0%) |
Property Value to Household Income Ratio in Deaf Smith County
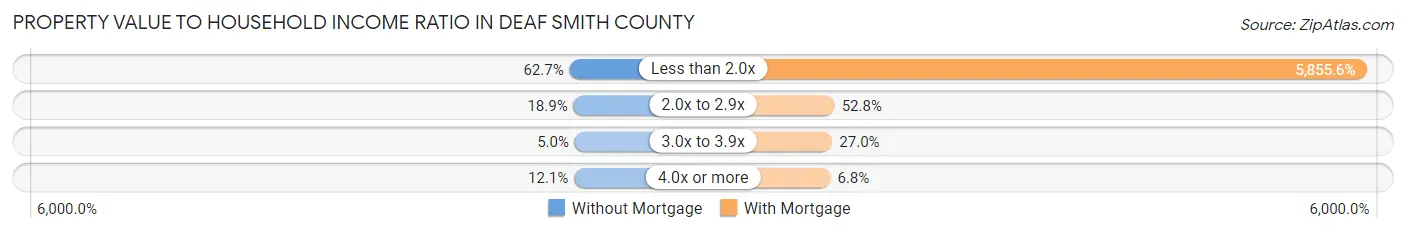
| Value-to-Income Ratio | Without Mortgage | With Mortgage |
| Less than 2.0x | 1,507 (62.7%) | 86,429 (5,855.6%) |
| 2.0x to 2.9x | 455 (18.9%) | 779 (52.8%) |
| 3.0x to 3.9x | 119 (5.0%) | 398 (27.0%) |
| 4.0x or more | 291 (12.1%) | 101 (6.8%) |
| Total | 2,405 (100.0%) | 1,476 (100.0%) |
Real Estate Taxes by Mortgage Status in Deaf Smith County
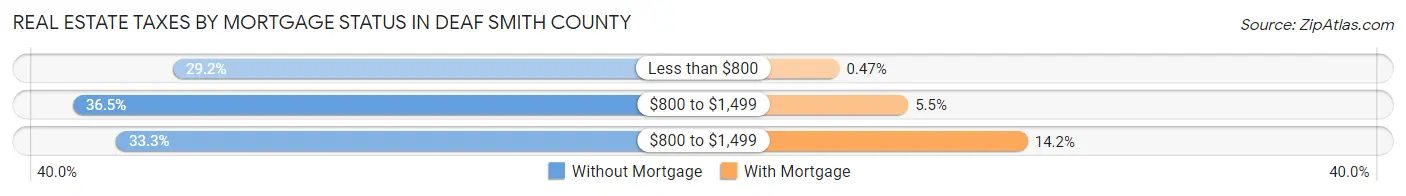
| Property Taxes | Without Mortgage | With Mortgage |
| Less than $800 | 701 (29.1%) | 7 (0.5%) |
| $800 to $1,499 | 877 (36.5%) | 81 (5.5%) |
| $800 to $1,499 | 801 (33.3%) | 210 (14.2%) |
| Total | 2,405 (100.0%) | 1,476 (100.0%) |
Health & Disability in Deaf Smith County
Health Insurance Coverage by Age in Deaf Smith County
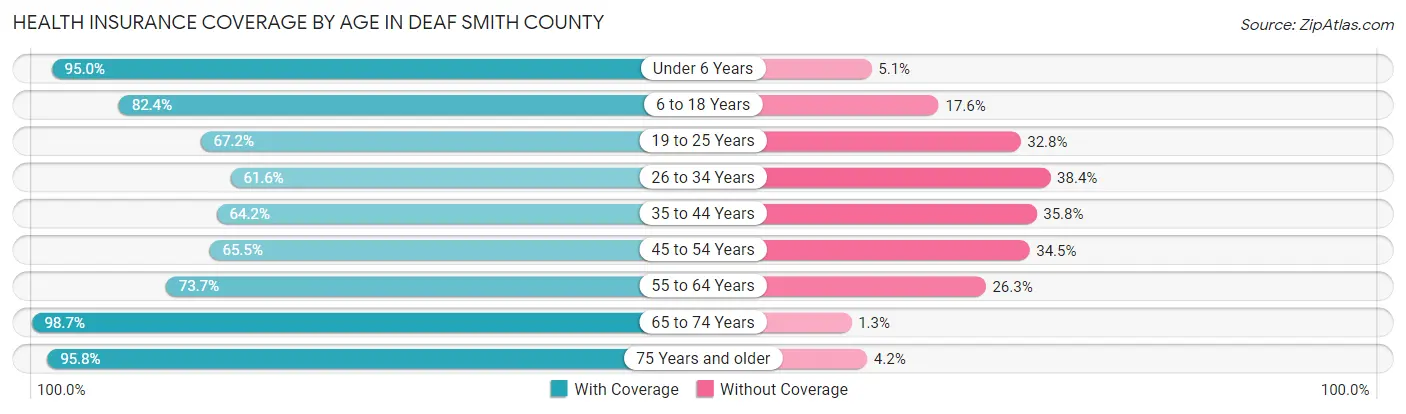
| Age Bracket | With Coverage | Without Coverage |
| Under 6 Years | 1,805 (95.0%) | 96 (5.1%) |
| 6 to 18 Years | 3,472 (82.4%) | 740 (17.6%) |
| 19 to 25 Years | 1,167 (67.2%) | 570 (32.8%) |
| 26 to 34 Years | 1,454 (61.6%) | 906 (38.4%) |
| 35 to 44 Years | 1,359 (64.2%) | 758 (35.8%) |
| 45 to 54 Years | 1,255 (65.5%) | 661 (34.5%) |
| 55 to 64 Years | 1,368 (73.7%) | 489 (26.3%) |
| 65 to 74 Years | 1,374 (98.7%) | 18 (1.3%) |
| 75 Years and older | 863 (95.8%) | 38 (4.2%) |
| Total | 14,117 (76.7%) | 4,276 (23.3%) |
Health Insurance Coverage by Citizenship Status in Deaf Smith County
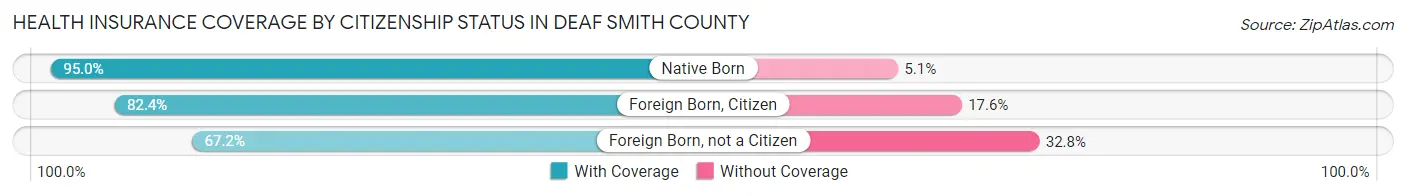
| Citizenship Status | With Coverage | Without Coverage |
| Native Born | 1,805 (95.0%) | 96 (5.1%) |
| Foreign Born, Citizen | 3,472 (82.4%) | 740 (17.6%) |
| Foreign Born, not a Citizen | 1,167 (67.2%) | 570 (32.8%) |
Health Insurance Coverage by Household Income in Deaf Smith County
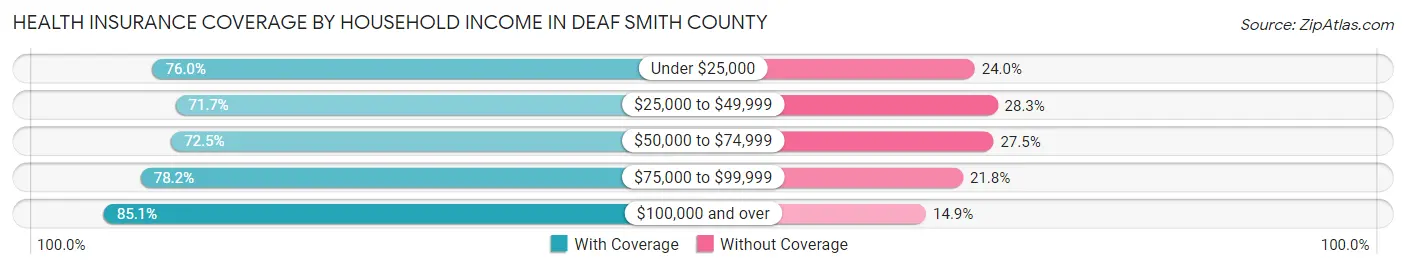
| Household Income | With Coverage | Without Coverage |
| Under $25,000 | 1,629 (76.0%) | 514 (24.0%) |
| $25,000 to $49,999 | 3,932 (71.7%) | 1,549 (28.3%) |
| $50,000 to $74,999 | 2,681 (72.5%) | 1,016 (27.5%) |
| $75,000 to $99,999 | 1,648 (78.2%) | 459 (21.8%) |
| $100,000 and over | 4,221 (85.1%) | 737 (14.9%) |
Public vs Private Health Insurance Coverage by Age in Deaf Smith County
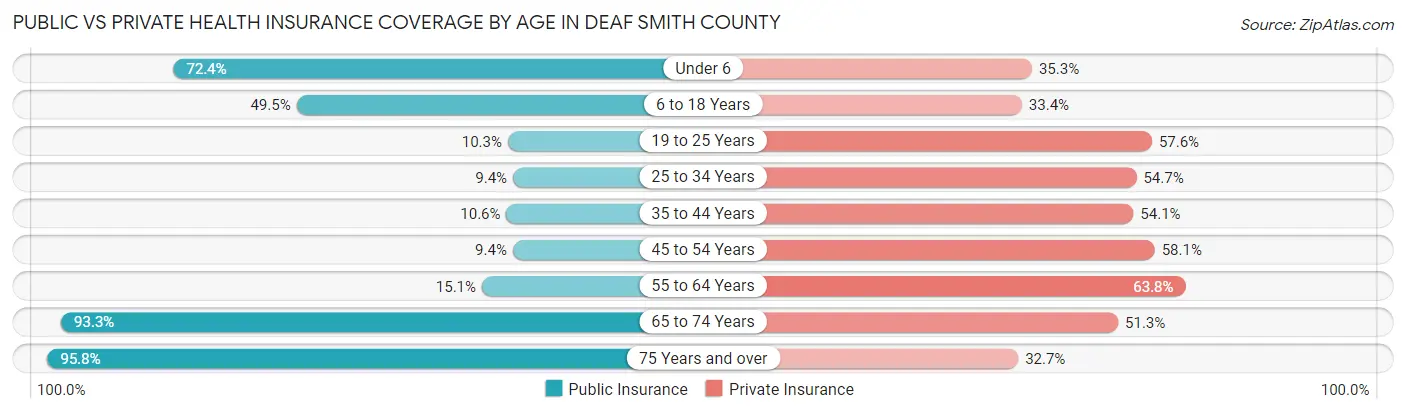
| Age Bracket | Public Insurance | Private Insurance |
| Under 6 | 1,376 (72.4%) | 671 (35.3%) |
| 6 to 18 Years | 2,086 (49.5%) | 1,408 (33.4%) |
| 19 to 25 Years | 179 (10.3%) | 1,000 (57.6%) |
| 25 to 34 Years | 221 (9.4%) | 1,291 (54.7%) |
| 35 to 44 Years | 224 (10.6%) | 1,146 (54.1%) |
| 45 to 54 Years | 180 (9.4%) | 1,113 (58.1%) |
| 55 to 64 Years | 281 (15.1%) | 1,184 (63.8%) |
| 65 to 74 Years | 1,298 (93.2%) | 714 (51.3%) |
| 75 Years and over | 863 (95.8%) | 295 (32.7%) |
| Total | 6,708 (36.5%) | 8,822 (48.0%) |
Disability Status by Sex by Age in Deaf Smith County
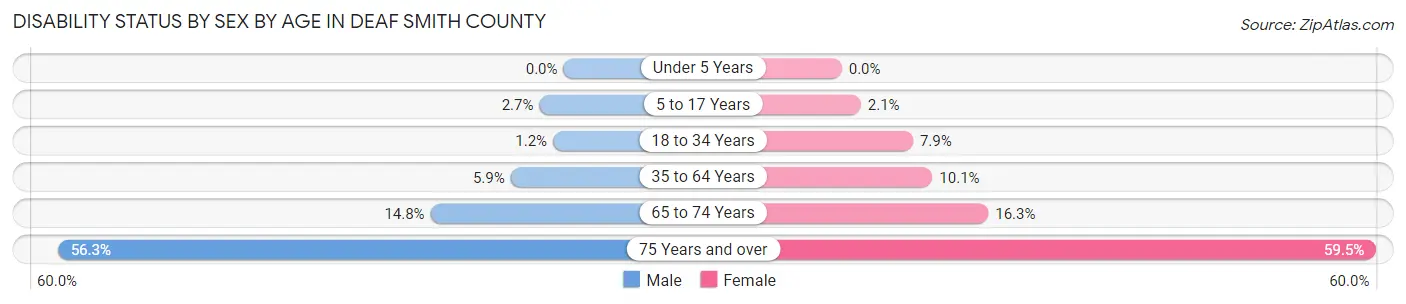
| Age Bracket | Male | Female |
| Under 5 Years | 0 (0.0%) | 0 (0.0%) |
| 5 to 17 Years | 55 (2.7%) | 44 (2.1%) |
| 18 to 34 Years | 27 (1.2%) | 171 (7.9%) |
| 35 to 64 Years | 175 (5.9%) | 294 (10.1%) |
| 65 to 74 Years | 99 (14.8%) | 118 (16.3%) |
| 75 Years and over | 232 (56.3%) | 291 (59.5%) |
Disability Class by Sex by Age in Deaf Smith County
Disability Class: Hearing Difficulty
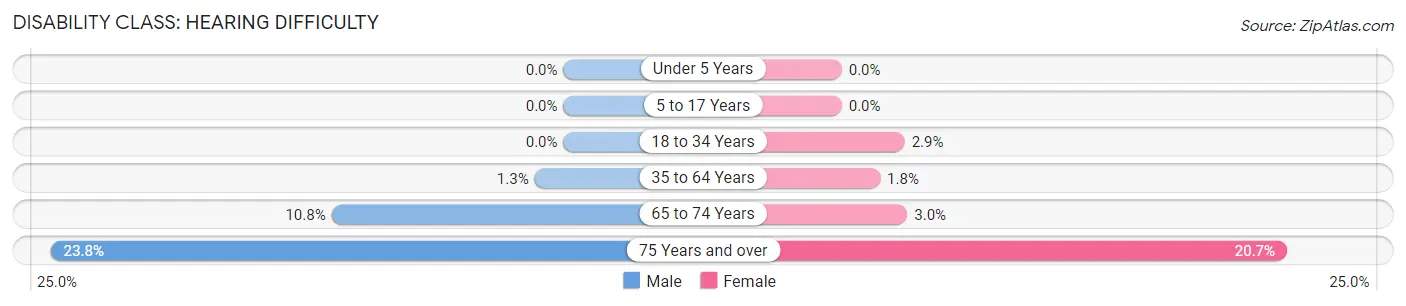
| Age Bracket | Male | Female |
| Under 5 Years | 0 (0.0%) | 0 (0.0%) |
| 5 to 17 Years | 0 (0.0%) | 0 (0.0%) |
| 18 to 34 Years | 0 (0.0%) | 63 (2.9%) |
| 35 to 64 Years | 40 (1.3%) | 52 (1.8%) |
| 65 to 74 Years | 72 (10.8%) | 22 (3.0%) |
| 75 Years and over | 98 (23.8%) | 101 (20.6%) |
Disability Class: Vision Difficulty
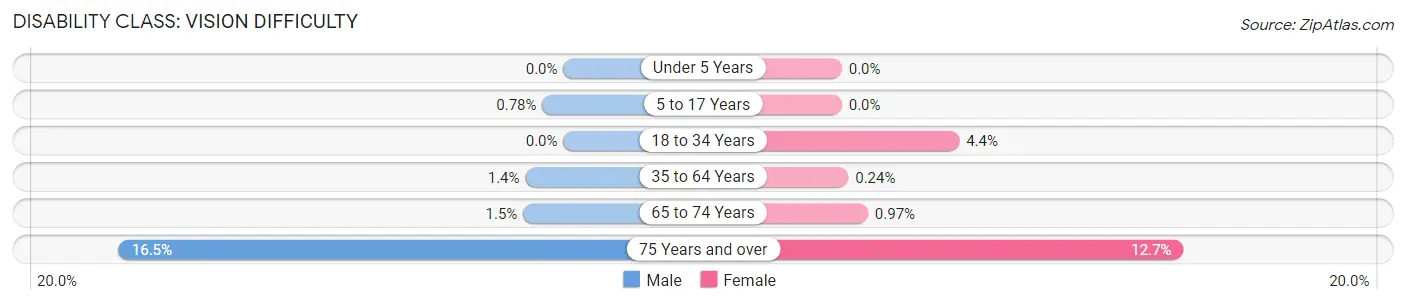
| Age Bracket | Male | Female |
| Under 5 Years | 0 (0.0%) | 0 (0.0%) |
| 5 to 17 Years | 16 (0.8%) | 0 (0.0%) |
| 18 to 34 Years | 0 (0.0%) | 94 (4.4%) |
| 35 to 64 Years | 42 (1.4%) | 7 (0.2%) |
| 65 to 74 Years | 10 (1.5%) | 7 (1.0%) |
| 75 Years and over | 68 (16.5%) | 62 (12.7%) |
Disability Class: Cognitive Difficulty
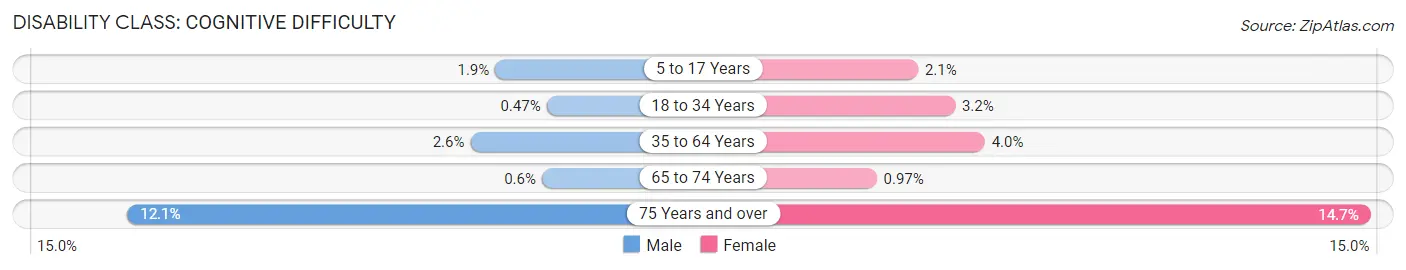
| Age Bracket | Male | Female |
| 5 to 17 Years | 39 (1.9%) | 44 (2.1%) |
| 18 to 34 Years | 11 (0.5%) | 68 (3.2%) |
| 35 to 64 Years | 77 (2.6%) | 116 (4.0%) |
| 65 to 74 Years | 4 (0.6%) | 7 (1.0%) |
| 75 Years and over | 50 (12.1%) | 72 (14.7%) |
Disability Class: Ambulatory Difficulty
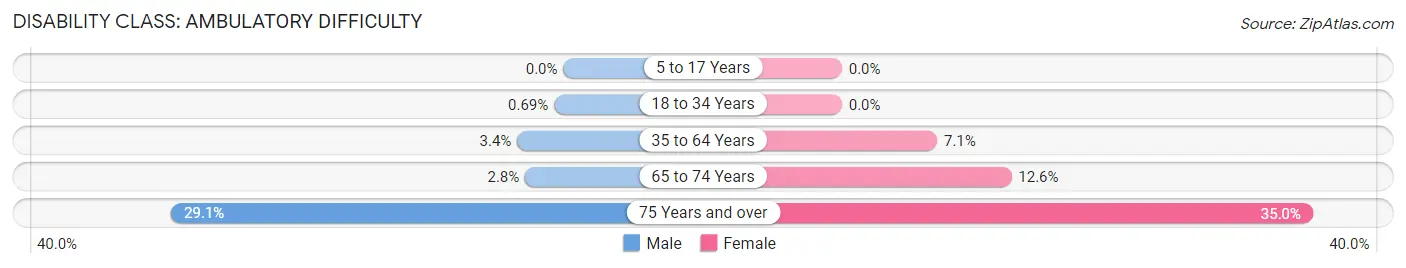
| Age Bracket | Male | Female |
| 5 to 17 Years | 0 (0.0%) | 0 (0.0%) |
| 18 to 34 Years | 16 (0.7%) | 0 (0.0%) |
| 35 to 64 Years | 102 (3.4%) | 206 (7.1%) |
| 65 to 74 Years | 19 (2.8%) | 91 (12.6%) |
| 75 Years and over | 120 (29.1%) | 171 (35.0%) |
Disability Class: Self-Care Difficulty
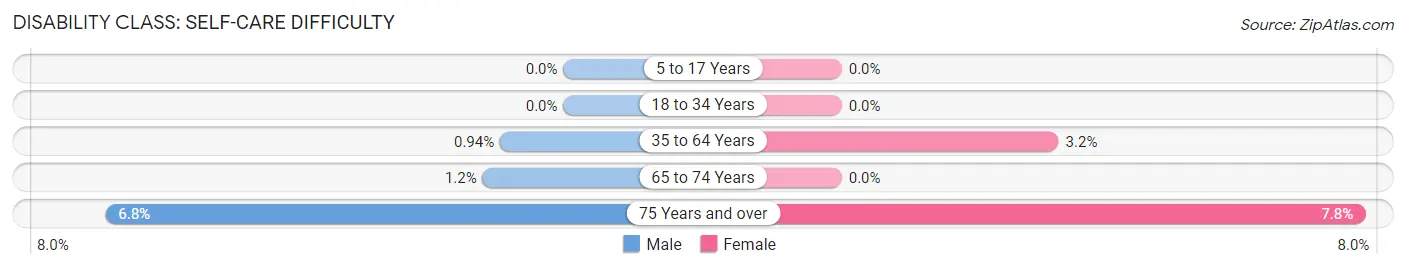
| Age Bracket | Male | Female |
| 5 to 17 Years | 0 (0.0%) | 0 (0.0%) |
| 18 to 34 Years | 0 (0.0%) | 0 (0.0%) |
| 35 to 64 Years | 28 (0.9%) | 94 (3.2%) |
| 65 to 74 Years | 8 (1.2%) | 0 (0.0%) |
| 75 Years and over | 28 (6.8%) | 38 (7.8%) |
Technology Access in Deaf Smith County
Computing Device Access in Deaf Smith County
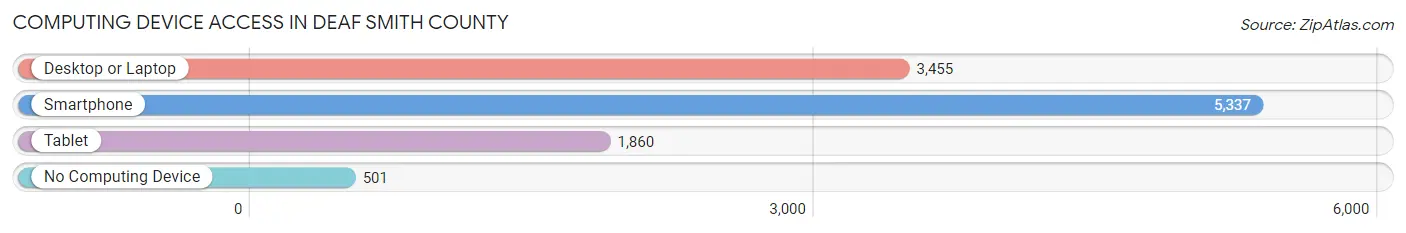
| Device Type | # Households | % Households |
| Desktop or Laptop | 3,455 | 57.4% |
| Smartphone | 5,337 | 88.6% |
| Tablet | 1,860 | 30.9% |
| No Computing Device | 501 | 8.3% |
| Total | 6,022 | 100.0% |
Internet Access in Deaf Smith County
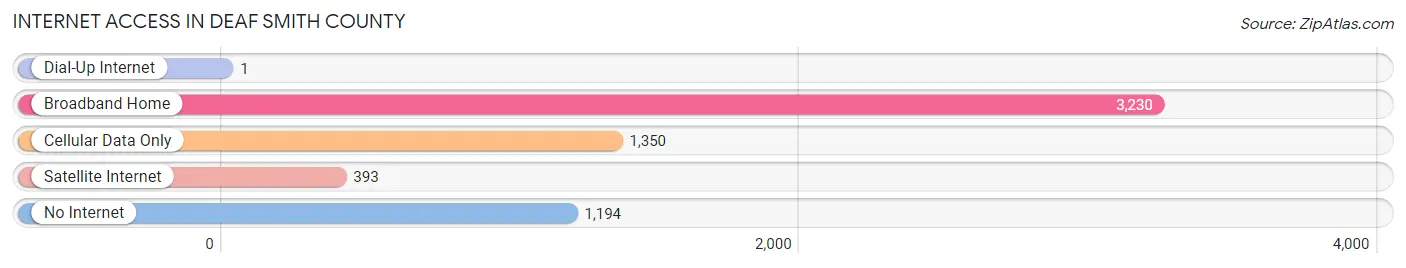
| Internet Type | # Households | % Households |
| Dial-Up Internet | 1 | 0.0% |
| Broadband Home | 3,230 | 53.6% |
| Cellular Data Only | 1,350 | 22.4% |
| Satellite Internet | 393 | 6.5% |
| No Internet | 1,194 | 19.8% |
| Total | 6,022 | 100.0% |
Deaf Smith County Summary
Deaf Smith County is located in the Texas Panhandle, in the northwestern corner of the state. It is bordered by Randall County to the north, Oldham County to the east, Parmer County to the south, and Castro County to the west. The county seat is Hereford, which is also the largest city in the county. The county was named after Erastus “Deaf” Smith, a hero of the Texas Revolution.
Geography
Deaf Smith County covers an area of 1,541 square miles, making it the fourth-largest county in Texas. The terrain is mostly flat, with some rolling hills in the eastern part of the county. The county is part of the High Plains region of Texas, and is mostly covered in grasslands. The Canadian River runs through the county, and there are several small lakes and reservoirs. The climate is semi-arid, with hot summers and mild winters.
Demographics
As of the 2010 census, Deaf Smith County had a population of 19,372. The racial makeup of the county was 76.2% White, 0.7% African American, 0.7% Native American, 0.3% Asian, 0.1% Pacific Islander, 19.7% from other races, and 2.3% from two or more races. Hispanic or Latino of any race were 44.2% of the population.
Economy
Deaf Smith County’s economy is largely based on agriculture. The county is one of the top producers of beef cattle in the state, and is also a major producer of cotton, wheat, and sorghum. The county is also home to several large food processing plants, including Cargill Meat Solutions and Tyson Foods. The county is also home to several oil and gas production companies, as well as several wind farms.
History
Deaf Smith County was created in 1876 from portions of Bexar and Young counties. The county was named after Erastus “Deaf” Smith, a hero of the Texas Revolution. The county seat was originally located in Oldham, but was moved to Hereford in 1890.
In the early 1900s, the county began to experience an economic boom due to the discovery of oil and gas in the area. This led to the development of several oil and gas production companies, as well as several wind farms.
In the 1950s, the county began to experience a population boom due to the development of the beef cattle industry. This led to the development of several large food processing plants, as well as an increase in the number of small businesses in the county.
Today, Deaf Smith County is a thriving agricultural and energy-producing county. The county is home to several large food processing plants, as well as several oil and gas production companies. The county is also home to several wind farms, which provide a significant portion of the county’s energy needs.
Common Questions
What is Per Capita Income in Deaf Smith County?
Per Capita income in Deaf Smith County is $23,310.
What is the Median Family Income in Deaf Smith County?
Median Family Income in Deaf Smith County is $54,307.
What is the Median Household income in Deaf Smith County?
Median Household Income in Deaf Smith County is $51,942.
What is Income or Wage Gap in Deaf Smith County?
Income or Wage Gap in Deaf Smith County is 33.5%.
Women in Deaf Smith County earn 66.5 cents for every dollar earned by a man.
What is Family Income Deficit in Deaf Smith County?
Family Income Deficit in Deaf Smith County is $12,312.
Families that are below poverty line in Deaf Smith County earn $12,312 less on average than the poverty threshold level.
What is Inequality or Gini Index in Deaf Smith County?
Inequality or Gini Index in Deaf Smith County is 0.41.
What is the Total Population of Deaf Smith County?
Total Population of Deaf Smith County is 18,585.
What is the Total Male Population of Deaf Smith County?
Total Male Population of Deaf Smith County is 9,357.
What is the Total Female Population of Deaf Smith County?
Total Female Population of Deaf Smith County is 9,228.
What is the Ratio of Males per 100 Females in Deaf Smith County?
There are 101.40 Males per 100 Females in Deaf Smith County.
What is the Ratio of Females per 100 Males in Deaf Smith County?
There are 98.62 Females per 100 Males in Deaf Smith County.
What is the Median Population Age in Deaf Smith County?
Median Population Age in Deaf Smith County is 32.0 Years.
What is the Average Family Size in Deaf Smith County
Average Family Size in Deaf Smith County is 3.5 People.
What is the Average Household Size in Deaf Smith County
Average Household Size in Deaf Smith County is 3.0 People.
How Large is the Labor Force in Deaf Smith County?
There are 8,608 People in the Labor Forcein in Deaf Smith County.
What is the Percentage of People in the Labor Force in Deaf Smith County?
64.0% of People are in the Labor Force in Deaf Smith County.
What is the Unemployment Rate in Deaf Smith County?
Unemployment Rate in Deaf Smith County is 2.1%.