Dallam County, TX Map & Demographics
Dallam County Map
Dallam County Overview
$28,936
PER CAPITA INCOME
$88,065
AVG FAMILY INCOME
$71,969
AVG HOUSEHOLD INCOME
54.1%
WAGE / INCOME GAP [ % ]
45.9¢/ $1
WAGE / INCOME GAP [ $ ]
$14,568
FAMILY INCOME DEFICIT
0.37
INEQUALITY / GINI INDEX
7,165
TOTAL POPULATION
3,836
MALE POPULATION
3,329
FEMALE POPULATION
115.23
MALES / 100 FEMALES
86.78
FEMALES / 100 MALES
30.8
MEDIAN AGE
3.8
AVG FAMILY SIZE
3.0
AVG HOUSEHOLD SIZE
3,941
LABOR FORCE [ PEOPLE ]
77.4%
PERCENT IN LABOR FORCE
2.6%
UNEMPLOYMENT RATE
Dallam County Area Codes
Income in Dallam County
Income Overview in Dallam County
Per Capita Income in Dallam County is $28,936, while median incomes of families and households are $88,065 and $71,969 respectively.
| Characteristic | Number | Measure |
| Per Capita Income | 7,165 | $28,936 |
| Median Family Income | 1,570 | $88,065 |
| Mean Family Income | 1,570 | $100,019 |
| Median Household Income | 2,333 | $71,969 |
| Mean Household Income | 2,333 | $83,617 |
| Income Deficit | 1,570 | $14,568 |
| Wage / Income Gap (%) | 7,165 | 54.11% |
| Wage / Income Gap ($) | 7,165 | 45.89¢ per $1 |
| Gini / Inequality Index | 7,165 | 0.37 |
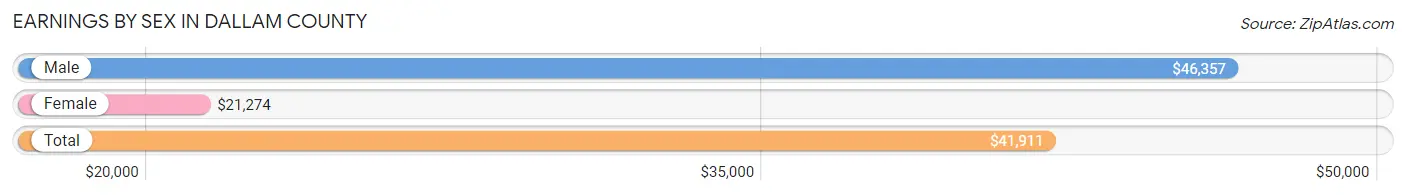
Earnings by Sex in Dallam County
Average Earnings in Dallam County are $41,911, $46,357 for men and $21,274 for women, a difference of 54.1%.
| Sex | Number | Average Earnings |
| Male | 2,586 (63.0%) | $46,357 |
| Female | 1,518 (37.0%) | $21,274 |
| Total | 4,104 (100.0%) | $41,911 |
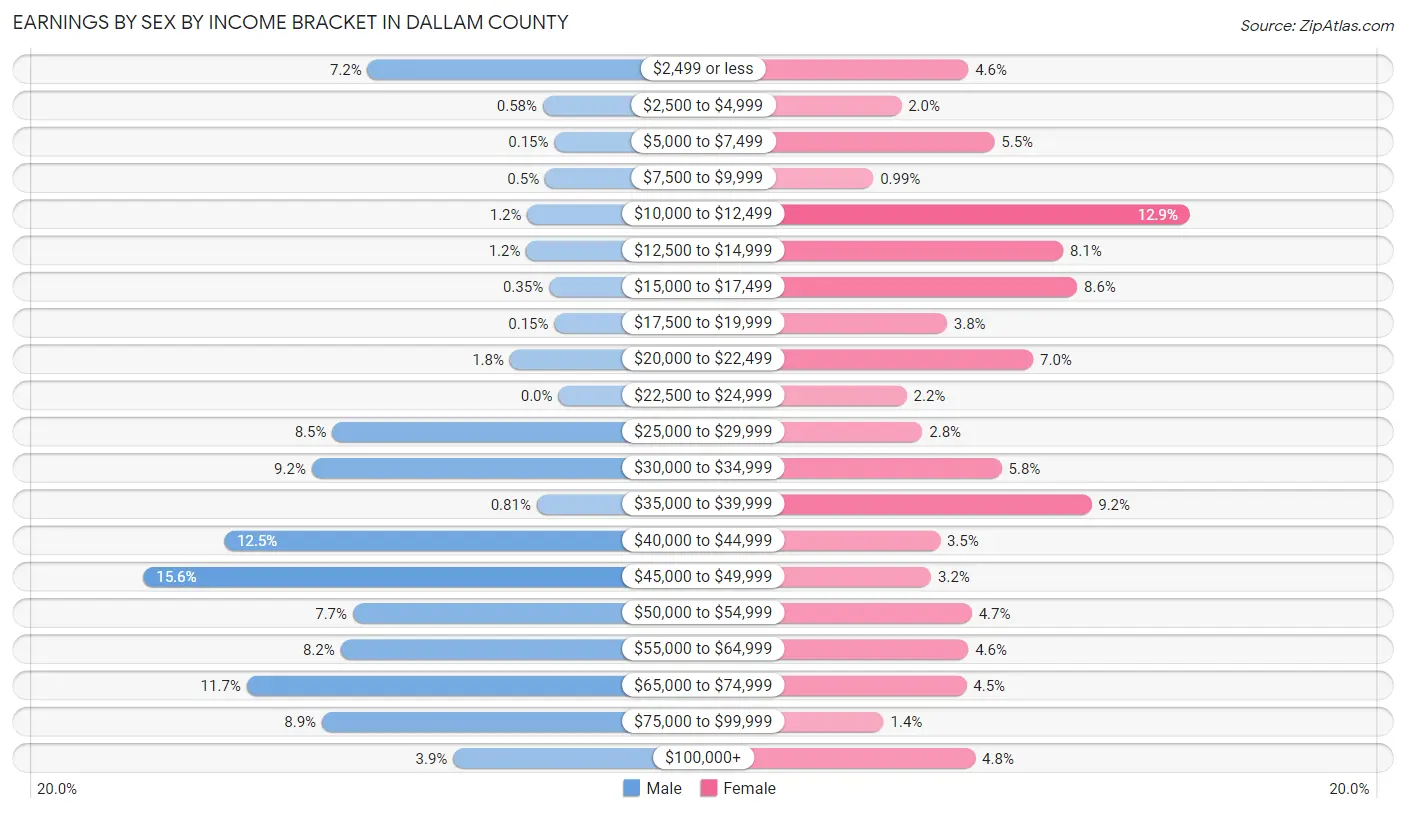
Earnings by Sex by Income Bracket in Dallam County
The most common earnings brackets in Dallam County are $45,000 to $49,999 for men (402 | 15.5%) and $10,000 to $12,499 for women (195 | 12.9%).
| Income | Male | Female |
| $2,499 or less | 185 (7.1%) | 69 (4.5%) |
| $2,500 to $4,999 | 15 (0.6%) | 31 (2.0%) |
| $5,000 to $7,499 | 4 (0.2%) | 84 (5.5%) |
| $7,500 to $9,999 | 13 (0.5%) | 15 (1.0%) |
| $10,000 to $12,499 | 30 (1.2%) | 195 (12.9%) |
| $12,500 to $14,999 | 31 (1.2%) | 123 (8.1%) |
| $15,000 to $17,499 | 9 (0.4%) | 131 (8.6%) |
| $17,500 to $19,999 | 4 (0.2%) | 57 (3.7%) |
| $20,000 to $22,499 | 47 (1.8%) | 106 (7.0%) |
| $22,500 to $24,999 | 0 (0.0%) | 34 (2.2%) |
| $25,000 to $29,999 | 219 (8.5%) | 43 (2.8%) |
| $30,000 to $34,999 | 239 (9.2%) | 88 (5.8%) |
| $35,000 to $39,999 | 21 (0.8%) | 139 (9.2%) |
| $40,000 to $44,999 | 324 (12.5%) | 53 (3.5%) |
| $45,000 to $49,999 | 402 (15.5%) | 48 (3.2%) |
| $50,000 to $54,999 | 199 (7.7%) | 71 (4.7%) |
| $55,000 to $64,999 | 211 (8.2%) | 69 (4.5%) |
| $65,000 to $74,999 | 302 (11.7%) | 68 (4.5%) |
| $75,000 to $99,999 | 229 (8.9%) | 21 (1.4%) |
| $100,000+ | 102 (3.9%) | 73 (4.8%) |
| Total | 2,586 (100.0%) | 1,518 (100.0%) |
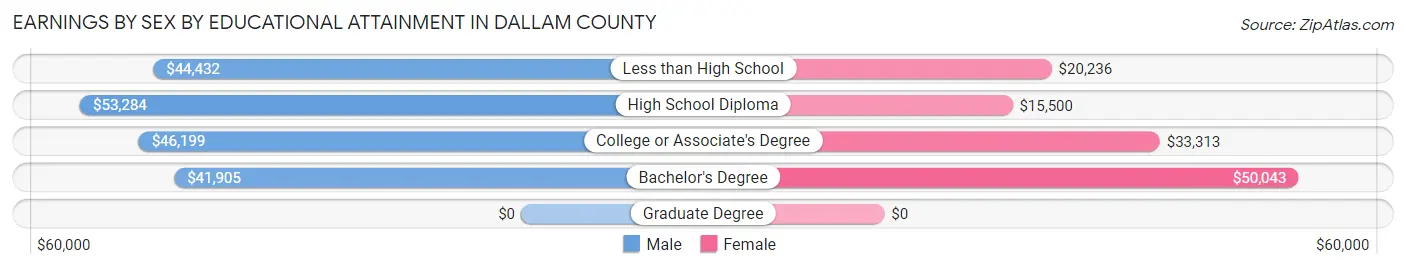
Earnings by Sex by Educational Attainment in Dallam County
Average earnings in Dallam County are $47,241 for men and $26,389 for women, a difference of 44.1%. Men with an educational attainment of high school diploma enjoy the highest average annual earnings of $53,284, while those with bachelor's degree education earn the least with $41,905. Women with an educational attainment of bachelor's degree earn the most with the average annual earnings of $50,043, while those with high school diploma education have the smallest earnings of $15,500.
| Educational Attainment | Male Income | Female Income |
| Less than High School | $44,432 | $20,236 |
| High School Diploma | $53,284 | $15,500 |
| College or Associate's Degree | $46,199 | $33,313 |
| Bachelor's Degree | $41,905 | $50,043 |
| Graduate Degree | - | - |
| Total | $47,241 | $26,389 |
Family Income in Dallam County
Family Income Brackets in Dallam County
According to the Dallam County family income data, there are 502 families falling into the $75,000 to $99,999 income range, which is the most common income bracket and makes up 32.0% of all families.
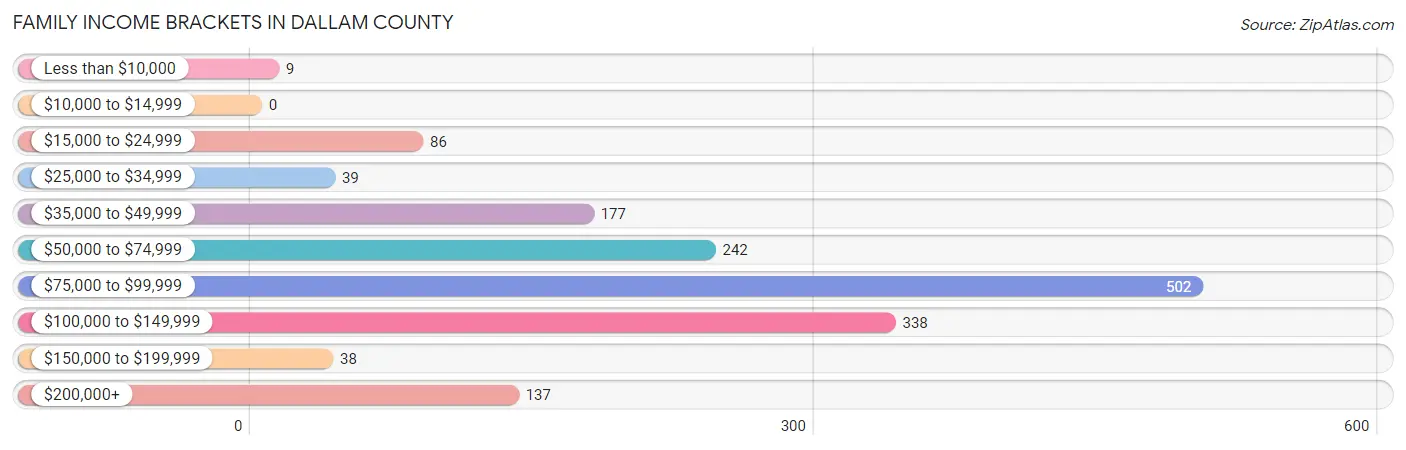
| Income Bracket | # Families | % Families |
| Less than $10,000 | 9 | 0.6% |
| $10,000 to $14,999 | 0 | 0.0% |
| $15,000 to $24,999 | 86 | 5.5% |
| $25,000 to $34,999 | 39 | 2.5% |
| $35,000 to $49,999 | 177 | 11.3% |
| $50,000 to $74,999 | 242 | 15.4% |
| $75,000 to $99,999 | 502 | 32.0% |
| $100,000 to $149,999 | 338 | 21.5% |
| $150,000 to $199,999 | 38 | 2.4% |
| $200,000+ | 137 | 8.7% |
Family Income by Famaliy Size in Dallam County
4-person families (334 | 21.3%) account for the highest median family income in Dallam County with $138,898 per family, while 2-person families (720 | 45.9%) have the highest median income of $43,250 per family member.
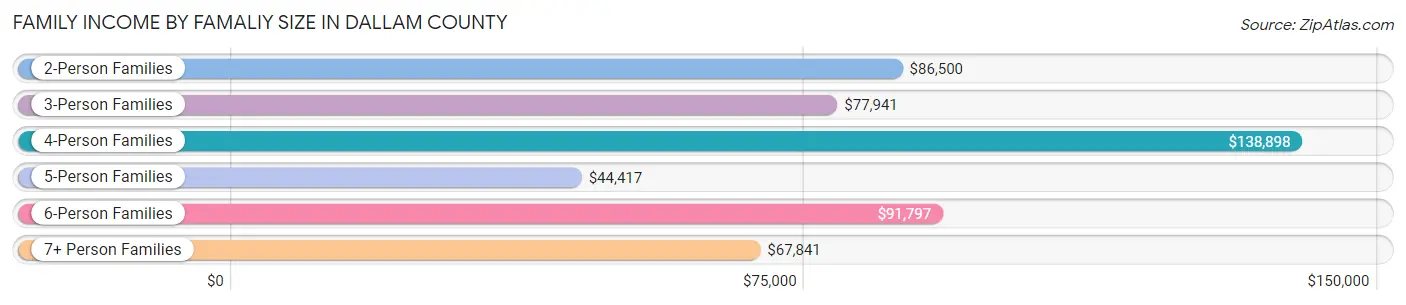
| Income Bracket | # Families | Median Income |
| 2-Person Families | 720 (45.9%) | $86,500 |
| 3-Person Families | 66 (4.2%) | $77,941 |
| 4-Person Families | 334 (21.3%) | $138,898 |
| 5-Person Families | 248 (15.8%) | $44,417 |
| 6-Person Families | 152 (9.7%) | $91,797 |
| 7+ Person Families | 50 (3.2%) | $67,841 |
| Total | 1,570 (100.0%) | $88,065 |
Family Income by Number of Earners in Dallam County
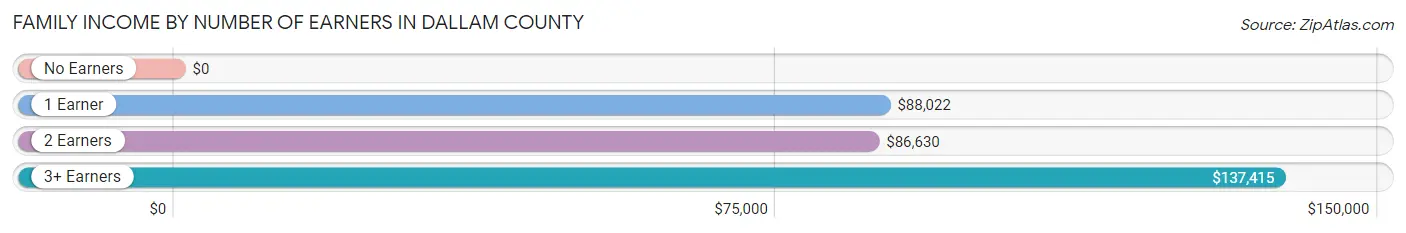
| Number of Earners | # Families | Median Income |
| No Earners | 94 (6.0%) | $0 |
| 1 Earner | 287 (18.3%) | $88,022 |
| 2 Earners | 910 (58.0%) | $86,630 |
| 3+ Earners | 279 (17.8%) | $137,415 |
| Total | 1,570 (100.0%) | $88,065 |
Household Income in Dallam County
Household Income Brackets in Dallam County
With 572 households falling in the category, the $50,000 to $74,999 income range is the most frequent in Dallam County, accounting for 24.5% of all households. In contrast, only 30 households (1.3%) fall into the $10,000 to $14,999 income bracket, making it the least populous group.
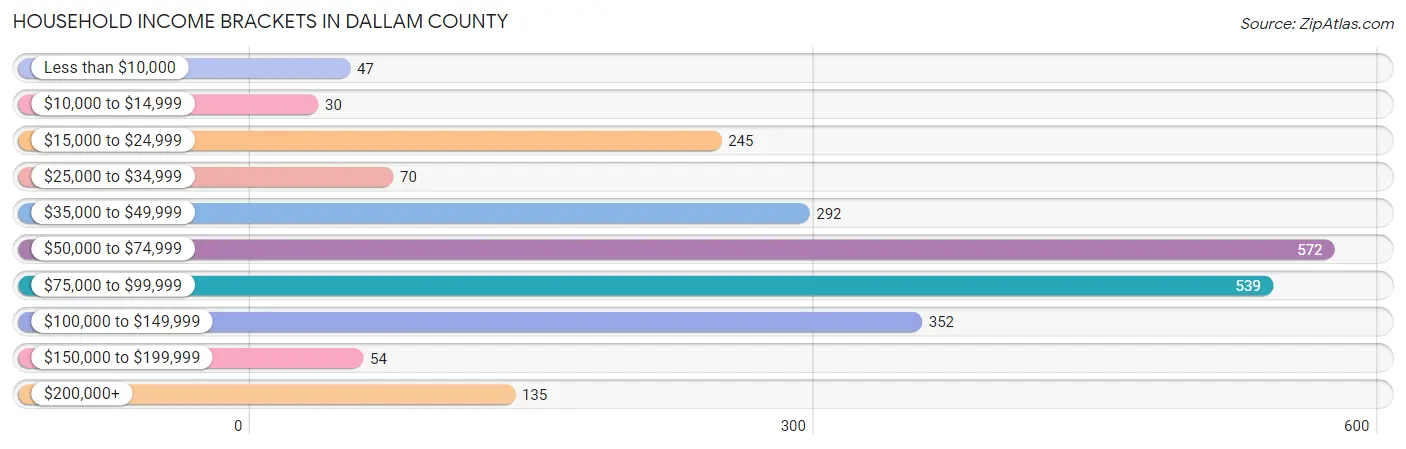
| Income Bracket | # Households | % Households |
| Less than $10,000 | 47 | 2.0% |
| $10,000 to $14,999 | 30 | 1.3% |
| $15,000 to $24,999 | 245 | 10.5% |
| $25,000 to $34,999 | 70 | 3.0% |
| $35,000 to $49,999 | 292 | 12.5% |
| $50,000 to $74,999 | 572 | 24.5% |
| $75,000 to $99,999 | 539 | 23.1% |
| $100,000 to $149,999 | 352 | 15.1% |
| $150,000 to $199,999 | 54 | 2.3% |
| $200,000+ | 135 | 5.8% |
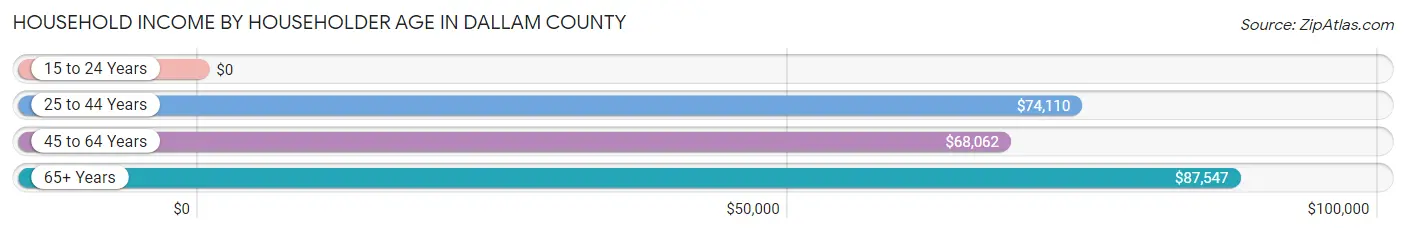
Household Income by Householder Age in Dallam County
The median household income in Dallam County is $71,969, with the highest median household income of $87,547 found in the 65+ years age bracket for the primary householder. A total of 425 households (18.2%) fall into this category. Meanwhile, the 15 to 24 years age bracket for the primary householder has the lowest median household income of $0, with 72 households (3.1%) in this group.
| Income Bracket | # Households | Median Income |
| 15 to 24 Years | 72 (3.1%) | $0 |
| 25 to 44 Years | 908 (38.9%) | $74,110 |
| 45 to 64 Years | 928 (39.8%) | $68,062 |
| 65+ Years | 425 (18.2%) | $87,547 |
| Total | 2,333 (100.0%) | $71,969 |
Poverty in Dallam County
Income Below Poverty by Sex and Age in Dallam County
With 7.3% poverty level for males and 10.0% for females among the residents of Dallam County, 15 year old males and 25 to 34 year old females are the most vulnerable to poverty, with 10 males (100.0%) and 118 females (30.9%) in their respective age groups living below the poverty level.
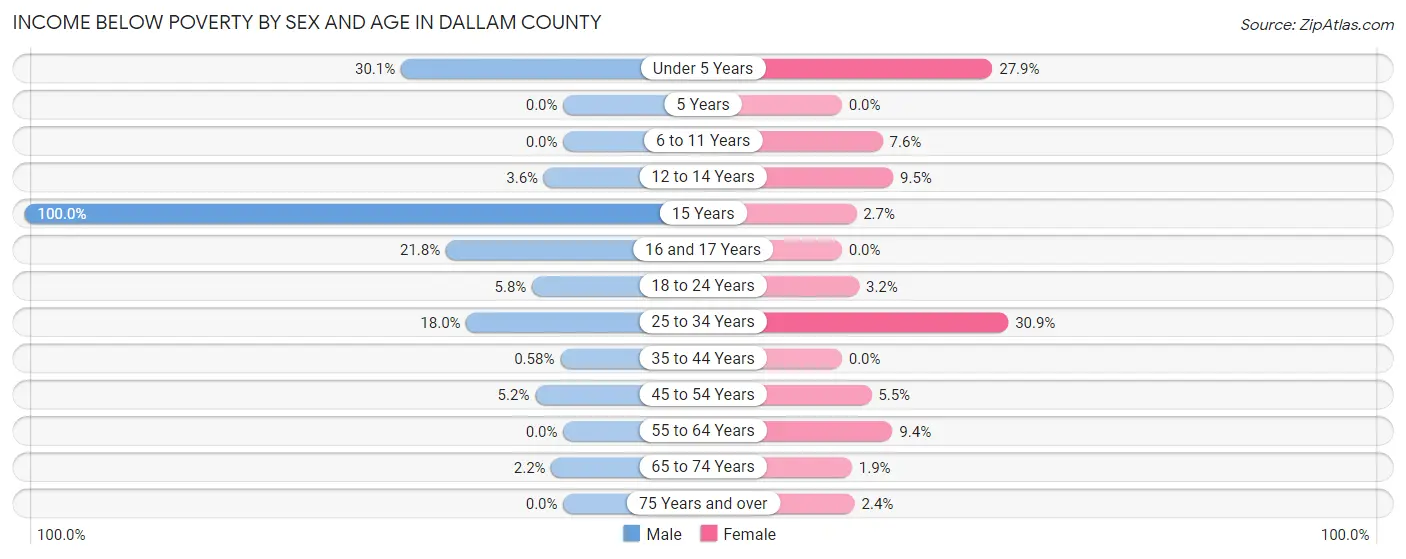
| Age Bracket | Male | Female |
| Under 5 Years | 69 (30.1%) | 81 (27.9%) |
| 5 Years | 0 (0.0%) | 0 (0.0%) |
| 6 to 11 Years | 0 (0.0%) | 29 (7.6%) |
| 12 to 14 Years | 3 (3.6%) | 22 (9.5%) |
| 15 Years | 10 (100.0%) | 3 (2.7%) |
| 16 and 17 Years | 27 (21.8%) | 0 (0.0%) |
| 18 to 24 Years | 10 (5.8%) | 8 (3.2%) |
| 25 to 34 Years | 125 (18.0%) | 118 (30.9%) |
| 35 to 44 Years | 3 (0.6%) | 0 (0.0%) |
| 45 to 54 Years | 25 (5.2%) | 24 (5.5%) |
| 55 to 64 Years | 0 (0.0%) | 31 (9.4%) |
| 65 to 74 Years | 6 (2.2%) | 3 (1.9%) |
| 75 Years and over | 0 (0.0%) | 3 (2.4%) |
| Total | 278 (7.3%) | 322 (10.0%) |
Income Above Poverty by Sex and Age in Dallam County
According to the poverty statistics in Dallam County, males aged 5 years and females aged 5 years are the age groups that are most secure financially, with 100.0% of males and 100.0% of females in these age groups living above the poverty line.
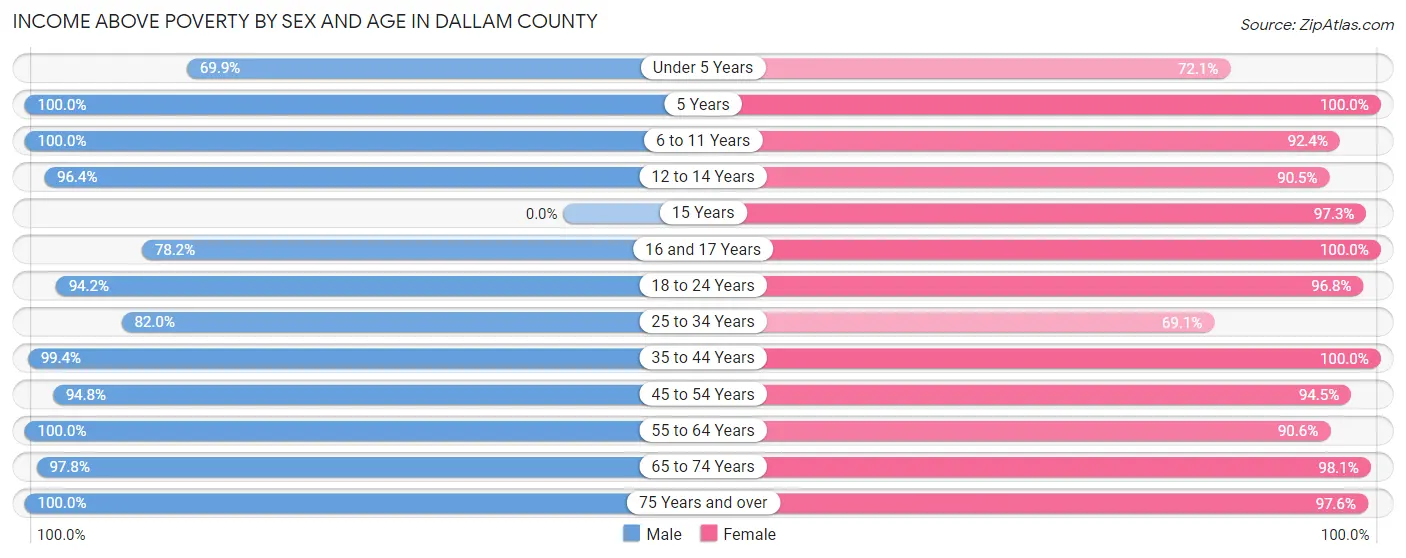
| Age Bracket | Male | Female |
| Under 5 Years | 160 (69.9%) | 209 (72.1%) |
| 5 Years | 20 (100.0%) | 45 (100.0%) |
| 6 to 11 Years | 549 (100.0%) | 354 (92.4%) |
| 12 to 14 Years | 80 (96.4%) | 209 (90.5%) |
| 15 Years | 0 (0.0%) | 109 (97.3%) |
| 16 and 17 Years | 97 (78.2%) | 72 (100.0%) |
| 18 to 24 Years | 163 (94.2%) | 242 (96.8%) |
| 25 to 34 Years | 570 (82.0%) | 264 (69.1%) |
| 35 to 44 Years | 513 (99.4%) | 388 (100.0%) |
| 45 to 54 Years | 454 (94.8%) | 414 (94.5%) |
| 55 to 64 Years | 527 (100.0%) | 299 (90.6%) |
| 65 to 74 Years | 265 (97.8%) | 158 (98.1%) |
| 75 Years and over | 123 (100.0%) | 123 (97.6%) |
| Total | 3,521 (92.7%) | 2,886 (90.0%) |
Income Below Poverty Among Married-Couple Families in Dallam County
The poverty statistics for married-couple families in Dallam County show that 1.5% or 21 of the total 1,412 families live below the poverty line. Families with 3 or 4 children have the highest poverty rate of 4.7%, comprising of 12 families. On the other hand, families with 5 or more children have the lowest poverty rate of 0.0%, which includes 0 families.
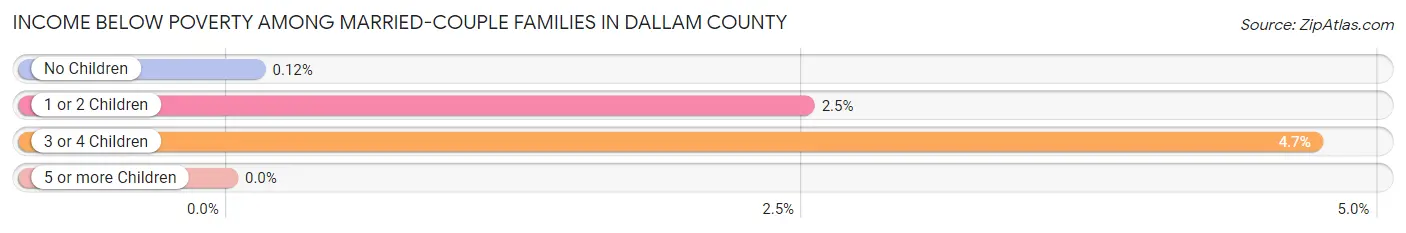
| Children | Above Poverty | Below Poverty |
| No Children | 802 (99.9%) | 1 (0.1%) |
| 1 or 2 Children | 311 (97.5%) | 8 (2.5%) |
| 3 or 4 Children | 242 (95.3%) | 12 (4.7%) |
| 5 or more Children | 36 (100.0%) | 0 (0.0%) |
| Total | 1,391 (98.5%) | 21 (1.5%) |
Income Below Poverty Among Single-Parent Households in Dallam County
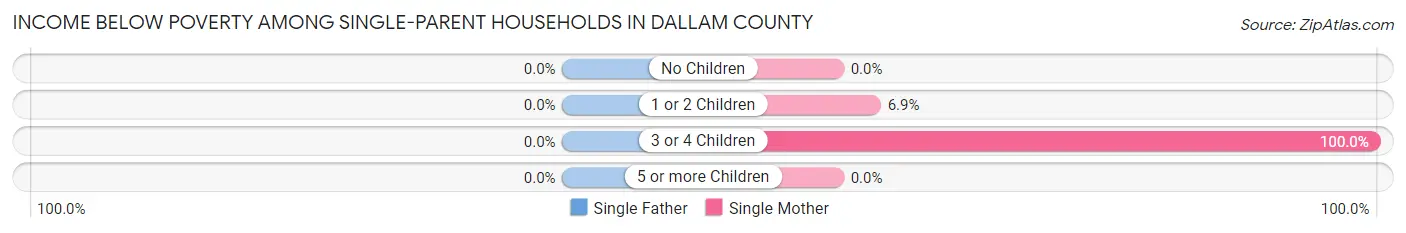
| Children | Single Father | Single Mother |
| No Children | 0 (0.0%) | 0 (0.0%) |
| 1 or 2 Children | 0 (0.0%) | 2 (6.9%) |
| 3 or 4 Children | 0 (0.0%) | 34 (100.0%) |
| 5 or more Children | 0 (0.0%) | 0 (0.0%) |
| Total | 0 (0.0%) | 36 (37.9%) |
Income Below Poverty Among Married-Couple vs Single-Parent Households in Dallam County
The poverty data for Dallam County shows that 21 of the married-couple family households (1.5%) and 36 of the single-parent households (22.8%) are living below the poverty level. Within the married-couple family households, those with 3 or 4 children have the highest poverty rate, with 12 households (4.7%) falling below the poverty line. Among the single-parent households, those with 3 or 4 children have the highest poverty rate, with 34 household (100.0%) living below poverty.
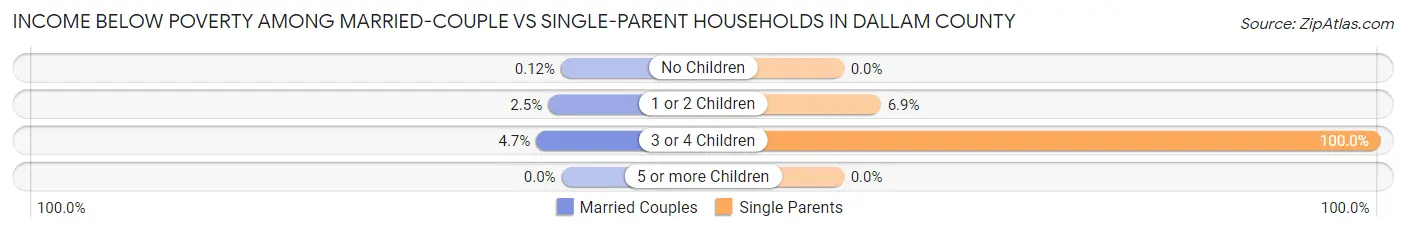
| Children | Married-Couple Families | Single-Parent Households |
| No Children | 1 (0.1%) | 0 (0.0%) |
| 1 or 2 Children | 8 (2.5%) | 2 (6.9%) |
| 3 or 4 Children | 12 (4.7%) | 34 (100.0%) |
| 5 or more Children | 0 (0.0%) | 0 (0.0%) |
| Total | 21 (1.5%) | 36 (22.8%) |
Race in Dallam County
The most populous races in Dallam County are White / Caucasian (5,235 | 73.1%), Hispanic or Latino (3,432 | 47.9%), and Two or more Races (1,041 | 14.5%).
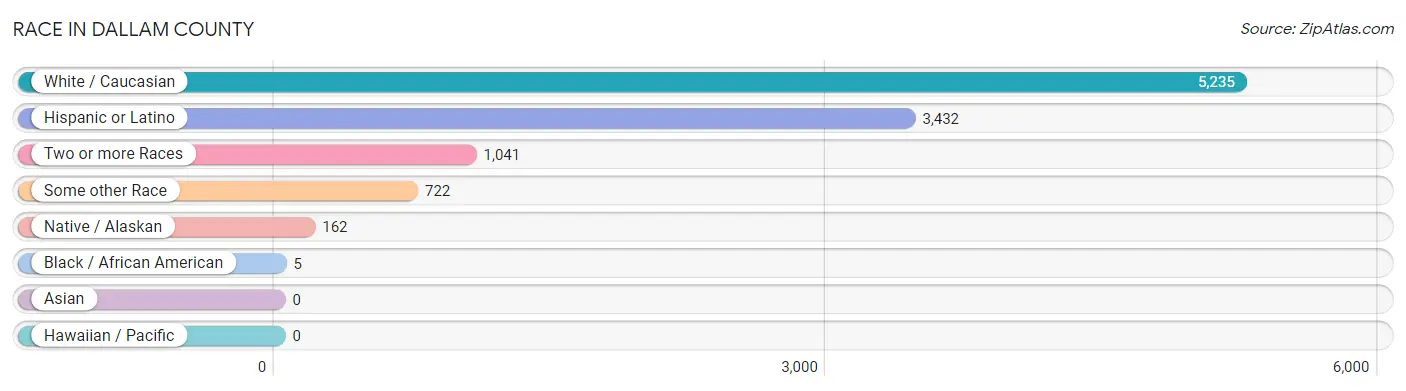
| Race | # Population | % Population |
| Asian | 0 | 0.0% |
| Black / African American | 5 | 0.1% |
| Hawaiian / Pacific | 0 | 0.0% |
| Hispanic or Latino | 3,432 | 47.9% |
| Native / Alaskan | 162 | 2.3% |
| White / Caucasian | 5,235 | 73.1% |
| Two or more Races | 1,041 | 14.5% |
| Some other Race | 722 | 10.1% |
| Total | 7,165 | 100.0% |
Ancestry in Dallam County
The most populous ancestries reported in Dallam County are Mexican (3,327 | 46.4%), German (927 | 12.9%), English (566 | 7.9%), American (381 | 5.3%), and Irish (362 | 5.1%), together accounting for 77.6% of all Dallam County residents.
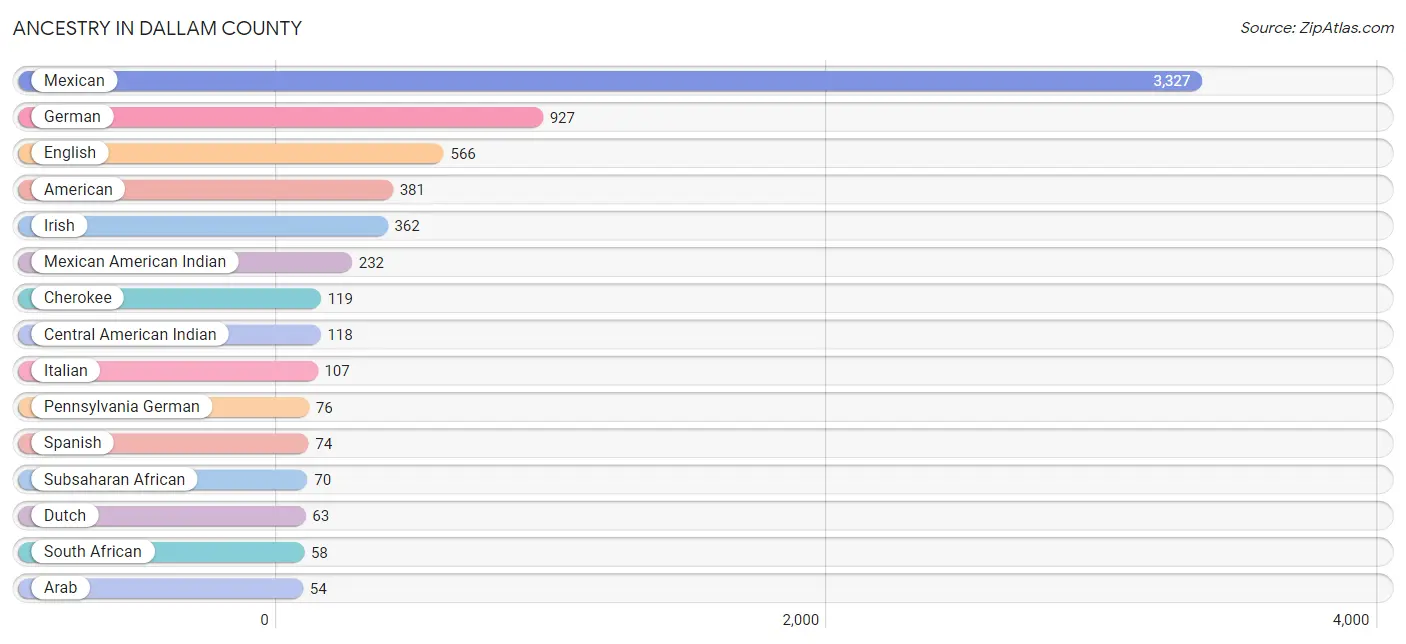
| Ancestry | # Population | % Population |
| African | 12 | 0.2% |
| American | 381 | 5.3% |
| Apache | 34 | 0.5% |
| Arab | 54 | 0.7% |
| Canadian | 3 | 0.0% |
| Celtic | 8 | 0.1% |
| Central American | 19 | 0.3% |
| Central American Indian | 118 | 1.7% |
| Cherokee | 119 | 1.7% |
| Chickasaw | 26 | 0.4% |
| Danish | 1 | 0.0% |
| Dutch | 63 | 0.9% |
| Dutch West Indian | 15 | 0.2% |
| English | 566 | 7.9% |
| European | 1 | 0.0% |
| French | 32 | 0.4% |
| German | 927 | 12.9% |
| Greek | 8 | 0.1% |
| Guatemalan | 19 | 0.3% |
| Irish | 362 | 5.1% |
| Italian | 107 | 1.5% |
| Lebanese | 54 | 0.7% |
| Mexican | 3,327 | 46.4% |
| Mexican American Indian | 232 | 3.2% |
| Norwegian | 20 | 0.3% |
| Pennsylvania German | 76 | 1.1% |
| Polish | 48 | 0.7% |
| Portuguese | 2 | 0.0% |
| Scotch-Irish | 8 | 0.1% |
| Scottish | 36 | 0.5% |
| Slavic | 11 | 0.2% |
| South African | 58 | 0.8% |
| Spaniard | 9 | 0.1% |
| Spanish | 74 | 1.0% |
| Subsaharan African | 70 | 1.0% |
| Swedish | 48 | 0.7% |
| Swiss | 1 | 0.0% |
| Ukrainian | 12 | 0.2% |
| Welsh | 14 | 0.2% | View All 39 Rows |
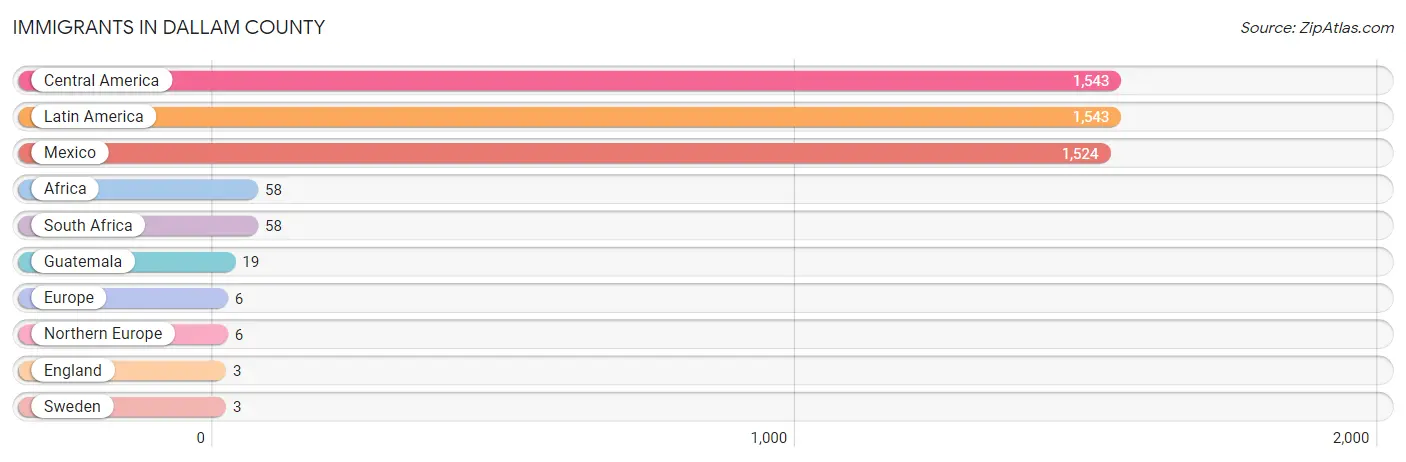
Immigrants in Dallam County
The most numerous immigrant groups reported in Dallam County came from Central America (1,543 | 21.5%), Latin America (1,543 | 21.5%), Mexico (1,524 | 21.3%), Africa (58 | 0.8%), and South Africa (58 | 0.8%), together accounting for 66.0% of all Dallam County residents.
| Immigration Origin | # Population | % Population |
| Africa | 58 | 0.8% |
| Central America | 1,543 | 21.5% |
| England | 3 | 0.0% |
| Europe | 6 | 0.1% |
| Guatemala | 19 | 0.3% |
| Latin America | 1,543 | 21.5% |
| Mexico | 1,524 | 21.3% |
| Northern Europe | 6 | 0.1% |
| South Africa | 58 | 0.8% |
| Sweden | 3 | 0.0% | View All 10 Rows |
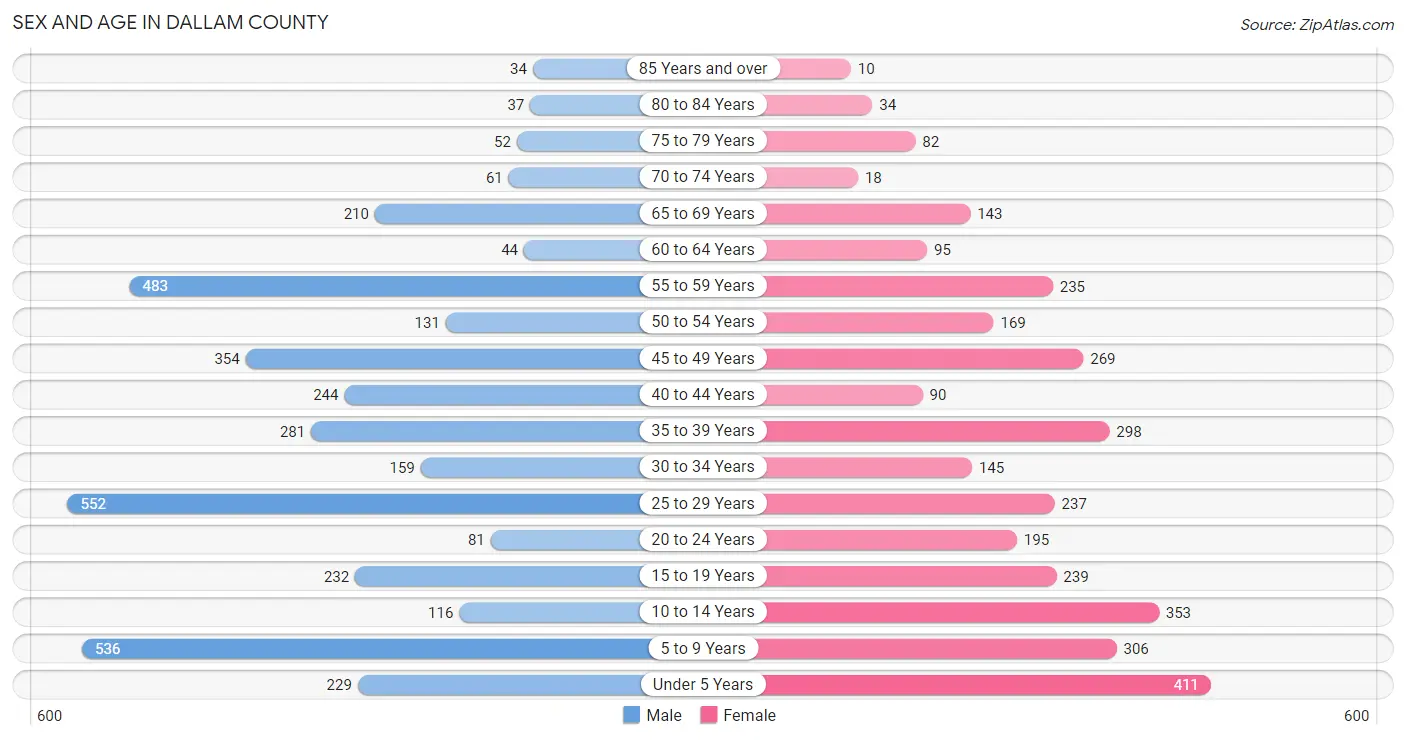
Sex and Age in Dallam County
Sex and Age in Dallam County
The most populous age groups in Dallam County are 25 to 29 Years (552 | 14.4%) for men and Under 5 Years (411 | 12.3%) for women.
| Age Bracket | Male | Female |
| Under 5 Years | 229 (6.0%) | 411 (12.3%) |
| 5 to 9 Years | 536 (14.0%) | 306 (9.2%) |
| 10 to 14 Years | 116 (3.0%) | 353 (10.6%) |
| 15 to 19 Years | 232 (6.0%) | 239 (7.2%) |
| 20 to 24 Years | 81 (2.1%) | 195 (5.9%) |
| 25 to 29 Years | 552 (14.4%) | 237 (7.1%) |
| 30 to 34 Years | 159 (4.1%) | 145 (4.4%) |
| 35 to 39 Years | 281 (7.3%) | 298 (8.9%) |
| 40 to 44 Years | 244 (6.4%) | 90 (2.7%) |
| 45 to 49 Years | 354 (9.2%) | 269 (8.1%) |
| 50 to 54 Years | 131 (3.4%) | 169 (5.1%) |
| 55 to 59 Years | 483 (12.6%) | 235 (7.1%) |
| 60 to 64 Years | 44 (1.1%) | 95 (2.9%) |
| 65 to 69 Years | 210 (5.5%) | 143 (4.3%) |
| 70 to 74 Years | 61 (1.6%) | 18 (0.5%) |
| 75 to 79 Years | 52 (1.4%) | 82 (2.5%) |
| 80 to 84 Years | 37 (1.0%) | 34 (1.0%) |
| 85 Years and over | 34 (0.9%) | 10 (0.3%) |
| Total | 3,836 (100.0%) | 3,329 (100.0%) |
Families and Households in Dallam County
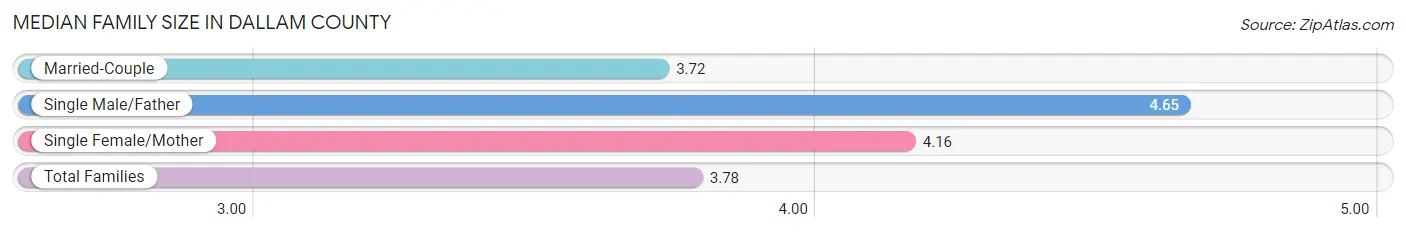
Median Family Size in Dallam County
The median family size in Dallam County is 3.78 persons per family, with single male/father families (63 | 4.0%) accounting for the largest median family size of 4.65 persons per family. On the other hand, married-couple families (1,412 | 89.9%) represent the smallest median family size with 3.72 persons per family.
| Family Type | # Families | Family Size |
| Married-Couple | 1,412 (89.9%) | 3.72 |
| Single Male/Father | 63 (4.0%) | 4.65 |
| Single Female/Mother | 95 (6.0%) | 4.16 |
| Total Families | 1,570 (100.0%) | 3.78 |
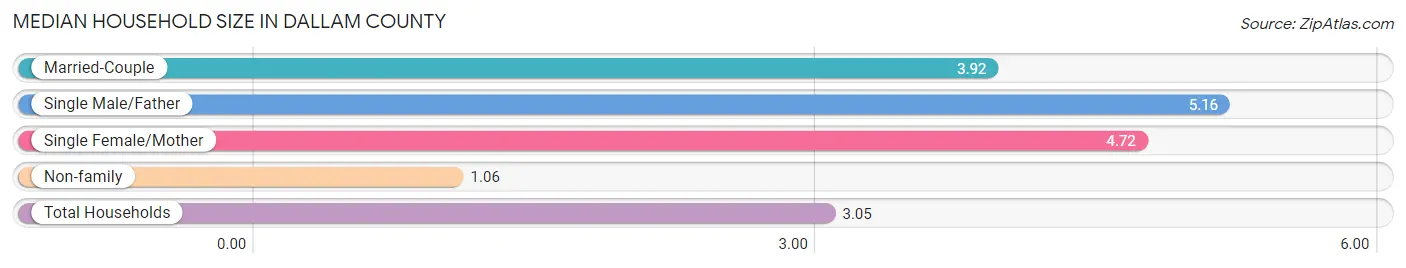
Median Household Size in Dallam County
The median household size in Dallam County is 3.05 persons per household, with single male/father households (63 | 2.7%) accounting for the largest median household size of 5.16 persons per household. non-family households (763 | 32.7%) represent the smallest median household size with 1.06 persons per household.
| Household Type | # Households | Household Size |
| Married-Couple | 1,412 (60.5%) | 3.92 |
| Single Male/Father | 63 (2.7%) | 5.16 |
| Single Female/Mother | 95 (4.1%) | 4.72 |
| Non-family | 763 (32.7%) | 1.06 |
| Total Households | 2,333 (100.0%) | 3.05 |
Household Size by Marriage Status in Dallam County
Out of a total of 2,333 households in Dallam County, 1,570 (67.3%) are family households, while 763 (32.7%) are nonfamily households. The most numerous type of family households are 2-person households, comprising 714, and the most common type of nonfamily households are 1-person households, comprising 728.
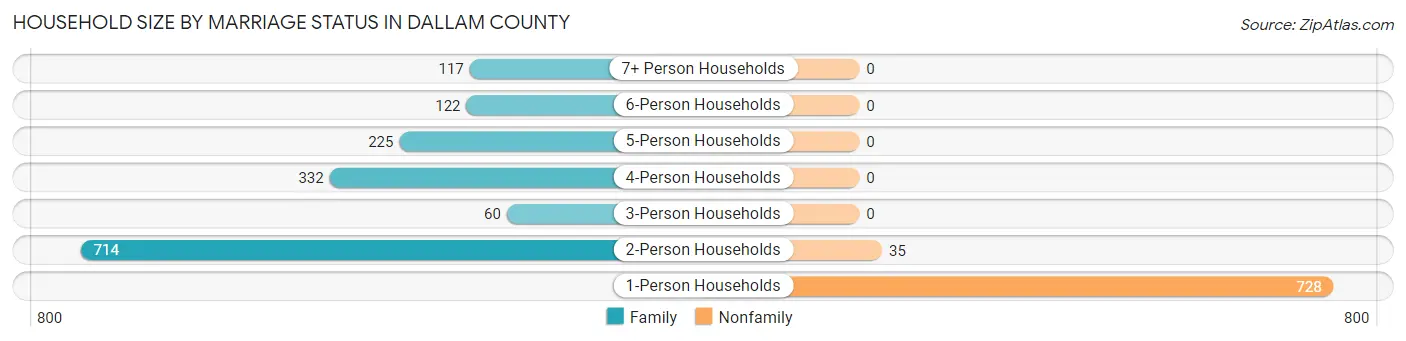
| Household Size | Family Households | Nonfamily Households |
| 1-Person Households | - | 728 (31.2%) |
| 2-Person Households | 714 (30.6%) | 35 (1.5%) |
| 3-Person Households | 60 (2.6%) | 0 (0.0%) |
| 4-Person Households | 332 (14.2%) | 0 (0.0%) |
| 5-Person Households | 225 (9.6%) | 0 (0.0%) |
| 6-Person Households | 122 (5.2%) | 0 (0.0%) |
| 7+ Person Households | 117 (5.0%) | 0 (0.0%) |
| Total | 1,570 (67.3%) | 763 (32.7%) |
Female Fertility in Dallam County
Fertility by Age in Dallam County
Average fertility rate in Dallam County is 73.0 births per 1,000 women. Women in the age bracket of 20 to 34 years have the highest fertility rate with 161.0 births per 1,000 women. Women in the age bracket of 20 to 34 years acount for 86.9% of all women with births.
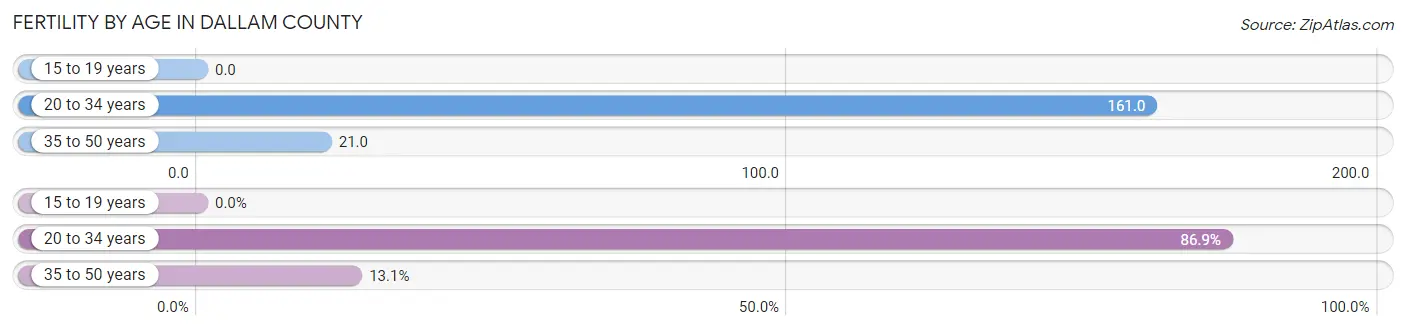
| Age Bracket | Women with Births | Births / 1,000 Women |
| 15 to 19 years | 0 (0.0%) | 0.0 |
| 20 to 34 years | 93 (86.9%) | 161.0 |
| 35 to 50 years | 14 (13.1%) | 21.0 |
| Total | 107 (100.0%) | 73.0 |
Fertility by Age by Marriage Status in Dallam County
82.2% of women with births (107) in Dallam County are married. The highest percentage of unmarried women with births falls into 20 to 34 years age bracket with 20.4% of them unmarried at the time of birth, while the lowest percentage of unmarried women with births belong to 35 to 50 years age bracket with 0.0% of them unmarried.
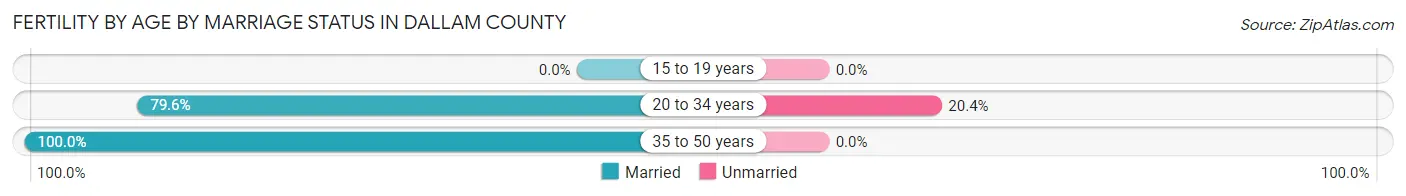
| Age Bracket | Married | Unmarried |
| 15 to 19 years | 0 (0.0%) | 0 (0.0%) |
| 20 to 34 years | 74 (79.6%) | 19 (20.4%) |
| 35 to 50 years | 14 (100.0%) | 0 (0.0%) |
| Total | 88 (82.2%) | 19 (17.8%) |
Fertility by Education in Dallam County
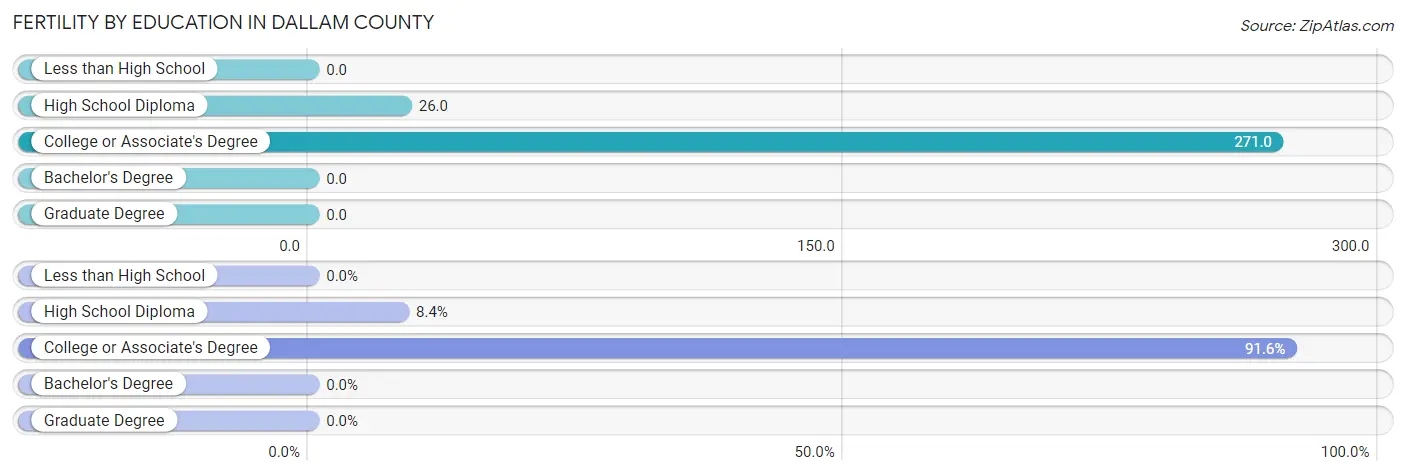
| Educational Attainment | Women with Births | Births / 1,000 Women |
| Less than High School | 0 (0.0%) | 0.0 |
| High School Diploma | 9 (8.4%) | 26.0 |
| College or Associate's Degree | 98 (91.6%) | 271.0 |
| Bachelor's Degree | 0 (0.0%) | 0.0 |
| Graduate Degree | 0 (0.0%) | 0.0 |
| Total | 107 (100.0%) | 73.0 |
Fertility by Education by Marriage Status in Dallam County
17.8% of women with births in Dallam County are unmarried. Women with the educational attainment of high school diploma are most likely to be married with 100.0% of them married at childbirth, while women with the educational attainment of college or associate's degree are least likely to be married with 19.4% of them unmarried at childbirth.
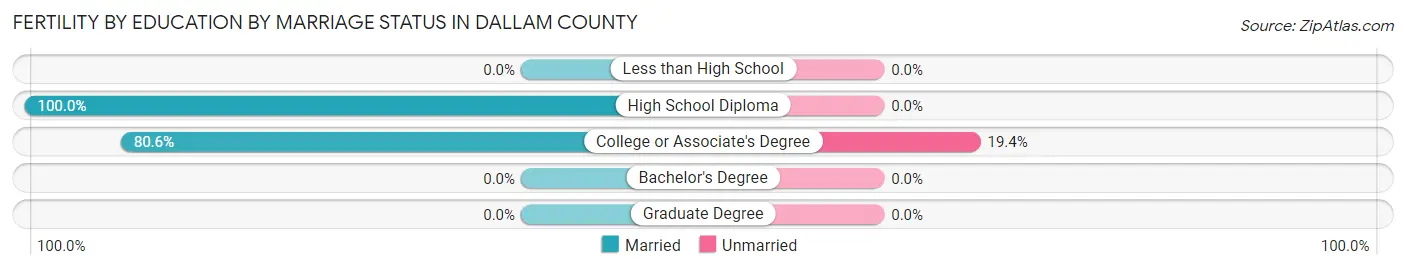
| Educational Attainment | Married | Unmarried |
| Less than High School | 0 (0.0%) | 0 (0.0%) |
| High School Diploma | 9 (100.0%) | 0 (0.0%) |
| College or Associate's Degree | 79 (80.6%) | 19 (19.4%) |
| Bachelor's Degree | 0 (0.0%) | 0 (0.0%) |
| Graduate Degree | 0 (0.0%) | 0 (0.0%) |
| Total | 88 (82.2%) | 19 (17.8%) |
Employment Characteristics in Dallam County
Employment by Class of Employer in Dallam County
Among the 3,814 employed individuals in Dallam County, private company employees (2,675 | 70.1%), self-employed (not incorporated) (678 | 17.8%), and local government employees (249 | 6.5%) make up the most common classes of employment.
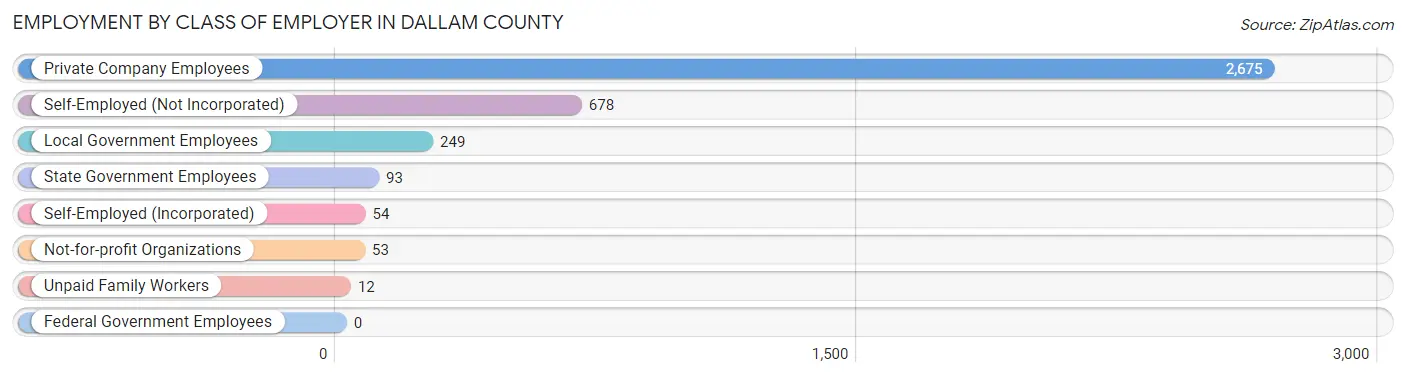
| Employer Class | # Employees | % Employees |
| Private Company Employees | 2,675 | 70.1% |
| Self-Employed (Incorporated) | 54 | 1.4% |
| Self-Employed (Not Incorporated) | 678 | 17.8% |
| Not-for-profit Organizations | 53 | 1.4% |
| Local Government Employees | 249 | 6.5% |
| State Government Employees | 93 | 2.4% |
| Federal Government Employees | 0 | 0.0% |
| Unpaid Family Workers | 12 | 0.3% |
| Total | 3,814 | 100.0% |
Employment Status by Age in Dallam County
According to the labor force statistics for Dallam County, out of the total population over 16 years of age (5,092), 77.4% or 3,941 individuals are in the labor force, with 2.6% or 102 of them unemployed. The age group with the highest labor force participation rate is 30 to 34 years, with 94.7% or 288 individuals in the labor force. Within the labor force, the 20 to 24 years age range has the highest percentage of unemployed individuals, with 29.9% or 38 of them being unemployed.
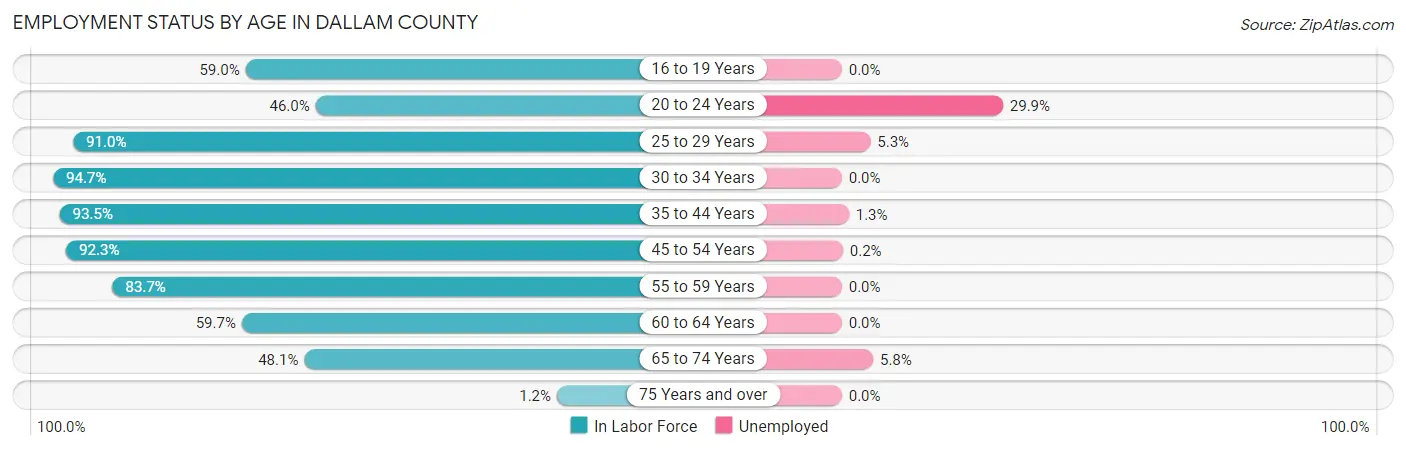
| Age Bracket | In Labor Force | Unemployed |
| 16 to 19 Years | 206 (59.0%) | 0 (0.0%) |
| 20 to 24 Years | 127 (46.0%) | 38 (29.9%) |
| 25 to 29 Years | 718 (91.0%) | 38 (5.3%) |
| 30 to 34 Years | 288 (94.7%) | 0 (0.0%) |
| 35 to 44 Years | 854 (93.5%) | 11 (1.3%) |
| 45 to 54 Years | 852 (92.3%) | 2 (0.2%) |
| 55 to 59 Years | 601 (83.7%) | 0 (0.0%) |
| 60 to 64 Years | 83 (59.7%) | 0 (0.0%) |
| 65 to 74 Years | 208 (48.1%) | 12 (5.8%) |
| 75 Years and over | 3 (1.2%) | 0 (0.0%) |
| Total | 3,941 (77.4%) | 102 (2.6%) |
Employment Status by Educational Attainment in Dallam County
According to labor force statistics for Dallam County, 89.7% of individuals (3,396) out of the total population between 25 and 64 years of age (3,786) are in the labor force, with 1.5% or 51 of them being unemployed. The group with the highest labor force participation rate are those with the educational attainment of college / associate degree, with 93.5% or 936 individuals in the labor force. Within the labor force, individuals with college / associate degree education have the highest percentage of unemployment, with 3.2% or 30 of them being unemployed.
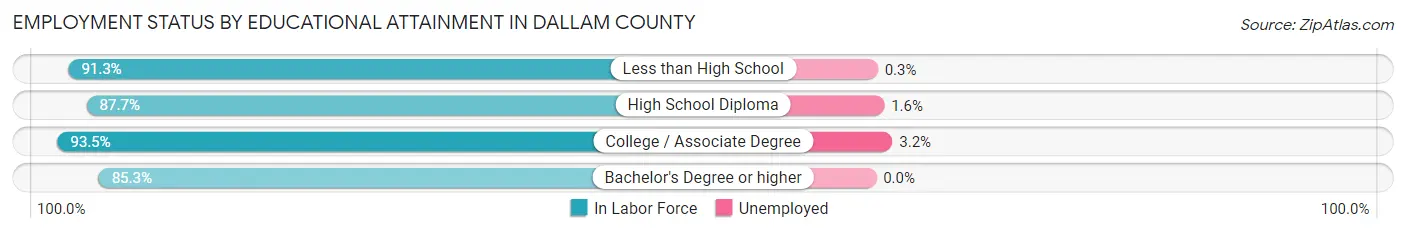
| Educational Attainment | In Labor Force | Unemployed |
| Less than High School | 779 (91.3%) | 3 (0.3%) |
| High School Diploma | 1,198 (87.7%) | 22 (1.6%) |
| College / Associate Degree | 936 (93.5%) | 32 (3.2%) |
| Bachelor's Degree or higher | 483 (85.3%) | 0 (0.0%) |
| Total | 3,396 (89.7%) | 57 (1.5%) |
Employment Occupations by Sex in Dallam County
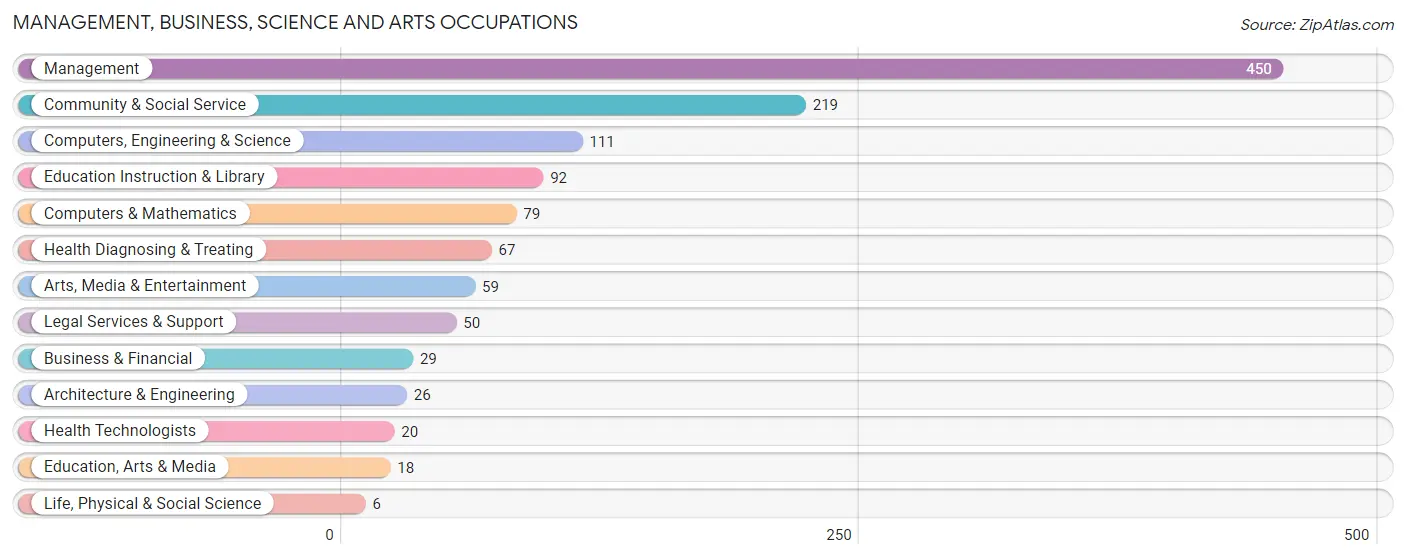
Management, Business, Science and Arts Occupations
The most common Management, Business, Science and Arts occupations in Dallam County are Management (450 | 11.7%), Community & Social Service (219 | 5.7%), Computers, Engineering & Science (111 | 2.9%), Education Instruction & Library (92 | 2.4%), and Computers & Mathematics (79 | 2.1%).
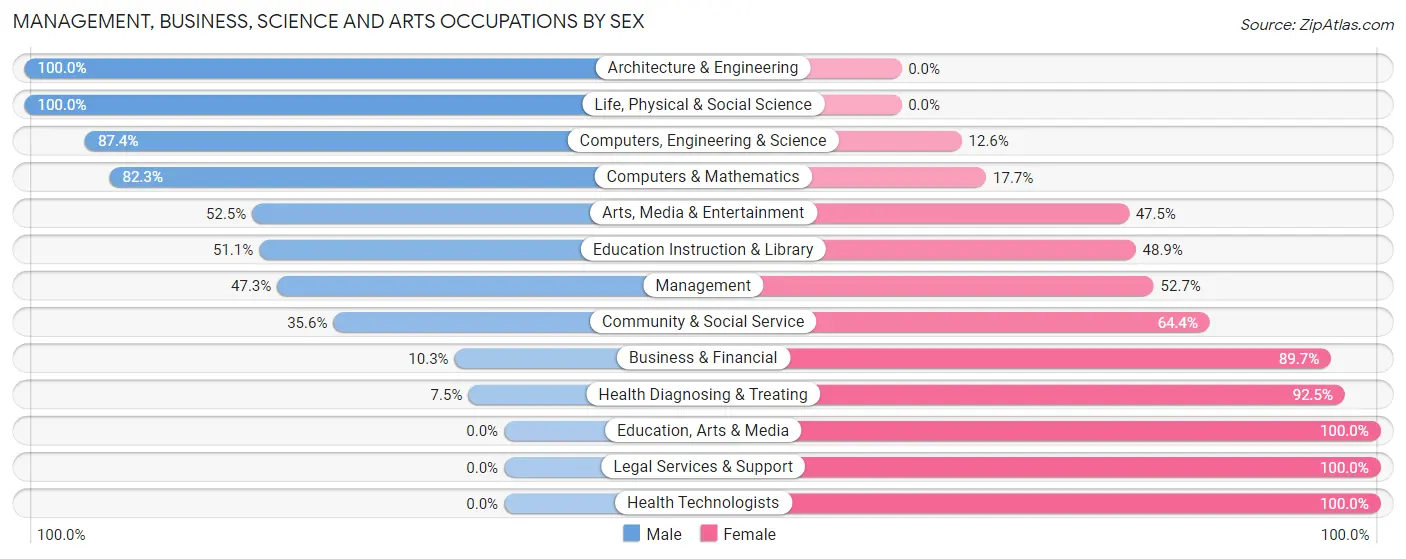
Management, Business, Science and Arts Occupations by Sex
Within the Management, Business, Science and Arts occupations in Dallam County, the most male-oriented occupations are Architecture & Engineering (100.0%), Life, Physical & Social Science (100.0%), and Computers, Engineering & Science (87.4%), while the most female-oriented occupations are Education, Arts & Media (100.0%), Legal Services & Support (100.0%), and Health Technologists (100.0%).
| Occupation | Male | Female |
| Management | 213 (47.3%) | 237 (52.7%) |
| Business & Financial | 3 (10.3%) | 26 (89.7%) |
| Computers, Engineering & Science | 97 (87.4%) | 14 (12.6%) |
| Computers & Mathematics | 65 (82.3%) | 14 (17.7%) |
| Architecture & Engineering | 26 (100.0%) | 0 (0.0%) |
| Life, Physical & Social Science | 6 (100.0%) | 0 (0.0%) |
| Community & Social Service | 78 (35.6%) | 141 (64.4%) |
| Education, Arts & Media | 0 (0.0%) | 18 (100.0%) |
| Legal Services & Support | 0 (0.0%) | 50 (100.0%) |
| Education Instruction & Library | 47 (51.1%) | 45 (48.9%) |
| Arts, Media & Entertainment | 31 (52.5%) | 28 (47.5%) |
| Health Diagnosing & Treating | 5 (7.5%) | 62 (92.5%) |
| Health Technologists | 0 (0.0%) | 20 (100.0%) |
| Total (Category) | 396 (45.2%) | 480 (54.8%) |
| Total (Overall) | 2,482 (64.6%) | 1,357 (35.3%) |
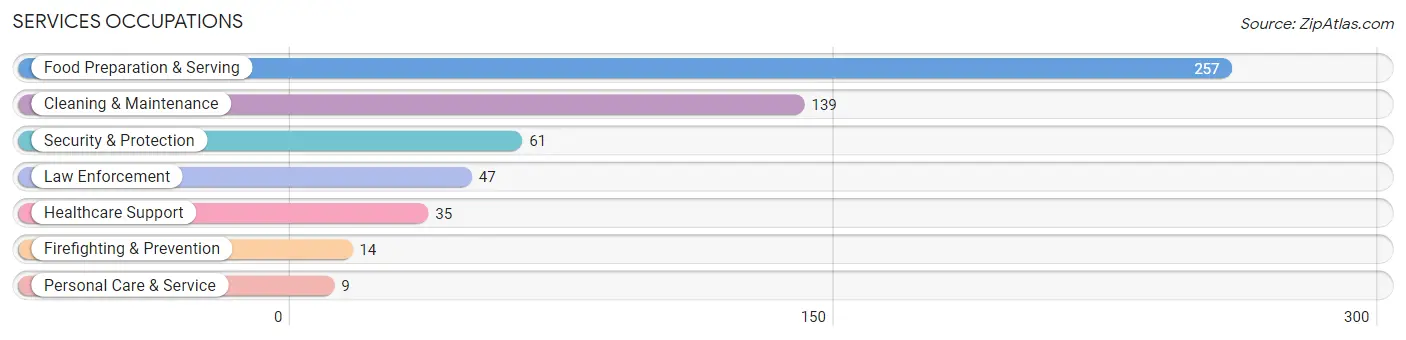
Services Occupations
The most common Services occupations in Dallam County are Food Preparation & Serving (257 | 6.7%), Cleaning & Maintenance (139 | 3.6%), Security & Protection (61 | 1.6%), Law Enforcement (47 | 1.2%), and Healthcare Support (35 | 0.9%).
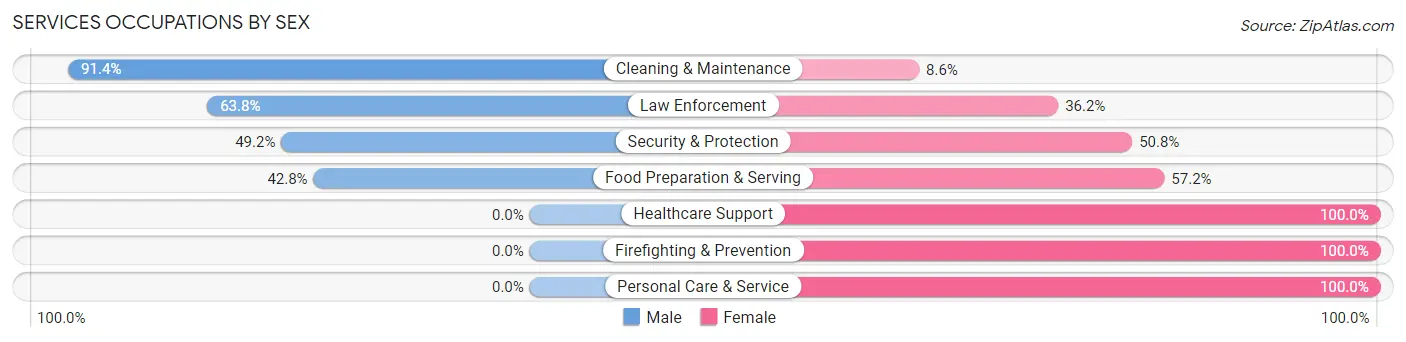
Services Occupations by Sex
Within the Services occupations in Dallam County, the most male-oriented occupations are Cleaning & Maintenance (91.4%), Law Enforcement (63.8%), and Security & Protection (49.2%), while the most female-oriented occupations are Healthcare Support (100.0%), Firefighting & Prevention (100.0%), and Personal Care & Service (100.0%).
| Occupation | Male | Female |
| Healthcare Support | 0 (0.0%) | 35 (100.0%) |
| Security & Protection | 30 (49.2%) | 31 (50.8%) |
| Firefighting & Prevention | 0 (0.0%) | 14 (100.0%) |
| Law Enforcement | 30 (63.8%) | 17 (36.2%) |
| Food Preparation & Serving | 110 (42.8%) | 147 (57.2%) |
| Cleaning & Maintenance | 127 (91.4%) | 12 (8.6%) |
| Personal Care & Service | 0 (0.0%) | 9 (100.0%) |
| Total (Category) | 267 (53.3%) | 234 (46.7%) |
| Total (Overall) | 2,482 (64.6%) | 1,357 (35.3%) |
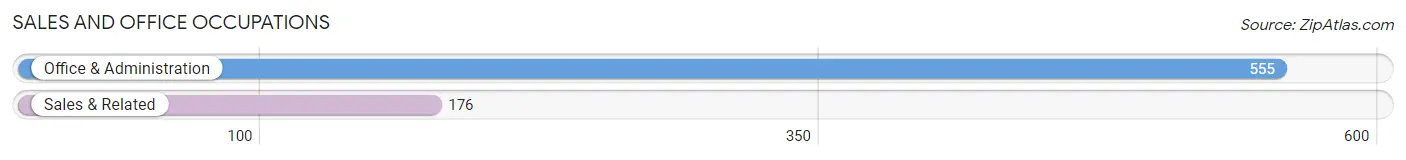
Sales and Office Occupations
The most common Sales and Office occupations in Dallam County are Office & Administration (555 | 14.5%), and Sales & Related (176 | 4.6%).
Sales and Office Occupations by Sex
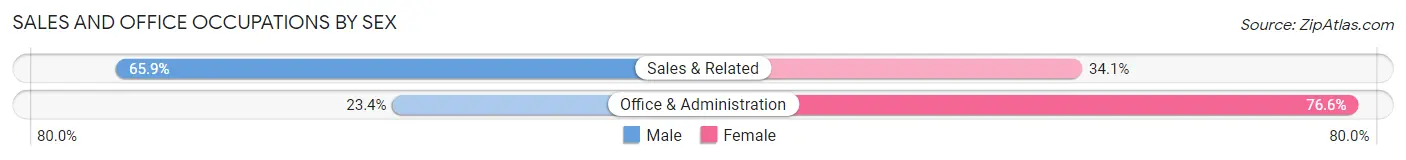
| Occupation | Male | Female |
| Sales & Related | 116 (65.9%) | 60 (34.1%) |
| Office & Administration | 130 (23.4%) | 425 (76.6%) |
| Total (Category) | 246 (33.7%) | 485 (66.3%) |
| Total (Overall) | 2,482 (64.6%) | 1,357 (35.3%) |
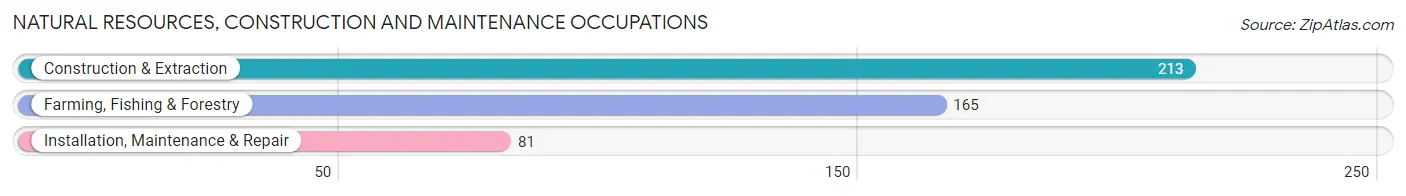
Natural Resources, Construction and Maintenance Occupations
The most common Natural Resources, Construction and Maintenance occupations in Dallam County are Construction & Extraction (213 | 5.6%), Farming, Fishing & Forestry (165 | 4.3%), and Installation, Maintenance & Repair (81 | 2.1%).
Natural Resources, Construction and Maintenance Occupations by Sex
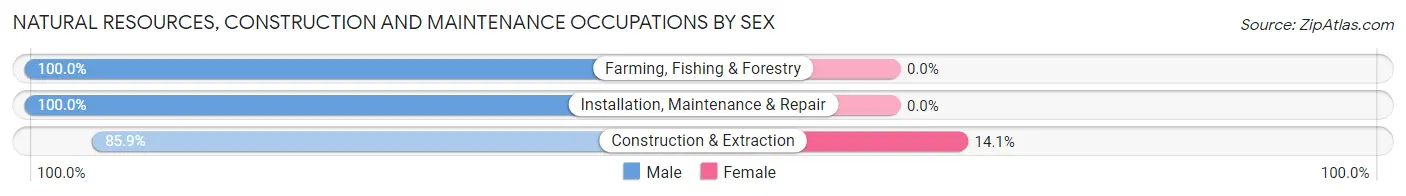
| Occupation | Male | Female |
| Farming, Fishing & Forestry | 165 (100.0%) | 0 (0.0%) |
| Construction & Extraction | 183 (85.9%) | 30 (14.1%) |
| Installation, Maintenance & Repair | 81 (100.0%) | 0 (0.0%) |
| Total (Category) | 429 (93.5%) | 30 (6.5%) |
| Total (Overall) | 2,482 (64.6%) | 1,357 (35.3%) |
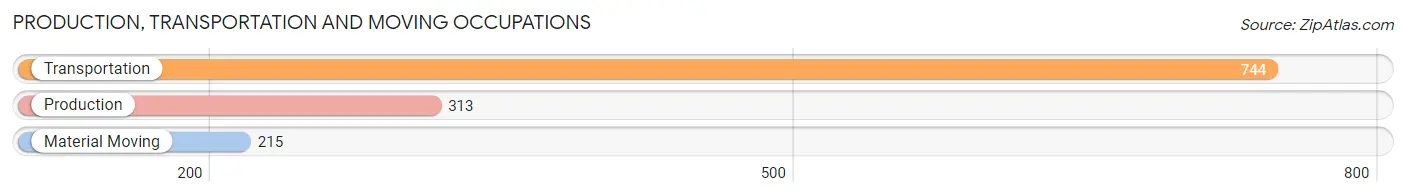
Production, Transportation and Moving Occupations
The most common Production, Transportation and Moving occupations in Dallam County are Transportation (744 | 19.4%), Production (313 | 8.2%), and Material Moving (215 | 5.6%).
Production, Transportation and Moving Occupations by Sex
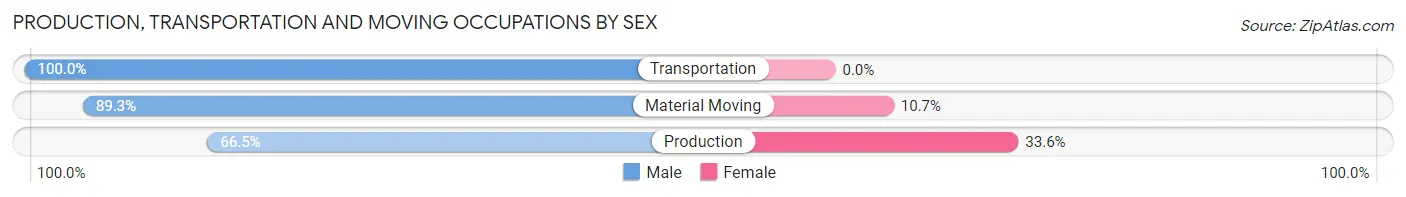
| Occupation | Male | Female |
| Production | 208 (66.4%) | 105 (33.6%) |
| Transportation | 744 (100.0%) | 0 (0.0%) |
| Material Moving | 192 (89.3%) | 23 (10.7%) |
| Total (Category) | 1,144 (89.9%) | 128 (10.1%) |
| Total (Overall) | 2,482 (64.6%) | 1,357 (35.3%) |
Employment Industries by Sex in Dallam County
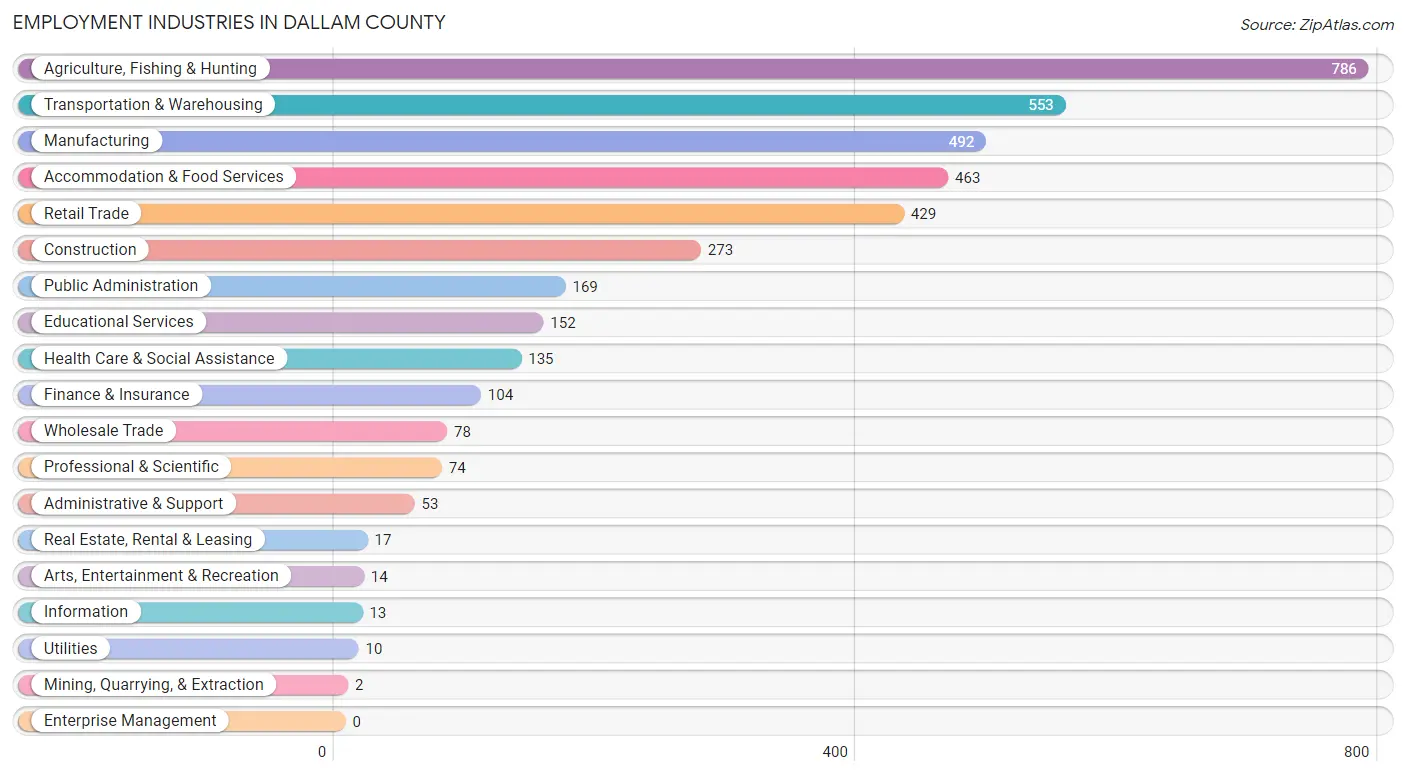
Employment Industries in Dallam County
The major employment industries in Dallam County include Agriculture, Fishing & Hunting (786 | 20.5%), Transportation & Warehousing (553 | 14.4%), Manufacturing (492 | 12.8%), Accommodation & Food Services (463 | 12.1%), and Retail Trade (429 | 11.2%).
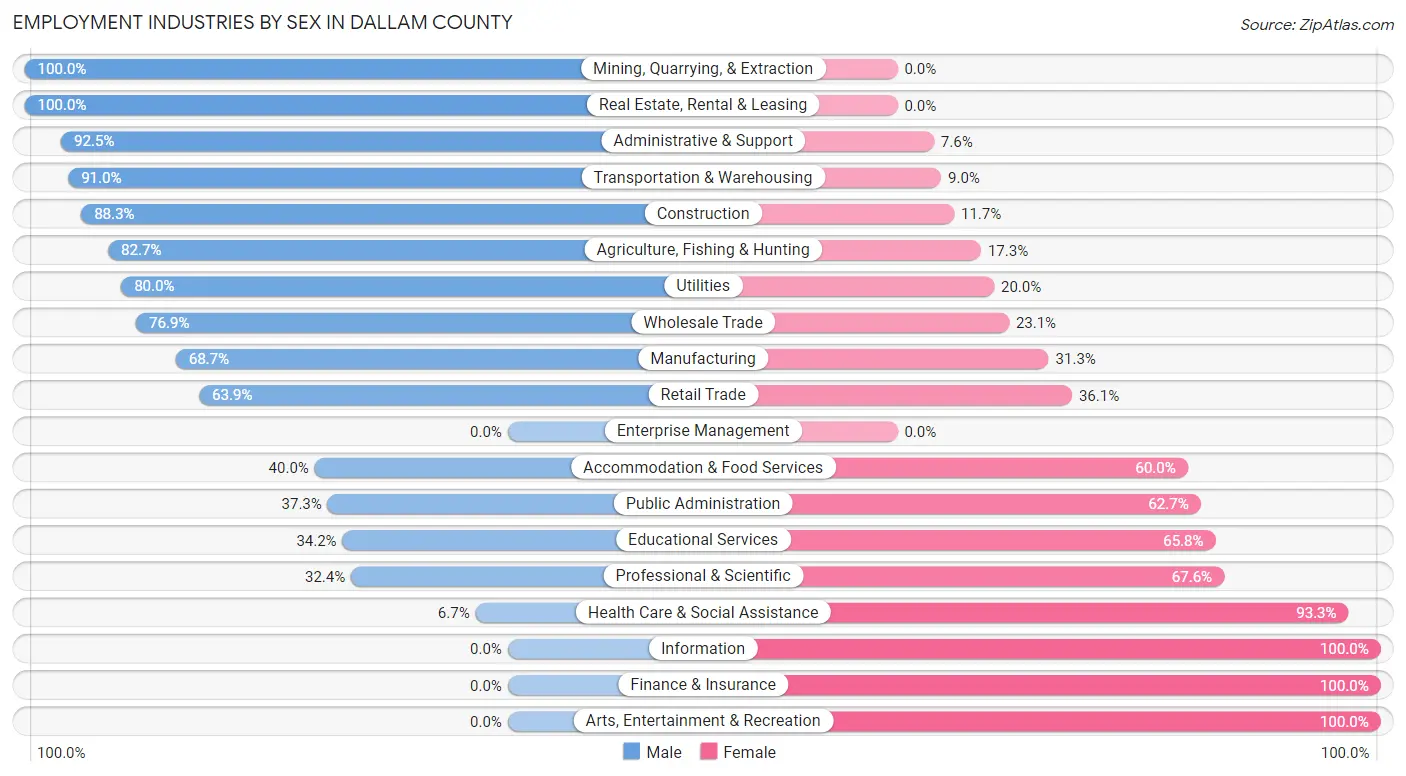
Employment Industries by Sex in Dallam County
The Dallam County industries that see more men than women are Mining, Quarrying, & Extraction (100.0%), Real Estate, Rental & Leasing (100.0%), and Administrative & Support (92.4%), whereas the industries that tend to have a higher number of women are Information (100.0%), Finance & Insurance (100.0%), and Arts, Entertainment & Recreation (100.0%).
| Industry | Male | Female |
| Agriculture, Fishing & Hunting | 650 (82.7%) | 136 (17.3%) |
| Mining, Quarrying, & Extraction | 2 (100.0%) | 0 (0.0%) |
| Construction | 241 (88.3%) | 32 (11.7%) |
| Manufacturing | 338 (68.7%) | 154 (31.3%) |
| Wholesale Trade | 60 (76.9%) | 18 (23.1%) |
| Retail Trade | 274 (63.9%) | 155 (36.1%) |
| Transportation & Warehousing | 503 (91.0%) | 50 (9.0%) |
| Utilities | 8 (80.0%) | 2 (20.0%) |
| Information | 0 (0.0%) | 13 (100.0%) |
| Finance & Insurance | 0 (0.0%) | 104 (100.0%) |
| Real Estate, Rental & Leasing | 17 (100.0%) | 0 (0.0%) |
| Professional & Scientific | 24 (32.4%) | 50 (67.6%) |
| Enterprise Management | 0 (0.0%) | 0 (0.0%) |
| Administrative & Support | 49 (92.4%) | 4 (7.5%) |
| Educational Services | 52 (34.2%) | 100 (65.8%) |
| Health Care & Social Assistance | 9 (6.7%) | 126 (93.3%) |
| Arts, Entertainment & Recreation | 0 (0.0%) | 14 (100.0%) |
| Accommodation & Food Services | 185 (40.0%) | 278 (60.0%) |
| Public Administration | 63 (37.3%) | 106 (62.7%) |
| Total | 2,482 (64.6%) | 1,357 (35.3%) |
Education in Dallam County
School Enrollment in Dallam County
The most common levels of schooling among the 1,731 students in Dallam County are elementary school (666 | 38.5%), middle school (394 | 22.8%), and high school (324 | 18.7%).
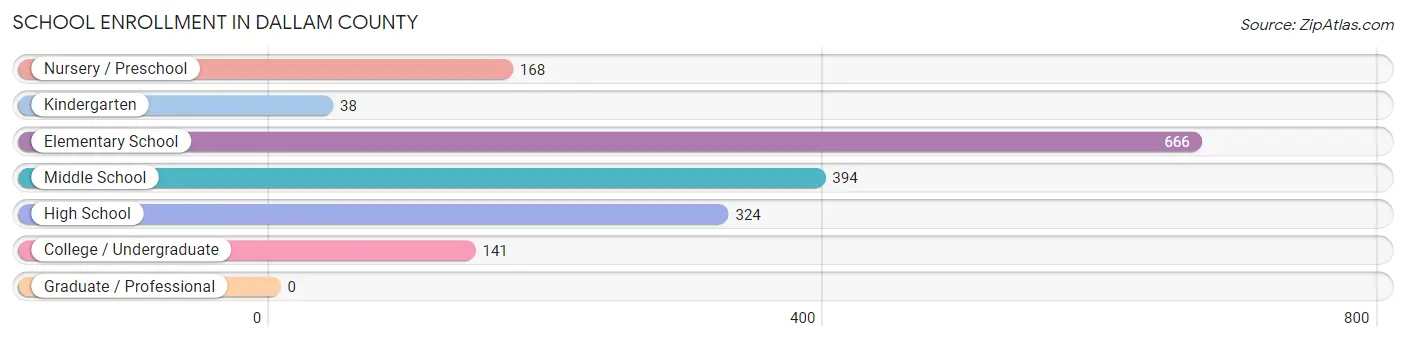
| School Level | # Students | % Students |
| Nursery / Preschool | 168 | 9.7% |
| Kindergarten | 38 | 2.2% |
| Elementary School | 666 | 38.5% |
| Middle School | 394 | 22.8% |
| High School | 324 | 18.7% |
| College / Undergraduate | 141 | 8.2% |
| Graduate / Professional | 0 | 0.0% |
| Total | 1,731 | 100.0% |
School Enrollment by Age by Funding Source in Dallam County
Out of a total of 1,731 students who are enrolled in schools in Dallam County, 339 (19.6%) attend a private institution, while the remaining 1,392 (80.4%) are enrolled in public schools. The age group of 3 to 4 year olds has the highest likelihood of being enrolled in private schools, with 90 (67.7% in the age bracket) enrolled. Conversely, the age group of 18 to 19 year olds has the lowest likelihood of being enrolled in a private school, with 58 (100.0% in the age bracket) attending a public institution.
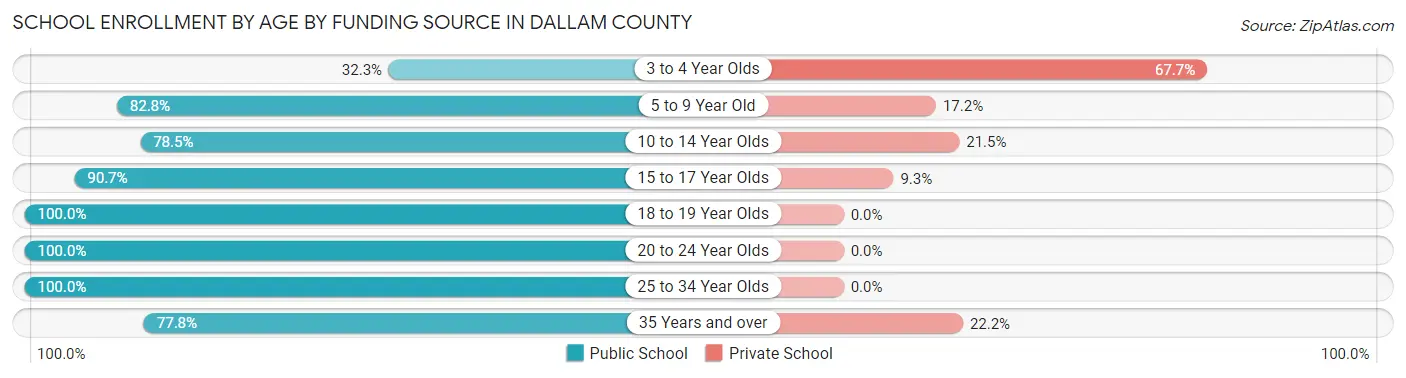
| Age Bracket | Public School | Private School |
| 3 to 4 Year Olds | 43 (32.3%) | 90 (67.7%) |
| 5 to 9 Year Old | 583 (82.8%) | 121 (17.2%) |
| 10 to 14 Year Olds | 368 (78.5%) | 101 (21.5%) |
| 15 to 17 Year Olds | 235 (90.7%) | 24 (9.3%) |
| 18 to 19 Year Olds | 58 (100.0%) | 0 (0.0%) |
| 20 to 24 Year Olds | 12 (100.0%) | 0 (0.0%) |
| 25 to 34 Year Olds | 78 (100.0%) | 0 (0.0%) |
| 35 Years and over | 14 (77.8%) | 4 (22.2%) |
| Total | 1,392 (80.4%) | 339 (19.6%) |
Educational Attainment by Field of Study in Dallam County
Arts & humanities (153 | 23.4%), psychology (90 | 13.8%), literature & languages (69 | 10.6%), engineering (55 | 8.4%), and communications (52 | 8.0%) are the most common fields of study among 653 individuals in Dallam County who have obtained a bachelor's degree or higher.
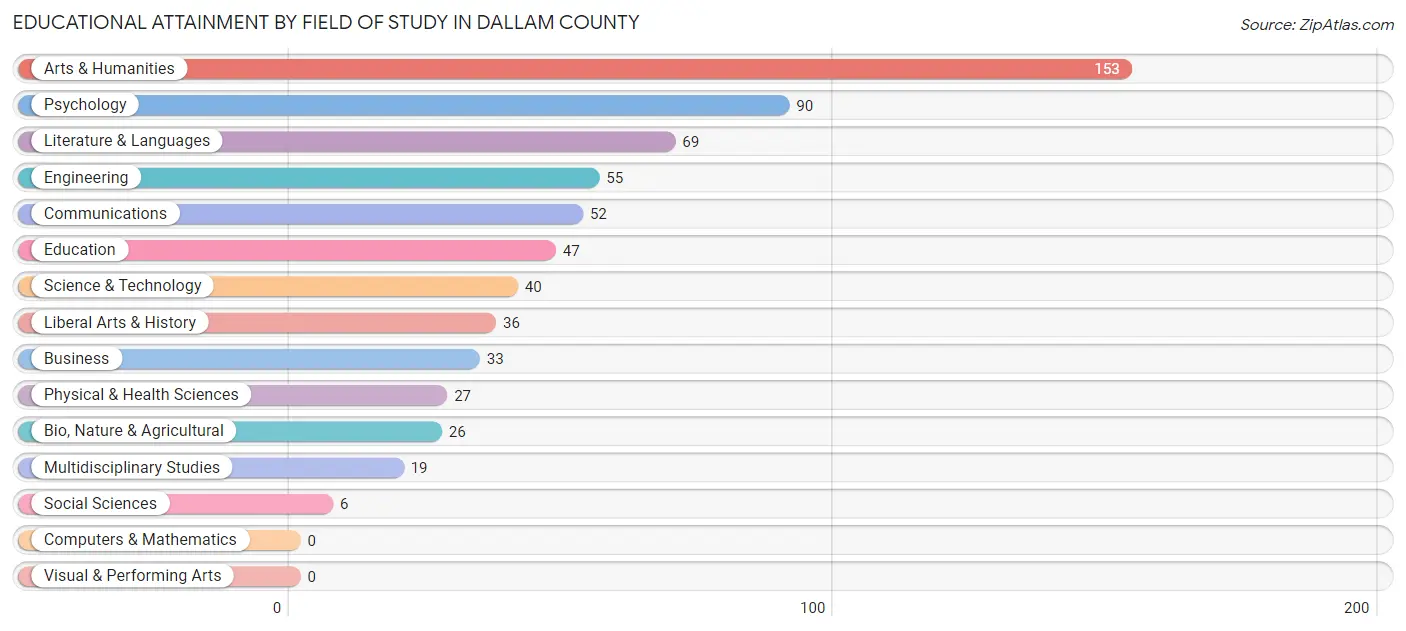
| Field of Study | # Graduates | % Graduates |
| Computers & Mathematics | 0 | 0.0% |
| Bio, Nature & Agricultural | 26 | 4.0% |
| Physical & Health Sciences | 27 | 4.1% |
| Psychology | 90 | 13.8% |
| Social Sciences | 6 | 0.9% |
| Engineering | 55 | 8.4% |
| Multidisciplinary Studies | 19 | 2.9% |
| Science & Technology | 40 | 6.1% |
| Business | 33 | 5.1% |
| Education | 47 | 7.2% |
| Literature & Languages | 69 | 10.6% |
| Liberal Arts & History | 36 | 5.5% |
| Visual & Performing Arts | 0 | 0.0% |
| Communications | 52 | 8.0% |
| Arts & Humanities | 153 | 23.4% |
| Total | 653 | 100.0% |
Transportation & Commute in Dallam County
Vehicle Availability by Sex in Dallam County
The most prevalent vehicle ownership categories in Dallam County are males with 2 vehicles (756, accounting for 30.7%) and females with 2 vehicles (415, making up 55.8%).
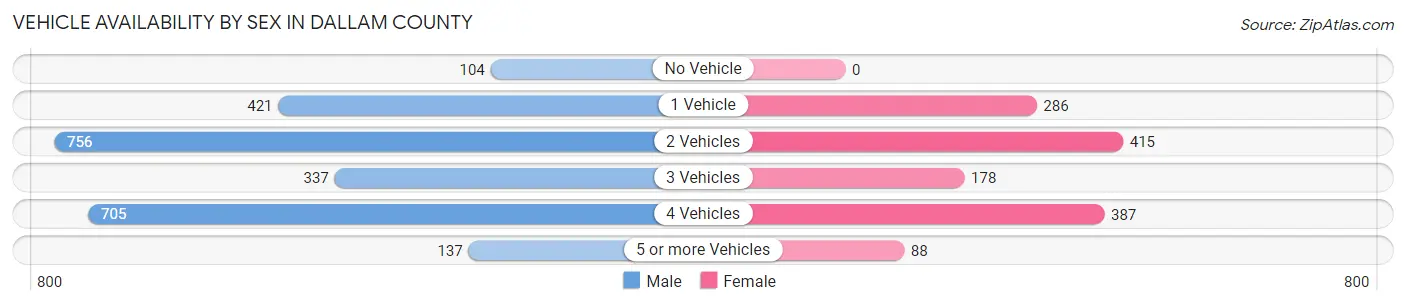
| Vehicles Available | Male | Female |
| No Vehicle | 104 (4.2%) | 0 (0.0%) |
| 1 Vehicle | 421 (17.1%) | 286 (21.1%) |
| 2 Vehicles | 756 (30.7%) | 415 (30.6%) |
| 3 Vehicles | 337 (13.7%) | 178 (13.2%) |
| 4 Vehicles | 705 (28.7%) | 387 (28.6%) |
| 5 or more Vehicles | 137 (5.6%) | 88 (6.5%) |
| Total | 2,460 (100.0%) | 1,354 (100.0%) |
Commute Time in Dallam County
The most frequently occuring commute durations in Dallam County are 5 to 9 minutes (1,687 commuters, 44.8%), 10 to 14 minutes (647 commuters, 17.2%), and 15 to 19 minutes (358 commuters, 9.5%).
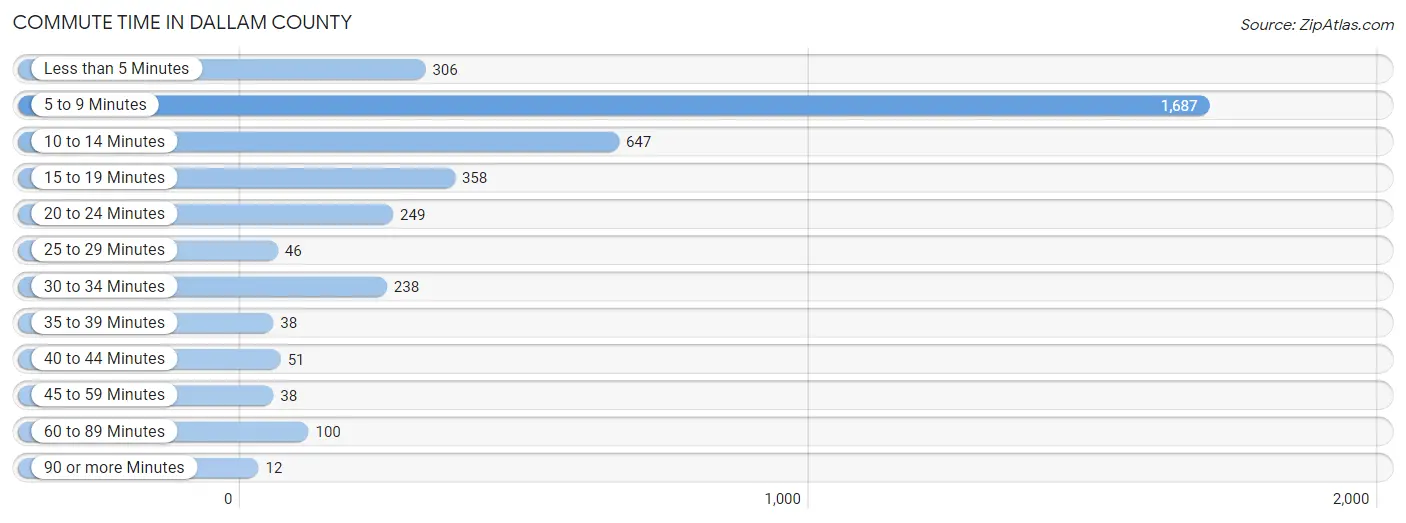
| Commute Time | # Commuters | % Commuters |
| Less than 5 Minutes | 306 | 8.1% |
| 5 to 9 Minutes | 1,687 | 44.8% |
| 10 to 14 Minutes | 647 | 17.2% |
| 15 to 19 Minutes | 358 | 9.5% |
| 20 to 24 Minutes | 249 | 6.6% |
| 25 to 29 Minutes | 46 | 1.2% |
| 30 to 34 Minutes | 238 | 6.3% |
| 35 to 39 Minutes | 38 | 1.0% |
| 40 to 44 Minutes | 51 | 1.3% |
| 45 to 59 Minutes | 38 | 1.0% |
| 60 to 89 Minutes | 100 | 2.6% |
| 90 or more Minutes | 12 | 0.3% |
Commute Time by Sex in Dallam County
The most common commute times in Dallam County are 5 to 9 minutes (1,126 commuters, 45.8%) for males and 5 to 9 minutes (561 commuters, 42.7%) for females.
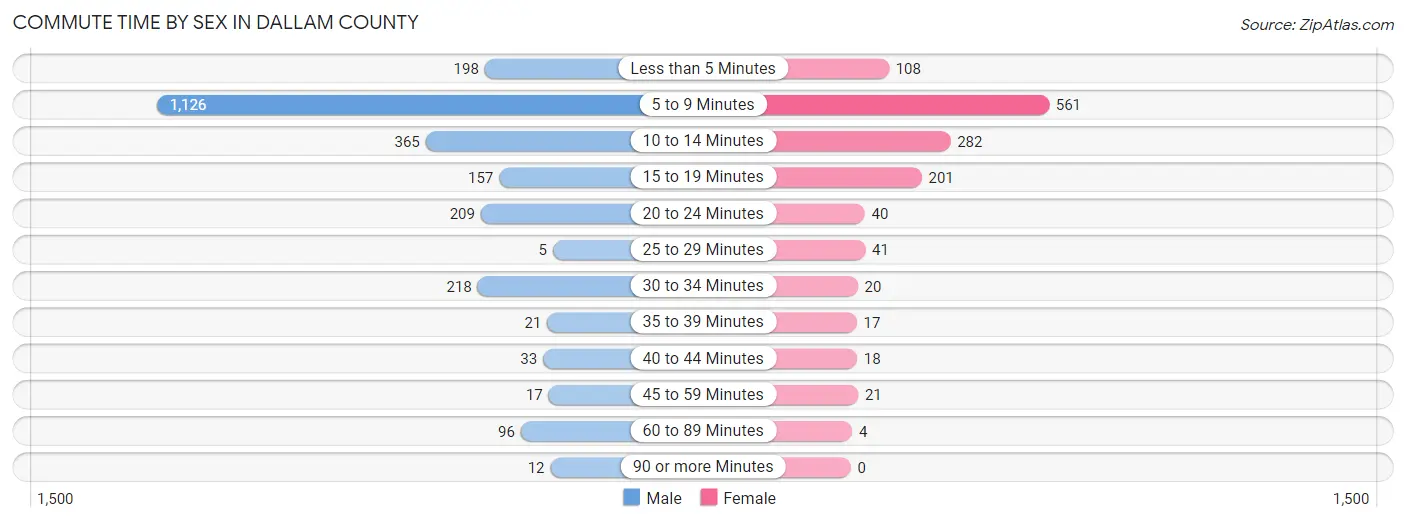
| Commute Time | Male | Female |
| Less than 5 Minutes | 198 (8.1%) | 108 (8.2%) |
| 5 to 9 Minutes | 1,126 (45.8%) | 561 (42.7%) |
| 10 to 14 Minutes | 365 (14.9%) | 282 (21.5%) |
| 15 to 19 Minutes | 157 (6.4%) | 201 (15.3%) |
| 20 to 24 Minutes | 209 (8.5%) | 40 (3.0%) |
| 25 to 29 Minutes | 5 (0.2%) | 41 (3.1%) |
| 30 to 34 Minutes | 218 (8.9%) | 20 (1.5%) |
| 35 to 39 Minutes | 21 (0.9%) | 17 (1.3%) |
| 40 to 44 Minutes | 33 (1.3%) | 18 (1.4%) |
| 45 to 59 Minutes | 17 (0.7%) | 21 (1.6%) |
| 60 to 89 Minutes | 96 (3.9%) | 4 (0.3%) |
| 90 or more Minutes | 12 (0.5%) | 0 (0.0%) |
Time of Departure to Work by Sex in Dallam County
The most frequent times of departure to work in Dallam County are 7:30 AM to 7:59 AM (509, 20.7%) for males and 12:00 PM to 3:59 PM (305, 23.2%) for females.
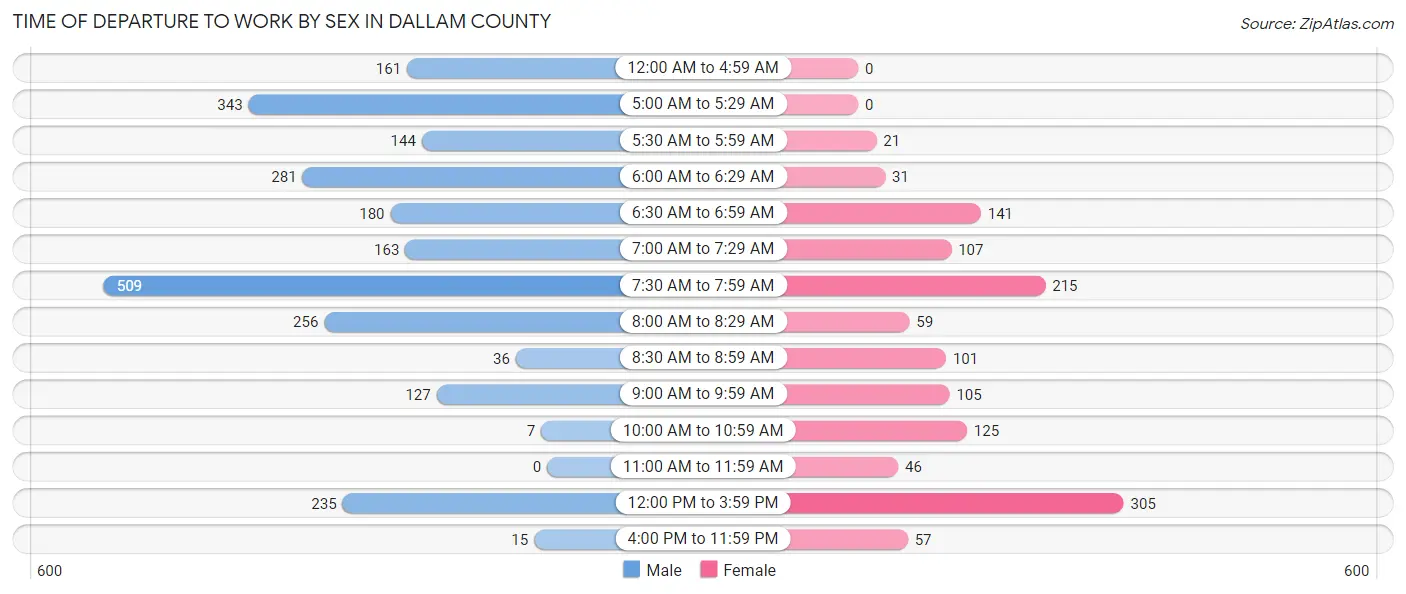
| Time of Departure | Male | Female |
| 12:00 AM to 4:59 AM | 161 (6.6%) | 0 (0.0%) |
| 5:00 AM to 5:29 AM | 343 (14.0%) | 0 (0.0%) |
| 5:30 AM to 5:59 AM | 144 (5.9%) | 21 (1.6%) |
| 6:00 AM to 6:29 AM | 281 (11.4%) | 31 (2.4%) |
| 6:30 AM to 6:59 AM | 180 (7.3%) | 141 (10.7%) |
| 7:00 AM to 7:29 AM | 163 (6.6%) | 107 (8.2%) |
| 7:30 AM to 7:59 AM | 509 (20.7%) | 215 (16.4%) |
| 8:00 AM to 8:29 AM | 256 (10.4%) | 59 (4.5%) |
| 8:30 AM to 8:59 AM | 36 (1.5%) | 101 (7.7%) |
| 9:00 AM to 9:59 AM | 127 (5.2%) | 105 (8.0%) |
| 10:00 AM to 10:59 AM | 7 (0.3%) | 125 (9.5%) |
| 11:00 AM to 11:59 AM | 0 (0.0%) | 46 (3.5%) |
| 12:00 PM to 3:59 PM | 235 (9.6%) | 305 (23.2%) |
| 4:00 PM to 11:59 PM | 15 (0.6%) | 57 (4.3%) |
| Total | 2,457 (100.0%) | 1,313 (100.0%) |
Housing Occupancy in Dallam County
Occupancy by Ownership in Dallam County
Of the total 2,333 dwellings in Dallam County, owner-occupied units account for 1,672 (71.7%), while renter-occupied units make up 661 (28.3%).
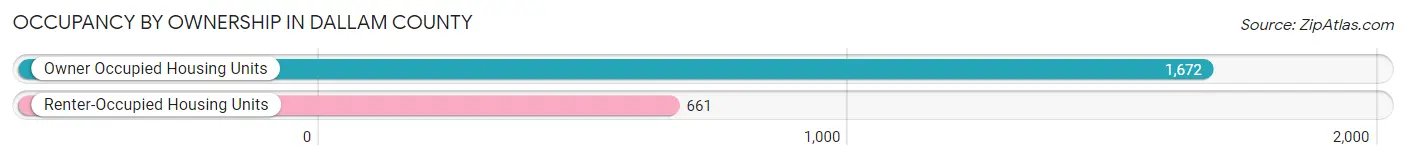
| Occupancy | # Housing Units | % Housing Units |
| Owner Occupied Housing Units | 1,672 | 71.7% |
| Renter-Occupied Housing Units | 661 | 28.3% |
| Total Occupied Housing Units | 2,333 | 100.0% |
Occupancy by Household Size in Dallam County
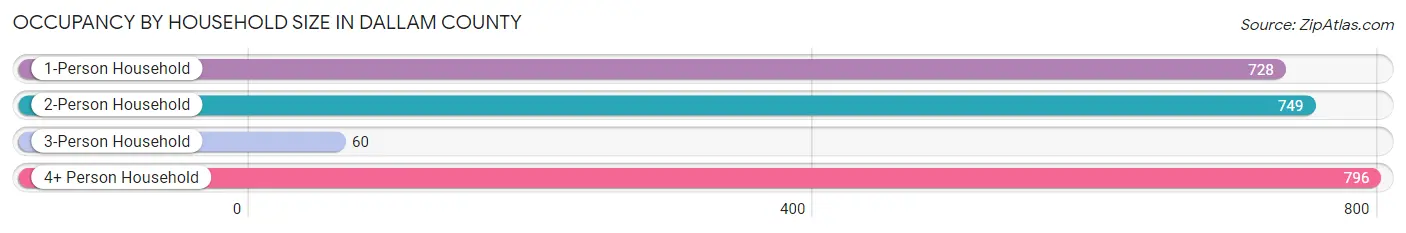
| Household Size | # Housing Units | % Housing Units |
| 1-Person Household | 728 | 31.2% |
| 2-Person Household | 749 | 32.1% |
| 3-Person Household | 60 | 2.6% |
| 4+ Person Household | 796 | 34.1% |
| Total Housing Units | 2,333 | 100.0% |
Occupancy by Ownership by Household Size in Dallam County
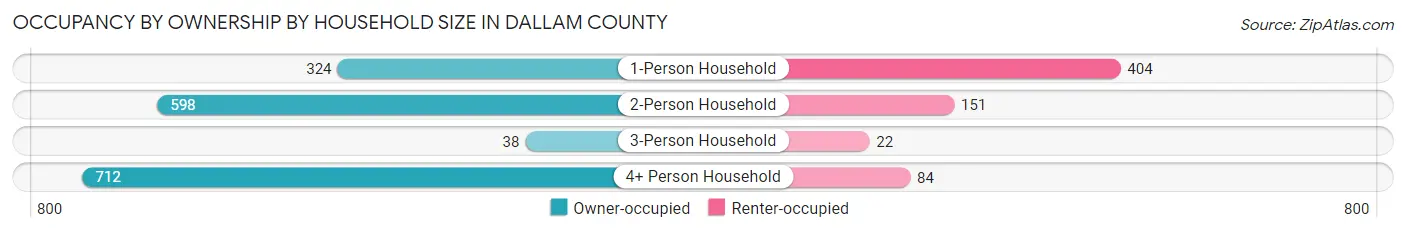
| Household Size | Owner-occupied | Renter-occupied |
| 1-Person Household | 324 (44.5%) | 404 (55.5%) |
| 2-Person Household | 598 (79.8%) | 151 (20.2%) |
| 3-Person Household | 38 (63.3%) | 22 (36.7%) |
| 4+ Person Household | 712 (89.4%) | 84 (10.5%) |
| Total Housing Units | 1,672 (71.7%) | 661 (28.3%) |
Occupancy by Educational Attainment in Dallam County
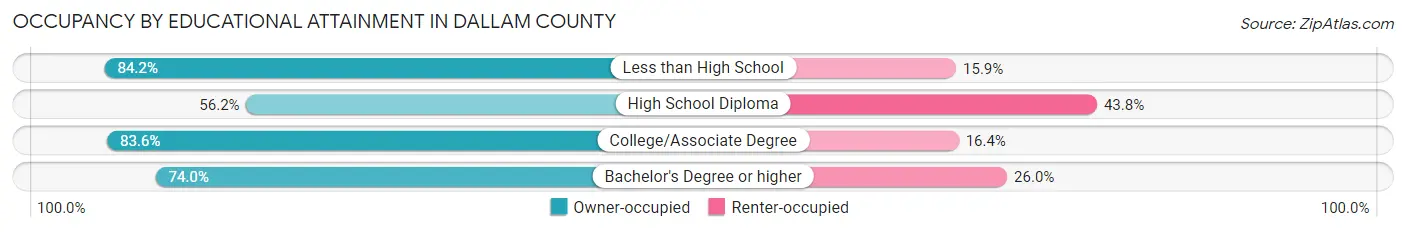
| Household Size | Owner-occupied | Renter-occupied |
| Less than High School | 430 (84.2%) | 81 (15.9%) |
| High School Diploma | 502 (56.2%) | 391 (43.8%) |
| College/Associate Degree | 455 (83.6%) | 89 (16.4%) |
| Bachelor's Degree or higher | 285 (74.0%) | 100 (26.0%) |
Occupancy by Age of Householder in Dallam County
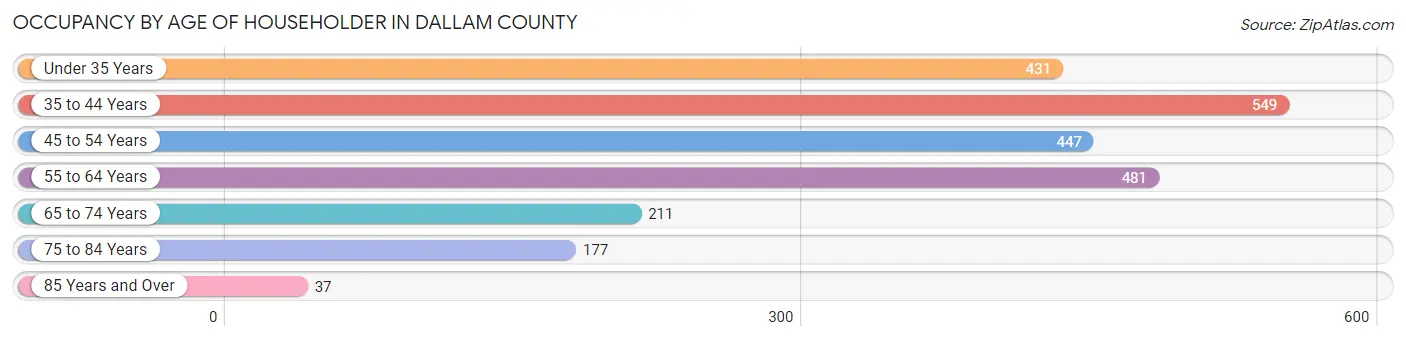
| Age Bracket | # Households | % Households |
| Under 35 Years | 431 | 18.5% |
| 35 to 44 Years | 549 | 23.5% |
| 45 to 54 Years | 447 | 19.2% |
| 55 to 64 Years | 481 | 20.6% |
| 65 to 74 Years | 211 | 9.0% |
| 75 to 84 Years | 177 | 7.6% |
| 85 Years and Over | 37 | 1.6% |
| Total | 2,333 | 100.0% |
Housing Finances in Dallam County
Median Income by Occupancy in Dallam County
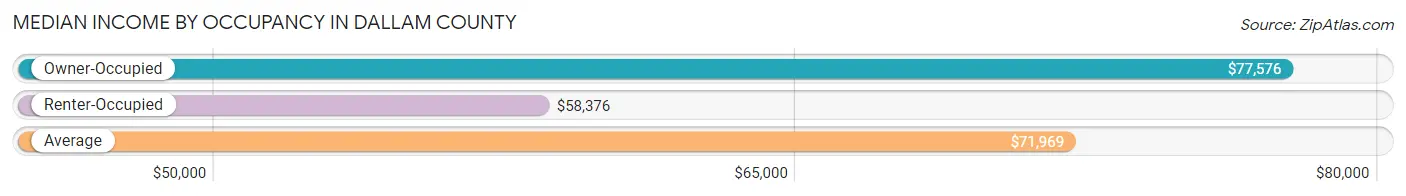
| Occupancy Type | # Households | Median Income |
| Owner-Occupied | 1,672 (71.7%) | $77,576 |
| Renter-Occupied | 661 (28.3%) | $58,376 |
| Average | 2,333 (100.0%) | $71,969 |
Occupancy by Householder Income Bracket in Dallam County
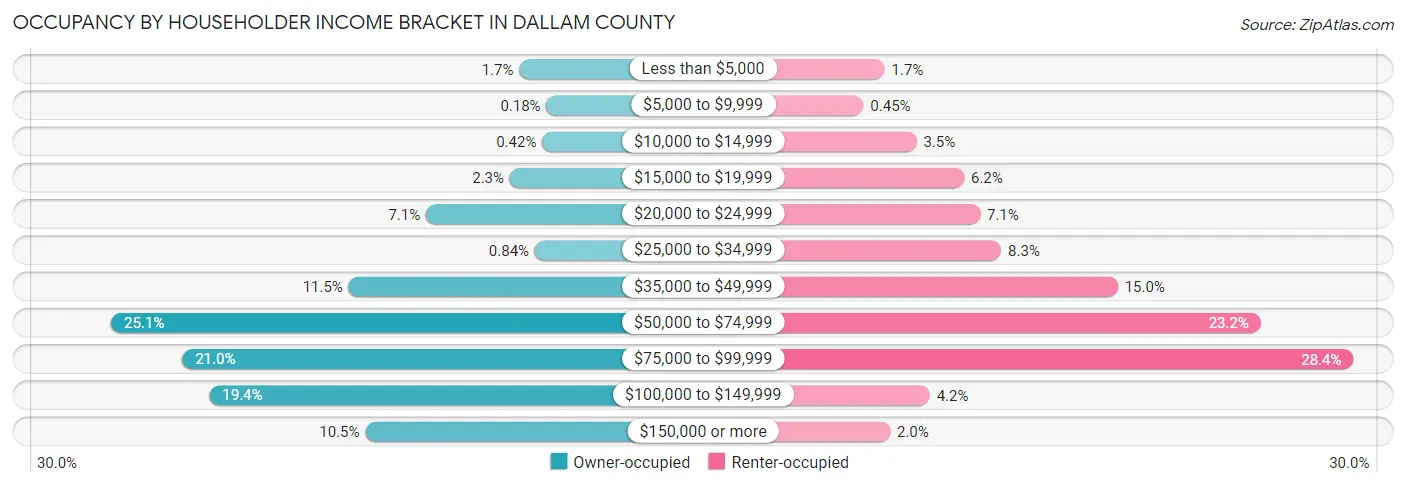
| Income Bracket | Owner-occupied | Renter-occupied |
| Less than $5,000 | 29 (1.7%) | 11 (1.7%) |
| $5,000 to $9,999 | 3 (0.2%) | 3 (0.4%) |
| $10,000 to $14,999 | 7 (0.4%) | 23 (3.5%) |
| $15,000 to $19,999 | 38 (2.3%) | 41 (6.2%) |
| $20,000 to $24,999 | 118 (7.1%) | 47 (7.1%) |
| $25,000 to $34,999 | 14 (0.8%) | 55 (8.3%) |
| $35,000 to $49,999 | 192 (11.5%) | 99 (15.0%) |
| $50,000 to $74,999 | 419 (25.1%) | 153 (23.2%) |
| $75,000 to $99,999 | 351 (21.0%) | 188 (28.4%) |
| $100,000 to $149,999 | 325 (19.4%) | 28 (4.2%) |
| $150,000 or more | 176 (10.5%) | 13 (2.0%) |
| Total | 1,672 (100.0%) | 661 (100.0%) |
Monthly Housing Cost Tiers in Dallam County
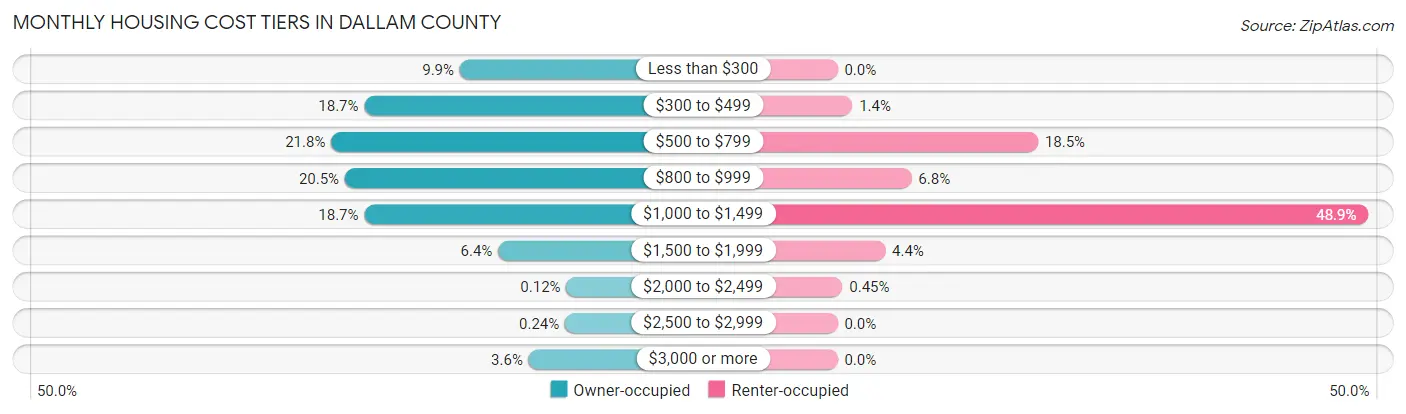
| Monthly Cost | Owner-occupied | Renter-occupied |
| Less than $300 | 166 (9.9%) | 0 (0.0%) |
| $300 to $499 | 313 (18.7%) | 9 (1.4%) |
| $500 to $799 | 364 (21.8%) | 122 (18.5%) |
| $800 to $999 | 343 (20.5%) | 45 (6.8%) |
| $1,000 to $1,499 | 313 (18.7%) | 323 (48.9%) |
| $1,500 to $1,999 | 107 (6.4%) | 29 (4.4%) |
| $2,000 to $2,499 | 2 (0.1%) | 3 (0.4%) |
| $2,500 to $2,999 | 4 (0.2%) | 0 (0.0%) |
| $3,000 or more | 60 (3.6%) | 0 (0.0%) |
| Total | 1,672 (100.0%) | 661 (100.0%) |
Physical Housing Characteristics in Dallam County
Housing Structures in Dallam County
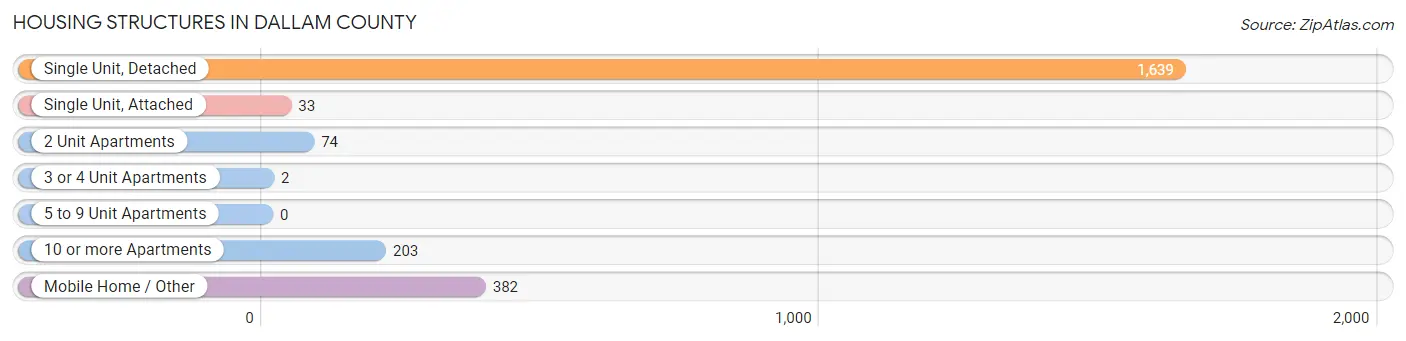
| Structure Type | # Housing Units | % Housing Units |
| Single Unit, Detached | 1,639 | 70.3% |
| Single Unit, Attached | 33 | 1.4% |
| 2 Unit Apartments | 74 | 3.2% |
| 3 or 4 Unit Apartments | 2 | 0.1% |
| 5 to 9 Unit Apartments | 0 | 0.0% |
| 10 or more Apartments | 203 | 8.7% |
| Mobile Home / Other | 382 | 16.4% |
| Total | 2,333 | 100.0% |
Housing Structures by Occupancy in Dallam County
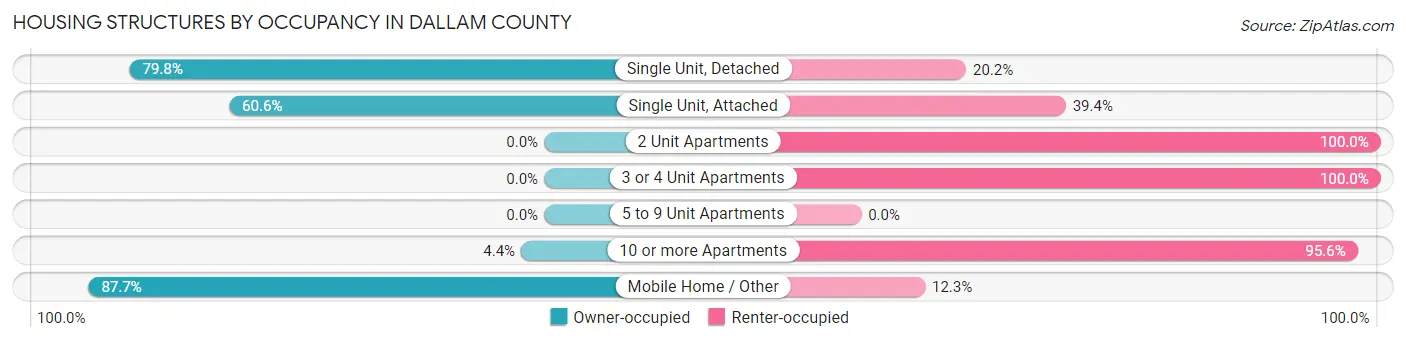
| Structure Type | Owner-occupied | Renter-occupied |
| Single Unit, Detached | 1,308 (79.8%) | 331 (20.2%) |
| Single Unit, Attached | 20 (60.6%) | 13 (39.4%) |
| 2 Unit Apartments | 0 (0.0%) | 74 (100.0%) |
| 3 or 4 Unit Apartments | 0 (0.0%) | 2 (100.0%) |
| 5 to 9 Unit Apartments | 0 (0.0%) | 0 (0.0%) |
| 10 or more Apartments | 9 (4.4%) | 194 (95.6%) |
| Mobile Home / Other | 335 (87.7%) | 47 (12.3%) |
| Total | 1,672 (71.7%) | 661 (28.3%) |
Housing Structures by Number of Rooms in Dallam County
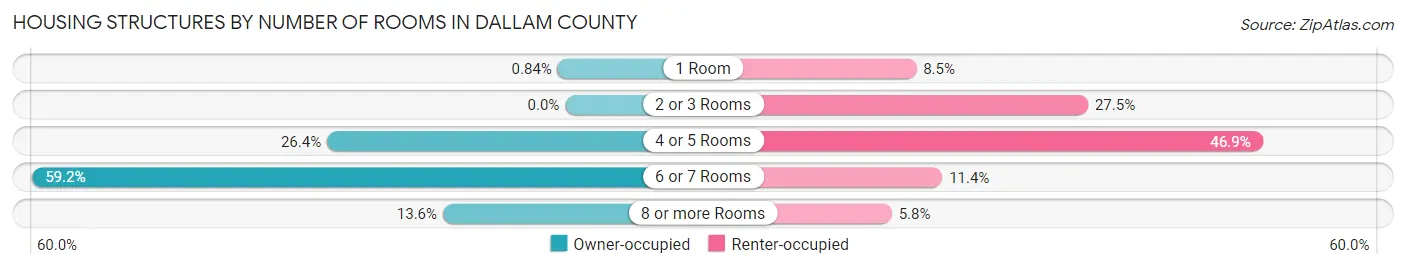
| Number of Rooms | Owner-occupied | Renter-occupied |
| 1 Room | 14 (0.8%) | 56 (8.5%) |
| 2 or 3 Rooms | 0 (0.0%) | 182 (27.5%) |
| 4 or 5 Rooms | 442 (26.4%) | 310 (46.9%) |
| 6 or 7 Rooms | 989 (59.2%) | 75 (11.4%) |
| 8 or more Rooms | 227 (13.6%) | 38 (5.8%) |
| Total | 1,672 (100.0%) | 661 (100.0%) |
Housing Structure by Heating Type in Dallam County
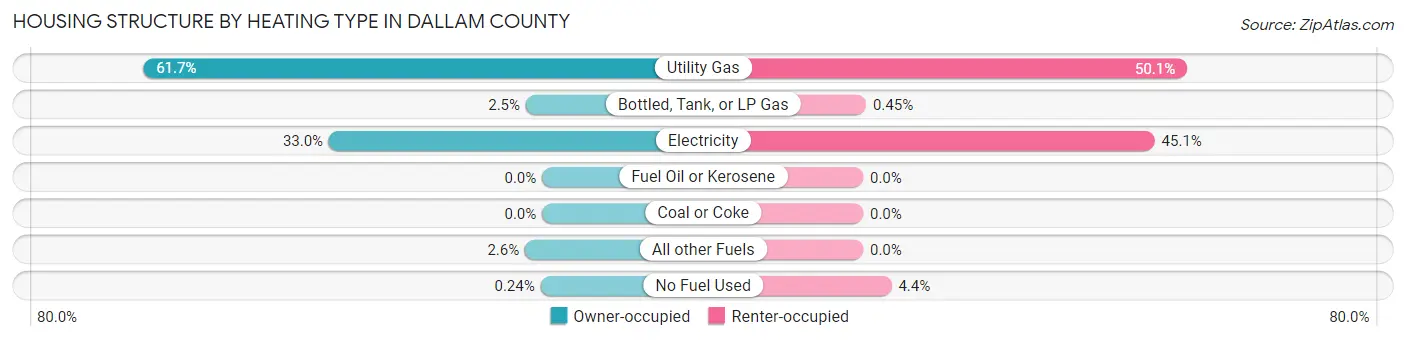
| Heating Type | Owner-occupied | Renter-occupied |
| Utility Gas | 1,031 (61.7%) | 331 (50.1%) |
| Bottled, Tank, or LP Gas | 42 (2.5%) | 3 (0.4%) |
| Electricity | 551 (33.0%) | 298 (45.1%) |
| Fuel Oil or Kerosene | 0 (0.0%) | 0 (0.0%) |
| Coal or Coke | 0 (0.0%) | 0 (0.0%) |
| All other Fuels | 44 (2.6%) | 0 (0.0%) |
| No Fuel Used | 4 (0.2%) | 29 (4.4%) |
| Total | 1,672 (100.0%) | 661 (100.0%) |
Household Vehicle Usage in Dallam County
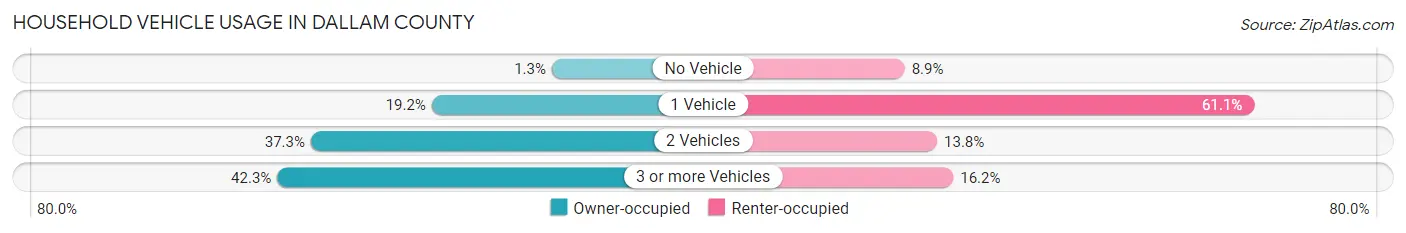
| Vehicles per Household | Owner-occupied | Renter-occupied |
| No Vehicle | 21 (1.3%) | 59 (8.9%) |
| 1 Vehicle | 321 (19.2%) | 404 (61.1%) |
| 2 Vehicles | 623 (37.3%) | 91 (13.8%) |
| 3 or more Vehicles | 707 (42.3%) | 107 (16.2%) |
| Total | 1,672 (100.0%) | 661 (100.0%) |
Real Estate & Mortgages in Dallam County
Real Estate and Mortgage Overview in Dallam County
| Characteristic | Without Mortgage | With Mortgage |
| Housing Units | 873 | 799 |
| Median Property Value | $114,400 | $113,600 |
| Median Household Income | $58,865 | $155 |
| Monthly Housing Costs | $451 | $60 |
| Real Estate Taxes | $980 | $39 |
Property Value by Mortgage Status in Dallam County
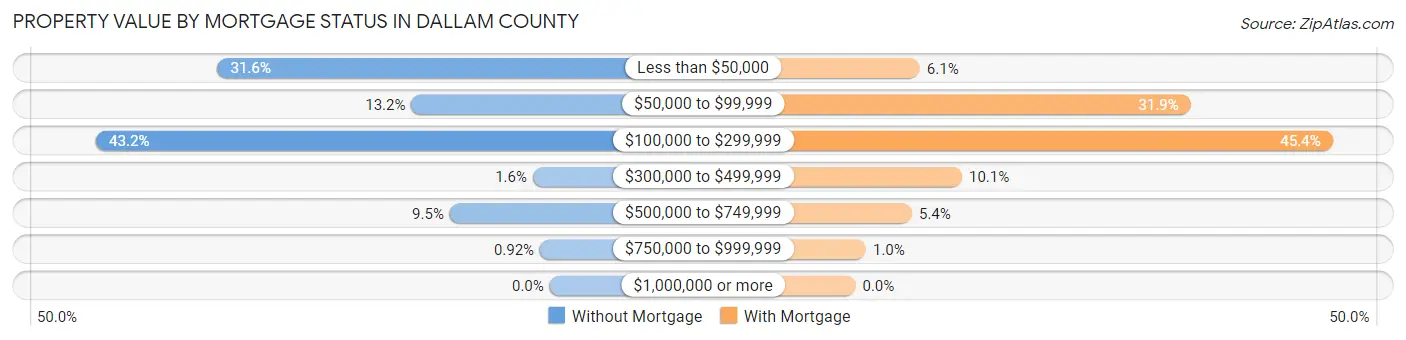
| Property Value | Without Mortgage | With Mortgage |
| Less than $50,000 | 276 (31.6%) | 49 (6.1%) |
| $50,000 to $99,999 | 115 (13.2%) | 255 (31.9%) |
| $100,000 to $299,999 | 377 (43.2%) | 363 (45.4%) |
| $300,000 to $499,999 | 14 (1.6%) | 81 (10.1%) |
| $500,000 to $749,999 | 83 (9.5%) | 43 (5.4%) |
| $750,000 to $999,999 | 8 (0.9%) | 8 (1.0%) |
| $1,000,000 or more | 0 (0.0%) | 0 (0.0%) |
| Total | 873 (100.0%) | 799 (100.0%) |
Household Income by Mortgage Status in Dallam County
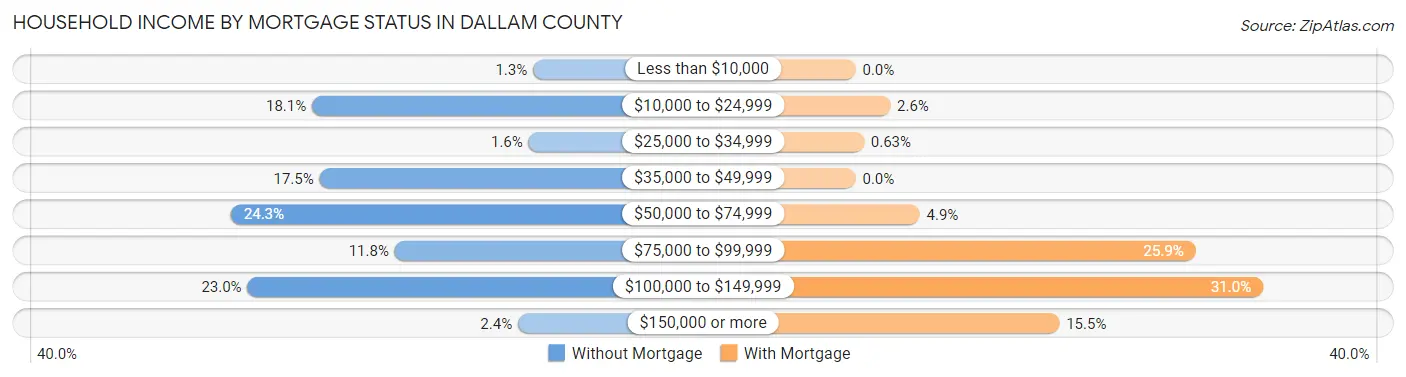
| Household Income | Without Mortgage | With Mortgage |
| Less than $10,000 | 11 (1.3%) | 0 (0.0%) |
| $10,000 to $24,999 | 158 (18.1%) | 21 (2.6%) |
| $25,000 to $34,999 | 14 (1.6%) | 5 (0.6%) |
| $35,000 to $49,999 | 153 (17.5%) | 0 (0.0%) |
| $50,000 to $74,999 | 212 (24.3%) | 39 (4.9%) |
| $75,000 to $99,999 | 103 (11.8%) | 207 (25.9%) |
| $100,000 to $149,999 | 201 (23.0%) | 248 (31.0%) |
| $150,000 or more | 21 (2.4%) | 124 (15.5%) |
| Total | 873 (100.0%) | 799 (100.0%) |
Property Value to Household Income Ratio in Dallam County
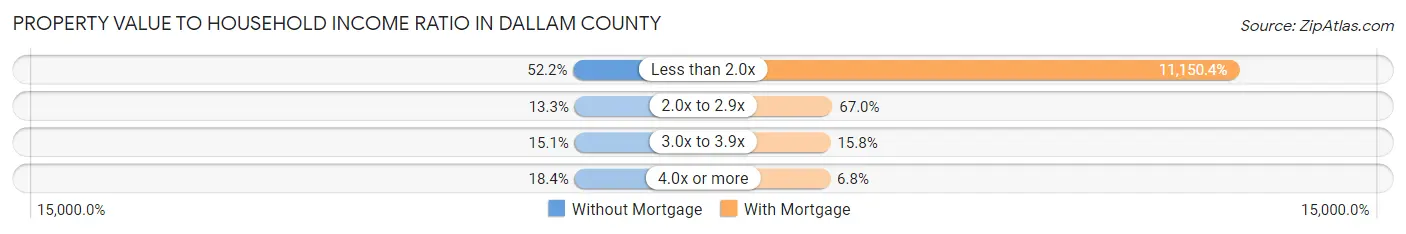
| Value-to-Income Ratio | Without Mortgage | With Mortgage |
| Less than 2.0x | 456 (52.2%) | 89,092 (11,150.4%) |
| 2.0x to 2.9x | 116 (13.3%) | 535 (67.0%) |
| 3.0x to 3.9x | 132 (15.1%) | 126 (15.8%) |
| 4.0x or more | 161 (18.4%) | 54 (6.8%) |
| Total | 873 (100.0%) | 799 (100.0%) |
Real Estate Taxes by Mortgage Status in Dallam County
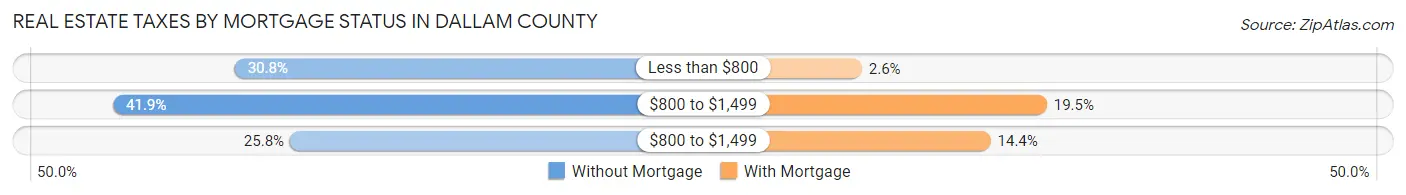
| Property Taxes | Without Mortgage | With Mortgage |
| Less than $800 | 269 (30.8%) | 21 (2.6%) |
| $800 to $1,499 | 366 (41.9%) | 156 (19.5%) |
| $800 to $1,499 | 225 (25.8%) | 115 (14.4%) |
| Total | 873 (100.0%) | 799 (100.0%) |
Health & Disability in Dallam County
Health Insurance Coverage by Age in Dallam County
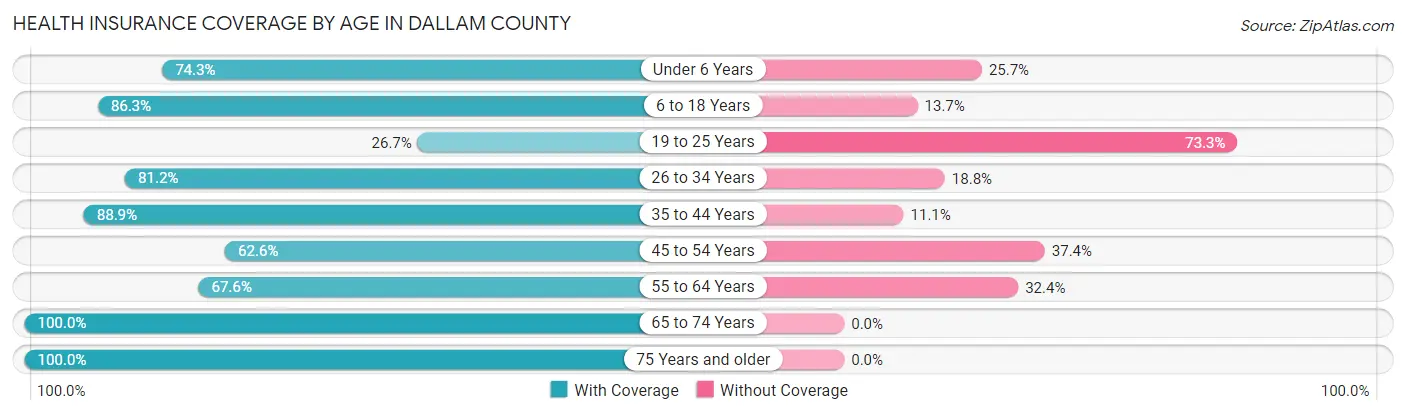
| Age Bracket | With Coverage | Without Coverage |
| Under 6 Years | 524 (74.3%) | 181 (25.7%) |
| 6 to 18 Years | 1,446 (86.3%) | 229 (13.7%) |
| 19 to 25 Years | 203 (26.7%) | 557 (73.3%) |
| 26 to 34 Years | 511 (81.2%) | 118 (18.8%) |
| 35 to 44 Years | 804 (88.9%) | 100 (11.1%) |
| 45 to 54 Years | 574 (62.6%) | 343 (37.4%) |
| 55 to 64 Years | 579 (67.6%) | 278 (32.4%) |
| 65 to 74 Years | 432 (100.0%) | 0 (0.0%) |
| 75 Years and older | 249 (100.0%) | 0 (0.0%) |
| Total | 5,322 (74.7%) | 1,806 (25.3%) |
Health Insurance Coverage by Citizenship Status in Dallam County
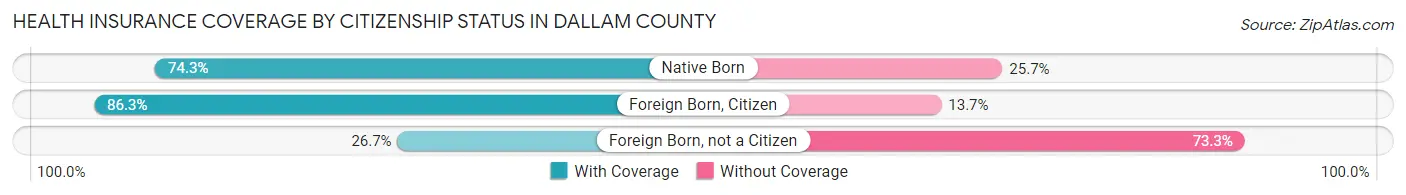
| Citizenship Status | With Coverage | Without Coverage |
| Native Born | 524 (74.3%) | 181 (25.7%) |
| Foreign Born, Citizen | 1,446 (86.3%) | 229 (13.7%) |
| Foreign Born, not a Citizen | 203 (26.7%) | 557 (73.3%) |
Health Insurance Coverage by Household Income in Dallam County
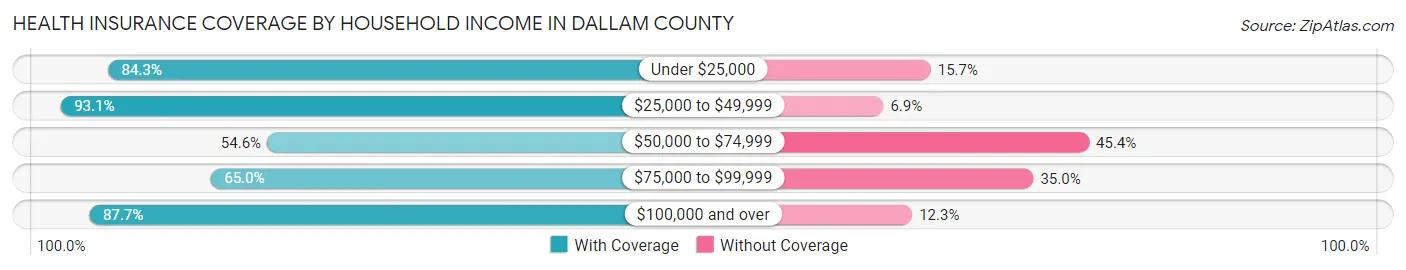
| Household Income | With Coverage | Without Coverage |
| Under $25,000 | 423 (84.3%) | 79 (15.7%) |
| $25,000 to $49,999 | 962 (93.1%) | 71 (6.9%) |
| $50,000 to $74,999 | 795 (54.6%) | 661 (45.4%) |
| $75,000 to $99,999 | 1,394 (65.0%) | 750 (35.0%) |
| $100,000 and over | 1,746 (87.7%) | 244 (12.3%) |
Public vs Private Health Insurance Coverage by Age in Dallam County
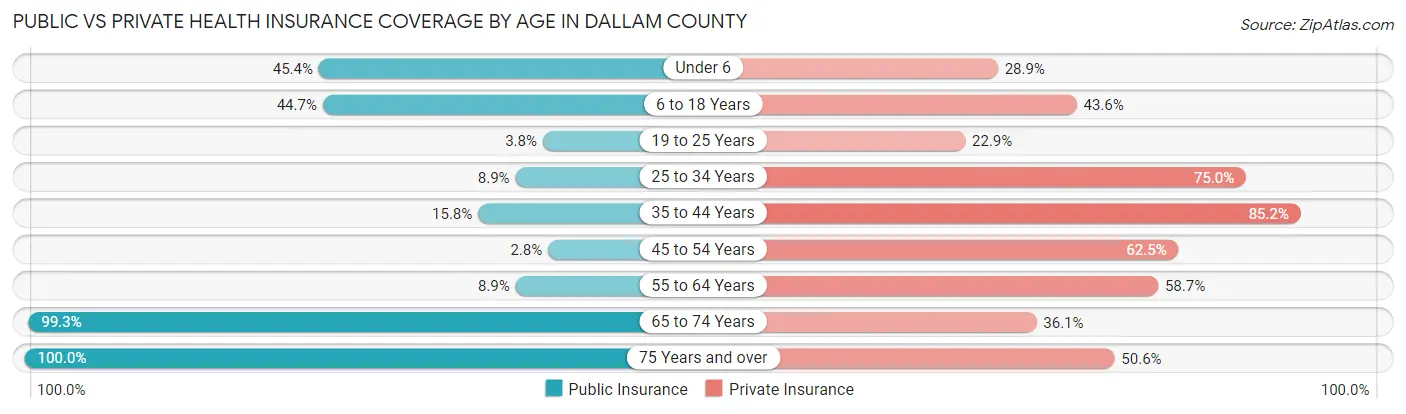
| Age Bracket | Public Insurance | Private Insurance |
| Under 6 | 320 (45.4%) | 204 (28.9%) |
| 6 to 18 Years | 748 (44.7%) | 730 (43.6%) |
| 19 to 25 Years | 29 (3.8%) | 174 (22.9%) |
| 25 to 34 Years | 56 (8.9%) | 472 (75.0%) |
| 35 to 44 Years | 143 (15.8%) | 770 (85.2%) |
| 45 to 54 Years | 26 (2.8%) | 573 (62.5%) |
| 55 to 64 Years | 76 (8.9%) | 503 (58.7%) |
| 65 to 74 Years | 429 (99.3%) | 156 (36.1%) |
| 75 Years and over | 249 (100.0%) | 126 (50.6%) |
| Total | 2,076 (29.1%) | 3,708 (52.0%) |
Disability Status by Sex by Age in Dallam County
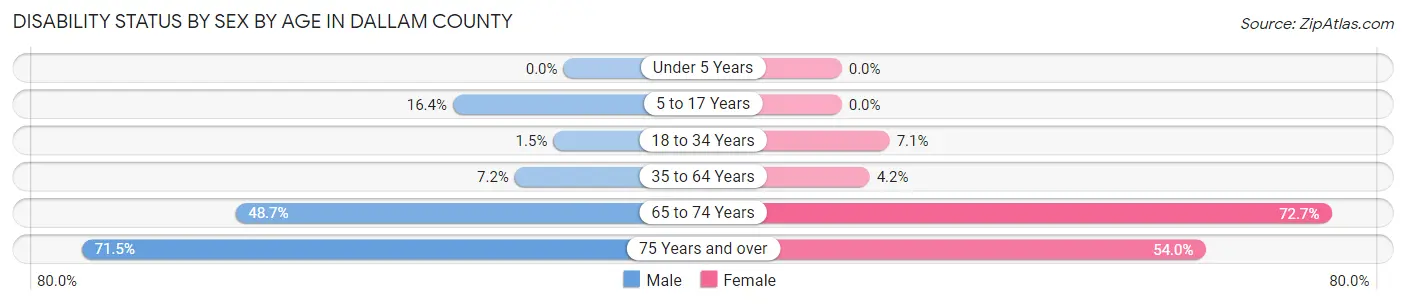
| Age Bracket | Male | Female |
| Under 5 Years | 0 (0.0%) | 0 (0.0%) |
| 5 to 17 Years | 129 (16.4%) | 0 (0.0%) |
| 18 to 34 Years | 13 (1.5%) | 45 (7.1%) |
| 35 to 64 Years | 110 (7.2%) | 48 (4.2%) |
| 65 to 74 Years | 132 (48.7%) | 117 (72.7%) |
| 75 Years and over | 88 (71.5%) | 68 (54.0%) |
Disability Class by Sex by Age in Dallam County
Disability Class: Hearing Difficulty
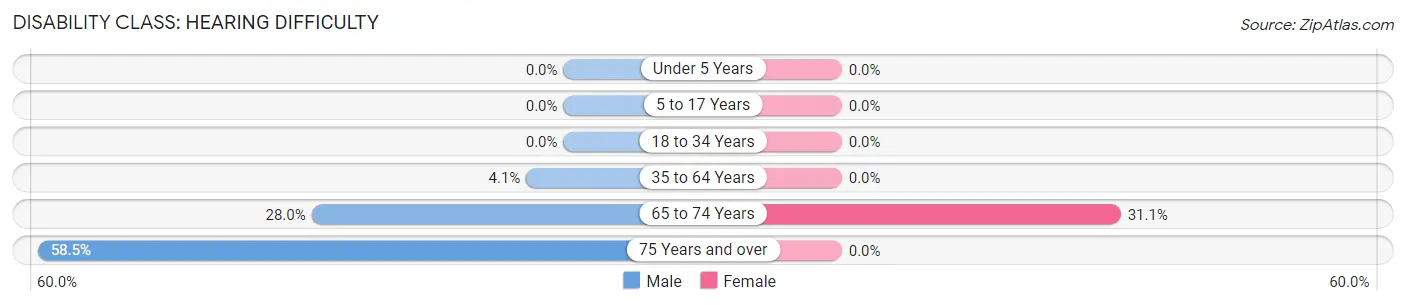
| Age Bracket | Male | Female |
| Under 5 Years | 0 (0.0%) | 0 (0.0%) |
| 5 to 17 Years | 0 (0.0%) | 0 (0.0%) |
| 18 to 34 Years | 0 (0.0%) | 0 (0.0%) |
| 35 to 64 Years | 63 (4.1%) | 0 (0.0%) |
| 65 to 74 Years | 76 (28.0%) | 50 (31.1%) |
| 75 Years and over | 72 (58.5%) | 0 (0.0%) |
Disability Class: Vision Difficulty
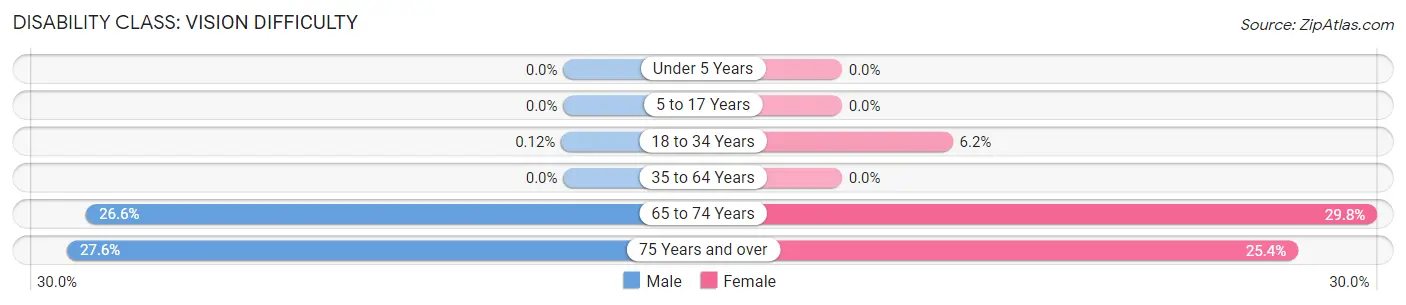
| Age Bracket | Male | Female |
| Under 5 Years | 0 (0.0%) | 0 (0.0%) |
| 5 to 17 Years | 0 (0.0%) | 0 (0.0%) |
| 18 to 34 Years | 1 (0.1%) | 39 (6.2%) |
| 35 to 64 Years | 0 (0.0%) | 0 (0.0%) |
| 65 to 74 Years | 72 (26.6%) | 48 (29.8%) |
| 75 Years and over | 34 (27.6%) | 32 (25.4%) |
Disability Class: Cognitive Difficulty
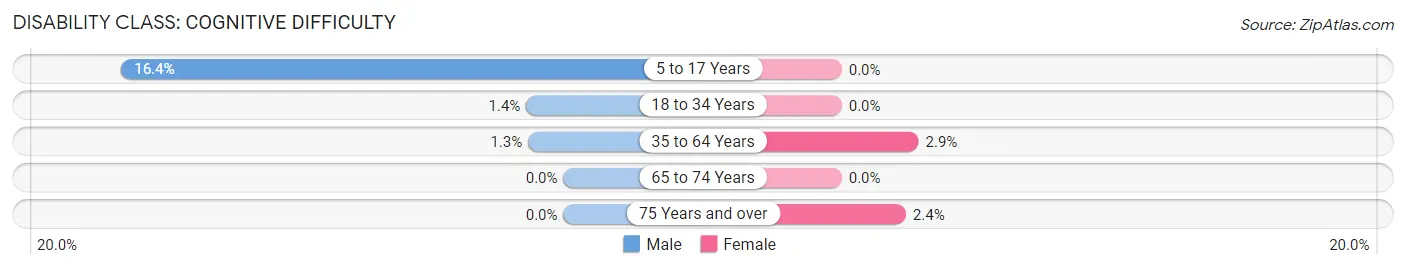
| Age Bracket | Male | Female |
| 5 to 17 Years | 129 (16.4%) | 0 (0.0%) |
| 18 to 34 Years | 12 (1.4%) | 0 (0.0%) |
| 35 to 64 Years | 20 (1.3%) | 33 (2.9%) |
| 65 to 74 Years | 0 (0.0%) | 0 (0.0%) |
| 75 Years and over | 0 (0.0%) | 3 (2.4%) |
Disability Class: Ambulatory Difficulty
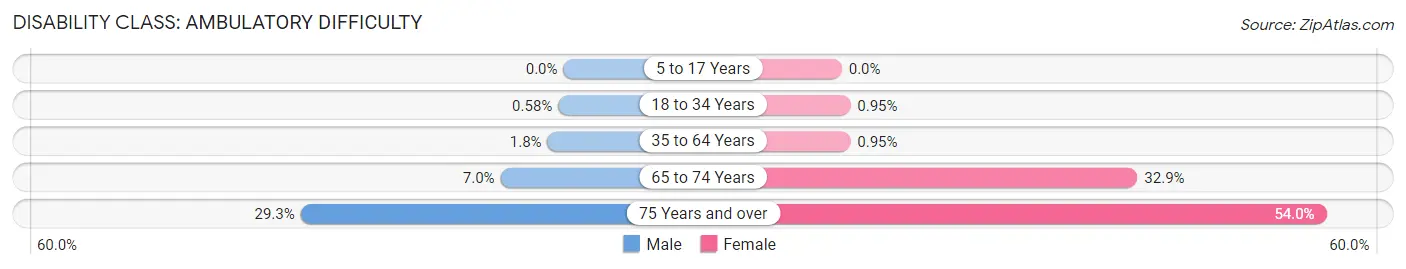
| Age Bracket | Male | Female |
| 5 to 17 Years | 0 (0.0%) | 0 (0.0%) |
| 18 to 34 Years | 5 (0.6%) | 6 (0.9%) |
| 35 to 64 Years | 27 (1.8%) | 11 (0.9%) |
| 65 to 74 Years | 19 (7.0%) | 53 (32.9%) |
| 75 Years and over | 36 (29.3%) | 68 (54.0%) |
Disability Class: Self-Care Difficulty
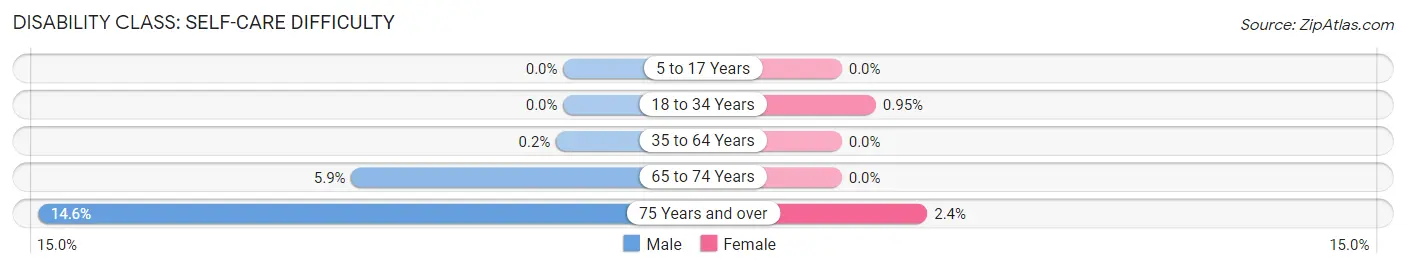
| Age Bracket | Male | Female |
| 5 to 17 Years | 0 (0.0%) | 0 (0.0%) |
| 18 to 34 Years | 0 (0.0%) | 6 (0.9%) |
| 35 to 64 Years | 3 (0.2%) | 0 (0.0%) |
| 65 to 74 Years | 16 (5.9%) | 0 (0.0%) |
| 75 Years and over | 18 (14.6%) | 3 (2.4%) |
Technology Access in Dallam County
Computing Device Access in Dallam County
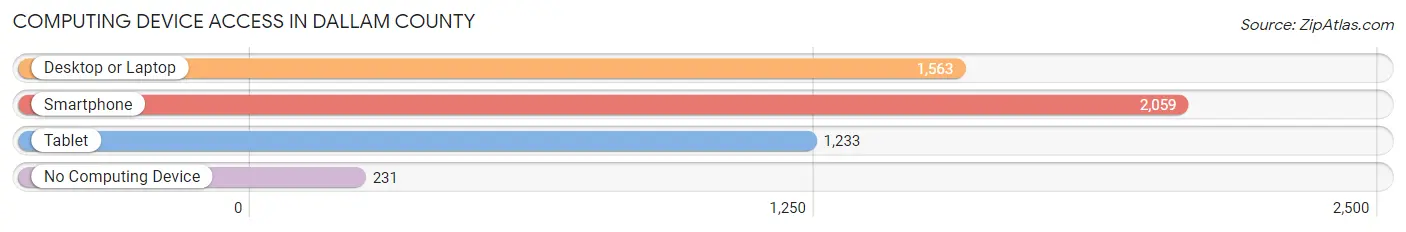
| Device Type | # Households | % Households |
| Desktop or Laptop | 1,563 | 67.0% |
| Smartphone | 2,059 | 88.3% |
| Tablet | 1,233 | 52.8% |
| No Computing Device | 231 | 9.9% |
| Total | 2,333 | 100.0% |
Internet Access in Dallam County
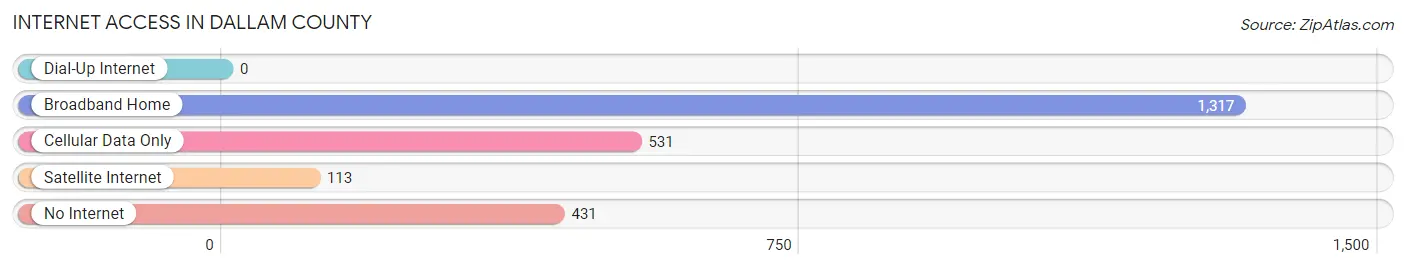
| Internet Type | # Households | % Households |
| Dial-Up Internet | 0 | 0.0% |
| Broadband Home | 1,317 | 56.5% |
| Cellular Data Only | 531 | 22.8% |
| Satellite Internet | 113 | 4.8% |
| No Internet | 431 | 18.5% |
| Total | 2,333 | 100.0% |
Dallam County Summary
Dallam County is located in the northwestern corner of the state of Texas, and is bordered by Oklahoma to the north, New Mexico to the west, and the Texas Panhandle to the east. The county seat is Dalhart, and the county is named for James Wilmer Dallam, a lawyer and newspaper editor who was killed in the Battle of San Jacinto.
Geography
Dallam County covers an area of 1,845 square miles, making it the fourth-largest county in Texas. The terrain is mostly flat, with some rolling hills in the western part of the county. The county is drained by the Canadian River, which forms its northern boundary. The county is part of the High Plains region of Texas, and is characterized by dry, windy conditions. The average annual precipitation is 17.5 inches, and the average temperature is 64 degrees Fahrenheit.
Demographics
As of the 2010 census, the population of Dallam County was 6,703, a decrease of 4.3% from the 2000 census. The population is spread out across the county, with the largest population centers being Dalhart (population 7,930) and Texline (population 1,068). The racial makeup of the county is predominantly white (83.3%), with smaller percentages of Hispanic (14.2%), African American (1.2%), and Native American (0.7%).
Economy
The economy of Dallam County is largely based on agriculture and ranching. The county is home to a large number of cattle ranches, and is one of the top producers of wheat in the state. Other crops grown in the county include corn, sorghum, and hay. The county is also home to a number of oil and gas wells, and is a major producer of natural gas.
The county is served by two major highways, US Highway 87 and US Highway 54. The county is also served by the Burlington Northern Santa Fe Railway, which runs through the county from north to south.
The unemployment rate in Dallam County is 4.2%, slightly lower than the state average of 4.5%. The median household income is $45,845, and the median home value is $90,000.
Conclusion
Dallam County is a rural county located in the northwestern corner of Texas. The county is characterized by its flat terrain and dry, windy conditions. The population of the county is predominantly white, and the economy is largely based on agriculture and ranching. The county is served by two major highways and the Burlington Northern Santa Fe Railway, and the unemployment rate is slightly lower than the state average.
Common Questions
What is Per Capita Income in Dallam County?
Per Capita income in Dallam County is $28,936.
What is the Median Family Income in Dallam County?
Median Family Income in Dallam County is $88,065.
What is the Median Household income in Dallam County?
Median Household Income in Dallam County is $71,969.
What is Income or Wage Gap in Dallam County?
Income or Wage Gap in Dallam County is 54.1%.
Women in Dallam County earn 45.9 cents for every dollar earned by a man.
What is Family Income Deficit in Dallam County?
Family Income Deficit in Dallam County is $14,568.
Families that are below poverty line in Dallam County earn $14,568 less on average than the poverty threshold level.
What is Inequality or Gini Index in Dallam County?
Inequality or Gini Index in Dallam County is 0.37.
What is the Total Population of Dallam County?
Total Population of Dallam County is 7,165.
What is the Total Male Population of Dallam County?
Total Male Population of Dallam County is 3,836.
What is the Total Female Population of Dallam County?
Total Female Population of Dallam County is 3,329.
What is the Ratio of Males per 100 Females in Dallam County?
There are 115.23 Males per 100 Females in Dallam County.
What is the Ratio of Females per 100 Males in Dallam County?
There are 86.78 Females per 100 Males in Dallam County.
What is the Median Population Age in Dallam County?
Median Population Age in Dallam County is 30.8 Years.
What is the Average Family Size in Dallam County
Average Family Size in Dallam County is 3.8 People.
What is the Average Household Size in Dallam County
Average Household Size in Dallam County is 3.0 People.
How Large is the Labor Force in Dallam County?
There are 3,941 People in the Labor Forcein in Dallam County.
What is the Percentage of People in the Labor Force in Dallam County?
77.4% of People are in the Labor Force in Dallam County.
What is the Unemployment Rate in Dallam County?
Unemployment Rate in Dallam County is 2.6%.