Crosby County, TX Map & Demographics
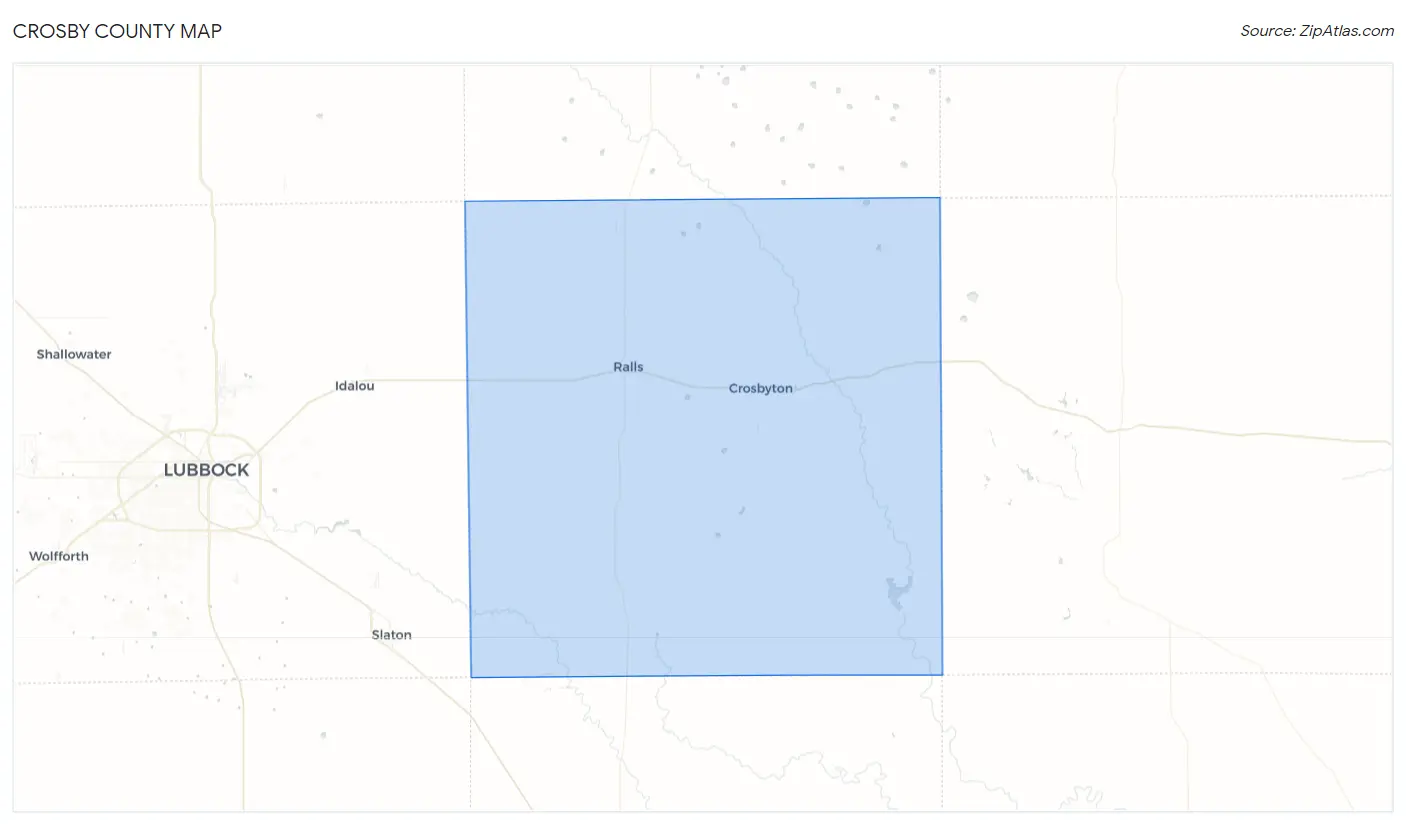
Crosby County Map
Crosby County Overview
$30,888
PER CAPITA INCOME
$65,538
AVG FAMILY INCOME
$50,268
AVG HOUSEHOLD INCOME
38.9%
WAGE / INCOME GAP [ % ]
61.1¢/ $1
WAGE / INCOME GAP [ $ ]
0.53
INEQUALITY / GINI INDEX
5,157
TOTAL POPULATION
2,607
MALE POPULATION
2,550
FEMALE POPULATION
102.24
MALES / 100 FEMALES
97.81
FEMALES / 100 MALES
39.4
MEDIAN AGE
3.0
AVG FAMILY SIZE
2.5
AVG HOUSEHOLD SIZE
2,489
LABOR FORCE [ PEOPLE ]
61.8%
PERCENT IN LABOR FORCE
4.9%
UNEMPLOYMENT RATE
Crosby County Area Codes
Income in Crosby County
Income Overview in Crosby County
Per Capita Income in Crosby County is $30,888, while median incomes of families and households are $65,538 and $50,268 respectively.
| Characteristic | Number | Measure |
| Per Capita Income | 5,157 | $30,888 |
| Median Family Income | 1,488 | $65,538 |
| Mean Family Income | 1,488 | $93,497 |
| Median Household Income | 1,994 | $50,268 |
| Mean Household Income | 1,994 | $78,614 |
| Income Deficit | 1,488 | $0 |
| Wage / Income Gap (%) | 5,157 | 38.94% |
| Wage / Income Gap ($) | 5,157 | 61.06¢ per $1 |
| Gini / Inequality Index | 5,157 | 0.53 |
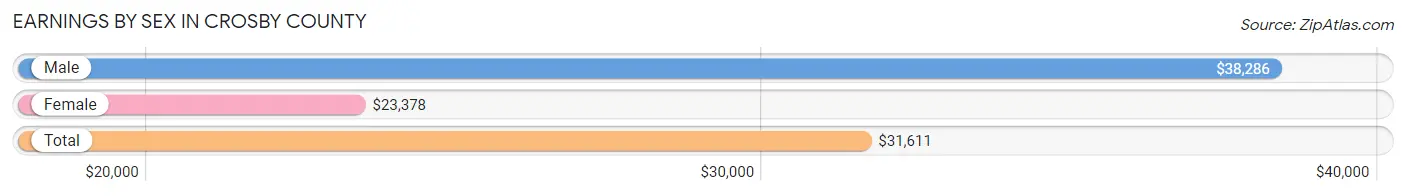
Earnings by Sex in Crosby County
Average Earnings in Crosby County are $31,611, $38,286 for men and $23,378 for women, a difference of 38.9%.
| Sex | Number | Average Earnings |
| Male | 1,464 (56.9%) | $38,286 |
| Female | 1,109 (43.1%) | $23,378 |
| Total | 2,573 (100.0%) | $31,611 |
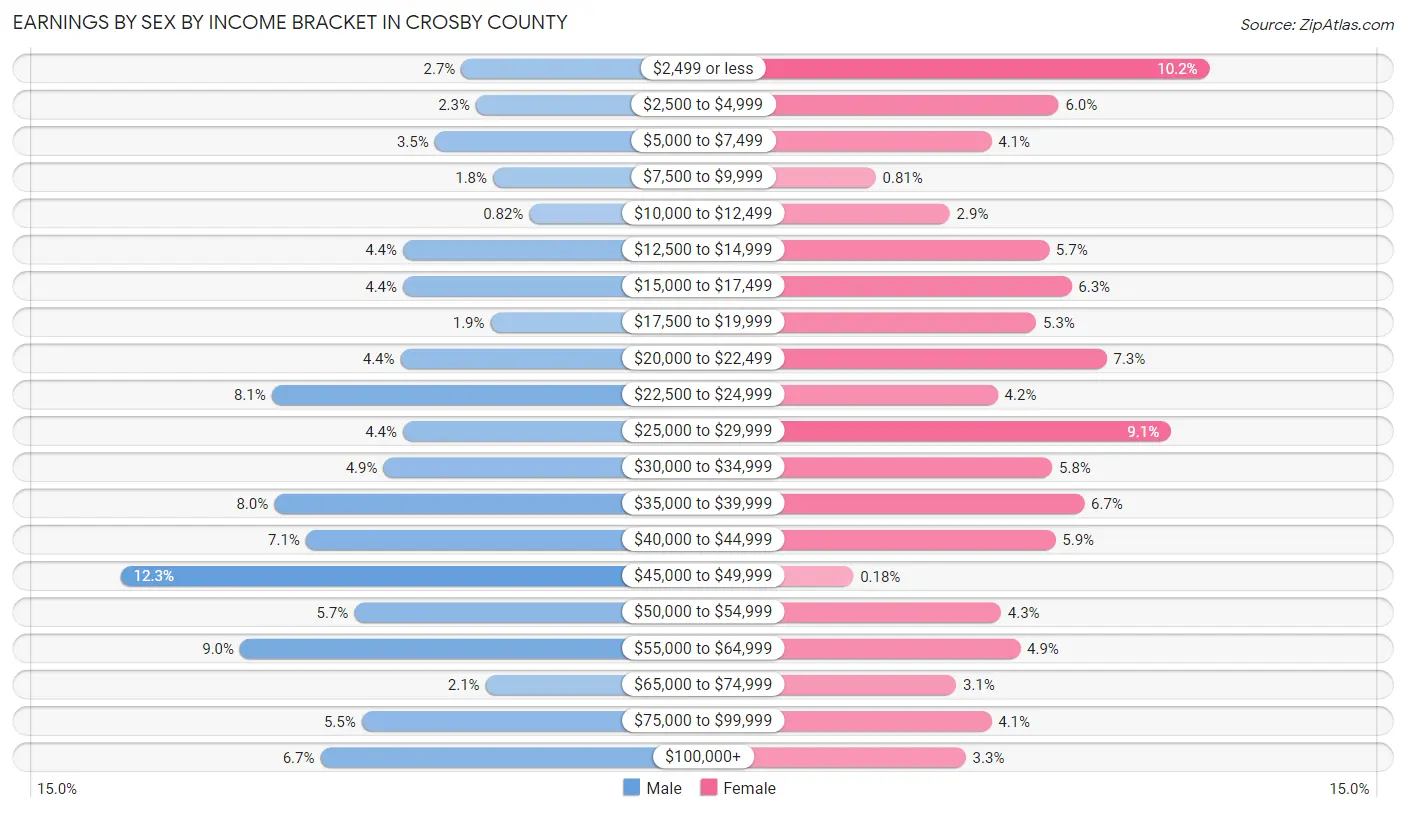
Earnings by Sex by Income Bracket in Crosby County
The most common earnings brackets in Crosby County are $45,000 to $49,999 for men (180 | 12.3%) and $2,499 or less for women (113 | 10.2%).
| Income | Male | Female |
| $2,499 or less | 40 (2.7%) | 113 (10.2%) |
| $2,500 to $4,999 | 34 (2.3%) | 66 (5.9%) |
| $5,000 to $7,499 | 51 (3.5%) | 45 (4.1%) |
| $7,500 to $9,999 | 27 (1.8%) | 9 (0.8%) |
| $10,000 to $12,499 | 12 (0.8%) | 32 (2.9%) |
| $12,500 to $14,999 | 64 (4.4%) | 63 (5.7%) |
| $15,000 to $17,499 | 64 (4.4%) | 70 (6.3%) |
| $17,500 to $19,999 | 28 (1.9%) | 59 (5.3%) |
| $20,000 to $22,499 | 65 (4.4%) | 81 (7.3%) |
| $22,500 to $24,999 | 118 (8.1%) | 47 (4.2%) |
| $25,000 to $29,999 | 64 (4.4%) | 101 (9.1%) |
| $30,000 to $34,999 | 72 (4.9%) | 64 (5.8%) |
| $35,000 to $39,999 | 117 (8.0%) | 74 (6.7%) |
| $40,000 to $44,999 | 104 (7.1%) | 65 (5.9%) |
| $45,000 to $49,999 | 180 (12.3%) | 2 (0.2%) |
| $50,000 to $54,999 | 84 (5.7%) | 48 (4.3%) |
| $55,000 to $64,999 | 131 (8.9%) | 54 (4.9%) |
| $65,000 to $74,999 | 30 (2.1%) | 34 (3.1%) |
| $75,000 to $99,999 | 81 (5.5%) | 45 (4.1%) |
| $100,000+ | 98 (6.7%) | 37 (3.3%) |
| Total | 1,464 (100.0%) | 1,109 (100.0%) |
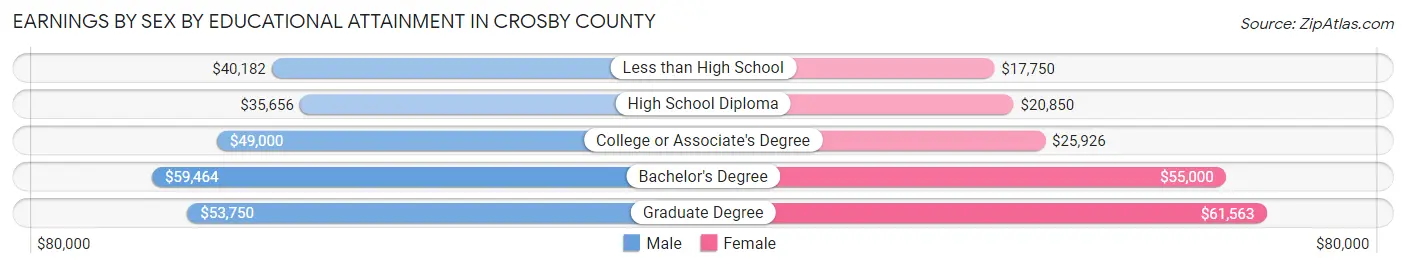
Earnings by Sex by Educational Attainment in Crosby County
Average earnings in Crosby County are $41,815 for men and $25,885 for women, a difference of 38.1%. Men with an educational attainment of bachelor's degree enjoy the highest average annual earnings of $59,464, while those with high school diploma education earn the least with $35,656. Women with an educational attainment of graduate degree earn the most with the average annual earnings of $61,563, while those with less than high school education have the smallest earnings of $17,750.
| Educational Attainment | Male Income | Female Income |
| Less than High School | $40,182 | $17,750 |
| High School Diploma | $35,656 | $20,850 |
| College or Associate's Degree | $49,000 | $25,926 |
| Bachelor's Degree | $59,464 | $55,000 |
| Graduate Degree | $53,750 | $61,563 |
| Total | $41,815 | $25,885 |
Family Income in Crosby County
Family Income Brackets in Crosby County
According to the Crosby County family income data, there are 351 families falling into the $50,000 to $74,999 income range, which is the most common income bracket and makes up 23.6% of all families. Conversely, the $10,000 to $14,999 income bracket is the least frequent group with only 22 families (1.5%) belonging to this category.
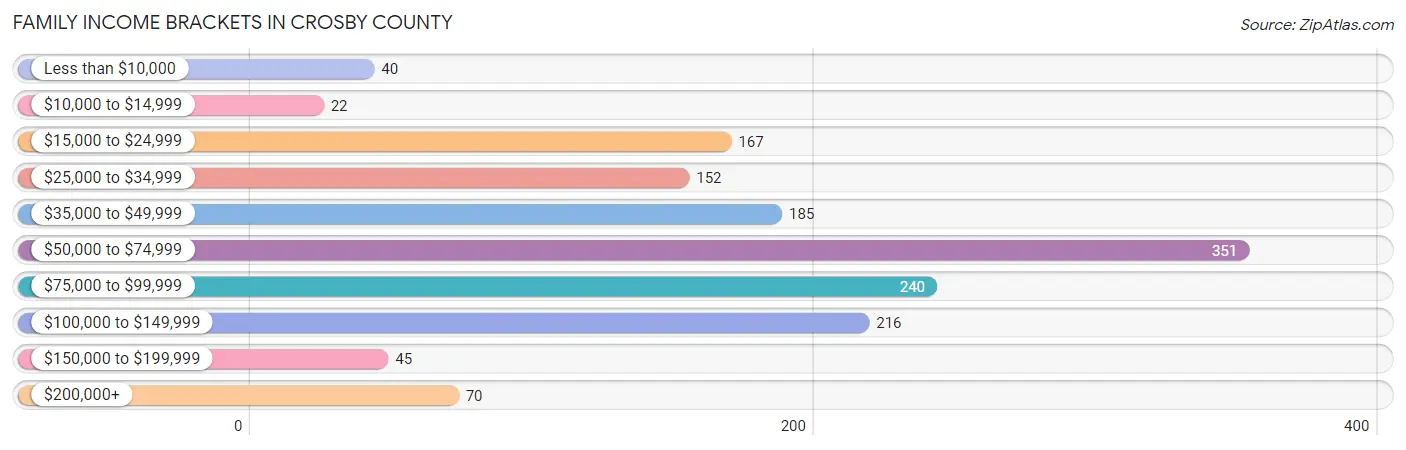
| Income Bracket | # Families | % Families |
| Less than $10,000 | 40 | 2.7% |
| $10,000 to $14,999 | 22 | 1.5% |
| $15,000 to $24,999 | 167 | 11.2% |
| $25,000 to $34,999 | 152 | 10.2% |
| $35,000 to $49,999 | 185 | 12.4% |
| $50,000 to $74,999 | 351 | 23.6% |
| $75,000 to $99,999 | 240 | 16.1% |
| $100,000 to $149,999 | 216 | 14.5% |
| $150,000 to $199,999 | 45 | 3.0% |
| $200,000+ | 70 | 4.7% |
Family Income by Famaliy Size in Crosby County
6-person families (64 | 4.3%) account for the highest median family income in Crosby County with $88,289 per family, while 2-person families (644 | 43.3%) have the highest median income of $29,956 per family member.
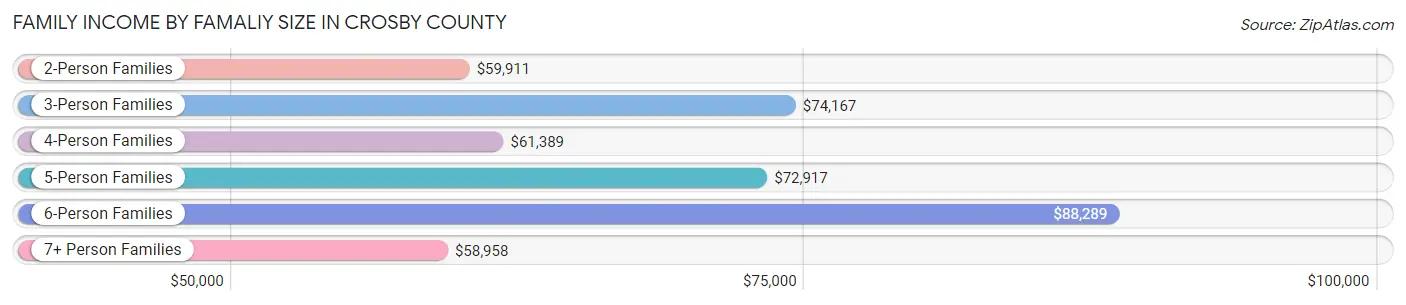
| Income Bracket | # Families | Median Income |
| 2-Person Families | 644 (43.3%) | $59,911 |
| 3-Person Families | 254 (17.1%) | $74,167 |
| 4-Person Families | 280 (18.8%) | $61,389 |
| 5-Person Families | 213 (14.3%) | $72,917 |
| 6-Person Families | 64 (4.3%) | $88,289 |
| 7+ Person Families | 33 (2.2%) | $58,958 |
| Total | 1,488 (100.0%) | $65,538 |
Family Income by Number of Earners in Crosby County
The median family income in Crosby County is $65,538, with families comprising 2 earners (464) having the highest median family income of $89,063, while families with no earners (197) have the lowest median family income of $36,250, accounting for 31.2% and 13.2% of families, respectively.
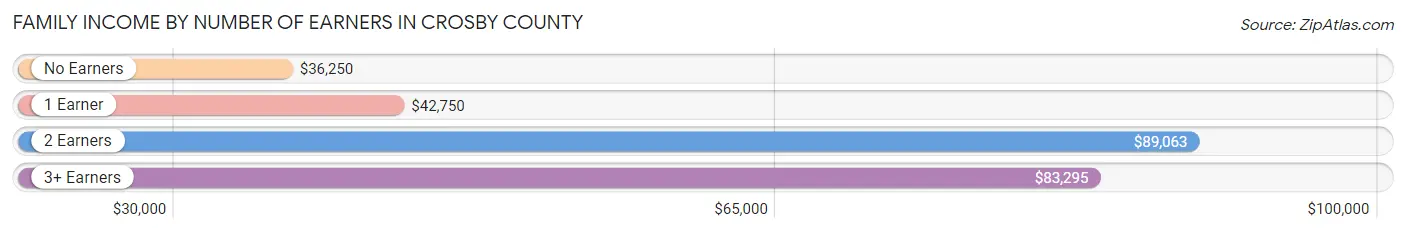
| Number of Earners | # Families | Median Income |
| No Earners | 197 (13.2%) | $36,250 |
| 1 Earner | 578 (38.8%) | $42,750 |
| 2 Earners | 464 (31.2%) | $89,063 |
| 3+ Earners | 249 (16.7%) | $83,295 |
| Total | 1,488 (100.0%) | $65,538 |
Household Income in Crosby County
Household Income Brackets in Crosby County
With 379 households falling in the category, the $50,000 to $74,999 income range is the most frequent in Crosby County, accounting for 19.0% of all households. In contrast, only 50 households (2.5%) fall into the $150,000 to $199,999 income bracket, making it the least populous group.
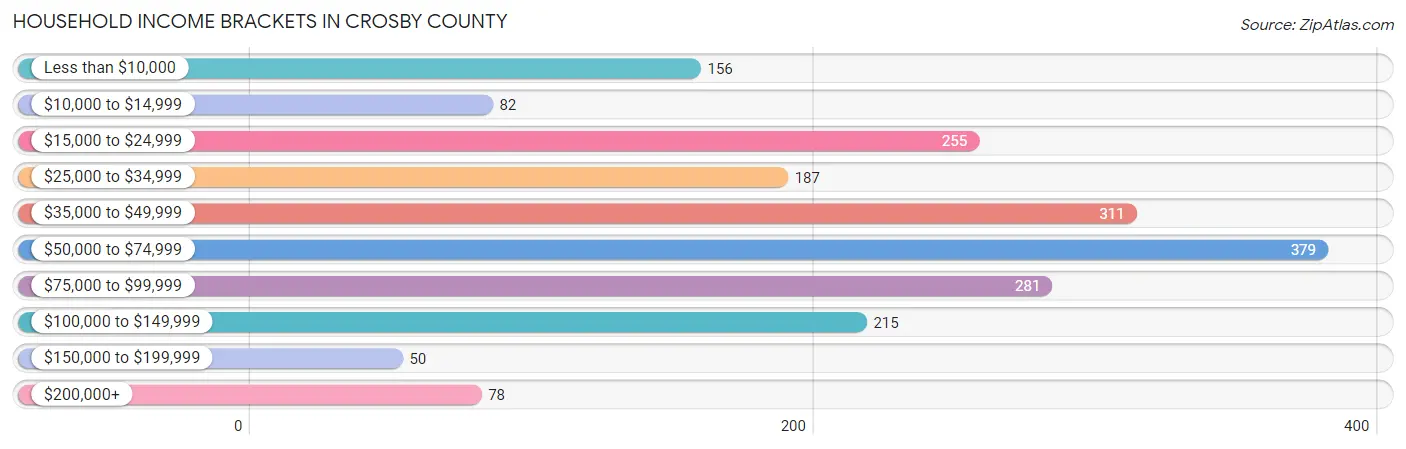
| Income Bracket | # Households | % Households |
| Less than $10,000 | 156 | 7.8% |
| $10,000 to $14,999 | 82 | 4.1% |
| $15,000 to $24,999 | 255 | 12.8% |
| $25,000 to $34,999 | 187 | 9.4% |
| $35,000 to $49,999 | 311 | 15.6% |
| $50,000 to $74,999 | 379 | 19.0% |
| $75,000 to $99,999 | 281 | 14.1% |
| $100,000 to $149,999 | 215 | 10.8% |
| $150,000 to $199,999 | 50 | 2.5% |
| $200,000+ | 78 | 3.9% |
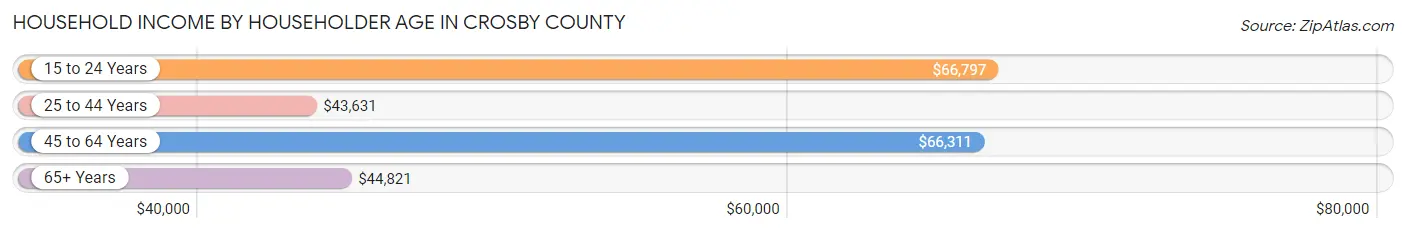
Household Income by Householder Age in Crosby County
The median household income in Crosby County is $50,268, with the highest median household income of $66,797 found in the 15 to 24 years age bracket for the primary householder. A total of 82 households (4.1%) fall into this category. Meanwhile, the 25 to 44 years age bracket for the primary householder has the lowest median household income of $43,631, with 715 households (35.9%) in this group.
| Income Bracket | # Households | Median Income |
| 15 to 24 Years | 82 (4.1%) | $66,797 |
| 25 to 44 Years | 715 (35.9%) | $43,631 |
| 45 to 64 Years | 667 (33.5%) | $66,311 |
| 65+ Years | 530 (26.6%) | $44,821 |
| Total | 1,994 (100.0%) | $50,268 |
Poverty in Crosby County
Income Below Poverty by Sex and Age in Crosby County
With 18.8% poverty level for males and 28.4% for females among the residents of Crosby County, 15 year old males and under 5 year old females are the most vulnerable to poverty, with 22 males (66.7%) and 84 females (56.0%) in their respective age groups living below the poverty level.
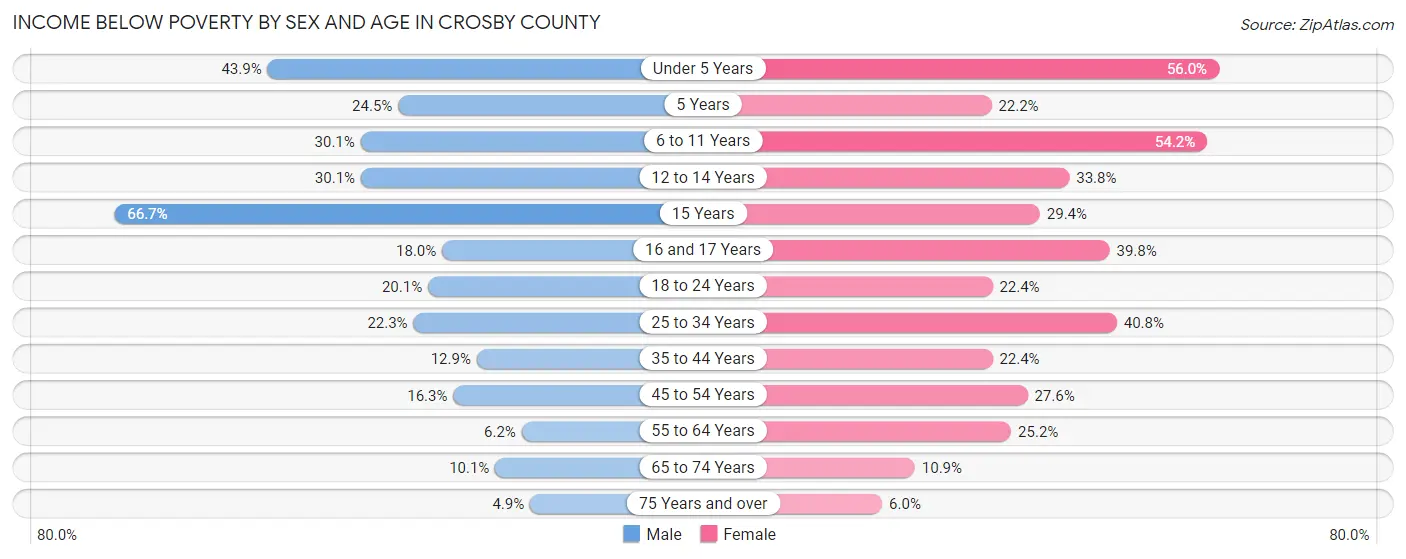
| Age Bracket | Male | Female |
| Under 5 Years | 76 (43.9%) | 84 (56.0%) |
| 5 Years | 13 (24.5%) | 6 (22.2%) |
| 6 to 11 Years | 53 (30.1%) | 128 (54.2%) |
| 12 to 14 Years | 49 (30.1%) | 25 (33.8%) |
| 15 Years | 22 (66.7%) | 10 (29.4%) |
| 16 and 17 Years | 18 (18.0%) | 33 (39.8%) |
| 18 to 24 Years | 42 (20.1%) | 49 (22.4%) |
| 25 to 34 Years | 69 (22.3%) | 98 (40.8%) |
| 35 to 44 Years | 53 (12.9%) | 85 (22.4%) |
| 45 to 54 Years | 33 (16.3%) | 67 (27.6%) |
| 55 to 64 Years | 19 (6.2%) | 85 (25.2%) |
| 65 to 74 Years | 26 (10.1%) | 28 (10.8%) |
| 75 Years and over | 8 (4.9%) | 13 (6.0%) |
| Total | 481 (18.8%) | 711 (28.4%) |
Income Above Poverty by Sex and Age in Crosby County
According to the poverty statistics in Crosby County, males aged 75 years and over and females aged 75 years and over are the age groups that are most secure financially, with 95.1% of males and 94.0% of females in these age groups living above the poverty line.
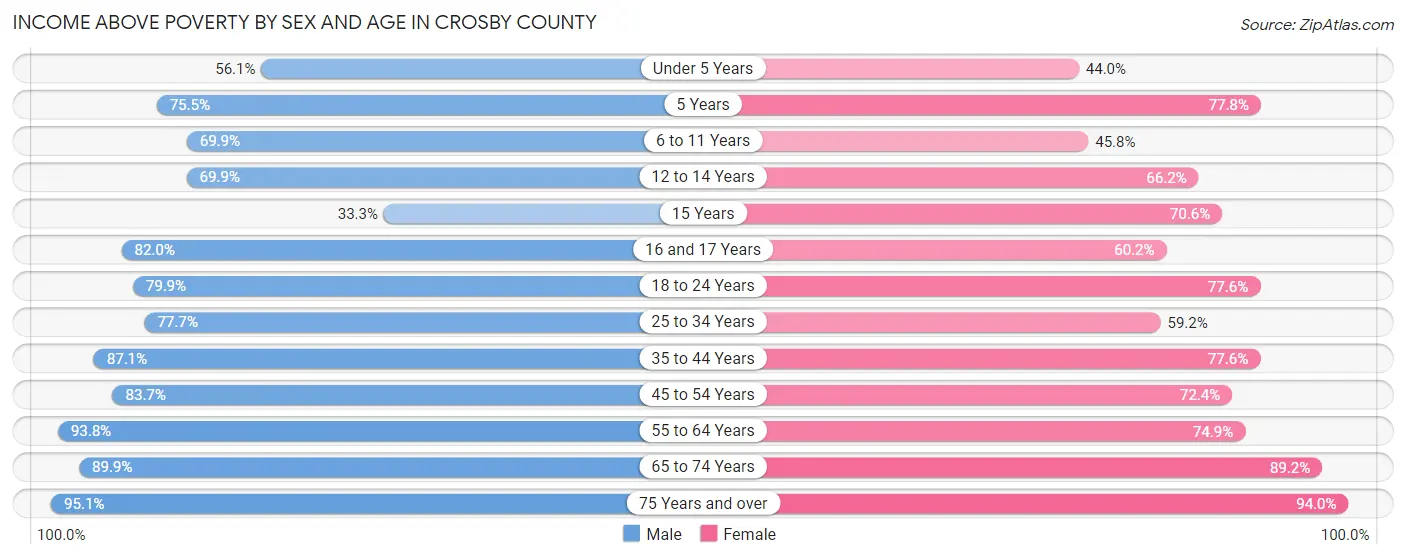
| Age Bracket | Male | Female |
| Under 5 Years | 97 (56.1%) | 66 (44.0%) |
| 5 Years | 40 (75.5%) | 21 (77.8%) |
| 6 to 11 Years | 123 (69.9%) | 108 (45.8%) |
| 12 to 14 Years | 114 (69.9%) | 49 (66.2%) |
| 15 Years | 11 (33.3%) | 24 (70.6%) |
| 16 and 17 Years | 82 (82.0%) | 50 (60.2%) |
| 18 to 24 Years | 167 (79.9%) | 170 (77.6%) |
| 25 to 34 Years | 241 (77.7%) | 142 (59.2%) |
| 35 to 44 Years | 359 (87.1%) | 295 (77.6%) |
| 45 to 54 Years | 169 (83.7%) | 176 (72.4%) |
| 55 to 64 Years | 288 (93.8%) | 253 (74.9%) |
| 65 to 74 Years | 231 (89.9%) | 230 (89.1%) |
| 75 Years and over | 154 (95.1%) | 204 (94.0%) |
| Total | 2,076 (81.2%) | 1,788 (71.6%) |
Income Below Poverty Among Married-Couple Families in Crosby County
The poverty statistics for married-couple families in Crosby County show that 9.4% or 93 of the total 993 families live below the poverty line. Families with 5 or more children have the highest poverty rate of 38.9%, comprising of 7 families. On the other hand, families with no children have the lowest poverty rate of 3.1%, which includes 18 families.
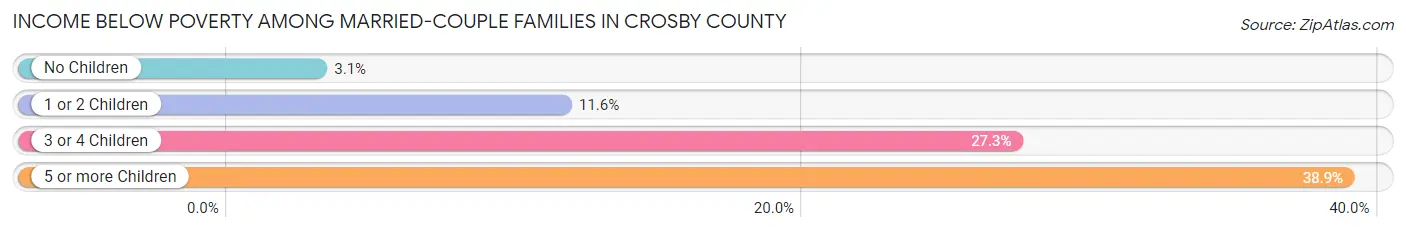
| Children | Above Poverty | Below Poverty |
| No Children | 560 (96.9%) | 18 (3.1%) |
| 1 or 2 Children | 228 (88.4%) | 30 (11.6%) |
| 3 or 4 Children | 101 (72.7%) | 38 (27.3%) |
| 5 or more Children | 11 (61.1%) | 7 (38.9%) |
| Total | 900 (90.6%) | 93 (9.4%) |
Income Below Poverty Among Single-Parent Households in Crosby County
According to the poverty data in Crosby County, 12.9% or 18 single-father households and 43.7% or 155 single-mother households are living below the poverty line. Among single-father households, those with 5 or more children have the highest poverty rate, with 6 households (100.0%) experiencing poverty. Likewise, among single-mother households, those with 5 or more children have the highest poverty rate, with 14 households (100.0%) falling below the poverty line.
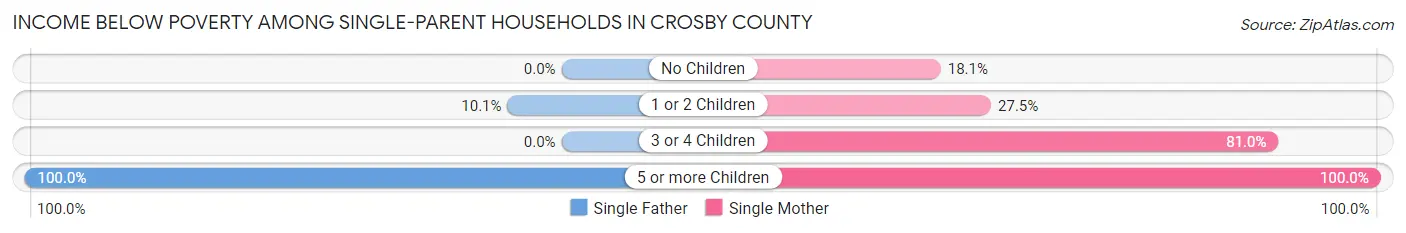
| Children | Single Father | Single Mother |
| No Children | 0 (0.0%) | 17 (18.1%) |
| 1 or 2 Children | 12 (10.1%) | 39 (27.5%) |
| 3 or 4 Children | 0 (0.0%) | 85 (80.9%) |
| 5 or more Children | 6 (100.0%) | 14 (100.0%) |
| Total | 18 (12.9%) | 155 (43.7%) |
Income Below Poverty Among Married-Couple vs Single-Parent Households in Crosby County
The poverty data for Crosby County shows that 93 of the married-couple family households (9.4%) and 173 of the single-parent households (34.9%) are living below the poverty level. Within the married-couple family households, those with 5 or more children have the highest poverty rate, with 7 households (38.9%) falling below the poverty line. Among the single-parent households, those with 5 or more children have the highest poverty rate, with 20 household (100.0%) living below poverty.
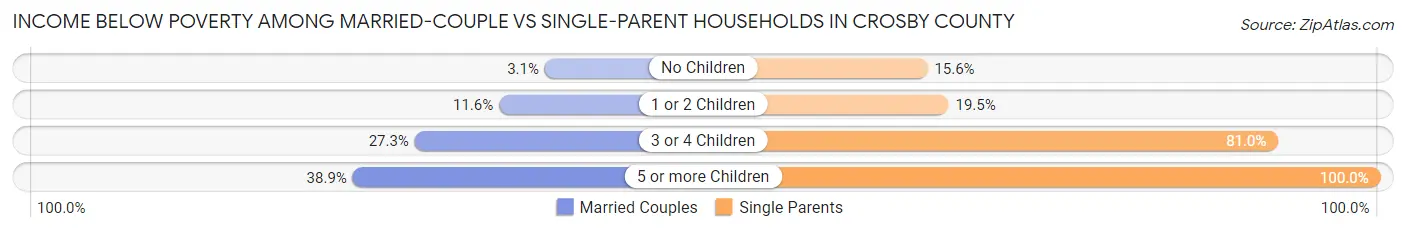
| Children | Married-Couple Families | Single-Parent Households |
| No Children | 18 (3.1%) | 17 (15.6%) |
| 1 or 2 Children | 30 (11.6%) | 51 (19.5%) |
| 3 or 4 Children | 38 (27.3%) | 85 (80.9%) |
| 5 or more Children | 7 (38.9%) | 20 (100.0%) |
| Total | 93 (9.4%) | 173 (34.9%) |
Race in Crosby County
The most populous races in Crosby County are White / Caucasian (3,790 | 73.5%), Hispanic or Latino (2,928 | 56.8%), and Some other Race (624 | 12.1%).
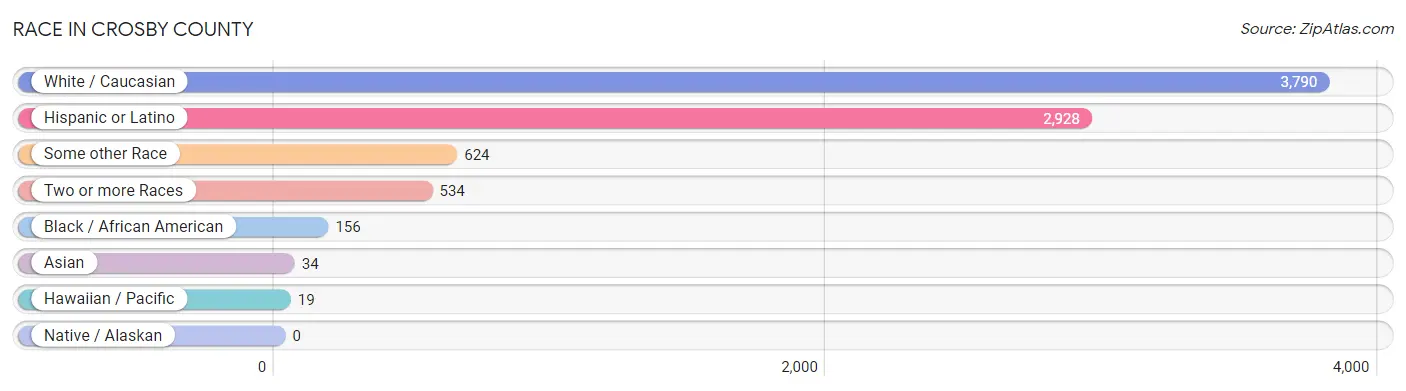
| Race | # Population | % Population |
| Asian | 34 | 0.7% |
| Black / African American | 156 | 3.0% |
| Hawaiian / Pacific | 19 | 0.4% |
| Hispanic or Latino | 2,928 | 56.8% |
| Native / Alaskan | 0 | 0.0% |
| White / Caucasian | 3,790 | 73.5% |
| Two or more Races | 534 | 10.3% |
| Some other Race | 624 | 12.1% |
| Total | 5,157 | 100.0% |
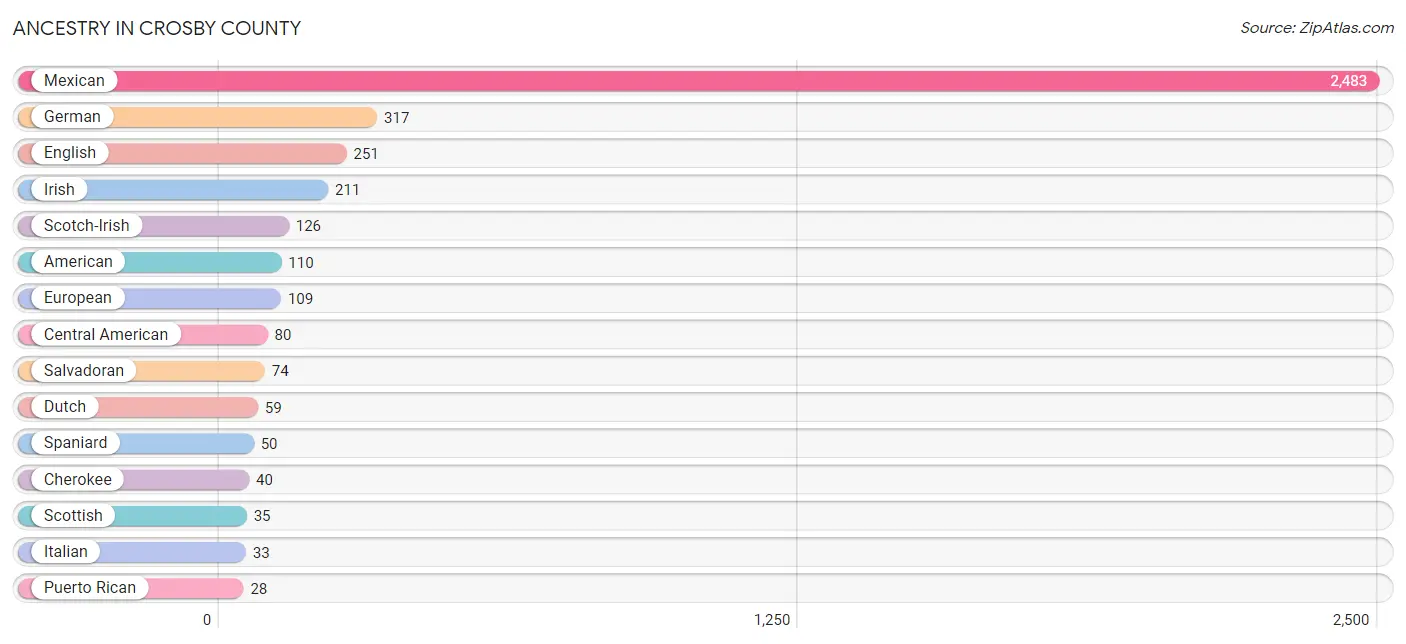
Ancestry in Crosby County
The most populous ancestries reported in Crosby County are Mexican (2,483 | 48.1%), German (317 | 6.1%), English (251 | 4.9%), Irish (211 | 4.1%), and Scotch-Irish (126 | 2.4%), together accounting for 65.7% of all Crosby County residents.
| Ancestry | # Population | % Population |
| African | 10 | 0.2% |
| American | 110 | 2.1% |
| Arab | 1 | 0.0% |
| Austrian | 13 | 0.3% |
| Blackfeet | 2 | 0.0% |
| British | 3 | 0.1% |
| Central American | 80 | 1.5% |
| Cherokee | 40 | 0.8% |
| Croatian | 8 | 0.2% |
| Cuban | 12 | 0.2% |
| Danish | 4 | 0.1% |
| Dutch | 59 | 1.1% |
| Dutch West Indian | 26 | 0.5% |
| English | 251 | 4.9% |
| European | 109 | 2.1% |
| Finnish | 6 | 0.1% |
| French | 19 | 0.4% |
| French Canadian | 4 | 0.1% |
| German | 317 | 6.1% |
| Greek | 9 | 0.2% |
| Honduran | 2 | 0.0% |
| Indian (Asian) | 2 | 0.0% |
| Irish | 211 | 4.1% |
| Italian | 33 | 0.6% |
| Korean | 19 | 0.4% |
| Mexican | 2,483 | 48.1% |
| Nicaraguan | 4 | 0.1% |
| Norwegian | 2 | 0.0% |
| Osage | 14 | 0.3% |
| Palestinian | 1 | 0.0% |
| Polish | 24 | 0.5% |
| Portuguese | 2 | 0.0% |
| Puerto Rican | 28 | 0.5% |
| Romanian | 6 | 0.1% |
| Salvadoran | 74 | 1.4% |
| Samoan | 19 | 0.4% |
| Scandinavian | 8 | 0.2% |
| Scotch-Irish | 126 | 2.4% |
| Scottish | 35 | 0.7% |
| Spaniard | 50 | 1.0% |
| Spanish | 24 | 0.5% |
| Sri Lankan | 13 | 0.3% |
| Subsaharan African | 10 | 0.2% |
| Swedish | 28 | 0.5% |
| Trinidadian and Tobagonian | 16 | 0.3% |
| Welsh | 8 | 0.2% |
| West Indian | 1 | 0.0% | View All 47 Rows |
Immigrants in Crosby County
The most numerous immigrant groups reported in Crosby County came from Latin America (261 | 5.1%), Central America (236 | 4.6%), Mexico (188 | 3.6%), El Salvador (46 | 0.9%), and Asia (34 | 0.7%), together accounting for 14.8% of all Crosby County residents.
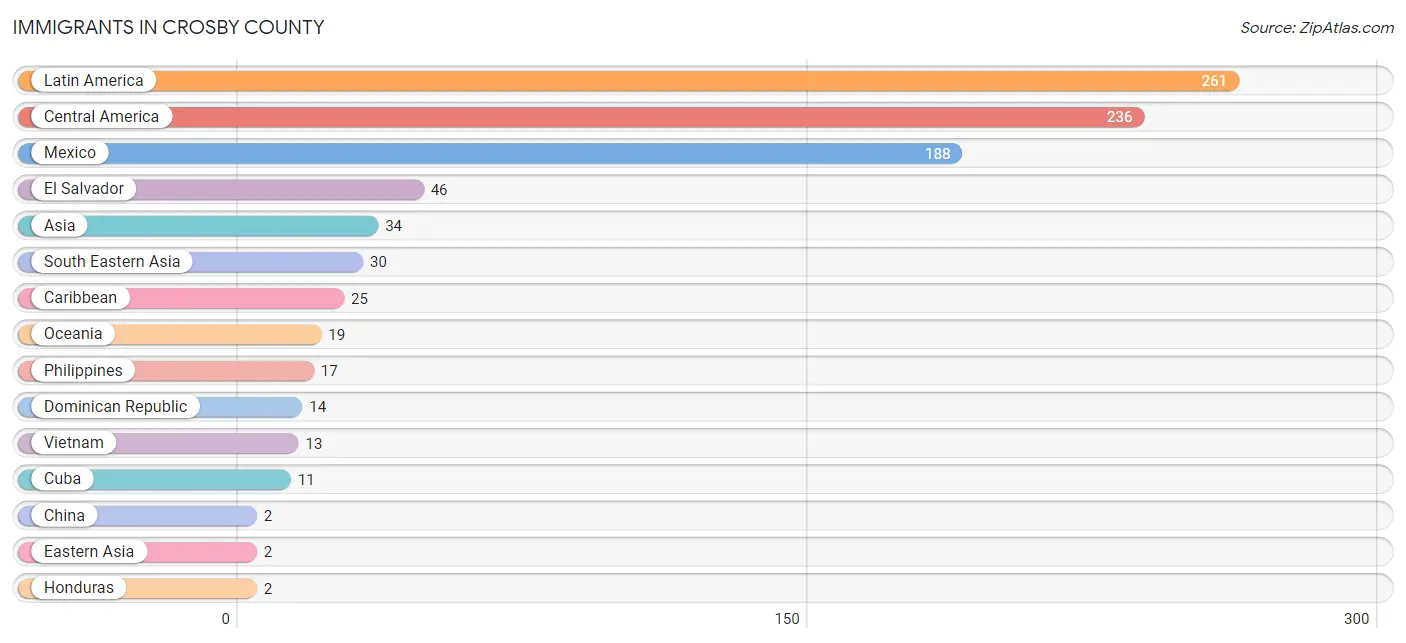
| Immigration Origin | # Population | % Population |
| Asia | 34 | 0.7% |
| Caribbean | 25 | 0.5% |
| Central America | 236 | 4.6% |
| China | 2 | 0.0% |
| Cuba | 11 | 0.2% |
| Dominican Republic | 14 | 0.3% |
| Eastern Asia | 2 | 0.0% |
| El Salvador | 46 | 0.9% |
| Honduras | 2 | 0.0% |
| Latin America | 261 | 5.1% |
| Mexico | 188 | 3.6% |
| Oceania | 19 | 0.4% |
| Philippines | 17 | 0.3% |
| South Central Asia | 2 | 0.0% |
| South Eastern Asia | 30 | 0.6% |
| Sri Lanka | 2 | 0.0% |
| Vietnam | 13 | 0.3% | View All 17 Rows |
Sex and Age in Crosby County
Sex and Age in Crosby County
The most populous age groups in Crosby County are 40 to 44 Years (263 | 10.1%) for men and 40 to 44 Years (213 | 8.4%) for women.
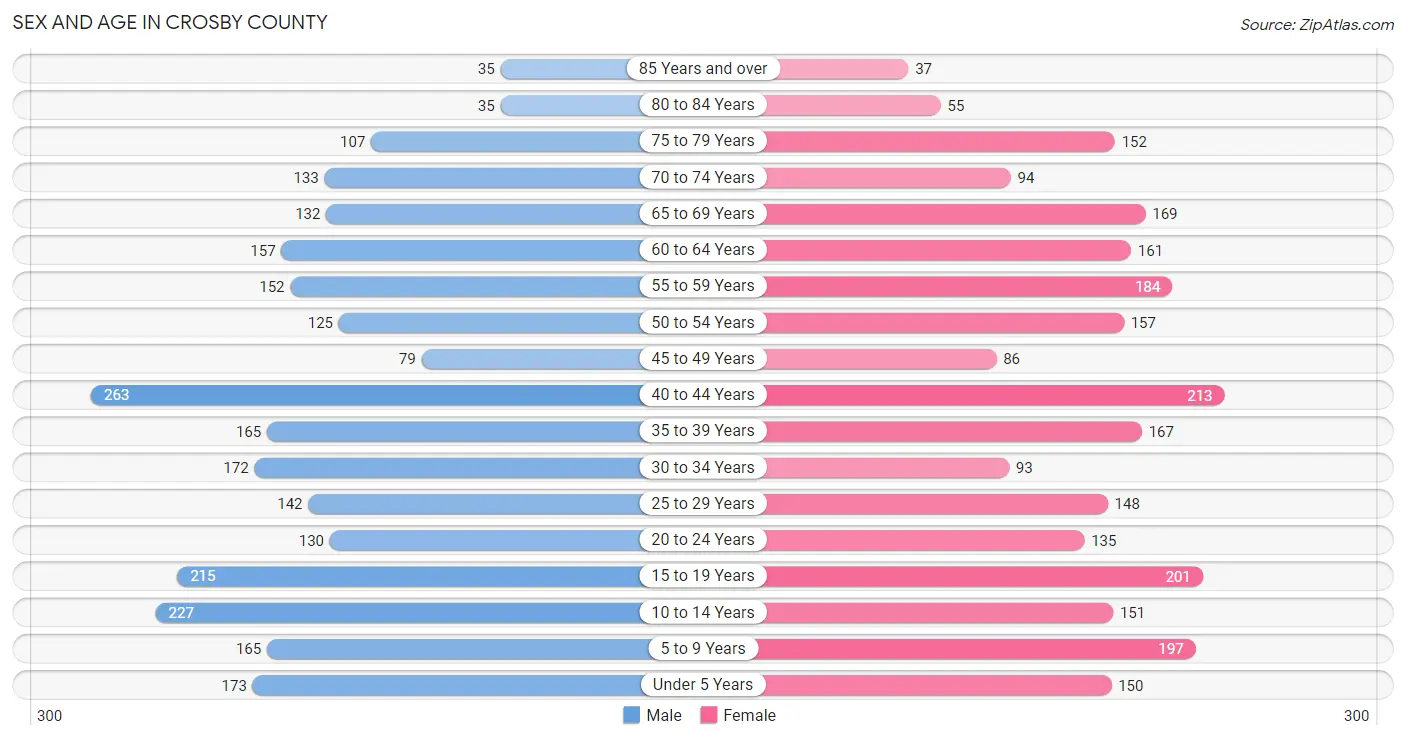
| Age Bracket | Male | Female |
| Under 5 Years | 173 (6.6%) | 150 (5.9%) |
| 5 to 9 Years | 165 (6.3%) | 197 (7.7%) |
| 10 to 14 Years | 227 (8.7%) | 151 (5.9%) |
| 15 to 19 Years | 215 (8.3%) | 201 (7.9%) |
| 20 to 24 Years | 130 (5.0%) | 135 (5.3%) |
| 25 to 29 Years | 142 (5.4%) | 148 (5.8%) |
| 30 to 34 Years | 172 (6.6%) | 93 (3.6%) |
| 35 to 39 Years | 165 (6.3%) | 167 (6.6%) |
| 40 to 44 Years | 263 (10.1%) | 213 (8.4%) |
| 45 to 49 Years | 79 (3.0%) | 86 (3.4%) |
| 50 to 54 Years | 125 (4.8%) | 157 (6.2%) |
| 55 to 59 Years | 152 (5.8%) | 184 (7.2%) |
| 60 to 64 Years | 157 (6.0%) | 161 (6.3%) |
| 65 to 69 Years | 132 (5.1%) | 169 (6.6%) |
| 70 to 74 Years | 133 (5.1%) | 94 (3.7%) |
| 75 to 79 Years | 107 (4.1%) | 152 (6.0%) |
| 80 to 84 Years | 35 (1.3%) | 55 (2.2%) |
| 85 Years and over | 35 (1.3%) | 37 (1.5%) |
| Total | 2,607 (100.0%) | 2,550 (100.0%) |
Families and Households in Crosby County
Median Family Size in Crosby County
The median family size in Crosby County is 2.97 persons per family, with single female/mother families (355 | 23.9%) accounting for the largest median family size of 3.29 persons per family. On the other hand, single male/father families (140 | 9.4%) represent the smallest median family size with 2.14 persons per family.
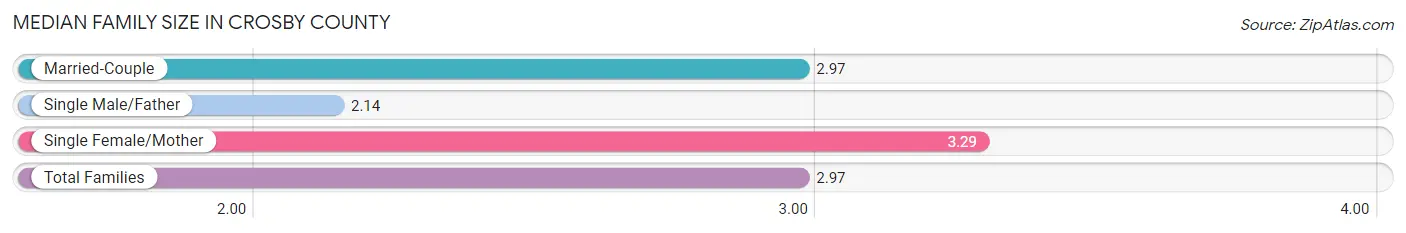
| Family Type | # Families | Family Size |
| Married-Couple | 993 (66.7%) | 2.97 |
| Single Male/Father | 140 (9.4%) | 2.14 |
| Single Female/Mother | 355 (23.9%) | 3.29 |
| Total Families | 1,488 (100.0%) | 2.97 |
Median Household Size in Crosby County
The median household size in Crosby County is 2.54 persons per household, with single female/mother households (355 | 17.8%) accounting for the largest median household size of 3.43 persons per household. non-family households (506 | 25.4%) represent the smallest median household size with 1.06 persons per household.
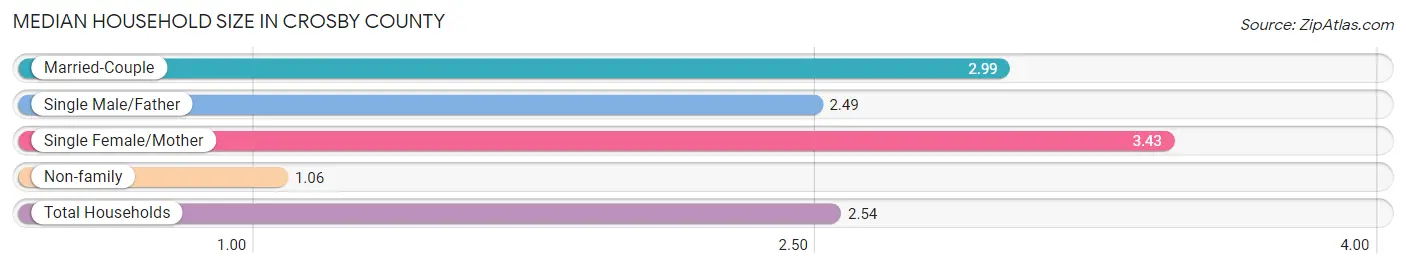
| Household Type | # Households | Household Size |
| Married-Couple | 993 (49.8%) | 2.99 |
| Single Male/Father | 140 (7.0%) | 2.49 |
| Single Female/Mother | 355 (17.8%) | 3.43 |
| Non-family | 506 (25.4%) | 1.06 |
| Total Households | 1,994 (100.0%) | 2.54 |
Household Size by Marriage Status in Crosby County
Out of a total of 1,994 households in Crosby County, 1,488 (74.6%) are family households, while 506 (25.4%) are nonfamily households. The most numerous type of family households are 2-person households, comprising 607, and the most common type of nonfamily households are 1-person households, comprising 461.
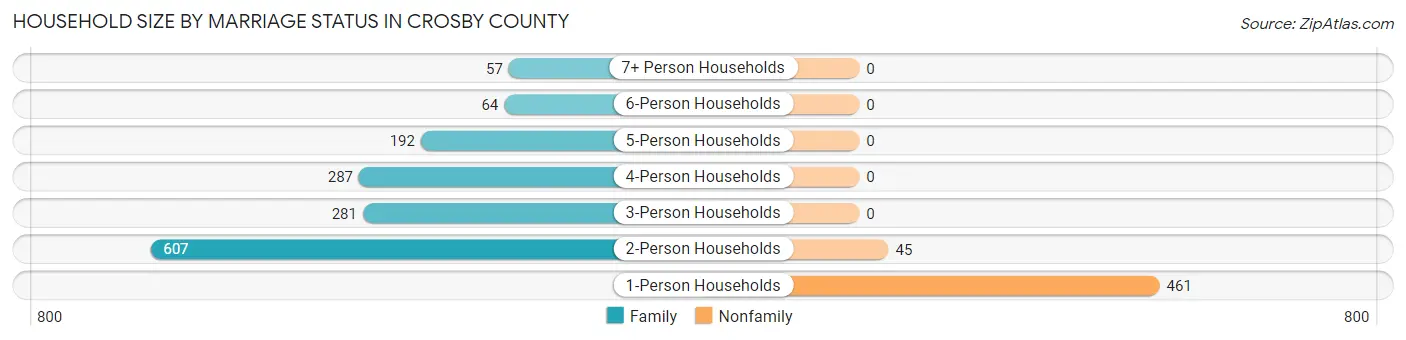
| Household Size | Family Households | Nonfamily Households |
| 1-Person Households | - | 461 (23.1%) |
| 2-Person Households | 607 (30.4%) | 45 (2.3%) |
| 3-Person Households | 281 (14.1%) | 0 (0.0%) |
| 4-Person Households | 287 (14.4%) | 0 (0.0%) |
| 5-Person Households | 192 (9.6%) | 0 (0.0%) |
| 6-Person Households | 64 (3.2%) | 0 (0.0%) |
| 7+ Person Households | 57 (2.9%) | 0 (0.0%) |
| Total | 1,488 (74.6%) | 506 (25.4%) |
Female Fertility in Crosby County
Fertility by Age in Crosby County
Average fertility rate in Crosby County is 37.0 births per 1,000 women. Women in the age bracket of 20 to 34 years have the highest fertility rate with 66.0 births per 1,000 women. Women in the age bracket of 20 to 34 years acount for 62.5% of all women with births.
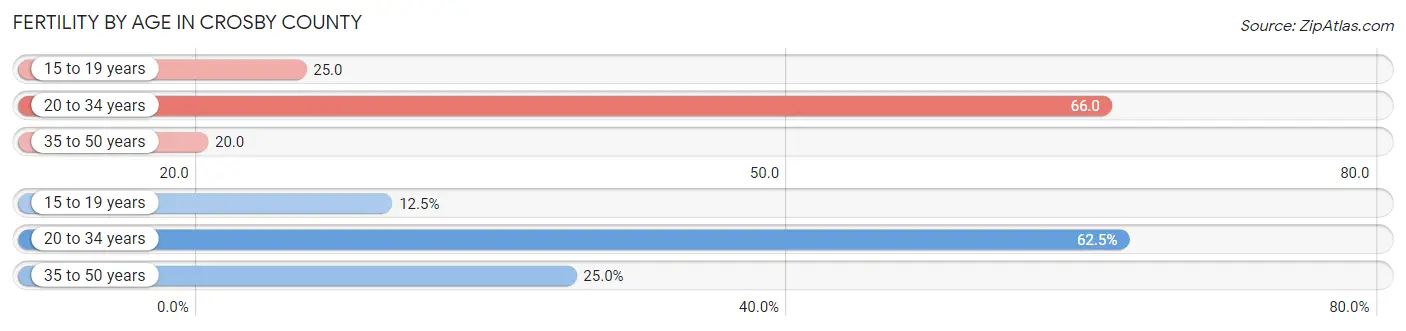
| Age Bracket | Women with Births | Births / 1,000 Women |
| 15 to 19 years | 5 (12.5%) | 25.0 |
| 20 to 34 years | 25 (62.5%) | 66.0 |
| 35 to 50 years | 10 (25.0%) | 20.0 |
| Total | 40 (100.0%) | 37.0 |
Fertility by Age by Marriage Status in Crosby County
62.5% of women with births (40) in Crosby County are married. The highest percentage of unmarried women with births falls into 15 to 19 years age bracket with 100.0% of them unmarried at the time of birth, while the lowest percentage of unmarried women with births belong to 20 to 34 years age bracket with 0.0% of them unmarried.
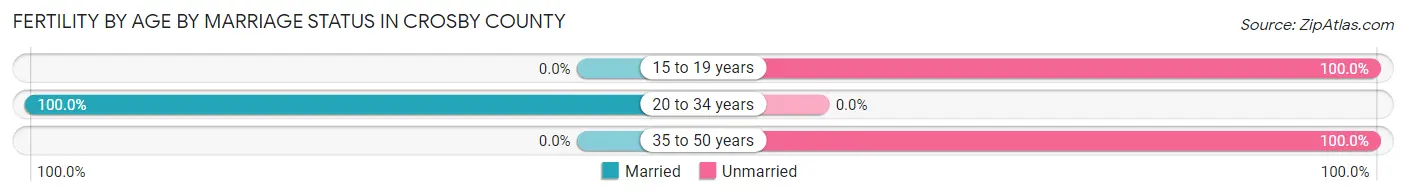
| Age Bracket | Married | Unmarried |
| 15 to 19 years | 0 (0.0%) | 5 (100.0%) |
| 20 to 34 years | 25 (100.0%) | 0 (0.0%) |
| 35 to 50 years | 0 (0.0%) | 10 (100.0%) |
| Total | 25 (62.5%) | 15 (37.5%) |
Fertility by Education in Crosby County
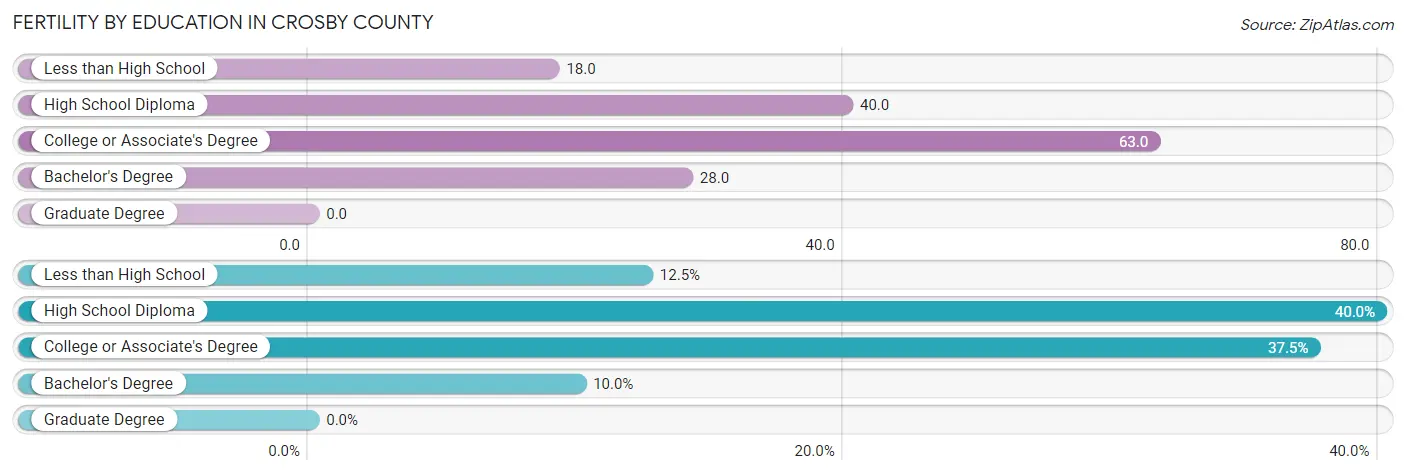
| Educational Attainment | Women with Births | Births / 1,000 Women |
| Less than High School | 5 (12.5%) | 18.0 |
| High School Diploma | 16 (40.0%) | 40.0 |
| College or Associate's Degree | 15 (37.5%) | 63.0 |
| Bachelor's Degree | 4 (10.0%) | 28.0 |
| Graduate Degree | 0 (0.0%) | 0.0 |
| Total | 40 (100.0%) | 37.0 |
Fertility by Education by Marriage Status in Crosby County
37.5% of women with births in Crosby County are unmarried. Women with the educational attainment of college or associate's degree are most likely to be married with 100.0% of them married at childbirth, while women with the educational attainment of less than high school are least likely to be married with 100.0% of them unmarried at childbirth.
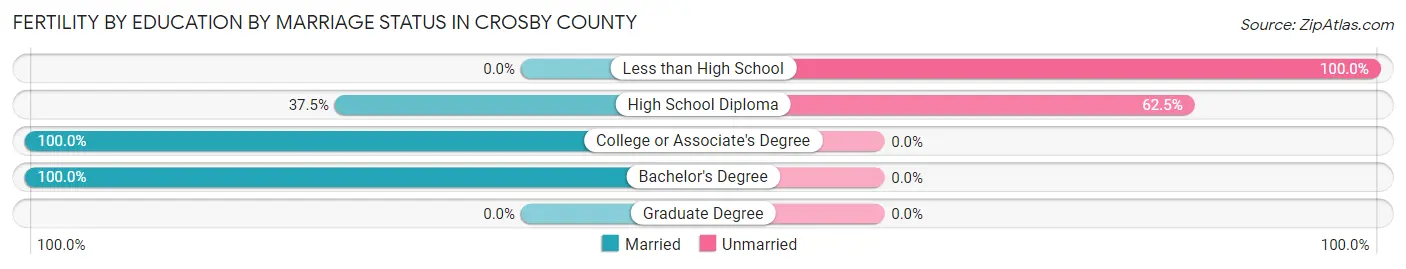
| Educational Attainment | Married | Unmarried |
| Less than High School | 0 (0.0%) | 5 (100.0%) |
| High School Diploma | 6 (37.5%) | 10 (62.5%) |
| College or Associate's Degree | 15 (100.0%) | 0 (0.0%) |
| Bachelor's Degree | 4 (100.0%) | 0 (0.0%) |
| Graduate Degree | 0 (0.0%) | 0 (0.0%) |
| Total | 25 (62.5%) | 15 (37.5%) |
Employment Characteristics in Crosby County
Employment by Class of Employer in Crosby County
Among the 2,335 employed individuals in Crosby County, private company employees (1,387 | 59.4%), local government employees (355 | 15.2%), and self-employed (not incorporated) (201 | 8.6%) make up the most common classes of employment.
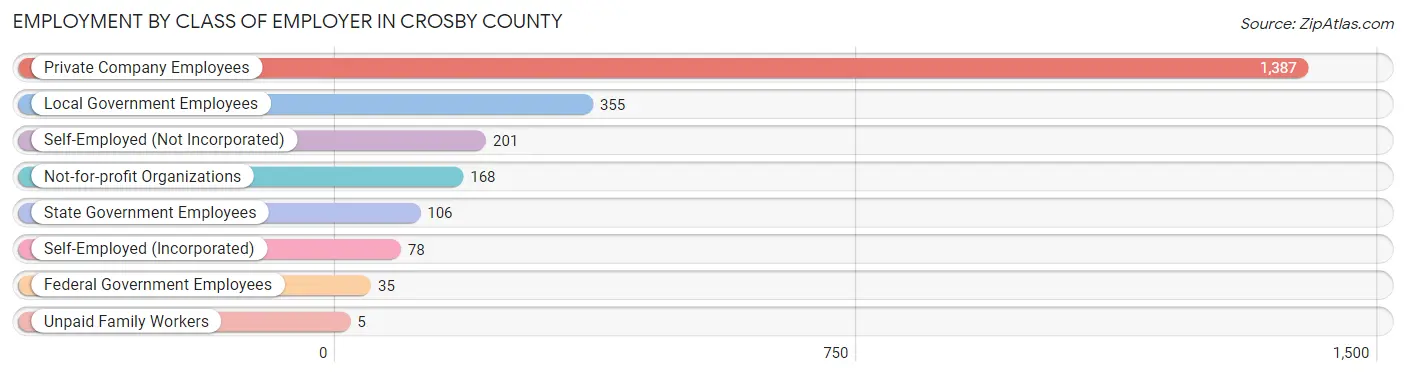
| Employer Class | # Employees | % Employees |
| Private Company Employees | 1,387 | 59.4% |
| Self-Employed (Incorporated) | 78 | 3.3% |
| Self-Employed (Not Incorporated) | 201 | 8.6% |
| Not-for-profit Organizations | 168 | 7.2% |
| Local Government Employees | 355 | 15.2% |
| State Government Employees | 106 | 4.5% |
| Federal Government Employees | 35 | 1.5% |
| Unpaid Family Workers | 5 | 0.2% |
| Total | 2,335 | 100.0% |
Employment Status by Age in Crosby County
According to the labor force statistics for Crosby County, out of the total population over 16 years of age (4,027), 61.8% or 2,489 individuals are in the labor force, with 4.9% or 122 of them unemployed. The age group with the highest labor force participation rate is 25 to 29 years, with 89.3% or 259 individuals in the labor force. Within the labor force, the 16 to 19 years age range has the highest percentage of unemployed individuals, with 19.3% or 26 of them being unemployed.
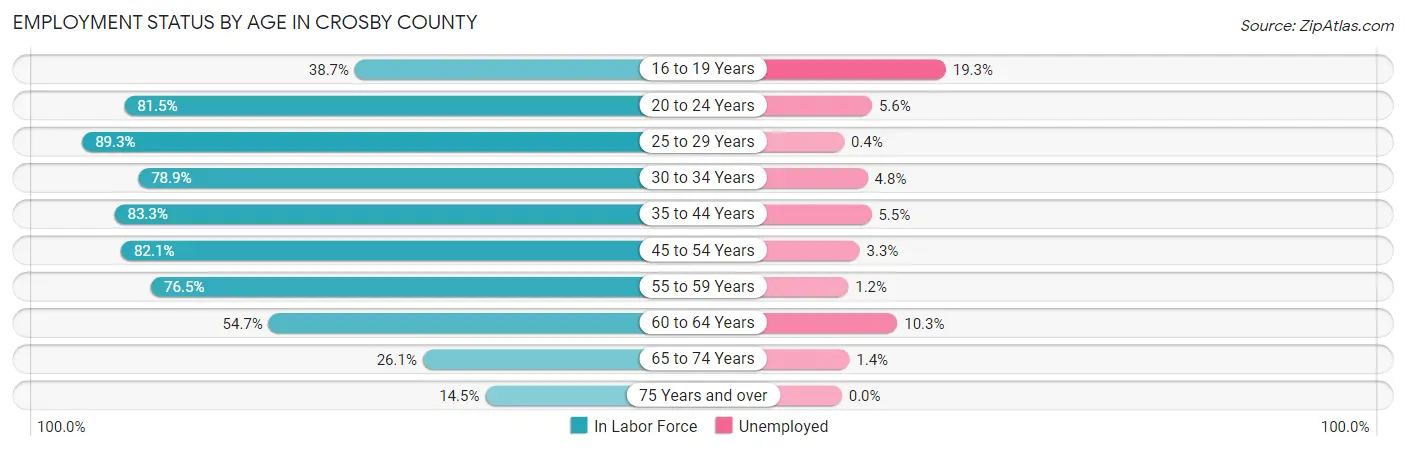
| Age Bracket | In Labor Force | Unemployed |
| 16 to 19 Years | 135 (38.7%) | 26 (19.3%) |
| 20 to 24 Years | 216 (81.5%) | 12 (5.6%) |
| 25 to 29 Years | 259 (89.3%) | 1 (0.4%) |
| 30 to 34 Years | 209 (78.9%) | 10 (4.8%) |
| 35 to 44 Years | 673 (83.3%) | 37 (5.5%) |
| 45 to 54 Years | 367 (82.1%) | 12 (3.3%) |
| 55 to 59 Years | 257 (76.5%) | 3 (1.2%) |
| 60 to 64 Years | 174 (54.7%) | 18 (10.3%) |
| 65 to 74 Years | 138 (26.1%) | 2 (1.4%) |
| 75 Years and over | 61 (14.5%) | 0 (0.0%) |
| Total | 2,489 (61.8%) | 122 (4.9%) |
Employment Status by Educational Attainment in Crosby County
According to labor force statistics for Crosby County, 78.7% of individuals (1,939) out of the total population between 25 and 64 years of age (2,464) are in the labor force, with 4.2% or 81 of them being unemployed. The group with the highest labor force participation rate are those with the educational attainment of bachelor's degree or higher, with 90.2% or 322 individuals in the labor force. Within the labor force, individuals with less than high school education have the highest percentage of unemployment, with 11.7% or 42 of them being unemployed.
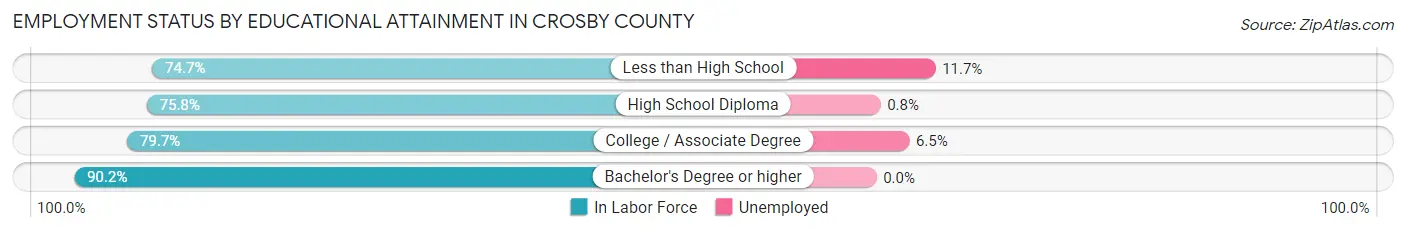
| Educational Attainment | In Labor Force | Unemployed |
| Less than High School | 360 (74.7%) | 56 (11.7%) |
| High School Diploma | 746 (75.8%) | 8 (0.8%) |
| College / Associate Degree | 511 (79.7%) | 42 (6.5%) |
| Bachelor's Degree or higher | 322 (90.2%) | 0 (0.0%) |
| Total | 1,939 (78.7%) | 103 (4.2%) |
Employment Occupations by Sex in Crosby County
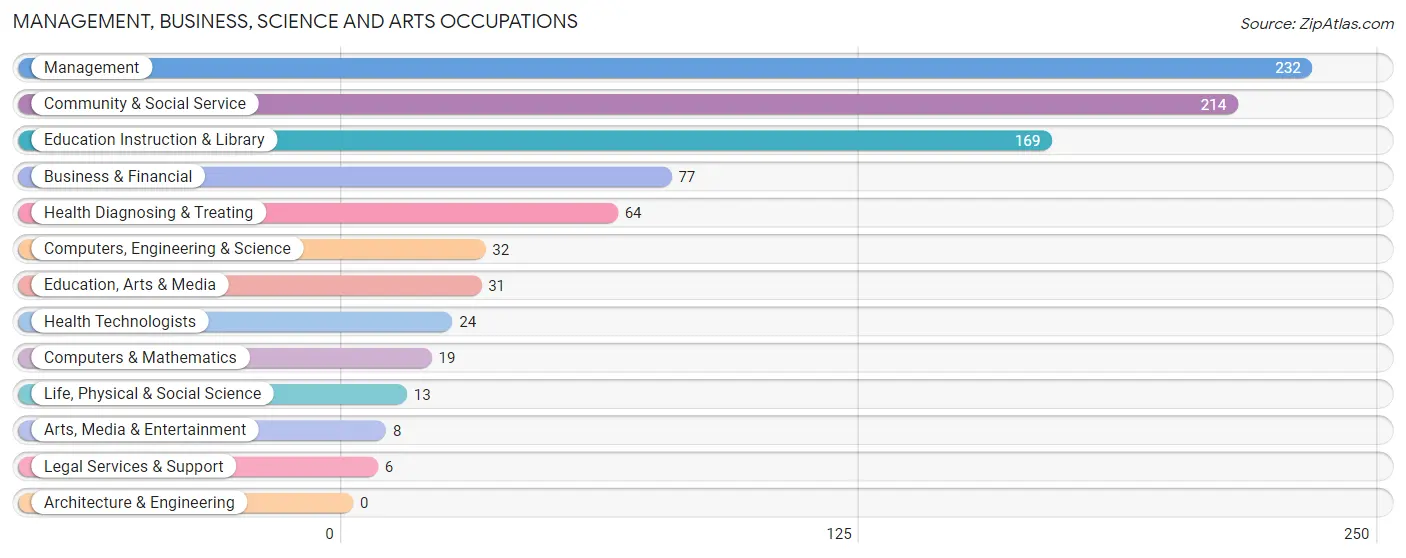
Management, Business, Science and Arts Occupations
The most common Management, Business, Science and Arts occupations in Crosby County are Management (232 | 9.8%), Community & Social Service (214 | 9.0%), Education Instruction & Library (169 | 7.1%), Business & Financial (77 | 3.3%), and Health Diagnosing & Treating (64 | 2.7%).
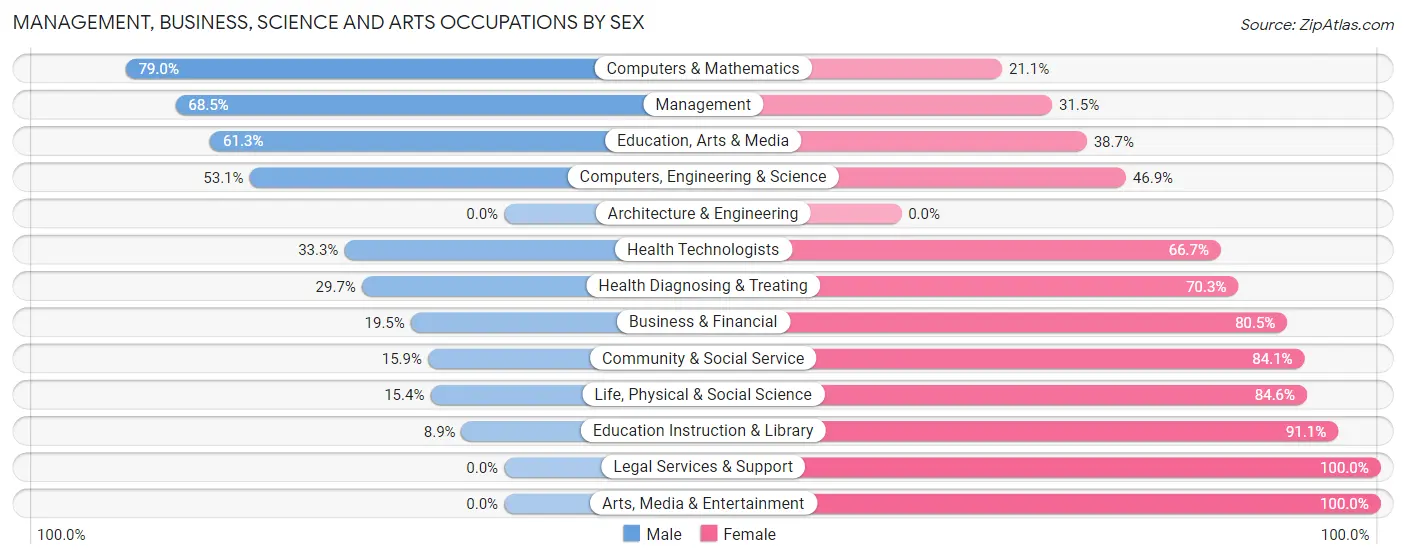
Management, Business, Science and Arts Occupations by Sex
Within the Management, Business, Science and Arts occupations in Crosby County, the most male-oriented occupations are Computers & Mathematics (78.9%), Management (68.5%), and Education, Arts & Media (61.3%), while the most female-oriented occupations are Legal Services & Support (100.0%), Arts, Media & Entertainment (100.0%), and Education Instruction & Library (91.1%).
| Occupation | Male | Female |
| Management | 159 (68.5%) | 73 (31.5%) |
| Business & Financial | 15 (19.5%) | 62 (80.5%) |
| Computers, Engineering & Science | 17 (53.1%) | 15 (46.9%) |
| Computers & Mathematics | 15 (78.9%) | 4 (21.0%) |
| Architecture & Engineering | 0 (0.0%) | 0 (0.0%) |
| Life, Physical & Social Science | 2 (15.4%) | 11 (84.6%) |
| Community & Social Service | 34 (15.9%) | 180 (84.1%) |
| Education, Arts & Media | 19 (61.3%) | 12 (38.7%) |
| Legal Services & Support | 0 (0.0%) | 6 (100.0%) |
| Education Instruction & Library | 15 (8.9%) | 154 (91.1%) |
| Arts, Media & Entertainment | 0 (0.0%) | 8 (100.0%) |
| Health Diagnosing & Treating | 19 (29.7%) | 45 (70.3%) |
| Health Technologists | 8 (33.3%) | 16 (66.7%) |
| Total (Category) | 244 (39.4%) | 375 (60.6%) |
| Total (Overall) | 1,368 (57.8%) | 1,000 (42.2%) |
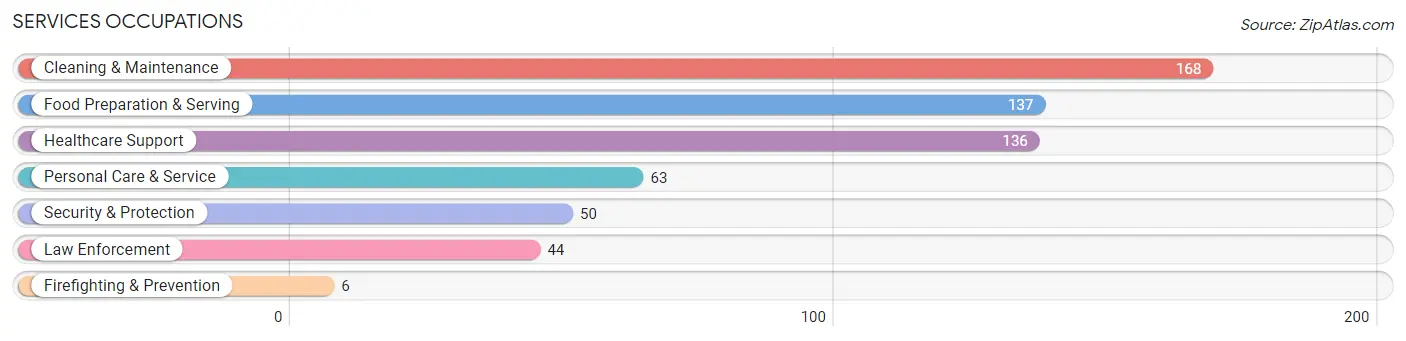
Services Occupations
The most common Services occupations in Crosby County are Cleaning & Maintenance (168 | 7.1%), Food Preparation & Serving (137 | 5.8%), Healthcare Support (136 | 5.7%), Personal Care & Service (63 | 2.7%), and Security & Protection (50 | 2.1%).
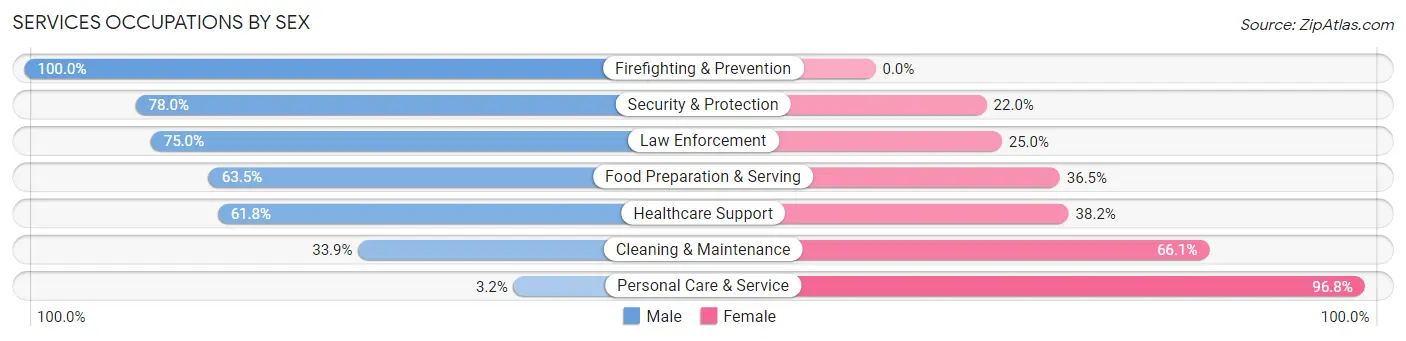
Services Occupations by Sex
Within the Services occupations in Crosby County, the most male-oriented occupations are Firefighting & Prevention (100.0%), Security & Protection (78.0%), and Law Enforcement (75.0%), while the most female-oriented occupations are Personal Care & Service (96.8%), Cleaning & Maintenance (66.1%), and Healthcare Support (38.2%).
| Occupation | Male | Female |
| Healthcare Support | 84 (61.8%) | 52 (38.2%) |
| Security & Protection | 39 (78.0%) | 11 (22.0%) |
| Firefighting & Prevention | 6 (100.0%) | 0 (0.0%) |
| Law Enforcement | 33 (75.0%) | 11 (25.0%) |
| Food Preparation & Serving | 87 (63.5%) | 50 (36.5%) |
| Cleaning & Maintenance | 57 (33.9%) | 111 (66.1%) |
| Personal Care & Service | 2 (3.2%) | 61 (96.8%) |
| Total (Category) | 269 (48.6%) | 285 (51.4%) |
| Total (Overall) | 1,368 (57.8%) | 1,000 (42.2%) |
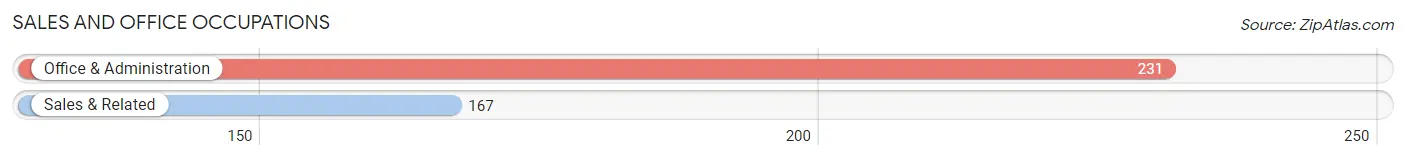
Sales and Office Occupations
The most common Sales and Office occupations in Crosby County are Office & Administration (231 | 9.8%), and Sales & Related (167 | 7.0%).
Sales and Office Occupations by Sex
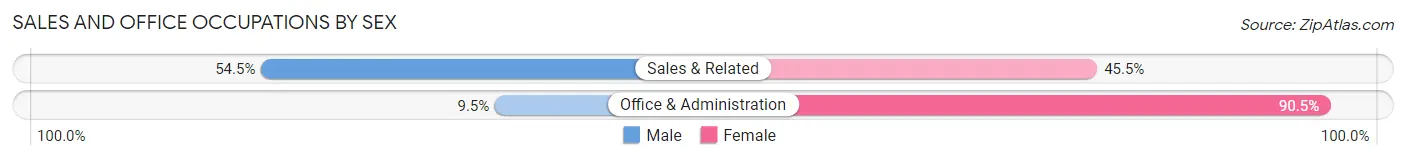
| Occupation | Male | Female |
| Sales & Related | 91 (54.5%) | 76 (45.5%) |
| Office & Administration | 22 (9.5%) | 209 (90.5%) |
| Total (Category) | 113 (28.4%) | 285 (71.6%) |
| Total (Overall) | 1,368 (57.8%) | 1,000 (42.2%) |
Natural Resources, Construction and Maintenance Occupations
The most common Natural Resources, Construction and Maintenance occupations in Crosby County are Construction & Extraction (244 | 10.3%), Farming, Fishing & Forestry (108 | 4.6%), and Installation, Maintenance & Repair (105 | 4.4%).
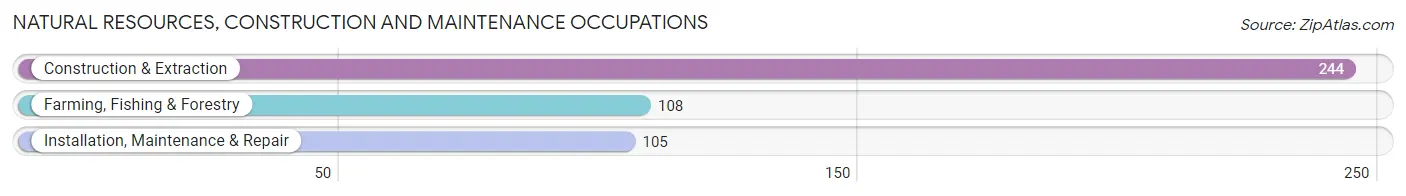
Natural Resources, Construction and Maintenance Occupations by Sex
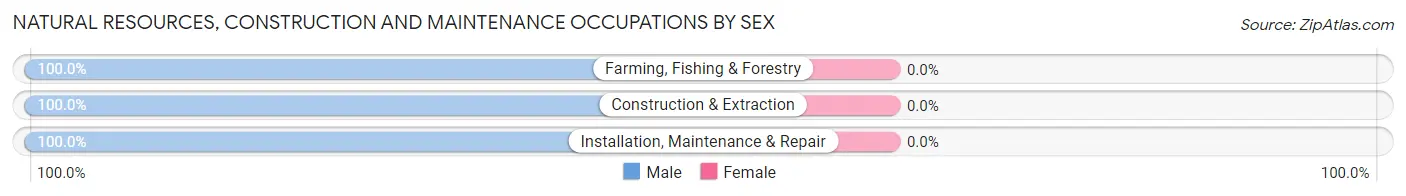
| Occupation | Male | Female |
| Farming, Fishing & Forestry | 108 (100.0%) | 0 (0.0%) |
| Construction & Extraction | 244 (100.0%) | 0 (0.0%) |
| Installation, Maintenance & Repair | 105 (100.0%) | 0 (0.0%) |
| Total (Category) | 457 (100.0%) | 0 (0.0%) |
| Total (Overall) | 1,368 (57.8%) | 1,000 (42.2%) |
Production, Transportation and Moving Occupations
The most common Production, Transportation and Moving occupations in Crosby County are Transportation (164 | 6.9%), Production (108 | 4.6%), and Material Moving (68 | 2.9%).
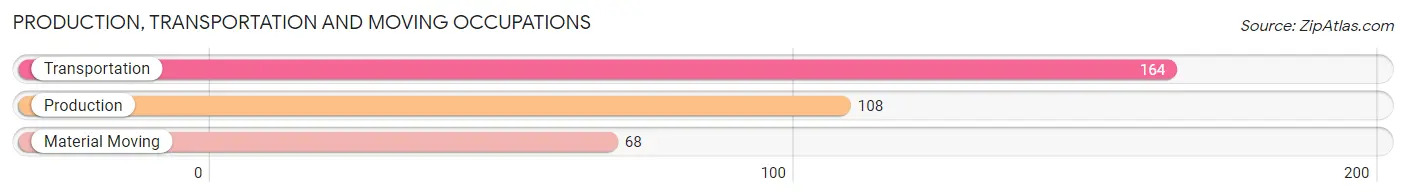
Production, Transportation and Moving Occupations by Sex
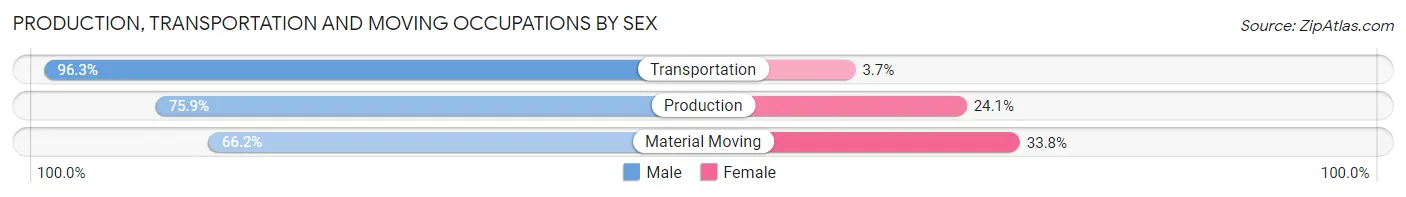
| Occupation | Male | Female |
| Production | 82 (75.9%) | 26 (24.1%) |
| Transportation | 158 (96.3%) | 6 (3.7%) |
| Material Moving | 45 (66.2%) | 23 (33.8%) |
| Total (Category) | 285 (83.8%) | 55 (16.2%) |
| Total (Overall) | 1,368 (57.8%) | 1,000 (42.2%) |
Employment Industries by Sex in Crosby County
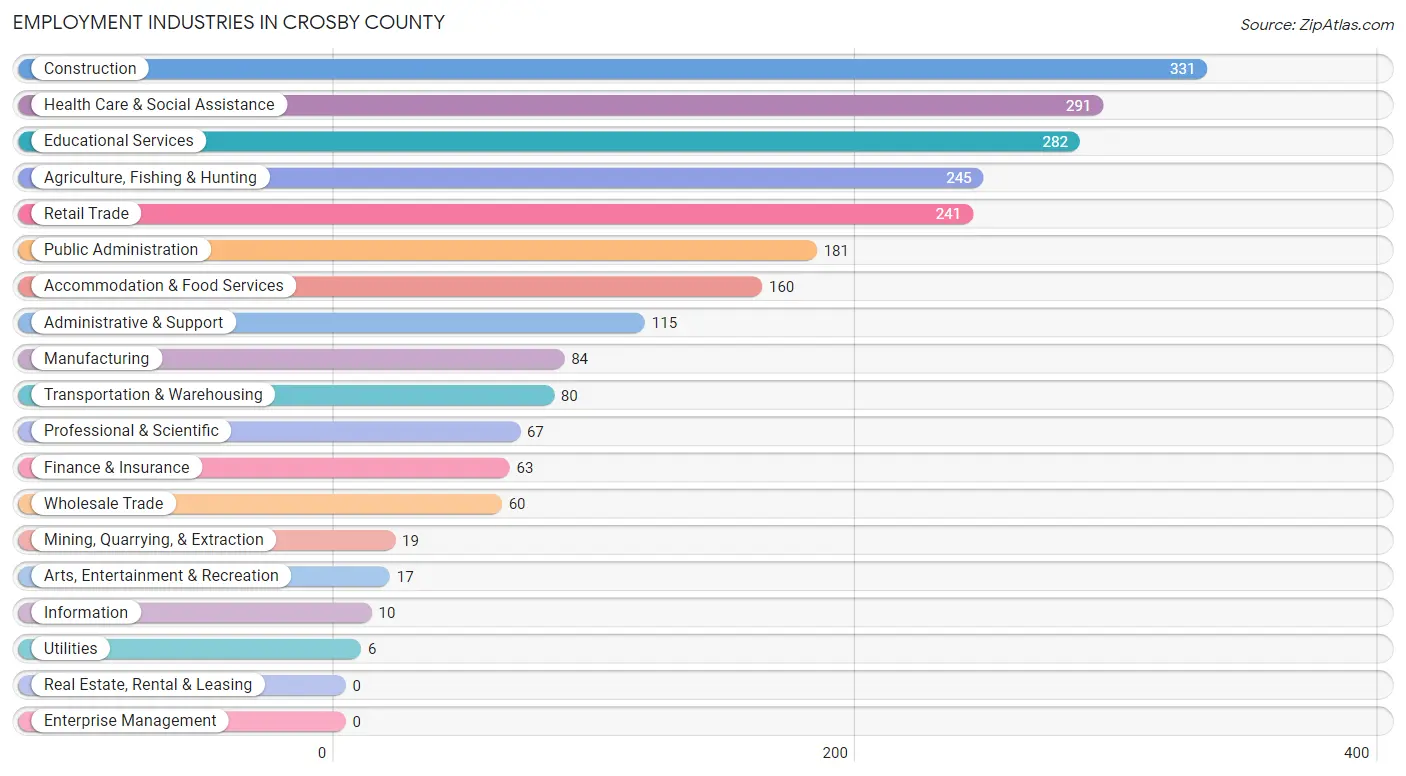
Employment Industries in Crosby County
The major employment industries in Crosby County include Construction (331 | 14.0%), Health Care & Social Assistance (291 | 12.3%), Educational Services (282 | 11.9%), Agriculture, Fishing & Hunting (245 | 10.3%), and Retail Trade (241 | 10.2%).
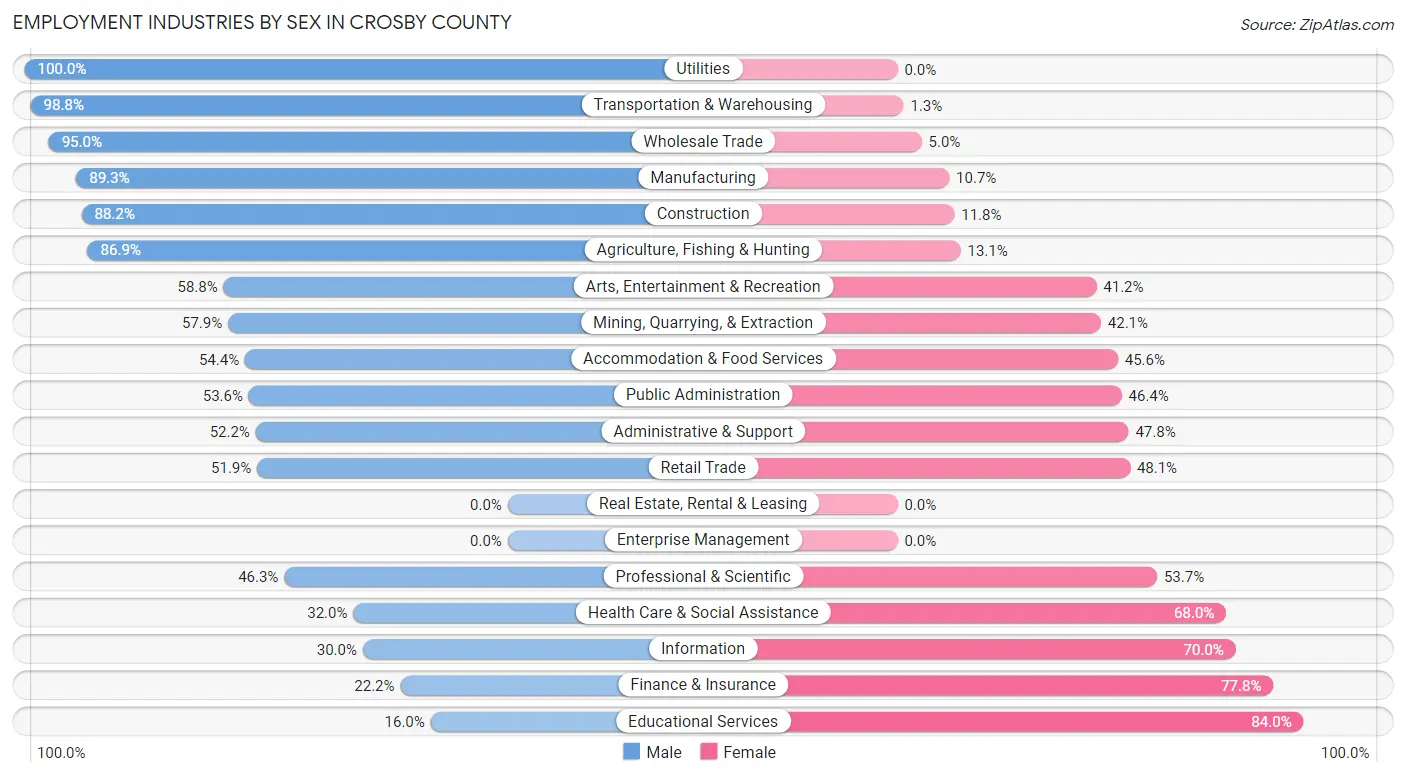
Employment Industries by Sex in Crosby County
The Crosby County industries that see more men than women are Utilities (100.0%), Transportation & Warehousing (98.8%), and Wholesale Trade (95.0%), whereas the industries that tend to have a higher number of women are Educational Services (84.0%), Finance & Insurance (77.8%), and Information (70.0%).
| Industry | Male | Female |
| Agriculture, Fishing & Hunting | 213 (86.9%) | 32 (13.1%) |
| Mining, Quarrying, & Extraction | 11 (57.9%) | 8 (42.1%) |
| Construction | 292 (88.2%) | 39 (11.8%) |
| Manufacturing | 75 (89.3%) | 9 (10.7%) |
| Wholesale Trade | 57 (95.0%) | 3 (5.0%) |
| Retail Trade | 125 (51.9%) | 116 (48.1%) |
| Transportation & Warehousing | 79 (98.8%) | 1 (1.3%) |
| Utilities | 6 (100.0%) | 0 (0.0%) |
| Information | 3 (30.0%) | 7 (70.0%) |
| Finance & Insurance | 14 (22.2%) | 49 (77.8%) |
| Real Estate, Rental & Leasing | 0 (0.0%) | 0 (0.0%) |
| Professional & Scientific | 31 (46.3%) | 36 (53.7%) |
| Enterprise Management | 0 (0.0%) | 0 (0.0%) |
| Administrative & Support | 60 (52.2%) | 55 (47.8%) |
| Educational Services | 45 (16.0%) | 237 (84.0%) |
| Health Care & Social Assistance | 93 (32.0%) | 198 (68.0%) |
| Arts, Entertainment & Recreation | 10 (58.8%) | 7 (41.2%) |
| Accommodation & Food Services | 87 (54.4%) | 73 (45.6%) |
| Public Administration | 97 (53.6%) | 84 (46.4%) |
| Total | 1,368 (57.8%) | 1,000 (42.2%) |
Education in Crosby County
School Enrollment in Crosby County
The most common levels of schooling among the 1,179 students in Crosby County are high school (330 | 28.0%), middle school (318 | 27.0%), and elementary school (226 | 19.2%).
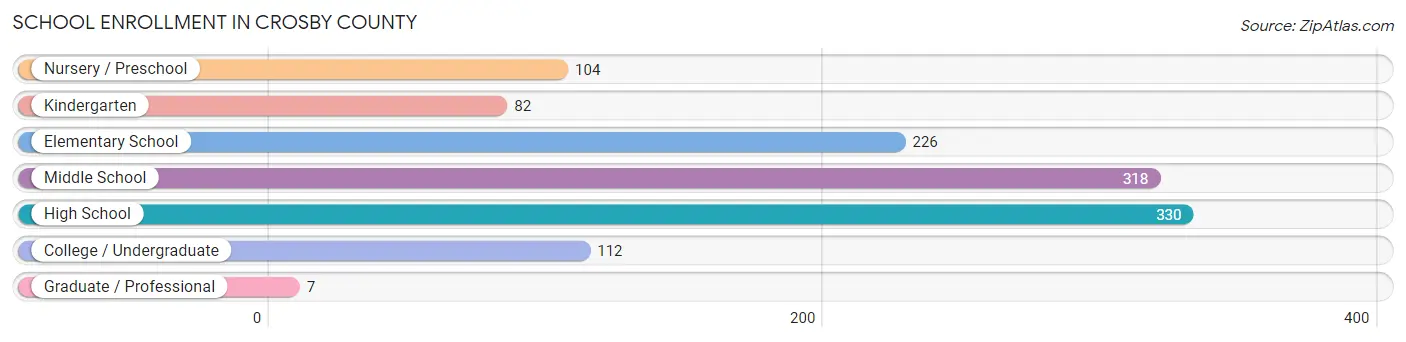
| School Level | # Students | % Students |
| Nursery / Preschool | 104 | 8.8% |
| Kindergarten | 82 | 7.0% |
| Elementary School | 226 | 19.2% |
| Middle School | 318 | 27.0% |
| High School | 330 | 28.0% |
| College / Undergraduate | 112 | 9.5% |
| Graduate / Professional | 7 | 0.6% |
| Total | 1,179 | 100.0% |
School Enrollment by Age by Funding Source in Crosby County
Out of a total of 1,179 students who are enrolled in schools in Crosby County, 61 (5.2%) attend a private institution, while the remaining 1,118 (94.8%) are enrolled in public schools. The age group of 10 to 14 year olds has the highest likelihood of being enrolled in private schools, with 33 (9.2% in the age bracket) enrolled. Conversely, the age group of 3 to 4 year olds has the lowest likelihood of being enrolled in a private school, with 75 (100.0% in the age bracket) attending a public institution.
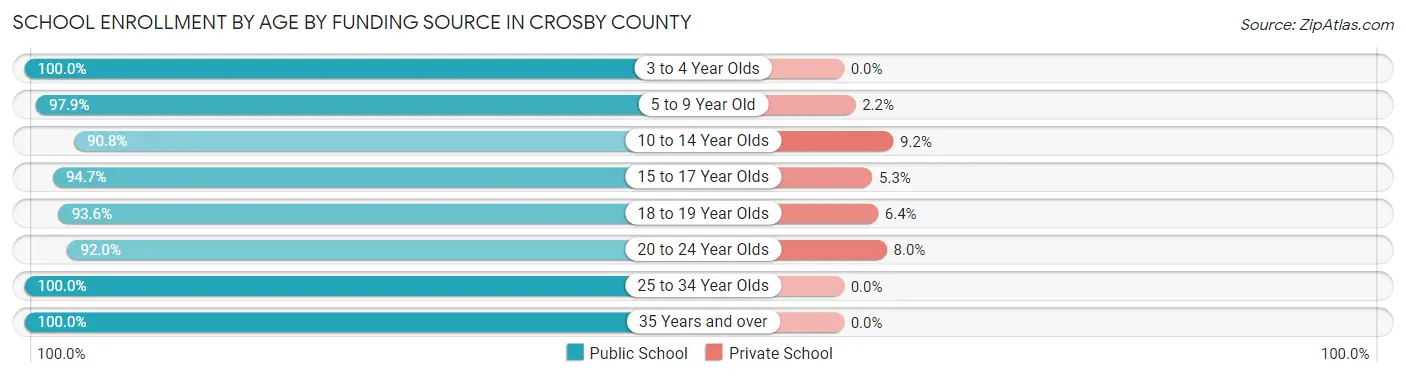
| Age Bracket | Public School | Private School |
| 3 to 4 Year Olds | 75 (100.0%) | 0 (0.0%) |
| 5 to 9 Year Old | 319 (97.9%) | 7 (2.1%) |
| 10 to 14 Year Olds | 325 (90.8%) | 33 (9.2%) |
| 15 to 17 Year Olds | 215 (94.7%) | 12 (5.3%) |
| 18 to 19 Year Olds | 103 (93.6%) | 7 (6.4%) |
| 20 to 24 Year Olds | 23 (92.0%) | 2 (8.0%) |
| 25 to 34 Year Olds | 17 (100.0%) | 0 (0.0%) |
| 35 Years and over | 41 (100.0%) | 0 (0.0%) |
| Total | 1,118 (94.8%) | 61 (5.2%) |
Educational Attainment by Field of Study in Crosby County
Education (150 | 28.6%), bio, nature & agricultural (91 | 17.4%), business (72 | 13.7%), arts & humanities (48 | 9.2%), and social sciences (34 | 6.5%) are the most common fields of study among 524 individuals in Crosby County who have obtained a bachelor's degree or higher.
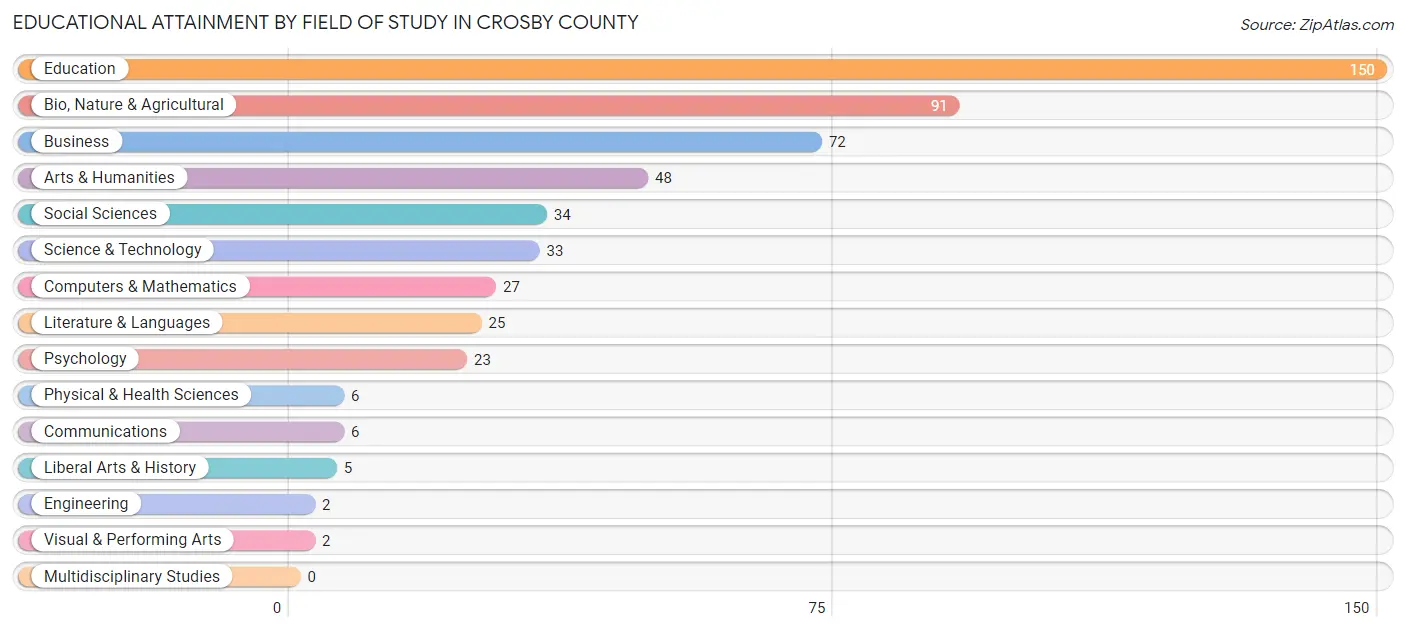
| Field of Study | # Graduates | % Graduates |
| Computers & Mathematics | 27 | 5.1% |
| Bio, Nature & Agricultural | 91 | 17.4% |
| Physical & Health Sciences | 6 | 1.1% |
| Psychology | 23 | 4.4% |
| Social Sciences | 34 | 6.5% |
| Engineering | 2 | 0.4% |
| Multidisciplinary Studies | 0 | 0.0% |
| Science & Technology | 33 | 6.3% |
| Business | 72 | 13.7% |
| Education | 150 | 28.6% |
| Literature & Languages | 25 | 4.8% |
| Liberal Arts & History | 5 | 0.9% |
| Visual & Performing Arts | 2 | 0.4% |
| Communications | 6 | 1.1% |
| Arts & Humanities | 48 | 9.2% |
| Total | 524 | 100.0% |
Transportation & Commute in Crosby County
Vehicle Availability by Sex in Crosby County
The most prevalent vehicle ownership categories in Crosby County are males with 2 vehicles (613, accounting for 45.3%) and females with 2 vehicles (398, making up 62.4%).
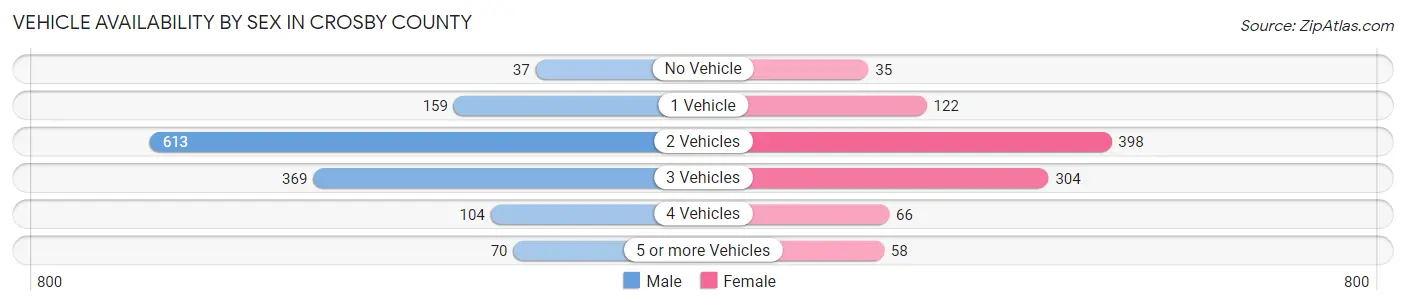
| Vehicles Available | Male | Female |
| No Vehicle | 37 (2.7%) | 35 (3.6%) |
| 1 Vehicle | 159 (11.8%) | 122 (12.4%) |
| 2 Vehicles | 613 (45.3%) | 398 (40.5%) |
| 3 Vehicles | 369 (27.3%) | 304 (30.9%) |
| 4 Vehicles | 104 (7.7%) | 66 (6.7%) |
| 5 or more Vehicles | 70 (5.2%) | 58 (5.9%) |
| Total | 1,352 (100.0%) | 983 (100.0%) |
Commute Time in Crosby County
The most frequently occuring commute durations in Crosby County are less than 5 minutes (417 commuters, 18.4%), 5 to 9 minutes (312 commuters, 13.8%), and 35 to 39 minutes (297 commuters, 13.1%).
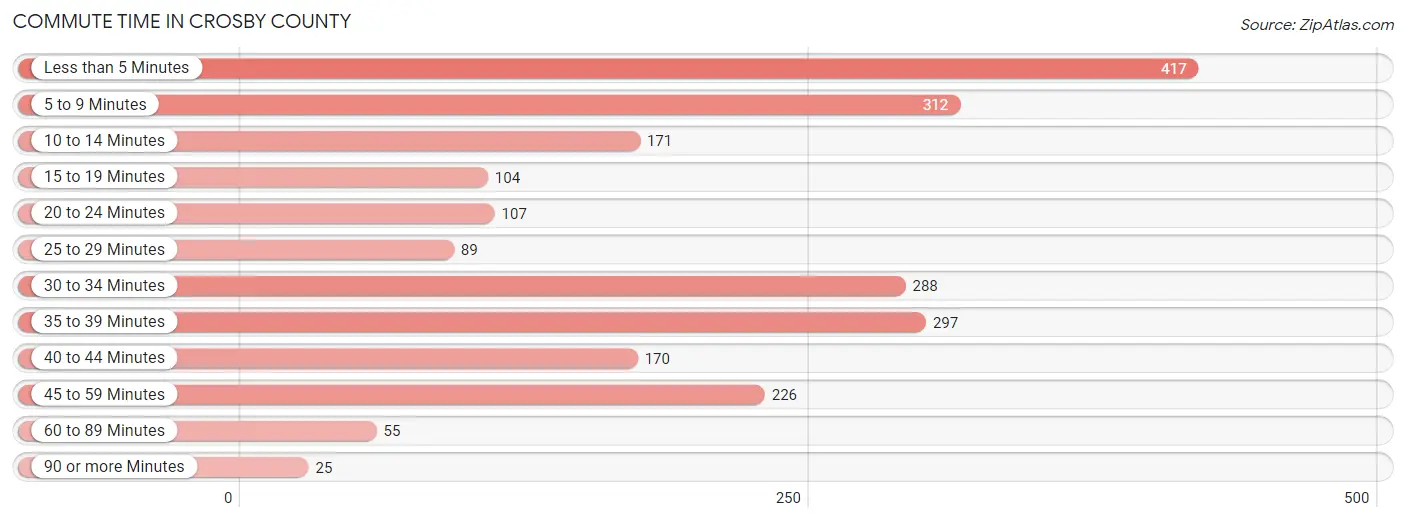
| Commute Time | # Commuters | % Commuters |
| Less than 5 Minutes | 417 | 18.4% |
| 5 to 9 Minutes | 312 | 13.8% |
| 10 to 14 Minutes | 171 | 7.6% |
| 15 to 19 Minutes | 104 | 4.6% |
| 20 to 24 Minutes | 107 | 4.7% |
| 25 to 29 Minutes | 89 | 3.9% |
| 30 to 34 Minutes | 288 | 12.7% |
| 35 to 39 Minutes | 297 | 13.1% |
| 40 to 44 Minutes | 170 | 7.5% |
| 45 to 59 Minutes | 226 | 10.0% |
| 60 to 89 Minutes | 55 | 2.4% |
| 90 or more Minutes | 25 | 1.1% |
Commute Time by Sex in Crosby County
The most common commute times in Crosby County are 35 to 39 minutes (189 commuters, 14.2%) for males and less than 5 minutes (265 commuters, 28.6%) for females.
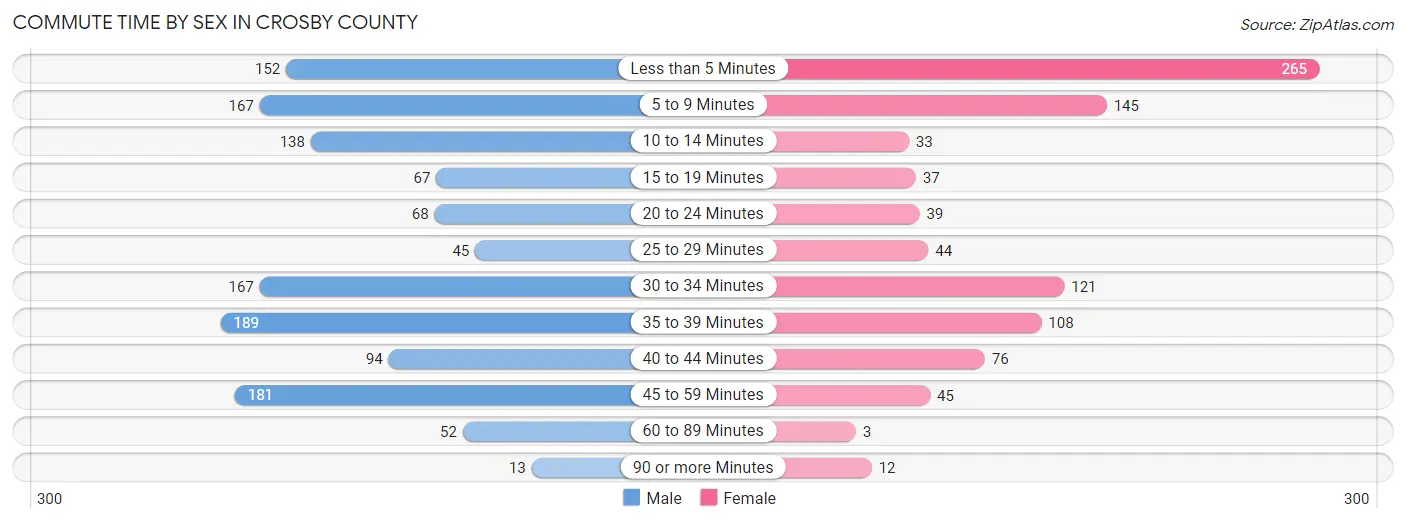
| Commute Time | Male | Female |
| Less than 5 Minutes | 152 (11.4%) | 265 (28.6%) |
| 5 to 9 Minutes | 167 (12.5%) | 145 (15.6%) |
| 10 to 14 Minutes | 138 (10.3%) | 33 (3.6%) |
| 15 to 19 Minutes | 67 (5.0%) | 37 (4.0%) |
| 20 to 24 Minutes | 68 (5.1%) | 39 (4.2%) |
| 25 to 29 Minutes | 45 (3.4%) | 44 (4.7%) |
| 30 to 34 Minutes | 167 (12.5%) | 121 (13.0%) |
| 35 to 39 Minutes | 189 (14.2%) | 108 (11.6%) |
| 40 to 44 Minutes | 94 (7.0%) | 76 (8.2%) |
| 45 to 59 Minutes | 181 (13.6%) | 45 (4.9%) |
| 60 to 89 Minutes | 52 (3.9%) | 3 (0.3%) |
| 90 or more Minutes | 13 (1.0%) | 12 (1.3%) |
Time of Departure to Work by Sex in Crosby County
The most frequent times of departure to work in Crosby County are 7:30 AM to 7:59 AM (290, 21.8%) for males and 7:30 AM to 7:59 AM (276, 29.7%) for females.
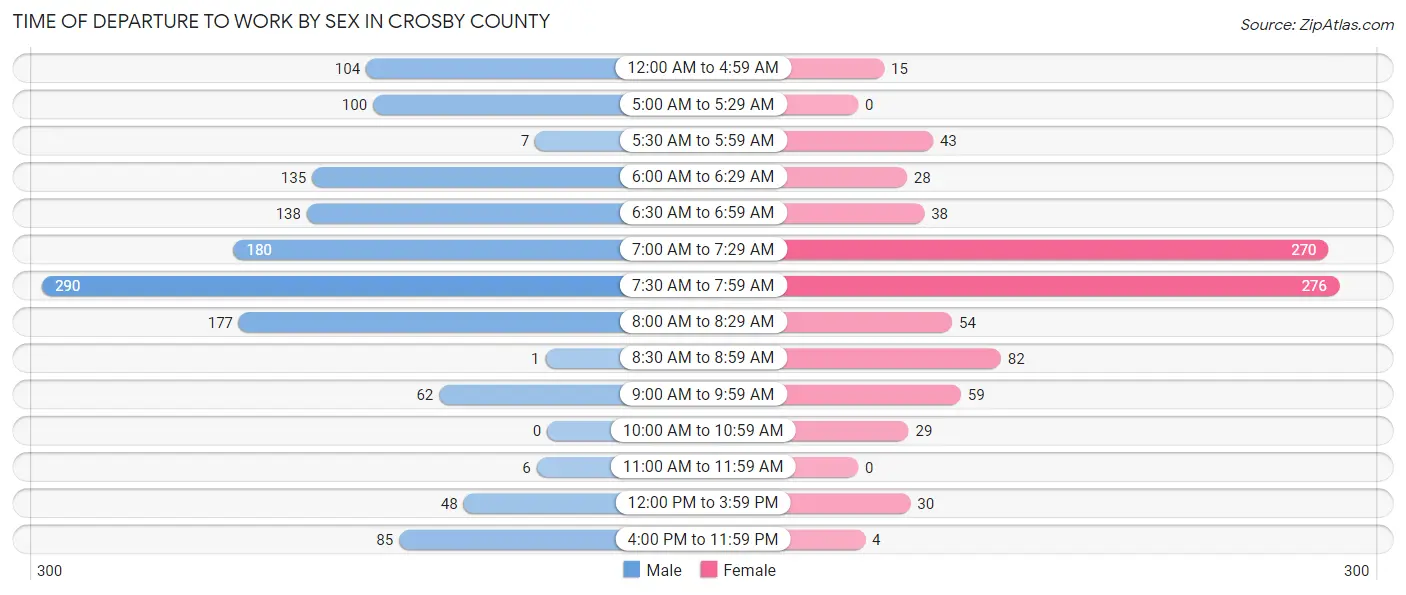
| Time of Departure | Male | Female |
| 12:00 AM to 4:59 AM | 104 (7.8%) | 15 (1.6%) |
| 5:00 AM to 5:29 AM | 100 (7.5%) | 0 (0.0%) |
| 5:30 AM to 5:59 AM | 7 (0.5%) | 43 (4.6%) |
| 6:00 AM to 6:29 AM | 135 (10.1%) | 28 (3.0%) |
| 6:30 AM to 6:59 AM | 138 (10.3%) | 38 (4.1%) |
| 7:00 AM to 7:29 AM | 180 (13.5%) | 270 (29.1%) |
| 7:30 AM to 7:59 AM | 290 (21.8%) | 276 (29.7%) |
| 8:00 AM to 8:29 AM | 177 (13.3%) | 54 (5.8%) |
| 8:30 AM to 8:59 AM | 1 (0.1%) | 82 (8.8%) |
| 9:00 AM to 9:59 AM | 62 (4.6%) | 59 (6.4%) |
| 10:00 AM to 10:59 AM | 0 (0.0%) | 29 (3.1%) |
| 11:00 AM to 11:59 AM | 6 (0.4%) | 0 (0.0%) |
| 12:00 PM to 3:59 PM | 48 (3.6%) | 30 (3.2%) |
| 4:00 PM to 11:59 PM | 85 (6.4%) | 4 (0.4%) |
| Total | 1,333 (100.0%) | 928 (100.0%) |
Housing Occupancy in Crosby County
Occupancy by Ownership in Crosby County
Of the total 1,994 dwellings in Crosby County, owner-occupied units account for 1,414 (70.9%), while renter-occupied units make up 580 (29.1%).
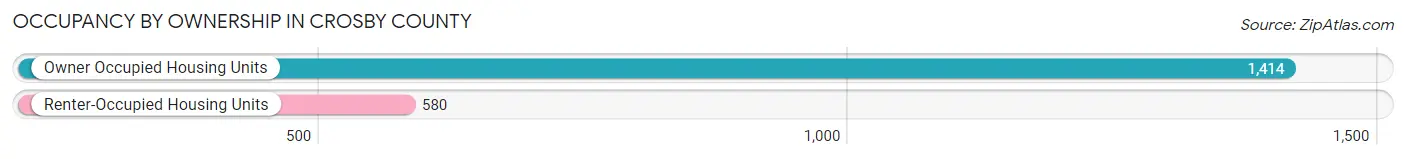
| Occupancy | # Housing Units | % Housing Units |
| Owner Occupied Housing Units | 1,414 | 70.9% |
| Renter-Occupied Housing Units | 580 | 29.1% |
| Total Occupied Housing Units | 1,994 | 100.0% |
Occupancy by Household Size in Crosby County
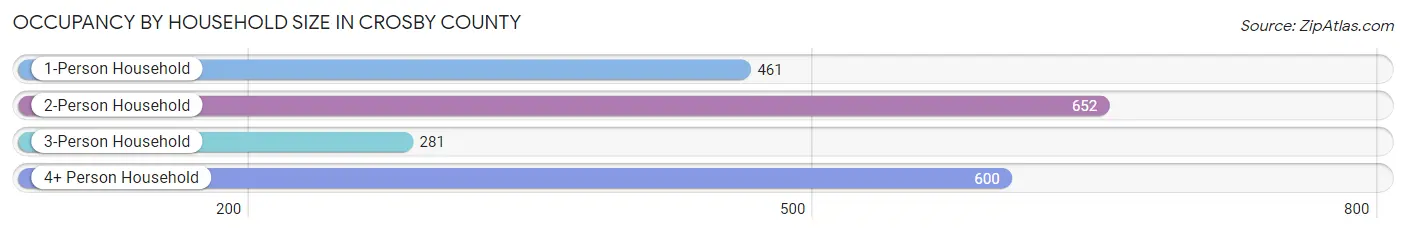
| Household Size | # Housing Units | % Housing Units |
| 1-Person Household | 461 | 23.1% |
| 2-Person Household | 652 | 32.7% |
| 3-Person Household | 281 | 14.1% |
| 4+ Person Household | 600 | 30.1% |
| Total Housing Units | 1,994 | 100.0% |
Occupancy by Ownership by Household Size in Crosby County
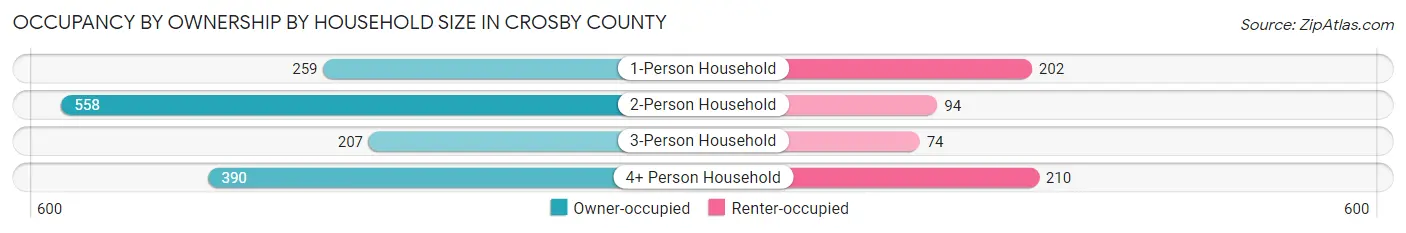
| Household Size | Owner-occupied | Renter-occupied |
| 1-Person Household | 259 (56.2%) | 202 (43.8%) |
| 2-Person Household | 558 (85.6%) | 94 (14.4%) |
| 3-Person Household | 207 (73.7%) | 74 (26.3%) |
| 4+ Person Household | 390 (65.0%) | 210 (35.0%) |
| Total Housing Units | 1,414 (70.9%) | 580 (29.1%) |
Occupancy by Educational Attainment in Crosby County
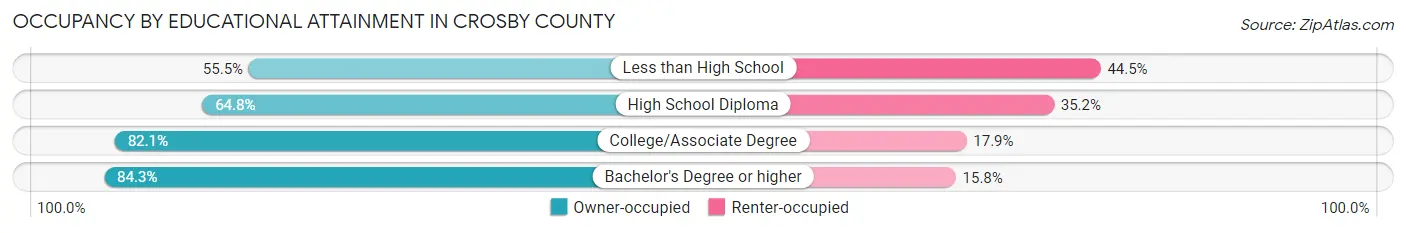
| Household Size | Owner-occupied | Renter-occupied |
| Less than High School | 236 (55.5%) | 189 (44.5%) |
| High School Diploma | 436 (64.8%) | 237 (35.2%) |
| College/Associate Degree | 496 (82.1%) | 108 (17.9%) |
| Bachelor's Degree or higher | 246 (84.3%) | 46 (15.8%) |
Occupancy by Age of Householder in Crosby County
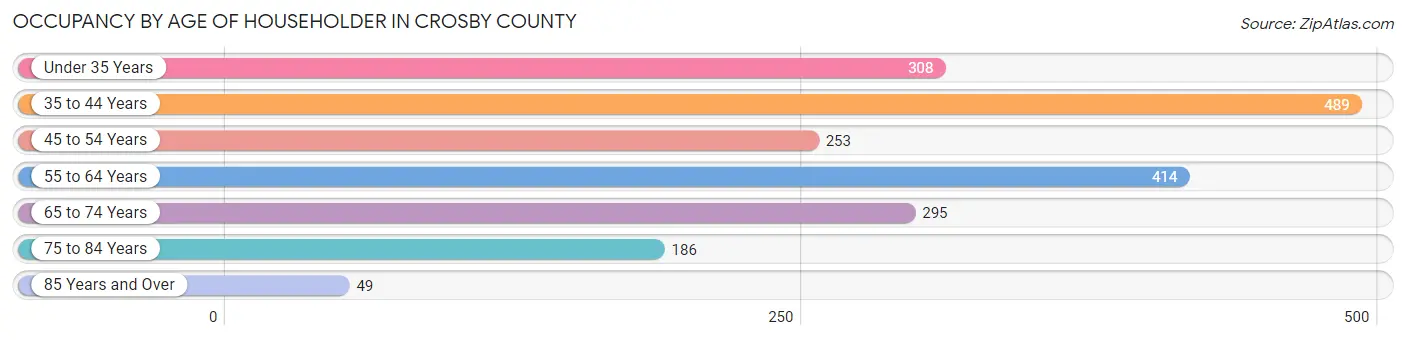
| Age Bracket | # Households | % Households |
| Under 35 Years | 308 | 15.4% |
| 35 to 44 Years | 489 | 24.5% |
| 45 to 54 Years | 253 | 12.7% |
| 55 to 64 Years | 414 | 20.8% |
| 65 to 74 Years | 295 | 14.8% |
| 75 to 84 Years | 186 | 9.3% |
| 85 Years and Over | 49 | 2.5% |
| Total | 1,994 | 100.0% |
Housing Finances in Crosby County
Median Income by Occupancy in Crosby County
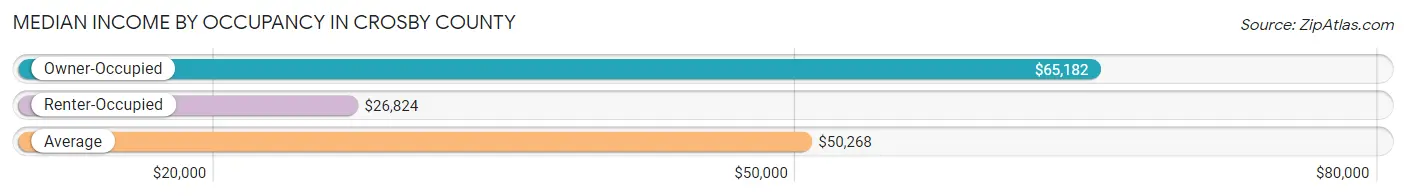
| Occupancy Type | # Households | Median Income |
| Owner-Occupied | 1,414 (70.9%) | $65,182 |
| Renter-Occupied | 580 (29.1%) | $26,824 |
| Average | 1,994 (100.0%) | $50,268 |
Occupancy by Householder Income Bracket in Crosby County
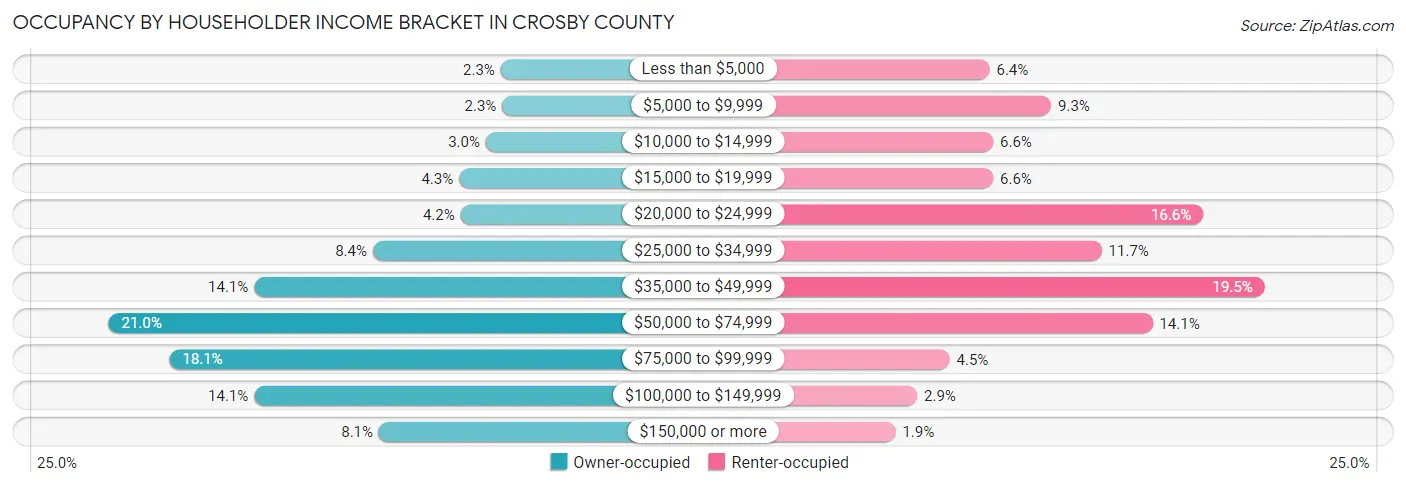
| Income Bracket | Owner-occupied | Renter-occupied |
| Less than $5,000 | 33 (2.3%) | 37 (6.4%) |
| $5,000 to $9,999 | 32 (2.3%) | 54 (9.3%) |
| $10,000 to $14,999 | 43 (3.0%) | 38 (6.6%) |
| $15,000 to $19,999 | 61 (4.3%) | 38 (6.6%) |
| $20,000 to $24,999 | 60 (4.2%) | 96 (16.6%) |
| $25,000 to $34,999 | 119 (8.4%) | 68 (11.7%) |
| $35,000 to $49,999 | 199 (14.1%) | 113 (19.5%) |
| $50,000 to $74,999 | 297 (21.0%) | 82 (14.1%) |
| $75,000 to $99,999 | 256 (18.1%) | 26 (4.5%) |
| $100,000 to $149,999 | 199 (14.1%) | 17 (2.9%) |
| $150,000 or more | 115 (8.1%) | 11 (1.9%) |
| Total | 1,414 (100.0%) | 580 (100.0%) |
Monthly Housing Cost Tiers in Crosby County
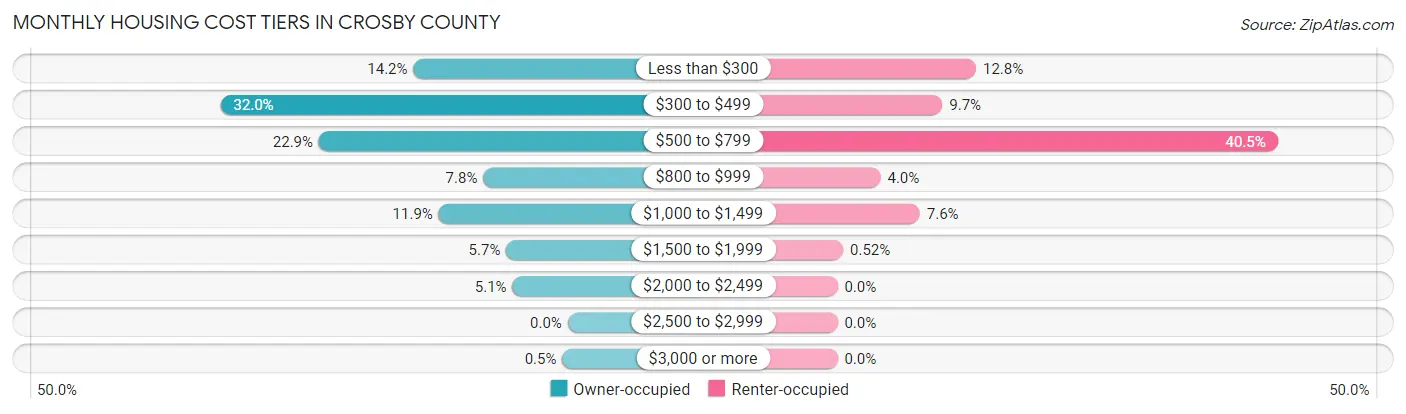
| Monthly Cost | Owner-occupied | Renter-occupied |
| Less than $300 | 201 (14.2%) | 74 (12.8%) |
| $300 to $499 | 452 (32.0%) | 56 (9.7%) |
| $500 to $799 | 324 (22.9%) | 235 (40.5%) |
| $800 to $999 | 110 (7.8%) | 23 (4.0%) |
| $1,000 to $1,499 | 168 (11.9%) | 44 (7.6%) |
| $1,500 to $1,999 | 80 (5.7%) | 3 (0.5%) |
| $2,000 to $2,499 | 72 (5.1%) | 0 (0.0%) |
| $2,500 to $2,999 | 0 (0.0%) | 0 (0.0%) |
| $3,000 or more | 7 (0.5%) | 0 (0.0%) |
| Total | 1,414 (100.0%) | 580 (100.0%) |
Physical Housing Characteristics in Crosby County
Housing Structures in Crosby County
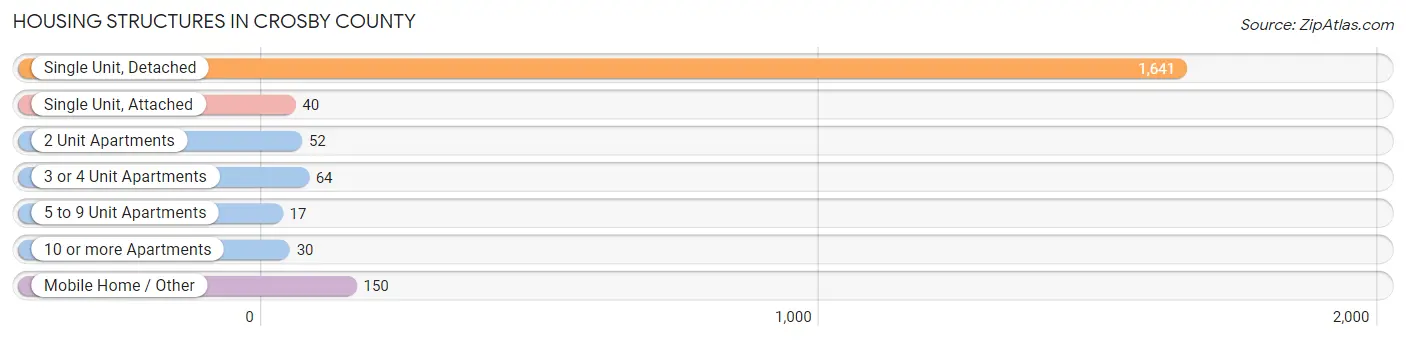
| Structure Type | # Housing Units | % Housing Units |
| Single Unit, Detached | 1,641 | 82.3% |
| Single Unit, Attached | 40 | 2.0% |
| 2 Unit Apartments | 52 | 2.6% |
| 3 or 4 Unit Apartments | 64 | 3.2% |
| 5 to 9 Unit Apartments | 17 | 0.9% |
| 10 or more Apartments | 30 | 1.5% |
| Mobile Home / Other | 150 | 7.5% |
| Total | 1,994 | 100.0% |
Housing Structures by Occupancy in Crosby County
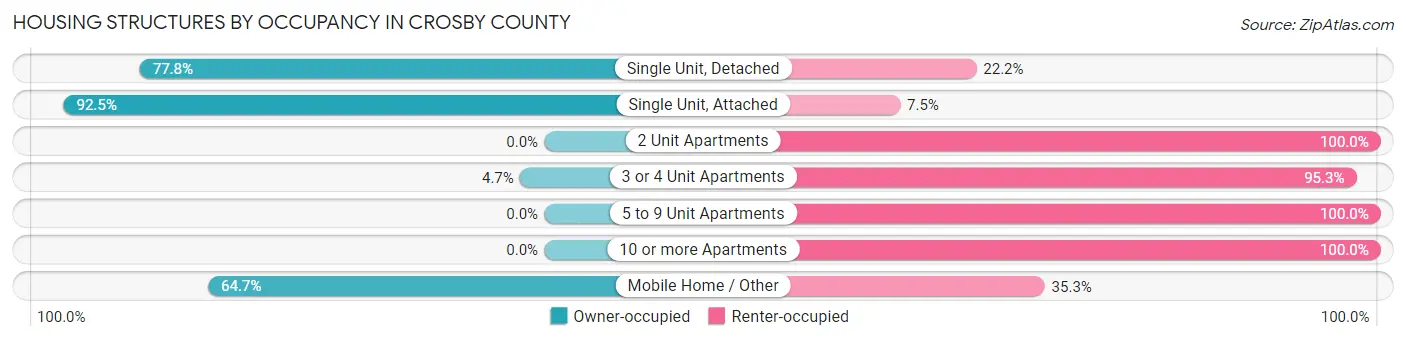
| Structure Type | Owner-occupied | Renter-occupied |
| Single Unit, Detached | 1,277 (77.8%) | 364 (22.2%) |
| Single Unit, Attached | 37 (92.5%) | 3 (7.5%) |
| 2 Unit Apartments | 0 (0.0%) | 52 (100.0%) |
| 3 or 4 Unit Apartments | 3 (4.7%) | 61 (95.3%) |
| 5 to 9 Unit Apartments | 0 (0.0%) | 17 (100.0%) |
| 10 or more Apartments | 0 (0.0%) | 30 (100.0%) |
| Mobile Home / Other | 97 (64.7%) | 53 (35.3%) |
| Total | 1,414 (70.9%) | 580 (29.1%) |
Housing Structures by Number of Rooms in Crosby County
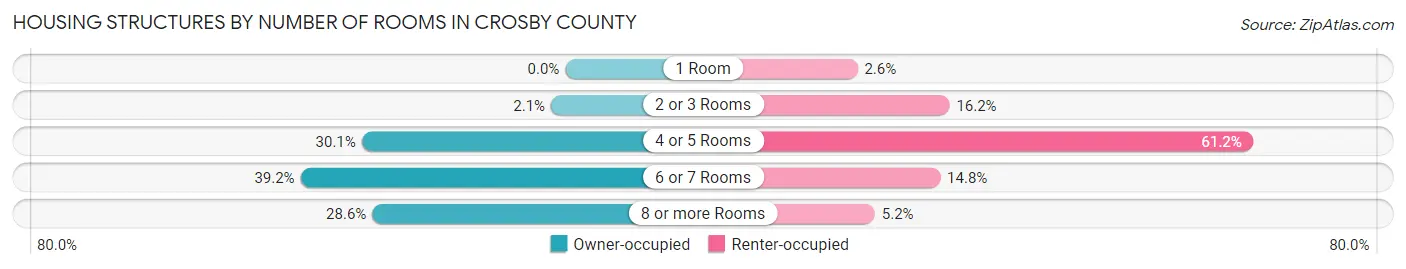
| Number of Rooms | Owner-occupied | Renter-occupied |
| 1 Room | 0 (0.0%) | 15 (2.6%) |
| 2 or 3 Rooms | 30 (2.1%) | 94 (16.2%) |
| 4 or 5 Rooms | 426 (30.1%) | 355 (61.2%) |
| 6 or 7 Rooms | 554 (39.2%) | 86 (14.8%) |
| 8 or more Rooms | 404 (28.6%) | 30 (5.2%) |
| Total | 1,414 (100.0%) | 580 (100.0%) |
Housing Structure by Heating Type in Crosby County
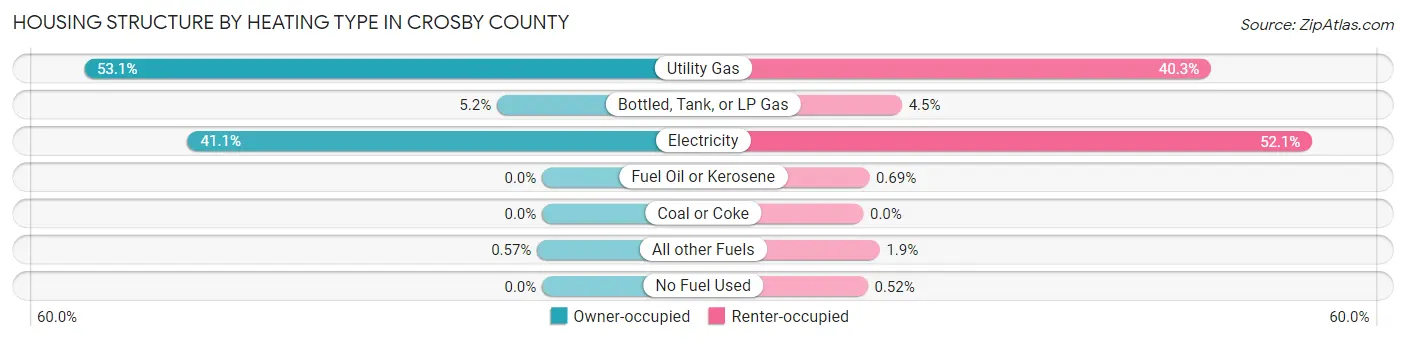
| Heating Type | Owner-occupied | Renter-occupied |
| Utility Gas | 751 (53.1%) | 234 (40.3%) |
| Bottled, Tank, or LP Gas | 74 (5.2%) | 26 (4.5%) |
| Electricity | 581 (41.1%) | 302 (52.1%) |
| Fuel Oil or Kerosene | 0 (0.0%) | 4 (0.7%) |
| Coal or Coke | 0 (0.0%) | 0 (0.0%) |
| All other Fuels | 8 (0.6%) | 11 (1.9%) |
| No Fuel Used | 0 (0.0%) | 3 (0.5%) |
| Total | 1,414 (100.0%) | 580 (100.0%) |
Household Vehicle Usage in Crosby County
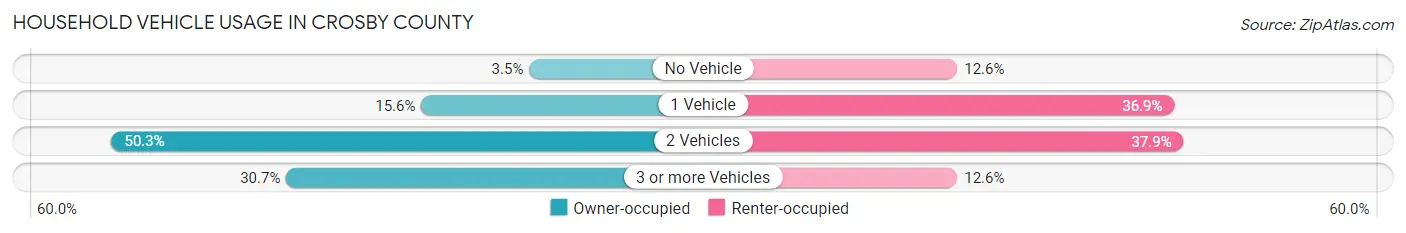
| Vehicles per Household | Owner-occupied | Renter-occupied |
| No Vehicle | 49 (3.5%) | 73 (12.6%) |
| 1 Vehicle | 220 (15.6%) | 214 (36.9%) |
| 2 Vehicles | 711 (50.3%) | 220 (37.9%) |
| 3 or more Vehicles | 434 (30.7%) | 73 (12.6%) |
| Total | 1,414 (100.0%) | 580 (100.0%) |
Real Estate & Mortgages in Crosby County
Real Estate and Mortgage Overview in Crosby County
| Characteristic | Without Mortgage | With Mortgage |
| Housing Units | 1,005 | 409 |
| Median Property Value | $58,900 | $97,800 |
| Median Household Income | $51,827 | $37 |
| Monthly Housing Costs | $432 | $7 |
| Real Estate Taxes | $1,179 | $0 |
Property Value by Mortgage Status in Crosby County
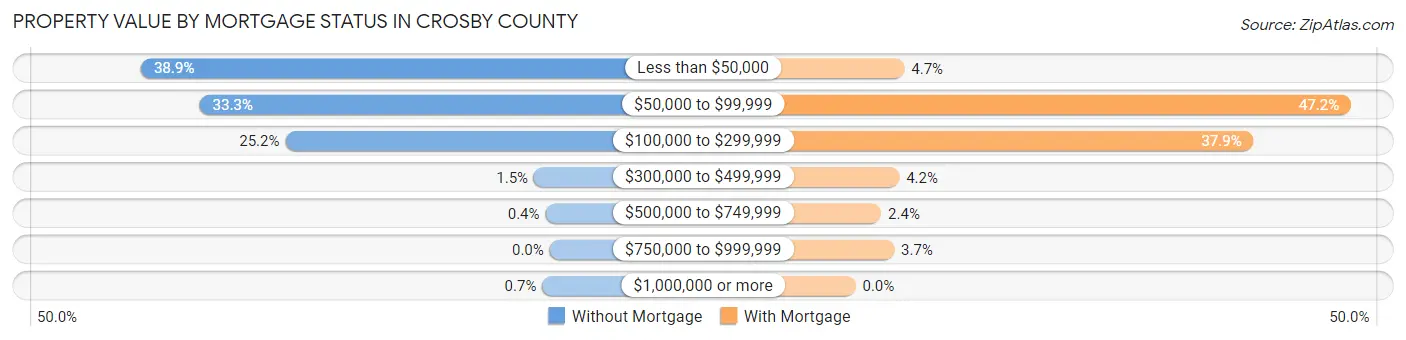
| Property Value | Without Mortgage | With Mortgage |
| Less than $50,000 | 391 (38.9%) | 19 (4.6%) |
| $50,000 to $99,999 | 335 (33.3%) | 193 (47.2%) |
| $100,000 to $299,999 | 253 (25.2%) | 155 (37.9%) |
| $300,000 to $499,999 | 15 (1.5%) | 17 (4.2%) |
| $500,000 to $749,999 | 4 (0.4%) | 10 (2.4%) |
| $750,000 to $999,999 | 0 (0.0%) | 15 (3.7%) |
| $1,000,000 or more | 7 (0.7%) | 0 (0.0%) |
| Total | 1,005 (100.0%) | 409 (100.0%) |
Household Income by Mortgage Status in Crosby County
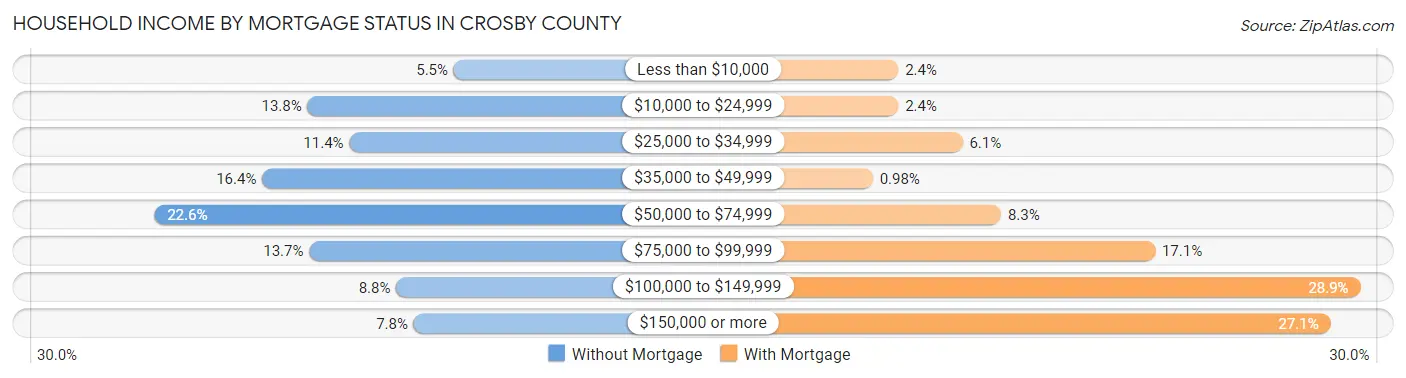
| Household Income | Without Mortgage | With Mortgage |
| Less than $10,000 | 55 (5.5%) | 10 (2.4%) |
| $10,000 to $24,999 | 139 (13.8%) | 10 (2.4%) |
| $25,000 to $34,999 | 115 (11.4%) | 25 (6.1%) |
| $35,000 to $49,999 | 165 (16.4%) | 4 (1.0%) |
| $50,000 to $74,999 | 227 (22.6%) | 34 (8.3%) |
| $75,000 to $99,999 | 138 (13.7%) | 70 (17.1%) |
| $100,000 to $149,999 | 88 (8.8%) | 118 (28.8%) |
| $150,000 or more | 78 (7.8%) | 111 (27.1%) |
| Total | 1,005 (100.0%) | 409 (100.0%) |
Property Value to Household Income Ratio in Crosby County
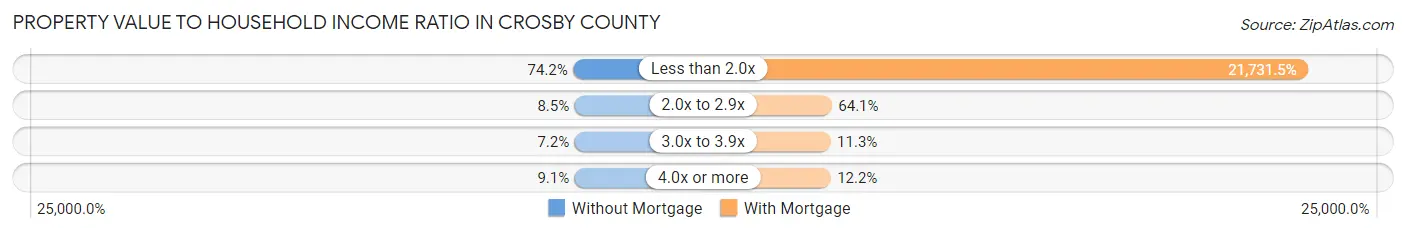
| Value-to-Income Ratio | Without Mortgage | With Mortgage |
| Less than 2.0x | 746 (74.2%) | 88,882 (21,731.5%) |
| 2.0x to 2.9x | 85 (8.5%) | 262 (64.1%) |
| 3.0x to 3.9x | 72 (7.2%) | 46 (11.3%) |
| 4.0x or more | 91 (9.0%) | 50 (12.2%) |
| Total | 1,005 (100.0%) | 409 (100.0%) |
Real Estate Taxes by Mortgage Status in Crosby County
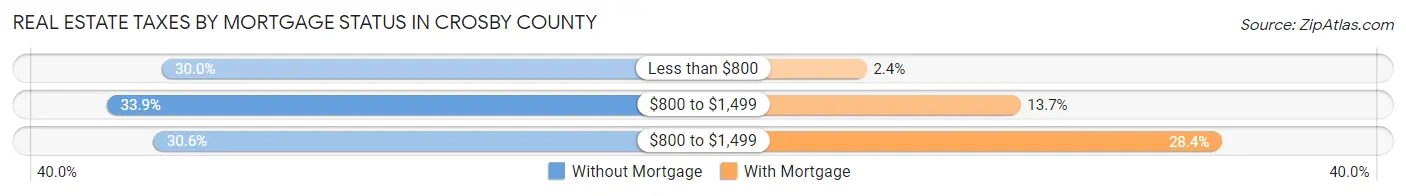
| Property Taxes | Without Mortgage | With Mortgage |
| Less than $800 | 301 (29.9%) | 10 (2.4%) |
| $800 to $1,499 | 341 (33.9%) | 56 (13.7%) |
| $800 to $1,499 | 307 (30.5%) | 116 (28.4%) |
| Total | 1,005 (100.0%) | 409 (100.0%) |
Health & Disability in Crosby County
Health Insurance Coverage by Age in Crosby County
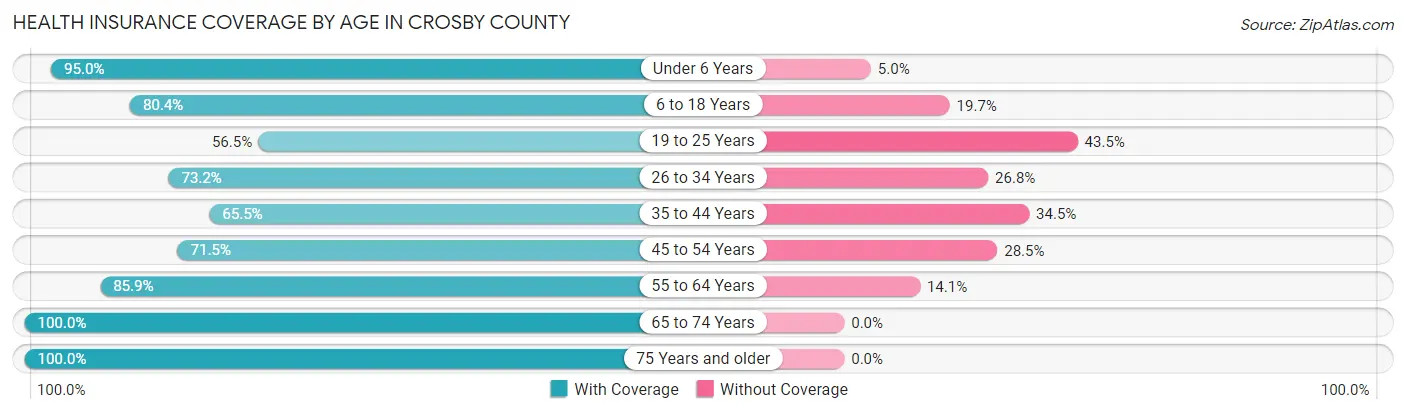
| Age Bracket | With Coverage | Without Coverage |
| Under 6 Years | 383 (95.0%) | 20 (5.0%) |
| 6 to 18 Years | 826 (80.3%) | 202 (19.7%) |
| 19 to 25 Years | 231 (56.5%) | 178 (43.5%) |
| 26 to 34 Years | 330 (73.2%) | 121 (26.8%) |
| 35 to 44 Years | 519 (65.5%) | 273 (34.5%) |
| 45 to 54 Years | 318 (71.5%) | 127 (28.5%) |
| 55 to 64 Years | 554 (85.9%) | 91 (14.1%) |
| 65 to 74 Years | 515 (100.0%) | 0 (0.0%) |
| 75 Years and older | 379 (100.0%) | 0 (0.0%) |
| Total | 4,055 (80.0%) | 1,012 (20.0%) |
Health Insurance Coverage by Citizenship Status in Crosby County
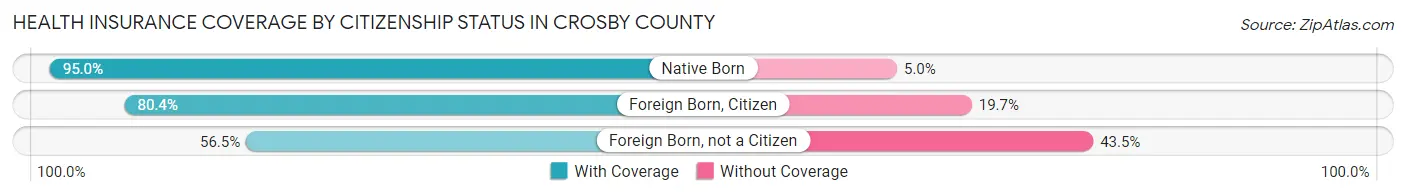
| Citizenship Status | With Coverage | Without Coverage |
| Native Born | 383 (95.0%) | 20 (5.0%) |
| Foreign Born, Citizen | 826 (80.3%) | 202 (19.7%) |
| Foreign Born, not a Citizen | 231 (56.5%) | 178 (43.5%) |
Health Insurance Coverage by Household Income in Crosby County
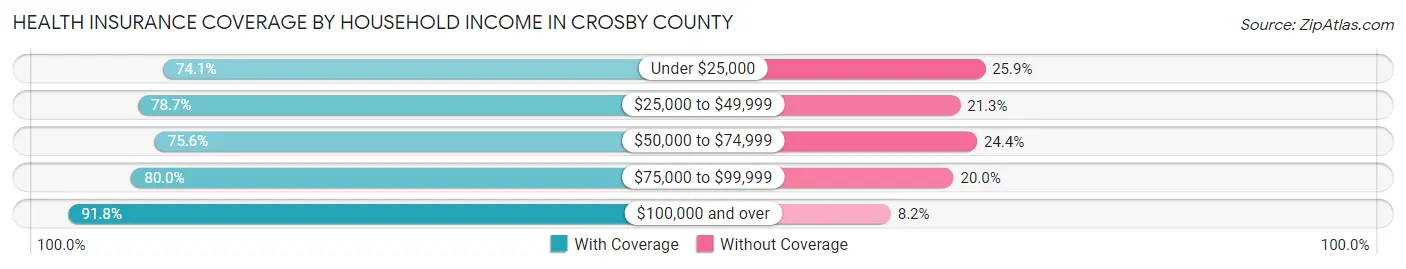
| Household Income | With Coverage | Without Coverage |
| Under $25,000 | 671 (74.1%) | 235 (25.9%) |
| $25,000 to $49,999 | 948 (78.7%) | 256 (21.3%) |
| $50,000 to $74,999 | 799 (75.6%) | 258 (24.4%) |
| $75,000 to $99,999 | 724 (80.0%) | 181 (20.0%) |
| $100,000 and over | 913 (91.8%) | 82 (8.2%) |
Public vs Private Health Insurance Coverage by Age in Crosby County
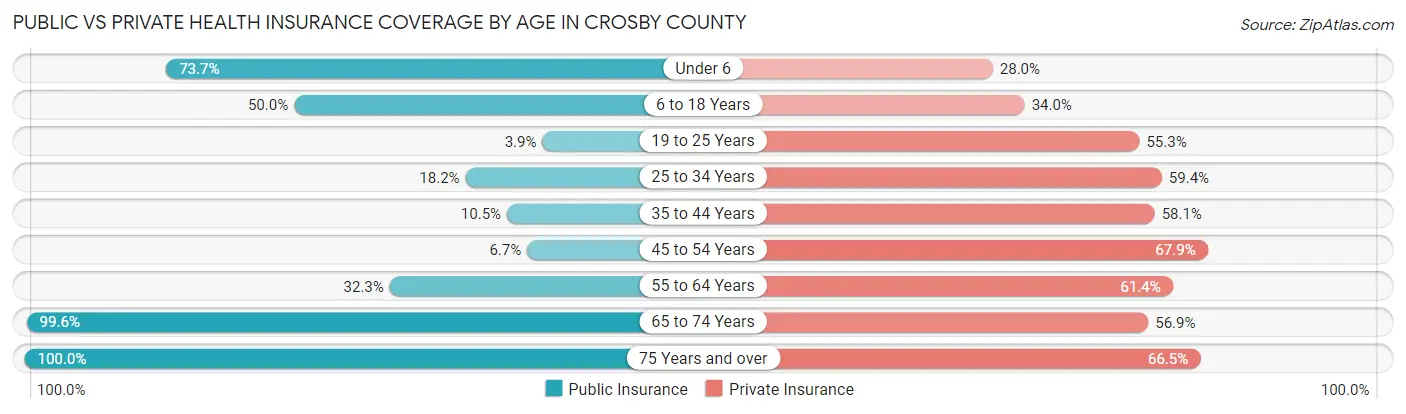
| Age Bracket | Public Insurance | Private Insurance |
| Under 6 | 297 (73.7%) | 113 (28.0%) |
| 6 to 18 Years | 514 (50.0%) | 349 (34.0%) |
| 19 to 25 Years | 16 (3.9%) | 226 (55.3%) |
| 25 to 34 Years | 82 (18.2%) | 268 (59.4%) |
| 35 to 44 Years | 83 (10.5%) | 460 (58.1%) |
| 45 to 54 Years | 30 (6.7%) | 302 (67.9%) |
| 55 to 64 Years | 208 (32.3%) | 396 (61.4%) |
| 65 to 74 Years | 513 (99.6%) | 293 (56.9%) |
| 75 Years and over | 379 (100.0%) | 252 (66.5%) |
| Total | 2,122 (41.9%) | 2,659 (52.5%) |
Disability Status by Sex by Age in Crosby County
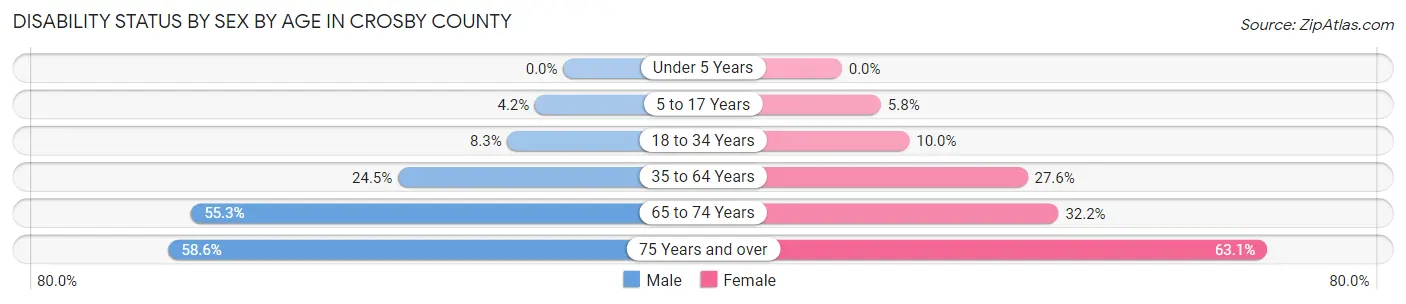
| Age Bracket | Male | Female |
| Under 5 Years | 0 (0.0%) | 0 (0.0%) |
| 5 to 17 Years | 22 (4.2%) | 27 (5.8%) |
| 18 to 34 Years | 43 (8.3%) | 46 (10.0%) |
| 35 to 64 Years | 226 (24.5%) | 265 (27.6%) |
| 65 to 74 Years | 142 (55.2%) | 83 (32.2%) |
| 75 Years and over | 95 (58.6%) | 137 (63.1%) |
Disability Class by Sex by Age in Crosby County
Disability Class: Hearing Difficulty
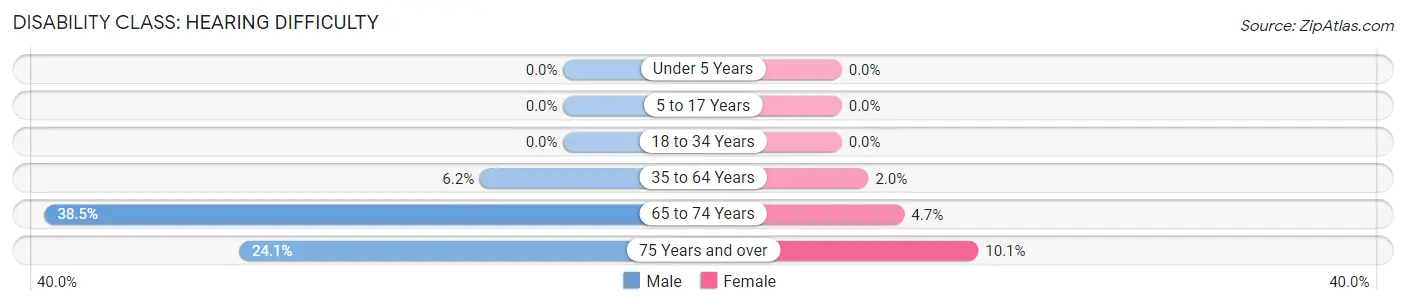
| Age Bracket | Male | Female |
| Under 5 Years | 0 (0.0%) | 0 (0.0%) |
| 5 to 17 Years | 0 (0.0%) | 0 (0.0%) |
| 18 to 34 Years | 0 (0.0%) | 0 (0.0%) |
| 35 to 64 Years | 57 (6.2%) | 19 (2.0%) |
| 65 to 74 Years | 99 (38.5%) | 12 (4.6%) |
| 75 Years and over | 39 (24.1%) | 22 (10.1%) |
Disability Class: Vision Difficulty
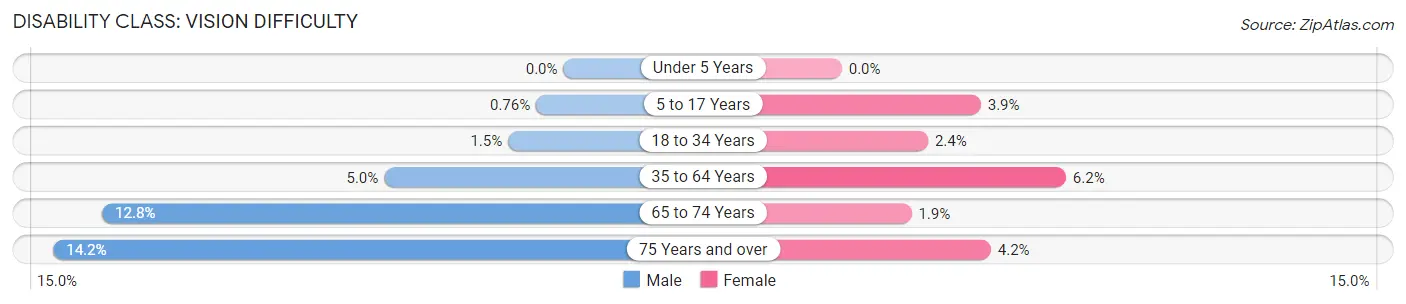
| Age Bracket | Male | Female |
| Under 5 Years | 0 (0.0%) | 0 (0.0%) |
| 5 to 17 Years | 4 (0.8%) | 18 (3.9%) |
| 18 to 34 Years | 8 (1.5%) | 11 (2.4%) |
| 35 to 64 Years | 46 (5.0%) | 60 (6.2%) |
| 65 to 74 Years | 33 (12.8%) | 5 (1.9%) |
| 75 Years and over | 23 (14.2%) | 9 (4.2%) |
Disability Class: Cognitive Difficulty
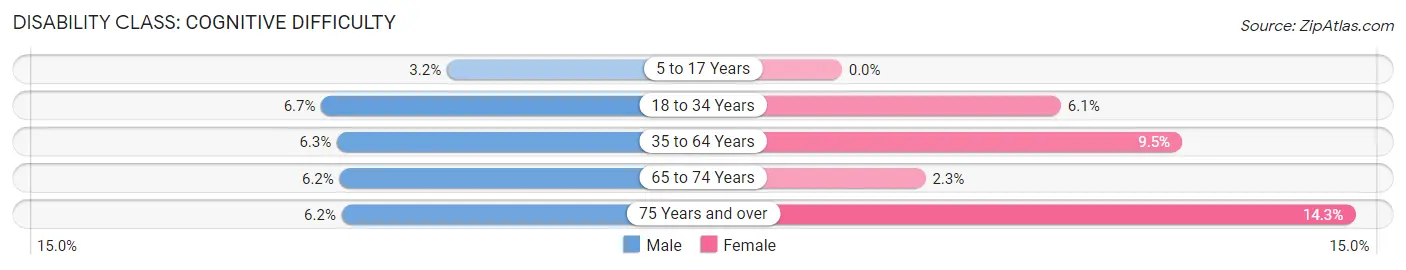
| Age Bracket | Male | Female |
| 5 to 17 Years | 17 (3.2%) | 0 (0.0%) |
| 18 to 34 Years | 35 (6.7%) | 28 (6.1%) |
| 35 to 64 Years | 58 (6.3%) | 91 (9.5%) |
| 65 to 74 Years | 16 (6.2%) | 6 (2.3%) |
| 75 Years and over | 10 (6.2%) | 31 (14.3%) |
Disability Class: Ambulatory Difficulty
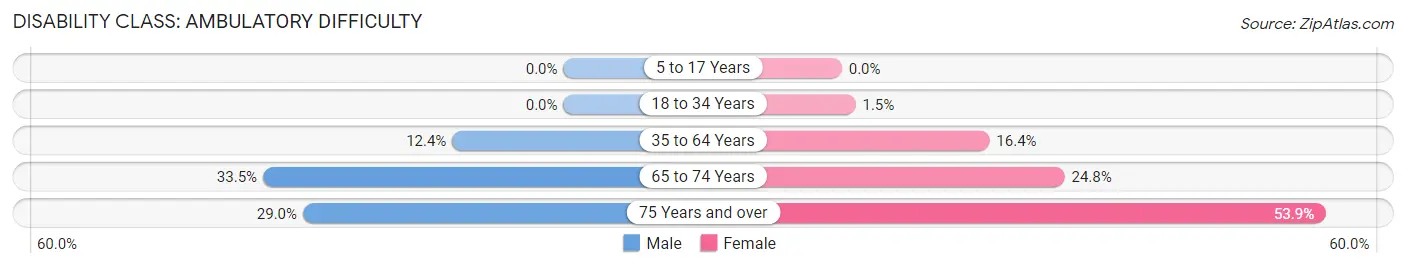
| Age Bracket | Male | Female |
| 5 to 17 Years | 0 (0.0%) | 0 (0.0%) |
| 18 to 34 Years | 0 (0.0%) | 7 (1.5%) |
| 35 to 64 Years | 114 (12.4%) | 158 (16.4%) |
| 65 to 74 Years | 86 (33.5%) | 64 (24.8%) |
| 75 Years and over | 47 (29.0%) | 117 (53.9%) |
Disability Class: Self-Care Difficulty
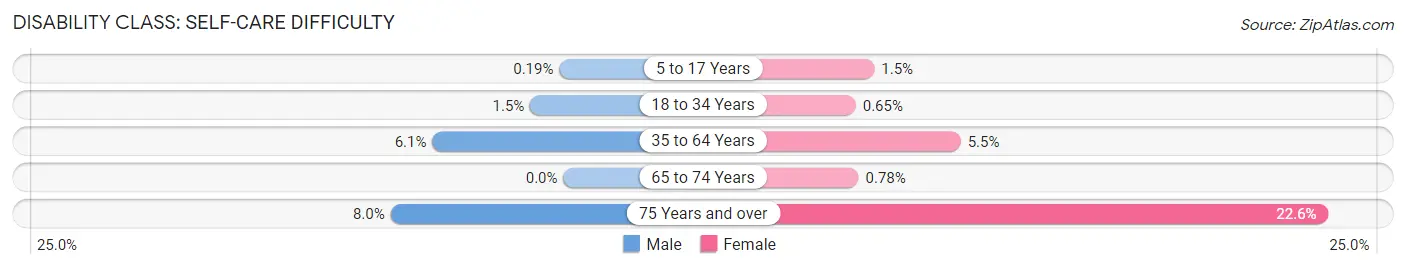
| Age Bracket | Male | Female |
| 5 to 17 Years | 1 (0.2%) | 7 (1.5%) |
| 18 to 34 Years | 8 (1.5%) | 3 (0.6%) |
| 35 to 64 Years | 56 (6.1%) | 53 (5.5%) |
| 65 to 74 Years | 0 (0.0%) | 2 (0.8%) |
| 75 Years and over | 13 (8.0%) | 49 (22.6%) |
Technology Access in Crosby County
Computing Device Access in Crosby County
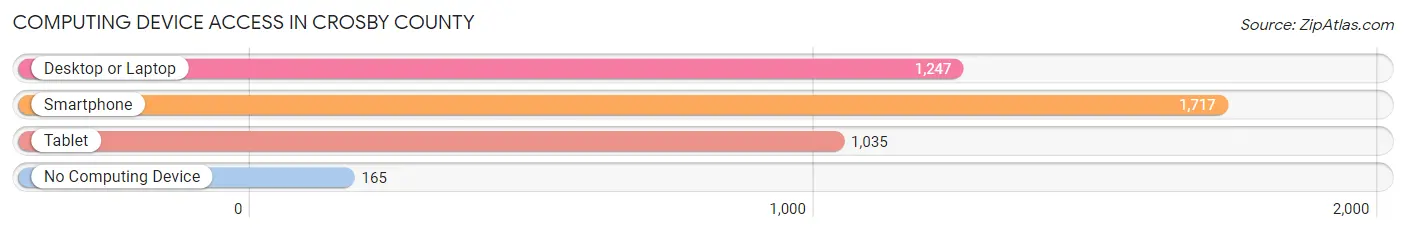
| Device Type | # Households | % Households |
| Desktop or Laptop | 1,247 | 62.5% |
| Smartphone | 1,717 | 86.1% |
| Tablet | 1,035 | 51.9% |
| No Computing Device | 165 | 8.3% |
| Total | 1,994 | 100.0% |
Internet Access in Crosby County
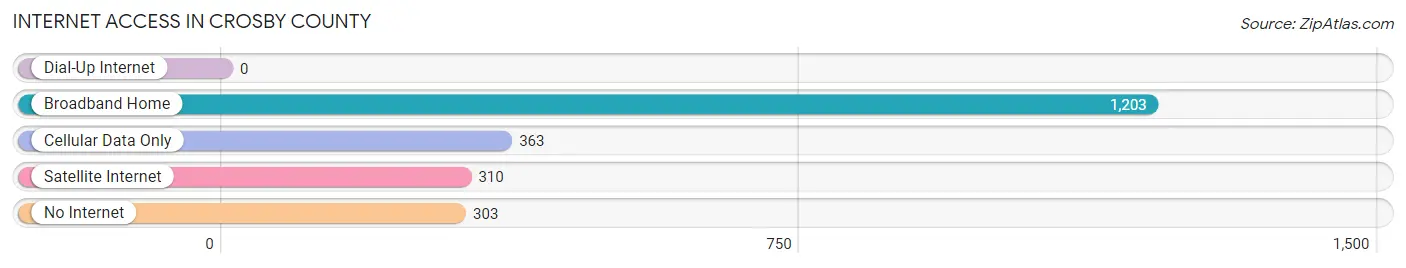
| Internet Type | # Households | % Households |
| Dial-Up Internet | 0 | 0.0% |
| Broadband Home | 1,203 | 60.3% |
| Cellular Data Only | 363 | 18.2% |
| Satellite Internet | 310 | 15.5% |
| No Internet | 303 | 15.2% |
| Total | 1,994 | 100.0% |
Crosby County Summary
Crosby County is located in the northwestern corner of the state of Texas, and is part of the Lubbock Metropolitan Statistical Area. The county was established in 1876 and is named after Stephen Crosby, a soldier in the Texas Revolution. Crosby County covers an area of 890 square miles and has a population of 6,059 as of the 2010 census.
Geography
Crosby County is located in the northwestern corner of the state of Texas, and is part of the Lubbock Metropolitan Statistical Area. The county is bordered by Floyd County to the north, Garza County to the east, Dickens County to the south, and Hale County to the west. The county is mostly flat, with some rolling hills in the northern part of the county. The county is drained by the White River, which flows through the county from north to south. The county is also home to several small lakes, including Lake Crosby and Lake Ransom.
The climate of Crosby County is semi-arid, with hot summers and mild winters. The average annual temperature is 64°F, and the average annual precipitation is 19.5 inches.
History
Crosby County was established in 1876 and is named after Stephen Crosby, a soldier in the Texas Revolution. The county was originally part of the Bexar District, and was later part of the Young County. The county was organized in 1876, and the first county seat was located in Estacado. The county seat was moved to Crosbyton in 1891.
The economy of Crosby County was largely based on agriculture in the early years. Cotton was the main crop, and the county was also known for its sheep and goat ranching. The economy of the county has diversified in recent years, and now includes oil and gas production, manufacturing, and tourism.
Demographics
As of the 2010 census, there were 6,059 people, 2,093 households, and 1,541 families living in Crosby County. The population density was 6.8 people per square mile. The racial makeup of the county was 79.2% White, 0.7% African American, 0.7% Native American, 0.2% Asian, 16.3% from other races, and 2.9% from two or more races. Hispanic or Latino of any race were 37.2% of the population.
The median income for a household in the county was $35,938, and the median income for a family was $41,944. The per capita income for the county was $16,845. About 17.2% of families and 21.2% of the population were below the poverty line, including 28.2% of those under age 18 and 15.2% of those age 65 or over.
Economy
The economy of Crosby County is largely based on agriculture, oil and gas production, manufacturing, and tourism. The county is home to several large oil and gas companies, including Chevron, ConocoPhillips, and Marathon Oil. The county is also home to several manufacturing companies, including a large wind turbine manufacturing plant.
Tourism is also an important part of the economy of Crosby County. The county is home to several state parks, including Lake Crosby State Park and White River State Park. The county is also home to several historic sites, including the Crosby County Courthouse and the Crosby County Historical Museum.
Conclusion
Crosby County is located in the northwestern corner of the state of Texas, and is part of the Lubbock Metropolitan Statistical Area. The county was established in 1876 and is named after Stephen Crosby, a soldier in the Texas Revolution. The county covers an area of 890 square miles and has a population of 6,059 as of the 2010 census. The economy of Crosby County is largely based on agriculture, oil and gas production, manufacturing, and tourism. The county is home to several state parks, historic sites, and manufacturing companies, and is an important part of the Lubbock Metropolitan Statistical Area.
Common Questions
What is Per Capita Income in Crosby County?
Per Capita income in Crosby County is $30,888.
What is the Median Family Income in Crosby County?
Median Family Income in Crosby County is $65,538.
What is the Median Household income in Crosby County?
Median Household Income in Crosby County is $50,268.
What is Income or Wage Gap in Crosby County?
Income or Wage Gap in Crosby County is 38.9%.
Women in Crosby County earn 61.1 cents for every dollar earned by a man.
What is Inequality or Gini Index in Crosby County?
Inequality or Gini Index in Crosby County is 0.53.
What is the Total Population of Crosby County?
Total Population of Crosby County is 5,157.
What is the Total Male Population of Crosby County?
Total Male Population of Crosby County is 2,607.
What is the Total Female Population of Crosby County?
Total Female Population of Crosby County is 2,550.
What is the Ratio of Males per 100 Females in Crosby County?
There are 102.24 Males per 100 Females in Crosby County.
What is the Ratio of Females per 100 Males in Crosby County?
There are 97.81 Females per 100 Males in Crosby County.
What is the Median Population Age in Crosby County?
Median Population Age in Crosby County is 39.4 Years.
What is the Average Family Size in Crosby County
Average Family Size in Crosby County is 3.0 People.
What is the Average Household Size in Crosby County
Average Household Size in Crosby County is 2.5 People.
How Large is the Labor Force in Crosby County?
There are 2,489 People in the Labor Forcein in Crosby County.
What is the Percentage of People in the Labor Force in Crosby County?
61.8% of People are in the Labor Force in Crosby County.
What is the Unemployment Rate in Crosby County?
Unemployment Rate in Crosby County is 4.9%.