Cottle County, TX Map & Demographics
Cottle County Map
Cottle County Overview
$26,081
PER CAPITA INCOME
$57,235
AVG FAMILY INCOME
$47,625
AVG HOUSEHOLD INCOME
58.8%
WAGE / INCOME GAP [ % ]
41.2¢/ $1
WAGE / INCOME GAP [ $ ]
0.49
INEQUALITY / GINI INDEX
1,647
TOTAL POPULATION
849
MALE POPULATION
798
FEMALE POPULATION
106.39
MALES / 100 FEMALES
93.99
FEMALES / 100 MALES
37.4
MEDIAN AGE
3.4
AVG FAMILY SIZE
2.4
AVG HOUSEHOLD SIZE
748
LABOR FORCE [ PEOPLE ]
58.1%
PERCENT IN LABOR FORCE
4.1%
UNEMPLOYMENT RATE
Cottle County Area Codes
Income in Cottle County
Income Overview in Cottle County
Per Capita Income in Cottle County is $26,081, while median incomes of families and households are $57,235 and $47,625 respectively.
| Characteristic | Number | Measure |
| Per Capita Income | 1,647 | $26,081 |
| Median Family Income | 373 | $57,235 |
| Mean Family Income | 373 | $85,765 |
| Median Household Income | 692 | $47,625 |
| Mean Household Income | 692 | $63,160 |
| Income Deficit | 373 | $0 |
| Wage / Income Gap (%) | 1,647 | 58.84% |
| Wage / Income Gap ($) | 1,647 | 41.16¢ per $1 |
| Gini / Inequality Index | 1,647 | 0.49 |
Earnings by Sex in Cottle County
Average Earnings in Cottle County are $30,345, $48,214 for men and $19,844 for women, a difference of 58.8%.
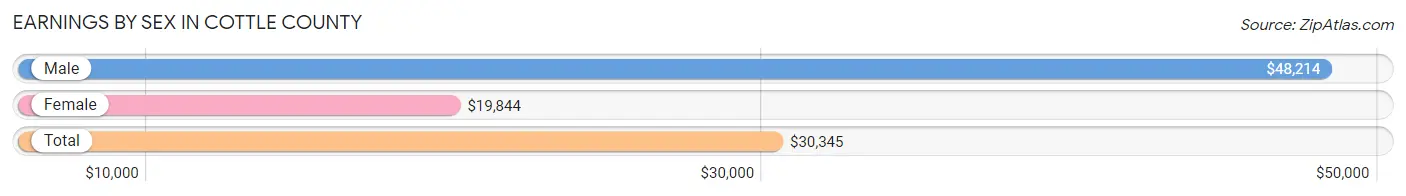
| Sex | Number | Average Earnings |
| Male | 384 (48.4%) | $48,214 |
| Female | 410 (51.6%) | $19,844 |
| Total | 794 (100.0%) | $30,345 |
Earnings by Sex by Income Bracket in Cottle County
The most common earnings brackets in Cottle County are $55,000 to $64,999 for men (73 | 19.0%) and $10,000 to $12,499 for women (57 | 13.9%).
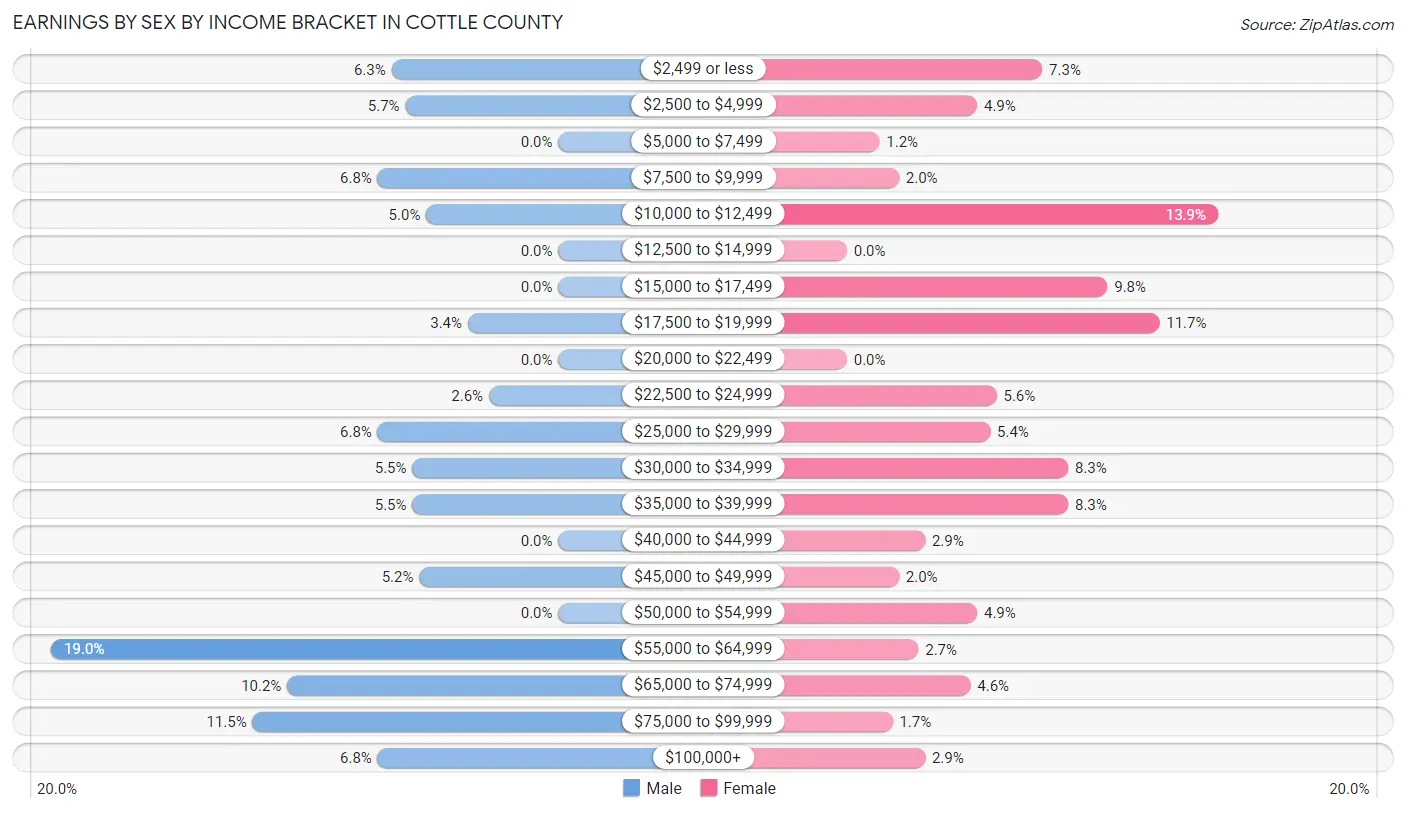
| Income | Male | Female |
| $2,499 or less | 24 (6.2%) | 30 (7.3%) |
| $2,500 to $4,999 | 22 (5.7%) | 20 (4.9%) |
| $5,000 to $7,499 | 0 (0.0%) | 5 (1.2%) |
| $7,500 to $9,999 | 26 (6.8%) | 8 (1.9%) |
| $10,000 to $12,499 | 19 (5.0%) | 57 (13.9%) |
| $12,500 to $14,999 | 0 (0.0%) | 0 (0.0%) |
| $15,000 to $17,499 | 0 (0.0%) | 40 (9.8%) |
| $17,500 to $19,999 | 13 (3.4%) | 48 (11.7%) |
| $20,000 to $22,499 | 0 (0.0%) | 0 (0.0%) |
| $22,500 to $24,999 | 10 (2.6%) | 23 (5.6%) |
| $25,000 to $29,999 | 26 (6.8%) | 22 (5.4%) |
| $30,000 to $34,999 | 21 (5.5%) | 34 (8.3%) |
| $35,000 to $39,999 | 21 (5.5%) | 34 (8.3%) |
| $40,000 to $44,999 | 0 (0.0%) | 12 (2.9%) |
| $45,000 to $49,999 | 20 (5.2%) | 8 (1.9%) |
| $50,000 to $54,999 | 0 (0.0%) | 20 (4.9%) |
| $55,000 to $64,999 | 73 (19.0%) | 11 (2.7%) |
| $65,000 to $74,999 | 39 (10.2%) | 19 (4.6%) |
| $75,000 to $99,999 | 44 (11.5%) | 7 (1.7%) |
| $100,000+ | 26 (6.8%) | 12 (2.9%) |
| Total | 384 (100.0%) | 410 (100.0%) |
Earnings by Sex by Educational Attainment in Cottle County
Average earnings in Cottle County are $55,806 for men and $25,341 for women, a difference of 54.6%. Men with an educational attainment of less than high school enjoy the highest average annual earnings of $66,016, while those with high school diploma education earn the least with $38,095. Women with an educational attainment of bachelor's degree earn the most with the average annual earnings of $53,938, while those with less than high school education have the smallest earnings of $16,125.
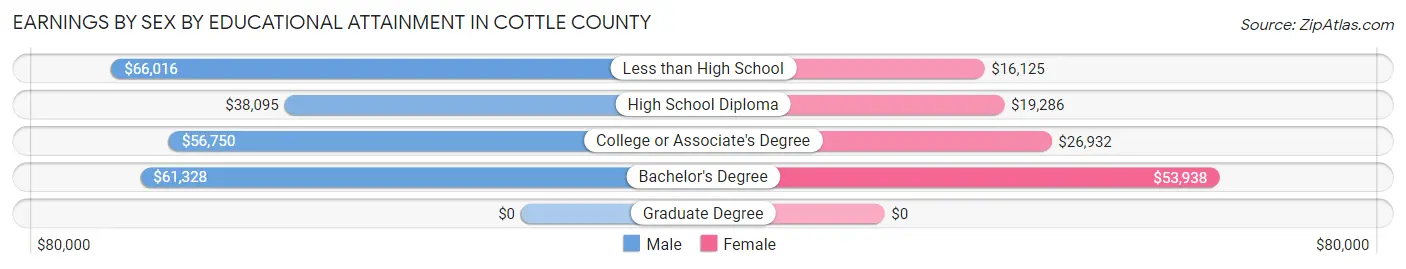
| Educational Attainment | Male Income | Female Income |
| Less than High School | $66,016 | $16,125 |
| High School Diploma | $38,095 | $19,286 |
| College or Associate's Degree | $56,750 | $26,932 |
| Bachelor's Degree | $61,328 | $53,938 |
| Graduate Degree | - | - |
| Total | $55,806 | $25,341 |
Family Income in Cottle County
Family Income Brackets in Cottle County
According to the Cottle County family income data, there are 60 families falling into the $35,000 to $49,999 income range, which is the most common income bracket and makes up 16.1% of all families. Conversely, the $25,000 to $34,999 income bracket is the least frequent group with only 13 families (3.5%) belonging to this category.
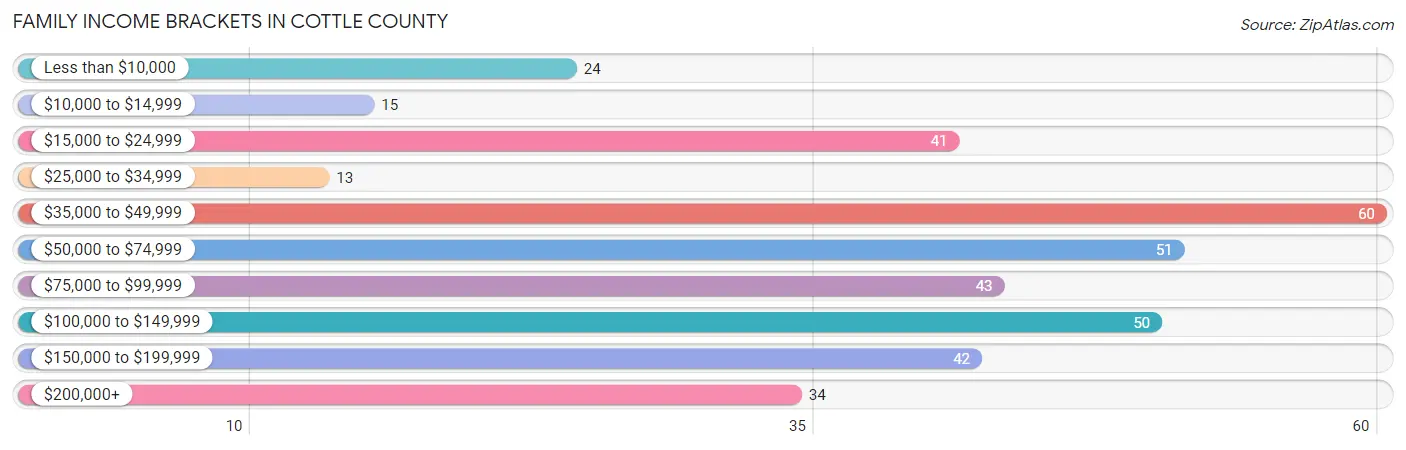
| Income Bracket | # Families | % Families |
| Less than $10,000 | 24 | 6.4% |
| $10,000 to $14,999 | 15 | 4.0% |
| $15,000 to $24,999 | 41 | 11.0% |
| $25,000 to $34,999 | 13 | 3.5% |
| $35,000 to $49,999 | 60 | 16.1% |
| $50,000 to $74,999 | 51 | 13.7% |
| $75,000 to $99,999 | 43 | 11.5% |
| $100,000 to $149,999 | 50 | 13.4% |
| $150,000 to $199,999 | 42 | 11.3% |
| $200,000+ | 34 | 9.1% |
Family Income by Famaliy Size in Cottle County
2-person families (163 | 43.7%) account for the highest median family income in Cottle County with $76,875 per family, while 2-person families (163 | 43.7%) have the highest median income of $38,438 per family member.
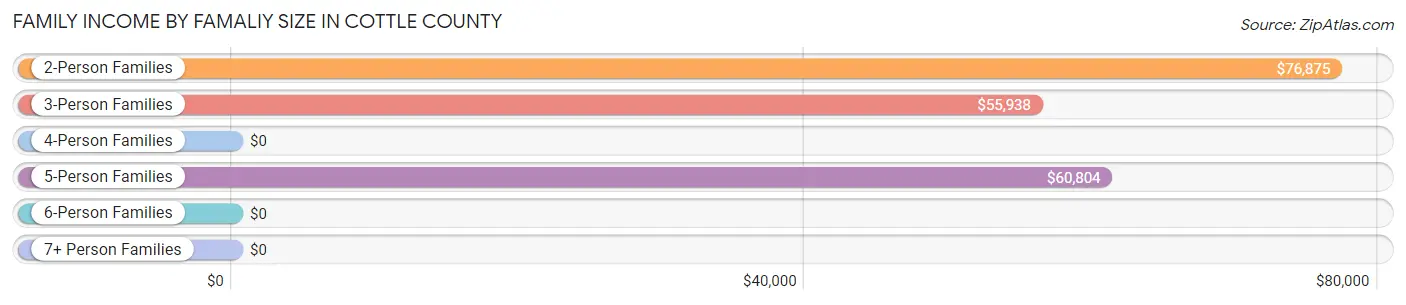
| Income Bracket | # Families | Median Income |
| 2-Person Families | 163 (43.7%) | $76,875 |
| 3-Person Families | 100 (26.8%) | $55,938 |
| 4-Person Families | 61 (16.4%) | $0 |
| 5-Person Families | 49 (13.1%) | $60,804 |
| 6-Person Families | 0 (0.0%) | $0 |
| 7+ Person Families | 0 (0.0%) | $0 |
| Total | 373 (100.0%) | $57,235 |
Family Income by Number of Earners in Cottle County
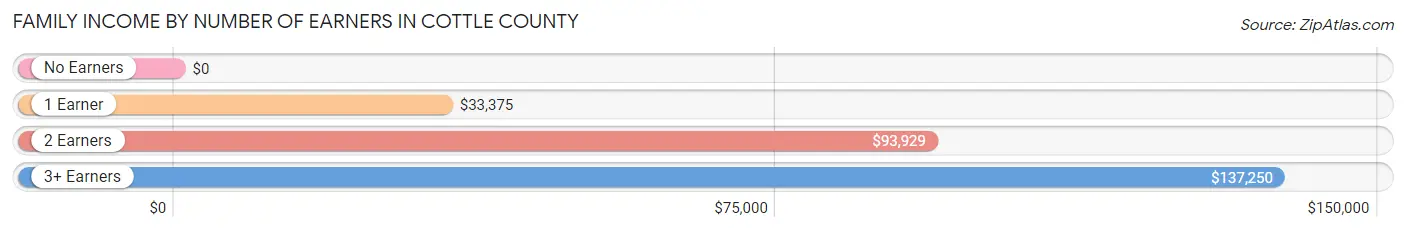
| Number of Earners | # Families | Median Income |
| No Earners | 61 (16.4%) | $0 |
| 1 Earner | 91 (24.4%) | $33,375 |
| 2 Earners | 202 (54.2%) | $93,929 |
| 3+ Earners | 19 (5.1%) | $137,250 |
| Total | 373 (100.0%) | $57,235 |
Household Income in Cottle County
Household Income Brackets in Cottle County
With 149 households falling in the category, the $15,000 to $24,999 income range is the most frequent in Cottle County, accounting for 21.5% of all households. In contrast, only 34 households (4.9%) fall into the $200,000+ income bracket, making it the least populous group.
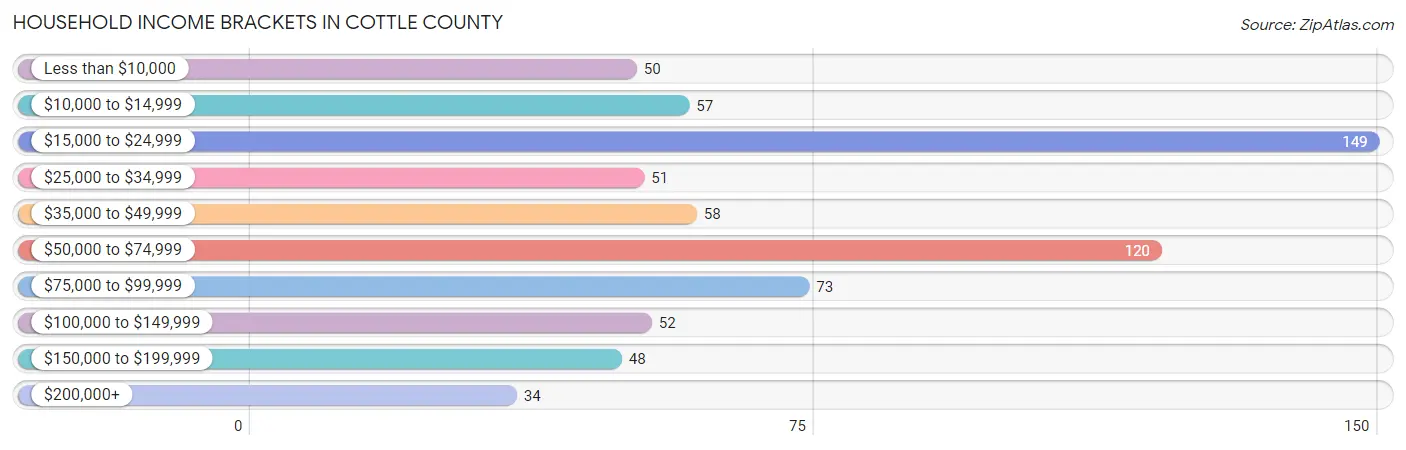
| Income Bracket | # Households | % Households |
| Less than $10,000 | 50 | 7.2% |
| $10,000 to $14,999 | 57 | 8.2% |
| $15,000 to $24,999 | 149 | 21.5% |
| $25,000 to $34,999 | 51 | 7.4% |
| $35,000 to $49,999 | 58 | 8.4% |
| $50,000 to $74,999 | 120 | 17.3% |
| $75,000 to $99,999 | 73 | 10.5% |
| $100,000 to $149,999 | 52 | 7.5% |
| $150,000 to $199,999 | 48 | 6.9% |
| $200,000+ | 34 | 4.9% |
Household Income by Householder Age in Cottle County
The median household income in Cottle County is $47,625, with the highest median household income of $72,000 found in the 45 to 64 years age bracket for the primary householder. A total of 206 households (29.8%) fall into this category. Meanwhile, the 15 to 24 years age bracket for the primary householder has the lowest median household income of $0, with 10 households (1.5%) in this group.
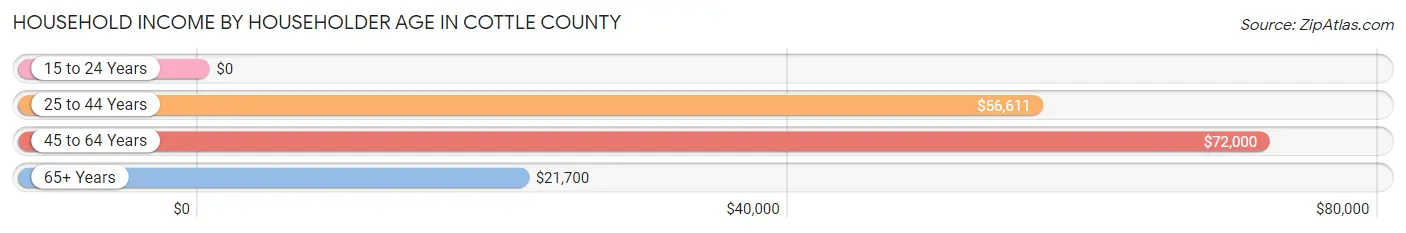
| Income Bracket | # Households | Median Income |
| 15 to 24 Years | 10 (1.5%) | $0 |
| 25 to 44 Years | 202 (29.2%) | $56,611 |
| 45 to 64 Years | 206 (29.8%) | $72,000 |
| 65+ Years | 274 (39.6%) | $21,700 |
| Total | 692 (100.0%) | $47,625 |
Poverty in Cottle County
Income Below Poverty by Sex and Age in Cottle County
With 20.3% poverty level for males and 28.2% for females among the residents of Cottle County, under 5 year old males and under 5 year old females are the most vulnerable to poverty, with 39 males (78.0%) and 37 females (72.6%) in their respective age groups living below the poverty level.
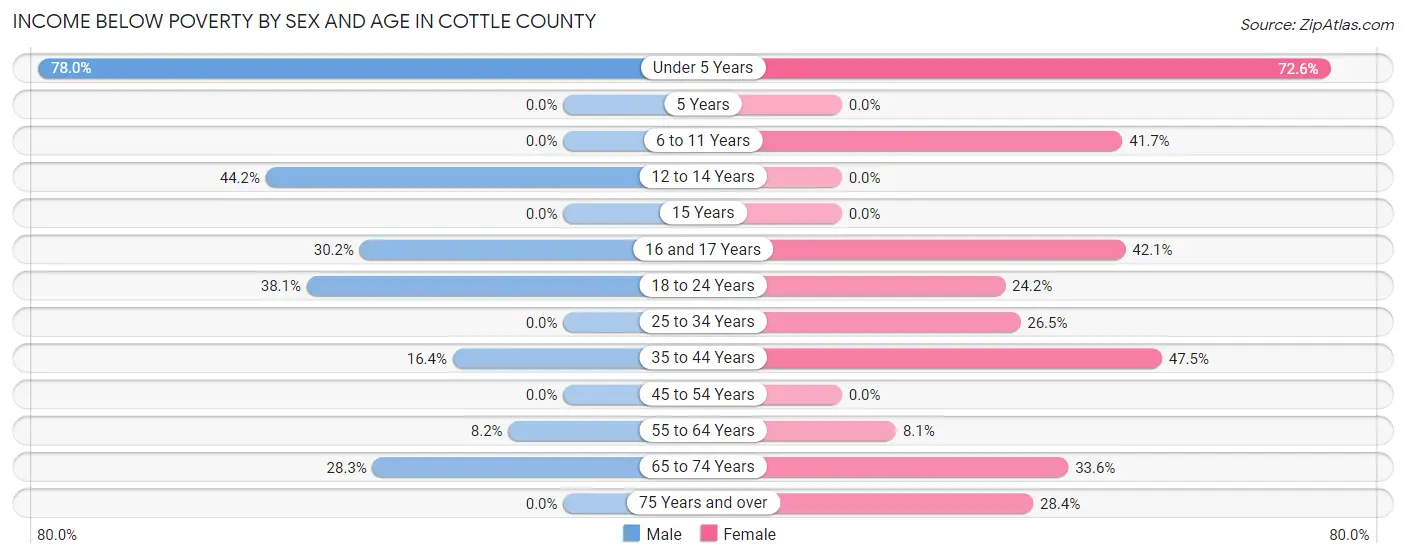
| Age Bracket | Male | Female |
| Under 5 Years | 39 (78.0%) | 37 (72.6%) |
| 5 Years | 0 (0.0%) | 0 (0.0%) |
| 6 to 11 Years | 0 (0.0%) | 25 (41.7%) |
| 12 to 14 Years | 38 (44.2%) | 0 (0.0%) |
| 15 Years | 0 (0.0%) | 0 (0.0%) |
| 16 and 17 Years | 13 (30.2%) | 8 (42.1%) |
| 18 to 24 Years | 24 (38.1%) | 16 (24.2%) |
| 25 to 34 Years | 0 (0.0%) | 22 (26.5%) |
| 35 to 44 Years | 22 (16.4%) | 48 (47.5%) |
| 45 to 54 Years | 0 (0.0%) | 0 (0.0%) |
| 55 to 64 Years | 4 (8.2%) | 7 (8.1%) |
| 65 to 74 Years | 32 (28.3%) | 39 (33.6%) |
| 75 Years and over | 0 (0.0%) | 23 (28.4%) |
| Total | 172 (20.3%) | 225 (28.2%) |
Income Above Poverty by Sex and Age in Cottle County
According to the poverty statistics in Cottle County, males aged 6 to 11 years and females aged 5 years are the age groups that are most secure financially, with 100.0% of males and 100.0% of females in these age groups living above the poverty line.
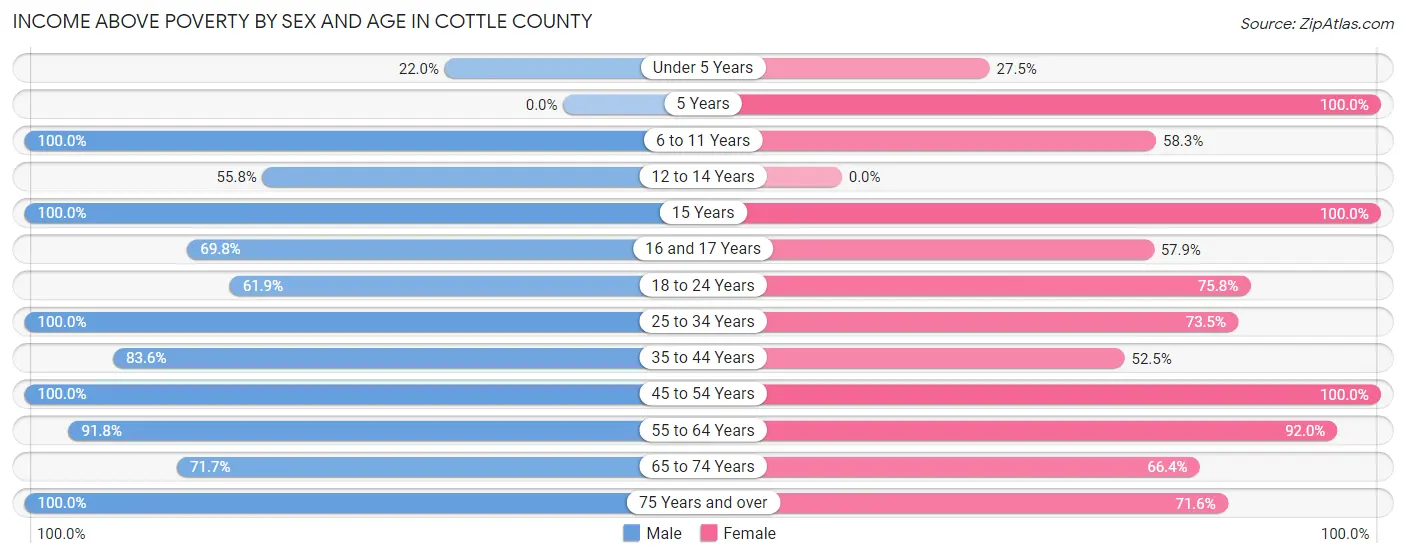
| Age Bracket | Male | Female |
| Under 5 Years | 11 (22.0%) | 14 (27.5%) |
| 5 Years | 0 (0.0%) | 14 (100.0%) |
| 6 to 11 Years | 85 (100.0%) | 35 (58.3%) |
| 12 to 14 Years | 48 (55.8%) | 0 (0.0%) |
| 15 Years | 5 (100.0%) | 8 (100.0%) |
| 16 and 17 Years | 30 (69.8%) | 11 (57.9%) |
| 18 to 24 Years | 39 (61.9%) | 50 (75.8%) |
| 25 to 34 Years | 130 (100.0%) | 61 (73.5%) |
| 35 to 44 Years | 112 (83.6%) | 53 (52.5%) |
| 45 to 54 Years | 41 (100.0%) | 112 (100.0%) |
| 55 to 64 Years | 45 (91.8%) | 80 (91.9%) |
| 65 to 74 Years | 81 (71.7%) | 77 (66.4%) |
| 75 Years and over | 50 (100.0%) | 58 (71.6%) |
| Total | 677 (79.7%) | 573 (71.8%) |
Income Below Poverty Among Married-Couple Families in Cottle County
The poverty statistics for married-couple families in Cottle County show that 7.5% or 19 of the total 252 families live below the poverty line. Families with no children have the highest poverty rate of 11.2%, comprising of 19 families. On the other hand, families with 1 or 2 children have the lowest poverty rate of 0.0%, which includes 0 families.
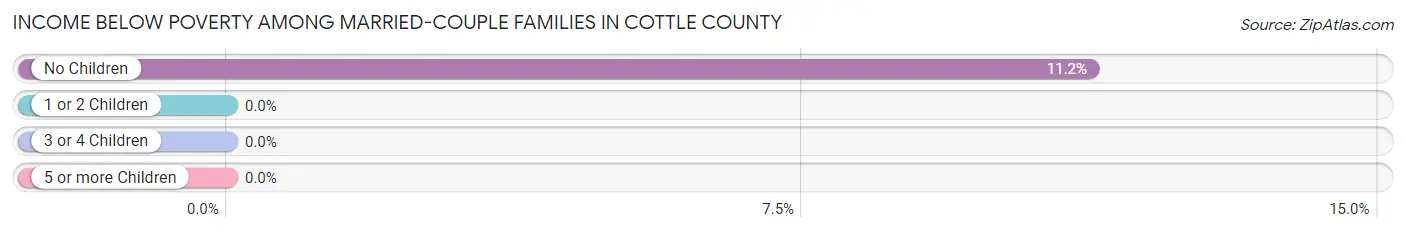
| Children | Above Poverty | Below Poverty |
| No Children | 150 (88.8%) | 19 (11.2%) |
| 1 or 2 Children | 54 (100.0%) | 0 (0.0%) |
| 3 or 4 Children | 29 (100.0%) | 0 (0.0%) |
| 5 or more Children | 0 (0.0%) | 0 (0.0%) |
| Total | 233 (92.5%) | 19 (7.5%) |
Income Below Poverty Among Single-Parent Households in Cottle County
According to the poverty data in Cottle County, 41.7% or 10 single-father households and 49.5% or 48 single-mother households are living below the poverty line. Among single-father households, those with 1 or 2 children have the highest poverty rate, with 10 households (83.3%) experiencing poverty. Likewise, among single-mother households, those with 3 or 4 children have the highest poverty rate, with 28 households (84.9%) falling below the poverty line.
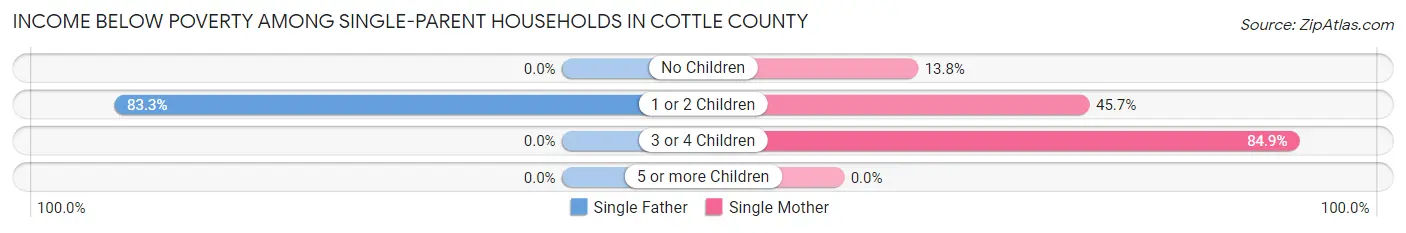
| Children | Single Father | Single Mother |
| No Children | 0 (0.0%) | 4 (13.8%) |
| 1 or 2 Children | 10 (83.3%) | 16 (45.7%) |
| 3 or 4 Children | 0 (0.0%) | 28 (84.9%) |
| 5 or more Children | 0 (0.0%) | 0 (0.0%) |
| Total | 10 (41.7%) | 48 (49.5%) |
Income Below Poverty Among Married-Couple vs Single-Parent Households in Cottle County
The poverty data for Cottle County shows that 19 of the married-couple family households (7.5%) and 58 of the single-parent households (47.9%) are living below the poverty level. Within the married-couple family households, those with no children have the highest poverty rate, with 19 households (11.2%) falling below the poverty line. Among the single-parent households, those with 3 or 4 children have the highest poverty rate, with 28 household (62.2%) living below poverty.
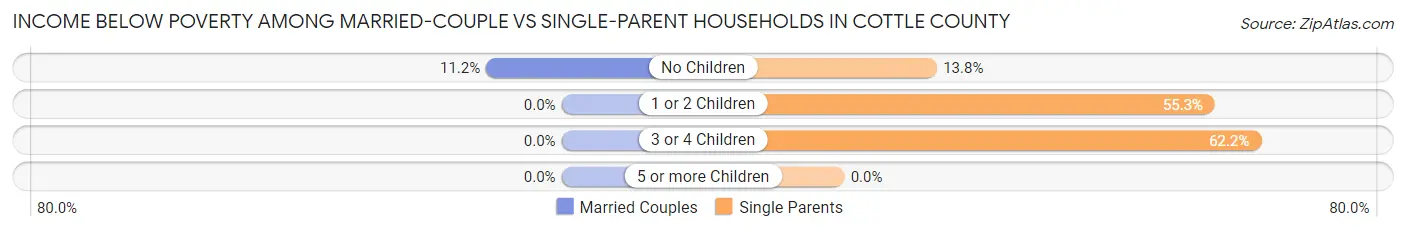
| Children | Married-Couple Families | Single-Parent Households |
| No Children | 19 (11.2%) | 4 (13.8%) |
| 1 or 2 Children | 0 (0.0%) | 26 (55.3%) |
| 3 or 4 Children | 0 (0.0%) | 28 (62.2%) |
| 5 or more Children | 0 (0.0%) | 0 (0.0%) |
| Total | 19 (7.5%) | 58 (47.9%) |
Race in Cottle County
The most populous races in Cottle County are White / Caucasian (1,227 | 74.5%), Hispanic or Latino (389 | 23.6%), and Two or more Races (282 | 17.1%).
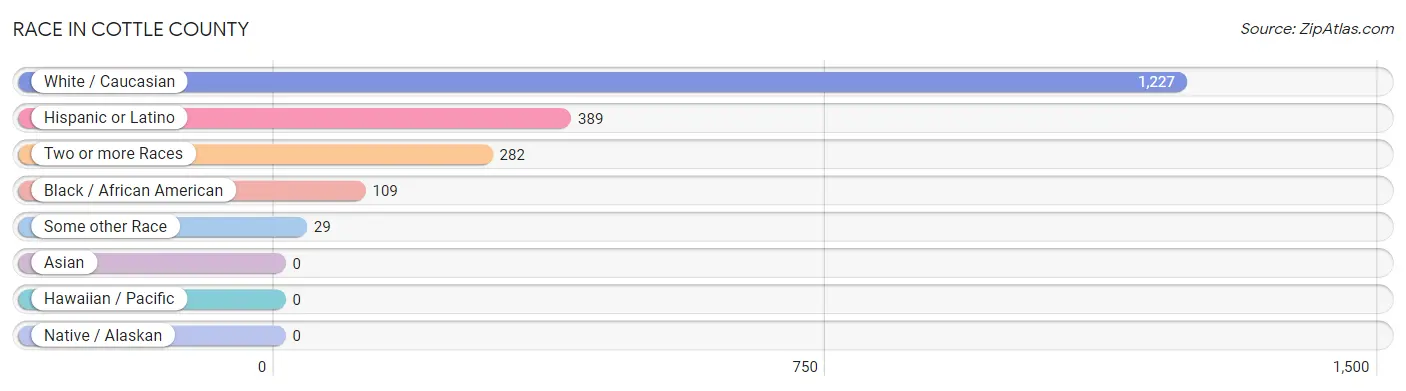
| Race | # Population | % Population |
| Asian | 0 | 0.0% |
| Black / African American | 109 | 6.6% |
| Hawaiian / Pacific | 0 | 0.0% |
| Hispanic or Latino | 389 | 23.6% |
| Native / Alaskan | 0 | 0.0% |
| White / Caucasian | 1,227 | 74.5% |
| Two or more Races | 282 | 17.1% |
| Some other Race | 29 | 1.8% |
| Total | 1,647 | 100.0% |
Ancestry in Cottle County
The most populous ancestries reported in Cottle County are Mexican (369 | 22.4%), Irish (158 | 9.6%), European (118 | 7.2%), German (96 | 5.8%), and English (88 | 5.3%), together accounting for 50.3% of all Cottle County residents.
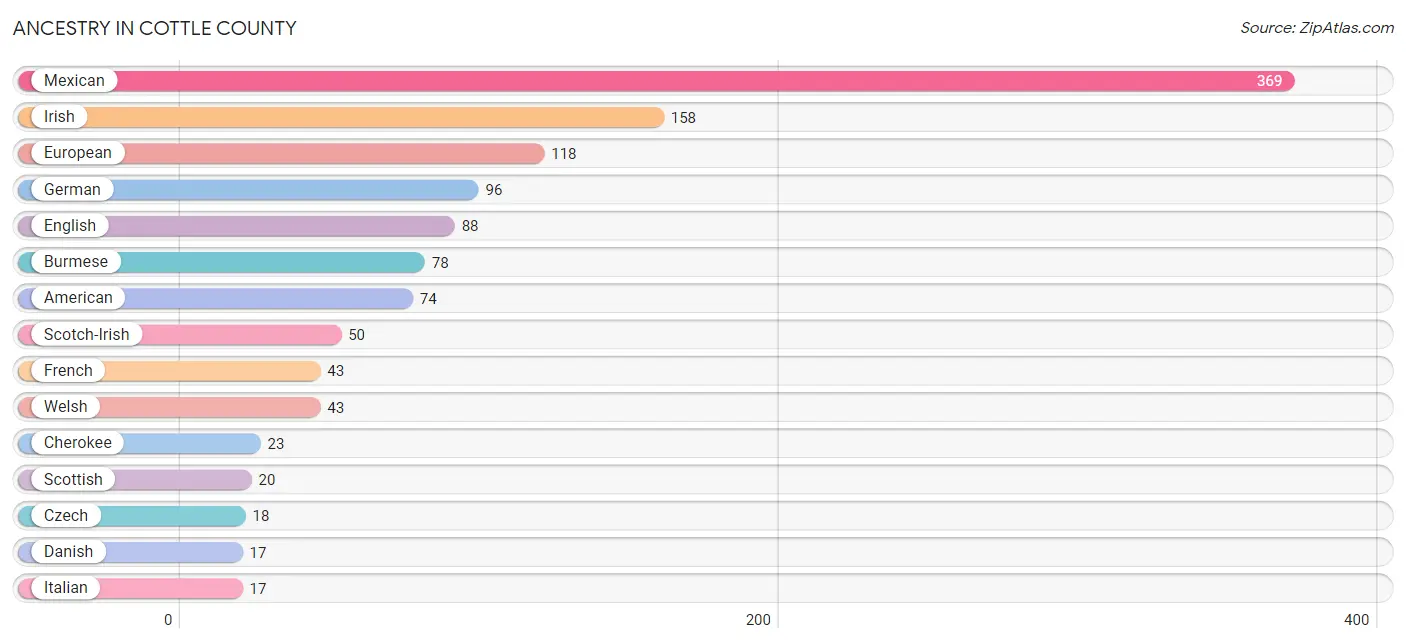
| Ancestry | # Population | % Population |
| American | 74 | 4.5% |
| Blackfeet | 5 | 0.3% |
| British | 13 | 0.8% |
| Burmese | 78 | 4.7% |
| Cherokee | 23 | 1.4% |
| Choctaw | 2 | 0.1% |
| Czech | 18 | 1.1% |
| Danish | 17 | 1.0% |
| Dutch | 12 | 0.7% |
| English | 88 | 5.3% |
| European | 118 | 7.2% |
| French | 43 | 2.6% |
| German | 96 | 5.8% |
| German Russian | 9 | 0.5% |
| Irish | 158 | 9.6% |
| Italian | 17 | 1.0% |
| Mexican | 369 | 22.4% |
| Scotch-Irish | 50 | 3.0% |
| Scottish | 20 | 1.2% |
| Swedish | 4 | 0.2% |
| Welsh | 43 | 2.6% | View All 21 Rows |
Immigrants in Cottle County

| Immigration Origin | # Population | % Population | View All 0 Rows |
Sex and Age in Cottle County
Sex and Age in Cottle County
The most populous age groups in Cottle County are 10 to 14 Years (131 | 15.4%) for men and 50 to 54 Years (79 | 9.9%) for women.
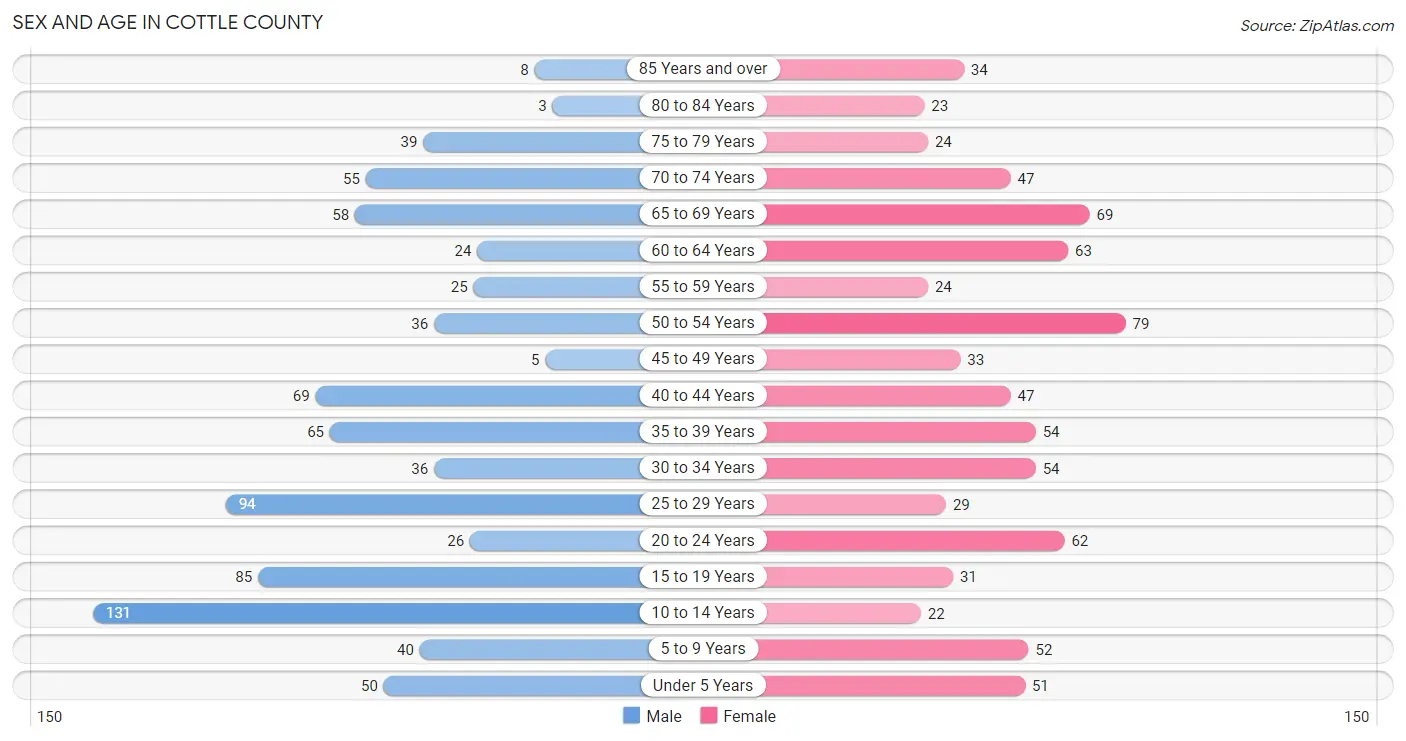
| Age Bracket | Male | Female |
| Under 5 Years | 50 (5.9%) | 51 (6.4%) |
| 5 to 9 Years | 40 (4.7%) | 52 (6.5%) |
| 10 to 14 Years | 131 (15.4%) | 22 (2.8%) |
| 15 to 19 Years | 85 (10.0%) | 31 (3.9%) |
| 20 to 24 Years | 26 (3.1%) | 62 (7.8%) |
| 25 to 29 Years | 94 (11.1%) | 29 (3.6%) |
| 30 to 34 Years | 36 (4.2%) | 54 (6.8%) |
| 35 to 39 Years | 65 (7.7%) | 54 (6.8%) |
| 40 to 44 Years | 69 (8.1%) | 47 (5.9%) |
| 45 to 49 Years | 5 (0.6%) | 33 (4.1%) |
| 50 to 54 Years | 36 (4.2%) | 79 (9.9%) |
| 55 to 59 Years | 25 (2.9%) | 24 (3.0%) |
| 60 to 64 Years | 24 (2.8%) | 63 (7.9%) |
| 65 to 69 Years | 58 (6.8%) | 69 (8.6%) |
| 70 to 74 Years | 55 (6.5%) | 47 (5.9%) |
| 75 to 79 Years | 39 (4.6%) | 24 (3.0%) |
| 80 to 84 Years | 3 (0.4%) | 23 (2.9%) |
| 85 Years and over | 8 (0.9%) | 34 (4.3%) |
| Total | 849 (100.0%) | 798 (100.0%) |
Families and Households in Cottle County
Median Family Size in Cottle County
The median family size in Cottle County is 3.35 persons per family, with single female/mother families (97 | 26.0%) accounting for the largest median family size of 5.02 persons per family. On the other hand, married-couple families (252 | 67.6%) represent the smallest median family size with 2.61 persons per family.
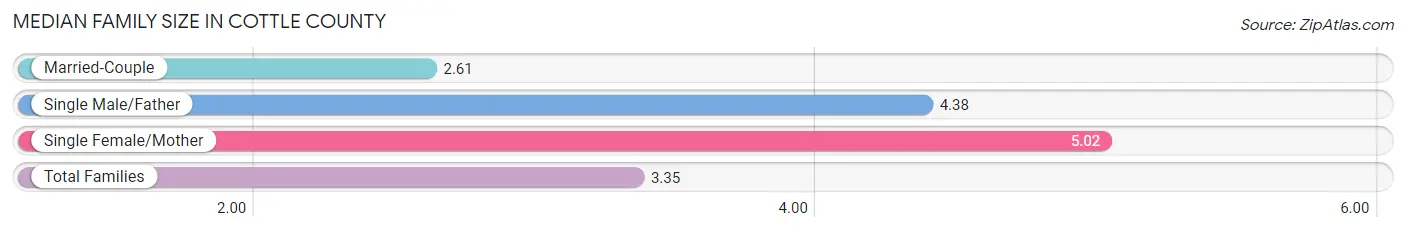
| Family Type | # Families | Family Size |
| Married-Couple | 252 (67.6%) | 2.61 |
| Single Male/Father | 24 (6.4%) | 4.38 |
| Single Female/Mother | 97 (26.0%) | 5.02 |
| Total Families | 373 (100.0%) | 3.35 |
Median Household Size in Cottle County
The median household size in Cottle County is 2.38 persons per household, with single male/father households (24 | 3.5%) accounting for the largest median household size of 5.71 persons per household. non-family households (319 | 46.1%) represent the smallest median household size with 1.10 persons per household.
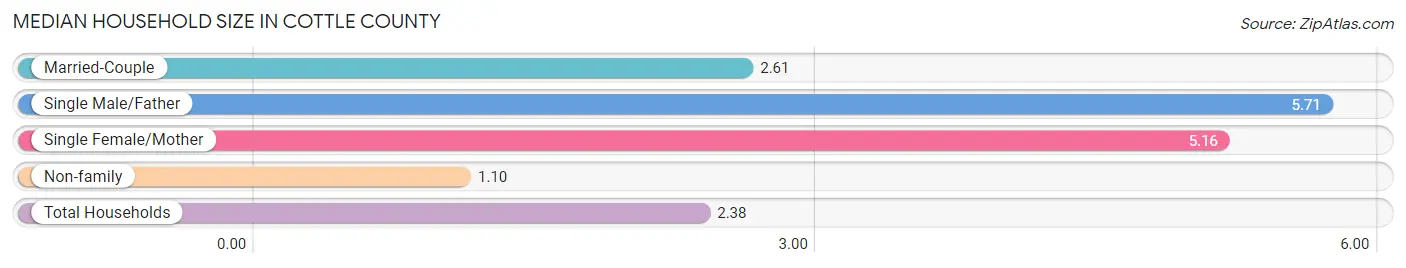
| Household Type | # Households | Household Size |
| Married-Couple | 252 (36.4%) | 2.61 |
| Single Male/Father | 24 (3.5%) | 5.71 |
| Single Female/Mother | 97 (14.0%) | 5.16 |
| Non-family | 319 (46.1%) | 1.10 |
| Total Households | 692 (100.0%) | 2.38 |
Household Size by Marriage Status in Cottle County
Out of a total of 692 households in Cottle County, 373 (53.9%) are family households, while 319 (46.1%) are nonfamily households. The most numerous type of family households are 2-person households, comprising 163, and the most common type of nonfamily households are 1-person households, comprising 307.
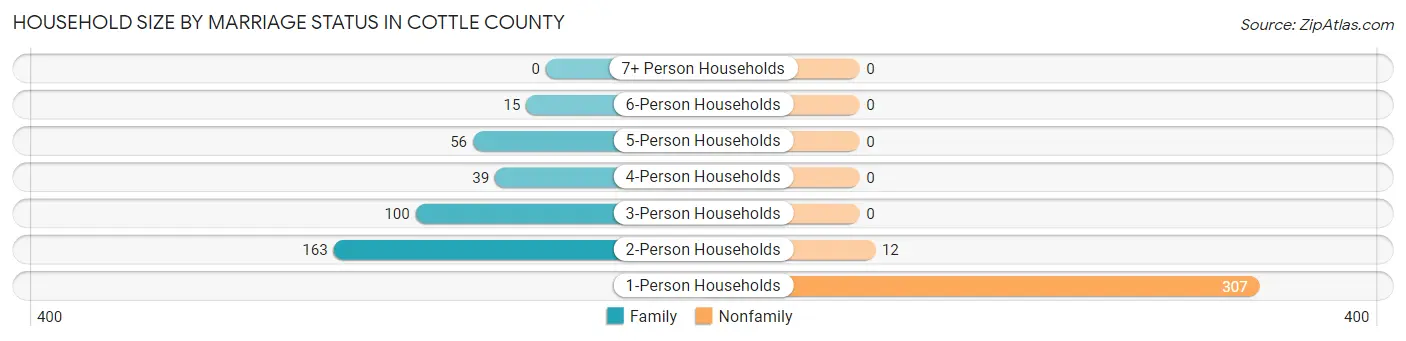
| Household Size | Family Households | Nonfamily Households |
| 1-Person Households | - | 307 (44.4%) |
| 2-Person Households | 163 (23.5%) | 12 (1.7%) |
| 3-Person Households | 100 (14.4%) | 0 (0.0%) |
| 4-Person Households | 39 (5.6%) | 0 (0.0%) |
| 5-Person Households | 56 (8.1%) | 0 (0.0%) |
| 6-Person Households | 15 (2.2%) | 0 (0.0%) |
| 7+ Person Households | 0 (0.0%) | 0 (0.0%) |
| Total | 373 (53.9%) | 319 (46.1%) |
Female Fertility in Cottle County
Fertility by Age in Cottle County
Average fertility rate in Cottle County is 72.0 births per 1,000 women. Women in the age bracket of 20 to 34 years have the highest fertility rate with 166.0 births per 1,000 women. Women in the age bracket of 20 to 34 years acount for 100.0% of all women with births.
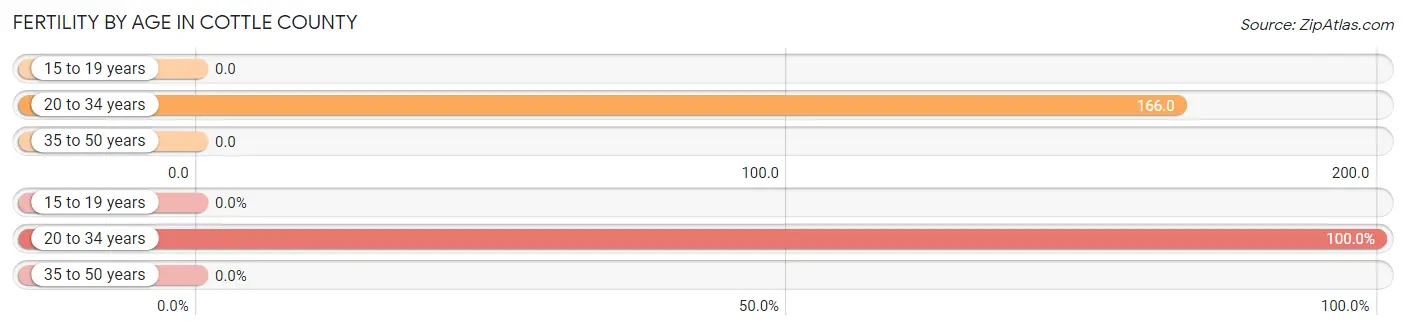
| Age Bracket | Women with Births | Births / 1,000 Women |
| 15 to 19 years | 0 (0.0%) | 0.0 |
| 20 to 34 years | 24 (100.0%) | 166.0 |
| 35 to 50 years | 0 (0.0%) | 0.0 |
| Total | 24 (100.0%) | 72.0 |
Fertility by Age by Marriage Status in Cottle County
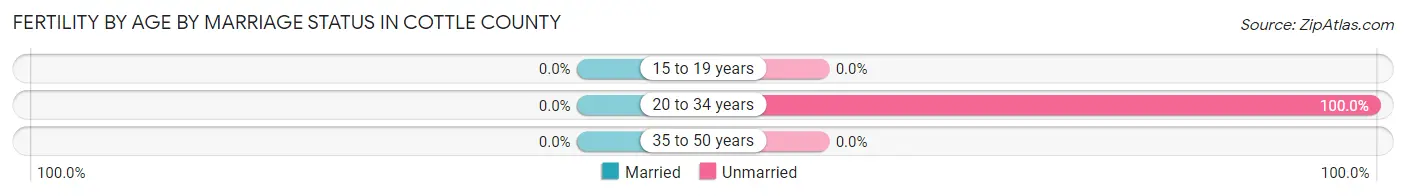
| Age Bracket | Married | Unmarried |
| 15 to 19 years | 0 (0.0%) | 0 (0.0%) |
| 20 to 34 years | 0 (0.0%) | 24 (100.0%) |
| 35 to 50 years | 0 (0.0%) | 0 (0.0%) |
| Total | 0 (0.0%) | 24 (100.0%) |
Fertility by Education in Cottle County
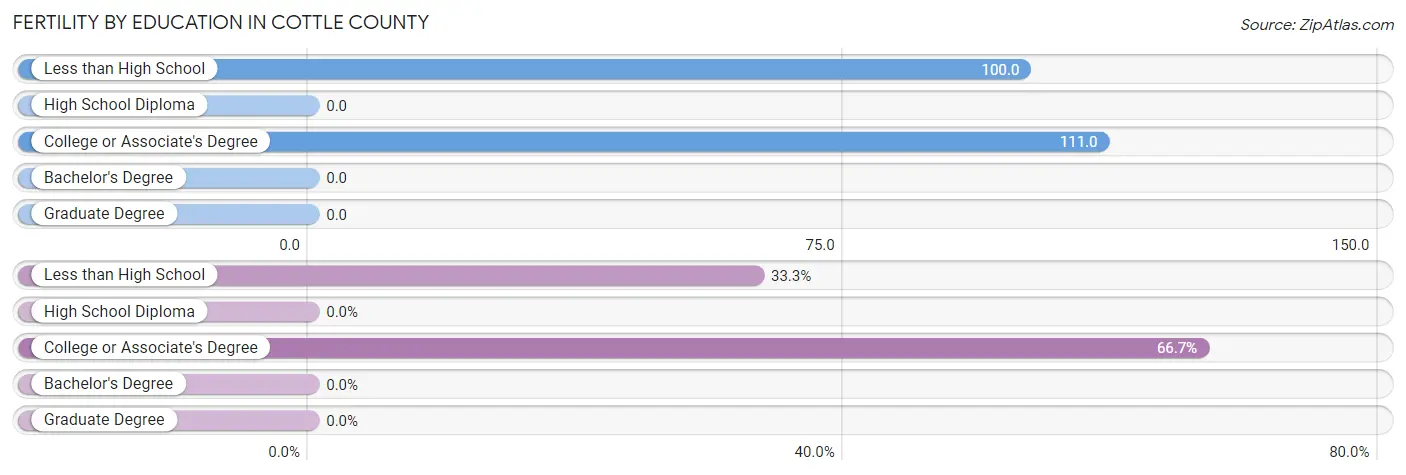
| Educational Attainment | Women with Births | Births / 1,000 Women |
| Less than High School | 8 (33.3%) | 100.0 |
| High School Diploma | 0 (0.0%) | 0.0 |
| College or Associate's Degree | 16 (66.7%) | 111.0 |
| Bachelor's Degree | 0 (0.0%) | 0.0 |
| Graduate Degree | 0 (0.0%) | 0.0 |
| Total | 24 (100.0%) | 72.0 |
Fertility by Education by Marriage Status in Cottle County
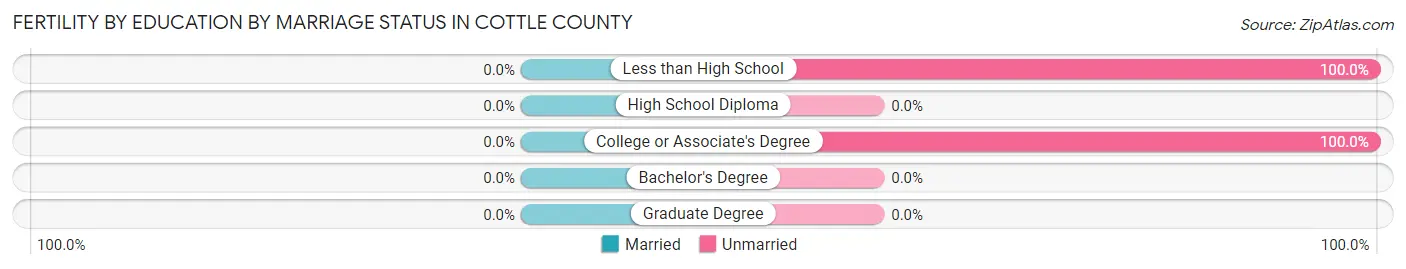
| Educational Attainment | Married | Unmarried |
| Less than High School | 0 (0.0%) | 8 (100.0%) |
| High School Diploma | 0 (0.0%) | 0 (0.0%) |
| College or Associate's Degree | 0 (0.0%) | 16 (100.0%) |
| Bachelor's Degree | 0 (0.0%) | 0 (0.0%) |
| Graduate Degree | 0 (0.0%) | 0 (0.0%) |
| Total | 0 (0.0%) | 24 (100.0%) |
Employment Characteristics in Cottle County
Employment by Class of Employer in Cottle County
Among the 713 employed individuals in Cottle County, private company employees (338 | 47.4%), self-employed (not incorporated) (123 | 17.2%), and not-for-profit organizations (75 | 10.5%) make up the most common classes of employment.
| Employer Class | # Employees | % Employees |
| Private Company Employees | 338 | 47.4% |
| Self-Employed (Incorporated) | 49 | 6.9% |
| Self-Employed (Not Incorporated) | 123 | 17.2% |
| Not-for-profit Organizations | 75 | 10.5% |
| Local Government Employees | 52 | 7.3% |
| State Government Employees | 53 | 7.4% |
| Federal Government Employees | 23 | 3.2% |
| Unpaid Family Workers | 0 | 0.0% |
| Total | 713 | 100.0% |
Employment Status by Age in Cottle County
According to the labor force statistics for Cottle County, out of the total population over 16 years of age (1,288), 58.1% or 748 individuals are in the labor force, with 4.1% or 31 of them unemployed. The age group with the highest labor force participation rate is 45 to 54 years, with 100.0% or 153 individuals in the labor force. Within the labor force, the 75 years and over age range has the highest percentage of unemployed individuals, with 33.3% or 8 of them being unemployed.
| Age Bracket | In Labor Force | Unemployed |
| 16 to 19 Years | 14 (13.6%) | 4 (28.6%) |
| 20 to 24 Years | 80 (90.9%) | 13 (16.3%) |
| 25 to 29 Years | 50 (40.7%) | 0 (0.0%) |
| 30 to 34 Years | 77 (85.6%) | 0 (0.0%) |
| 35 to 44 Years | 180 (76.6%) | 0 (0.0%) |
| 45 to 54 Years | 153 (100.0%) | 6 (3.9%) |
| 55 to 59 Years | 47 (95.9%) | 0 (0.0%) |
| 60 to 64 Years | 53 (60.9%) | 0 (0.0%) |
| 65 to 74 Years | 70 (30.6%) | 0 (0.0%) |
| 75 Years and over | 24 (18.3%) | 8 (33.3%) |
| Total | 748 (58.1%) | 31 (4.1%) |
Employment Status by Educational Attainment in Cottle County
According to labor force statistics for Cottle County, 76.0% of individuals (560) out of the total population between 25 and 64 years of age (737) are in the labor force, with 1.1% or 6 of them being unemployed. The group with the highest labor force participation rate are those with the educational attainment of less than high school, with 88.5% or 69 individuals in the labor force. Within the labor force, individuals with bachelor's degree or higher education have the highest percentage of unemployment, with 4.9% or 6 of them being unemployed.
| Educational Attainment | In Labor Force | Unemployed |
| Less than High School | 69 (88.5%) | 0 (0.0%) |
| High School Diploma | 123 (54.4%) | 0 (0.0%) |
| College / Associate Degree | 245 (85.4%) | 0 (0.0%) |
| Bachelor's Degree or higher | 123 (84.2%) | 7 (4.9%) |
| Total | 560 (76.0%) | 8 (1.1%) |
Employment Occupations by Sex in Cottle County
Management, Business, Science and Arts Occupations
The most common Management, Business, Science and Arts occupations in Cottle County are Management (115 | 16.0%), Community & Social Service (52 | 7.2%), Education Instruction & Library (40 | 5.6%), Health Diagnosing & Treating (21 | 2.9%), and Business & Financial (20 | 2.8%).
Management, Business, Science and Arts Occupations by Sex
Within the Management, Business, Science and Arts occupations in Cottle County, the most male-oriented occupations are Management (67.8%), Education, Arts & Media (58.3%), and Community & Social Service (30.8%), while the most female-oriented occupations are Business & Financial (100.0%), Health Diagnosing & Treating (100.0%), and Health Technologists (100.0%).
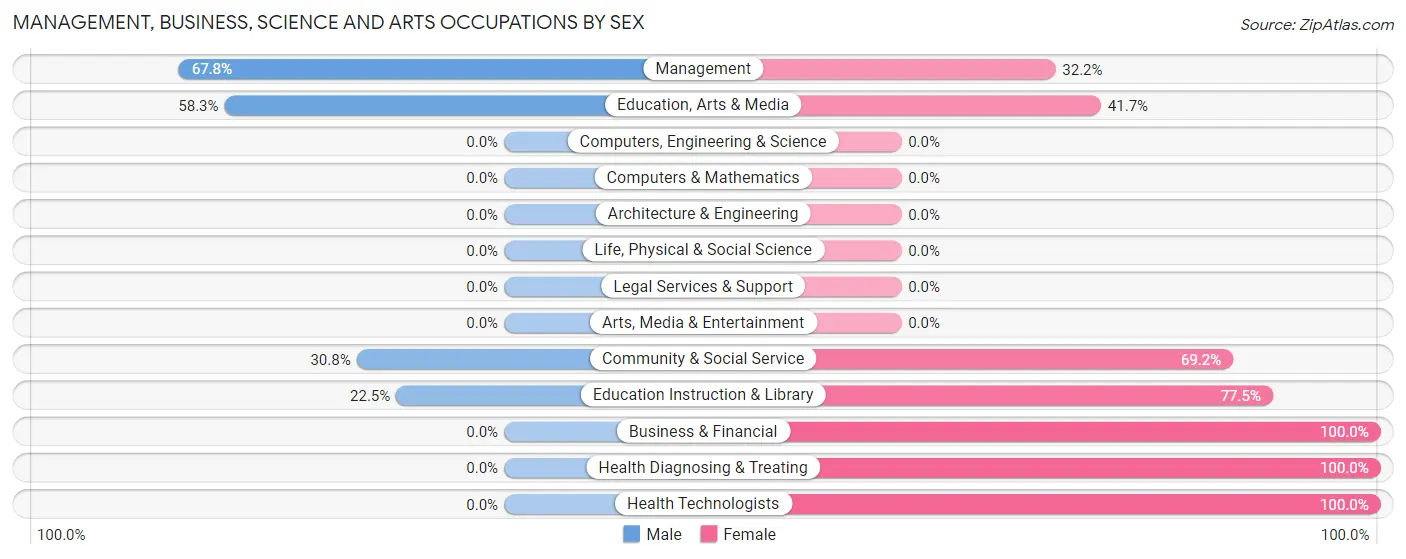
| Occupation | Male | Female |
| Management | 78 (67.8%) | 37 (32.2%) |
| Business & Financial | 0 (0.0%) | 20 (100.0%) |
| Computers, Engineering & Science | 0 (0.0%) | 0 (0.0%) |
| Computers & Mathematics | 0 (0.0%) | 0 (0.0%) |
| Architecture & Engineering | 0 (0.0%) | 0 (0.0%) |
| Life, Physical & Social Science | 0 (0.0%) | 0 (0.0%) |
| Community & Social Service | 16 (30.8%) | 36 (69.2%) |
| Education, Arts & Media | 7 (58.3%) | 5 (41.7%) |
| Legal Services & Support | 0 (0.0%) | 0 (0.0%) |
| Education Instruction & Library | 9 (22.5%) | 31 (77.5%) |
| Arts, Media & Entertainment | 0 (0.0%) | 0 (0.0%) |
| Health Diagnosing & Treating | 0 (0.0%) | 21 (100.0%) |
| Health Technologists | 0 (0.0%) | 12 (100.0%) |
| Total (Category) | 94 (45.2%) | 114 (54.8%) |
| Total (Overall) | 340 (47.4%) | 377 (52.6%) |
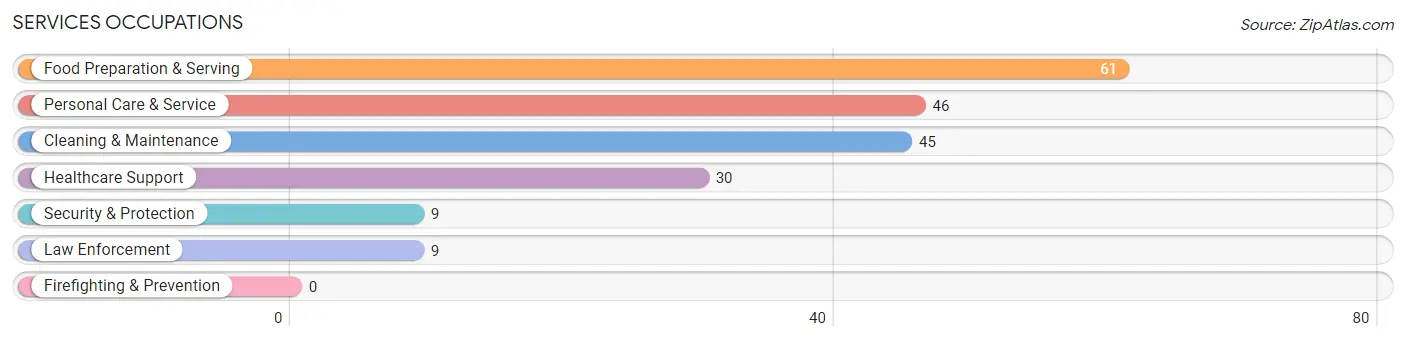
Services Occupations
The most common Services occupations in Cottle County are Food Preparation & Serving (61 | 8.5%), Personal Care & Service (46 | 6.4%), Cleaning & Maintenance (45 | 6.3%), Healthcare Support (30 | 4.2%), and Security & Protection (9 | 1.3%).
Services Occupations by Sex
Within the Services occupations in Cottle County, the most male-oriented occupations are Security & Protection (100.0%), Law Enforcement (100.0%), and Personal Care & Service (63.0%), while the most female-oriented occupations are Healthcare Support (100.0%), Food Preparation & Serving (100.0%), and Cleaning & Maintenance (82.2%).
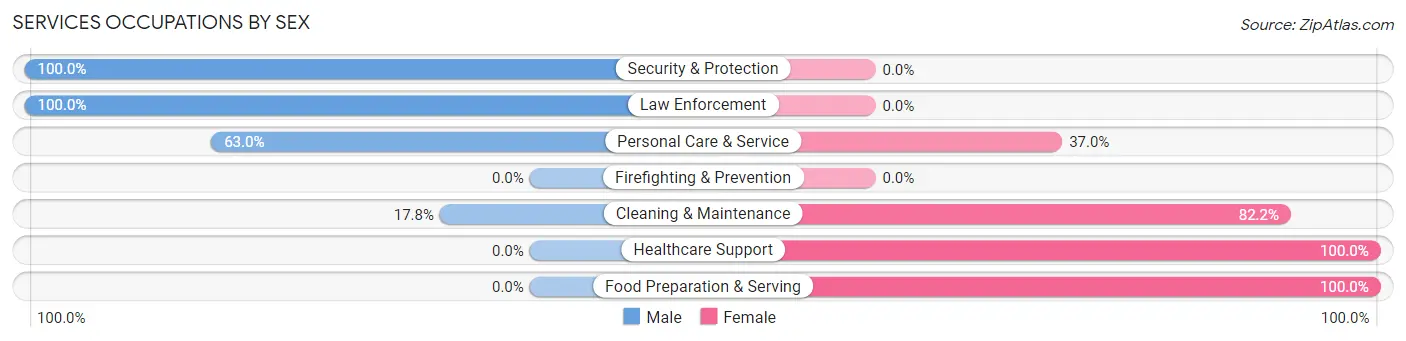
| Occupation | Male | Female |
| Healthcare Support | 0 (0.0%) | 30 (100.0%) |
| Security & Protection | 9 (100.0%) | 0 (0.0%) |
| Firefighting & Prevention | 0 (0.0%) | 0 (0.0%) |
| Law Enforcement | 9 (100.0%) | 0 (0.0%) |
| Food Preparation & Serving | 0 (0.0%) | 61 (100.0%) |
| Cleaning & Maintenance | 8 (17.8%) | 37 (82.2%) |
| Personal Care & Service | 29 (63.0%) | 17 (37.0%) |
| Total (Category) | 46 (24.1%) | 145 (75.9%) |
| Total (Overall) | 340 (47.4%) | 377 (52.6%) |
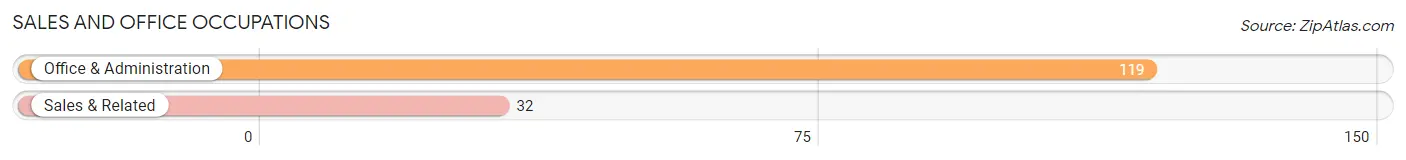
Sales and Office Occupations
The most common Sales and Office occupations in Cottle County are Office & Administration (119 | 16.6%), and Sales & Related (32 | 4.5%).
Sales and Office Occupations by Sex
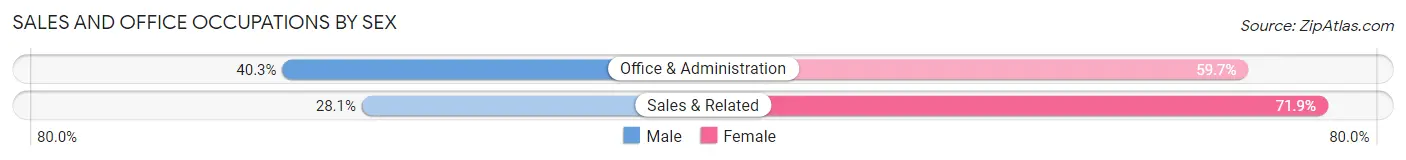
| Occupation | Male | Female |
| Sales & Related | 9 (28.1%) | 23 (71.9%) |
| Office & Administration | 48 (40.3%) | 71 (59.7%) |
| Total (Category) | 57 (37.8%) | 94 (62.3%) |
| Total (Overall) | 340 (47.4%) | 377 (52.6%) |
Natural Resources, Construction and Maintenance Occupations
The most common Natural Resources, Construction and Maintenance occupations in Cottle County are Construction & Extraction (104 | 14.5%), Installation, Maintenance & Repair (7 | 1.0%), and Farming, Fishing & Forestry (5 | 0.7%).
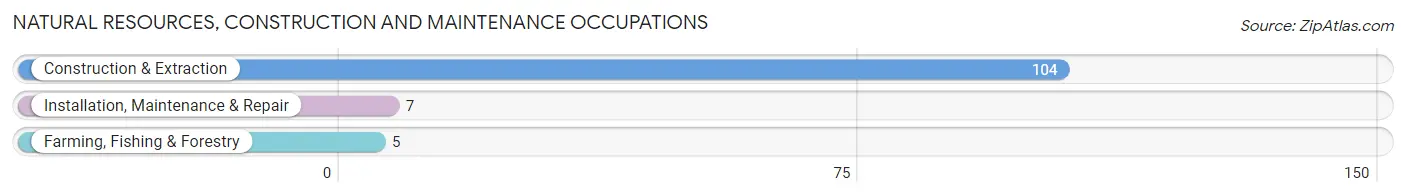
Natural Resources, Construction and Maintenance Occupations by Sex
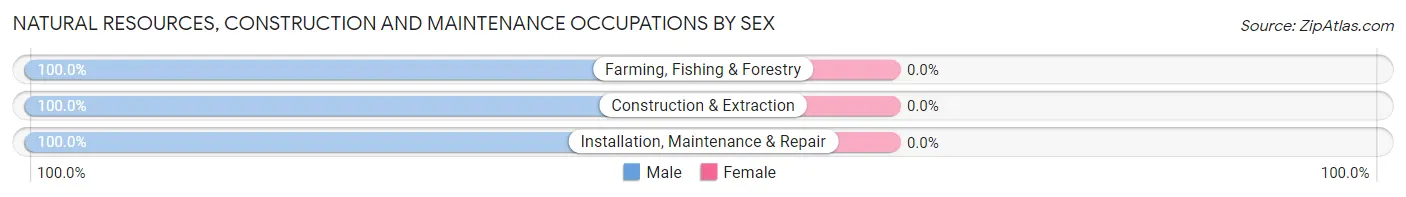
| Occupation | Male | Female |
| Farming, Fishing & Forestry | 5 (100.0%) | 0 (0.0%) |
| Construction & Extraction | 104 (100.0%) | 0 (0.0%) |
| Installation, Maintenance & Repair | 7 (100.0%) | 0 (0.0%) |
| Total (Category) | 116 (100.0%) | 0 (0.0%) |
| Total (Overall) | 340 (47.4%) | 377 (52.6%) |
Production, Transportation and Moving Occupations
The most common Production, Transportation and Moving occupations in Cottle County are , and Material Moving (51 | 7.1%).
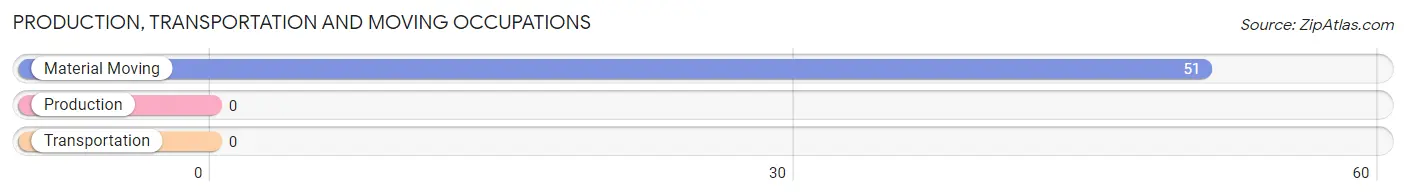
Production, Transportation and Moving Occupations by Sex
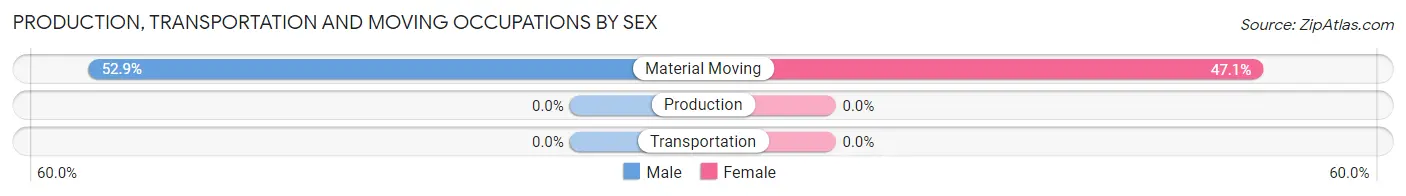
| Occupation | Male | Female |
| Production | 0 (0.0%) | 0 (0.0%) |
| Transportation | 0 (0.0%) | 0 (0.0%) |
| Material Moving | 27 (52.9%) | 24 (47.1%) |
| Total (Category) | 27 (52.9%) | 24 (47.1%) |
| Total (Overall) | 340 (47.4%) | 377 (52.6%) |
Employment Industries by Sex in Cottle County
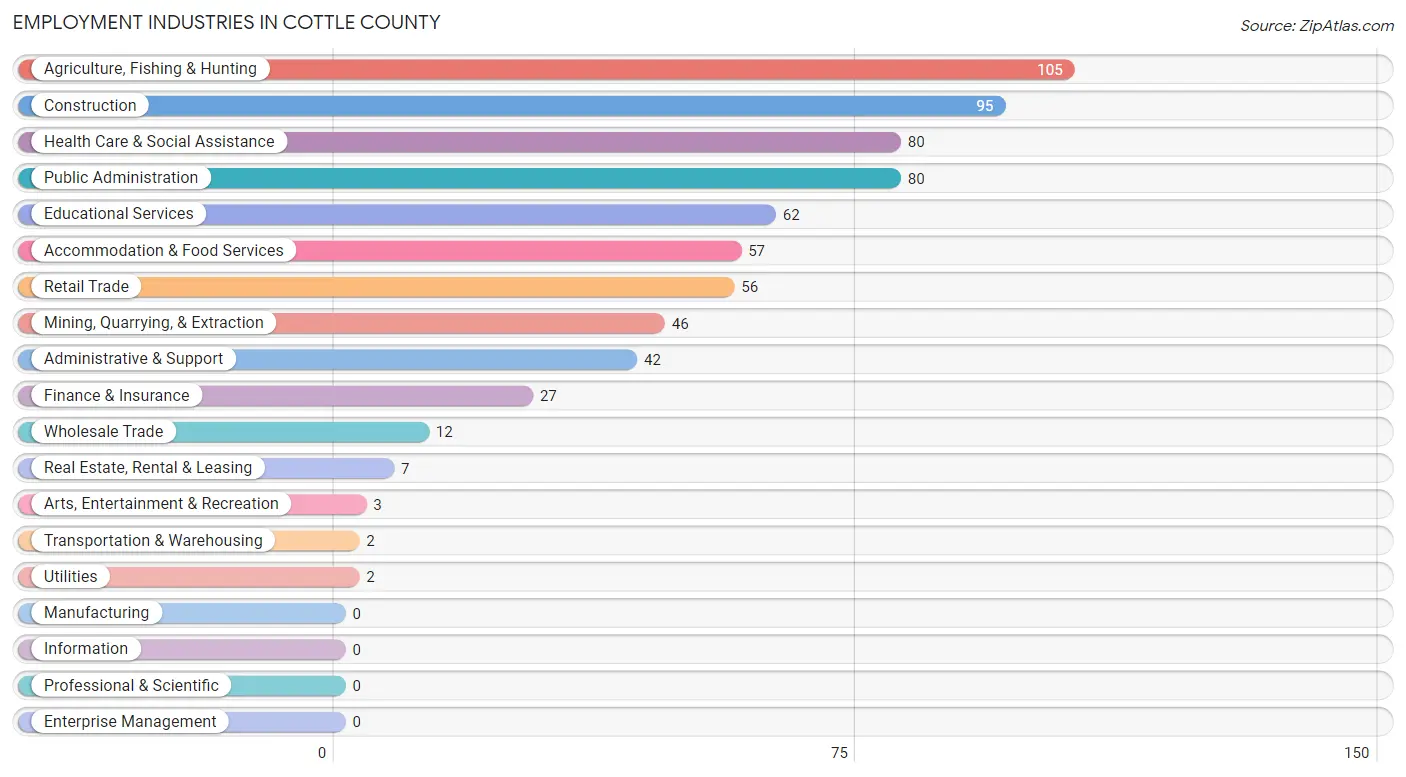
Employment Industries in Cottle County
The major employment industries in Cottle County include Agriculture, Fishing & Hunting (105 | 14.6%), Construction (95 | 13.3%), Health Care & Social Assistance (80 | 11.2%), Public Administration (80 | 11.2%), and Educational Services (62 | 8.6%).
Employment Industries by Sex in Cottle County
The Cottle County industries that see more men than women are Mining, Quarrying, & Extraction (100.0%), Construction (100.0%), and Wholesale Trade (100.0%), whereas the industries that tend to have a higher number of women are Finance & Insurance (100.0%), Real Estate, Rental & Leasing (100.0%), and Health Care & Social Assistance (100.0%).
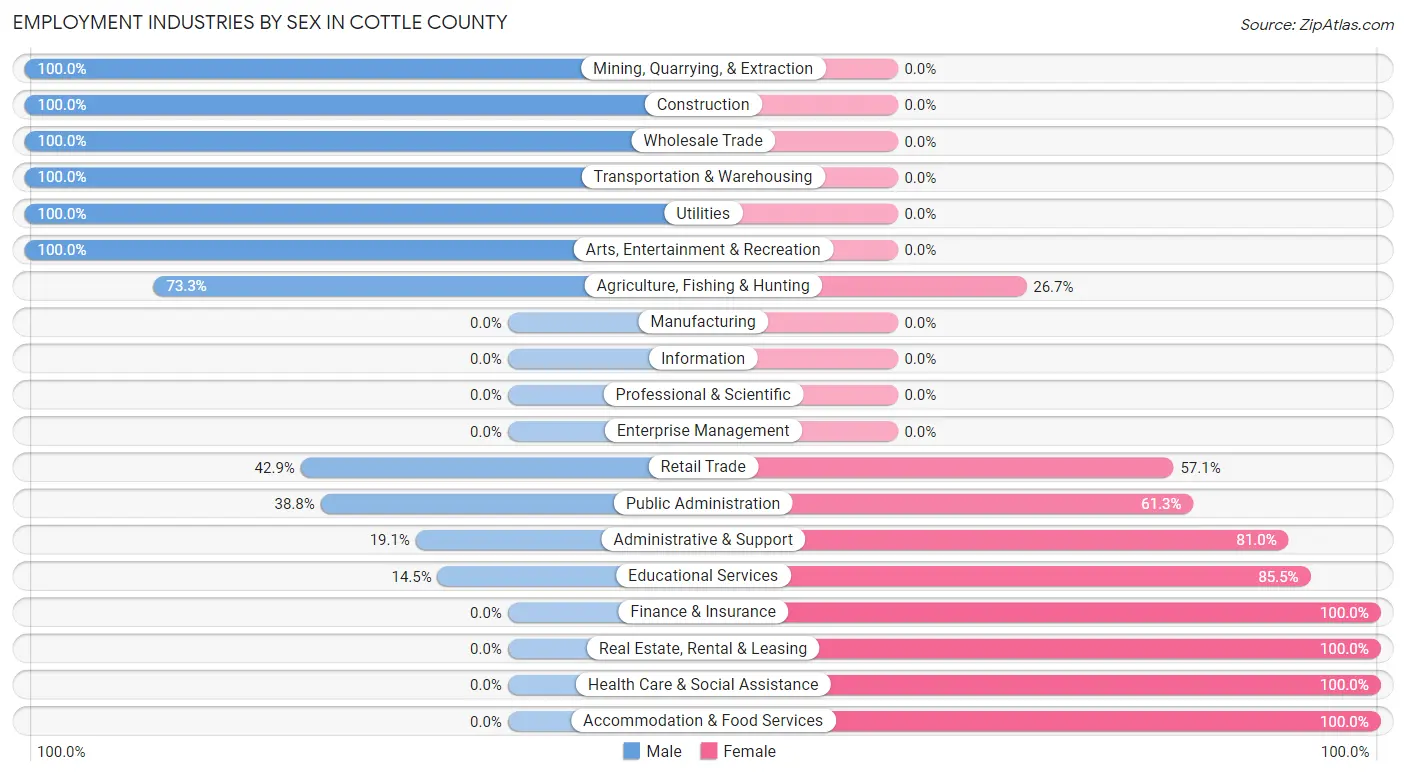
| Industry | Male | Female |
| Agriculture, Fishing & Hunting | 77 (73.3%) | 28 (26.7%) |
| Mining, Quarrying, & Extraction | 46 (100.0%) | 0 (0.0%) |
| Construction | 95 (100.0%) | 0 (0.0%) |
| Manufacturing | 0 (0.0%) | 0 (0.0%) |
| Wholesale Trade | 12 (100.0%) | 0 (0.0%) |
| Retail Trade | 24 (42.9%) | 32 (57.1%) |
| Transportation & Warehousing | 2 (100.0%) | 0 (0.0%) |
| Utilities | 2 (100.0%) | 0 (0.0%) |
| Information | 0 (0.0%) | 0 (0.0%) |
| Finance & Insurance | 0 (0.0%) | 27 (100.0%) |
| Real Estate, Rental & Leasing | 0 (0.0%) | 7 (100.0%) |
| Professional & Scientific | 0 (0.0%) | 0 (0.0%) |
| Enterprise Management | 0 (0.0%) | 0 (0.0%) |
| Administrative & Support | 8 (19.1%) | 34 (80.9%) |
| Educational Services | 9 (14.5%) | 53 (85.5%) |
| Health Care & Social Assistance | 0 (0.0%) | 80 (100.0%) |
| Arts, Entertainment & Recreation | 3 (100.0%) | 0 (0.0%) |
| Accommodation & Food Services | 0 (0.0%) | 57 (100.0%) |
| Public Administration | 31 (38.8%) | 49 (61.3%) |
| Total | 340 (47.4%) | 377 (52.6%) |
Education in Cottle County
School Enrollment in Cottle County
The most common levels of schooling among the 425 students in Cottle County are high school (110 | 25.9%), elementary school (108 | 25.4%), and middle school (101 | 23.8%).
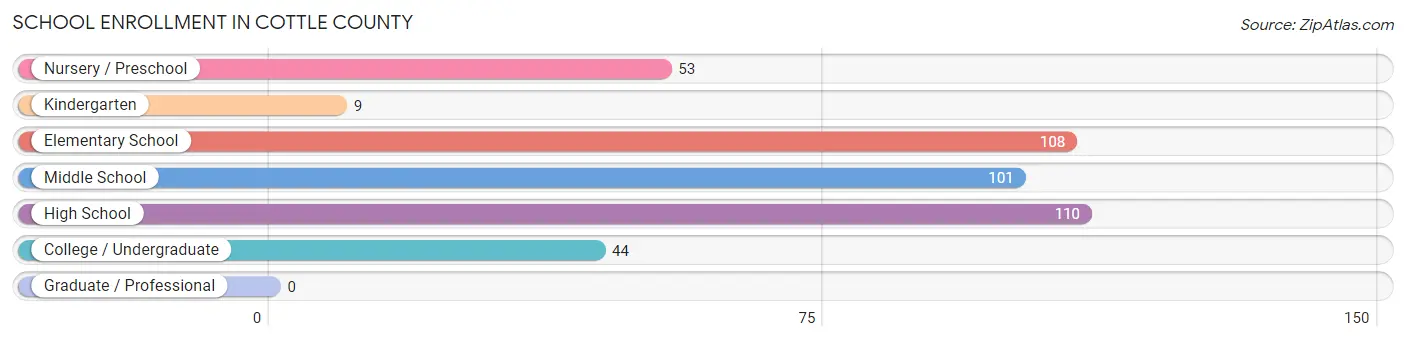
| School Level | # Students | % Students |
| Nursery / Preschool | 53 | 12.5% |
| Kindergarten | 9 | 2.1% |
| Elementary School | 108 | 25.4% |
| Middle School | 101 | 23.8% |
| High School | 110 | 25.9% |
| College / Undergraduate | 44 | 10.3% |
| Graduate / Professional | 0 | 0.0% |
| Total | 425 | 100.0% |
School Enrollment by Age by Funding Source in Cottle County
Out of a total of 425 students who are enrolled in schools in Cottle County, 53 (12.5%) attend a private institution, while the remaining 372 (87.5%) are enrolled in public schools. The age group of 25 to 34 year olds has the highest likelihood of being enrolled in private schools, with 21 (100.0% in the age bracket) enrolled. Conversely, the age group of 3 to 4 year olds has the lowest likelihood of being enrolled in a private school, with 53 (100.0% in the age bracket) attending a public institution.
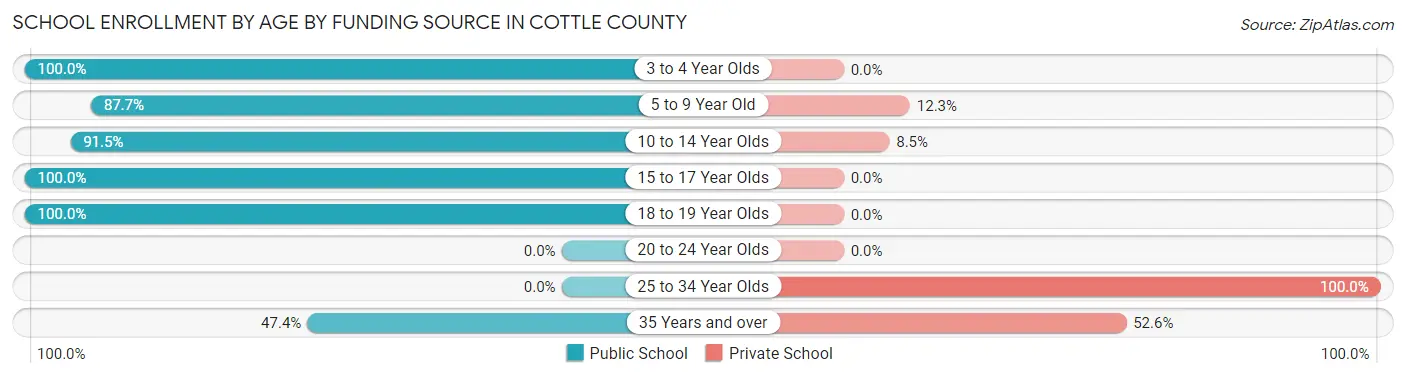
| Age Bracket | Public School | Private School |
| 3 to 4 Year Olds | 53 (100.0%) | 0 (0.0%) |
| 5 to 9 Year Old | 64 (87.7%) | 9 (12.3%) |
| 10 to 14 Year Olds | 140 (91.5%) | 13 (8.5%) |
| 15 to 17 Year Olds | 65 (100.0%) | 0 (0.0%) |
| 18 to 19 Year Olds | 41 (100.0%) | 0 (0.0%) |
| 20 to 24 Year Olds | 0 (0.0%) | 0 (0.0%) |
| 25 to 34 Year Olds | 0 (0.0%) | 21 (100.0%) |
| 35 Years and over | 9 (47.4%) | 10 (52.6%) |
| Total | 372 (87.5%) | 53 (12.5%) |
Educational Attainment by Field of Study in Cottle County
Business (80 | 34.8%), education (63 | 27.4%), visual & performing arts (20 | 8.7%), computers & mathematics (18 | 7.8%), and science & technology (13 | 5.7%) are the most common fields of study among 230 individuals in Cottle County who have obtained a bachelor's degree or higher.
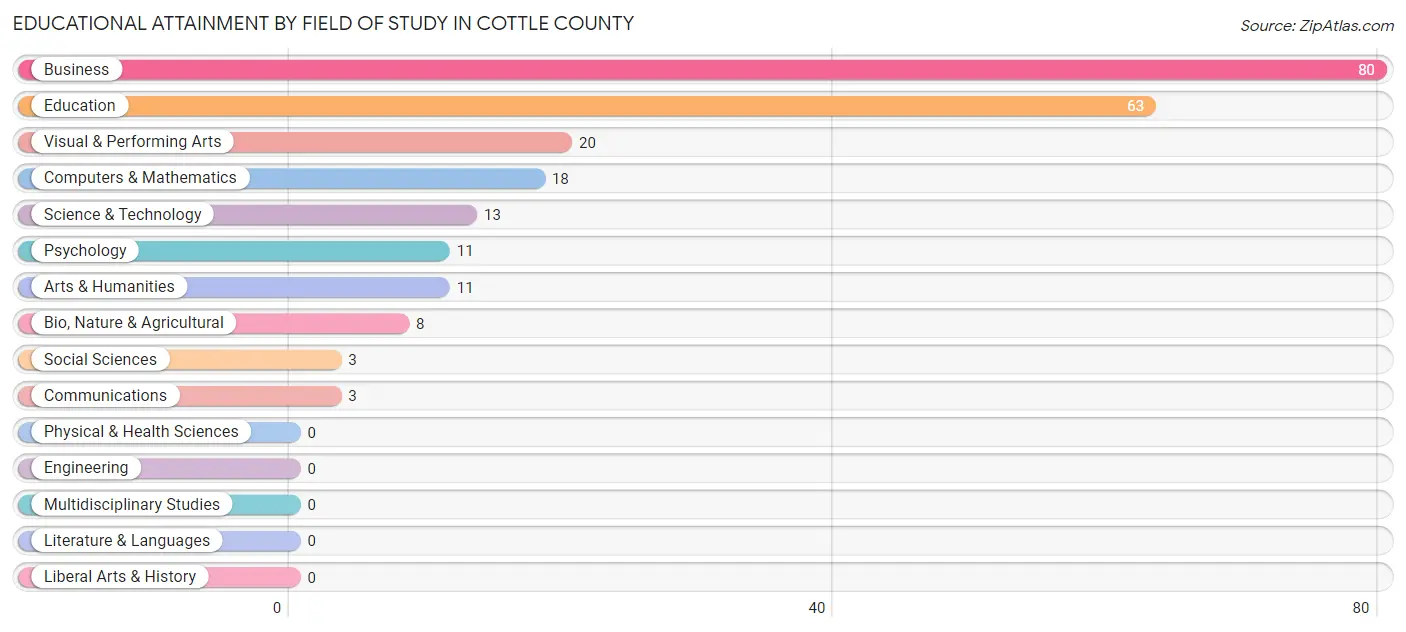
| Field of Study | # Graduates | % Graduates |
| Computers & Mathematics | 18 | 7.8% |
| Bio, Nature & Agricultural | 8 | 3.5% |
| Physical & Health Sciences | 0 | 0.0% |
| Psychology | 11 | 4.8% |
| Social Sciences | 3 | 1.3% |
| Engineering | 0 | 0.0% |
| Multidisciplinary Studies | 0 | 0.0% |
| Science & Technology | 13 | 5.7% |
| Business | 80 | 34.8% |
| Education | 63 | 27.4% |
| Literature & Languages | 0 | 0.0% |
| Liberal Arts & History | 0 | 0.0% |
| Visual & Performing Arts | 20 | 8.7% |
| Communications | 3 | 1.3% |
| Arts & Humanities | 11 | 4.8% |
| Total | 230 | 100.0% |
Transportation & Commute in Cottle County
Vehicle Availability by Sex in Cottle County
The most prevalent vehicle ownership categories in Cottle County are males with 2 vehicles (158, accounting for 47.0%) and females with 2 vehicles (159, making up 41.9%).
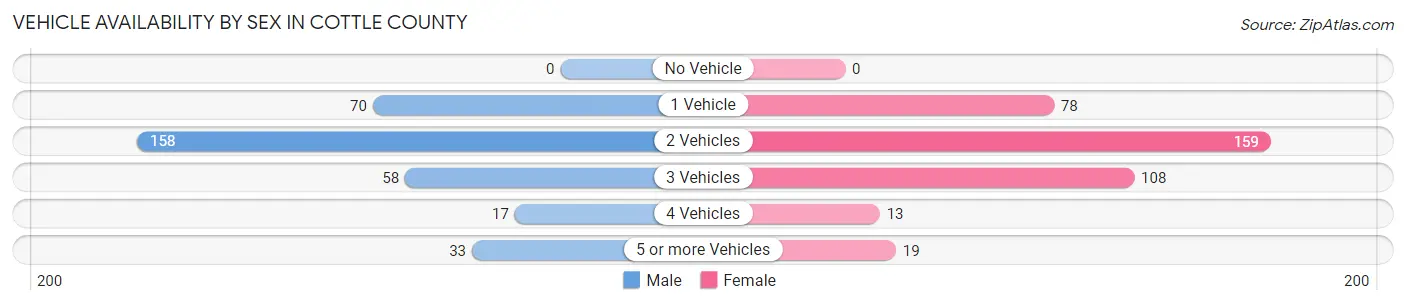
| Vehicles Available | Male | Female |
| No Vehicle | 0 (0.0%) | 0 (0.0%) |
| 1 Vehicle | 70 (20.8%) | 78 (20.7%) |
| 2 Vehicles | 158 (47.0%) | 159 (42.2%) |
| 3 Vehicles | 58 (17.3%) | 108 (28.6%) |
| 4 Vehicles | 17 (5.1%) | 13 (3.5%) |
| 5 or more Vehicles | 33 (9.8%) | 19 (5.0%) |
| Total | 336 (100.0%) | 377 (100.0%) |
Commute Time in Cottle County
The most frequently occuring commute durations in Cottle County are less than 5 minutes (121 commuters, 22.2%), 5 to 9 minutes (100 commuters, 18.4%), and 30 to 34 minutes (98 commuters, 18.0%).
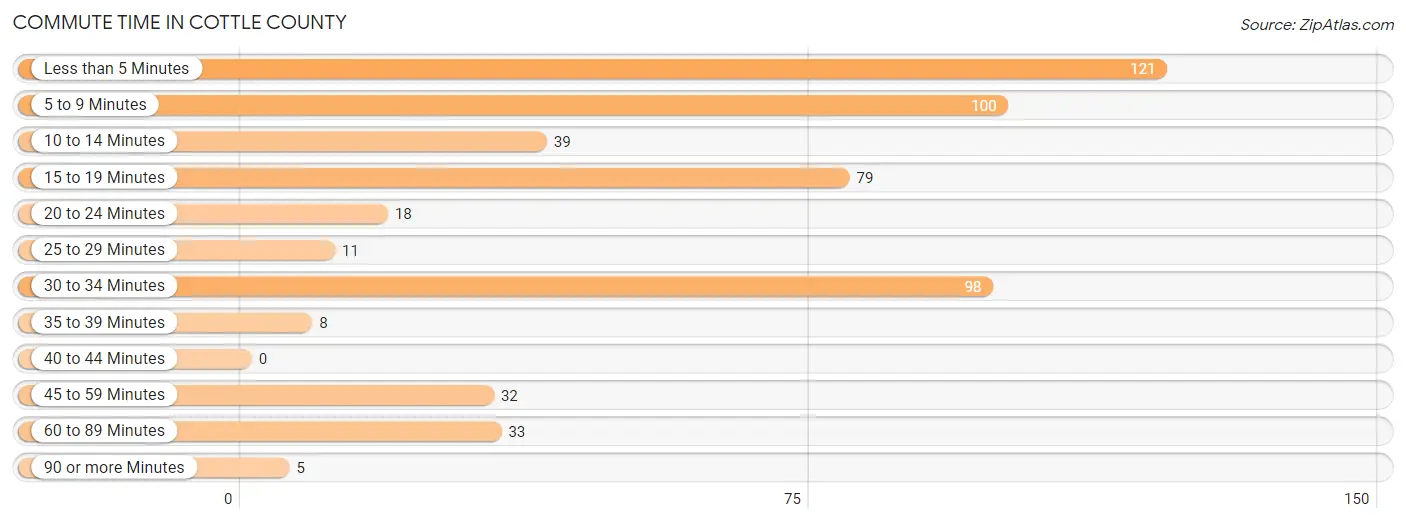
| Commute Time | # Commuters | % Commuters |
| Less than 5 Minutes | 121 | 22.2% |
| 5 to 9 Minutes | 100 | 18.4% |
| 10 to 14 Minutes | 39 | 7.2% |
| 15 to 19 Minutes | 79 | 14.5% |
| 20 to 24 Minutes | 18 | 3.3% |
| 25 to 29 Minutes | 11 | 2.0% |
| 30 to 34 Minutes | 98 | 18.0% |
| 35 to 39 Minutes | 8 | 1.5% |
| 40 to 44 Minutes | 0 | 0.0% |
| 45 to 59 Minutes | 32 | 5.9% |
| 60 to 89 Minutes | 33 | 6.1% |
| 90 or more Minutes | 5 | 0.9% |
Commute Time by Sex in Cottle County
The most common commute times in Cottle County are less than 5 minutes (50 commuters, 19.2%) for males and 5 to 9 minutes (73 commuters, 25.7%) for females.
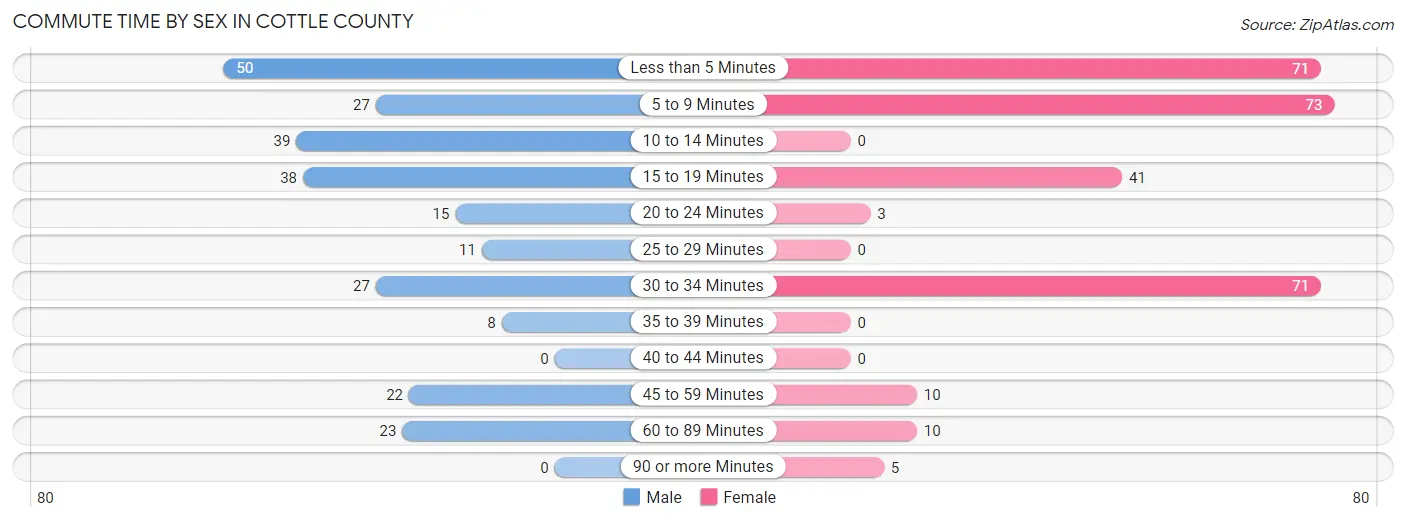
| Commute Time | Male | Female |
| Less than 5 Minutes | 50 (19.2%) | 71 (25.0%) |
| 5 to 9 Minutes | 27 (10.4%) | 73 (25.7%) |
| 10 to 14 Minutes | 39 (15.0%) | 0 (0.0%) |
| 15 to 19 Minutes | 38 (14.6%) | 41 (14.4%) |
| 20 to 24 Minutes | 15 (5.8%) | 3 (1.1%) |
| 25 to 29 Minutes | 11 (4.2%) | 0 (0.0%) |
| 30 to 34 Minutes | 27 (10.4%) | 71 (25.0%) |
| 35 to 39 Minutes | 8 (3.1%) | 0 (0.0%) |
| 40 to 44 Minutes | 0 (0.0%) | 0 (0.0%) |
| 45 to 59 Minutes | 22 (8.5%) | 10 (3.5%) |
| 60 to 89 Minutes | 23 (8.8%) | 10 (3.5%) |
| 90 or more Minutes | 0 (0.0%) | 5 (1.8%) |
Time of Departure to Work by Sex in Cottle County
The most frequent times of departure to work in Cottle County are 6:30 AM to 6:59 AM (47, 18.1%) for males and 7:30 AM to 7:59 AM (67, 23.6%) for females.
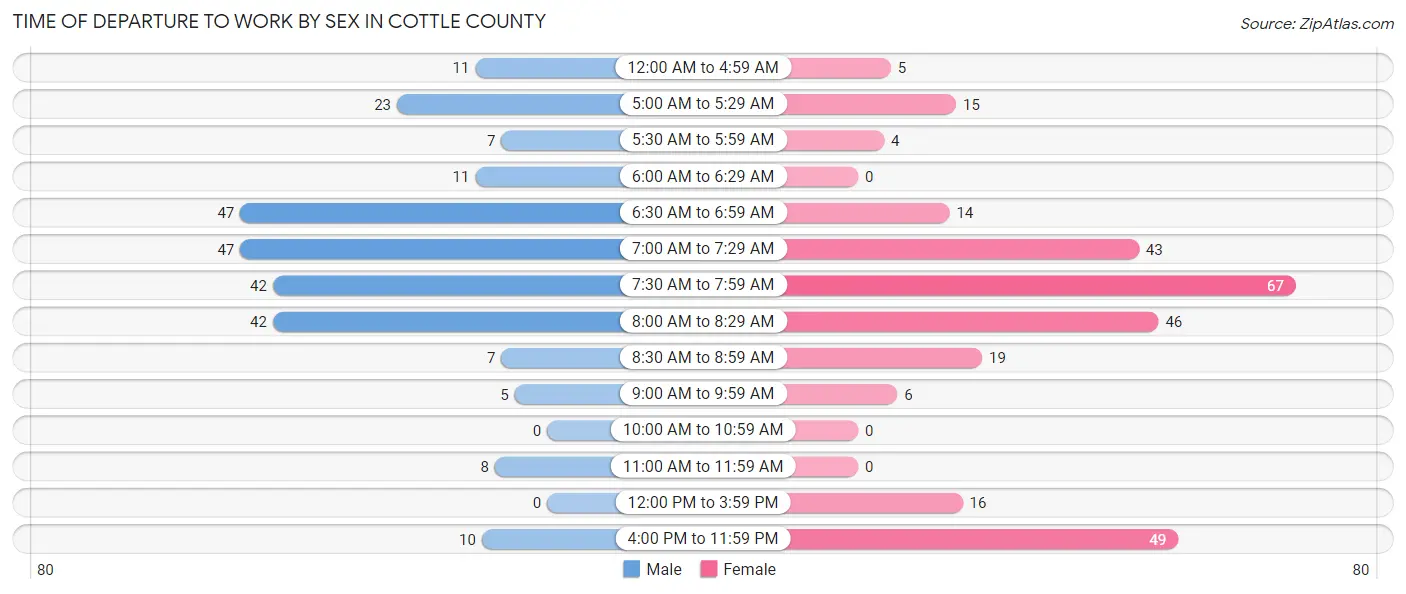
| Time of Departure | Male | Female |
| 12:00 AM to 4:59 AM | 11 (4.2%) | 5 (1.8%) |
| 5:00 AM to 5:29 AM | 23 (8.8%) | 15 (5.3%) |
| 5:30 AM to 5:59 AM | 7 (2.7%) | 4 (1.4%) |
| 6:00 AM to 6:29 AM | 11 (4.2%) | 0 (0.0%) |
| 6:30 AM to 6:59 AM | 47 (18.1%) | 14 (4.9%) |
| 7:00 AM to 7:29 AM | 47 (18.1%) | 43 (15.1%) |
| 7:30 AM to 7:59 AM | 42 (16.2%) | 67 (23.6%) |
| 8:00 AM to 8:29 AM | 42 (16.2%) | 46 (16.2%) |
| 8:30 AM to 8:59 AM | 7 (2.7%) | 19 (6.7%) |
| 9:00 AM to 9:59 AM | 5 (1.9%) | 6 (2.1%) |
| 10:00 AM to 10:59 AM | 0 (0.0%) | 0 (0.0%) |
| 11:00 AM to 11:59 AM | 8 (3.1%) | 0 (0.0%) |
| 12:00 PM to 3:59 PM | 0 (0.0%) | 16 (5.6%) |
| 4:00 PM to 11:59 PM | 10 (3.8%) | 49 (17.2%) |
| Total | 260 (100.0%) | 284 (100.0%) |
Housing Occupancy in Cottle County
Occupancy by Ownership in Cottle County
Of the total 692 dwellings in Cottle County, owner-occupied units account for 462 (66.8%), while renter-occupied units make up 230 (33.2%).
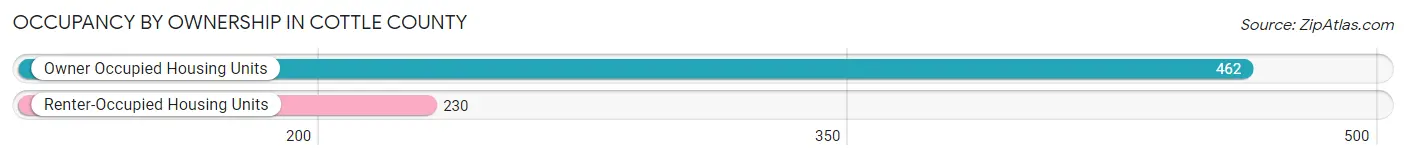
| Occupancy | # Housing Units | % Housing Units |
| Owner Occupied Housing Units | 462 | 66.8% |
| Renter-Occupied Housing Units | 230 | 33.2% |
| Total Occupied Housing Units | 692 | 100.0% |
Occupancy by Household Size in Cottle County
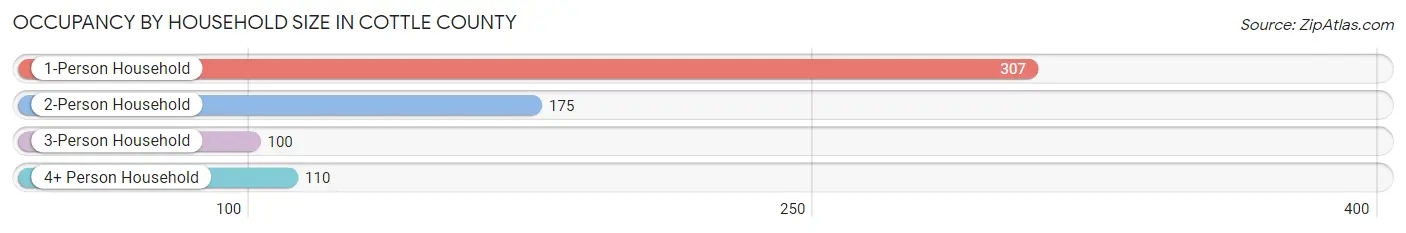
| Household Size | # Housing Units | % Housing Units |
| 1-Person Household | 307 | 44.4% |
| 2-Person Household | 175 | 25.3% |
| 3-Person Household | 100 | 14.4% |
| 4+ Person Household | 110 | 15.9% |
| Total Housing Units | 692 | 100.0% |
Occupancy by Ownership by Household Size in Cottle County
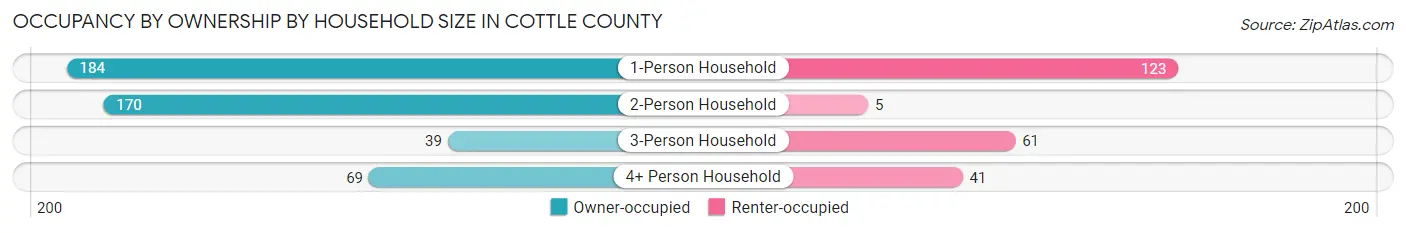
| Household Size | Owner-occupied | Renter-occupied |
| 1-Person Household | 184 (59.9%) | 123 (40.1%) |
| 2-Person Household | 170 (97.1%) | 5 (2.9%) |
| 3-Person Household | 39 (39.0%) | 61 (61.0%) |
| 4+ Person Household | 69 (62.7%) | 41 (37.3%) |
| Total Housing Units | 462 (66.8%) | 230 (33.2%) |
Occupancy by Educational Attainment in Cottle County
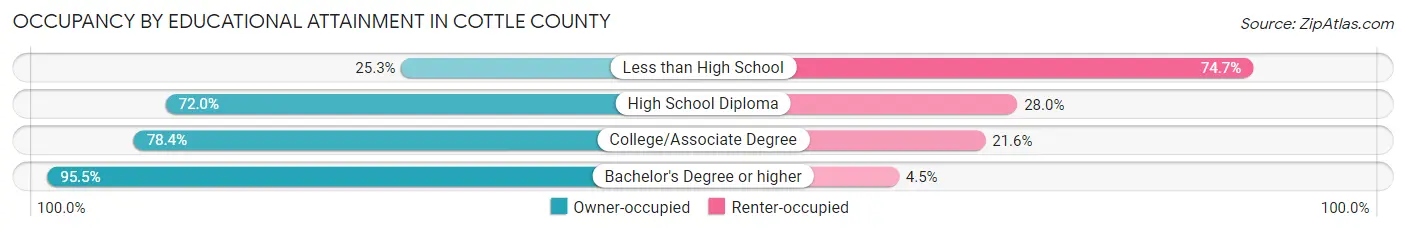
| Household Size | Owner-occupied | Renter-occupied |
| Less than High School | 43 (25.3%) | 127 (74.7%) |
| High School Diploma | 103 (72.0%) | 40 (28.0%) |
| College/Associate Degree | 210 (78.4%) | 58 (21.6%) |
| Bachelor's Degree or higher | 106 (95.5%) | 5 (4.5%) |
Occupancy by Age of Householder in Cottle County
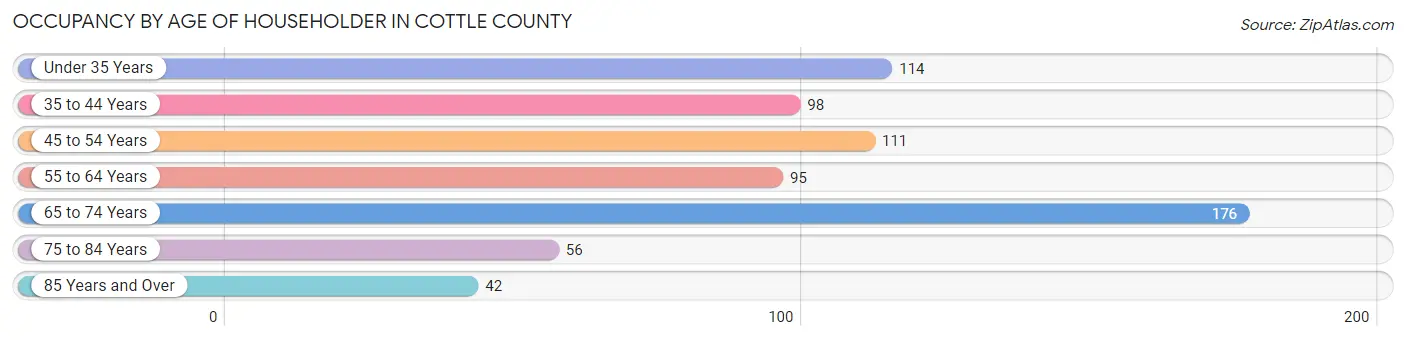
| Age Bracket | # Households | % Households |
| Under 35 Years | 114 | 16.5% |
| 35 to 44 Years | 98 | 14.2% |
| 45 to 54 Years | 111 | 16.0% |
| 55 to 64 Years | 95 | 13.7% |
| 65 to 74 Years | 176 | 25.4% |
| 75 to 84 Years | 56 | 8.1% |
| 85 Years and Over | 42 | 6.1% |
| Total | 692 | 100.0% |
Housing Finances in Cottle County
Median Income by Occupancy in Cottle County
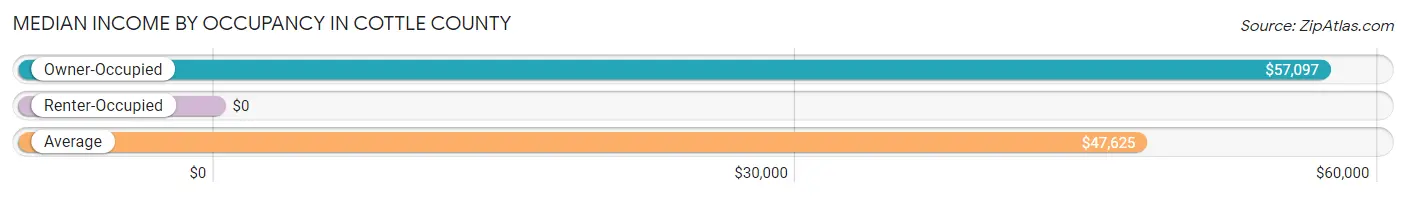
| Occupancy Type | # Households | Median Income |
| Owner-Occupied | 462 (66.8%) | $57,097 |
| Renter-Occupied | 230 (33.2%) | $0 |
| Average | 692 (100.0%) | $47,625 |
Occupancy by Householder Income Bracket in Cottle County
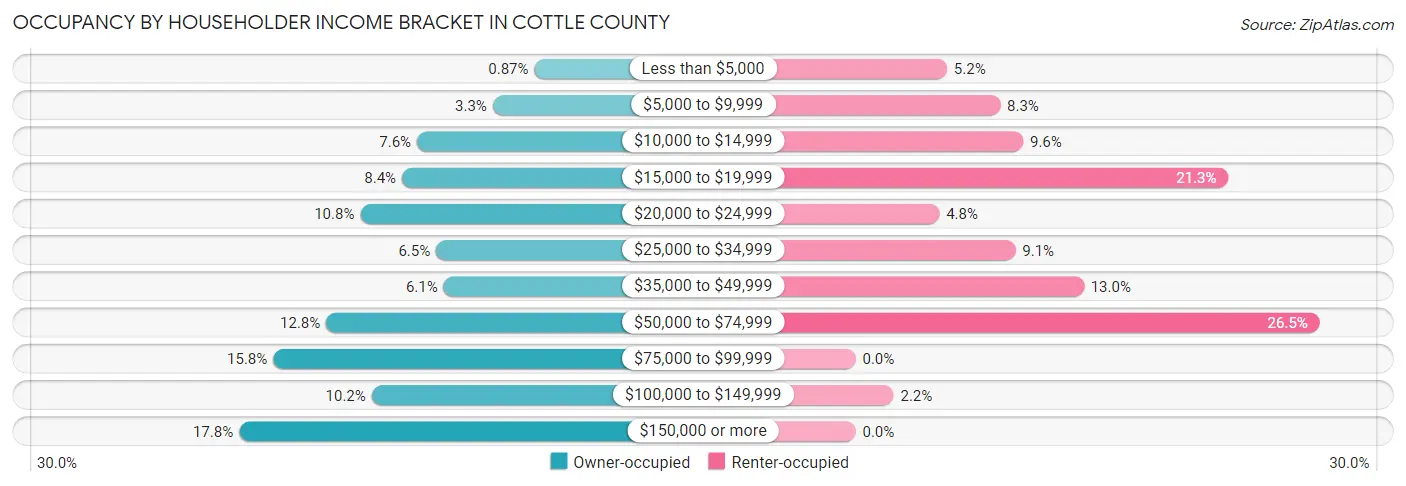
| Income Bracket | Owner-occupied | Renter-occupied |
| Less than $5,000 | 4 (0.9%) | 12 (5.2%) |
| $5,000 to $9,999 | 15 (3.3%) | 19 (8.3%) |
| $10,000 to $14,999 | 35 (7.6%) | 22 (9.6%) |
| $15,000 to $19,999 | 39 (8.4%) | 49 (21.3%) |
| $20,000 to $24,999 | 50 (10.8%) | 11 (4.8%) |
| $25,000 to $34,999 | 30 (6.5%) | 21 (9.1%) |
| $35,000 to $49,999 | 28 (6.1%) | 30 (13.0%) |
| $50,000 to $74,999 | 59 (12.8%) | 61 (26.5%) |
| $75,000 to $99,999 | 73 (15.8%) | 0 (0.0%) |
| $100,000 to $149,999 | 47 (10.2%) | 5 (2.2%) |
| $150,000 or more | 82 (17.7%) | 0 (0.0%) |
| Total | 462 (100.0%) | 230 (100.0%) |
Monthly Housing Cost Tiers in Cottle County
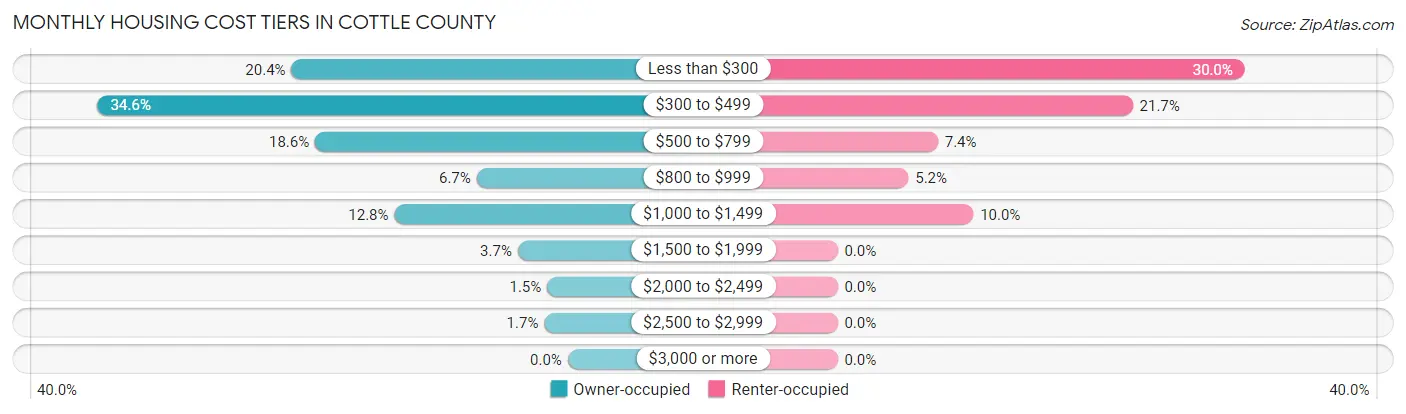
| Monthly Cost | Owner-occupied | Renter-occupied |
| Less than $300 | 94 (20.3%) | 69 (30.0%) |
| $300 to $499 | 160 (34.6%) | 50 (21.7%) |
| $500 to $799 | 86 (18.6%) | 17 (7.4%) |
| $800 to $999 | 31 (6.7%) | 12 (5.2%) |
| $1,000 to $1,499 | 59 (12.8%) | 23 (10.0%) |
| $1,500 to $1,999 | 17 (3.7%) | 0 (0.0%) |
| $2,000 to $2,499 | 7 (1.5%) | 0 (0.0%) |
| $2,500 to $2,999 | 8 (1.7%) | 0 (0.0%) |
| $3,000 or more | 0 (0.0%) | 0 (0.0%) |
| Total | 462 (100.0%) | 230 (100.0%) |
Physical Housing Characteristics in Cottle County
Housing Structures in Cottle County
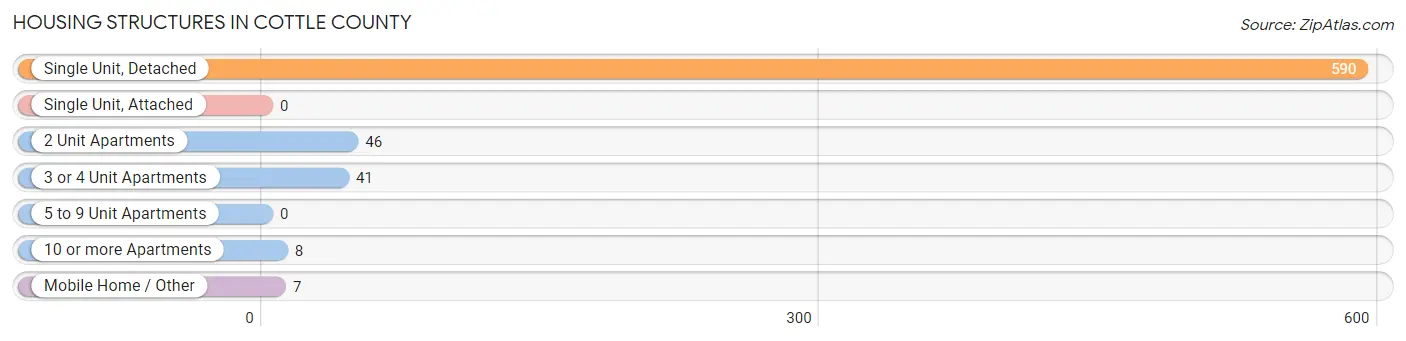
| Structure Type | # Housing Units | % Housing Units |
| Single Unit, Detached | 590 | 85.3% |
| Single Unit, Attached | 0 | 0.0% |
| 2 Unit Apartments | 46 | 6.7% |
| 3 or 4 Unit Apartments | 41 | 5.9% |
| 5 to 9 Unit Apartments | 0 | 0.0% |
| 10 or more Apartments | 8 | 1.2% |
| Mobile Home / Other | 7 | 1.0% |
| Total | 692 | 100.0% |
Housing Structures by Occupancy in Cottle County
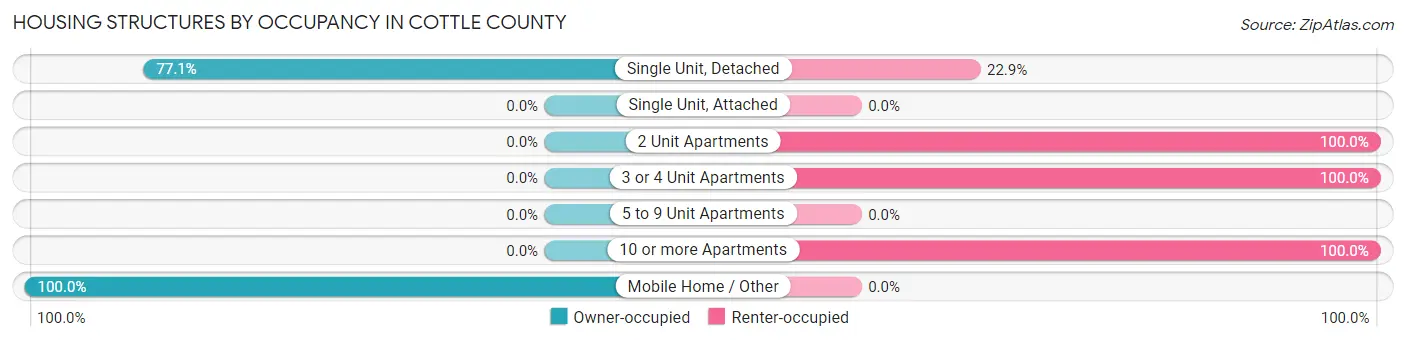
| Structure Type | Owner-occupied | Renter-occupied |
| Single Unit, Detached | 455 (77.1%) | 135 (22.9%) |
| Single Unit, Attached | 0 (0.0%) | 0 (0.0%) |
| 2 Unit Apartments | 0 (0.0%) | 46 (100.0%) |
| 3 or 4 Unit Apartments | 0 (0.0%) | 41 (100.0%) |
| 5 to 9 Unit Apartments | 0 (0.0%) | 0 (0.0%) |
| 10 or more Apartments | 0 (0.0%) | 8 (100.0%) |
| Mobile Home / Other | 7 (100.0%) | 0 (0.0%) |
| Total | 462 (66.8%) | 230 (33.2%) |
Housing Structures by Number of Rooms in Cottle County
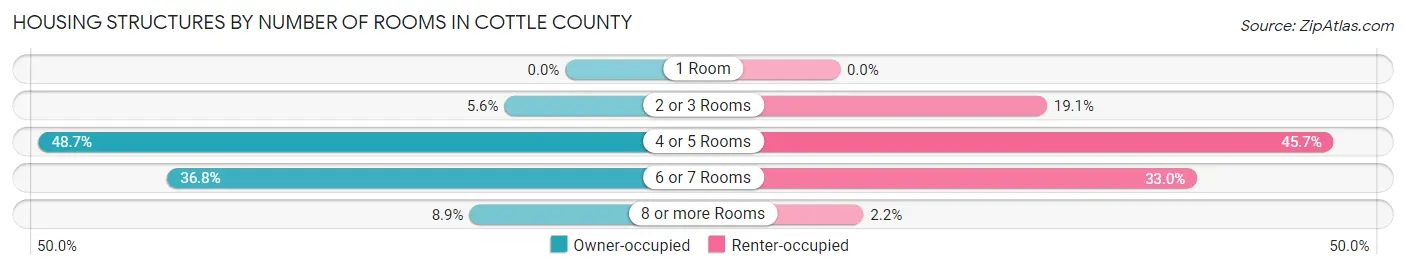
| Number of Rooms | Owner-occupied | Renter-occupied |
| 1 Room | 0 (0.0%) | 0 (0.0%) |
| 2 or 3 Rooms | 26 (5.6%) | 44 (19.1%) |
| 4 or 5 Rooms | 225 (48.7%) | 105 (45.7%) |
| 6 or 7 Rooms | 170 (36.8%) | 76 (33.0%) |
| 8 or more Rooms | 41 (8.9%) | 5 (2.2%) |
| Total | 462 (100.0%) | 230 (100.0%) |
Housing Structure by Heating Type in Cottle County
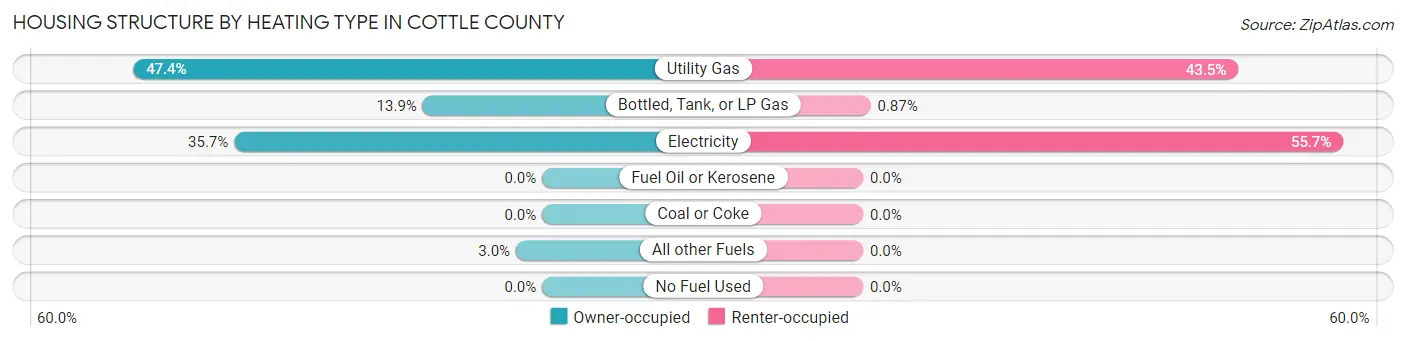
| Heating Type | Owner-occupied | Renter-occupied |
| Utility Gas | 219 (47.4%) | 100 (43.5%) |
| Bottled, Tank, or LP Gas | 64 (13.9%) | 2 (0.9%) |
| Electricity | 165 (35.7%) | 128 (55.6%) |
| Fuel Oil or Kerosene | 0 (0.0%) | 0 (0.0%) |
| Coal or Coke | 0 (0.0%) | 0 (0.0%) |
| All other Fuels | 14 (3.0%) | 0 (0.0%) |
| No Fuel Used | 0 (0.0%) | 0 (0.0%) |
| Total | 462 (100.0%) | 230 (100.0%) |
Household Vehicle Usage in Cottle County
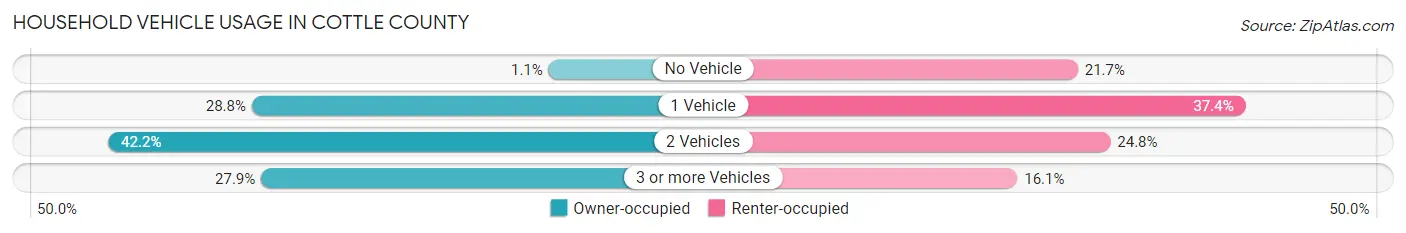
| Vehicles per Household | Owner-occupied | Renter-occupied |
| No Vehicle | 5 (1.1%) | 50 (21.7%) |
| 1 Vehicle | 133 (28.8%) | 86 (37.4%) |
| 2 Vehicles | 195 (42.2%) | 57 (24.8%) |
| 3 or more Vehicles | 129 (27.9%) | 37 (16.1%) |
| Total | 462 (100.0%) | 230 (100.0%) |
Real Estate & Mortgages in Cottle County
Real Estate and Mortgage Overview in Cottle County
| Characteristic | Without Mortgage | With Mortgage |
| Housing Units | 339 | 123 |
| Median Property Value | $52,300 | $48,800 |
| Median Household Income | $54,688 | $28 |
| Monthly Housing Costs | $370 | $0 |
| Real Estate Taxes | $582 | $4 |
Property Value by Mortgage Status in Cottle County
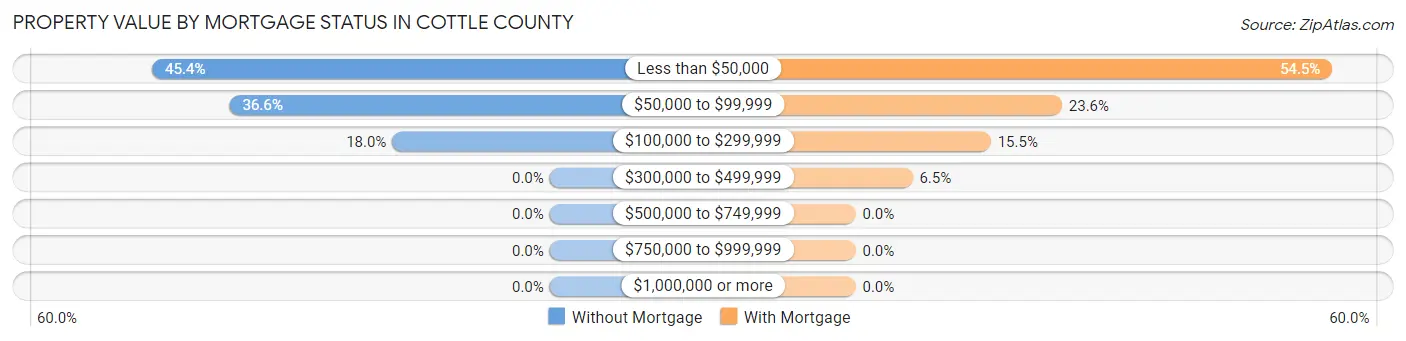
| Property Value | Without Mortgage | With Mortgage |
| Less than $50,000 | 154 (45.4%) | 67 (54.5%) |
| $50,000 to $99,999 | 124 (36.6%) | 29 (23.6%) |
| $100,000 to $299,999 | 61 (18.0%) | 19 (15.4%) |
| $300,000 to $499,999 | 0 (0.0%) | 8 (6.5%) |
| $500,000 to $749,999 | 0 (0.0%) | 0 (0.0%) |
| $750,000 to $999,999 | 0 (0.0%) | 0 (0.0%) |
| $1,000,000 or more | 0 (0.0%) | 0 (0.0%) |
| Total | 339 (100.0%) | 123 (100.0%) |
Household Income by Mortgage Status in Cottle County
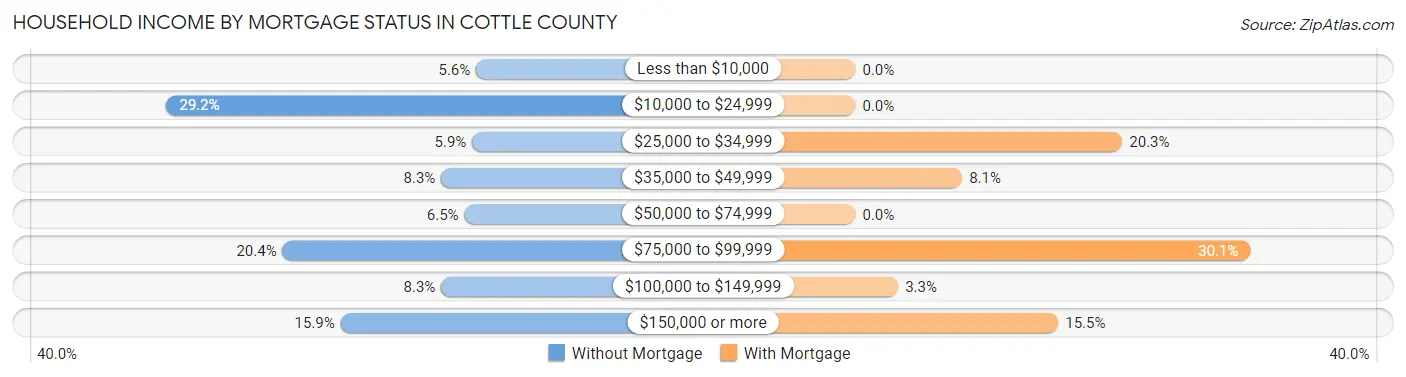
| Household Income | Without Mortgage | With Mortgage |
| Less than $10,000 | 19 (5.6%) | 0 (0.0%) |
| $10,000 to $24,999 | 99 (29.2%) | 0 (0.0%) |
| $25,000 to $34,999 | 20 (5.9%) | 25 (20.3%) |
| $35,000 to $49,999 | 28 (8.3%) | 10 (8.1%) |
| $50,000 to $74,999 | 22 (6.5%) | 0 (0.0%) |
| $75,000 to $99,999 | 69 (20.3%) | 37 (30.1%) |
| $100,000 to $149,999 | 28 (8.3%) | 4 (3.3%) |
| $150,000 or more | 54 (15.9%) | 19 (15.4%) |
| Total | 339 (100.0%) | 123 (100.0%) |
Property Value to Household Income Ratio in Cottle County
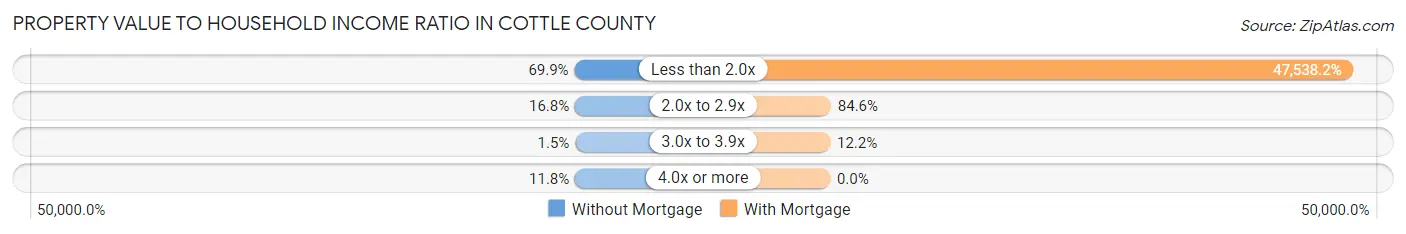
| Value-to-Income Ratio | Without Mortgage | With Mortgage |
| Less than 2.0x | 237 (69.9%) | 58,472 (47,538.2%) |
| 2.0x to 2.9x | 57 (16.8%) | 104 (84.6%) |
| 3.0x to 3.9x | 5 (1.5%) | 15 (12.2%) |
| 4.0x or more | 40 (11.8%) | 0 (0.0%) |
| Total | 339 (100.0%) | 123 (100.0%) |
Real Estate Taxes by Mortgage Status in Cottle County
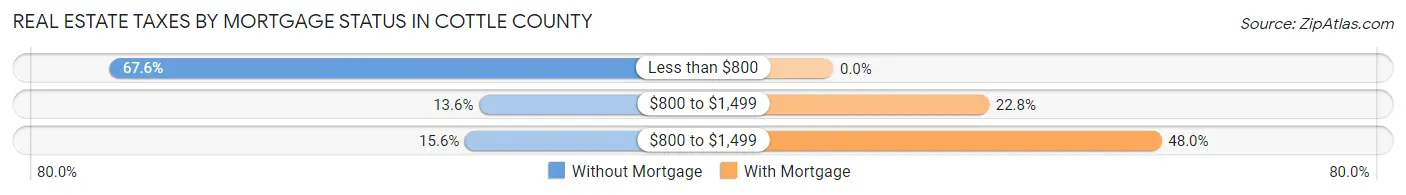
| Property Taxes | Without Mortgage | With Mortgage |
| Less than $800 | 229 (67.5%) | 0 (0.0%) |
| $800 to $1,499 | 46 (13.6%) | 28 (22.8%) |
| $800 to $1,499 | 53 (15.6%) | 59 (48.0%) |
| Total | 339 (100.0%) | 123 (100.0%) |
Health & Disability in Cottle County
Health Insurance Coverage by Age in Cottle County
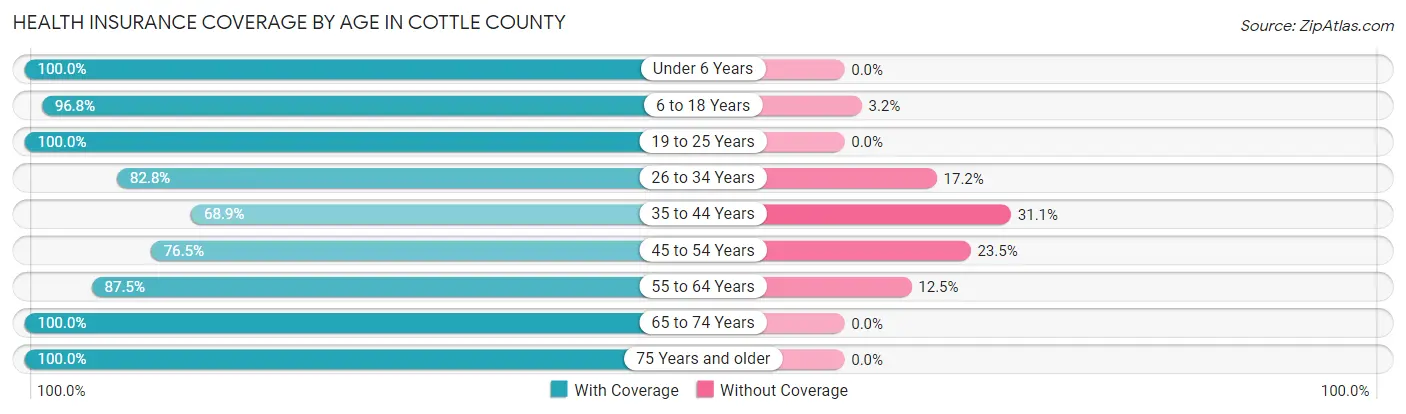
| Age Bracket | With Coverage | Without Coverage |
| Under 6 Years | 115 (100.0%) | 0 (0.0%) |
| 6 to 18 Years | 332 (96.8%) | 11 (3.2%) |
| 19 to 25 Years | 96 (100.0%) | 0 (0.0%) |
| 26 to 34 Years | 173 (82.8%) | 36 (17.2%) |
| 35 to 44 Years | 162 (68.9%) | 73 (31.1%) |
| 45 to 54 Years | 117 (76.5%) | 36 (23.5%) |
| 55 to 64 Years | 119 (87.5%) | 17 (12.5%) |
| 65 to 74 Years | 229 (100.0%) | 0 (0.0%) |
| 75 Years and older | 131 (100.0%) | 0 (0.0%) |
| Total | 1,474 (89.5%) | 173 (10.5%) |
Health Insurance Coverage by Citizenship Status in Cottle County
| Citizenship Status | With Coverage | Without Coverage |
| Native Born | 115 (100.0%) | 0 (0.0%) |
| Foreign Born, Citizen | 332 (96.8%) | 11 (3.2%) |
| Foreign Born, not a Citizen | 96 (100.0%) | 0 (0.0%) |
Health Insurance Coverage by Household Income in Cottle County
| Household Income | With Coverage | Without Coverage |
| Under $25,000 | 316 (85.9%) | 52 (14.1%) |
| $25,000 to $49,999 | 441 (98.2%) | 8 (1.8%) |
| $50,000 to $74,999 | 248 (84.1%) | 47 (15.9%) |
| $75,000 to $99,999 | 102 (72.9%) | 38 (27.1%) |
| $100,000 and over | 367 (92.9%) | 28 (7.1%) |
Public vs Private Health Insurance Coverage by Age in Cottle County
| Age Bracket | Public Insurance | Private Insurance |
| Under 6 | 87 (75.6%) | 51 (44.4%) |
| 6 to 18 Years | 160 (46.7%) | 237 (69.1%) |
| 19 to 25 Years | 32 (33.3%) | 64 (66.7%) |
| 25 to 34 Years | 86 (41.1%) | 92 (44.0%) |
| 35 to 44 Years | 31 (13.2%) | 147 (62.5%) |
| 45 to 54 Years | 7 (4.6%) | 110 (71.9%) |
| 55 to 64 Years | 26 (19.1%) | 93 (68.4%) |
| 65 to 74 Years | 229 (100.0%) | 161 (70.3%) |
| 75 Years and over | 131 (100.0%) | 93 (71.0%) |
| Total | 789 (47.9%) | 1,048 (63.6%) |
Disability Status by Sex by Age in Cottle County
| Age Bracket | Male | Female |
| Under 5 Years | 0 (0.0%) | 7 (13.7%) |
| 5 to 17 Years | 47 (21.5%) | 2 (2.0%) |
| 18 to 34 Years | 73 (37.8%) | 4 (2.7%) |
| 35 to 64 Years | 31 (13.8%) | 84 (28.0%) |
| 65 to 74 Years | 62 (54.9%) | 57 (49.1%) |
| 75 Years and over | 28 (56.0%) | 63 (77.8%) |
Disability Class by Sex by Age in Cottle County
Disability Class: Hearing Difficulty
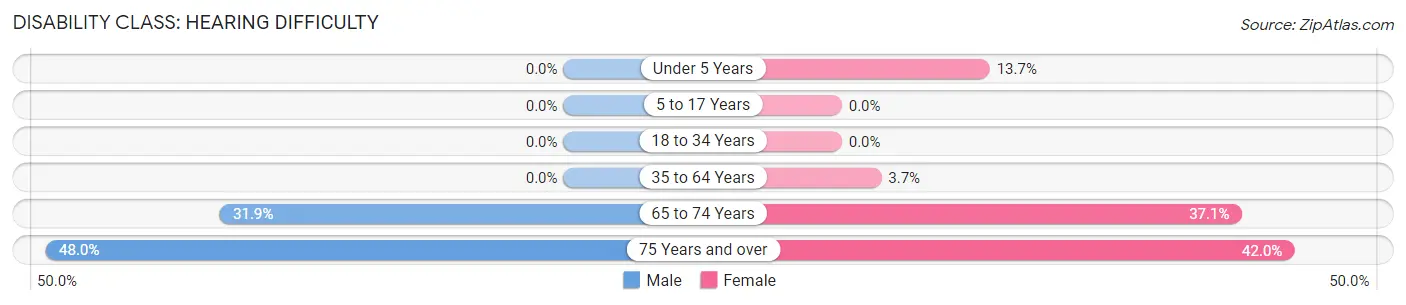
| Age Bracket | Male | Female |
| Under 5 Years | 0 (0.0%) | 7 (13.7%) |
| 5 to 17 Years | 0 (0.0%) | 0 (0.0%) |
| 18 to 34 Years | 0 (0.0%) | 0 (0.0%) |
| 35 to 64 Years | 0 (0.0%) | 11 (3.7%) |
| 65 to 74 Years | 36 (31.9%) | 43 (37.1%) |
| 75 Years and over | 24 (48.0%) | 34 (42.0%) |
Disability Class: Vision Difficulty
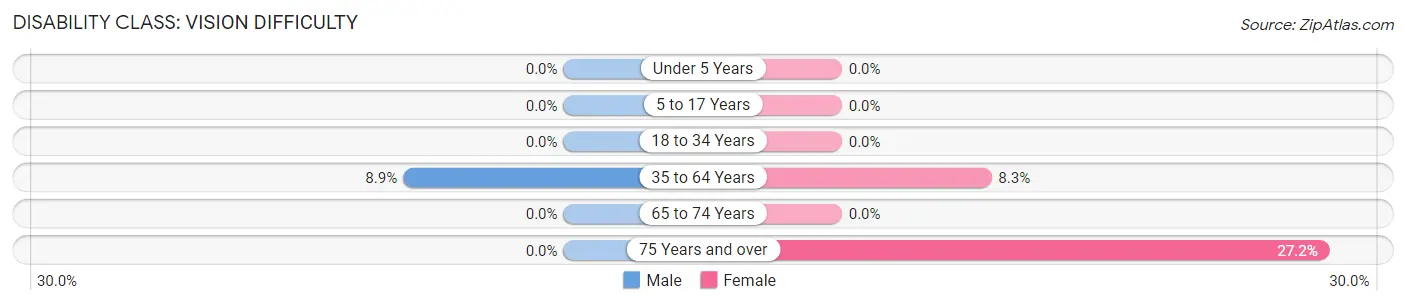
| Age Bracket | Male | Female |
| Under 5 Years | 0 (0.0%) | 0 (0.0%) |
| 5 to 17 Years | 0 (0.0%) | 0 (0.0%) |
| 18 to 34 Years | 0 (0.0%) | 0 (0.0%) |
| 35 to 64 Years | 20 (8.9%) | 25 (8.3%) |
| 65 to 74 Years | 0 (0.0%) | 0 (0.0%) |
| 75 Years and over | 0 (0.0%) | 22 (27.2%) |
Disability Class: Cognitive Difficulty
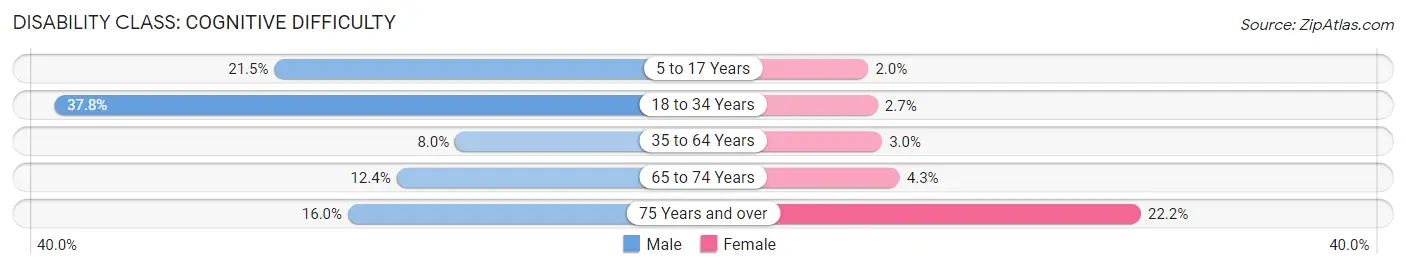
| Age Bracket | Male | Female |
| 5 to 17 Years | 47 (21.5%) | 2 (2.0%) |
| 18 to 34 Years | 73 (37.8%) | 4 (2.7%) |
| 35 to 64 Years | 18 (8.0%) | 9 (3.0%) |
| 65 to 74 Years | 14 (12.4%) | 5 (4.3%) |
| 75 Years and over | 8 (16.0%) | 18 (22.2%) |
Disability Class: Ambulatory Difficulty
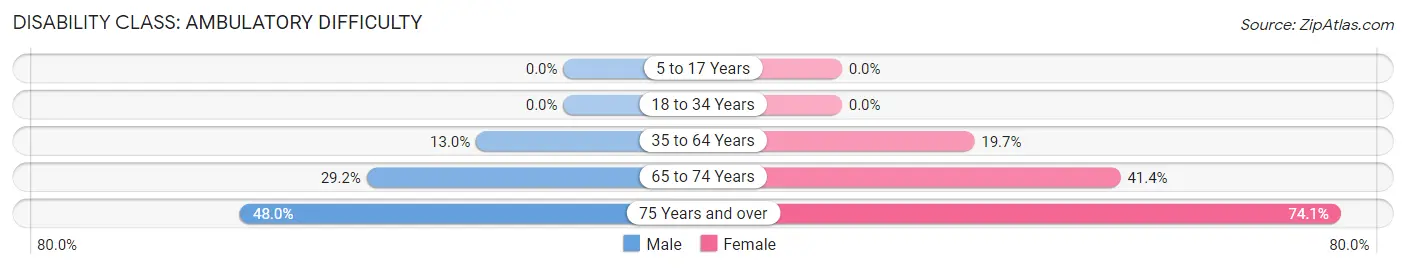
| Age Bracket | Male | Female |
| 5 to 17 Years | 0 (0.0%) | 0 (0.0%) |
| 18 to 34 Years | 0 (0.0%) | 0 (0.0%) |
| 35 to 64 Years | 29 (13.0%) | 59 (19.7%) |
| 65 to 74 Years | 33 (29.2%) | 48 (41.4%) |
| 75 Years and over | 24 (48.0%) | 60 (74.1%) |
Disability Class: Self-Care Difficulty
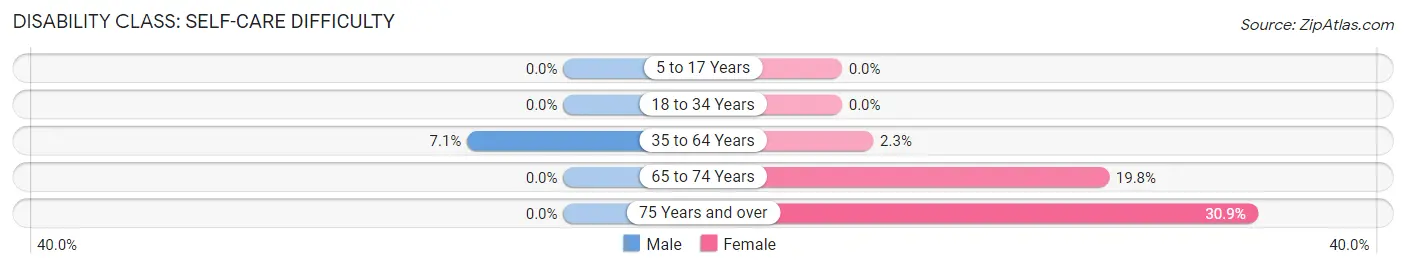
| Age Bracket | Male | Female |
| 5 to 17 Years | 0 (0.0%) | 0 (0.0%) |
| 18 to 34 Years | 0 (0.0%) | 0 (0.0%) |
| 35 to 64 Years | 16 (7.1%) | 7 (2.3%) |
| 65 to 74 Years | 0 (0.0%) | 23 (19.8%) |
| 75 Years and over | 0 (0.0%) | 25 (30.9%) |
Technology Access in Cottle County
Computing Device Access in Cottle County
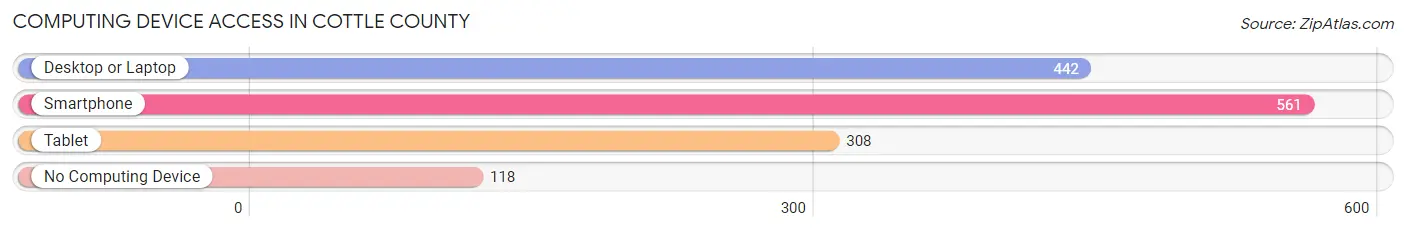
| Device Type | # Households | % Households |
| Desktop or Laptop | 442 | 63.9% |
| Smartphone | 561 | 81.1% |
| Tablet | 308 | 44.5% |
| No Computing Device | 118 | 17.1% |
| Total | 692 | 100.0% |
Internet Access in Cottle County
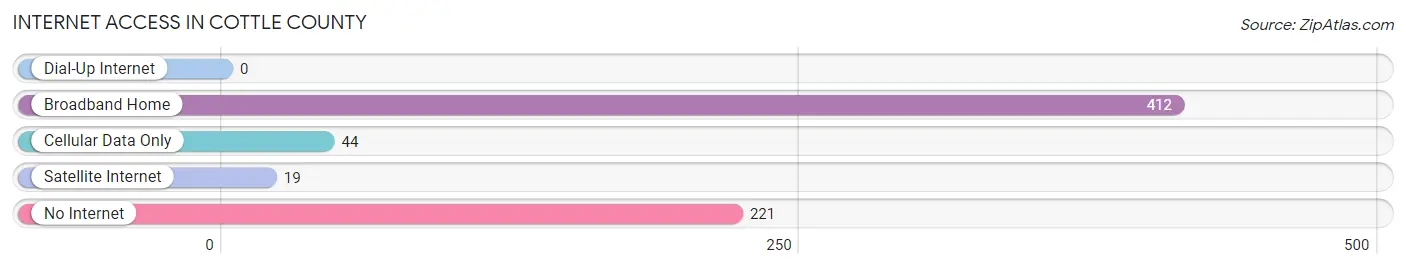
| Internet Type | # Households | % Households |
| Dial-Up Internet | 0 | 0.0% |
| Broadband Home | 412 | 59.5% |
| Cellular Data Only | 44 | 6.4% |
| Satellite Internet | 19 | 2.8% |
| No Internet | 221 | 31.9% |
| Total | 692 | 100.0% |
Cottle County Summary
Cottle County is located in the northwestern corner of Texas, and is bordered by King, Dickens, Motley, Floyd, and Hall Counties. It is part of the Rolling Plains region of Texas, and is known for its flat terrain and rolling hills. The county is named after George Washington Cottle, a Texas Ranger who fought in the Battle of Plum Creek.
Geography
Cottle County covers an area of 902 square miles, and is the second smallest county in Texas. The terrain is mostly flat, with some rolling hills. The county is located in the Rolling Plains region of Texas, and is part of the High Plains Aquifer. The county is home to several small lakes, including Lake Cottle, Lake Kemp, and Lake Motley. The county is also home to several creeks, including the Salt Fork of the Brazos River, the Double Mountain Fork of the Brazos River, and the Clear Fork of the Brazos River.
The climate in Cottle County is semi-arid, with hot summers and mild winters. The average annual temperature is 68°F, and the average annual precipitation is 22 inches.
Economy
The economy of Cottle County is largely based on agriculture. The county is home to several large farms, and the main crops grown in the county are cotton, wheat, and sorghum. Cattle ranching is also an important part of the economy, and the county is home to several large ranches.
The county is also home to several oil and gas fields, and oil and gas production is an important part of the economy. The county is also home to several wind farms, and wind energy is an important source of income for the county.
Demographics
As of the 2010 census, the population of Cottle County was 3,505. The population is largely rural, and the median household income is $37,917. The population is largely white (90.3%), with small percentages of African American (3.2%), Hispanic (3.2%), and Native American (1.2%) residents.
The county is home to several small towns, including Paducah, Cee Vee, and Roaring Springs. The county seat is Paducah, and the largest town in the county is Paducah.
Conclusion
Cottle County is a small county located in the northwestern corner of Texas. The county is known for its flat terrain and rolling hills, and is part of the Rolling Plains region of Texas. The economy of the county is largely based on agriculture, and the county is home to several large farms and ranches. The population of the county is largely rural, and the median household income is $37,917. The county is home to several small towns, and the county seat is Paducah.
Common Questions
What is Per Capita Income in Cottle County?
Per Capita income in Cottle County is $26,081.
What is the Median Family Income in Cottle County?
Median Family Income in Cottle County is $57,235.
What is the Median Household income in Cottle County?
Median Household Income in Cottle County is $47,625.
What is Income or Wage Gap in Cottle County?
Income or Wage Gap in Cottle County is 58.8%.
Women in Cottle County earn 41.2 cents for every dollar earned by a man.
What is Inequality or Gini Index in Cottle County?
Inequality or Gini Index in Cottle County is 0.49.
What is the Total Population of Cottle County?
Total Population of Cottle County is 1,647.
What is the Total Male Population of Cottle County?
Total Male Population of Cottle County is 849.
What is the Total Female Population of Cottle County?
Total Female Population of Cottle County is 798.
What is the Ratio of Males per 100 Females in Cottle County?
There are 106.39 Males per 100 Females in Cottle County.
What is the Ratio of Females per 100 Males in Cottle County?
There are 93.99 Females per 100 Males in Cottle County.
What is the Median Population Age in Cottle County?
Median Population Age in Cottle County is 37.4 Years.
What is the Average Family Size in Cottle County
Average Family Size in Cottle County is 3.4 People.
What is the Average Household Size in Cottle County
Average Household Size in Cottle County is 2.4 People.
How Large is the Labor Force in Cottle County?
There are 748 People in the Labor Forcein in Cottle County.
What is the Percentage of People in the Labor Force in Cottle County?
58.1% of People are in the Labor Force in Cottle County.
What is the Unemployment Rate in Cottle County?
Unemployment Rate in Cottle County is 4.1%.