Coryell County, TX Map & Demographics
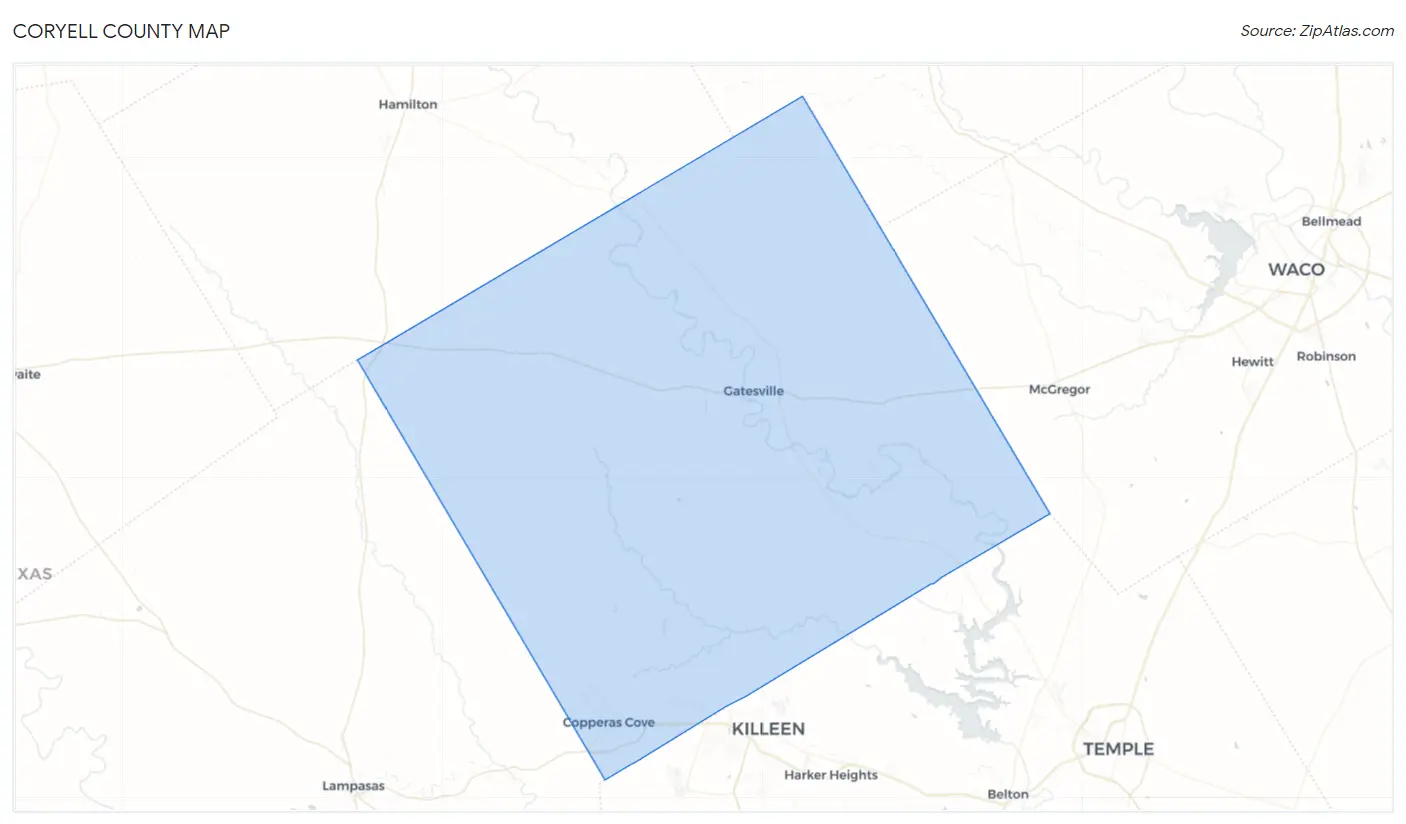
Coryell County Map
Coryell County Overview
$26,699
PER CAPITA INCOME
$70,217
AVG FAMILY INCOME
$63,281
AVG HOUSEHOLD INCOME
22.6%
WAGE / INCOME GAP [ % ]
77.4¢/ $1
WAGE / INCOME GAP [ $ ]
$10,216
FAMILY INCOME DEFICIT
0.41
INEQUALITY / GINI INDEX
82,927
TOTAL POPULATION
42,084
MALE POPULATION
40,843
FEMALE POPULATION
103.04
MALES / 100 FEMALES
97.05
FEMALES / 100 MALES
32.2
MEDIAN AGE
3.2
AVG FAMILY SIZE
2.7
AVG HOUSEHOLD SIZE
36,920
LABOR FORCE [ PEOPLE ]
55.9%
PERCENT IN LABOR FORCE
7.1%
UNEMPLOYMENT RATE
Income in Coryell County
Income Overview in Coryell County
Per Capita Income in Coryell County is $26,699, while median incomes of families and households are $70,217 and $63,281 respectively.
| Characteristic | Number | Measure |
| Per Capita Income | 82,927 | $26,699 |
| Median Family Income | 17,900 | $70,217 |
| Mean Family Income | 17,900 | $86,372 |
| Median Household Income | 25,156 | $63,281 |
| Mean Household Income | 25,156 | $77,044 |
| Income Deficit | 17,900 | $10,216 |
| Wage / Income Gap (%) | 82,927 | 22.58% |
| Wage / Income Gap ($) | 82,927 | 77.42¢ per $1 |
| Gini / Inequality Index | 82,927 | 0.41 |
Earnings by Sex in Coryell County
Average Earnings in Coryell County are $31,814, $34,733 for men and $26,889 for women, a difference of 22.6%.
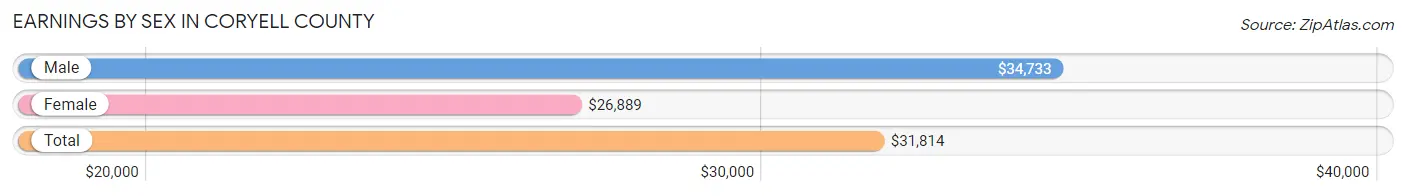
| Sex | Number | Average Earnings |
| Male | 23,515 (58.9%) | $34,733 |
| Female | 16,435 (41.1%) | $26,889 |
| Total | 39,950 (100.0%) | $31,814 |
Earnings by Sex by Income Bracket in Coryell County
The most common earnings brackets in Coryell County are $25,000 to $29,999 for men (2,773 | 11.8%) and $30,000 to $34,999 for women (1,318 | 8.0%).
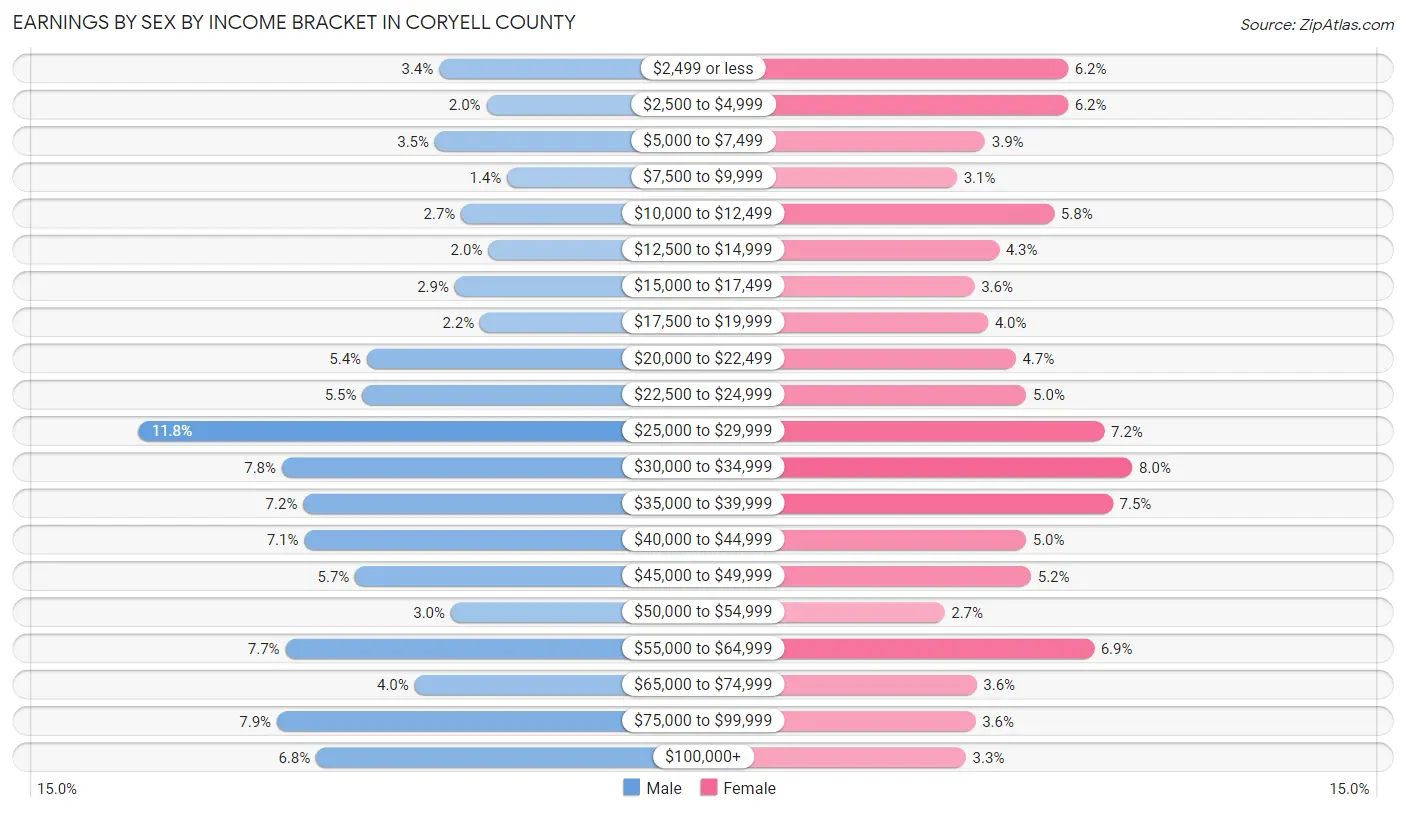
| Income | Male | Female |
| $2,499 or less | 787 (3.4%) | 1,021 (6.2%) |
| $2,500 to $4,999 | 475 (2.0%) | 1,021 (6.2%) |
| $5,000 to $7,499 | 816 (3.5%) | 637 (3.9%) |
| $7,500 to $9,999 | 339 (1.4%) | 508 (3.1%) |
| $10,000 to $12,499 | 641 (2.7%) | 957 (5.8%) |
| $12,500 to $14,999 | 463 (2.0%) | 702 (4.3%) |
| $15,000 to $17,499 | 685 (2.9%) | 589 (3.6%) |
| $17,500 to $19,999 | 518 (2.2%) | 651 (4.0%) |
| $20,000 to $22,499 | 1,264 (5.4%) | 779 (4.7%) |
| $22,500 to $24,999 | 1,296 (5.5%) | 829 (5.0%) |
| $25,000 to $29,999 | 2,773 (11.8%) | 1,188 (7.2%) |
| $30,000 to $34,999 | 1,828 (7.8%) | 1,318 (8.0%) |
| $35,000 to $39,999 | 1,685 (7.2%) | 1,228 (7.5%) |
| $40,000 to $44,999 | 1,679 (7.1%) | 827 (5.0%) |
| $45,000 to $49,999 | 1,342 (5.7%) | 849 (5.2%) |
| $50,000 to $54,999 | 709 (3.0%) | 450 (2.7%) |
| $55,000 to $64,999 | 1,804 (7.7%) | 1,140 (6.9%) |
| $65,000 to $74,999 | 949 (4.0%) | 599 (3.6%) |
| $75,000 to $99,999 | 1,860 (7.9%) | 593 (3.6%) |
| $100,000+ | 1,602 (6.8%) | 549 (3.3%) |
| Total | 23,515 (100.0%) | 16,435 (100.0%) |
Earnings by Sex by Educational Attainment in Coryell County
Average earnings in Coryell County are $42,903 for men and $31,230 for women, a difference of 27.2%. Men with an educational attainment of graduate degree enjoy the highest average annual earnings of $78,145, while those with less than high school education earn the least with $26,400. Women with an educational attainment of graduate degree earn the most with the average annual earnings of $54,652, while those with high school diploma education have the smallest earnings of $23,100.
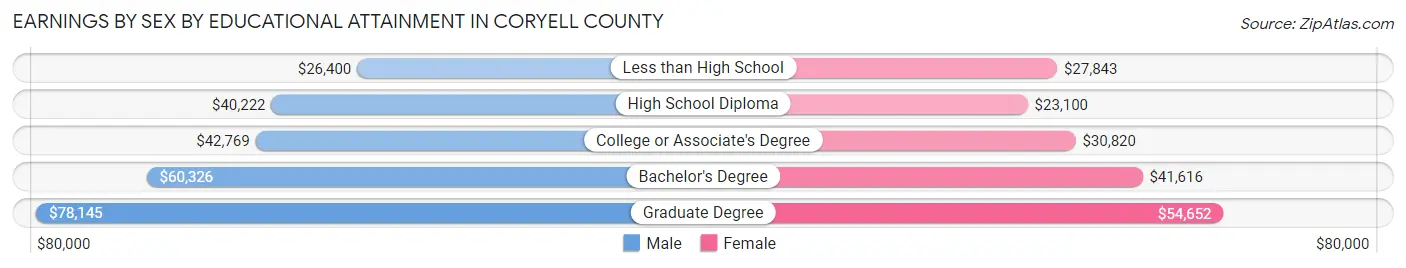
| Educational Attainment | Male Income | Female Income |
| Less than High School | $26,400 | $27,843 |
| High School Diploma | $40,222 | $23,100 |
| College or Associate's Degree | $42,769 | $30,820 |
| Bachelor's Degree | $60,326 | $41,616 |
| Graduate Degree | $78,145 | $54,652 |
| Total | $42,903 | $31,230 |
Family Income in Coryell County
Family Income Brackets in Coryell County
According to the Coryell County family income data, there are 4,063 families falling into the $50,000 to $74,999 income range, which is the most common income bracket and makes up 22.7% of all families. Conversely, the $10,000 to $14,999 income bracket is the least frequent group with only 322 families (1.8%) belonging to this category.
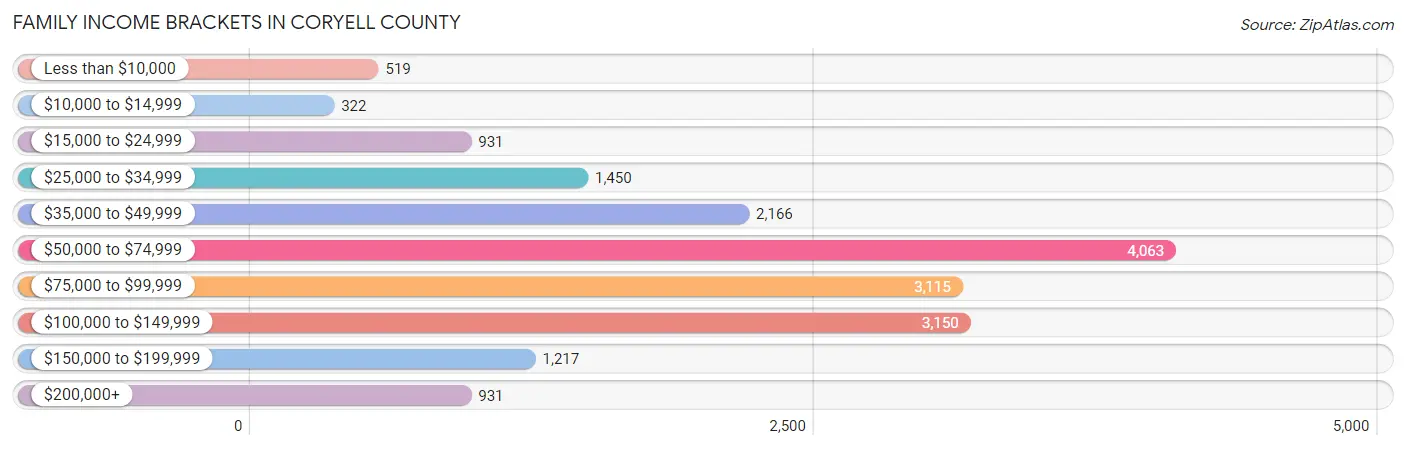
| Income Bracket | # Families | % Families |
| Less than $10,000 | 519 | 2.9% |
| $10,000 to $14,999 | 322 | 1.8% |
| $15,000 to $24,999 | 931 | 5.2% |
| $25,000 to $34,999 | 1,450 | 8.1% |
| $35,000 to $49,999 | 2,166 | 12.1% |
| $50,000 to $74,999 | 4,063 | 22.7% |
| $75,000 to $99,999 | 3,115 | 17.4% |
| $100,000 to $149,999 | 3,150 | 17.6% |
| $150,000 to $199,999 | 1,217 | 6.8% |
| $200,000+ | 931 | 5.2% |
Family Income by Famaliy Size in Coryell County
7+ person families (370 | 2.1%) account for the highest median family income in Coryell County with $104,430 per family, while 2-person families (8,097 | 45.2%) have the highest median income of $33,289 per family member.
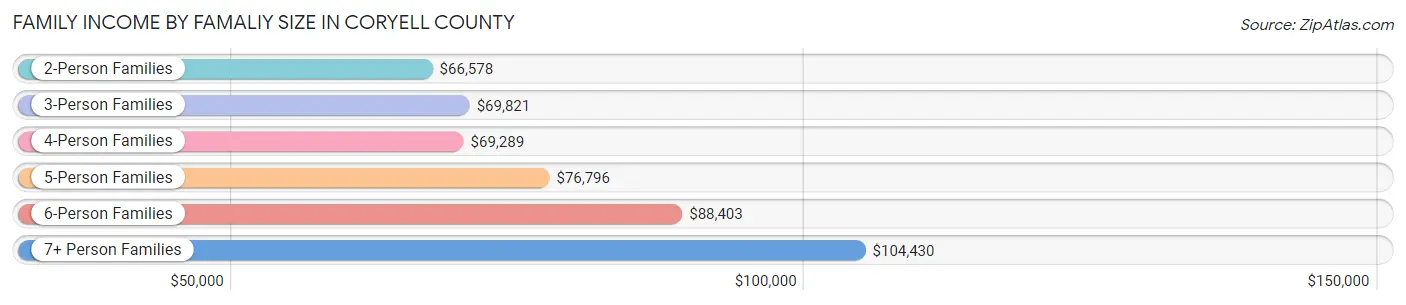
| Income Bracket | # Families | Median Income |
| 2-Person Families | 8,097 (45.2%) | $66,578 |
| 3-Person Families | 3,939 (22.0%) | $69,821 |
| 4-Person Families | 3,236 (18.1%) | $69,289 |
| 5-Person Families | 1,829 (10.2%) | $76,796 |
| 6-Person Families | 429 (2.4%) | $88,403 |
| 7+ Person Families | 370 (2.1%) | $104,430 |
| Total | 17,900 (100.0%) | $70,217 |
Family Income by Number of Earners in Coryell County
The median family income in Coryell County is $70,217, with families comprising 3+ earners (1,046) having the highest median family income of $120,903, while families with no earners (2,524) have the lowest median family income of $46,525, accounting for 5.8% and 14.1% of families, respectively.
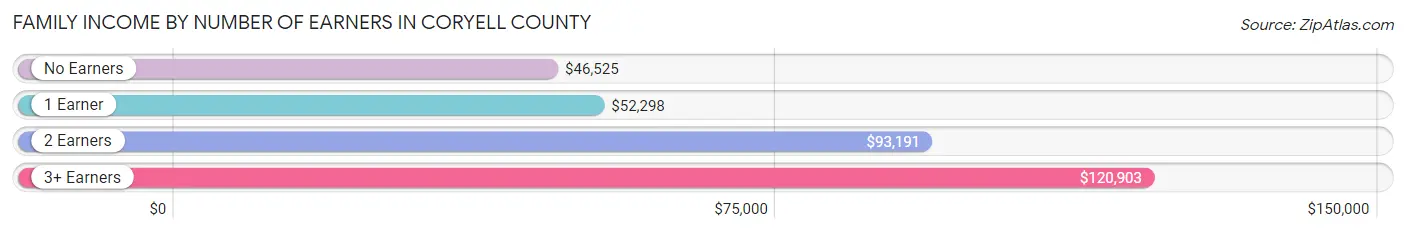
| Number of Earners | # Families | Median Income |
| No Earners | 2,524 (14.1%) | $46,525 |
| 1 Earner | 7,422 (41.5%) | $52,298 |
| 2 Earners | 6,908 (38.6%) | $93,191 |
| 3+ Earners | 1,046 (5.8%) | $120,903 |
| Total | 17,900 (100.0%) | $70,217 |
Household Income in Coryell County
Household Income Brackets in Coryell County
With 5,258 households falling in the category, the $50,000 to $74,999 income range is the most frequent in Coryell County, accounting for 20.9% of all households. In contrast, only 805 households (3.2%) fall into the less than $10,000 income bracket, making it the least populous group.
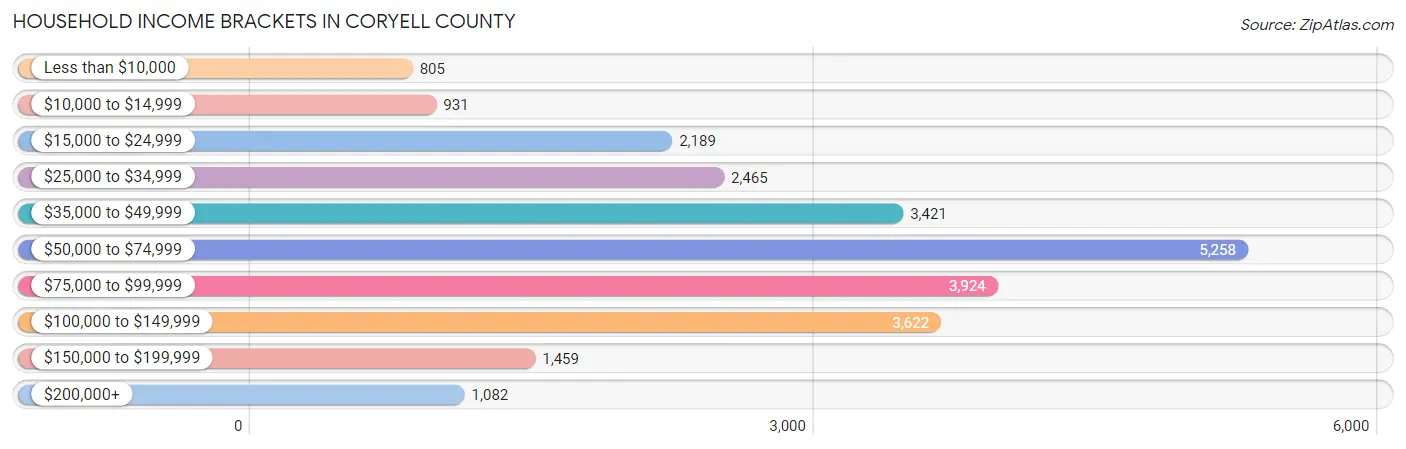
| Income Bracket | # Households | % Households |
| Less than $10,000 | 805 | 3.2% |
| $10,000 to $14,999 | 931 | 3.7% |
| $15,000 to $24,999 | 2,189 | 8.7% |
| $25,000 to $34,999 | 2,465 | 9.8% |
| $35,000 to $49,999 | 3,421 | 13.6% |
| $50,000 to $74,999 | 5,258 | 20.9% |
| $75,000 to $99,999 | 3,924 | 15.6% |
| $100,000 to $149,999 | 3,622 | 14.4% |
| $150,000 to $199,999 | 1,459 | 5.8% |
| $200,000+ | 1,082 | 4.3% |
Household Income by Householder Age in Coryell County
The median household income in Coryell County is $63,281, with the highest median household income of $70,793 found in the 45 to 64 years age bracket for the primary householder. A total of 8,000 households (31.8%) fall into this category. Meanwhile, the 15 to 24 years age bracket for the primary householder has the lowest median household income of $50,478, with 1,556 households (6.2%) in this group.
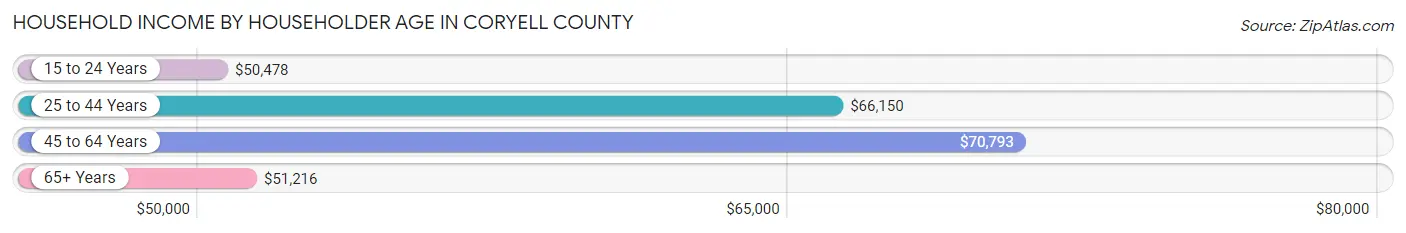
| Income Bracket | # Households | Median Income |
| 15 to 24 Years | 1,556 (6.2%) | $50,478 |
| 25 to 44 Years | 9,719 (38.6%) | $66,150 |
| 45 to 64 Years | 8,000 (31.8%) | $70,793 |
| 65+ Years | 5,881 (23.4%) | $51,216 |
| Total | 25,156 (100.0%) | $63,281 |
Poverty in Coryell County
Income Below Poverty by Sex and Age in Coryell County
With 10.0% poverty level for males and 11.2% for females among the residents of Coryell County, under 5 year old males and under 5 year old females are the most vulnerable to poverty, with 449 males (16.8%) and 411 females (15.6%) in their respective age groups living below the poverty level.
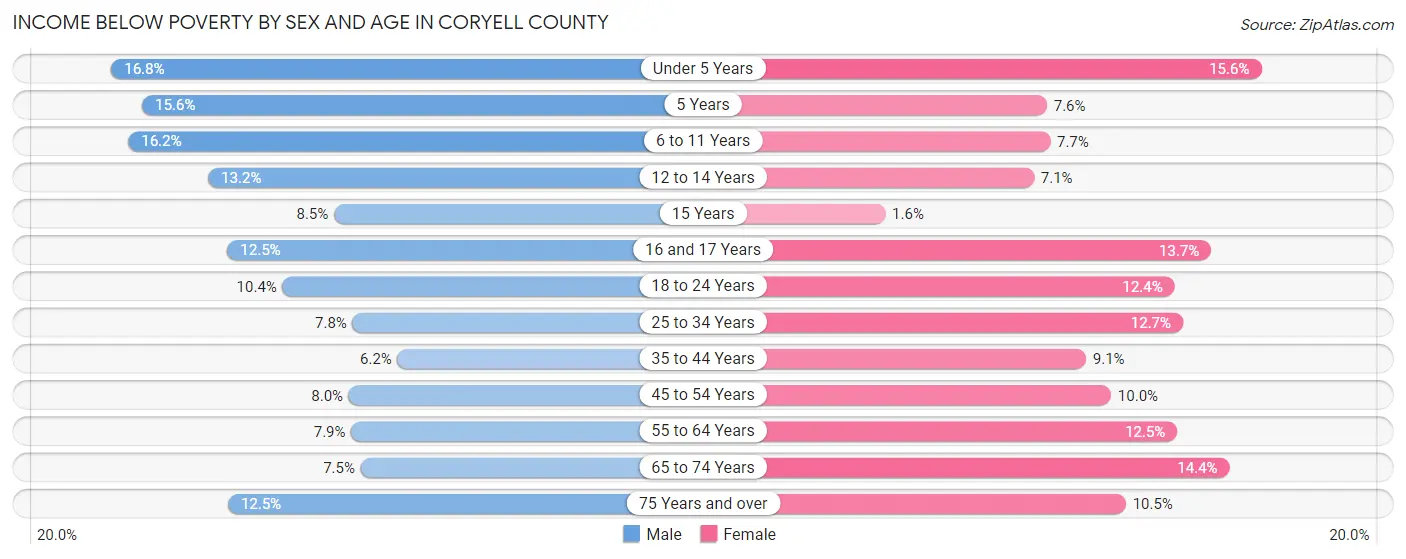
| Age Bracket | Male | Female |
| Under 5 Years | 449 (16.8%) | 411 (15.6%) |
| 5 Years | 91 (15.6%) | 41 (7.6%) |
| 6 to 11 Years | 494 (16.2%) | 231 (7.7%) |
| 12 to 14 Years | 209 (13.2%) | 112 (7.1%) |
| 15 Years | 32 (8.5%) | 7 (1.6%) |
| 16 and 17 Years | 121 (12.5%) | 119 (13.7%) |
| 18 to 24 Years | 244 (10.4%) | 407 (12.3%) |
| 25 to 34 Years | 455 (7.8%) | 723 (12.7%) |
| 35 to 44 Years | 316 (6.1%) | 380 (9.1%) |
| 45 to 54 Years | 290 (8.0%) | 384 (10.0%) |
| 55 to 64 Years | 234 (7.9%) | 374 (12.4%) |
| 65 to 74 Years | 178 (7.5%) | 413 (14.4%) |
| 75 Years and over | 167 (12.4%) | 210 (10.5%) |
| Total | 3,280 (10.0%) | 3,812 (11.2%) |
Income Above Poverty by Sex and Age in Coryell County
According to the poverty statistics in Coryell County, males aged 35 to 44 years and females aged 15 years are the age groups that are most secure financially, with 93.9% of males and 98.4% of females in these age groups living above the poverty line.
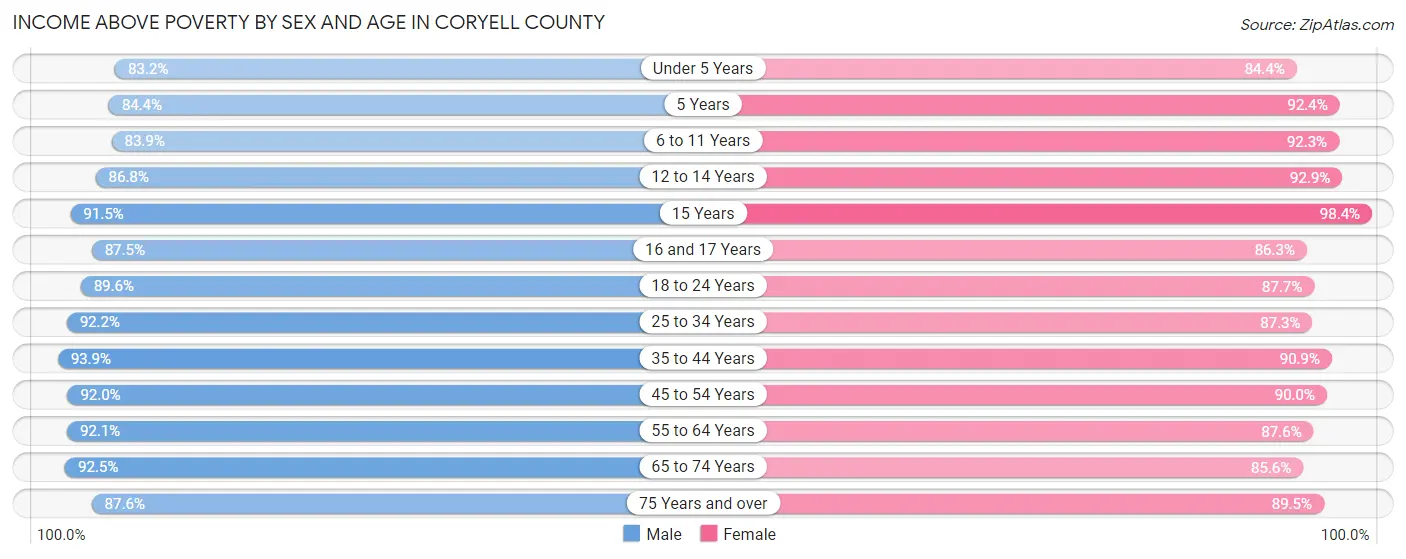
| Age Bracket | Male | Female |
| Under 5 Years | 2,227 (83.2%) | 2,229 (84.4%) |
| 5 Years | 491 (84.4%) | 498 (92.4%) |
| 6 to 11 Years | 2,565 (83.9%) | 2,757 (92.3%) |
| 12 to 14 Years | 1,375 (86.8%) | 1,459 (92.9%) |
| 15 Years | 344 (91.5%) | 429 (98.4%) |
| 16 and 17 Years | 849 (87.5%) | 749 (86.3%) |
| 18 to 24 Years | 2,098 (89.6%) | 2,888 (87.6%) |
| 25 to 34 Years | 5,365 (92.2%) | 4,987 (87.3%) |
| 35 to 44 Years | 4,822 (93.9%) | 3,813 (90.9%) |
| 45 to 54 Years | 3,355 (92.0%) | 3,461 (90.0%) |
| 55 to 64 Years | 2,740 (92.1%) | 2,630 (87.5%) |
| 65 to 74 Years | 2,190 (92.5%) | 2,458 (85.6%) |
| 75 Years and over | 1,174 (87.5%) | 1,783 (89.5%) |
| Total | 29,595 (90.0%) | 30,141 (88.8%) |
Income Below Poverty Among Married-Couple Families in Coryell County
The poverty statistics for married-couple families in Coryell County show that 5.6% or 725 of the total 12,989 families live below the poverty line. Families with 3 or 4 children have the highest poverty rate of 11.8%, comprising of 156 families. On the other hand, families with 1 or 2 children have the lowest poverty rate of 4.1%, which includes 195 families.
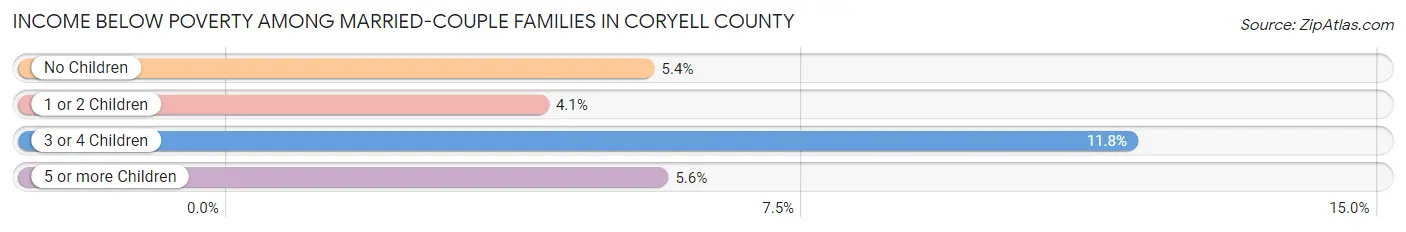
| Children | Above Poverty | Below Poverty |
| No Children | 6,323 (94.6%) | 364 (5.4%) |
| 1 or 2 Children | 4,603 (95.9%) | 195 (4.1%) |
| 3 or 4 Children | 1,170 (88.2%) | 156 (11.8%) |
| 5 or more Children | 168 (94.4%) | 10 (5.6%) |
| Total | 12,264 (94.4%) | 725 (5.6%) |
Income Below Poverty Among Single-Parent Households in Coryell County
According to the poverty data in Coryell County, 8.9% or 117 single-father households and 17.1% or 617 single-mother households are living below the poverty line. Among single-father households, those with 5 or more children have the highest poverty rate, with 14 households (100.0%) experiencing poverty. Likewise, among single-mother households, those with 5 or more children have the highest poverty rate, with 78 households (89.7%) falling below the poverty line.
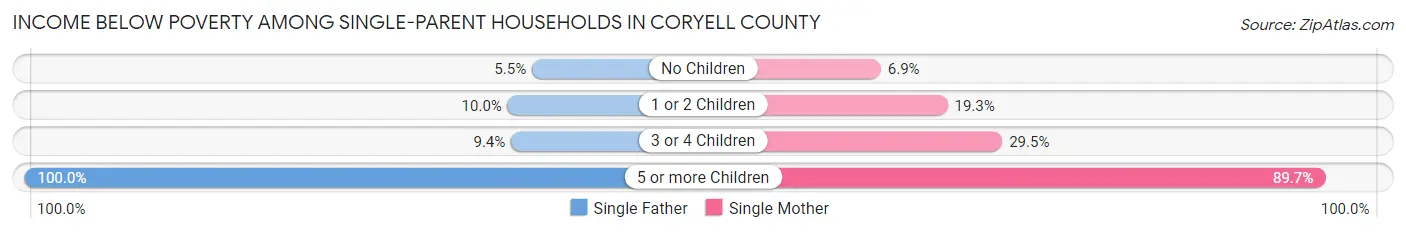
| Children | Single Father | Single Mother |
| No Children | 31 (5.5%) | 93 (6.9%) |
| 1 or 2 Children | 57 (10.0%) | 371 (19.3%) |
| 3 or 4 Children | 15 (9.4%) | 75 (29.5%) |
| 5 or more Children | 14 (100.0%) | 78 (89.7%) |
| Total | 117 (8.9%) | 617 (17.1%) |
Income Below Poverty Among Married-Couple vs Single-Parent Households in Coryell County
The poverty data for Coryell County shows that 725 of the married-couple family households (5.6%) and 734 of the single-parent households (14.9%) are living below the poverty level. Within the married-couple family households, those with 3 or 4 children have the highest poverty rate, with 156 households (11.8%) falling below the poverty line. Among the single-parent households, those with 5 or more children have the highest poverty rate, with 92 household (91.1%) living below poverty.
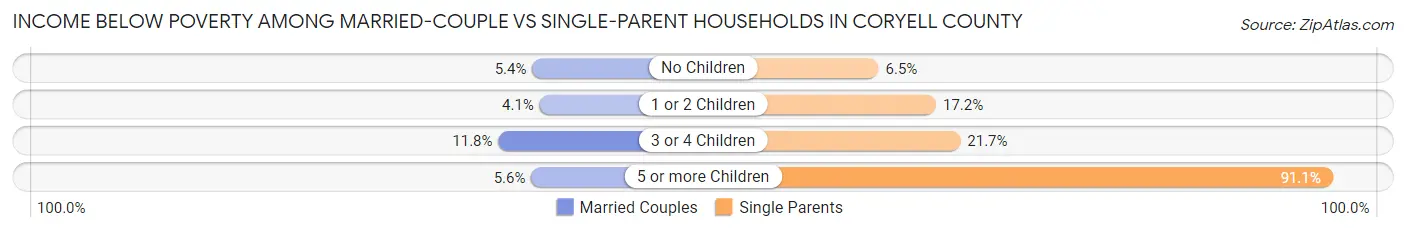
| Children | Married-Couple Families | Single-Parent Households |
| No Children | 364 (5.4%) | 124 (6.5%) |
| 1 or 2 Children | 195 (4.1%) | 428 (17.2%) |
| 3 or 4 Children | 156 (11.8%) | 90 (21.7%) |
| 5 or more Children | 10 (5.6%) | 92 (91.1%) |
| Total | 725 (5.6%) | 734 (14.9%) |
Race in Coryell County
The most populous races in Coryell County are White / Caucasian (53,170 | 64.1%), Hispanic or Latino (16,252 | 19.6%), and Two or more Races (13,039 | 15.7%).
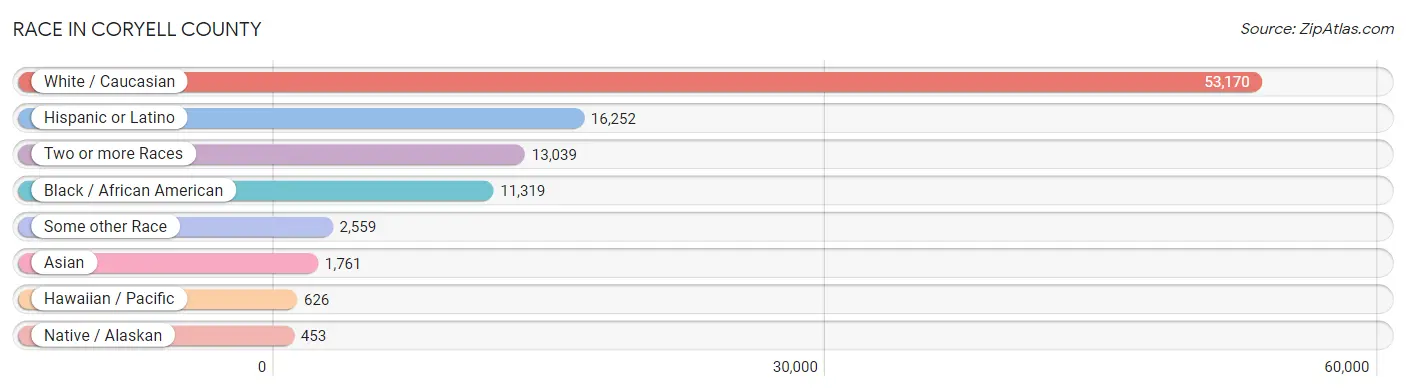
| Race | # Population | % Population |
| Asian | 1,761 | 2.1% |
| Black / African American | 11,319 | 13.7% |
| Hawaiian / Pacific | 626 | 0.7% |
| Hispanic or Latino | 16,252 | 19.6% |
| Native / Alaskan | 453 | 0.5% |
| White / Caucasian | 53,170 | 64.1% |
| Two or more Races | 13,039 | 15.7% |
| Some other Race | 2,559 | 3.1% |
| Total | 82,927 | 100.0% |
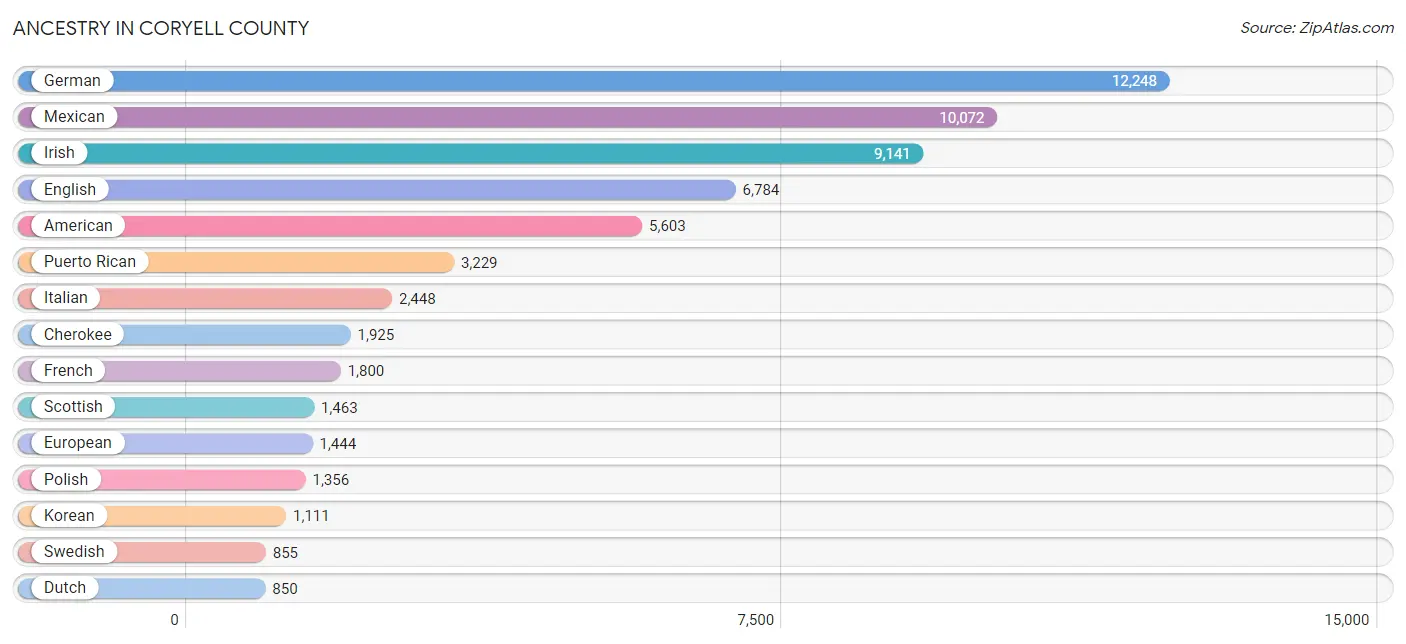
Ancestry in Coryell County
The most populous ancestries reported in Coryell County are German (12,248 | 14.8%), Mexican (10,072 | 12.1%), Irish (9,141 | 11.0%), English (6,784 | 8.2%), and American (5,603 | 6.8%), together accounting for 52.9% of all Coryell County residents.
| Ancestry | # Population | % Population |
| African | 446 | 0.5% |
| Albanian | 55 | 0.1% |
| American | 5,603 | 6.8% |
| Apache | 141 | 0.2% |
| Arab | 395 | 0.5% |
| Australian | 7 | 0.0% |
| Austrian | 258 | 0.3% |
| Barbadian | 5 | 0.0% |
| Belgian | 30 | 0.0% |
| Belizean | 97 | 0.1% |
| Bhutanese | 293 | 0.4% |
| Blackfeet | 191 | 0.2% |
| Brazilian | 153 | 0.2% |
| British | 334 | 0.4% |
| British West Indian | 72 | 0.1% |
| Burmese | 740 | 0.9% |
| Cajun | 39 | 0.1% |
| Canadian | 295 | 0.4% |
| Celtic | 5 | 0.0% |
| Central American | 752 | 0.9% |
| Central American Indian | 130 | 0.2% |
| Cherokee | 1,925 | 2.3% |
| Cheyenne | 3 | 0.0% |
| Chickasaw | 49 | 0.1% |
| Chippewa | 74 | 0.1% |
| Choctaw | 235 | 0.3% |
| Colombian | 264 | 0.3% |
| Colville | 6 | 0.0% |
| Comanche | 101 | 0.1% |
| Costa Rican | 75 | 0.1% |
| Creek | 43 | 0.1% |
| Croatian | 161 | 0.2% |
| Cuban | 248 | 0.3% |
| Czech | 329 | 0.4% |
| Czechoslovakian | 68 | 0.1% |
| Danish | 266 | 0.3% |
| Delaware | 23 | 0.0% |
| Dominican | 319 | 0.4% |
| Dutch | 850 | 1.0% |
| Dutch West Indian | 61 | 0.1% |
| Eastern European | 13 | 0.0% |
| Ecuadorian | 9 | 0.0% |
| Egyptian | 52 | 0.1% |
| English | 6,784 | 8.2% |
| European | 1,444 | 1.7% |
| Fijian | 111 | 0.1% |
| Finnish | 96 | 0.1% |
| French | 1,800 | 2.2% |
| French American Indian | 8 | 0.0% |
| French Canadian | 486 | 0.6% |
| German | 12,248 | 14.8% |
| Greek | 37 | 0.0% |
| Guamanian / Chamorro | 379 | 0.5% |
| Guatemalan | 130 | 0.2% |
| Guyanese | 20 | 0.0% |
| Haitian | 144 | 0.2% |
| Honduran | 157 | 0.2% |
| Hopi | 15 | 0.0% |
| Houma | 7 | 0.0% |
| Hungarian | 72 | 0.1% |
| Icelander | 29 | 0.0% |
| Indian (Asian) | 325 | 0.4% |
| Irish | 9,141 | 11.0% |
| Iroquois | 60 | 0.1% |
| Israeli | 85 | 0.1% |
| Italian | 2,448 | 2.9% |
| Jamaican | 261 | 0.3% |
| Japanese | 175 | 0.2% |
| Jordanian | 90 | 0.1% |
| Kenyan | 18 | 0.0% |
| Kiowa | 38 | 0.1% |
| Korean | 1,111 | 1.3% |
| Latvian | 12 | 0.0% |
| Lebanese | 183 | 0.2% |
| Lithuanian | 99 | 0.1% |
| Lumbee | 39 | 0.1% |
| Macedonian | 75 | 0.1% |
| Malaysian | 57 | 0.1% |
| Maltese | 130 | 0.2% |
| Mexican | 10,072 | 12.1% |
| Mexican American Indian | 205 | 0.3% |
| Moroccan | 9 | 0.0% |
| Native Hawaiian | 125 | 0.2% |
| Navajo | 66 | 0.1% |
| New Zealander | 41 | 0.1% |
| Nigerian | 135 | 0.2% |
| Northern European | 204 | 0.3% |
| Norwegian | 814 | 1.0% |
| Pakistani | 18 | 0.0% |
| Panamanian | 127 | 0.2% |
| Peruvian | 106 | 0.1% |
| Polish | 1,356 | 1.6% |
| Portuguese | 160 | 0.2% |
| Puerto Rican | 3,229 | 3.9% |
| Romanian | 57 | 0.1% |
| Russian | 357 | 0.4% |
| Salvadoran | 263 | 0.3% |
| Samoan | 283 | 0.3% |
| Scandinavian | 500 | 0.6% |
| Scotch-Irish | 665 | 0.8% |
| Scottish | 1,463 | 1.8% |
| Senegalese | 29 | 0.0% |
| Serbian | 6 | 0.0% |
| Sioux | 39 | 0.1% |
| Slavic | 7 | 0.0% |
| Slovak | 34 | 0.0% |
| Slovene | 13 | 0.0% |
| Somali | 6 | 0.0% |
| South African | 19 | 0.0% |
| South American | 468 | 0.6% |
| South American Indian | 8 | 0.0% |
| Spaniard | 583 | 0.7% |
| Spanish | 196 | 0.2% |
| Sri Lankan | 191 | 0.2% |
| Subsaharan African | 735 | 0.9% |
| Swedish | 855 | 1.0% |
| Swiss | 33 | 0.0% |
| Thai | 135 | 0.2% |
| Turkish | 28 | 0.0% |
| Ukrainian | 26 | 0.0% |
| Uruguayan | 12 | 0.0% |
| Ute | 143 | 0.2% |
| Venezuelan | 77 | 0.1% |
| Vietnamese | 10 | 0.0% |
| Welsh | 315 | 0.4% |
| West Indian | 24 | 0.0% |
| Yaqui | 7 | 0.0% |
| Yugoslavian | 12 | 0.0% | View All 128 Rows |
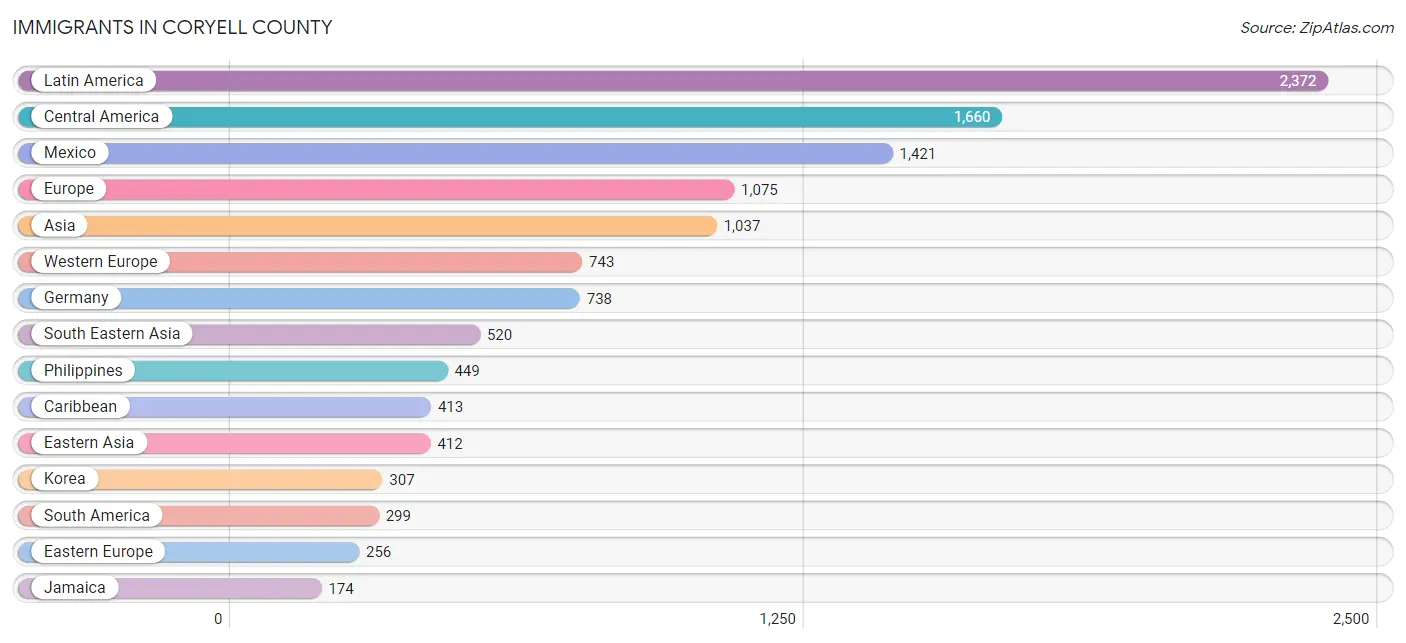
Immigrants in Coryell County
The most numerous immigrant groups reported in Coryell County came from Latin America (2,372 | 2.9%), Central America (1,660 | 2.0%), Mexico (1,421 | 1.7%), Europe (1,075 | 1.3%), and Asia (1,037 | 1.3%), together accounting for 9.1% of all Coryell County residents.
| Immigration Origin | # Population | % Population |
| Africa | 171 | 0.2% |
| Asia | 1,037 | 1.3% |
| Bangladesh | 10 | 0.0% |
| Belize | 30 | 0.0% |
| Brazil | 125 | 0.2% |
| Cambodia | 15 | 0.0% |
| Cameroon | 28 | 0.0% |
| Canada | 107 | 0.1% |
| Caribbean | 413 | 0.5% |
| Central America | 1,660 | 2.0% |
| China | 70 | 0.1% |
| Colombia | 77 | 0.1% |
| Costa Rica | 32 | 0.0% |
| Cuba | 7 | 0.0% |
| Czechoslovakia | 29 | 0.0% |
| Denmark | 7 | 0.0% |
| Dominican Republic | 127 | 0.2% |
| Eastern Africa | 41 | 0.1% |
| Eastern Asia | 412 | 0.5% |
| Eastern Europe | 256 | 0.3% |
| Ecuador | 9 | 0.0% |
| El Salvador | 58 | 0.1% |
| Europe | 1,075 | 1.3% |
| France | 5 | 0.0% |
| Germany | 738 | 0.9% |
| Ghana | 29 | 0.0% |
| Guatemala | 31 | 0.0% |
| Haiti | 88 | 0.1% |
| Honduras | 53 | 0.1% |
| Hong Kong | 6 | 0.0% |
| Hungary | 8 | 0.0% |
| India | 42 | 0.1% |
| Indonesia | 10 | 0.0% |
| Iraq | 15 | 0.0% |
| Italy | 24 | 0.0% |
| Jamaica | 174 | 0.2% |
| Japan | 35 | 0.0% |
| Kenya | 18 | 0.0% |
| Korea | 307 | 0.4% |
| Kuwait | 9 | 0.0% |
| Laos | 6 | 0.0% |
| Latin America | 2,372 | 2.9% |
| Mexico | 1,421 | 1.7% |
| Middle Africa | 28 | 0.0% |
| Nigeria | 13 | 0.0% |
| North Macedonia | 75 | 0.1% |
| Northern Europe | 52 | 0.1% |
| Norway | 7 | 0.0% |
| Oceania | 133 | 0.2% |
| Panama | 35 | 0.0% |
| Peru | 20 | 0.0% |
| Philippines | 449 | 0.5% |
| Poland | 28 | 0.0% |
| Romania | 11 | 0.0% |
| Russia | 72 | 0.1% |
| Serbia | 6 | 0.0% |
| Somalia | 6 | 0.0% |
| South Africa | 34 | 0.0% |
| South America | 299 | 0.4% |
| South Central Asia | 52 | 0.1% |
| South Eastern Asia | 520 | 0.6% |
| Southern Europe | 24 | 0.0% |
| St. Vincent and the Grenadines | 10 | 0.0% |
| Taiwan | 25 | 0.0% |
| Thailand | 18 | 0.0% |
| Trinidad and Tobago | 7 | 0.0% |
| Turkey | 16 | 0.0% |
| Uganda | 17 | 0.0% |
| Ukraine | 21 | 0.0% |
| Uruguay | 12 | 0.0% |
| Venezuela | 53 | 0.1% |
| Vietnam | 22 | 0.0% |
| Western Africa | 50 | 0.1% |
| Western Asia | 53 | 0.1% |
| Western Europe | 743 | 0.9% | View All 75 Rows |
Sex and Age in Coryell County
Sex and Age in Coryell County
The most populous age groups in Coryell County are 20 to 24 Years (5,829 | 13.9%) for men and 25 to 29 Years (3,882 | 9.5%) for women.
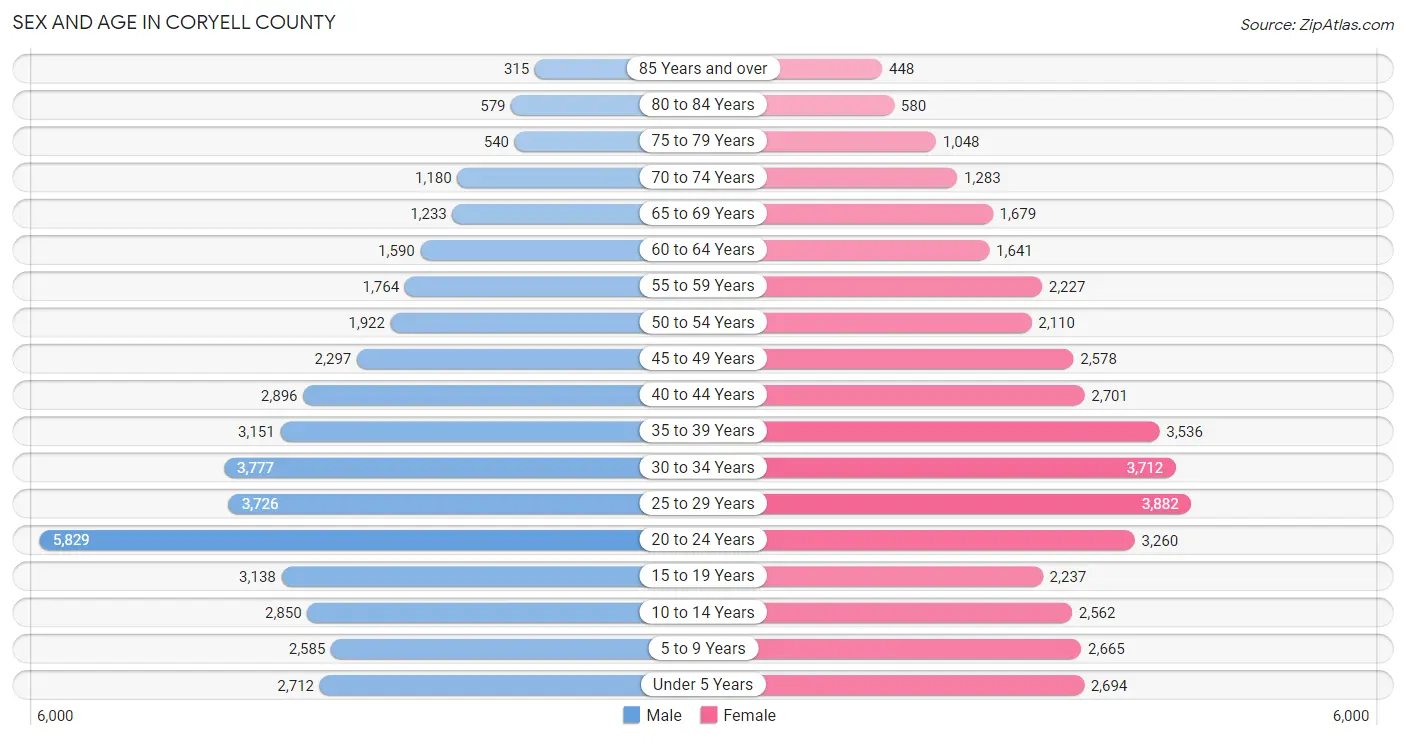
| Age Bracket | Male | Female |
| Under 5 Years | 2,712 (6.4%) | 2,694 (6.6%) |
| 5 to 9 Years | 2,585 (6.1%) | 2,665 (6.5%) |
| 10 to 14 Years | 2,850 (6.8%) | 2,562 (6.3%) |
| 15 to 19 Years | 3,138 (7.5%) | 2,237 (5.5%) |
| 20 to 24 Years | 5,829 (13.9%) | 3,260 (8.0%) |
| 25 to 29 Years | 3,726 (8.8%) | 3,882 (9.5%) |
| 30 to 34 Years | 3,777 (9.0%) | 3,712 (9.1%) |
| 35 to 39 Years | 3,151 (7.5%) | 3,536 (8.7%) |
| 40 to 44 Years | 2,896 (6.9%) | 2,701 (6.6%) |
| 45 to 49 Years | 2,297 (5.5%) | 2,578 (6.3%) |
| 50 to 54 Years | 1,922 (4.6%) | 2,110 (5.2%) |
| 55 to 59 Years | 1,764 (4.2%) | 2,227 (5.4%) |
| 60 to 64 Years | 1,590 (3.8%) | 1,641 (4.0%) |
| 65 to 69 Years | 1,233 (2.9%) | 1,679 (4.1%) |
| 70 to 74 Years | 1,180 (2.8%) | 1,283 (3.1%) |
| 75 to 79 Years | 540 (1.3%) | 1,048 (2.6%) |
| 80 to 84 Years | 579 (1.4%) | 580 (1.4%) |
| 85 Years and over | 315 (0.7%) | 448 (1.1%) |
| Total | 42,084 (100.0%) | 40,843 (100.0%) |
Families and Households in Coryell County
Median Family Size in Coryell County
The median family size in Coryell County is 3.17 persons per family, with married-couple families (12,989 | 72.6%) accounting for the largest median family size of 3.24 persons per family. On the other hand, single male/father families (1,308 | 7.3%) represent the smallest median family size with 2.94 persons per family.

| Family Type | # Families | Family Size |
| Married-Couple | 12,989 (72.6%) | 3.24 |
| Single Male/Father | 1,308 (7.3%) | 2.94 |
| Single Female/Mother | 3,603 (20.1%) | 3.01 |
| Total Families | 17,900 (100.0%) | 3.17 |
Median Household Size in Coryell County
The median household size in Coryell County is 2.66 persons per household, with single male/father households (1,308 | 5.2%) accounting for the largest median household size of 3.31 persons per household. non-family households (7,256 | 28.8%) represent the smallest median household size with 1.18 persons per household.

| Household Type | # Households | Household Size |
| Married-Couple | 12,989 (51.6%) | 3.27 |
| Single Male/Father | 1,308 (5.2%) | 3.31 |
| Single Female/Mother | 3,603 (14.3%) | 3.22 |
| Non-family | 7,256 (28.8%) | 1.18 |
| Total Households | 25,156 (100.0%) | 2.66 |
Household Size by Marriage Status in Coryell County
Out of a total of 25,156 households in Coryell County, 17,900 (71.2%) are family households, while 7,256 (28.8%) are nonfamily households. The most numerous type of family households are 2-person households, comprising 7,455, and the most common type of nonfamily households are 1-person households, comprising 6,186.
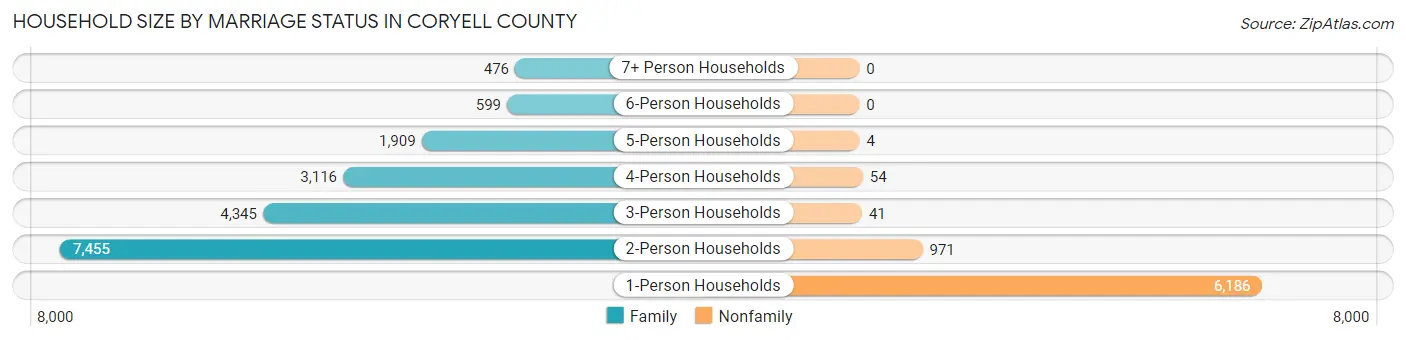
| Household Size | Family Households | Nonfamily Households |
| 1-Person Households | - | 6,186 (24.6%) |
| 2-Person Households | 7,455 (29.6%) | 971 (3.9%) |
| 3-Person Households | 4,345 (17.3%) | 41 (0.2%) |
| 4-Person Households | 3,116 (12.4%) | 54 (0.2%) |
| 5-Person Households | 1,909 (7.6%) | 4 (0.0%) |
| 6-Person Households | 599 (2.4%) | 0 (0.0%) |
| 7+ Person Households | 476 (1.9%) | 0 (0.0%) |
| Total | 17,900 (71.2%) | 7,256 (28.8%) |
Female Fertility in Coryell County
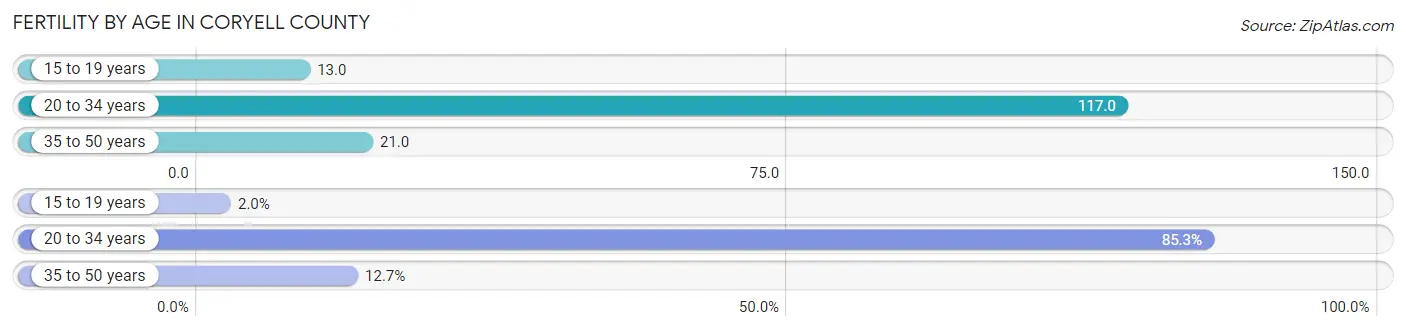
Fertility by Age in Coryell County
Average fertility rate in Coryell County is 67.0 births per 1,000 women. Women in the age bracket of 20 to 34 years have the highest fertility rate with 117.0 births per 1,000 women. Women in the age bracket of 20 to 34 years acount for 85.3% of all women with births.
| Age Bracket | Women with Births | Births / 1,000 Women |
| 15 to 19 years | 29 (1.9%) | 13.0 |
| 20 to 34 years | 1,267 (85.3%) | 117.0 |
| 35 to 50 years | 189 (12.7%) | 21.0 |
| Total | 1,485 (100.0%) | 67.0 |
Fertility by Age by Marriage Status in Coryell County
77.3% of women with births (1,485) in Coryell County are married. The highest percentage of unmarried women with births falls into 20 to 34 years age bracket with 23.9% of them unmarried at the time of birth, while the lowest percentage of unmarried women with births belong to 15 to 19 years age bracket with 0.0% of them unmarried.
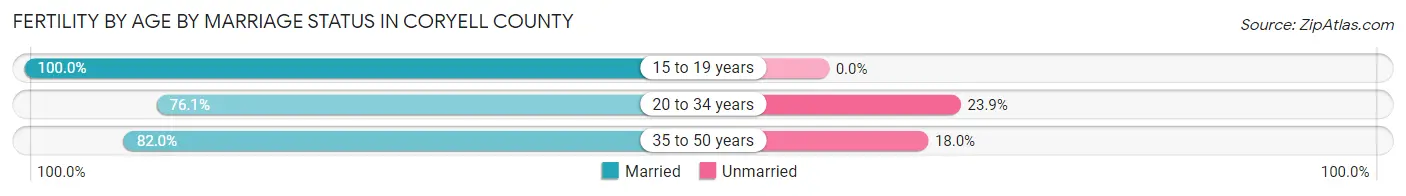
| Age Bracket | Married | Unmarried |
| 15 to 19 years | 29 (100.0%) | 0 (0.0%) |
| 20 to 34 years | 964 (76.1%) | 303 (23.9%) |
| 35 to 50 years | 155 (82.0%) | 34 (18.0%) |
| Total | 1,148 (77.3%) | 337 (22.7%) |
Fertility by Education in Coryell County
Average fertility rate in Coryell County is 67.0 births per 1,000 women. Women with the education attainment of college or associate's degree have the highest fertility rate of 91.0 births per 1,000 women, while women with the education attainment of less than high school have the lowest fertility at 12.0 births per 1,000 women. Women with the education attainment of college or associate's degree represent 62.1% of all women with births.
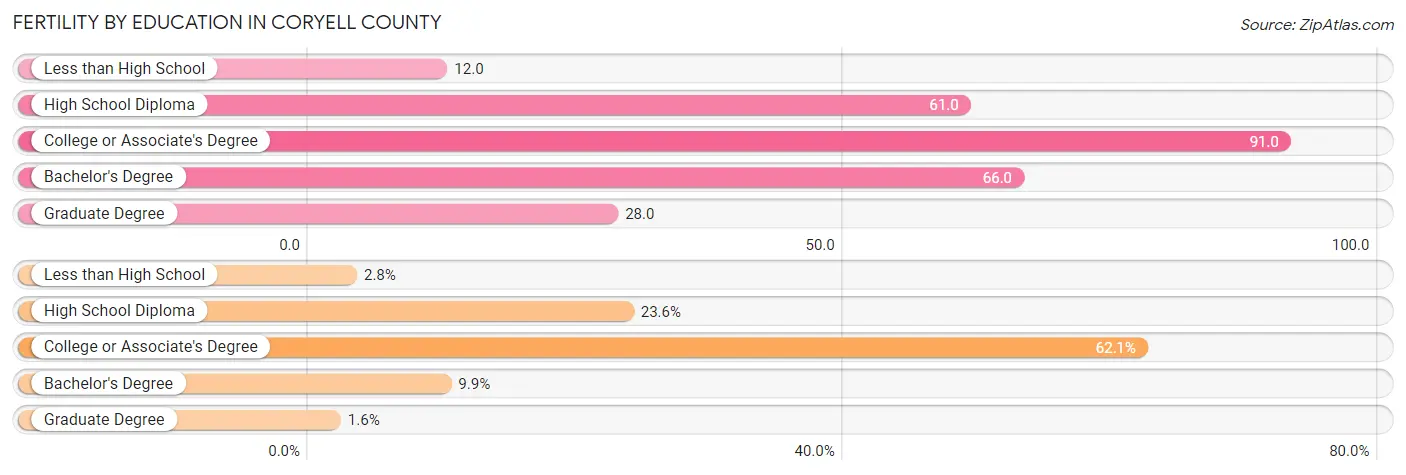
| Educational Attainment | Women with Births | Births / 1,000 Women |
| Less than High School | 42 (2.8%) | 12.0 |
| High School Diploma | 350 (23.6%) | 61.0 |
| College or Associate's Degree | 922 (62.1%) | 91.0 |
| Bachelor's Degree | 147 (9.9%) | 66.0 |
| Graduate Degree | 24 (1.6%) | 28.0 |
| Total | 1,485 (100.0%) | 67.0 |
Fertility by Education by Marriage Status in Coryell County
22.7% of women with births in Coryell County are unmarried. Women with the educational attainment of bachelor's degree are most likely to be married with 100.0% of them married at childbirth, while women with the educational attainment of high school diploma are least likely to be married with 28.9% of them unmarried at childbirth.

| Educational Attainment | Married | Unmarried |
| Less than High School | 35 (83.3%) | 7 (16.7%) |
| High School Diploma | 249 (71.1%) | 101 (28.9%) |
| College or Associate's Degree | 693 (75.2%) | 229 (24.8%) |
| Bachelor's Degree | 147 (100.0%) | 0 (0.0%) |
| Graduate Degree | 24 (100.0%) | 0 (0.0%) |
| Total | 1,148 (77.3%) | 337 (22.7%) |
Employment Characteristics in Coryell County
Employment by Class of Employer in Coryell County
Among the 33,899 employed individuals in Coryell County, private company employees (14,083 | 41.5%), federal government employees (11,574 | 34.1%), and local government employees (2,739 | 8.1%) make up the most common classes of employment.
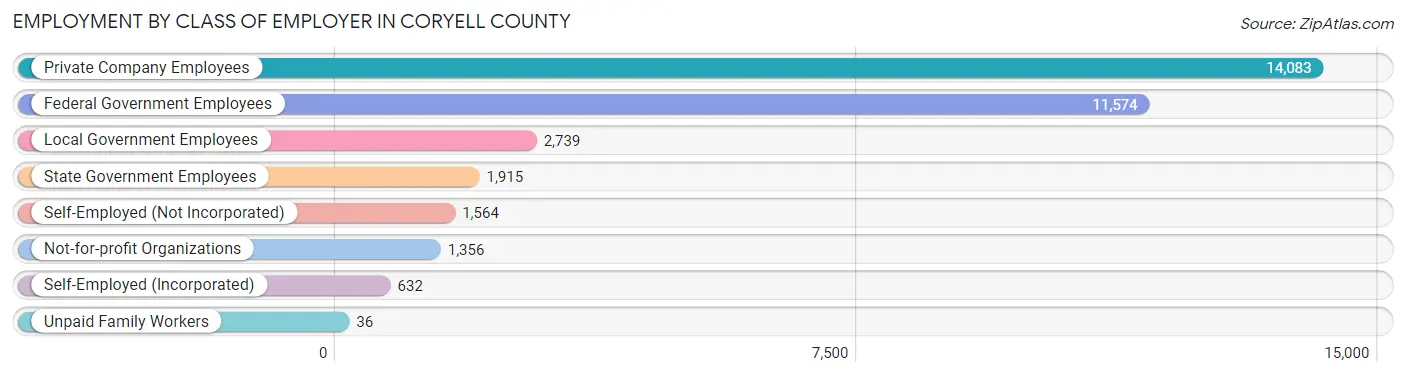
| Employer Class | # Employees | % Employees |
| Private Company Employees | 14,083 | 41.5% |
| Self-Employed (Incorporated) | 632 | 1.9% |
| Self-Employed (Not Incorporated) | 1,564 | 4.6% |
| Not-for-profit Organizations | 1,356 | 4.0% |
| Local Government Employees | 2,739 | 8.1% |
| State Government Employees | 1,915 | 5.7% |
| Federal Government Employees | 11,574 | 34.1% |
| Unpaid Family Workers | 36 | 0.1% |
| Total | 33,899 | 100.0% |
Employment Status by Age in Coryell County
According to the labor force statistics for Coryell County, out of the total population over 16 years of age (66,047), 55.9% or 36,920 individuals are in the labor force, with 7.1% or 2,621 of them unemployed. The age group with the highest labor force participation rate is 20 to 24 years, with 79.5% or 7,226 individuals in the labor force. Within the labor force, the 16 to 19 years age range has the highest percentage of unemployed individuals, with 17.3% or 378 of them being unemployed.
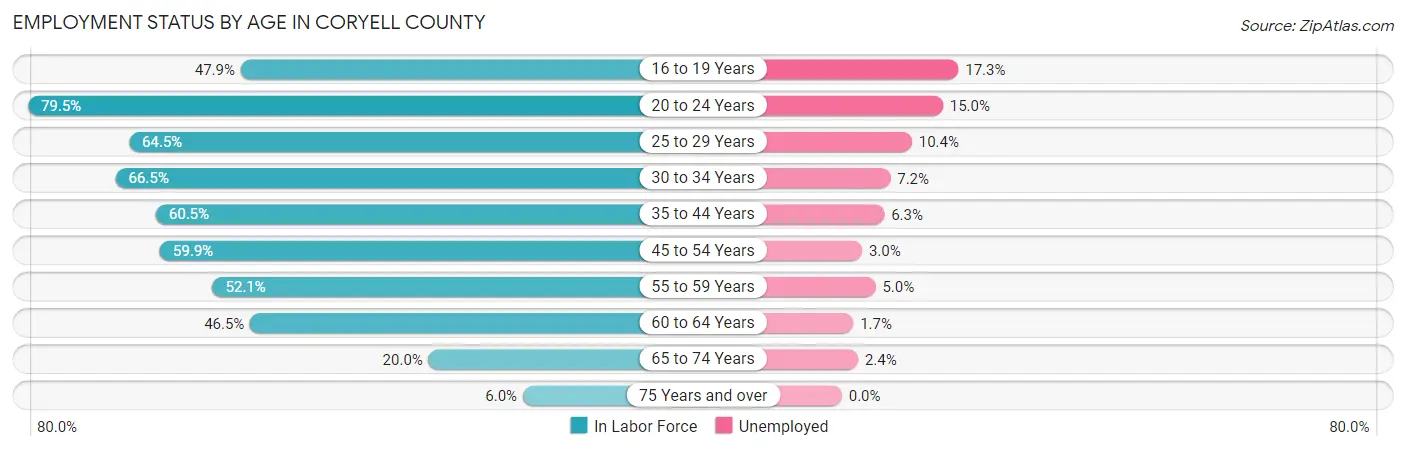
| Age Bracket | In Labor Force | Unemployed |
| 16 to 19 Years | 2,186 (47.9%) | 378 (17.3%) |
| 20 to 24 Years | 7,226 (79.5%) | 1,084 (15.0%) |
| 25 to 29 Years | 4,907 (64.5%) | 510 (10.4%) |
| 30 to 34 Years | 4,980 (66.5%) | 359 (7.2%) |
| 35 to 44 Years | 7,432 (60.5%) | 468 (6.3%) |
| 45 to 54 Years | 5,335 (59.9%) | 160 (3.0%) |
| 55 to 59 Years | 2,079 (52.1%) | 104 (5.0%) |
| 60 to 64 Years | 1,502 (46.5%) | 26 (1.7%) |
| 65 to 74 Years | 1,075 (20.0%) | 26 (2.4%) |
| 75 Years and over | 211 (6.0%) | 0 (0.0%) |
| Total | 36,920 (55.9%) | 2,621 (7.1%) |
Employment Status by Educational Attainment in Coryell County
According to labor force statistics for Coryell County, 60.3% of individuals (26,237) out of the total population between 25 and 64 years of age (43,510) are in the labor force, with 5.9% or 1,548 of them being unemployed. The group with the highest labor force participation rate are those with the educational attainment of bachelor's degree or higher, with 80.2% or 6,111 individuals in the labor force. Within the labor force, individuals with less than high school education have the highest percentage of unemployment, with 10.4% or 140 of them being unemployed.
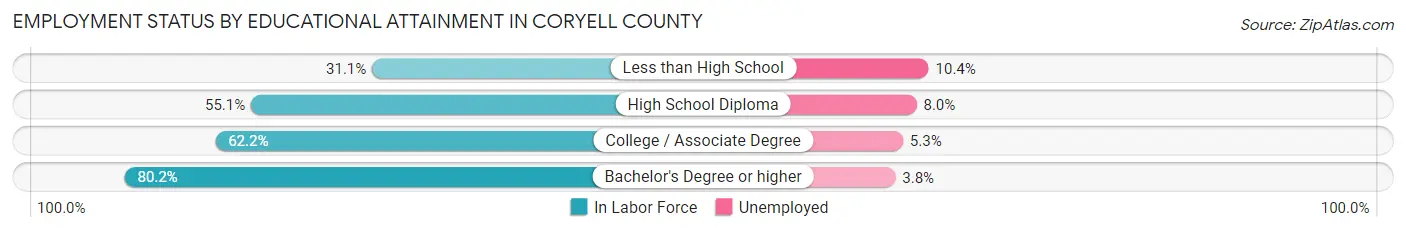
| Educational Attainment | In Labor Force | Unemployed |
| Less than High School | 1,345 (31.1%) | 450 (10.4%) |
| High School Diploma | 6,606 (55.1%) | 959 (8.0%) |
| College / Associate Degree | 12,176 (62.2%) | 1,038 (5.3%) |
| Bachelor's Degree or higher | 6,111 (80.2%) | 290 (3.8%) |
| Total | 26,237 (60.3%) | 2,567 (5.9%) |
Employment Occupations by Sex in Coryell County
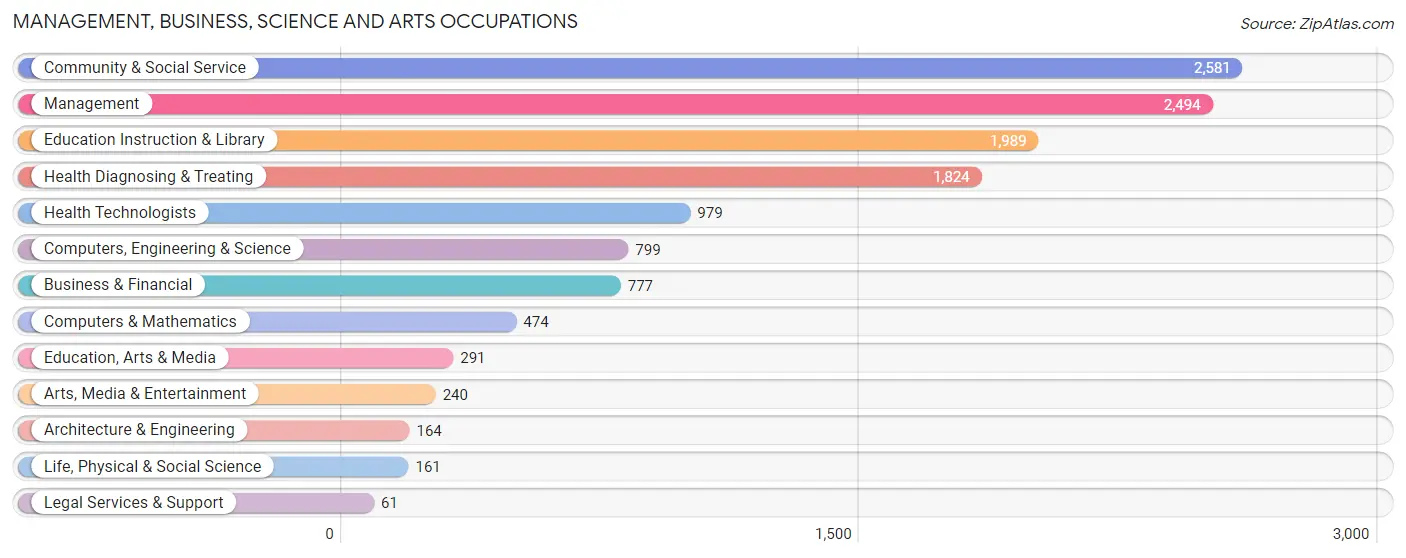
Management, Business, Science and Arts Occupations
The most common Management, Business, Science and Arts occupations in Coryell County are Community & Social Service (2,581 | 10.3%), Management (2,494 | 9.9%), Education Instruction & Library (1,989 | 7.9%), Health Diagnosing & Treating (1,824 | 7.3%), and Health Technologists (979 | 3.9%).
Management, Business, Science and Arts Occupations by Sex
Within the Management, Business, Science and Arts occupations in Coryell County, the most male-oriented occupations are Architecture & Engineering (84.2%), Computers, Engineering & Science (78.0%), and Life, Physical & Social Science (77.0%), while the most female-oriented occupations are Legal Services & Support (85.3%), Health Technologists (80.1%), and Health Diagnosing & Treating (74.2%).
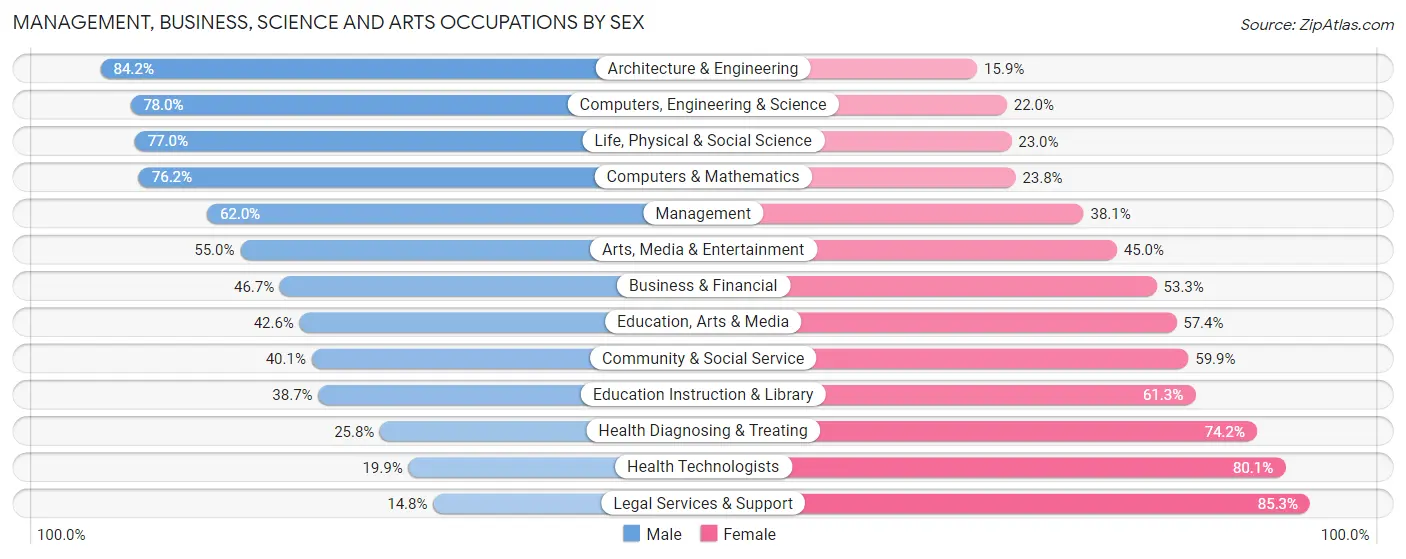
| Occupation | Male | Female |
| Management | 1,545 (62.0%) | 949 (38.1%) |
| Business & Financial | 363 (46.7%) | 414 (53.3%) |
| Computers, Engineering & Science | 623 (78.0%) | 176 (22.0%) |
| Computers & Mathematics | 361 (76.2%) | 113 (23.8%) |
| Architecture & Engineering | 138 (84.2%) | 26 (15.9%) |
| Life, Physical & Social Science | 124 (77.0%) | 37 (23.0%) |
| Community & Social Service | 1,035 (40.1%) | 1,546 (59.9%) |
| Education, Arts & Media | 124 (42.6%) | 167 (57.4%) |
| Legal Services & Support | 9 (14.7%) | 52 (85.3%) |
| Education Instruction & Library | 770 (38.7%) | 1,219 (61.3%) |
| Arts, Media & Entertainment | 132 (55.0%) | 108 (45.0%) |
| Health Diagnosing & Treating | 471 (25.8%) | 1,353 (74.2%) |
| Health Technologists | 195 (19.9%) | 784 (80.1%) |
| Total (Category) | 4,037 (47.6%) | 4,438 (52.4%) |
| Total (Overall) | 13,311 (52.9%) | 11,830 (47.0%) |
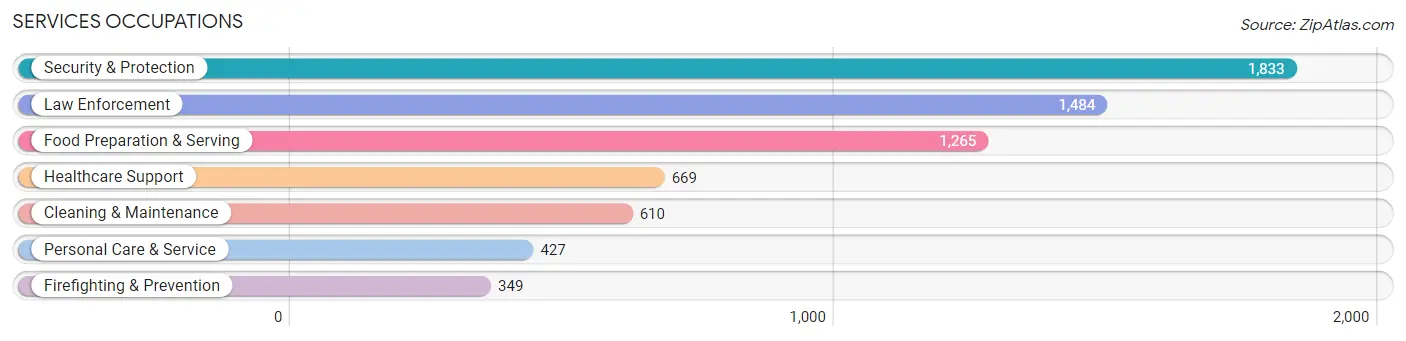
Services Occupations
The most common Services occupations in Coryell County are Security & Protection (1,833 | 7.3%), Law Enforcement (1,484 | 5.9%), Food Preparation & Serving (1,265 | 5.0%), Healthcare Support (669 | 2.7%), and Cleaning & Maintenance (610 | 2.4%).
Services Occupations by Sex
Within the Services occupations in Coryell County, the most male-oriented occupations are Firefighting & Prevention (77.9%), Cleaning & Maintenance (70.2%), and Security & Protection (59.3%), while the most female-oriented occupations are Personal Care & Service (82.4%), Healthcare Support (75.8%), and Food Preparation & Serving (65.8%).
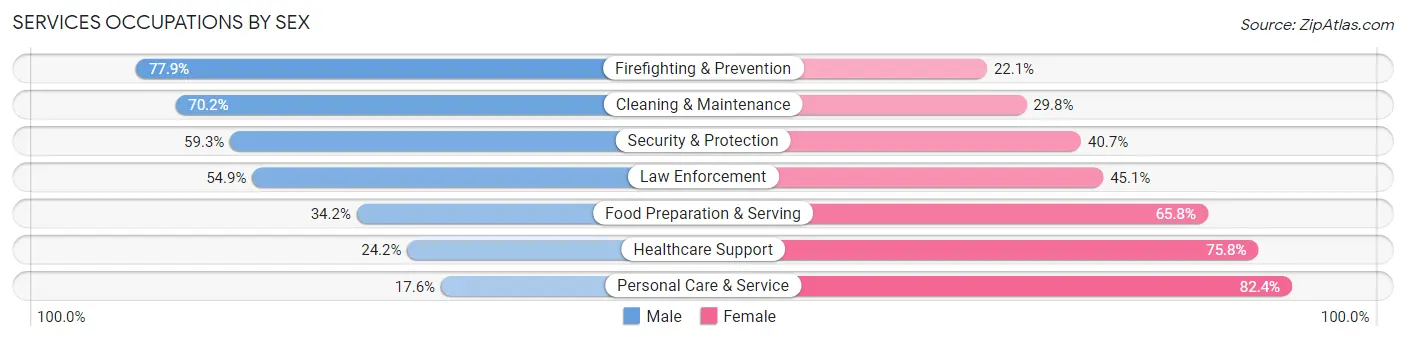
| Occupation | Male | Female |
| Healthcare Support | 162 (24.2%) | 507 (75.8%) |
| Security & Protection | 1,087 (59.3%) | 746 (40.7%) |
| Firefighting & Prevention | 272 (77.9%) | 77 (22.1%) |
| Law Enforcement | 815 (54.9%) | 669 (45.1%) |
| Food Preparation & Serving | 433 (34.2%) | 832 (65.8%) |
| Cleaning & Maintenance | 428 (70.2%) | 182 (29.8%) |
| Personal Care & Service | 75 (17.6%) | 352 (82.4%) |
| Total (Category) | 2,185 (45.5%) | 2,619 (54.5%) |
| Total (Overall) | 13,311 (52.9%) | 11,830 (47.0%) |
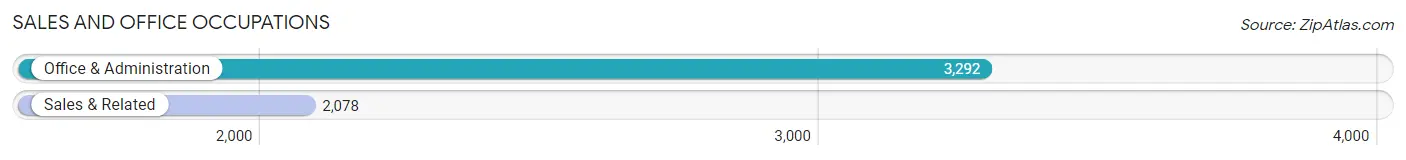
Sales and Office Occupations
The most common Sales and Office occupations in Coryell County are Office & Administration (3,292 | 13.1%), and Sales & Related (2,078 | 8.3%).
Sales and Office Occupations by Sex
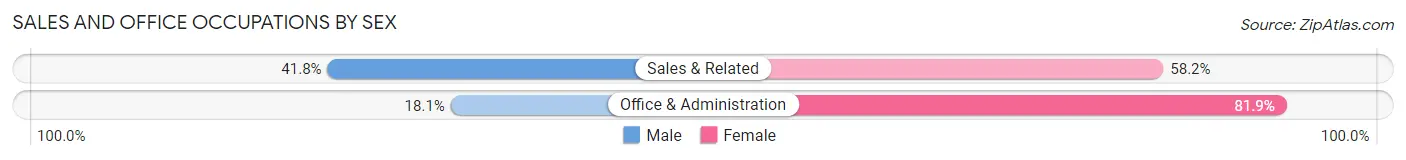
| Occupation | Male | Female |
| Sales & Related | 868 (41.8%) | 1,210 (58.2%) |
| Office & Administration | 595 (18.1%) | 2,697 (81.9%) |
| Total (Category) | 1,463 (27.2%) | 3,907 (72.8%) |
| Total (Overall) | 13,311 (52.9%) | 11,830 (47.0%) |
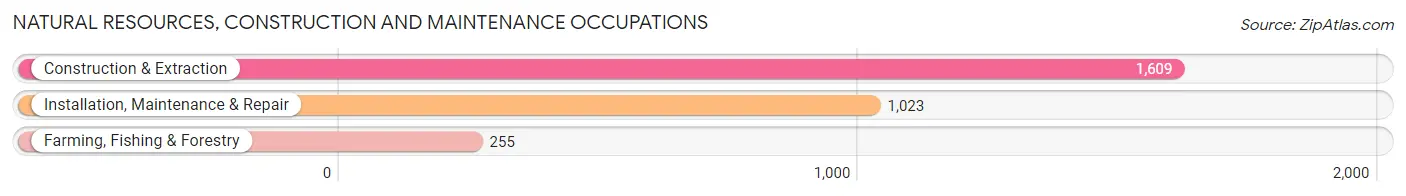
Natural Resources, Construction and Maintenance Occupations
The most common Natural Resources, Construction and Maintenance occupations in Coryell County are Construction & Extraction (1,609 | 6.4%), Installation, Maintenance & Repair (1,023 | 4.1%), and Farming, Fishing & Forestry (255 | 1.0%).
Natural Resources, Construction and Maintenance Occupations by Sex
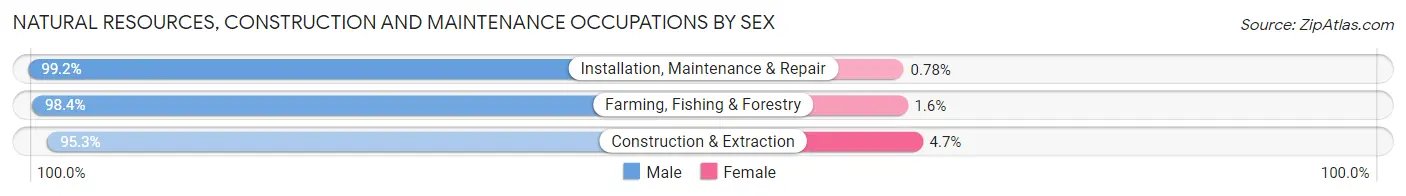
| Occupation | Male | Female |
| Farming, Fishing & Forestry | 251 (98.4%) | 4 (1.6%) |
| Construction & Extraction | 1,533 (95.3%) | 76 (4.7%) |
| Installation, Maintenance & Repair | 1,015 (99.2%) | 8 (0.8%) |
| Total (Category) | 2,799 (97.0%) | 88 (3.0%) |
| Total (Overall) | 13,311 (52.9%) | 11,830 (47.0%) |
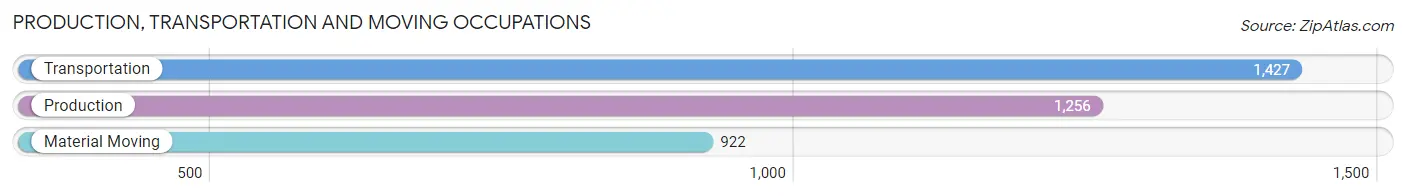
Production, Transportation and Moving Occupations
The most common Production, Transportation and Moving occupations in Coryell County are Transportation (1,427 | 5.7%), Production (1,256 | 5.0%), and Material Moving (922 | 3.7%).
Production, Transportation and Moving Occupations by Sex
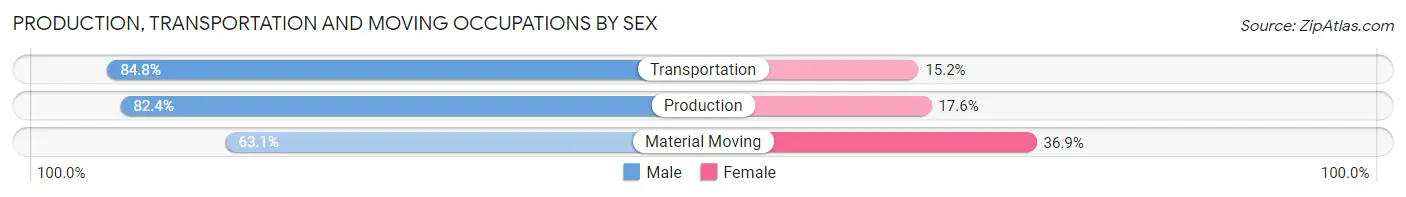
| Occupation | Male | Female |
| Production | 1,035 (82.4%) | 221 (17.6%) |
| Transportation | 1,210 (84.8%) | 217 (15.2%) |
| Material Moving | 582 (63.1%) | 340 (36.9%) |
| Total (Category) | 2,827 (78.4%) | 778 (21.6%) |
| Total (Overall) | 13,311 (52.9%) | 11,830 (47.0%) |
Employment Industries by Sex in Coryell County
Employment Industries in Coryell County
The major employment industries in Coryell County include Public Administration (3,299 | 13.1%), Health Care & Social Assistance (3,208 | 12.8%), Educational Services (2,593 | 10.3%), Retail Trade (2,465 | 9.8%), and Construction (2,083 | 8.3%).
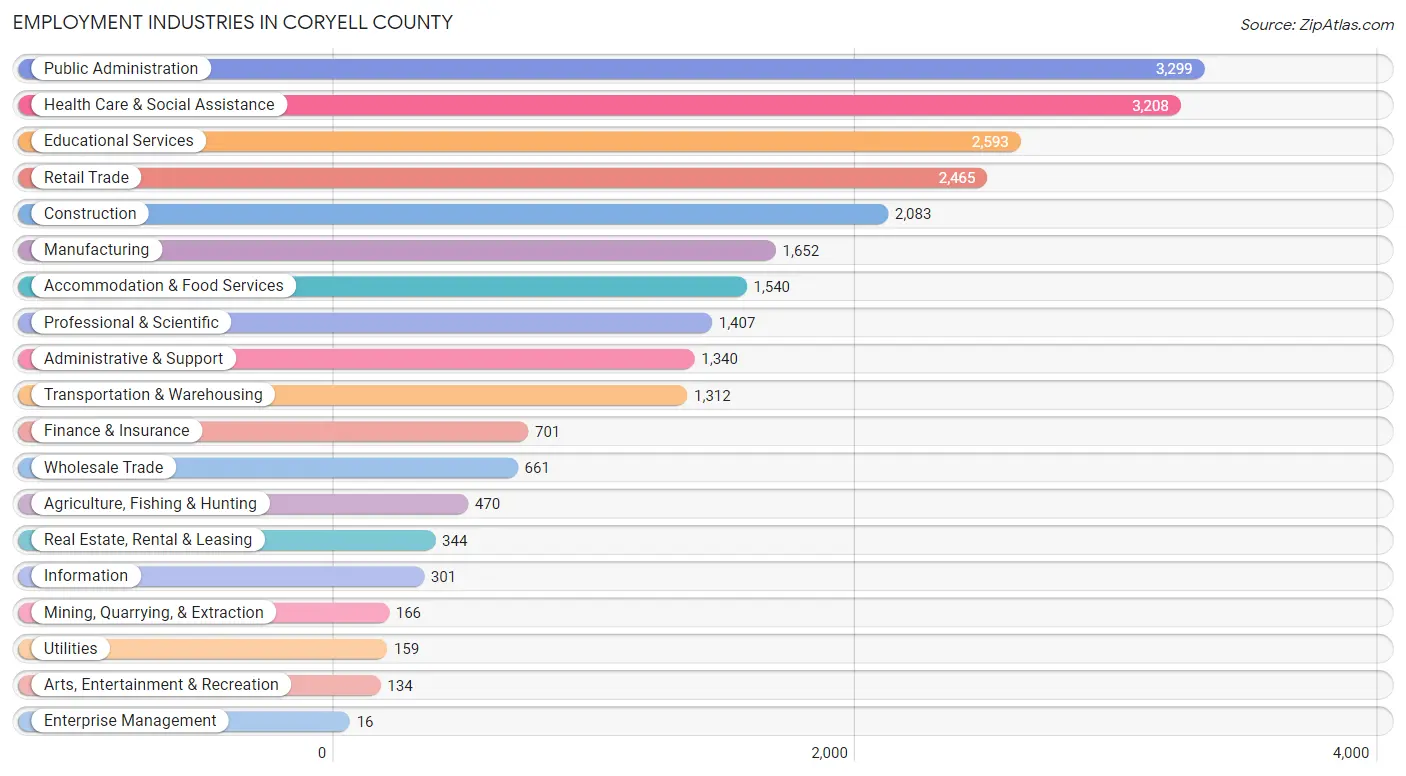
Employment Industries by Sex in Coryell County
The Coryell County industries that see more men than women are Mining, Quarrying, & Extraction (99.4%), Agriculture, Fishing & Hunting (93.0%), and Construction (92.5%), whereas the industries that tend to have a higher number of women are Enterprise Management (100.0%), Health Care & Social Assistance (79.3%), and Finance & Insurance (77.0%).
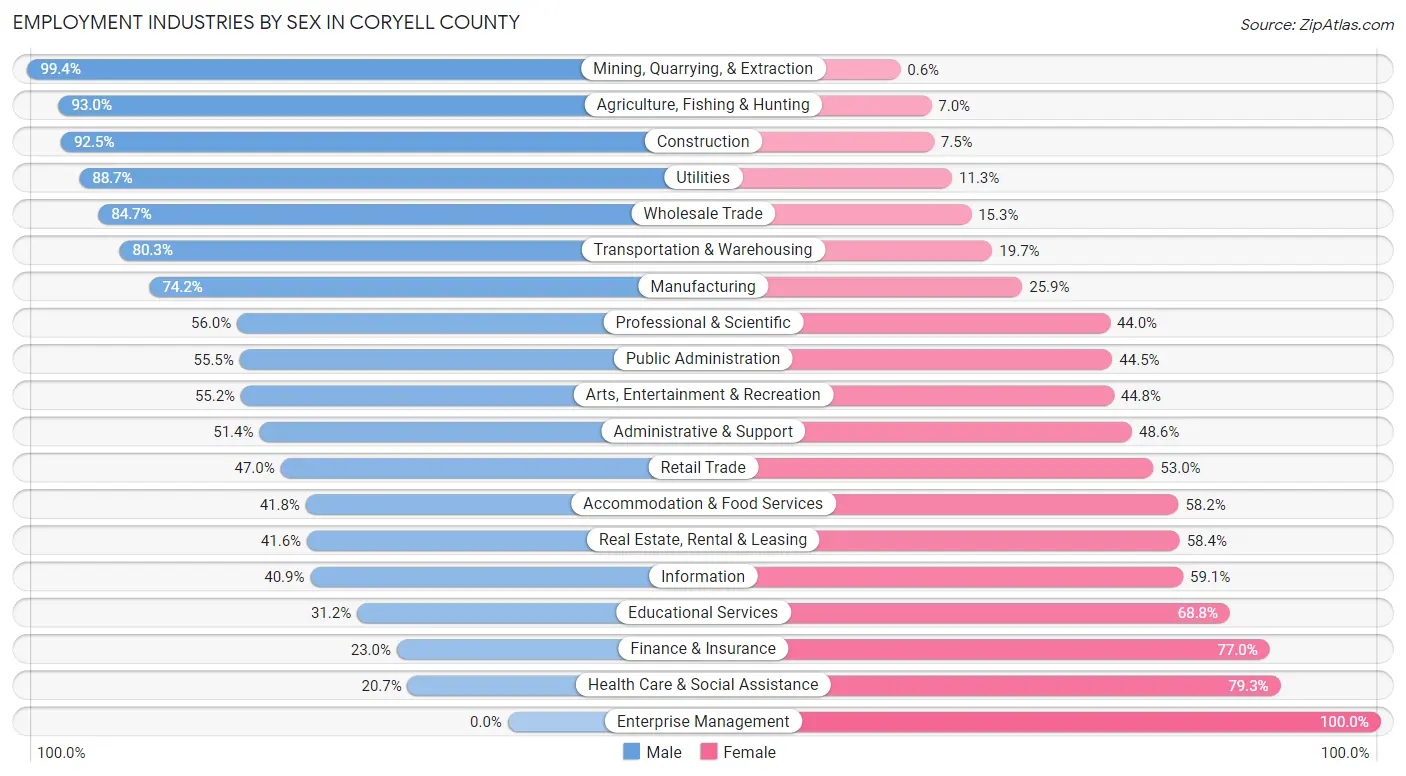
| Industry | Male | Female |
| Agriculture, Fishing & Hunting | 437 (93.0%) | 33 (7.0%) |
| Mining, Quarrying, & Extraction | 165 (99.4%) | 1 (0.6%) |
| Construction | 1,926 (92.5%) | 157 (7.5%) |
| Manufacturing | 1,225 (74.2%) | 427 (25.9%) |
| Wholesale Trade | 560 (84.7%) | 101 (15.3%) |
| Retail Trade | 1,159 (47.0%) | 1,306 (53.0%) |
| Transportation & Warehousing | 1,054 (80.3%) | 258 (19.7%) |
| Utilities | 141 (88.7%) | 18 (11.3%) |
| Information | 123 (40.9%) | 178 (59.1%) |
| Finance & Insurance | 161 (23.0%) | 540 (77.0%) |
| Real Estate, Rental & Leasing | 143 (41.6%) | 201 (58.4%) |
| Professional & Scientific | 788 (56.0%) | 619 (44.0%) |
| Enterprise Management | 0 (0.0%) | 16 (100.0%) |
| Administrative & Support | 689 (51.4%) | 651 (48.6%) |
| Educational Services | 809 (31.2%) | 1,784 (68.8%) |
| Health Care & Social Assistance | 665 (20.7%) | 2,543 (79.3%) |
| Arts, Entertainment & Recreation | 74 (55.2%) | 60 (44.8%) |
| Accommodation & Food Services | 644 (41.8%) | 896 (58.2%) |
| Public Administration | 1,831 (55.5%) | 1,468 (44.5%) |
| Total | 13,311 (52.9%) | 11,830 (47.0%) |
Education in Coryell County
School Enrollment in Coryell County
The most common levels of schooling among the 20,274 students in Coryell County are high school (4,696 | 23.2%), college / undergraduate (4,615 | 22.8%), and middle school (4,297 | 21.2%).
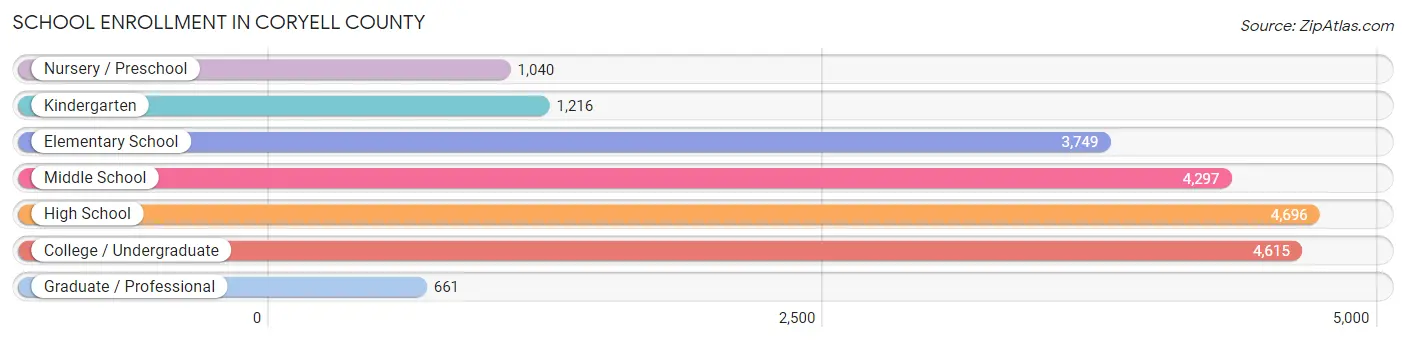
| School Level | # Students | % Students |
| Nursery / Preschool | 1,040 | 5.1% |
| Kindergarten | 1,216 | 6.0% |
| Elementary School | 3,749 | 18.5% |
| Middle School | 4,297 | 21.2% |
| High School | 4,696 | 23.2% |
| College / Undergraduate | 4,615 | 22.8% |
| Graduate / Professional | 661 | 3.3% |
| Total | 20,274 | 100.0% |
School Enrollment by Age by Funding Source in Coryell County
Out of a total of 20,274 students who are enrolled in schools in Coryell County, 1,804 (8.9%) attend a private institution, while the remaining 18,470 (91.1%) are enrolled in public schools. The age group of 35 years and over has the highest likelihood of being enrolled in private schools, with 410 (21.8% in the age bracket) enrolled. Conversely, the age group of 15 to 17 year olds has the lowest likelihood of being enrolled in a private school, with 2,435 (96.7% in the age bracket) attending a public institution.
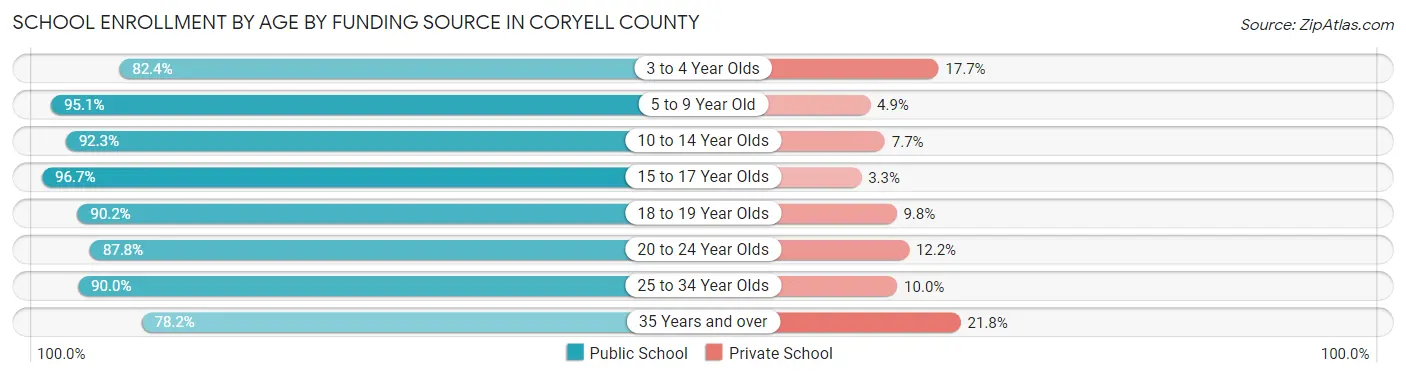
| Age Bracket | Public School | Private School |
| 3 to 4 Year Olds | 714 (82.4%) | 153 (17.6%) |
| 5 to 9 Year Old | 4,595 (95.1%) | 238 (4.9%) |
| 10 to 14 Year Olds | 4,933 (92.3%) | 410 (7.7%) |
| 15 to 17 Year Olds | 2,435 (96.7%) | 82 (3.3%) |
| 18 to 19 Year Olds | 843 (90.2%) | 92 (9.8%) |
| 20 to 24 Year Olds | 1,358 (87.8%) | 188 (12.2%) |
| 25 to 34 Year Olds | 2,116 (90.0%) | 234 (10.0%) |
| 35 Years and over | 1,473 (78.2%) | 410 (21.8%) |
| Total | 18,470 (91.1%) | 1,804 (8.9%) |
Educational Attainment by Field of Study in Coryell County
Business (1,750 | 18.2%), arts & humanities (1,322 | 13.8%), education (1,290 | 13.4%), science & technology (1,023 | 10.7%), and liberal arts & history (740 | 7.7%) are the most common fields of study among 9,598 individuals in Coryell County who have obtained a bachelor's degree or higher.
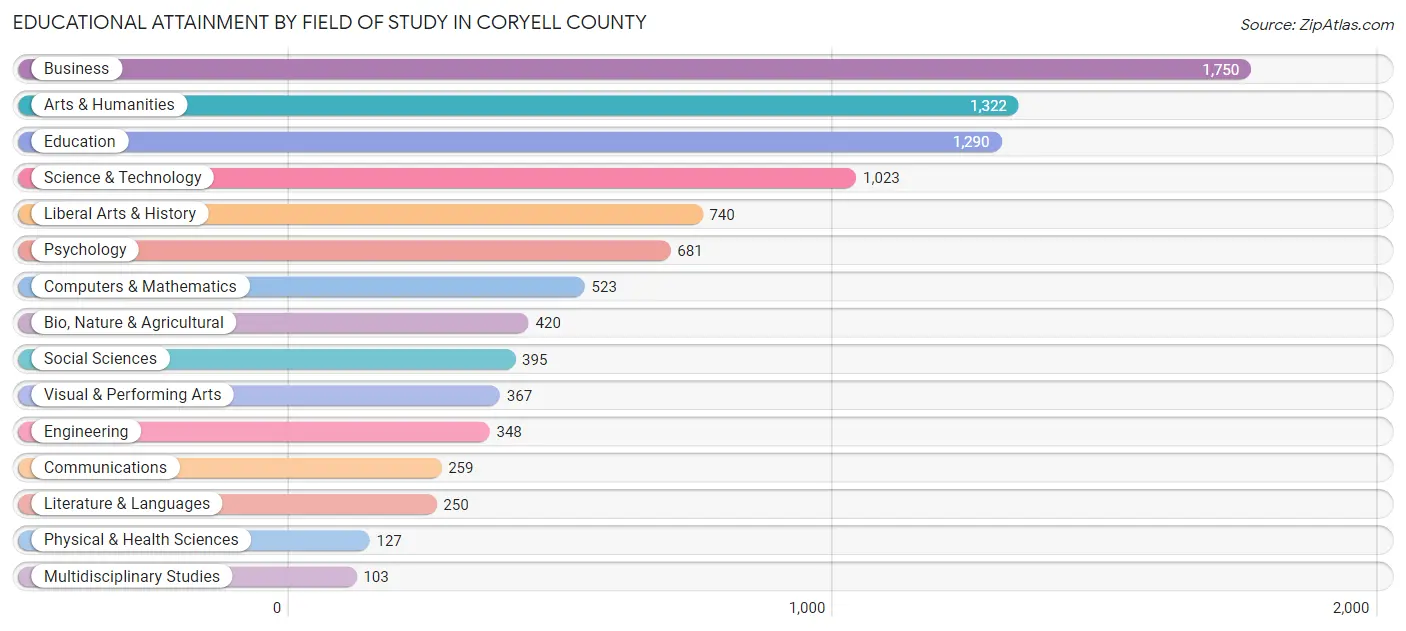
| Field of Study | # Graduates | % Graduates |
| Computers & Mathematics | 523 | 5.4% |
| Bio, Nature & Agricultural | 420 | 4.4% |
| Physical & Health Sciences | 127 | 1.3% |
| Psychology | 681 | 7.1% |
| Social Sciences | 395 | 4.1% |
| Engineering | 348 | 3.6% |
| Multidisciplinary Studies | 103 | 1.1% |
| Science & Technology | 1,023 | 10.7% |
| Business | 1,750 | 18.2% |
| Education | 1,290 | 13.4% |
| Literature & Languages | 250 | 2.6% |
| Liberal Arts & History | 740 | 7.7% |
| Visual & Performing Arts | 367 | 3.8% |
| Communications | 259 | 2.7% |
| Arts & Humanities | 1,322 | 13.8% |
| Total | 9,598 | 100.0% |
Transportation & Commute in Coryell County
Vehicle Availability by Sex in Coryell County
The most prevalent vehicle ownership categories in Coryell County are males with 2 vehicles (7,375, accounting for 45.6%) and females with 2 vehicles (4,822, making up 62.4%).
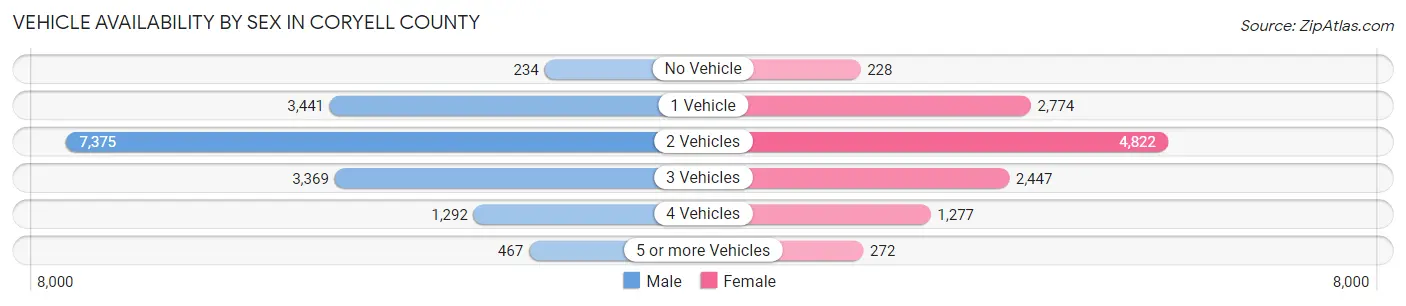
| Vehicles Available | Male | Female |
| No Vehicle | 234 (1.5%) | 228 (1.9%) |
| 1 Vehicle | 3,441 (21.3%) | 2,774 (23.5%) |
| 2 Vehicles | 7,375 (45.6%) | 4,822 (40.8%) |
| 3 Vehicles | 3,369 (20.8%) | 2,447 (20.7%) |
| 4 Vehicles | 1,292 (8.0%) | 1,277 (10.8%) |
| 5 or more Vehicles | 467 (2.9%) | 272 (2.3%) |
| Total | 16,178 (100.0%) | 11,820 (100.0%) |
Commute Time in Coryell County
The most frequently occuring commute durations in Coryell County are 15 to 19 minutes (5,276 commuters, 17.2%), 10 to 14 minutes (5,064 commuters, 16.5%), and 5 to 9 minutes (4,791 commuters, 15.6%).
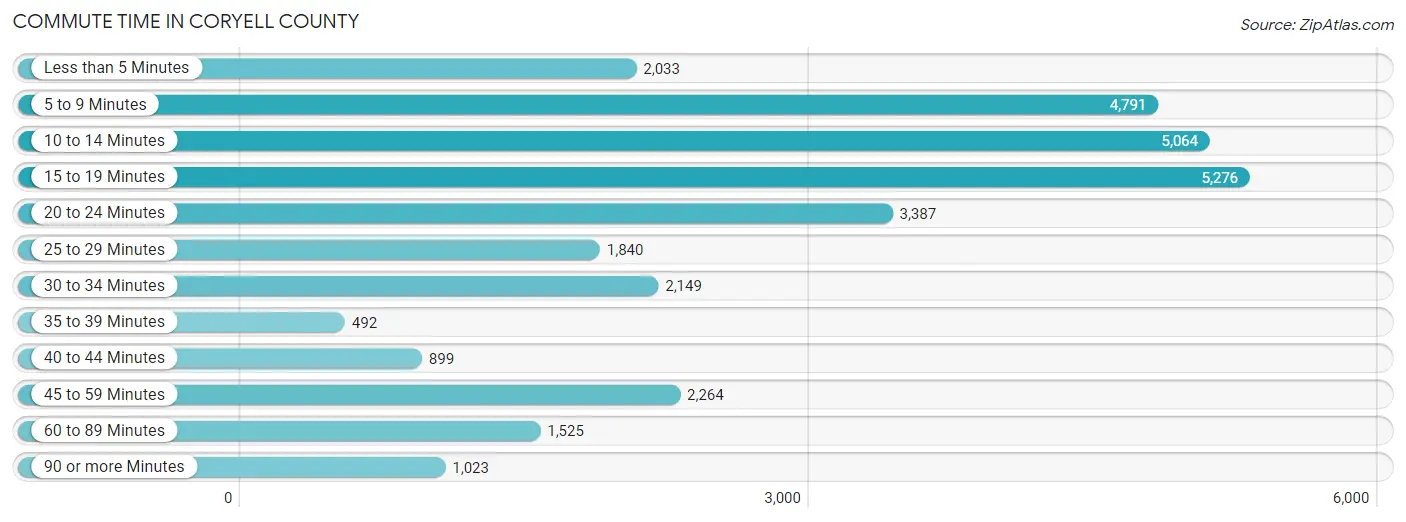
| Commute Time | # Commuters | % Commuters |
| Less than 5 Minutes | 2,033 | 6.6% |
| 5 to 9 Minutes | 4,791 | 15.6% |
| 10 to 14 Minutes | 5,064 | 16.5% |
| 15 to 19 Minutes | 5,276 | 17.2% |
| 20 to 24 Minutes | 3,387 | 11.0% |
| 25 to 29 Minutes | 1,840 | 6.0% |
| 30 to 34 Minutes | 2,149 | 7.0% |
| 35 to 39 Minutes | 492 | 1.6% |
| 40 to 44 Minutes | 899 | 2.9% |
| 45 to 59 Minutes | 2,264 | 7.4% |
| 60 to 89 Minutes | 1,525 | 5.0% |
| 90 or more Minutes | 1,023 | 3.3% |
Commute Time by Sex in Coryell County
The most common commute times in Coryell County are 15 to 19 minutes (3,192 commuters, 16.4%) for males and 15 to 19 minutes (2,084 commuters, 18.4%) for females.
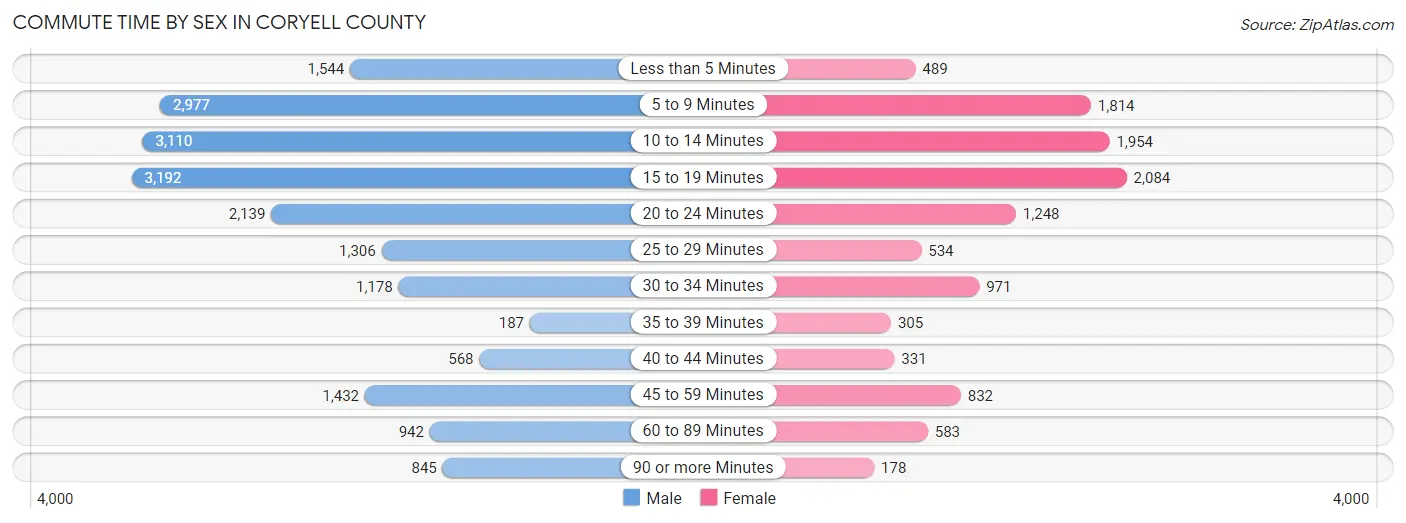
| Commute Time | Male | Female |
| Less than 5 Minutes | 1,544 (8.0%) | 489 (4.3%) |
| 5 to 9 Minutes | 2,977 (15.3%) | 1,814 (16.0%) |
| 10 to 14 Minutes | 3,110 (16.0%) | 1,954 (17.3%) |
| 15 to 19 Minutes | 3,192 (16.4%) | 2,084 (18.4%) |
| 20 to 24 Minutes | 2,139 (11.0%) | 1,248 (11.0%) |
| 25 to 29 Minutes | 1,306 (6.7%) | 534 (4.7%) |
| 30 to 34 Minutes | 1,178 (6.1%) | 971 (8.6%) |
| 35 to 39 Minutes | 187 (1.0%) | 305 (2.7%) |
| 40 to 44 Minutes | 568 (2.9%) | 331 (2.9%) |
| 45 to 59 Minutes | 1,432 (7.4%) | 832 (7.3%) |
| 60 to 89 Minutes | 942 (4.9%) | 583 (5.1%) |
| 90 or more Minutes | 845 (4.3%) | 178 (1.6%) |
Time of Departure to Work by Sex in Coryell County
The most frequent times of departure to work in Coryell County are 6:00 AM to 6:29 AM (3,216, 16.6%) for males and 7:00 AM to 7:29 AM (1,600, 14.1%) for females.
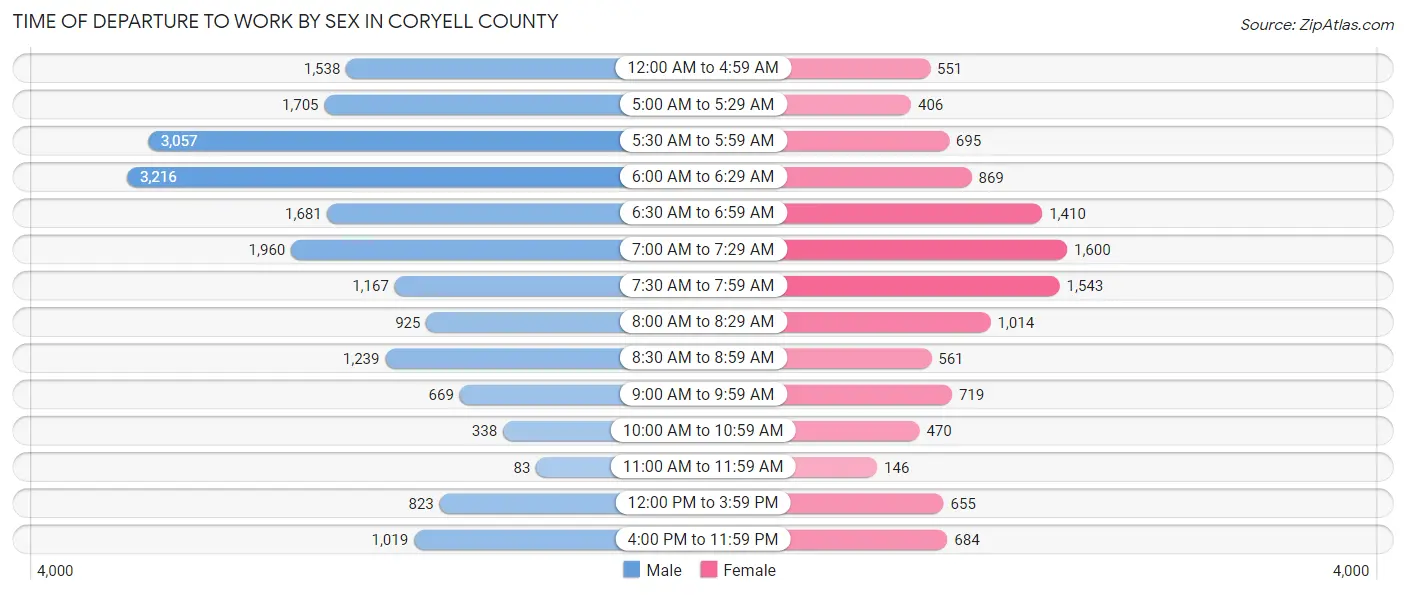
| Time of Departure | Male | Female |
| 12:00 AM to 4:59 AM | 1,538 (7.9%) | 551 (4.9%) |
| 5:00 AM to 5:29 AM | 1,705 (8.8%) | 406 (3.6%) |
| 5:30 AM to 5:59 AM | 3,057 (15.7%) | 695 (6.1%) |
| 6:00 AM to 6:29 AM | 3,216 (16.6%) | 869 (7.7%) |
| 6:30 AM to 6:59 AM | 1,681 (8.7%) | 1,410 (12.4%) |
| 7:00 AM to 7:29 AM | 1,960 (10.1%) | 1,600 (14.1%) |
| 7:30 AM to 7:59 AM | 1,167 (6.0%) | 1,543 (13.6%) |
| 8:00 AM to 8:29 AM | 925 (4.8%) | 1,014 (9.0%) |
| 8:30 AM to 8:59 AM | 1,239 (6.4%) | 561 (5.0%) |
| 9:00 AM to 9:59 AM | 669 (3.4%) | 719 (6.4%) |
| 10:00 AM to 10:59 AM | 338 (1.7%) | 470 (4.2%) |
| 11:00 AM to 11:59 AM | 83 (0.4%) | 146 (1.3%) |
| 12:00 PM to 3:59 PM | 823 (4.2%) | 655 (5.8%) |
| 4:00 PM to 11:59 PM | 1,019 (5.2%) | 684 (6.0%) |
| Total | 19,420 (100.0%) | 11,323 (100.0%) |
Housing Occupancy in Coryell County
Occupancy by Ownership in Coryell County
Of the total 25,156 dwellings in Coryell County, owner-occupied units account for 14,538 (57.8%), while renter-occupied units make up 10,618 (42.2%).
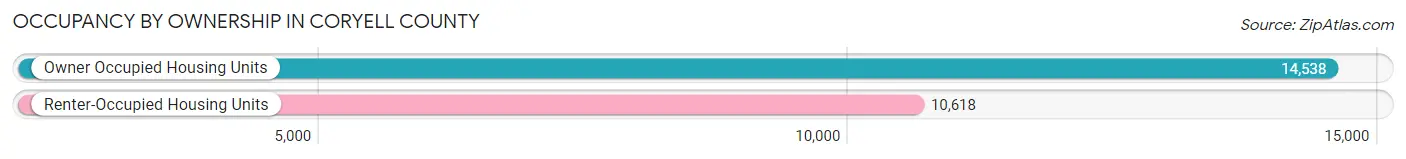
| Occupancy | # Housing Units | % Housing Units |
| Owner Occupied Housing Units | 14,538 | 57.8% |
| Renter-Occupied Housing Units | 10,618 | 42.2% |
| Total Occupied Housing Units | 25,156 | 100.0% |
Occupancy by Household Size in Coryell County
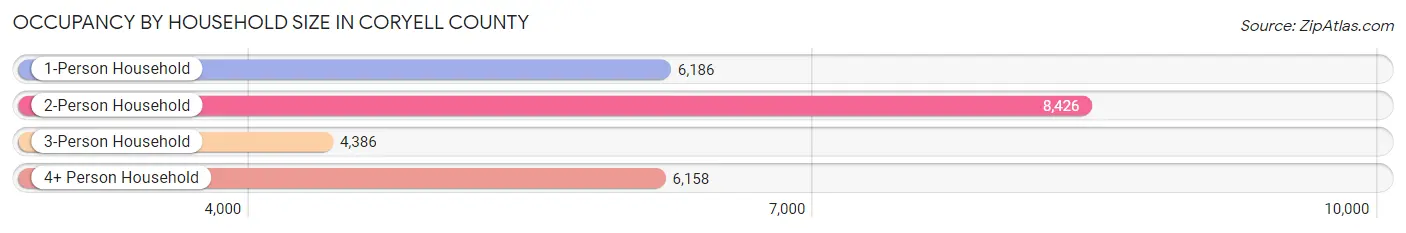
| Household Size | # Housing Units | % Housing Units |
| 1-Person Household | 6,186 | 24.6% |
| 2-Person Household | 8,426 | 33.5% |
| 3-Person Household | 4,386 | 17.4% |
| 4+ Person Household | 6,158 | 24.5% |
| Total Housing Units | 25,156 | 100.0% |
Occupancy by Ownership by Household Size in Coryell County
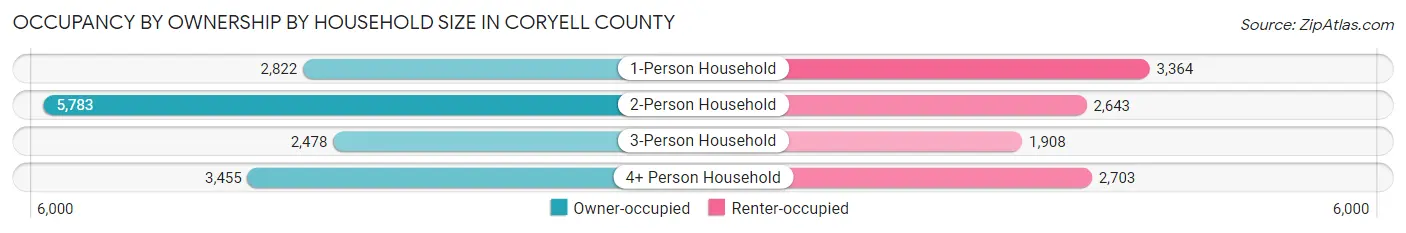
| Household Size | Owner-occupied | Renter-occupied |
| 1-Person Household | 2,822 (45.6%) | 3,364 (54.4%) |
| 2-Person Household | 5,783 (68.6%) | 2,643 (31.4%) |
| 3-Person Household | 2,478 (56.5%) | 1,908 (43.5%) |
| 4+ Person Household | 3,455 (56.1%) | 2,703 (43.9%) |
| Total Housing Units | 14,538 (57.8%) | 10,618 (42.2%) |
Occupancy by Educational Attainment in Coryell County
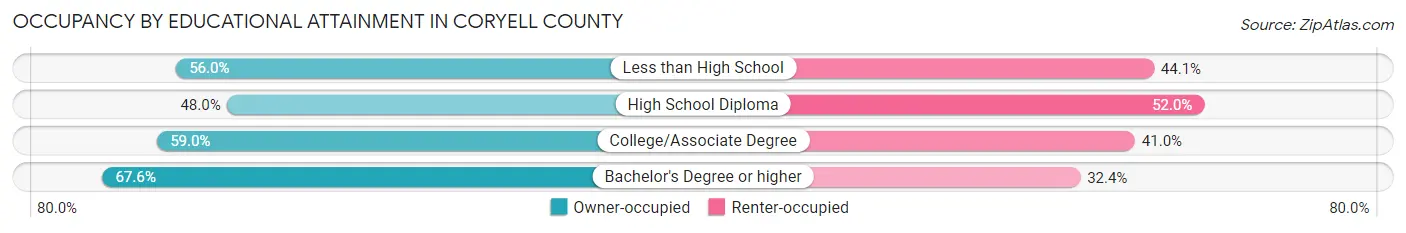
| Household Size | Owner-occupied | Renter-occupied |
| Less than High School | 827 (55.9%) | 651 (44.1%) |
| High School Diploma | 3,067 (48.0%) | 3,325 (52.0%) |
| College/Associate Degree | 7,120 (59.0%) | 4,956 (41.0%) |
| Bachelor's Degree or higher | 3,524 (67.6%) | 1,686 (32.4%) |
Occupancy by Age of Householder in Coryell County
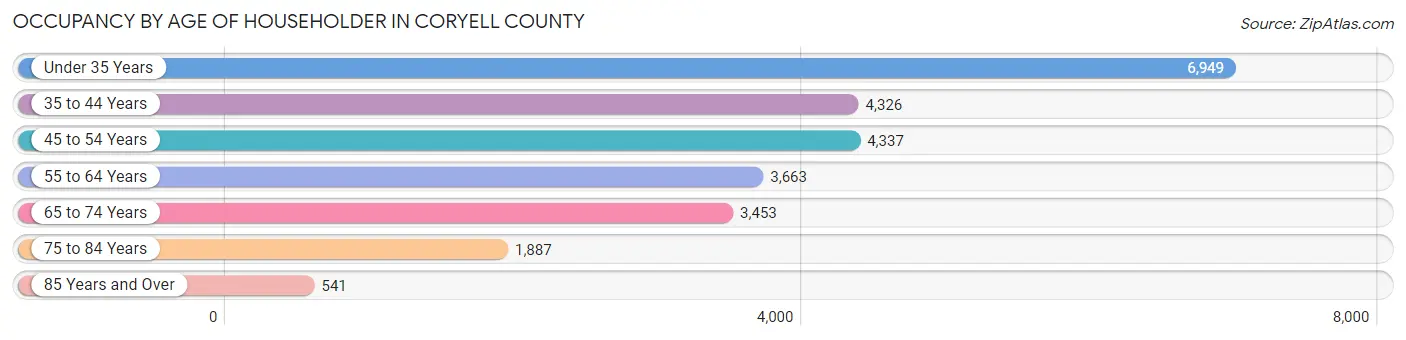
| Age Bracket | # Households | % Households |
| Under 35 Years | 6,949 | 27.6% |
| 35 to 44 Years | 4,326 | 17.2% |
| 45 to 54 Years | 4,337 | 17.2% |
| 55 to 64 Years | 3,663 | 14.6% |
| 65 to 74 Years | 3,453 | 13.7% |
| 75 to 84 Years | 1,887 | 7.5% |
| 85 Years and Over | 541 | 2.1% |
| Total | 25,156 | 100.0% |
Housing Finances in Coryell County
Median Income by Occupancy in Coryell County
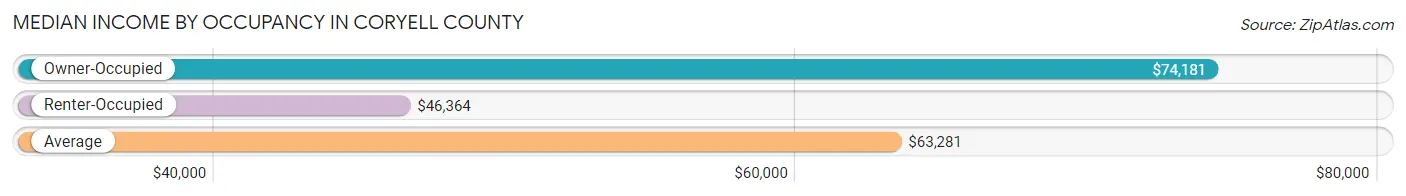
| Occupancy Type | # Households | Median Income |
| Owner-Occupied | 14,538 (57.8%) | $74,181 |
| Renter-Occupied | 10,618 (42.2%) | $46,364 |
| Average | 25,156 (100.0%) | $63,281 |
Occupancy by Householder Income Bracket in Coryell County
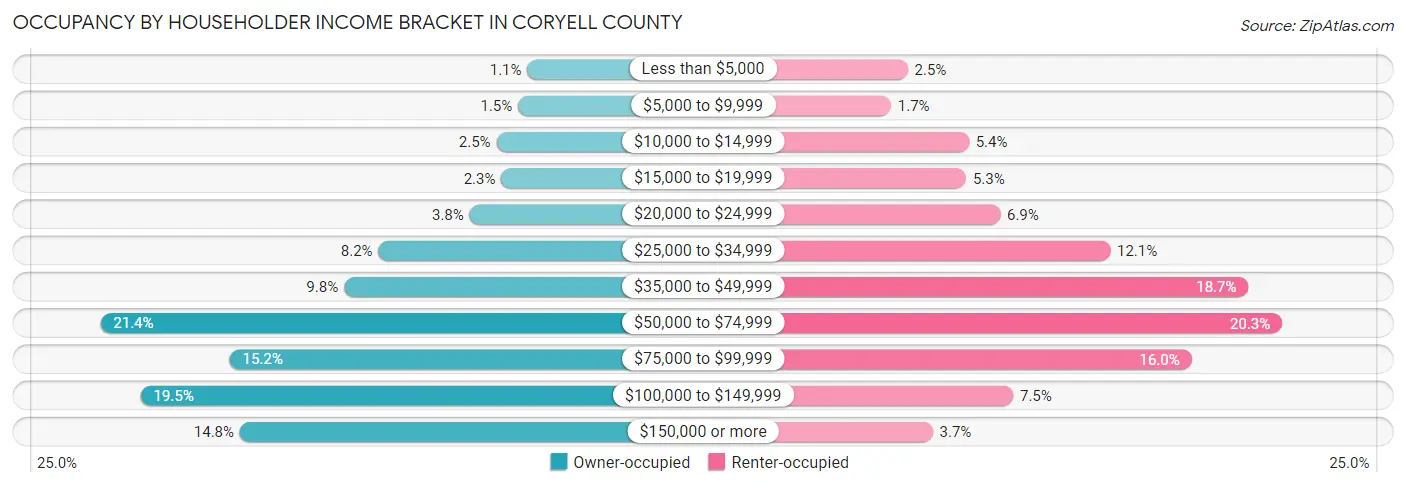
| Income Bracket | Owner-occupied | Renter-occupied |
| Less than $5,000 | 154 (1.1%) | 263 (2.5%) |
| $5,000 to $9,999 | 218 (1.5%) | 178 (1.7%) |
| $10,000 to $14,999 | 368 (2.5%) | 572 (5.4%) |
| $15,000 to $19,999 | 334 (2.3%) | 559 (5.3%) |
| $20,000 to $24,999 | 554 (3.8%) | 731 (6.9%) |
| $25,000 to $34,999 | 1,185 (8.2%) | 1,287 (12.1%) |
| $35,000 to $49,999 | 1,423 (9.8%) | 1,986 (18.7%) |
| $50,000 to $74,999 | 3,109 (21.4%) | 2,157 (20.3%) |
| $75,000 to $99,999 | 2,216 (15.2%) | 1,699 (16.0%) |
| $100,000 to $149,999 | 2,832 (19.5%) | 796 (7.5%) |
| $150,000 or more | 2,145 (14.7%) | 390 (3.7%) |
| Total | 14,538 (100.0%) | 10,618 (100.0%) |
Monthly Housing Cost Tiers in Coryell County
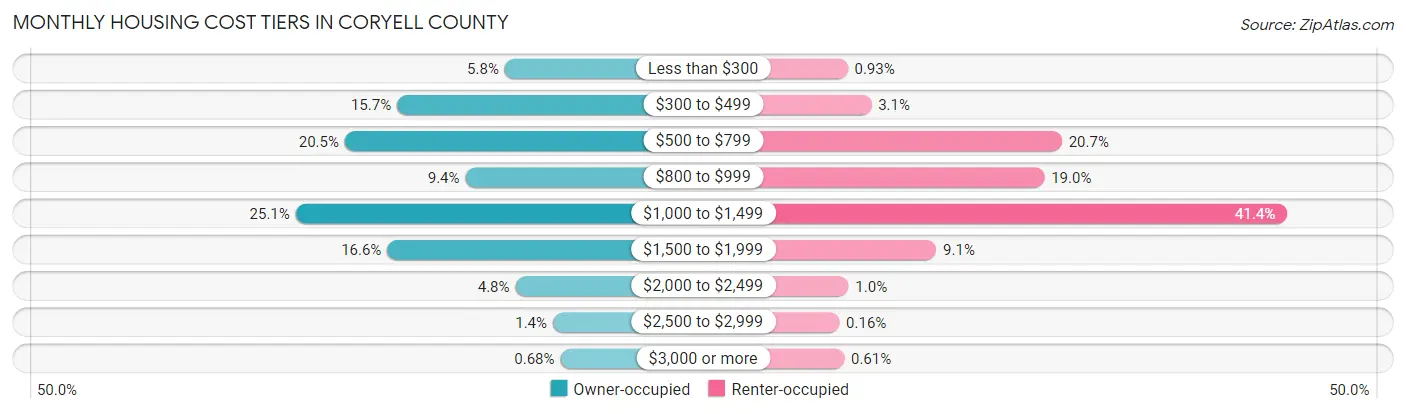
| Monthly Cost | Owner-occupied | Renter-occupied |
| Less than $300 | 843 (5.8%) | 99 (0.9%) |
| $300 to $499 | 2,286 (15.7%) | 330 (3.1%) |
| $500 to $799 | 2,983 (20.5%) | 2,193 (20.6%) |
| $800 to $999 | 1,369 (9.4%) | 2,022 (19.0%) |
| $1,000 to $1,499 | 3,642 (25.1%) | 4,396 (41.4%) |
| $1,500 to $1,999 | 2,416 (16.6%) | 965 (9.1%) |
| $2,000 to $2,499 | 701 (4.8%) | 107 (1.0%) |
| $2,500 to $2,999 | 199 (1.4%) | 17 (0.2%) |
| $3,000 or more | 99 (0.7%) | 65 (0.6%) |
| Total | 14,538 (100.0%) | 10,618 (100.0%) |
Physical Housing Characteristics in Coryell County
Housing Structures in Coryell County
| Structure Type | # Housing Units | % Housing Units |
| Single Unit, Detached | 16,742 | 66.5% |
| Single Unit, Attached | 2,252 | 8.9% |
| 2 Unit Apartments | 1,570 | 6.2% |
| 3 or 4 Unit Apartments | 941 | 3.7% |
| 5 to 9 Unit Apartments | 857 | 3.4% |
| 10 or more Apartments | 1,261 | 5.0% |
| Mobile Home / Other | 1,533 | 6.1% |
| Total | 25,156 | 100.0% |
Housing Structures by Occupancy in Coryell County
| Structure Type | Owner-occupied | Renter-occupied |
| Single Unit, Detached | 13,174 (78.7%) | 3,568 (21.3%) |
| Single Unit, Attached | 95 (4.2%) | 2,157 (95.8%) |
| 2 Unit Apartments | 81 (5.2%) | 1,489 (94.8%) |
| 3 or 4 Unit Apartments | 0 (0.0%) | 941 (100.0%) |
| 5 to 9 Unit Apartments | 0 (0.0%) | 857 (100.0%) |
| 10 or more Apartments | 18 (1.4%) | 1,243 (98.6%) |
| Mobile Home / Other | 1,170 (76.3%) | 363 (23.7%) |
| Total | 14,538 (57.8%) | 10,618 (42.2%) |
Housing Structures by Number of Rooms in Coryell County
| Number of Rooms | Owner-occupied | Renter-occupied |
| 1 Room | 69 (0.5%) | 178 (1.7%) |
| 2 or 3 Rooms | 495 (3.4%) | 2,060 (19.4%) |
| 4 or 5 Rooms | 4,188 (28.8%) | 5,096 (48.0%) |
| 6 or 7 Rooms | 6,427 (44.2%) | 2,388 (22.5%) |
| 8 or more Rooms | 3,359 (23.1%) | 896 (8.4%) |
| Total | 14,538 (100.0%) | 10,618 (100.0%) |
Housing Structure by Heating Type in Coryell County

| Heating Type | Owner-occupied | Renter-occupied |
| Utility Gas | 3,186 (21.9%) | 2,344 (22.1%) |
| Bottled, Tank, or LP Gas | 747 (5.1%) | 235 (2.2%) |
| Electricity | 10,146 (69.8%) | 7,984 (75.2%) |
| Fuel Oil or Kerosene | 0 (0.0%) | 3 (0.0%) |
| Coal or Coke | 0 (0.0%) | 0 (0.0%) |
| All other Fuels | 353 (2.4%) | 15 (0.1%) |
| No Fuel Used | 106 (0.7%) | 37 (0.4%) |
| Total | 14,538 (100.0%) | 10,618 (100.0%) |
Household Vehicle Usage in Coryell County
| Vehicles per Household | Owner-occupied | Renter-occupied |
| No Vehicle | 339 (2.3%) | 727 (6.9%) |
| 1 Vehicle | 3,451 (23.7%) | 5,154 (48.5%) |
| 2 Vehicles | 6,048 (41.6%) | 3,879 (36.5%) |
| 3 or more Vehicles | 4,700 (32.3%) | 858 (8.1%) |
| Total | 14,538 (100.0%) | 10,618 (100.0%) |
Real Estate & Mortgages in Coryell County
Real Estate and Mortgage Overview in Coryell County
| Characteristic | Without Mortgage | With Mortgage |
| Housing Units | 6,460 | 8,078 |
| Median Property Value | $130,000 | $171,200 |
| Median Household Income | $59,212 | $1,380 |
| Monthly Housing Costs | $514 | $96 |
| Real Estate Taxes | $1,821 | $1,143 |
Property Value by Mortgage Status in Coryell County
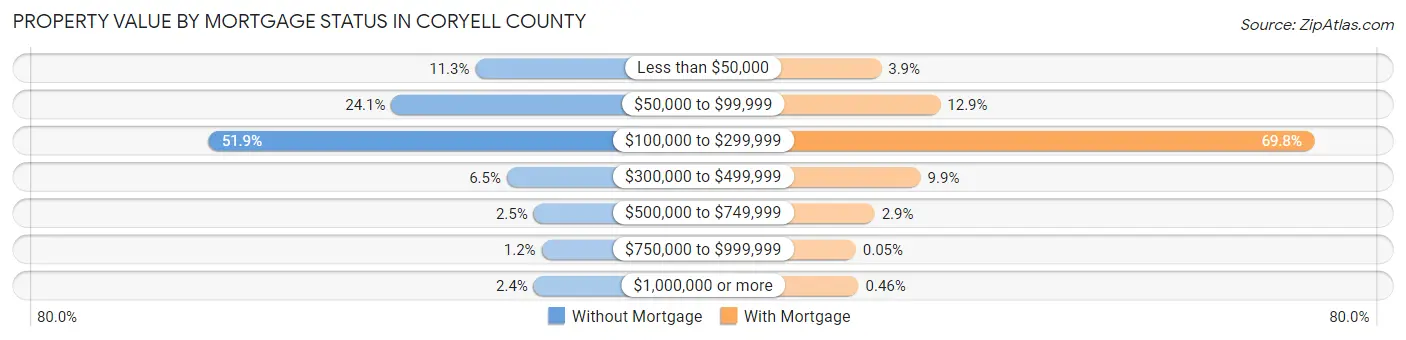
| Property Value | Without Mortgage | With Mortgage |
| Less than $50,000 | 731 (11.3%) | 317 (3.9%) |
| $50,000 to $99,999 | 1,558 (24.1%) | 1,044 (12.9%) |
| $100,000 to $299,999 | 3,355 (51.9%) | 5,639 (69.8%) |
| $300,000 to $499,999 | 421 (6.5%) | 801 (9.9%) |
| $500,000 to $749,999 | 158 (2.5%) | 236 (2.9%) |
| $750,000 to $999,999 | 80 (1.2%) | 4 (0.1%) |
| $1,000,000 or more | 157 (2.4%) | 37 (0.5%) |
| Total | 6,460 (100.0%) | 8,078 (100.0%) |
Household Income by Mortgage Status in Coryell County
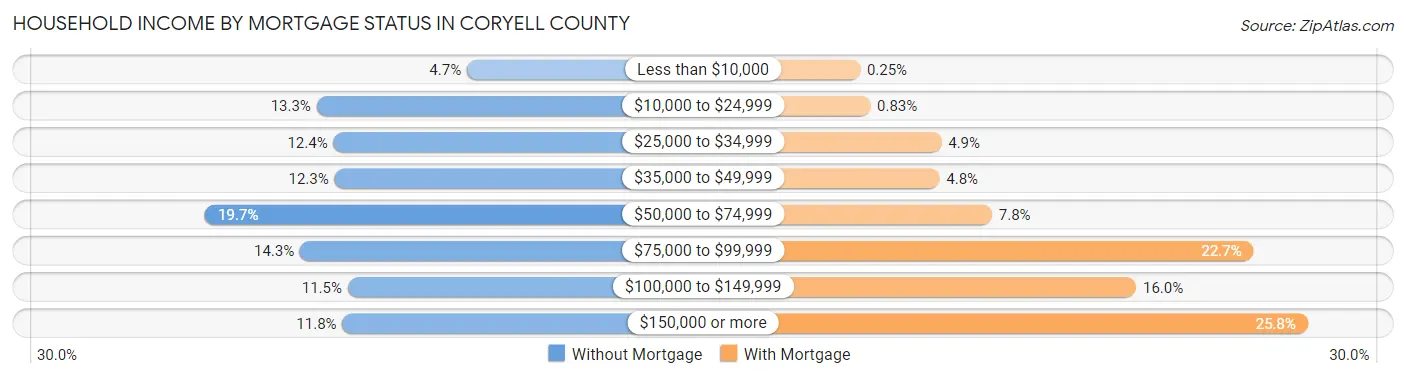
| Household Income | Without Mortgage | With Mortgage |
| Less than $10,000 | 305 (4.7%) | 20 (0.3%) |
| $10,000 to $24,999 | 860 (13.3%) | 67 (0.8%) |
| $25,000 to $34,999 | 798 (12.3%) | 396 (4.9%) |
| $35,000 to $49,999 | 794 (12.3%) | 387 (4.8%) |
| $50,000 to $74,999 | 1,272 (19.7%) | 629 (7.8%) |
| $75,000 to $99,999 | 921 (14.3%) | 1,837 (22.7%) |
| $100,000 to $149,999 | 745 (11.5%) | 1,295 (16.0%) |
| $150,000 or more | 765 (11.8%) | 2,087 (25.8%) |
| Total | 6,460 (100.0%) | 8,078 (100.0%) |
Property Value to Household Income Ratio in Coryell County
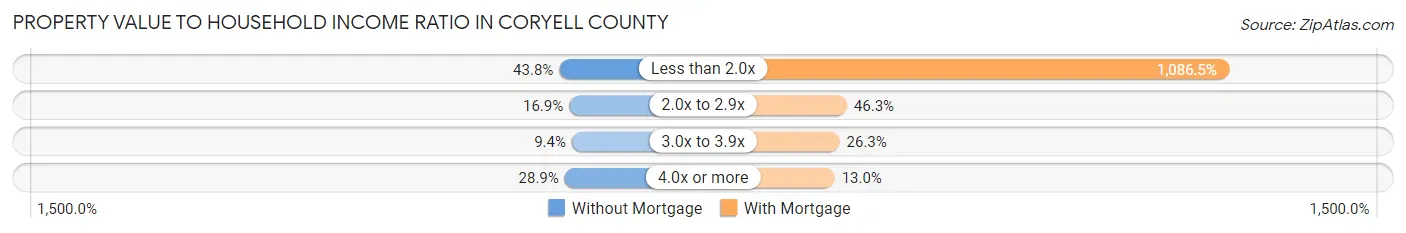
| Value-to-Income Ratio | Without Mortgage | With Mortgage |
| Less than 2.0x | 2,827 (43.8%) | 87,767 (1,086.5%) |
| 2.0x to 2.9x | 1,090 (16.9%) | 3,740 (46.3%) |
| 3.0x to 3.9x | 604 (9.3%) | 2,128 (26.3%) |
| 4.0x or more | 1,869 (28.9%) | 1,051 (13.0%) |
| Total | 6,460 (100.0%) | 8,078 (100.0%) |
Real Estate Taxes by Mortgage Status in Coryell County
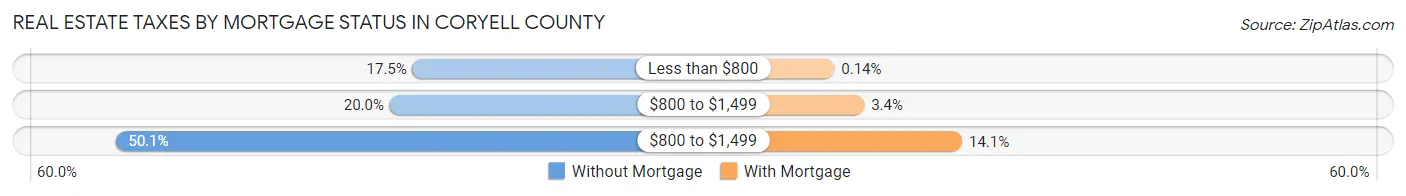
| Property Taxes | Without Mortgage | With Mortgage |
| Less than $800 | 1,129 (17.5%) | 11 (0.1%) |
| $800 to $1,499 | 1,291 (20.0%) | 276 (3.4%) |
| $800 to $1,499 | 3,234 (50.1%) | 1,142 (14.1%) |
| Total | 6,460 (100.0%) | 8,078 (100.0%) |
Health & Disability in Coryell County
Health Insurance Coverage by Age in Coryell County
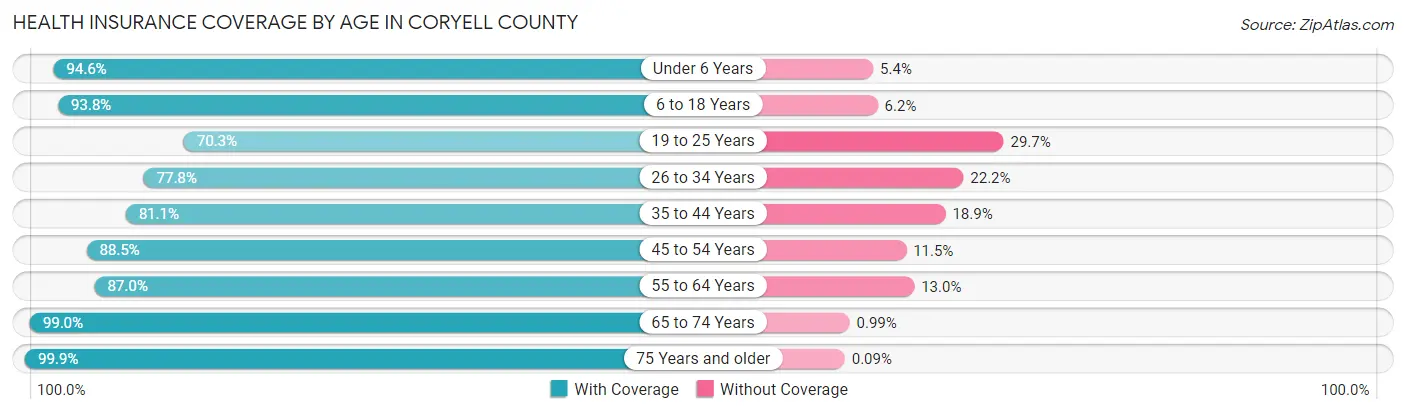
| Age Bracket | With Coverage | Without Coverage |
| Under 6 Years | 6,178 (94.6%) | 351 (5.4%) |
| 6 to 18 Years | 12,103 (93.8%) | 803 (6.2%) |
| 19 to 25 Years | 3,828 (70.3%) | 1,617 (29.7%) |
| 26 to 34 Years | 6,669 (77.8%) | 1,903 (22.2%) |
| 35 to 44 Years | 6,575 (81.1%) | 1,529 (18.9%) |
| 45 to 54 Years | 6,347 (88.5%) | 828 (11.5%) |
| 55 to 64 Years | 5,154 (87.0%) | 773 (13.0%) |
| 65 to 74 Years | 5,187 (99.0%) | 52 (1.0%) |
| 75 Years and older | 3,331 (99.9%) | 3 (0.1%) |
| Total | 55,372 (87.6%) | 7,859 (12.4%) |
Health Insurance Coverage by Citizenship Status in Coryell County
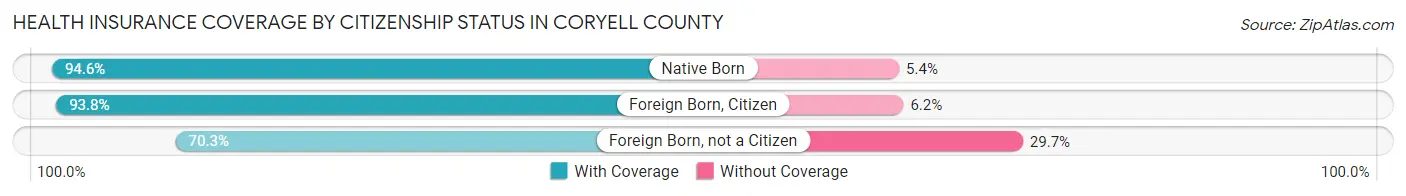
| Citizenship Status | With Coverage | Without Coverage |
| Native Born | 6,178 (94.6%) | 351 (5.4%) |
| Foreign Born, Citizen | 12,103 (93.8%) | 803 (6.2%) |
| Foreign Born, not a Citizen | 3,828 (70.3%) | 1,617 (29.7%) |
Health Insurance Coverage by Household Income in Coryell County
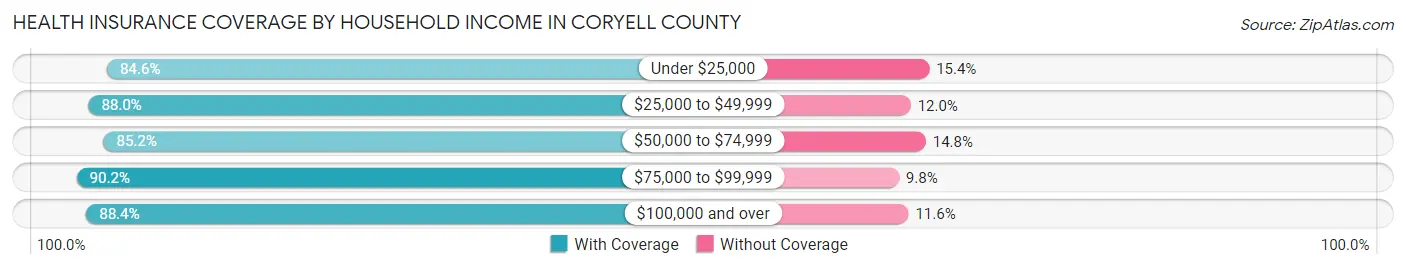
| Household Income | With Coverage | Without Coverage |
| Under $25,000 | 5,524 (84.6%) | 1,009 (15.4%) |
| $25,000 to $49,999 | 10,579 (88.0%) | 1,439 (12.0%) |
| $50,000 to $74,999 | 11,246 (85.2%) | 1,953 (14.8%) |
| $75,000 to $99,999 | 10,050 (90.2%) | 1,087 (9.8%) |
| $100,000 and over | 17,717 (88.4%) | 2,316 (11.6%) |
Public vs Private Health Insurance Coverage by Age in Coryell County
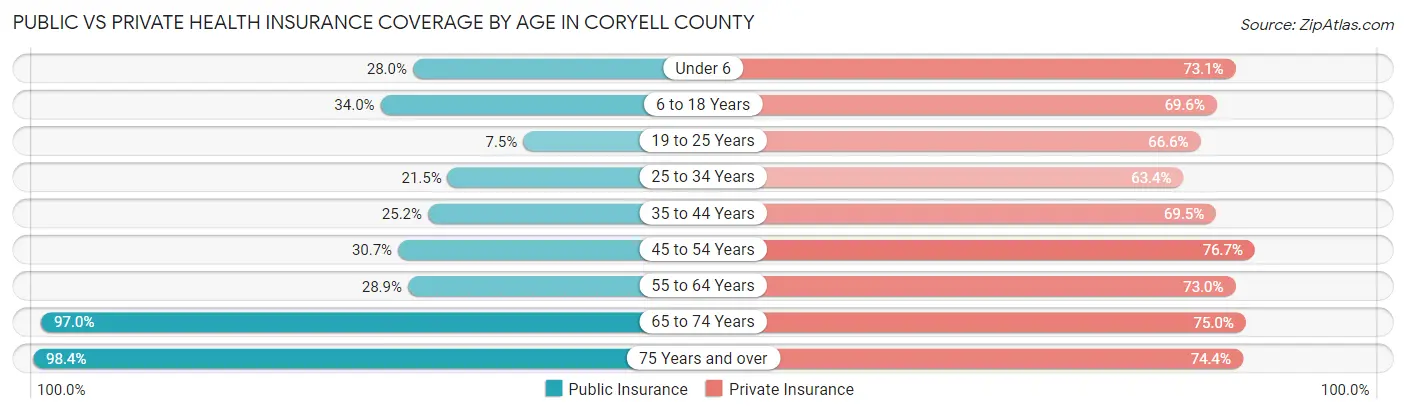
| Age Bracket | Public Insurance | Private Insurance |
| Under 6 | 1,825 (28.0%) | 4,770 (73.1%) |
| 6 to 18 Years | 4,383 (34.0%) | 8,981 (69.6%) |
| 19 to 25 Years | 407 (7.5%) | 3,624 (66.6%) |
| 25 to 34 Years | 1,842 (21.5%) | 5,433 (63.4%) |
| 35 to 44 Years | 2,038 (25.2%) | 5,630 (69.5%) |
| 45 to 54 Years | 2,203 (30.7%) | 5,500 (76.7%) |
| 55 to 64 Years | 1,711 (28.9%) | 4,329 (73.0%) |
| 65 to 74 Years | 5,079 (97.0%) | 3,927 (75.0%) |
| 75 Years and over | 3,281 (98.4%) | 2,481 (74.4%) |
| Total | 22,769 (36.0%) | 44,675 (70.7%) |
Disability Status by Sex by Age in Coryell County
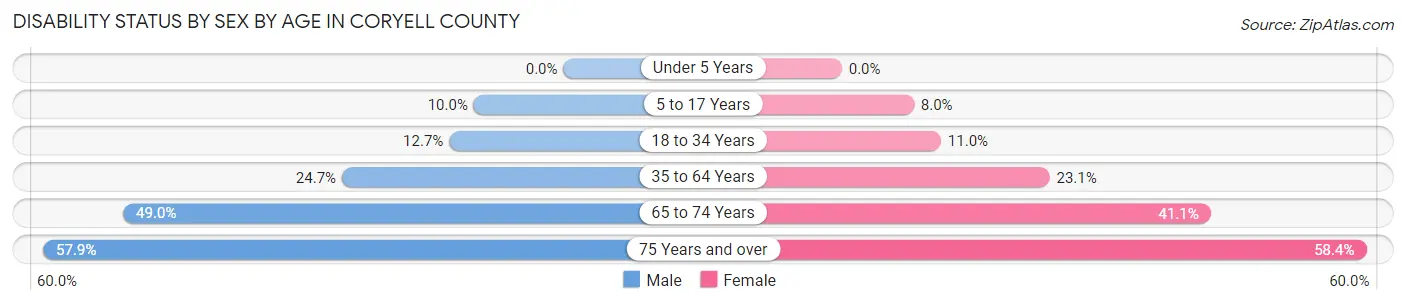
| Age Bracket | Male | Female |
| Under 5 Years | 0 (0.0%) | 0 (0.0%) |
| 5 to 17 Years | 677 (10.0%) | 524 (8.0%) |
| 18 to 34 Years | 754 (12.7%) | 972 (11.0%) |
| 35 to 64 Years | 2,567 (24.7%) | 2,498 (23.1%) |
| 65 to 74 Years | 1,161 (49.0%) | 1,179 (41.1%) |
| 75 Years and over | 777 (57.9%) | 1,164 (58.4%) |
Disability Class by Sex by Age in Coryell County
Disability Class: Hearing Difficulty
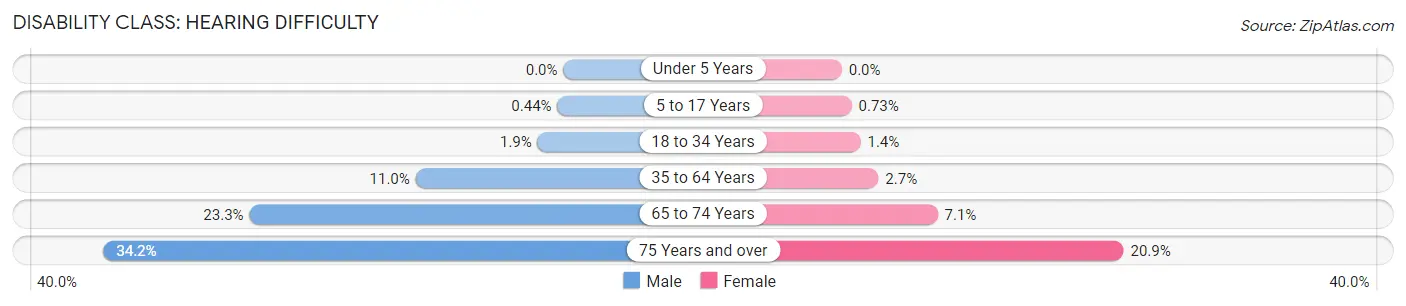
| Age Bracket | Male | Female |
| Under 5 Years | 0 (0.0%) | 0 (0.0%) |
| 5 to 17 Years | 30 (0.4%) | 48 (0.7%) |
| 18 to 34 Years | 113 (1.9%) | 122 (1.4%) |
| 35 to 64 Years | 1,142 (11.0%) | 294 (2.7%) |
| 65 to 74 Years | 552 (23.3%) | 204 (7.1%) |
| 75 Years and over | 458 (34.2%) | 417 (20.9%) |
Disability Class: Vision Difficulty
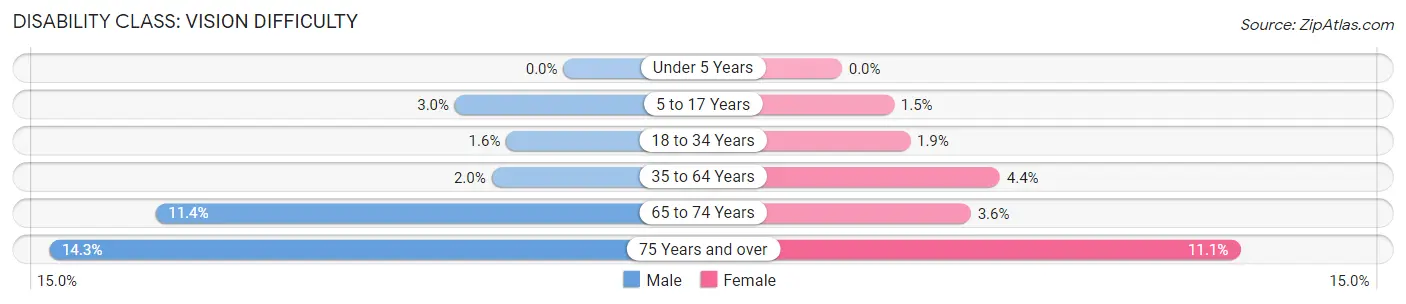
| Age Bracket | Male | Female |
| Under 5 Years | 0 (0.0%) | 0 (0.0%) |
| 5 to 17 Years | 205 (3.0%) | 95 (1.5%) |
| 18 to 34 Years | 94 (1.6%) | 167 (1.9%) |
| 35 to 64 Years | 208 (2.0%) | 475 (4.4%) |
| 65 to 74 Years | 269 (11.4%) | 103 (3.6%) |
| 75 Years and over | 192 (14.3%) | 221 (11.1%) |
Disability Class: Cognitive Difficulty
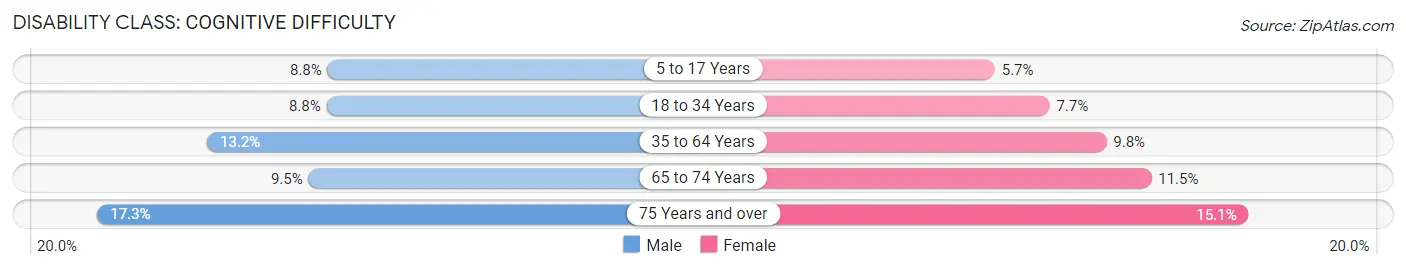
| Age Bracket | Male | Female |
| 5 to 17 Years | 593 (8.7%) | 371 (5.7%) |
| 18 to 34 Years | 521 (8.8%) | 679 (7.7%) |
| 35 to 64 Years | 1,377 (13.2%) | 1,060 (9.8%) |
| 65 to 74 Years | 224 (9.5%) | 330 (11.5%) |
| 75 Years and over | 232 (17.3%) | 301 (15.1%) |
Disability Class: Ambulatory Difficulty
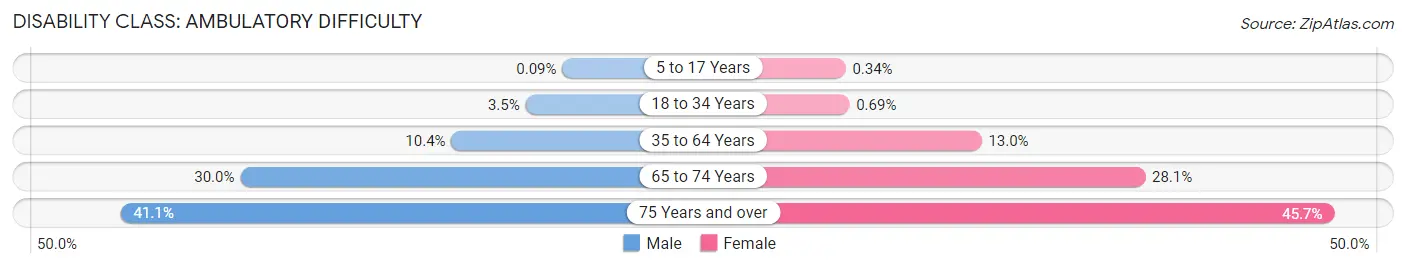
| Age Bracket | Male | Female |
| 5 to 17 Years | 6 (0.1%) | 22 (0.3%) |
| 18 to 34 Years | 208 (3.5%) | 61 (0.7%) |
| 35 to 64 Years | 1,082 (10.4%) | 1,399 (13.0%) |
| 65 to 74 Years | 710 (30.0%) | 808 (28.1%) |
| 75 Years and over | 551 (41.1%) | 911 (45.7%) |
Disability Class: Self-Care Difficulty
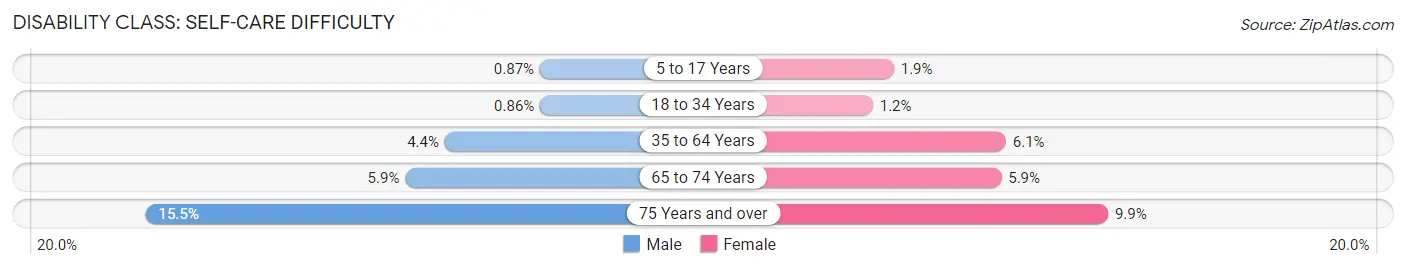
| Age Bracket | Male | Female |
| 5 to 17 Years | 59 (0.9%) | 126 (1.9%) |
| 18 to 34 Years | 51 (0.9%) | 101 (1.1%) |
| 35 to 64 Years | 458 (4.4%) | 657 (6.1%) |
| 65 to 74 Years | 139 (5.9%) | 170 (5.9%) |
| 75 Years and over | 208 (15.5%) | 197 (9.9%) |
Technology Access in Coryell County
Computing Device Access in Coryell County
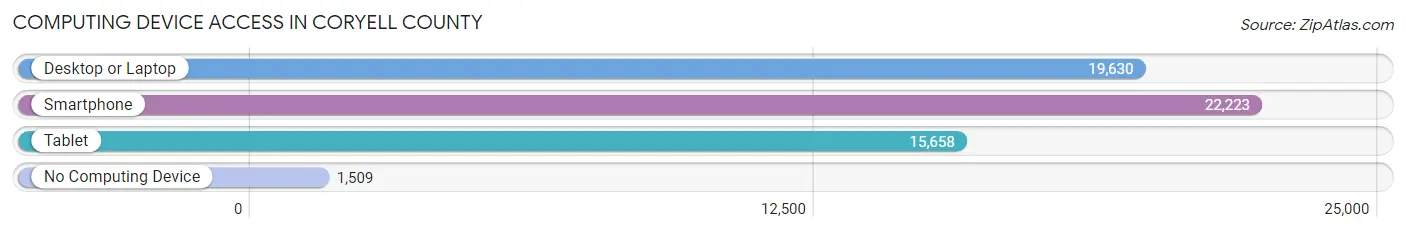
| Device Type | # Households | % Households |
| Desktop or Laptop | 19,630 | 78.0% |
| Smartphone | 22,223 | 88.3% |
| Tablet | 15,658 | 62.2% |
| No Computing Device | 1,509 | 6.0% |
| Total | 25,156 | 100.0% |
Internet Access in Coryell County
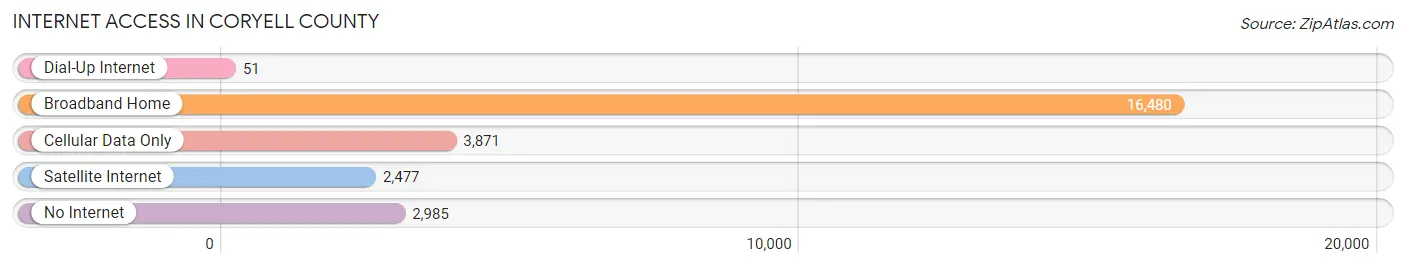
| Internet Type | # Households | % Households |
| Dial-Up Internet | 51 | 0.2% |
| Broadband Home | 16,480 | 65.5% |
| Cellular Data Only | 3,871 | 15.4% |
| Satellite Internet | 2,477 | 9.9% |
| No Internet | 2,985 | 11.9% |
| Total | 25,156 | 100.0% |
Coryell County Summary
Coryell County is located in Central Texas, in the heart of the state. It is bordered by Bell County to the north, Lampasas County to the east, Hamilton County to the south, and Bosque County to the west. The county seat is Gatesville, and the county is named for James Coryell, a Texas Ranger and early settler of the area.
History
The area that is now Coryell County was originally inhabited by the Tonkawa and Comanche Native American tribes. The first European settlers arrived in the area in the early 1840s, and the county was officially established in 1854. The county was named for James Coryell, a Texas Ranger and early settler of the area.
During the Civil War, Coryell County was divided in its loyalties, with some residents supporting the Confederacy and others supporting the Union. After the war, the county experienced a period of growth and development, with the establishment of several towns and the construction of the Gulf, Colorado and Santa Fe Railway.
Geography
Coryell County covers an area of 890 square miles, with a population of 75,388 as of the 2020 census. The county is located in Central Texas, and is bordered by Bell County to the north, Lampasas County to the east, Hamilton County to the south, and Bosque County to the west. The county seat is Gatesville, and the county is home to several small towns, including Copperas Cove, Evant, and Oglesby.
The county is mostly flat, with some rolling hills in the western part of the county. The county is drained by the Leon River, which flows through the county from north to south. The county is also home to several lakes, including Lake Belton, Lake Stillhouse Hollow, and Lake Waco.
Economy
Coryell County has a diverse economy, with a mix of agriculture, manufacturing, and services. The county is home to several large employers, including the Gatesville Independent School District, the Copperas Cove Independent School District, and the Fort Hood military base.
Agriculture is an important part of the county's economy, with the county producing a variety of crops, including cotton, corn, wheat, and hay. The county is also home to several livestock operations, including cattle, sheep, and goats.
Manufacturing is also an important part of the county's economy, with several large employers, including the Gatesville Manufacturing Company, the Copperas Cove Manufacturing Company, and the Evant Manufacturing Company.
Demographics
As of the 2020 census, Coryell County had a population of 75,388. The population is predominantly white (77.3%), with a small Hispanic population (17.2%) and a small African American population (2.2%). The median household income in the county is $50,945, and the median home value is $150,000.
Conclusion
Coryell County is located in Central Texas, and is bordered by Bell County to the north, Lampasas County to the east, Hamilton County to the south, and Bosque County to the west. The county has a diverse economy, with a mix of agriculture, manufacturing, and services. The population is predominantly white, with a small Hispanic population and a small African American population. The median household income in the county is $50,945, and the median home value is $150,000.
Common Questions
What is Per Capita Income in Coryell County?
Per Capita income in Coryell County is $26,699.
What is the Median Family Income in Coryell County?
Median Family Income in Coryell County is $70,217.
What is the Median Household income in Coryell County?
Median Household Income in Coryell County is $63,281.
What is Income or Wage Gap in Coryell County?
Income or Wage Gap in Coryell County is 22.6%.
Women in Coryell County earn 77.4 cents for every dollar earned by a man.
What is Family Income Deficit in Coryell County?
Family Income Deficit in Coryell County is $10,216.
Families that are below poverty line in Coryell County earn $10,216 less on average than the poverty threshold level.
What is Inequality or Gini Index in Coryell County?
Inequality or Gini Index in Coryell County is 0.41.
What is the Total Population of Coryell County?
Total Population of Coryell County is 82,927.
What is the Total Male Population of Coryell County?
Total Male Population of Coryell County is 42,084.
What is the Total Female Population of Coryell County?
Total Female Population of Coryell County is 40,843.
What is the Ratio of Males per 100 Females in Coryell County?
There are 103.04 Males per 100 Females in Coryell County.
What is the Ratio of Females per 100 Males in Coryell County?
There are 97.05 Females per 100 Males in Coryell County.
What is the Median Population Age in Coryell County?
Median Population Age in Coryell County is 32.2 Years.
What is the Average Family Size in Coryell County
Average Family Size in Coryell County is 3.2 People.
What is the Average Household Size in Coryell County
Average Household Size in Coryell County is 2.7 People.
How Large is the Labor Force in Coryell County?
There are 36,920 People in the Labor Forcein in Coryell County.
What is the Percentage of People in the Labor Force in Coryell County?
55.9% of People are in the Labor Force in Coryell County.
What is the Unemployment Rate in Coryell County?
Unemployment Rate in Coryell County is 7.1%.