Cooke County, TX Map & Demographics
Cooke County Map
Cooke County Overview
$36,275
PER CAPITA INCOME
$85,134
AVG FAMILY INCOME
$66,374
AVG HOUSEHOLD INCOME
28.9%
WAGE / INCOME GAP [ % ]
71.1¢/ $1
WAGE / INCOME GAP [ $ ]
$8,803
FAMILY INCOME DEFICIT
0.45
INEQUALITY / GINI INDEX
41,860
TOTAL POPULATION
20,838
MALE POPULATION
21,022
FEMALE POPULATION
99.12
MALES / 100 FEMALES
100.88
FEMALES / 100 MALES
40.4
MEDIAN AGE
3.0
AVG FAMILY SIZE
2.5
AVG HOUSEHOLD SIZE
20,854
LABOR FORCE [ PEOPLE ]
62.8%
PERCENT IN LABOR FORCE
3.9%
UNEMPLOYMENT RATE
Cooke County Area Codes
Income in Cooke County
Income Overview in Cooke County
Per Capita Income in Cooke County is $36,275, while median incomes of families and households are $85,134 and $66,374 respectively.
| Characteristic | Number | Measure |
| Per Capita Income | 41,860 | $36,275 |
| Median Family Income | 11,504 | $85,134 |
| Mean Family Income | 11,504 | $110,551 |
| Median Household Income | 16,196 | $66,374 |
| Mean Household Income | 16,196 | $93,118 |
| Income Deficit | 11,504 | $8,803 |
| Wage / Income Gap (%) | 41,860 | 28.93% |
| Wage / Income Gap ($) | 41,860 | 71.07¢ per $1 |
| Gini / Inequality Index | 41,860 | 0.45 |
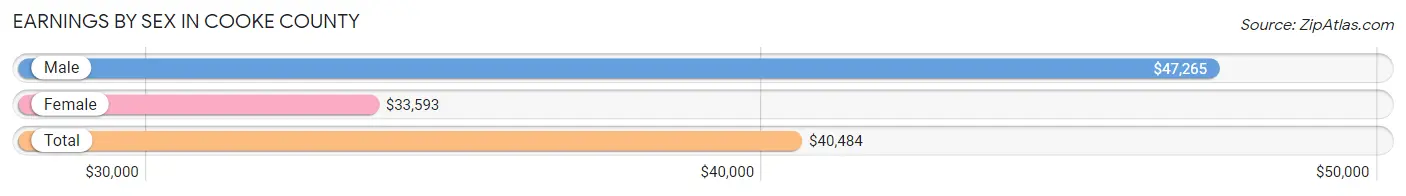
Earnings by Sex in Cooke County
Average Earnings in Cooke County are $40,484, $47,265 for men and $33,593 for women, a difference of 28.9%.
| Sex | Number | Average Earnings |
| Male | 11,977 (54.5%) | $47,265 |
| Female | 9,991 (45.5%) | $33,593 |
| Total | 21,968 (100.0%) | $40,484 |
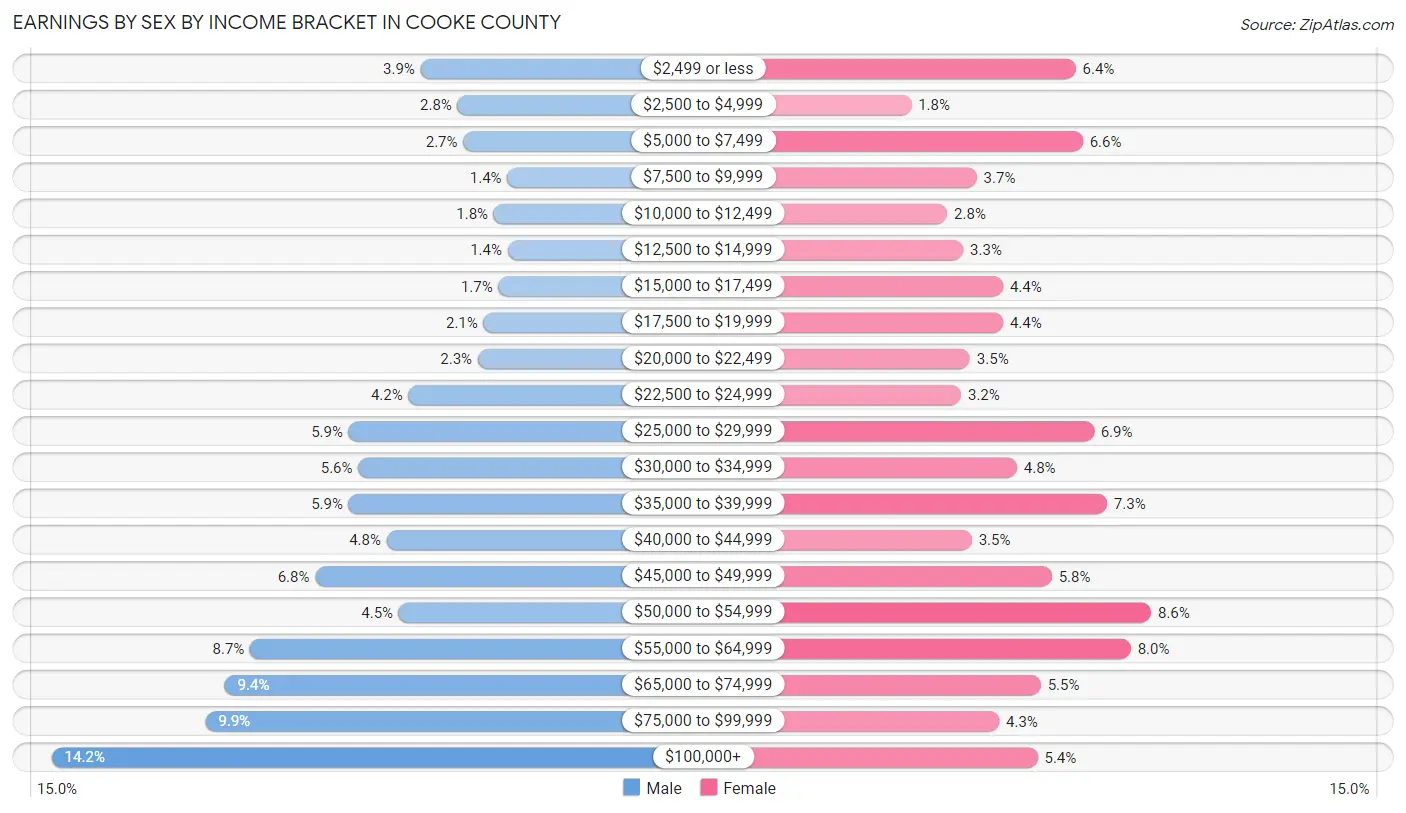
Earnings by Sex by Income Bracket in Cooke County
The most common earnings brackets in Cooke County are $100,000+ for men (1,705 | 14.2%) and $50,000 to $54,999 for women (854 | 8.6%).
| Income | Male | Female |
| $2,499 or less | 463 (3.9%) | 642 (6.4%) |
| $2,500 to $4,999 | 339 (2.8%) | 181 (1.8%) |
| $5,000 to $7,499 | 320 (2.7%) | 662 (6.6%) |
| $7,500 to $9,999 | 171 (1.4%) | 365 (3.6%) |
| $10,000 to $12,499 | 217 (1.8%) | 282 (2.8%) |
| $12,500 to $14,999 | 170 (1.4%) | 327 (3.3%) |
| $15,000 to $17,499 | 201 (1.7%) | 439 (4.4%) |
| $17,500 to $19,999 | 251 (2.1%) | 439 (4.4%) |
| $20,000 to $22,499 | 271 (2.3%) | 346 (3.5%) |
| $22,500 to $24,999 | 504 (4.2%) | 321 (3.2%) |
| $25,000 to $29,999 | 706 (5.9%) | 693 (6.9%) |
| $30,000 to $34,999 | 673 (5.6%) | 478 (4.8%) |
| $35,000 to $39,999 | 706 (5.9%) | 730 (7.3%) |
| $40,000 to $44,999 | 577 (4.8%) | 351 (3.5%) |
| $45,000 to $49,999 | 818 (6.8%) | 575 (5.8%) |
| $50,000 to $54,999 | 537 (4.5%) | 854 (8.6%) |
| $55,000 to $64,999 | 1,037 (8.7%) | 797 (8.0%) |
| $65,000 to $74,999 | 1,123 (9.4%) | 545 (5.4%) |
| $75,000 to $99,999 | 1,188 (9.9%) | 428 (4.3%) |
| $100,000+ | 1,705 (14.2%) | 536 (5.4%) |
| Total | 11,977 (100.0%) | 9,991 (100.0%) |
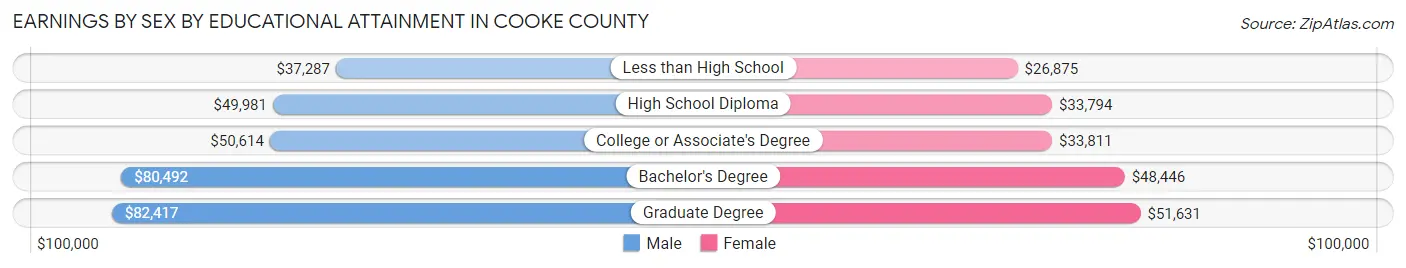
Earnings by Sex by Educational Attainment in Cooke County
Average earnings in Cooke County are $52,010 for men and $37,875 for women, a difference of 27.2%. Men with an educational attainment of graduate degree enjoy the highest average annual earnings of $82,417, while those with less than high school education earn the least with $37,287. Women with an educational attainment of graduate degree earn the most with the average annual earnings of $51,631, while those with less than high school education have the smallest earnings of $26,875.
| Educational Attainment | Male Income | Female Income |
| Less than High School | $37,287 | $26,875 |
| High School Diploma | $49,981 | $33,794 |
| College or Associate's Degree | $50,614 | $33,811 |
| Bachelor's Degree | $80,492 | $48,446 |
| Graduate Degree | $82,417 | $51,631 |
| Total | $52,010 | $37,875 |
Family Income in Cooke County
Family Income Brackets in Cooke County
According to the Cooke County family income data, there are 2,496 families falling into the $100,000 to $149,999 income range, which is the most common income bracket and makes up 21.7% of all families. Conversely, the $10,000 to $14,999 income bracket is the least frequent group with only 196 families (1.7%) belonging to this category.
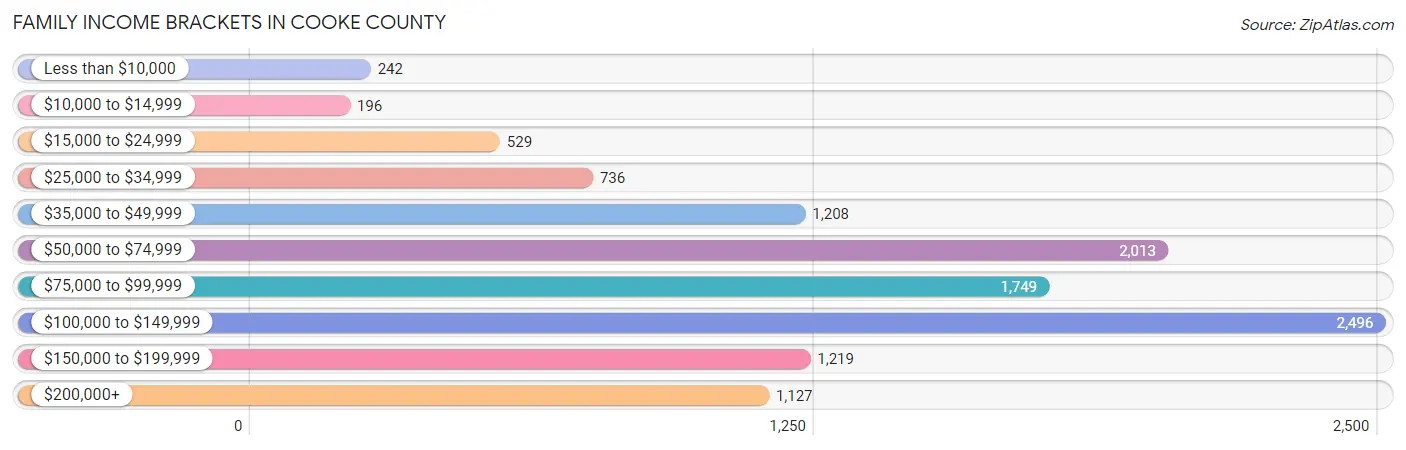
| Income Bracket | # Families | % Families |
| Less than $10,000 | 242 | 2.1% |
| $10,000 to $14,999 | 196 | 1.7% |
| $15,000 to $24,999 | 529 | 4.6% |
| $25,000 to $34,999 | 736 | 6.4% |
| $35,000 to $49,999 | 1,208 | 10.5% |
| $50,000 to $74,999 | 2,013 | 17.5% |
| $75,000 to $99,999 | 1,749 | 15.2% |
| $100,000 to $149,999 | 2,496 | 21.7% |
| $150,000 to $199,999 | 1,219 | 10.6% |
| $200,000+ | 1,127 | 9.8% |
Family Income by Famaliy Size in Cooke County
6-person families (306 | 2.7%) account for the highest median family income in Cooke County with $113,125 per family, while 2-person families (5,742 | 49.9%) have the highest median income of $39,910 per family member.
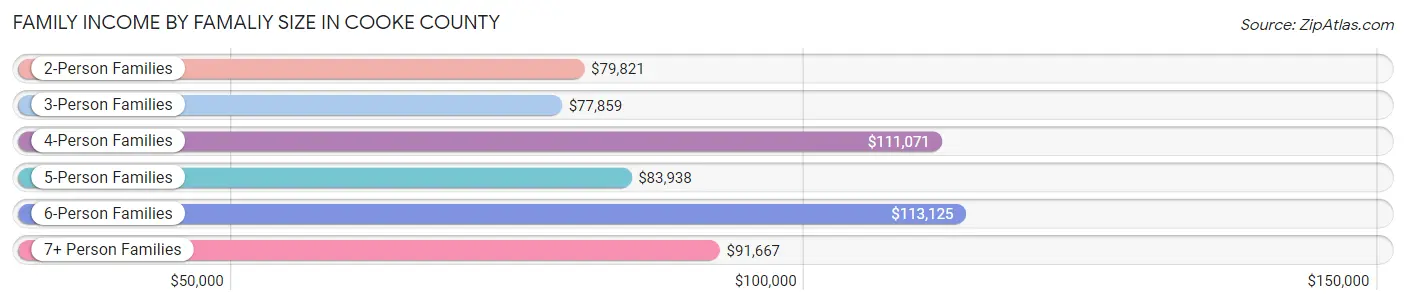
| Income Bracket | # Families | Median Income |
| 2-Person Families | 5,742 (49.9%) | $79,821 |
| 3-Person Families | 2,289 (19.9%) | $77,859 |
| 4-Person Families | 1,840 (16.0%) | $111,071 |
| 5-Person Families | 1,009 (8.8%) | $83,938 |
| 6-Person Families | 306 (2.7%) | $113,125 |
| 7+ Person Families | 318 (2.8%) | $91,667 |
| Total | 11,504 (100.0%) | $85,134 |
Family Income by Number of Earners in Cooke County
The median family income in Cooke County is $85,134, with families comprising 3+ earners (1,250) having the highest median family income of $137,475, while families with 1 earner (4,084) have the lowest median family income of $54,444, accounting for 10.9% and 35.5% of families, respectively.
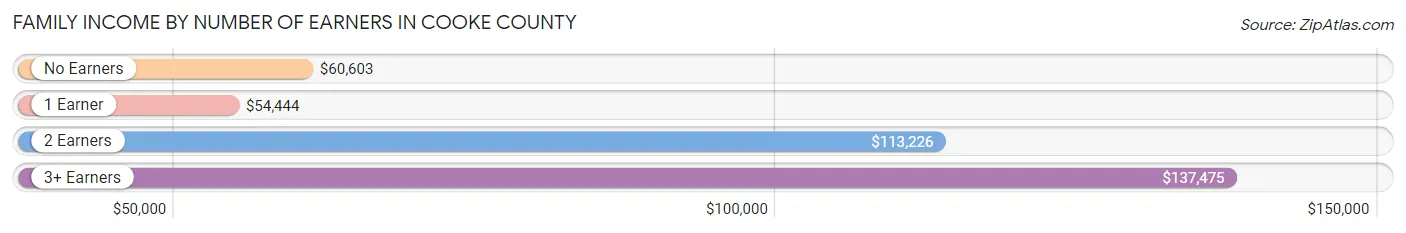
| Number of Earners | # Families | Median Income |
| No Earners | 1,612 (14.0%) | $60,603 |
| 1 Earner | 4,084 (35.5%) | $54,444 |
| 2 Earners | 4,558 (39.6%) | $113,226 |
| 3+ Earners | 1,250 (10.9%) | $137,475 |
| Total | 11,504 (100.0%) | $85,134 |
Household Income in Cooke County
Household Income Brackets in Cooke County
With 2,996 households falling in the category, the $50,000 to $74,999 income range is the most frequent in Cooke County, accounting for 18.5% of all households. In contrast, only 518 households (3.2%) fall into the less than $10,000 income bracket, making it the least populous group.
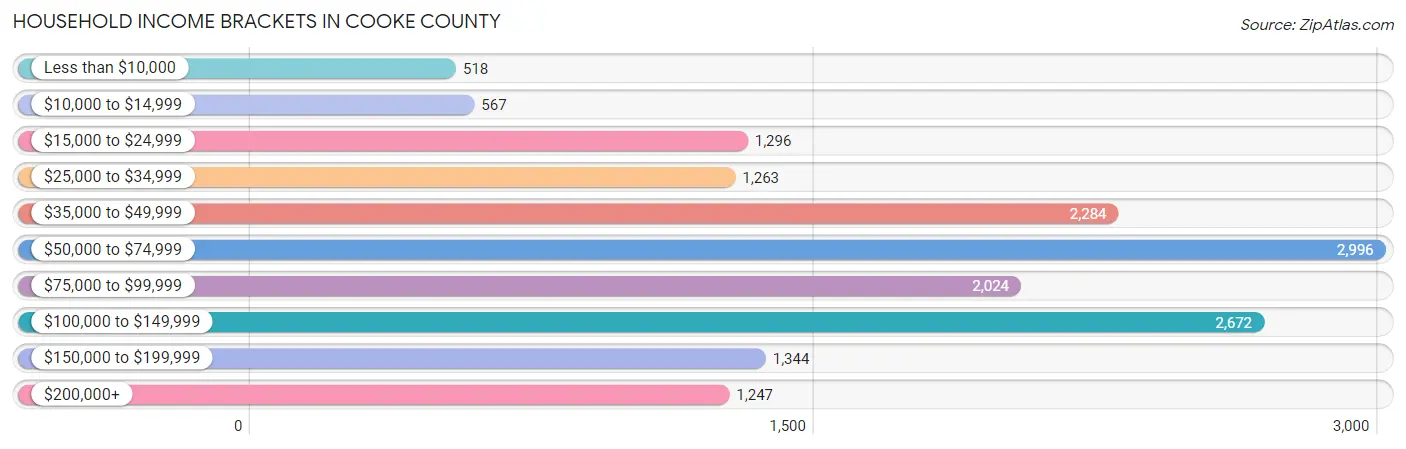
| Income Bracket | # Households | % Households |
| Less than $10,000 | 518 | 3.2% |
| $10,000 to $14,999 | 567 | 3.5% |
| $15,000 to $24,999 | 1,296 | 8.0% |
| $25,000 to $34,999 | 1,263 | 7.8% |
| $35,000 to $49,999 | 2,284 | 14.1% |
| $50,000 to $74,999 | 2,996 | 18.5% |
| $75,000 to $99,999 | 2,024 | 12.5% |
| $100,000 to $149,999 | 2,672 | 16.5% |
| $150,000 to $199,999 | 1,344 | 8.3% |
| $200,000+ | 1,247 | 7.7% |
Household Income by Householder Age in Cooke County
The median household income in Cooke County is $66,374, with the highest median household income of $86,559 found in the 45 to 64 years age bracket for the primary householder. A total of 6,036 households (37.3%) fall into this category. Meanwhile, the 15 to 24 years age bracket for the primary householder has the lowest median household income of $51,127, with 610 households (3.8%) in this group.
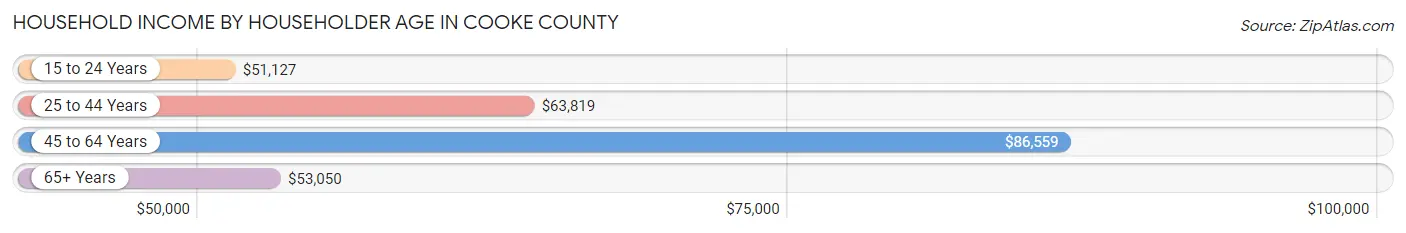
| Income Bracket | # Households | Median Income |
| 15 to 24 Years | 610 (3.8%) | $51,127 |
| 25 to 44 Years | 4,948 (30.5%) | $63,819 |
| 45 to 64 Years | 6,036 (37.3%) | $86,559 |
| 65+ Years | 4,602 (28.4%) | $53,050 |
| Total | 16,196 (100.0%) | $66,374 |
Poverty in Cooke County
Income Below Poverty by Sex and Age in Cooke County
With 12.1% poverty level for males and 14.5% for females among the residents of Cooke County, 16 and 17 year old males and 5 year old females are the most vulnerable to poverty, with 143 males (30.8%) and 155 females (41.3%) in their respective age groups living below the poverty level.
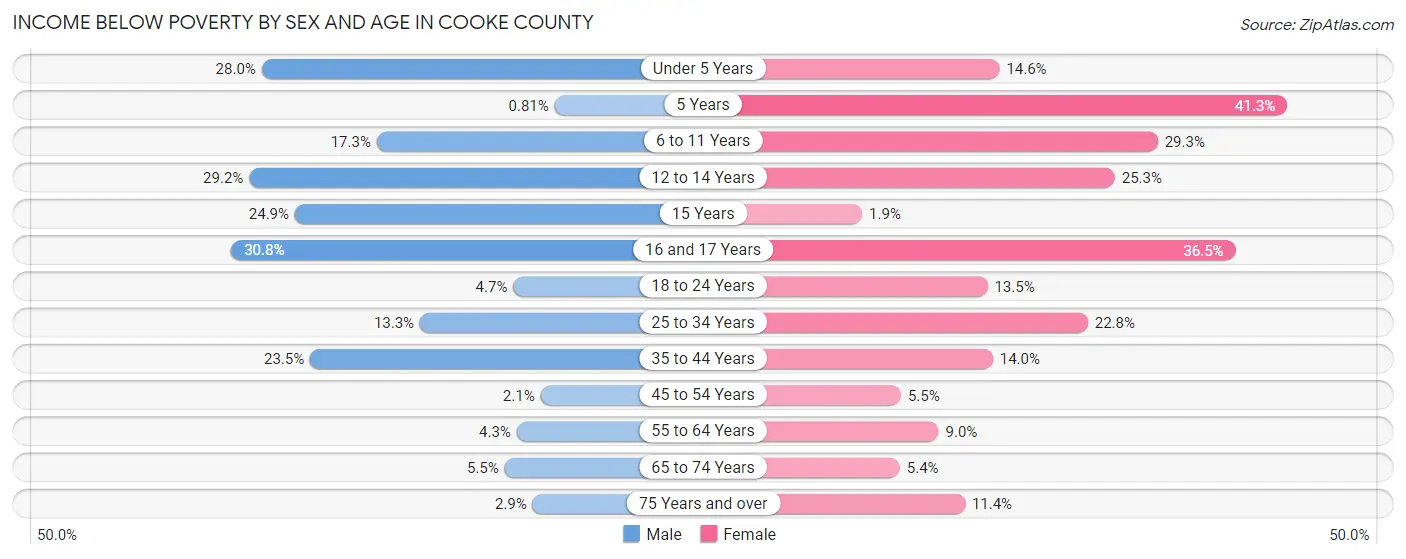
| Age Bracket | Male | Female |
| Under 5 Years | 378 (28.0%) | 176 (14.6%) |
| 5 Years | 1 (0.8%) | 155 (41.3%) |
| 6 to 11 Years | 297 (17.3%) | 468 (29.3%) |
| 12 to 14 Years | 247 (29.2%) | 169 (25.3%) |
| 15 Years | 81 (24.9%) | 5 (1.9%) |
| 16 and 17 Years | 143 (30.8%) | 160 (36.5%) |
| 18 to 24 Years | 84 (4.6%) | 230 (13.5%) |
| 25 to 34 Years | 315 (13.3%) | 587 (22.8%) |
| 35 to 44 Years | 591 (23.5%) | 332 (14.0%) |
| 45 to 54 Years | 51 (2.1%) | 136 (5.5%) |
| 55 to 64 Years | 126 (4.3%) | 265 (9.0%) |
| 65 to 74 Years | 125 (5.4%) | 127 (5.4%) |
| 75 Years and over | 38 (2.9%) | 192 (11.4%) |
| Total | 2,477 (12.1%) | 3,002 (14.5%) |
Income Above Poverty by Sex and Age in Cooke County
According to the poverty statistics in Cooke County, males aged 5 years and females aged 15 years are the age groups that are most secure financially, with 99.2% of males and 98.1% of females in these age groups living above the poverty line.
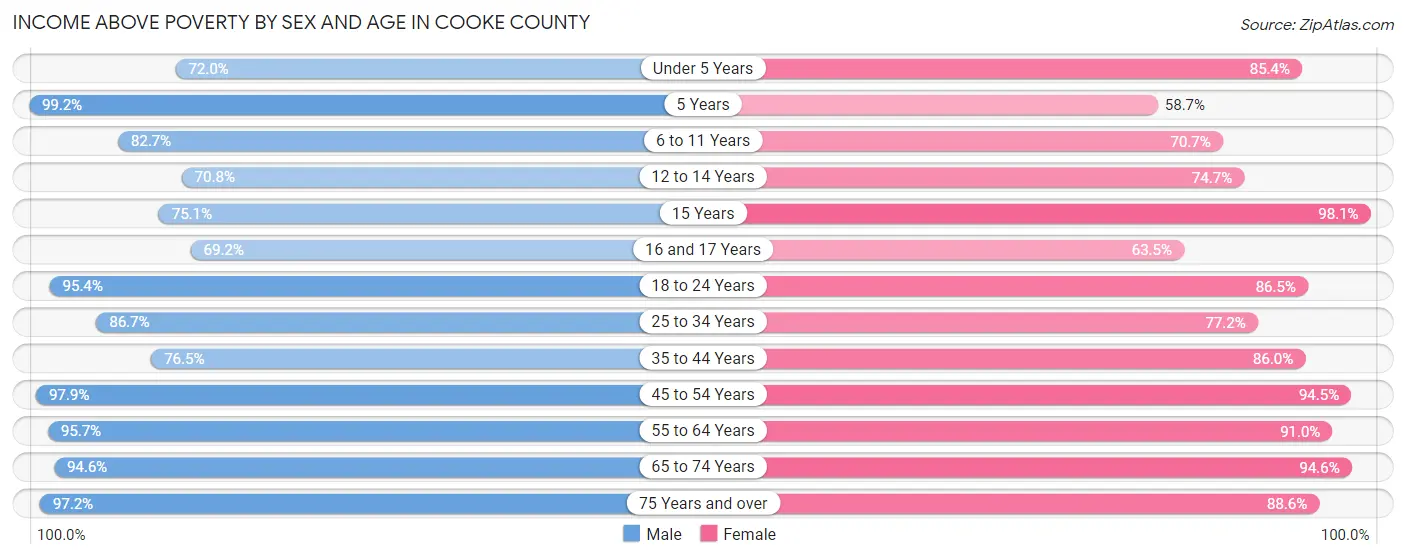
| Age Bracket | Male | Female |
| Under 5 Years | 972 (72.0%) | 1,027 (85.4%) |
| 5 Years | 123 (99.2%) | 220 (58.7%) |
| 6 to 11 Years | 1,418 (82.7%) | 1,128 (70.7%) |
| 12 to 14 Years | 600 (70.8%) | 498 (74.7%) |
| 15 Years | 244 (75.1%) | 260 (98.1%) |
| 16 and 17 Years | 321 (69.2%) | 278 (63.5%) |
| 18 to 24 Years | 1,724 (95.4%) | 1,471 (86.5%) |
| 25 to 34 Years | 2,051 (86.7%) | 1,984 (77.2%) |
| 35 to 44 Years | 1,923 (76.5%) | 2,038 (86.0%) |
| 45 to 54 Years | 2,354 (97.9%) | 2,339 (94.5%) |
| 55 to 64 Years | 2,786 (95.7%) | 2,687 (91.0%) |
| 65 to 74 Years | 2,167 (94.6%) | 2,231 (94.6%) |
| 75 Years and over | 1,296 (97.2%) | 1,488 (88.6%) |
| Total | 17,979 (87.9%) | 17,649 (85.5%) |
Income Below Poverty Among Married-Couple Families in Cooke County
The poverty statistics for married-couple families in Cooke County show that 5.3% or 482 of the total 9,030 families live below the poverty line. Families with 5 or more children have the highest poverty rate of 36.7%, comprising of 54 families. On the other hand, families with no children have the lowest poverty rate of 1.7%, which includes 92 families.
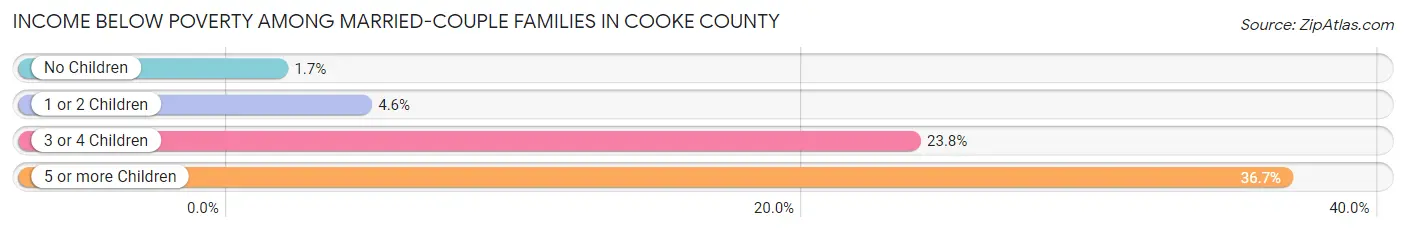
| Children | Above Poverty | Below Poverty |
| No Children | 5,245 (98.3%) | 92 (1.7%) |
| 1 or 2 Children | 2,526 (95.4%) | 123 (4.6%) |
| 3 or 4 Children | 684 (76.2%) | 213 (23.7%) |
| 5 or more Children | 93 (63.3%) | 54 (36.7%) |
| Total | 8,548 (94.7%) | 482 (5.3%) |
Income Below Poverty Among Single-Parent Households in Cooke County
According to the poverty data in Cooke County, 32.2% or 247 single-father households and 23.0% or 393 single-mother households are living below the poverty line. Among single-father households, those with 5 or more children have the highest poverty rate, with 13 households (86.7%) experiencing poverty. Likewise, among single-mother households, those with 3 or 4 children have the highest poverty rate, with 181 households (77.3%) falling below the poverty line.
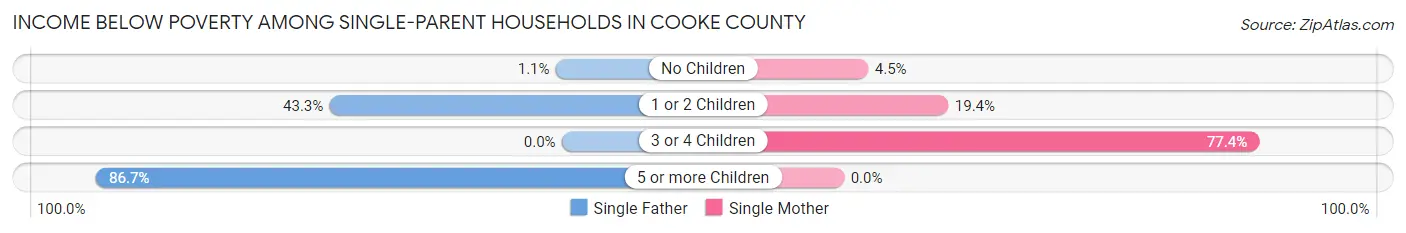
| Children | Single Father | Single Mother |
| No Children | 2 (1.1%) | 22 (4.5%) |
| 1 or 2 Children | 232 (43.3%) | 190 (19.4%) |
| 3 or 4 Children | 0 (0.0%) | 181 (77.3%) |
| 5 or more Children | 13 (86.7%) | 0 (0.0%) |
| Total | 247 (32.2%) | 393 (23.0%) |
Income Below Poverty Among Married-Couple vs Single-Parent Households in Cooke County
The poverty data for Cooke County shows that 482 of the married-couple family households (5.3%) and 640 of the single-parent households (25.9%) are living below the poverty level. Within the married-couple family households, those with 5 or more children have the highest poverty rate, with 54 households (36.7%) falling below the poverty line. Among the single-parent households, those with 3 or 4 children have the highest poverty rate, with 181 household (65.6%) living below poverty.
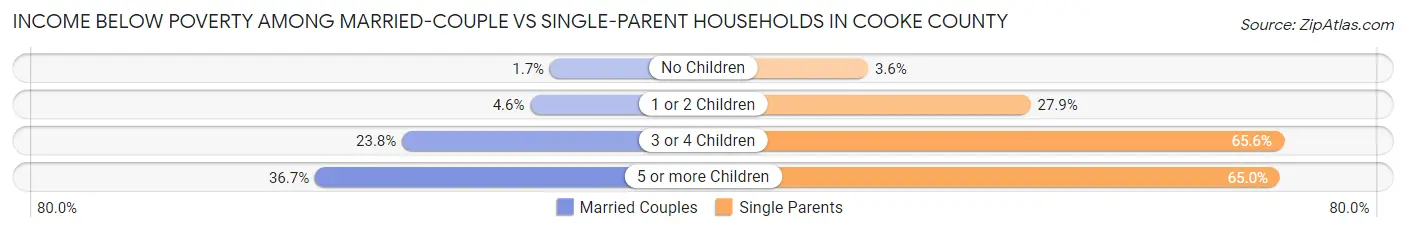
| Children | Married-Couple Families | Single-Parent Households |
| No Children | 92 (1.7%) | 24 (3.6%) |
| 1 or 2 Children | 123 (4.6%) | 422 (27.9%) |
| 3 or 4 Children | 213 (23.7%) | 181 (65.6%) |
| 5 or more Children | 54 (36.7%) | 13 (65.0%) |
| Total | 482 (5.3%) | 640 (25.9%) |
Race in Cooke County
The most populous races in Cooke County are White / Caucasian (34,831 | 83.2%), Hispanic or Latino (7,967 | 19.0%), and Two or more Races (4,136 | 9.9%).
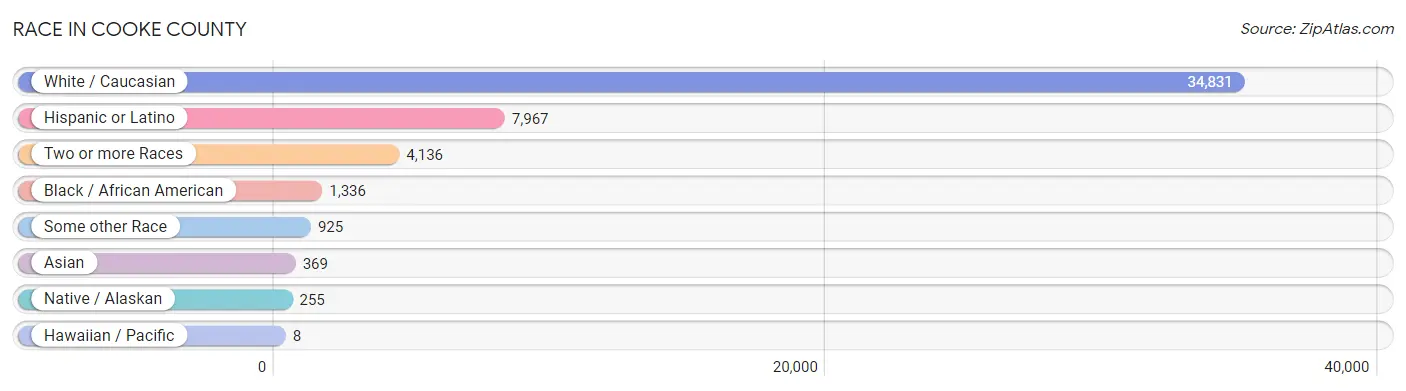
| Race | # Population | % Population |
| Asian | 369 | 0.9% |
| Black / African American | 1,336 | 3.2% |
| Hawaiian / Pacific | 8 | 0.0% |
| Hispanic or Latino | 7,967 | 19.0% |
| Native / Alaskan | 255 | 0.6% |
| White / Caucasian | 34,831 | 83.2% |
| Two or more Races | 4,136 | 9.9% |
| Some other Race | 925 | 2.2% |
| Total | 41,860 | 100.0% |
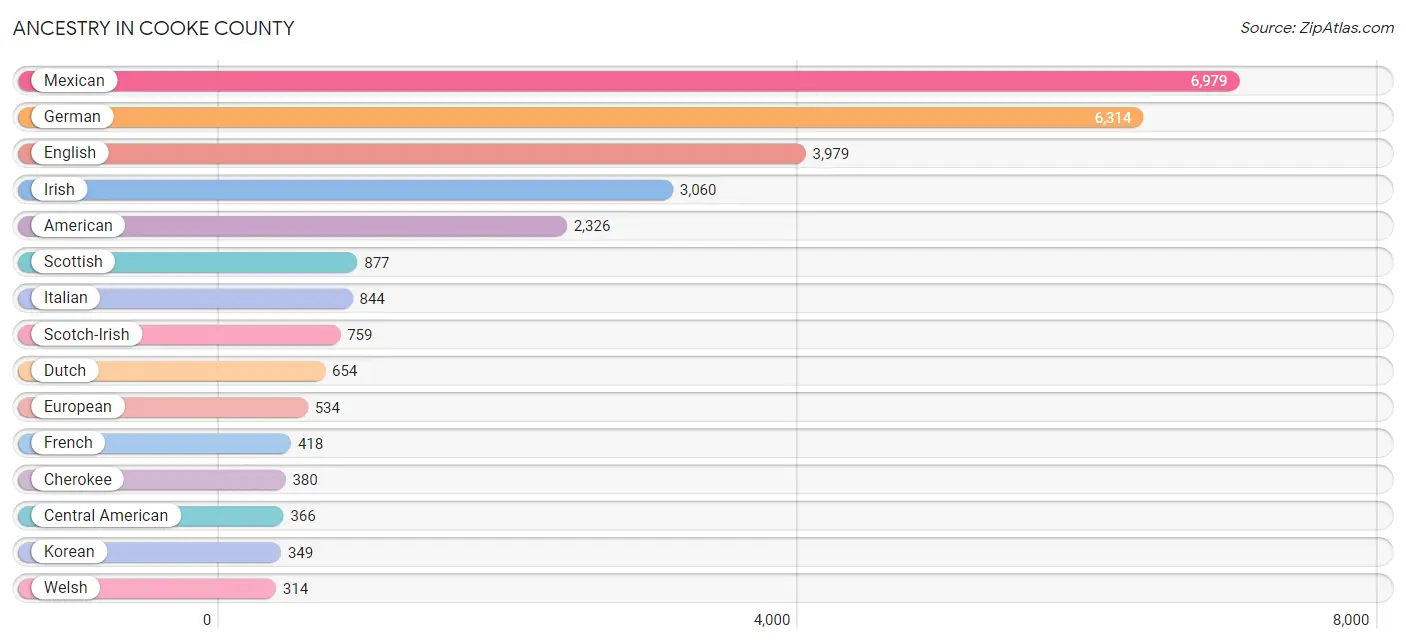
Ancestry in Cooke County
The most populous ancestries reported in Cooke County are Mexican (6,979 | 16.7%), German (6,314 | 15.1%), English (3,979 | 9.5%), Irish (3,060 | 7.3%), and American (2,326 | 5.6%), together accounting for 54.1% of all Cooke County residents.
| Ancestry | # Population | % Population |
| African | 10 | 0.0% |
| American | 2,326 | 5.6% |
| Apache | 41 | 0.1% |
| Austrian | 17 | 0.0% |
| Basque | 4 | 0.0% |
| Bhutanese | 11 | 0.0% |
| Blackfeet | 23 | 0.1% |
| Brazilian | 135 | 0.3% |
| British | 147 | 0.4% |
| Bulgarian | 9 | 0.0% |
| Burmese | 6 | 0.0% |
| Cajun | 16 | 0.0% |
| Canadian | 19 | 0.1% |
| Central American | 366 | 0.9% |
| Central American Indian | 61 | 0.2% |
| Cherokee | 380 | 0.9% |
| Chickasaw | 82 | 0.2% |
| Chippewa | 2 | 0.0% |
| Choctaw | 34 | 0.1% |
| Colombian | 17 | 0.0% |
| Comanche | 18 | 0.0% |
| Creek | 17 | 0.0% |
| Croatian | 14 | 0.0% |
| Czech | 68 | 0.2% |
| Danish | 74 | 0.2% |
| Dutch | 654 | 1.6% |
| Dutch West Indian | 27 | 0.1% |
| Eastern European | 55 | 0.1% |
| English | 3,979 | 9.5% |
| European | 534 | 1.3% |
| Finnish | 2 | 0.0% |
| French | 418 | 1.0% |
| French American Indian | 15 | 0.0% |
| French Canadian | 34 | 0.1% |
| German | 6,314 | 15.1% |
| Greek | 41 | 0.1% |
| Guatemalan | 187 | 0.4% |
| Honduran | 9 | 0.0% |
| Hungarian | 19 | 0.1% |
| Indian (Asian) | 32 | 0.1% |
| Irish | 3,060 | 7.3% |
| Italian | 844 | 2.0% |
| Jamaican | 3 | 0.0% |
| Japanese | 5 | 0.0% |
| Korean | 349 | 0.8% |
| Latvian | 38 | 0.1% |
| Lithuanian | 38 | 0.1% |
| Macedonian | 5 | 0.0% |
| Mexican | 6,979 | 16.7% |
| Mexican American Indian | 61 | 0.2% |
| Northern European | 16 | 0.0% |
| Norwegian | 148 | 0.4% |
| Osage | 21 | 0.1% |
| Pakistani | 15 | 0.0% |
| Pennsylvania German | 19 | 0.1% |
| Peruvian | 5 | 0.0% |
| Polish | 290 | 0.7% |
| Portuguese | 41 | 0.1% |
| Puerto Rican | 198 | 0.5% |
| Romanian | 11 | 0.0% |
| Russian | 90 | 0.2% |
| Salvadoran | 170 | 0.4% |
| Scandinavian | 47 | 0.1% |
| Scotch-Irish | 759 | 1.8% |
| Scottish | 877 | 2.1% |
| Seminole | 15 | 0.0% |
| Slovene | 2 | 0.0% |
| South American | 39 | 0.1% |
| Spaniard | 230 | 0.5% |
| Spanish | 59 | 0.1% |
| Sri Lankan | 22 | 0.1% |
| Subsaharan African | 16 | 0.0% |
| Swedish | 262 | 0.6% |
| Swiss | 82 | 0.2% |
| Thai | 141 | 0.3% |
| Ukrainian | 128 | 0.3% |
| Venezuelan | 17 | 0.0% |
| Welsh | 314 | 0.7% | View All 78 Rows |
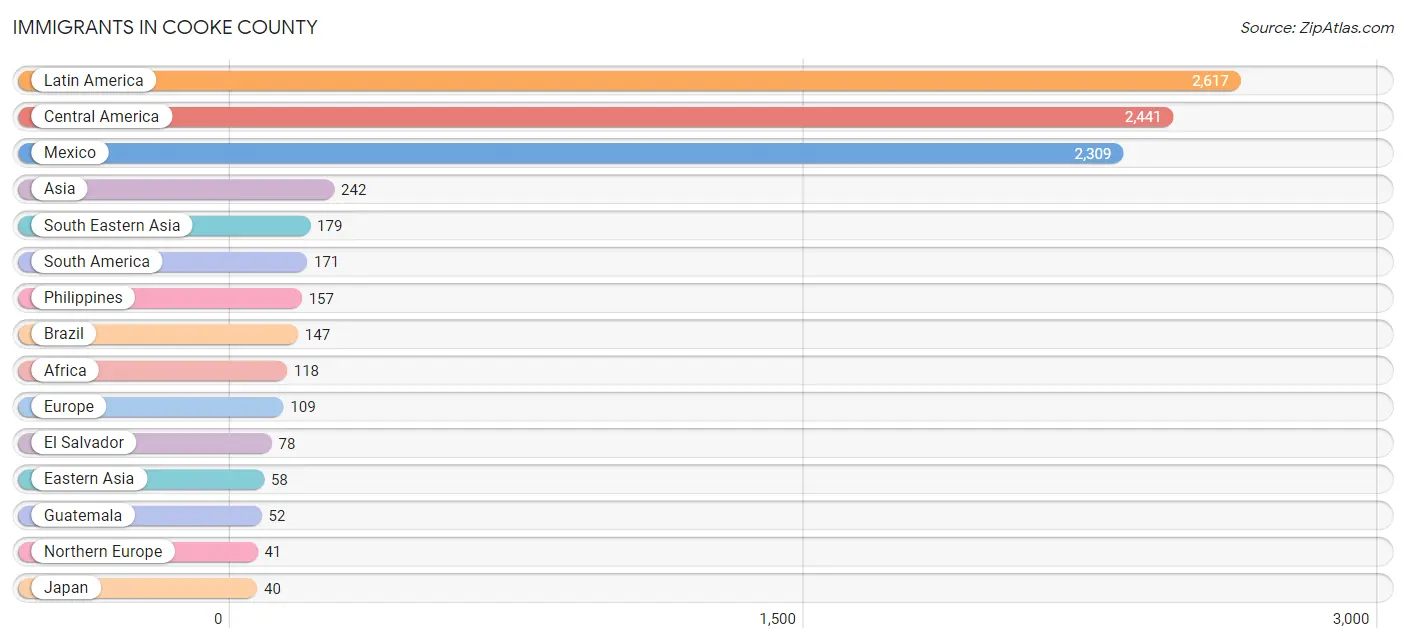
Immigrants in Cooke County
The most numerous immigrant groups reported in Cooke County came from Latin America (2,617 | 6.2%), Central America (2,441 | 5.8%), Mexico (2,309 | 5.5%), Asia (242 | 0.6%), and South Eastern Asia (179 | 0.4%), together accounting for 18.6% of all Cooke County residents.
| Immigration Origin | # Population | % Population |
| Africa | 118 | 0.3% |
| Asia | 242 | 0.6% |
| Brazil | 147 | 0.4% |
| Canada | 21 | 0.1% |
| Caribbean | 5 | 0.0% |
| Central America | 2,441 | 5.8% |
| Chile | 2 | 0.0% |
| China | 12 | 0.0% |
| Eastern Africa | 3 | 0.0% |
| Eastern Asia | 58 | 0.1% |
| Eastern Europe | 38 | 0.1% |
| El Salvador | 78 | 0.2% |
| Ethiopia | 3 | 0.0% |
| Europe | 109 | 0.3% |
| Germany | 30 | 0.1% |
| Guatemala | 52 | 0.1% |
| Honduras | 2 | 0.0% |
| Hong Kong | 12 | 0.0% |
| India | 5 | 0.0% |
| Ireland | 36 | 0.1% |
| Japan | 40 | 0.1% |
| Korea | 6 | 0.0% |
| Latin America | 2,617 | 6.2% |
| Mexico | 2,309 | 5.5% |
| Northern Europe | 41 | 0.1% |
| Peru | 5 | 0.0% |
| Philippines | 157 | 0.4% |
| Poland | 27 | 0.1% |
| Romania | 11 | 0.0% |
| South Africa | 8 | 0.0% |
| South America | 171 | 0.4% |
| South Central Asia | 5 | 0.0% |
| South Eastern Asia | 179 | 0.4% |
| Trinidad and Tobago | 2 | 0.0% |
| Venezuela | 17 | 0.0% |
| Vietnam | 22 | 0.1% |
| Western Europe | 30 | 0.1% | View All 37 Rows |
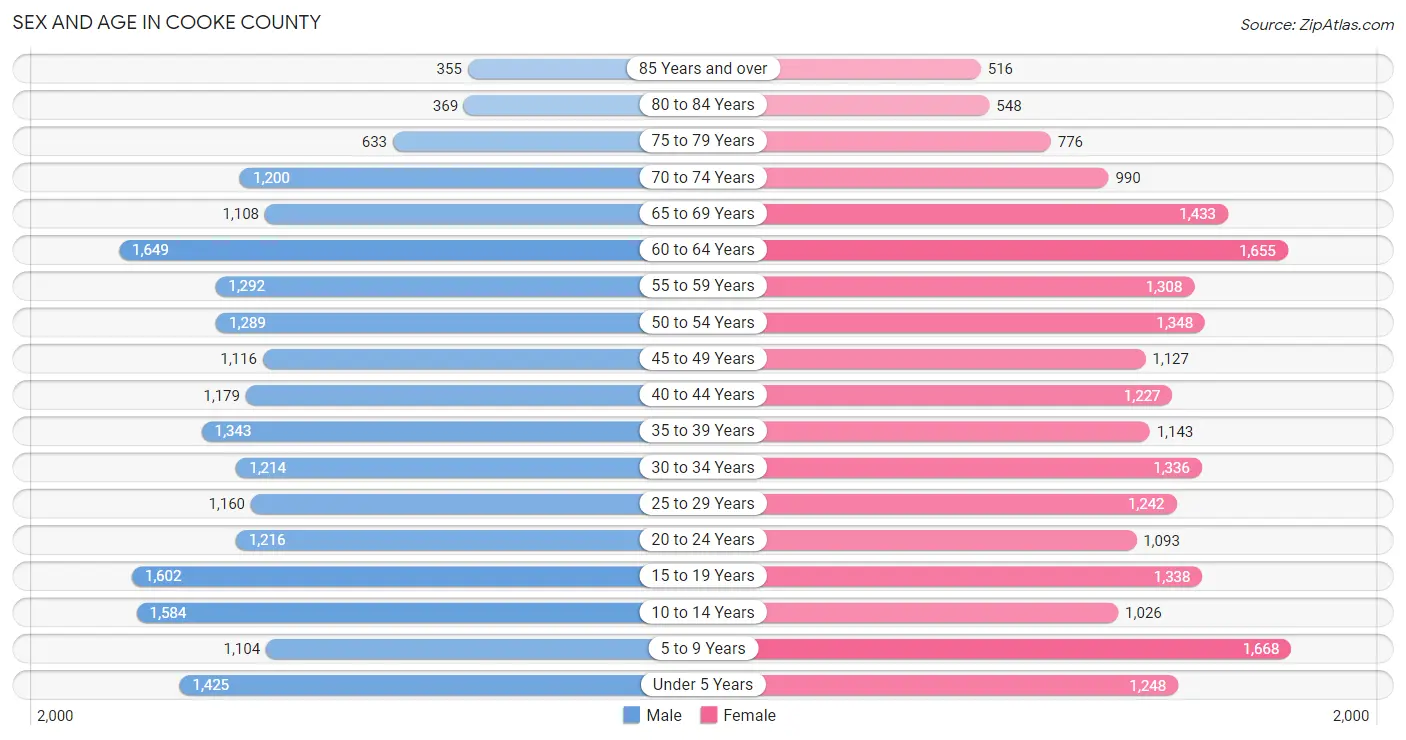
Sex and Age in Cooke County
Sex and Age in Cooke County
The most populous age groups in Cooke County are 60 to 64 Years (1,649 | 7.9%) for men and 5 to 9 Years (1,668 | 7.9%) for women.
| Age Bracket | Male | Female |
| Under 5 Years | 1,425 (6.8%) | 1,248 (5.9%) |
| 5 to 9 Years | 1,104 (5.3%) | 1,668 (7.9%) |
| 10 to 14 Years | 1,584 (7.6%) | 1,026 (4.9%) |
| 15 to 19 Years | 1,602 (7.7%) | 1,338 (6.4%) |
| 20 to 24 Years | 1,216 (5.8%) | 1,093 (5.2%) |
| 25 to 29 Years | 1,160 (5.6%) | 1,242 (5.9%) |
| 30 to 34 Years | 1,214 (5.8%) | 1,336 (6.4%) |
| 35 to 39 Years | 1,343 (6.4%) | 1,143 (5.4%) |
| 40 to 44 Years | 1,179 (5.7%) | 1,227 (5.8%) |
| 45 to 49 Years | 1,116 (5.4%) | 1,127 (5.4%) |
| 50 to 54 Years | 1,289 (6.2%) | 1,348 (6.4%) |
| 55 to 59 Years | 1,292 (6.2%) | 1,308 (6.2%) |
| 60 to 64 Years | 1,649 (7.9%) | 1,655 (7.9%) |
| 65 to 69 Years | 1,108 (5.3%) | 1,433 (6.8%) |
| 70 to 74 Years | 1,200 (5.8%) | 990 (4.7%) |
| 75 to 79 Years | 633 (3.0%) | 776 (3.7%) |
| 80 to 84 Years | 369 (1.8%) | 548 (2.6%) |
| 85 Years and over | 355 (1.7%) | 516 (2.5%) |
| Total | 20,838 (100.0%) | 21,022 (100.0%) |
Families and Households in Cooke County
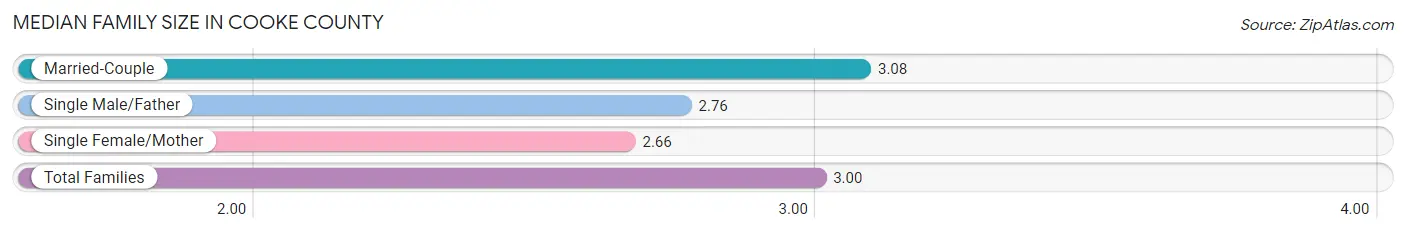
Median Family Size in Cooke County
The median family size in Cooke County is 3.00 persons per family, with married-couple families (9,030 | 78.5%) accounting for the largest median family size of 3.08 persons per family. On the other hand, single female/mother families (1,706 | 14.8%) represent the smallest median family size with 2.66 persons per family.
| Family Type | # Families | Family Size |
| Married-Couple | 9,030 (78.5%) | 3.08 |
| Single Male/Father | 768 (6.7%) | 2.76 |
| Single Female/Mother | 1,706 (14.8%) | 2.66 |
| Total Families | 11,504 (100.0%) | 3.00 |
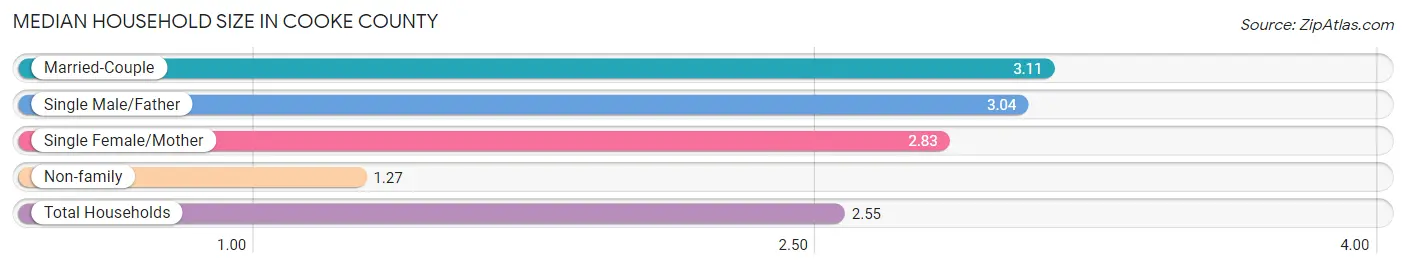
Median Household Size in Cooke County
The median household size in Cooke County is 2.55 persons per household, with married-couple households (9,030 | 55.7%) accounting for the largest median household size of 3.11 persons per household. non-family households (4,692 | 29.0%) represent the smallest median household size with 1.27 persons per household.
| Household Type | # Households | Household Size |
| Married-Couple | 9,030 (55.7%) | 3.11 |
| Single Male/Father | 768 (4.7%) | 3.04 |
| Single Female/Mother | 1,706 (10.5%) | 2.83 |
| Non-family | 4,692 (29.0%) | 1.27 |
| Total Households | 16,196 (100.0%) | 2.55 |
Household Size by Marriage Status in Cooke County
Out of a total of 16,196 households in Cooke County, 11,504 (71.0%) are family households, while 4,692 (29.0%) are nonfamily households. The most numerous type of family households are 2-person households, comprising 5,323, and the most common type of nonfamily households are 1-person households, comprising 3,843.
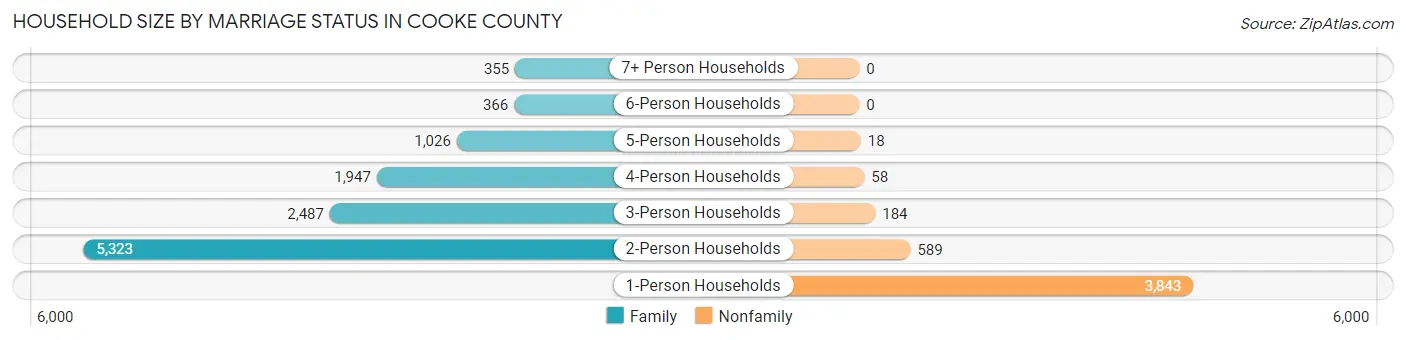
| Household Size | Family Households | Nonfamily Households |
| 1-Person Households | - | 3,843 (23.7%) |
| 2-Person Households | 5,323 (32.9%) | 589 (3.6%) |
| 3-Person Households | 2,487 (15.4%) | 184 (1.1%) |
| 4-Person Households | 1,947 (12.0%) | 58 (0.4%) |
| 5-Person Households | 1,026 (6.3%) | 18 (0.1%) |
| 6-Person Households | 366 (2.3%) | 0 (0.0%) |
| 7+ Person Households | 355 (2.2%) | 0 (0.0%) |
| Total | 11,504 (71.0%) | 4,692 (29.0%) |
Female Fertility in Cooke County
Fertility by Age in Cooke County
Average fertility rate in Cooke County is 58.0 births per 1,000 women. Women in the age bracket of 20 to 34 years have the highest fertility rate with 117.0 births per 1,000 women. Women in the age bracket of 20 to 34 years acount for 85.1% of all women with births.
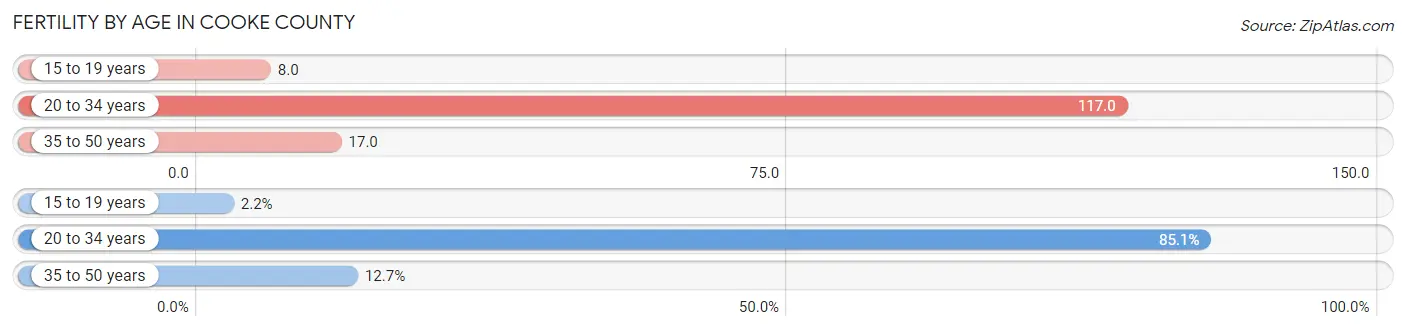
| Age Bracket | Women with Births | Births / 1,000 Women |
| 15 to 19 years | 11 (2.2%) | 8.0 |
| 20 to 34 years | 428 (85.1%) | 117.0 |
| 35 to 50 years | 64 (12.7%) | 17.0 |
| Total | 503 (100.0%) | 58.0 |
Fertility by Age by Marriage Status in Cooke County
58.1% of women with births (503) in Cooke County are married. The highest percentage of unmarried women with births falls into 15 to 19 years age bracket with 100.0% of them unmarried at the time of birth, while the lowest percentage of unmarried women with births belong to 35 to 50 years age bracket with 0.0% of them unmarried.
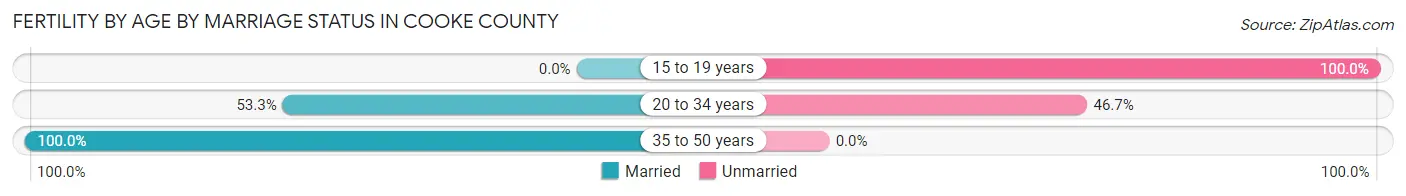
| Age Bracket | Married | Unmarried |
| 15 to 19 years | 0 (0.0%) | 11 (100.0%) |
| 20 to 34 years | 228 (53.3%) | 200 (46.7%) |
| 35 to 50 years | 64 (100.0%) | 0 (0.0%) |
| Total | 292 (58.1%) | 211 (41.9%) |
Fertility by Education in Cooke County
Average fertility rate in Cooke County is 58.0 births per 1,000 women. Women with the education attainment of college or associate's degree have the highest fertility rate of 96.0 births per 1,000 women, while women with the education attainment of bachelor's degree have the lowest fertility at 28.0 births per 1,000 women. Women with the education attainment of college or associate's degree represent 56.3% of all women with births.
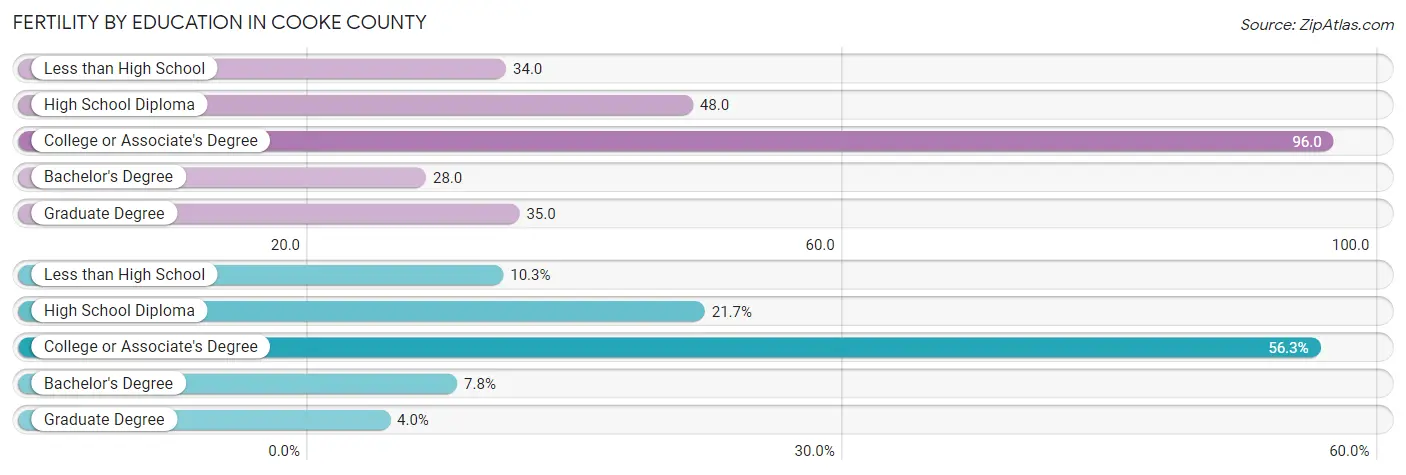
| Educational Attainment | Women with Births | Births / 1,000 Women |
| Less than High School | 52 (10.3%) | 34.0 |
| High School Diploma | 109 (21.7%) | 48.0 |
| College or Associate's Degree | 283 (56.3%) | 96.0 |
| Bachelor's Degree | 39 (7.7%) | 28.0 |
| Graduate Degree | 20 (4.0%) | 35.0 |
| Total | 503 (100.0%) | 58.0 |
Fertility by Education by Marriage Status in Cooke County
41.9% of women with births in Cooke County are unmarried. Women with the educational attainment of less than high school are most likely to be married with 100.0% of them married at childbirth, while women with the educational attainment of college or associate's degree are least likely to be married with 58.0% of them unmarried at childbirth.
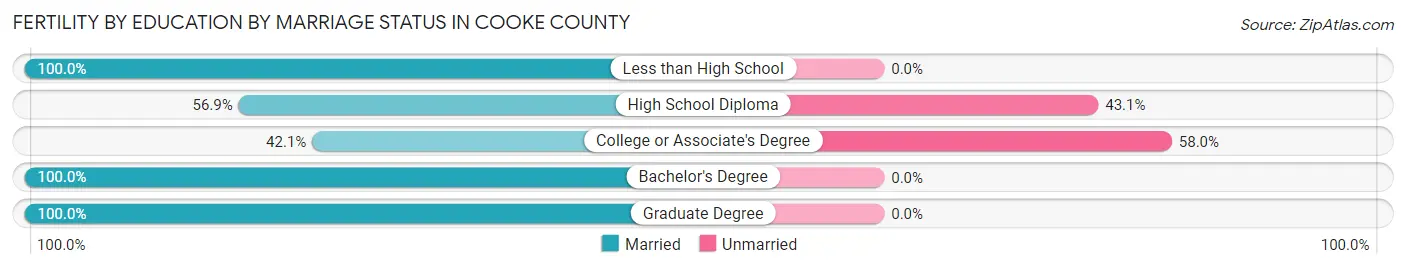
| Educational Attainment | Married | Unmarried |
| Less than High School | 52 (100.0%) | 0 (0.0%) |
| High School Diploma | 62 (56.9%) | 47 (43.1%) |
| College or Associate's Degree | 119 (42.0%) | 164 (58.0%) |
| Bachelor's Degree | 39 (100.0%) | 0 (0.0%) |
| Graduate Degree | 20 (100.0%) | 0 (0.0%) |
| Total | 292 (58.1%) | 211 (41.9%) |
Employment Characteristics in Cooke County
Employment by Class of Employer in Cooke County
Among the 19,886 employed individuals in Cooke County, private company employees (14,291 | 71.9%), local government employees (1,557 | 7.8%), and self-employed (not incorporated) (1,310 | 6.6%) make up the most common classes of employment.
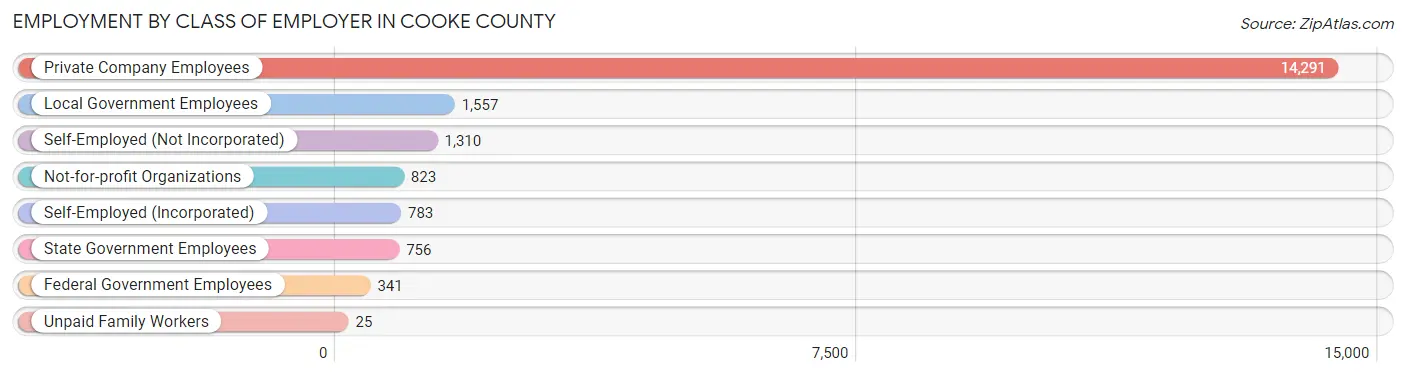
| Employer Class | # Employees | % Employees |
| Private Company Employees | 14,291 | 71.9% |
| Self-Employed (Incorporated) | 783 | 3.9% |
| Self-Employed (Not Incorporated) | 1,310 | 6.6% |
| Not-for-profit Organizations | 823 | 4.1% |
| Local Government Employees | 1,557 | 7.8% |
| State Government Employees | 756 | 3.8% |
| Federal Government Employees | 341 | 1.7% |
| Unpaid Family Workers | 25 | 0.1% |
| Total | 19,886 | 100.0% |
Employment Status by Age in Cooke County
According to the labor force statistics for Cooke County, out of the total population over 16 years of age (33,207), 62.8% or 20,854 individuals are in the labor force, with 3.9% or 813 of them unemployed. The age group with the highest labor force participation rate is 30 to 34 years, with 91.7% or 2,338 individuals in the labor force. Within the labor force, the 16 to 19 years age range has the highest percentage of unemployed individuals, with 15.1% or 161 of them being unemployed.
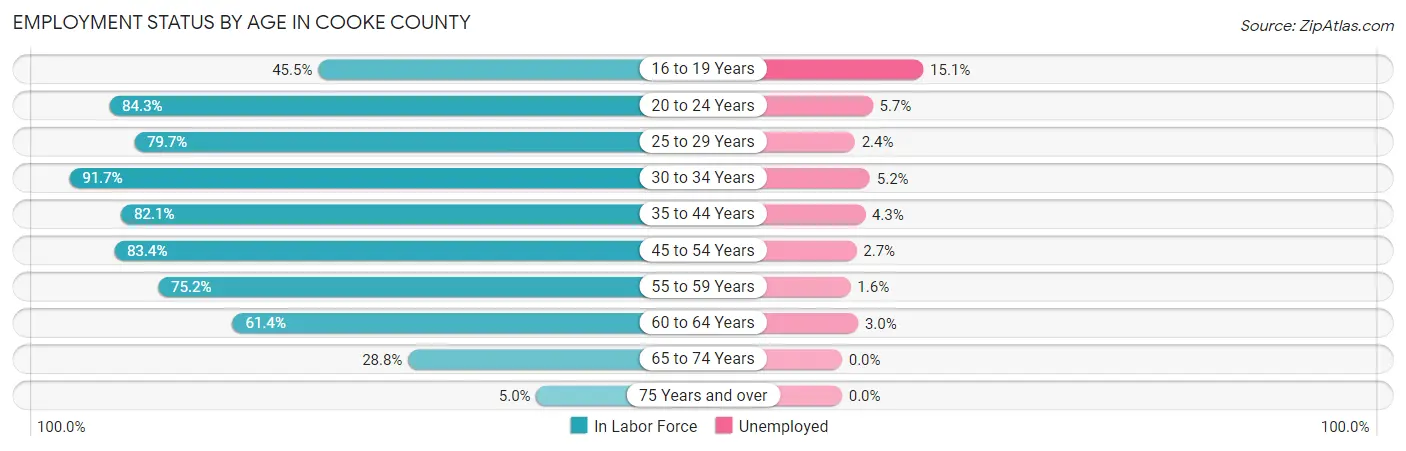
| Age Bracket | In Labor Force | Unemployed |
| 16 to 19 Years | 1,066 (45.5%) | 161 (15.1%) |
| 20 to 24 Years | 1,946 (84.3%) | 111 (5.7%) |
| 25 to 29 Years | 1,914 (79.7%) | 46 (2.4%) |
| 30 to 34 Years | 2,338 (91.7%) | 122 (5.2%) |
| 35 to 44 Years | 4,016 (82.1%) | 173 (4.3%) |
| 45 to 54 Years | 4,070 (83.4%) | 110 (2.7%) |
| 55 to 59 Years | 1,955 (75.2%) | 31 (1.6%) |
| 60 to 64 Years | 2,029 (61.4%) | 61 (3.0%) |
| 65 to 74 Years | 1,363 (28.8%) | 0 (0.0%) |
| 75 Years and over | 160 (5.0%) | 0 (0.0%) |
| Total | 20,854 (62.8%) | 813 (3.9%) |
Employment Status by Educational Attainment in Cooke County
According to labor force statistics for Cooke County, 79.1% of individuals (16,317) out of the total population between 25 and 64 years of age (20,628) are in the labor force, with 3.3% or 538 of them being unemployed. The group with the highest labor force participation rate are those with the educational attainment of bachelor's degree or higher, with 87.6% or 4,128 individuals in the labor force. Within the labor force, individuals with college / associate degree education have the highest percentage of unemployment, with 5.0% or 278 of them being unemployed.
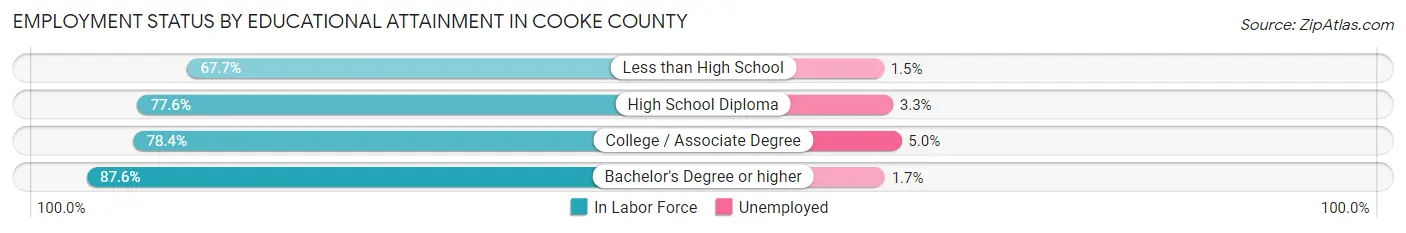
| Educational Attainment | In Labor Force | Unemployed |
| Less than High School | 1,425 (67.7%) | 32 (1.5%) |
| High School Diploma | 5,220 (77.6%) | 222 (3.3%) |
| College / Associate Degree | 5,554 (78.4%) | 354 (5.0%) |
| Bachelor's Degree or higher | 4,128 (87.6%) | 80 (1.7%) |
| Total | 16,317 (79.1%) | 681 (3.3%) |
Employment Occupations by Sex in Cooke County
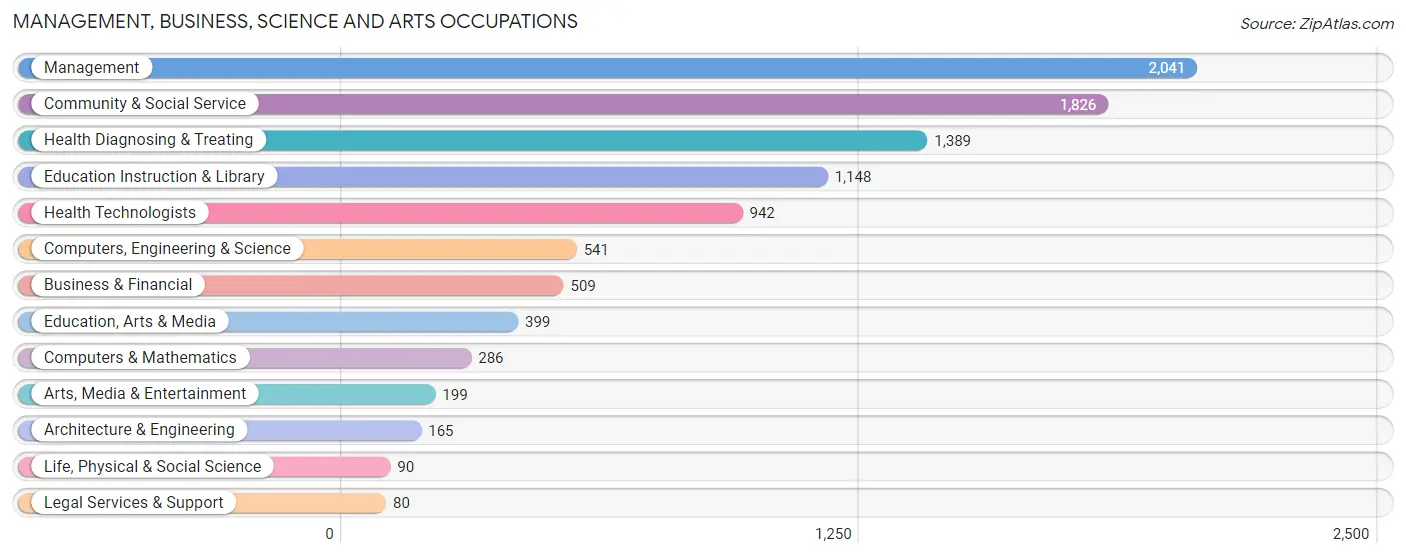
Management, Business, Science and Arts Occupations
The most common Management, Business, Science and Arts occupations in Cooke County are Management (2,041 | 10.2%), Community & Social Service (1,826 | 9.1%), Health Diagnosing & Treating (1,389 | 6.9%), Education Instruction & Library (1,148 | 5.7%), and Health Technologists (942 | 4.7%).
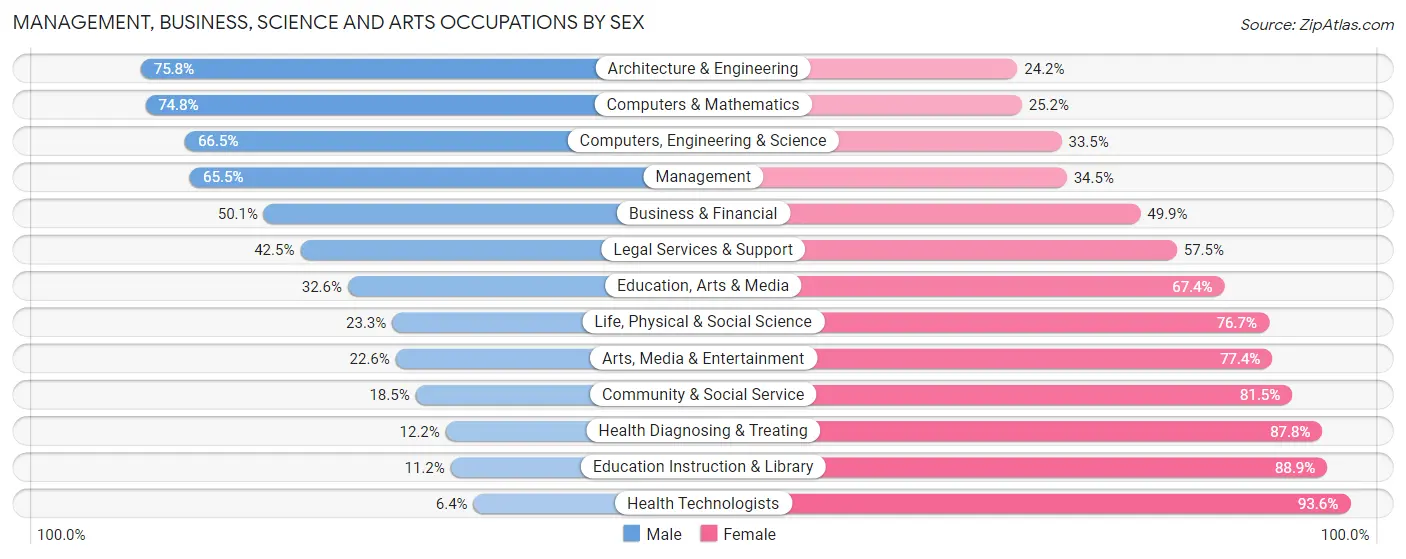
Management, Business, Science and Arts Occupations by Sex
Within the Management, Business, Science and Arts occupations in Cooke County, the most male-oriented occupations are Architecture & Engineering (75.8%), Computers & Mathematics (74.8%), and Computers, Engineering & Science (66.5%), while the most female-oriented occupations are Health Technologists (93.6%), Education Instruction & Library (88.8%), and Health Diagnosing & Treating (87.8%).
| Occupation | Male | Female |
| Management | 1,336 (65.5%) | 705 (34.5%) |
| Business & Financial | 255 (50.1%) | 254 (49.9%) |
| Computers, Engineering & Science | 360 (66.5%) | 181 (33.5%) |
| Computers & Mathematics | 214 (74.8%) | 72 (25.2%) |
| Architecture & Engineering | 125 (75.8%) | 40 (24.2%) |
| Life, Physical & Social Science | 21 (23.3%) | 69 (76.7%) |
| Community & Social Service | 337 (18.5%) | 1,489 (81.5%) |
| Education, Arts & Media | 130 (32.6%) | 269 (67.4%) |
| Legal Services & Support | 34 (42.5%) | 46 (57.5%) |
| Education Instruction & Library | 128 (11.2%) | 1,020 (88.8%) |
| Arts, Media & Entertainment | 45 (22.6%) | 154 (77.4%) |
| Health Diagnosing & Treating | 169 (12.2%) | 1,220 (87.8%) |
| Health Technologists | 60 (6.4%) | 882 (93.6%) |
| Total (Category) | 2,457 (39.0%) | 3,849 (61.0%) |
| Total (Overall) | 10,852 (54.1%) | 9,195 (45.9%) |
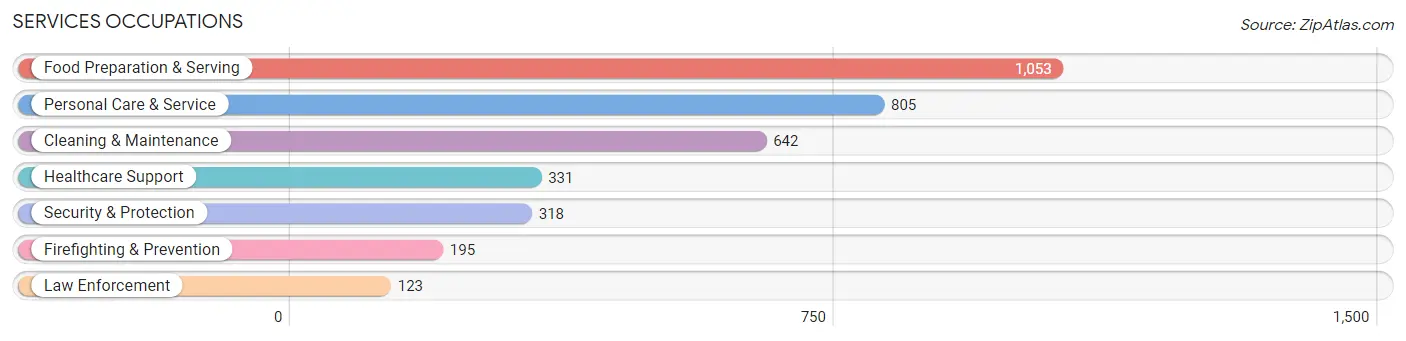
Services Occupations
The most common Services occupations in Cooke County are Food Preparation & Serving (1,053 | 5.2%), Personal Care & Service (805 | 4.0%), Cleaning & Maintenance (642 | 3.2%), Healthcare Support (331 | 1.7%), and Security & Protection (318 | 1.6%).
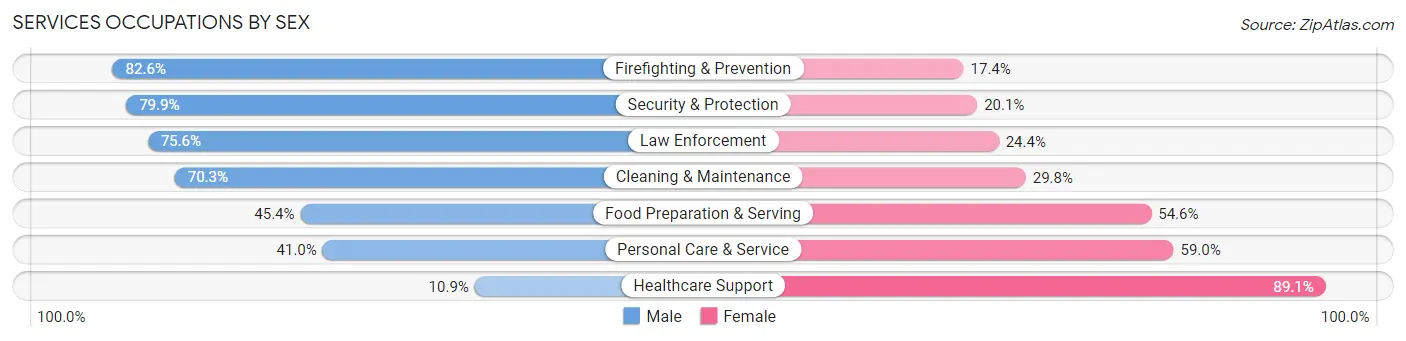
Services Occupations by Sex
Within the Services occupations in Cooke County, the most male-oriented occupations are Firefighting & Prevention (82.6%), Security & Protection (79.9%), and Law Enforcement (75.6%), while the most female-oriented occupations are Healthcare Support (89.1%), Personal Care & Service (59.0%), and Food Preparation & Serving (54.6%).
| Occupation | Male | Female |
| Healthcare Support | 36 (10.9%) | 295 (89.1%) |
| Security & Protection | 254 (79.9%) | 64 (20.1%) |
| Firefighting & Prevention | 161 (82.6%) | 34 (17.4%) |
| Law Enforcement | 93 (75.6%) | 30 (24.4%) |
| Food Preparation & Serving | 478 (45.4%) | 575 (54.6%) |
| Cleaning & Maintenance | 451 (70.3%) | 191 (29.7%) |
| Personal Care & Service | 330 (41.0%) | 475 (59.0%) |
| Total (Category) | 1,549 (49.2%) | 1,600 (50.8%) |
| Total (Overall) | 10,852 (54.1%) | 9,195 (45.9%) |
Sales and Office Occupations
The most common Sales and Office occupations in Cooke County are Office & Administration (2,304 | 11.5%), and Sales & Related (1,507 | 7.5%).

Sales and Office Occupations by Sex
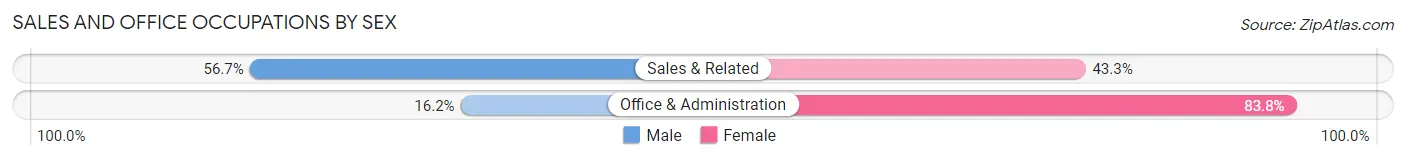
| Occupation | Male | Female |
| Sales & Related | 855 (56.7%) | 652 (43.3%) |
| Office & Administration | 373 (16.2%) | 1,931 (83.8%) |
| Total (Category) | 1,228 (32.2%) | 2,583 (67.8%) |
| Total (Overall) | 10,852 (54.1%) | 9,195 (45.9%) |
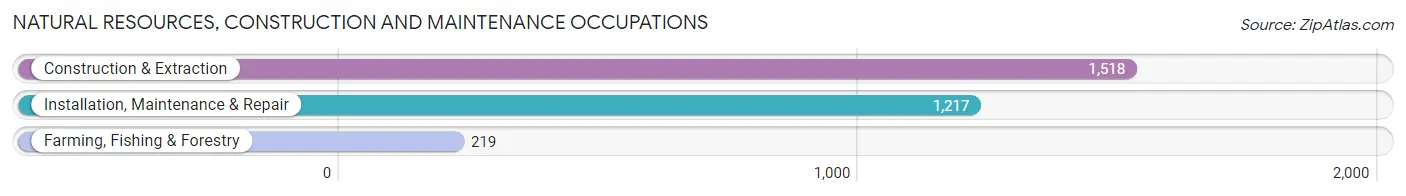
Natural Resources, Construction and Maintenance Occupations
The most common Natural Resources, Construction and Maintenance occupations in Cooke County are Construction & Extraction (1,518 | 7.6%), Installation, Maintenance & Repair (1,217 | 6.1%), and Farming, Fishing & Forestry (219 | 1.1%).
Natural Resources, Construction and Maintenance Occupations by Sex
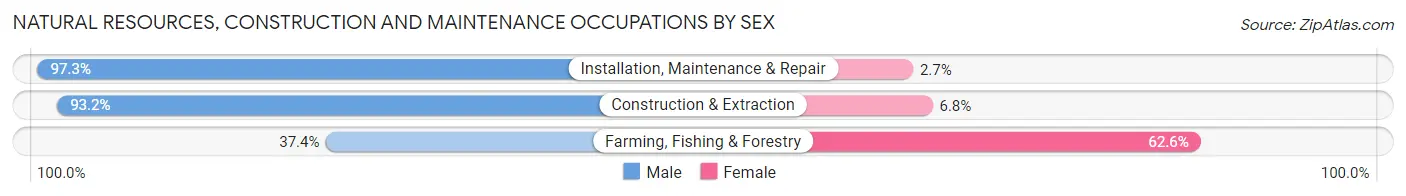
| Occupation | Male | Female |
| Farming, Fishing & Forestry | 82 (37.4%) | 137 (62.6%) |
| Construction & Extraction | 1,415 (93.2%) | 103 (6.8%) |
| Installation, Maintenance & Repair | 1,184 (97.3%) | 33 (2.7%) |
| Total (Category) | 2,681 (90.8%) | 273 (9.2%) |
| Total (Overall) | 10,852 (54.1%) | 9,195 (45.9%) |
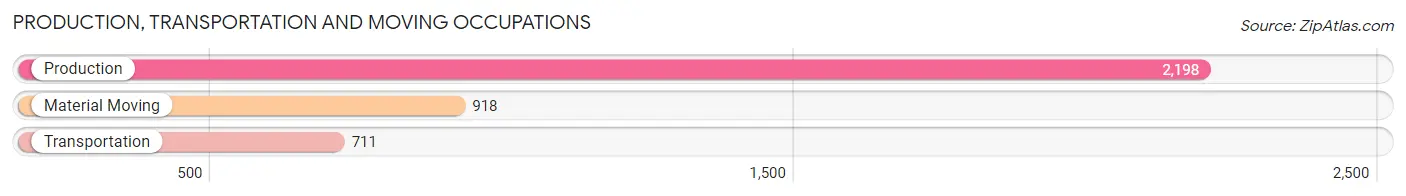
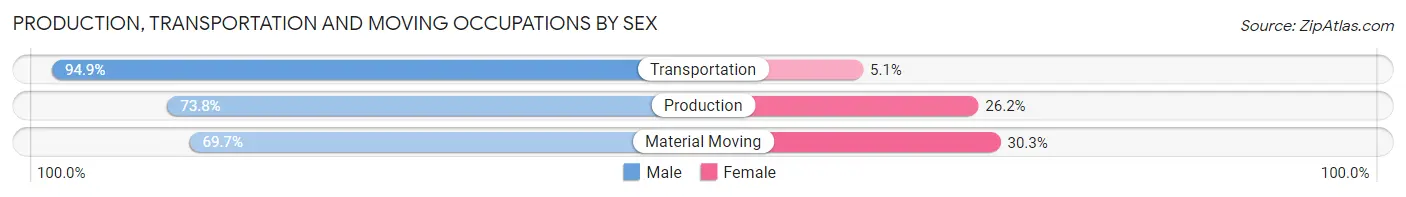
Production, Transportation and Moving Occupations
The most common Production, Transportation and Moving occupations in Cooke County are Production (2,198 | 11.0%), Material Moving (918 | 4.6%), and Transportation (711 | 3.5%).
Production, Transportation and Moving Occupations by Sex
| Occupation | Male | Female |
| Production | 1,622 (73.8%) | 576 (26.2%) |
| Transportation | 675 (94.9%) | 36 (5.1%) |
| Material Moving | 640 (69.7%) | 278 (30.3%) |
| Total (Category) | 2,937 (76.7%) | 890 (23.3%) |
| Total (Overall) | 10,852 (54.1%) | 9,195 (45.9%) |
Employment Industries by Sex in Cooke County
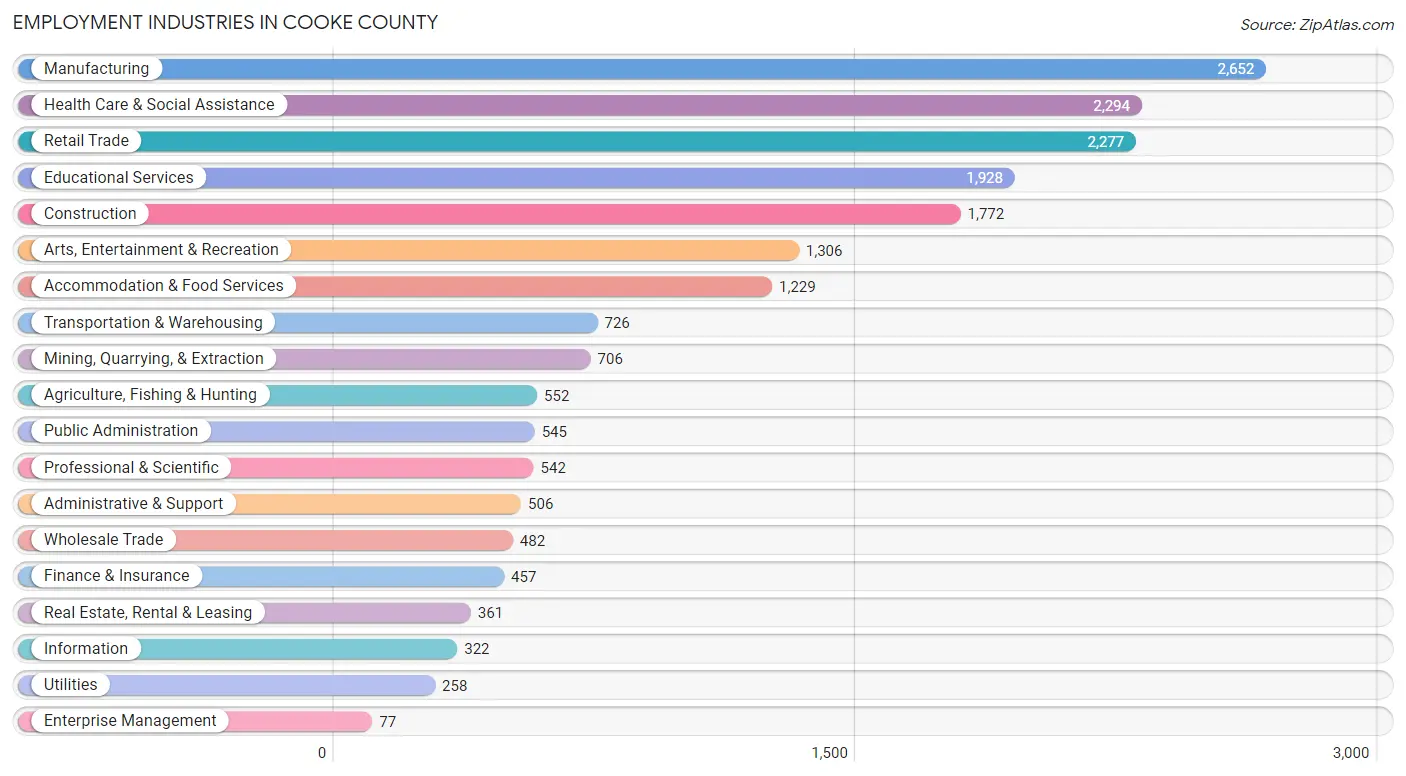
Employment Industries in Cooke County
The major employment industries in Cooke County include Manufacturing (2,652 | 13.2%), Health Care & Social Assistance (2,294 | 11.4%), Retail Trade (2,277 | 11.4%), Educational Services (1,928 | 9.6%), and Construction (1,772 | 8.8%).
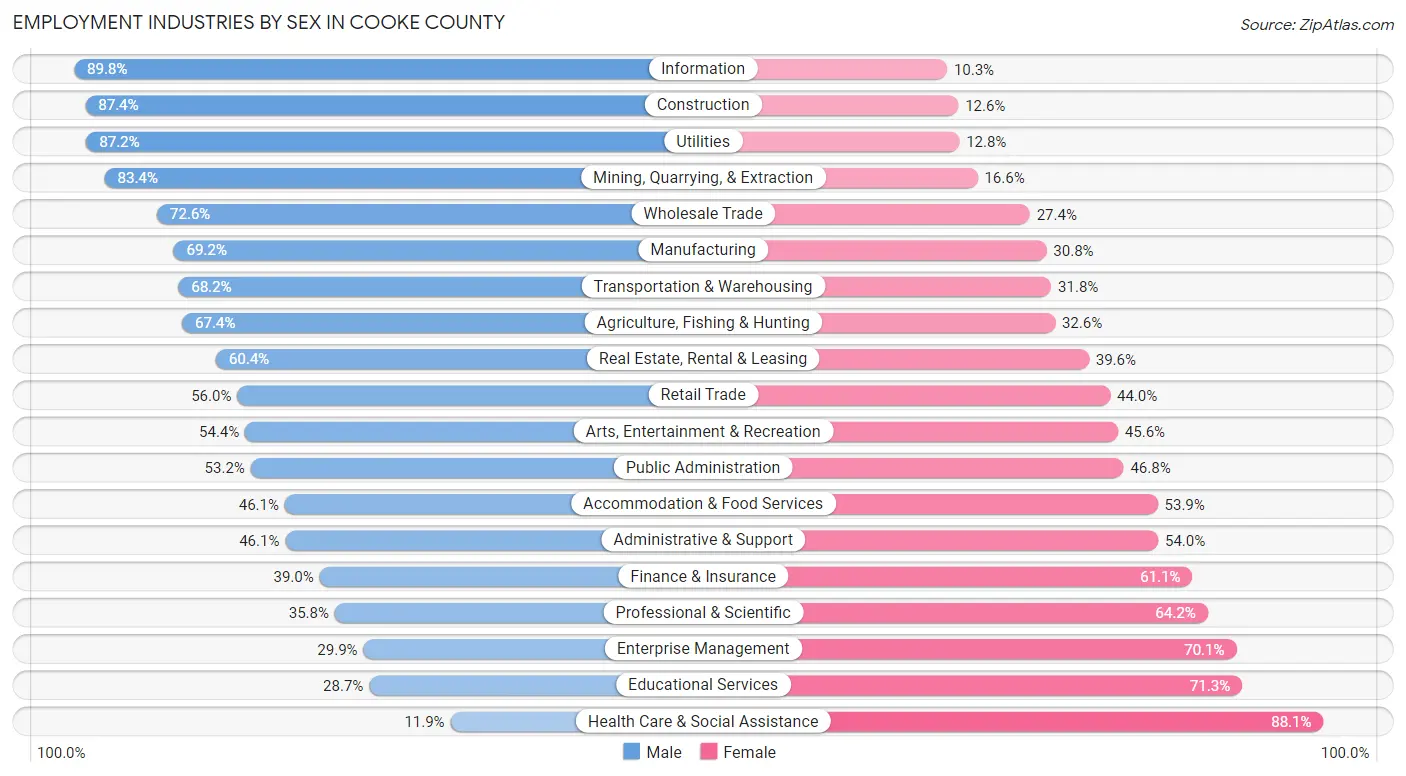
Employment Industries by Sex in Cooke County
The Cooke County industries that see more men than women are Information (89.7%), Construction (87.4%), and Utilities (87.2%), whereas the industries that tend to have a higher number of women are Health Care & Social Assistance (88.1%), Educational Services (71.3%), and Enterprise Management (70.1%).
| Industry | Male | Female |
| Agriculture, Fishing & Hunting | 372 (67.4%) | 180 (32.6%) |
| Mining, Quarrying, & Extraction | 589 (83.4%) | 117 (16.6%) |
| Construction | 1,549 (87.4%) | 223 (12.6%) |
| Manufacturing | 1,834 (69.2%) | 818 (30.8%) |
| Wholesale Trade | 350 (72.6%) | 132 (27.4%) |
| Retail Trade | 1,275 (56.0%) | 1,002 (44.0%) |
| Transportation & Warehousing | 495 (68.2%) | 231 (31.8%) |
| Utilities | 225 (87.2%) | 33 (12.8%) |
| Information | 289 (89.7%) | 33 (10.2%) |
| Finance & Insurance | 178 (39.0%) | 279 (61.1%) |
| Real Estate, Rental & Leasing | 218 (60.4%) | 143 (39.6%) |
| Professional & Scientific | 194 (35.8%) | 348 (64.2%) |
| Enterprise Management | 23 (29.9%) | 54 (70.1%) |
| Administrative & Support | 233 (46.1%) | 273 (53.9%) |
| Educational Services | 553 (28.7%) | 1,375 (71.3%) |
| Health Care & Social Assistance | 272 (11.9%) | 2,022 (88.1%) |
| Arts, Entertainment & Recreation | 710 (54.4%) | 596 (45.6%) |
| Accommodation & Food Services | 567 (46.1%) | 662 (53.9%) |
| Public Administration | 290 (53.2%) | 255 (46.8%) |
| Total | 10,852 (54.1%) | 9,195 (45.9%) |
Education in Cooke County
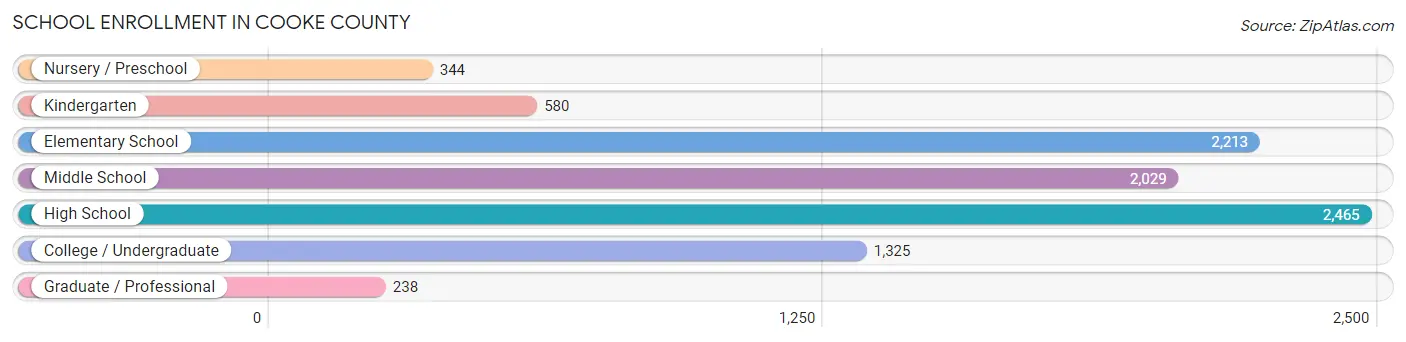
School Enrollment in Cooke County
The most common levels of schooling among the 9,194 students in Cooke County are high school (2,465 | 26.8%), elementary school (2,213 | 24.1%), and middle school (2,029 | 22.1%).
| School Level | # Students | % Students |
| Nursery / Preschool | 344 | 3.7% |
| Kindergarten | 580 | 6.3% |
| Elementary School | 2,213 | 24.1% |
| Middle School | 2,029 | 22.1% |
| High School | 2,465 | 26.8% |
| College / Undergraduate | 1,325 | 14.4% |
| Graduate / Professional | 238 | 2.6% |
| Total | 9,194 | 100.0% |
School Enrollment by Age by Funding Source in Cooke County
Out of a total of 9,194 students who are enrolled in schools in Cooke County, 827 (9.0%) attend a private institution, while the remaining 8,367 (91.0%) are enrolled in public schools. The age group of 3 to 4 year olds has the highest likelihood of being enrolled in private schools, with 73 (32.6% in the age bracket) enrolled. Conversely, the age group of 25 to 34 year olds has the lowest likelihood of being enrolled in a private school, with 467 (98.5% in the age bracket) attending a public institution.
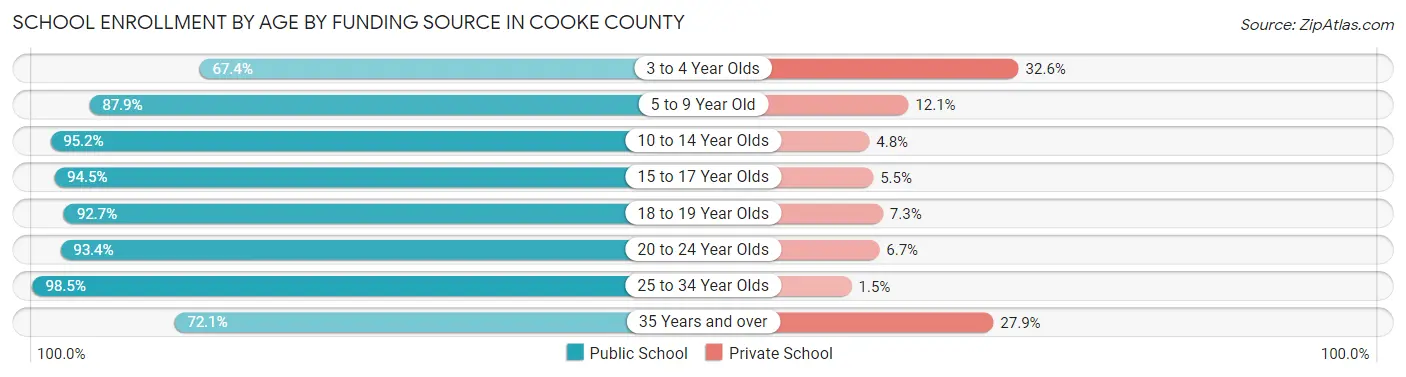
| Age Bracket | Public School | Private School |
| 3 to 4 Year Olds | 151 (67.4%) | 73 (32.6%) |
| 5 to 9 Year Old | 2,355 (87.9%) | 323 (12.1%) |
| 10 to 14 Year Olds | 2,429 (95.2%) | 122 (4.8%) |
| 15 to 17 Year Olds | 1,355 (94.5%) | 79 (5.5%) |
| 18 to 19 Year Olds | 925 (92.7%) | 73 (7.3%) |
| 20 to 24 Year Olds | 351 (93.3%) | 25 (6.7%) |
| 25 to 34 Year Olds | 467 (98.5%) | 7 (1.5%) |
| 35 Years and over | 331 (72.1%) | 128 (27.9%) |
| Total | 8,367 (91.0%) | 827 (9.0%) |
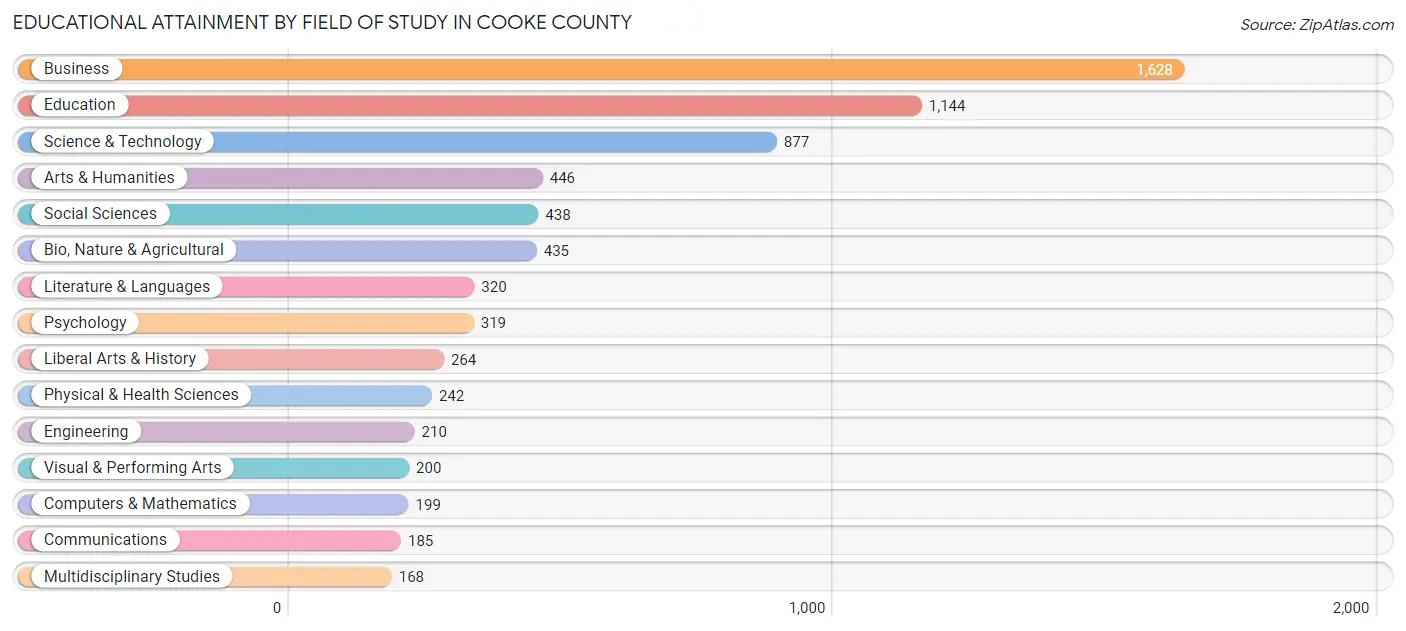
Educational Attainment by Field of Study in Cooke County
Business (1,628 | 23.0%), education (1,144 | 16.2%), science & technology (877 | 12.4%), arts & humanities (446 | 6.3%), and social sciences (438 | 6.2%) are the most common fields of study among 7,075 individuals in Cooke County who have obtained a bachelor's degree or higher.
| Field of Study | # Graduates | % Graduates |
| Computers & Mathematics | 199 | 2.8% |
| Bio, Nature & Agricultural | 435 | 6.1% |
| Physical & Health Sciences | 242 | 3.4% |
| Psychology | 319 | 4.5% |
| Social Sciences | 438 | 6.2% |
| Engineering | 210 | 3.0% |
| Multidisciplinary Studies | 168 | 2.4% |
| Science & Technology | 877 | 12.4% |
| Business | 1,628 | 23.0% |
| Education | 1,144 | 16.2% |
| Literature & Languages | 320 | 4.5% |
| Liberal Arts & History | 264 | 3.7% |
| Visual & Performing Arts | 200 | 2.8% |
| Communications | 185 | 2.6% |
| Arts & Humanities | 446 | 6.3% |
| Total | 7,075 | 100.0% |
Transportation & Commute in Cooke County
Vehicle Availability by Sex in Cooke County
The most prevalent vehicle ownership categories in Cooke County are males with 2 vehicles (4,807, accounting for 44.8%) and females with 2 vehicles (3,707, making up 52.8%).
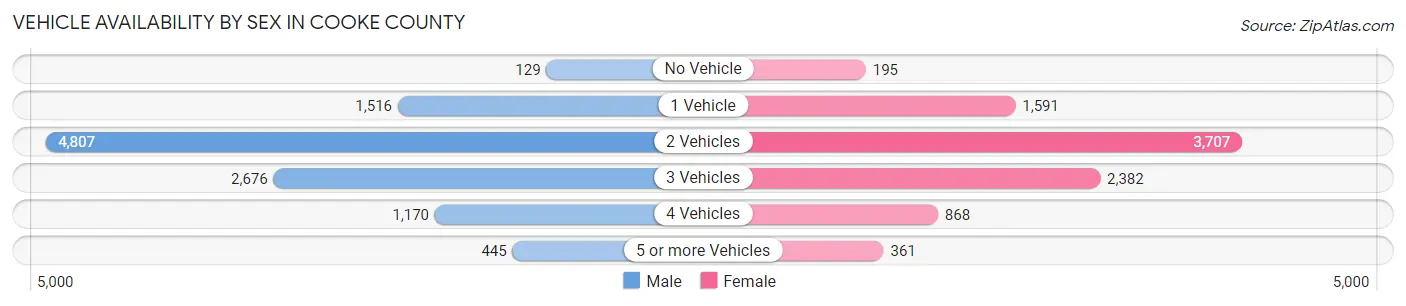
| Vehicles Available | Male | Female |
| No Vehicle | 129 (1.2%) | 195 (2.1%) |
| 1 Vehicle | 1,516 (14.1%) | 1,591 (17.5%) |
| 2 Vehicles | 4,807 (44.8%) | 3,707 (40.7%) |
| 3 Vehicles | 2,676 (24.9%) | 2,382 (26.2%) |
| 4 Vehicles | 1,170 (10.9%) | 868 (9.5%) |
| 5 or more Vehicles | 445 (4.1%) | 361 (4.0%) |
| Total | 10,743 (100.0%) | 9,104 (100.0%) |
Commute Time in Cooke County
The most frequently occuring commute durations in Cooke County are 10 to 14 minutes (3,184 commuters, 17.1%), 5 to 9 minutes (2,932 commuters, 15.8%), and 30 to 34 minutes (2,188 commuters, 11.8%).
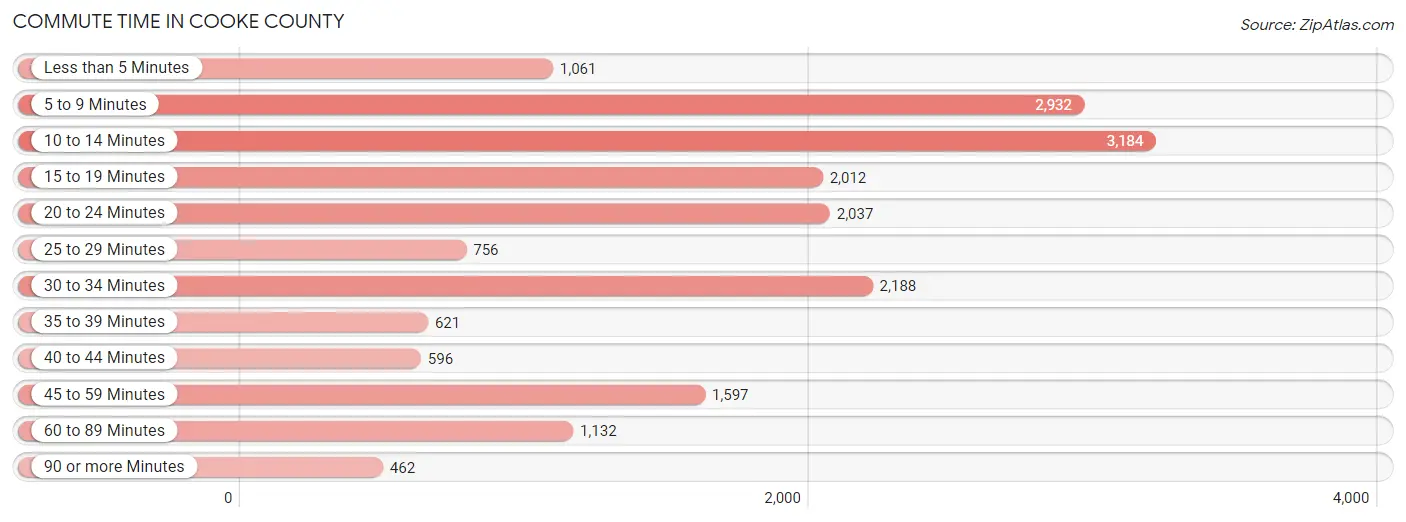
| Commute Time | # Commuters | % Commuters |
| Less than 5 Minutes | 1,061 | 5.7% |
| 5 to 9 Minutes | 2,932 | 15.8% |
| 10 to 14 Minutes | 3,184 | 17.1% |
| 15 to 19 Minutes | 2,012 | 10.8% |
| 20 to 24 Minutes | 2,037 | 11.0% |
| 25 to 29 Minutes | 756 | 4.1% |
| 30 to 34 Minutes | 2,188 | 11.8% |
| 35 to 39 Minutes | 621 | 3.3% |
| 40 to 44 Minutes | 596 | 3.2% |
| 45 to 59 Minutes | 1,597 | 8.6% |
| 60 to 89 Minutes | 1,132 | 6.1% |
| 90 or more Minutes | 462 | 2.5% |
Commute Time by Sex in Cooke County
The most common commute times in Cooke County are 10 to 14 minutes (1,645 commuters, 16.3%) for males and 10 to 14 minutes (1,539 commuters, 18.1%) for females.
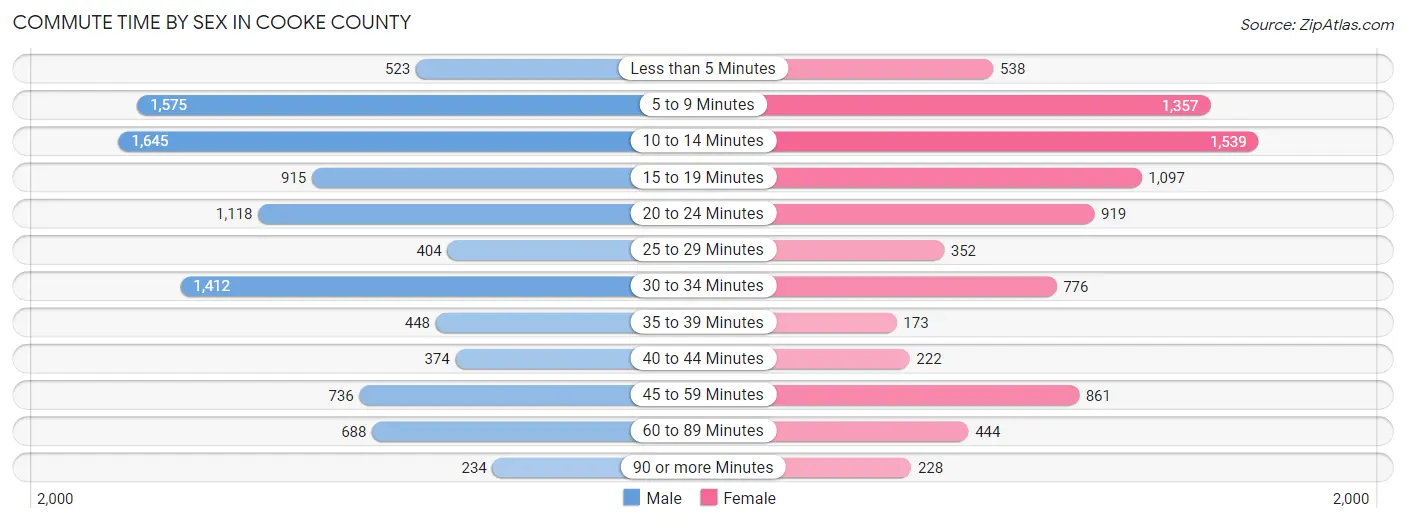
| Commute Time | Male | Female |
| Less than 5 Minutes | 523 (5.2%) | 538 (6.3%) |
| 5 to 9 Minutes | 1,575 (15.6%) | 1,357 (16.0%) |
| 10 to 14 Minutes | 1,645 (16.3%) | 1,539 (18.1%) |
| 15 to 19 Minutes | 915 (9.1%) | 1,097 (12.9%) |
| 20 to 24 Minutes | 1,118 (11.1%) | 919 (10.8%) |
| 25 to 29 Minutes | 404 (4.0%) | 352 (4.1%) |
| 30 to 34 Minutes | 1,412 (14.0%) | 776 (9.1%) |
| 35 to 39 Minutes | 448 (4.4%) | 173 (2.0%) |
| 40 to 44 Minutes | 374 (3.7%) | 222 (2.6%) |
| 45 to 59 Minutes | 736 (7.3%) | 861 (10.1%) |
| 60 to 89 Minutes | 688 (6.8%) | 444 (5.2%) |
| 90 or more Minutes | 234 (2.3%) | 228 (2.7%) |
Time of Departure to Work by Sex in Cooke County
The most frequent times of departure to work in Cooke County are 7:00 AM to 7:29 AM (1,239, 12.3%) for males and 7:30 AM to 7:59 AM (1,350, 15.9%) for females.
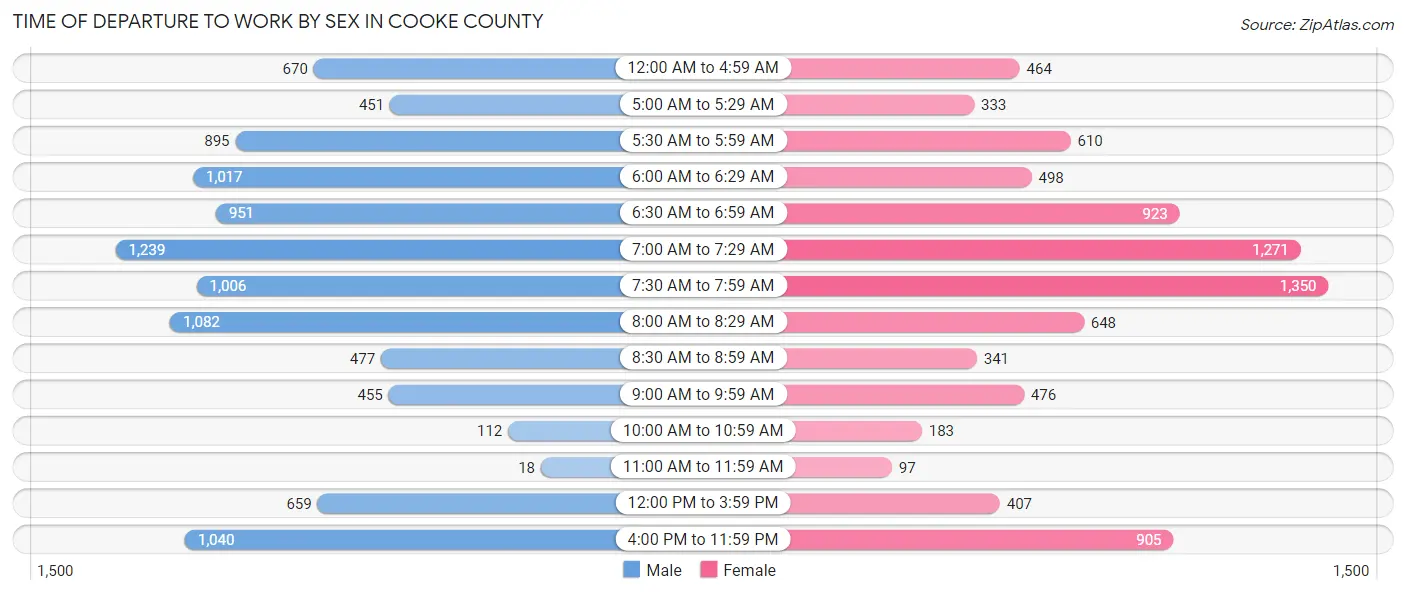
| Time of Departure | Male | Female |
| 12:00 AM to 4:59 AM | 670 (6.7%) | 464 (5.4%) |
| 5:00 AM to 5:29 AM | 451 (4.5%) | 333 (3.9%) |
| 5:30 AM to 5:59 AM | 895 (8.9%) | 610 (7.2%) |
| 6:00 AM to 6:29 AM | 1,017 (10.1%) | 498 (5.9%) |
| 6:30 AM to 6:59 AM | 951 (9.4%) | 923 (10.8%) |
| 7:00 AM to 7:29 AM | 1,239 (12.3%) | 1,271 (14.9%) |
| 7:30 AM to 7:59 AM | 1,006 (10.0%) | 1,350 (15.9%) |
| 8:00 AM to 8:29 AM | 1,082 (10.7%) | 648 (7.6%) |
| 8:30 AM to 8:59 AM | 477 (4.7%) | 341 (4.0%) |
| 9:00 AM to 9:59 AM | 455 (4.5%) | 476 (5.6%) |
| 10:00 AM to 10:59 AM | 112 (1.1%) | 183 (2.1%) |
| 11:00 AM to 11:59 AM | 18 (0.2%) | 97 (1.1%) |
| 12:00 PM to 3:59 PM | 659 (6.5%) | 407 (4.8%) |
| 4:00 PM to 11:59 PM | 1,040 (10.3%) | 905 (10.6%) |
| Total | 10,072 (100.0%) | 8,506 (100.0%) |
Housing Occupancy in Cooke County
Occupancy by Ownership in Cooke County
Of the total 16,196 dwellings in Cooke County, owner-occupied units account for 11,192 (69.1%), while renter-occupied units make up 5,004 (30.9%).
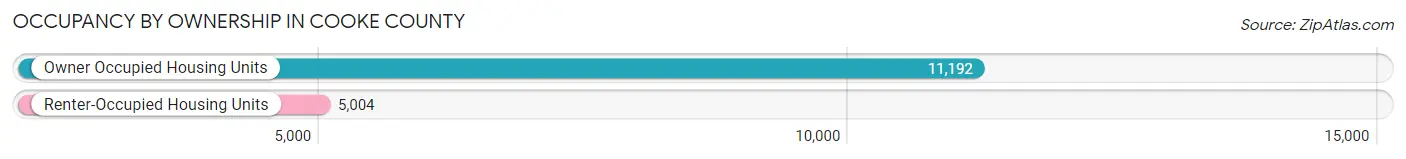
| Occupancy | # Housing Units | % Housing Units |
| Owner Occupied Housing Units | 11,192 | 69.1% |
| Renter-Occupied Housing Units | 5,004 | 30.9% |
| Total Occupied Housing Units | 16,196 | 100.0% |
Occupancy by Household Size in Cooke County
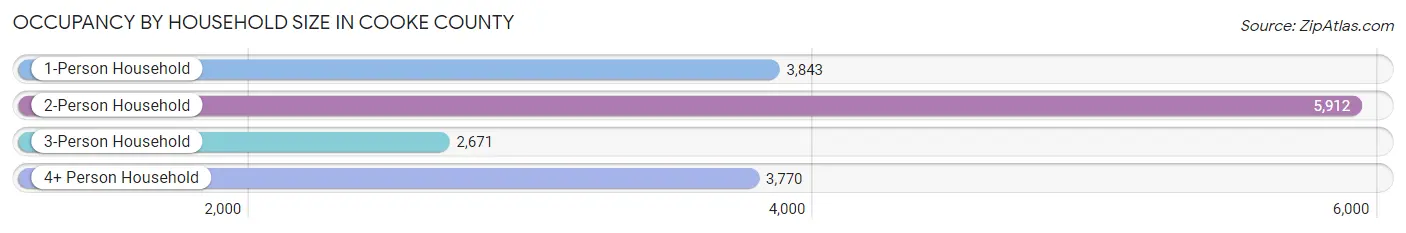
| Household Size | # Housing Units | % Housing Units |
| 1-Person Household | 3,843 | 23.7% |
| 2-Person Household | 5,912 | 36.5% |
| 3-Person Household | 2,671 | 16.5% |
| 4+ Person Household | 3,770 | 23.3% |
| Total Housing Units | 16,196 | 100.0% |
Occupancy by Ownership by Household Size in Cooke County
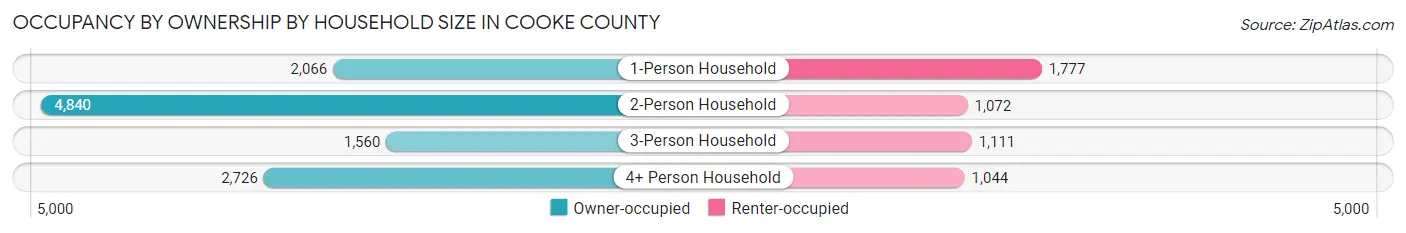
| Household Size | Owner-occupied | Renter-occupied |
| 1-Person Household | 2,066 (53.8%) | 1,777 (46.2%) |
| 2-Person Household | 4,840 (81.9%) | 1,072 (18.1%) |
| 3-Person Household | 1,560 (58.4%) | 1,111 (41.6%) |
| 4+ Person Household | 2,726 (72.3%) | 1,044 (27.7%) |
| Total Housing Units | 11,192 (69.1%) | 5,004 (30.9%) |
Occupancy by Educational Attainment in Cooke County
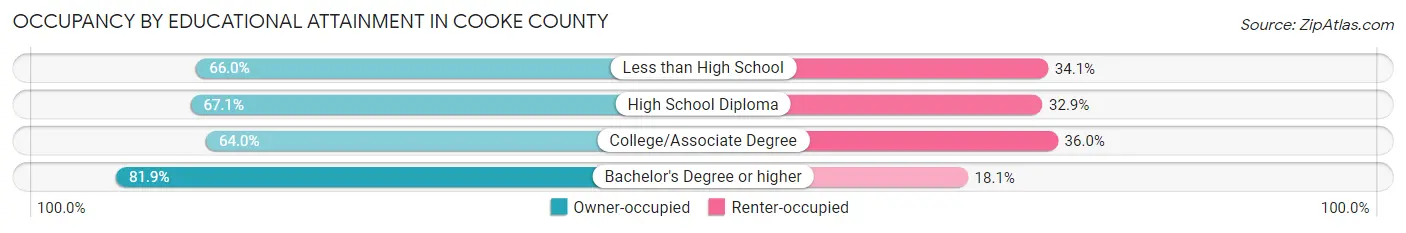
| Household Size | Owner-occupied | Renter-occupied |
| Less than High School | 1,141 (65.9%) | 589 (34.1%) |
| High School Diploma | 3,273 (67.1%) | 1,605 (32.9%) |
| College/Associate Degree | 3,844 (64.0%) | 2,160 (36.0%) |
| Bachelor's Degree or higher | 2,934 (81.9%) | 650 (18.1%) |
Occupancy by Age of Householder in Cooke County
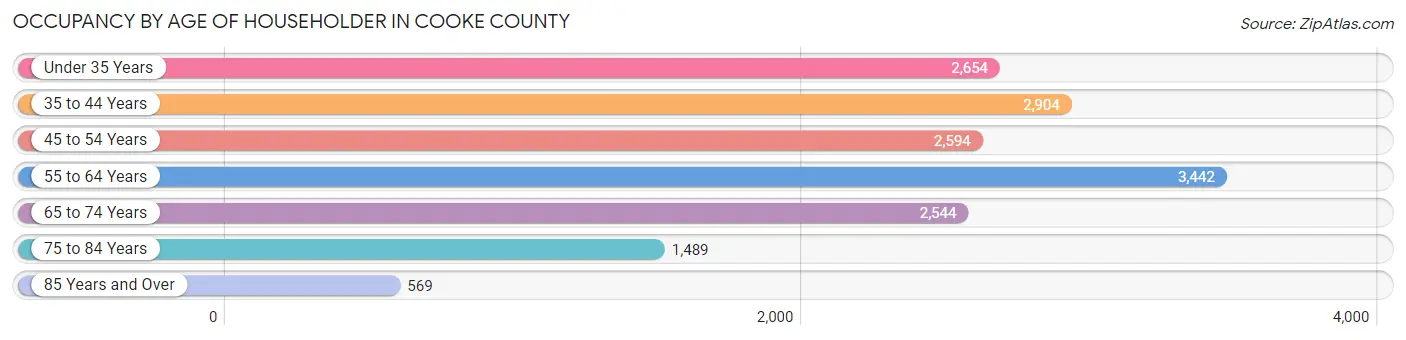
| Age Bracket | # Households | % Households |
| Under 35 Years | 2,654 | 16.4% |
| 35 to 44 Years | 2,904 | 17.9% |
| 45 to 54 Years | 2,594 | 16.0% |
| 55 to 64 Years | 3,442 | 21.2% |
| 65 to 74 Years | 2,544 | 15.7% |
| 75 to 84 Years | 1,489 | 9.2% |
| 85 Years and Over | 569 | 3.5% |
| Total | 16,196 | 100.0% |
Housing Finances in Cooke County
Median Income by Occupancy in Cooke County
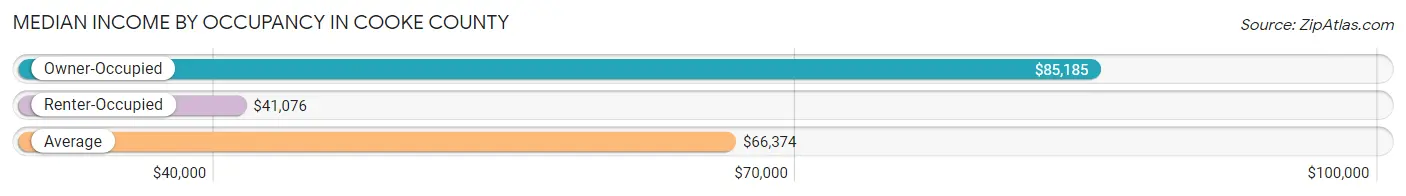
| Occupancy Type | # Households | Median Income |
| Owner-Occupied | 11,192 (69.1%) | $85,185 |
| Renter-Occupied | 5,004 (30.9%) | $41,076 |
| Average | 16,196 (100.0%) | $66,374 |
Occupancy by Householder Income Bracket in Cooke County
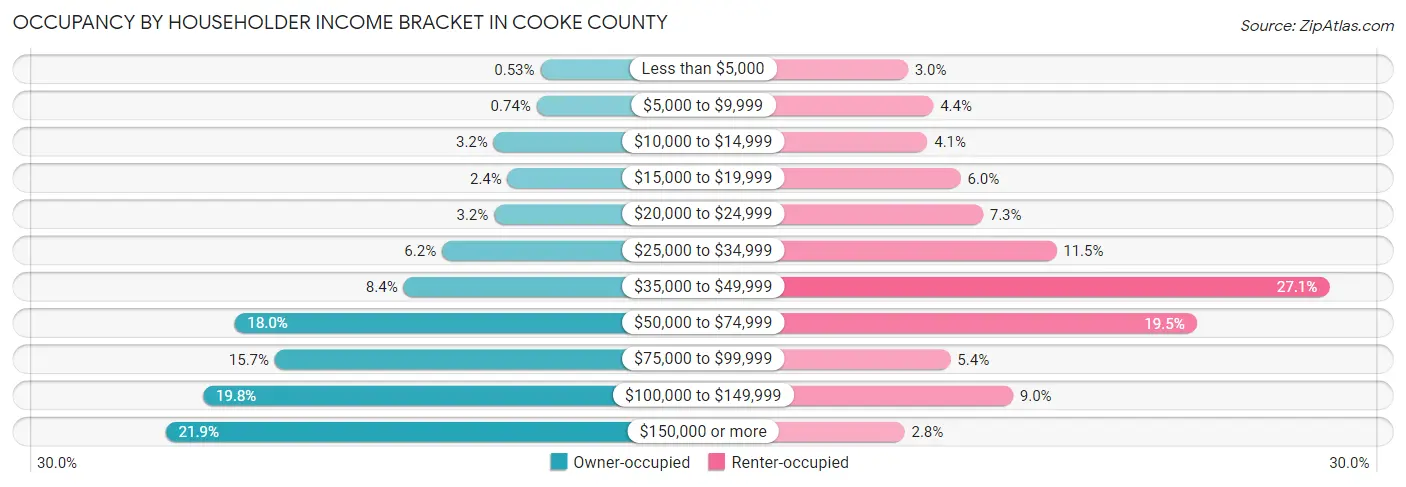
| Income Bracket | Owner-occupied | Renter-occupied |
| Less than $5,000 | 59 (0.5%) | 149 (3.0%) |
| $5,000 to $9,999 | 83 (0.7%) | 222 (4.4%) |
| $10,000 to $14,999 | 358 (3.2%) | 205 (4.1%) |
| $15,000 to $19,999 | 269 (2.4%) | 300 (6.0%) |
| $20,000 to $24,999 | 355 (3.2%) | 364 (7.3%) |
| $25,000 to $34,999 | 688 (6.1%) | 574 (11.5%) |
| $35,000 to $49,999 | 934 (8.4%) | 1,354 (27.1%) |
| $50,000 to $74,999 | 2,016 (18.0%) | 975 (19.5%) |
| $75,000 to $99,999 | 1,757 (15.7%) | 271 (5.4%) |
| $100,000 to $149,999 | 2,217 (19.8%) | 450 (9.0%) |
| $150,000 or more | 2,456 (21.9%) | 140 (2.8%) |
| Total | 11,192 (100.0%) | 5,004 (100.0%) |
Monthly Housing Cost Tiers in Cooke County
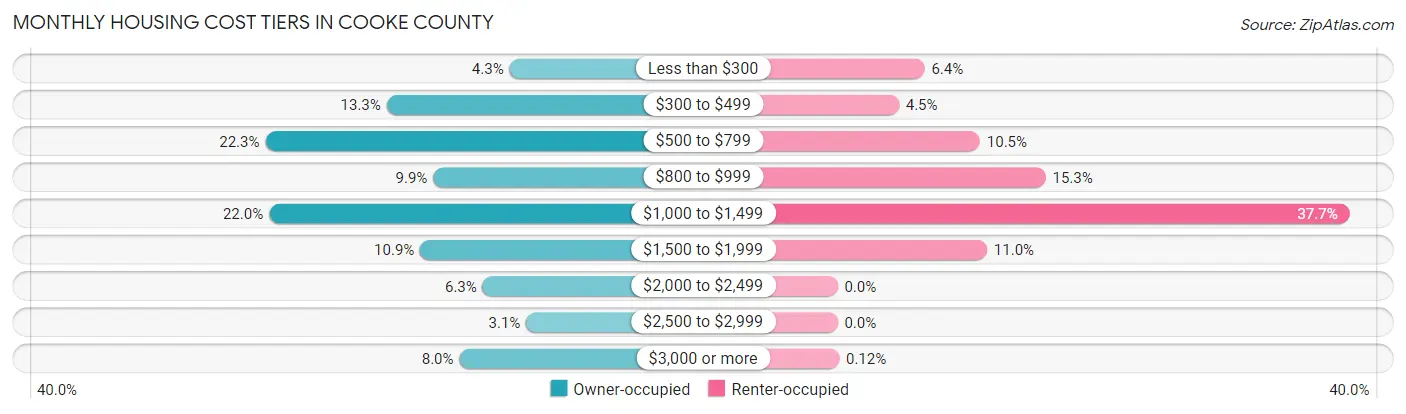
| Monthly Cost | Owner-occupied | Renter-occupied |
| Less than $300 | 480 (4.3%) | 321 (6.4%) |
| $300 to $499 | 1,493 (13.3%) | 226 (4.5%) |
| $500 to $799 | 2,493 (22.3%) | 525 (10.5%) |
| $800 to $999 | 1,109 (9.9%) | 767 (15.3%) |
| $1,000 to $1,499 | 2,462 (22.0%) | 1,887 (37.7%) |
| $1,500 to $1,999 | 1,217 (10.9%) | 551 (11.0%) |
| $2,000 to $2,499 | 702 (6.3%) | 0 (0.0%) |
| $2,500 to $2,999 | 343 (3.1%) | 0 (0.0%) |
| $3,000 or more | 893 (8.0%) | 6 (0.1%) |
| Total | 11,192 (100.0%) | 5,004 (100.0%) |
Physical Housing Characteristics in Cooke County
Housing Structures in Cooke County
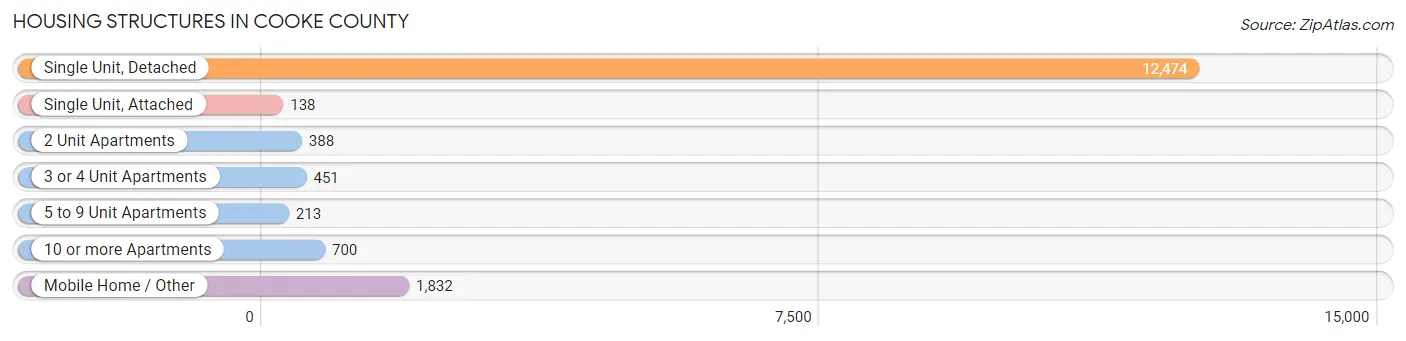
| Structure Type | # Housing Units | % Housing Units |
| Single Unit, Detached | 12,474 | 77.0% |
| Single Unit, Attached | 138 | 0.9% |
| 2 Unit Apartments | 388 | 2.4% |
| 3 or 4 Unit Apartments | 451 | 2.8% |
| 5 to 9 Unit Apartments | 213 | 1.3% |
| 10 or more Apartments | 700 | 4.3% |
| Mobile Home / Other | 1,832 | 11.3% |
| Total | 16,196 | 100.0% |
Housing Structures by Occupancy in Cooke County
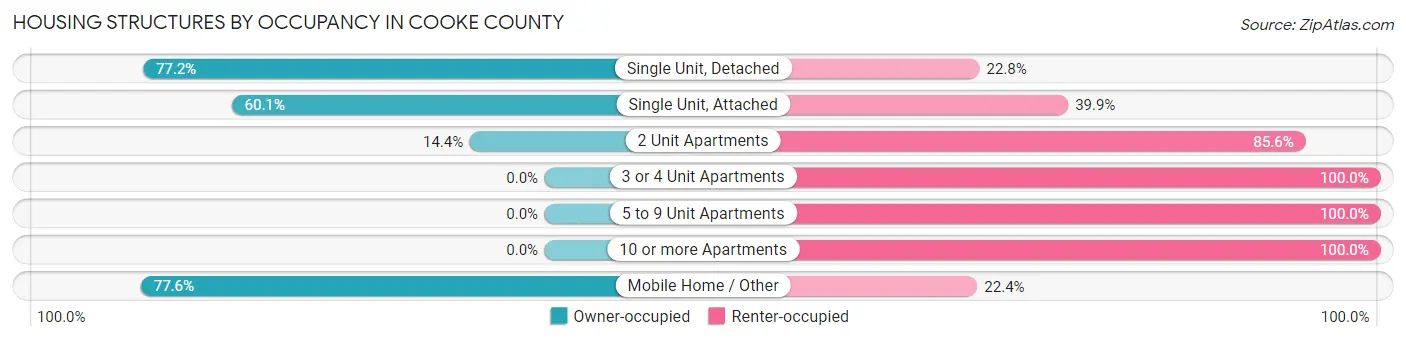
| Structure Type | Owner-occupied | Renter-occupied |
| Single Unit, Detached | 9,631 (77.2%) | 2,843 (22.8%) |
| Single Unit, Attached | 83 (60.1%) | 55 (39.9%) |
| 2 Unit Apartments | 56 (14.4%) | 332 (85.6%) |
| 3 or 4 Unit Apartments | 0 (0.0%) | 451 (100.0%) |
| 5 to 9 Unit Apartments | 0 (0.0%) | 213 (100.0%) |
| 10 or more Apartments | 0 (0.0%) | 700 (100.0%) |
| Mobile Home / Other | 1,422 (77.6%) | 410 (22.4%) |
| Total | 11,192 (69.1%) | 5,004 (30.9%) |
Housing Structures by Number of Rooms in Cooke County
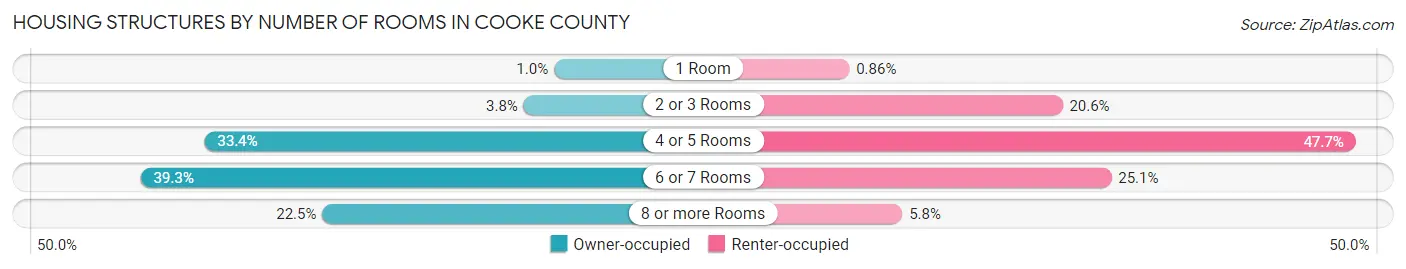
| Number of Rooms | Owner-occupied | Renter-occupied |
| 1 Room | 116 (1.0%) | 43 (0.9%) |
| 2 or 3 Rooms | 430 (3.8%) | 1,030 (20.6%) |
| 4 or 5 Rooms | 3,735 (33.4%) | 2,387 (47.7%) |
| 6 or 7 Rooms | 4,396 (39.3%) | 1,256 (25.1%) |
| 8 or more Rooms | 2,515 (22.5%) | 288 (5.8%) |
| Total | 11,192 (100.0%) | 5,004 (100.0%) |
Housing Structure by Heating Type in Cooke County
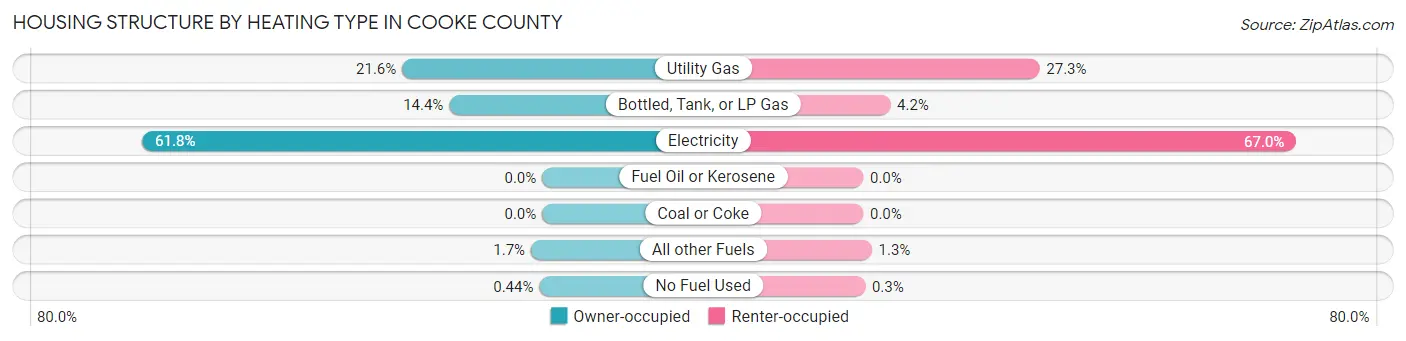
| Heating Type | Owner-occupied | Renter-occupied |
| Utility Gas | 2,422 (21.6%) | 1,364 (27.3%) |
| Bottled, Tank, or LP Gas | 1,607 (14.4%) | 209 (4.2%) |
| Electricity | 6,920 (61.8%) | 3,350 (66.9%) |
| Fuel Oil or Kerosene | 0 (0.0%) | 0 (0.0%) |
| Coal or Coke | 0 (0.0%) | 0 (0.0%) |
| All other Fuels | 194 (1.7%) | 66 (1.3%) |
| No Fuel Used | 49 (0.4%) | 15 (0.3%) |
| Total | 11,192 (100.0%) | 5,004 (100.0%) |
Household Vehicle Usage in Cooke County
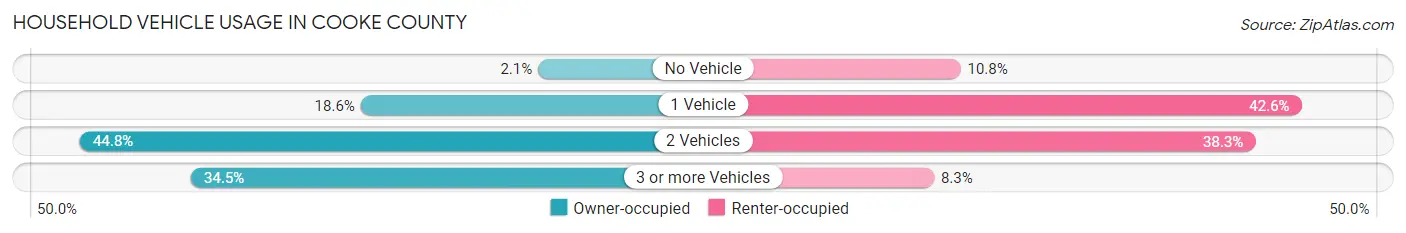
| Vehicles per Household | Owner-occupied | Renter-occupied |
| No Vehicle | 232 (2.1%) | 540 (10.8%) |
| 1 Vehicle | 2,085 (18.6%) | 2,132 (42.6%) |
| 2 Vehicles | 5,017 (44.8%) | 1,916 (38.3%) |
| 3 or more Vehicles | 3,858 (34.5%) | 416 (8.3%) |
| Total | 11,192 (100.0%) | 5,004 (100.0%) |
Real Estate & Mortgages in Cooke County
Real Estate and Mortgage Overview in Cooke County
| Characteristic | Without Mortgage | With Mortgage |
| Housing Units | 5,800 | 5,392 |
| Median Property Value | $180,500 | $229,800 |
| Median Household Income | $68,712 | $1,521 |
| Monthly Housing Costs | $609 | $893 |
| Real Estate Taxes | $2,287 | $224 |
Property Value by Mortgage Status in Cooke County
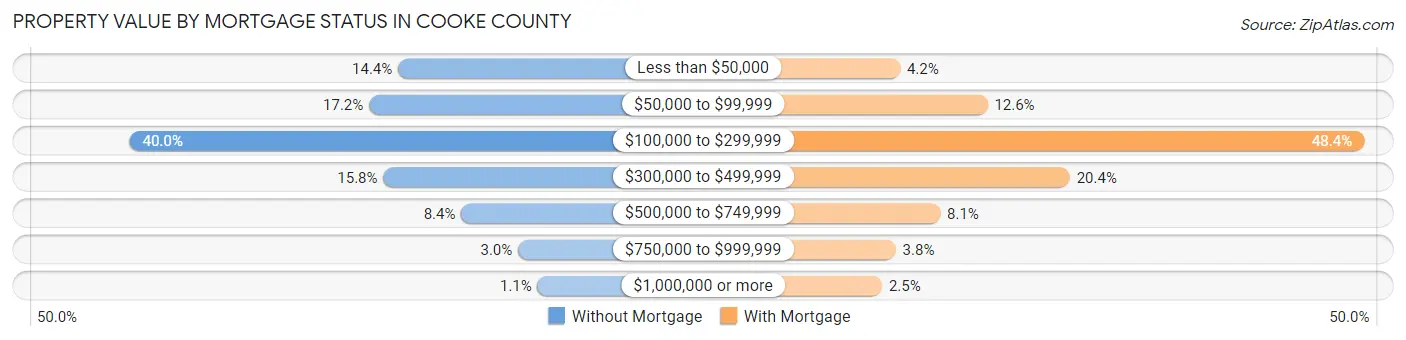
| Property Value | Without Mortgage | With Mortgage |
| Less than $50,000 | 837 (14.4%) | 228 (4.2%) |
| $50,000 to $99,999 | 997 (17.2%) | 677 (12.6%) |
| $100,000 to $299,999 | 2,320 (40.0%) | 2,611 (48.4%) |
| $300,000 to $499,999 | 918 (15.8%) | 1,100 (20.4%) |
| $500,000 to $749,999 | 488 (8.4%) | 434 (8.1%) |
| $750,000 to $999,999 | 174 (3.0%) | 206 (3.8%) |
| $1,000,000 or more | 66 (1.1%) | 136 (2.5%) |
| Total | 5,800 (100.0%) | 5,392 (100.0%) |
Household Income by Mortgage Status in Cooke County
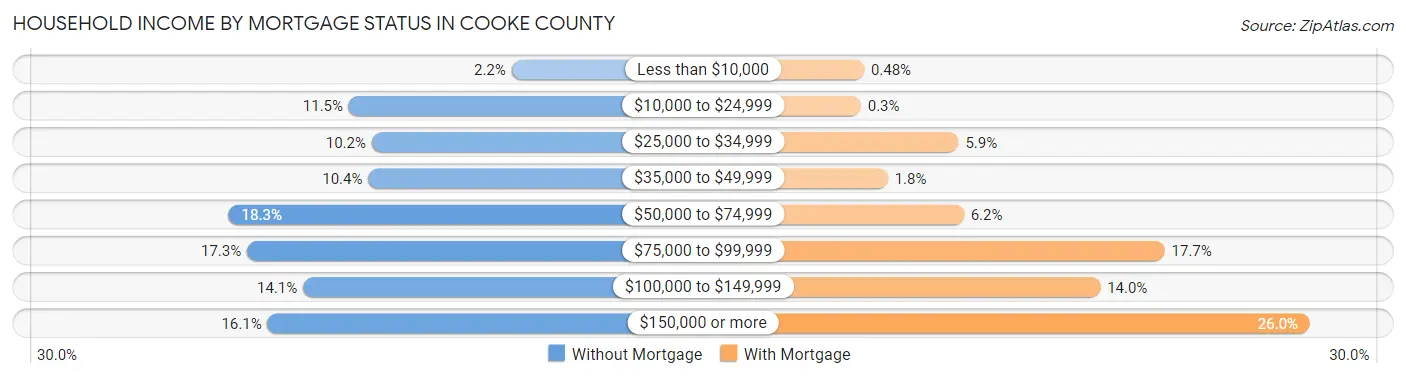
| Household Income | Without Mortgage | With Mortgage |
| Less than $10,000 | 126 (2.2%) | 26 (0.5%) |
| $10,000 to $24,999 | 665 (11.5%) | 16 (0.3%) |
| $25,000 to $34,999 | 589 (10.2%) | 317 (5.9%) |
| $35,000 to $49,999 | 601 (10.4%) | 99 (1.8%) |
| $50,000 to $74,999 | 1,064 (18.3%) | 333 (6.2%) |
| $75,000 to $99,999 | 1,003 (17.3%) | 952 (17.7%) |
| $100,000 to $149,999 | 817 (14.1%) | 754 (14.0%) |
| $150,000 or more | 935 (16.1%) | 1,400 (26.0%) |
| Total | 5,800 (100.0%) | 5,392 (100.0%) |
Property Value to Household Income Ratio in Cooke County
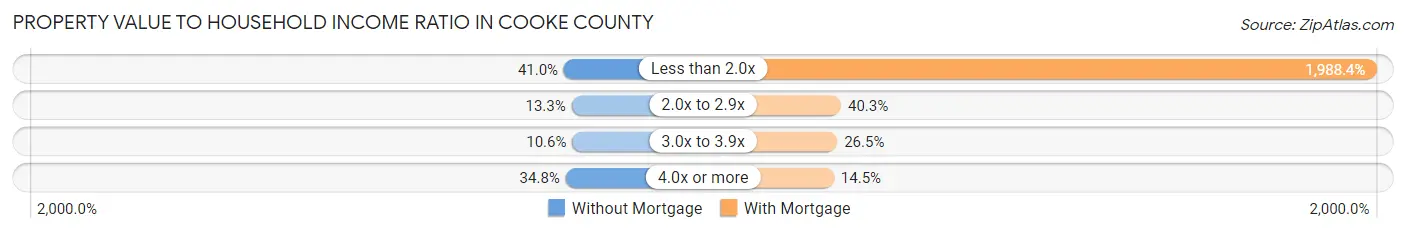
| Value-to-Income Ratio | Without Mortgage | With Mortgage |
| Less than 2.0x | 2,375 (40.9%) | 107,212 (1,988.4%) |
| 2.0x to 2.9x | 773 (13.3%) | 2,174 (40.3%) |
| 3.0x to 3.9x | 615 (10.6%) | 1,429 (26.5%) |
| 4.0x or more | 2,016 (34.8%) | 779 (14.4%) |
| Total | 5,800 (100.0%) | 5,392 (100.0%) |
Real Estate Taxes by Mortgage Status in Cooke County
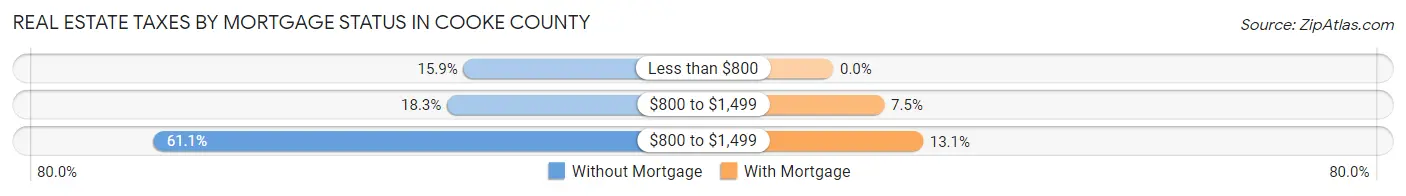
| Property Taxes | Without Mortgage | With Mortgage |
| Less than $800 | 920 (15.9%) | 0 (0.0%) |
| $800 to $1,499 | 1,059 (18.3%) | 403 (7.5%) |
| $800 to $1,499 | 3,545 (61.1%) | 707 (13.1%) |
| Total | 5,800 (100.0%) | 5,392 (100.0%) |
Health & Disability in Cooke County
Health Insurance Coverage by Age in Cooke County
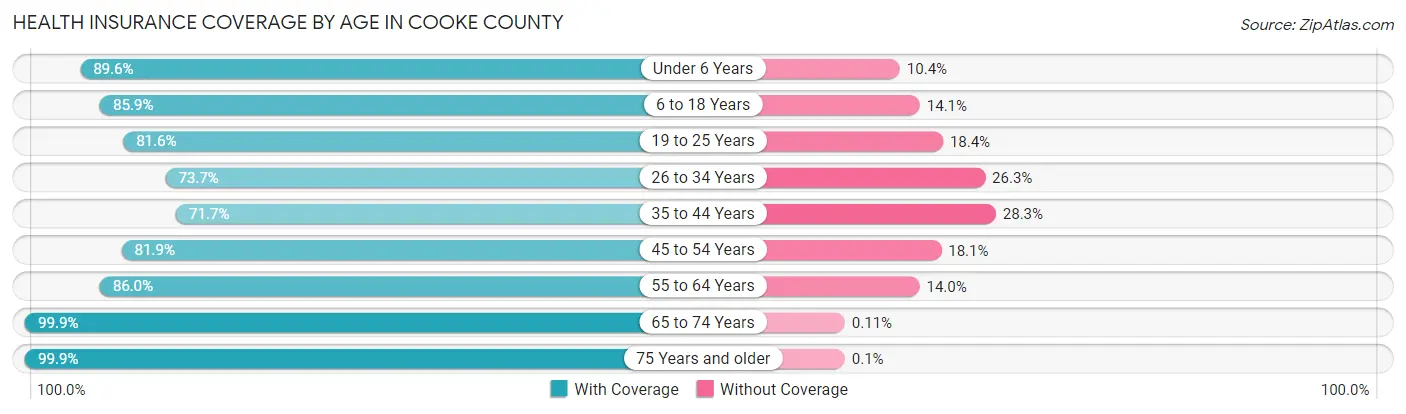
| Age Bracket | With Coverage | Without Coverage |
| Under 6 Years | 2,843 (89.6%) | 329 (10.4%) |
| 6 to 18 Years | 6,305 (85.9%) | 1,034 (14.1%) |
| 19 to 25 Years | 2,630 (81.6%) | 593 (18.4%) |
| 26 to 34 Years | 3,219 (73.7%) | 1,147 (26.3%) |
| 35 to 44 Years | 3,504 (71.7%) | 1,380 (28.3%) |
| 45 to 54 Years | 3,997 (81.9%) | 883 (18.1%) |
| 55 to 64 Years | 5,041 (86.0%) | 823 (14.0%) |
| 65 to 74 Years | 4,645 (99.9%) | 5 (0.1%) |
| 75 Years and older | 3,011 (99.9%) | 3 (0.1%) |
| Total | 35,195 (85.0%) | 6,197 (15.0%) |
Health Insurance Coverage by Citizenship Status in Cooke County
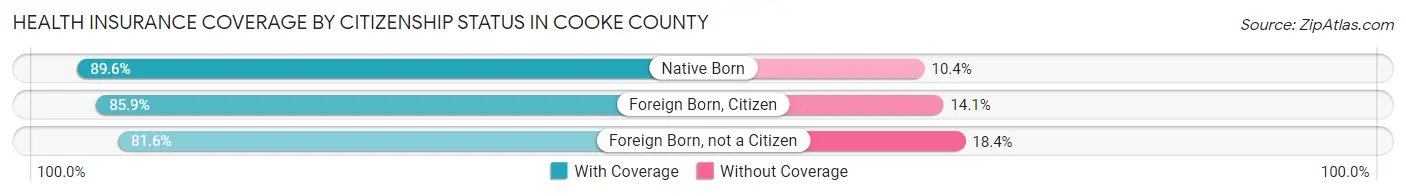
| Citizenship Status | With Coverage | Without Coverage |
| Native Born | 2,843 (89.6%) | 329 (10.4%) |
| Foreign Born, Citizen | 6,305 (85.9%) | 1,034 (14.1%) |
| Foreign Born, not a Citizen | 2,630 (81.6%) | 593 (18.4%) |
Health Insurance Coverage by Household Income in Cooke County
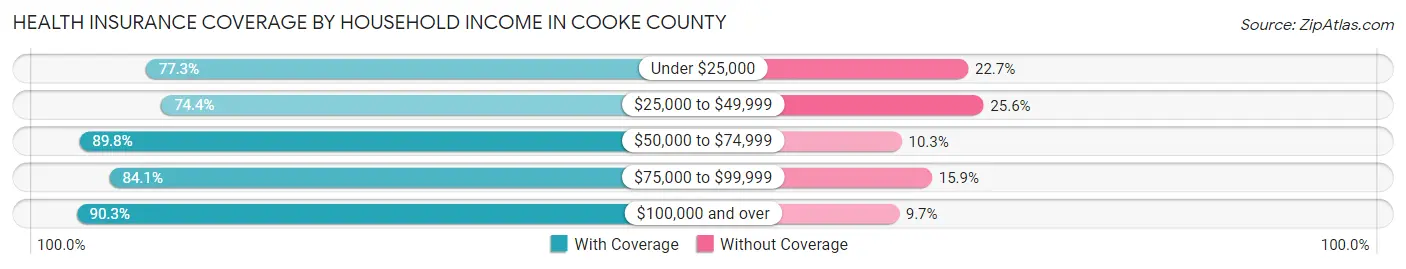
| Household Income | With Coverage | Without Coverage |
| Under $25,000 | 3,334 (77.3%) | 980 (22.7%) |
| $25,000 to $49,999 | 5,624 (74.4%) | 1,935 (25.6%) |
| $50,000 to $74,999 | 6,454 (89.7%) | 737 (10.2%) |
| $75,000 to $99,999 | 5,054 (84.1%) | 957 (15.9%) |
| $100,000 and over | 14,590 (90.3%) | 1,574 (9.7%) |
Public vs Private Health Insurance Coverage by Age in Cooke County
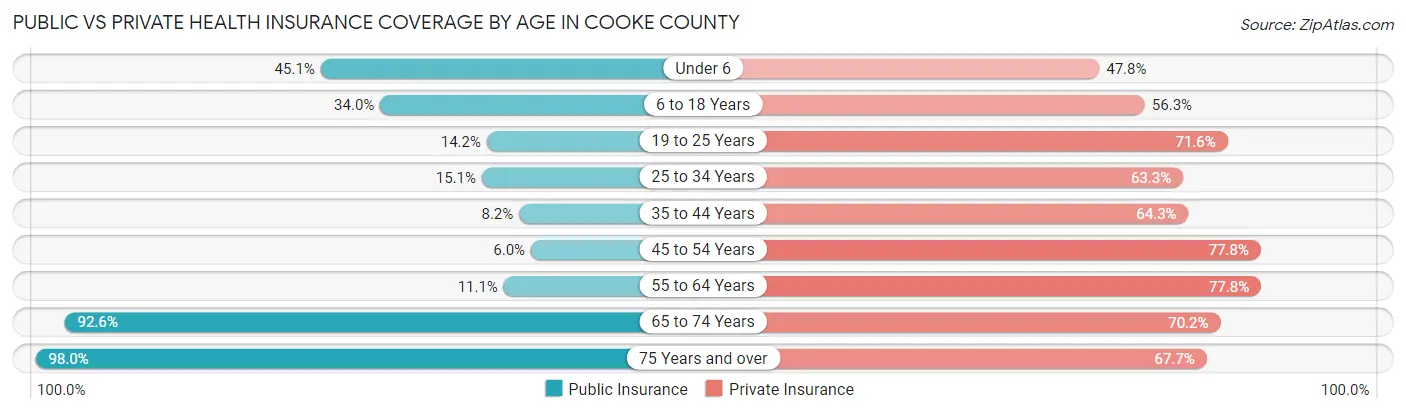
| Age Bracket | Public Insurance | Private Insurance |
| Under 6 | 1,429 (45.1%) | 1,516 (47.8%) |
| 6 to 18 Years | 2,495 (34.0%) | 4,129 (56.3%) |
| 19 to 25 Years | 458 (14.2%) | 2,308 (71.6%) |
| 25 to 34 Years | 661 (15.1%) | 2,765 (63.3%) |
| 35 to 44 Years | 401 (8.2%) | 3,142 (64.3%) |
| 45 to 54 Years | 294 (6.0%) | 3,795 (77.8%) |
| 55 to 64 Years | 649 (11.1%) | 4,563 (77.8%) |
| 65 to 74 Years | 4,305 (92.6%) | 3,266 (70.2%) |
| 75 Years and over | 2,953 (98.0%) | 2,041 (67.7%) |
| Total | 13,645 (33.0%) | 27,525 (66.5%) |
Disability Status by Sex by Age in Cooke County
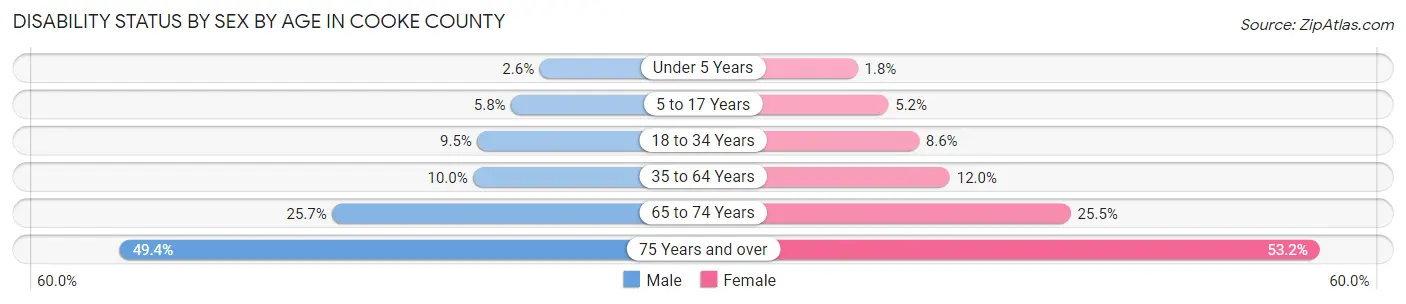
| Age Bracket | Male | Female |
| Under 5 Years | 37 (2.6%) | 22 (1.8%) |
| 5 to 17 Years | 201 (5.8%) | 176 (5.2%) |
| 18 to 34 Years | 406 (9.5%) | 369 (8.6%) |
| 35 to 64 Years | 783 (10.0%) | 938 (12.0%) |
| 65 to 74 Years | 589 (25.7%) | 601 (25.5%) |
| 75 Years and over | 659 (49.4%) | 894 (53.2%) |
Disability Class by Sex by Age in Cooke County
Disability Class: Hearing Difficulty
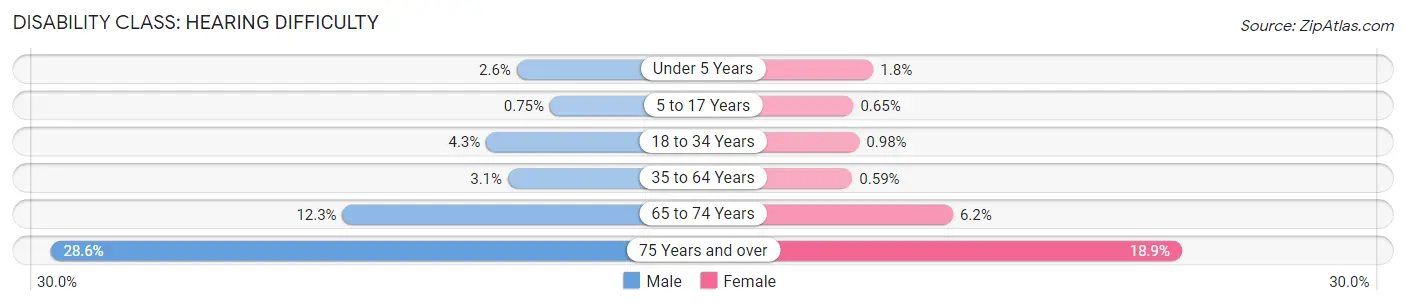
| Age Bracket | Male | Female |
| Under 5 Years | 37 (2.6%) | 22 (1.8%) |
| 5 to 17 Years | 26 (0.7%) | 22 (0.6%) |
| 18 to 34 Years | 183 (4.3%) | 42 (1.0%) |
| 35 to 64 Years | 242 (3.1%) | 46 (0.6%) |
| 65 to 74 Years | 282 (12.3%) | 146 (6.2%) |
| 75 Years and over | 381 (28.6%) | 318 (18.9%) |
Disability Class: Vision Difficulty
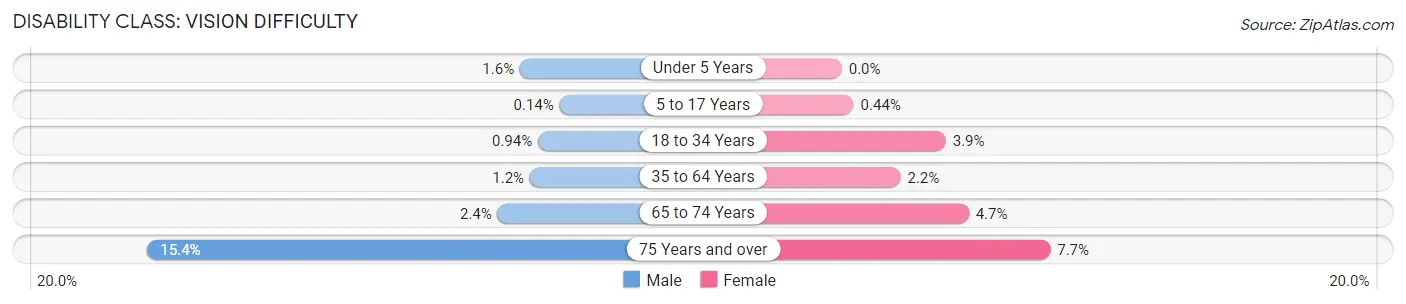
| Age Bracket | Male | Female |
| Under 5 Years | 23 (1.6%) | 0 (0.0%) |
| 5 to 17 Years | 5 (0.1%) | 15 (0.4%) |
| 18 to 34 Years | 40 (0.9%) | 166 (3.9%) |
| 35 to 64 Years | 97 (1.2%) | 170 (2.2%) |
| 65 to 74 Years | 56 (2.4%) | 111 (4.7%) |
| 75 Years and over | 206 (15.4%) | 130 (7.7%) |
Disability Class: Cognitive Difficulty
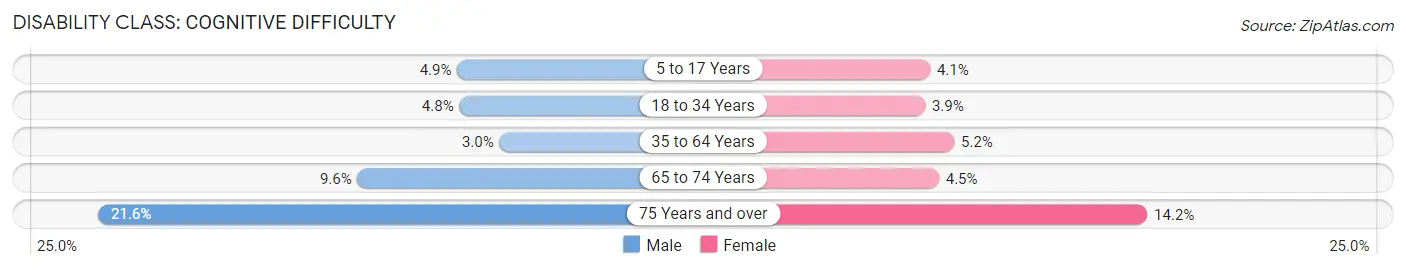
| Age Bracket | Male | Female |
| 5 to 17 Years | 171 (4.9%) | 139 (4.1%) |
| 18 to 34 Years | 205 (4.8%) | 166 (3.9%) |
| 35 to 64 Years | 232 (3.0%) | 406 (5.2%) |
| 65 to 74 Years | 219 (9.6%) | 106 (4.5%) |
| 75 Years and over | 288 (21.6%) | 238 (14.2%) |
Disability Class: Ambulatory Difficulty
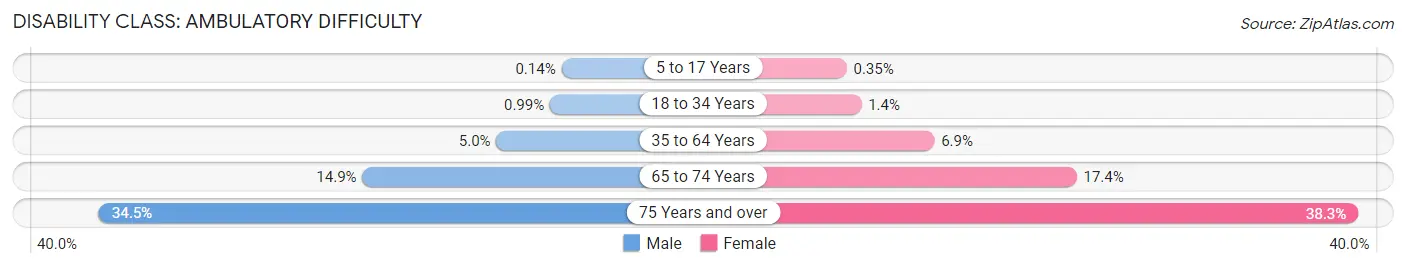
| Age Bracket | Male | Female |
| 5 to 17 Years | 5 (0.1%) | 12 (0.4%) |
| 18 to 34 Years | 42 (1.0%) | 62 (1.4%) |
| 35 to 64 Years | 389 (5.0%) | 535 (6.9%) |
| 65 to 74 Years | 342 (14.9%) | 411 (17.4%) |
| 75 Years and over | 460 (34.5%) | 644 (38.3%) |
Disability Class: Self-Care Difficulty
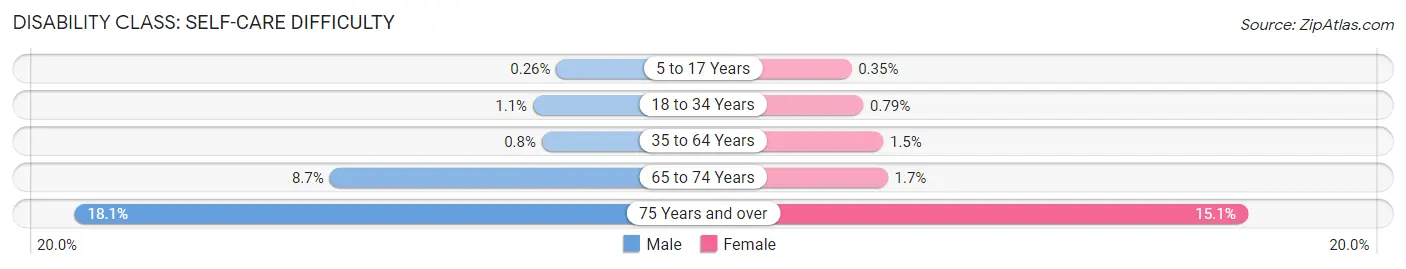
| Age Bracket | Male | Female |
| 5 to 17 Years | 9 (0.3%) | 12 (0.4%) |
| 18 to 34 Years | 48 (1.1%) | 34 (0.8%) |
| 35 to 64 Years | 63 (0.8%) | 119 (1.5%) |
| 65 to 74 Years | 199 (8.7%) | 40 (1.7%) |
| 75 Years and over | 242 (18.1%) | 253 (15.1%) |
Technology Access in Cooke County
Computing Device Access in Cooke County
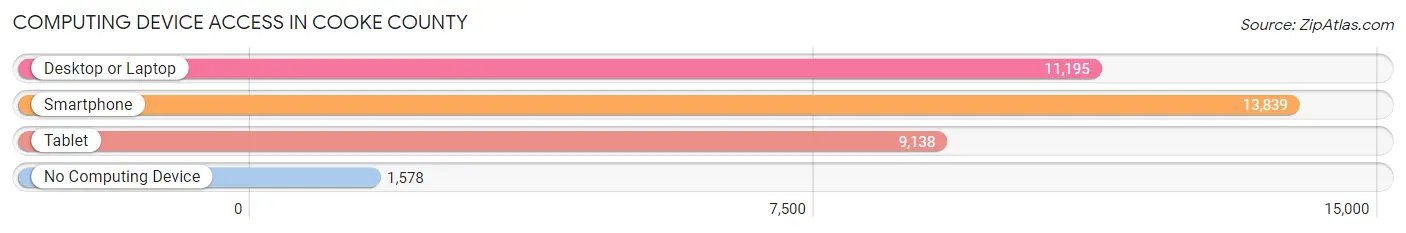
| Device Type | # Households | % Households |
| Desktop or Laptop | 11,195 | 69.1% |
| Smartphone | 13,839 | 85.5% |
| Tablet | 9,138 | 56.4% |
| No Computing Device | 1,578 | 9.7% |
| Total | 16,196 | 100.0% |
Internet Access in Cooke County
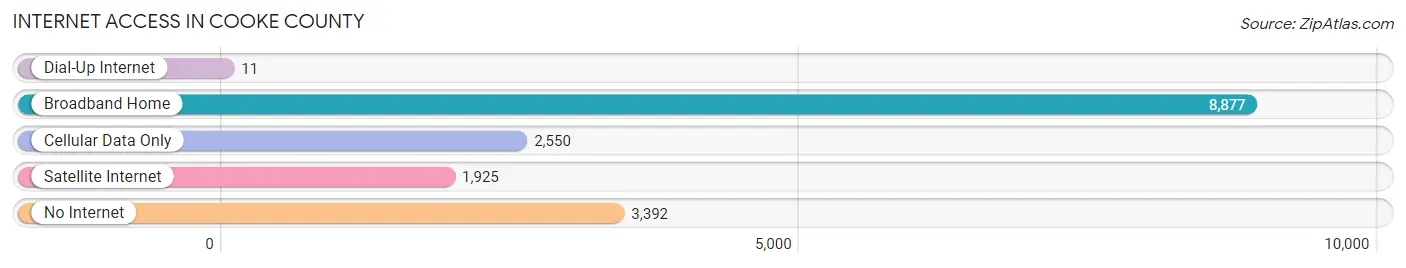
| Internet Type | # Households | % Households |
| Dial-Up Internet | 11 | 0.1% |
| Broadband Home | 8,877 | 54.8% |
| Cellular Data Only | 2,550 | 15.7% |
| Satellite Internet | 1,925 | 11.9% |
| No Internet | 3,392 | 20.9% |
| Total | 16,196 | 100.0% |
Cooke County Summary
Cooke County is located in the north-central region of Texas, and is part of the Texoma region. It is bordered by Grayson County to the north, Denton County to the east, Montague County to the west, and Wise County to the south. The county seat is Gainesville, and the largest city is Gainesville. As of the 2010 census, the population was 38,437.
History
Cooke County was established in 1848 and named after William G. Cooke, a soldier in the Texas Revolution. The county was originally part of Fannin County, and was later divided into Cooke, Grayson, and Fannin counties.
The first settlers in the area were Native Americans, including the Tonkawa, Comanche, and Wichita tribes. The first white settlers arrived in the 1840s, and the county was officially organized in 1848.
The county was largely agricultural in the 19th century, with cotton and corn being the main crops. The county also had a strong cattle industry, and the first railroad line was built in 1879.
Geography
Cooke County covers an area of 890 square miles, and is located in the north-central region of Texas. It is bordered by Grayson County to the north, Denton County to the east, Montague County to the west, and Wise County to the south.
The terrain of the county is mostly flat, with some rolling hills in the western part of the county. The county is drained by the Red River, which forms the northern border of the county.
Economy
The economy of Cooke County is largely based on agriculture and manufacturing. The county is home to several large manufacturing companies, including a Tyson Foods plant and a General Motors plant.
Agriculture is also an important part of the economy, with cotton, corn, and wheat being the main crops. Cattle ranching is also an important part of the economy, and the county is home to several large ranches.
Demographics
As of the 2010 census, the population of Cooke County was 38,437. The racial makeup of the county was 79.2% White, 11.7% Hispanic or Latino, 6.3% African American, 1.2% Native American, 0.5% Asian, and 1.1% from other races.
The median household income in the county was $45,945, and the median family income was $54,945. The per capita income was $22,845. About 11.2% of the population was below the poverty line.
Conclusion
Cooke County is located in the north-central region of Texas, and is part of the Texoma region. It is bordered by Grayson County to the north, Denton County to the east, Montague County to the west, and Wise County to the south. The county seat is Gainesville, and the largest city is Gainesville. As of the 2010 census, the population was 38,437. The economy of Cooke County is largely based on agriculture and manufacturing, with cotton, corn, and wheat being the main crops. Cattle ranching is also an important part of the economy, and the county is home to several large ranches. The racial makeup of the county was 79.2% White, 11.7% Hispanic or Latino, 6.3% African American, 1.2% Native American, 0.5% Asian, and 1.1% from other races. The median household income in the county was $45,945, and the median family income was $54,945. The per capita income was $22,845. About 11.2% of the population was below the poverty line.
Common Questions
What is Per Capita Income in Cooke County?
Per Capita income in Cooke County is $36,275.
What is the Median Family Income in Cooke County?
Median Family Income in Cooke County is $85,134.
What is the Median Household income in Cooke County?
Median Household Income in Cooke County is $66,374.
What is Income or Wage Gap in Cooke County?
Income or Wage Gap in Cooke County is 28.9%.
Women in Cooke County earn 71.1 cents for every dollar earned by a man.
What is Family Income Deficit in Cooke County?
Family Income Deficit in Cooke County is $8,803.
Families that are below poverty line in Cooke County earn $8,803 less on average than the poverty threshold level.
What is Inequality or Gini Index in Cooke County?
Inequality or Gini Index in Cooke County is 0.45.
What is the Total Population of Cooke County?
Total Population of Cooke County is 41,860.
What is the Total Male Population of Cooke County?
Total Male Population of Cooke County is 20,838.
What is the Total Female Population of Cooke County?
Total Female Population of Cooke County is 21,022.
What is the Ratio of Males per 100 Females in Cooke County?
There are 99.12 Males per 100 Females in Cooke County.
What is the Ratio of Females per 100 Males in Cooke County?
There are 100.88 Females per 100 Males in Cooke County.
What is the Median Population Age in Cooke County?
Median Population Age in Cooke County is 40.4 Years.
What is the Average Family Size in Cooke County
Average Family Size in Cooke County is 3.0 People.
What is the Average Household Size in Cooke County
Average Household Size in Cooke County is 2.5 People.
How Large is the Labor Force in Cooke County?
There are 20,854 People in the Labor Forcein in Cooke County.
What is the Percentage of People in the Labor Force in Cooke County?
62.8% of People are in the Labor Force in Cooke County.
What is the Unemployment Rate in Cooke County?
Unemployment Rate in Cooke County is 3.9%.