Concho County, TX Map & Demographics
Concho County Map
Concho County Overview
$24,207
PER CAPITA INCOME
$75,878
AVG FAMILY INCOME
$55,750
AVG HOUSEHOLD INCOME
24.4%
WAGE / INCOME GAP [ % ]
75.6¢/ $1
WAGE / INCOME GAP [ $ ]
$10,128
FAMILY INCOME DEFICIT
0.41
INEQUALITY / GINI INDEX
3,235
TOTAL POPULATION
1,793
MALE POPULATION
1,442
FEMALE POPULATION
124.34
MALES / 100 FEMALES
80.42
FEMALES / 100 MALES
46.4
MEDIAN AGE
3.9
AVG FAMILY SIZE
3.0
AVG HOUSEHOLD SIZE
1,019
LABOR FORCE [ PEOPLE ]
37.7%
PERCENT IN LABOR FORCE
2.3%
UNEMPLOYMENT RATE
Concho County Area Codes
Income in Concho County
Income Overview in Concho County
Per Capita Income in Concho County is $24,207, while median incomes of families and households are $75,878 and $55,750 respectively.
| Characteristic | Number | Measure |
| Per Capita Income | 3,235 | $24,207 |
| Median Family Income | 538 | $75,878 |
| Mean Family Income | 538 | $82,470 |
| Median Household Income | 816 | $55,750 |
| Mean Household Income | 816 | $67,435 |
| Income Deficit | 538 | $10,128 |
| Wage / Income Gap (%) | 3,235 | 24.38% |
| Wage / Income Gap ($) | 3,235 | 75.62¢ per $1 |
| Gini / Inequality Index | 3,235 | 0.41 |
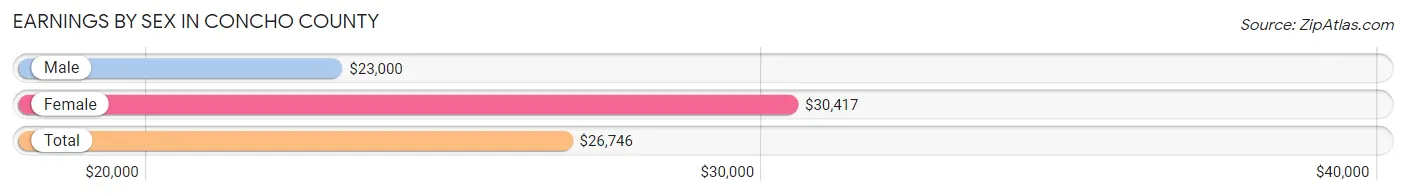
Earnings by Sex in Concho County
Average Earnings in Concho County are $26,746, $23,000 for men and $30,417 for women, a difference of 24.4%.
| Sex | Number | Average Earnings |
| Male | 666 (49.0%) | $23,000 |
| Female | 692 (51.0%) | $30,417 |
| Total | 1,358 (100.0%) | $26,746 |
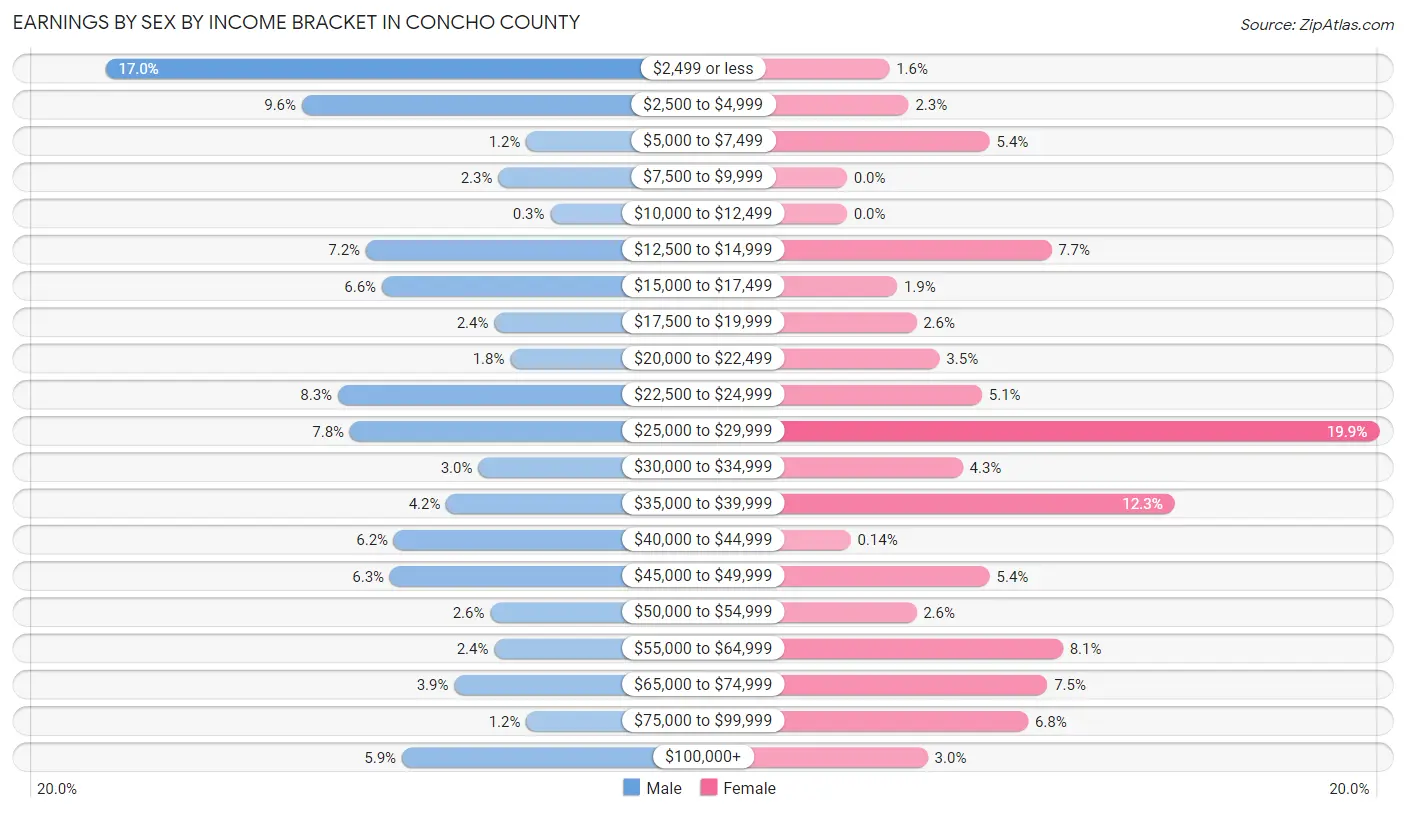
Earnings by Sex by Income Bracket in Concho County
The most common earnings brackets in Concho County are $2,499 or less for men (113 | 17.0%) and $25,000 to $29,999 for women (138 | 19.9%).
| Income | Male | Female |
| $2,499 or less | 113 (17.0%) | 11 (1.6%) |
| $2,500 to $4,999 | 64 (9.6%) | 16 (2.3%) |
| $5,000 to $7,499 | 8 (1.2%) | 37 (5.3%) |
| $7,500 to $9,999 | 15 (2.2%) | 0 (0.0%) |
| $10,000 to $12,499 | 2 (0.3%) | 0 (0.0%) |
| $12,500 to $14,999 | 48 (7.2%) | 53 (7.7%) |
| $15,000 to $17,499 | 44 (6.6%) | 13 (1.9%) |
| $17,500 to $19,999 | 16 (2.4%) | 18 (2.6%) |
| $20,000 to $22,499 | 12 (1.8%) | 24 (3.5%) |
| $22,500 to $24,999 | 55 (8.3%) | 35 (5.1%) |
| $25,000 to $29,999 | 52 (7.8%) | 138 (19.9%) |
| $30,000 to $34,999 | 20 (3.0%) | 30 (4.3%) |
| $35,000 to $39,999 | 28 (4.2%) | 85 (12.3%) |
| $40,000 to $44,999 | 41 (6.2%) | 1 (0.1%) |
| $45,000 to $49,999 | 42 (6.3%) | 37 (5.3%) |
| $50,000 to $54,999 | 17 (2.5%) | 18 (2.6%) |
| $55,000 to $64,999 | 16 (2.4%) | 56 (8.1%) |
| $65,000 to $74,999 | 26 (3.9%) | 52 (7.5%) |
| $75,000 to $99,999 | 8 (1.2%) | 47 (6.8%) |
| $100,000+ | 39 (5.9%) | 21 (3.0%) |
| Total | 666 (100.0%) | 692 (100.0%) |
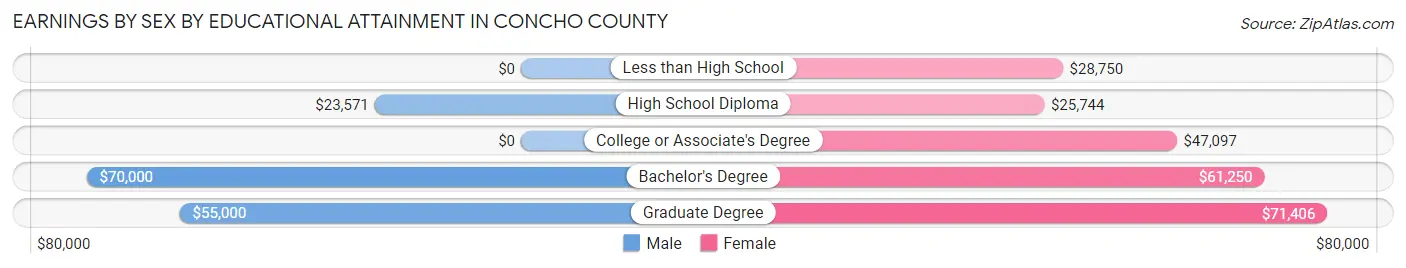
Earnings by Sex by Educational Attainment in Concho County
Average earnings in Concho County are $22,705 for men and $34,271 for women, a difference of 33.8%. Men with an educational attainment of bachelor's degree enjoy the highest average annual earnings of $70,000, while those with high school diploma education earn the least with $23,571. Women with an educational attainment of graduate degree earn the most with the average annual earnings of $71,406, while those with high school diploma education have the smallest earnings of $25,744.
| Educational Attainment | Male Income | Female Income |
| Less than High School | - | - |
| High School Diploma | $23,571 | $25,744 |
| College or Associate's Degree | - | - |
| Bachelor's Degree | $70,000 | $61,250 |
| Graduate Degree | $55,000 | $71,406 |
| Total | $22,705 | $34,271 |
Family Income in Concho County
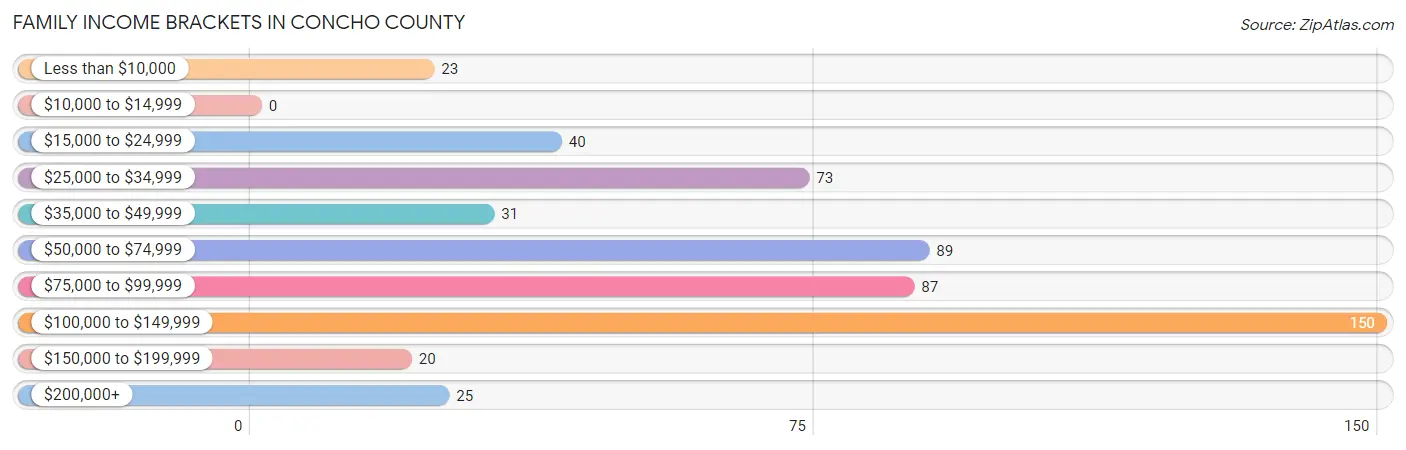
Family Income Brackets in Concho County
According to the Concho County family income data, there are 150 families falling into the $100,000 to $149,999 income range, which is the most common income bracket and makes up 27.9% of all families.
| Income Bracket | # Families | % Families |
| Less than $10,000 | 23 | 4.3% |
| $10,000 to $14,999 | 0 | 0.0% |
| $15,000 to $24,999 | 40 | 7.4% |
| $25,000 to $34,999 | 73 | 13.6% |
| $35,000 to $49,999 | 31 | 5.8% |
| $50,000 to $74,999 | 89 | 16.5% |
| $75,000 to $99,999 | 87 | 16.2% |
| $100,000 to $149,999 | 150 | 27.9% |
| $150,000 to $199,999 | 20 | 3.7% |
| $200,000+ | 25 | 4.6% |
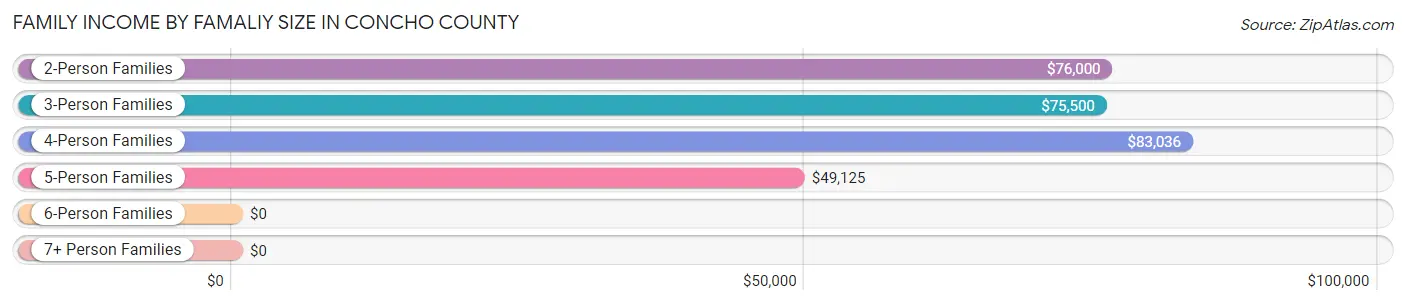
Family Income by Famaliy Size in Concho County
4-person families (72 | 13.4%) account for the highest median family income in Concho County with $83,036 per family, while 2-person families (350 | 65.1%) have the highest median income of $38,000 per family member.
| Income Bracket | # Families | Median Income |
| 2-Person Families | 350 (65.1%) | $76,000 |
| 3-Person Families | 90 (16.7%) | $75,500 |
| 4-Person Families | 72 (13.4%) | $83,036 |
| 5-Person Families | 13 (2.4%) | $49,125 |
| 6-Person Families | 0 (0.0%) | $0 |
| 7+ Person Families | 13 (2.4%) | $0 |
| Total | 538 (100.0%) | $75,878 |
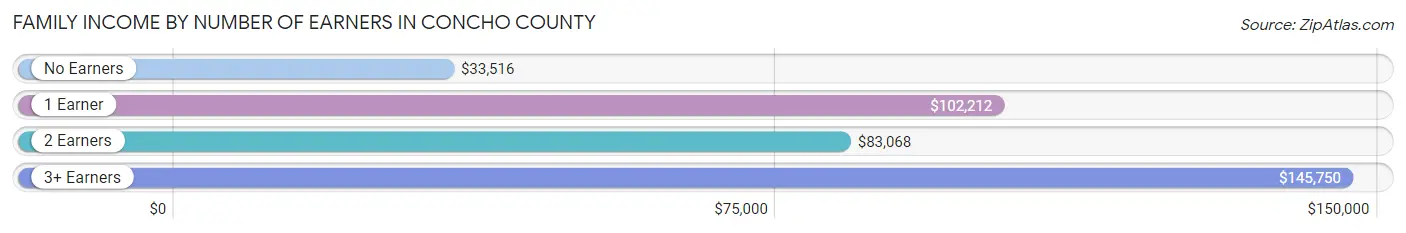
Family Income by Number of Earners in Concho County
The median family income in Concho County is $75,878, with families comprising 3+ earners (7) having the highest median family income of $145,750, while families with no earners (152) have the lowest median family income of $33,516, accounting for 1.3% and 28.2% of families, respectively.
| Number of Earners | # Families | Median Income |
| No Earners | 152 (28.2%) | $33,516 |
| 1 Earner | 215 (40.0%) | $102,212 |
| 2 Earners | 164 (30.5%) | $83,068 |
| 3+ Earners | 7 (1.3%) | $145,750 |
| Total | 538 (100.0%) | $75,878 |
Household Income in Concho County
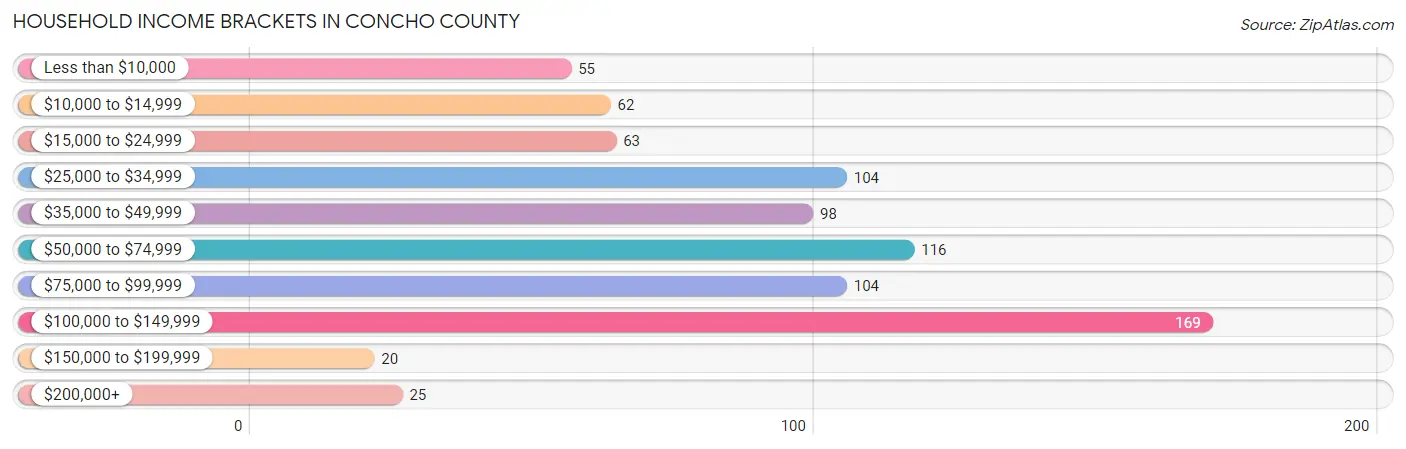
Household Income Brackets in Concho County
With 169 households falling in the category, the $100,000 to $149,999 income range is the most frequent in Concho County, accounting for 20.7% of all households. In contrast, only 20 households (2.5%) fall into the $150,000 to $199,999 income bracket, making it the least populous group.
| Income Bracket | # Households | % Households |
| Less than $10,000 | 55 | 6.7% |
| $10,000 to $14,999 | 62 | 7.6% |
| $15,000 to $24,999 | 63 | 7.7% |
| $25,000 to $34,999 | 104 | 12.7% |
| $35,000 to $49,999 | 98 | 12.0% |
| $50,000 to $74,999 | 116 | 14.2% |
| $75,000 to $99,999 | 104 | 12.7% |
| $100,000 to $149,999 | 169 | 20.7% |
| $150,000 to $199,999 | 20 | 2.5% |
| $200,000+ | 25 | 3.1% |
Household Income by Householder Age in Concho County
The median household income in Concho County is $55,750, with the highest median household income of $92,500 found in the 45 to 64 years age bracket for the primary householder. A total of 304 households (37.2%) fall into this category. Meanwhile, the 15 to 24 years age bracket for the primary householder has the lowest median household income of $0, with 8 households (1.0%) in this group.
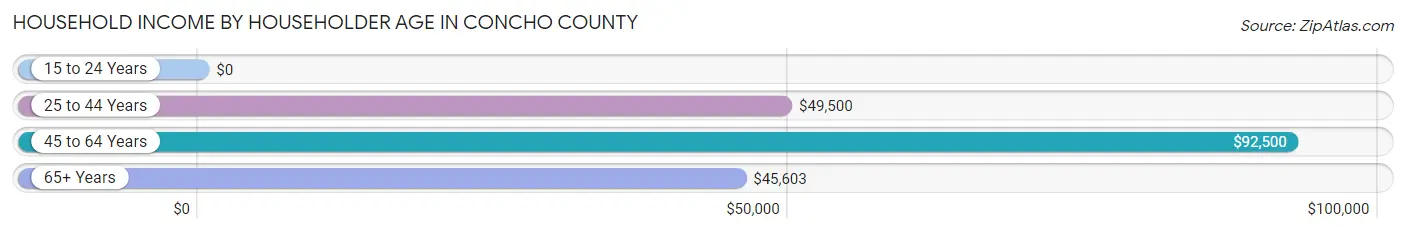
| Income Bracket | # Households | Median Income |
| 15 to 24 Years | 8 (1.0%) | $0 |
| 25 to 44 Years | 142 (17.4%) | $49,500 |
| 45 to 64 Years | 304 (37.2%) | $92,500 |
| 65+ Years | 362 (44.4%) | $45,603 |
| Total | 816 (100.0%) | $55,750 |
Poverty in Concho County
Income Below Poverty by Sex and Age in Concho County
With 18.5% poverty level for males and 14.1% for females among the residents of Concho County, 6 to 11 year old males and under 5 year old females are the most vulnerable to poverty, with 92 males (59.4%) and 50 females (83.3%) in their respective age groups living below the poverty level.
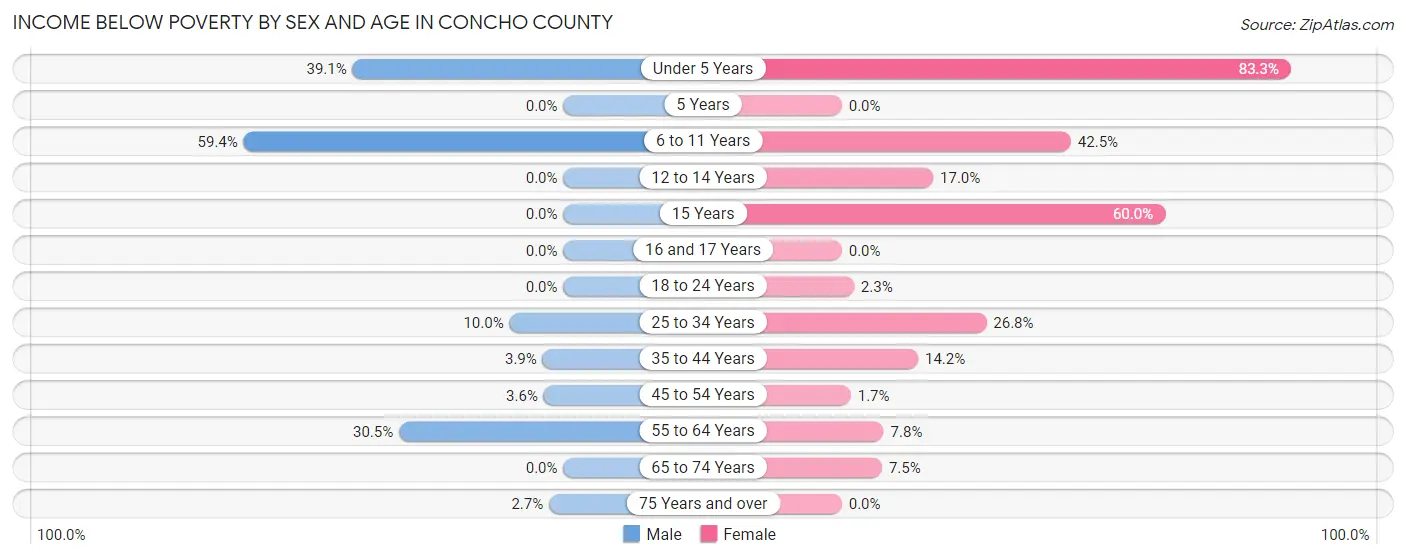
| Age Bracket | Male | Female |
| Under 5 Years | 27 (39.1%) | 50 (83.3%) |
| 5 Years | 0 (0.0%) | 0 (0.0%) |
| 6 to 11 Years | 92 (59.4%) | 37 (42.5%) |
| 12 to 14 Years | 0 (0.0%) | 10 (17.0%) |
| 15 Years | 0 (0.0%) | 9 (60.0%) |
| 16 and 17 Years | 0 (0.0%) | 0 (0.0%) |
| 18 to 24 Years | 0 (0.0%) | 2 (2.2%) |
| 25 to 34 Years | 1 (10.0%) | 33 (26.8%) |
| 35 to 44 Years | 1 (3.8%) | 15 (14.1%) |
| 45 to 54 Years | 2 (3.6%) | 4 (1.7%) |
| 55 to 64 Years | 61 (30.5%) | 16 (7.8%) |
| 65 to 74 Years | 0 (0.0%) | 21 (7.4%) |
| 75 Years and over | 4 (2.6%) | 0 (0.0%) |
| Total | 188 (18.5%) | 197 (14.1%) |
Income Above Poverty by Sex and Age in Concho County
According to the poverty statistics in Concho County, males aged 5 years and females aged 16 and 17 years are the age groups that are most secure financially, with 100.0% of males and 100.0% of females in these age groups living above the poverty line.
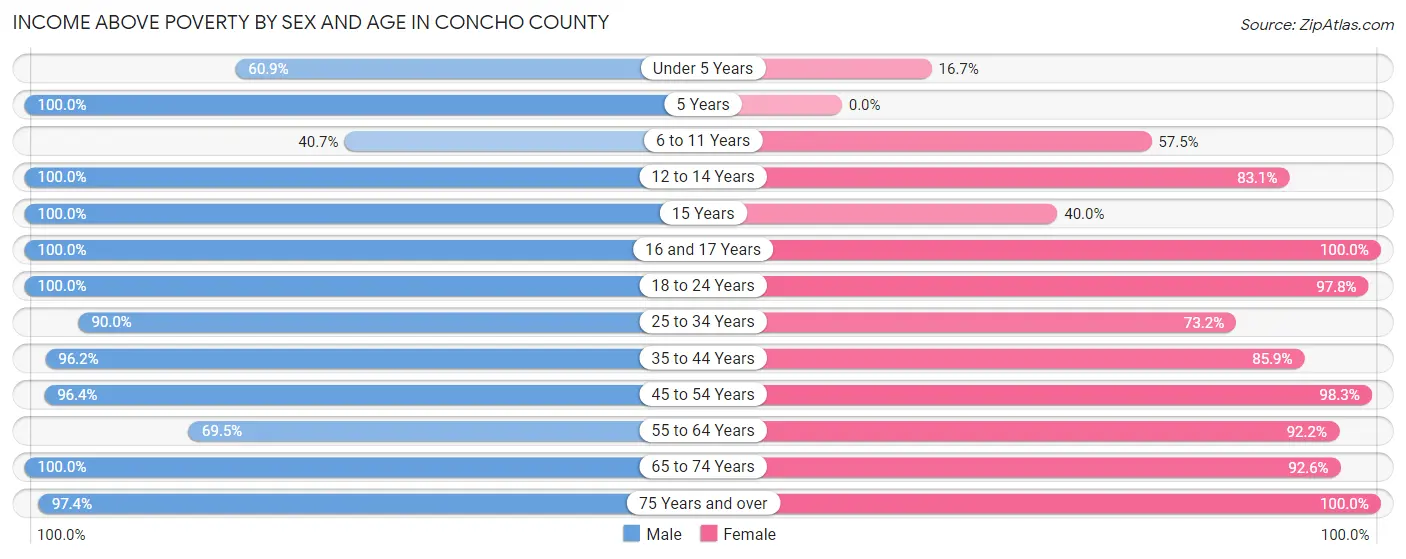
| Age Bracket | Male | Female |
| Under 5 Years | 42 (60.9%) | 10 (16.7%) |
| 5 Years | 4 (100.0%) | 0 (0.0%) |
| 6 to 11 Years | 63 (40.6%) | 50 (57.5%) |
| 12 to 14 Years | 68 (100.0%) | 49 (83.1%) |
| 15 Years | 16 (100.0%) | 6 (40.0%) |
| 16 and 17 Years | 31 (100.0%) | 27 (100.0%) |
| 18 to 24 Years | 22 (100.0%) | 87 (97.8%) |
| 25 to 34 Years | 9 (90.0%) | 90 (73.2%) |
| 35 to 44 Years | 25 (96.2%) | 91 (85.9%) |
| 45 to 54 Years | 53 (96.4%) | 235 (98.3%) |
| 55 to 64 Years | 139 (69.5%) | 190 (92.2%) |
| 65 to 74 Years | 210 (100.0%) | 261 (92.5%) |
| 75 Years and over | 147 (97.4%) | 107 (100.0%) |
| Total | 829 (81.5%) | 1,203 (85.9%) |
Income Below Poverty Among Married-Couple Families in Concho County
The poverty statistics for married-couple families in Concho County show that 5.1% or 22 of the total 429 families live below the poverty line. Families with 5 or more children have the highest poverty rate of 100.0%, comprising of 13 families. On the other hand, families with no children have the lowest poverty rate of 0.0%, which includes 0 families.
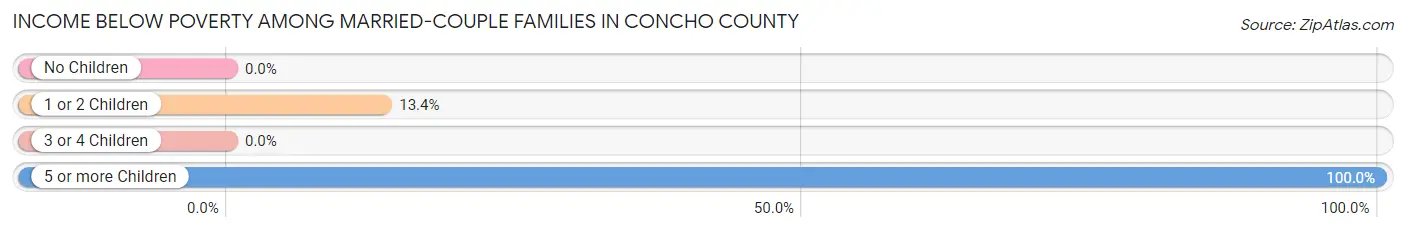
| Children | Above Poverty | Below Poverty |
| No Children | 337 (100.0%) | 0 (0.0%) |
| 1 or 2 Children | 58 (86.6%) | 9 (13.4%) |
| 3 or 4 Children | 12 (100.0%) | 0 (0.0%) |
| 5 or more Children | 0 (0.0%) | 13 (100.0%) |
| Total | 407 (94.9%) | 22 (5.1%) |
Income Below Poverty Among Single-Parent Households in Concho County
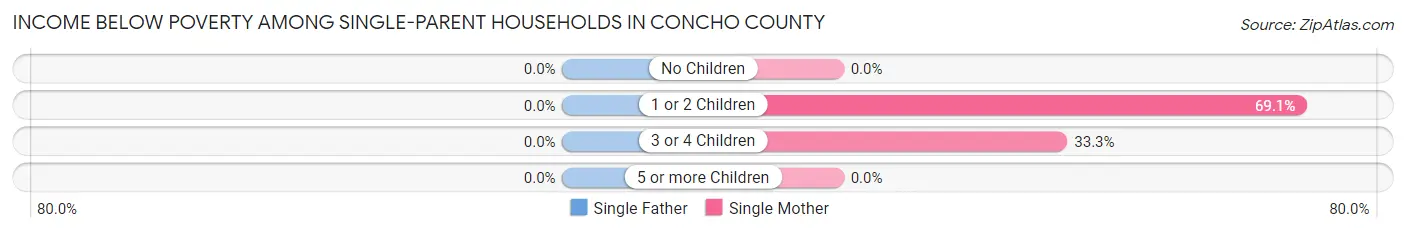
| Children | Single Father | Single Mother |
| No Children | 0 (0.0%) | 0 (0.0%) |
| 1 or 2 Children | 0 (0.0%) | 29 (69.1%) |
| 3 or 4 Children | 0 (0.0%) | 3 (33.3%) |
| 5 or more Children | 0 (0.0%) | 0 (0.0%) |
| Total | 0 (0.0%) | 32 (41.6%) |
Income Below Poverty Among Married-Couple vs Single-Parent Households in Concho County
The poverty data for Concho County shows that 22 of the married-couple family households (5.1%) and 32 of the single-parent households (29.4%) are living below the poverty level. Within the married-couple family households, those with 5 or more children have the highest poverty rate, with 13 households (100.0%) falling below the poverty line. Among the single-parent households, those with 1 or 2 children have the highest poverty rate, with 29 household (54.7%) living below poverty.
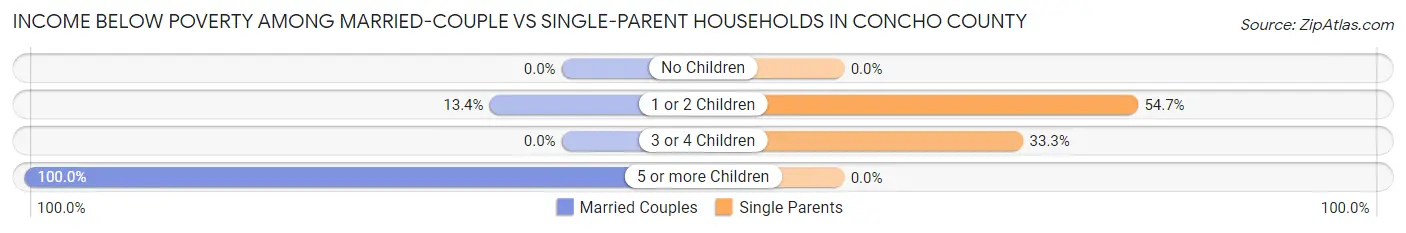
| Children | Married-Couple Families | Single-Parent Households |
| No Children | 0 (0.0%) | 0 (0.0%) |
| 1 or 2 Children | 9 (13.4%) | 29 (54.7%) |
| 3 or 4 Children | 0 (0.0%) | 3 (33.3%) |
| 5 or more Children | 13 (100.0%) | 0 (0.0%) |
| Total | 22 (5.1%) | 32 (29.4%) |
Race in Concho County
The most populous races in Concho County are White / Caucasian (2,451 | 75.8%), Hispanic or Latino (1,254 | 38.8%), and Two or more Races (530 | 16.4%).
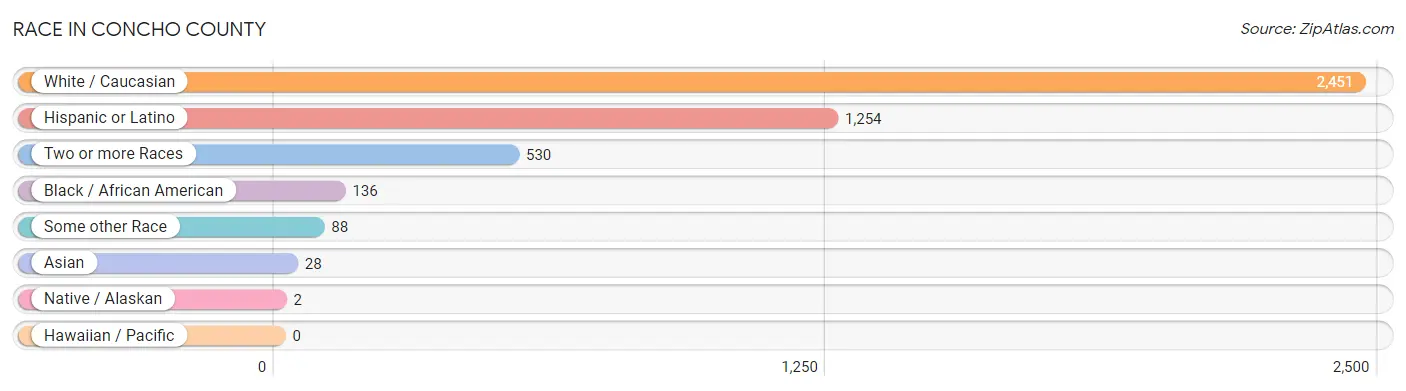
| Race | # Population | % Population |
| Asian | 28 | 0.9% |
| Black / African American | 136 | 4.2% |
| Hawaiian / Pacific | 0 | 0.0% |
| Hispanic or Latino | 1,254 | 38.8% |
| Native / Alaskan | 2 | 0.1% |
| White / Caucasian | 2,451 | 75.8% |
| Two or more Races | 530 | 16.4% |
| Some other Race | 88 | 2.7% |
| Total | 3,235 | 100.0% |
Ancestry in Concho County
The most populous ancestries reported in Concho County are Mexican (934 | 28.9%), German (525 | 16.2%), English (314 | 9.7%), European (305 | 9.4%), and Irish (266 | 8.2%), together accounting for 72.5% of all Concho County residents.
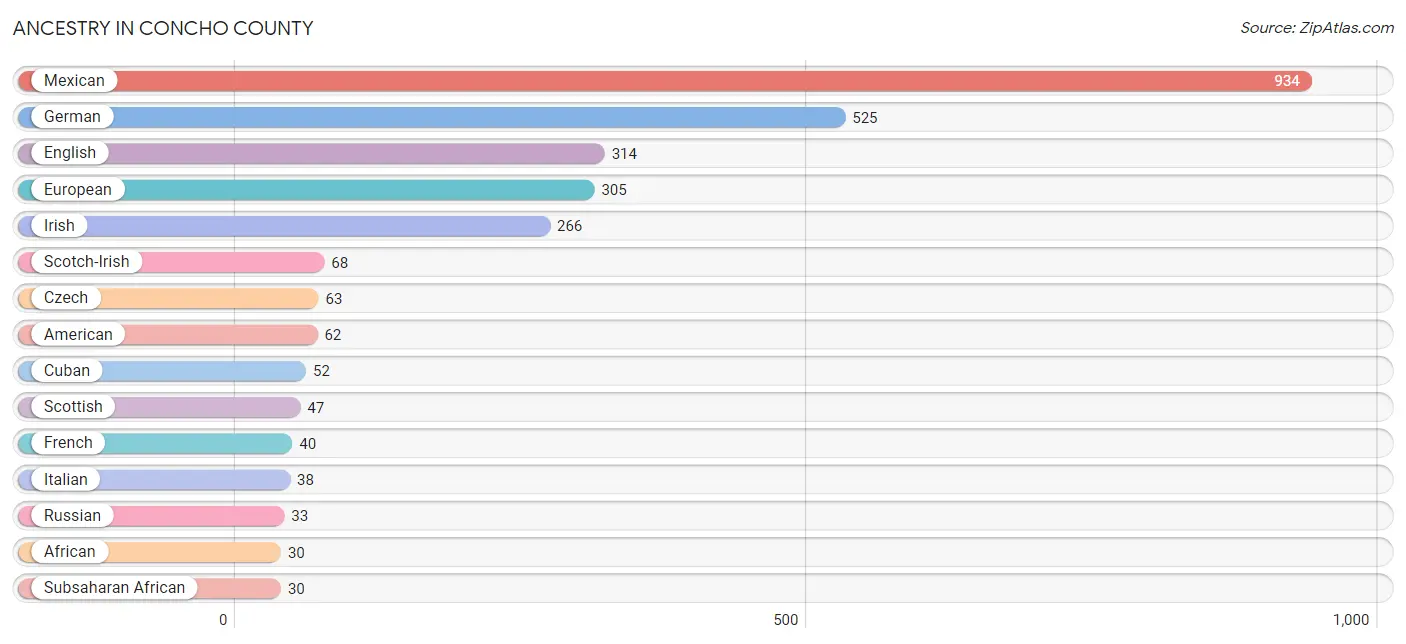
| Ancestry | # Population | % Population |
| African | 30 | 0.9% |
| American | 62 | 1.9% |
| Brazilian | 6 | 0.2% |
| British | 4 | 0.1% |
| Central American | 8 | 0.3% |
| Cuban | 52 | 1.6% |
| Czech | 63 | 1.9% |
| Czechoslovakian | 6 | 0.2% |
| Dutch | 7 | 0.2% |
| Dutch West Indian | 3 | 0.1% |
| Eastern European | 5 | 0.2% |
| English | 314 | 9.7% |
| European | 305 | 9.4% |
| French | 40 | 1.2% |
| French Canadian | 11 | 0.3% |
| German | 525 | 16.2% |
| Hungarian | 2 | 0.1% |
| Irish | 266 | 8.2% |
| Italian | 38 | 1.2% |
| Mexican | 934 | 28.9% |
| Northern European | 5 | 0.2% |
| Pakistani | 26 | 0.8% |
| Pima | 2 | 0.1% |
| Polish | 6 | 0.2% |
| Russian | 33 | 1.0% |
| Salvadoran | 8 | 0.3% |
| Scotch-Irish | 68 | 2.1% |
| Scottish | 47 | 1.5% |
| Spaniard | 2 | 0.1% |
| Subsaharan African | 30 | 0.9% |
| Swedish | 28 | 0.9% |
| Swiss | 5 | 0.2% |
| Thai | 10 | 0.3% | View All 33 Rows |
Immigrants in Concho County
The most numerous immigrant groups reported in Concho County came from Latin America (318 | 9.8%), Central America (244 | 7.5%), Mexico (205 | 6.3%), Caribbean (68 | 2.1%), and Cuba (68 | 2.1%), together accounting for 27.9% of all Concho County residents.
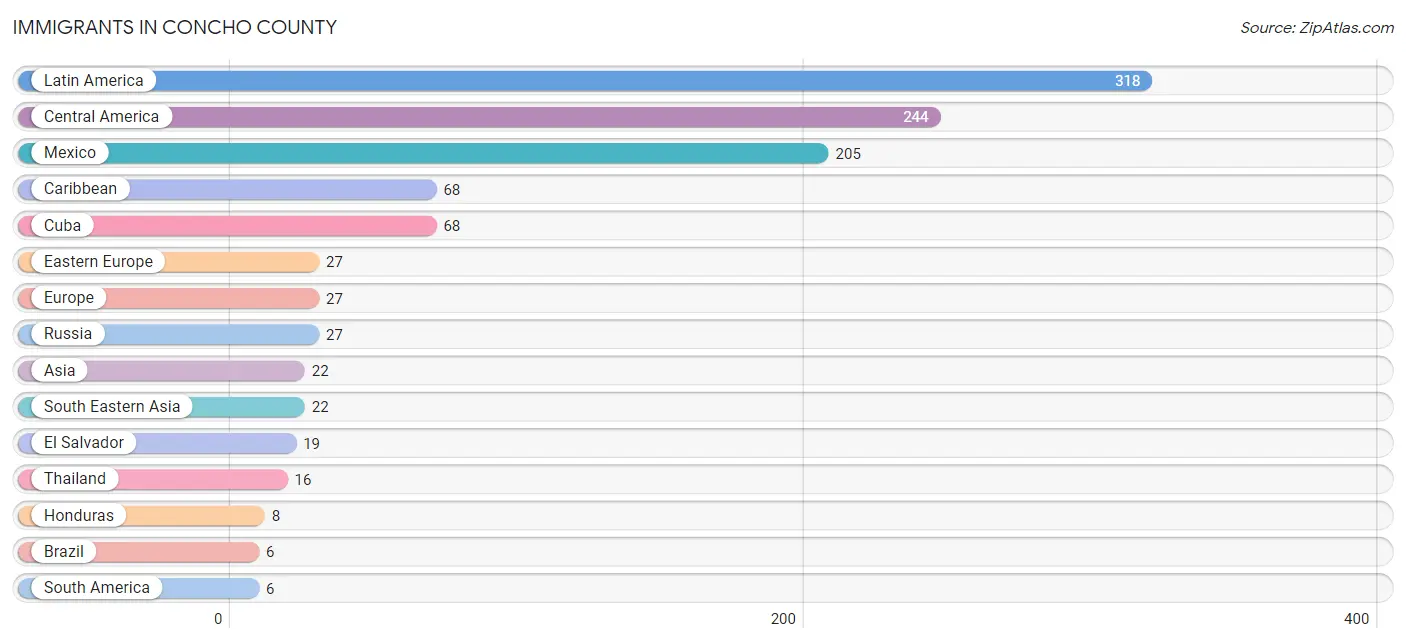
| Immigration Origin | # Population | % Population |
| Asia | 22 | 0.7% |
| Brazil | 6 | 0.2% |
| Caribbean | 68 | 2.1% |
| Central America | 244 | 7.5% |
| Cuba | 68 | 2.1% |
| Eastern Europe | 27 | 0.8% |
| El Salvador | 19 | 0.6% |
| Europe | 27 | 0.8% |
| Honduras | 8 | 0.3% |
| Latin America | 318 | 9.8% |
| Mexico | 205 | 6.3% |
| Philippines | 1 | 0.0% |
| Russia | 27 | 0.8% |
| South America | 6 | 0.2% |
| South Eastern Asia | 22 | 0.7% |
| Thailand | 16 | 0.5% |
| Vietnam | 5 | 0.2% | View All 17 Rows |
Sex and Age in Concho County
Sex and Age in Concho County
The most populous age groups in Concho County are 55 to 59 Years (186 | 10.4%) for men and 70 to 74 Years (178 | 12.3%) for women.
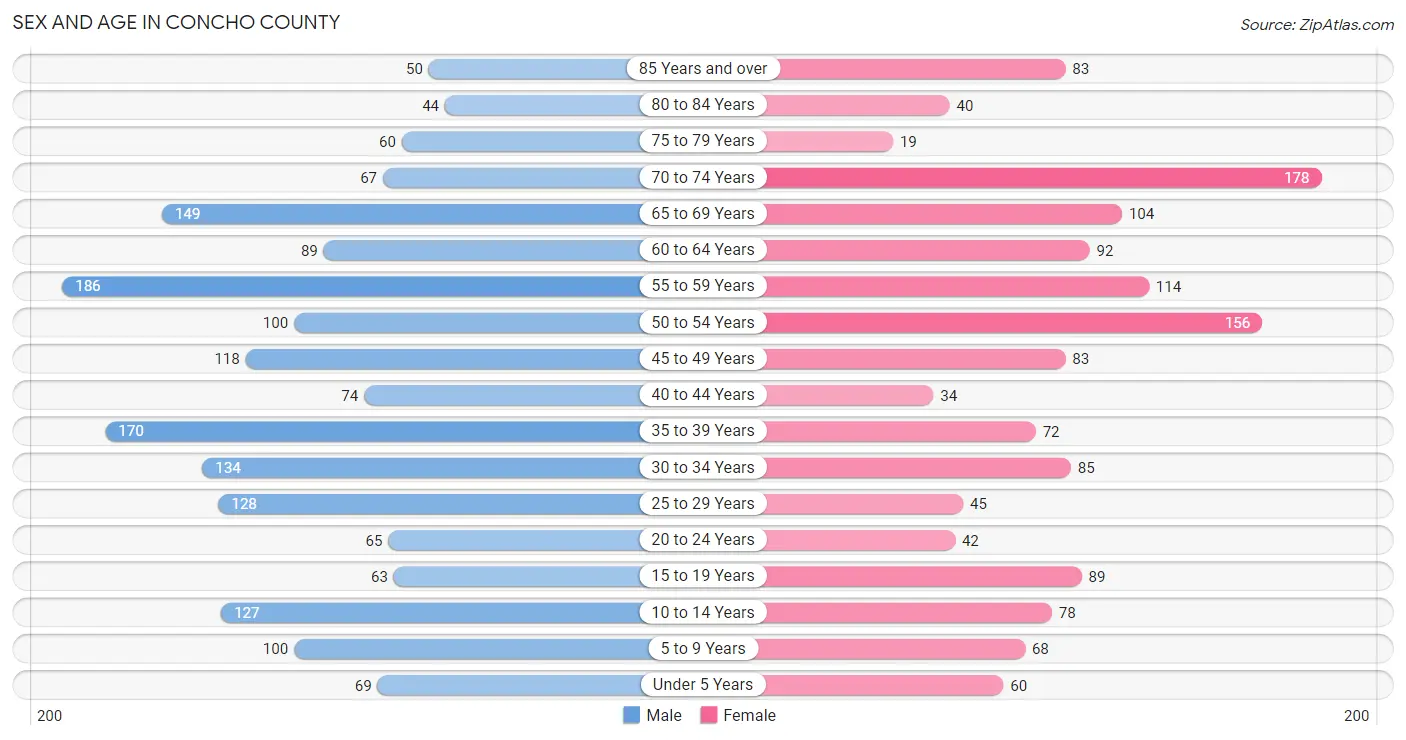
| Age Bracket | Male | Female |
| Under 5 Years | 69 (3.8%) | 60 (4.2%) |
| 5 to 9 Years | 100 (5.6%) | 68 (4.7%) |
| 10 to 14 Years | 127 (7.1%) | 78 (5.4%) |
| 15 to 19 Years | 63 (3.5%) | 89 (6.2%) |
| 20 to 24 Years | 65 (3.6%) | 42 (2.9%) |
| 25 to 29 Years | 128 (7.1%) | 45 (3.1%) |
| 30 to 34 Years | 134 (7.5%) | 85 (5.9%) |
| 35 to 39 Years | 170 (9.5%) | 72 (5.0%) |
| 40 to 44 Years | 74 (4.1%) | 34 (2.4%) |
| 45 to 49 Years | 118 (6.6%) | 83 (5.8%) |
| 50 to 54 Years | 100 (5.6%) | 156 (10.8%) |
| 55 to 59 Years | 186 (10.4%) | 114 (7.9%) |
| 60 to 64 Years | 89 (5.0%) | 92 (6.4%) |
| 65 to 69 Years | 149 (8.3%) | 104 (7.2%) |
| 70 to 74 Years | 67 (3.7%) | 178 (12.3%) |
| 75 to 79 Years | 60 (3.4%) | 19 (1.3%) |
| 80 to 84 Years | 44 (2.5%) | 40 (2.8%) |
| 85 Years and over | 50 (2.8%) | 83 (5.8%) |
| Total | 1,793 (100.0%) | 1,442 (100.0%) |
Families and Households in Concho County
Median Family Size in Concho County
The median family size in Concho County is 3.89 persons per family, with single male/father families (32 | 5.9%) accounting for the largest median family size of 6.22 persons per family. On the other hand, married-couple families (429 | 79.7%) represent the smallest median family size with 3.67 persons per family.
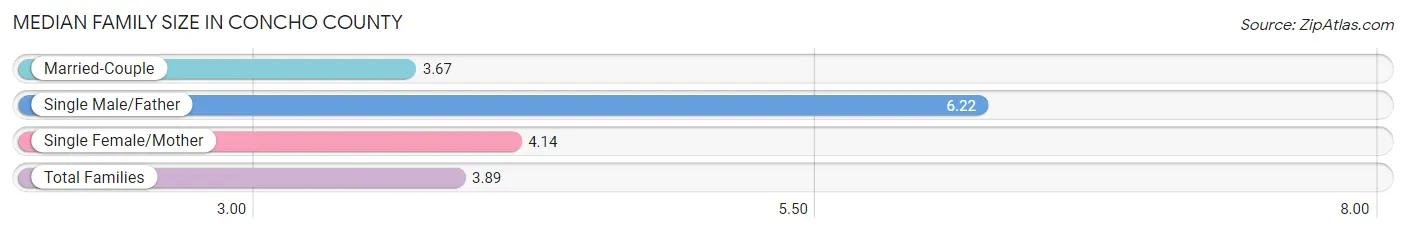
| Family Type | # Families | Family Size |
| Married-Couple | 429 (79.7%) | 3.67 |
| Single Male/Father | 32 (5.9%) | 6.22 |
| Single Female/Mother | 77 (14.3%) | 4.14 |
| Total Families | 538 (100.0%) | 3.89 |
Median Household Size in Concho County
The median household size in Concho County is 2.96 persons per household, with single male/father households (32 | 3.9%) accounting for the largest median household size of 6.31 persons per household. non-family households (278 | 34.1%) represent the smallest median household size with 1.15 persons per household.
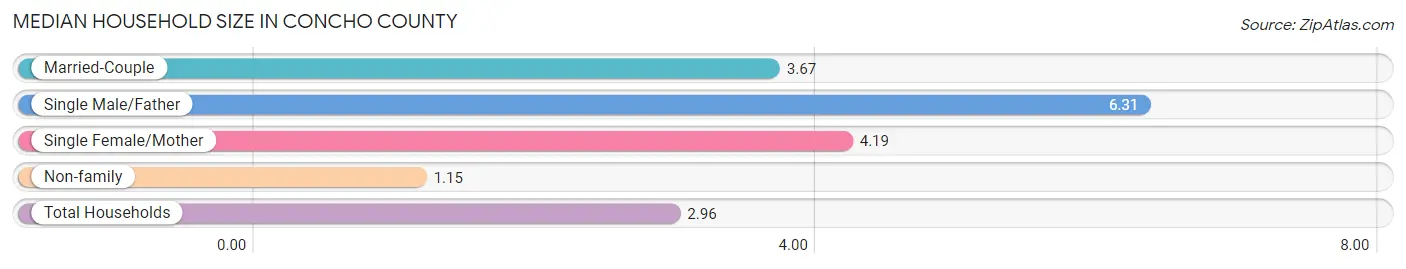
| Household Type | # Households | Household Size |
| Married-Couple | 429 (52.6%) | 3.67 |
| Single Male/Father | 32 (3.9%) | 6.31 |
| Single Female/Mother | 77 (9.4%) | 4.19 |
| Non-family | 278 (34.1%) | 1.15 |
| Total Households | 816 (100.0%) | 2.96 |
Household Size by Marriage Status in Concho County
Out of a total of 816 households in Concho County, 538 (65.9%) are family households, while 278 (34.1%) are nonfamily households. The most numerous type of family households are 2-person households, comprising 345, and the most common type of nonfamily households are 1-person households, comprising 264.
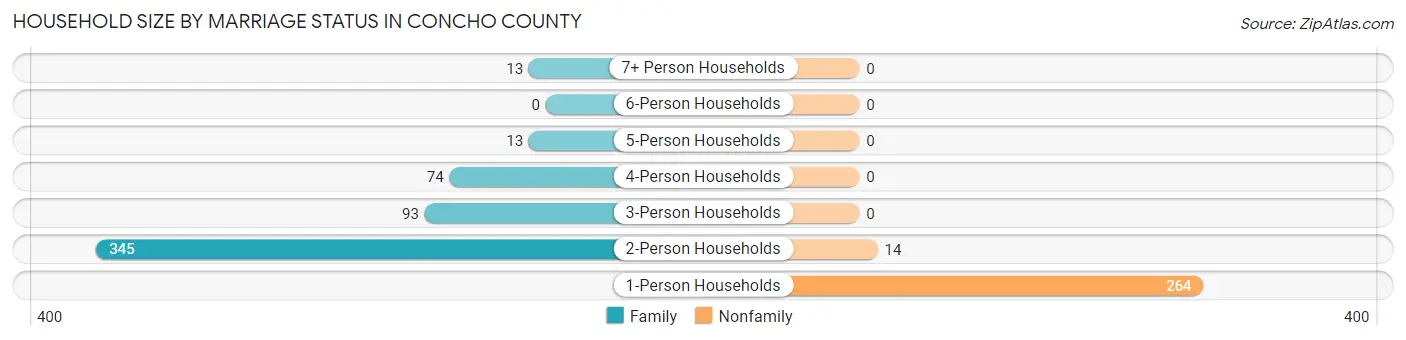
| Household Size | Family Households | Nonfamily Households |
| 1-Person Households | - | 264 (32.4%) |
| 2-Person Households | 345 (42.3%) | 14 (1.7%) |
| 3-Person Households | 93 (11.4%) | 0 (0.0%) |
| 4-Person Households | 74 (9.1%) | 0 (0.0%) |
| 5-Person Households | 13 (1.6%) | 0 (0.0%) |
| 6-Person Households | 0 (0.0%) | 0 (0.0%) |
| 7+ Person Households | 13 (1.6%) | 0 (0.0%) |
| Total | 538 (65.9%) | 278 (34.1%) |
Female Fertility in Concho County
Fertility by Age in Concho County
Average fertility rate in Concho County is 32.0 births per 1,000 women. Women in the age bracket of 20 to 34 years have the highest fertility rate with 87.0 births per 1,000 women. Women in the age bracket of 20 to 34 years acount for 100.0% of all women with births.
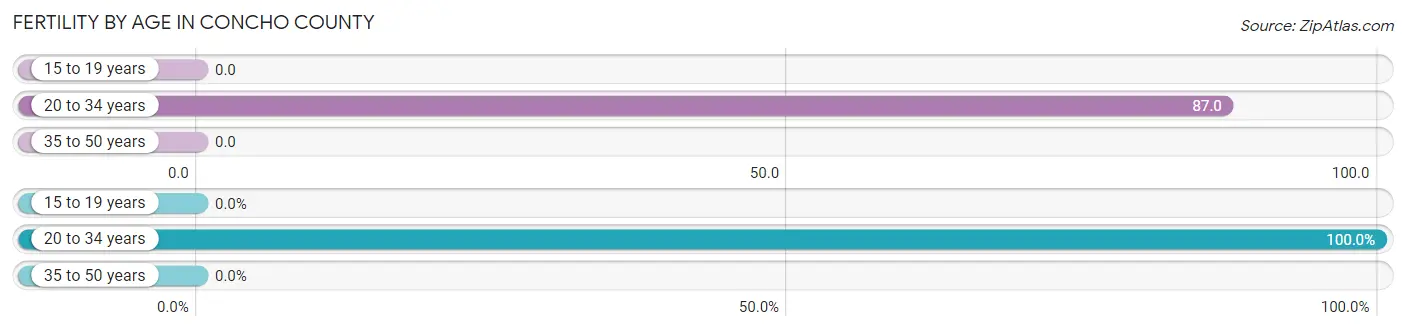
| Age Bracket | Women with Births | Births / 1,000 Women |
| 15 to 19 years | 0 (0.0%) | 0.0 |
| 20 to 34 years | 15 (100.0%) | 87.0 |
| 35 to 50 years | 0 (0.0%) | 0.0 |
| Total | 15 (100.0%) | 32.0 |
Fertility by Age by Marriage Status in Concho County
86.7% of women with births (15) in Concho County are married. The highest percentage of unmarried women with births falls into 20 to 34 years age bracket with 13.3% of them unmarried at the time of birth, while the lowest percentage of unmarried women with births belong to 20 to 34 years age bracket with 13.3% of them unmarried.
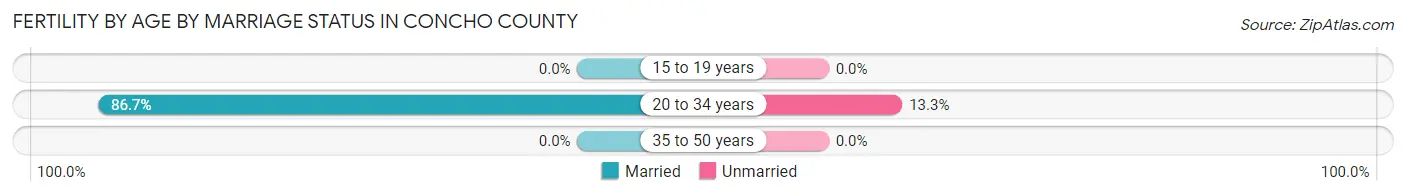
| Age Bracket | Married | Unmarried |
| 15 to 19 years | 0 (0.0%) | 0 (0.0%) |
| 20 to 34 years | 13 (86.7%) | 2 (13.3%) |
| 35 to 50 years | 0 (0.0%) | 0 (0.0%) |
| Total | 13 (86.7%) | 2 (13.3%) |
Fertility by Education in Concho County
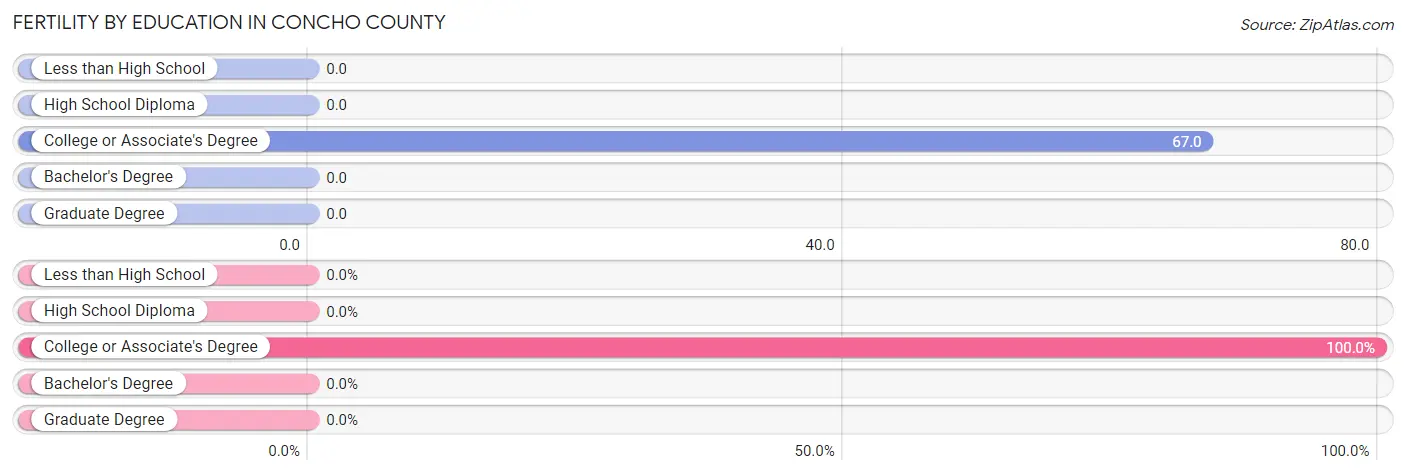
| Educational Attainment | Women with Births | Births / 1,000 Women |
| Less than High School | 0 (0.0%) | 0.0 |
| High School Diploma | 0 (0.0%) | 0.0 |
| College or Associate's Degree | 15 (100.0%) | 67.0 |
| Bachelor's Degree | 0 (0.0%) | 0.0 |
| Graduate Degree | 0 (0.0%) | 0.0 |
| Total | 15 (100.0%) | 32.0 |
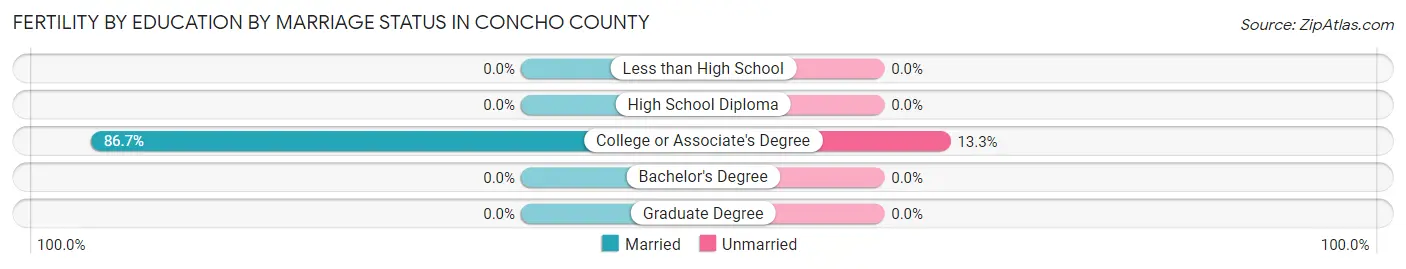
Fertility by Education by Marriage Status in Concho County
13.3% of women with births in Concho County are unmarried. Women with the educational attainment of college or associate's degree are most likely to be married with 86.7% of them married at childbirth, while women with the educational attainment of college or associate's degree are least likely to be married with 13.3% of them unmarried at childbirth.
| Educational Attainment | Married | Unmarried |
| Less than High School | 0 (0.0%) | 0 (0.0%) |
| High School Diploma | 0 (0.0%) | 0 (0.0%) |
| College or Associate's Degree | 13 (86.7%) | 2 (13.3%) |
| Bachelor's Degree | 0 (0.0%) | 0 (0.0%) |
| Graduate Degree | 0 (0.0%) | 0 (0.0%) |
| Total | 13 (86.7%) | 2 (13.3%) |
Employment Characteristics in Concho County
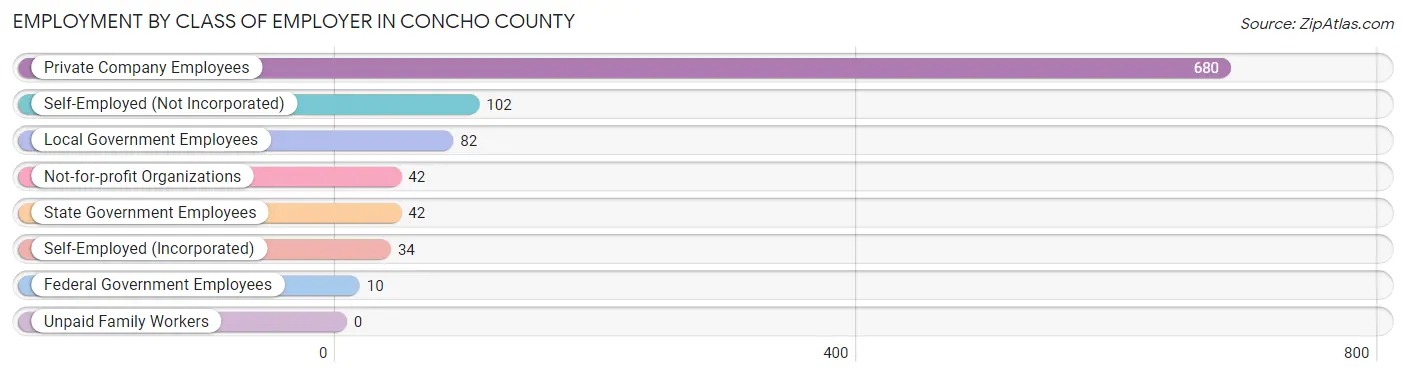
Employment by Class of Employer in Concho County
Among the 992 employed individuals in Concho County, private company employees (680 | 68.5%), self-employed (not incorporated) (102 | 10.3%), and local government employees (82 | 8.3%) make up the most common classes of employment.
| Employer Class | # Employees | % Employees |
| Private Company Employees | 680 | 68.5% |
| Self-Employed (Incorporated) | 34 | 3.4% |
| Self-Employed (Not Incorporated) | 102 | 10.3% |
| Not-for-profit Organizations | 42 | 4.2% |
| Local Government Employees | 82 | 8.3% |
| State Government Employees | 42 | 4.2% |
| Federal Government Employees | 10 | 1.0% |
| Unpaid Family Workers | 0 | 0.0% |
| Total | 992 | 100.0% |
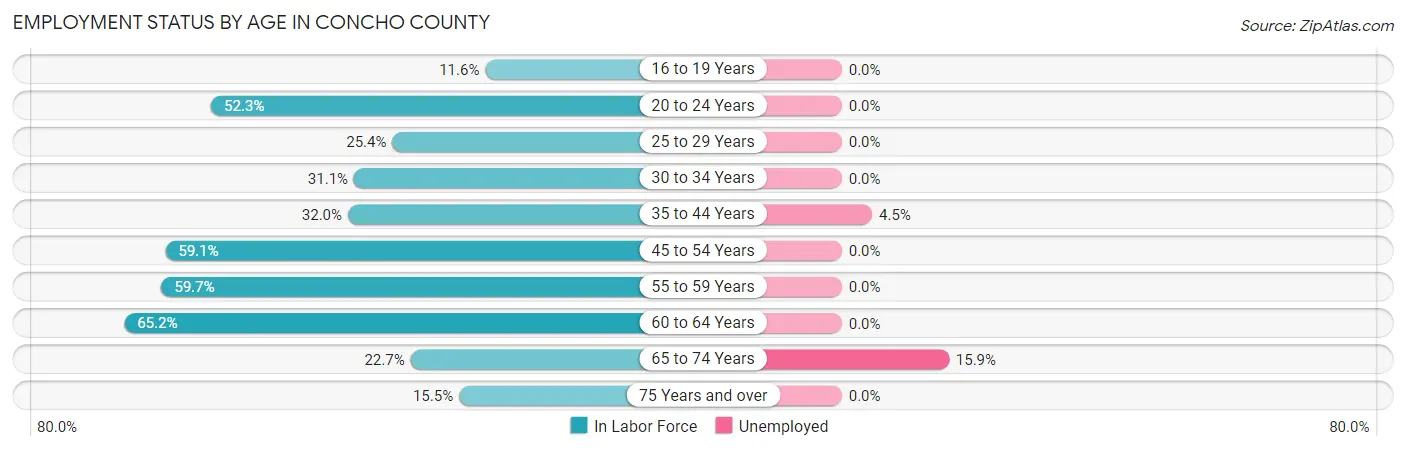
Employment Status by Age in Concho County
According to the labor force statistics for Concho County, out of the total population over 16 years of age (2,702), 37.7% or 1,019 individuals are in the labor force, with 2.3% or 23 of them unemployed. The age group with the highest labor force participation rate is 60 to 64 years, with 65.2% or 118 individuals in the labor force. Within the labor force, the 65 to 74 years age range has the highest percentage of unemployed individuals, with 15.9% or 18 of them being unemployed.
| Age Bracket | In Labor Force | Unemployed |
| 16 to 19 Years | 14 (11.6%) | 0 (0.0%) |
| 20 to 24 Years | 56 (52.3%) | 0 (0.0%) |
| 25 to 29 Years | 44 (25.4%) | 0 (0.0%) |
| 30 to 34 Years | 68 (31.1%) | 0 (0.0%) |
| 35 to 44 Years | 112 (32.0%) | 5 (4.5%) |
| 45 to 54 Years | 270 (59.1%) | 0 (0.0%) |
| 55 to 59 Years | 179 (59.7%) | 0 (0.0%) |
| 60 to 64 Years | 118 (65.2%) | 0 (0.0%) |
| 65 to 74 Years | 113 (22.7%) | 18 (15.9%) |
| 75 Years and over | 46 (15.5%) | 0 (0.0%) |
| Total | 1,019 (37.7%) | 23 (2.3%) |
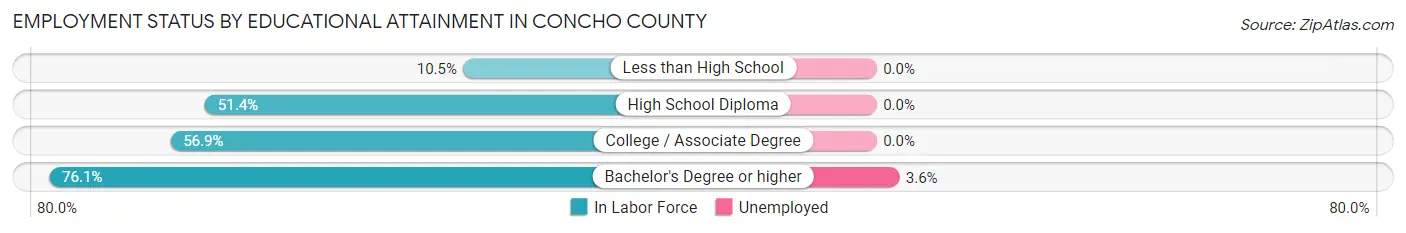
Employment Status by Educational Attainment in Concho County
According to labor force statistics for Concho County, 47.1% of individuals (791) out of the total population between 25 and 64 years of age (1,680) are in the labor force, with 0.6% or 5 of them being unemployed. The group with the highest labor force participation rate are those with the educational attainment of bachelor's degree or higher, with 76.1% or 140 individuals in the labor force. Within the labor force, individuals with bachelor's degree or higher education have the highest percentage of unemployment, with 3.6% or 5 of them being unemployed.
| Educational Attainment | In Labor Force | Unemployed |
| Less than High School | 37 (10.5%) | 0 (0.0%) |
| High School Diploma | 339 (51.4%) | 0 (0.0%) |
| College / Associate Degree | 275 (56.9%) | 0 (0.0%) |
| Bachelor's Degree or higher | 140 (76.1%) | 7 (3.6%) |
| Total | 791 (47.1%) | 10 (0.6%) |
Employment Occupations by Sex in Concho County
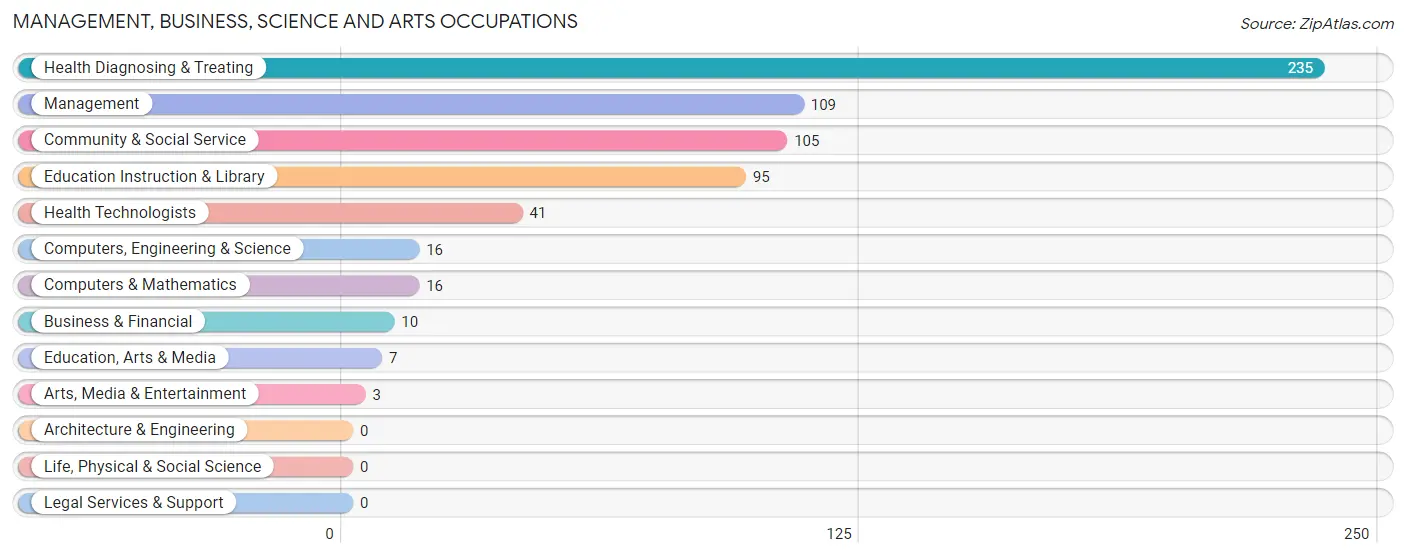
Management, Business, Science and Arts Occupations
The most common Management, Business, Science and Arts occupations in Concho County are Health Diagnosing & Treating (235 | 23.6%), Management (109 | 10.9%), Community & Social Service (105 | 10.5%), Education Instruction & Library (95 | 9.5%), and Health Technologists (41 | 4.1%).
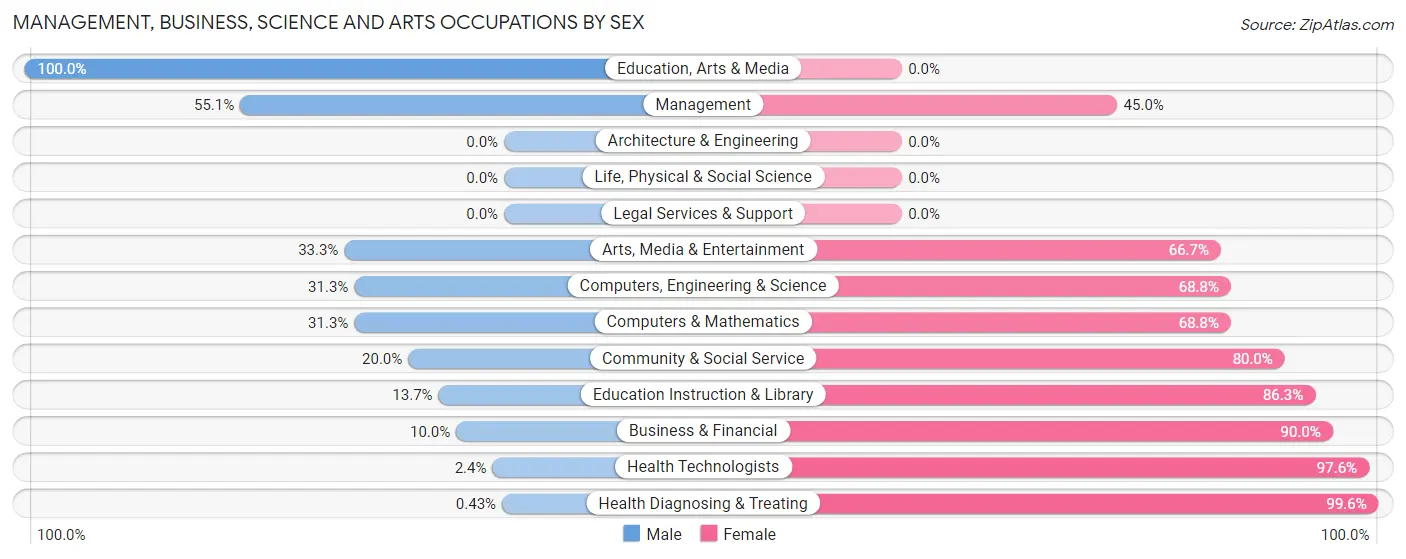
Management, Business, Science and Arts Occupations by Sex
Within the Management, Business, Science and Arts occupations in Concho County, the most male-oriented occupations are Education, Arts & Media (100.0%), Management (55.0%), and Arts, Media & Entertainment (33.3%), while the most female-oriented occupations are Health Diagnosing & Treating (99.6%), Health Technologists (97.6%), and Business & Financial (90.0%).
| Occupation | Male | Female |
| Management | 60 (55.0%) | 49 (45.0%) |
| Business & Financial | 1 (10.0%) | 9 (90.0%) |
| Computers, Engineering & Science | 5 (31.2%) | 11 (68.8%) |
| Computers & Mathematics | 5 (31.2%) | 11 (68.8%) |
| Architecture & Engineering | 0 (0.0%) | 0 (0.0%) |
| Life, Physical & Social Science | 0 (0.0%) | 0 (0.0%) |
| Community & Social Service | 21 (20.0%) | 84 (80.0%) |
| Education, Arts & Media | 7 (100.0%) | 0 (0.0%) |
| Legal Services & Support | 0 (0.0%) | 0 (0.0%) |
| Education Instruction & Library | 13 (13.7%) | 82 (86.3%) |
| Arts, Media & Entertainment | 1 (33.3%) | 2 (66.7%) |
| Health Diagnosing & Treating | 1 (0.4%) | 234 (99.6%) |
| Health Technologists | 1 (2.4%) | 40 (97.6%) |
| Total (Category) | 88 (18.5%) | 387 (81.5%) |
| Total (Overall) | 338 (33.9%) | 659 (66.1%) |
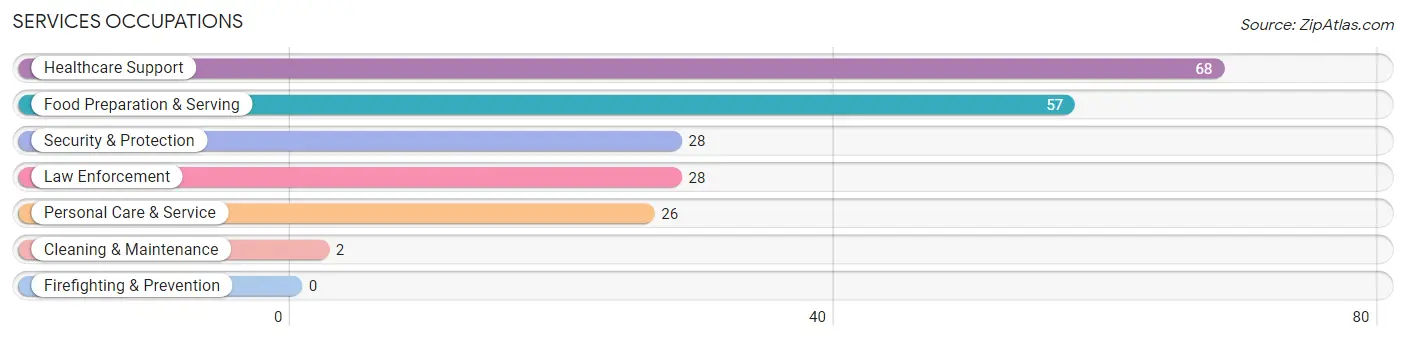
Services Occupations
The most common Services occupations in Concho County are Healthcare Support (68 | 6.8%), Food Preparation & Serving (57 | 5.7%), Security & Protection (28 | 2.8%), Law Enforcement (28 | 2.8%), and Personal Care & Service (26 | 2.6%).
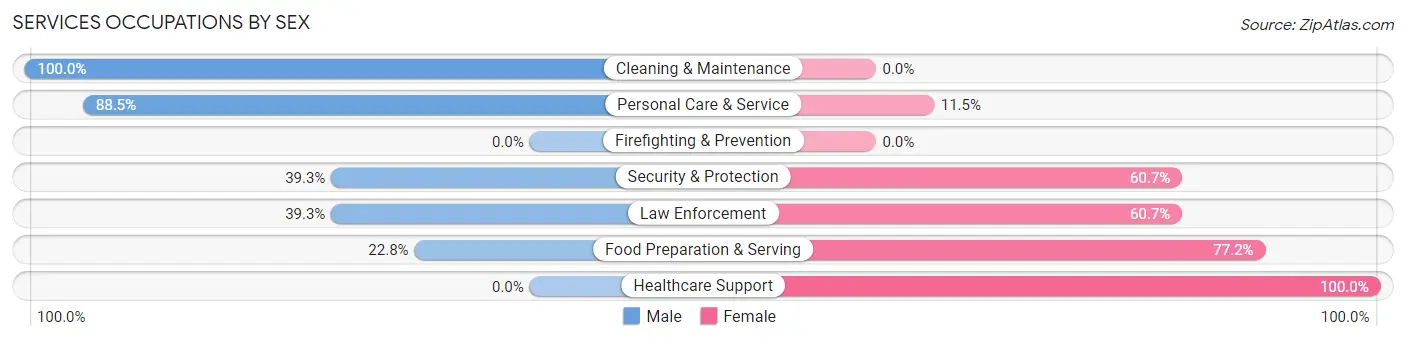
Services Occupations by Sex
Within the Services occupations in Concho County, the most male-oriented occupations are Cleaning & Maintenance (100.0%), Personal Care & Service (88.5%), and Security & Protection (39.3%), while the most female-oriented occupations are Healthcare Support (100.0%), Food Preparation & Serving (77.2%), and Security & Protection (60.7%).
| Occupation | Male | Female |
| Healthcare Support | 0 (0.0%) | 68 (100.0%) |
| Security & Protection | 11 (39.3%) | 17 (60.7%) |
| Firefighting & Prevention | 0 (0.0%) | 0 (0.0%) |
| Law Enforcement | 11 (39.3%) | 17 (60.7%) |
| Food Preparation & Serving | 13 (22.8%) | 44 (77.2%) |
| Cleaning & Maintenance | 2 (100.0%) | 0 (0.0%) |
| Personal Care & Service | 23 (88.5%) | 3 (11.5%) |
| Total (Category) | 49 (27.1%) | 132 (72.9%) |
| Total (Overall) | 338 (33.9%) | 659 (66.1%) |
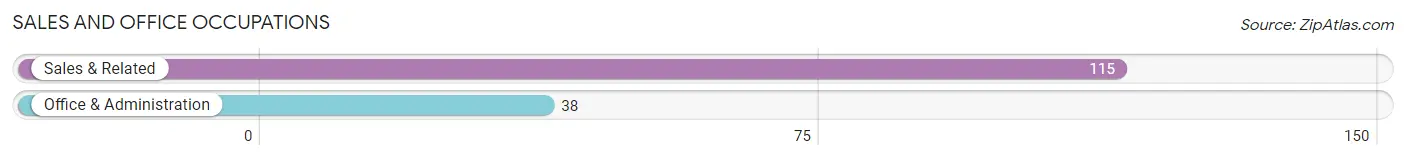
Sales and Office Occupations
The most common Sales and Office occupations in Concho County are Sales & Related (115 | 11.5%), and Office & Administration (38 | 3.8%).
Sales and Office Occupations by Sex
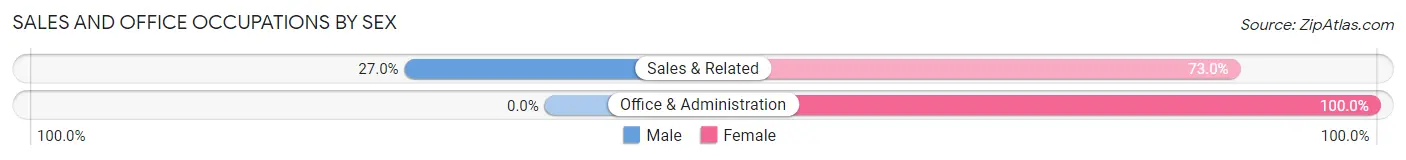
| Occupation | Male | Female |
| Sales & Related | 31 (27.0%) | 84 (73.0%) |
| Office & Administration | 0 (0.0%) | 38 (100.0%) |
| Total (Category) | 31 (20.3%) | 122 (79.7%) |
| Total (Overall) | 338 (33.9%) | 659 (66.1%) |
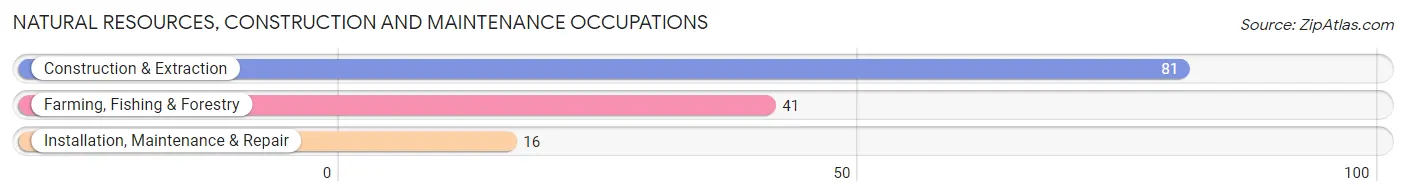
Natural Resources, Construction and Maintenance Occupations
The most common Natural Resources, Construction and Maintenance occupations in Concho County are Construction & Extraction (81 | 8.1%), Farming, Fishing & Forestry (41 | 4.1%), and Installation, Maintenance & Repair (16 | 1.6%).
Natural Resources, Construction and Maintenance Occupations by Sex
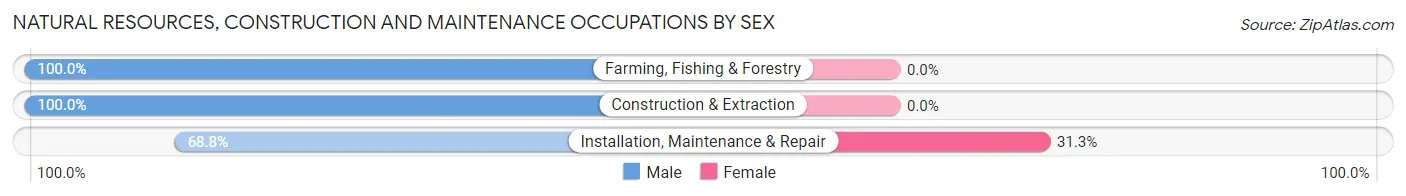
| Occupation | Male | Female |
| Farming, Fishing & Forestry | 41 (100.0%) | 0 (0.0%) |
| Construction & Extraction | 81 (100.0%) | 0 (0.0%) |
| Installation, Maintenance & Repair | 11 (68.8%) | 5 (31.2%) |
| Total (Category) | 133 (96.4%) | 5 (3.6%) |
| Total (Overall) | 338 (33.9%) | 659 (66.1%) |
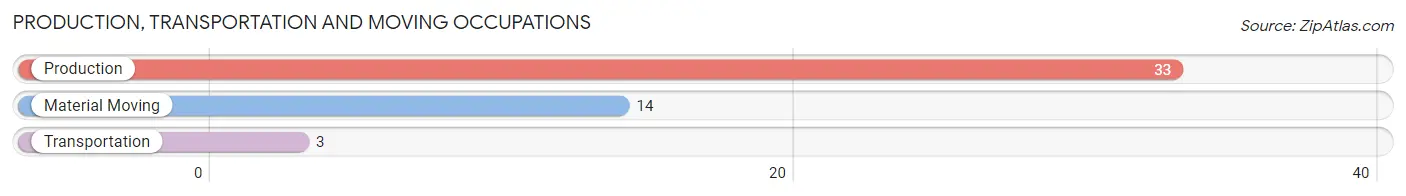
Production, Transportation and Moving Occupations
The most common Production, Transportation and Moving occupations in Concho County are Production (33 | 3.3%), Material Moving (14 | 1.4%), and Transportation (3 | 0.3%).
Production, Transportation and Moving Occupations by Sex
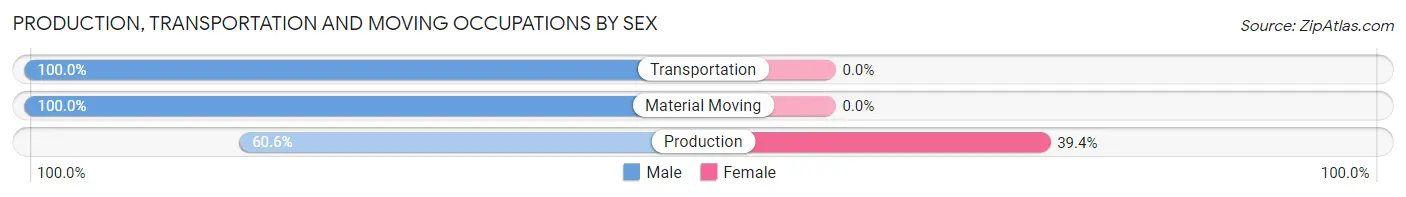
| Occupation | Male | Female |
| Production | 20 (60.6%) | 13 (39.4%) |
| Transportation | 3 (100.0%) | 0 (0.0%) |
| Material Moving | 14 (100.0%) | 0 (0.0%) |
| Total (Category) | 37 (74.0%) | 13 (26.0%) |
| Total (Overall) | 338 (33.9%) | 659 (66.1%) |
Employment Industries by Sex in Concho County
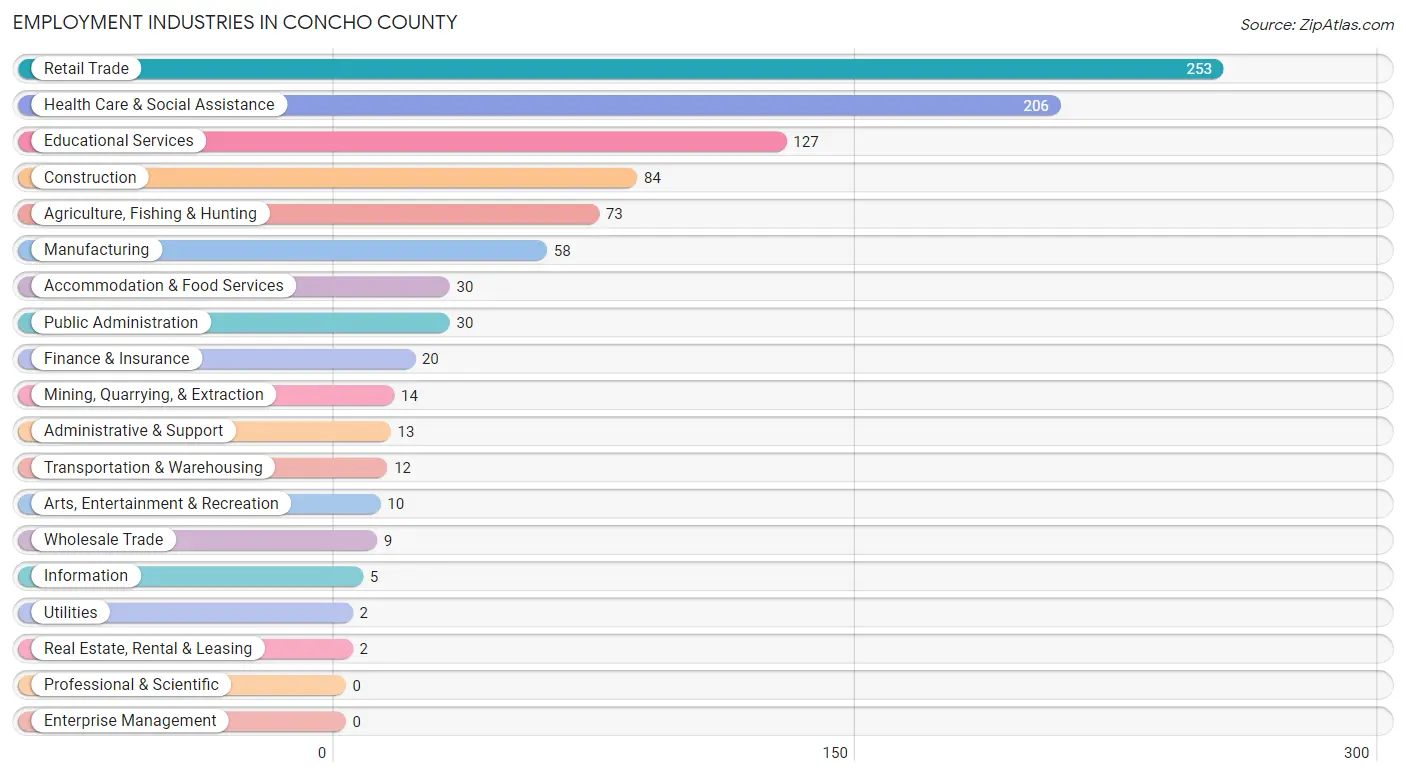
Employment Industries in Concho County
The major employment industries in Concho County include Retail Trade (253 | 25.4%), Health Care & Social Assistance (206 | 20.7%), Educational Services (127 | 12.7%), Construction (84 | 8.4%), and Agriculture, Fishing & Hunting (73 | 7.3%).
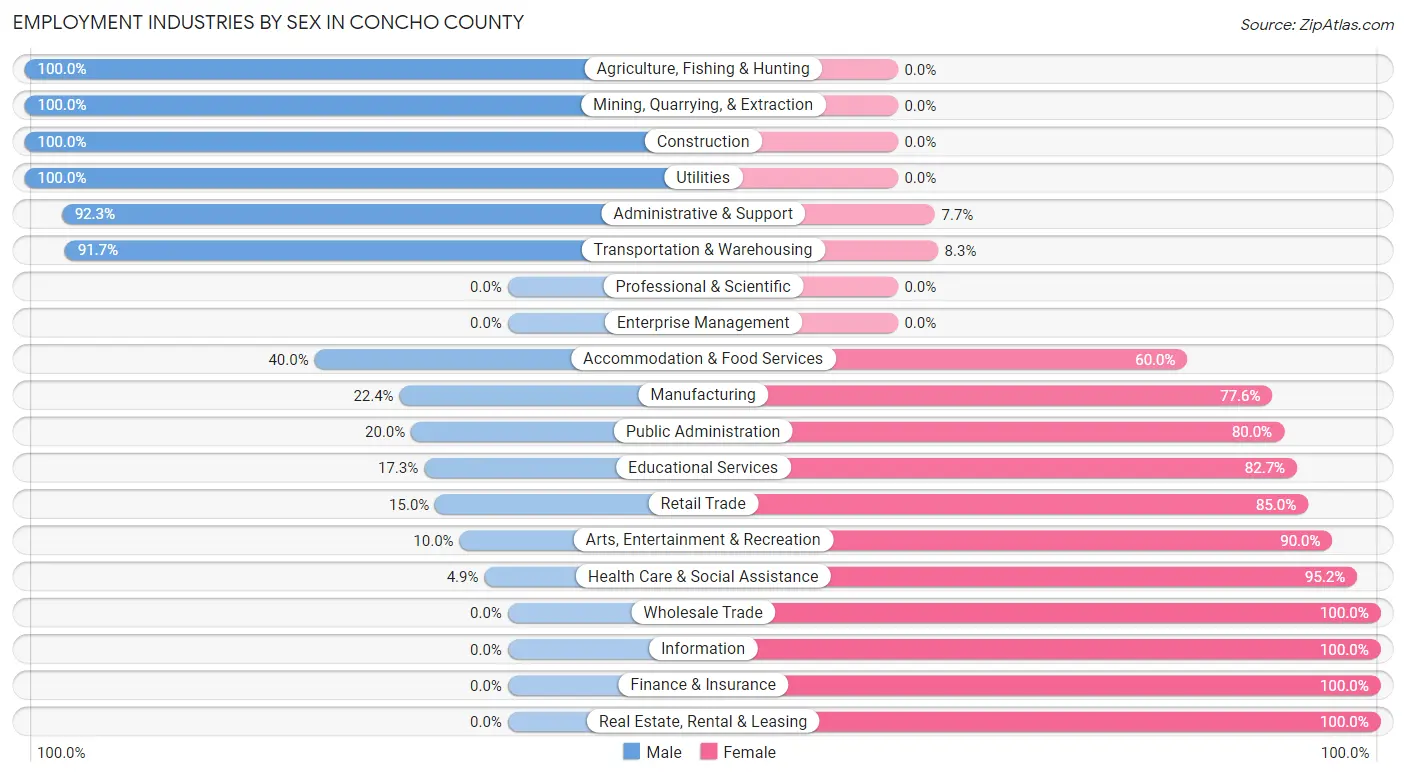
Employment Industries by Sex in Concho County
The Concho County industries that see more men than women are Agriculture, Fishing & Hunting (100.0%), Mining, Quarrying, & Extraction (100.0%), and Construction (100.0%), whereas the industries that tend to have a higher number of women are Wholesale Trade (100.0%), Information (100.0%), and Finance & Insurance (100.0%).
| Industry | Male | Female |
| Agriculture, Fishing & Hunting | 73 (100.0%) | 0 (0.0%) |
| Mining, Quarrying, & Extraction | 14 (100.0%) | 0 (0.0%) |
| Construction | 84 (100.0%) | 0 (0.0%) |
| Manufacturing | 13 (22.4%) | 45 (77.6%) |
| Wholesale Trade | 0 (0.0%) | 9 (100.0%) |
| Retail Trade | 38 (15.0%) | 215 (85.0%) |
| Transportation & Warehousing | 11 (91.7%) | 1 (8.3%) |
| Utilities | 2 (100.0%) | 0 (0.0%) |
| Information | 0 (0.0%) | 5 (100.0%) |
| Finance & Insurance | 0 (0.0%) | 20 (100.0%) |
| Real Estate, Rental & Leasing | 0 (0.0%) | 2 (100.0%) |
| Professional & Scientific | 0 (0.0%) | 0 (0.0%) |
| Enterprise Management | 0 (0.0%) | 0 (0.0%) |
| Administrative & Support | 12 (92.3%) | 1 (7.7%) |
| Educational Services | 22 (17.3%) | 105 (82.7%) |
| Health Care & Social Assistance | 10 (4.9%) | 196 (95.2%) |
| Arts, Entertainment & Recreation | 1 (10.0%) | 9 (90.0%) |
| Accommodation & Food Services | 12 (40.0%) | 18 (60.0%) |
| Public Administration | 6 (20.0%) | 24 (80.0%) |
| Total | 338 (33.9%) | 659 (66.1%) |
Education in Concho County
School Enrollment in Concho County
The most common levels of schooling among the 649 students in Concho County are high school (200 | 30.8%), middle school (198 | 30.5%), and elementary school (146 | 22.5%).
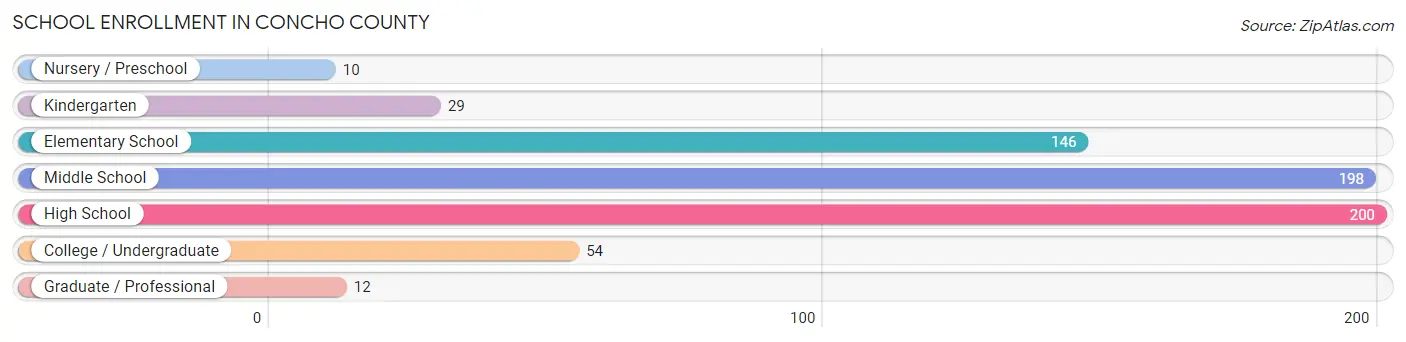
| School Level | # Students | % Students |
| Nursery / Preschool | 10 | 1.5% |
| Kindergarten | 29 | 4.5% |
| Elementary School | 146 | 22.5% |
| Middle School | 198 | 30.5% |
| High School | 200 | 30.8% |
| College / Undergraduate | 54 | 8.3% |
| Graduate / Professional | 12 | 1.8% |
| Total | 649 | 100.0% |
School Enrollment by Age by Funding Source in Concho County
Out of a total of 649 students who are enrolled in schools in Concho County, 28 (4.3%) attend a private institution, while the remaining 621 (95.7%) are enrolled in public schools. The age group of 3 to 4 year olds has the highest likelihood of being enrolled in private schools, with 10 (100.0% in the age bracket) enrolled. Conversely, the age group of 10 to 14 year olds has the lowest likelihood of being enrolled in a private school, with 205 (100.0% in the age bracket) attending a public institution.
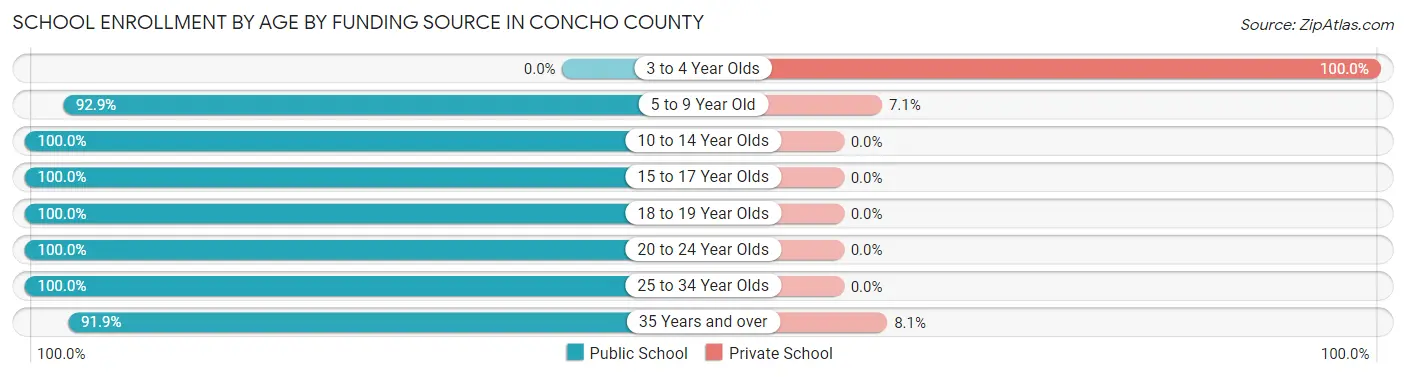
| Age Bracket | Public School | Private School |
| 3 to 4 Year Olds | 0 (0.0%) | 10 (100.0%) |
| 5 to 9 Year Old | 156 (92.9%) | 12 (7.1%) |
| 10 to 14 Year Olds | 205 (100.0%) | 0 (0.0%) |
| 15 to 17 Year Olds | 89 (100.0%) | 0 (0.0%) |
| 18 to 19 Year Olds | 49 (100.0%) | 0 (0.0%) |
| 20 to 24 Year Olds | 8 (100.0%) | 0 (0.0%) |
| 25 to 34 Year Olds | 46 (100.0%) | 0 (0.0%) |
| 35 Years and over | 68 (91.9%) | 6 (8.1%) |
| Total | 621 (95.7%) | 28 (4.3%) |
Educational Attainment by Field of Study in Concho County
Education (90 | 30.0%), business (55 | 18.3%), liberal arts & history (23 | 7.7%), bio, nature & agricultural (20 | 6.7%), and social sciences (15 | 5.0%) are the most common fields of study among 300 individuals in Concho County who have obtained a bachelor's degree or higher.
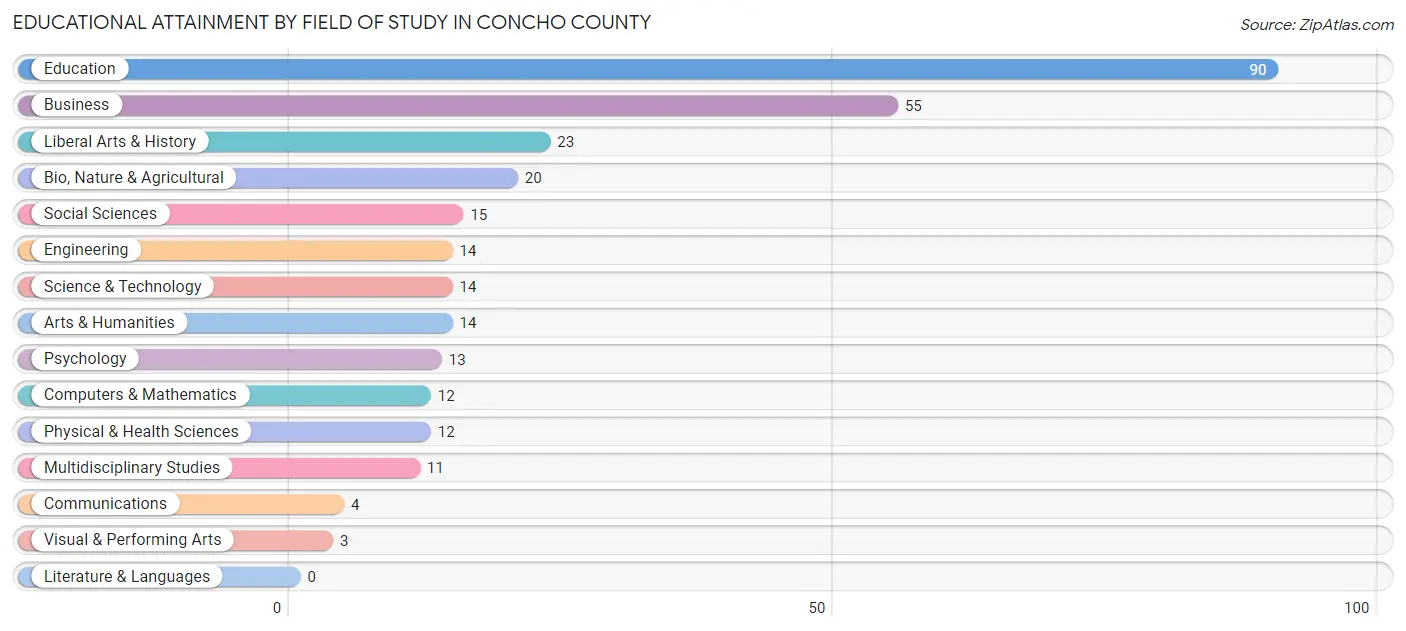
| Field of Study | # Graduates | % Graduates |
| Computers & Mathematics | 12 | 4.0% |
| Bio, Nature & Agricultural | 20 | 6.7% |
| Physical & Health Sciences | 12 | 4.0% |
| Psychology | 13 | 4.3% |
| Social Sciences | 15 | 5.0% |
| Engineering | 14 | 4.7% |
| Multidisciplinary Studies | 11 | 3.7% |
| Science & Technology | 14 | 4.7% |
| Business | 55 | 18.3% |
| Education | 90 | 30.0% |
| Literature & Languages | 0 | 0.0% |
| Liberal Arts & History | 23 | 7.7% |
| Visual & Performing Arts | 3 | 1.0% |
| Communications | 4 | 1.3% |
| Arts & Humanities | 14 | 4.7% |
| Total | 300 | 100.0% |
Transportation & Commute in Concho County
Vehicle Availability by Sex in Concho County
The most prevalent vehicle ownership categories in Concho County are males with 2 vehicles (154, accounting for 46.3%) and females with 2 vehicles (216, making up 23.4%).
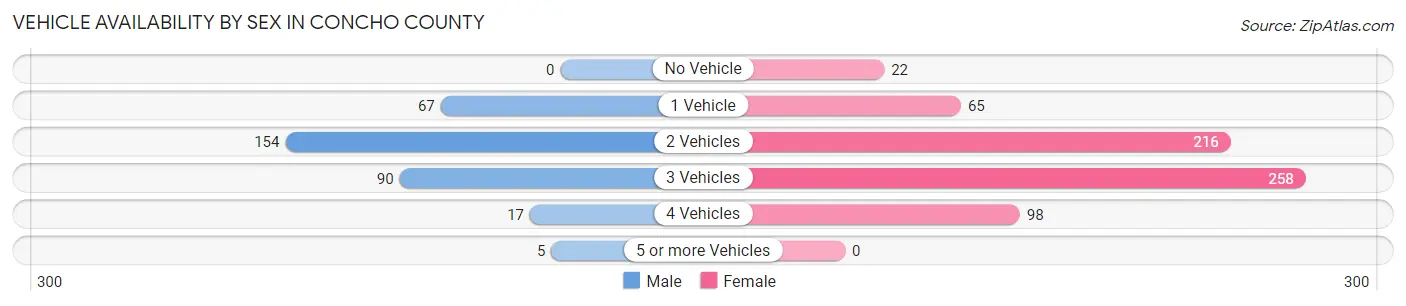
| Vehicles Available | Male | Female |
| No Vehicle | 0 (0.0%) | 22 (3.3%) |
| 1 Vehicle | 67 (20.1%) | 65 (9.9%) |
| 2 Vehicles | 154 (46.3%) | 216 (32.8%) |
| 3 Vehicles | 90 (27.0%) | 258 (39.2%) |
| 4 Vehicles | 17 (5.1%) | 98 (14.9%) |
| 5 or more Vehicles | 5 (1.5%) | 0 (0.0%) |
| Total | 333 (100.0%) | 659 (100.0%) |
Commute Time in Concho County
The most frequently occuring commute durations in Concho County are 40 to 44 minutes (201 commuters, 21.2%), 5 to 9 minutes (166 commuters, 17.5%), and less than 5 minutes (149 commuters, 15.7%).
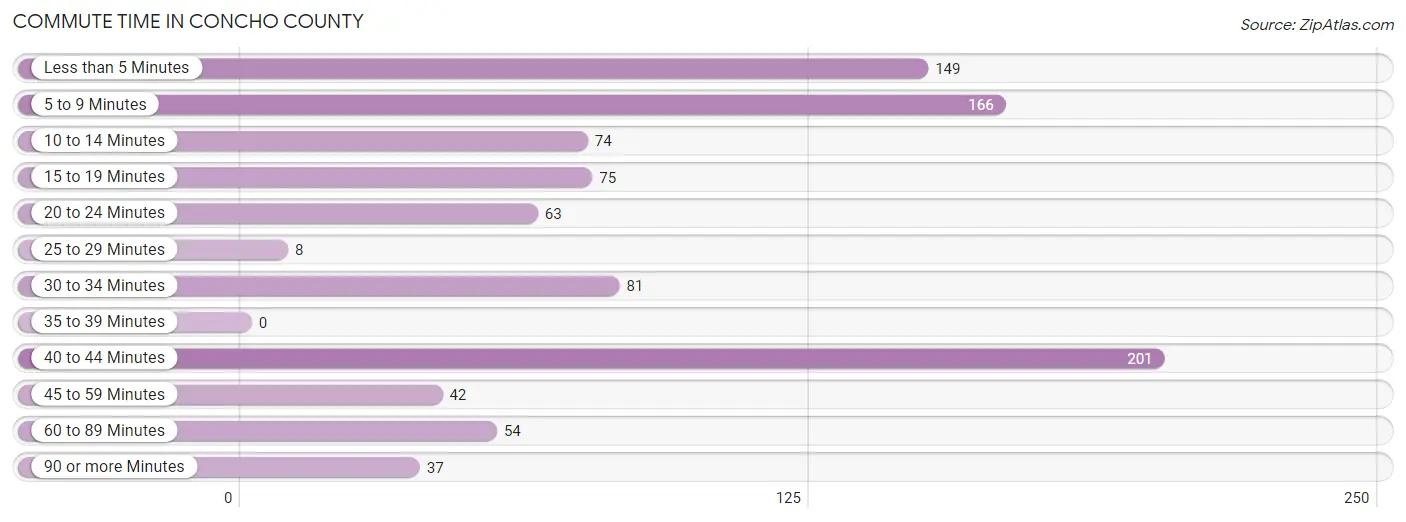
| Commute Time | # Commuters | % Commuters |
| Less than 5 Minutes | 149 | 15.7% |
| 5 to 9 Minutes | 166 | 17.5% |
| 10 to 14 Minutes | 74 | 7.8% |
| 15 to 19 Minutes | 75 | 7.9% |
| 20 to 24 Minutes | 63 | 6.6% |
| 25 to 29 Minutes | 8 | 0.8% |
| 30 to 34 Minutes | 81 | 8.5% |
| 35 to 39 Minutes | 0 | 0.0% |
| 40 to 44 Minutes | 201 | 21.2% |
| 45 to 59 Minutes | 42 | 4.4% |
| 60 to 89 Minutes | 54 | 5.7% |
| 90 or more Minutes | 37 | 3.9% |
Commute Time by Sex in Concho County
The most common commute times in Concho County are 5 to 9 minutes (65 commuters, 20.0%) for males and 40 to 44 minutes (194 commuters, 31.0%) for females.
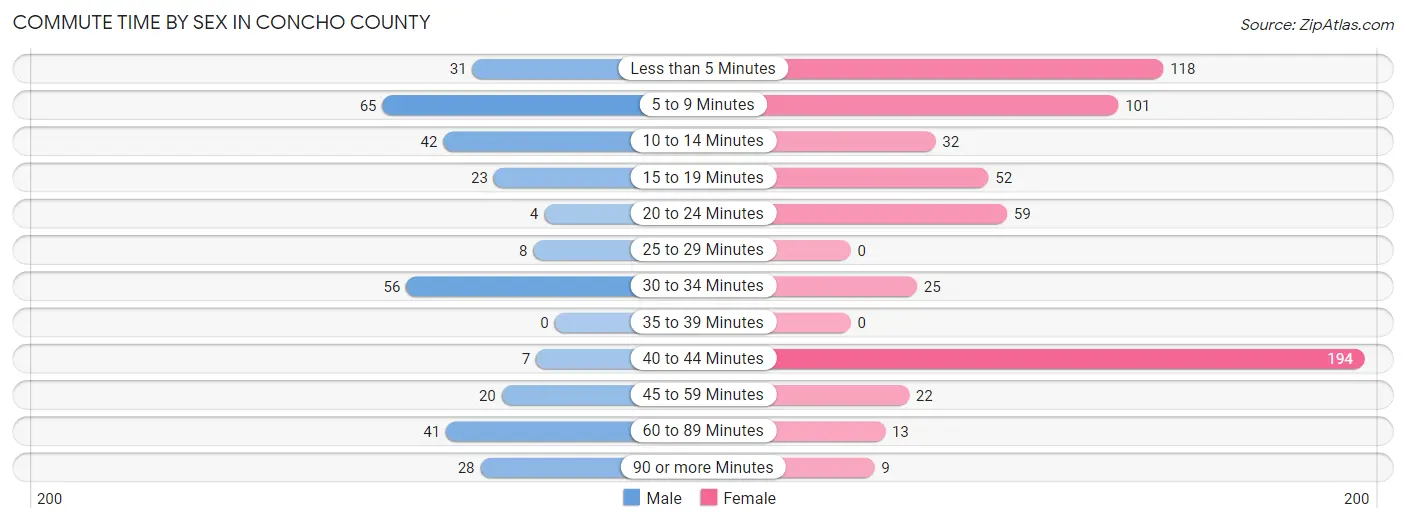
| Commute Time | Male | Female |
| Less than 5 Minutes | 31 (9.5%) | 118 (18.9%) |
| 5 to 9 Minutes | 65 (20.0%) | 101 (16.2%) |
| 10 to 14 Minutes | 42 (12.9%) | 32 (5.1%) |
| 15 to 19 Minutes | 23 (7.1%) | 52 (8.3%) |
| 20 to 24 Minutes | 4 (1.2%) | 59 (9.4%) |
| 25 to 29 Minutes | 8 (2.5%) | 0 (0.0%) |
| 30 to 34 Minutes | 56 (17.2%) | 25 (4.0%) |
| 35 to 39 Minutes | 0 (0.0%) | 0 (0.0%) |
| 40 to 44 Minutes | 7 (2.1%) | 194 (31.0%) |
| 45 to 59 Minutes | 20 (6.1%) | 22 (3.5%) |
| 60 to 89 Minutes | 41 (12.6%) | 13 (2.1%) |
| 90 or more Minutes | 28 (8.6%) | 9 (1.4%) |
Time of Departure to Work by Sex in Concho County
The most frequent times of departure to work in Concho County are 5:00 AM to 5:29 AM (55, 16.9%) for males and 7:30 AM to 7:59 AM (182, 29.1%) for females.
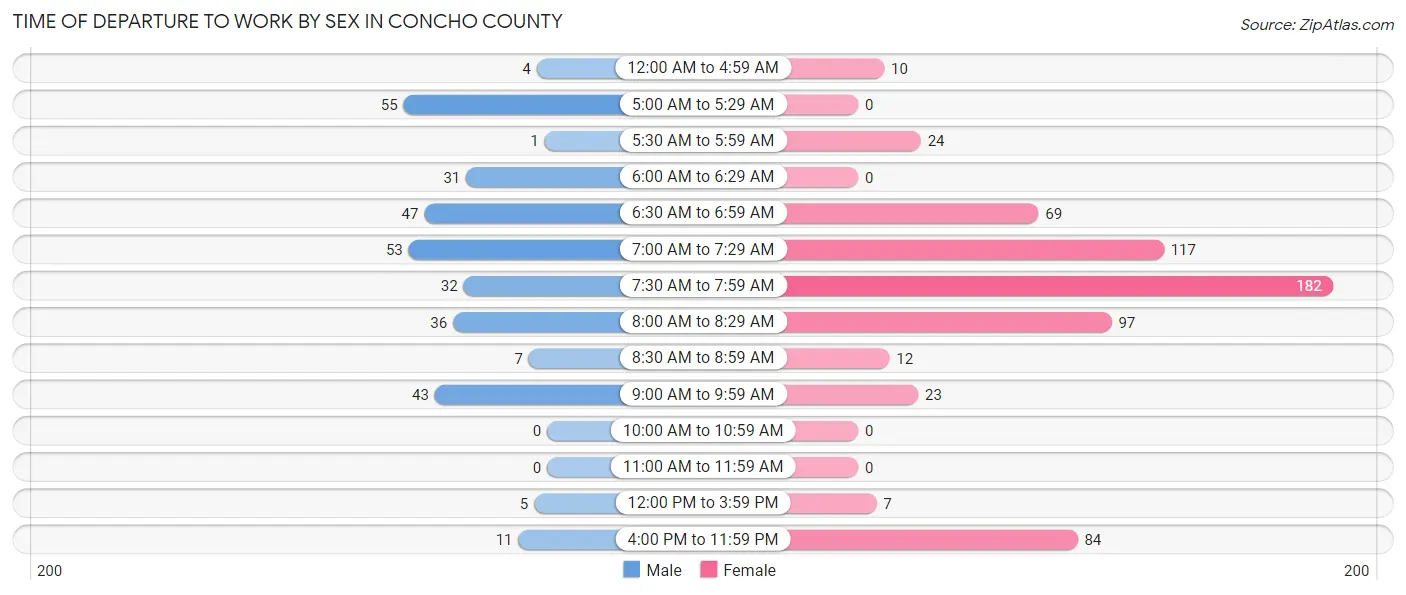
| Time of Departure | Male | Female |
| 12:00 AM to 4:59 AM | 4 (1.2%) | 10 (1.6%) |
| 5:00 AM to 5:29 AM | 55 (16.9%) | 0 (0.0%) |
| 5:30 AM to 5:59 AM | 1 (0.3%) | 24 (3.8%) |
| 6:00 AM to 6:29 AM | 31 (9.5%) | 0 (0.0%) |
| 6:30 AM to 6:59 AM | 47 (14.5%) | 69 (11.0%) |
| 7:00 AM to 7:29 AM | 53 (16.3%) | 117 (18.7%) |
| 7:30 AM to 7:59 AM | 32 (9.9%) | 182 (29.1%) |
| 8:00 AM to 8:29 AM | 36 (11.1%) | 97 (15.5%) |
| 8:30 AM to 8:59 AM | 7 (2.1%) | 12 (1.9%) |
| 9:00 AM to 9:59 AM | 43 (13.2%) | 23 (3.7%) |
| 10:00 AM to 10:59 AM | 0 (0.0%) | 0 (0.0%) |
| 11:00 AM to 11:59 AM | 0 (0.0%) | 0 (0.0%) |
| 12:00 PM to 3:59 PM | 5 (1.5%) | 7 (1.1%) |
| 4:00 PM to 11:59 PM | 11 (3.4%) | 84 (13.4%) |
| Total | 325 (100.0%) | 625 (100.0%) |
Housing Occupancy in Concho County
Occupancy by Ownership in Concho County
Of the total 816 dwellings in Concho County, owner-occupied units account for 659 (80.8%), while renter-occupied units make up 157 (19.2%).
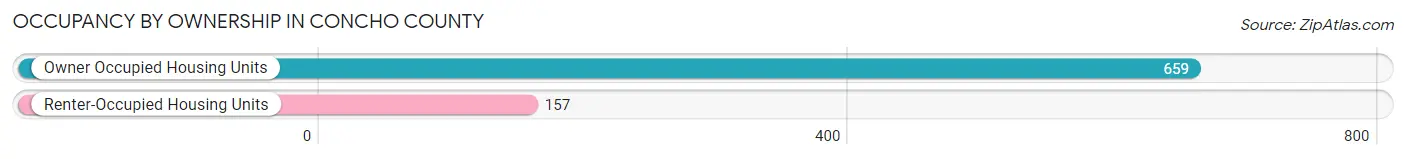
| Occupancy | # Housing Units | % Housing Units |
| Owner Occupied Housing Units | 659 | 80.8% |
| Renter-Occupied Housing Units | 157 | 19.2% |
| Total Occupied Housing Units | 816 | 100.0% |
Occupancy by Household Size in Concho County
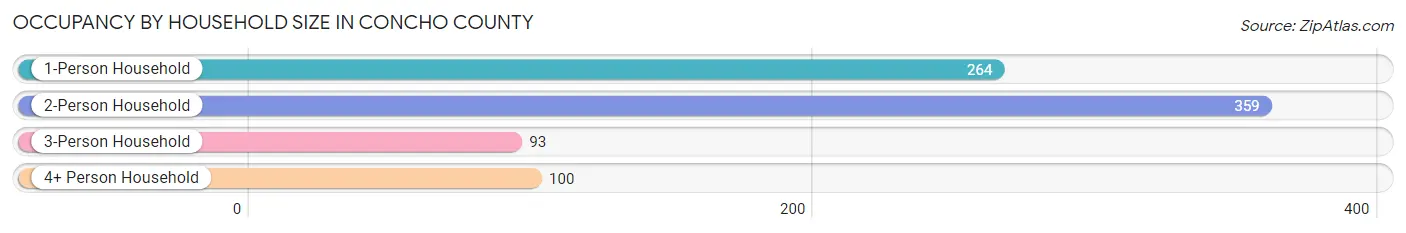
| Household Size | # Housing Units | % Housing Units |
| 1-Person Household | 264 | 32.4% |
| 2-Person Household | 359 | 44.0% |
| 3-Person Household | 93 | 11.4% |
| 4+ Person Household | 100 | 12.2% |
| Total Housing Units | 816 | 100.0% |
Occupancy by Ownership by Household Size in Concho County
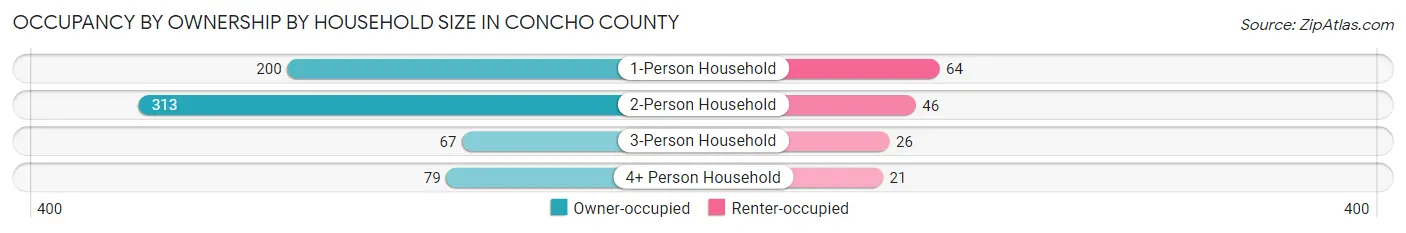
| Household Size | Owner-occupied | Renter-occupied |
| 1-Person Household | 200 (75.8%) | 64 (24.2%) |
| 2-Person Household | 313 (87.2%) | 46 (12.8%) |
| 3-Person Household | 67 (72.0%) | 26 (28.0%) |
| 4+ Person Household | 79 (79.0%) | 21 (21.0%) |
| Total Housing Units | 659 (80.8%) | 157 (19.2%) |
Occupancy by Educational Attainment in Concho County
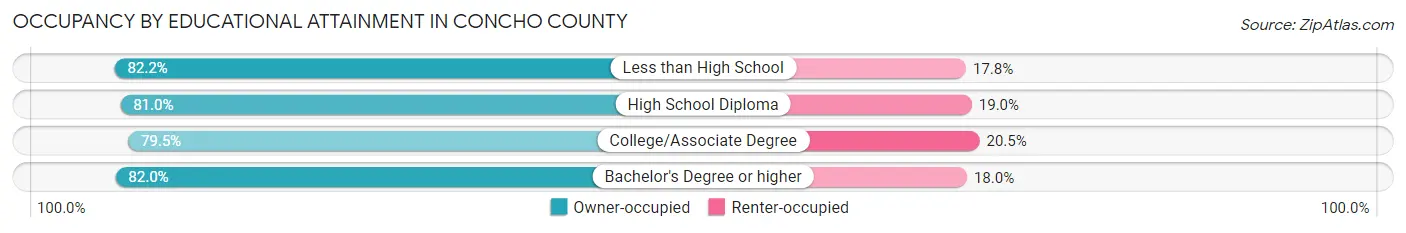
| Household Size | Owner-occupied | Renter-occupied |
| Less than High School | 83 (82.2%) | 18 (17.8%) |
| High School Diploma | 188 (81.0%) | 44 (19.0%) |
| College/Associate Degree | 256 (79.5%) | 66 (20.5%) |
| Bachelor's Degree or higher | 132 (82.0%) | 29 (18.0%) |
Occupancy by Age of Householder in Concho County
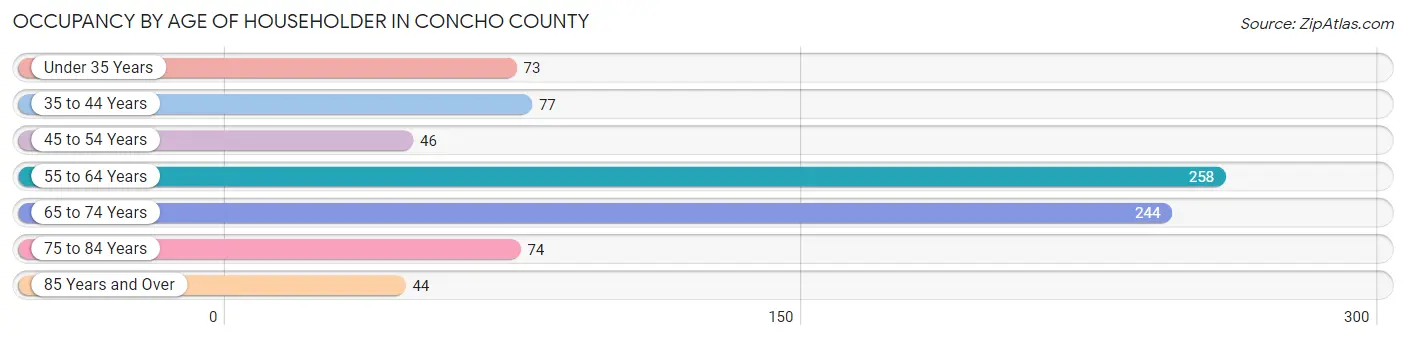
| Age Bracket | # Households | % Households |
| Under 35 Years | 73 | 8.9% |
| 35 to 44 Years | 77 | 9.4% |
| 45 to 54 Years | 46 | 5.6% |
| 55 to 64 Years | 258 | 31.6% |
| 65 to 74 Years | 244 | 29.9% |
| 75 to 84 Years | 74 | 9.1% |
| 85 Years and Over | 44 | 5.4% |
| Total | 816 | 100.0% |
Housing Finances in Concho County
Median Income by Occupancy in Concho County
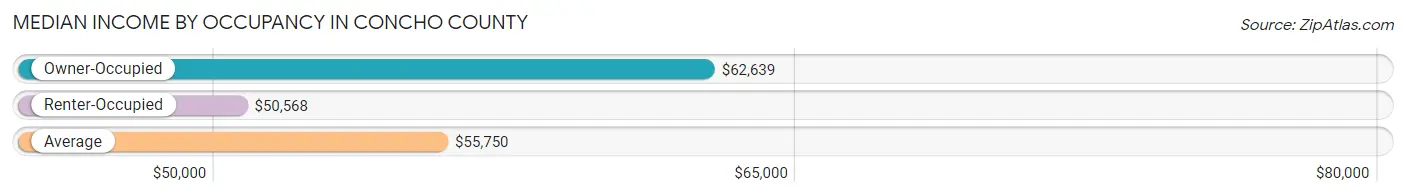
| Occupancy Type | # Households | Median Income |
| Owner-Occupied | 659 (80.8%) | $62,639 |
| Renter-Occupied | 157 (19.2%) | $50,568 |
| Average | 816 (100.0%) | $55,750 |
Occupancy by Householder Income Bracket in Concho County
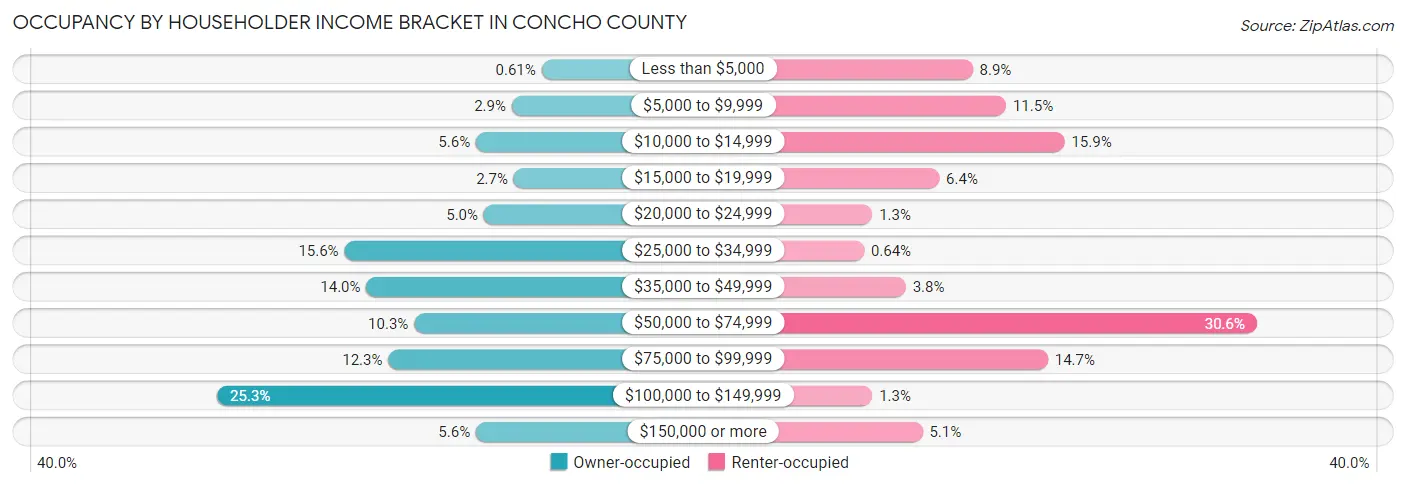
| Income Bracket | Owner-occupied | Renter-occupied |
| Less than $5,000 | 4 (0.6%) | 14 (8.9%) |
| $5,000 to $9,999 | 19 (2.9%) | 18 (11.5%) |
| $10,000 to $14,999 | 37 (5.6%) | 25 (15.9%) |
| $15,000 to $19,999 | 18 (2.7%) | 10 (6.4%) |
| $20,000 to $24,999 | 33 (5.0%) | 2 (1.3%) |
| $25,000 to $34,999 | 103 (15.6%) | 1 (0.6%) |
| $35,000 to $49,999 | 92 (14.0%) | 6 (3.8%) |
| $50,000 to $74,999 | 68 (10.3%) | 48 (30.6%) |
| $75,000 to $99,999 | 81 (12.3%) | 23 (14.6%) |
| $100,000 to $149,999 | 167 (25.3%) | 2 (1.3%) |
| $150,000 or more | 37 (5.6%) | 8 (5.1%) |
| Total | 659 (100.0%) | 157 (100.0%) |
Monthly Housing Cost Tiers in Concho County
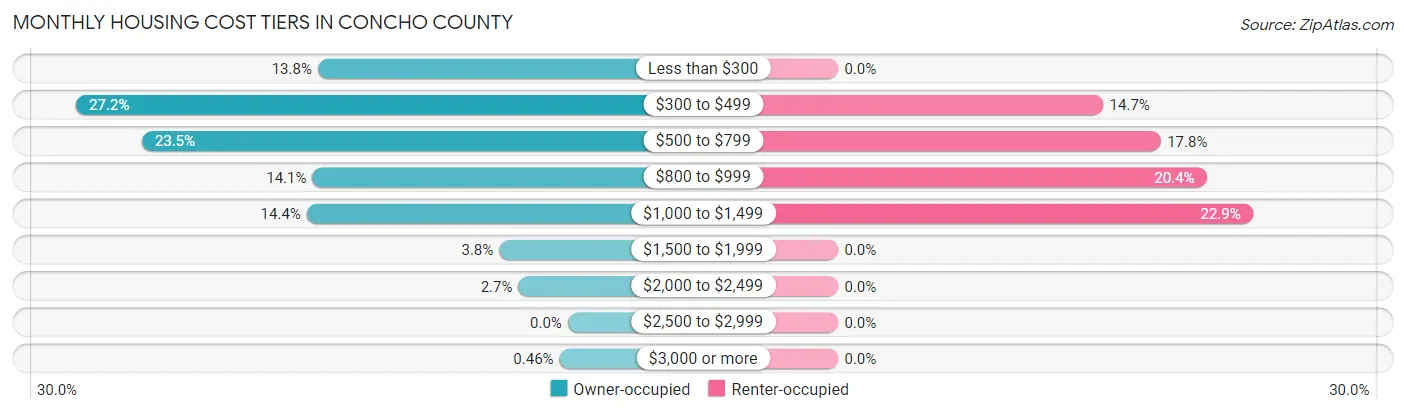
| Monthly Cost | Owner-occupied | Renter-occupied |
| Less than $300 | 91 (13.8%) | 0 (0.0%) |
| $300 to $499 | 179 (27.2%) | 23 (14.6%) |
| $500 to $799 | 155 (23.5%) | 28 (17.8%) |
| $800 to $999 | 93 (14.1%) | 32 (20.4%) |
| $1,000 to $1,499 | 95 (14.4%) | 36 (22.9%) |
| $1,500 to $1,999 | 25 (3.8%) | 0 (0.0%) |
| $2,000 to $2,499 | 18 (2.7%) | 0 (0.0%) |
| $2,500 to $2,999 | 0 (0.0%) | 0 (0.0%) |
| $3,000 or more | 3 (0.5%) | 0 (0.0%) |
| Total | 659 (100.0%) | 157 (100.0%) |
Physical Housing Characteristics in Concho County
Housing Structures in Concho County
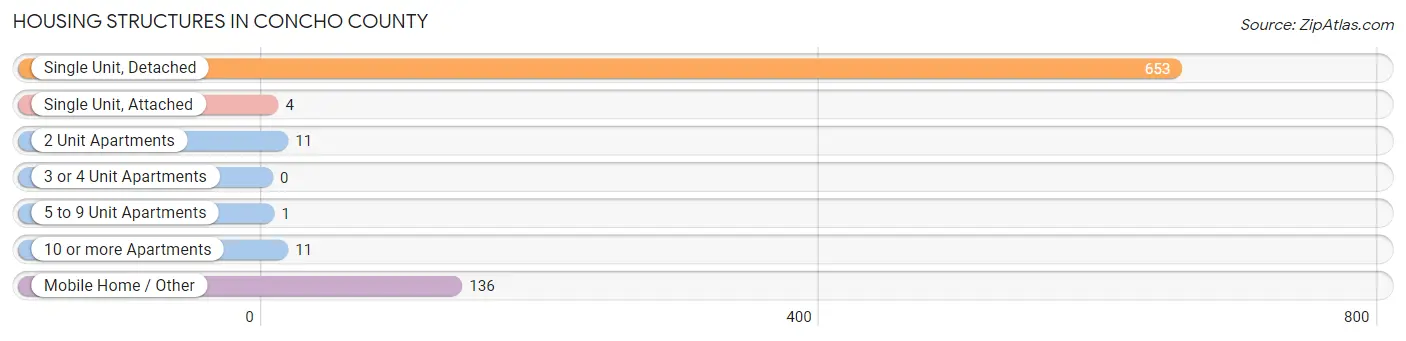
| Structure Type | # Housing Units | % Housing Units |
| Single Unit, Detached | 653 | 80.0% |
| Single Unit, Attached | 4 | 0.5% |
| 2 Unit Apartments | 11 | 1.3% |
| 3 or 4 Unit Apartments | 0 | 0.0% |
| 5 to 9 Unit Apartments | 1 | 0.1% |
| 10 or more Apartments | 11 | 1.3% |
| Mobile Home / Other | 136 | 16.7% |
| Total | 816 | 100.0% |
Housing Structures by Occupancy in Concho County
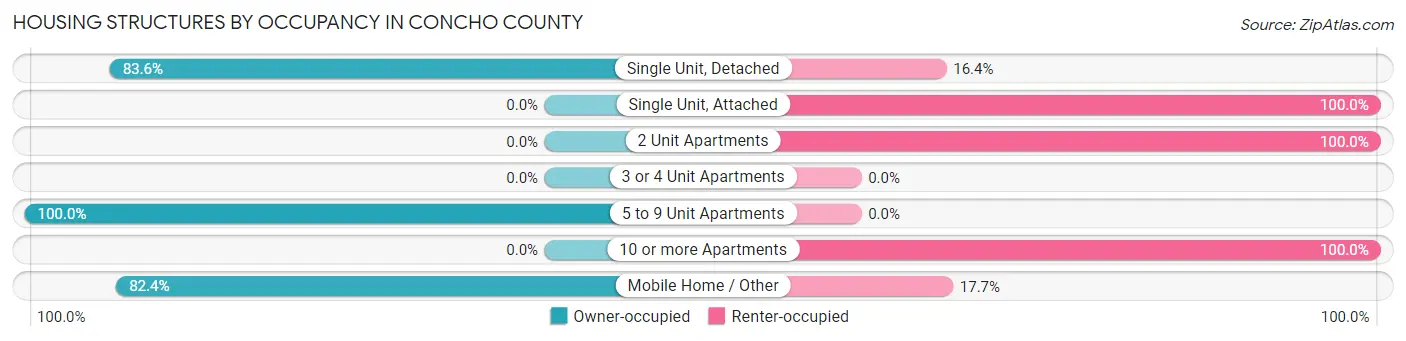
| Structure Type | Owner-occupied | Renter-occupied |
| Single Unit, Detached | 546 (83.6%) | 107 (16.4%) |
| Single Unit, Attached | 0 (0.0%) | 4 (100.0%) |
| 2 Unit Apartments | 0 (0.0%) | 11 (100.0%) |
| 3 or 4 Unit Apartments | 0 (0.0%) | 0 (0.0%) |
| 5 to 9 Unit Apartments | 1 (100.0%) | 0 (0.0%) |
| 10 or more Apartments | 0 (0.0%) | 11 (100.0%) |
| Mobile Home / Other | 112 (82.4%) | 24 (17.6%) |
| Total | 659 (80.8%) | 157 (19.2%) |
Housing Structures by Number of Rooms in Concho County
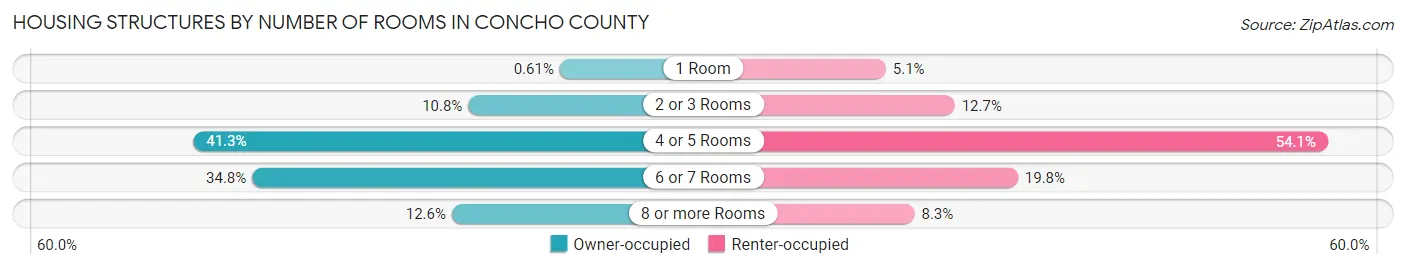
| Number of Rooms | Owner-occupied | Renter-occupied |
| 1 Room | 4 (0.6%) | 8 (5.1%) |
| 2 or 3 Rooms | 71 (10.8%) | 20 (12.7%) |
| 4 or 5 Rooms | 272 (41.3%) | 85 (54.1%) |
| 6 or 7 Rooms | 229 (34.7%) | 31 (19.8%) |
| 8 or more Rooms | 83 (12.6%) | 13 (8.3%) |
| Total | 659 (100.0%) | 157 (100.0%) |
Housing Structure by Heating Type in Concho County
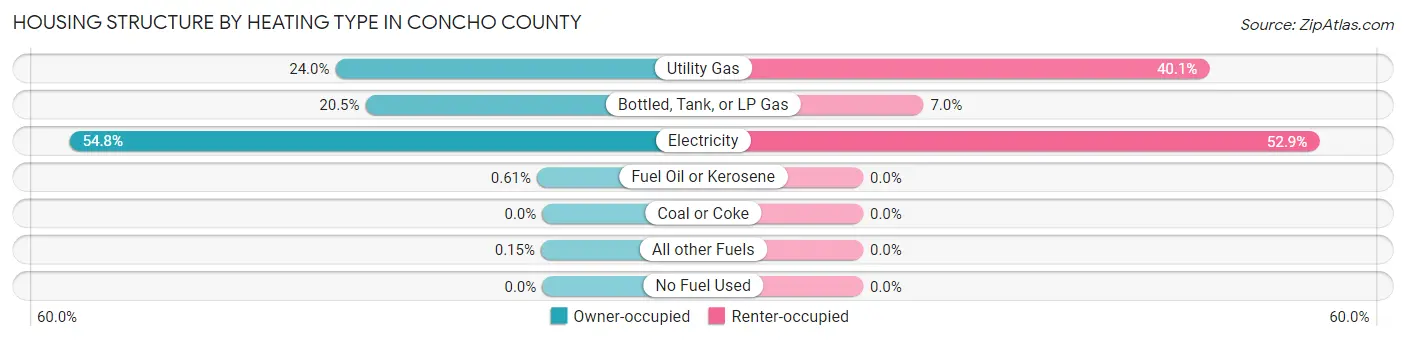
| Heating Type | Owner-occupied | Renter-occupied |
| Utility Gas | 158 (24.0%) | 63 (40.1%) |
| Bottled, Tank, or LP Gas | 135 (20.5%) | 11 (7.0%) |
| Electricity | 361 (54.8%) | 83 (52.9%) |
| Fuel Oil or Kerosene | 4 (0.6%) | 0 (0.0%) |
| Coal or Coke | 0 (0.0%) | 0 (0.0%) |
| All other Fuels | 1 (0.2%) | 0 (0.0%) |
| No Fuel Used | 0 (0.0%) | 0 (0.0%) |
| Total | 659 (100.0%) | 157 (100.0%) |
Household Vehicle Usage in Concho County
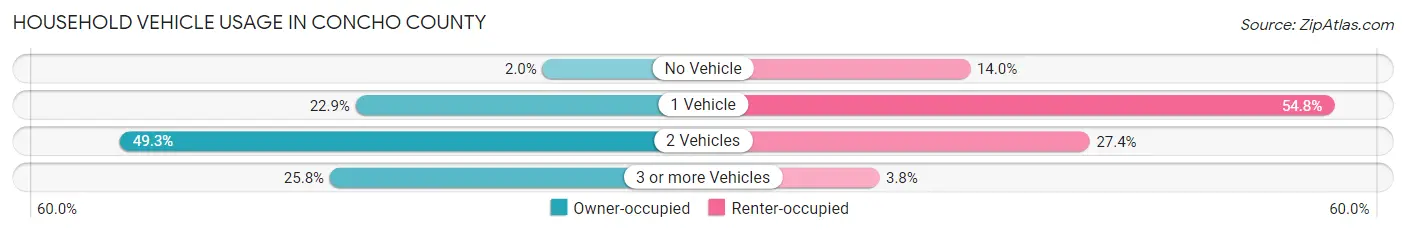
| Vehicles per Household | Owner-occupied | Renter-occupied |
| No Vehicle | 13 (2.0%) | 22 (14.0%) |
| 1 Vehicle | 151 (22.9%) | 86 (54.8%) |
| 2 Vehicles | 325 (49.3%) | 43 (27.4%) |
| 3 or more Vehicles | 170 (25.8%) | 6 (3.8%) |
| Total | 659 (100.0%) | 157 (100.0%) |
Real Estate & Mortgages in Concho County
Real Estate and Mortgage Overview in Concho County
| Characteristic | Without Mortgage | With Mortgage |
| Housing Units | 464 | 195 |
| Median Property Value | $87,900 | $103,700 |
| Median Household Income | $50,625 | $12 |
| Monthly Housing Costs | $471 | $3 |
| Real Estate Taxes | $1,158 | $14 |
Property Value by Mortgage Status in Concho County
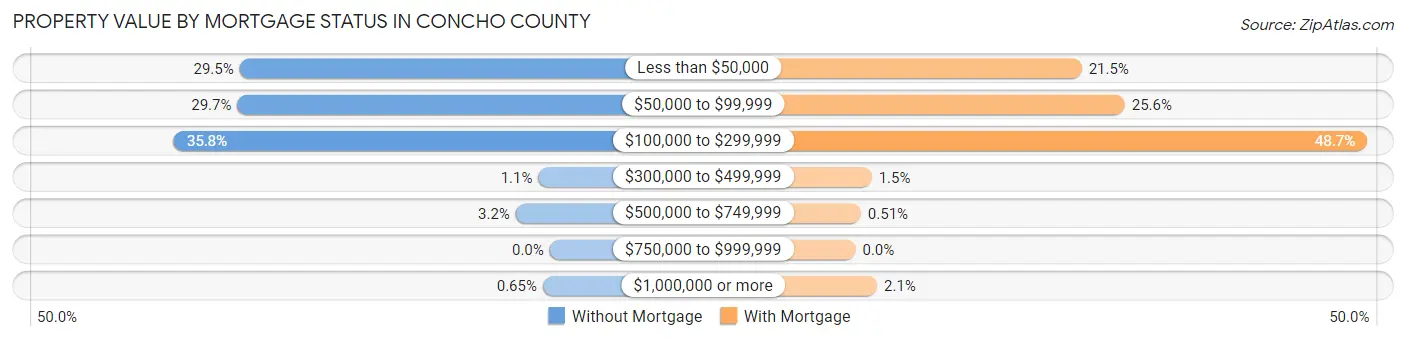
| Property Value | Without Mortgage | With Mortgage |
| Less than $50,000 | 137 (29.5%) | 42 (21.5%) |
| $50,000 to $99,999 | 138 (29.7%) | 50 (25.6%) |
| $100,000 to $299,999 | 166 (35.8%) | 95 (48.7%) |
| $300,000 to $499,999 | 5 (1.1%) | 3 (1.5%) |
| $500,000 to $749,999 | 15 (3.2%) | 1 (0.5%) |
| $750,000 to $999,999 | 0 (0.0%) | 0 (0.0%) |
| $1,000,000 or more | 3 (0.6%) | 4 (2.1%) |
| Total | 464 (100.0%) | 195 (100.0%) |
Household Income by Mortgage Status in Concho County
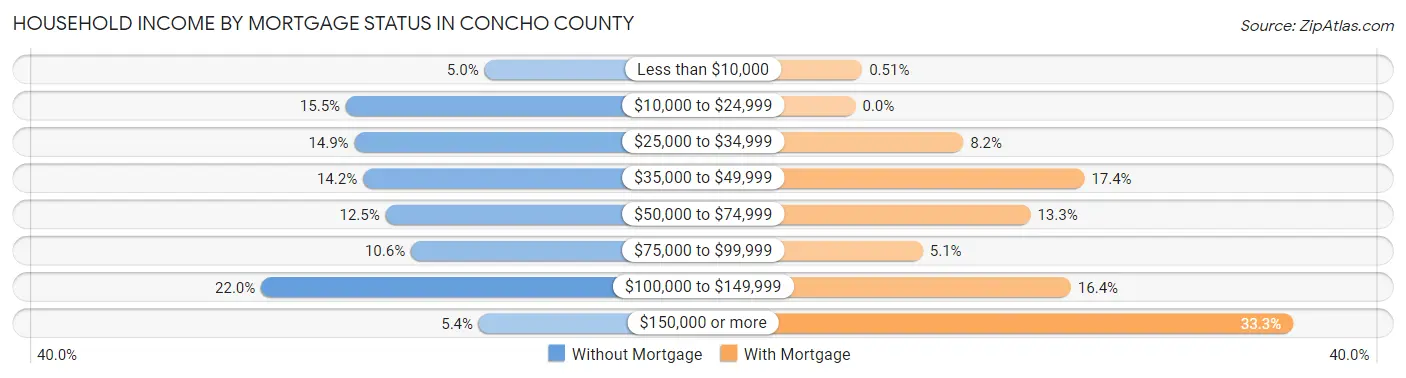
| Household Income | Without Mortgage | With Mortgage |
| Less than $10,000 | 23 (5.0%) | 1 (0.5%) |
| $10,000 to $24,999 | 72 (15.5%) | 0 (0.0%) |
| $25,000 to $34,999 | 69 (14.9%) | 16 (8.2%) |
| $35,000 to $49,999 | 66 (14.2%) | 34 (17.4%) |
| $50,000 to $74,999 | 58 (12.5%) | 26 (13.3%) |
| $75,000 to $99,999 | 49 (10.6%) | 10 (5.1%) |
| $100,000 to $149,999 | 102 (22.0%) | 32 (16.4%) |
| $150,000 or more | 25 (5.4%) | 65 (33.3%) |
| Total | 464 (100.0%) | 195 (100.0%) |
Property Value to Household Income Ratio in Concho County
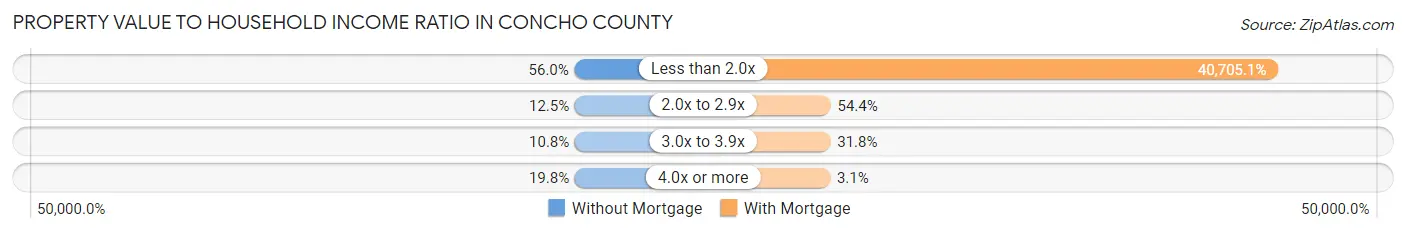
| Value-to-Income Ratio | Without Mortgage | With Mortgage |
| Less than 2.0x | 260 (56.0%) | 79,375 (40,705.1%) |
| 2.0x to 2.9x | 58 (12.5%) | 106 (54.4%) |
| 3.0x to 3.9x | 50 (10.8%) | 62 (31.8%) |
| 4.0x or more | 92 (19.8%) | 6 (3.1%) |
| Total | 464 (100.0%) | 195 (100.0%) |
Real Estate Taxes by Mortgage Status in Concho County
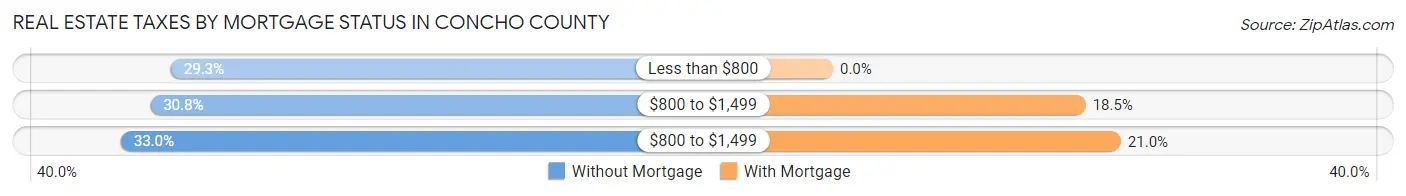
| Property Taxes | Without Mortgage | With Mortgage |
| Less than $800 | 136 (29.3%) | 0 (0.0%) |
| $800 to $1,499 | 143 (30.8%) | 36 (18.5%) |
| $800 to $1,499 | 153 (33.0%) | 41 (21.0%) |
| Total | 464 (100.0%) | 195 (100.0%) |
Health & Disability in Concho County
Health Insurance Coverage by Age in Concho County
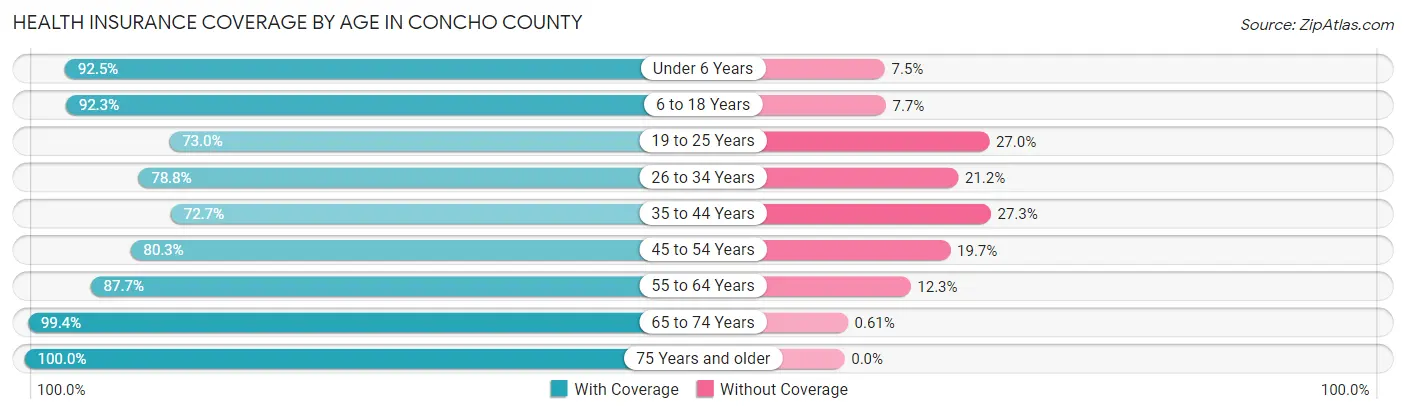
| Age Bracket | With Coverage | Without Coverage |
| Under 6 Years | 123 (92.5%) | 10 (7.5%) |
| 6 to 18 Years | 468 (92.3%) | 39 (7.7%) |
| 19 to 25 Years | 46 (73.0%) | 17 (27.0%) |
| 26 to 34 Years | 104 (78.8%) | 28 (21.2%) |
| 35 to 44 Years | 96 (72.7%) | 36 (27.3%) |
| 45 to 54 Years | 236 (80.3%) | 58 (19.7%) |
| 55 to 64 Years | 356 (87.7%) | 50 (12.3%) |
| 65 to 74 Years | 489 (99.4%) | 3 (0.6%) |
| 75 Years and older | 258 (100.0%) | 0 (0.0%) |
| Total | 2,176 (90.0%) | 241 (10.0%) |
Health Insurance Coverage by Citizenship Status in Concho County
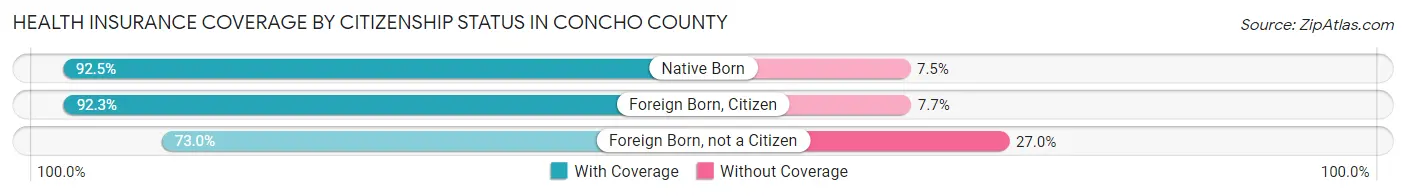
| Citizenship Status | With Coverage | Without Coverage |
| Native Born | 123 (92.5%) | 10 (7.5%) |
| Foreign Born, Citizen | 468 (92.3%) | 39 (7.7%) |
| Foreign Born, not a Citizen | 46 (73.0%) | 17 (27.0%) |
Health Insurance Coverage by Household Income in Concho County
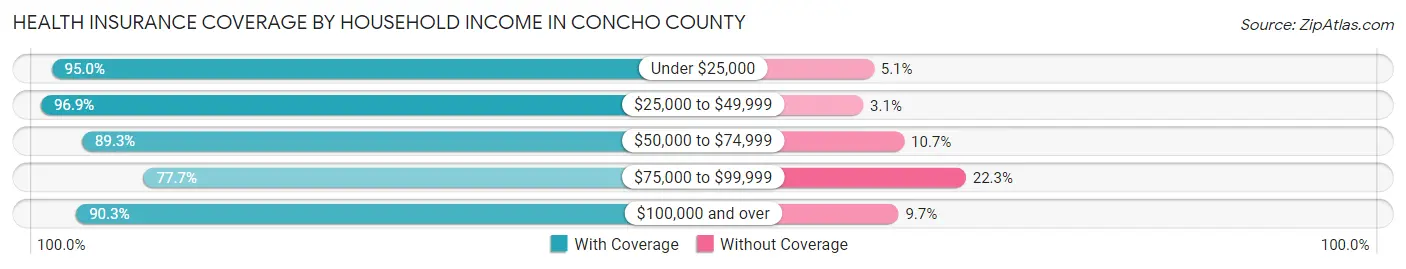
| Household Income | With Coverage | Without Coverage |
| Under $25,000 | 301 (95.0%) | 16 (5.1%) |
| $25,000 to $49,999 | 568 (96.9%) | 18 (3.1%) |
| $50,000 to $74,999 | 374 (89.3%) | 45 (10.7%) |
| $75,000 to $99,999 | 345 (77.7%) | 99 (22.3%) |
| $100,000 and over | 588 (90.3%) | 63 (9.7%) |
Public vs Private Health Insurance Coverage by Age in Concho County
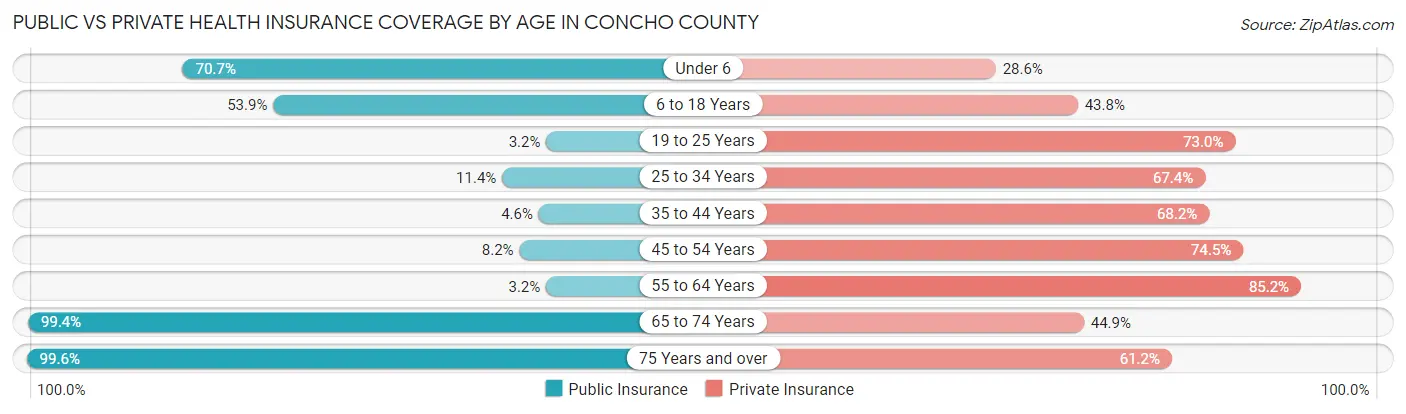
| Age Bracket | Public Insurance | Private Insurance |
| Under 6 | 94 (70.7%) | 38 (28.6%) |
| 6 to 18 Years | 273 (53.8%) | 222 (43.8%) |
| 19 to 25 Years | 2 (3.2%) | 46 (73.0%) |
| 25 to 34 Years | 15 (11.4%) | 89 (67.4%) |
| 35 to 44 Years | 6 (4.5%) | 90 (68.2%) |
| 45 to 54 Years | 24 (8.2%) | 219 (74.5%) |
| 55 to 64 Years | 13 (3.2%) | 346 (85.2%) |
| 65 to 74 Years | 489 (99.4%) | 221 (44.9%) |
| 75 Years and over | 257 (99.6%) | 158 (61.2%) |
| Total | 1,173 (48.5%) | 1,429 (59.1%) |
Disability Status by Sex by Age in Concho County
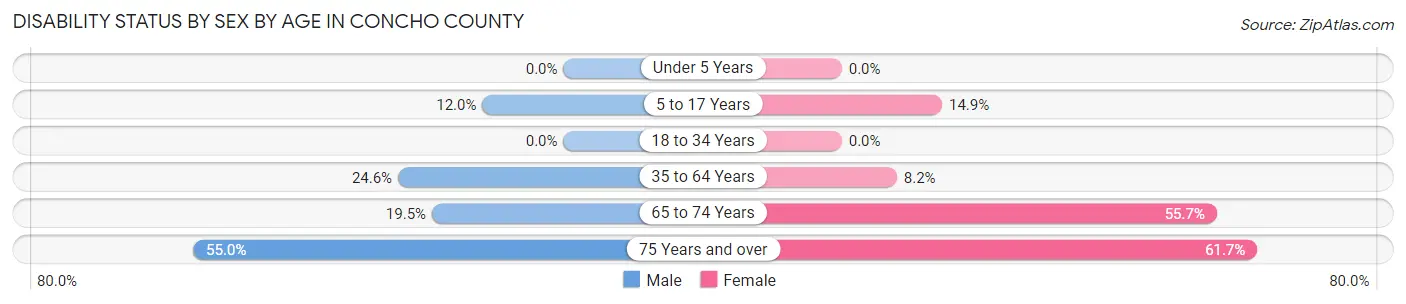
| Age Bracket | Male | Female |
| Under 5 Years | 0 (0.0%) | 0 (0.0%) |
| 5 to 17 Years | 33 (12.0%) | 28 (14.9%) |
| 18 to 34 Years | 0 (0.0%) | 0 (0.0%) |
| 35 to 64 Years | 69 (24.6%) | 45 (8.2%) |
| 65 to 74 Years | 41 (19.5%) | 157 (55.7%) |
| 75 Years and over | 83 (55.0%) | 66 (61.7%) |
Disability Class by Sex by Age in Concho County
Disability Class: Hearing Difficulty
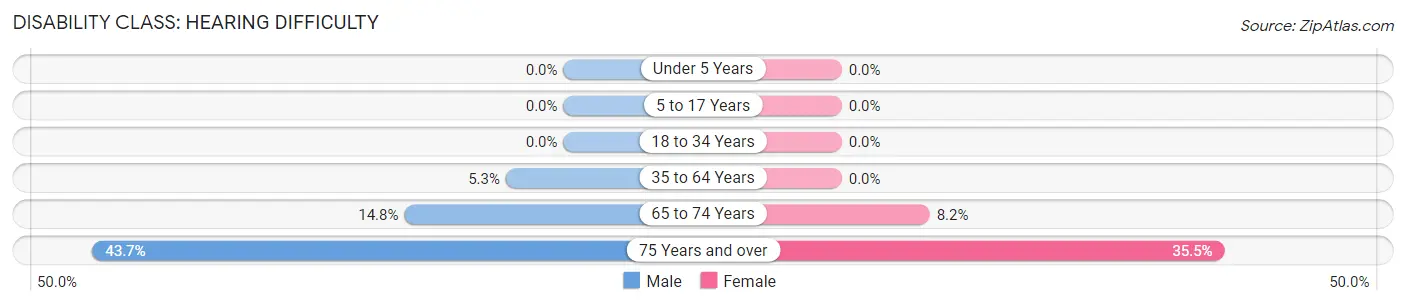
| Age Bracket | Male | Female |
| Under 5 Years | 0 (0.0%) | 0 (0.0%) |
| 5 to 17 Years | 0 (0.0%) | 0 (0.0%) |
| 18 to 34 Years | 0 (0.0%) | 0 (0.0%) |
| 35 to 64 Years | 15 (5.3%) | 0 (0.0%) |
| 65 to 74 Years | 31 (14.8%) | 23 (8.2%) |
| 75 Years and over | 66 (43.7%) | 38 (35.5%) |
Disability Class: Vision Difficulty
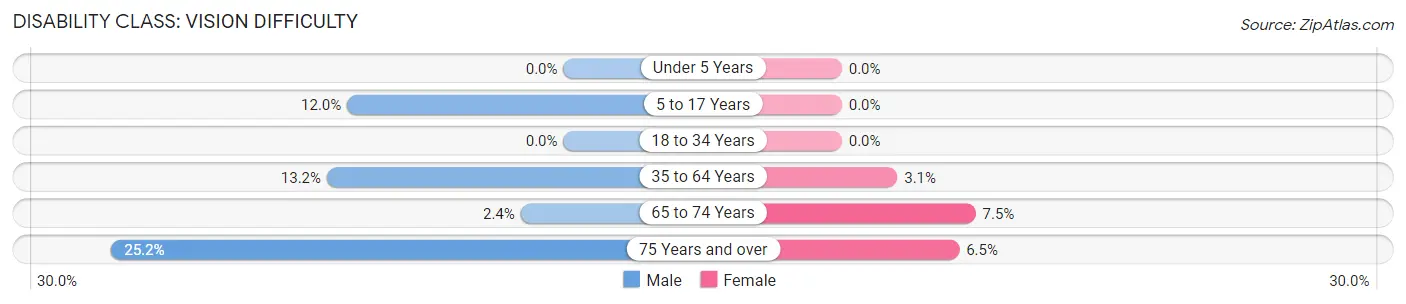
| Age Bracket | Male | Female |
| Under 5 Years | 0 (0.0%) | 0 (0.0%) |
| 5 to 17 Years | 33 (12.0%) | 0 (0.0%) |
| 18 to 34 Years | 0 (0.0%) | 0 (0.0%) |
| 35 to 64 Years | 37 (13.2%) | 17 (3.1%) |
| 65 to 74 Years | 5 (2.4%) | 21 (7.4%) |
| 75 Years and over | 38 (25.2%) | 7 (6.5%) |
Disability Class: Cognitive Difficulty
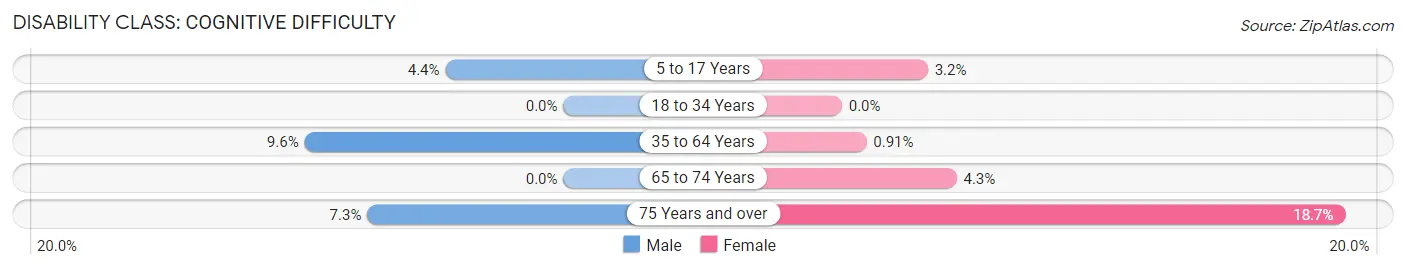
| Age Bracket | Male | Female |
| 5 to 17 Years | 12 (4.4%) | 6 (3.2%) |
| 18 to 34 Years | 0 (0.0%) | 0 (0.0%) |
| 35 to 64 Years | 27 (9.6%) | 5 (0.9%) |
| 65 to 74 Years | 0 (0.0%) | 12 (4.3%) |
| 75 Years and over | 11 (7.3%) | 20 (18.7%) |
Disability Class: Ambulatory Difficulty
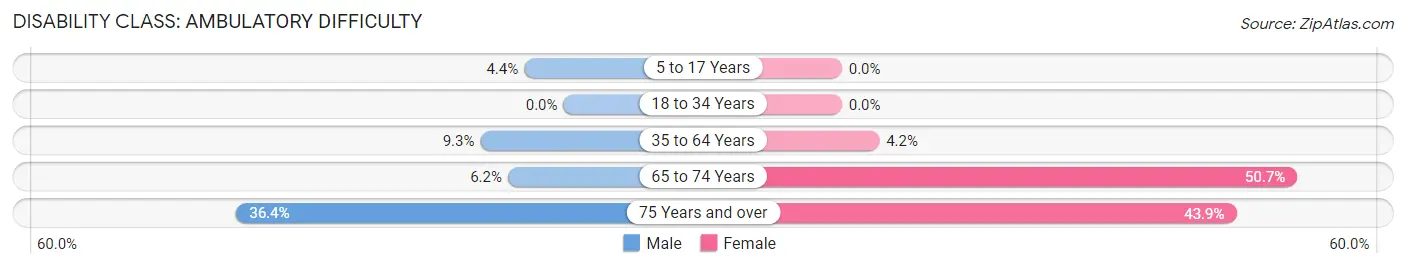
| Age Bracket | Male | Female |
| 5 to 17 Years | 12 (4.4%) | 0 (0.0%) |
| 18 to 34 Years | 0 (0.0%) | 0 (0.0%) |
| 35 to 64 Years | 26 (9.2%) | 23 (4.2%) |
| 65 to 74 Years | 13 (6.2%) | 143 (50.7%) |
| 75 Years and over | 55 (36.4%) | 47 (43.9%) |
Disability Class: Self-Care Difficulty
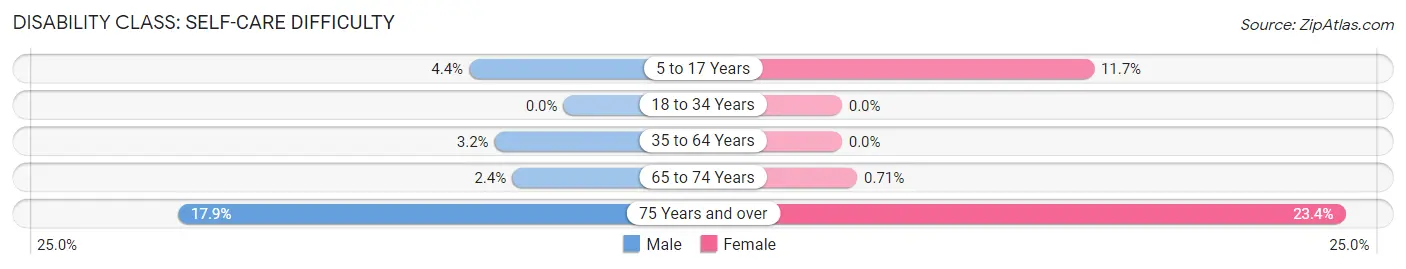
| Age Bracket | Male | Female |
| 5 to 17 Years | 12 (4.4%) | 22 (11.7%) |
| 18 to 34 Years | 0 (0.0%) | 0 (0.0%) |
| 35 to 64 Years | 9 (3.2%) | 0 (0.0%) |
| 65 to 74 Years | 5 (2.4%) | 2 (0.7%) |
| 75 Years and over | 27 (17.9%) | 25 (23.4%) |
Technology Access in Concho County
Computing Device Access in Concho County
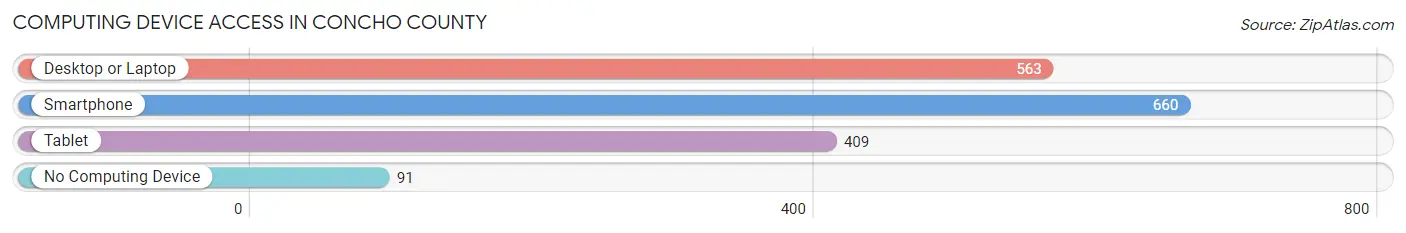
| Device Type | # Households | % Households |
| Desktop or Laptop | 563 | 69.0% |
| Smartphone | 660 | 80.9% |
| Tablet | 409 | 50.1% |
| No Computing Device | 91 | 11.2% |
| Total | 816 | 100.0% |
Internet Access in Concho County
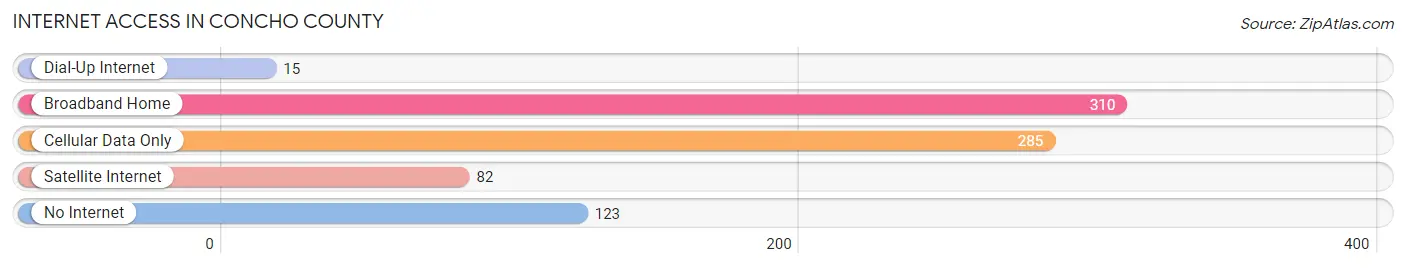
| Internet Type | # Households | % Households |
| Dial-Up Internet | 15 | 1.8% |
| Broadband Home | 310 | 38.0% |
| Cellular Data Only | 285 | 34.9% |
| Satellite Internet | 82 | 10.1% |
| No Internet | 123 | 15.1% |
| Total | 816 | 100.0% |
Concho County Summary
Concho County is located in the western part of Texas, in the Edwards Plateau region. It is bordered by Runnels County to the north, Tom Green County to the east, Schleicher County to the south, and Menard County to the west. The county seat is Paint Rock, and the largest city is Eden. The county has a total area of 902 square miles, of which 899 square miles is land and 3 square miles is water.
History
Concho County was established in 1858 and named for the Concho River, which runs through the county. The county was originally part of Bexar County, but was later divided into several smaller counties. The first settlers in the area were ranchers, who were attracted by the abundance of grass and water. The county was also home to several Native American tribes, including the Comanche, Apache, and Kiowa.
The county was largely rural until the late 19th century, when the railroad arrived. This brought an influx of settlers and businesses, and the county began to develop. The county seat was moved from Paint Rock to Eden in 1891.
Geography
Concho County is located in the western part of Texas, in the Edwards Plateau region. It is bordered by Runnels County to the north, Tom Green County to the east, Schleicher County to the south, and Menard County to the west. The county has a total area of 902 square miles, of which 899 square miles is land and 3 square miles is water.
The terrain of Concho County is mostly flat, with some rolling hills. The county is home to several rivers, including the Concho, Colorado, and San Saba. The county is also home to several lakes, including Lake O.H. Ivie, Lake Nasworthy, and Lake Spence.
Economy
The economy of Concho County is largely based on agriculture and ranching. The county is home to several large ranches, including the 6666 Ranch and the Pitchfork Ranch. The county is also home to several oil and gas fields, which provide jobs for many of the county's residents.
The county is also home to several manufacturing companies, including a steel mill and a paper mill. The county is also home to several retail stores, restaurants, and other businesses.
Demographics
As of the 2010 census, the population of Concho County was 4,087. The racial makeup of the county was 81.3% White, 0.7% African American, 0.7% Native American, 0.2% Asian, 0.1% Pacific Islander, 15.2% from other races, and 2.0% from two or more races. Hispanic or Latino of any race were 33.2% of the population.
The median income for a household in the county was $31,944, and the median income for a family was $37,813. The per capita income for the county was $17,845. About 17.2% of families and 21.2% of the population were below the poverty line, including 28.2% of those under age 18 and 15.2% of those age 65 or over.
Common Questions
What is Per Capita Income in Concho County?
Per Capita income in Concho County is $24,207.
What is the Median Family Income in Concho County?
Median Family Income in Concho County is $75,878.
What is the Median Household income in Concho County?
Median Household Income in Concho County is $55,750.
What is Income or Wage Gap in Concho County?
Income or Wage Gap in Concho County is 24.4%.
Women in Concho County earn 75.6 cents for every dollar earned by a man.
What is Family Income Deficit in Concho County?
Family Income Deficit in Concho County is $10,128.
Families that are below poverty line in Concho County earn $10,128 less on average than the poverty threshold level.
What is Inequality or Gini Index in Concho County?
Inequality or Gini Index in Concho County is 0.41.
What is the Total Population of Concho County?
Total Population of Concho County is 3,235.
What is the Total Male Population of Concho County?
Total Male Population of Concho County is 1,793.
What is the Total Female Population of Concho County?
Total Female Population of Concho County is 1,442.
What is the Ratio of Males per 100 Females in Concho County?
There are 124.34 Males per 100 Females in Concho County.
What is the Ratio of Females per 100 Males in Concho County?
There are 80.42 Females per 100 Males in Concho County.
What is the Median Population Age in Concho County?
Median Population Age in Concho County is 46.4 Years.
What is the Average Family Size in Concho County
Average Family Size in Concho County is 3.9 People.
What is the Average Household Size in Concho County
Average Household Size in Concho County is 3.0 People.
How Large is the Labor Force in Concho County?
There are 1,019 People in the Labor Forcein in Concho County.
What is the Percentage of People in the Labor Force in Concho County?
37.7% of People are in the Labor Force in Concho County.
What is the Unemployment Rate in Concho County?
Unemployment Rate in Concho County is 2.3%.