Comanche County, TX Map & Demographics
Comanche County Map
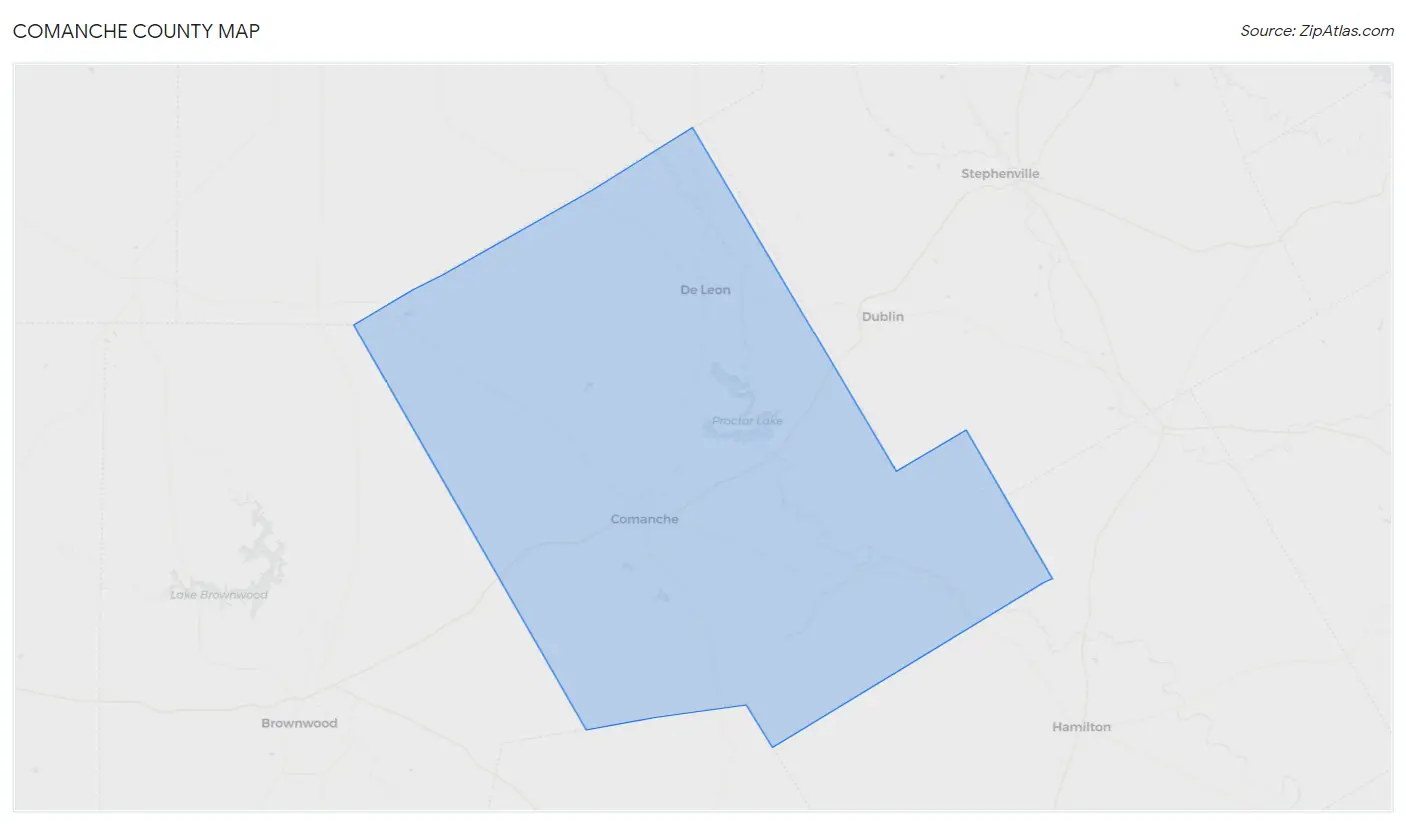
Comanche County Overview
$31,171
PER CAPITA INCOME
$81,117
AVG FAMILY INCOME
$57,383
AVG HOUSEHOLD INCOME
33.7%
WAGE / INCOME GAP [ % ]
66.3¢/ $1
WAGE / INCOME GAP [ $ ]
$9,775
FAMILY INCOME DEFICIT
0.45
INEQUALITY / GINI INDEX
13,651
TOTAL POPULATION
6,881
MALE POPULATION
6,770
FEMALE POPULATION
101.64
MALES / 100 FEMALES
98.39
FEMALES / 100 MALES
44.2
MEDIAN AGE
3.1
AVG FAMILY SIZE
2.5
AVG HOUSEHOLD SIZE
6,661
LABOR FORCE [ PEOPLE ]
60.8%
PERCENT IN LABOR FORCE
7.3%
UNEMPLOYMENT RATE
Income in Comanche County
Income Overview in Comanche County
Per Capita Income in Comanche County is $31,171, while median incomes of families and households are $81,117 and $57,383 respectively.
| Characteristic | Number | Measure |
| Per Capita Income | 13,651 | $31,171 |
| Median Family Income | 3,596 | $81,117 |
| Mean Family Income | 3,596 | $95,226 |
| Median Household Income | 5,340 | $57,383 |
| Mean Household Income | 5,340 | $77,697 |
| Income Deficit | 3,596 | $9,775 |
| Wage / Income Gap (%) | 13,651 | 33.74% |
| Wage / Income Gap ($) | 13,651 | 66.26¢ per $1 |
| Gini / Inequality Index | 13,651 | 0.45 |
Earnings by Sex in Comanche County
Average Earnings in Comanche County are $35,258, $41,618 for men and $27,576 for women, a difference of 33.7%.
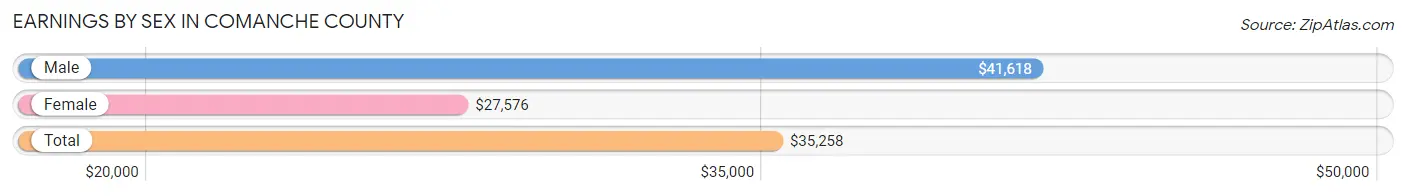
| Sex | Number | Average Earnings |
| Male | 3,842 (55.2%) | $41,618 |
| Female | 3,112 (44.8%) | $27,576 |
| Total | 6,954 (100.0%) | $35,258 |
Earnings by Sex by Income Bracket in Comanche County
The most common earnings brackets in Comanche County are $75,000 to $99,999 for men (416 | 10.8%) and $2,499 or less for women (278 | 8.9%).
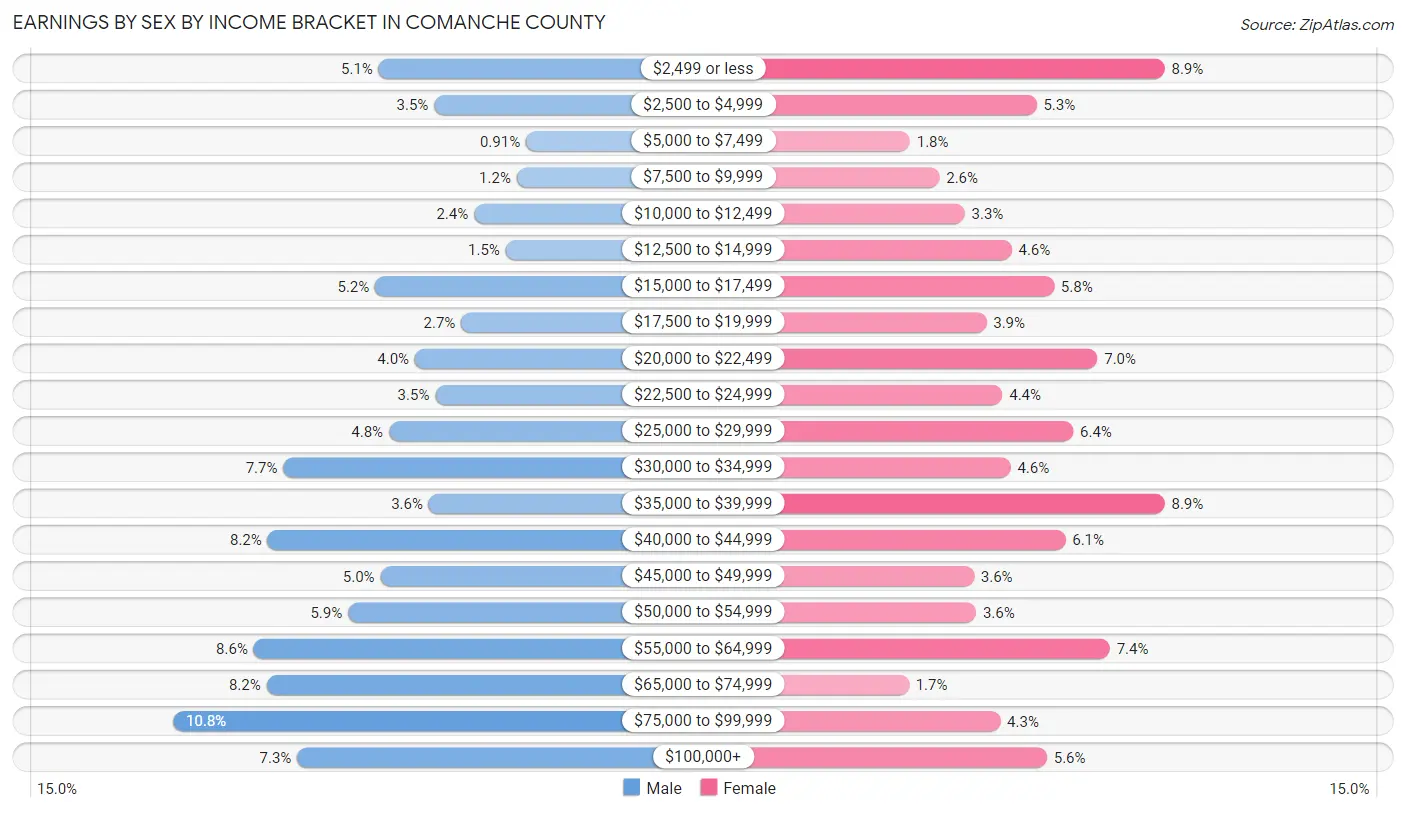
| Income | Male | Female |
| $2,499 or less | 194 (5.1%) | 278 (8.9%) |
| $2,500 to $4,999 | 134 (3.5%) | 166 (5.3%) |
| $5,000 to $7,499 | 35 (0.9%) | 55 (1.8%) |
| $7,500 to $9,999 | 45 (1.2%) | 81 (2.6%) |
| $10,000 to $12,499 | 91 (2.4%) | 103 (3.3%) |
| $12,500 to $14,999 | 57 (1.5%) | 144 (4.6%) |
| $15,000 to $17,499 | 198 (5.1%) | 181 (5.8%) |
| $17,500 to $19,999 | 105 (2.7%) | 122 (3.9%) |
| $20,000 to $22,499 | 155 (4.0%) | 219 (7.0%) |
| $22,500 to $24,999 | 133 (3.5%) | 136 (4.4%) |
| $25,000 to $29,999 | 183 (4.8%) | 198 (6.4%) |
| $30,000 to $34,999 | 297 (7.7%) | 143 (4.6%) |
| $35,000 to $39,999 | 140 (3.6%) | 278 (8.9%) |
| $40,000 to $44,999 | 314 (8.2%) | 191 (6.1%) |
| $45,000 to $49,999 | 192 (5.0%) | 111 (3.6%) |
| $50,000 to $54,999 | 227 (5.9%) | 113 (3.6%) |
| $55,000 to $64,999 | 329 (8.6%) | 230 (7.4%) |
| $65,000 to $74,999 | 315 (8.2%) | 54 (1.7%) |
| $75,000 to $99,999 | 416 (10.8%) | 134 (4.3%) |
| $100,000+ | 282 (7.3%) | 175 (5.6%) |
| Total | 3,842 (100.0%) | 3,112 (100.0%) |
Earnings by Sex by Educational Attainment in Comanche County
Average earnings in Comanche County are $47,724 for men and $30,548 for women, a difference of 36.0%. Men with an educational attainment of graduate degree enjoy the highest average annual earnings of $76,513, while those with less than high school education earn the least with $40,497. Women with an educational attainment of graduate degree earn the most with the average annual earnings of $60,455, while those with less than high school education have the smallest earnings of $20,656.
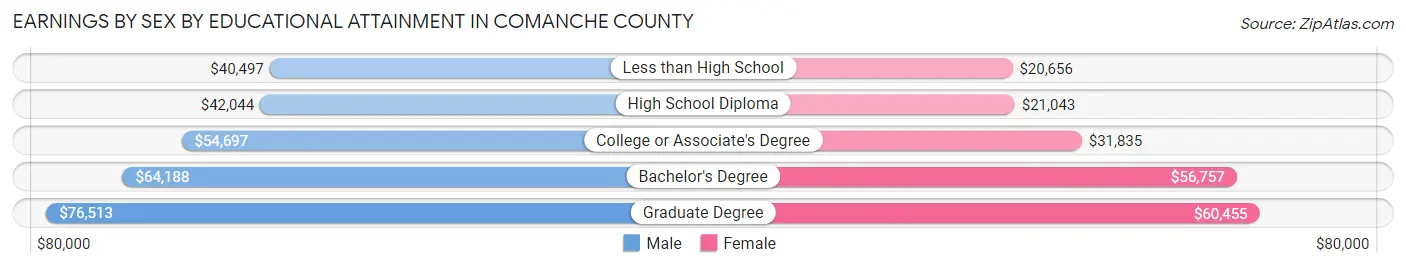
| Educational Attainment | Male Income | Female Income |
| Less than High School | $40,497 | $20,656 |
| High School Diploma | $42,044 | $21,043 |
| College or Associate's Degree | $54,697 | $31,835 |
| Bachelor's Degree | $64,188 | $56,757 |
| Graduate Degree | $76,513 | $60,455 |
| Total | $47,724 | $30,548 |
Family Income in Comanche County
Family Income Brackets in Comanche County
According to the Comanche County family income data, there are 881 families falling into the $100,000 to $149,999 income range, which is the most common income bracket and makes up 24.5% of all families. Conversely, the $10,000 to $14,999 income bracket is the least frequent group with only 47 families (1.3%) belonging to this category.
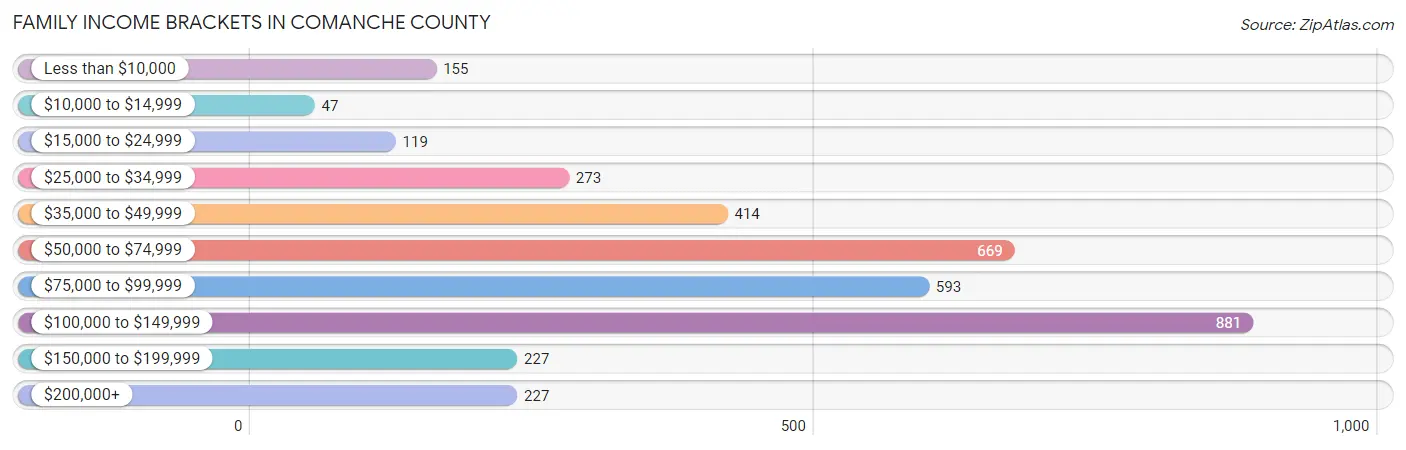
| Income Bracket | # Families | % Families |
| Less than $10,000 | 155 | 4.3% |
| $10,000 to $14,999 | 47 | 1.3% |
| $15,000 to $24,999 | 119 | 3.3% |
| $25,000 to $34,999 | 273 | 7.6% |
| $35,000 to $49,999 | 414 | 11.5% |
| $50,000 to $74,999 | 669 | 18.6% |
| $75,000 to $99,999 | 593 | 16.5% |
| $100,000 to $149,999 | 881 | 24.5% |
| $150,000 to $199,999 | 227 | 6.3% |
| $200,000+ | 227 | 6.3% |
Family Income by Famaliy Size in Comanche County
7+ person families (64 | 1.8%) account for the highest median family income in Comanche County with $250,001 per family, while 7+ person families (64 | 1.8%) have the highest median income of $35,714 per family member.
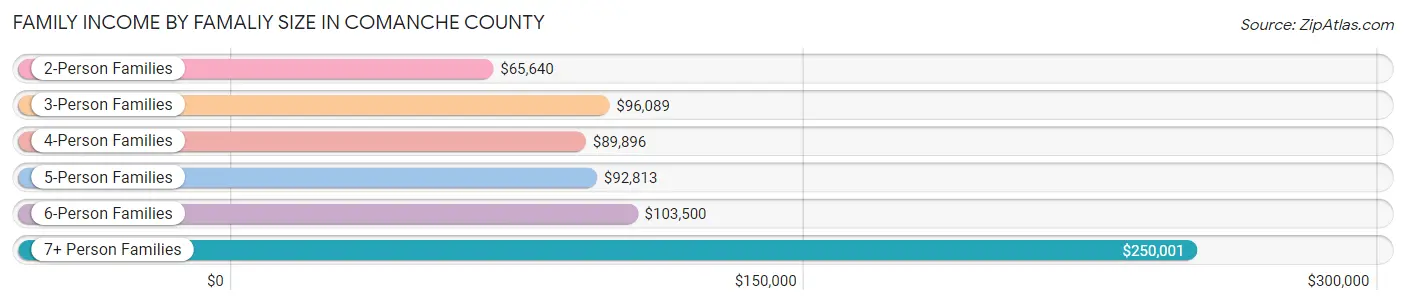
| Income Bracket | # Families | Median Income |
| 2-Person Families | 1,938 (53.9%) | $65,640 |
| 3-Person Families | 567 (15.8%) | $96,089 |
| 4-Person Families | 675 (18.8%) | $89,896 |
| 5-Person Families | 216 (6.0%) | $92,813 |
| 6-Person Families | 136 (3.8%) | $103,500 |
| 7+ Person Families | 64 (1.8%) | $250,001 |
| Total | 3,596 (100.0%) | $81,117 |
Family Income by Number of Earners in Comanche County
The median family income in Comanche County is $81,117, with families comprising 3+ earners (535) having the highest median family income of $118,642, while families with no earners (696) have the lowest median family income of $50,056, accounting for 14.9% and 19.4% of families, respectively.
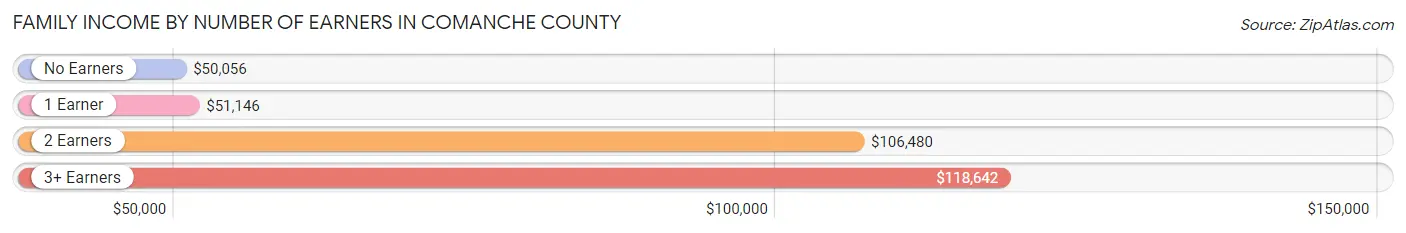
| Number of Earners | # Families | Median Income |
| No Earners | 696 (19.4%) | $50,056 |
| 1 Earner | 1,138 (31.7%) | $51,146 |
| 2 Earners | 1,227 (34.1%) | $106,480 |
| 3+ Earners | 535 (14.9%) | $118,642 |
| Total | 3,596 (100.0%) | $81,117 |
Household Income in Comanche County
Household Income Brackets in Comanche County
With 983 households falling in the category, the $100,000 to $149,999 income range is the most frequent in Comanche County, accounting for 18.4% of all households. In contrast, only 208 households (3.9%) fall into the $10,000 to $14,999 income bracket, making it the least populous group.
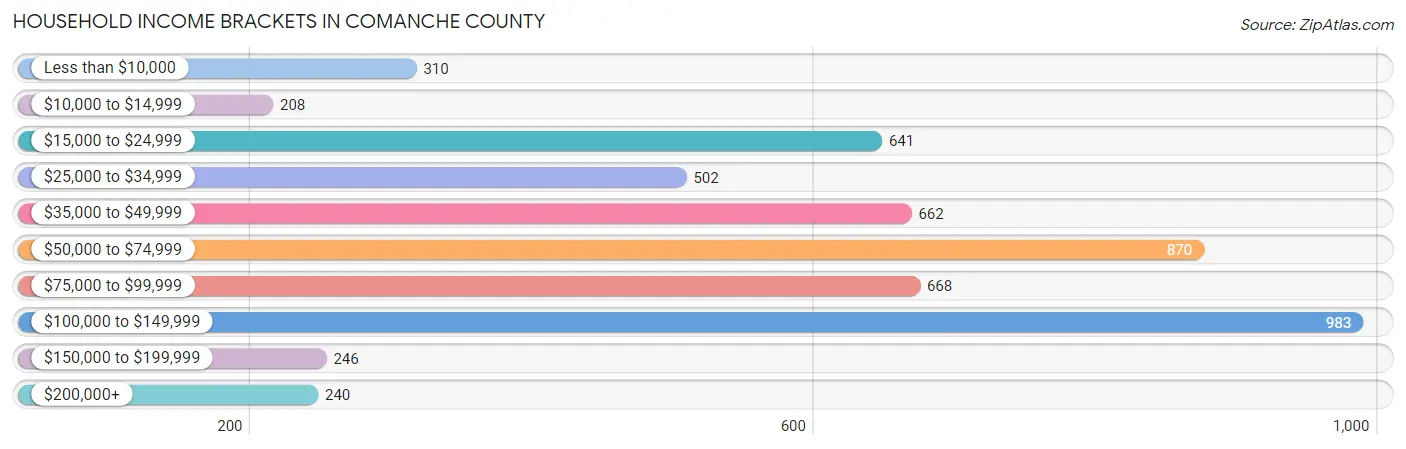
| Income Bracket | # Households | % Households |
| Less than $10,000 | 310 | 5.8% |
| $10,000 to $14,999 | 208 | 3.9% |
| $15,000 to $24,999 | 641 | 12.0% |
| $25,000 to $34,999 | 502 | 9.4% |
| $35,000 to $49,999 | 662 | 12.4% |
| $50,000 to $74,999 | 870 | 16.3% |
| $75,000 to $99,999 | 668 | 12.5% |
| $100,000 to $149,999 | 983 | 18.4% |
| $150,000 to $199,999 | 246 | 4.6% |
| $200,000+ | 240 | 4.5% |
Household Income by Householder Age in Comanche County
The median household income in Comanche County is $57,383, with the highest median household income of $79,559 found in the 45 to 64 years age bracket for the primary householder. A total of 1,834 households (34.3%) fall into this category. Meanwhile, the 15 to 24 years age bracket for the primary householder has the lowest median household income of $37,039, with 75 households (1.4%) in this group.
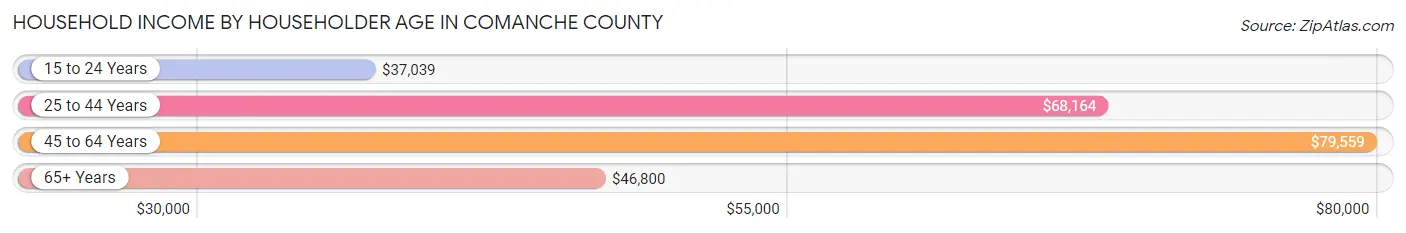
| Income Bracket | # Households | Median Income |
| 15 to 24 Years | 75 (1.4%) | $37,039 |
| 25 to 44 Years | 1,411 (26.4%) | $68,164 |
| 45 to 64 Years | 1,834 (34.3%) | $79,559 |
| 65+ Years | 2,020 (37.8%) | $46,800 |
| Total | 5,340 (100.0%) | $57,383 |
Poverty in Comanche County
Income Below Poverty by Sex and Age in Comanche County
With 11.8% poverty level for males and 15.2% for females among the residents of Comanche County, 15 year old males and under 5 year old females are the most vulnerable to poverty, with 17 males (23.9%) and 128 females (36.4%) in their respective age groups living below the poverty level.
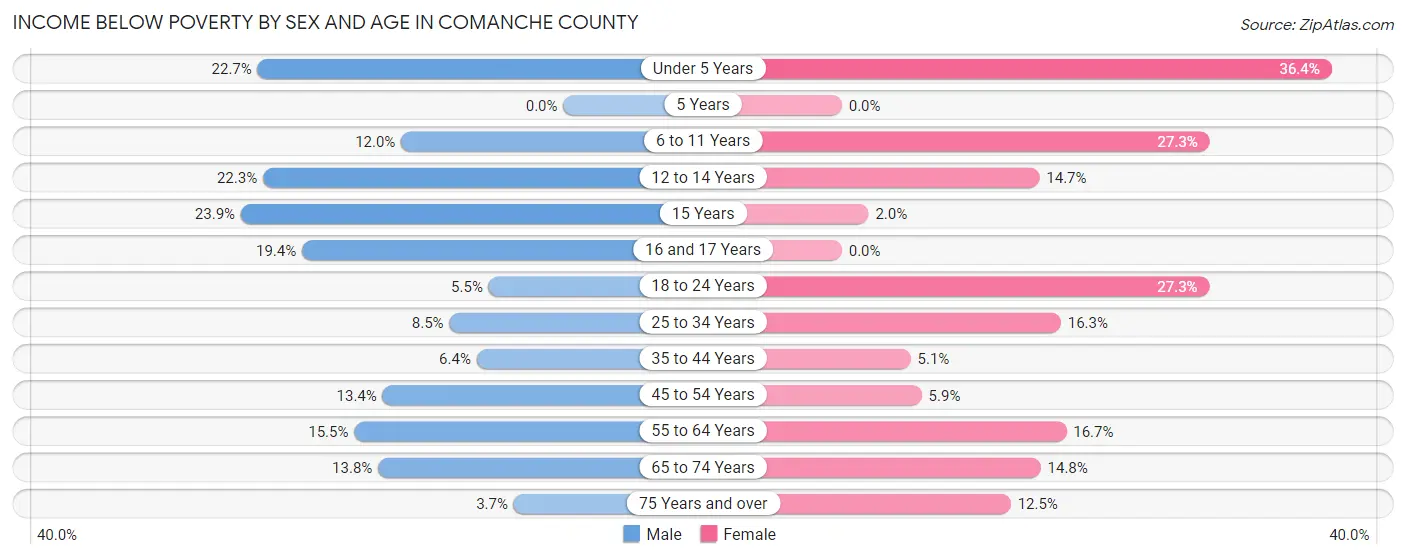
| Age Bracket | Male | Female |
| Under 5 Years | 79 (22.7%) | 128 (36.4%) |
| 5 Years | 0 (0.0%) | 0 (0.0%) |
| 6 to 11 Years | 68 (12.0%) | 151 (27.3%) |
| 12 to 14 Years | 60 (22.3%) | 38 (14.7%) |
| 15 Years | 17 (23.9%) | 2 (2.0%) |
| 16 and 17 Years | 39 (19.4%) | 0 (0.0%) |
| 18 to 24 Years | 26 (5.5%) | 131 (27.3%) |
| 25 to 34 Years | 66 (8.5%) | 106 (16.3%) |
| 35 to 44 Years | 45 (6.4%) | 38 (5.1%) |
| 45 to 54 Years | 102 (13.4%) | 47 (5.9%) |
| 55 to 64 Years | 154 (15.5%) | 152 (16.7%) |
| 65 to 74 Years | 120 (13.8%) | 141 (14.8%) |
| 75 Years and over | 23 (3.7%) | 83 (12.5%) |
| Total | 799 (11.8%) | 1,017 (15.2%) |
Income Above Poverty by Sex and Age in Comanche County
According to the poverty statistics in Comanche County, males aged 5 years and females aged 5 years are the age groups that are most secure financially, with 100.0% of males and 100.0% of females in these age groups living above the poverty line.
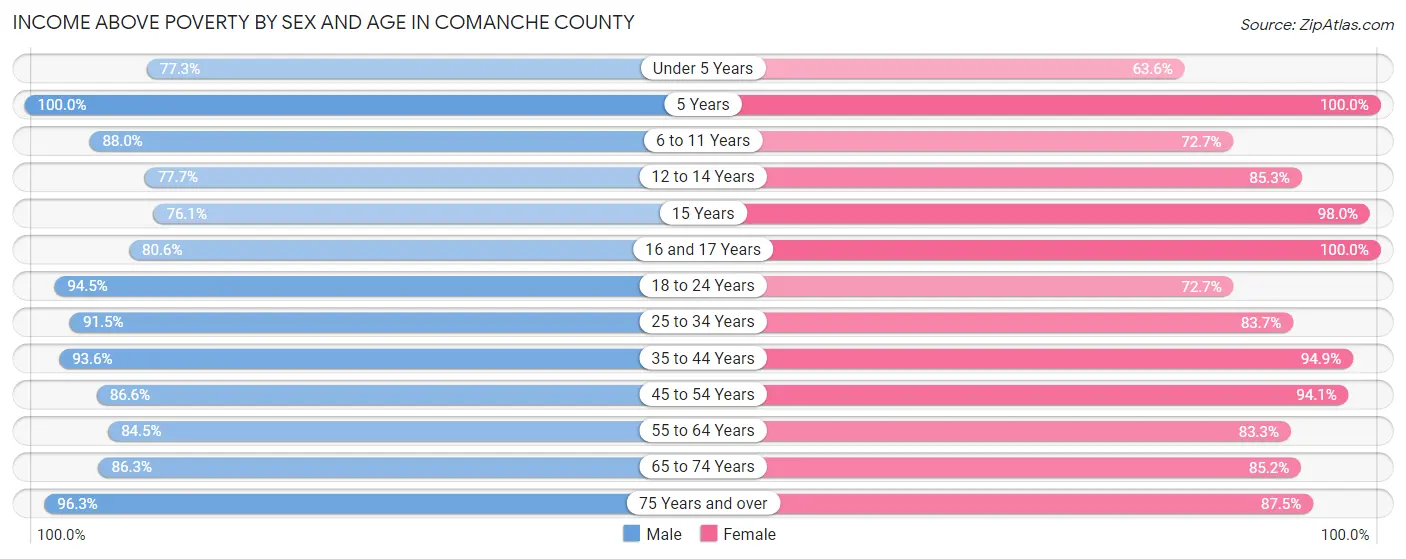
| Age Bracket | Male | Female |
| Under 5 Years | 269 (77.3%) | 224 (63.6%) |
| 5 Years | 92 (100.0%) | 39 (100.0%) |
| 6 to 11 Years | 497 (88.0%) | 402 (72.7%) |
| 12 to 14 Years | 209 (77.7%) | 221 (85.3%) |
| 15 Years | 54 (76.1%) | 99 (98.0%) |
| 16 and 17 Years | 162 (80.6%) | 179 (100.0%) |
| 18 to 24 Years | 443 (94.5%) | 349 (72.7%) |
| 25 to 34 Years | 714 (91.5%) | 546 (83.7%) |
| 35 to 44 Years | 655 (93.6%) | 705 (94.9%) |
| 45 to 54 Years | 658 (86.6%) | 745 (94.1%) |
| 55 to 64 Years | 838 (84.5%) | 760 (83.3%) |
| 65 to 74 Years | 753 (86.3%) | 814 (85.2%) |
| 75 Years and over | 602 (96.3%) | 579 (87.5%) |
| Total | 5,946 (88.1%) | 5,662 (84.8%) |
Income Below Poverty Among Married-Couple Families in Comanche County
The poverty statistics for married-couple families in Comanche County show that 8.0% or 244 of the total 3,035 families live below the poverty line. Families with 5 or more children have the highest poverty rate of 80.0%, comprising of 4 families. On the other hand, families with 1 or 2 children have the lowest poverty rate of 6.2%, which includes 65 families.
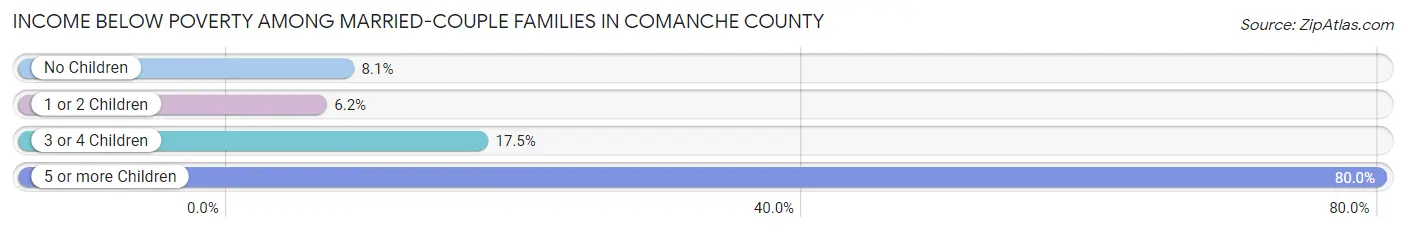
| Children | Above Poverty | Below Poverty |
| No Children | 1,687 (91.9%) | 149 (8.1%) |
| 1 or 2 Children | 980 (93.8%) | 65 (6.2%) |
| 3 or 4 Children | 123 (82.6%) | 26 (17.4%) |
| 5 or more Children | 1 (20.0%) | 4 (80.0%) |
| Total | 2,791 (92.0%) | 244 (8.0%) |
Income Below Poverty Among Single-Parent Households in Comanche County
According to the poverty data in Comanche County, 15.0% or 22 single-father households and 15.0% or 62 single-mother households are living below the poverty line. Among single-father households, those with 1 or 2 children have the highest poverty rate, with 13 households (19.1%) experiencing poverty. Likewise, among single-mother households, those with 3 or 4 children have the highest poverty rate, with 14 households (31.1%) falling below the poverty line.
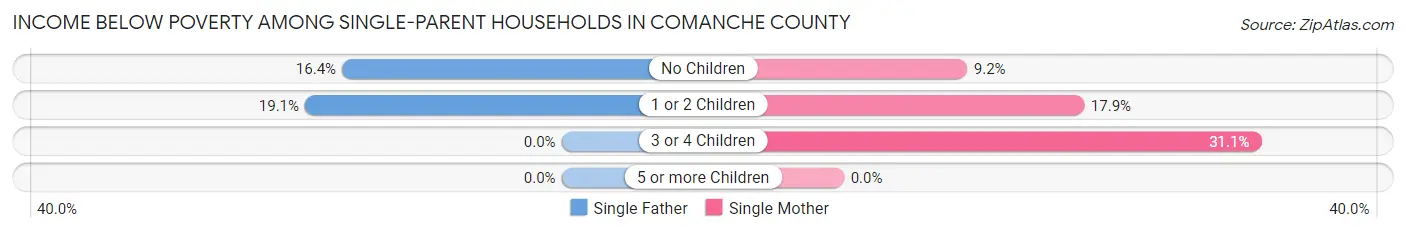
| Children | Single Father | Single Mother |
| No Children | 9 (16.4%) | 19 (9.2%) |
| 1 or 2 Children | 13 (19.1%) | 29 (17.9%) |
| 3 or 4 Children | 0 (0.0%) | 14 (31.1%) |
| 5 or more Children | 0 (0.0%) | 0 (0.0%) |
| Total | 22 (15.0%) | 62 (15.0%) |
Income Below Poverty Among Married-Couple vs Single-Parent Households in Comanche County
The poverty data for Comanche County shows that 244 of the married-couple family households (8.0%) and 84 of the single-parent households (15.0%) are living below the poverty level. Within the married-couple family households, those with 5 or more children have the highest poverty rate, with 4 households (80.0%) falling below the poverty line. Among the single-parent households, those with 3 or 4 children have the highest poverty rate, with 14 household (20.3%) living below poverty.
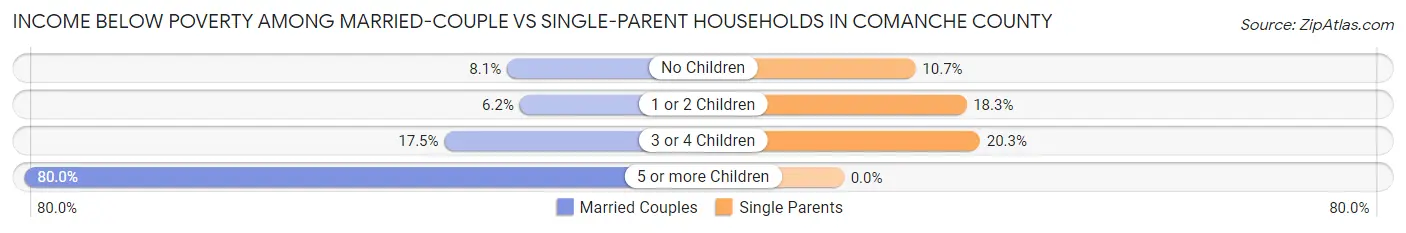
| Children | Married-Couple Families | Single-Parent Households |
| No Children | 149 (8.1%) | 28 (10.7%) |
| 1 or 2 Children | 65 (6.2%) | 42 (18.3%) |
| 3 or 4 Children | 26 (17.4%) | 14 (20.3%) |
| 5 or more Children | 4 (80.0%) | 0 (0.0%) |
| Total | 244 (8.0%) | 84 (15.0%) |
Race in Comanche County
The most populous races in Comanche County are White / Caucasian (10,200 | 74.7%), Hispanic or Latino (3,983 | 29.2%), and Two or more Races (2,823 | 20.7%).
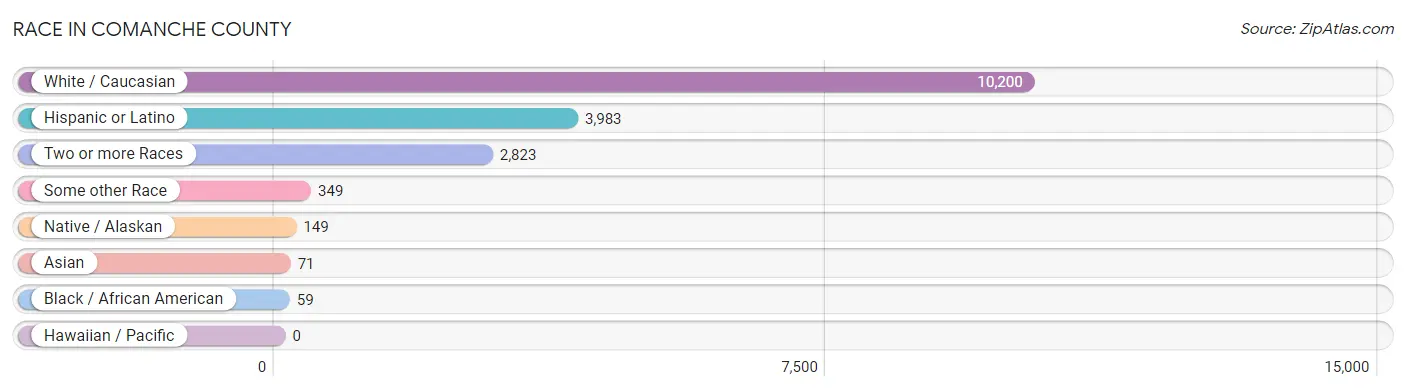
| Race | # Population | % Population |
| Asian | 71 | 0.5% |
| Black / African American | 59 | 0.4% |
| Hawaiian / Pacific | 0 | 0.0% |
| Hispanic or Latino | 3,983 | 29.2% |
| Native / Alaskan | 149 | 1.1% |
| White / Caucasian | 10,200 | 74.7% |
| Two or more Races | 2,823 | 20.7% |
| Some other Race | 349 | 2.6% |
| Total | 13,651 | 100.0% |
Ancestry in Comanche County
The most populous ancestries reported in Comanche County are Mexican (3,846 | 28.2%), German (1,352 | 9.9%), English (1,310 | 9.6%), Irish (1,153 | 8.5%), and American (1,051 | 7.7%), together accounting for 63.8% of all Comanche County residents.
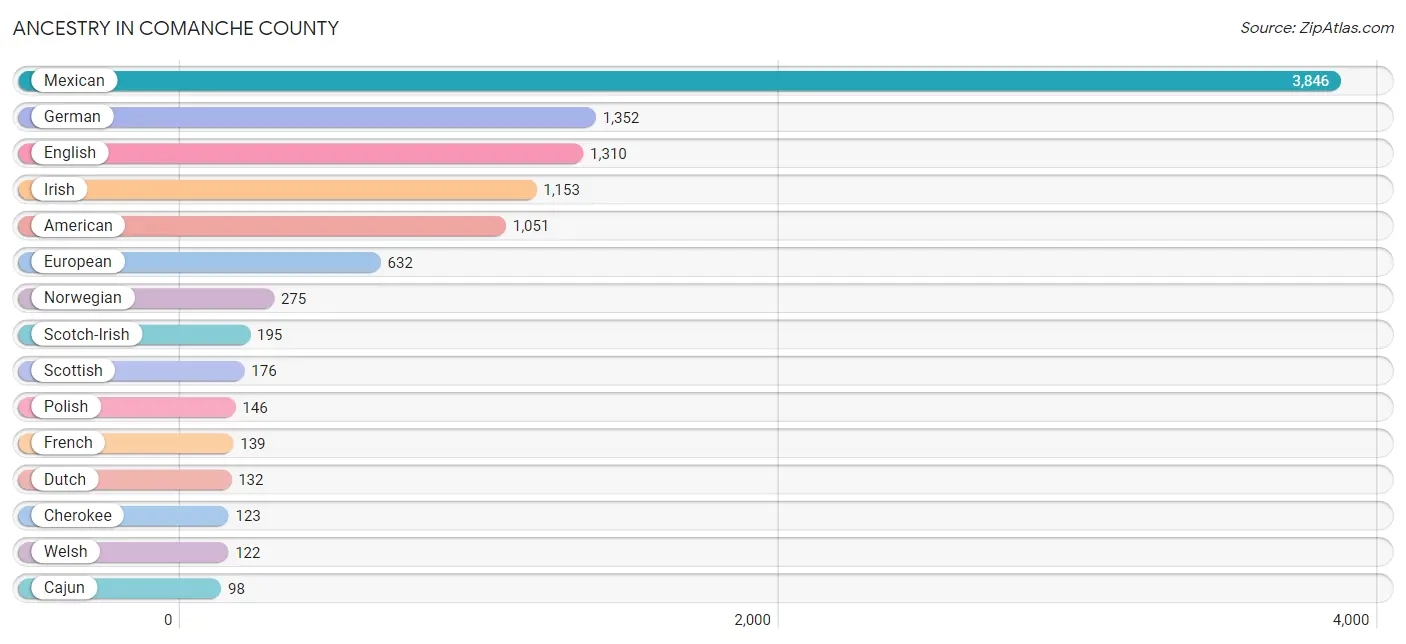
| Ancestry | # Population | % Population |
| American | 1,051 | 7.7% |
| Belgian | 4 | 0.0% |
| British | 52 | 0.4% |
| Burmese | 6 | 0.0% |
| Cajun | 98 | 0.7% |
| Central American | 15 | 0.1% |
| Cherokee | 123 | 0.9% |
| Choctaw | 44 | 0.3% |
| Comanche | 2 | 0.0% |
| Creek | 4 | 0.0% |
| Cuban | 12 | 0.1% |
| Czech | 39 | 0.3% |
| Danish | 8 | 0.1% |
| Dutch | 132 | 1.0% |
| Dutch West Indian | 3 | 0.0% |
| English | 1,310 | 9.6% |
| European | 632 | 4.6% |
| Finnish | 3 | 0.0% |
| French | 139 | 1.0% |
| German | 1,352 | 9.9% |
| Guatemalan | 13 | 0.1% |
| Honduran | 1 | 0.0% |
| Irish | 1,153 | 8.5% |
| Italian | 94 | 0.7% |
| Japanese | 6 | 0.0% |
| Korean | 31 | 0.2% |
| Laotian | 29 | 0.2% |
| Luxembourger | 27 | 0.2% |
| Mexican | 3,846 | 28.2% |
| Mexican American Indian | 93 | 0.7% |
| Northern European | 46 | 0.3% |
| Norwegian | 275 | 2.0% |
| Panamanian | 1 | 0.0% |
| Polish | 146 | 1.1% |
| Portuguese | 13 | 0.1% |
| Russian | 2 | 0.0% |
| Scandinavian | 42 | 0.3% |
| Scotch-Irish | 195 | 1.4% |
| Scottish | 176 | 1.3% |
| South African | 15 | 0.1% |
| Spaniard | 77 | 0.6% |
| Spanish | 13 | 0.1% |
| Sri Lankan | 1 | 0.0% |
| Subsaharan African | 15 | 0.1% |
| Swedish | 41 | 0.3% |
| Thai | 37 | 0.3% |
| Welsh | 122 | 0.9% | View All 47 Rows |
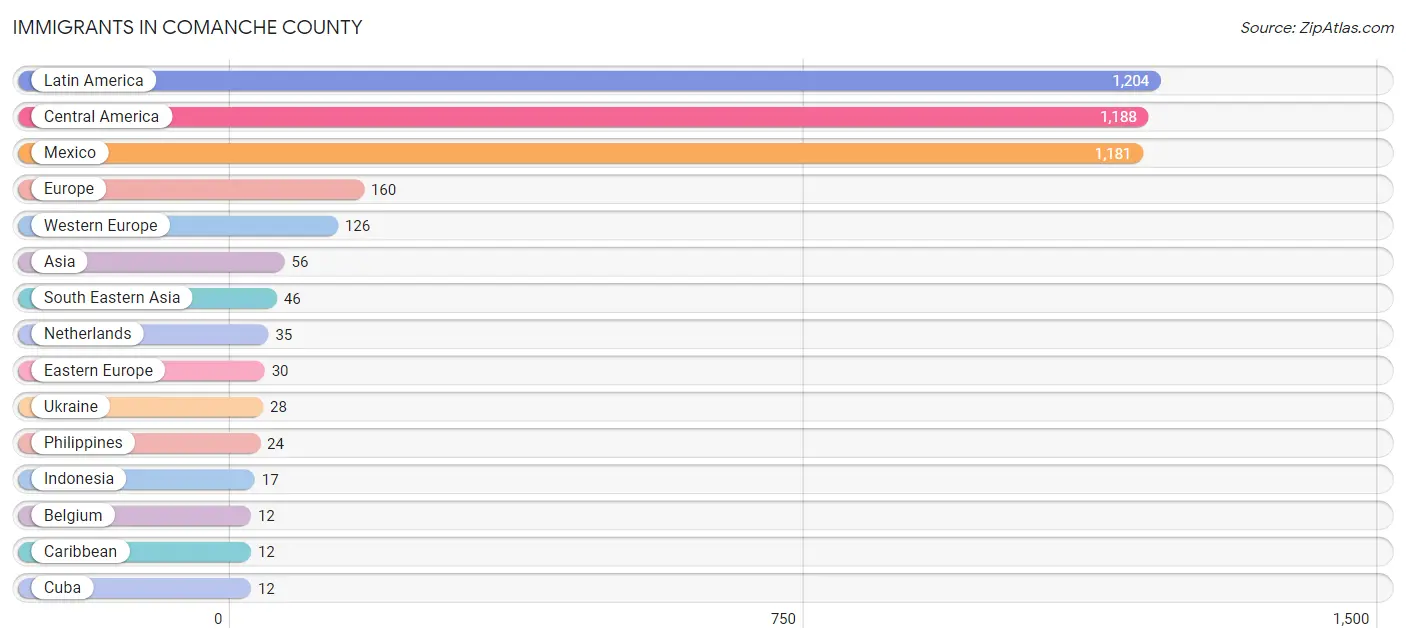
Immigrants in Comanche County
The most numerous immigrant groups reported in Comanche County came from Latin America (1,204 | 8.8%), Central America (1,188 | 8.7%), Mexico (1,181 | 8.6%), Europe (160 | 1.2%), and Western Europe (126 | 0.9%), together accounting for 28.3% of all Comanche County residents.
| Immigration Origin | # Population | % Population |
| Africa | 7 | 0.1% |
| Asia | 56 | 0.4% |
| Belgium | 12 | 0.1% |
| Brazil | 4 | 0.0% |
| Cambodia | 2 | 0.0% |
| Canada | 10 | 0.1% |
| Caribbean | 12 | 0.1% |
| Central America | 1,188 | 8.7% |
| Cuba | 12 | 0.1% |
| Eastern Africa | 2 | 0.0% |
| Eastern Asia | 10 | 0.1% |
| Eastern Europe | 30 | 0.2% |
| Europe | 160 | 1.2% |
| Germany | 10 | 0.1% |
| Guatemala | 6 | 0.0% |
| Honduras | 1 | 0.0% |
| Indonesia | 17 | 0.1% |
| Korea | 10 | 0.1% |
| Latin America | 1,204 | 8.8% |
| Mexico | 1,181 | 8.6% |
| Netherlands | 35 | 0.3% |
| Northern Europe | 4 | 0.0% |
| Philippines | 24 | 0.2% |
| Russia | 2 | 0.0% |
| South Africa | 5 | 0.0% |
| South America | 4 | 0.0% |
| South Eastern Asia | 46 | 0.3% |
| Thailand | 2 | 0.0% |
| Ukraine | 28 | 0.2% |
| Vietnam | 1 | 0.0% |
| Western Europe | 126 | 0.9% |
| Zimbabwe | 2 | 0.0% | View All 32 Rows |
Sex and Age in Comanche County
Sex and Age in Comanche County
The most populous age groups in Comanche County are 55 to 59 Years (664 | 9.7%) for men and 55 to 59 Years (497 | 7.3%) for women.
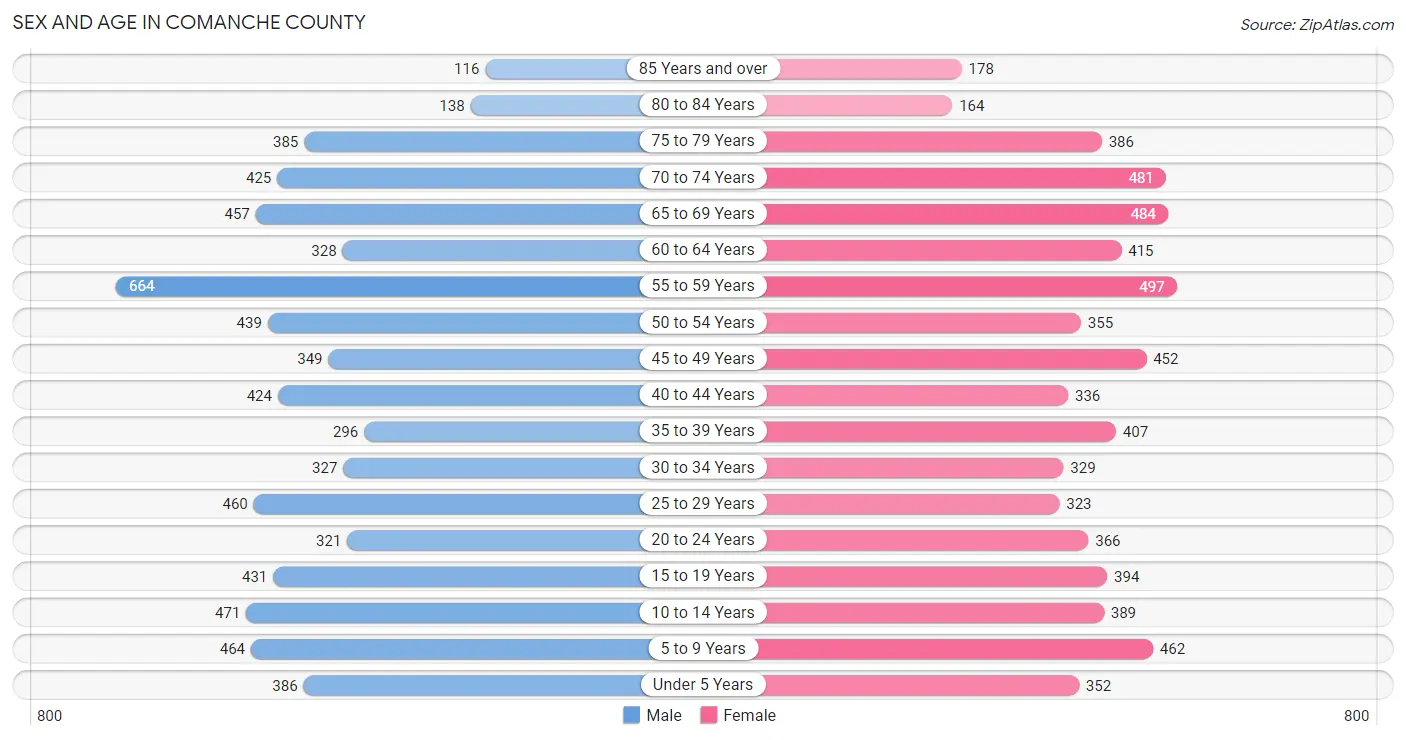
| Age Bracket | Male | Female |
| Under 5 Years | 386 (5.6%) | 352 (5.2%) |
| 5 to 9 Years | 464 (6.7%) | 462 (6.8%) |
| 10 to 14 Years | 471 (6.8%) | 389 (5.8%) |
| 15 to 19 Years | 431 (6.3%) | 394 (5.8%) |
| 20 to 24 Years | 321 (4.7%) | 366 (5.4%) |
| 25 to 29 Years | 460 (6.7%) | 323 (4.8%) |
| 30 to 34 Years | 327 (4.8%) | 329 (4.9%) |
| 35 to 39 Years | 296 (4.3%) | 407 (6.0%) |
| 40 to 44 Years | 424 (6.2%) | 336 (5.0%) |
| 45 to 49 Years | 349 (5.1%) | 452 (6.7%) |
| 50 to 54 Years | 439 (6.4%) | 355 (5.2%) |
| 55 to 59 Years | 664 (9.7%) | 497 (7.3%) |
| 60 to 64 Years | 328 (4.8%) | 415 (6.1%) |
| 65 to 69 Years | 457 (6.6%) | 484 (7.1%) |
| 70 to 74 Years | 425 (6.2%) | 481 (7.1%) |
| 75 to 79 Years | 385 (5.6%) | 386 (5.7%) |
| 80 to 84 Years | 138 (2.0%) | 164 (2.4%) |
| 85 Years and over | 116 (1.7%) | 178 (2.6%) |
| Total | 6,881 (100.0%) | 6,770 (100.0%) |
Families and Households in Comanche County
Median Family Size in Comanche County
The median family size in Comanche County is 3.13 persons per family, with single female/mother families (414 | 11.5%) accounting for the largest median family size of 3.17 persons per family. On the other hand, single male/father families (147 | 4.1%) represent the smallest median family size with 2.44 persons per family.
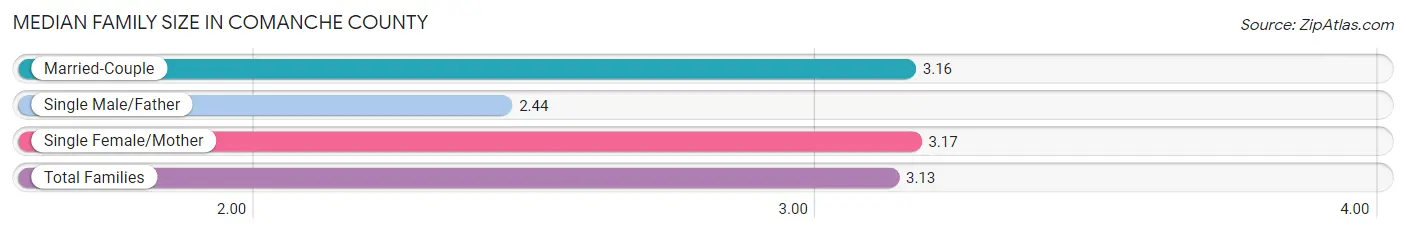
| Family Type | # Families | Family Size |
| Married-Couple | 3,035 (84.4%) | 3.16 |
| Single Male/Father | 147 (4.1%) | 2.44 |
| Single Female/Mother | 414 (11.5%) | 3.17 |
| Total Families | 3,596 (100.0%) | 3.13 |
Median Household Size in Comanche County
The median household size in Comanche County is 2.52 persons per household, with single female/mother households (414 | 7.7%) accounting for the largest median household size of 3.39 persons per household. non-family households (1,744 | 32.7%) represent the smallest median household size with 1.16 persons per household.
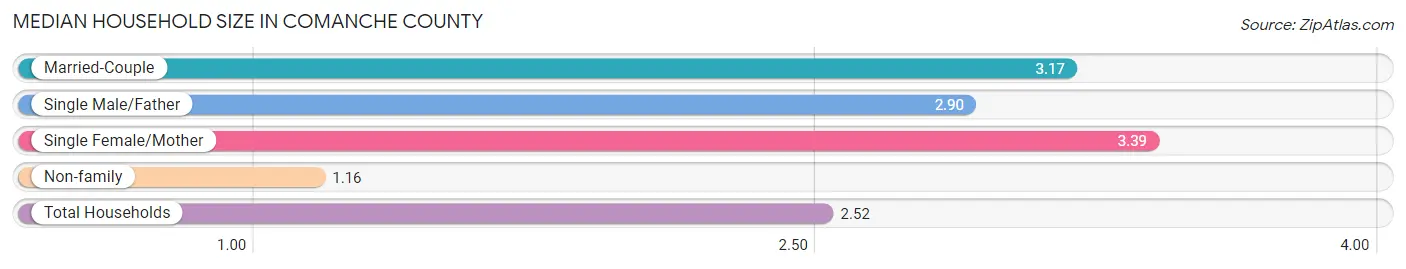
| Household Type | # Households | Household Size |
| Married-Couple | 3,035 (56.8%) | 3.17 |
| Single Male/Father | 147 (2.8%) | 2.90 |
| Single Female/Mother | 414 (7.7%) | 3.39 |
| Non-family | 1,744 (32.7%) | 1.16 |
| Total Households | 5,340 (100.0%) | 2.52 |
Household Size by Marriage Status in Comanche County
Out of a total of 5,340 households in Comanche County, 3,596 (67.3%) are family households, while 1,744 (32.7%) are nonfamily households. The most numerous type of family households are 2-person households, comprising 1,872, and the most common type of nonfamily households are 1-person households, comprising 1,528.
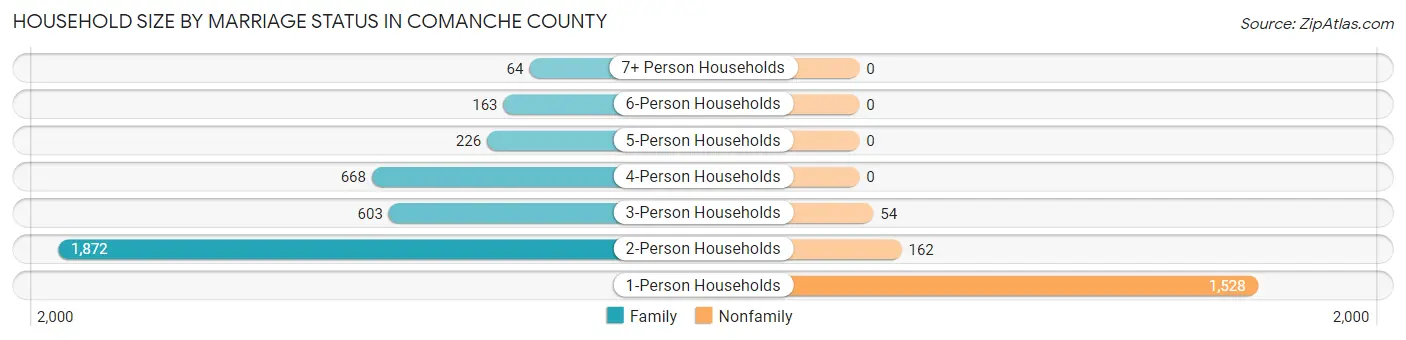
| Household Size | Family Households | Nonfamily Households |
| 1-Person Households | - | 1,528 (28.6%) |
| 2-Person Households | 1,872 (35.1%) | 162 (3.0%) |
| 3-Person Households | 603 (11.3%) | 54 (1.0%) |
| 4-Person Households | 668 (12.5%) | 0 (0.0%) |
| 5-Person Households | 226 (4.2%) | 0 (0.0%) |
| 6-Person Households | 163 (3.0%) | 0 (0.0%) |
| 7+ Person Households | 64 (1.2%) | 0 (0.0%) |
| Total | 3,596 (67.3%) | 1,744 (32.7%) |
Female Fertility in Comanche County
Fertility by Age in Comanche County
Average fertility rate in Comanche County is 39.0 births per 1,000 women. Women in the age bracket of 20 to 34 years have the highest fertility rate with 92.0 births per 1,000 women. Women in the age bracket of 20 to 34 years acount for 87.0% of all women with births.
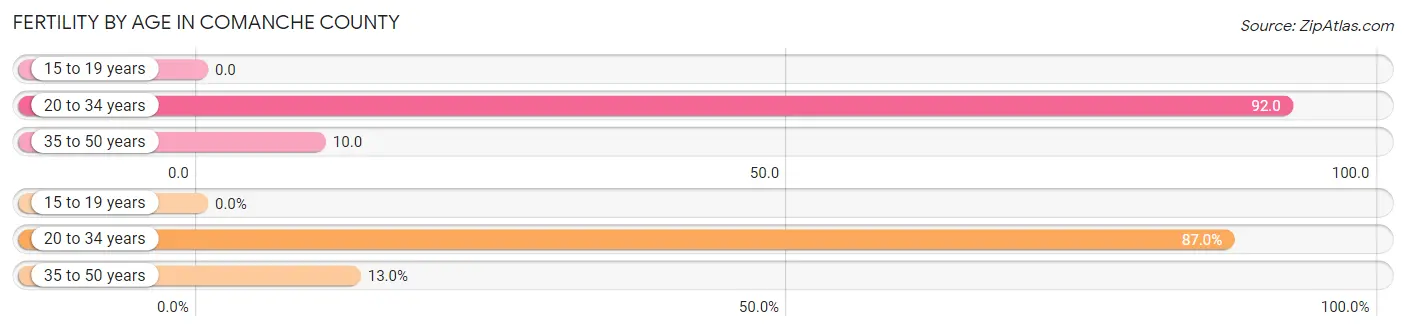
| Age Bracket | Women with Births | Births / 1,000 Women |
| 15 to 19 years | 0 (0.0%) | 0.0 |
| 20 to 34 years | 94 (87.0%) | 92.0 |
| 35 to 50 years | 14 (13.0%) | 10.0 |
| Total | 108 (100.0%) | 39.0 |
Fertility by Age by Marriage Status in Comanche County
73.1% of women with births (108) in Comanche County are married. The highest percentage of unmarried women with births falls into 20 to 34 years age bracket with 30.8% of them unmarried at the time of birth, while the lowest percentage of unmarried women with births belong to 35 to 50 years age bracket with 0.0% of them unmarried.
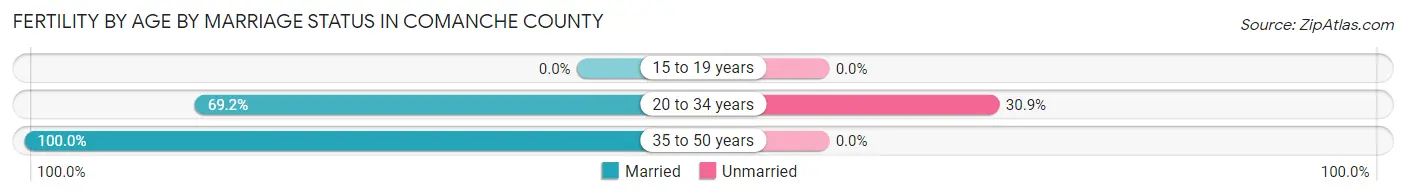
| Age Bracket | Married | Unmarried |
| 15 to 19 years | 0 (0.0%) | 0 (0.0%) |
| 20 to 34 years | 65 (69.2%) | 29 (30.8%) |
| 35 to 50 years | 14 (100.0%) | 0 (0.0%) |
| Total | 79 (73.2%) | 29 (26.9%) |
Fertility by Education in Comanche County
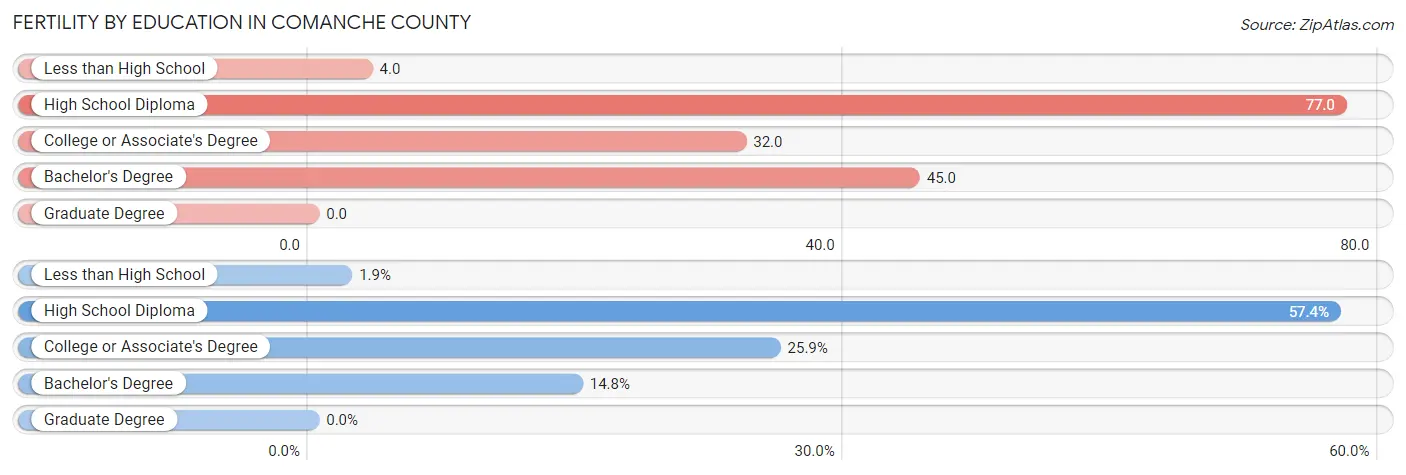
| Educational Attainment | Women with Births | Births / 1,000 Women |
| Less than High School | 2 (1.8%) | 4.0 |
| High School Diploma | 62 (57.4%) | 77.0 |
| College or Associate's Degree | 28 (25.9%) | 32.0 |
| Bachelor's Degree | 16 (14.8%) | 45.0 |
| Graduate Degree | 0 (0.0%) | 0.0 |
| Total | 108 (100.0%) | 39.0 |
Fertility by Education by Marriage Status in Comanche County
26.9% of women with births in Comanche County are unmarried. Women with the educational attainment of less than high school are most likely to be married with 100.0% of them married at childbirth, while women with the educational attainment of college or associate's degree are least likely to be married with 46.4% of them unmarried at childbirth.
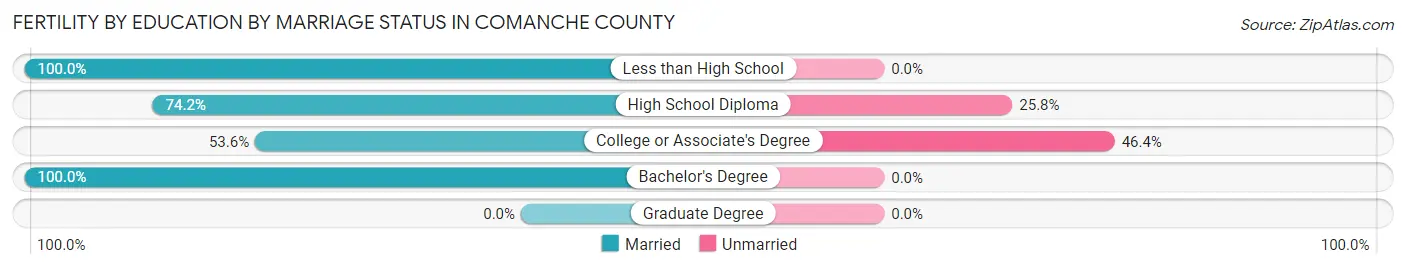
| Educational Attainment | Married | Unmarried |
| Less than High School | 2 (100.0%) | 0 (0.0%) |
| High School Diploma | 46 (74.2%) | 16 (25.8%) |
| College or Associate's Degree | 15 (53.6%) | 13 (46.4%) |
| Bachelor's Degree | 16 (100.0%) | 0 (0.0%) |
| Graduate Degree | 0 (0.0%) | 0 (0.0%) |
| Total | 79 (73.2%) | 29 (26.9%) |
Employment Characteristics in Comanche County
Employment by Class of Employer in Comanche County
Among the 6,042 employed individuals in Comanche County, private company employees (3,565 | 59.0%), self-employed (not incorporated) (800 | 13.2%), and local government employees (629 | 10.4%) make up the most common classes of employment.
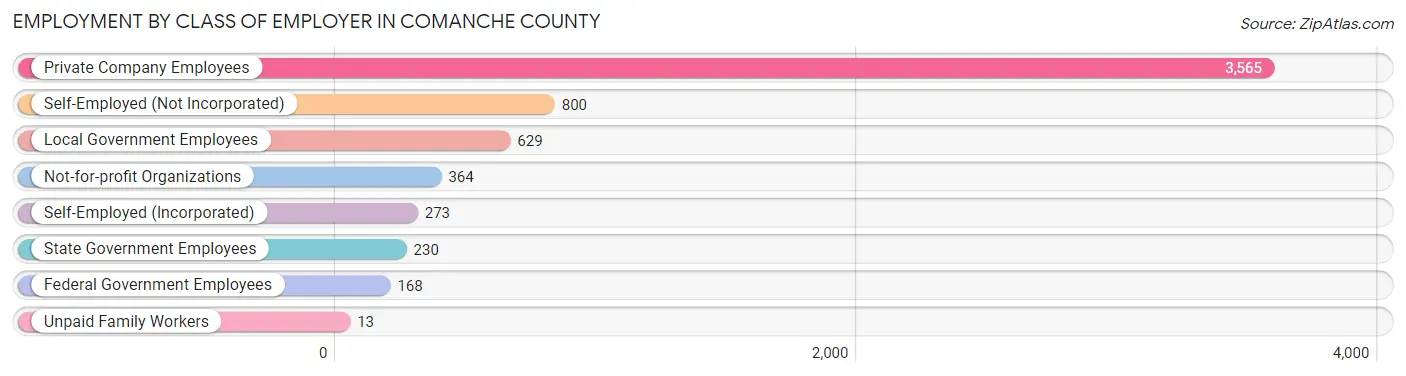
| Employer Class | # Employees | % Employees |
| Private Company Employees | 3,565 | 59.0% |
| Self-Employed (Incorporated) | 273 | 4.5% |
| Self-Employed (Not Incorporated) | 800 | 13.2% |
| Not-for-profit Organizations | 364 | 6.0% |
| Local Government Employees | 629 | 10.4% |
| State Government Employees | 230 | 3.8% |
| Federal Government Employees | 168 | 2.8% |
| Unpaid Family Workers | 13 | 0.2% |
| Total | 6,042 | 100.0% |
Employment Status by Age in Comanche County
According to the labor force statistics for Comanche County, out of the total population over 16 years of age (10,955), 60.8% or 6,661 individuals are in the labor force, with 7.3% or 486 of them unemployed. The age group with the highest labor force participation rate is 25 to 29 years, with 87.9% or 688 individuals in the labor force. Within the labor force, the 16 to 19 years age range has the highest percentage of unemployed individuals, with 21.5% or 64 of them being unemployed.
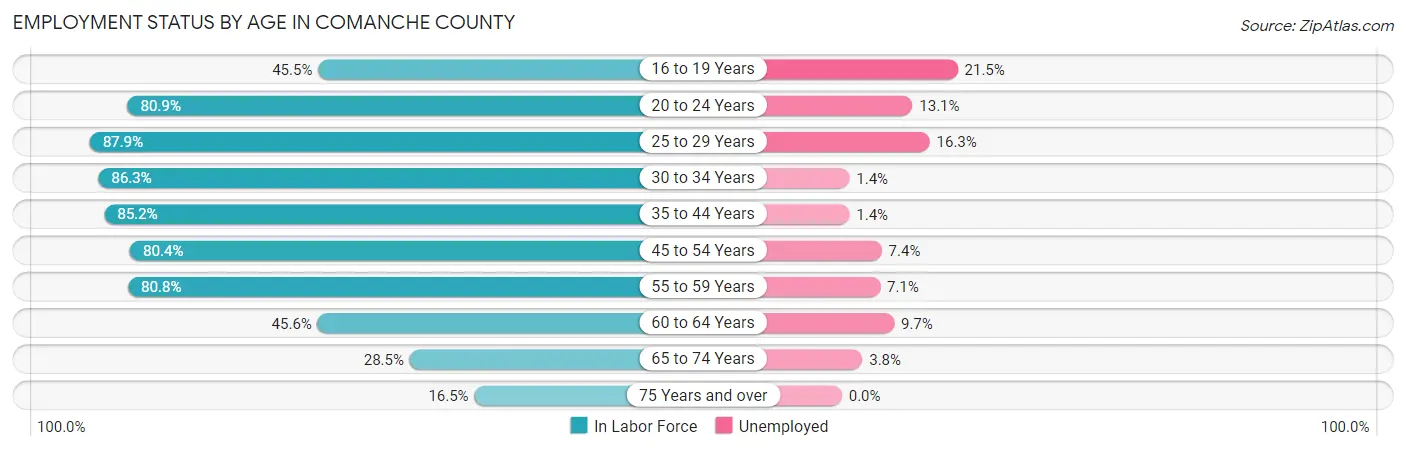
| Age Bracket | In Labor Force | Unemployed |
| 16 to 19 Years | 297 (45.5%) | 64 (21.5%) |
| 20 to 24 Years | 556 (80.9%) | 73 (13.1%) |
| 25 to 29 Years | 688 (87.9%) | 112 (16.3%) |
| 30 to 34 Years | 566 (86.3%) | 8 (1.4%) |
| 35 to 44 Years | 1,246 (85.2%) | 17 (1.4%) |
| 45 to 54 Years | 1,282 (80.4%) | 95 (7.4%) |
| 55 to 59 Years | 938 (80.8%) | 67 (7.1%) |
| 60 to 64 Years | 339 (45.6%) | 33 (9.7%) |
| 65 to 74 Years | 526 (28.5%) | 20 (3.8%) |
| 75 Years and over | 226 (16.5%) | 0 (0.0%) |
| Total | 6,661 (60.8%) | 486 (7.3%) |
Employment Status by Educational Attainment in Comanche County
According to labor force statistics for Comanche County, 79.1% of individuals (5,063) out of the total population between 25 and 64 years of age (6,401) are in the labor force, with 6.6% or 334 of them being unemployed. The group with the highest labor force participation rate are those with the educational attainment of bachelor's degree or higher, with 84.9% or 938 individuals in the labor force. Within the labor force, individuals with college / associate degree education have the highest percentage of unemployment, with 9.9% or 176 of them being unemployed.
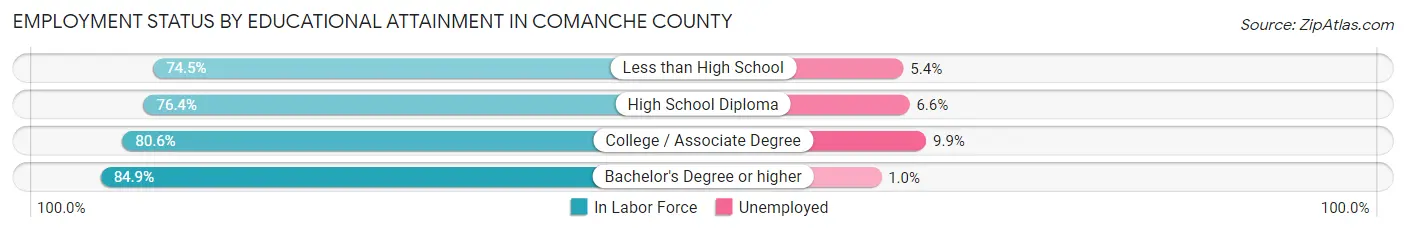
| Educational Attainment | In Labor Force | Unemployed |
| Less than High School | 716 (74.5%) | 52 (5.4%) |
| High School Diploma | 1,627 (76.4%) | 141 (6.6%) |
| College / Associate Degree | 1,778 (80.6%) | 218 (9.9%) |
| Bachelor's Degree or higher | 938 (84.9%) | 11 (1.0%) |
| Total | 5,063 (79.1%) | 422 (6.6%) |
Employment Occupations by Sex in Comanche County
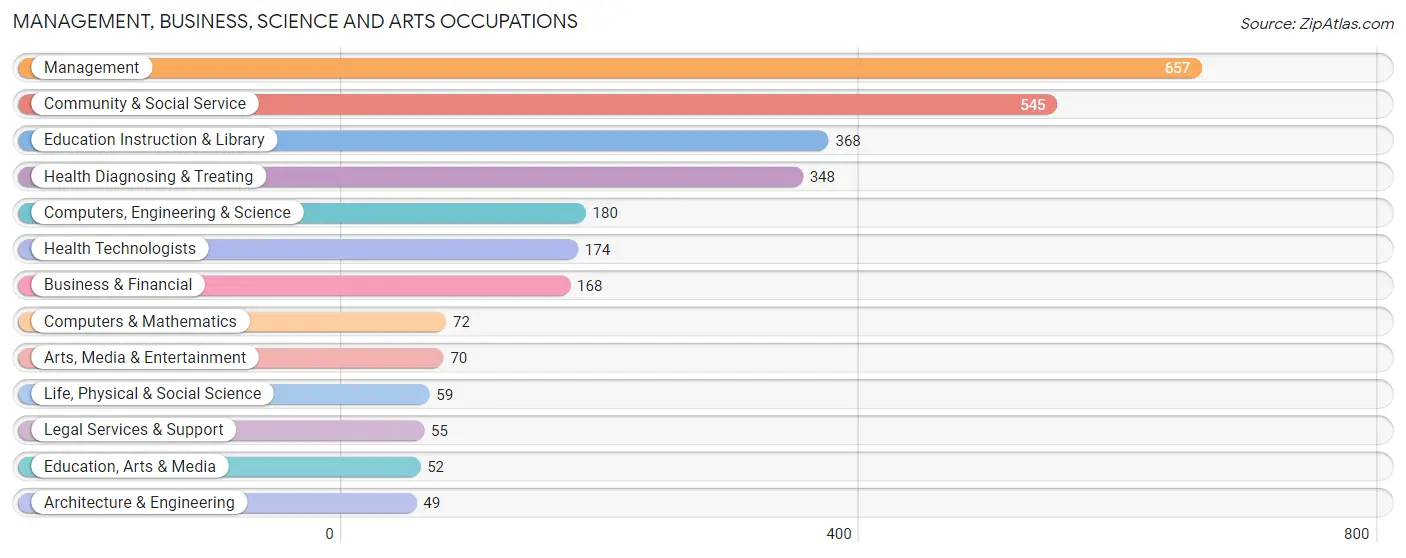
Management, Business, Science and Arts Occupations
The most common Management, Business, Science and Arts occupations in Comanche County are Management (657 | 10.6%), Community & Social Service (545 | 8.8%), Education Instruction & Library (368 | 6.0%), Health Diagnosing & Treating (348 | 5.6%), and Computers, Engineering & Science (180 | 2.9%).
Management, Business, Science and Arts Occupations by Sex
Within the Management, Business, Science and Arts occupations in Comanche County, the most male-oriented occupations are Management (79.1%), Legal Services & Support (78.2%), and Computers & Mathematics (56.9%), while the most female-oriented occupations are Health Diagnosing & Treating (92.8%), Arts, Media & Entertainment (88.6%), and Health Technologists (86.8%).
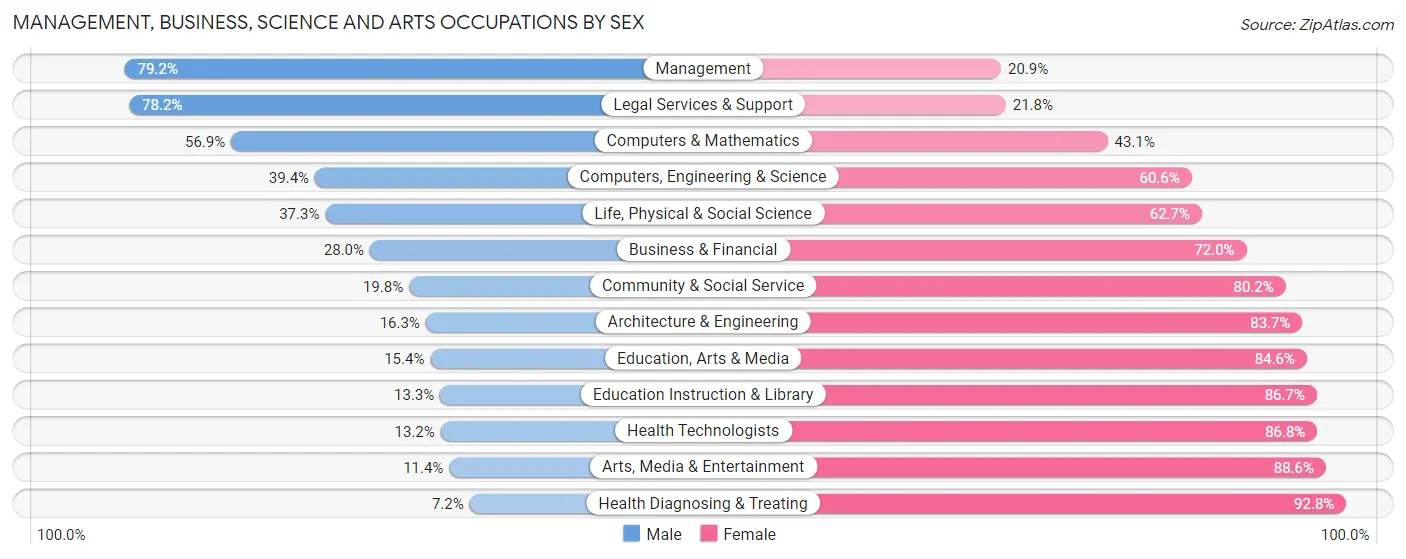
| Occupation | Male | Female |
| Management | 520 (79.1%) | 137 (20.8%) |
| Business & Financial | 47 (28.0%) | 121 (72.0%) |
| Computers, Engineering & Science | 71 (39.4%) | 109 (60.6%) |
| Computers & Mathematics | 41 (56.9%) | 31 (43.1%) |
| Architecture & Engineering | 8 (16.3%) | 41 (83.7%) |
| Life, Physical & Social Science | 22 (37.3%) | 37 (62.7%) |
| Community & Social Service | 108 (19.8%) | 437 (80.2%) |
| Education, Arts & Media | 8 (15.4%) | 44 (84.6%) |
| Legal Services & Support | 43 (78.2%) | 12 (21.8%) |
| Education Instruction & Library | 49 (13.3%) | 319 (86.7%) |
| Arts, Media & Entertainment | 8 (11.4%) | 62 (88.6%) |
| Health Diagnosing & Treating | 25 (7.2%) | 323 (92.8%) |
| Health Technologists | 23 (13.2%) | 151 (86.8%) |
| Total (Category) | 771 (40.6%) | 1,127 (59.4%) |
| Total (Overall) | 3,295 (53.3%) | 2,882 (46.7%) |
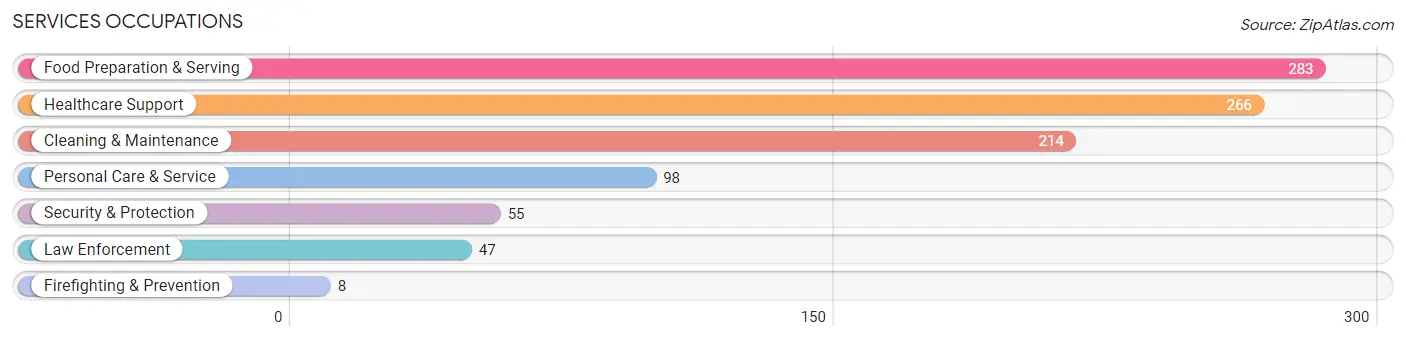
Services Occupations
The most common Services occupations in Comanche County are Food Preparation & Serving (283 | 4.6%), Healthcare Support (266 | 4.3%), Cleaning & Maintenance (214 | 3.5%), Personal Care & Service (98 | 1.6%), and Security & Protection (55 | 0.9%).
Services Occupations by Sex
Within the Services occupations in Comanche County, the most male-oriented occupations are Security & Protection (100.0%), Firefighting & Prevention (100.0%), and Law Enforcement (100.0%), while the most female-oriented occupations are Healthcare Support (100.0%), Personal Care & Service (69.4%), and Food Preparation & Serving (69.3%).
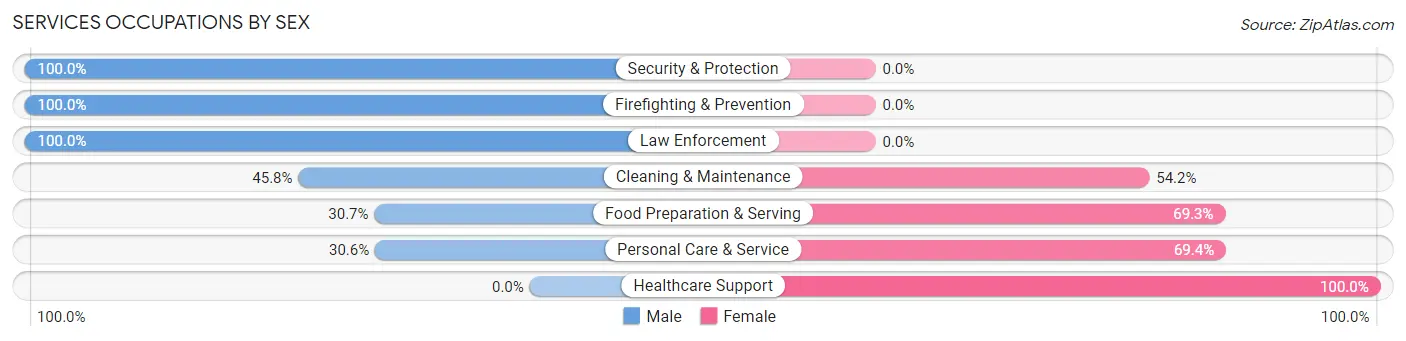
| Occupation | Male | Female |
| Healthcare Support | 0 (0.0%) | 266 (100.0%) |
| Security & Protection | 55 (100.0%) | 0 (0.0%) |
| Firefighting & Prevention | 8 (100.0%) | 0 (0.0%) |
| Law Enforcement | 47 (100.0%) | 0 (0.0%) |
| Food Preparation & Serving | 87 (30.7%) | 196 (69.3%) |
| Cleaning & Maintenance | 98 (45.8%) | 116 (54.2%) |
| Personal Care & Service | 30 (30.6%) | 68 (69.4%) |
| Total (Category) | 270 (29.5%) | 646 (70.5%) |
| Total (Overall) | 3,295 (53.3%) | 2,882 (46.7%) |
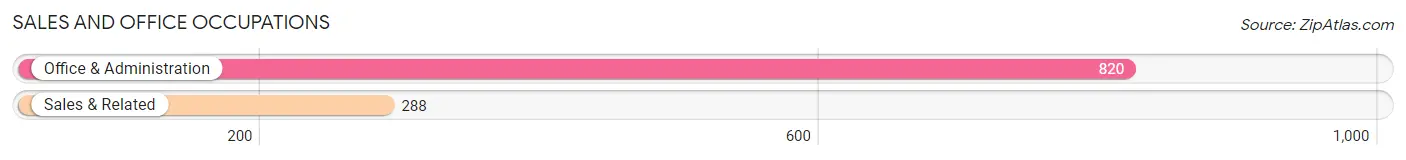
Sales and Office Occupations
The most common Sales and Office occupations in Comanche County are Office & Administration (820 | 13.3%), and Sales & Related (288 | 4.7%).
Sales and Office Occupations by Sex
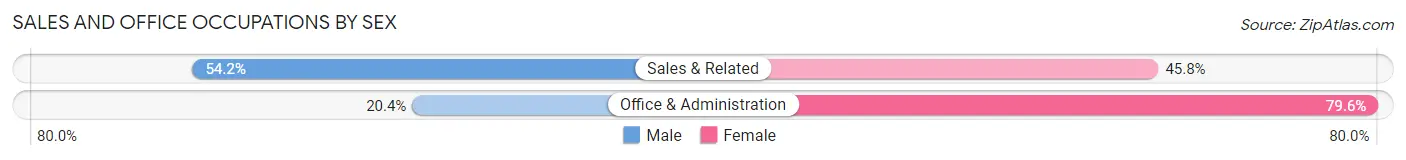
| Occupation | Male | Female |
| Sales & Related | 156 (54.2%) | 132 (45.8%) |
| Office & Administration | 167 (20.4%) | 653 (79.6%) |
| Total (Category) | 323 (29.1%) | 785 (70.9%) |
| Total (Overall) | 3,295 (53.3%) | 2,882 (46.7%) |
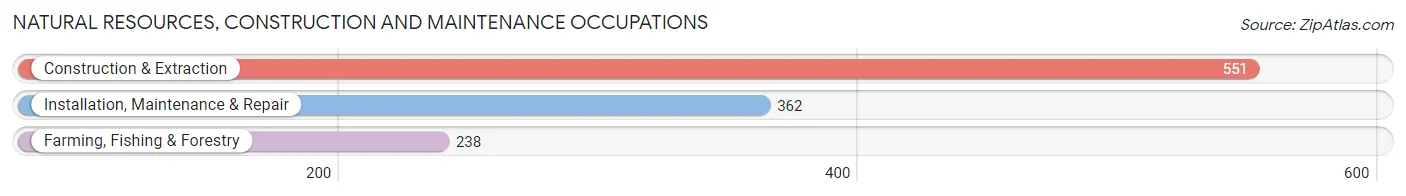
Natural Resources, Construction and Maintenance Occupations
The most common Natural Resources, Construction and Maintenance occupations in Comanche County are Construction & Extraction (551 | 8.9%), Installation, Maintenance & Repair (362 | 5.9%), and Farming, Fishing & Forestry (238 | 3.8%).
Natural Resources, Construction and Maintenance Occupations by Sex
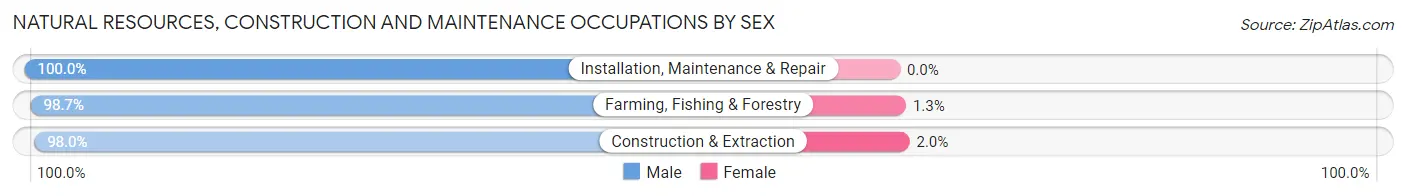
| Occupation | Male | Female |
| Farming, Fishing & Forestry | 235 (98.7%) | 3 (1.3%) |
| Construction & Extraction | 540 (98.0%) | 11 (2.0%) |
| Installation, Maintenance & Repair | 362 (100.0%) | 0 (0.0%) |
| Total (Category) | 1,137 (98.8%) | 14 (1.2%) |
| Total (Overall) | 3,295 (53.3%) | 2,882 (46.7%) |
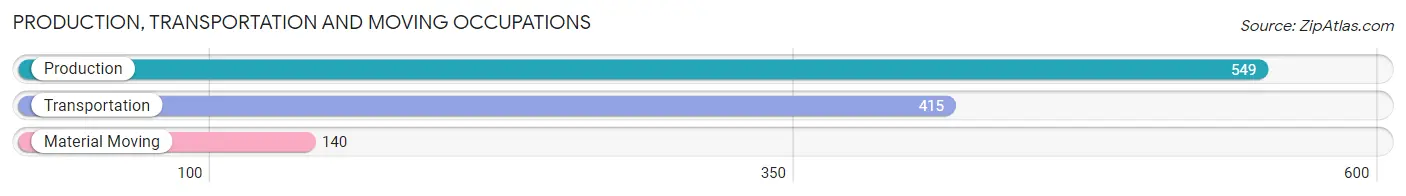
Production, Transportation and Moving Occupations
The most common Production, Transportation and Moving occupations in Comanche County are Production (549 | 8.9%), Transportation (415 | 6.7%), and Material Moving (140 | 2.3%).
Production, Transportation and Moving Occupations by Sex
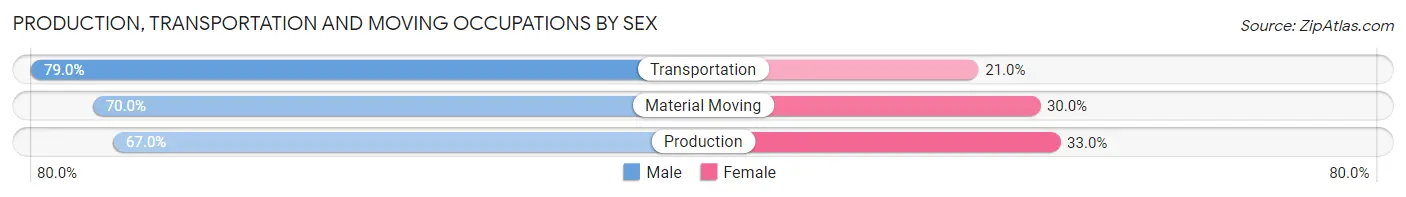
| Occupation | Male | Female |
| Production | 368 (67.0%) | 181 (33.0%) |
| Transportation | 328 (79.0%) | 87 (21.0%) |
| Material Moving | 98 (70.0%) | 42 (30.0%) |
| Total (Category) | 794 (71.9%) | 310 (28.1%) |
| Total (Overall) | 3,295 (53.3%) | 2,882 (46.7%) |
Employment Industries by Sex in Comanche County
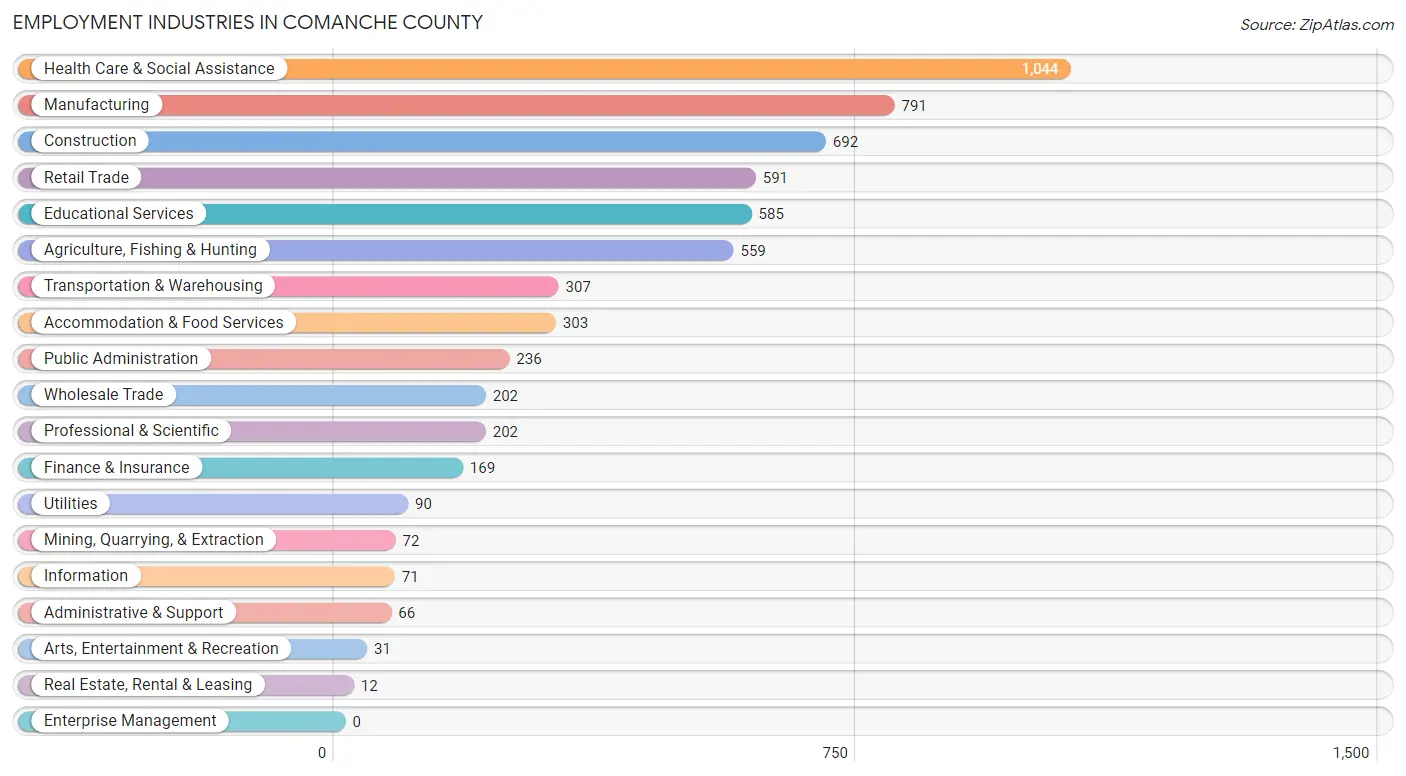
Employment Industries in Comanche County
The major employment industries in Comanche County include Health Care & Social Assistance (1,044 | 16.9%), Manufacturing (791 | 12.8%), Construction (692 | 11.2%), Retail Trade (591 | 9.6%), and Educational Services (585 | 9.5%).
Employment Industries by Sex in Comanche County
The Comanche County industries that see more men than women are Mining, Quarrying, & Extraction (94.4%), Construction (90.5%), and Transportation & Warehousing (86.6%), whereas the industries that tend to have a higher number of women are Real Estate, Rental & Leasing (100.0%), Arts, Entertainment & Recreation (100.0%), and Health Care & Social Assistance (94.8%).
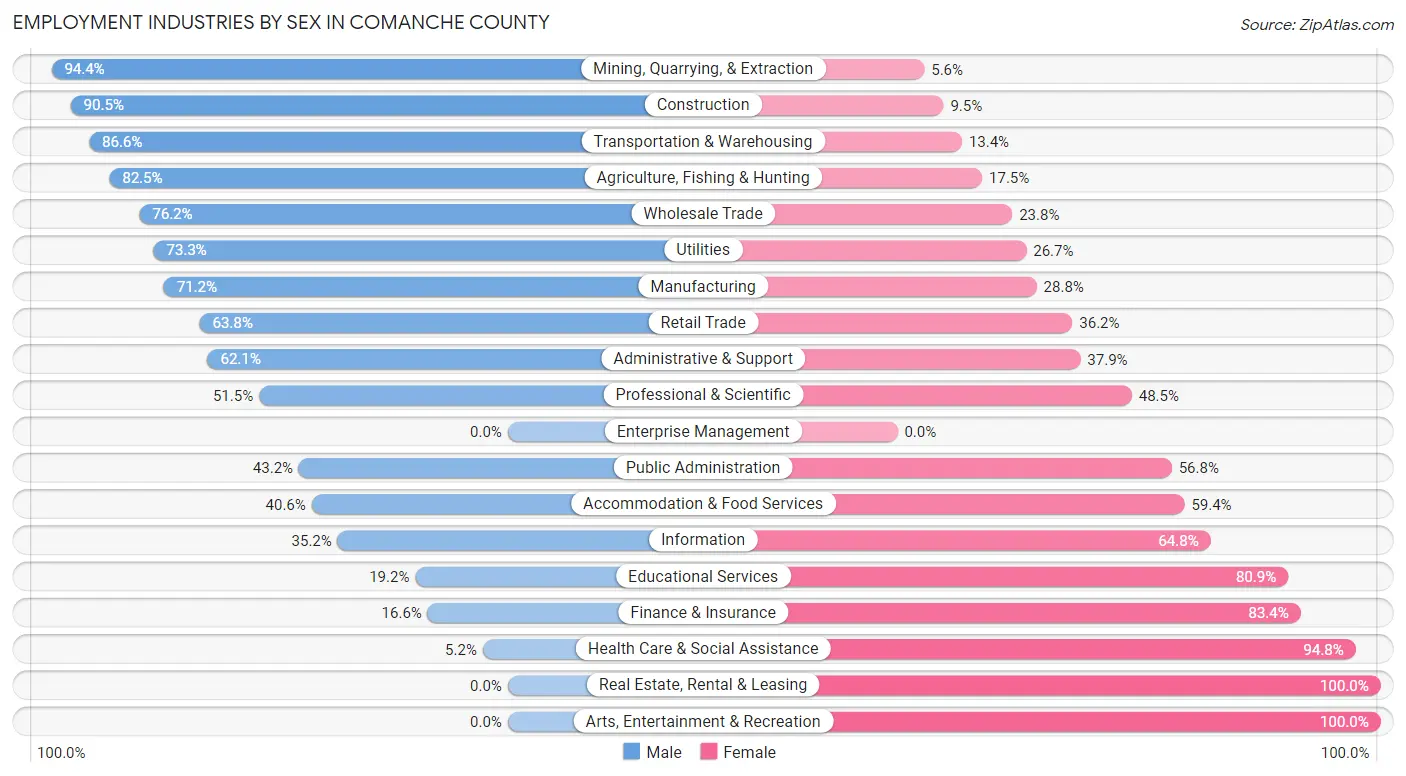
| Industry | Male | Female |
| Agriculture, Fishing & Hunting | 461 (82.5%) | 98 (17.5%) |
| Mining, Quarrying, & Extraction | 68 (94.4%) | 4 (5.6%) |
| Construction | 626 (90.5%) | 66 (9.5%) |
| Manufacturing | 563 (71.2%) | 228 (28.8%) |
| Wholesale Trade | 154 (76.2%) | 48 (23.8%) |
| Retail Trade | 377 (63.8%) | 214 (36.2%) |
| Transportation & Warehousing | 266 (86.6%) | 41 (13.4%) |
| Utilities | 66 (73.3%) | 24 (26.7%) |
| Information | 25 (35.2%) | 46 (64.8%) |
| Finance & Insurance | 28 (16.6%) | 141 (83.4%) |
| Real Estate, Rental & Leasing | 0 (0.0%) | 12 (100.0%) |
| Professional & Scientific | 104 (51.5%) | 98 (48.5%) |
| Enterprise Management | 0 (0.0%) | 0 (0.0%) |
| Administrative & Support | 41 (62.1%) | 25 (37.9%) |
| Educational Services | 112 (19.2%) | 473 (80.8%) |
| Health Care & Social Assistance | 54 (5.2%) | 990 (94.8%) |
| Arts, Entertainment & Recreation | 0 (0.0%) | 31 (100.0%) |
| Accommodation & Food Services | 123 (40.6%) | 180 (59.4%) |
| Public Administration | 102 (43.2%) | 134 (56.8%) |
| Total | 3,295 (53.3%) | 2,882 (46.7%) |
Education in Comanche County
School Enrollment in Comanche County
The most common levels of schooling among the 2,995 students in Comanche County are elementary school (831 | 27.8%), high school (699 | 23.3%), and middle school (667 | 22.3%).
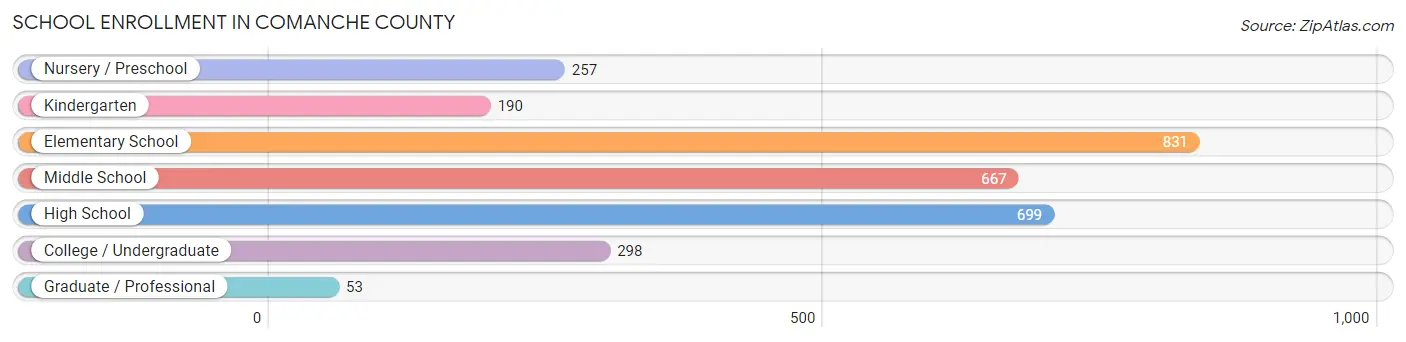
| School Level | # Students | % Students |
| Nursery / Preschool | 257 | 8.6% |
| Kindergarten | 190 | 6.3% |
| Elementary School | 831 | 27.8% |
| Middle School | 667 | 22.3% |
| High School | 699 | 23.3% |
| College / Undergraduate | 298 | 10.0% |
| Graduate / Professional | 53 | 1.8% |
| Total | 2,995 | 100.0% |
School Enrollment by Age by Funding Source in Comanche County
Out of a total of 2,995 students who are enrolled in schools in Comanche County, 326 (10.9%) attend a private institution, while the remaining 2,669 (89.1%) are enrolled in public schools. The age group of 35 years and over has the highest likelihood of being enrolled in private schools, with 38 (35.5% in the age bracket) enrolled. Conversely, the age group of 18 to 19 year olds has the lowest likelihood of being enrolled in a private school, with 167 (100.0% in the age bracket) attending a public institution.
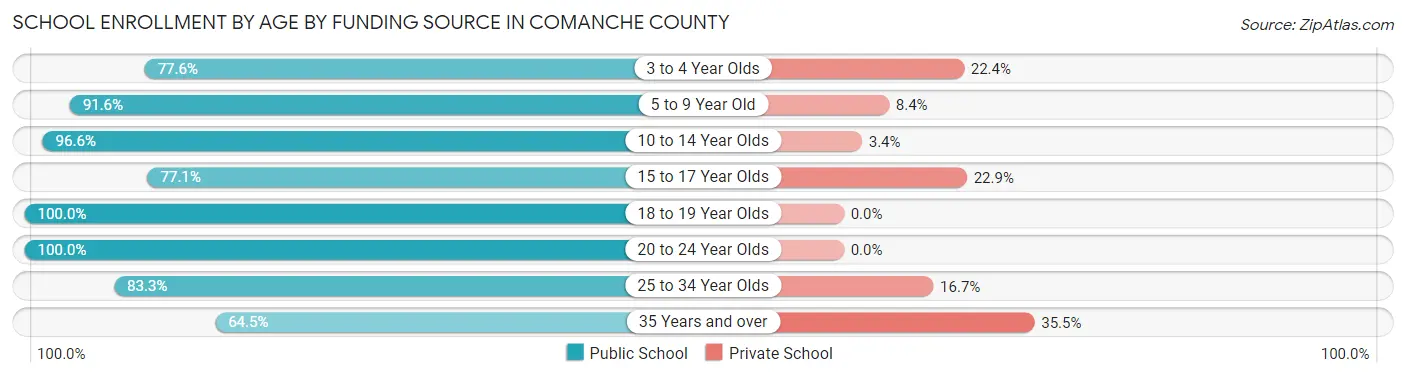
| Age Bracket | Public School | Private School |
| 3 to 4 Year Olds | 163 (77.6%) | 47 (22.4%) |
| 5 to 9 Year Old | 848 (91.6%) | 78 (8.4%) |
| 10 to 14 Year Olds | 831 (96.6%) | 29 (3.4%) |
| 15 to 17 Year Olds | 407 (77.1%) | 121 (22.9%) |
| 18 to 19 Year Olds | 167 (100.0%) | 0 (0.0%) |
| 20 to 24 Year Olds | 119 (100.0%) | 0 (0.0%) |
| 25 to 34 Year Olds | 65 (83.3%) | 13 (16.7%) |
| 35 Years and over | 69 (64.5%) | 38 (35.5%) |
| Total | 2,669 (89.1%) | 326 (10.9%) |
Educational Attainment by Field of Study in Comanche County
Education (524 | 27.8%), business (349 | 18.5%), bio, nature & agricultural (305 | 16.2%), arts & humanities (165 | 8.7%), and science & technology (144 | 7.6%) are the most common fields of study among 1,887 individuals in Comanche County who have obtained a bachelor's degree or higher.
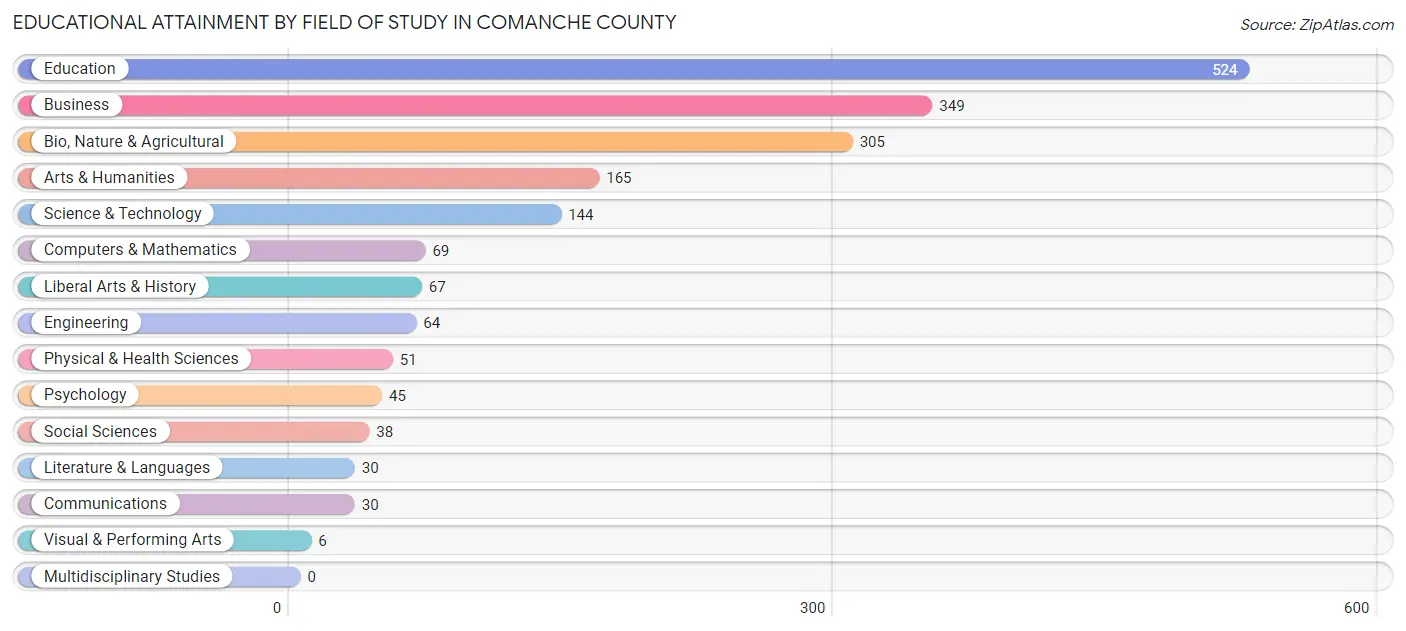
| Field of Study | # Graduates | % Graduates |
| Computers & Mathematics | 69 | 3.7% |
| Bio, Nature & Agricultural | 305 | 16.2% |
| Physical & Health Sciences | 51 | 2.7% |
| Psychology | 45 | 2.4% |
| Social Sciences | 38 | 2.0% |
| Engineering | 64 | 3.4% |
| Multidisciplinary Studies | 0 | 0.0% |
| Science & Technology | 144 | 7.6% |
| Business | 349 | 18.5% |
| Education | 524 | 27.8% |
| Literature & Languages | 30 | 1.6% |
| Liberal Arts & History | 67 | 3.5% |
| Visual & Performing Arts | 6 | 0.3% |
| Communications | 30 | 1.6% |
| Arts & Humanities | 165 | 8.7% |
| Total | 1,887 | 100.0% |
Transportation & Commute in Comanche County
Vehicle Availability by Sex in Comanche County
The most prevalent vehicle ownership categories in Comanche County are males with 2 vehicles (1,186, accounting for 36.4%) and females with 2 vehicles (809, making up 42.6%).
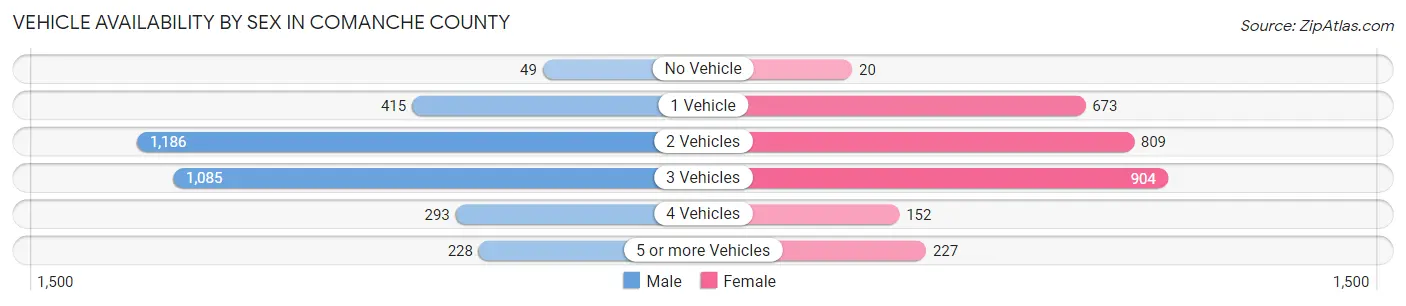
| Vehicles Available | Male | Female |
| No Vehicle | 49 (1.5%) | 20 (0.7%) |
| 1 Vehicle | 415 (12.8%) | 673 (24.2%) |
| 2 Vehicles | 1,186 (36.4%) | 809 (29.0%) |
| 3 Vehicles | 1,085 (33.3%) | 904 (32.5%) |
| 4 Vehicles | 293 (9.0%) | 152 (5.5%) |
| 5 or more Vehicles | 228 (7.0%) | 227 (8.2%) |
| Total | 3,256 (100.0%) | 2,785 (100.0%) |
Commute Time in Comanche County
The most frequently occuring commute durations in Comanche County are 5 to 9 minutes (1,136 commuters, 19.7%), 10 to 14 minutes (979 commuters, 16.9%), and 30 to 34 minutes (691 commuters, 12.0%).
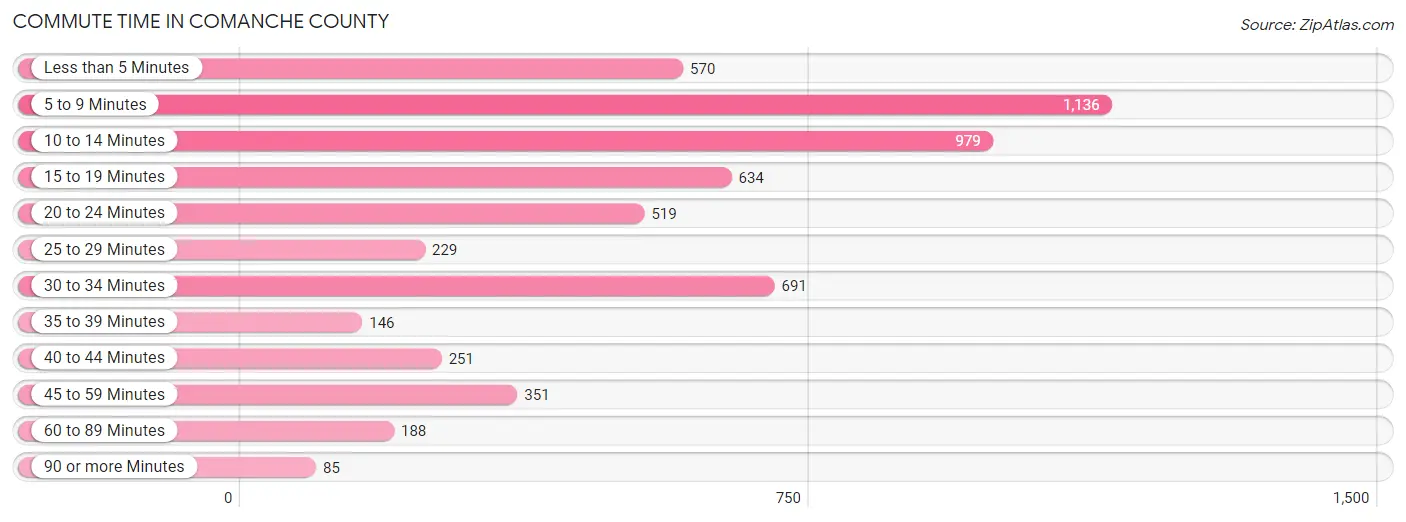
| Commute Time | # Commuters | % Commuters |
| Less than 5 Minutes | 570 | 9.9% |
| 5 to 9 Minutes | 1,136 | 19.7% |
| 10 to 14 Minutes | 979 | 16.9% |
| 15 to 19 Minutes | 634 | 11.0% |
| 20 to 24 Minutes | 519 | 9.0% |
| 25 to 29 Minutes | 229 | 4.0% |
| 30 to 34 Minutes | 691 | 12.0% |
| 35 to 39 Minutes | 146 | 2.5% |
| 40 to 44 Minutes | 251 | 4.3% |
| 45 to 59 Minutes | 351 | 6.1% |
| 60 to 89 Minutes | 188 | 3.3% |
| 90 or more Minutes | 85 | 1.5% |
Commute Time by Sex in Comanche County
The most common commute times in Comanche County are 5 to 9 minutes (624 commuters, 19.8%) for males and 5 to 9 minutes (512 commuters, 19.5%) for females.
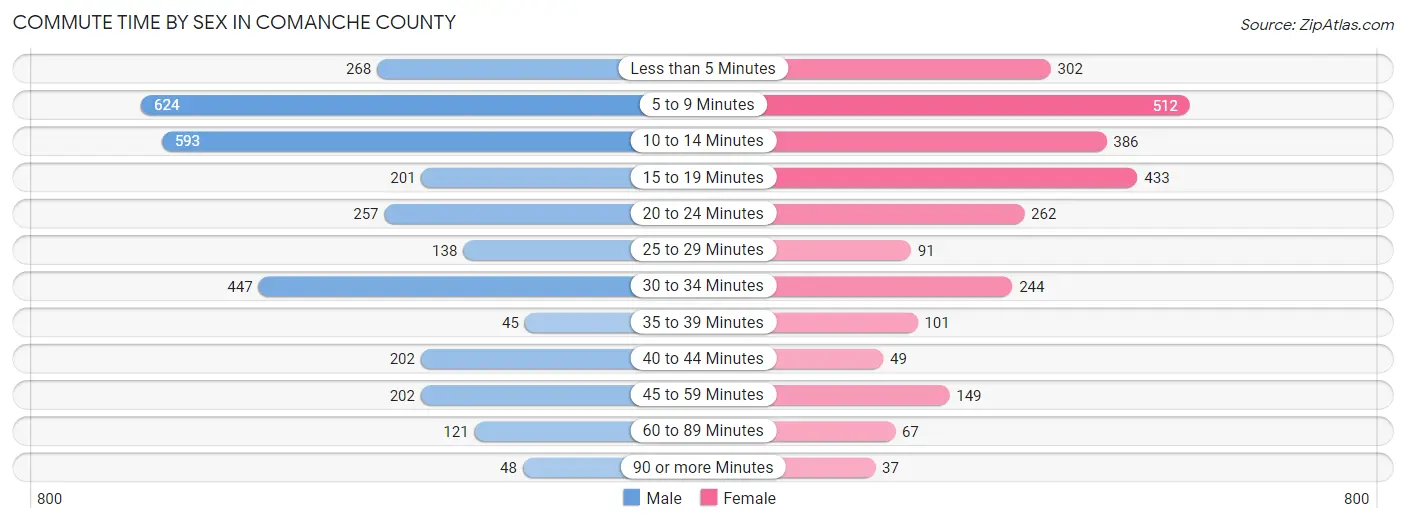
| Commute Time | Male | Female |
| Less than 5 Minutes | 268 (8.5%) | 302 (11.5%) |
| 5 to 9 Minutes | 624 (19.8%) | 512 (19.5%) |
| 10 to 14 Minutes | 593 (18.9%) | 386 (14.7%) |
| 15 to 19 Minutes | 201 (6.4%) | 433 (16.5%) |
| 20 to 24 Minutes | 257 (8.2%) | 262 (10.0%) |
| 25 to 29 Minutes | 138 (4.4%) | 91 (3.5%) |
| 30 to 34 Minutes | 447 (14.2%) | 244 (9.3%) |
| 35 to 39 Minutes | 45 (1.4%) | 101 (3.8%) |
| 40 to 44 Minutes | 202 (6.4%) | 49 (1.9%) |
| 45 to 59 Minutes | 202 (6.4%) | 149 (5.7%) |
| 60 to 89 Minutes | 121 (3.8%) | 67 (2.5%) |
| 90 or more Minutes | 48 (1.5%) | 37 (1.4%) |
Time of Departure to Work by Sex in Comanche County
The most frequent times of departure to work in Comanche County are 7:00 AM to 7:29 AM (627, 19.9%) for males and 7:30 AM to 7:59 AM (645, 24.5%) for females.
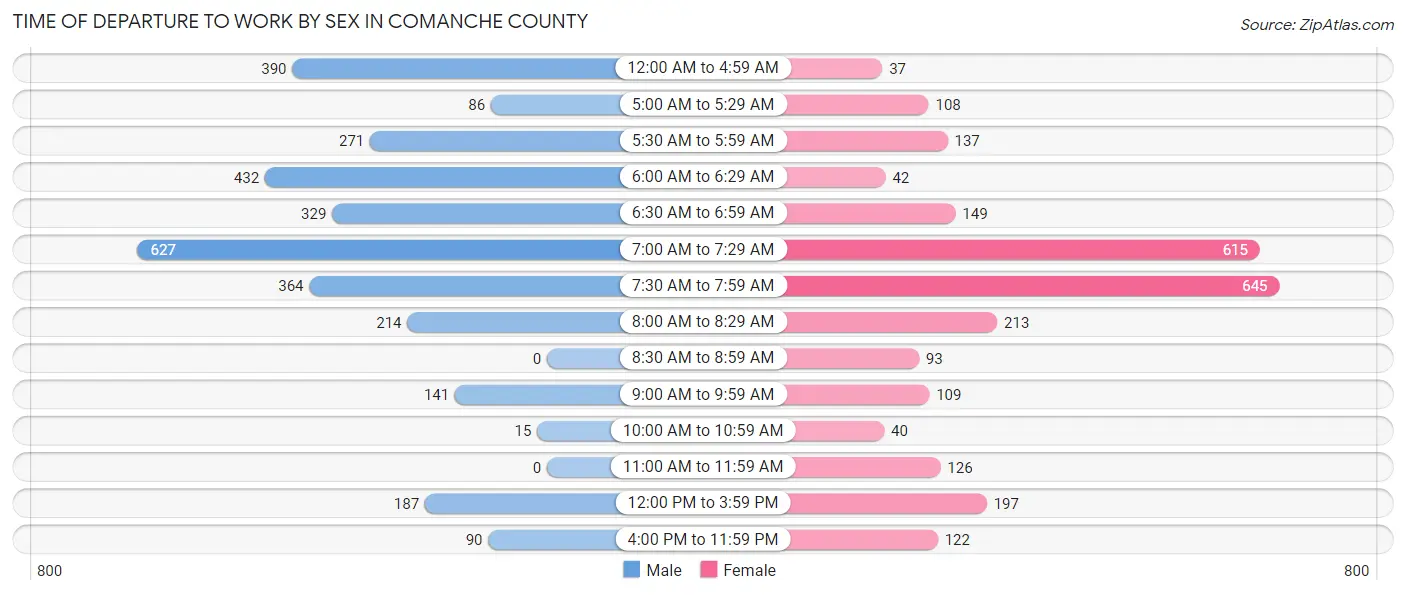
| Time of Departure | Male | Female |
| 12:00 AM to 4:59 AM | 390 (12.4%) | 37 (1.4%) |
| 5:00 AM to 5:29 AM | 86 (2.7%) | 108 (4.1%) |
| 5:30 AM to 5:59 AM | 271 (8.6%) | 137 (5.2%) |
| 6:00 AM to 6:29 AM | 432 (13.7%) | 42 (1.6%) |
| 6:30 AM to 6:59 AM | 329 (10.5%) | 149 (5.7%) |
| 7:00 AM to 7:29 AM | 627 (19.9%) | 615 (23.4%) |
| 7:30 AM to 7:59 AM | 364 (11.6%) | 645 (24.5%) |
| 8:00 AM to 8:29 AM | 214 (6.8%) | 213 (8.1%) |
| 8:30 AM to 8:59 AM | 0 (0.0%) | 93 (3.5%) |
| 9:00 AM to 9:59 AM | 141 (4.5%) | 109 (4.1%) |
| 10:00 AM to 10:59 AM | 15 (0.5%) | 40 (1.5%) |
| 11:00 AM to 11:59 AM | 0 (0.0%) | 126 (4.8%) |
| 12:00 PM to 3:59 PM | 187 (5.9%) | 197 (7.5%) |
| 4:00 PM to 11:59 PM | 90 (2.9%) | 122 (4.6%) |
| Total | 3,146 (100.0%) | 2,633 (100.0%) |
Housing Occupancy in Comanche County
Occupancy by Ownership in Comanche County
Of the total 5,340 dwellings in Comanche County, owner-occupied units account for 4,401 (82.4%), while renter-occupied units make up 939 (17.6%).
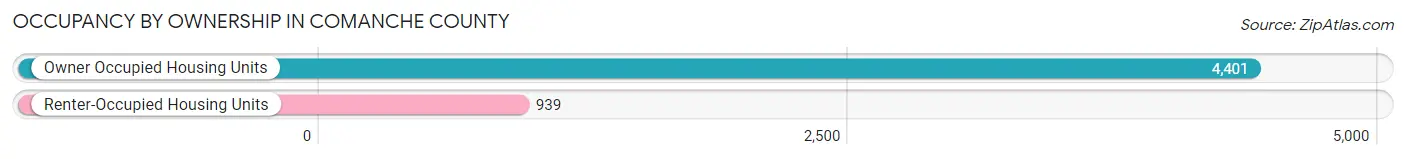
| Occupancy | # Housing Units | % Housing Units |
| Owner Occupied Housing Units | 4,401 | 82.4% |
| Renter-Occupied Housing Units | 939 | 17.6% |
| Total Occupied Housing Units | 5,340 | 100.0% |
Occupancy by Household Size in Comanche County
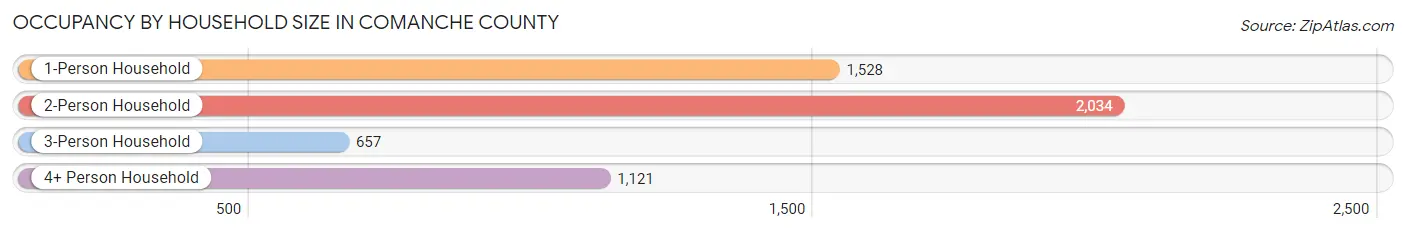
| Household Size | # Housing Units | % Housing Units |
| 1-Person Household | 1,528 | 28.6% |
| 2-Person Household | 2,034 | 38.1% |
| 3-Person Household | 657 | 12.3% |
| 4+ Person Household | 1,121 | 21.0% |
| Total Housing Units | 5,340 | 100.0% |
Occupancy by Ownership by Household Size in Comanche County
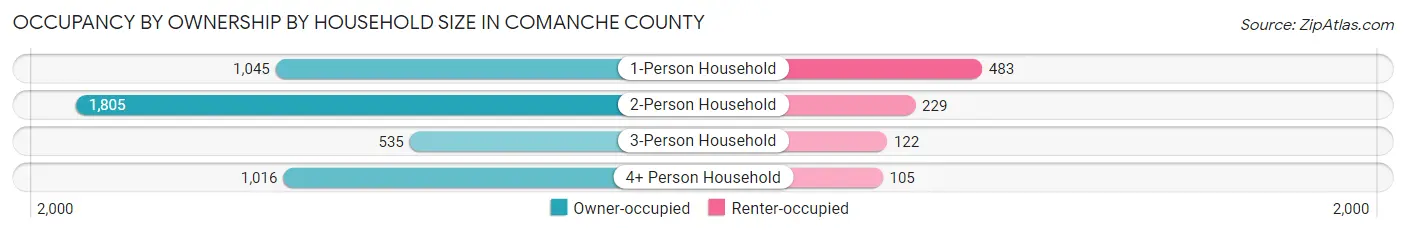
| Household Size | Owner-occupied | Renter-occupied |
| 1-Person Household | 1,045 (68.4%) | 483 (31.6%) |
| 2-Person Household | 1,805 (88.7%) | 229 (11.3%) |
| 3-Person Household | 535 (81.4%) | 122 (18.6%) |
| 4+ Person Household | 1,016 (90.6%) | 105 (9.4%) |
| Total Housing Units | 4,401 (82.4%) | 939 (17.6%) |
Occupancy by Educational Attainment in Comanche County
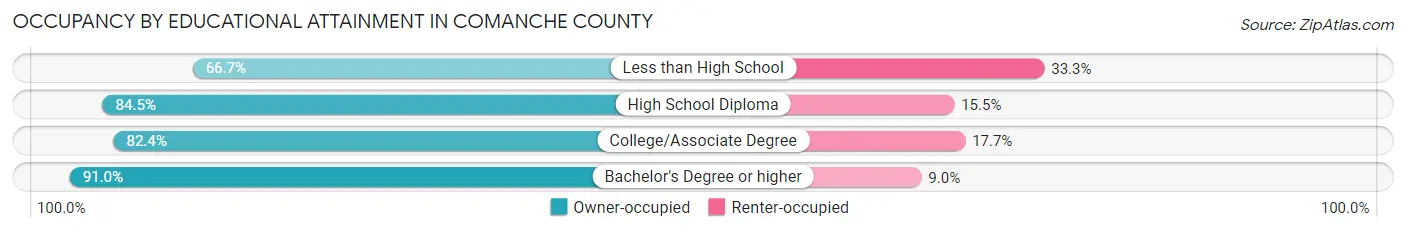
| Household Size | Owner-occupied | Renter-occupied |
| Less than High School | 540 (66.7%) | 270 (33.3%) |
| High School Diploma | 1,316 (84.5%) | 241 (15.5%) |
| College/Associate Degree | 1,530 (82.4%) | 328 (17.6%) |
| Bachelor's Degree or higher | 1,015 (91.0%) | 100 (9.0%) |
Occupancy by Age of Householder in Comanche County
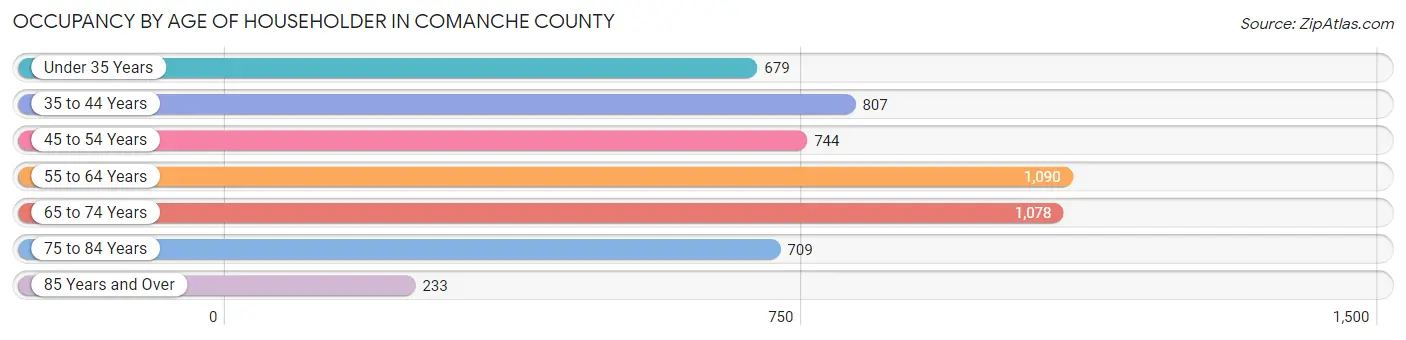
| Age Bracket | # Households | % Households |
| Under 35 Years | 679 | 12.7% |
| 35 to 44 Years | 807 | 15.1% |
| 45 to 54 Years | 744 | 13.9% |
| 55 to 64 Years | 1,090 | 20.4% |
| 65 to 74 Years | 1,078 | 20.2% |
| 75 to 84 Years | 709 | 13.3% |
| 85 Years and Over | 233 | 4.4% |
| Total | 5,340 | 100.0% |
Housing Finances in Comanche County
Median Income by Occupancy in Comanche County
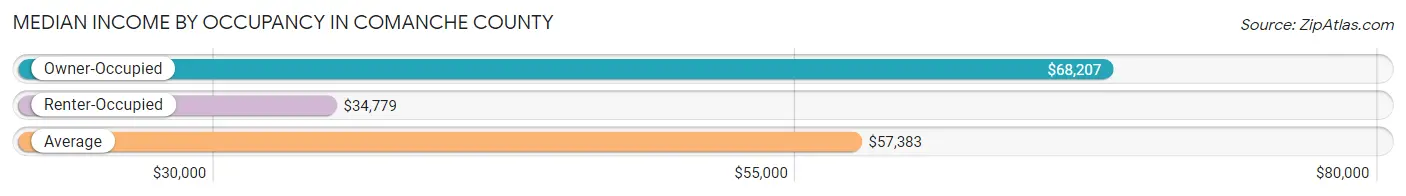
| Occupancy Type | # Households | Median Income |
| Owner-Occupied | 4,401 (82.4%) | $68,207 |
| Renter-Occupied | 939 (17.6%) | $34,779 |
| Average | 5,340 (100.0%) | $57,383 |
Occupancy by Householder Income Bracket in Comanche County
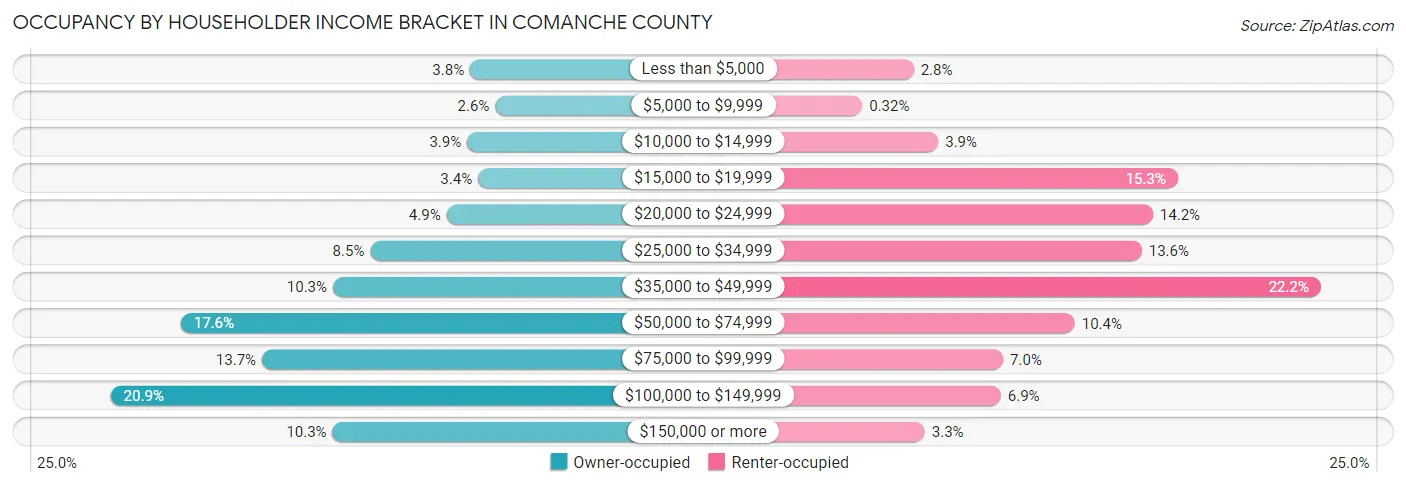
| Income Bracket | Owner-occupied | Renter-occupied |
| Less than $5,000 | 167 (3.8%) | 26 (2.8%) |
| $5,000 to $9,999 | 114 (2.6%) | 3 (0.3%) |
| $10,000 to $14,999 | 173 (3.9%) | 37 (3.9%) |
| $15,000 to $19,999 | 150 (3.4%) | 144 (15.3%) |
| $20,000 to $24,999 | 216 (4.9%) | 133 (14.2%) |
| $25,000 to $34,999 | 376 (8.5%) | 128 (13.6%) |
| $35,000 to $49,999 | 454 (10.3%) | 208 (22.2%) |
| $50,000 to $74,999 | 773 (17.6%) | 98 (10.4%) |
| $75,000 to $99,999 | 603 (13.7%) | 66 (7.0%) |
| $100,000 to $149,999 | 920 (20.9%) | 65 (6.9%) |
| $150,000 or more | 455 (10.3%) | 31 (3.3%) |
| Total | 4,401 (100.0%) | 939 (100.0%) |
Monthly Housing Cost Tiers in Comanche County
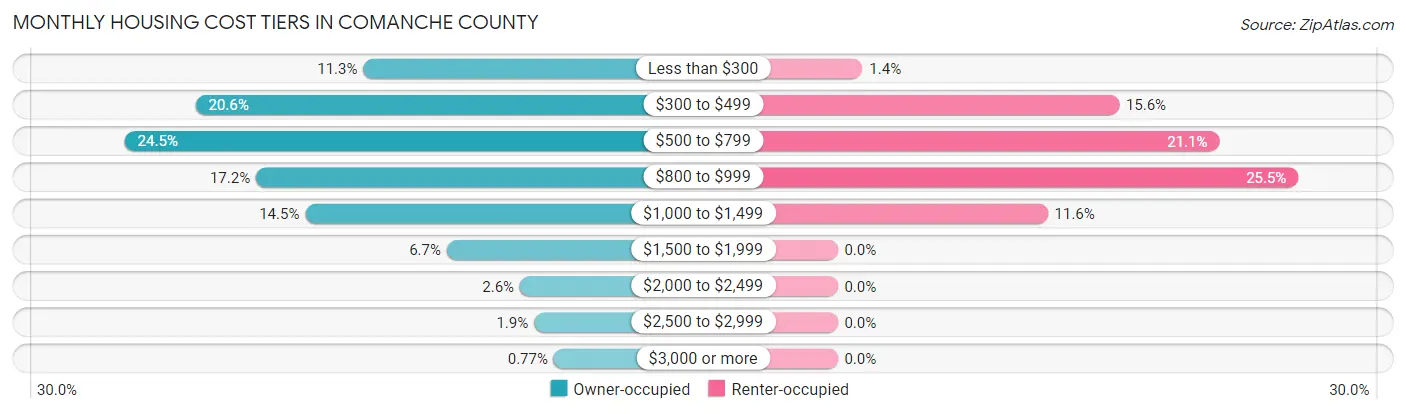
| Monthly Cost | Owner-occupied | Renter-occupied |
| Less than $300 | 497 (11.3%) | 13 (1.4%) |
| $300 to $499 | 905 (20.6%) | 146 (15.5%) |
| $500 to $799 | 1,077 (24.5%) | 198 (21.1%) |
| $800 to $999 | 758 (17.2%) | 239 (25.5%) |
| $1,000 to $1,499 | 638 (14.5%) | 109 (11.6%) |
| $1,500 to $1,999 | 294 (6.7%) | 0 (0.0%) |
| $2,000 to $2,499 | 116 (2.6%) | 0 (0.0%) |
| $2,500 to $2,999 | 82 (1.9%) | 0 (0.0%) |
| $3,000 or more | 34 (0.8%) | 0 (0.0%) |
| Total | 4,401 (100.0%) | 939 (100.0%) |
Physical Housing Characteristics in Comanche County
Housing Structures in Comanche County
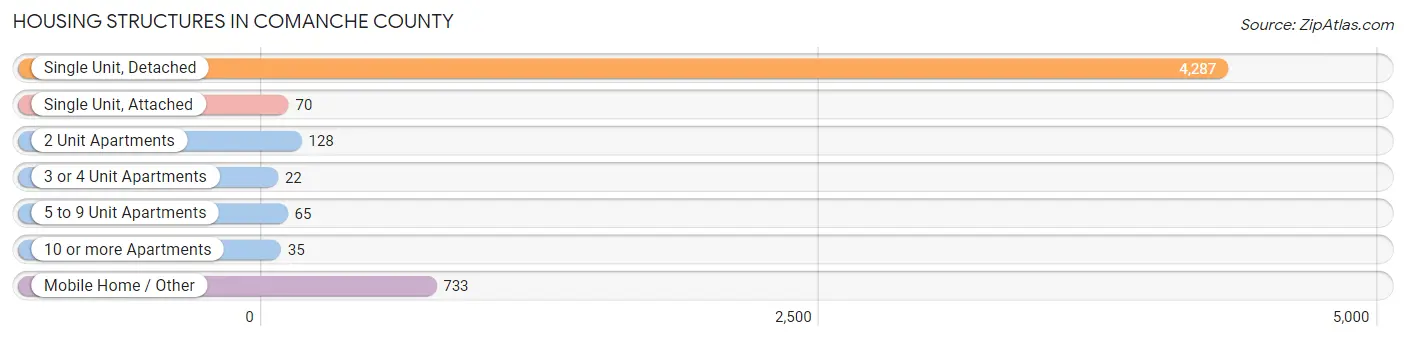
| Structure Type | # Housing Units | % Housing Units |
| Single Unit, Detached | 4,287 | 80.3% |
| Single Unit, Attached | 70 | 1.3% |
| 2 Unit Apartments | 128 | 2.4% |
| 3 or 4 Unit Apartments | 22 | 0.4% |
| 5 to 9 Unit Apartments | 65 | 1.2% |
| 10 or more Apartments | 35 | 0.7% |
| Mobile Home / Other | 733 | 13.7% |
| Total | 5,340 | 100.0% |
Housing Structures by Occupancy in Comanche County
| Structure Type | Owner-occupied | Renter-occupied |
| Single Unit, Detached | 3,742 (87.3%) | 545 (12.7%) |
| Single Unit, Attached | 45 (64.3%) | 25 (35.7%) |
| 2 Unit Apartments | 7 (5.5%) | 121 (94.5%) |
| 3 or 4 Unit Apartments | 0 (0.0%) | 22 (100.0%) |
| 5 to 9 Unit Apartments | 0 (0.0%) | 65 (100.0%) |
| 10 or more Apartments | 0 (0.0%) | 35 (100.0%) |
| Mobile Home / Other | 607 (82.8%) | 126 (17.2%) |
| Total | 4,401 (82.4%) | 939 (17.6%) |
Housing Structures by Number of Rooms in Comanche County
| Number of Rooms | Owner-occupied | Renter-occupied |
| 1 Room | 19 (0.4%) | 16 (1.7%) |
| 2 or 3 Rooms | 139 (3.2%) | 175 (18.6%) |
| 4 or 5 Rooms | 1,554 (35.3%) | 525 (55.9%) |
| 6 or 7 Rooms | 1,903 (43.2%) | 184 (19.6%) |
| 8 or more Rooms | 786 (17.9%) | 39 (4.2%) |
| Total | 4,401 (100.0%) | 939 (100.0%) |
Housing Structure by Heating Type in Comanche County
| Heating Type | Owner-occupied | Renter-occupied |
| Utility Gas | 972 (22.1%) | 158 (16.8%) |
| Bottled, Tank, or LP Gas | 652 (14.8%) | 172 (18.3%) |
| Electricity | 2,634 (59.9%) | 595 (63.4%) |
| Fuel Oil or Kerosene | 0 (0.0%) | 9 (1.0%) |
| Coal or Coke | 0 (0.0%) | 0 (0.0%) |
| All other Fuels | 142 (3.2%) | 5 (0.5%) |
| No Fuel Used | 1 (0.0%) | 0 (0.0%) |
| Total | 4,401 (100.0%) | 939 (100.0%) |
Household Vehicle Usage in Comanche County
| Vehicles per Household | Owner-occupied | Renter-occupied |
| No Vehicle | 169 (3.8%) | 63 (6.7%) |
| 1 Vehicle | 984 (22.4%) | 492 (52.4%) |
| 2 Vehicles | 1,682 (38.2%) | 268 (28.5%) |
| 3 or more Vehicles | 1,566 (35.6%) | 116 (12.3%) |
| Total | 4,401 (100.0%) | 939 (100.0%) |
Real Estate & Mortgages in Comanche County
Real Estate and Mortgage Overview in Comanche County
| Characteristic | Without Mortgage | With Mortgage |
| Housing Units | 3,073 | 1,328 |
| Median Property Value | $118,800 | $156,600 |
| Median Household Income | $57,525 | $175 |
| Monthly Housing Costs | $537 | $34 |
| Real Estate Taxes | $1,917 | $39 |
Property Value by Mortgage Status in Comanche County
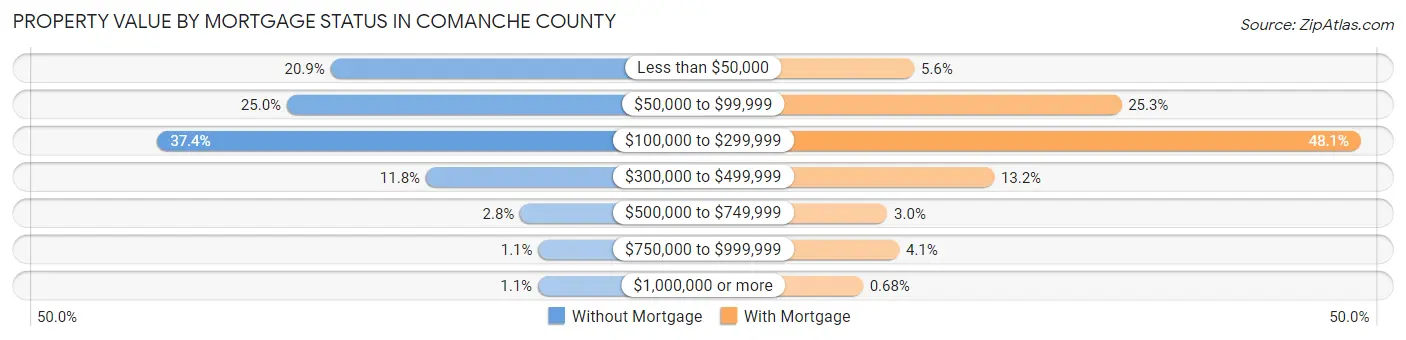
| Property Value | Without Mortgage | With Mortgage |
| Less than $50,000 | 641 (20.9%) | 74 (5.6%) |
| $50,000 to $99,999 | 769 (25.0%) | 336 (25.3%) |
| $100,000 to $299,999 | 1,148 (37.4%) | 639 (48.1%) |
| $300,000 to $499,999 | 362 (11.8%) | 175 (13.2%) |
| $500,000 to $749,999 | 86 (2.8%) | 40 (3.0%) |
| $750,000 to $999,999 | 33 (1.1%) | 55 (4.1%) |
| $1,000,000 or more | 34 (1.1%) | 9 (0.7%) |
| Total | 3,073 (100.0%) | 1,328 (100.0%) |
Household Income by Mortgage Status in Comanche County
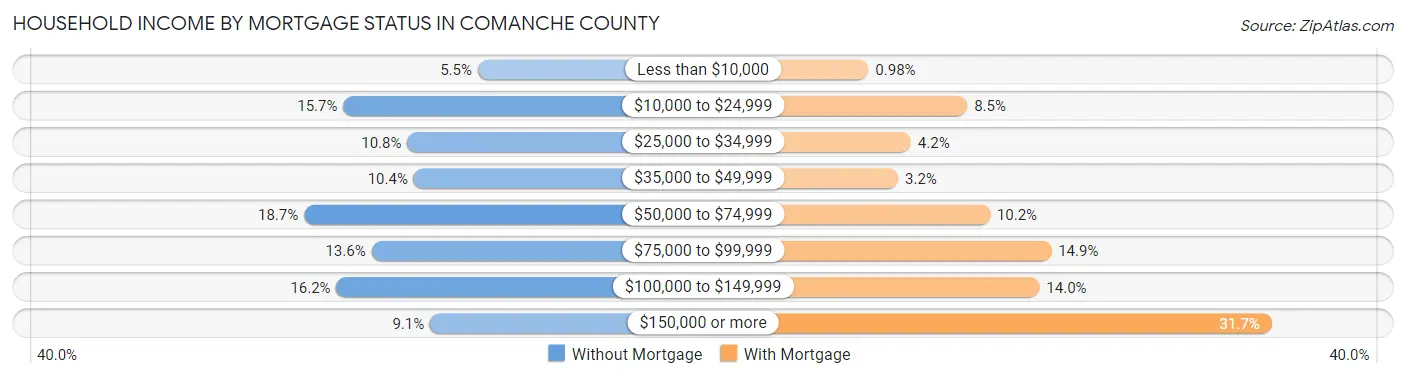
| Household Income | Without Mortgage | With Mortgage |
| Less than $10,000 | 168 (5.5%) | 13 (1.0%) |
| $10,000 to $24,999 | 483 (15.7%) | 113 (8.5%) |
| $25,000 to $34,999 | 333 (10.8%) | 56 (4.2%) |
| $35,000 to $49,999 | 318 (10.3%) | 43 (3.2%) |
| $50,000 to $74,999 | 575 (18.7%) | 136 (10.2%) |
| $75,000 to $99,999 | 417 (13.6%) | 198 (14.9%) |
| $100,000 to $149,999 | 499 (16.2%) | 186 (14.0%) |
| $150,000 or more | 280 (9.1%) | 421 (31.7%) |
| Total | 3,073 (100.0%) | 1,328 (100.0%) |
Property Value to Household Income Ratio in Comanche County
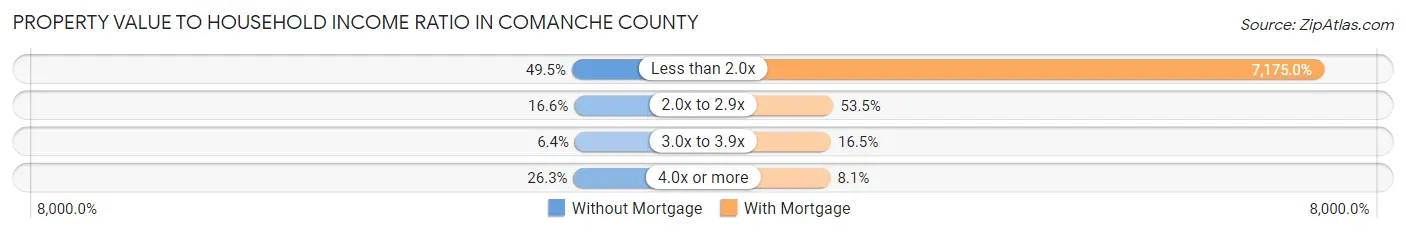
| Value-to-Income Ratio | Without Mortgage | With Mortgage |
| Less than 2.0x | 1,520 (49.5%) | 95,284 (7,175.0%) |
| 2.0x to 2.9x | 510 (16.6%) | 710 (53.5%) |
| 3.0x to 3.9x | 198 (6.4%) | 219 (16.5%) |
| 4.0x or more | 807 (26.3%) | 108 (8.1%) |
| Total | 3,073 (100.0%) | 1,328 (100.0%) |
Real Estate Taxes by Mortgage Status in Comanche County
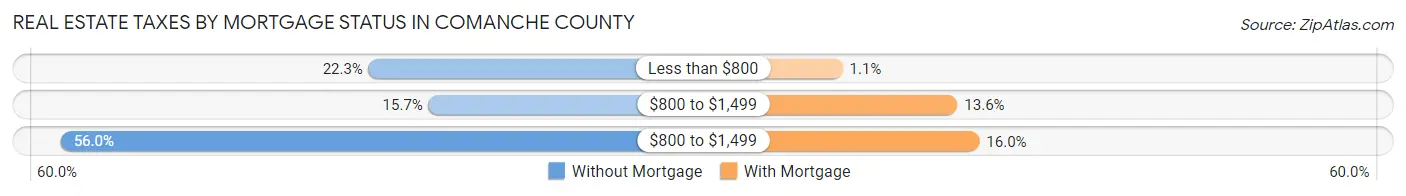
| Property Taxes | Without Mortgage | With Mortgage |
| Less than $800 | 685 (22.3%) | 14 (1.1%) |
| $800 to $1,499 | 483 (15.7%) | 181 (13.6%) |
| $800 to $1,499 | 1,722 (56.0%) | 213 (16.0%) |
| Total | 3,073 (100.0%) | 1,328 (100.0%) |
Health & Disability in Comanche County
Health Insurance Coverage by Age in Comanche County
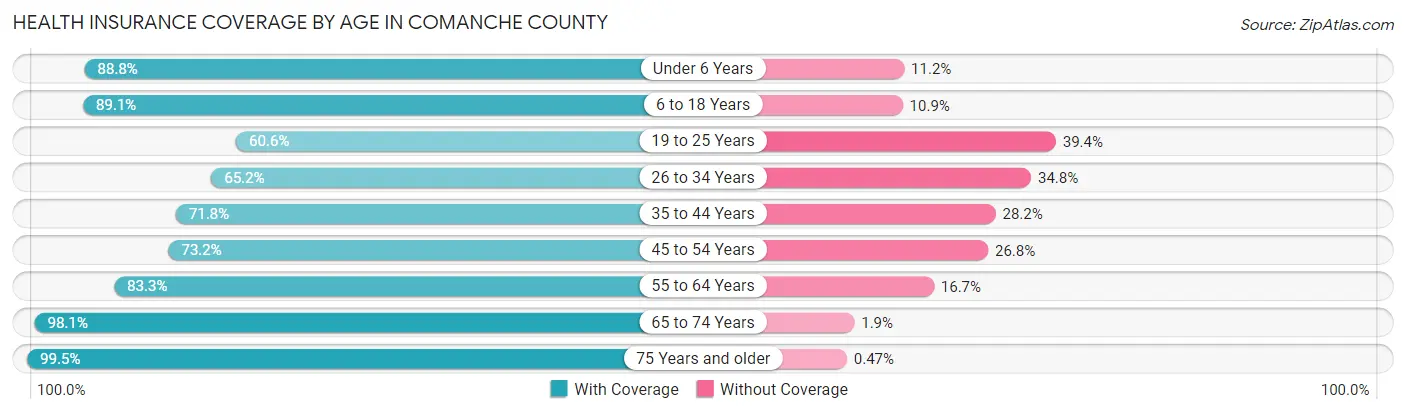
| Age Bracket | With Coverage | Without Coverage |
| Under 6 Years | 772 (88.8%) | 97 (11.2%) |
| 6 to 18 Years | 2,106 (89.1%) | 257 (10.9%) |
| 19 to 25 Years | 565 (60.6%) | 368 (39.4%) |
| 26 to 34 Years | 842 (65.2%) | 450 (34.8%) |
| 35 to 44 Years | 1,036 (71.8%) | 407 (28.2%) |
| 45 to 54 Years | 1,136 (73.2%) | 416 (26.8%) |
| 55 to 64 Years | 1,586 (83.3%) | 318 (16.7%) |
| 65 to 74 Years | 1,794 (98.1%) | 34 (1.9%) |
| 75 Years and older | 1,281 (99.5%) | 6 (0.5%) |
| Total | 11,118 (82.5%) | 2,353 (17.5%) |
Health Insurance Coverage by Citizenship Status in Comanche County
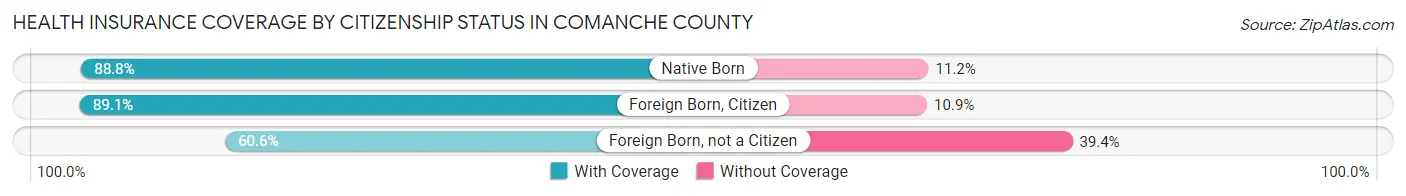
| Citizenship Status | With Coverage | Without Coverage |
| Native Born | 772 (88.8%) | 97 (11.2%) |
| Foreign Born, Citizen | 2,106 (89.1%) | 257 (10.9%) |
| Foreign Born, not a Citizen | 565 (60.6%) | 368 (39.4%) |
Health Insurance Coverage by Household Income in Comanche County
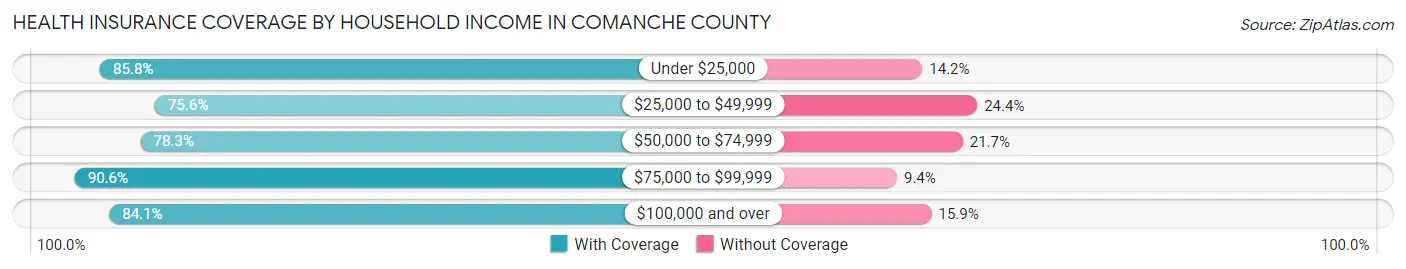
| Household Income | With Coverage | Without Coverage |
| Under $25,000 | 1,461 (85.8%) | 241 (14.2%) |
| $25,000 to $49,999 | 2,133 (75.6%) | 690 (24.4%) |
| $50,000 to $74,999 | 1,758 (78.3%) | 488 (21.7%) |
| $75,000 to $99,999 | 1,867 (90.6%) | 194 (9.4%) |
| $100,000 and over | 3,898 (84.1%) | 736 (15.9%) |
Public vs Private Health Insurance Coverage by Age in Comanche County
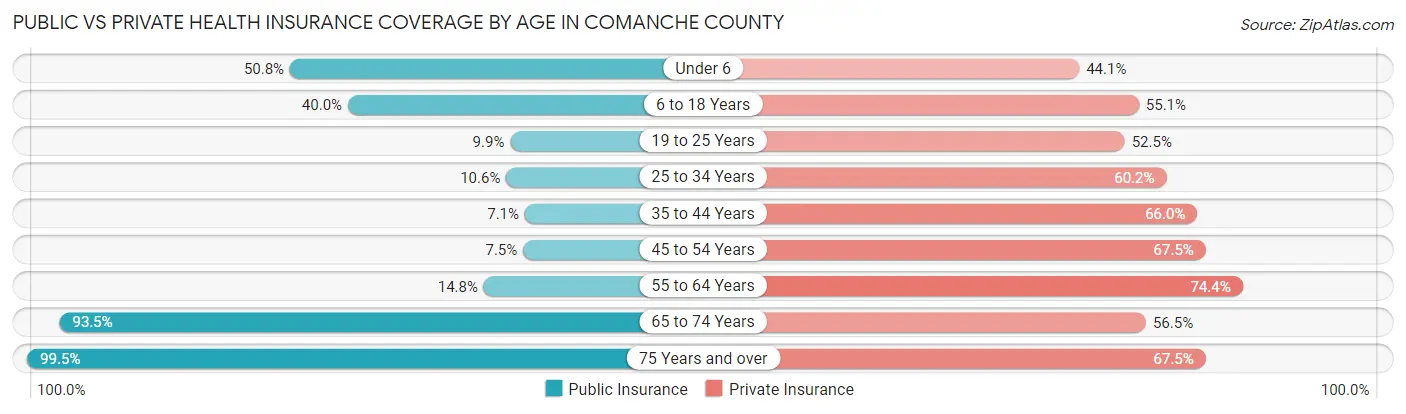
| Age Bracket | Public Insurance | Private Insurance |
| Under 6 | 441 (50.7%) | 383 (44.1%) |
| 6 to 18 Years | 945 (40.0%) | 1,303 (55.1%) |
| 19 to 25 Years | 92 (9.9%) | 490 (52.5%) |
| 25 to 34 Years | 137 (10.6%) | 778 (60.2%) |
| 35 to 44 Years | 103 (7.1%) | 952 (66.0%) |
| 45 to 54 Years | 116 (7.5%) | 1,048 (67.5%) |
| 55 to 64 Years | 281 (14.8%) | 1,416 (74.4%) |
| 65 to 74 Years | 1,710 (93.5%) | 1,032 (56.5%) |
| 75 Years and over | 1,281 (99.5%) | 869 (67.5%) |
| Total | 5,106 (37.9%) | 8,271 (61.4%) |
Disability Status by Sex by Age in Comanche County
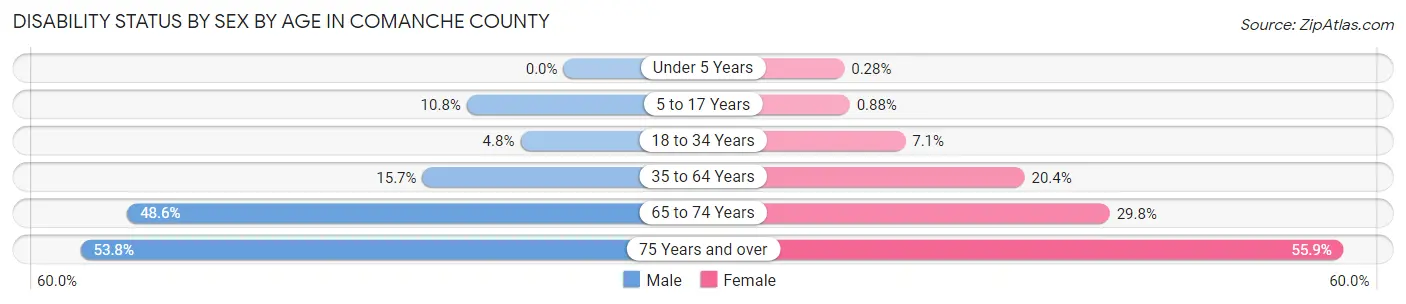
| Age Bracket | Male | Female |
| Under 5 Years | 0 (0.0%) | 1 (0.3%) |
| 5 to 17 Years | 130 (10.8%) | 10 (0.9%) |
| 18 to 34 Years | 60 (4.8%) | 80 (7.1%) |
| 35 to 64 Years | 385 (15.7%) | 498 (20.3%) |
| 65 to 74 Years | 424 (48.6%) | 285 (29.8%) |
| 75 Years and over | 336 (53.8%) | 370 (55.9%) |
Disability Class by Sex by Age in Comanche County
Disability Class: Hearing Difficulty
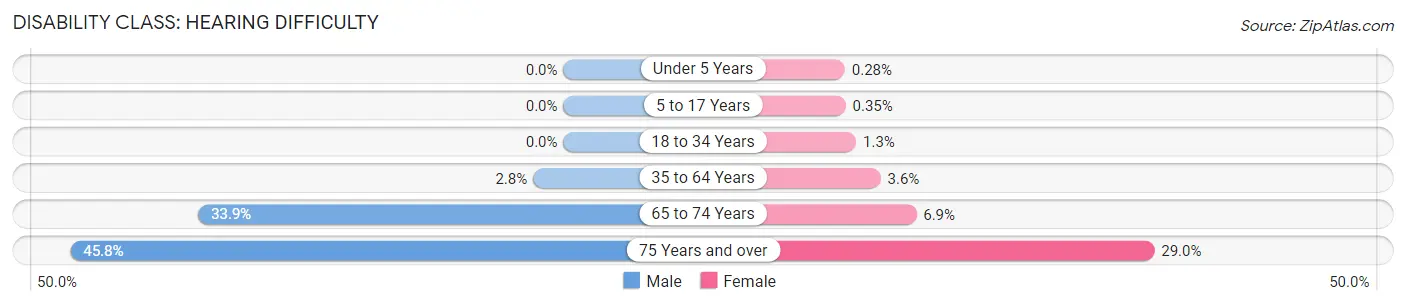
| Age Bracket | Male | Female |
| Under 5 Years | 0 (0.0%) | 1 (0.3%) |
| 5 to 17 Years | 0 (0.0%) | 4 (0.4%) |
| 18 to 34 Years | 0 (0.0%) | 15 (1.3%) |
| 35 to 64 Years | 69 (2.8%) | 88 (3.6%) |
| 65 to 74 Years | 296 (33.9%) | 66 (6.9%) |
| 75 Years and over | 286 (45.8%) | 192 (29.0%) |
Disability Class: Vision Difficulty
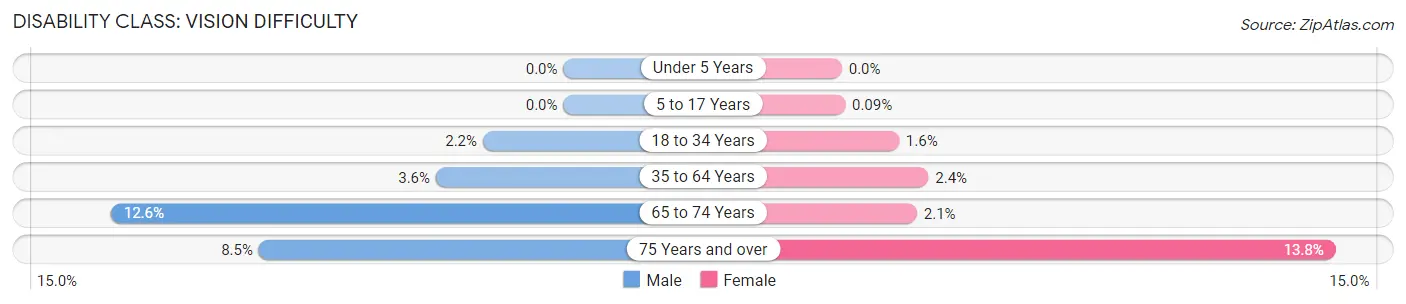
| Age Bracket | Male | Female |
| Under 5 Years | 0 (0.0%) | 0 (0.0%) |
| 5 to 17 Years | 0 (0.0%) | 1 (0.1%) |
| 18 to 34 Years | 28 (2.2%) | 18 (1.6%) |
| 35 to 64 Years | 87 (3.5%) | 59 (2.4%) |
| 65 to 74 Years | 110 (12.6%) | 20 (2.1%) |
| 75 Years and over | 53 (8.5%) | 91 (13.8%) |
Disability Class: Cognitive Difficulty
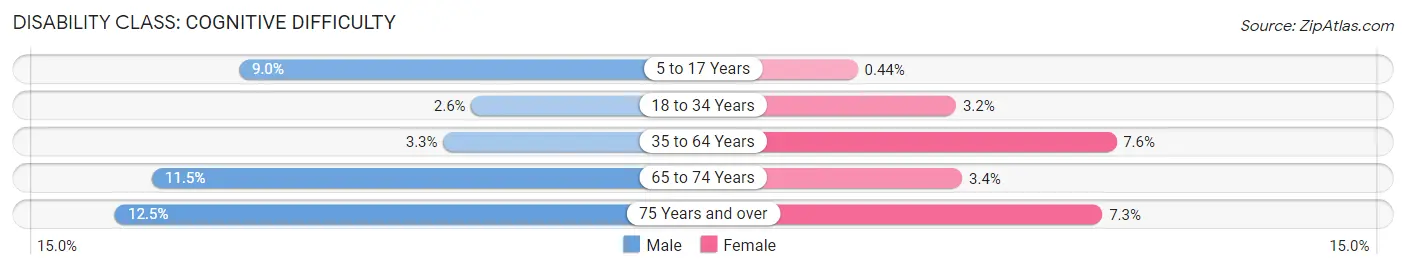
| Age Bracket | Male | Female |
| 5 to 17 Years | 109 (9.0%) | 5 (0.4%) |
| 18 to 34 Years | 32 (2.6%) | 36 (3.2%) |
| 35 to 64 Years | 82 (3.3%) | 187 (7.6%) |
| 65 to 74 Years | 100 (11.5%) | 32 (3.4%) |
| 75 Years and over | 78 (12.5%) | 48 (7.2%) |
Disability Class: Ambulatory Difficulty
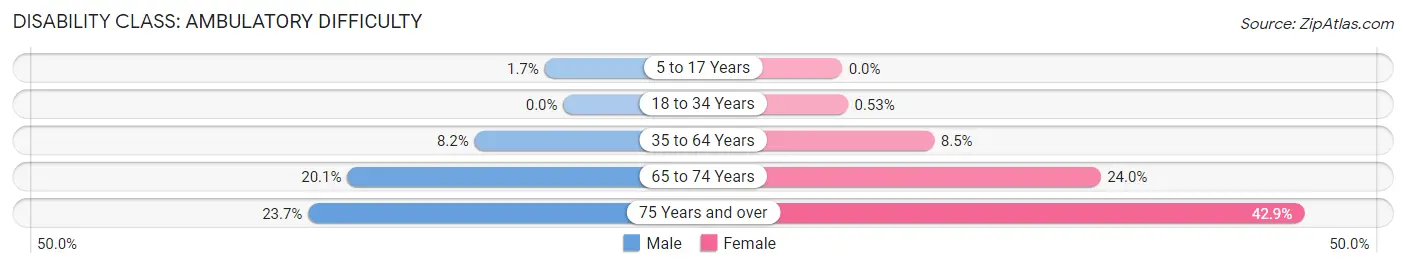
| Age Bracket | Male | Female |
| 5 to 17 Years | 21 (1.7%) | 0 (0.0%) |
| 18 to 34 Years | 0 (0.0%) | 6 (0.5%) |
| 35 to 64 Years | 202 (8.2%) | 209 (8.5%) |
| 65 to 74 Years | 175 (20.1%) | 229 (24.0%) |
| 75 Years and over | 148 (23.7%) | 284 (42.9%) |
Disability Class: Self-Care Difficulty
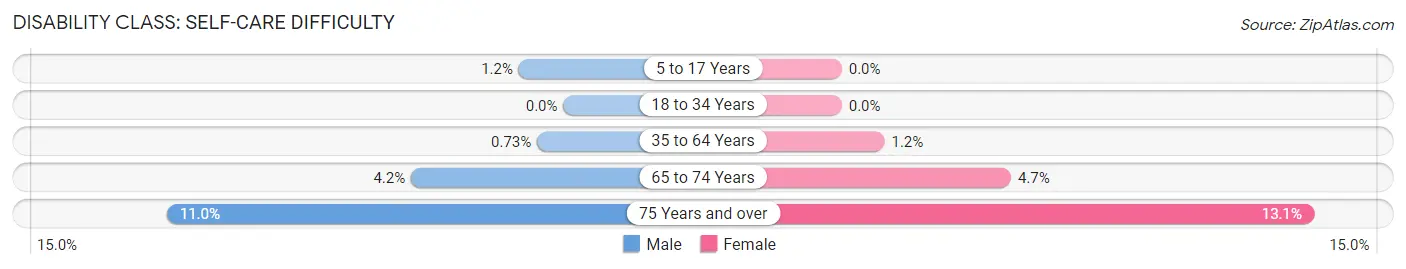
| Age Bracket | Male | Female |
| 5 to 17 Years | 15 (1.2%) | 0 (0.0%) |
| 18 to 34 Years | 0 (0.0%) | 0 (0.0%) |
| 35 to 64 Years | 18 (0.7%) | 29 (1.2%) |
| 65 to 74 Years | 37 (4.2%) | 45 (4.7%) |
| 75 Years and over | 69 (11.0%) | 87 (13.1%) |
Technology Access in Comanche County
Computing Device Access in Comanche County
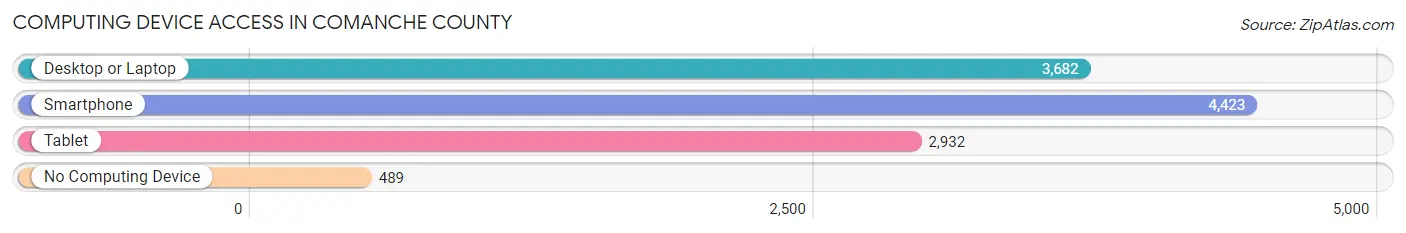
| Device Type | # Households | % Households |
| Desktop or Laptop | 3,682 | 69.0% |
| Smartphone | 4,423 | 82.8% |
| Tablet | 2,932 | 54.9% |
| No Computing Device | 489 | 9.2% |
| Total | 5,340 | 100.0% |
Internet Access in Comanche County
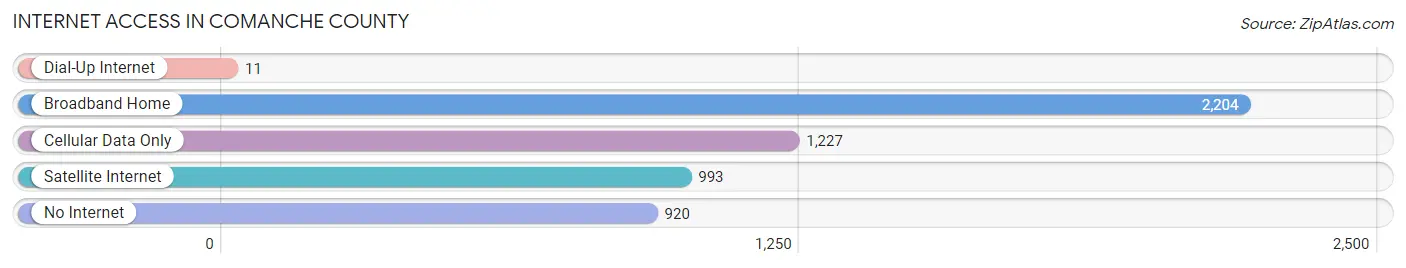
| Internet Type | # Households | % Households |
| Dial-Up Internet | 11 | 0.2% |
| Broadband Home | 2,204 | 41.3% |
| Cellular Data Only | 1,227 | 23.0% |
| Satellite Internet | 993 | 18.6% |
| No Internet | 920 | 17.2% |
| Total | 5,340 | 100.0% |
Comanche County Summary
Comanche County is located in Central Texas, in the heart of the Texas Hill Country. It is bordered by Brown, Mills, Hamilton, Erath, Eastland, and Stephens counties. The county seat is Comanche, and the largest city is De Leon. The county was named for the Comanche Native American tribe, which once inhabited the area.
Geography
Comanche County covers an area of 1,082 square miles, making it the 33rd largest county in Texas. The terrain is mostly rolling hills, with some flat areas in the east. The county is drained by the Leon River, which flows through the county from north to south. The county is also home to several small lakes, including Lake Proctor and Lake Comanche.
The climate of Comanche County is generally mild, with hot summers and cool winters. The average annual temperature is around 68 degrees Fahrenheit, and the average annual precipitation is around 33 inches.
Demographics
As of the 2010 census, Comanche County had a population of 13,974. The racial makeup of the county was 84.3% White, 8.2% Hispanic or Latino, 5.2% African American, 0.7% Native American, 0.3% Asian, and 0.2% Pacific Islander. The median household income was $37,945, and the median family income was $45,945.
Economy
Comanche County’s economy is largely based on agriculture and ranching. The county is home to several large ranches, including the Comanche Ranch, which is one of the largest in the state. The county is also home to several small businesses, including a number of restaurants, retail stores, and service providers.
The county is also home to several oil and gas fields, which provide jobs and revenue for the county. The county is also home to several wind farms, which provide renewable energy to the area.
The county is served by two school districts, the Comanche Independent School District and the De Leon Independent School District. The county is also home to several higher education institutions, including the University of Texas at Austin, Texas A&M University, and Texas State University.
Conclusion
Comanche County is a rural county located in Central Texas. It is home to several large ranches, small businesses, and oil and gas fields. The county is also home to several higher education institutions, and is served by two school districts. The county has a population of 13,974, and the median household income is $37,945. Comanche County is a great place to live, work, and raise a family.
Common Questions
What is Per Capita Income in Comanche County?
Per Capita income in Comanche County is $31,171.
What is the Median Family Income in Comanche County?
Median Family Income in Comanche County is $81,117.
What is the Median Household income in Comanche County?
Median Household Income in Comanche County is $57,383.
What is Income or Wage Gap in Comanche County?
Income or Wage Gap in Comanche County is 33.7%.
Women in Comanche County earn 66.3 cents for every dollar earned by a man.
What is Family Income Deficit in Comanche County?
Family Income Deficit in Comanche County is $9,775.
Families that are below poverty line in Comanche County earn $9,775 less on average than the poverty threshold level.
What is Inequality or Gini Index in Comanche County?
Inequality or Gini Index in Comanche County is 0.45.
What is the Total Population of Comanche County?
Total Population of Comanche County is 13,651.
What is the Total Male Population of Comanche County?
Total Male Population of Comanche County is 6,881.
What is the Total Female Population of Comanche County?
Total Female Population of Comanche County is 6,770.
What is the Ratio of Males per 100 Females in Comanche County?
There are 101.64 Males per 100 Females in Comanche County.
What is the Ratio of Females per 100 Males in Comanche County?
There are 98.39 Females per 100 Males in Comanche County.
What is the Median Population Age in Comanche County?
Median Population Age in Comanche County is 44.2 Years.
What is the Average Family Size in Comanche County
Average Family Size in Comanche County is 3.1 People.
What is the Average Household Size in Comanche County
Average Household Size in Comanche County is 2.5 People.
How Large is the Labor Force in Comanche County?
There are 6,661 People in the Labor Forcein in Comanche County.
What is the Percentage of People in the Labor Force in Comanche County?
60.8% of People are in the Labor Force in Comanche County.
What is the Unemployment Rate in Comanche County?
Unemployment Rate in Comanche County is 7.3%.