Colorado County, TX Map & Demographics
Colorado County Map
Colorado County Overview
$35,002
PER CAPITA INCOME
$73,565
AVG FAMILY INCOME
$63,352
AVG HOUSEHOLD INCOME
42.8%
WAGE / INCOME GAP [ % ]
57.2¢/ $1
WAGE / INCOME GAP [ $ ]
$12,023
FAMILY INCOME DEFICIT
0.47
INEQUALITY / GINI INDEX
20,582
TOTAL POPULATION
10,233
MALE POPULATION
10,349
FEMALE POPULATION
98.88
MALES / 100 FEMALES
101.13
FEMALES / 100 MALES
43.2
MEDIAN AGE
3.4
AVG FAMILY SIZE
2.7
AVG HOUSEHOLD SIZE
9,381
LABOR FORCE [ PEOPLE ]
57.6%
PERCENT IN LABOR FORCE
5.7%
UNEMPLOYMENT RATE
Colorado County Area Codes
Income in Colorado County
Income Overview in Colorado County
Per Capita Income in Colorado County is $35,002, while median incomes of families and households are $73,565 and $63,352 respectively.
| Characteristic | Number | Measure |
| Per Capita Income | 20,582 | $35,002 |
| Median Family Income | 4,966 | $73,565 |
| Mean Family Income | 4,966 | $105,803 |
| Median Household Income | 7,376 | $63,352 |
| Mean Household Income | 7,376 | $88,293 |
| Income Deficit | 4,966 | $12,023 |
| Wage / Income Gap (%) | 20,582 | 42.85% |
| Wage / Income Gap ($) | 20,582 | 57.15¢ per $1 |
| Gini / Inequality Index | 20,582 | 0.47 |
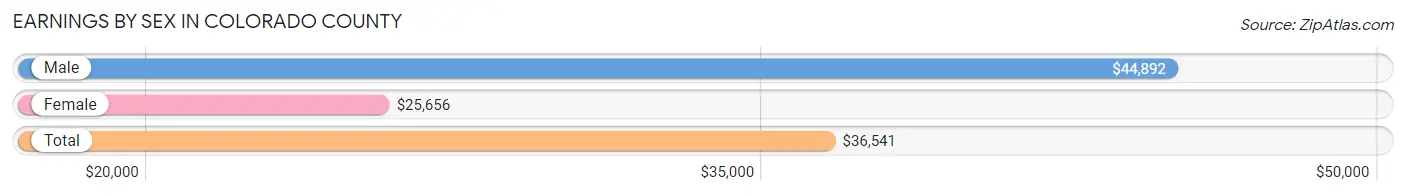
Earnings by Sex in Colorado County
Average Earnings in Colorado County are $36,541, $44,892 for men and $25,656 for women, a difference of 42.8%.
| Sex | Number | Average Earnings |
| Male | 5,413 (55.9%) | $44,892 |
| Female | 4,272 (44.1%) | $25,656 |
| Total | 9,685 (100.0%) | $36,541 |
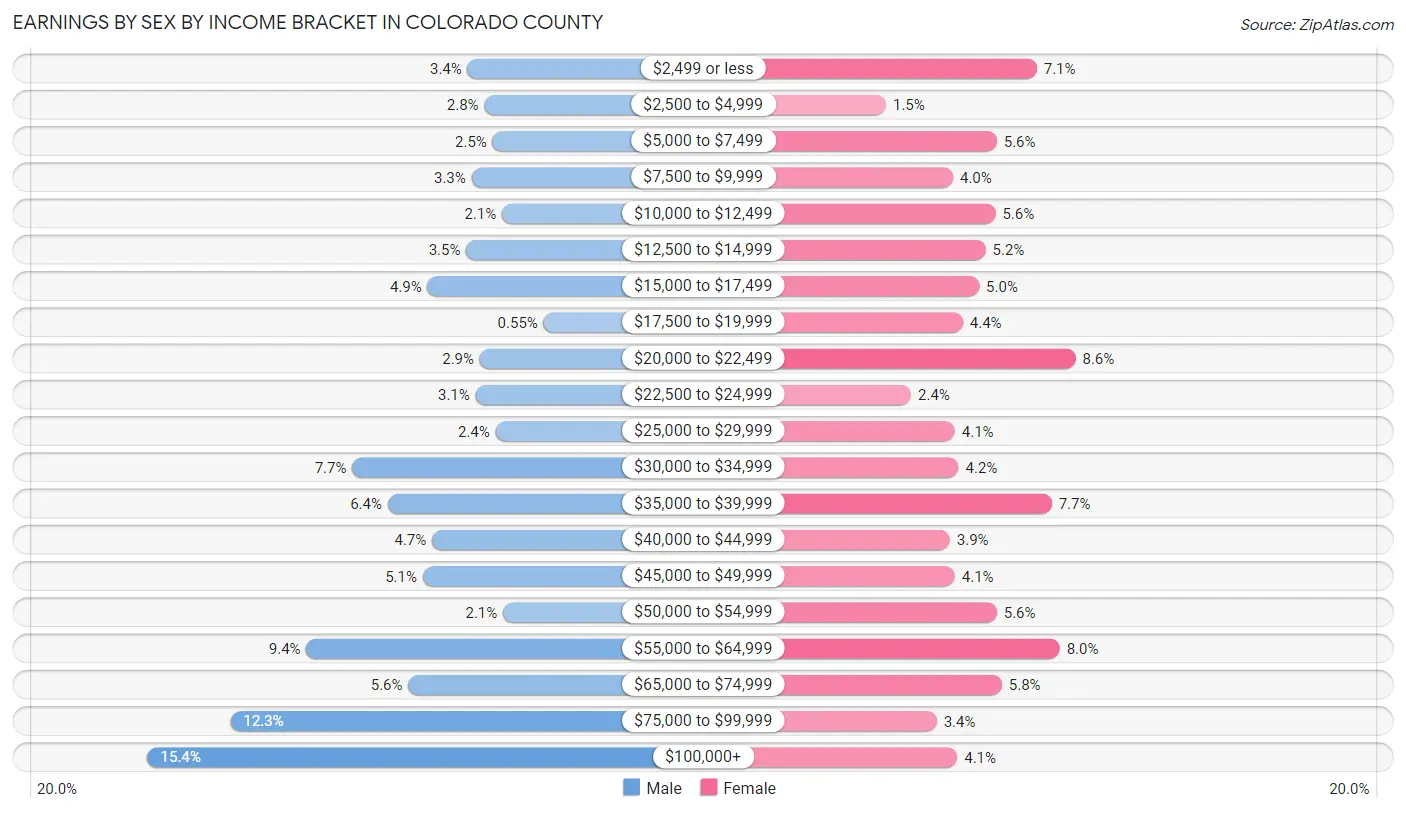
Earnings by Sex by Income Bracket in Colorado County
The most common earnings brackets in Colorado County are $100,000+ for men (833 | 15.4%) and $20,000 to $22,499 for women (366 | 8.6%).
| Income | Male | Female |
| $2,499 or less | 184 (3.4%) | 304 (7.1%) |
| $2,500 to $4,999 | 150 (2.8%) | 63 (1.5%) |
| $5,000 to $7,499 | 133 (2.5%) | 240 (5.6%) |
| $7,500 to $9,999 | 176 (3.3%) | 170 (4.0%) |
| $10,000 to $12,499 | 114 (2.1%) | 238 (5.6%) |
| $12,500 to $14,999 | 187 (3.5%) | 222 (5.2%) |
| $15,000 to $17,499 | 265 (4.9%) | 212 (5.0%) |
| $17,500 to $19,999 | 30 (0.5%) | 186 (4.3%) |
| $20,000 to $22,499 | 159 (2.9%) | 366 (8.6%) |
| $22,500 to $24,999 | 168 (3.1%) | 103 (2.4%) |
| $25,000 to $29,999 | 127 (2.4%) | 173 (4.1%) |
| $30,000 to $34,999 | 418 (7.7%) | 179 (4.2%) |
| $35,000 to $39,999 | 346 (6.4%) | 328 (7.7%) |
| $40,000 to $44,999 | 256 (4.7%) | 165 (3.9%) |
| $45,000 to $49,999 | 275 (5.1%) | 173 (4.1%) |
| $50,000 to $54,999 | 112 (2.1%) | 240 (5.6%) |
| $55,000 to $64,999 | 511 (9.4%) | 341 (8.0%) |
| $65,000 to $74,999 | 304 (5.6%) | 248 (5.8%) |
| $75,000 to $99,999 | 665 (12.3%) | 144 (3.4%) |
| $100,000+ | 833 (15.4%) | 177 (4.1%) |
| Total | 5,413 (100.0%) | 4,272 (100.0%) |
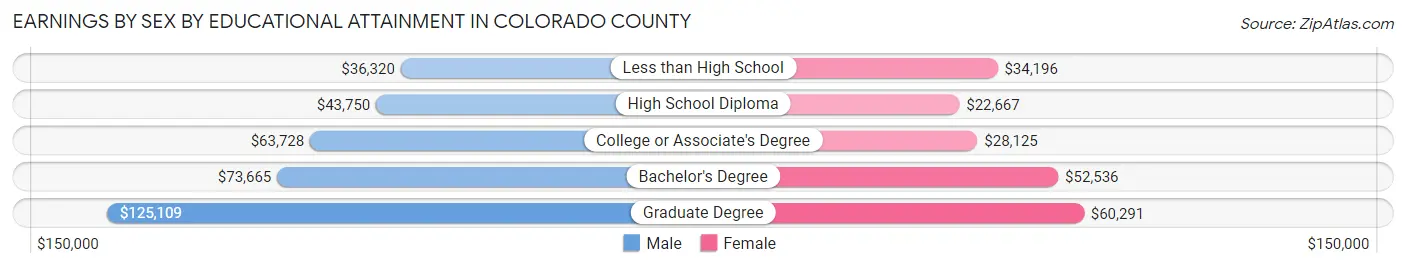
Earnings by Sex by Educational Attainment in Colorado County
Average earnings in Colorado County are $50,373 for men and $34,454 for women, a difference of 31.6%. Men with an educational attainment of graduate degree enjoy the highest average annual earnings of $125,109, while those with less than high school education earn the least with $36,320. Women with an educational attainment of graduate degree earn the most with the average annual earnings of $60,291, while those with high school diploma education have the smallest earnings of $22,667.
| Educational Attainment | Male Income | Female Income |
| Less than High School | $36,320 | $34,196 |
| High School Diploma | $43,750 | $22,667 |
| College or Associate's Degree | $63,728 | $28,125 |
| Bachelor's Degree | $73,665 | $52,536 |
| Graduate Degree | $125,109 | $60,291 |
| Total | $50,373 | $34,454 |
Family Income in Colorado County
Family Income Brackets in Colorado County
According to the Colorado County family income data, there are 1,232 families falling into the $50,000 to $74,999 income range, which is the most common income bracket and makes up 24.8% of all families. Conversely, the $10,000 to $14,999 income bracket is the least frequent group with only 15 families (0.3%) belonging to this category.
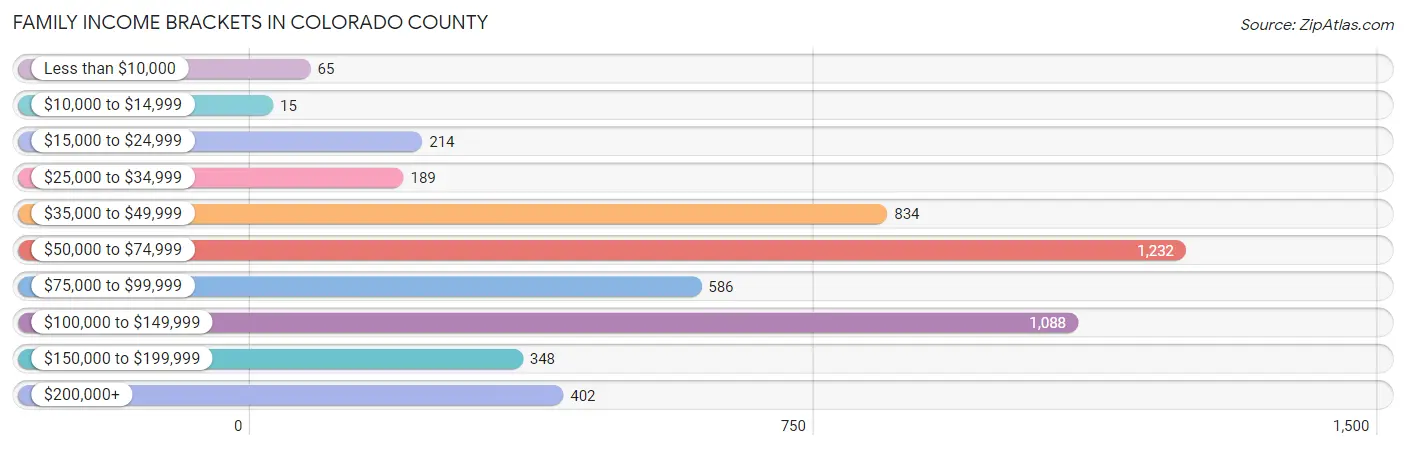
| Income Bracket | # Families | % Families |
| Less than $10,000 | 65 | 1.3% |
| $10,000 to $14,999 | 15 | 0.3% |
| $15,000 to $24,999 | 214 | 4.3% |
| $25,000 to $34,999 | 189 | 3.8% |
| $35,000 to $49,999 | 834 | 16.8% |
| $50,000 to $74,999 | 1,232 | 24.8% |
| $75,000 to $99,999 | 586 | 11.8% |
| $100,000 to $149,999 | 1,088 | 21.9% |
| $150,000 to $199,999 | 348 | 7.0% |
| $200,000+ | 402 | 8.1% |
Family Income by Famaliy Size in Colorado County
7+ person families (125 | 2.5%) account for the highest median family income in Colorado County with $101,546 per family, while 2-person families (2,869 | 57.8%) have the highest median income of $35,414 per family member.
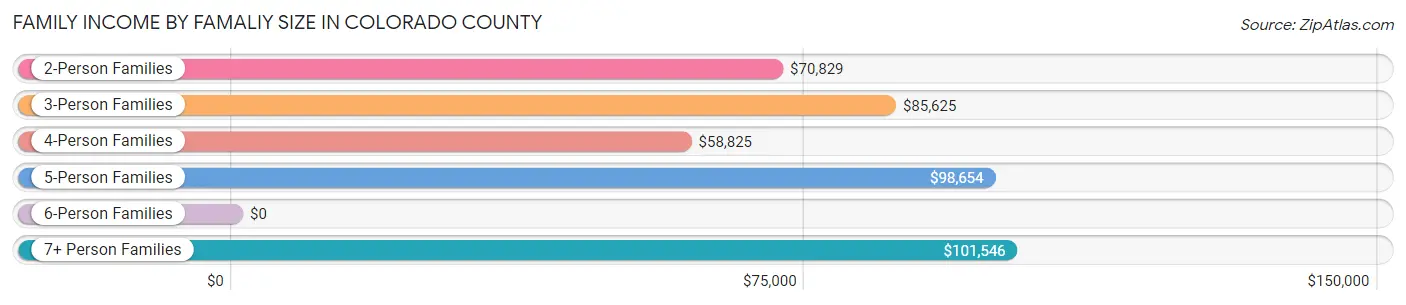
| Income Bracket | # Families | Median Income |
| 2-Person Families | 2,869 (57.8%) | $70,829 |
| 3-Person Families | 1,004 (20.2%) | $85,625 |
| 4-Person Families | 481 (9.7%) | $58,825 |
| 5-Person Families | 362 (7.3%) | $98,654 |
| 6-Person Families | 125 (2.5%) | $0 |
| 7+ Person Families | 125 (2.5%) | $101,546 |
| Total | 4,966 (100.0%) | $73,565 |
Family Income by Number of Earners in Colorado County
The median family income in Colorado County is $73,565, with families comprising 3+ earners (421) having the highest median family income of $119,844, while families with no earners (854) have the lowest median family income of $58,803, accounting for 8.5% and 17.2% of families, respectively.
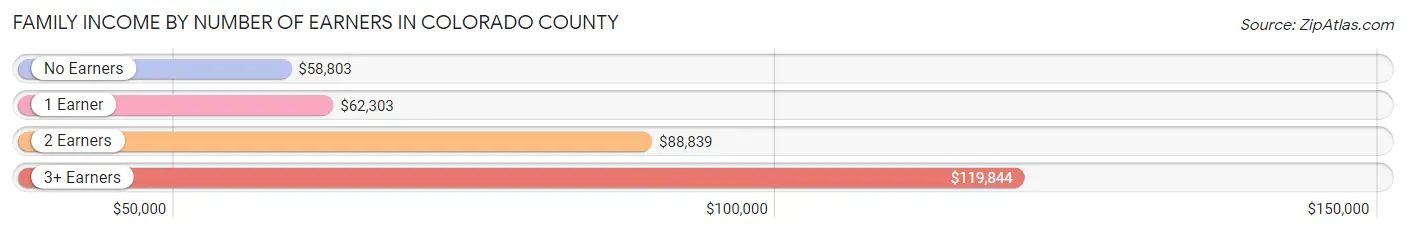
| Number of Earners | # Families | Median Income |
| No Earners | 854 (17.2%) | $58,803 |
| 1 Earner | 1,562 (31.5%) | $62,303 |
| 2 Earners | 2,129 (42.9%) | $88,839 |
| 3+ Earners | 421 (8.5%) | $119,844 |
| Total | 4,966 (100.0%) | $73,565 |
Household Income in Colorado County
Household Income Brackets in Colorado County
With 1,726 households falling in the category, the $50,000 to $74,999 income range is the most frequent in Colorado County, accounting for 23.4% of all households. In contrast, only 302 households (4.1%) fall into the $10,000 to $14,999 income bracket, making it the least populous group.
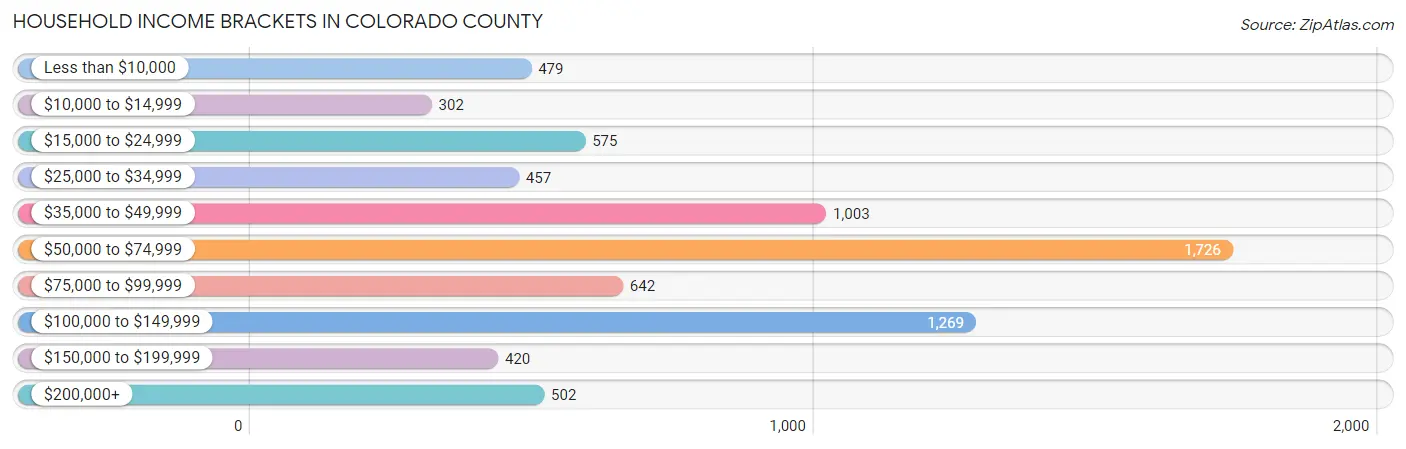
| Income Bracket | # Households | % Households |
| Less than $10,000 | 479 | 6.5% |
| $10,000 to $14,999 | 302 | 4.1% |
| $15,000 to $24,999 | 575 | 7.8% |
| $25,000 to $34,999 | 457 | 6.2% |
| $35,000 to $49,999 | 1,003 | 13.6% |
| $50,000 to $74,999 | 1,726 | 23.4% |
| $75,000 to $99,999 | 642 | 8.7% |
| $100,000 to $149,999 | 1,269 | 17.2% |
| $150,000 to $199,999 | 420 | 5.7% |
| $200,000+ | 502 | 6.8% |
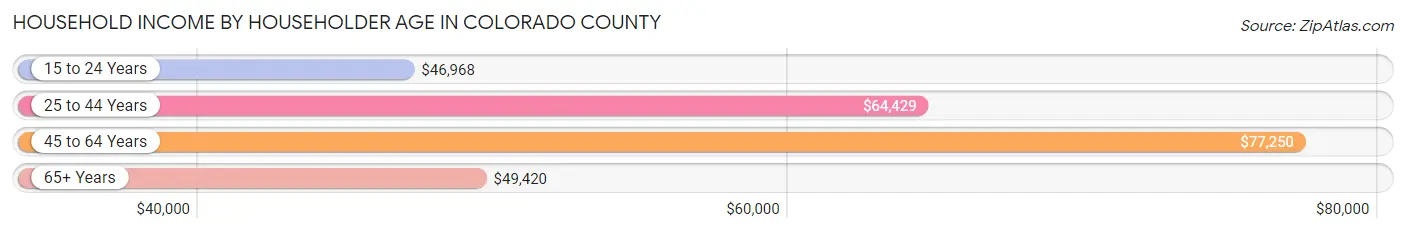
Household Income by Householder Age in Colorado County
The median household income in Colorado County is $63,352, with the highest median household income of $77,250 found in the 45 to 64 years age bracket for the primary householder. A total of 2,764 households (37.5%) fall into this category. Meanwhile, the 15 to 24 years age bracket for the primary householder has the lowest median household income of $46,968, with 189 households (2.6%) in this group.
| Income Bracket | # Households | Median Income |
| 15 to 24 Years | 189 (2.6%) | $46,968 |
| 25 to 44 Years | 1,692 (22.9%) | $64,429 |
| 45 to 64 Years | 2,764 (37.5%) | $77,250 |
| 65+ Years | 2,731 (37.0%) | $49,420 |
| Total | 7,376 (100.0%) | $63,352 |
Poverty in Colorado County
Income Below Poverty by Sex and Age in Colorado County
With 5.9% poverty level for males and 9.0% for females among the residents of Colorado County, 16 and 17 year old males and 18 to 24 year old females are the most vulnerable to poverty, with 95 males (41.8%) and 144 females (16.2%) in their respective age groups living below the poverty level.
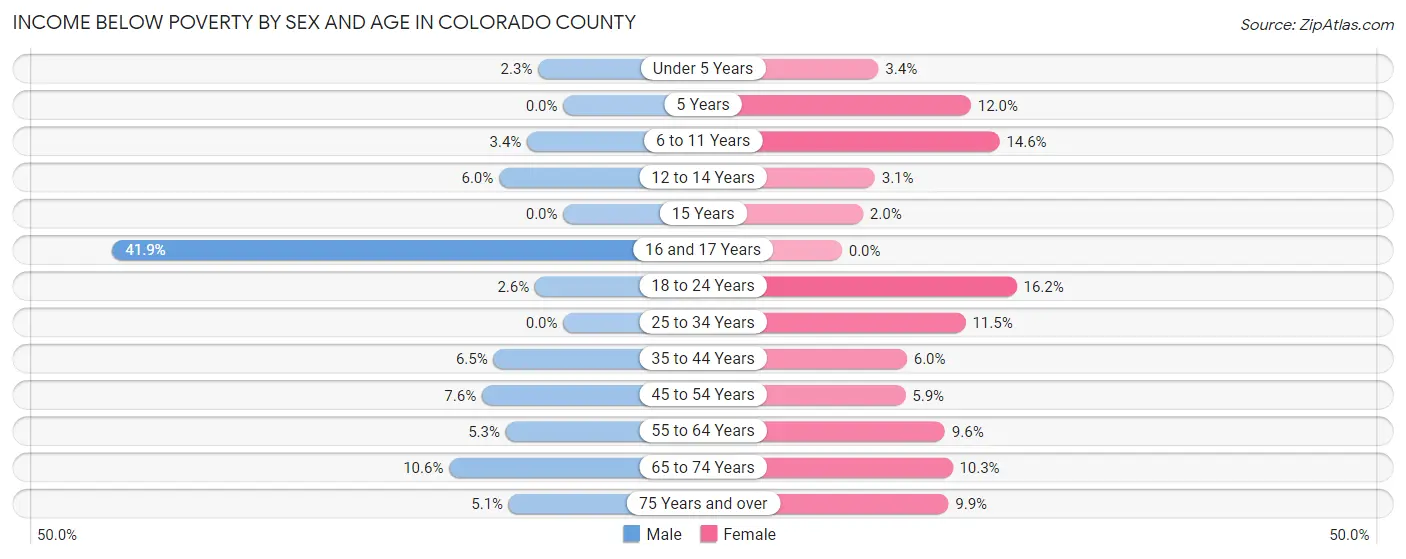
| Age Bracket | Male | Female |
| Under 5 Years | 9 (2.3%) | 27 (3.4%) |
| 5 Years | 0 (0.0%) | 17 (12.0%) |
| 6 to 11 Years | 37 (3.4%) | 91 (14.6%) |
| 12 to 14 Years | 23 (6.0%) | 11 (3.1%) |
| 15 Years | 0 (0.0%) | 1 (2.0%) |
| 16 and 17 Years | 95 (41.8%) | 0 (0.0%) |
| 18 to 24 Years | 23 (2.6%) | 144 (16.2%) |
| 25 to 34 Years | 0 (0.0%) | 111 (11.5%) |
| 35 to 44 Years | 69 (6.5%) | 49 (6.0%) |
| 45 to 54 Years | 84 (7.5%) | 77 (5.9%) |
| 55 to 64 Years | 79 (5.3%) | 137 (9.6%) |
| 65 to 74 Years | 135 (10.6%) | 135 (10.3%) |
| 75 Years and over | 39 (5.1%) | 97 (9.9%) |
| Total | 593 (5.9%) | 897 (9.0%) |
Income Above Poverty by Sex and Age in Colorado County
According to the poverty statistics in Colorado County, males aged 5 years and females aged 16 and 17 years are the age groups that are most secure financially, with 100.0% of males and 100.0% of females in these age groups living above the poverty line.
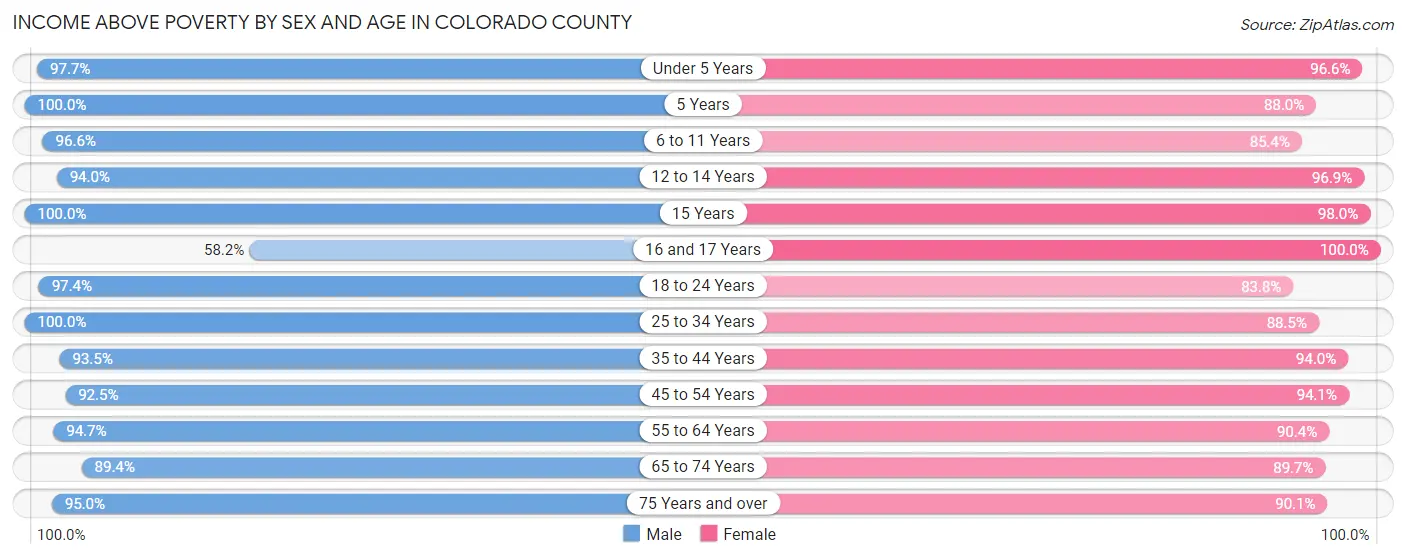
| Age Bracket | Male | Female |
| Under 5 Years | 377 (97.7%) | 766 (96.6%) |
| 5 Years | 96 (100.0%) | 125 (88.0%) |
| 6 to 11 Years | 1,063 (96.6%) | 531 (85.4%) |
| 12 to 14 Years | 363 (94.0%) | 348 (96.9%) |
| 15 Years | 111 (100.0%) | 50 (98.0%) |
| 16 and 17 Years | 132 (58.2%) | 270 (100.0%) |
| 18 to 24 Years | 853 (97.4%) | 744 (83.8%) |
| 25 to 34 Years | 1,173 (100.0%) | 856 (88.5%) |
| 35 to 44 Years | 995 (93.5%) | 763 (94.0%) |
| 45 to 54 Years | 1,029 (92.4%) | 1,228 (94.1%) |
| 55 to 64 Years | 1,401 (94.7%) | 1,294 (90.4%) |
| 65 to 74 Years | 1,140 (89.4%) | 1,179 (89.7%) |
| 75 Years and over | 734 (95.0%) | 884 (90.1%) |
| Total | 9,467 (94.1%) | 9,038 (91.0%) |
Income Below Poverty Among Married-Couple Families in Colorado County
The poverty statistics for married-couple families in Colorado County show that 1.9% or 80 of the total 4,097 families live below the poverty line. Families with 3 or 4 children have the highest poverty rate of 7.5%, comprising of 24 families. On the other hand, families with 5 or more children have the lowest poverty rate of 0.0%, which includes 0 families.
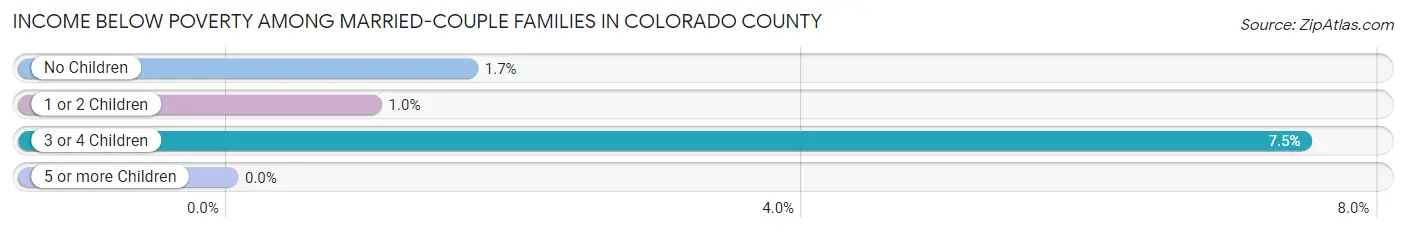
| Children | Above Poverty | Below Poverty |
| No Children | 2,771 (98.3%) | 47 (1.7%) |
| 1 or 2 Children | 892 (99.0%) | 9 (1.0%) |
| 3 or 4 Children | 297 (92.5%) | 24 (7.5%) |
| 5 or more Children | 57 (100.0%) | 0 (0.0%) |
| Total | 4,017 (98.1%) | 80 (1.9%) |
Income Below Poverty Among Single-Parent Households in Colorado County
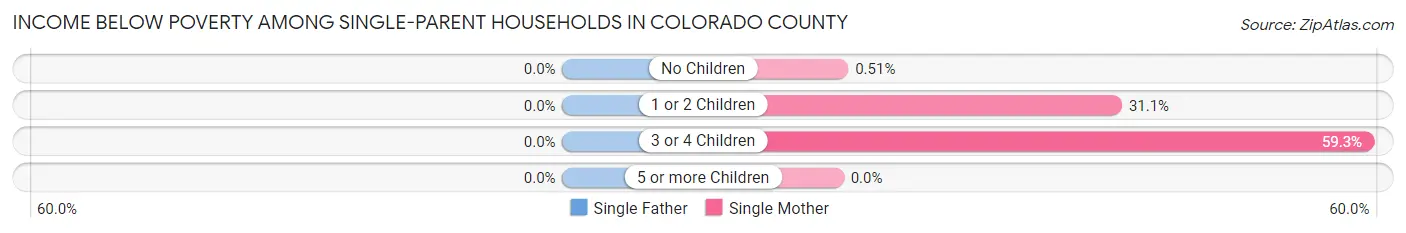
| Children | Single Father | Single Mother |
| No Children | 0 (0.0%) | 2 (0.5%) |
| 1 or 2 Children | 0 (0.0%) | 51 (31.1%) |
| 3 or 4 Children | 0 (0.0%) | 16 (59.3%) |
| 5 or more Children | 0 (0.0%) | 0 (0.0%) |
| Total | 0 (0.0%) | 69 (11.8%) |
Income Below Poverty Among Married-Couple vs Single-Parent Households in Colorado County
The poverty data for Colorado County shows that 80 of the married-couple family households (1.9%) and 69 of the single-parent households (7.9%) are living below the poverty level. Within the married-couple family households, those with 3 or 4 children have the highest poverty rate, with 24 households (7.5%) falling below the poverty line. Among the single-parent households, those with 3 or 4 children have the highest poverty rate, with 16 household (29.6%) living below poverty.
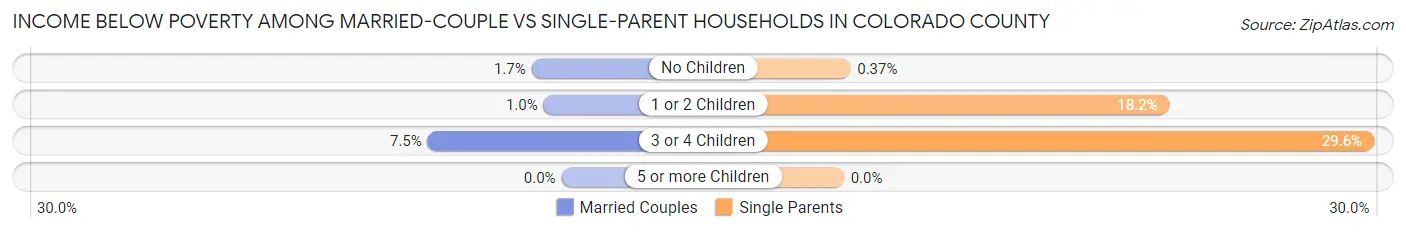
| Children | Married-Couple Families | Single-Parent Households |
| No Children | 47 (1.7%) | 2 (0.4%) |
| 1 or 2 Children | 9 (1.0%) | 51 (18.2%) |
| 3 or 4 Children | 24 (7.5%) | 16 (29.6%) |
| 5 or more Children | 0 (0.0%) | 0 (0.0%) |
| Total | 80 (1.9%) | 69 (7.9%) |
Race in Colorado County
The most populous races in Colorado County are White / Caucasian (13,966 | 67.9%), Hispanic or Latino (6,463 | 31.4%), and Some other Race (2,684 | 13.0%).
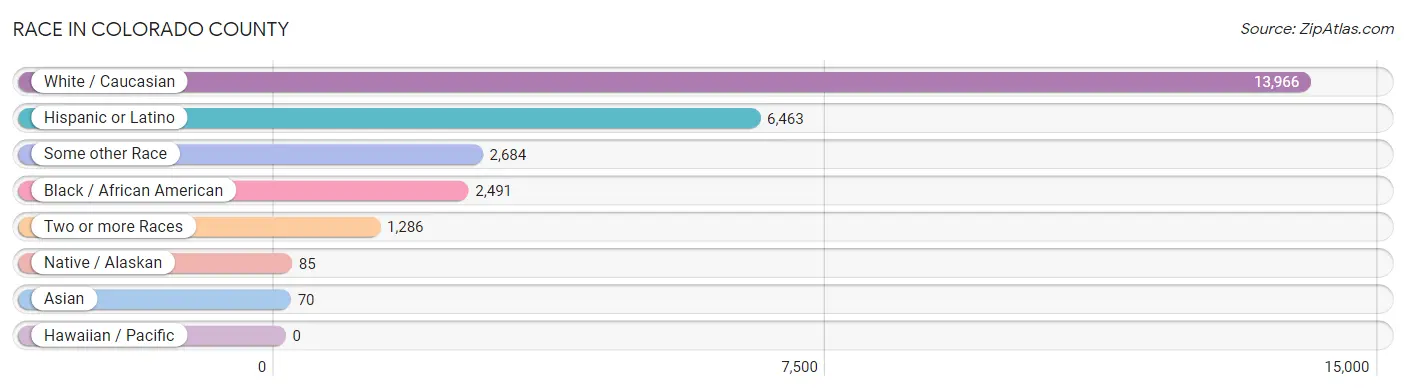
| Race | # Population | % Population |
| Asian | 70 | 0.3% |
| Black / African American | 2,491 | 12.1% |
| Hawaiian / Pacific | 0 | 0.0% |
| Hispanic or Latino | 6,463 | 31.4% |
| Native / Alaskan | 85 | 0.4% |
| White / Caucasian | 13,966 | 67.9% |
| Two or more Races | 1,286 | 6.2% |
| Some other Race | 2,684 | 13.0% |
| Total | 20,582 | 100.0% |
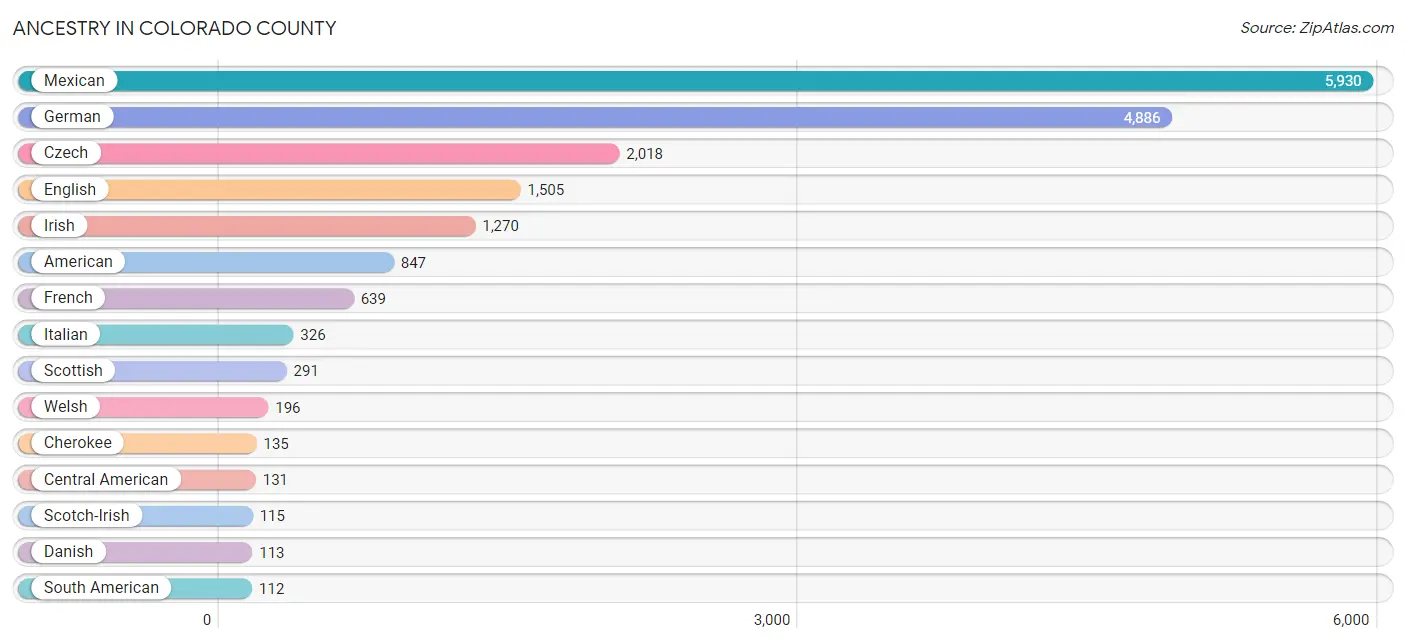
Ancestry in Colorado County
The most populous ancestries reported in Colorado County are Mexican (5,930 | 28.8%), German (4,886 | 23.7%), Czech (2,018 | 9.8%), English (1,505 | 7.3%), and Irish (1,270 | 6.2%), together accounting for 75.8% of all Colorado County residents.
| Ancestry | # Population | % Population |
| African | 40 | 0.2% |
| American | 847 | 4.1% |
| Australian | 5 | 0.0% |
| Austrian | 10 | 0.1% |
| British | 52 | 0.3% |
| Cajun | 4 | 0.0% |
| Canadian | 16 | 0.1% |
| Central American | 131 | 0.6% |
| Cherokee | 135 | 0.7% |
| Colombian | 87 | 0.4% |
| Costa Rican | 8 | 0.0% |
| Croatian | 2 | 0.0% |
| Czech | 2,018 | 9.8% |
| Czechoslovakian | 14 | 0.1% |
| Danish | 113 | 0.5% |
| Dutch | 91 | 0.4% |
| Ecuadorian | 25 | 0.1% |
| English | 1,505 | 7.3% |
| European | 58 | 0.3% |
| French | 639 | 3.1% |
| German | 4,886 | 23.7% |
| Ghanaian | 29 | 0.1% |
| Honduran | 95 | 0.5% |
| Hungarian | 12 | 0.1% |
| Irish | 1,270 | 6.2% |
| Italian | 326 | 1.6% |
| Jamaican | 8 | 0.0% |
| Korean | 19 | 0.1% |
| Latvian | 6 | 0.0% |
| Mexican | 5,930 | 28.8% |
| Mexican American Indian | 12 | 0.1% |
| Nicaraguan | 3 | 0.0% |
| Northern European | 29 | 0.1% |
| Norwegian | 80 | 0.4% |
| Polish | 45 | 0.2% |
| Russian | 18 | 0.1% |
| Salvadoran | 25 | 0.1% |
| Scotch-Irish | 115 | 0.6% |
| Scottish | 291 | 1.4% |
| Serbian | 19 | 0.1% |
| South African | 8 | 0.0% |
| South American | 112 | 0.5% |
| Spaniard | 20 | 0.1% |
| Sri Lankan | 29 | 0.1% |
| Subsaharan African | 48 | 0.2% |
| Swedish | 77 | 0.4% |
| Vietnamese | 17 | 0.1% |
| Welsh | 196 | 0.9% | View All 48 Rows |
Immigrants in Colorado County
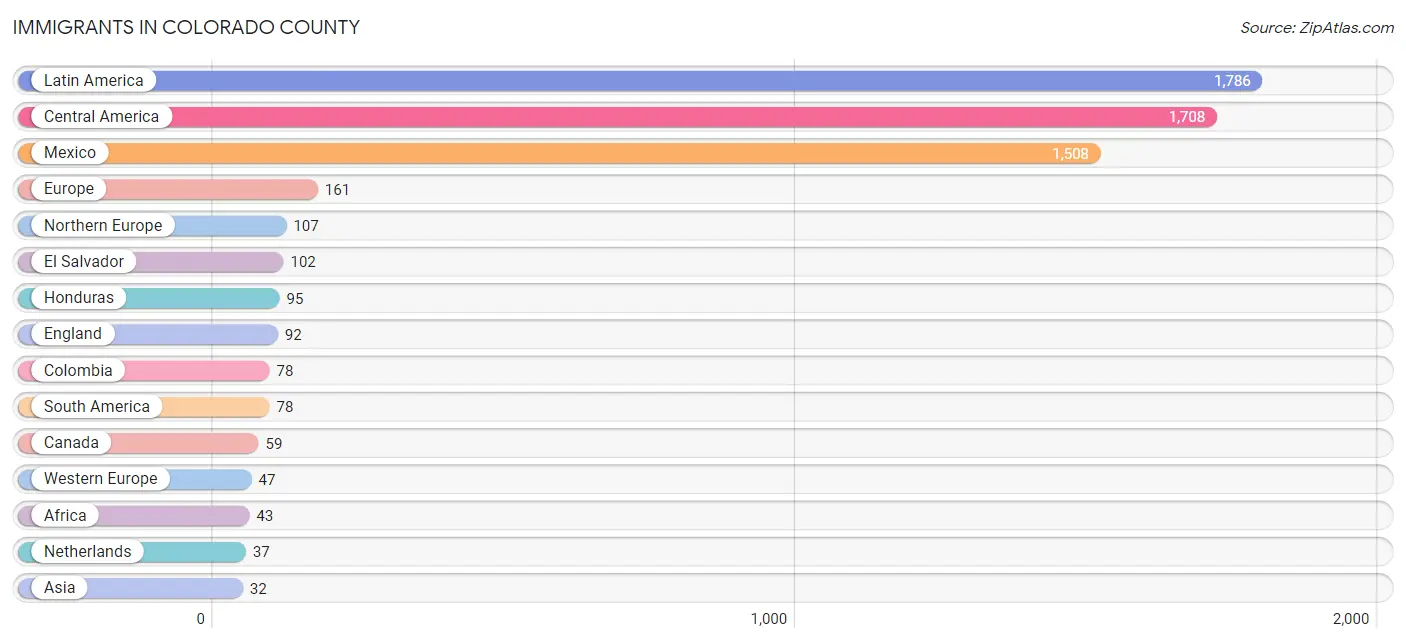
The most numerous immigrant groups reported in Colorado County came from Latin America (1,786 | 8.7%), Central America (1,708 | 8.3%), Mexico (1,508 | 7.3%), Europe (161 | 0.8%), and Northern Europe (107 | 0.5%), together accounting for 25.6% of all Colorado County residents.
| Immigration Origin | # Population | % Population |
| Africa | 43 | 0.2% |
| Asia | 32 | 0.2% |
| Bangladesh | 17 | 0.1% |
| Canada | 59 | 0.3% |
| Central America | 1,708 | 8.3% |
| Colombia | 78 | 0.4% |
| Czechoslovakia | 6 | 0.0% |
| Eastern Africa | 6 | 0.0% |
| Eastern Europe | 7 | 0.0% |
| El Salvador | 102 | 0.5% |
| England | 92 | 0.4% |
| Ethiopia | 6 | 0.0% |
| Europe | 161 | 0.8% |
| Germany | 10 | 0.1% |
| Ghana | 29 | 0.1% |
| Honduras | 95 | 0.5% |
| Latin America | 1,786 | 8.7% |
| Mexico | 1,508 | 7.3% |
| Netherlands | 37 | 0.2% |
| Nicaragua | 3 | 0.0% |
| Northern Europe | 107 | 0.5% |
| Serbia | 1 | 0.0% |
| South Africa | 8 | 0.0% |
| South America | 78 | 0.4% |
| South Central Asia | 17 | 0.1% |
| South Eastern Asia | 15 | 0.1% |
| Vietnam | 15 | 0.1% |
| Western Africa | 29 | 0.1% |
| Western Europe | 47 | 0.2% | View All 29 Rows |
Sex and Age in Colorado County
Sex and Age in Colorado County
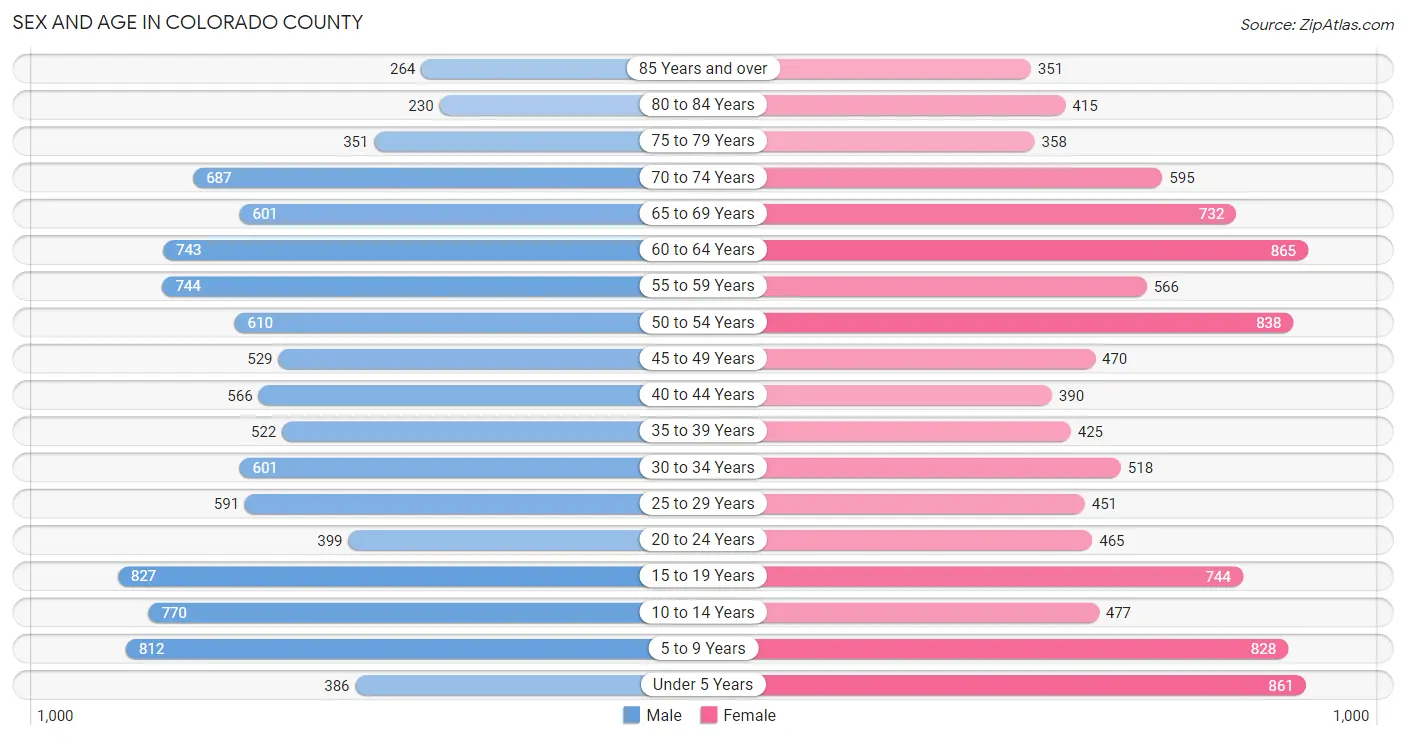
The most populous age groups in Colorado County are 15 to 19 Years (827 | 8.1%) for men and 60 to 64 Years (865 | 8.4%) for women.
| Age Bracket | Male | Female |
| Under 5 Years | 386 (3.8%) | 861 (8.3%) |
| 5 to 9 Years | 812 (7.9%) | 828 (8.0%) |
| 10 to 14 Years | 770 (7.5%) | 477 (4.6%) |
| 15 to 19 Years | 827 (8.1%) | 744 (7.2%) |
| 20 to 24 Years | 399 (3.9%) | 465 (4.5%) |
| 25 to 29 Years | 591 (5.8%) | 451 (4.4%) |
| 30 to 34 Years | 601 (5.9%) | 518 (5.0%) |
| 35 to 39 Years | 522 (5.1%) | 425 (4.1%) |
| 40 to 44 Years | 566 (5.5%) | 390 (3.8%) |
| 45 to 49 Years | 529 (5.2%) | 470 (4.5%) |
| 50 to 54 Years | 610 (6.0%) | 838 (8.1%) |
| 55 to 59 Years | 744 (7.3%) | 566 (5.5%) |
| 60 to 64 Years | 743 (7.3%) | 865 (8.4%) |
| 65 to 69 Years | 601 (5.9%) | 732 (7.1%) |
| 70 to 74 Years | 687 (6.7%) | 595 (5.8%) |
| 75 to 79 Years | 351 (3.4%) | 358 (3.5%) |
| 80 to 84 Years | 230 (2.2%) | 415 (4.0%) |
| 85 Years and over | 264 (2.6%) | 351 (3.4%) |
| Total | 10,233 (100.0%) | 10,349 (100.0%) |
Families and Households in Colorado County
Median Family Size in Colorado County
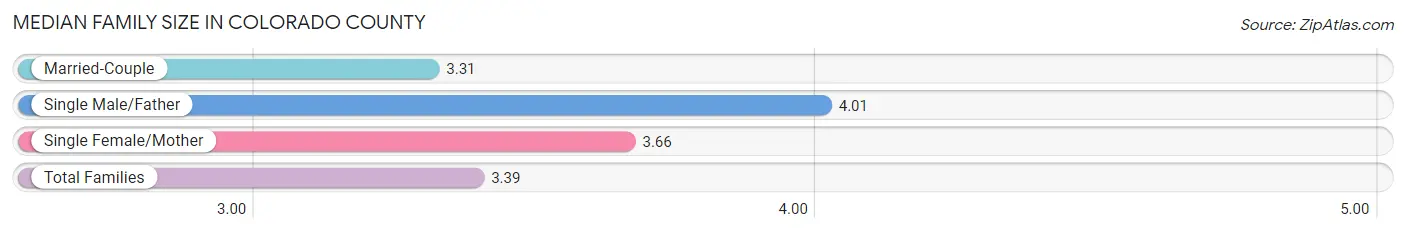
The median family size in Colorado County is 3.39 persons per family, with single male/father families (285 | 5.7%) accounting for the largest median family size of 4.01 persons per family. On the other hand, married-couple families (4,097 | 82.5%) represent the smallest median family size with 3.31 persons per family.
| Family Type | # Families | Family Size |
| Married-Couple | 4,097 (82.5%) | 3.31 |
| Single Male/Father | 285 (5.7%) | 4.01 |
| Single Female/Mother | 584 (11.8%) | 3.66 |
| Total Families | 4,966 (100.0%) | 3.39 |
Median Household Size in Colorado County
The median household size in Colorado County is 2.74 persons per household, with single male/father households (285 | 3.9%) accounting for the largest median household size of 4.14 persons per household. non-family households (2,410 | 32.7%) represent the smallest median household size with 1.31 persons per household.

| Household Type | # Households | Household Size |
| Married-Couple | 4,097 (55.5%) | 3.33 |
| Single Male/Father | 285 (3.9%) | 4.14 |
| Single Female/Mother | 584 (7.9%) | 3.80 |
| Non-family | 2,410 (32.7%) | 1.31 |
| Total Households | 7,376 (100.0%) | 2.74 |
Household Size by Marriage Status in Colorado County
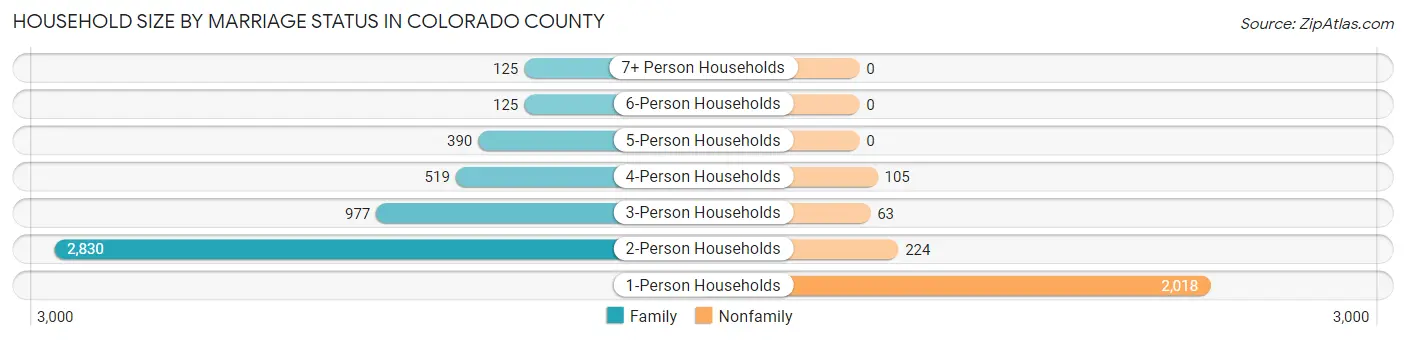
Out of a total of 7,376 households in Colorado County, 4,966 (67.3%) are family households, while 2,410 (32.7%) are nonfamily households. The most numerous type of family households are 2-person households, comprising 2,830, and the most common type of nonfamily households are 1-person households, comprising 2,018.
| Household Size | Family Households | Nonfamily Households |
| 1-Person Households | - | 2,018 (27.4%) |
| 2-Person Households | 2,830 (38.4%) | 224 (3.0%) |
| 3-Person Households | 977 (13.3%) | 63 (0.9%) |
| 4-Person Households | 519 (7.0%) | 105 (1.4%) |
| 5-Person Households | 390 (5.3%) | 0 (0.0%) |
| 6-Person Households | 125 (1.7%) | 0 (0.0%) |
| 7+ Person Households | 125 (1.7%) | 0 (0.0%) |
| Total | 4,966 (67.3%) | 2,410 (32.7%) |
Female Fertility in Colorado County
Fertility by Age in Colorado County
Average fertility rate in Colorado County is 76.0 births per 1,000 women. Women in the age bracket of 20 to 34 years have the highest fertility rate with 172.0 births per 1,000 women. Women in the age bracket of 20 to 34 years acount for 88.5% of all women with births.
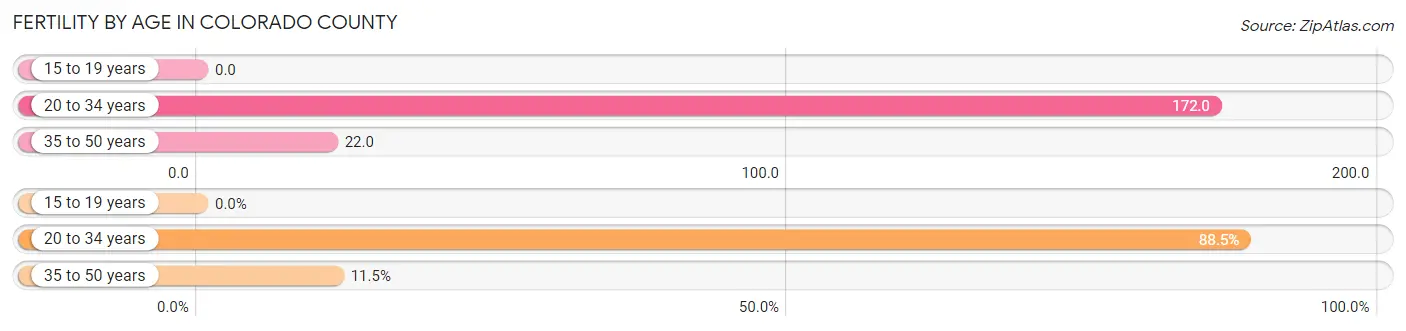
| Age Bracket | Women with Births | Births / 1,000 Women |
| 15 to 19 years | 0 (0.0%) | 0.0 |
| 20 to 34 years | 246 (88.5%) | 172.0 |
| 35 to 50 years | 32 (11.5%) | 22.0 |
| Total | 278 (100.0%) | 76.0 |
Fertility by Age by Marriage Status in Colorado County
89.6% of women with births (278) in Colorado County are married. The highest percentage of unmarried women with births falls into 35 to 50 years age bracket with 34.4% of them unmarried at the time of birth, while the lowest percentage of unmarried women with births belong to 20 to 34 years age bracket with 7.3% of them unmarried.
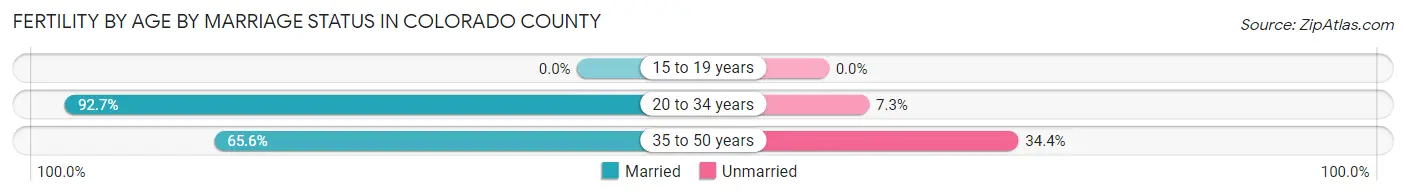
| Age Bracket | Married | Unmarried |
| 15 to 19 years | 0 (0.0%) | 0 (0.0%) |
| 20 to 34 years | 228 (92.7%) | 18 (7.3%) |
| 35 to 50 years | 21 (65.6%) | 11 (34.4%) |
| Total | 249 (89.6%) | 29 (10.4%) |
Fertility by Education in Colorado County
Average fertility rate in Colorado County is 76.0 births per 1,000 women. Women with the education attainment of graduate degree have the highest fertility rate of 162.0 births per 1,000 women, while women with the education attainment of less than high school have the lowest fertility at 15.0 births per 1,000 women. Women with the education attainment of college or associate's degree represent 55.8% of all women with births.
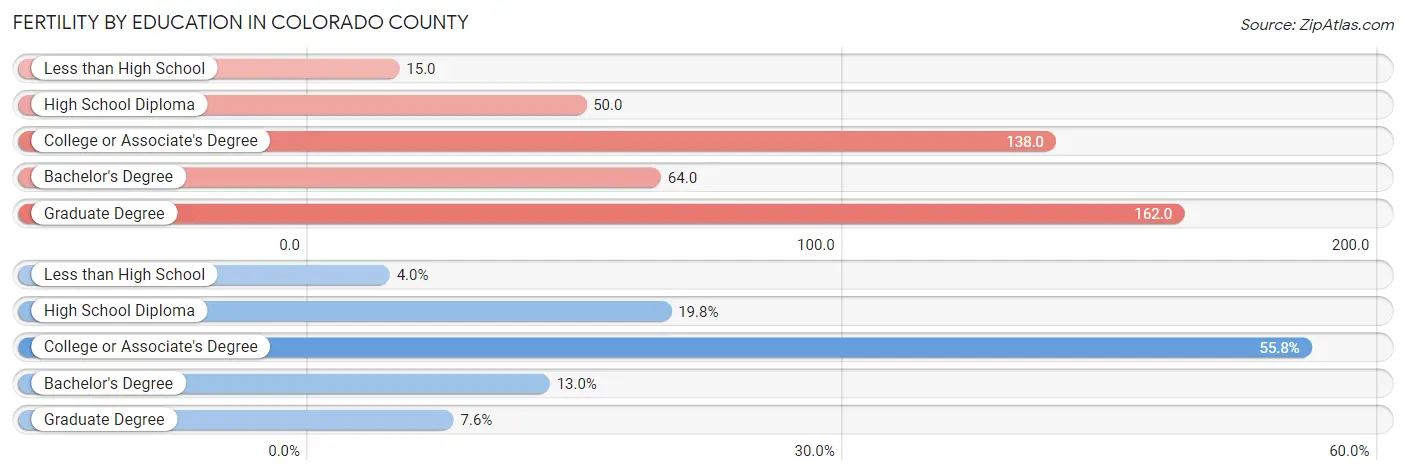
| Educational Attainment | Women with Births | Births / 1,000 Women |
| Less than High School | 11 (4.0%) | 15.0 |
| High School Diploma | 55 (19.8%) | 50.0 |
| College or Associate's Degree | 155 (55.8%) | 138.0 |
| Bachelor's Degree | 36 (13.0%) | 64.0 |
| Graduate Degree | 21 (7.5%) | 162.0 |
| Total | 278 (100.0%) | 76.0 |
Fertility by Education by Marriage Status in Colorado County
10.4% of women with births in Colorado County are unmarried. Women with the educational attainment of bachelor's degree are most likely to be married with 100.0% of them married at childbirth, while women with the educational attainment of less than high school are least likely to be married with 100.0% of them unmarried at childbirth.
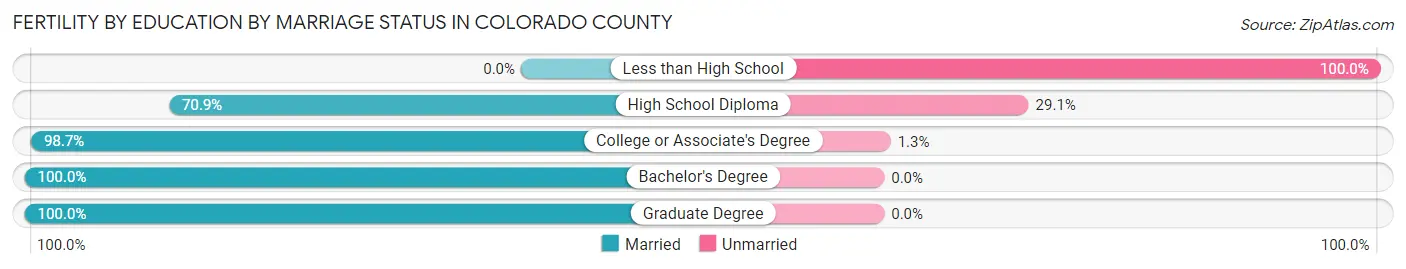
| Educational Attainment | Married | Unmarried |
| Less than High School | 0 (0.0%) | 11 (100.0%) |
| High School Diploma | 39 (70.9%) | 16 (29.1%) |
| College or Associate's Degree | 153 (98.7%) | 2 (1.3%) |
| Bachelor's Degree | 36 (100.0%) | 0 (0.0%) |
| Graduate Degree | 21 (100.0%) | 0 (0.0%) |
| Total | 249 (89.6%) | 29 (10.4%) |
Employment Characteristics in Colorado County
Employment by Class of Employer in Colorado County
Among the 8,769 employed individuals in Colorado County, private company employees (5,745 | 65.5%), self-employed (not incorporated) (862 | 9.8%), and not-for-profit organizations (805 | 9.2%) make up the most common classes of employment.
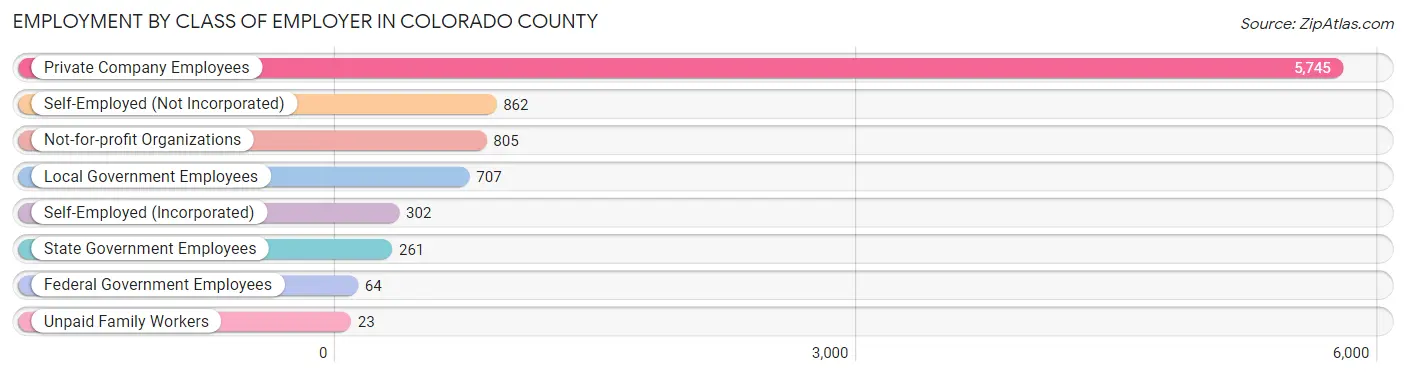
| Employer Class | # Employees | % Employees |
| Private Company Employees | 5,745 | 65.5% |
| Self-Employed (Incorporated) | 302 | 3.4% |
| Self-Employed (Not Incorporated) | 862 | 9.8% |
| Not-for-profit Organizations | 805 | 9.2% |
| Local Government Employees | 707 | 8.1% |
| State Government Employees | 261 | 3.0% |
| Federal Government Employees | 64 | 0.7% |
| Unpaid Family Workers | 23 | 0.3% |
| Total | 8,769 | 100.0% |
Employment Status by Age in Colorado County
According to the labor force statistics for Colorado County, out of the total population over 16 years of age (16,286), 57.6% or 9,381 individuals are in the labor force, with 5.7% or 535 of them unemployed. The age group with the highest labor force participation rate is 20 to 24 years, with 93.1% or 804 individuals in the labor force. Within the labor force, the 16 to 19 years age range has the highest percentage of unemployed individuals, with 21.0% or 139 of them being unemployed.
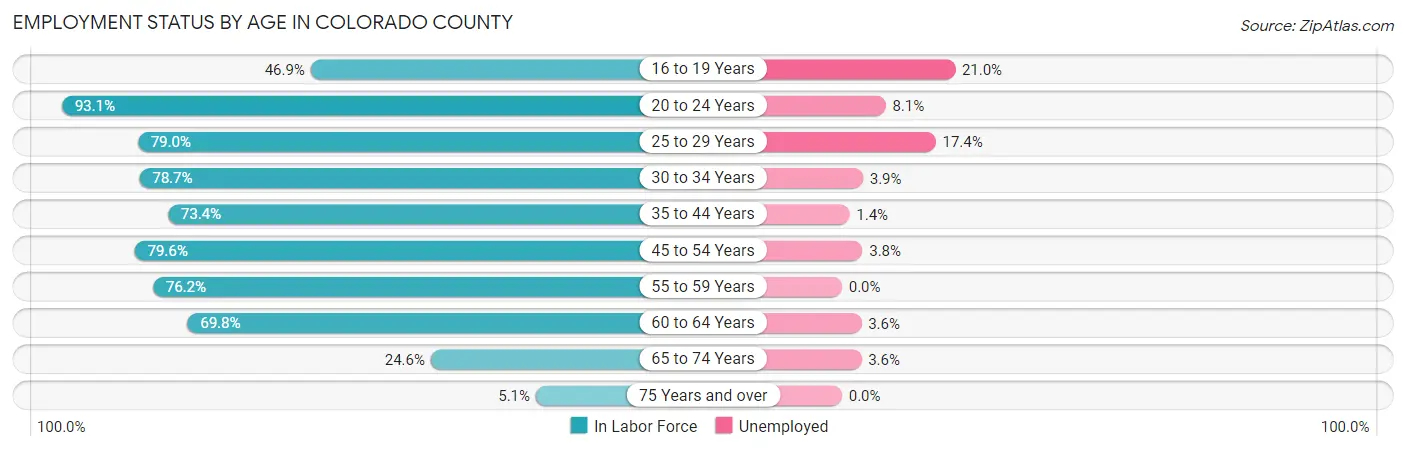
| Age Bracket | In Labor Force | Unemployed |
| 16 to 19 Years | 661 (46.9%) | 139 (21.0%) |
| 20 to 24 Years | 804 (93.1%) | 65 (8.1%) |
| 25 to 29 Years | 823 (79.0%) | 143 (17.4%) |
| 30 to 34 Years | 881 (78.7%) | 34 (3.9%) |
| 35 to 44 Years | 1,397 (73.4%) | 20 (1.4%) |
| 45 to 54 Years | 1,948 (79.6%) | 74 (3.8%) |
| 55 to 59 Years | 998 (76.2%) | 0 (0.0%) |
| 60 to 64 Years | 1,122 (69.8%) | 40 (3.6%) |
| 65 to 74 Years | 643 (24.6%) | 23 (3.6%) |
| 75 Years and over | 100 (5.1%) | 0 (0.0%) |
| Total | 9,381 (57.6%) | 535 (5.7%) |
Employment Status by Educational Attainment in Colorado County
According to labor force statistics for Colorado County, 76.1% of individuals (7,175) out of the total population between 25 and 64 years of age (9,429) are in the labor force, with 4.3% or 309 of them being unemployed. The group with the highest labor force participation rate are those with the educational attainment of bachelor's degree or higher, with 79.5% or 1,714 individuals in the labor force. Within the labor force, individuals with college / associate degree education have the highest percentage of unemployment, with 9.0% or 185 of them being unemployed.
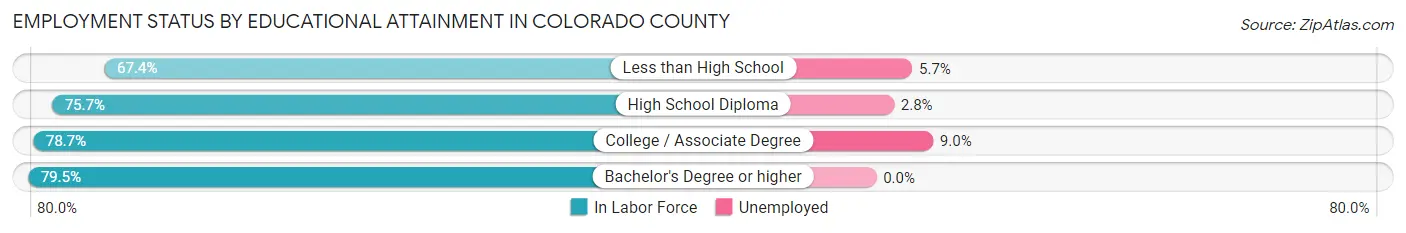
| Educational Attainment | In Labor Force | Unemployed |
| Less than High School | 1,039 (67.4%) | 88 (5.7%) |
| High School Diploma | 2,365 (75.7%) | 87 (2.8%) |
| College / Associate Degree | 2,052 (78.7%) | 235 (9.0%) |
| Bachelor's Degree or higher | 1,714 (79.5%) | 0 (0.0%) |
| Total | 7,175 (76.1%) | 405 (4.3%) |
Employment Occupations by Sex in Colorado County
Management, Business, Science and Arts Occupations
The most common Management, Business, Science and Arts occupations in Colorado County are Management (1,132 | 12.8%), Community & Social Service (872 | 9.9%), Health Diagnosing & Treating (771 | 8.7%), Education Instruction & Library (521 | 5.9%), and Computers, Engineering & Science (274 | 3.1%).
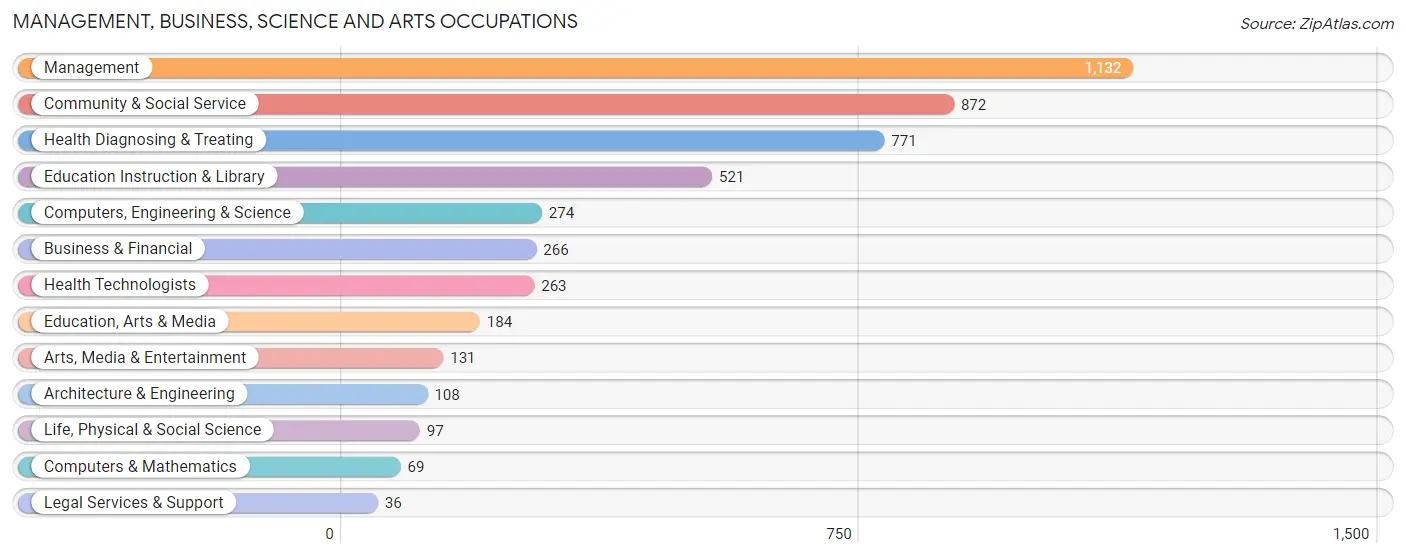
Management, Business, Science and Arts Occupations by Sex
Within the Management, Business, Science and Arts occupations in Colorado County, the most male-oriented occupations are Architecture & Engineering (100.0%), Legal Services & Support (100.0%), and Computers & Mathematics (76.8%), while the most female-oriented occupations are Education Instruction & Library (94.6%), Arts, Media & Entertainment (87.0%), and Community & Social Service (77.4%).
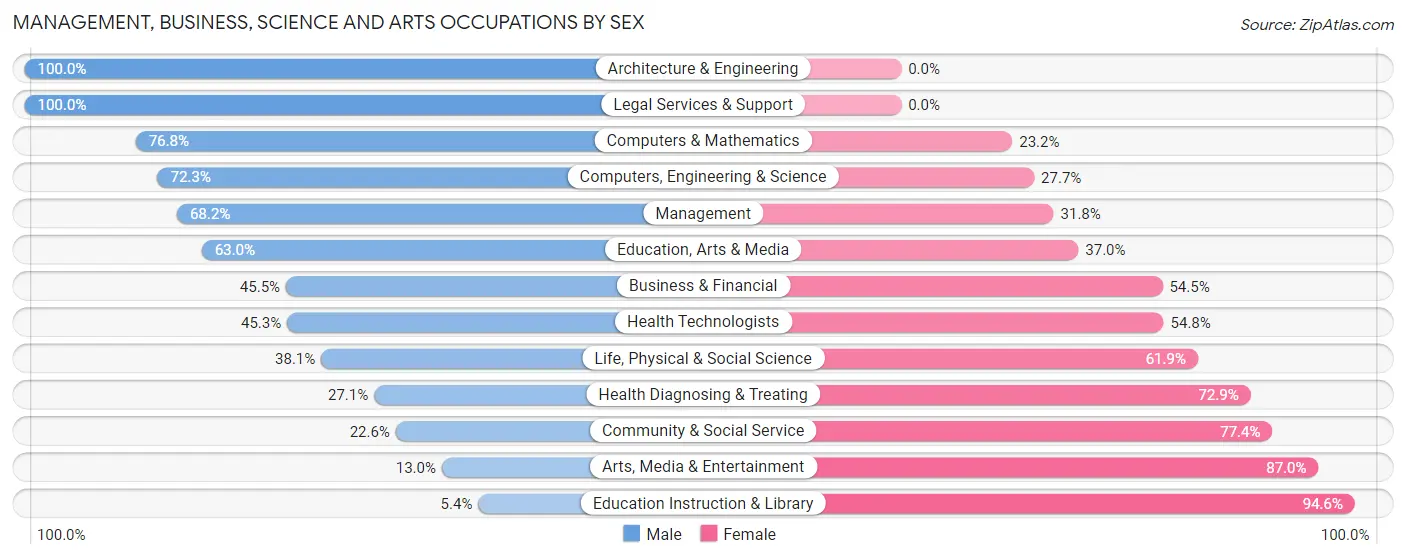
| Occupation | Male | Female |
| Management | 772 (68.2%) | 360 (31.8%) |
| Business & Financial | 121 (45.5%) | 145 (54.5%) |
| Computers, Engineering & Science | 198 (72.3%) | 76 (27.7%) |
| Computers & Mathematics | 53 (76.8%) | 16 (23.2%) |
| Architecture & Engineering | 108 (100.0%) | 0 (0.0%) |
| Life, Physical & Social Science | 37 (38.1%) | 60 (61.9%) |
| Community & Social Service | 197 (22.6%) | 675 (77.4%) |
| Education, Arts & Media | 116 (63.0%) | 68 (37.0%) |
| Legal Services & Support | 36 (100.0%) | 0 (0.0%) |
| Education Instruction & Library | 28 (5.4%) | 493 (94.6%) |
| Arts, Media & Entertainment | 17 (13.0%) | 114 (87.0%) |
| Health Diagnosing & Treating | 209 (27.1%) | 562 (72.9%) |
| Health Technologists | 119 (45.3%) | 144 (54.7%) |
| Total (Category) | 1,497 (45.2%) | 1,818 (54.8%) |
| Total (Overall) | 4,966 (56.2%) | 3,875 (43.8%) |
Services Occupations
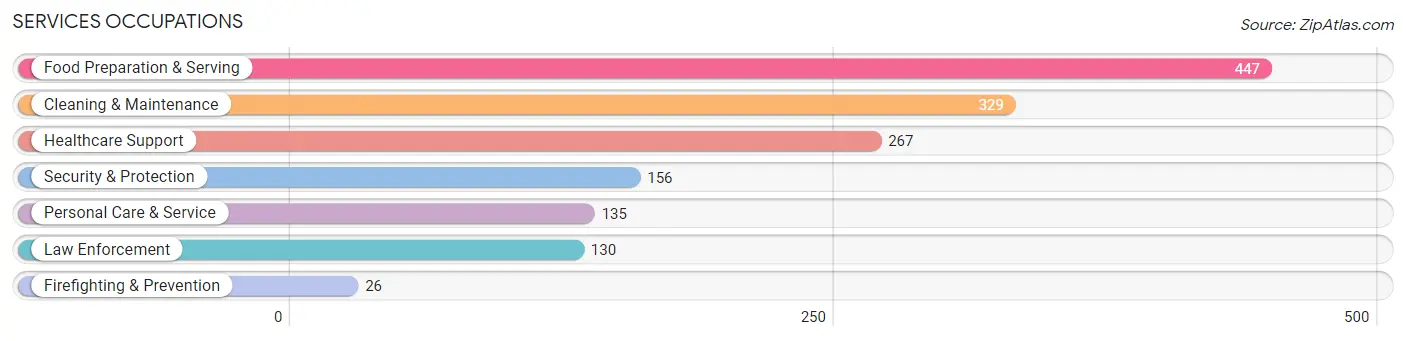
The most common Services occupations in Colorado County are Food Preparation & Serving (447 | 5.1%), Cleaning & Maintenance (329 | 3.7%), Healthcare Support (267 | 3.0%), Security & Protection (156 | 1.8%), and Personal Care & Service (135 | 1.5%).
Services Occupations by Sex
Within the Services occupations in Colorado County, the most male-oriented occupations are Firefighting & Prevention (100.0%), Cleaning & Maintenance (76.6%), and Security & Protection (44.2%), while the most female-oriented occupations are Personal Care & Service (100.0%), Healthcare Support (80.1%), and Food Preparation & Serving (68.9%).
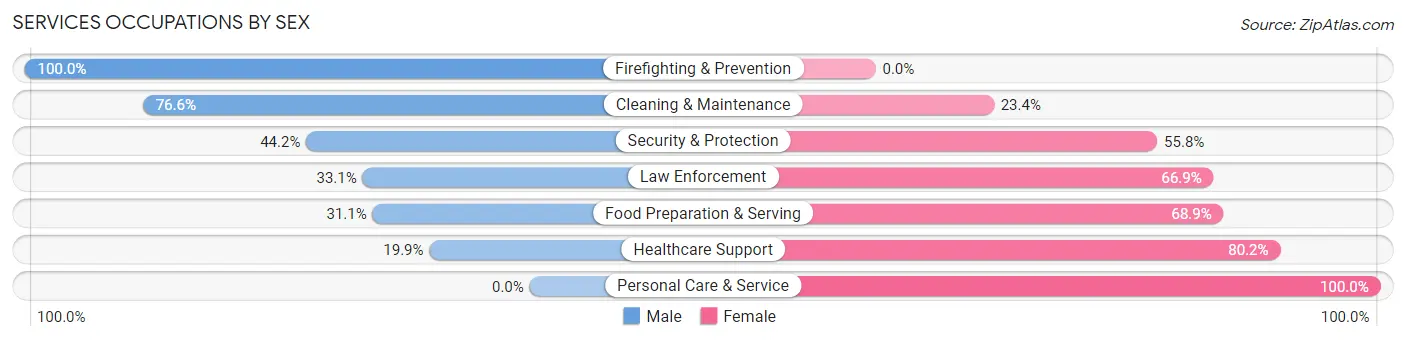
| Occupation | Male | Female |
| Healthcare Support | 53 (19.9%) | 214 (80.1%) |
| Security & Protection | 69 (44.2%) | 87 (55.8%) |
| Firefighting & Prevention | 26 (100.0%) | 0 (0.0%) |
| Law Enforcement | 43 (33.1%) | 87 (66.9%) |
| Food Preparation & Serving | 139 (31.1%) | 308 (68.9%) |
| Cleaning & Maintenance | 252 (76.6%) | 77 (23.4%) |
| Personal Care & Service | 0 (0.0%) | 135 (100.0%) |
| Total (Category) | 513 (38.5%) | 821 (61.5%) |
| Total (Overall) | 4,966 (56.2%) | 3,875 (43.8%) |
Sales and Office Occupations
The most common Sales and Office occupations in Colorado County are Sales & Related (1,053 | 11.9%), and Office & Administration (545 | 6.2%).

Sales and Office Occupations by Sex
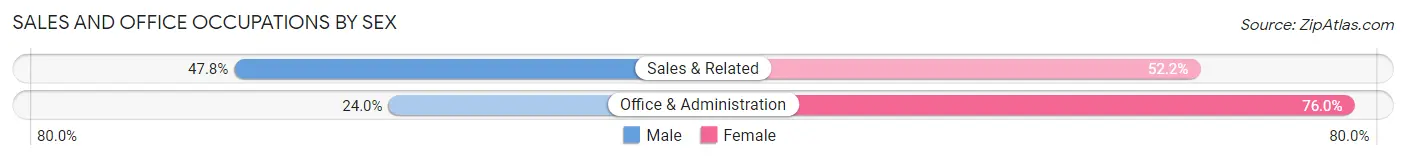
| Occupation | Male | Female |
| Sales & Related | 503 (47.8%) | 550 (52.2%) |
| Office & Administration | 131 (24.0%) | 414 (76.0%) |
| Total (Category) | 634 (39.7%) | 964 (60.3%) |
| Total (Overall) | 4,966 (56.2%) | 3,875 (43.8%) |
Natural Resources, Construction and Maintenance Occupations
The most common Natural Resources, Construction and Maintenance occupations in Colorado County are Construction & Extraction (653 | 7.4%), Installation, Maintenance & Repair (404 | 4.6%), and Farming, Fishing & Forestry (333 | 3.8%).
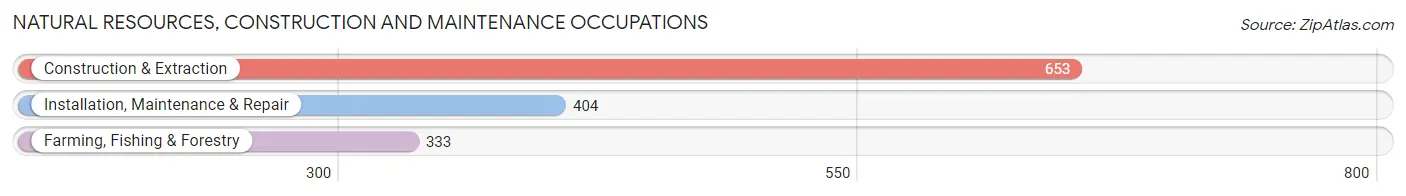
Natural Resources, Construction and Maintenance Occupations by Sex
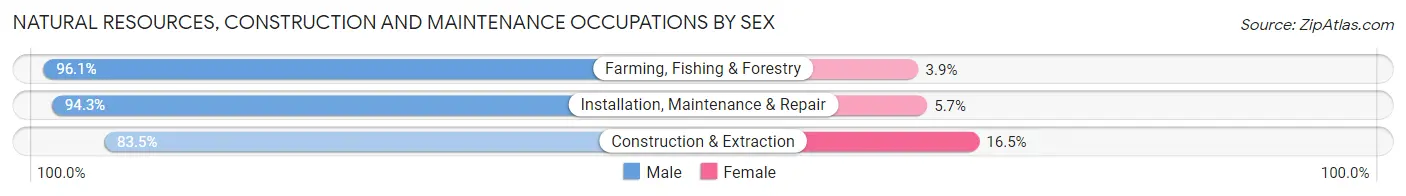
| Occupation | Male | Female |
| Farming, Fishing & Forestry | 320 (96.1%) | 13 (3.9%) |
| Construction & Extraction | 545 (83.5%) | 108 (16.5%) |
| Installation, Maintenance & Repair | 381 (94.3%) | 23 (5.7%) |
| Total (Category) | 1,246 (89.6%) | 144 (10.4%) |
| Total (Overall) | 4,966 (56.2%) | 3,875 (43.8%) |
Production, Transportation and Moving Occupations
The most common Production, Transportation and Moving occupations in Colorado County are Material Moving (477 | 5.4%), Production (389 | 4.4%), and Transportation (338 | 3.8%).
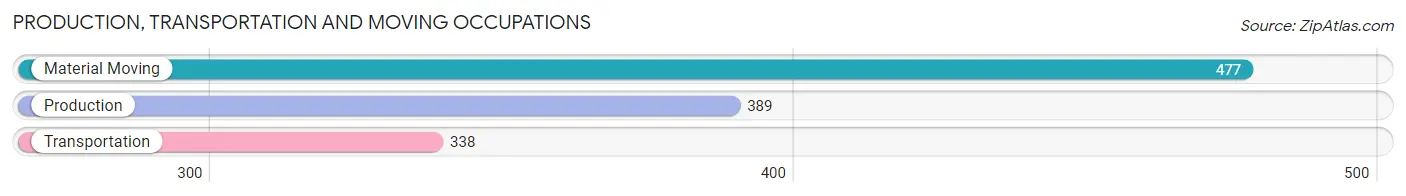
Production, Transportation and Moving Occupations by Sex
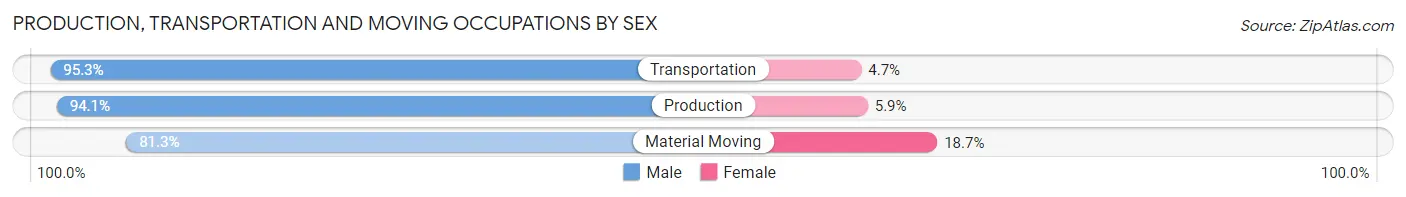
| Occupation | Male | Female |
| Production | 366 (94.1%) | 23 (5.9%) |
| Transportation | 322 (95.3%) | 16 (4.7%) |
| Material Moving | 388 (81.3%) | 89 (18.7%) |
| Total (Category) | 1,076 (89.4%) | 128 (10.6%) |
| Total (Overall) | 4,966 (56.2%) | 3,875 (43.8%) |
Employment Industries by Sex in Colorado County
Employment Industries in Colorado County
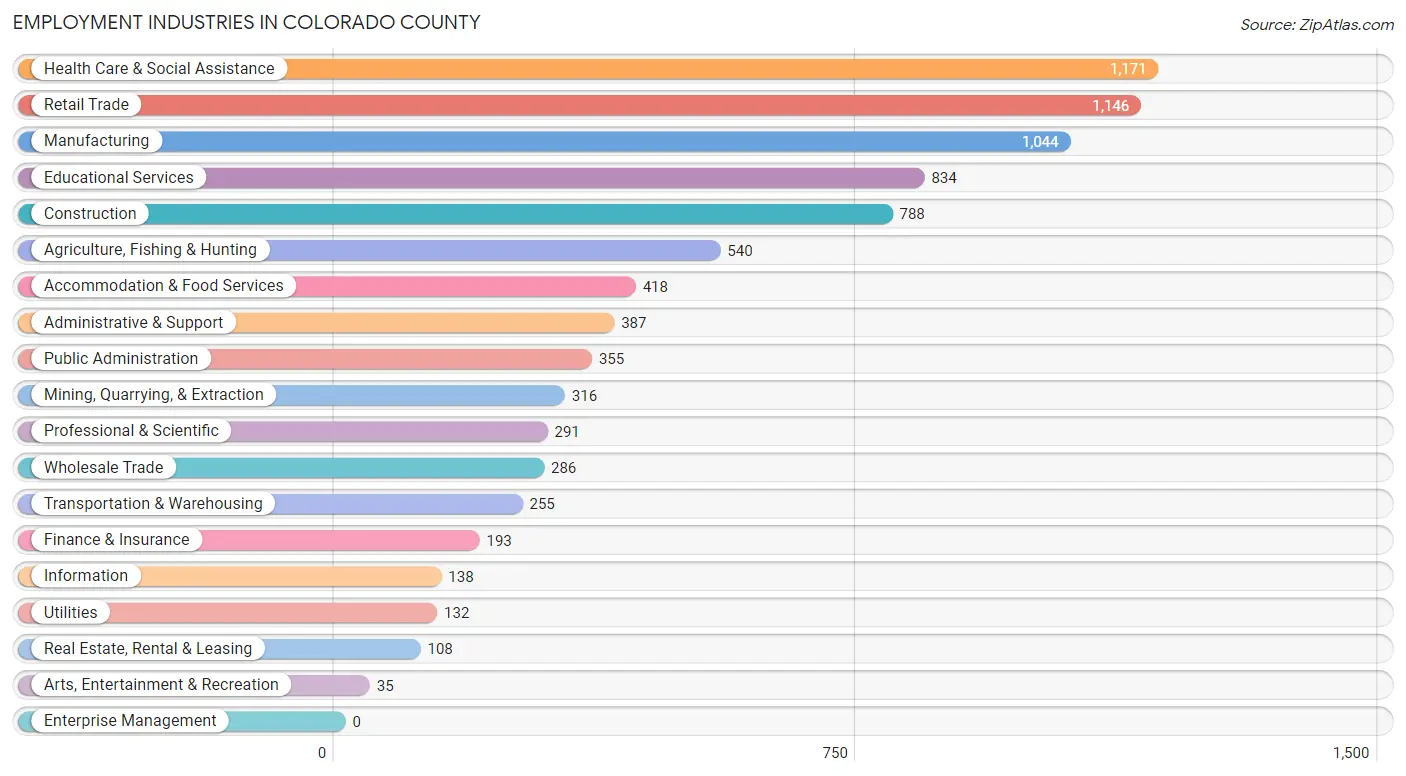
The major employment industries in Colorado County include Health Care & Social Assistance (1,171 | 13.3%), Retail Trade (1,146 | 13.0%), Manufacturing (1,044 | 11.8%), Educational Services (834 | 9.4%), and Construction (788 | 8.9%).
Employment Industries by Sex in Colorado County
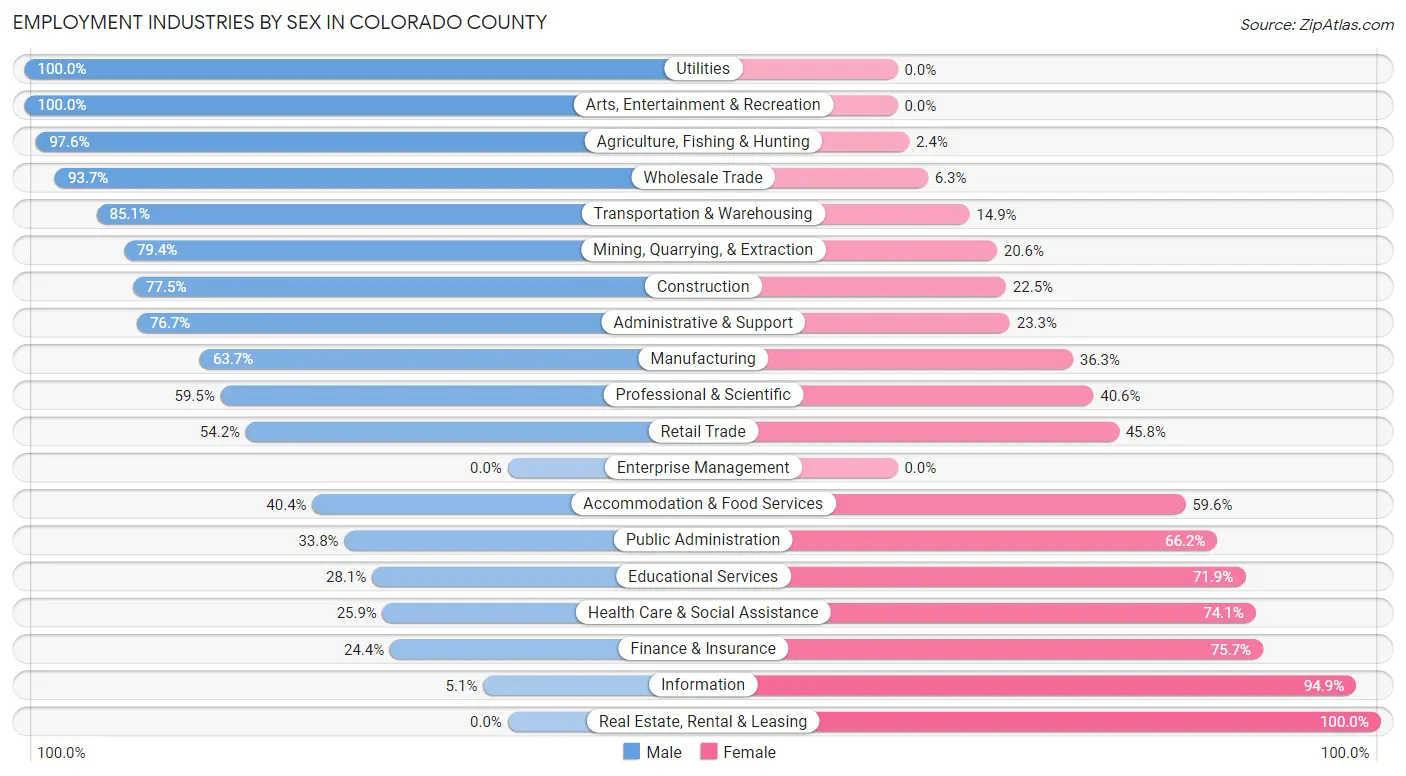
The Colorado County industries that see more men than women are Utilities (100.0%), Arts, Entertainment & Recreation (100.0%), and Agriculture, Fishing & Hunting (97.6%), whereas the industries that tend to have a higher number of women are Real Estate, Rental & Leasing (100.0%), Information (94.9%), and Finance & Insurance (75.6%).
| Industry | Male | Female |
| Agriculture, Fishing & Hunting | 527 (97.6%) | 13 (2.4%) |
| Mining, Quarrying, & Extraction | 251 (79.4%) | 65 (20.6%) |
| Construction | 611 (77.5%) | 177 (22.5%) |
| Manufacturing | 665 (63.7%) | 379 (36.3%) |
| Wholesale Trade | 268 (93.7%) | 18 (6.3%) |
| Retail Trade | 621 (54.2%) | 525 (45.8%) |
| Transportation & Warehousing | 217 (85.1%) | 38 (14.9%) |
| Utilities | 132 (100.0%) | 0 (0.0%) |
| Information | 7 (5.1%) | 131 (94.9%) |
| Finance & Insurance | 47 (24.3%) | 146 (75.6%) |
| Real Estate, Rental & Leasing | 0 (0.0%) | 108 (100.0%) |
| Professional & Scientific | 173 (59.5%) | 118 (40.6%) |
| Enterprise Management | 0 (0.0%) | 0 (0.0%) |
| Administrative & Support | 297 (76.7%) | 90 (23.3%) |
| Educational Services | 234 (28.1%) | 600 (71.9%) |
| Health Care & Social Assistance | 303 (25.9%) | 868 (74.1%) |
| Arts, Entertainment & Recreation | 35 (100.0%) | 0 (0.0%) |
| Accommodation & Food Services | 169 (40.4%) | 249 (59.6%) |
| Public Administration | 120 (33.8%) | 235 (66.2%) |
| Total | 4,966 (56.2%) | 3,875 (43.8%) |
Education in Colorado County
School Enrollment in Colorado County
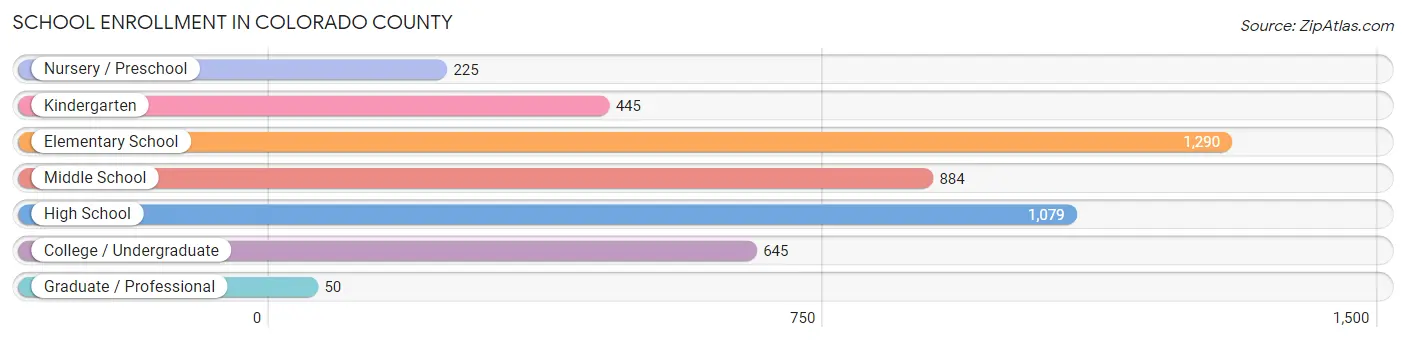
The most common levels of schooling among the 4,618 students in Colorado County are elementary school (1,290 | 27.9%), high school (1,079 | 23.4%), and middle school (884 | 19.1%).
| School Level | # Students | % Students |
| Nursery / Preschool | 225 | 4.9% |
| Kindergarten | 445 | 9.6% |
| Elementary School | 1,290 | 27.9% |
| Middle School | 884 | 19.1% |
| High School | 1,079 | 23.4% |
| College / Undergraduate | 645 | 14.0% |
| Graduate / Professional | 50 | 1.1% |
| Total | 4,618 | 100.0% |
School Enrollment by Age by Funding Source in Colorado County
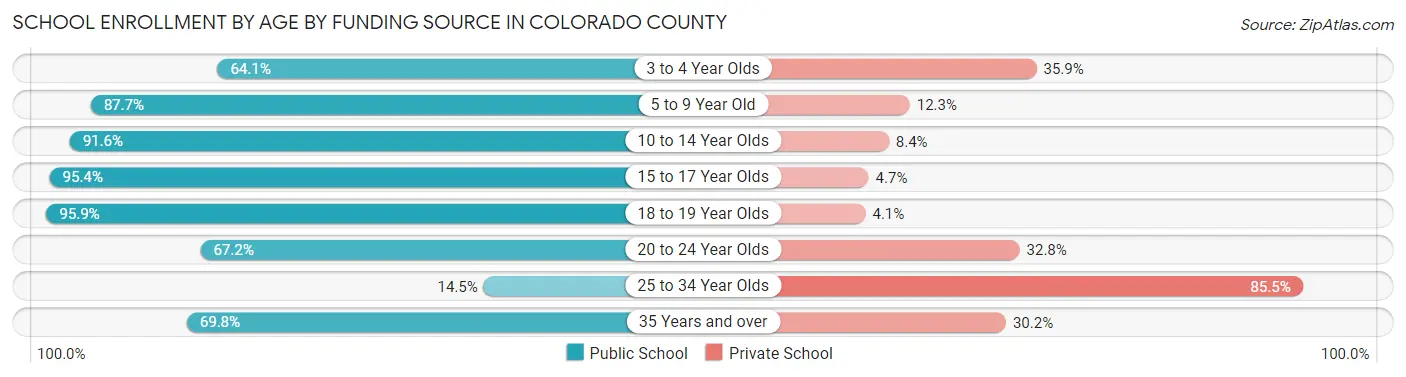
Out of a total of 4,618 students who are enrolled in schools in Colorado County, 577 (12.5%) attend a private institution, while the remaining 4,041 (87.5%) are enrolled in public schools. The age group of 25 to 34 year olds has the highest likelihood of being enrolled in private schools, with 53 (85.5% in the age bracket) enrolled. Conversely, the age group of 18 to 19 year olds has the lowest likelihood of being enrolled in a private school, with 542 (95.9% in the age bracket) attending a public institution.
| Age Bracket | Public School | Private School |
| 3 to 4 Year Olds | 107 (64.1%) | 60 (35.9%) |
| 5 to 9 Year Old | 1,438 (87.7%) | 202 (12.3%) |
| 10 to 14 Year Olds | 1,132 (91.6%) | 104 (8.4%) |
| 15 to 17 Year Olds | 595 (95.4%) | 29 (4.6%) |
| 18 to 19 Year Olds | 542 (95.9%) | 23 (4.1%) |
| 20 to 24 Year Olds | 160 (67.2%) | 78 (32.8%) |
| 25 to 34 Year Olds | 9 (14.5%) | 53 (85.5%) |
| 35 Years and over | 60 (69.8%) | 26 (30.2%) |
| Total | 4,041 (87.5%) | 577 (12.5%) |
Educational Attainment by Field of Study in Colorado County
Education (690 | 20.4%), bio, nature & agricultural (477 | 14.1%), business (472 | 14.0%), science & technology (292 | 8.6%), and arts & humanities (234 | 6.9%) are the most common fields of study among 3,375 individuals in Colorado County who have obtained a bachelor's degree or higher.
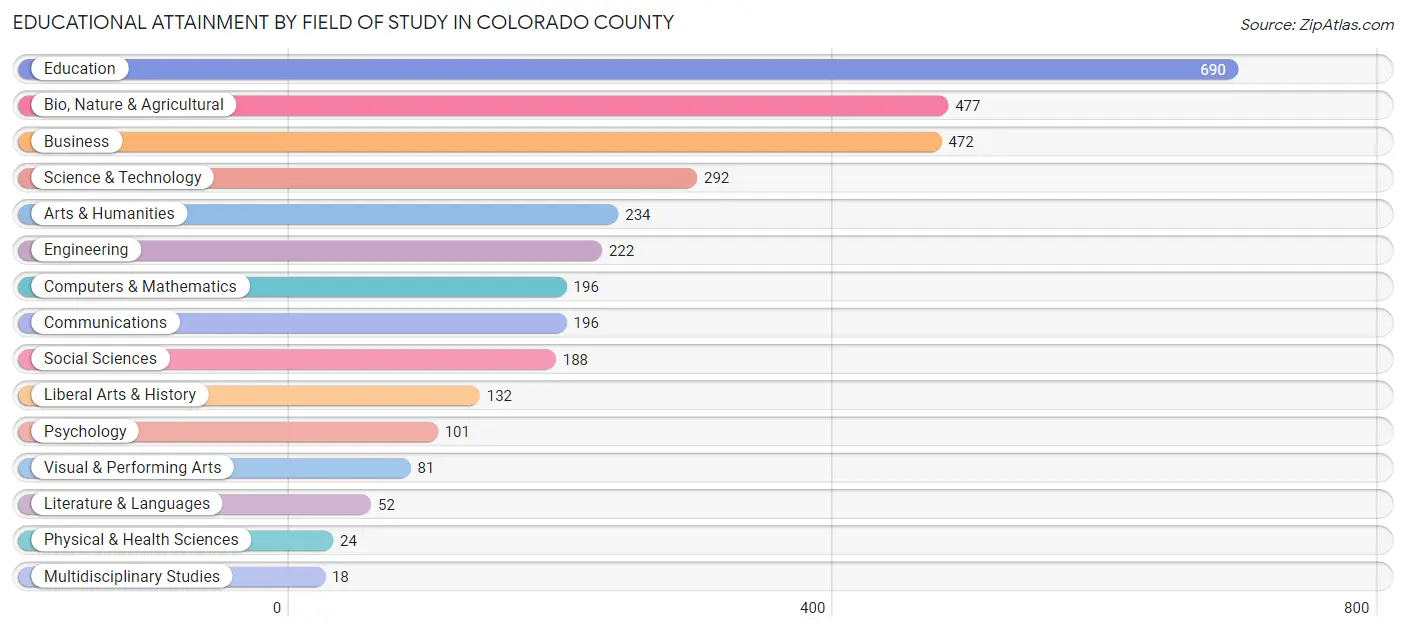
| Field of Study | # Graduates | % Graduates |
| Computers & Mathematics | 196 | 5.8% |
| Bio, Nature & Agricultural | 477 | 14.1% |
| Physical & Health Sciences | 24 | 0.7% |
| Psychology | 101 | 3.0% |
| Social Sciences | 188 | 5.6% |
| Engineering | 222 | 6.6% |
| Multidisciplinary Studies | 18 | 0.5% |
| Science & Technology | 292 | 8.6% |
| Business | 472 | 14.0% |
| Education | 690 | 20.4% |
| Literature & Languages | 52 | 1.5% |
| Liberal Arts & History | 132 | 3.9% |
| Visual & Performing Arts | 81 | 2.4% |
| Communications | 196 | 5.8% |
| Arts & Humanities | 234 | 6.9% |
| Total | 3,375 | 100.0% |
Transportation & Commute in Colorado County
Vehicle Availability by Sex in Colorado County
The most prevalent vehicle ownership categories in Colorado County are males with 2 vehicles (2,315, accounting for 46.8%) and females with 2 vehicles (1,928, making up 60.6%).
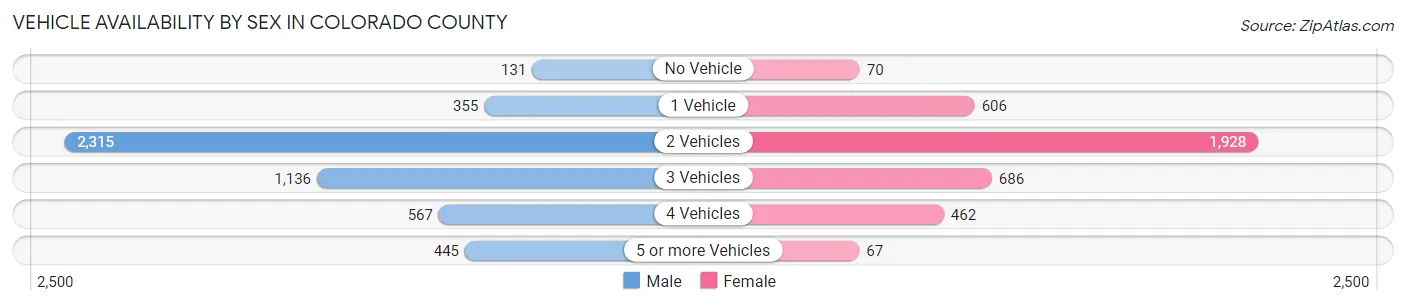
| Vehicles Available | Male | Female |
| No Vehicle | 131 (2.6%) | 70 (1.8%) |
| 1 Vehicle | 355 (7.2%) | 606 (15.9%) |
| 2 Vehicles | 2,315 (46.8%) | 1,928 (50.5%) |
| 3 Vehicles | 1,136 (23.0%) | 686 (18.0%) |
| 4 Vehicles | 567 (11.5%) | 462 (12.1%) |
| 5 or more Vehicles | 445 (9.0%) | 67 (1.8%) |
| Total | 4,949 (100.0%) | 3,819 (100.0%) |
Commute Time in Colorado County
The most frequently occuring commute durations in Colorado County are 5 to 9 minutes (1,843 commuters, 21.7%), 15 to 19 minutes (1,071 commuters, 12.6%), and 20 to 24 minutes (874 commuters, 10.3%).
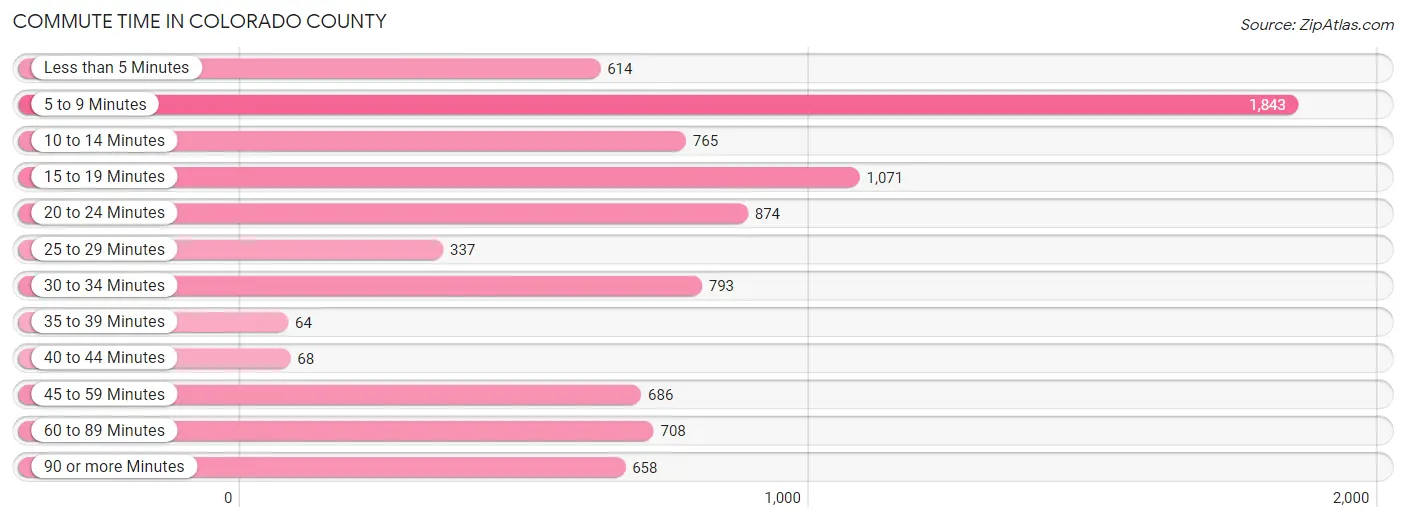
| Commute Time | # Commuters | % Commuters |
| Less than 5 Minutes | 614 | 7.2% |
| 5 to 9 Minutes | 1,843 | 21.7% |
| 10 to 14 Minutes | 765 | 9.0% |
| 15 to 19 Minutes | 1,071 | 12.6% |
| 20 to 24 Minutes | 874 | 10.3% |
| 25 to 29 Minutes | 337 | 4.0% |
| 30 to 34 Minutes | 793 | 9.3% |
| 35 to 39 Minutes | 64 | 0.7% |
| 40 to 44 Minutes | 68 | 0.8% |
| 45 to 59 Minutes | 686 | 8.1% |
| 60 to 89 Minutes | 708 | 8.4% |
| 90 or more Minutes | 658 | 7.8% |
Commute Time by Sex in Colorado County
The most common commute times in Colorado County are 5 to 9 minutes (931 commuters, 19.5%) for males and 5 to 9 minutes (912 commuters, 24.6%) for females.
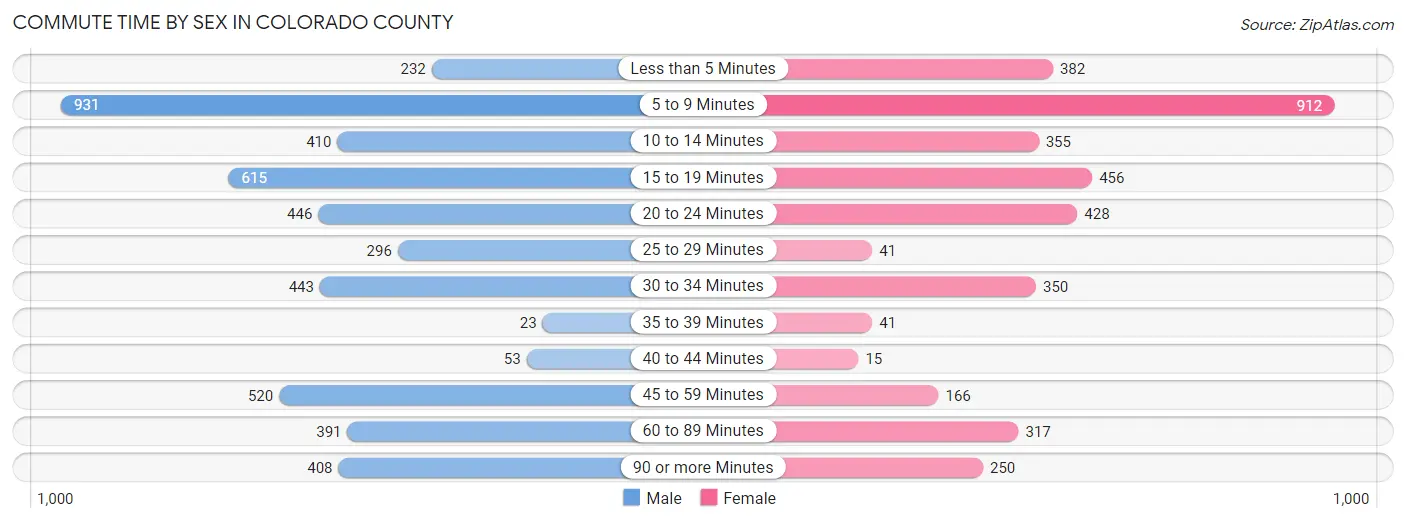
| Commute Time | Male | Female |
| Less than 5 Minutes | 232 (4.9%) | 382 (10.3%) |
| 5 to 9 Minutes | 931 (19.5%) | 912 (24.6%) |
| 10 to 14 Minutes | 410 (8.6%) | 355 (9.6%) |
| 15 to 19 Minutes | 615 (12.9%) | 456 (12.3%) |
| 20 to 24 Minutes | 446 (9.3%) | 428 (11.5%) |
| 25 to 29 Minutes | 296 (6.2%) | 41 (1.1%) |
| 30 to 34 Minutes | 443 (9.3%) | 350 (9.4%) |
| 35 to 39 Minutes | 23 (0.5%) | 41 (1.1%) |
| 40 to 44 Minutes | 53 (1.1%) | 15 (0.4%) |
| 45 to 59 Minutes | 520 (10.9%) | 166 (4.5%) |
| 60 to 89 Minutes | 391 (8.2%) | 317 (8.5%) |
| 90 or more Minutes | 408 (8.6%) | 250 (6.7%) |
Time of Departure to Work by Sex in Colorado County
The most frequent times of departure to work in Colorado County are 12:00 AM to 4:59 AM (671, 14.1%) for males and 7:30 AM to 7:59 AM (880, 23.7%) for females.
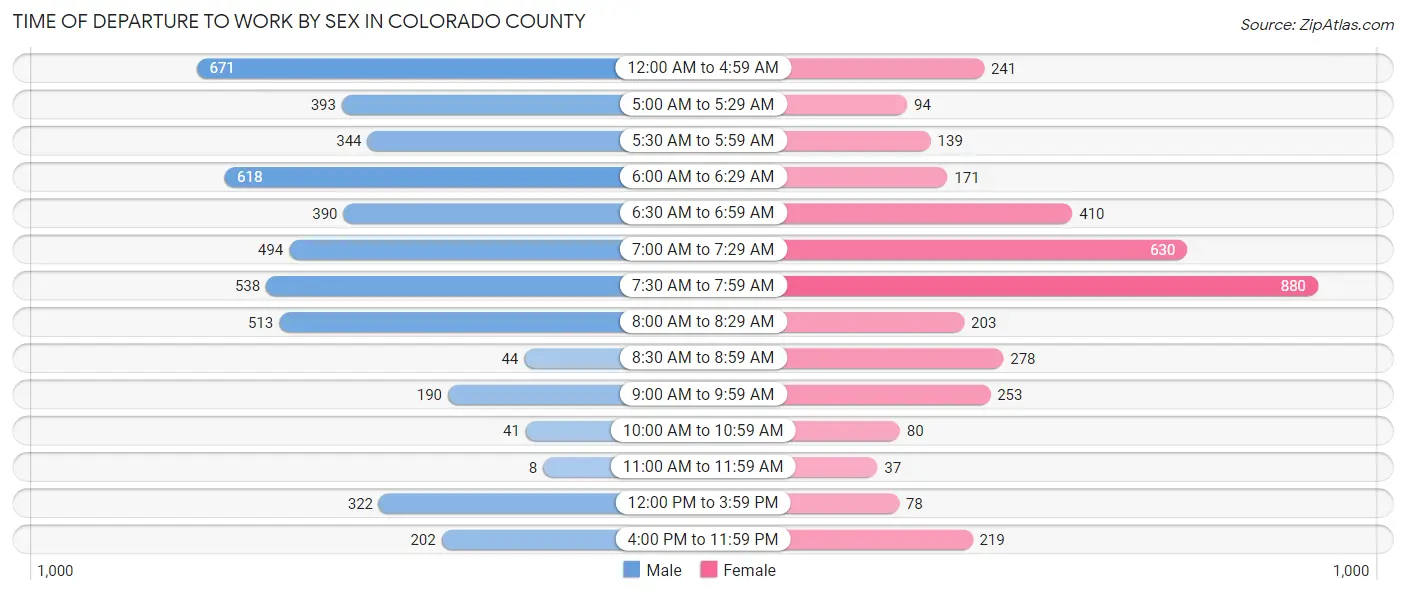
| Time of Departure | Male | Female |
| 12:00 AM to 4:59 AM | 671 (14.1%) | 241 (6.5%) |
| 5:00 AM to 5:29 AM | 393 (8.2%) | 94 (2.5%) |
| 5:30 AM to 5:59 AM | 344 (7.2%) | 139 (3.7%) |
| 6:00 AM to 6:29 AM | 618 (13.0%) | 171 (4.6%) |
| 6:30 AM to 6:59 AM | 390 (8.2%) | 410 (11.0%) |
| 7:00 AM to 7:29 AM | 494 (10.4%) | 630 (17.0%) |
| 7:30 AM to 7:59 AM | 538 (11.3%) | 880 (23.7%) |
| 8:00 AM to 8:29 AM | 513 (10.8%) | 203 (5.5%) |
| 8:30 AM to 8:59 AM | 44 (0.9%) | 278 (7.5%) |
| 9:00 AM to 9:59 AM | 190 (4.0%) | 253 (6.8%) |
| 10:00 AM to 10:59 AM | 41 (0.9%) | 80 (2.1%) |
| 11:00 AM to 11:59 AM | 8 (0.2%) | 37 (1.0%) |
| 12:00 PM to 3:59 PM | 322 (6.8%) | 78 (2.1%) |
| 4:00 PM to 11:59 PM | 202 (4.2%) | 219 (5.9%) |
| Total | 4,768 (100.0%) | 3,713 (100.0%) |
Housing Occupancy in Colorado County
Occupancy by Ownership in Colorado County
Of the total 7,376 dwellings in Colorado County, owner-occupied units account for 6,061 (82.2%), while renter-occupied units make up 1,315 (17.8%).
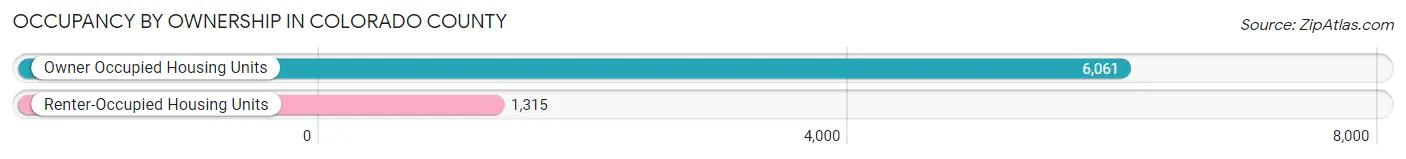
| Occupancy | # Housing Units | % Housing Units |
| Owner Occupied Housing Units | 6,061 | 82.2% |
| Renter-Occupied Housing Units | 1,315 | 17.8% |
| Total Occupied Housing Units | 7,376 | 100.0% |
Occupancy by Household Size in Colorado County
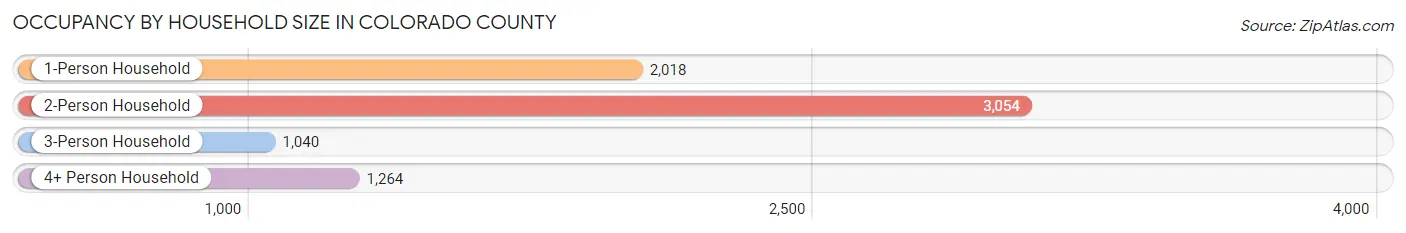
| Household Size | # Housing Units | % Housing Units |
| 1-Person Household | 2,018 | 27.4% |
| 2-Person Household | 3,054 | 41.4% |
| 3-Person Household | 1,040 | 14.1% |
| 4+ Person Household | 1,264 | 17.1% |
| Total Housing Units | 7,376 | 100.0% |
Occupancy by Ownership by Household Size in Colorado County
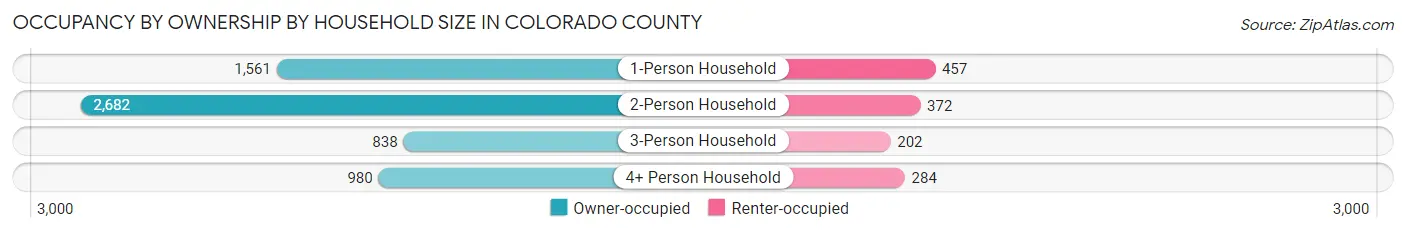
| Household Size | Owner-occupied | Renter-occupied |
| 1-Person Household | 1,561 (77.3%) | 457 (22.7%) |
| 2-Person Household | 2,682 (87.8%) | 372 (12.2%) |
| 3-Person Household | 838 (80.6%) | 202 (19.4%) |
| 4+ Person Household | 980 (77.5%) | 284 (22.5%) |
| Total Housing Units | 6,061 (82.2%) | 1,315 (17.8%) |
Occupancy by Educational Attainment in Colorado County
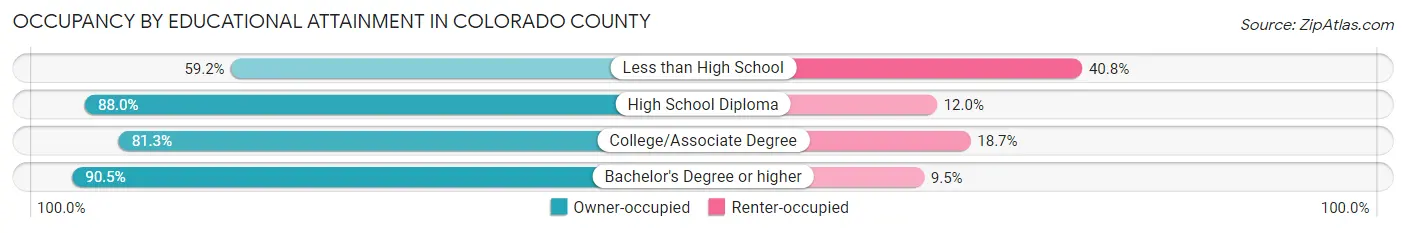
| Household Size | Owner-occupied | Renter-occupied |
| Less than High School | 657 (59.2%) | 453 (40.8%) |
| High School Diploma | 2,140 (88.0%) | 292 (12.0%) |
| College/Associate Degree | 1,829 (81.3%) | 420 (18.7%) |
| Bachelor's Degree or higher | 1,435 (90.5%) | 150 (9.5%) |
Occupancy by Age of Householder in Colorado County
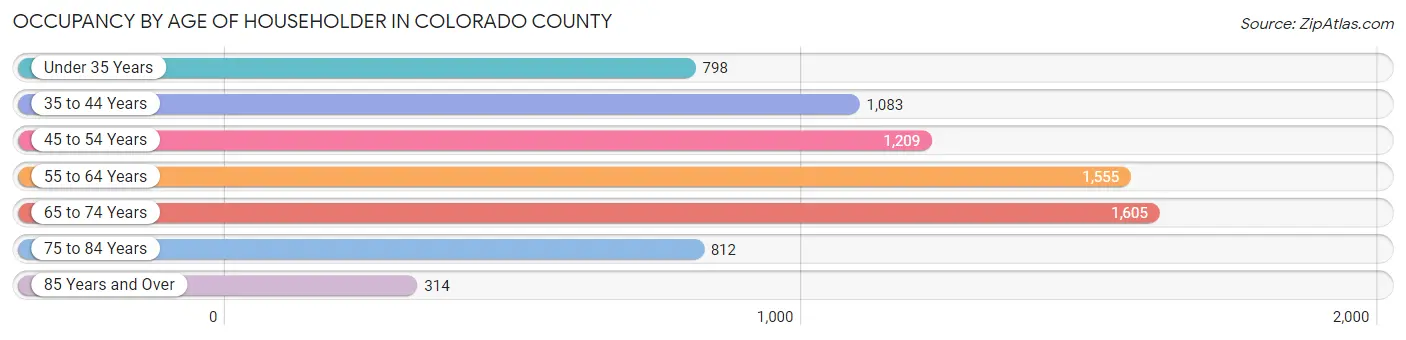
| Age Bracket | # Households | % Households |
| Under 35 Years | 798 | 10.8% |
| 35 to 44 Years | 1,083 | 14.7% |
| 45 to 54 Years | 1,209 | 16.4% |
| 55 to 64 Years | 1,555 | 21.1% |
| 65 to 74 Years | 1,605 | 21.8% |
| 75 to 84 Years | 812 | 11.0% |
| 85 Years and Over | 314 | 4.3% |
| Total | 7,376 | 100.0% |
Housing Finances in Colorado County
Median Income by Occupancy in Colorado County
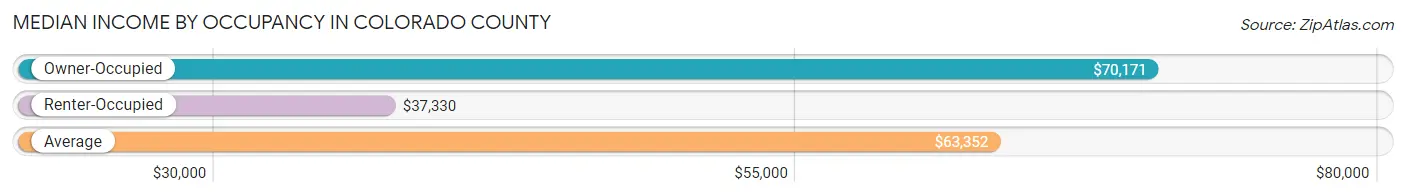
| Occupancy Type | # Households | Median Income |
| Owner-Occupied | 6,061 (82.2%) | $70,171 |
| Renter-Occupied | 1,315 (17.8%) | $37,330 |
| Average | 7,376 (100.0%) | $63,352 |
Occupancy by Householder Income Bracket in Colorado County
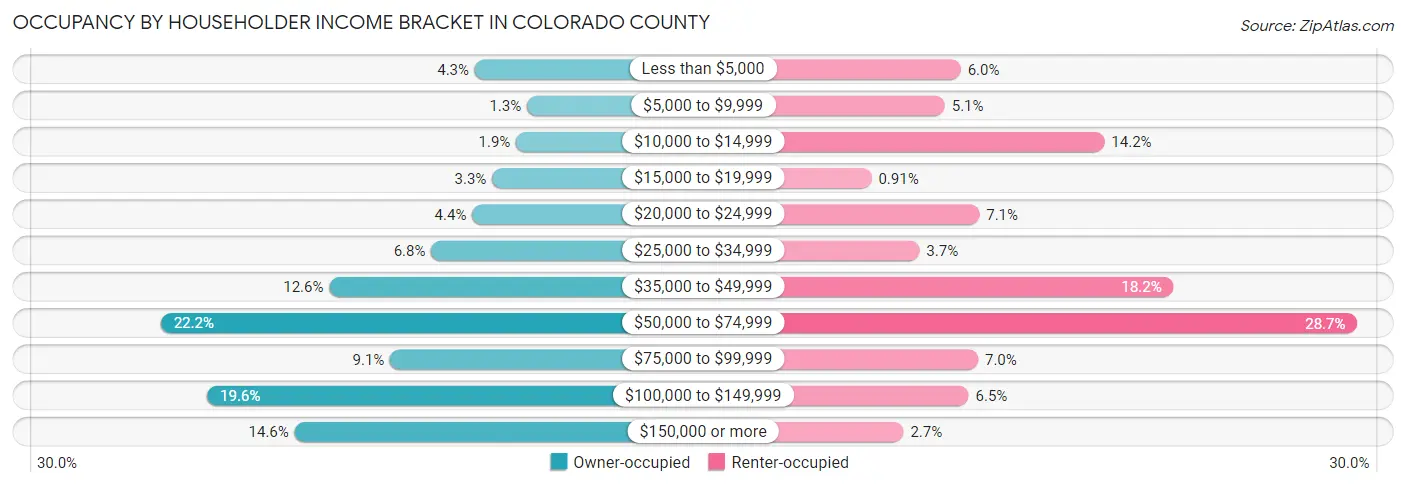
| Income Bracket | Owner-occupied | Renter-occupied |
| Less than $5,000 | 259 (4.3%) | 79 (6.0%) |
| $5,000 to $9,999 | 78 (1.3%) | 67 (5.1%) |
| $10,000 to $14,999 | 116 (1.9%) | 187 (14.2%) |
| $15,000 to $19,999 | 199 (3.3%) | 12 (0.9%) |
| $20,000 to $24,999 | 268 (4.4%) | 93 (7.1%) |
| $25,000 to $34,999 | 410 (6.8%) | 48 (3.6%) |
| $35,000 to $49,999 | 763 (12.6%) | 239 (18.2%) |
| $50,000 to $74,999 | 1,347 (22.2%) | 377 (28.7%) |
| $75,000 to $99,999 | 552 (9.1%) | 92 (7.0%) |
| $100,000 to $149,999 | 1,186 (19.6%) | 85 (6.5%) |
| $150,000 or more | 883 (14.6%) | 36 (2.7%) |
| Total | 6,061 (100.0%) | 1,315 (100.0%) |
Monthly Housing Cost Tiers in Colorado County
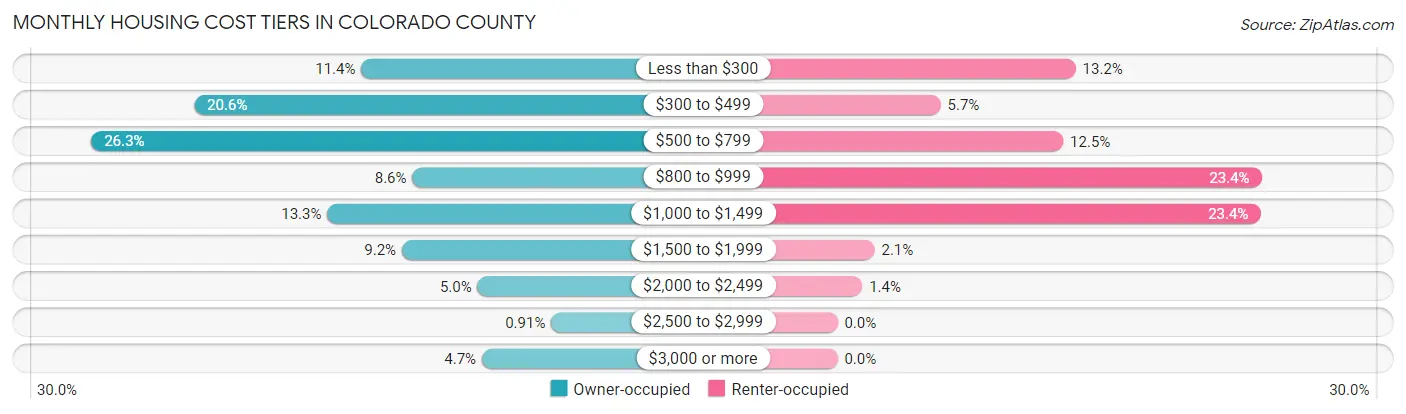
| Monthly Cost | Owner-occupied | Renter-occupied |
| Less than $300 | 691 (11.4%) | 173 (13.2%) |
| $300 to $499 | 1,251 (20.6%) | 75 (5.7%) |
| $500 to $799 | 1,595 (26.3%) | 164 (12.5%) |
| $800 to $999 | 520 (8.6%) | 308 (23.4%) |
| $1,000 to $1,499 | 805 (13.3%) | 307 (23.4%) |
| $1,500 to $1,999 | 555 (9.2%) | 27 (2.1%) |
| $2,000 to $2,499 | 302 (5.0%) | 18 (1.4%) |
| $2,500 to $2,999 | 55 (0.9%) | 0 (0.0%) |
| $3,000 or more | 287 (4.7%) | 0 (0.0%) |
| Total | 6,061 (100.0%) | 1,315 (100.0%) |
Physical Housing Characteristics in Colorado County
Housing Structures in Colorado County
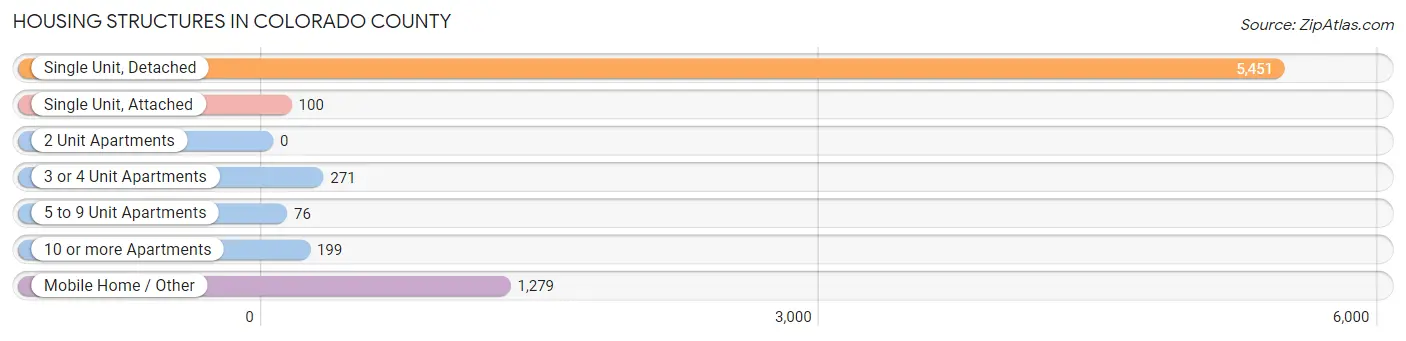
| Structure Type | # Housing Units | % Housing Units |
| Single Unit, Detached | 5,451 | 73.9% |
| Single Unit, Attached | 100 | 1.4% |
| 2 Unit Apartments | 0 | 0.0% |
| 3 or 4 Unit Apartments | 271 | 3.7% |
| 5 to 9 Unit Apartments | 76 | 1.0% |
| 10 or more Apartments | 199 | 2.7% |
| Mobile Home / Other | 1,279 | 17.3% |
| Total | 7,376 | 100.0% |
Housing Structures by Occupancy in Colorado County
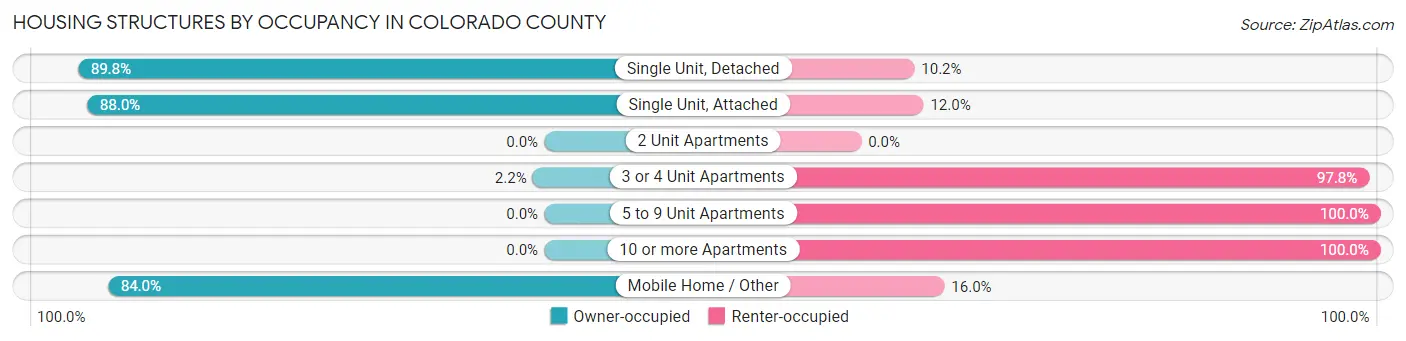
| Structure Type | Owner-occupied | Renter-occupied |
| Single Unit, Detached | 4,893 (89.8%) | 558 (10.2%) |
| Single Unit, Attached | 88 (88.0%) | 12 (12.0%) |
| 2 Unit Apartments | 0 (0.0%) | 0 (0.0%) |
| 3 or 4 Unit Apartments | 6 (2.2%) | 265 (97.8%) |
| 5 to 9 Unit Apartments | 0 (0.0%) | 76 (100.0%) |
| 10 or more Apartments | 0 (0.0%) | 199 (100.0%) |
| Mobile Home / Other | 1,074 (84.0%) | 205 (16.0%) |
| Total | 6,061 (82.2%) | 1,315 (17.8%) |
Housing Structures by Number of Rooms in Colorado County
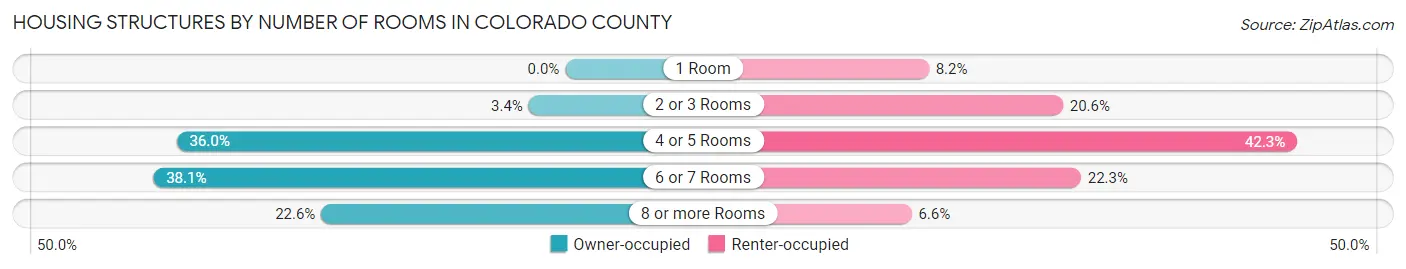
| Number of Rooms | Owner-occupied | Renter-occupied |
| 1 Room | 0 (0.0%) | 108 (8.2%) |
| 2 or 3 Rooms | 205 (3.4%) | 271 (20.6%) |
| 4 or 5 Rooms | 2,179 (35.9%) | 556 (42.3%) |
| 6 or 7 Rooms | 2,309 (38.1%) | 293 (22.3%) |
| 8 or more Rooms | 1,368 (22.6%) | 87 (6.6%) |
| Total | 6,061 (100.0%) | 1,315 (100.0%) |
Housing Structure by Heating Type in Colorado County

| Heating Type | Owner-occupied | Renter-occupied |
| Utility Gas | 1,283 (21.2%) | 217 (16.5%) |
| Bottled, Tank, or LP Gas | 938 (15.5%) | 189 (14.4%) |
| Electricity | 3,610 (59.6%) | 909 (69.1%) |
| Fuel Oil or Kerosene | 0 (0.0%) | 0 (0.0%) |
| Coal or Coke | 51 (0.8%) | 0 (0.0%) |
| All other Fuels | 179 (2.9%) | 0 (0.0%) |
| No Fuel Used | 0 (0.0%) | 0 (0.0%) |
| Total | 6,061 (100.0%) | 1,315 (100.0%) |
Household Vehicle Usage in Colorado County
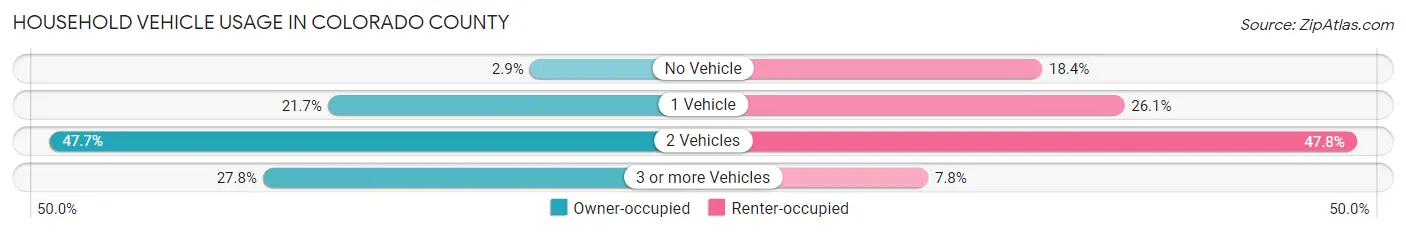
| Vehicles per Household | Owner-occupied | Renter-occupied |
| No Vehicle | 174 (2.9%) | 242 (18.4%) |
| 1 Vehicle | 1,315 (21.7%) | 343 (26.1%) |
| 2 Vehicles | 2,889 (47.7%) | 628 (47.8%) |
| 3 or more Vehicles | 1,683 (27.8%) | 102 (7.8%) |
| Total | 6,061 (100.0%) | 1,315 (100.0%) |
Real Estate & Mortgages in Colorado County
Real Estate and Mortgage Overview in Colorado County
| Characteristic | Without Mortgage | With Mortgage |
| Housing Units | 4,034 | 2,027 |
| Median Property Value | $154,000 | $198,800 |
| Median Household Income | $64,167 | $291 |
| Monthly Housing Costs | $517 | $274 |
| Real Estate Taxes | $1,978 | $26 |
Property Value by Mortgage Status in Colorado County
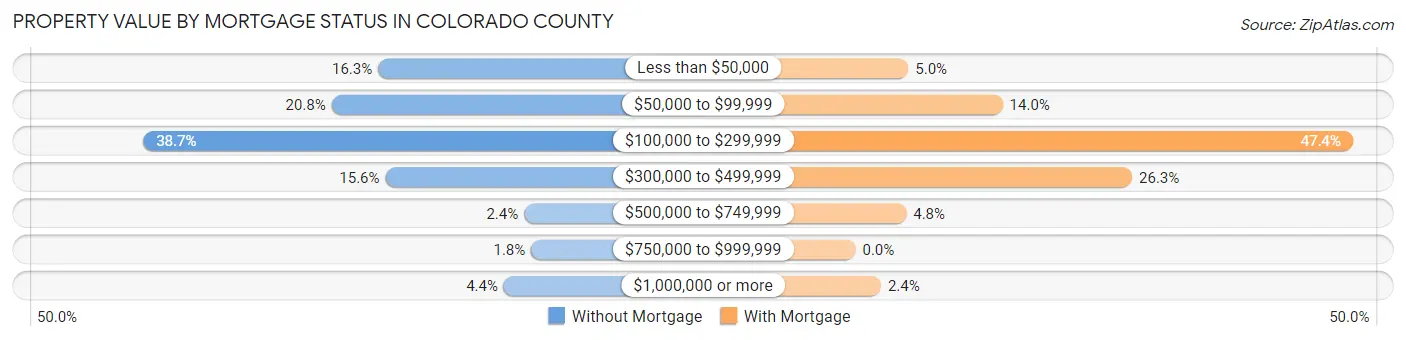
| Property Value | Without Mortgage | With Mortgage |
| Less than $50,000 | 659 (16.3%) | 102 (5.0%) |
| $50,000 to $99,999 | 838 (20.8%) | 284 (14.0%) |
| $100,000 to $299,999 | 1,561 (38.7%) | 960 (47.4%) |
| $300,000 to $499,999 | 631 (15.6%) | 534 (26.3%) |
| $500,000 to $749,999 | 98 (2.4%) | 98 (4.8%) |
| $750,000 to $999,999 | 71 (1.8%) | 0 (0.0%) |
| $1,000,000 or more | 176 (4.4%) | 49 (2.4%) |
| Total | 4,034 (100.0%) | 2,027 (100.0%) |
Household Income by Mortgage Status in Colorado County
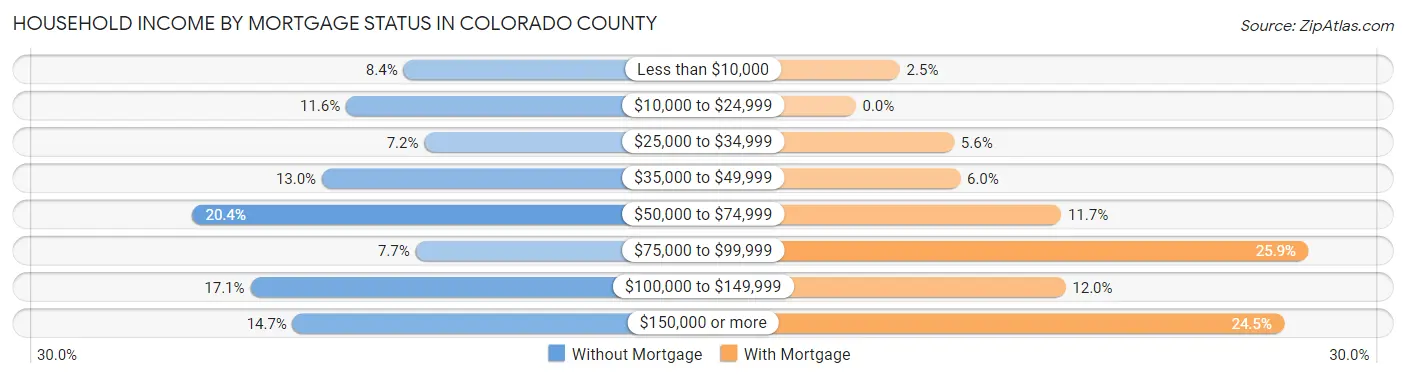
| Household Income | Without Mortgage | With Mortgage |
| Less than $10,000 | 337 (8.4%) | 51 (2.5%) |
| $10,000 to $24,999 | 469 (11.6%) | 0 (0.0%) |
| $25,000 to $34,999 | 289 (7.2%) | 114 (5.6%) |
| $35,000 to $49,999 | 525 (13.0%) | 121 (6.0%) |
| $50,000 to $74,999 | 823 (20.4%) | 238 (11.7%) |
| $75,000 to $99,999 | 309 (7.7%) | 524 (25.9%) |
| $100,000 to $149,999 | 690 (17.1%) | 243 (12.0%) |
| $150,000 or more | 592 (14.7%) | 496 (24.5%) |
| Total | 4,034 (100.0%) | 2,027 (100.0%) |
Property Value to Household Income Ratio in Colorado County
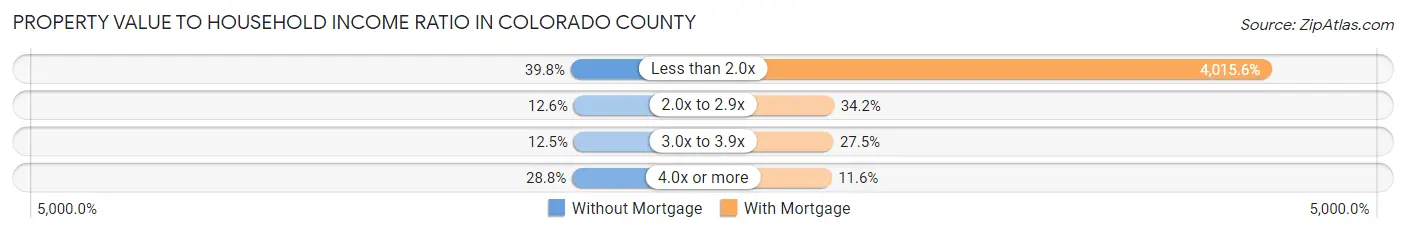
| Value-to-Income Ratio | Without Mortgage | With Mortgage |
| Less than 2.0x | 1,604 (39.8%) | 81,397 (4,015.6%) |
| 2.0x to 2.9x | 507 (12.6%) | 693 (34.2%) |
| 3.0x to 3.9x | 504 (12.5%) | 557 (27.5%) |
| 4.0x or more | 1,160 (28.8%) | 235 (11.6%) |
| Total | 4,034 (100.0%) | 2,027 (100.0%) |
Real Estate Taxes by Mortgage Status in Colorado County

| Property Taxes | Without Mortgage | With Mortgage |
| Less than $800 | 918 (22.8%) | 0 (0.0%) |
| $800 to $1,499 | 655 (16.2%) | 260 (12.8%) |
| $800 to $1,499 | 2,055 (50.9%) | 255 (12.6%) |
| Total | 4,034 (100.0%) | 2,027 (100.0%) |
Health & Disability in Colorado County
Health Insurance Coverage by Age in Colorado County
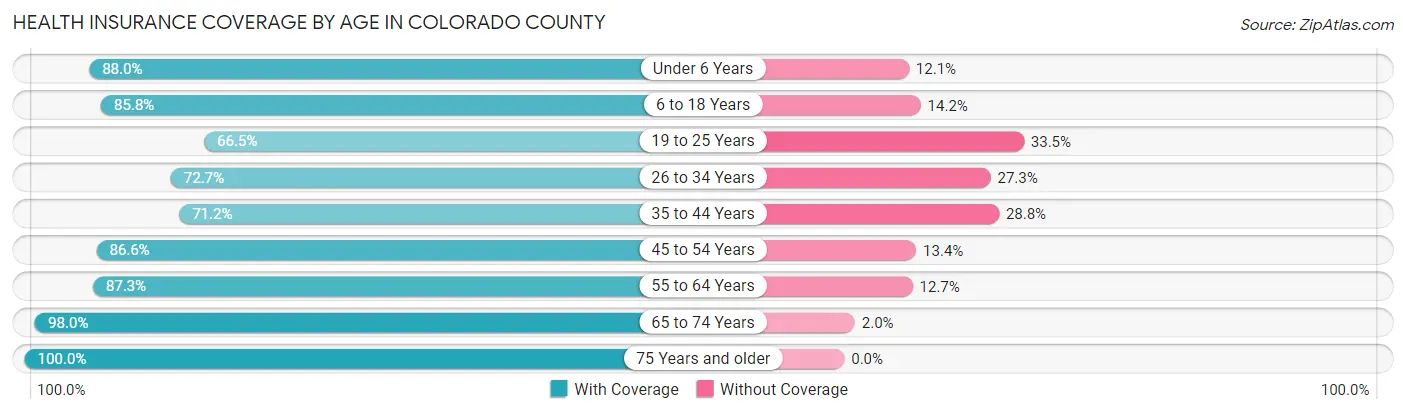
| Age Bracket | With Coverage | Without Coverage |
| Under 6 Years | 1,306 (87.9%) | 179 (12.0%) |
| 6 to 18 Years | 3,253 (85.8%) | 540 (14.2%) |
| 19 to 25 Years | 1,087 (66.5%) | 547 (33.5%) |
| 26 to 34 Years | 1,298 (72.7%) | 487 (27.3%) |
| 35 to 44 Years | 1,335 (71.2%) | 541 (28.8%) |
| 45 to 54 Years | 2,094 (86.6%) | 324 (13.4%) |
| 55 to 64 Years | 2,540 (87.3%) | 371 (12.7%) |
| 65 to 74 Years | 2,538 (98.0%) | 51 (2.0%) |
| 75 Years and older | 1,754 (100.0%) | 0 (0.0%) |
| Total | 17,205 (85.0%) | 3,040 (15.0%) |
Health Insurance Coverage by Citizenship Status in Colorado County
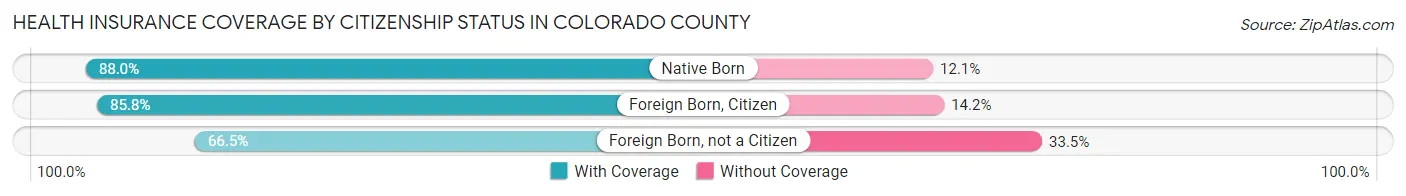
| Citizenship Status | With Coverage | Without Coverage |
| Native Born | 1,306 (87.9%) | 179 (12.0%) |
| Foreign Born, Citizen | 3,253 (85.8%) | 540 (14.2%) |
| Foreign Born, not a Citizen | 1,087 (66.5%) | 547 (33.5%) |
Health Insurance Coverage by Household Income in Colorado County
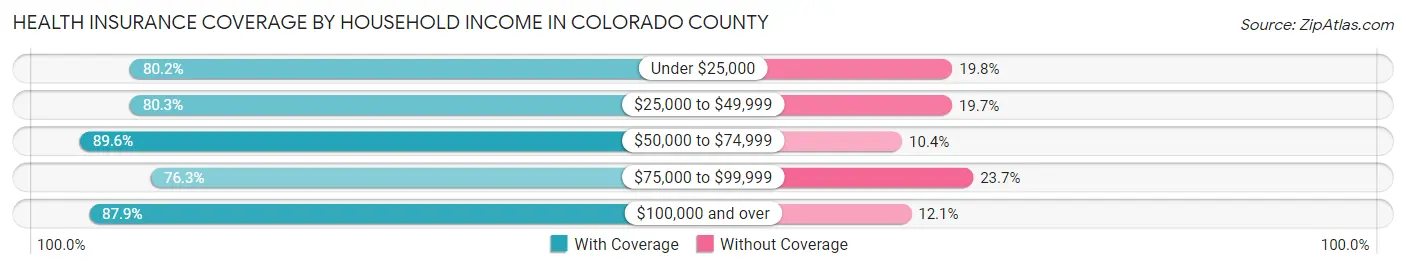
| Household Income | With Coverage | Without Coverage |
| Under $25,000 | 1,590 (80.2%) | 392 (19.8%) |
| $25,000 to $49,999 | 2,946 (80.3%) | 723 (19.7%) |
| $50,000 to $74,999 | 4,387 (89.6%) | 507 (10.4%) |
| $75,000 to $99,999 | 1,607 (76.3%) | 499 (23.7%) |
| $100,000 and over | 6,658 (87.9%) | 916 (12.1%) |
Public vs Private Health Insurance Coverage by Age in Colorado County
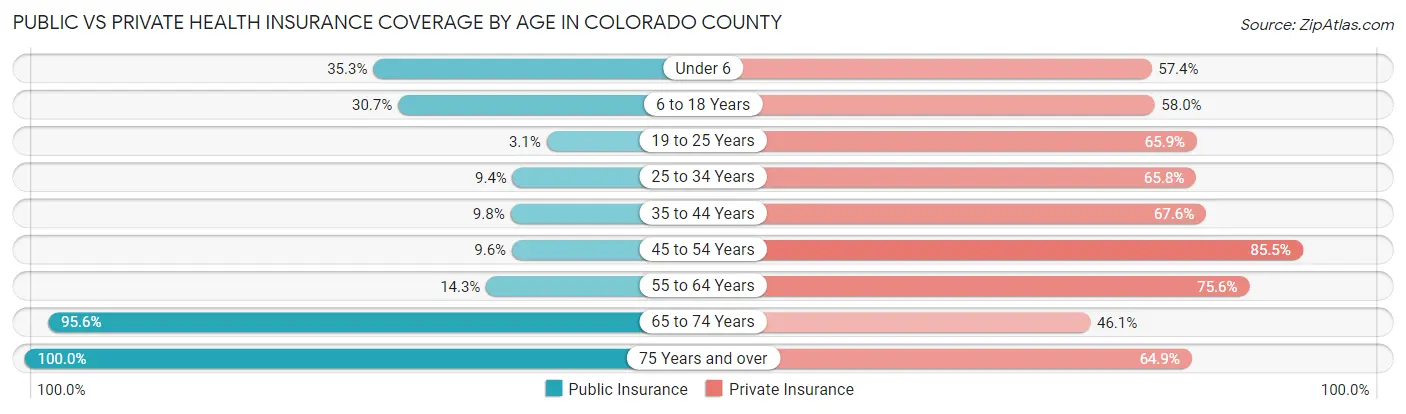
| Age Bracket | Public Insurance | Private Insurance |
| Under 6 | 524 (35.3%) | 853 (57.4%) |
| 6 to 18 Years | 1,164 (30.7%) | 2,201 (58.0%) |
| 19 to 25 Years | 51 (3.1%) | 1,077 (65.9%) |
| 25 to 34 Years | 168 (9.4%) | 1,174 (65.8%) |
| 35 to 44 Years | 184 (9.8%) | 1,268 (67.6%) |
| 45 to 54 Years | 231 (9.6%) | 2,068 (85.5%) |
| 55 to 64 Years | 417 (14.3%) | 2,202 (75.6%) |
| 65 to 74 Years | 2,476 (95.6%) | 1,193 (46.1%) |
| 75 Years and over | 1,754 (100.0%) | 1,139 (64.9%) |
| Total | 6,969 (34.4%) | 13,175 (65.1%) |
Disability Status by Sex by Age in Colorado County
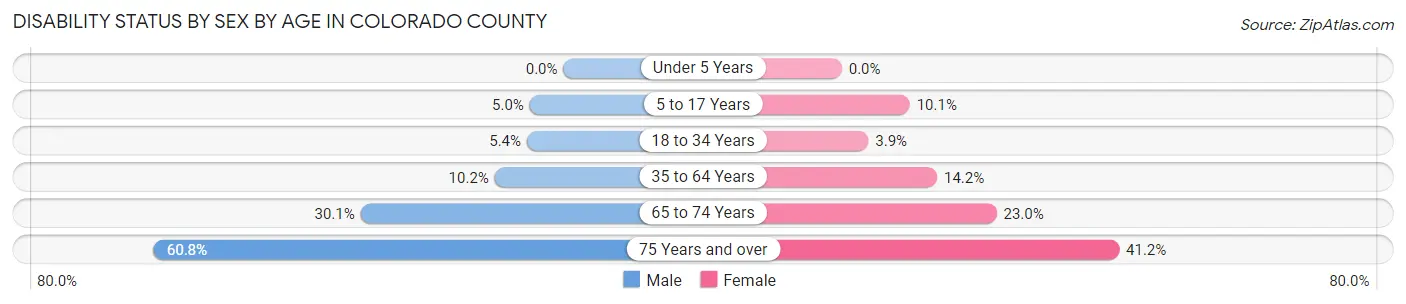
| Age Bracket | Male | Female |
| Under 5 Years | 0 (0.0%) | 0 (0.0%) |
| 5 to 17 Years | 96 (5.0%) | 164 (10.1%) |
| 18 to 34 Years | 111 (5.4%) | 73 (3.9%) |
| 35 to 64 Years | 373 (10.2%) | 502 (14.1%) |
| 65 to 74 Years | 384 (30.1%) | 302 (23.0%) |
| 75 Years and over | 470 (60.8%) | 404 (41.2%) |
Disability Class by Sex by Age in Colorado County
Disability Class: Hearing Difficulty
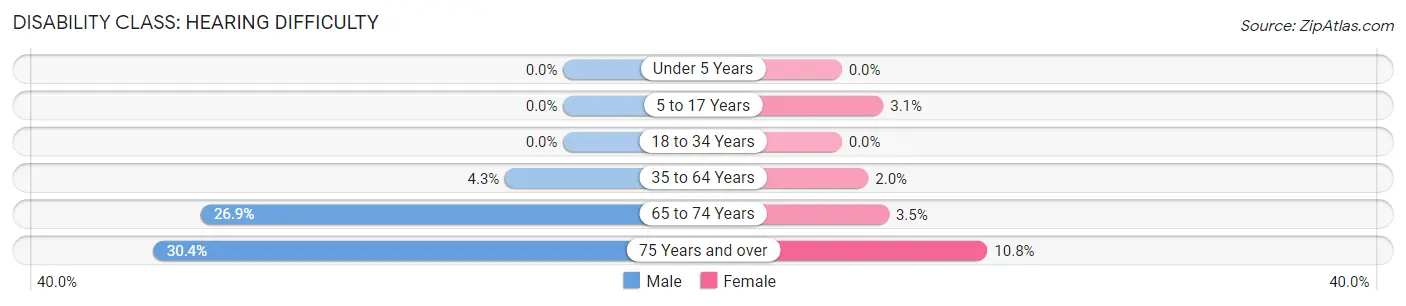
| Age Bracket | Male | Female |
| Under 5 Years | 0 (0.0%) | 0 (0.0%) |
| 5 to 17 Years | 0 (0.0%) | 50 (3.1%) |
| 18 to 34 Years | 0 (0.0%) | 0 (0.0%) |
| 35 to 64 Years | 158 (4.3%) | 70 (2.0%) |
| 65 to 74 Years | 343 (26.9%) | 46 (3.5%) |
| 75 Years and over | 235 (30.4%) | 106 (10.8%) |
Disability Class: Vision Difficulty
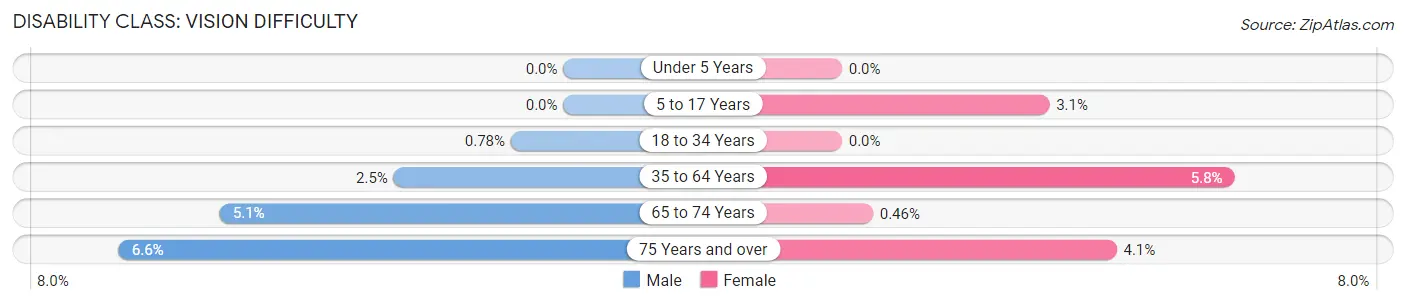
| Age Bracket | Male | Female |
| Under 5 Years | 0 (0.0%) | 0 (0.0%) |
| 5 to 17 Years | 0 (0.0%) | 50 (3.1%) |
| 18 to 34 Years | 16 (0.8%) | 0 (0.0%) |
| 35 to 64 Years | 92 (2.5%) | 207 (5.8%) |
| 65 to 74 Years | 65 (5.1%) | 6 (0.5%) |
| 75 Years and over | 51 (6.6%) | 40 (4.1%) |
Disability Class: Cognitive Difficulty
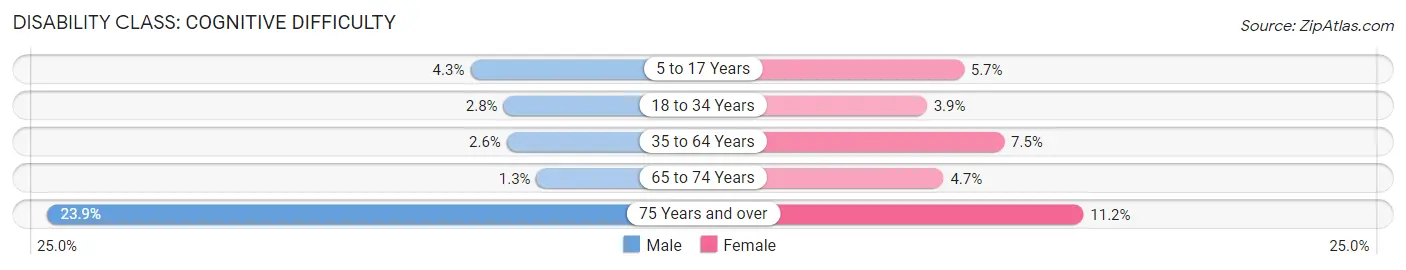
| Age Bracket | Male | Female |
| 5 to 17 Years | 83 (4.3%) | 92 (5.7%) |
| 18 to 34 Years | 57 (2.8%) | 73 (3.9%) |
| 35 to 64 Years | 96 (2.6%) | 267 (7.5%) |
| 65 to 74 Years | 16 (1.3%) | 62 (4.7%) |
| 75 Years and over | 185 (23.9%) | 110 (11.2%) |
Disability Class: Ambulatory Difficulty
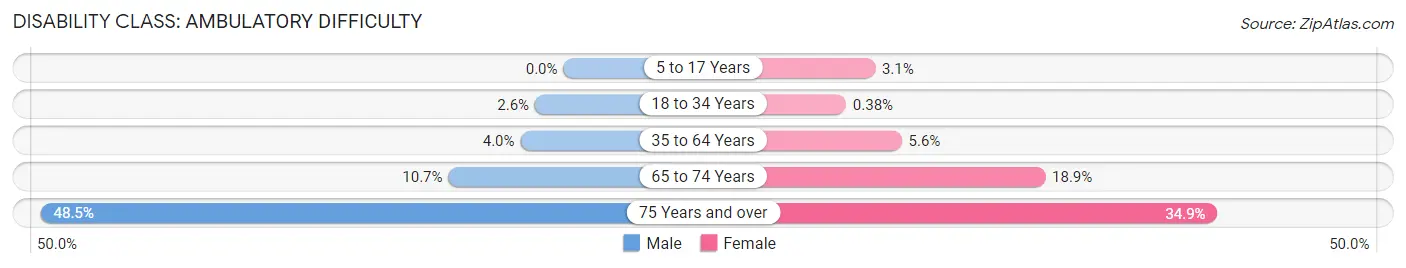
| Age Bracket | Male | Female |
| 5 to 17 Years | 0 (0.0%) | 50 (3.1%) |
| 18 to 34 Years | 54 (2.6%) | 7 (0.4%) |
| 35 to 64 Years | 146 (4.0%) | 197 (5.6%) |
| 65 to 74 Years | 136 (10.7%) | 248 (18.9%) |
| 75 Years and over | 375 (48.5%) | 342 (34.9%) |
Disability Class: Self-Care Difficulty
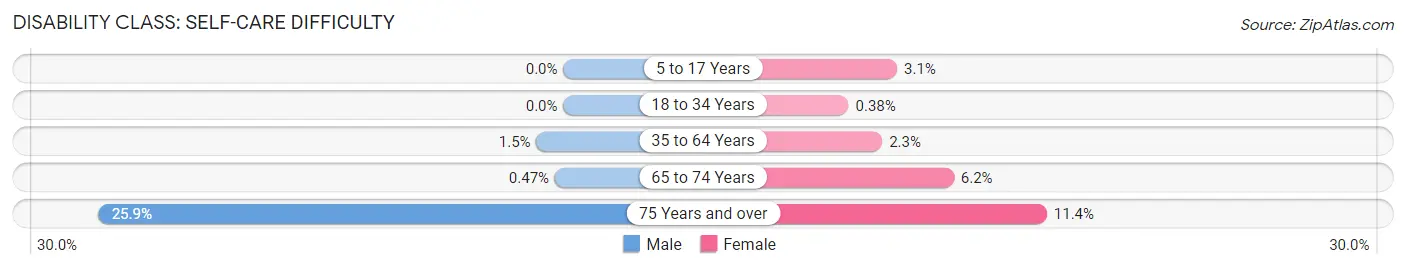
| Age Bracket | Male | Female |
| 5 to 17 Years | 0 (0.0%) | 50 (3.1%) |
| 18 to 34 Years | 0 (0.0%) | 7 (0.4%) |
| 35 to 64 Years | 55 (1.5%) | 80 (2.2%) |
| 65 to 74 Years | 6 (0.5%) | 82 (6.2%) |
| 75 Years and over | 200 (25.9%) | 112 (11.4%) |
Technology Access in Colorado County
Computing Device Access in Colorado County
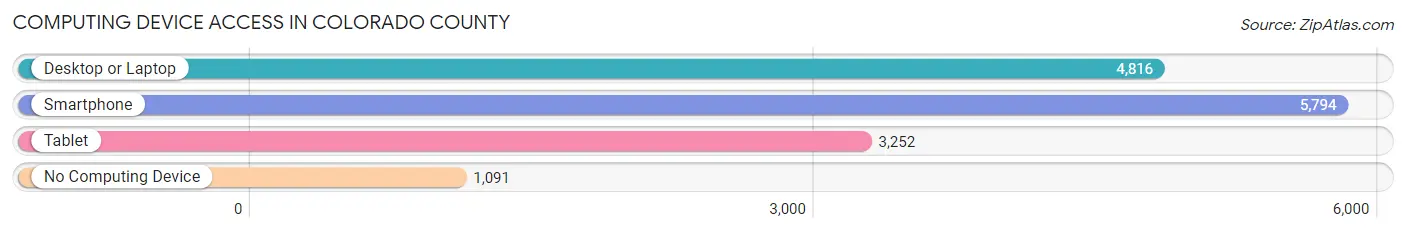
| Device Type | # Households | % Households |
| Desktop or Laptop | 4,816 | 65.3% |
| Smartphone | 5,794 | 78.5% |
| Tablet | 3,252 | 44.1% |
| No Computing Device | 1,091 | 14.8% |
| Total | 7,376 | 100.0% |
Internet Access in Colorado County
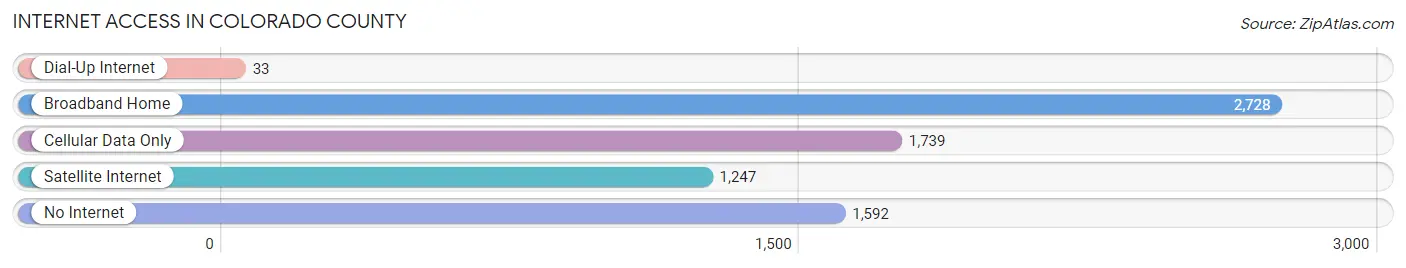
| Internet Type | # Households | % Households |
| Dial-Up Internet | 33 | 0.4% |
| Broadband Home | 2,728 | 37.0% |
| Cellular Data Only | 1,739 | 23.6% |
| Satellite Internet | 1,247 | 16.9% |
| No Internet | 1,592 | 21.6% |
| Total | 7,376 | 100.0% |
Colorado County Summary
County History
Colorado County, Texas is located in the southeastern part of the state, and is part of the Houston-The Woodlands-Sugar Land metropolitan area. The county was established in 1836 and named after the Colorado River, which runs through the county. The county seat is Columbus, which was founded in 1837.
The first settlers in the area were Native Americans, including the Tonkawa, Karankawa, and Lipan Apache tribes. The first European settlers arrived in the area in the early 1800s, and the county was officially established in 1836.
The county was an important part of the Texas Revolution, and the Battle of Coleto Creek was fought in the county in 1836. The county was also the site of the Battle of Plum Creek in 1840, which was a battle between the Texas Rangers and Comanche Indians.
The county was an important part of the cattle industry in the late 1800s and early 1900s. The county was also an important part of the cotton industry, and the town of Weimar was known as the “Cotton Capital of Texas”.
The county has a rich history of music, and is home to the Colorado County Music Hall of Fame. The county is also home to the Colorado County Fair, which has been held annually since 1875.
Geography
Colorado County is located in the southeastern part of Texas, and is bordered by Austin, Fayette, Lavaca, Wharton, and Matagorda counties. The county covers an area of 1,082 square miles, and is the 33rd largest county in the state.
The county is mostly flat, with some rolling hills in the western part of the county. The Colorado River runs through the county, and there are several small lakes and reservoirs in the county. The county is also home to several state parks, including Bastrop State Park, Colorado Bend State Park, and Lake Somerville State Park.
Economy
The economy of Colorado County is largely based on agriculture, with cotton, corn, and soybeans being the main crops. The county is also home to several oil and gas fields, and there are several manufacturing plants in the county.
The county is home to several large employers, including the Colorado County Electric Cooperative, the Colorado County Appraisal District, and the Colorado County Sheriff’s Office. The county is also home to several small businesses, including restaurants, retail stores, and service providers.
Demographics
As of the 2010 census, the population of Colorado County was 20,874. The population is mostly white (83.3%), with a small Hispanic population (14.2%). The median household income in the county is $45,837, and the median home value is $117,400.
The county is home to several small towns, including Columbus, Weimar, Eagle Lake, and Alleyton. The county is also home to several unincorporated communities, including Frelsburg, Glidden, and Sheridan.
Conclusion
Colorado County, Texas is a rural county located in the southeastern part of the state. The county has a rich history, and is home to several state parks and historical sites. The economy of the county is largely based on agriculture, and the county is home to several large employers. The population of the county is mostly white, with a small Hispanic population.
Common Questions
What is Per Capita Income in Colorado County?
Per Capita income in Colorado County is $35,002.
What is the Median Family Income in Colorado County?
Median Family Income in Colorado County is $73,565.
What is the Median Household income in Colorado County?
Median Household Income in Colorado County is $63,352.
What is Income or Wage Gap in Colorado County?
Income or Wage Gap in Colorado County is 42.8%.
Women in Colorado County earn 57.2 cents for every dollar earned by a man.
What is Family Income Deficit in Colorado County?
Family Income Deficit in Colorado County is $12,023.
Families that are below poverty line in Colorado County earn $12,023 less on average than the poverty threshold level.
What is Inequality or Gini Index in Colorado County?
Inequality or Gini Index in Colorado County is 0.47.
What is the Total Population of Colorado County?
Total Population of Colorado County is 20,582.
What is the Total Male Population of Colorado County?
Total Male Population of Colorado County is 10,233.
What is the Total Female Population of Colorado County?
Total Female Population of Colorado County is 10,349.
What is the Ratio of Males per 100 Females in Colorado County?
There are 98.88 Males per 100 Females in Colorado County.
What is the Ratio of Females per 100 Males in Colorado County?
There are 101.13 Females per 100 Males in Colorado County.
What is the Median Population Age in Colorado County?
Median Population Age in Colorado County is 43.2 Years.
What is the Average Family Size in Colorado County
Average Family Size in Colorado County is 3.4 People.
What is the Average Household Size in Colorado County
Average Household Size in Colorado County is 2.7 People.
How Large is the Labor Force in Colorado County?
There are 9,381 People in the Labor Forcein in Colorado County.
What is the Percentage of People in the Labor Force in Colorado County?
57.6% of People are in the Labor Force in Colorado County.
What is the Unemployment Rate in Colorado County?
Unemployment Rate in Colorado County is 5.7%.