Collingsworth County, TX Map & Demographics
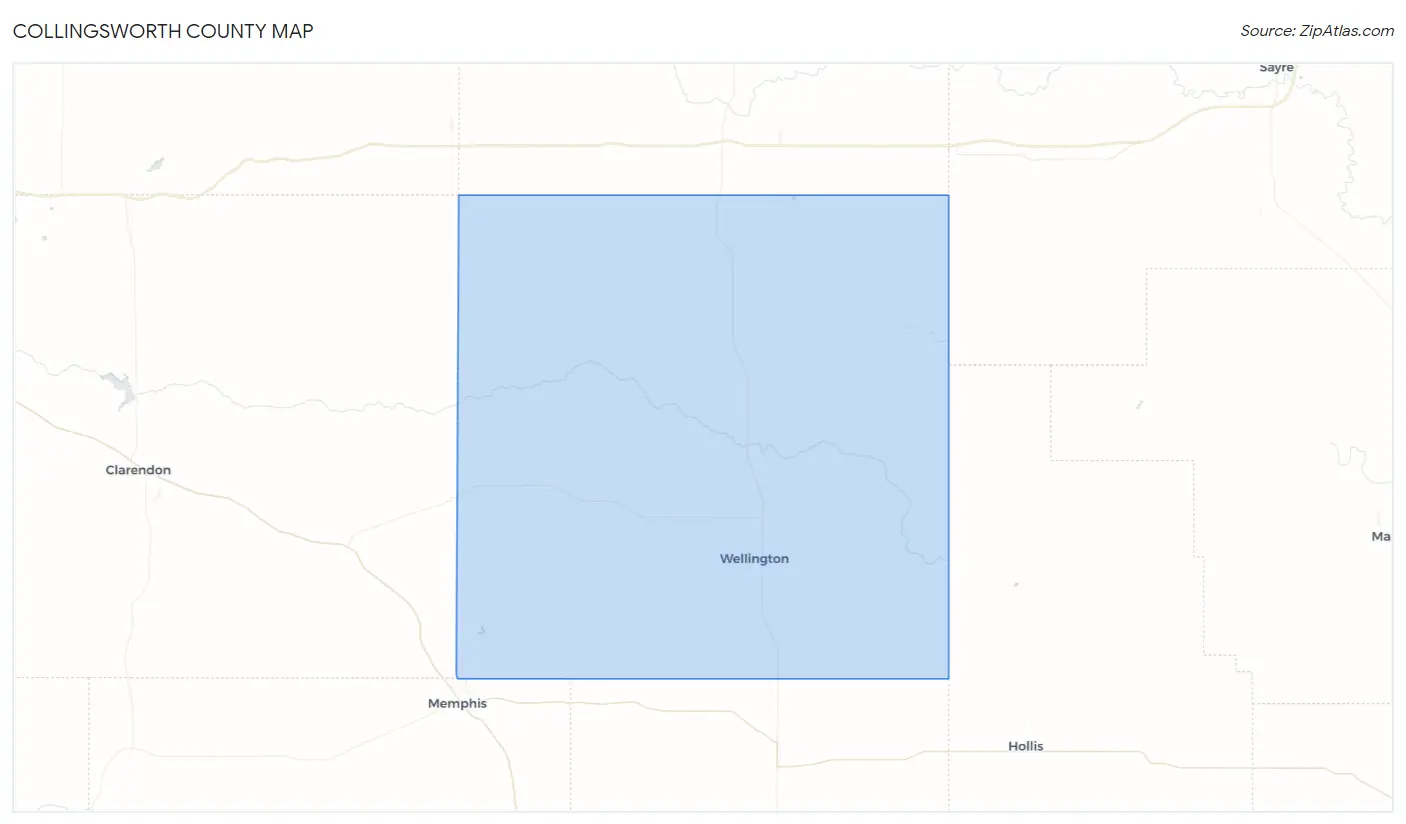
Collingsworth County Map
Collingsworth County Overview
$33,436
PER CAPITA INCOME
$61,675
AVG FAMILY INCOME
$52,045
AVG HOUSEHOLD INCOME
43.0%
WAGE / INCOME GAP [ % ]
57.0¢/ $1
WAGE / INCOME GAP [ $ ]
0.53
INEQUALITY / GINI INDEX
2,865
TOTAL POPULATION
1,405
MALE POPULATION
1,460
FEMALE POPULATION
96.23
MALES / 100 FEMALES
103.91
FEMALES / 100 MALES
38.3
MEDIAN AGE
3.1
AVG FAMILY SIZE
2.7
AVG HOUSEHOLD SIZE
1,344
LABOR FORCE [ PEOPLE ]
64.1%
PERCENT IN LABOR FORCE
2.8%
UNEMPLOYMENT RATE
Collingsworth County Area Codes
Income in Collingsworth County
Income Overview in Collingsworth County
Per Capita Income in Collingsworth County is $33,436, while median incomes of families and households are $61,675 and $52,045 respectively.
| Characteristic | Number | Measure |
| Per Capita Income | 2,865 | $33,436 |
| Median Family Income | 741 | $61,675 |
| Mean Family Income | 741 | $98,311 |
| Median Household Income | 1,018 | $52,045 |
| Mean Household Income | 1,018 | $87,624 |
| Income Deficit | 741 | $0 |
| Wage / Income Gap (%) | 2,865 | 43.01% |
| Wage / Income Gap ($) | 2,865 | 56.99¢ per $1 |
| Gini / Inequality Index | 2,865 | 0.53 |
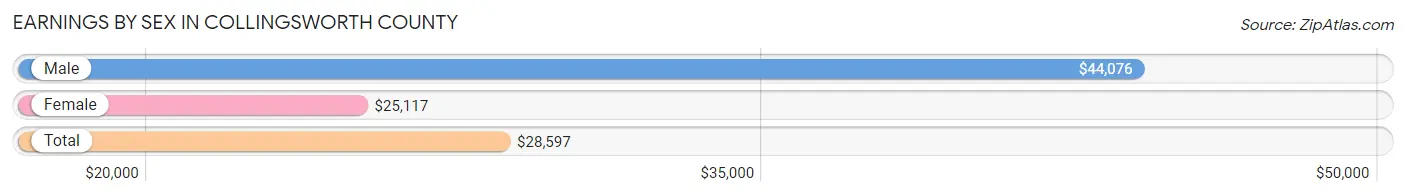
Earnings by Sex in Collingsworth County
Average Earnings in Collingsworth County are $28,597, $44,076 for men and $25,117 for women, a difference of 43.0%.
| Sex | Number | Average Earnings |
| Male | 699 (46.7%) | $44,076 |
| Female | 798 (53.3%) | $25,117 |
| Total | 1,497 (100.0%) | $28,597 |
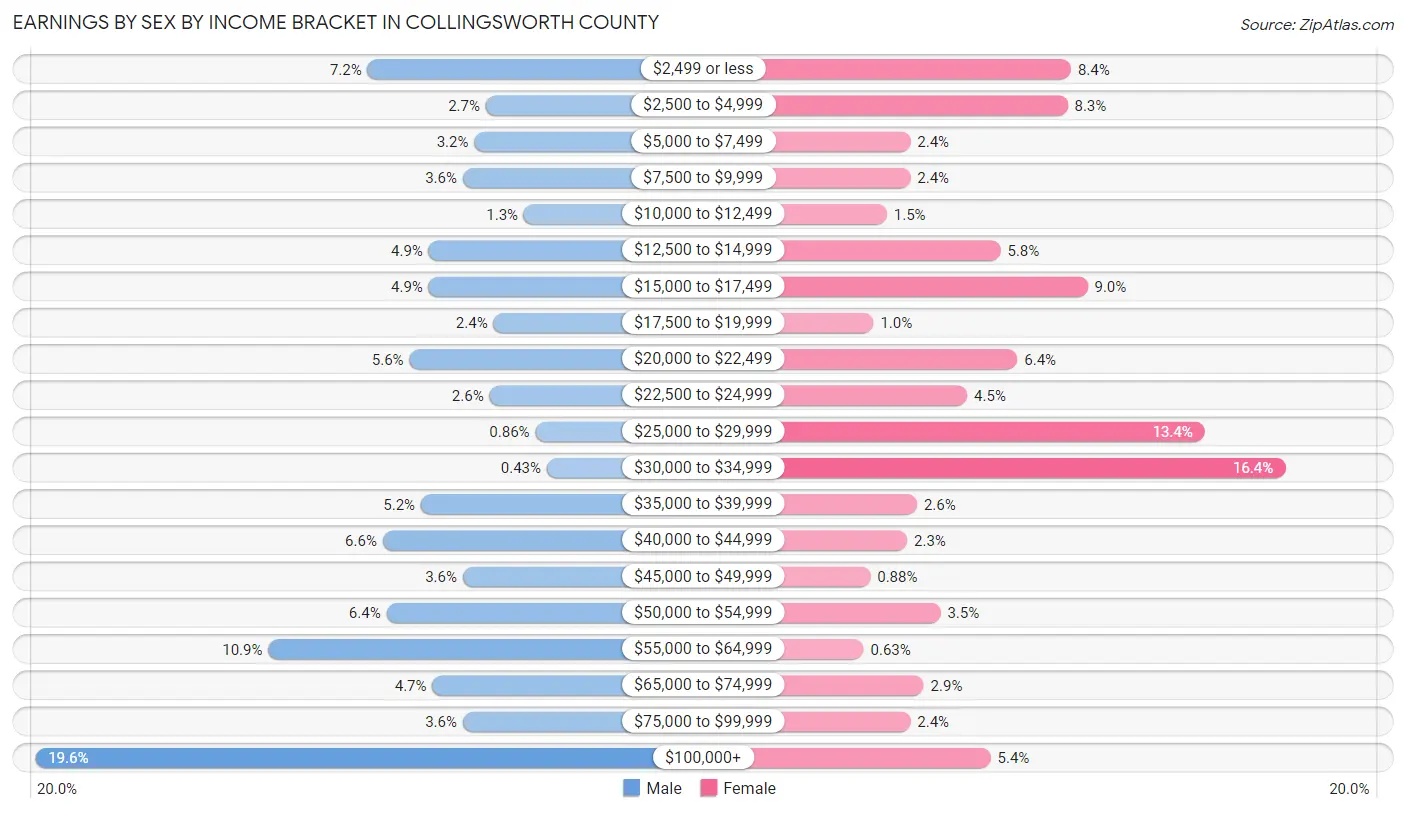
Earnings by Sex by Income Bracket in Collingsworth County
The most common earnings brackets in Collingsworth County are $100,000+ for men (137 | 19.6%) and $30,000 to $34,999 for women (131 | 16.4%).
| Income | Male | Female |
| $2,499 or less | 50 (7.1%) | 67 (8.4%) |
| $2,500 to $4,999 | 19 (2.7%) | 66 (8.3%) |
| $5,000 to $7,499 | 22 (3.2%) | 19 (2.4%) |
| $7,500 to $9,999 | 25 (3.6%) | 19 (2.4%) |
| $10,000 to $12,499 | 9 (1.3%) | 12 (1.5%) |
| $12,500 to $14,999 | 34 (4.9%) | 46 (5.8%) |
| $15,000 to $17,499 | 34 (4.9%) | 72 (9.0%) |
| $17,500 to $19,999 | 17 (2.4%) | 8 (1.0%) |
| $20,000 to $22,499 | 39 (5.6%) | 51 (6.4%) |
| $22,500 to $24,999 | 18 (2.6%) | 36 (4.5%) |
| $25,000 to $29,999 | 6 (0.9%) | 107 (13.4%) |
| $30,000 to $34,999 | 3 (0.4%) | 131 (16.4%) |
| $35,000 to $39,999 | 36 (5.1%) | 21 (2.6%) |
| $40,000 to $44,999 | 46 (6.6%) | 18 (2.3%) |
| $45,000 to $49,999 | 25 (3.6%) | 7 (0.9%) |
| $50,000 to $54,999 | 45 (6.4%) | 28 (3.5%) |
| $55,000 to $64,999 | 76 (10.9%) | 5 (0.6%) |
| $65,000 to $74,999 | 33 (4.7%) | 23 (2.9%) |
| $75,000 to $99,999 | 25 (3.6%) | 19 (2.4%) |
| $100,000+ | 137 (19.6%) | 43 (5.4%) |
| Total | 699 (100.0%) | 798 (100.0%) |
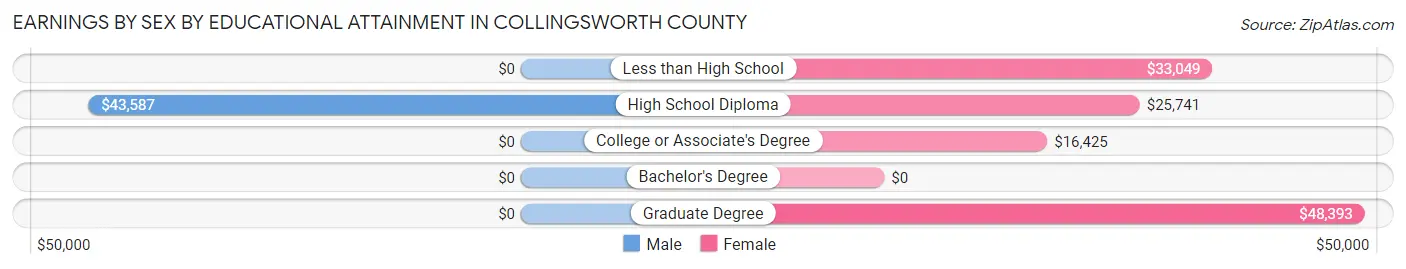
Earnings by Sex by Educational Attainment in Collingsworth County
Average earnings in Collingsworth County are $50,161 for men and $28,601 for women, a difference of 43.0%. Men with an educational attainment of high school diploma enjoy the highest average annual earnings of $43,587, while those with high school diploma education earn the least with $43,587. Women with an educational attainment of graduate degree earn the most with the average annual earnings of $48,393, while those with college or associate's degree education have the smallest earnings of $16,425.
| Educational Attainment | Male Income | Female Income |
| Less than High School | - | - |
| High School Diploma | $43,587 | $25,741 |
| College or Associate's Degree | - | - |
| Bachelor's Degree | - | - |
| Graduate Degree | - | - |
| Total | $50,161 | $28,601 |
Family Income in Collingsworth County
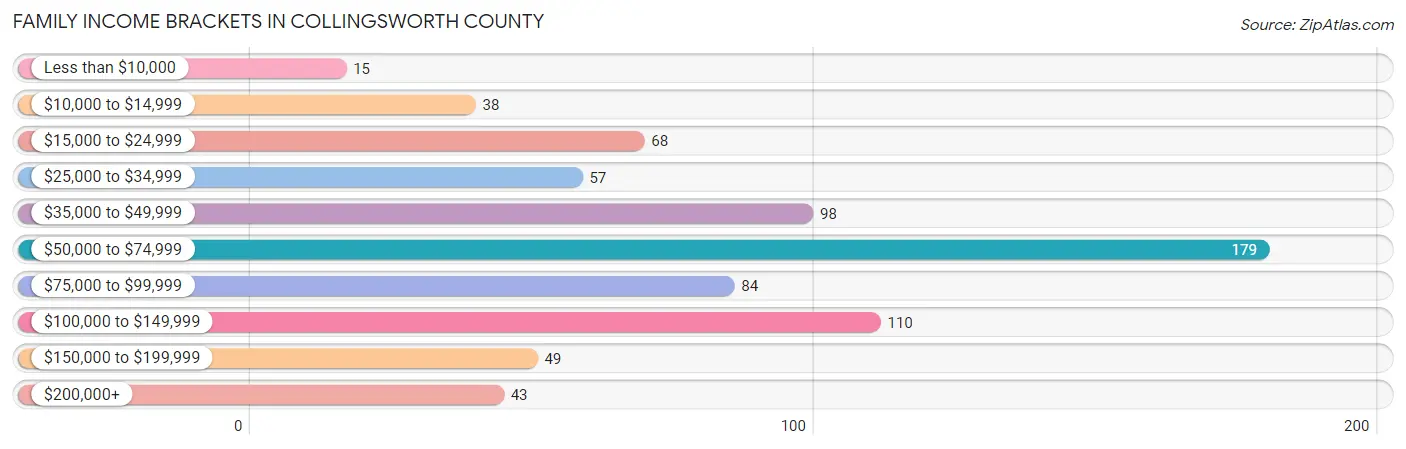
Family Income Brackets in Collingsworth County
According to the Collingsworth County family income data, there are 179 families falling into the $50,000 to $74,999 income range, which is the most common income bracket and makes up 24.2% of all families. Conversely, the less than $10,000 income bracket is the least frequent group with only 15 families (2.0%) belonging to this category.
| Income Bracket | # Families | % Families |
| Less than $10,000 | 15 | 2.0% |
| $10,000 to $14,999 | 38 | 5.1% |
| $15,000 to $24,999 | 68 | 9.2% |
| $25,000 to $34,999 | 57 | 7.7% |
| $35,000 to $49,999 | 98 | 13.2% |
| $50,000 to $74,999 | 179 | 24.2% |
| $75,000 to $99,999 | 84 | 11.3% |
| $100,000 to $149,999 | 110 | 14.8% |
| $150,000 to $199,999 | 49 | 6.6% |
| $200,000+ | 43 | 5.8% |
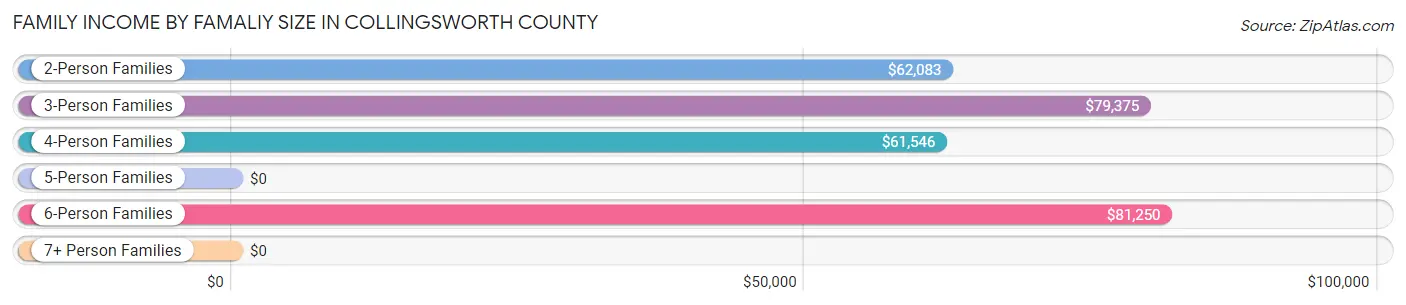
Family Income by Famaliy Size in Collingsworth County
6-person families (44 | 5.9%) account for the highest median family income in Collingsworth County with $81,250 per family, while 2-person families (317 | 42.8%) have the highest median income of $31,042 per family member.
| Income Bracket | # Families | Median Income |
| 2-Person Families | 317 (42.8%) | $62,083 |
| 3-Person Families | 108 (14.6%) | $79,375 |
| 4-Person Families | 165 (22.3%) | $61,546 |
| 5-Person Families | 87 (11.7%) | $0 |
| 6-Person Families | 44 (5.9%) | $81,250 |
| 7+ Person Families | 20 (2.7%) | $0 |
| Total | 741 (100.0%) | $61,675 |
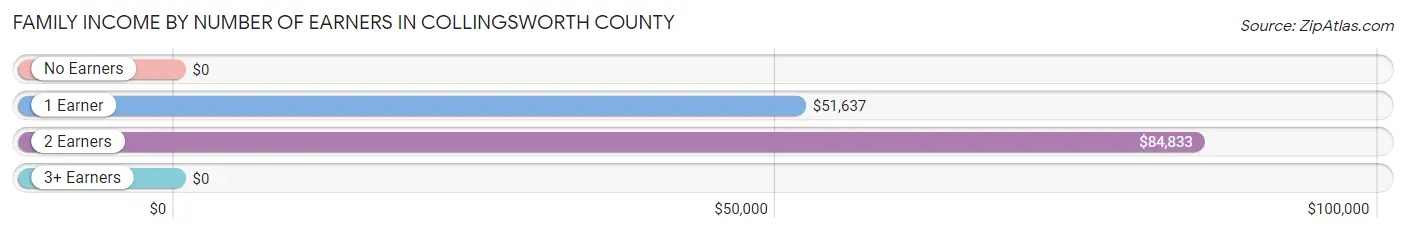
Family Income by Number of Earners in Collingsworth County
| Number of Earners | # Families | Median Income |
| No Earners | 66 (8.9%) | $0 |
| 1 Earner | 403 (54.4%) | $51,637 |
| 2 Earners | 202 (27.3%) | $84,833 |
| 3+ Earners | 70 (9.5%) | $0 |
| Total | 741 (100.0%) | $61,675 |
Household Income in Collingsworth County
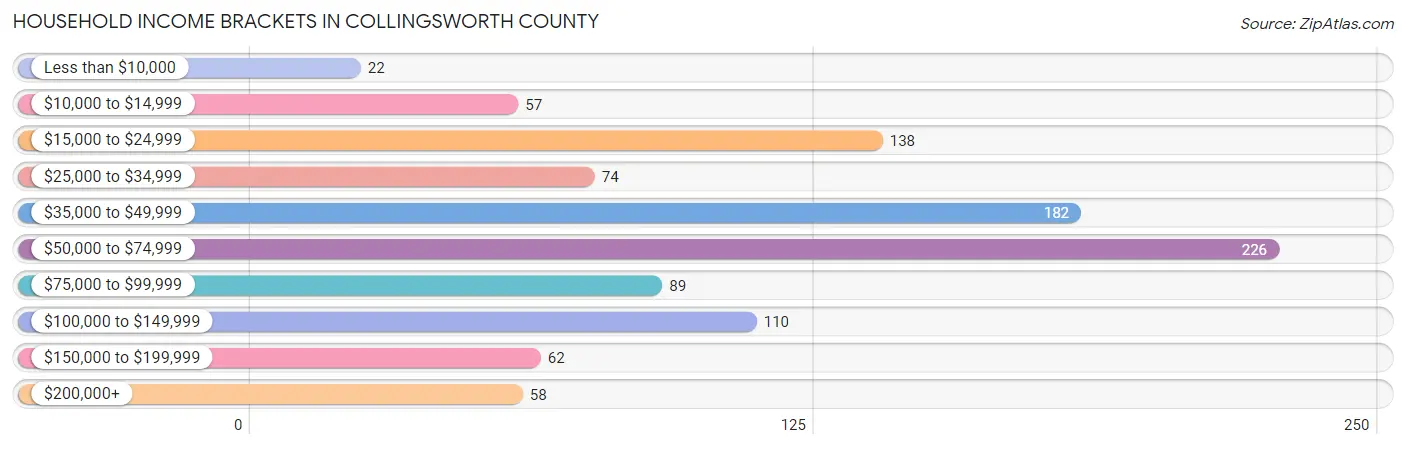
Household Income Brackets in Collingsworth County
With 226 households falling in the category, the $50,000 to $74,999 income range is the most frequent in Collingsworth County, accounting for 22.2% of all households. In contrast, only 22 households (2.2%) fall into the less than $10,000 income bracket, making it the least populous group.
| Income Bracket | # Households | % Households |
| Less than $10,000 | 22 | 2.2% |
| $10,000 to $14,999 | 57 | 5.6% |
| $15,000 to $24,999 | 138 | 13.6% |
| $25,000 to $34,999 | 74 | 7.3% |
| $35,000 to $49,999 | 182 | 17.9% |
| $50,000 to $74,999 | 226 | 22.2% |
| $75,000 to $99,999 | 89 | 8.7% |
| $100,000 to $149,999 | 110 | 10.8% |
| $150,000 to $199,999 | 62 | 6.1% |
| $200,000+ | 58 | 5.7% |
Household Income by Householder Age in Collingsworth County
The median household income in Collingsworth County is $52,045, with the highest median household income of $61,543 found in the 25 to 44 years age bracket for the primary householder. A total of 348 households (34.2%) fall into this category. Meanwhile, the 15 to 24 years age bracket for the primary householder has the lowest median household income of $0, with 42 households (4.1%) in this group.
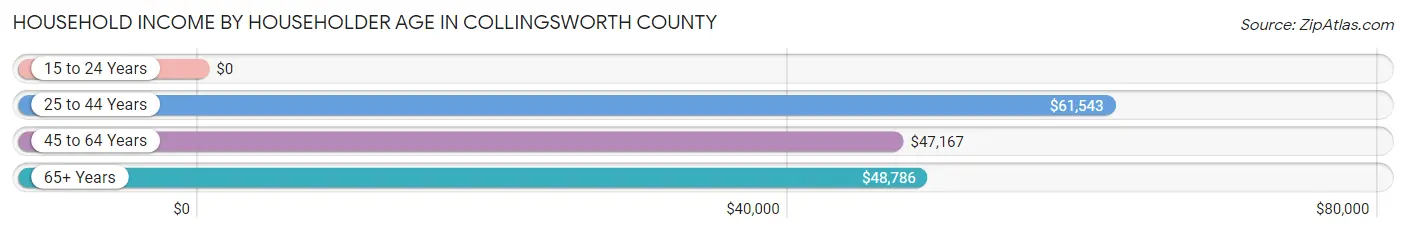
| Income Bracket | # Households | Median Income |
| 15 to 24 Years | 42 (4.1%) | $0 |
| 25 to 44 Years | 348 (34.2%) | $61,543 |
| 45 to 64 Years | 268 (26.3%) | $47,167 |
| 65+ Years | 360 (35.4%) | $48,786 |
| Total | 1,018 (100.0%) | $52,045 |
Poverty in Collingsworth County
Income Below Poverty by Sex and Age in Collingsworth County
With 21.0% poverty level for males and 23.6% for females among the residents of Collingsworth County, under 5 year old males and 12 to 14 year old females are the most vulnerable to poverty, with 37 males (35.6%) and 14 females (77.8%) in their respective age groups living below the poverty level.
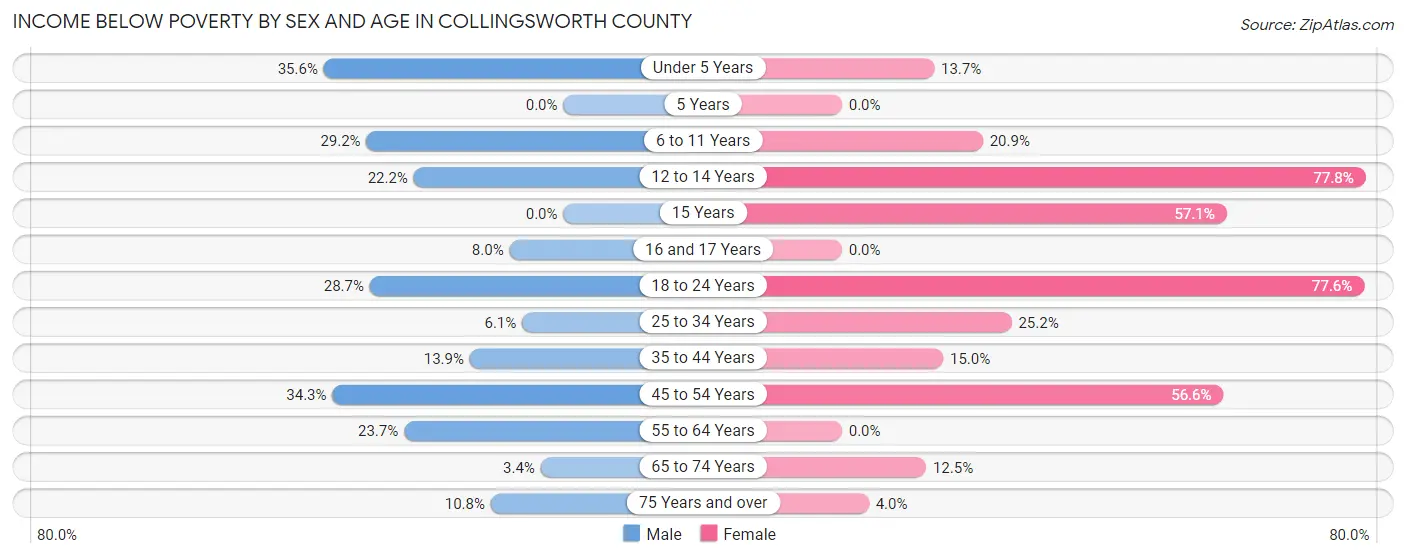
| Age Bracket | Male | Female |
| Under 5 Years | 37 (35.6%) | 10 (13.7%) |
| 5 Years | 0 (0.0%) | 0 (0.0%) |
| 6 to 11 Years | 69 (29.2%) | 36 (20.9%) |
| 12 to 14 Years | 24 (22.2%) | 14 (77.8%) |
| 15 Years | 0 (0.0%) | 8 (57.1%) |
| 16 and 17 Years | 2 (8.0%) | 0 (0.0%) |
| 18 to 24 Years | 25 (28.7%) | 114 (77.5%) |
| 25 to 34 Years | 3 (6.1%) | 31 (25.2%) |
| 35 to 44 Years | 30 (13.9%) | 34 (15.0%) |
| 45 to 54 Years | 59 (34.3%) | 64 (56.6%) |
| 55 to 64 Years | 22 (23.7%) | 0 (0.0%) |
| 65 to 74 Years | 6 (3.4%) | 24 (12.5%) |
| 75 Years and over | 7 (10.8%) | 4 (4.0%) |
| Total | 284 (21.0%) | 339 (23.6%) |
Income Above Poverty by Sex and Age in Collingsworth County
According to the poverty statistics in Collingsworth County, males aged 5 years and females aged 5 years are the age groups that are most secure financially, with 100.0% of males and 100.0% of females in these age groups living above the poverty line.
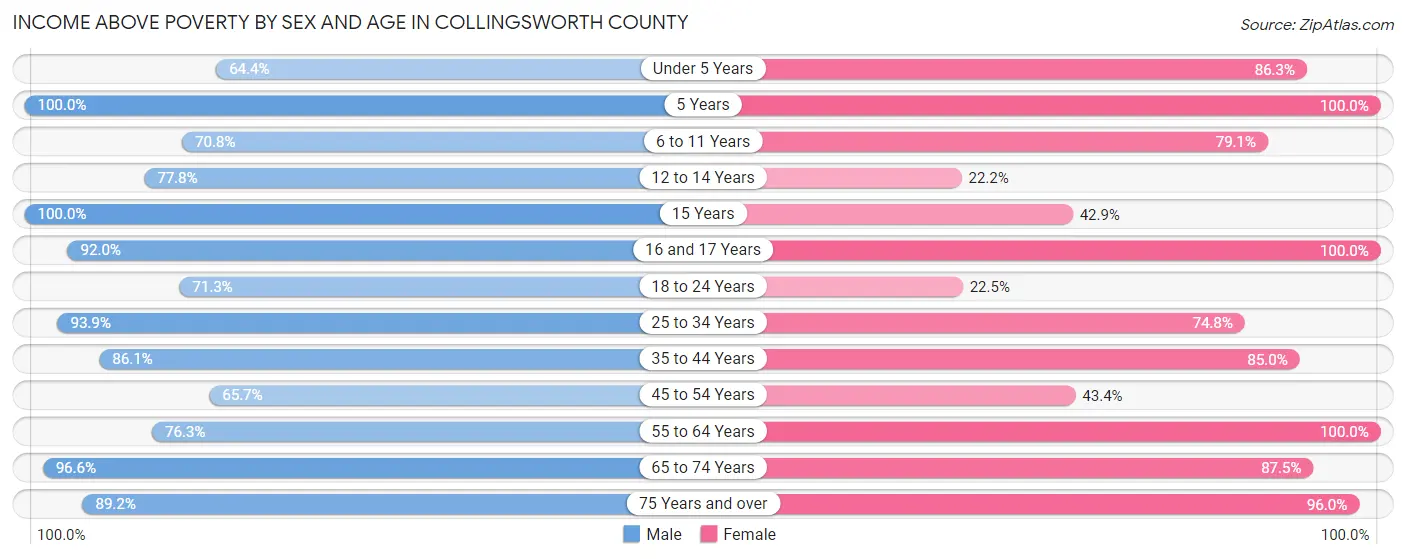
| Age Bracket | Male | Female |
| Under 5 Years | 67 (64.4%) | 63 (86.3%) |
| 5 Years | 5 (100.0%) | 17 (100.0%) |
| 6 to 11 Years | 167 (70.8%) | 136 (79.1%) |
| 12 to 14 Years | 84 (77.8%) | 4 (22.2%) |
| 15 Years | 15 (100.0%) | 6 (42.9%) |
| 16 and 17 Years | 23 (92.0%) | 51 (100.0%) |
| 18 to 24 Years | 62 (71.3%) | 33 (22.5%) |
| 25 to 34 Years | 46 (93.9%) | 92 (74.8%) |
| 35 to 44 Years | 186 (86.1%) | 192 (85.0%) |
| 45 to 54 Years | 113 (65.7%) | 49 (43.4%) |
| 55 to 64 Years | 71 (76.3%) | 189 (100.0%) |
| 65 to 74 Years | 172 (96.6%) | 168 (87.5%) |
| 75 Years and over | 58 (89.2%) | 96 (96.0%) |
| Total | 1,069 (79.0%) | 1,096 (76.4%) |
Income Below Poverty Among Married-Couple Families in Collingsworth County
The poverty statistics for married-couple families in Collingsworth County show that 16.4% or 82 of the total 500 families live below the poverty line. Families with no children have the highest poverty rate of 17.3%, comprising of 45 families. On the other hand, families with 3 or 4 children have the lowest poverty rate of 13.2%, which includes 12 families.
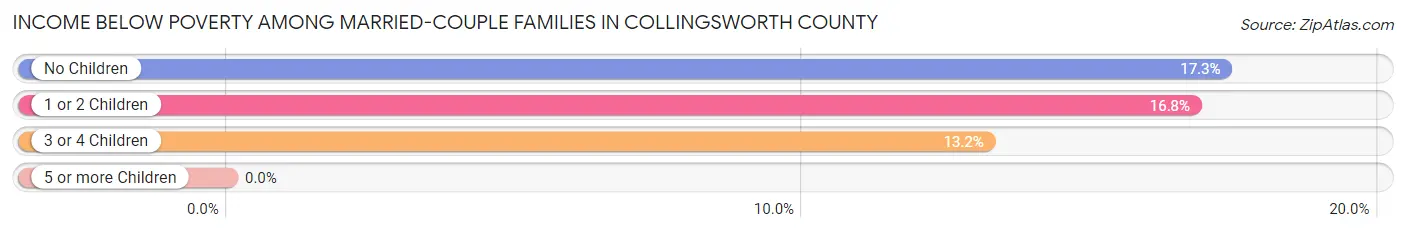
| Children | Above Poverty | Below Poverty |
| No Children | 215 (82.7%) | 45 (17.3%) |
| 1 or 2 Children | 124 (83.2%) | 25 (16.8%) |
| 3 or 4 Children | 79 (86.8%) | 12 (13.2%) |
| 5 or more Children | 0 (0.0%) | 0 (0.0%) |
| Total | 418 (83.6%) | 82 (16.4%) |
Income Below Poverty Among Single-Parent Households in Collingsworth County
According to the poverty data in Collingsworth County, 15.2% or 14 single-father households and 36.2% or 54 single-mother households are living below the poverty line. Among single-father households, those with 1 or 2 children have the highest poverty rate, with 14 households (35.9%) experiencing poverty. Likewise, among single-mother households, those with 3 or 4 children have the highest poverty rate, with 38 households (100.0%) falling below the poverty line.
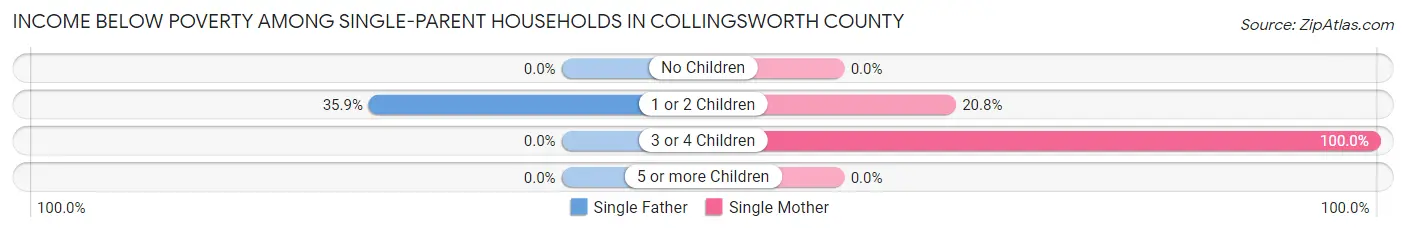
| Children | Single Father | Single Mother |
| No Children | 0 (0.0%) | 0 (0.0%) |
| 1 or 2 Children | 14 (35.9%) | 16 (20.8%) |
| 3 or 4 Children | 0 (0.0%) | 38 (100.0%) |
| 5 or more Children | 0 (0.0%) | 0 (0.0%) |
| Total | 14 (15.2%) | 54 (36.2%) |
Income Below Poverty Among Married-Couple vs Single-Parent Households in Collingsworth County
The poverty data for Collingsworth County shows that 82 of the married-couple family households (16.4%) and 68 of the single-parent households (28.2%) are living below the poverty level. Within the married-couple family households, those with no children have the highest poverty rate, with 45 households (17.3%) falling below the poverty line. Among the single-parent households, those with 3 or 4 children have the highest poverty rate, with 38 household (50.0%) living below poverty.
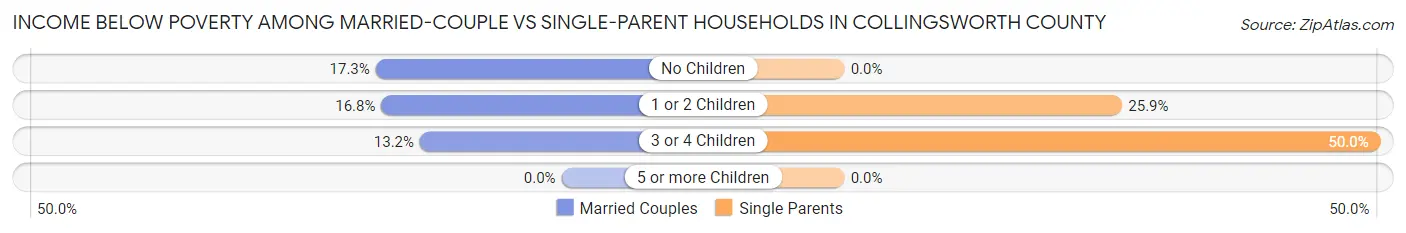
| Children | Married-Couple Families | Single-Parent Households |
| No Children | 45 (17.3%) | 0 (0.0%) |
| 1 or 2 Children | 25 (16.8%) | 30 (25.9%) |
| 3 or 4 Children | 12 (13.2%) | 38 (50.0%) |
| 5 or more Children | 0 (0.0%) | 0 (0.0%) |
| Total | 82 (16.4%) | 68 (28.2%) |
Race in Collingsworth County
The most populous races in Collingsworth County are White / Caucasian (1,999 | 69.8%), Hispanic or Latino (840 | 29.3%), and Two or more Races (446 | 15.6%).
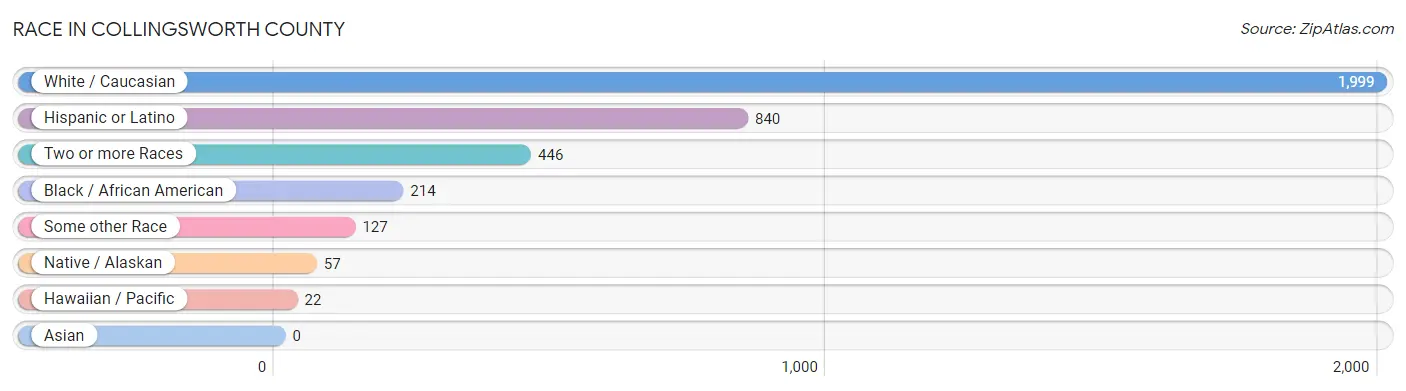
| Race | # Population | % Population |
| Asian | 0 | 0.0% |
| Black / African American | 214 | 7.5% |
| Hawaiian / Pacific | 22 | 0.8% |
| Hispanic or Latino | 840 | 29.3% |
| Native / Alaskan | 57 | 2.0% |
| White / Caucasian | 1,999 | 69.8% |
| Two or more Races | 446 | 15.6% |
| Some other Race | 127 | 4.4% |
| Total | 2,865 | 100.0% |
Ancestry in Collingsworth County
The most populous ancestries reported in Collingsworth County are Mexican (635 | 22.2%), Irish (488 | 17.0%), German (372 | 13.0%), English (339 | 11.8%), and European (157 | 5.5%), together accounting for 69.5% of all Collingsworth County residents.
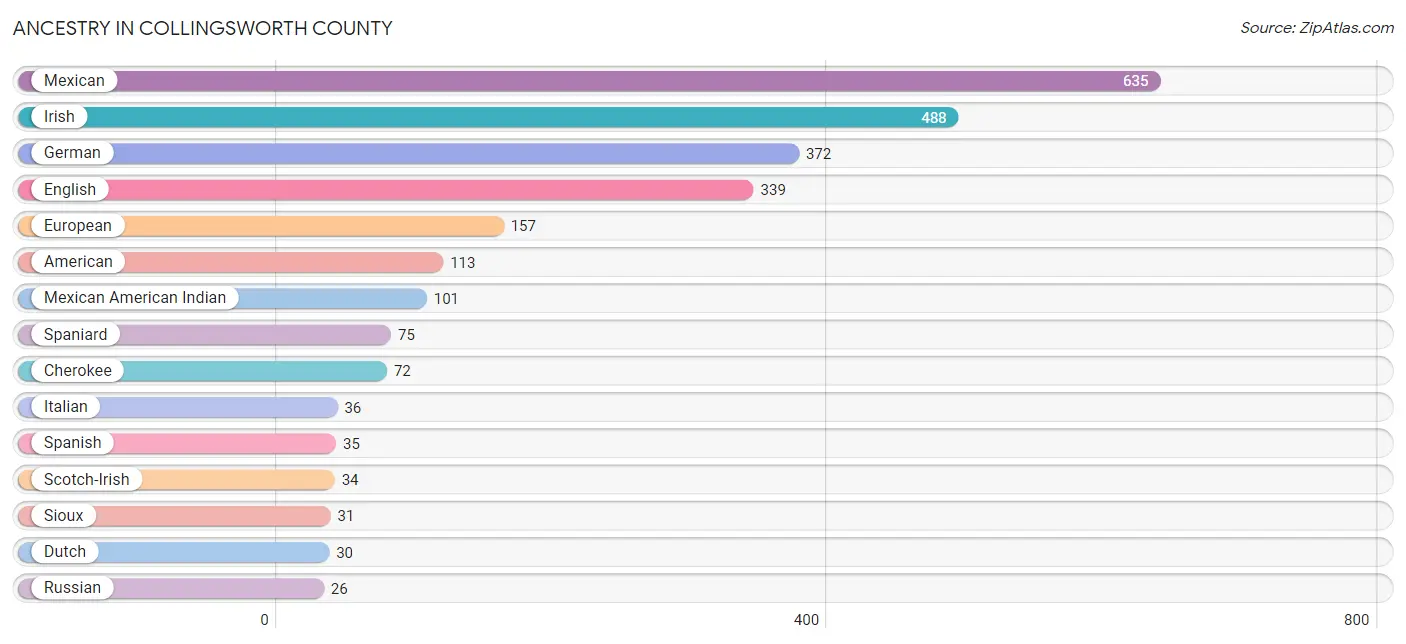
| Ancestry | # Population | % Population |
| American | 113 | 3.9% |
| Apache | 6 | 0.2% |
| Arapaho | 7 | 0.2% |
| Celtic | 13 | 0.4% |
| Cherokee | 72 | 2.5% |
| Chickasaw | 4 | 0.1% |
| Choctaw | 12 | 0.4% |
| Comanche | 9 | 0.3% |
| Dutch | 30 | 1.1% |
| English | 339 | 11.8% |
| European | 157 | 5.5% |
| French | 4 | 0.1% |
| German | 372 | 13.0% |
| Irish | 488 | 17.0% |
| Iroquois | 2 | 0.1% |
| Italian | 36 | 1.3% |
| Mexican | 635 | 22.2% |
| Mexican American Indian | 101 | 3.5% |
| Pennsylvania German | 4 | 0.1% |
| Polish | 11 | 0.4% |
| Russian | 26 | 0.9% |
| Samoan | 22 | 0.8% |
| Scandinavian | 2 | 0.1% |
| Scotch-Irish | 34 | 1.2% |
| Scottish | 11 | 0.4% |
| Sioux | 31 | 1.1% |
| Spaniard | 75 | 2.6% |
| Spanish | 35 | 1.2% |
| Swiss | 4 | 0.1% |
| Turkish | 8 | 0.3% |
| Welsh | 12 | 0.4% | View All 31 Rows |
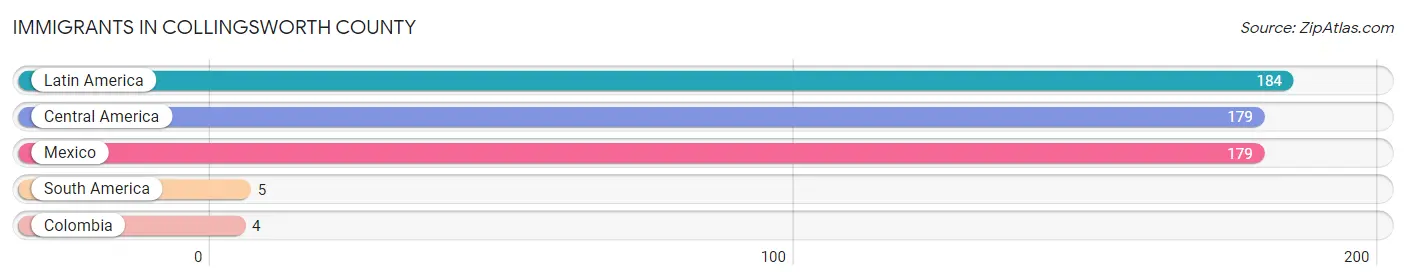
Immigrants in Collingsworth County
The most numerous immigrant groups reported in Collingsworth County came from Latin America (184 | 6.4%), Central America (179 | 6.2%), Mexico (179 | 6.2%), South America (5 | 0.2%), and Colombia (4 | 0.1%), together accounting for 19.2% of all Collingsworth County residents.
| Immigration Origin | # Population | % Population |
| Central America | 179 | 6.2% |
| Colombia | 4 | 0.1% |
| Latin America | 184 | 6.4% |
| Mexico | 179 | 6.2% |
| South America | 5 | 0.2% | View All 5 Rows |
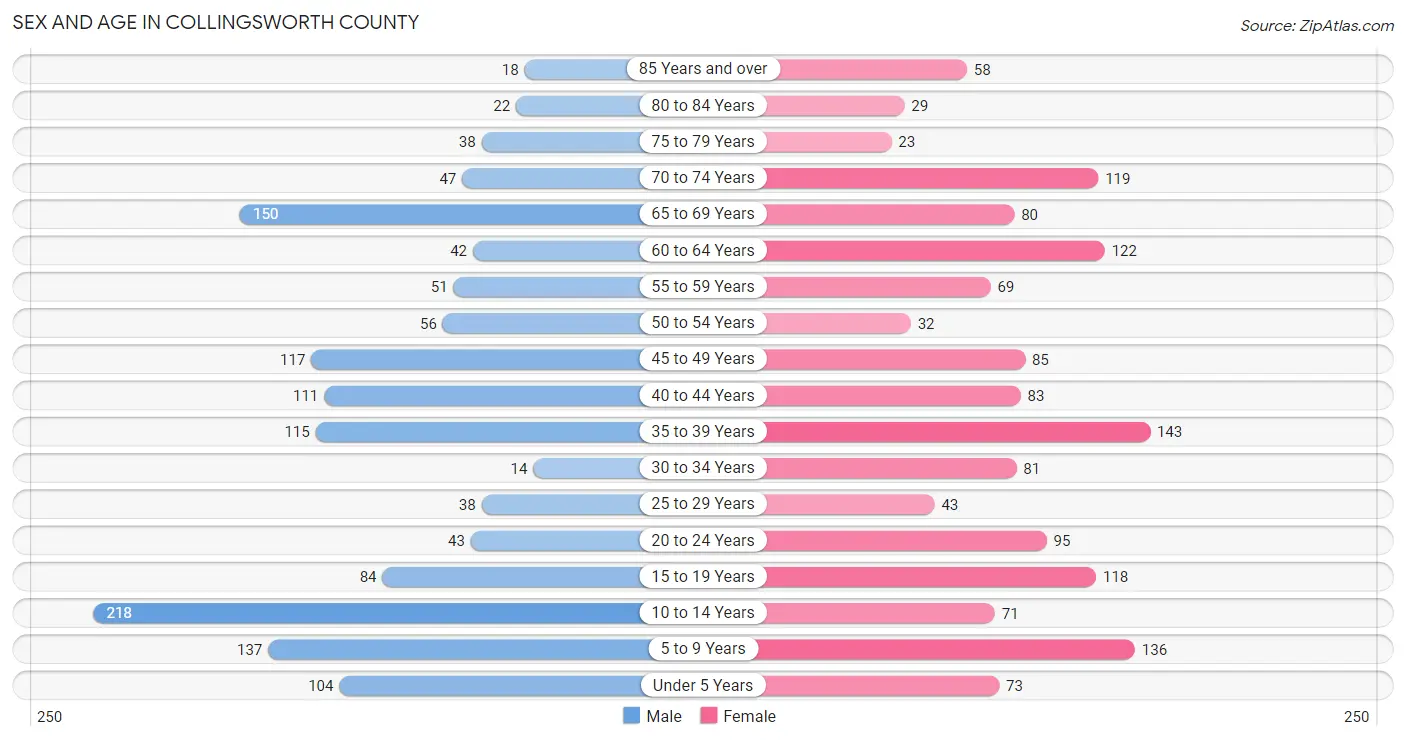
Sex and Age in Collingsworth County
Sex and Age in Collingsworth County
The most populous age groups in Collingsworth County are 10 to 14 Years (218 | 15.5%) for men and 35 to 39 Years (143 | 9.8%) for women.
| Age Bracket | Male | Female |
| Under 5 Years | 104 (7.4%) | 73 (5.0%) |
| 5 to 9 Years | 137 (9.8%) | 136 (9.3%) |
| 10 to 14 Years | 218 (15.5%) | 71 (4.9%) |
| 15 to 19 Years | 84 (6.0%) | 118 (8.1%) |
| 20 to 24 Years | 43 (3.1%) | 95 (6.5%) |
| 25 to 29 Years | 38 (2.7%) | 43 (2.9%) |
| 30 to 34 Years | 14 (1.0%) | 81 (5.6%) |
| 35 to 39 Years | 115 (8.2%) | 143 (9.8%) |
| 40 to 44 Years | 111 (7.9%) | 83 (5.7%) |
| 45 to 49 Years | 117 (8.3%) | 85 (5.8%) |
| 50 to 54 Years | 56 (4.0%) | 32 (2.2%) |
| 55 to 59 Years | 51 (3.6%) | 69 (4.7%) |
| 60 to 64 Years | 42 (3.0%) | 122 (8.4%) |
| 65 to 69 Years | 150 (10.7%) | 80 (5.5%) |
| 70 to 74 Years | 47 (3.4%) | 119 (8.2%) |
| 75 to 79 Years | 38 (2.7%) | 23 (1.6%) |
| 80 to 84 Years | 22 (1.6%) | 29 (2.0%) |
| 85 Years and over | 18 (1.3%) | 58 (4.0%) |
| Total | 1,405 (100.0%) | 1,460 (100.0%) |
Families and Households in Collingsworth County
Median Family Size in Collingsworth County
The median family size in Collingsworth County is 3.09 persons per family, with married-couple families (500 | 67.5%) accounting for the largest median family size of 3.3 persons per family. On the other hand, single female/mother families (149 | 20.1%) represent the smallest median family size with 2.64 persons per family.

| Family Type | # Families | Family Size |
| Married-Couple | 500 (67.5%) | 3.30 |
| Single Male/Father | 92 (12.4%) | 2.66 |
| Single Female/Mother | 149 (20.1%) | 2.64 |
| Total Families | 741 (100.0%) | 3.09 |
Median Household Size in Collingsworth County
The median household size in Collingsworth County is 2.74 persons per household, with married-couple households (500 | 49.1%) accounting for the largest median household size of 3.46 persons per household. non-family households (277 | 27.2%) represent the smallest median household size with 1.45 persons per household.

| Household Type | # Households | Household Size |
| Married-Couple | 500 (49.1%) | 3.46 |
| Single Male/Father | 92 (9.0%) | 2.66 |
| Single Female/Mother | 149 (14.6%) | 2.81 |
| Non-family | 277 (27.2%) | 1.45 |
| Total Households | 1,018 (100.0%) | 2.74 |
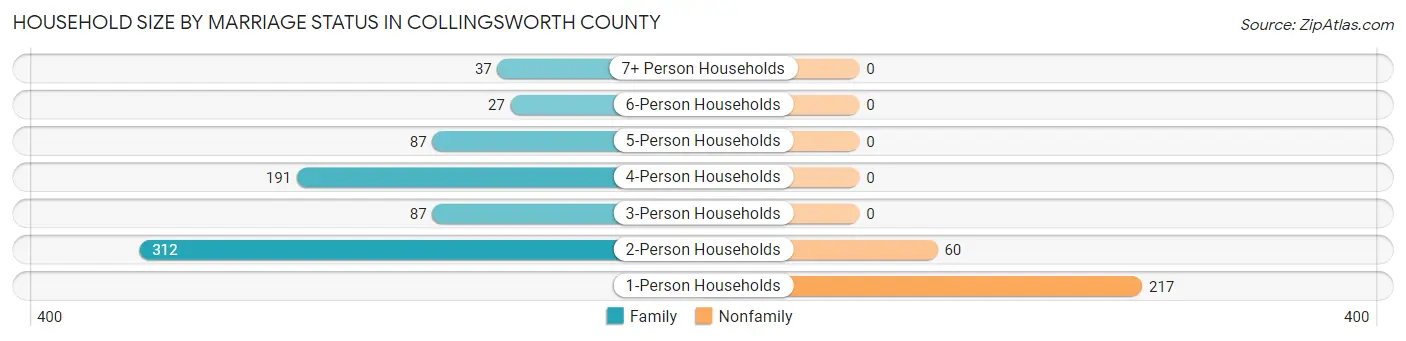
Household Size by Marriage Status in Collingsworth County
Out of a total of 1,018 households in Collingsworth County, 741 (72.8%) are family households, while 277 (27.2%) are nonfamily households. The most numerous type of family households are 2-person households, comprising 312, and the most common type of nonfamily households are 1-person households, comprising 217.
| Household Size | Family Households | Nonfamily Households |
| 1-Person Households | - | 217 (21.3%) |
| 2-Person Households | 312 (30.6%) | 60 (5.9%) |
| 3-Person Households | 87 (8.6%) | 0 (0.0%) |
| 4-Person Households | 191 (18.8%) | 0 (0.0%) |
| 5-Person Households | 87 (8.6%) | 0 (0.0%) |
| 6-Person Households | 27 (2.6%) | 0 (0.0%) |
| 7+ Person Households | 37 (3.6%) | 0 (0.0%) |
| Total | 741 (72.8%) | 277 (27.2%) |
Female Fertility in Collingsworth County
Fertility by Age in Collingsworth County
Average fertility rate in Collingsworth County is 78.0 births per 1,000 women. Women in the age bracket of 20 to 34 years have the highest fertility rate with 164.0 births per 1,000 women. Women in the age bracket of 20 to 34 years acount for 70.6% of all women with births.
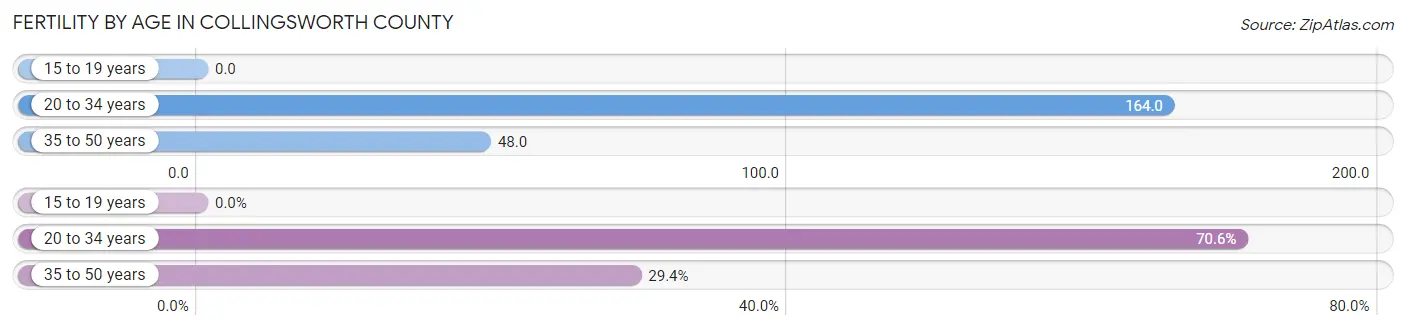
| Age Bracket | Women with Births | Births / 1,000 Women |
| 15 to 19 years | 0 (0.0%) | 0.0 |
| 20 to 34 years | 36 (70.6%) | 164.0 |
| 35 to 50 years | 15 (29.4%) | 48.0 |
| Total | 51 (100.0%) | 78.0 |
Fertility by Age by Marriage Status in Collingsworth County
15.7% of women with births (51) in Collingsworth County are married. The highest percentage of unmarried women with births falls into 35 to 50 years age bracket with 100.0% of them unmarried at the time of birth, while the lowest percentage of unmarried women with births belong to 20 to 34 years age bracket with 77.8% of them unmarried.
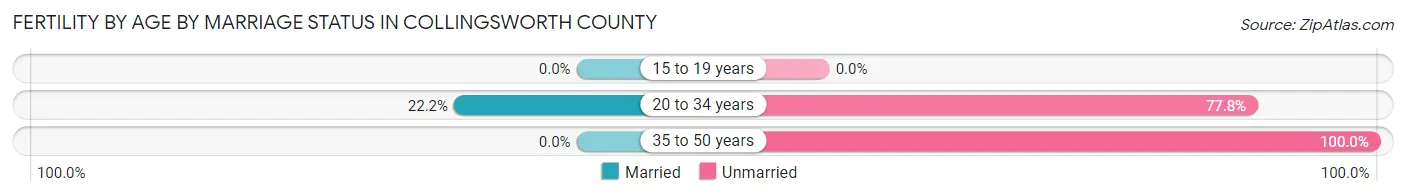
| Age Bracket | Married | Unmarried |
| 15 to 19 years | 0 (0.0%) | 0 (0.0%) |
| 20 to 34 years | 8 (22.2%) | 28 (77.8%) |
| 35 to 50 years | 0 (0.0%) | 15 (100.0%) |
| Total | 8 (15.7%) | 43 (84.3%) |
Fertility by Education in Collingsworth County
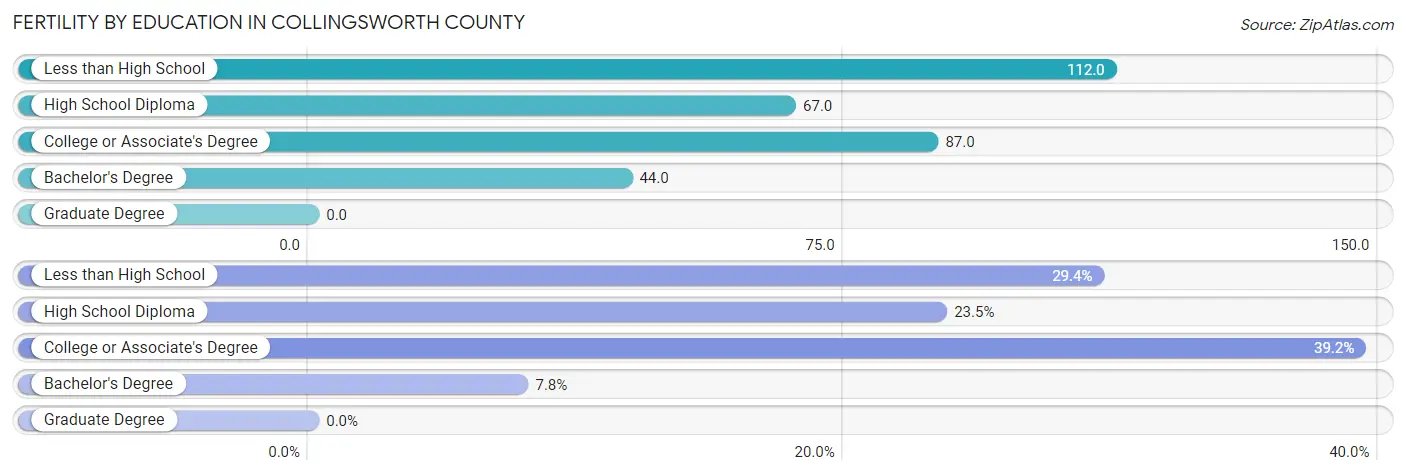
| Educational Attainment | Women with Births | Births / 1,000 Women |
| Less than High School | 15 (29.4%) | 112.0 |
| High School Diploma | 12 (23.5%) | 67.0 |
| College or Associate's Degree | 20 (39.2%) | 87.0 |
| Bachelor's Degree | 4 (7.8%) | 44.0 |
| Graduate Degree | 0 (0.0%) | 0.0 |
| Total | 51 (100.0%) | 78.0 |
Fertility by Education by Marriage Status in Collingsworth County
84.3% of women with births in Collingsworth County are unmarried. Women with the educational attainment of bachelor's degree are most likely to be married with 100.0% of them married at childbirth, while women with the educational attainment of less than high school are least likely to be married with 100.0% of them unmarried at childbirth.
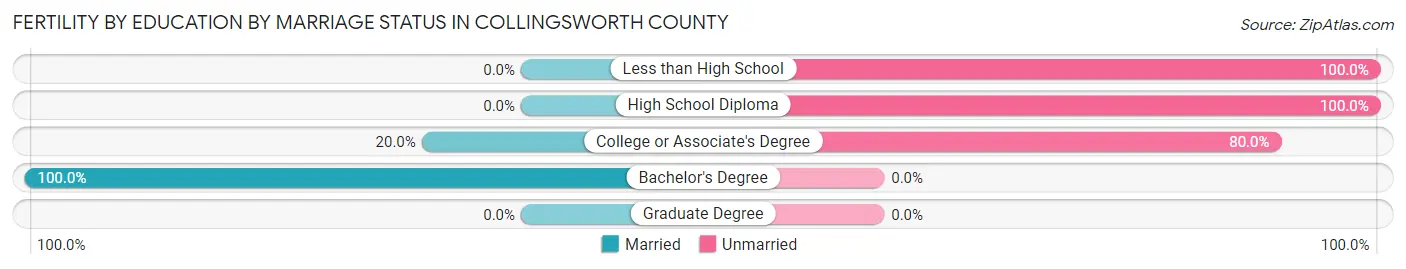
| Educational Attainment | Married | Unmarried |
| Less than High School | 0 (0.0%) | 15 (100.0%) |
| High School Diploma | 0 (0.0%) | 12 (100.0%) |
| College or Associate's Degree | 4 (20.0%) | 16 (80.0%) |
| Bachelor's Degree | 4 (100.0%) | 0 (0.0%) |
| Graduate Degree | 0 (0.0%) | 0 (0.0%) |
| Total | 8 (15.7%) | 43 (84.3%) |
Employment Characteristics in Collingsworth County
Employment by Class of Employer in Collingsworth County
Among the 1,218 employed individuals in Collingsworth County, private company employees (732 | 60.1%), local government employees (153 | 12.6%), and self-employed (not incorporated) (148 | 12.1%) make up the most common classes of employment.
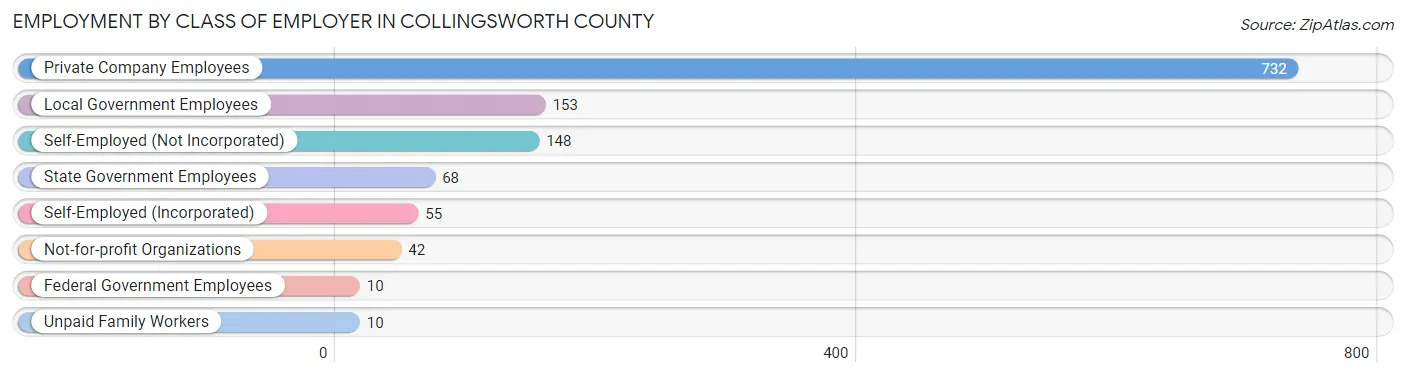
| Employer Class | # Employees | % Employees |
| Private Company Employees | 732 | 60.1% |
| Self-Employed (Incorporated) | 55 | 4.5% |
| Self-Employed (Not Incorporated) | 148 | 12.1% |
| Not-for-profit Organizations | 42 | 3.5% |
| Local Government Employees | 153 | 12.6% |
| State Government Employees | 68 | 5.6% |
| Federal Government Employees | 10 | 0.8% |
| Unpaid Family Workers | 10 | 0.8% |
| Total | 1,218 | 100.0% |
Employment Status by Age in Collingsworth County
According to the labor force statistics for Collingsworth County, out of the total population over 16 years of age (2,097), 64.1% or 1,344 individuals are in the labor force, with 2.8% or 38 of them unemployed. The age group with the highest labor force participation rate is 30 to 34 years, with 89.5% or 85 individuals in the labor force. Within the labor force, the 35 to 44 years age range has the highest percentage of unemployed individuals, with 7.6% or 27 of them being unemployed.
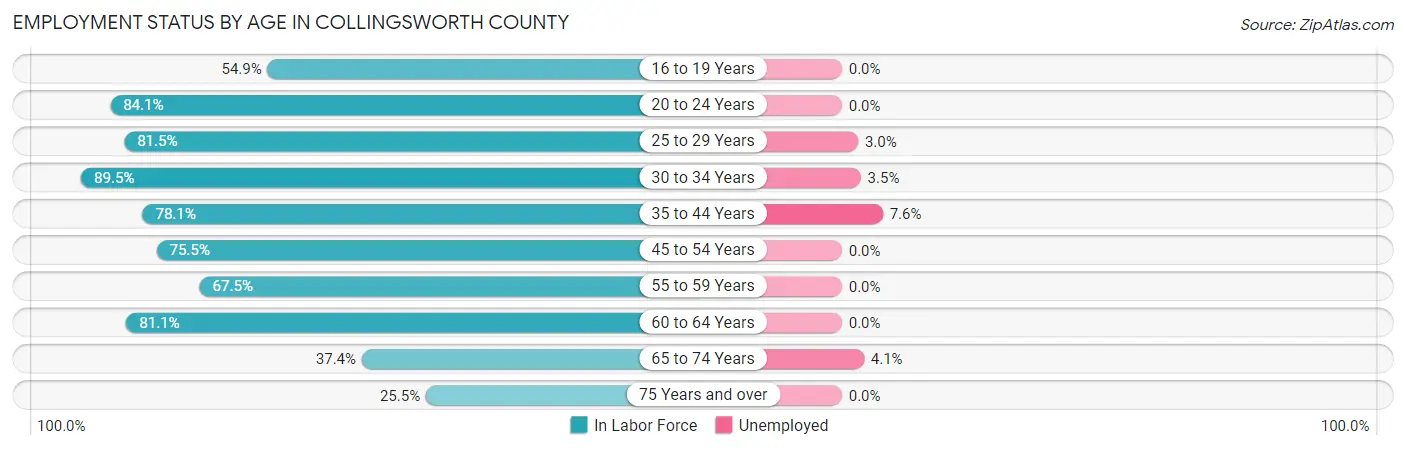
| Age Bracket | In Labor Force | Unemployed |
| 16 to 19 Years | 95 (54.9%) | 0 (0.0%) |
| 20 to 24 Years | 116 (84.1%) | 0 (0.0%) |
| 25 to 29 Years | 66 (81.5%) | 2 (3.0%) |
| 30 to 34 Years | 85 (89.5%) | 3 (3.5%) |
| 35 to 44 Years | 353 (78.1%) | 27 (7.6%) |
| 45 to 54 Years | 219 (75.5%) | 0 (0.0%) |
| 55 to 59 Years | 81 (67.5%) | 0 (0.0%) |
| 60 to 64 Years | 133 (81.1%) | 0 (0.0%) |
| 65 to 74 Years | 148 (37.4%) | 6 (4.1%) |
| 75 Years and over | 48 (25.5%) | 0 (0.0%) |
| Total | 1,344 (64.1%) | 38 (2.8%) |
Employment Status by Educational Attainment in Collingsworth County
According to labor force statistics for Collingsworth County, 78.0% of individuals (938) out of the total population between 25 and 64 years of age (1,202) are in the labor force, with 3.4% or 32 of them being unemployed. The group with the highest labor force participation rate are those with the educational attainment of bachelor's degree or higher, with 89.2% or 288 individuals in the labor force. Within the labor force, individuals with college / associate degree education have the highest percentage of unemployment, with 13.5% or 30 of them being unemployed.
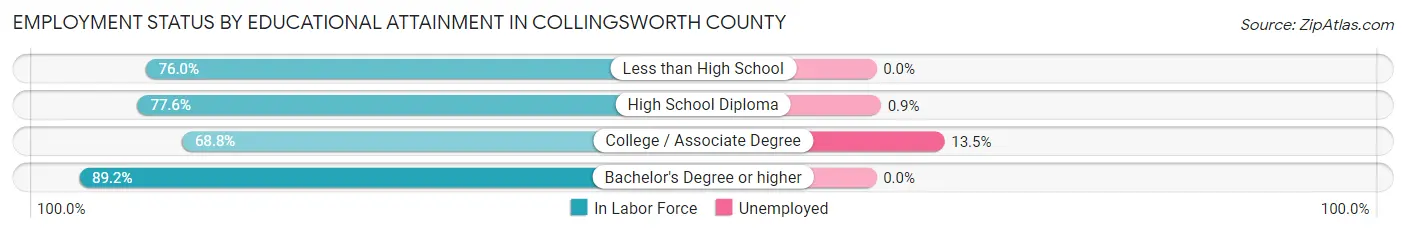
| Educational Attainment | In Labor Force | Unemployed |
| Less than High School | 215 (76.0%) | 0 (0.0%) |
| High School Diploma | 211 (77.6%) | 2 (0.9%) |
| College / Associate Degree | 223 (68.8%) | 44 (13.5%) |
| Bachelor's Degree or higher | 288 (89.2%) | 0 (0.0%) |
| Total | 938 (78.0%) | 41 (3.4%) |
Employment Occupations by Sex in Collingsworth County
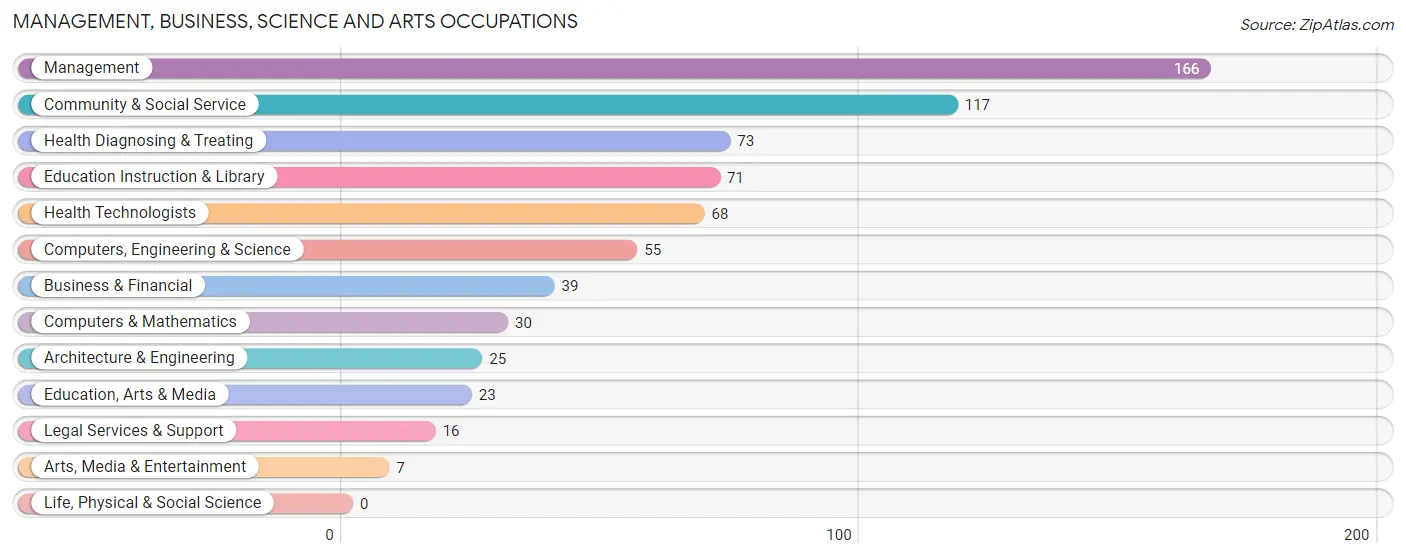
Management, Business, Science and Arts Occupations
The most common Management, Business, Science and Arts occupations in Collingsworth County are Management (166 | 12.7%), Community & Social Service (117 | 9.0%), Health Diagnosing & Treating (73 | 5.6%), Education Instruction & Library (71 | 5.4%), and Health Technologists (68 | 5.2%).
Management, Business, Science and Arts Occupations by Sex
Within the Management, Business, Science and Arts occupations in Collingsworth County, the most male-oriented occupations are Arts, Media & Entertainment (85.7%), Management (80.1%), and Education, Arts & Media (39.1%), while the most female-oriented occupations are Education Instruction & Library (100.0%), Health Diagnosing & Treating (87.7%), and Health Technologists (86.8%).
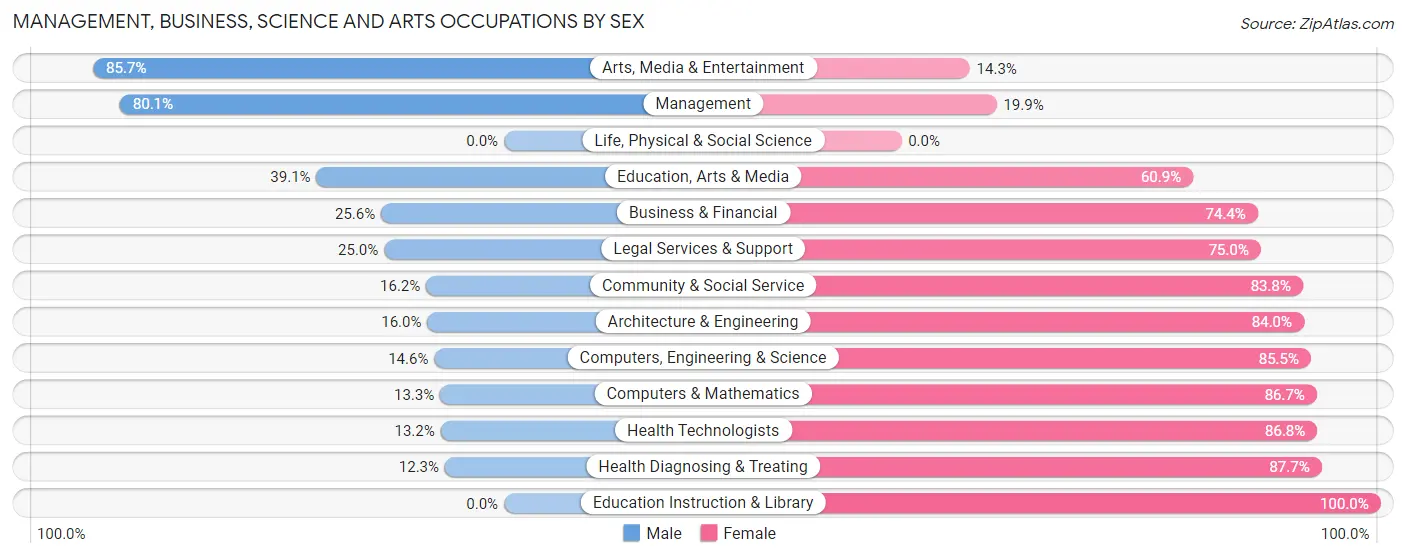
| Occupation | Male | Female |
| Management | 133 (80.1%) | 33 (19.9%) |
| Business & Financial | 10 (25.6%) | 29 (74.4%) |
| Computers, Engineering & Science | 8 (14.5%) | 47 (85.5%) |
| Computers & Mathematics | 4 (13.3%) | 26 (86.7%) |
| Architecture & Engineering | 4 (16.0%) | 21 (84.0%) |
| Life, Physical & Social Science | 0 (0.0%) | 0 (0.0%) |
| Community & Social Service | 19 (16.2%) | 98 (83.8%) |
| Education, Arts & Media | 9 (39.1%) | 14 (60.9%) |
| Legal Services & Support | 4 (25.0%) | 12 (75.0%) |
| Education Instruction & Library | 0 (0.0%) | 71 (100.0%) |
| Arts, Media & Entertainment | 6 (85.7%) | 1 (14.3%) |
| Health Diagnosing & Treating | 9 (12.3%) | 64 (87.7%) |
| Health Technologists | 9 (13.2%) | 59 (86.8%) |
| Total (Category) | 179 (39.8%) | 271 (60.2%) |
| Total (Overall) | 624 (47.8%) | 682 (52.2%) |
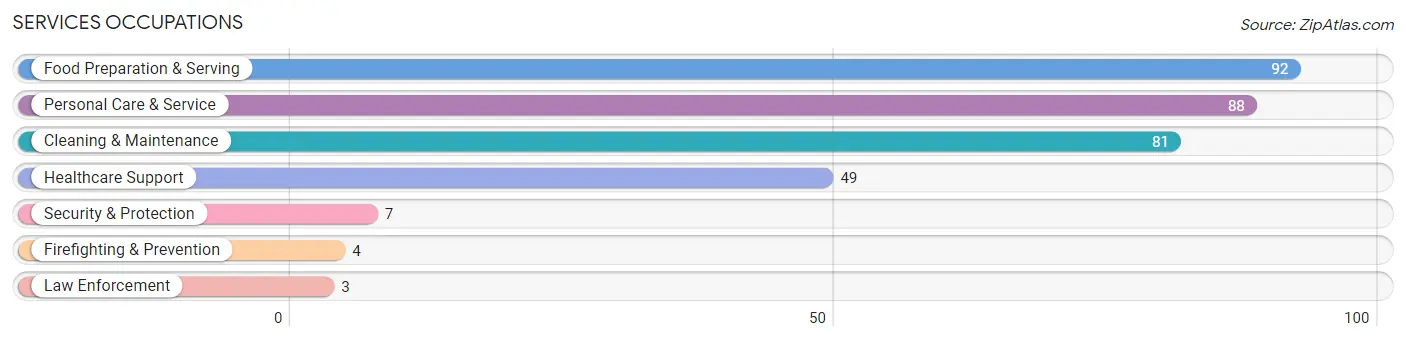
Services Occupations
The most common Services occupations in Collingsworth County are Food Preparation & Serving (92 | 7.0%), Personal Care & Service (88 | 6.7%), Cleaning & Maintenance (81 | 6.2%), Healthcare Support (49 | 3.7%), and Security & Protection (7 | 0.5%).
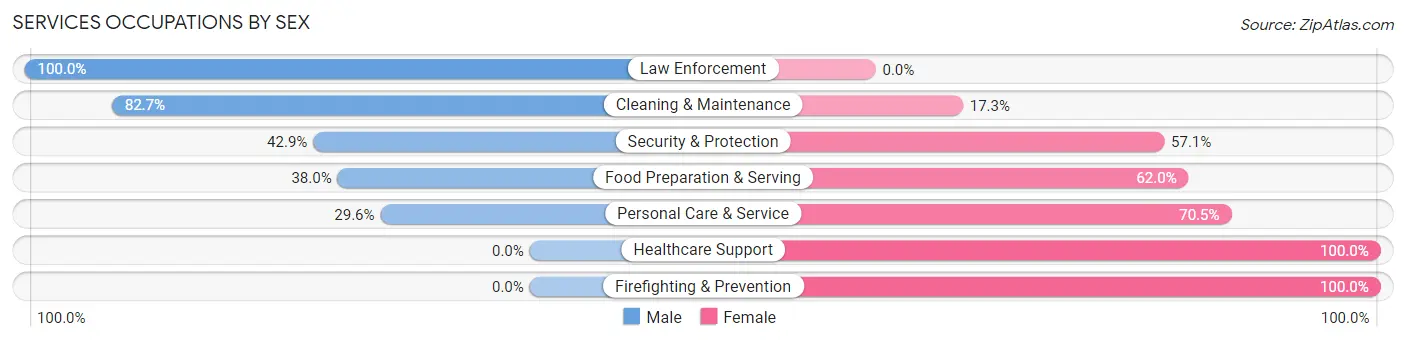
Services Occupations by Sex
Within the Services occupations in Collingsworth County, the most male-oriented occupations are Law Enforcement (100.0%), Cleaning & Maintenance (82.7%), and Security & Protection (42.9%), while the most female-oriented occupations are Healthcare Support (100.0%), Firefighting & Prevention (100.0%), and Personal Care & Service (70.5%).
| Occupation | Male | Female |
| Healthcare Support | 0 (0.0%) | 49 (100.0%) |
| Security & Protection | 3 (42.9%) | 4 (57.1%) |
| Firefighting & Prevention | 0 (0.0%) | 4 (100.0%) |
| Law Enforcement | 3 (100.0%) | 0 (0.0%) |
| Food Preparation & Serving | 35 (38.0%) | 57 (62.0%) |
| Cleaning & Maintenance | 67 (82.7%) | 14 (17.3%) |
| Personal Care & Service | 26 (29.5%) | 62 (70.5%) |
| Total (Category) | 131 (41.3%) | 186 (58.7%) |
| Total (Overall) | 624 (47.8%) | 682 (52.2%) |
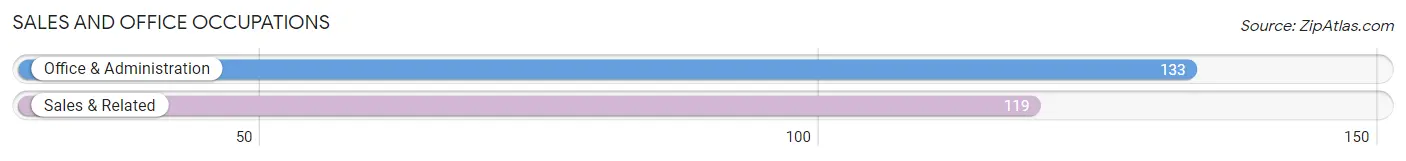
Sales and Office Occupations
The most common Sales and Office occupations in Collingsworth County are Office & Administration (133 | 10.2%), and Sales & Related (119 | 9.1%).
Sales and Office Occupations by Sex
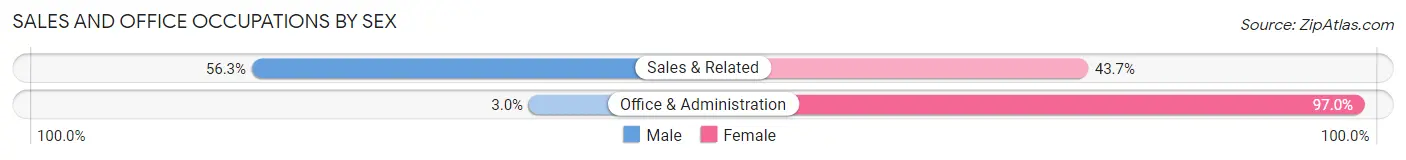
| Occupation | Male | Female |
| Sales & Related | 67 (56.3%) | 52 (43.7%) |
| Office & Administration | 4 (3.0%) | 129 (97.0%) |
| Total (Category) | 71 (28.2%) | 181 (71.8%) |
| Total (Overall) | 624 (47.8%) | 682 (52.2%) |
Natural Resources, Construction and Maintenance Occupations
The most common Natural Resources, Construction and Maintenance occupations in Collingsworth County are Construction & Extraction (90 | 6.9%), Farming, Fishing & Forestry (61 | 4.7%), and Installation, Maintenance & Repair (46 | 3.5%).
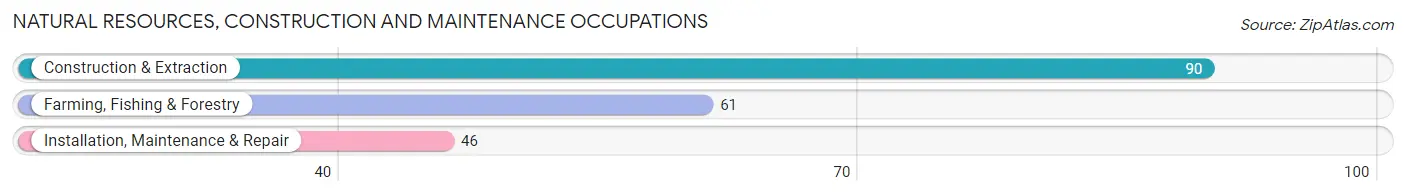
Natural Resources, Construction and Maintenance Occupations by Sex
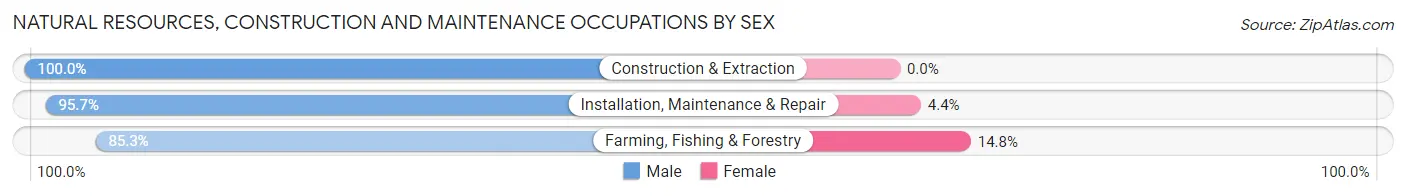
| Occupation | Male | Female |
| Farming, Fishing & Forestry | 52 (85.3%) | 9 (14.7%) |
| Construction & Extraction | 90 (100.0%) | 0 (0.0%) |
| Installation, Maintenance & Repair | 44 (95.7%) | 2 (4.3%) |
| Total (Category) | 186 (94.4%) | 11 (5.6%) |
| Total (Overall) | 624 (47.8%) | 682 (52.2%) |
Production, Transportation and Moving Occupations
The most common Production, Transportation and Moving occupations in Collingsworth County are Production (56 | 4.3%), Transportation (28 | 2.1%), and Material Moving (6 | 0.5%).
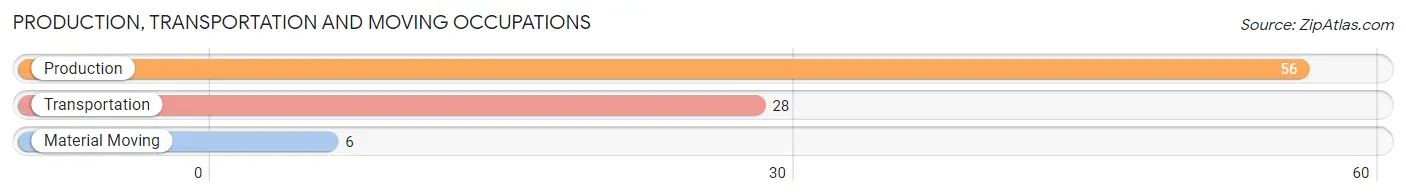
Production, Transportation and Moving Occupations by Sex
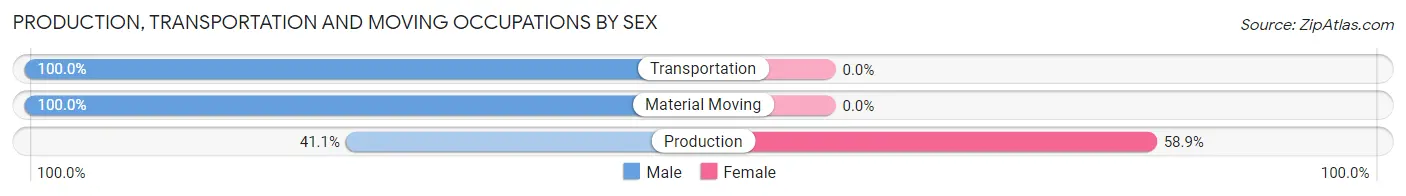
| Occupation | Male | Female |
| Production | 23 (41.1%) | 33 (58.9%) |
| Transportation | 28 (100.0%) | 0 (0.0%) |
| Material Moving | 6 (100.0%) | 0 (0.0%) |
| Total (Category) | 57 (63.3%) | 33 (36.7%) |
| Total (Overall) | 624 (47.8%) | 682 (52.2%) |
Employment Industries by Sex in Collingsworth County
Employment Industries in Collingsworth County
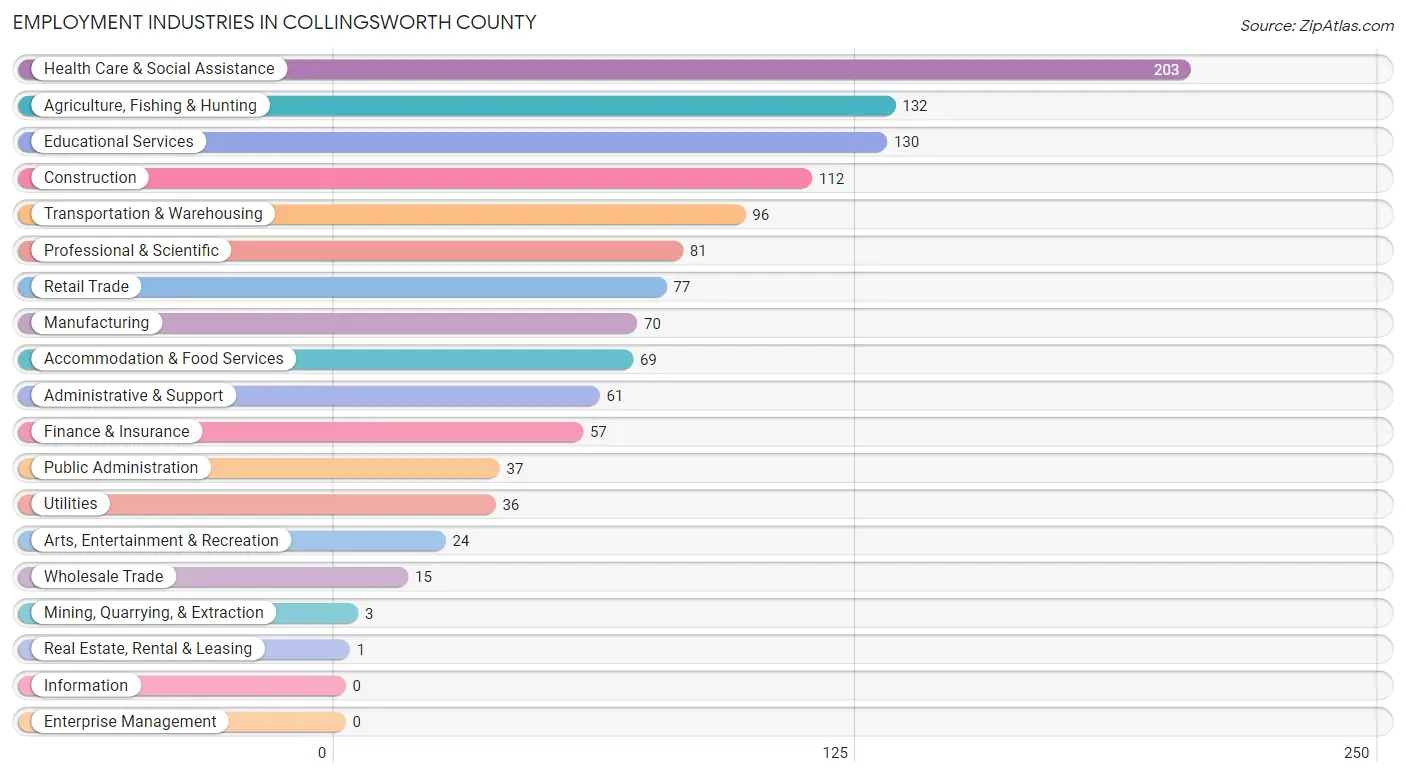
The major employment industries in Collingsworth County include Health Care & Social Assistance (203 | 15.5%), Agriculture, Fishing & Hunting (132 | 10.1%), Educational Services (130 | 10.0%), Construction (112 | 8.6%), and Transportation & Warehousing (96 | 7.3%).
Employment Industries by Sex in Collingsworth County
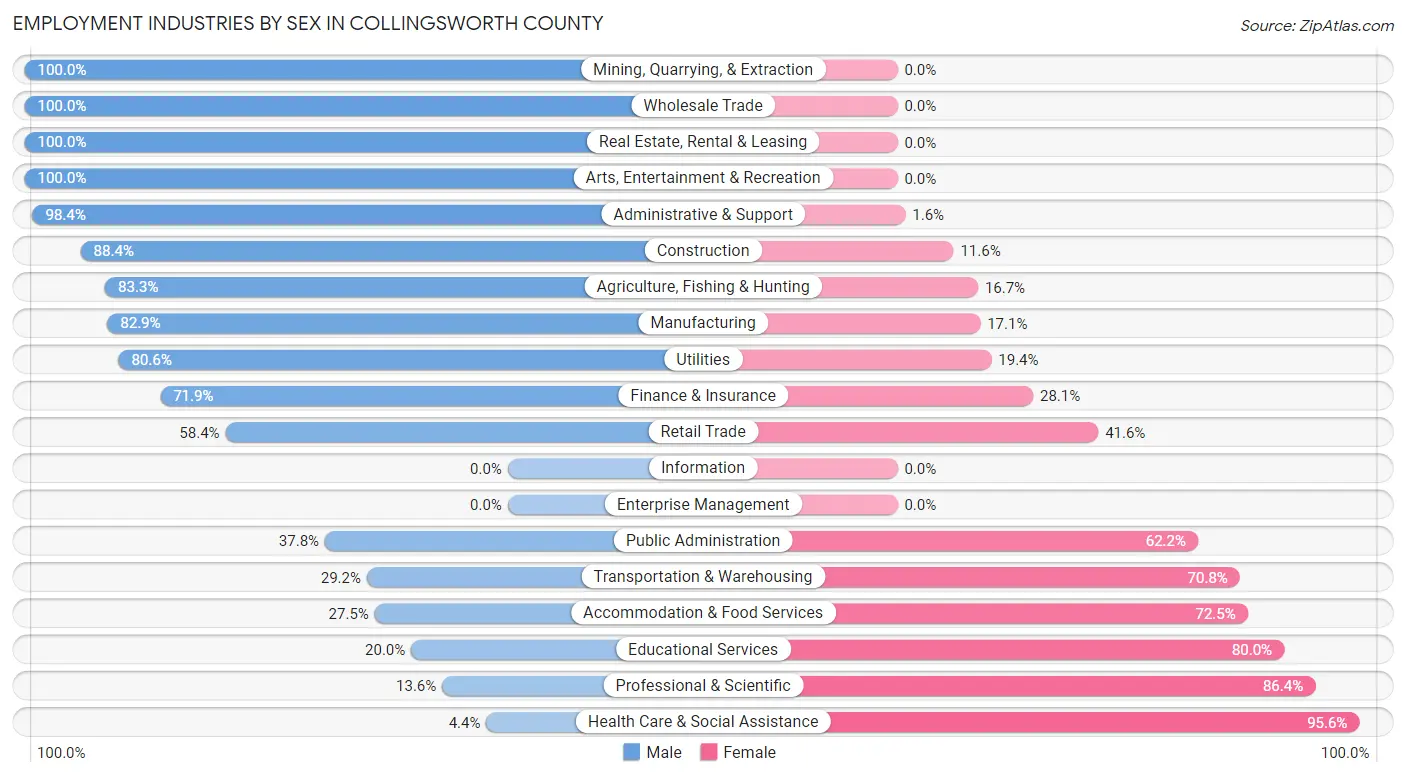
The Collingsworth County industries that see more men than women are Mining, Quarrying, & Extraction (100.0%), Wholesale Trade (100.0%), and Real Estate, Rental & Leasing (100.0%), whereas the industries that tend to have a higher number of women are Health Care & Social Assistance (95.6%), Professional & Scientific (86.4%), and Educational Services (80.0%).
| Industry | Male | Female |
| Agriculture, Fishing & Hunting | 110 (83.3%) | 22 (16.7%) |
| Mining, Quarrying, & Extraction | 3 (100.0%) | 0 (0.0%) |
| Construction | 99 (88.4%) | 13 (11.6%) |
| Manufacturing | 58 (82.9%) | 12 (17.1%) |
| Wholesale Trade | 15 (100.0%) | 0 (0.0%) |
| Retail Trade | 45 (58.4%) | 32 (41.6%) |
| Transportation & Warehousing | 28 (29.2%) | 68 (70.8%) |
| Utilities | 29 (80.6%) | 7 (19.4%) |
| Information | 0 (0.0%) | 0 (0.0%) |
| Finance & Insurance | 41 (71.9%) | 16 (28.1%) |
| Real Estate, Rental & Leasing | 1 (100.0%) | 0 (0.0%) |
| Professional & Scientific | 11 (13.6%) | 70 (86.4%) |
| Enterprise Management | 0 (0.0%) | 0 (0.0%) |
| Administrative & Support | 60 (98.4%) | 1 (1.6%) |
| Educational Services | 26 (20.0%) | 104 (80.0%) |
| Health Care & Social Assistance | 9 (4.4%) | 194 (95.6%) |
| Arts, Entertainment & Recreation | 24 (100.0%) | 0 (0.0%) |
| Accommodation & Food Services | 19 (27.5%) | 50 (72.5%) |
| Public Administration | 14 (37.8%) | 23 (62.2%) |
| Total | 624 (47.8%) | 682 (52.2%) |
Education in Collingsworth County
School Enrollment in Collingsworth County
The most common levels of schooling among the 838 students in Collingsworth County are elementary school (244 | 29.1%), middle school (242 | 28.9%), and high school (162 | 19.3%).
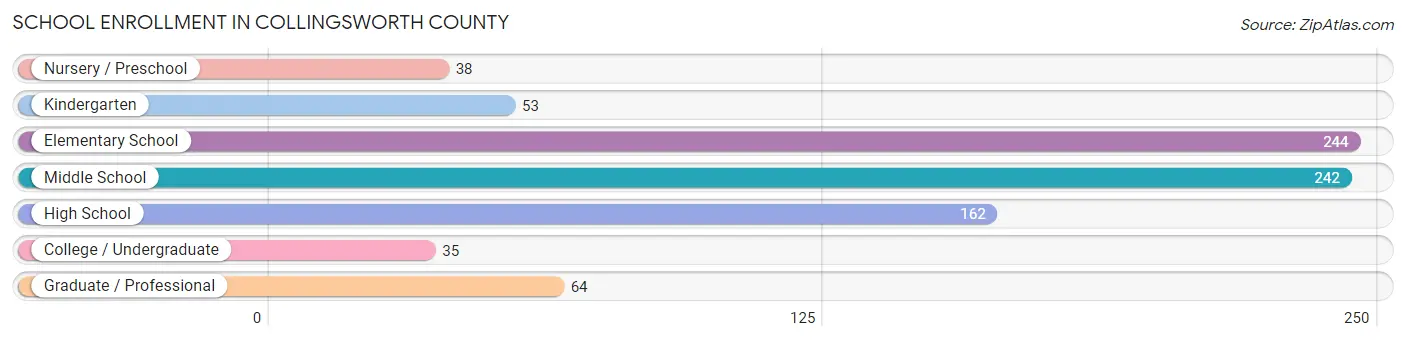
| School Level | # Students | % Students |
| Nursery / Preschool | 38 | 4.5% |
| Kindergarten | 53 | 6.3% |
| Elementary School | 244 | 29.1% |
| Middle School | 242 | 28.9% |
| High School | 162 | 19.3% |
| College / Undergraduate | 35 | 4.2% |
| Graduate / Professional | 64 | 7.6% |
| Total | 838 | 100.0% |
School Enrollment by Age by Funding Source in Collingsworth County
Out of a total of 838 students who are enrolled in schools in Collingsworth County, 47 (5.6%) attend a private institution, while the remaining 791 (94.4%) are enrolled in public schools. The age group of 35 years and over has the highest likelihood of being enrolled in private schools, with 13 (16.5% in the age bracket) enrolled. Conversely, the age group of 18 to 19 year olds has the lowest likelihood of being enrolled in a private school, with 44 (100.0% in the age bracket) attending a public institution.
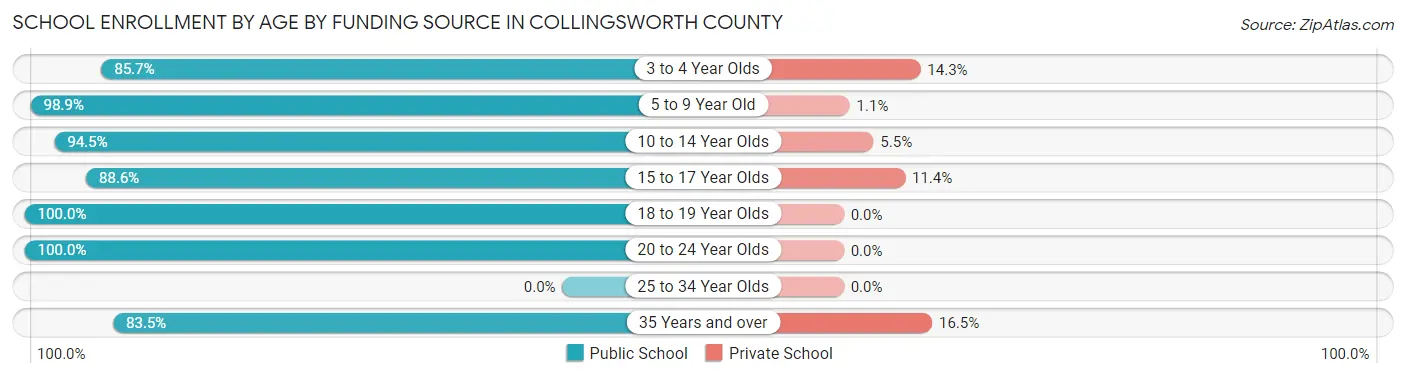
| Age Bracket | Public School | Private School |
| 3 to 4 Year Olds | 18 (85.7%) | 3 (14.3%) |
| 5 to 9 Year Old | 266 (98.9%) | 3 (1.1%) |
| 10 to 14 Year Olds | 273 (94.5%) | 16 (5.5%) |
| 15 to 17 Year Olds | 93 (88.6%) | 12 (11.4%) |
| 18 to 19 Year Olds | 44 (100.0%) | 0 (0.0%) |
| 20 to 24 Year Olds | 31 (100.0%) | 0 (0.0%) |
| 25 to 34 Year Olds | 0 (0.0%) | 0 (0.0%) |
| 35 Years and over | 66 (83.5%) | 13 (16.5%) |
| Total | 791 (94.4%) | 47 (5.6%) |
Educational Attainment by Field of Study in Collingsworth County
Science & technology (91 | 18.6%), bio, nature & agricultural (80 | 16.4%), psychology (76 | 15.5%), social sciences (51 | 10.4%), and education (47 | 9.6%) are the most common fields of study among 489 individuals in Collingsworth County who have obtained a bachelor's degree or higher.
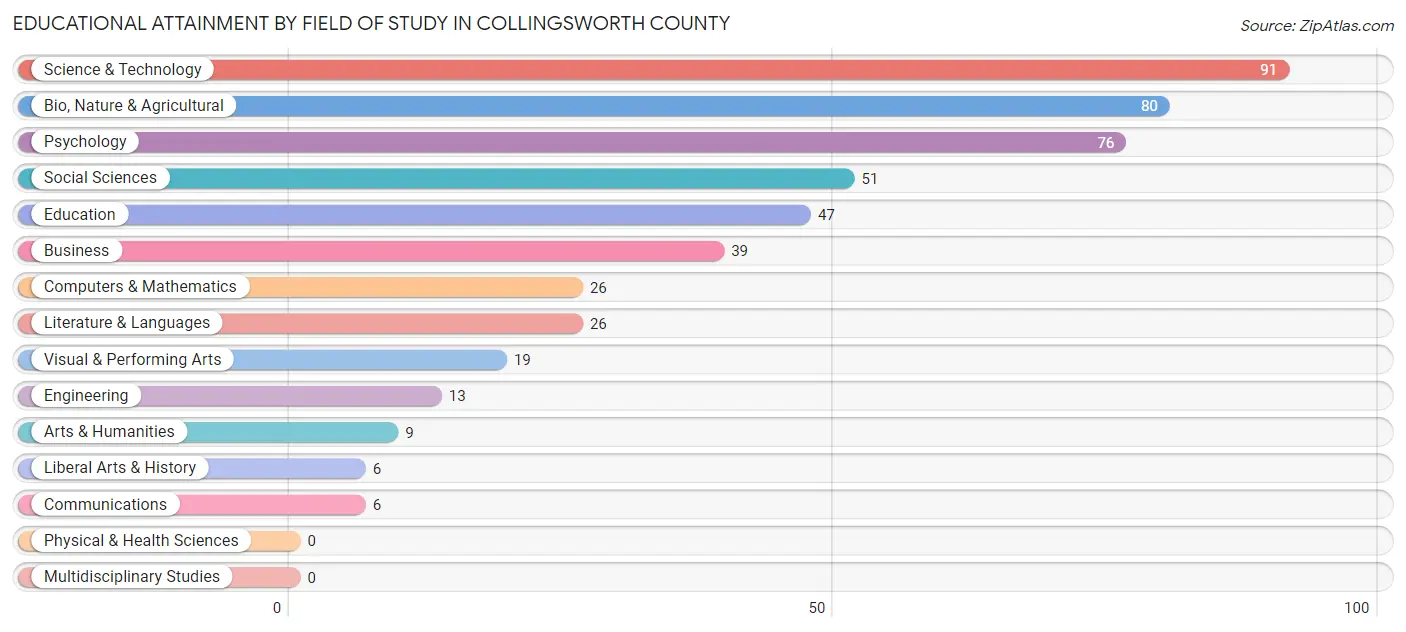
| Field of Study | # Graduates | % Graduates |
| Computers & Mathematics | 26 | 5.3% |
| Bio, Nature & Agricultural | 80 | 16.4% |
| Physical & Health Sciences | 0 | 0.0% |
| Psychology | 76 | 15.5% |
| Social Sciences | 51 | 10.4% |
| Engineering | 13 | 2.7% |
| Multidisciplinary Studies | 0 | 0.0% |
| Science & Technology | 91 | 18.6% |
| Business | 39 | 8.0% |
| Education | 47 | 9.6% |
| Literature & Languages | 26 | 5.3% |
| Liberal Arts & History | 6 | 1.2% |
| Visual & Performing Arts | 19 | 3.9% |
| Communications | 6 | 1.2% |
| Arts & Humanities | 9 | 1.8% |
| Total | 489 | 100.0% |
Transportation & Commute in Collingsworth County
Vehicle Availability by Sex in Collingsworth County
The most prevalent vehicle ownership categories in Collingsworth County are males with 2 vehicles (274, accounting for 43.9%) and females with 2 vehicles (186, making up 46.1%).
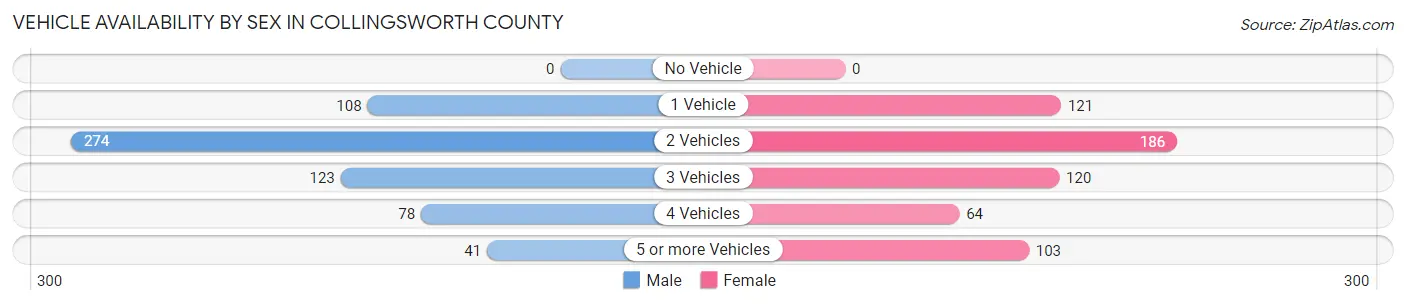
| Vehicles Available | Male | Female |
| No Vehicle | 0 (0.0%) | 0 (0.0%) |
| 1 Vehicle | 108 (17.3%) | 121 (20.4%) |
| 2 Vehicles | 274 (43.9%) | 186 (31.3%) |
| 3 Vehicles | 123 (19.7%) | 120 (20.2%) |
| 4 Vehicles | 78 (12.5%) | 64 (10.8%) |
| 5 or more Vehicles | 41 (6.6%) | 103 (17.3%) |
| Total | 624 (100.0%) | 594 (100.0%) |
Commute Time in Collingsworth County
The most frequently occuring commute durations in Collingsworth County are 5 to 9 minutes (349 commuters, 30.6%), less than 5 minutes (272 commuters, 23.9%), and 15 to 19 minutes (130 commuters, 11.4%).
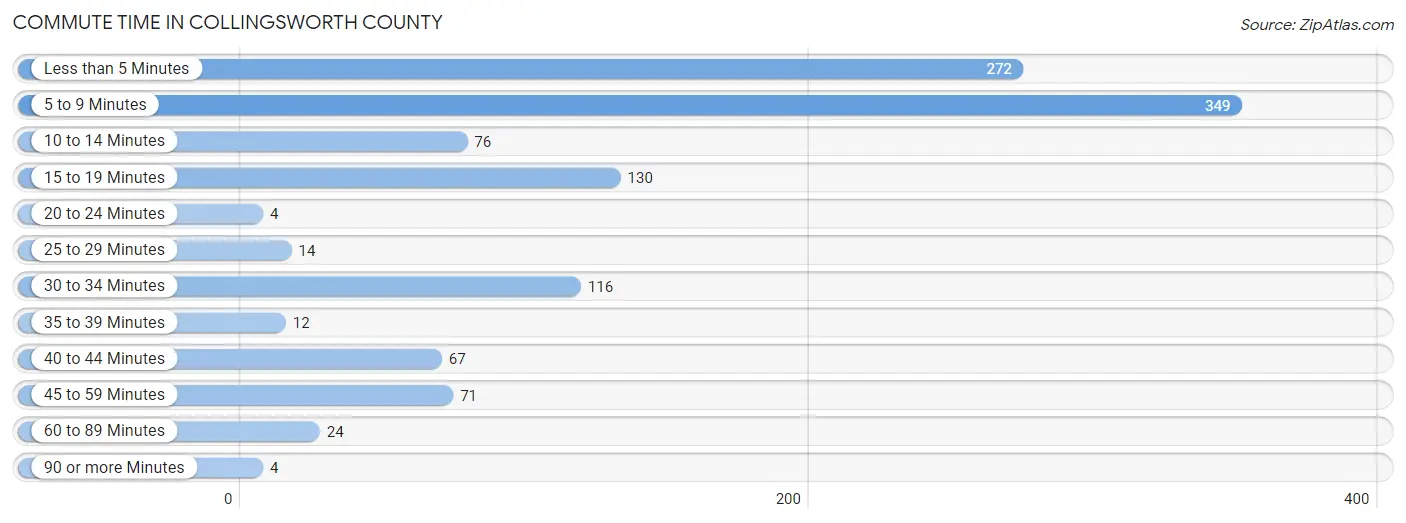
| Commute Time | # Commuters | % Commuters |
| Less than 5 Minutes | 272 | 23.9% |
| 5 to 9 Minutes | 349 | 30.6% |
| 10 to 14 Minutes | 76 | 6.7% |
| 15 to 19 Minutes | 130 | 11.4% |
| 20 to 24 Minutes | 4 | 0.4% |
| 25 to 29 Minutes | 14 | 1.2% |
| 30 to 34 Minutes | 116 | 10.2% |
| 35 to 39 Minutes | 12 | 1.1% |
| 40 to 44 Minutes | 67 | 5.9% |
| 45 to 59 Minutes | 71 | 6.2% |
| 60 to 89 Minutes | 24 | 2.1% |
| 90 or more Minutes | 4 | 0.4% |
Commute Time by Sex in Collingsworth County
The most common commute times in Collingsworth County are 5 to 9 minutes (147 commuters, 24.6%) for males and 5 to 9 minutes (202 commuters, 37.3%) for females.
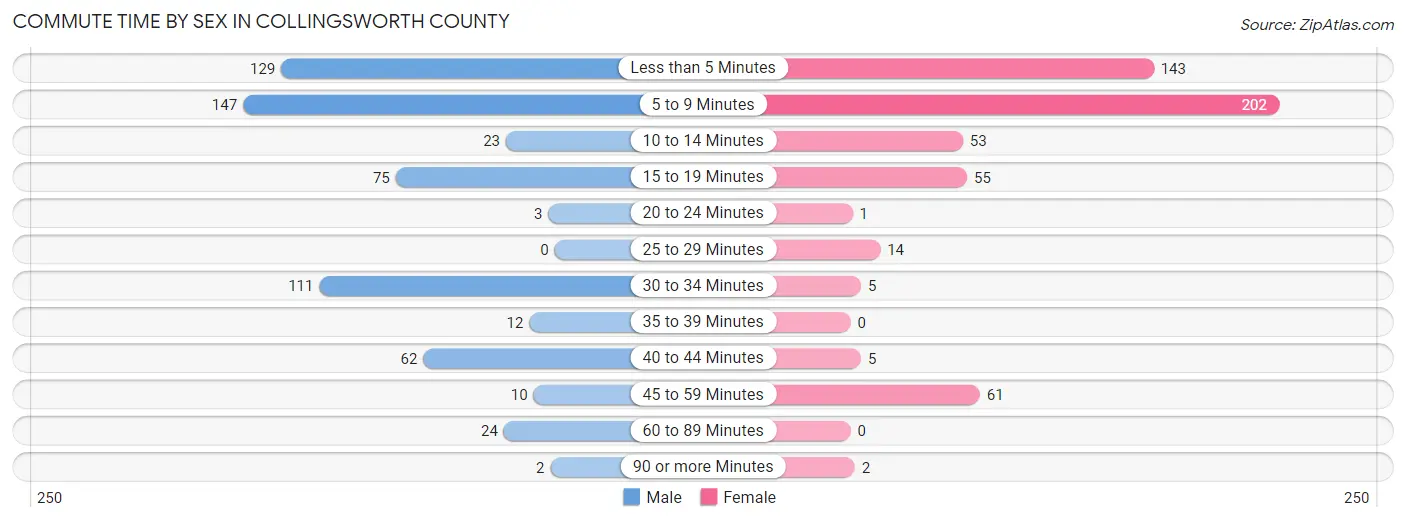
| Commute Time | Male | Female |
| Less than 5 Minutes | 129 (21.6%) | 143 (26.4%) |
| 5 to 9 Minutes | 147 (24.6%) | 202 (37.3%) |
| 10 to 14 Minutes | 23 (3.8%) | 53 (9.8%) |
| 15 to 19 Minutes | 75 (12.5%) | 55 (10.2%) |
| 20 to 24 Minutes | 3 (0.5%) | 1 (0.2%) |
| 25 to 29 Minutes | 0 (0.0%) | 14 (2.6%) |
| 30 to 34 Minutes | 111 (18.6%) | 5 (0.9%) |
| 35 to 39 Minutes | 12 (2.0%) | 0 (0.0%) |
| 40 to 44 Minutes | 62 (10.4%) | 5 (0.9%) |
| 45 to 59 Minutes | 10 (1.7%) | 61 (11.3%) |
| 60 to 89 Minutes | 24 (4.0%) | 0 (0.0%) |
| 90 or more Minutes | 2 (0.3%) | 2 (0.4%) |
Time of Departure to Work by Sex in Collingsworth County
The most frequent times of departure to work in Collingsworth County are 7:30 AM to 7:59 AM (127, 21.2%) for males and 9:00 AM to 9:59 AM (82, 15.2%) for females.
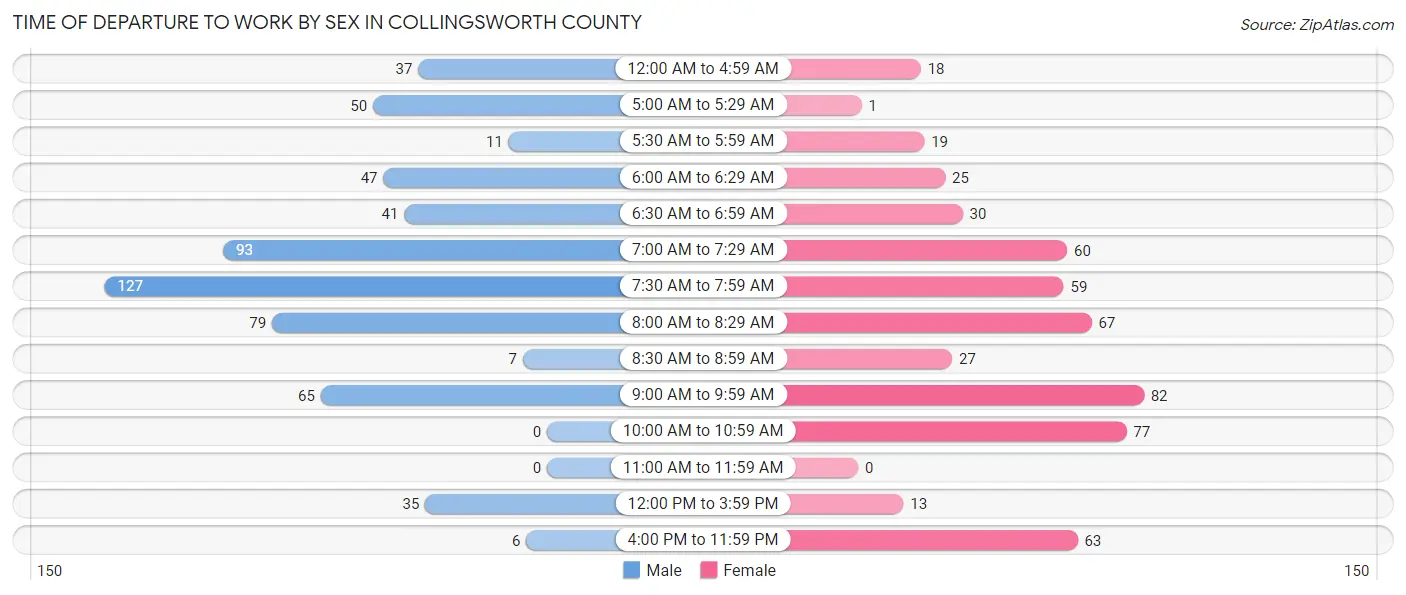
| Time of Departure | Male | Female |
| 12:00 AM to 4:59 AM | 37 (6.2%) | 18 (3.3%) |
| 5:00 AM to 5:29 AM | 50 (8.4%) | 1 (0.2%) |
| 5:30 AM to 5:59 AM | 11 (1.8%) | 19 (3.5%) |
| 6:00 AM to 6:29 AM | 47 (7.9%) | 25 (4.6%) |
| 6:30 AM to 6:59 AM | 41 (6.9%) | 30 (5.6%) |
| 7:00 AM to 7:29 AM | 93 (15.5%) | 60 (11.1%) |
| 7:30 AM to 7:59 AM | 127 (21.2%) | 59 (10.9%) |
| 8:00 AM to 8:29 AM | 79 (13.2%) | 67 (12.4%) |
| 8:30 AM to 8:59 AM | 7 (1.2%) | 27 (5.0%) |
| 9:00 AM to 9:59 AM | 65 (10.9%) | 82 (15.2%) |
| 10:00 AM to 10:59 AM | 0 (0.0%) | 77 (14.2%) |
| 11:00 AM to 11:59 AM | 0 (0.0%) | 0 (0.0%) |
| 12:00 PM to 3:59 PM | 35 (5.9%) | 13 (2.4%) |
| 4:00 PM to 11:59 PM | 6 (1.0%) | 63 (11.7%) |
| Total | 598 (100.0%) | 541 (100.0%) |
Housing Occupancy in Collingsworth County
Occupancy by Ownership in Collingsworth County
Of the total 1,018 dwellings in Collingsworth County, owner-occupied units account for 778 (76.4%), while renter-occupied units make up 240 (23.6%).
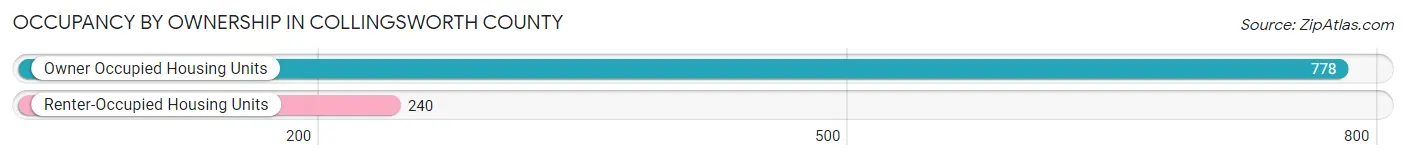
| Occupancy | # Housing Units | % Housing Units |
| Owner Occupied Housing Units | 778 | 76.4% |
| Renter-Occupied Housing Units | 240 | 23.6% |
| Total Occupied Housing Units | 1,018 | 100.0% |
Occupancy by Household Size in Collingsworth County
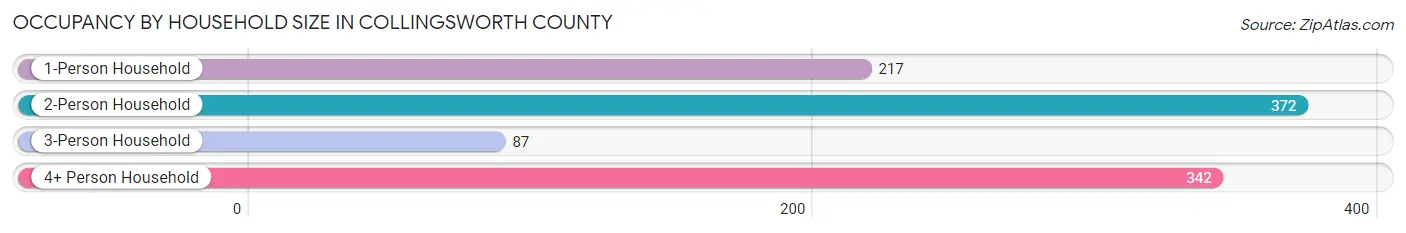
| Household Size | # Housing Units | % Housing Units |
| 1-Person Household | 217 | 21.3% |
| 2-Person Household | 372 | 36.5% |
| 3-Person Household | 87 | 8.6% |
| 4+ Person Household | 342 | 33.6% |
| Total Housing Units | 1,018 | 100.0% |
Occupancy by Ownership by Household Size in Collingsworth County
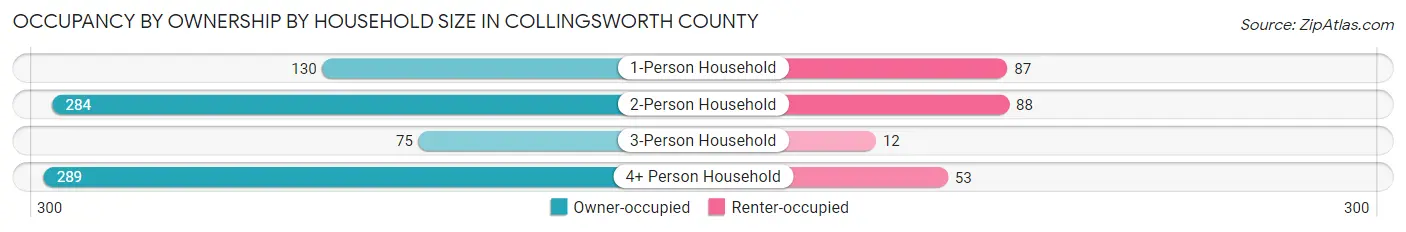
| Household Size | Owner-occupied | Renter-occupied |
| 1-Person Household | 130 (59.9%) | 87 (40.1%) |
| 2-Person Household | 284 (76.3%) | 88 (23.7%) |
| 3-Person Household | 75 (86.2%) | 12 (13.8%) |
| 4+ Person Household | 289 (84.5%) | 53 (15.5%) |
| Total Housing Units | 778 (76.4%) | 240 (23.6%) |
Occupancy by Educational Attainment in Collingsworth County
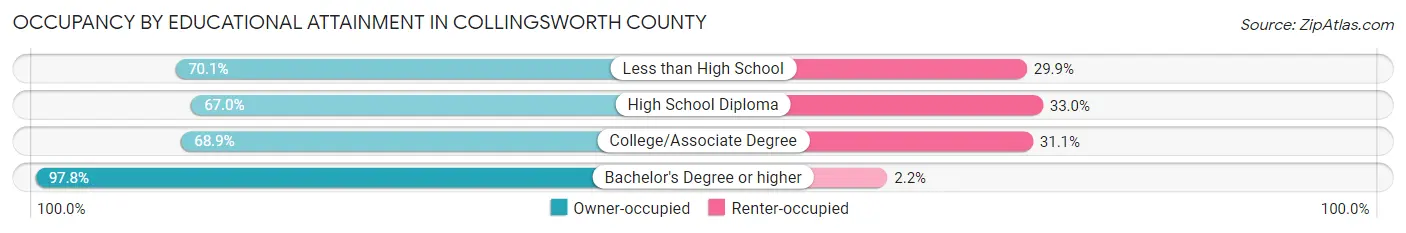
| Household Size | Owner-occupied | Renter-occupied |
| Less than High School | 148 (70.1%) | 63 (29.9%) |
| High School Diploma | 152 (67.0%) | 75 (33.0%) |
| College/Associate Degree | 213 (68.9%) | 96 (31.1%) |
| Bachelor's Degree or higher | 265 (97.8%) | 6 (2.2%) |
Occupancy by Age of Householder in Collingsworth County
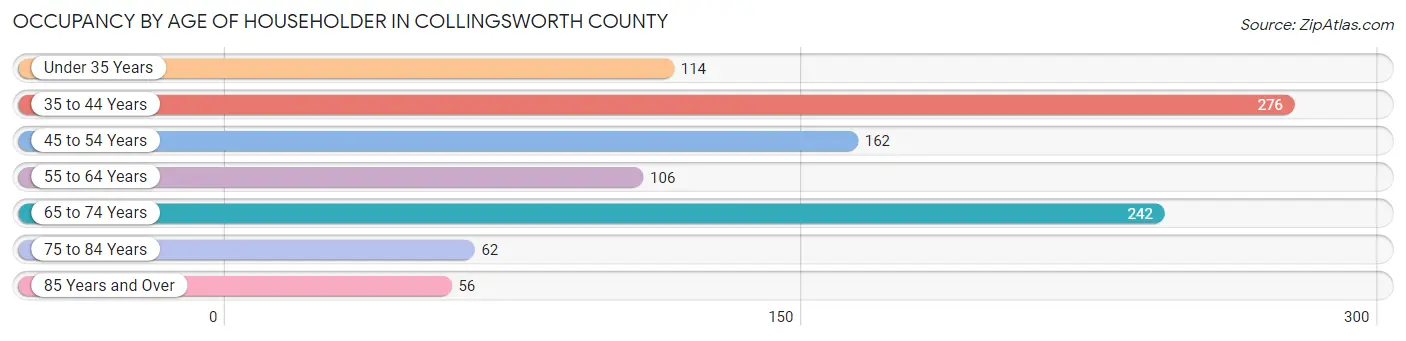
| Age Bracket | # Households | % Households |
| Under 35 Years | 114 | 11.2% |
| 35 to 44 Years | 276 | 27.1% |
| 45 to 54 Years | 162 | 15.9% |
| 55 to 64 Years | 106 | 10.4% |
| 65 to 74 Years | 242 | 23.8% |
| 75 to 84 Years | 62 | 6.1% |
| 85 Years and Over | 56 | 5.5% |
| Total | 1,018 | 100.0% |
Housing Finances in Collingsworth County
Median Income by Occupancy in Collingsworth County
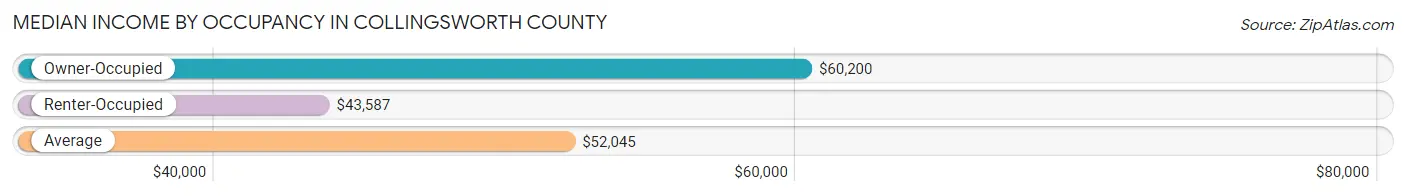
| Occupancy Type | # Households | Median Income |
| Owner-Occupied | 778 (76.4%) | $60,200 |
| Renter-Occupied | 240 (23.6%) | $43,587 |
| Average | 1,018 (100.0%) | $52,045 |
Occupancy by Householder Income Bracket in Collingsworth County
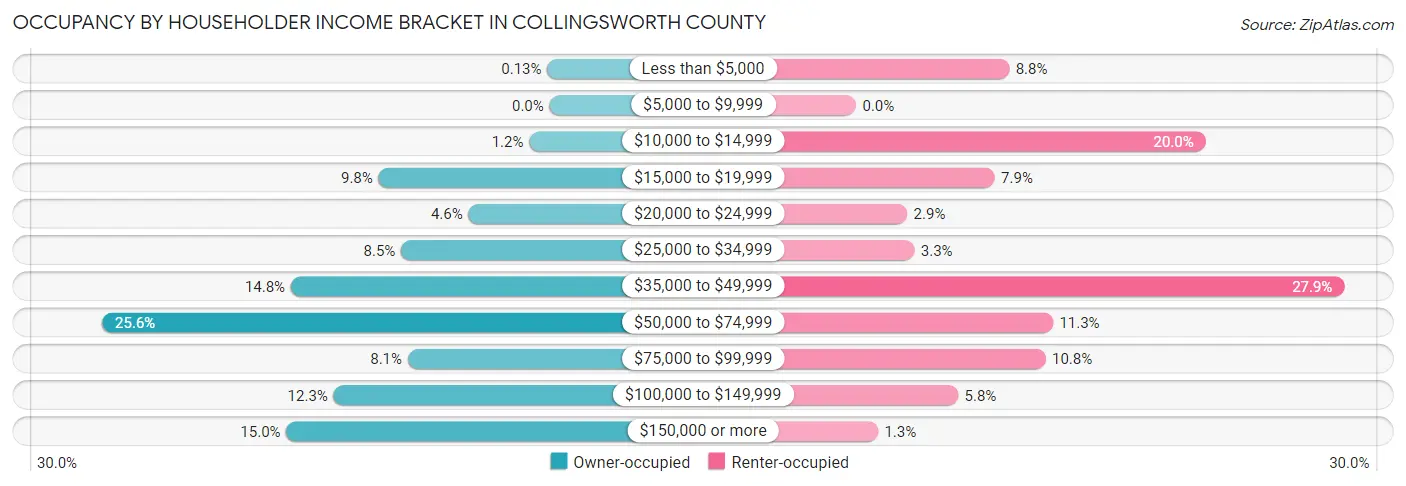
| Income Bracket | Owner-occupied | Renter-occupied |
| Less than $5,000 | 1 (0.1%) | 21 (8.7%) |
| $5,000 to $9,999 | 0 (0.0%) | 0 (0.0%) |
| $10,000 to $14,999 | 9 (1.2%) | 48 (20.0%) |
| $15,000 to $19,999 | 76 (9.8%) | 19 (7.9%) |
| $20,000 to $24,999 | 36 (4.6%) | 7 (2.9%) |
| $25,000 to $34,999 | 66 (8.5%) | 8 (3.3%) |
| $35,000 to $49,999 | 115 (14.8%) | 67 (27.9%) |
| $50,000 to $74,999 | 199 (25.6%) | 27 (11.3%) |
| $75,000 to $99,999 | 63 (8.1%) | 26 (10.8%) |
| $100,000 to $149,999 | 96 (12.3%) | 14 (5.8%) |
| $150,000 or more | 117 (15.0%) | 3 (1.3%) |
| Total | 778 (100.0%) | 240 (100.0%) |
Monthly Housing Cost Tiers in Collingsworth County
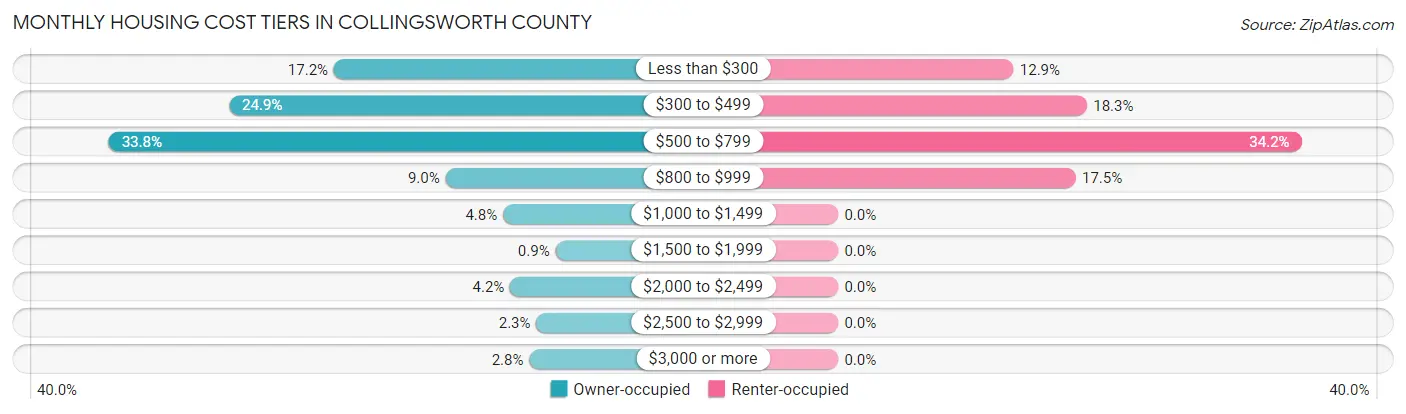
| Monthly Cost | Owner-occupied | Renter-occupied |
| Less than $300 | 134 (17.2%) | 31 (12.9%) |
| $300 to $499 | 194 (24.9%) | 44 (18.3%) |
| $500 to $799 | 263 (33.8%) | 82 (34.2%) |
| $800 to $999 | 70 (9.0%) | 42 (17.5%) |
| $1,000 to $1,499 | 37 (4.8%) | 0 (0.0%) |
| $1,500 to $1,999 | 7 (0.9%) | 0 (0.0%) |
| $2,000 to $2,499 | 33 (4.2%) | 0 (0.0%) |
| $2,500 to $2,999 | 18 (2.3%) | 0 (0.0%) |
| $3,000 or more | 22 (2.8%) | 0 (0.0%) |
| Total | 778 (100.0%) | 240 (100.0%) |
Physical Housing Characteristics in Collingsworth County
Housing Structures in Collingsworth County
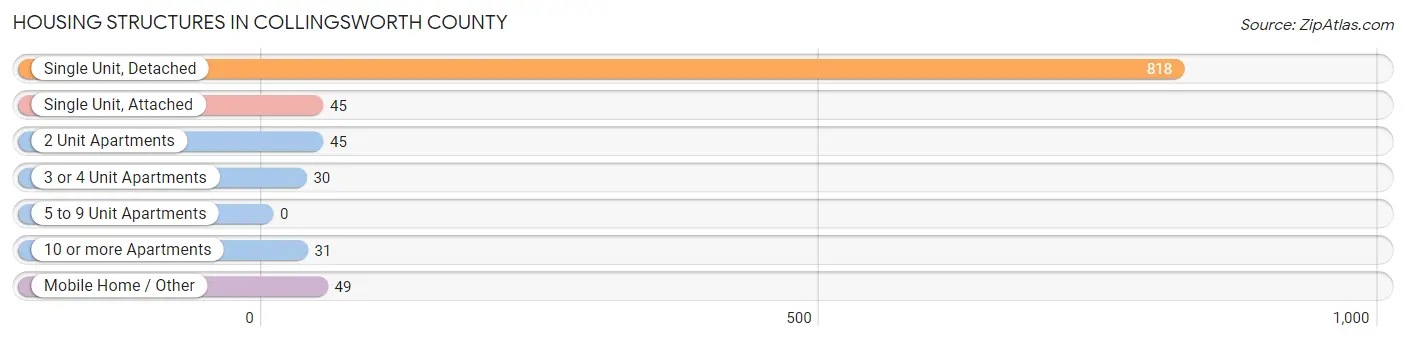
| Structure Type | # Housing Units | % Housing Units |
| Single Unit, Detached | 818 | 80.3% |
| Single Unit, Attached | 45 | 4.4% |
| 2 Unit Apartments | 45 | 4.4% |
| 3 or 4 Unit Apartments | 30 | 2.9% |
| 5 to 9 Unit Apartments | 0 | 0.0% |
| 10 or more Apartments | 31 | 3.0% |
| Mobile Home / Other | 49 | 4.8% |
| Total | 1,018 | 100.0% |
Housing Structures by Occupancy in Collingsworth County
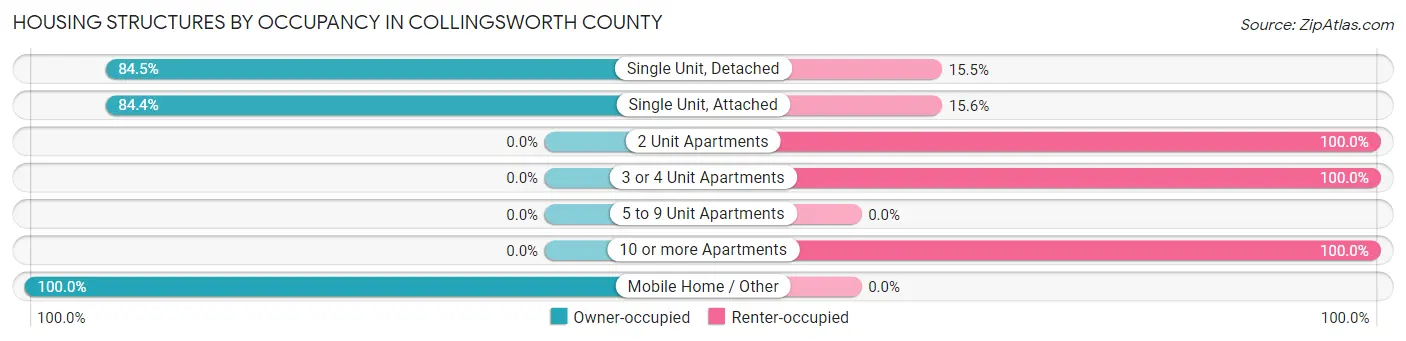
| Structure Type | Owner-occupied | Renter-occupied |
| Single Unit, Detached | 691 (84.5%) | 127 (15.5%) |
| Single Unit, Attached | 38 (84.4%) | 7 (15.6%) |
| 2 Unit Apartments | 0 (0.0%) | 45 (100.0%) |
| 3 or 4 Unit Apartments | 0 (0.0%) | 30 (100.0%) |
| 5 to 9 Unit Apartments | 0 (0.0%) | 0 (0.0%) |
| 10 or more Apartments | 0 (0.0%) | 31 (100.0%) |
| Mobile Home / Other | 49 (100.0%) | 0 (0.0%) |
| Total | 778 (76.4%) | 240 (23.6%) |
Housing Structures by Number of Rooms in Collingsworth County
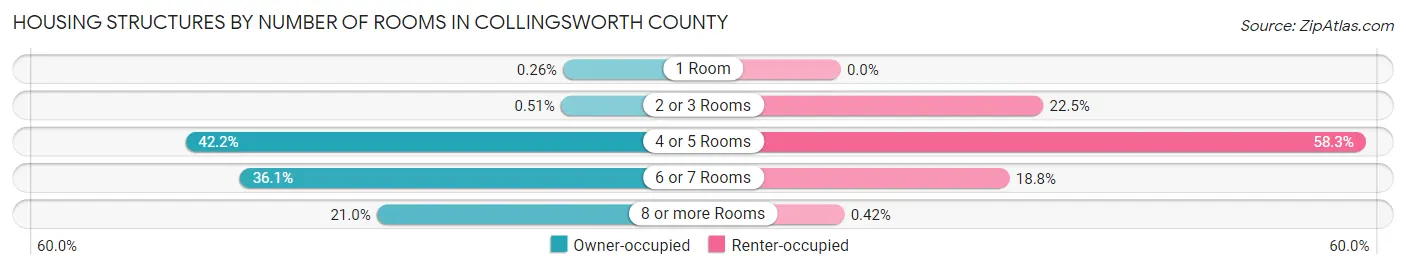
| Number of Rooms | Owner-occupied | Renter-occupied |
| 1 Room | 2 (0.3%) | 0 (0.0%) |
| 2 or 3 Rooms | 4 (0.5%) | 54 (22.5%) |
| 4 or 5 Rooms | 328 (42.2%) | 140 (58.3%) |
| 6 or 7 Rooms | 281 (36.1%) | 45 (18.8%) |
| 8 or more Rooms | 163 (20.9%) | 1 (0.4%) |
| Total | 778 (100.0%) | 240 (100.0%) |
Housing Structure by Heating Type in Collingsworth County
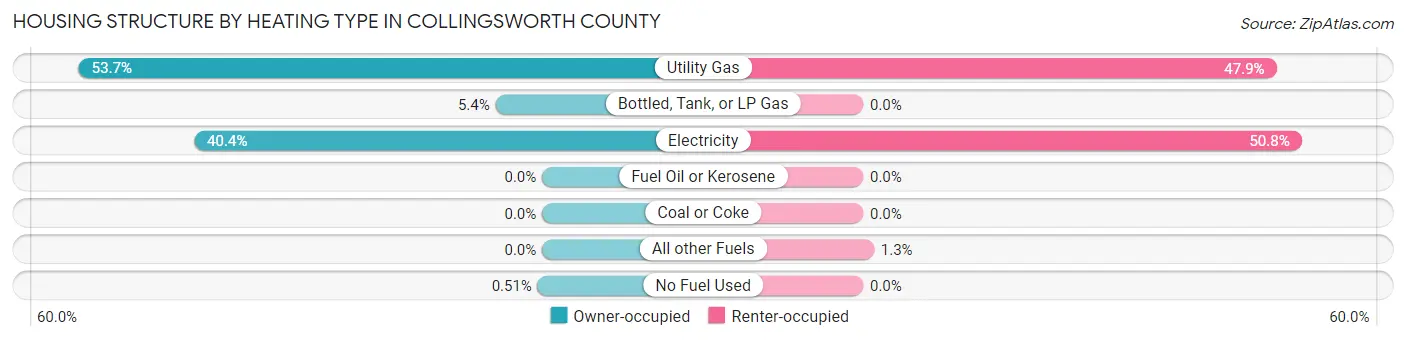
| Heating Type | Owner-occupied | Renter-occupied |
| Utility Gas | 418 (53.7%) | 115 (47.9%) |
| Bottled, Tank, or LP Gas | 42 (5.4%) | 0 (0.0%) |
| Electricity | 314 (40.4%) | 122 (50.8%) |
| Fuel Oil or Kerosene | 0 (0.0%) | 0 (0.0%) |
| Coal or Coke | 0 (0.0%) | 0 (0.0%) |
| All other Fuels | 0 (0.0%) | 3 (1.3%) |
| No Fuel Used | 4 (0.5%) | 0 (0.0%) |
| Total | 778 (100.0%) | 240 (100.0%) |
Household Vehicle Usage in Collingsworth County
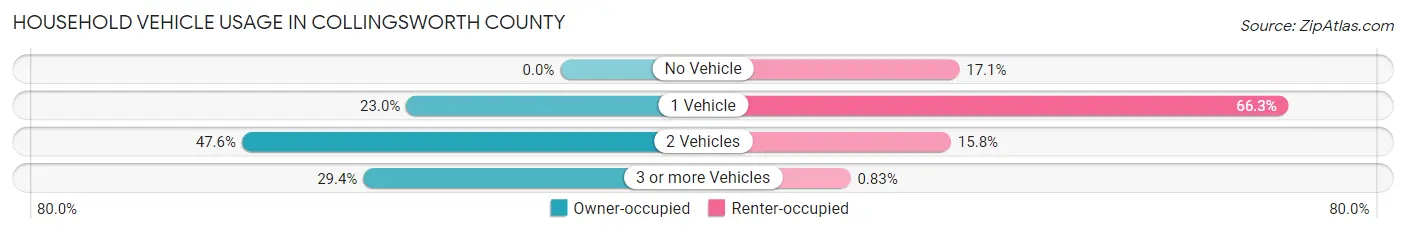
| Vehicles per Household | Owner-occupied | Renter-occupied |
| No Vehicle | 0 (0.0%) | 41 (17.1%) |
| 1 Vehicle | 179 (23.0%) | 159 (66.2%) |
| 2 Vehicles | 370 (47.6%) | 38 (15.8%) |
| 3 or more Vehicles | 229 (29.4%) | 2 (0.8%) |
| Total | 778 (100.0%) | 240 (100.0%) |
Real Estate & Mortgages in Collingsworth County
Real Estate and Mortgage Overview in Collingsworth County
| Characteristic | Without Mortgage | With Mortgage |
| Housing Units | 533 | 245 |
| Median Property Value | $104,200 | $82,200 |
| Median Household Income | $60,152 | $38 |
| Monthly Housing Costs | $438 | $22 |
| Real Estate Taxes | $1,207 | $0 |
Property Value by Mortgage Status in Collingsworth County
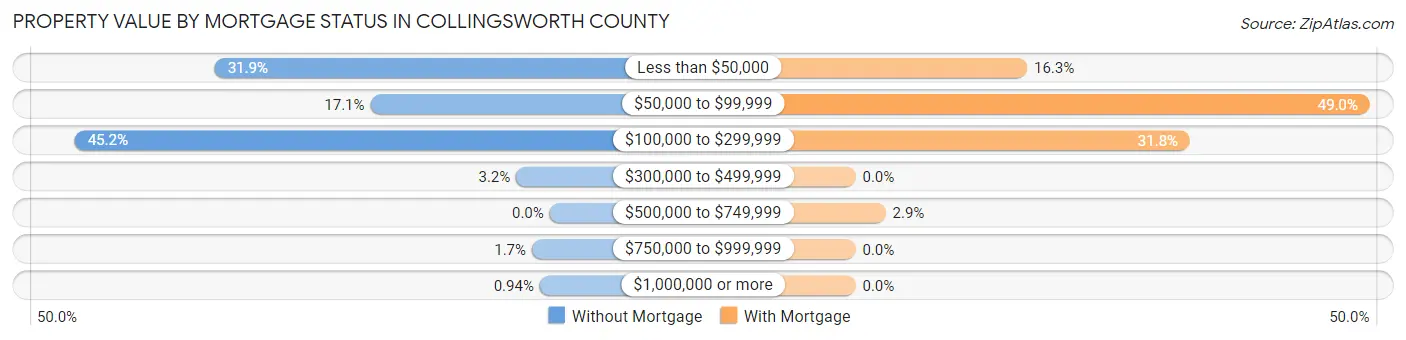
| Property Value | Without Mortgage | With Mortgage |
| Less than $50,000 | 170 (31.9%) | 40 (16.3%) |
| $50,000 to $99,999 | 91 (17.1%) | 120 (49.0%) |
| $100,000 to $299,999 | 241 (45.2%) | 78 (31.8%) |
| $300,000 to $499,999 | 17 (3.2%) | 0 (0.0%) |
| $500,000 to $749,999 | 0 (0.0%) | 7 (2.9%) |
| $750,000 to $999,999 | 9 (1.7%) | 0 (0.0%) |
| $1,000,000 or more | 5 (0.9%) | 0 (0.0%) |
| Total | 533 (100.0%) | 245 (100.0%) |
Household Income by Mortgage Status in Collingsworth County
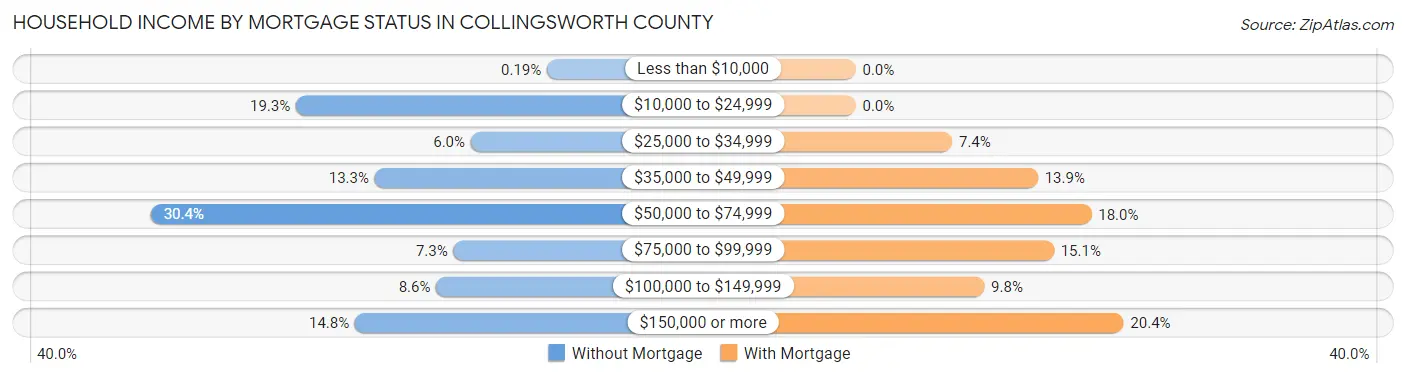
| Household Income | Without Mortgage | With Mortgage |
| Less than $10,000 | 1 (0.2%) | 0 (0.0%) |
| $10,000 to $24,999 | 103 (19.3%) | 0 (0.0%) |
| $25,000 to $34,999 | 32 (6.0%) | 18 (7.3%) |
| $35,000 to $49,999 | 71 (13.3%) | 34 (13.9%) |
| $50,000 to $74,999 | 162 (30.4%) | 44 (18.0%) |
| $75,000 to $99,999 | 39 (7.3%) | 37 (15.1%) |
| $100,000 to $149,999 | 46 (8.6%) | 24 (9.8%) |
| $150,000 or more | 79 (14.8%) | 50 (20.4%) |
| Total | 533 (100.0%) | 245 (100.0%) |
Property Value to Household Income Ratio in Collingsworth County
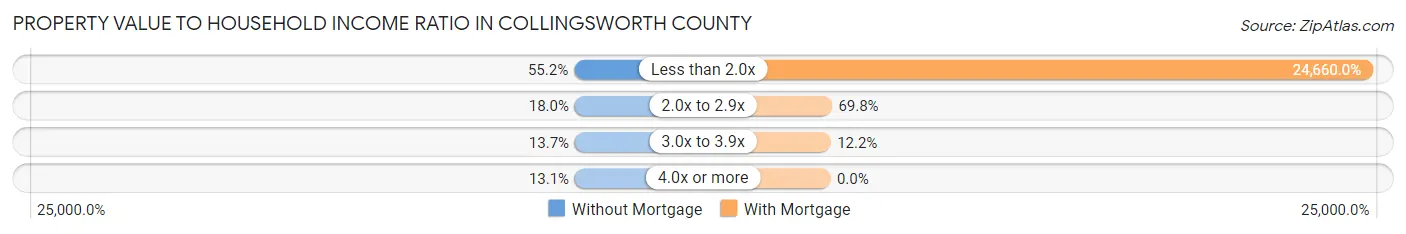
| Value-to-Income Ratio | Without Mortgage | With Mortgage |
| Less than 2.0x | 294 (55.2%) | 60,417 (24,660.0%) |
| 2.0x to 2.9x | 96 (18.0%) | 171 (69.8%) |
| 3.0x to 3.9x | 73 (13.7%) | 30 (12.2%) |
| 4.0x or more | 70 (13.1%) | 0 (0.0%) |
| Total | 533 (100.0%) | 245 (100.0%) |
Real Estate Taxes by Mortgage Status in Collingsworth County
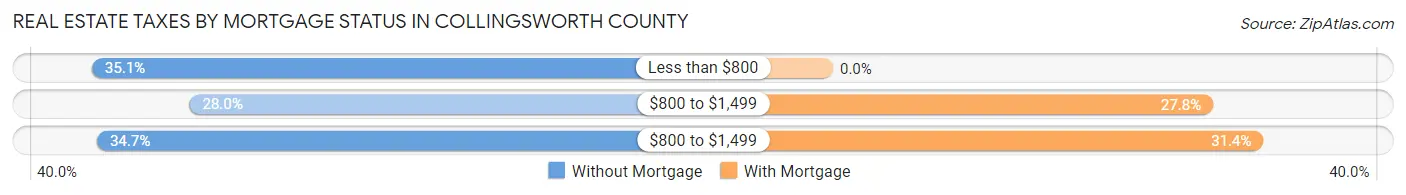
| Property Taxes | Without Mortgage | With Mortgage |
| Less than $800 | 187 (35.1%) | 0 (0.0%) |
| $800 to $1,499 | 149 (28.0%) | 68 (27.8%) |
| $800 to $1,499 | 185 (34.7%) | 77 (31.4%) |
| Total | 533 (100.0%) | 245 (100.0%) |
Health & Disability in Collingsworth County
Health Insurance Coverage by Age in Collingsworth County
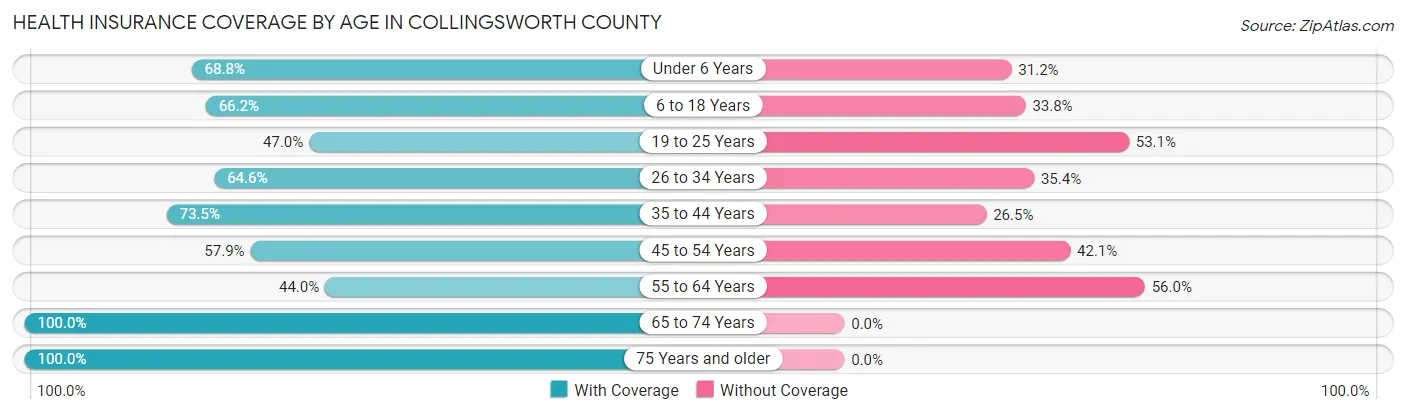
| Age Bracket | With Coverage | Without Coverage |
| Under 6 Years | 137 (68.8%) | 62 (31.2%) |
| 6 to 18 Years | 490 (66.2%) | 250 (33.8%) |
| 19 to 25 Years | 77 (46.9%) | 87 (53.0%) |
| 26 to 34 Years | 95 (64.6%) | 52 (35.4%) |
| 35 to 44 Years | 325 (73.5%) | 117 (26.5%) |
| 45 to 54 Years | 165 (57.9%) | 120 (42.1%) |
| 55 to 64 Years | 124 (44.0%) | 158 (56.0%) |
| 65 to 74 Years | 370 (100.0%) | 0 (0.0%) |
| 75 Years and older | 165 (100.0%) | 0 (0.0%) |
| Total | 1,948 (69.7%) | 846 (30.3%) |
Health Insurance Coverage by Citizenship Status in Collingsworth County
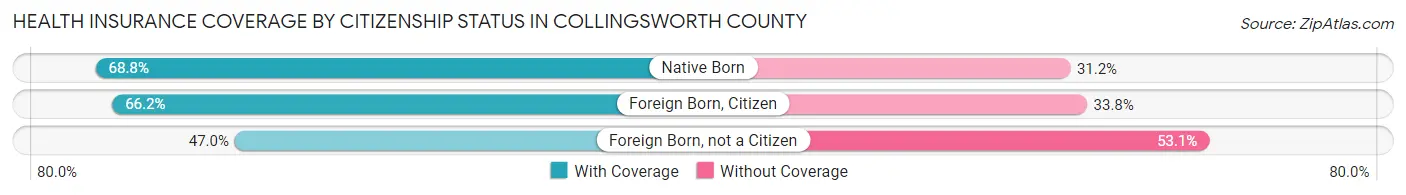
| Citizenship Status | With Coverage | Without Coverage |
| Native Born | 137 (68.8%) | 62 (31.2%) |
| Foreign Born, Citizen | 490 (66.2%) | 250 (33.8%) |
| Foreign Born, not a Citizen | 77 (46.9%) | 87 (53.0%) |
Health Insurance Coverage by Household Income in Collingsworth County
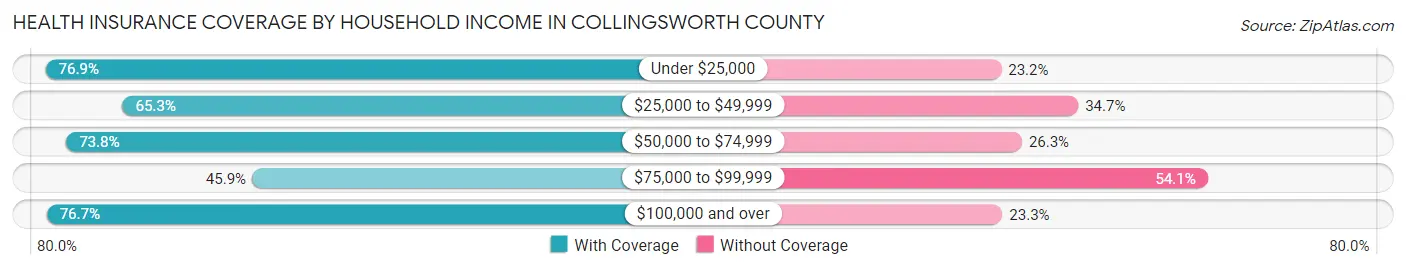
| Household Income | With Coverage | Without Coverage |
| Under $25,000 | 342 (76.8%) | 103 (23.2%) |
| $25,000 to $49,999 | 433 (65.3%) | 230 (34.7%) |
| $50,000 to $74,999 | 354 (73.8%) | 126 (26.3%) |
| $75,000 to $99,999 | 158 (45.9%) | 186 (54.1%) |
| $100,000 and over | 661 (76.7%) | 201 (23.3%) |
Public vs Private Health Insurance Coverage by Age in Collingsworth County
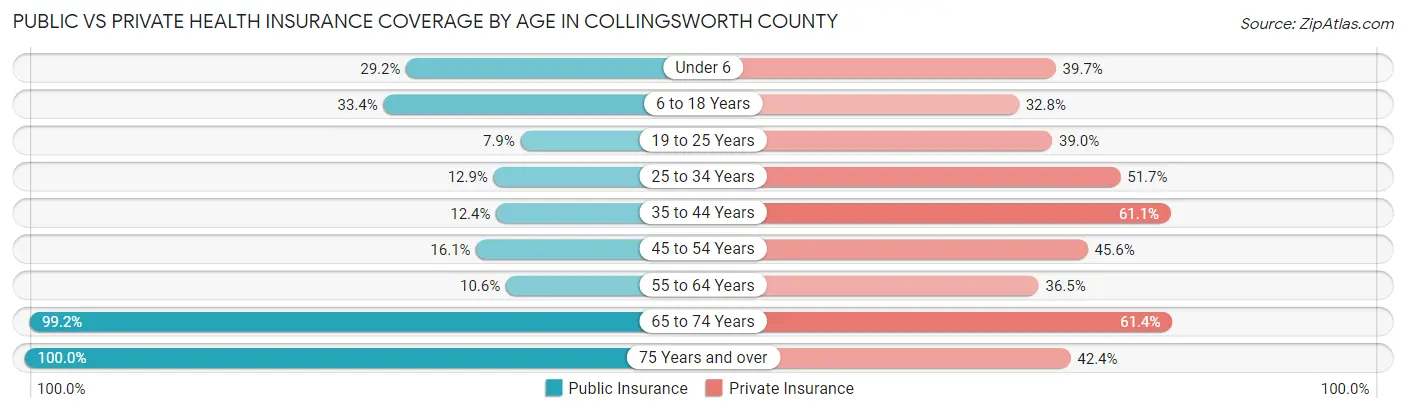
| Age Bracket | Public Insurance | Private Insurance |
| Under 6 | 58 (29.1%) | 79 (39.7%) |
| 6 to 18 Years | 247 (33.4%) | 243 (32.8%) |
| 19 to 25 Years | 13 (7.9%) | 64 (39.0%) |
| 25 to 34 Years | 19 (12.9%) | 76 (51.7%) |
| 35 to 44 Years | 55 (12.4%) | 270 (61.1%) |
| 45 to 54 Years | 46 (16.1%) | 130 (45.6%) |
| 55 to 64 Years | 30 (10.6%) | 103 (36.5%) |
| 65 to 74 Years | 367 (99.2%) | 227 (61.4%) |
| 75 Years and over | 165 (100.0%) | 70 (42.4%) |
| Total | 1,000 (35.8%) | 1,262 (45.2%) |
Disability Status by Sex by Age in Collingsworth County
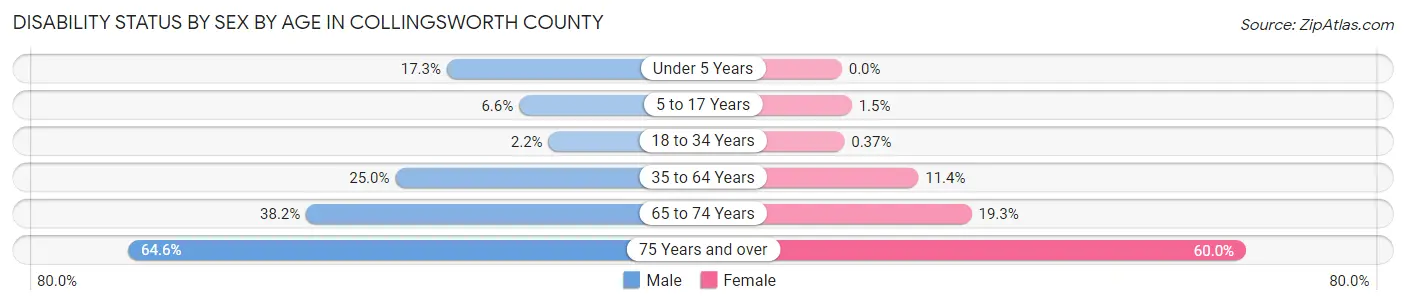
| Age Bracket | Male | Female |
| Under 5 Years | 18 (17.3%) | 0 (0.0%) |
| 5 to 17 Years | 26 (6.6%) | 4 (1.5%) |
| 18 to 34 Years | 3 (2.2%) | 1 (0.4%) |
| 35 to 64 Years | 120 (24.9%) | 60 (11.4%) |
| 65 to 74 Years | 68 (38.2%) | 37 (19.3%) |
| 75 Years and over | 42 (64.6%) | 60 (60.0%) |
Disability Class by Sex by Age in Collingsworth County
Disability Class: Hearing Difficulty
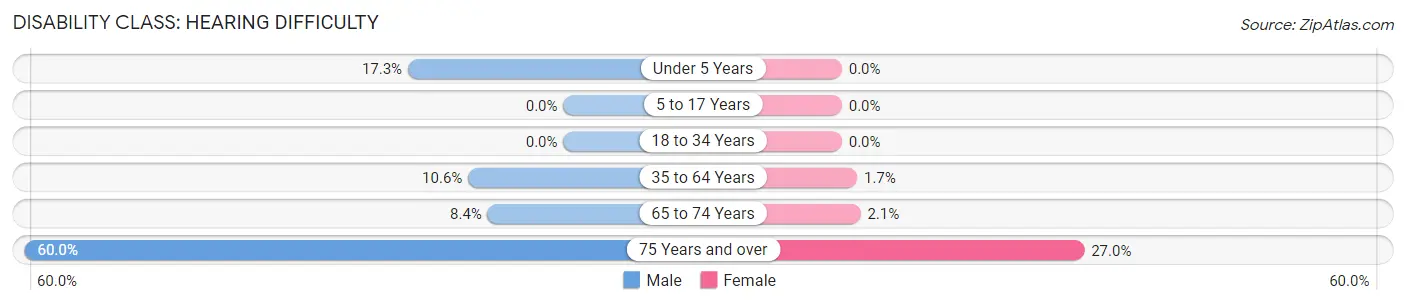
| Age Bracket | Male | Female |
| Under 5 Years | 18 (17.3%) | 0 (0.0%) |
| 5 to 17 Years | 0 (0.0%) | 0 (0.0%) |
| 18 to 34 Years | 0 (0.0%) | 0 (0.0%) |
| 35 to 64 Years | 51 (10.6%) | 9 (1.7%) |
| 65 to 74 Years | 15 (8.4%) | 4 (2.1%) |
| 75 Years and over | 39 (60.0%) | 27 (27.0%) |
Disability Class: Vision Difficulty
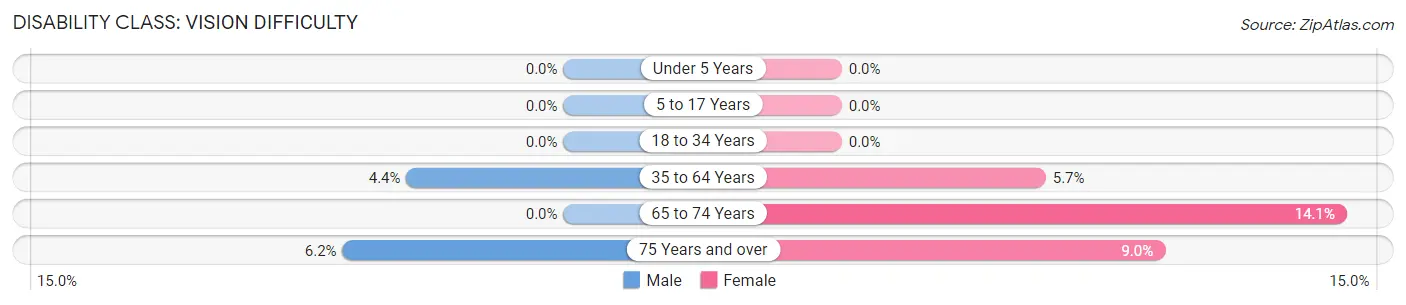
| Age Bracket | Male | Female |
| Under 5 Years | 0 (0.0%) | 0 (0.0%) |
| 5 to 17 Years | 0 (0.0%) | 0 (0.0%) |
| 18 to 34 Years | 0 (0.0%) | 0 (0.0%) |
| 35 to 64 Years | 21 (4.4%) | 30 (5.7%) |
| 65 to 74 Years | 0 (0.0%) | 27 (14.1%) |
| 75 Years and over | 4 (6.1%) | 9 (9.0%) |
Disability Class: Cognitive Difficulty
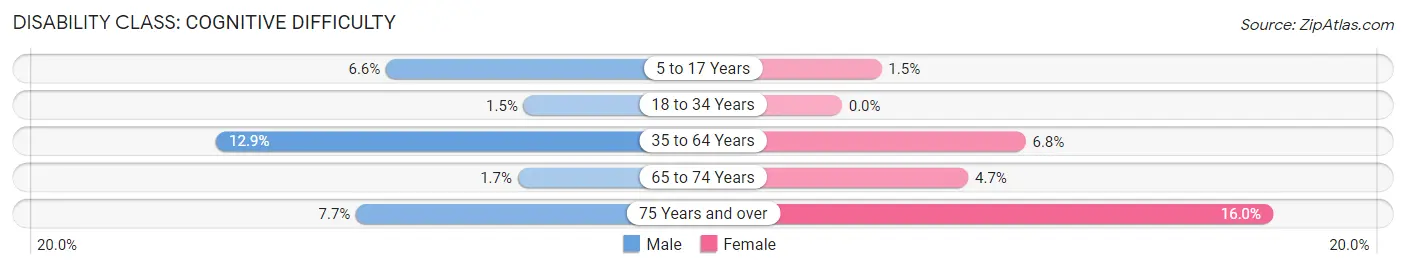
| Age Bracket | Male | Female |
| 5 to 17 Years | 26 (6.6%) | 4 (1.5%) |
| 18 to 34 Years | 2 (1.5%) | 0 (0.0%) |
| 35 to 64 Years | 62 (12.9%) | 36 (6.8%) |
| 65 to 74 Years | 3 (1.7%) | 9 (4.7%) |
| 75 Years and over | 5 (7.7%) | 16 (16.0%) |
Disability Class: Ambulatory Difficulty
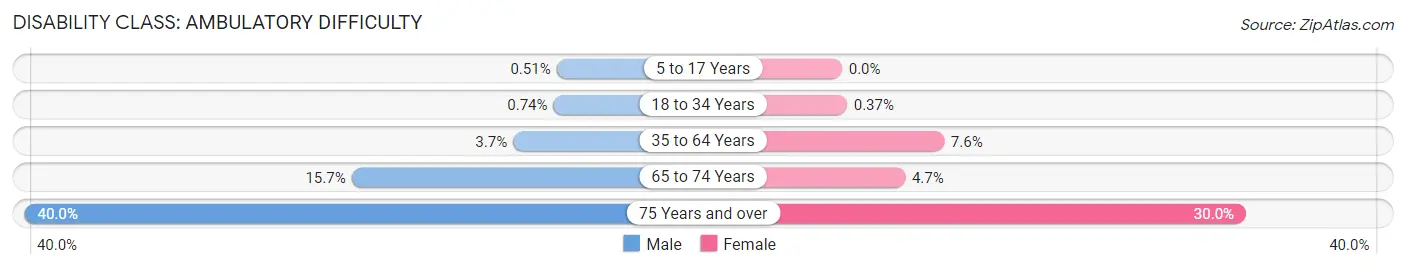
| Age Bracket | Male | Female |
| 5 to 17 Years | 2 (0.5%) | 0 (0.0%) |
| 18 to 34 Years | 1 (0.7%) | 1 (0.4%) |
| 35 to 64 Years | 18 (3.7%) | 40 (7.6%) |
| 65 to 74 Years | 28 (15.7%) | 9 (4.7%) |
| 75 Years and over | 26 (40.0%) | 30 (30.0%) |
Disability Class: Self-Care Difficulty
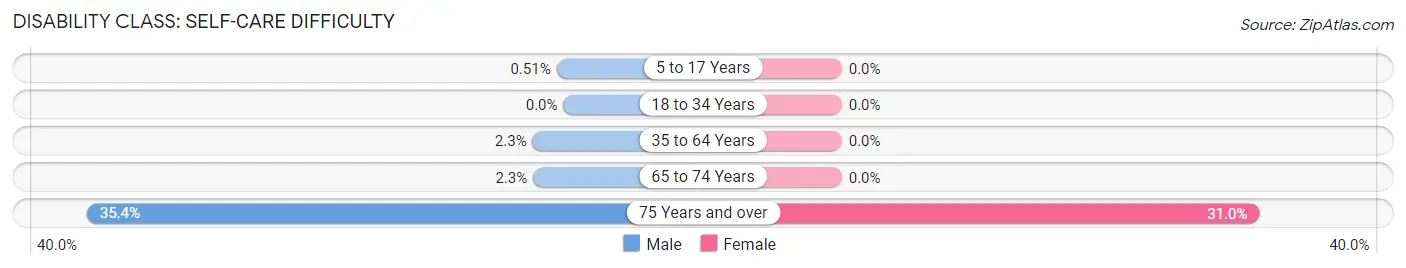
| Age Bracket | Male | Female |
| 5 to 17 Years | 2 (0.5%) | 0 (0.0%) |
| 18 to 34 Years | 0 (0.0%) | 0 (0.0%) |
| 35 to 64 Years | 11 (2.3%) | 0 (0.0%) |
| 65 to 74 Years | 4 (2.2%) | 0 (0.0%) |
| 75 Years and over | 23 (35.4%) | 31 (31.0%) |
Technology Access in Collingsworth County
Computing Device Access in Collingsworth County
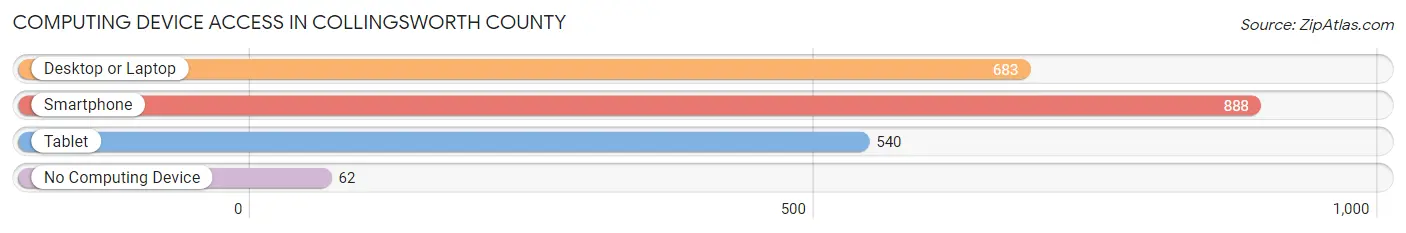
| Device Type | # Households | % Households |
| Desktop or Laptop | 683 | 67.1% |
| Smartphone | 888 | 87.2% |
| Tablet | 540 | 53.0% |
| No Computing Device | 62 | 6.1% |
| Total | 1,018 | 100.0% |
Internet Access in Collingsworth County
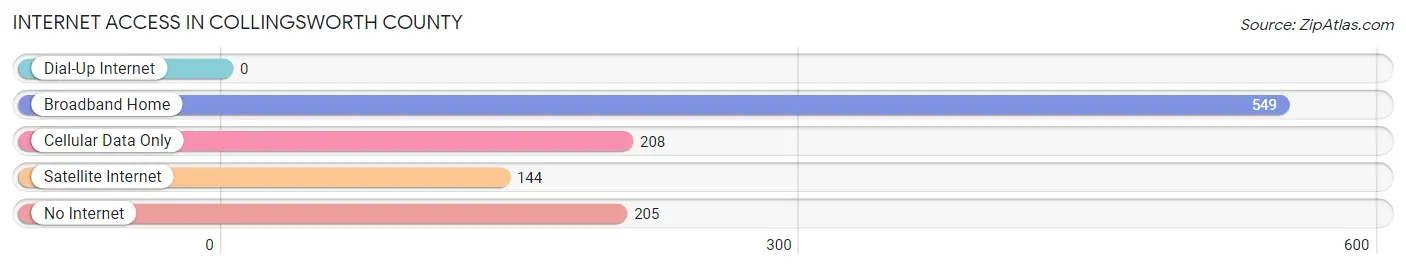
| Internet Type | # Households | % Households |
| Dial-Up Internet | 0 | 0.0% |
| Broadband Home | 549 | 53.9% |
| Cellular Data Only | 208 | 20.4% |
| Satellite Internet | 144 | 14.1% |
| No Internet | 205 | 20.1% |
| Total | 1,018 | 100.0% |
Collingsworth County Summary
Collingsworth County is located in the northern part of the Texas Panhandle, in the United States. It is bordered by Wheeler County to the north, Donley County to the east, Hall County to the south, and Childress County to the west. The county seat is Wellington, and the largest city is Wellington. The county was created in 1876 and is named for James Collinsworth, a signer of the Texas Declaration of Independence.
Geography
Collingsworth County covers an area of 919 square miles, of which 917 square miles is land and 2 square miles is water. The terrain is mostly flat, with some rolling hills in the western part of the county. The county is drained by the North Fork of the Red River, which flows through the center of the county. The county is part of the High Plains region of Texas, and is mostly covered in grasslands.
Demographics
As of the 2010 census, the population of Collingsworth County was 3,057, a decrease of 4.3% from the 2000 census. The racial makeup of the county was 81.3% White, 0.3% African American, 0.7% Native American, 0.2% Asian, 0.1% Pacific Islander, 15.7% from other races, and 1.9% from two or more races. Hispanic or Latino of any race were 33.2% of the population.
The median household income was $35,938, and the median family income was $41,944. The per capita income was $17,845. About 17.2% of families and 20.7% of the population were below the poverty line, including 28.2% of those under age 18 and 14.2% of those age 65 or over.
Economy
Agriculture is the main economic activity in Collingsworth County. The county is home to a variety of crops, including wheat, corn, sorghum, cotton, and hay. Cattle and sheep are also raised in the county.
Oil and gas production is also an important part of the economy. The county is home to several oil and gas fields, including the Wellington Field, which is the largest in the county.
The county also has a growing tourism industry, with several attractions, including the Collingsworth County Museum, the Collingsworth County Historical Society, and the Collingsworth County Fair.
Conclusion
Collingsworth County is a rural county located in the northern part of the Texas Panhandle. It is home to a variety of crops, as well as oil and gas production. The county also has a growing tourism industry, with several attractions. The population of the county is 3,057, and the median household income is $35,938.
Common Questions
What is Per Capita Income in Collingsworth County?
Per Capita income in Collingsworth County is $33,436.
What is the Median Family Income in Collingsworth County?
Median Family Income in Collingsworth County is $61,675.
What is the Median Household income in Collingsworth County?
Median Household Income in Collingsworth County is $52,045.
What is Income or Wage Gap in Collingsworth County?
Income or Wage Gap in Collingsworth County is 43.0%.
Women in Collingsworth County earn 57.0 cents for every dollar earned by a man.
What is Inequality or Gini Index in Collingsworth County?
Inequality or Gini Index in Collingsworth County is 0.53.
What is the Total Population of Collingsworth County?
Total Population of Collingsworth County is 2,865.
What is the Total Male Population of Collingsworth County?
Total Male Population of Collingsworth County is 1,405.
What is the Total Female Population of Collingsworth County?
Total Female Population of Collingsworth County is 1,460.
What is the Ratio of Males per 100 Females in Collingsworth County?
There are 96.23 Males per 100 Females in Collingsworth County.
What is the Ratio of Females per 100 Males in Collingsworth County?
There are 103.91 Females per 100 Males in Collingsworth County.
What is the Median Population Age in Collingsworth County?
Median Population Age in Collingsworth County is 38.3 Years.
What is the Average Family Size in Collingsworth County
Average Family Size in Collingsworth County is 3.1 People.
What is the Average Household Size in Collingsworth County
Average Household Size in Collingsworth County is 2.7 People.
How Large is the Labor Force in Collingsworth County?
There are 1,344 People in the Labor Forcein in Collingsworth County.
What is the Percentage of People in the Labor Force in Collingsworth County?
64.1% of People are in the Labor Force in Collingsworth County.
What is the Unemployment Rate in Collingsworth County?
Unemployment Rate in Collingsworth County is 2.8%.