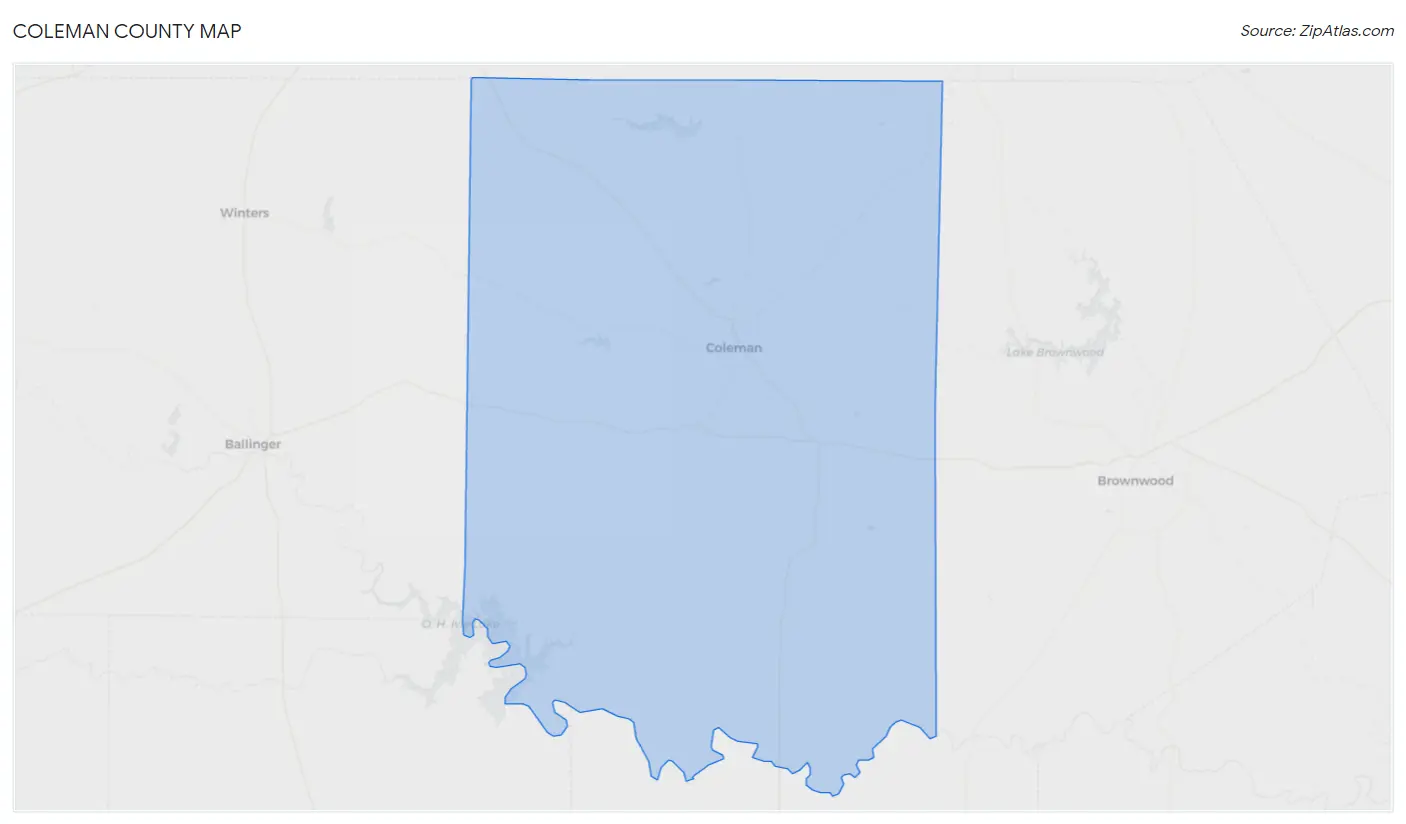
Coleman County, TX Map & Demographics
Coleman County Map
Coleman County Overview
$31,249
PER CAPITA INCOME
$59,681
AVG FAMILY INCOME
$51,034
AVG HOUSEHOLD INCOME
9.0%
WAGE / INCOME GAP [ % ]
91.0¢/ $1
WAGE / INCOME GAP [ $ ]
0.48
INEQUALITY / GINI INDEX
7,808
TOTAL POPULATION
3,913
MALE POPULATION
3,895
FEMALE POPULATION
100.46
MALES / 100 FEMALES
99.54
FEMALES / 100 MALES
48.4
MEDIAN AGE
3.2
AVG FAMILY SIZE
2.4
AVG HOUSEHOLD SIZE
3,598
LABOR FORCE [ PEOPLE ]
57.5%
PERCENT IN LABOR FORCE
6.3%
UNEMPLOYMENT RATE
Coleman County Area Codes
Income in Coleman County
Income Overview in Coleman County
Per Capita Income in Coleman County is $31,249, while median incomes of families and households are $59,681 and $51,034 respectively.
| Characteristic | Number | Measure |
| Per Capita Income | 7,808 | $31,249 |
| Median Family Income | 1,840 | $59,681 |
| Mean Family Income | 1,840 | $85,632 |
| Median Household Income | 3,210 | $51,034 |
| Mean Household Income | 3,210 | $73,573 |
| Income Deficit | 1,840 | $0 |
| Wage / Income Gap (%) | 7,808 | 8.99% |
| Wage / Income Gap ($) | 7,808 | 91.01¢ per $1 |
| Gini / Inequality Index | 7,808 | 0.48 |
Earnings by Sex in Coleman County
Average Earnings in Coleman County are $34,146, $35,874 for men and $32,650 for women, a difference of 9.0%.
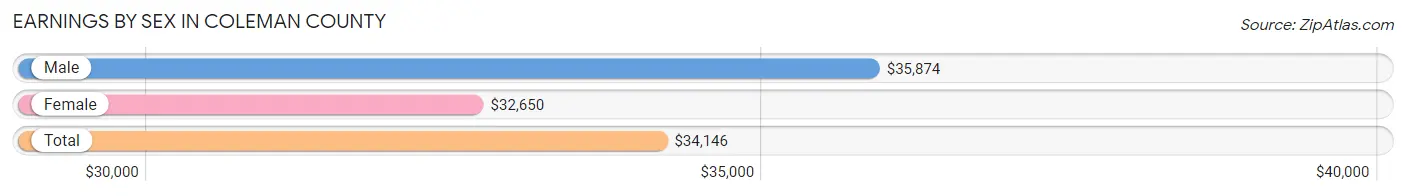
| Sex | Number | Average Earnings |
| Male | 2,077 (56.2%) | $35,874 |
| Female | 1,616 (43.8%) | $32,650 |
| Total | 3,693 (100.0%) | $34,146 |
Earnings by Sex by Income Bracket in Coleman County
The most common earnings brackets in Coleman County are $2,500 to $4,999 for men (220 | 10.6%) and $40,000 to $44,999 for women (173 | 10.7%).
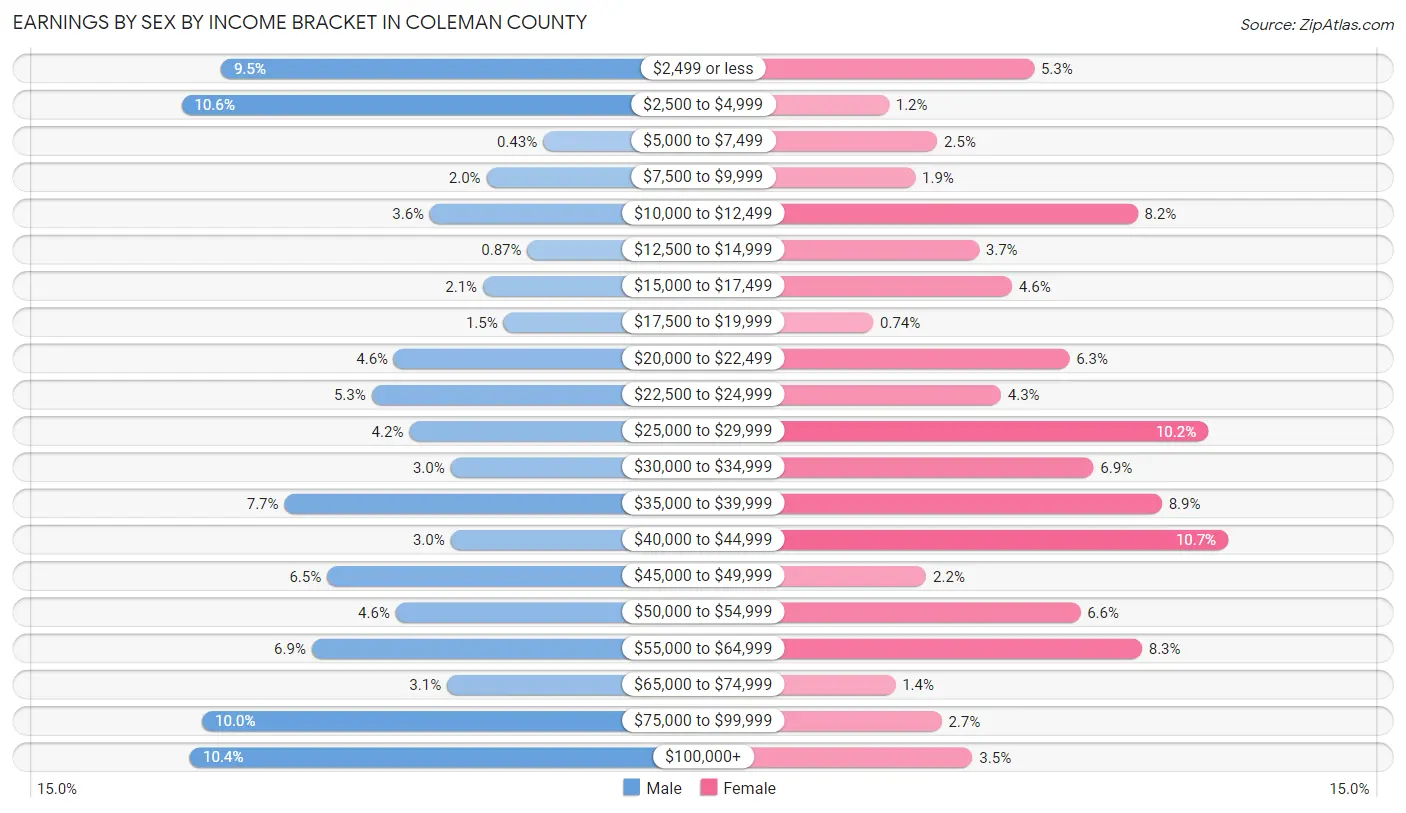
| Income | Male | Female |
| $2,499 or less | 197 (9.5%) | 85 (5.3%) |
| $2,500 to $4,999 | 220 (10.6%) | 19 (1.2%) |
| $5,000 to $7,499 | 9 (0.4%) | 41 (2.5%) |
| $7,500 to $9,999 | 42 (2.0%) | 31 (1.9%) |
| $10,000 to $12,499 | 75 (3.6%) | 132 (8.2%) |
| $12,500 to $14,999 | 18 (0.9%) | 60 (3.7%) |
| $15,000 to $17,499 | 44 (2.1%) | 75 (4.6%) |
| $17,500 to $19,999 | 32 (1.5%) | 12 (0.7%) |
| $20,000 to $22,499 | 96 (4.6%) | 101 (6.2%) |
| $22,500 to $24,999 | 109 (5.2%) | 70 (4.3%) |
| $25,000 to $29,999 | 87 (4.2%) | 164 (10.2%) |
| $30,000 to $34,999 | 63 (3.0%) | 112 (6.9%) |
| $35,000 to $39,999 | 160 (7.7%) | 143 (8.8%) |
| $40,000 to $44,999 | 63 (3.0%) | 173 (10.7%) |
| $45,000 to $49,999 | 135 (6.5%) | 36 (2.2%) |
| $50,000 to $54,999 | 95 (4.6%) | 106 (6.6%) |
| $55,000 to $64,999 | 144 (6.9%) | 134 (8.3%) |
| $65,000 to $74,999 | 65 (3.1%) | 22 (1.4%) |
| $75,000 to $99,999 | 208 (10.0%) | 43 (2.7%) |
| $100,000+ | 215 (10.3%) | 57 (3.5%) |
| Total | 2,077 (100.0%) | 1,616 (100.0%) |
Earnings by Sex by Educational Attainment in Coleman County
Average earnings in Coleman County are $40,391 for men and $35,437 for women, a difference of 12.3%. Men with an educational attainment of bachelor's degree enjoy the highest average annual earnings of $69,500, while those with college or associate's degree education earn the least with $35,604. Women with an educational attainment of graduate degree earn the most with the average annual earnings of $63,468, while those with high school diploma education have the smallest earnings of $27,782.
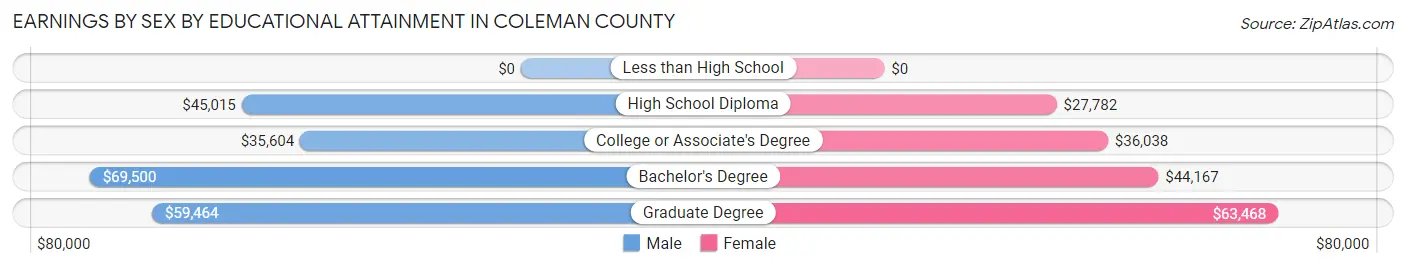
| Educational Attainment | Male Income | Female Income |
| Less than High School | - | - |
| High School Diploma | $45,015 | $27,782 |
| College or Associate's Degree | $35,604 | $36,038 |
| Bachelor's Degree | $69,500 | $44,167 |
| Graduate Degree | $59,464 | $63,468 |
| Total | $40,391 | $35,437 |
Family Income in Coleman County
Family Income Brackets in Coleman County
According to the Coleman County family income data, there are 451 families falling into the $50,000 to $74,999 income range, which is the most common income bracket and makes up 24.5% of all families. Conversely, the less than $10,000 income bracket is the least frequent group with only 63 families (3.4%) belonging to this category.
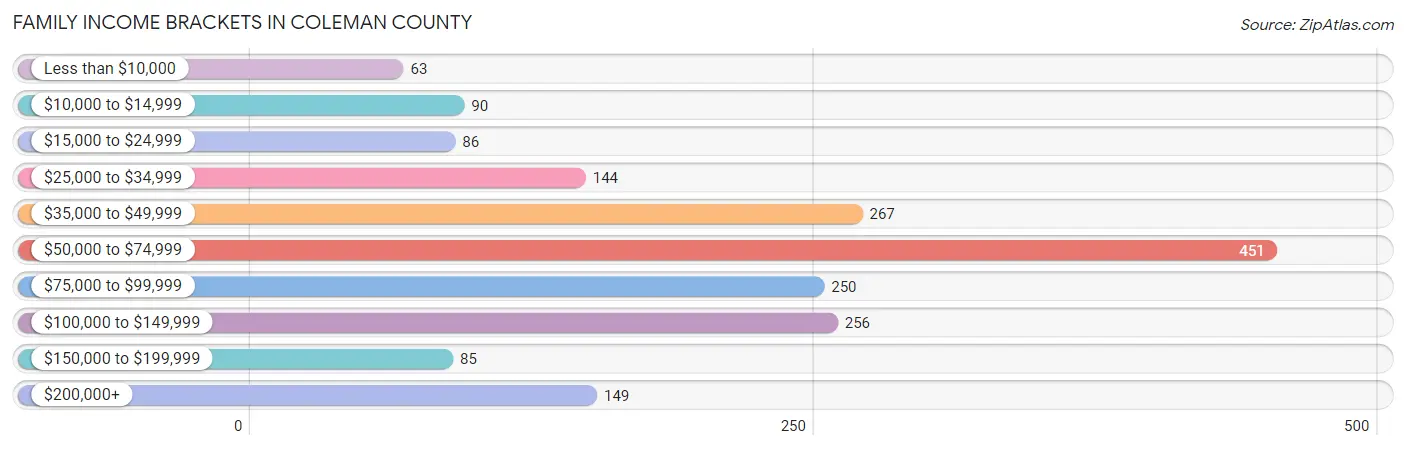
| Income Bracket | # Families | % Families |
| Less than $10,000 | 63 | 3.4% |
| $10,000 to $14,999 | 90 | 4.9% |
| $15,000 to $24,999 | 86 | 4.7% |
| $25,000 to $34,999 | 144 | 7.8% |
| $35,000 to $49,999 | 267 | 14.5% |
| $50,000 to $74,999 | 451 | 24.5% |
| $75,000 to $99,999 | 250 | 13.6% |
| $100,000 to $149,999 | 256 | 13.9% |
| $150,000 to $199,999 | 85 | 4.6% |
| $200,000+ | 149 | 8.1% |
Family Income by Famaliy Size in Coleman County
5-person families (97 | 5.3%) account for the highest median family income in Coleman County with $101,299 per family, while 2-person families (1,096 | 59.6%) have the highest median income of $25,764 per family member.
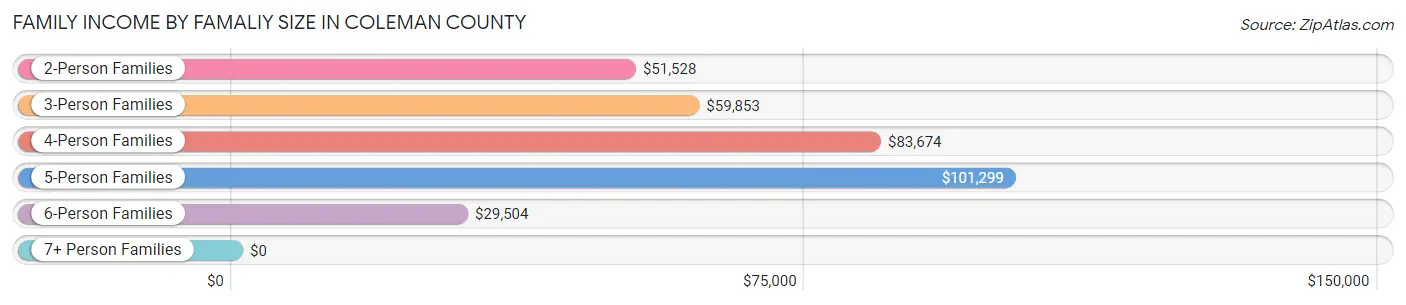
| Income Bracket | # Families | Median Income |
| 2-Person Families | 1,096 (59.6%) | $51,528 |
| 3-Person Families | 198 (10.8%) | $59,853 |
| 4-Person Families | 347 (18.9%) | $83,674 |
| 5-Person Families | 97 (5.3%) | $101,299 |
| 6-Person Families | 93 (5.1%) | $29,504 |
| 7+ Person Families | 9 (0.5%) | $0 |
| Total | 1,840 (100.0%) | $59,681 |
Family Income by Number of Earners in Coleman County
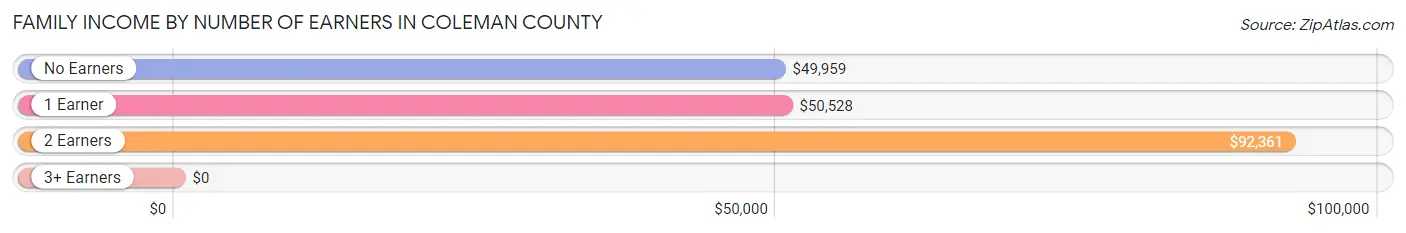
| Number of Earners | # Families | Median Income |
| No Earners | 412 (22.4%) | $49,959 |
| 1 Earner | 572 (31.1%) | $50,528 |
| 2 Earners | 749 (40.7%) | $92,361 |
| 3+ Earners | 107 (5.8%) | $0 |
| Total | 1,840 (100.0%) | $59,681 |
Household Income in Coleman County
Household Income Brackets in Coleman County
With 748 households falling in the category, the $50,000 to $74,999 income range is the most frequent in Coleman County, accounting for 23.3% of all households. In contrast, only 106 households (3.3%) fall into the less than $10,000 income bracket, making it the least populous group.
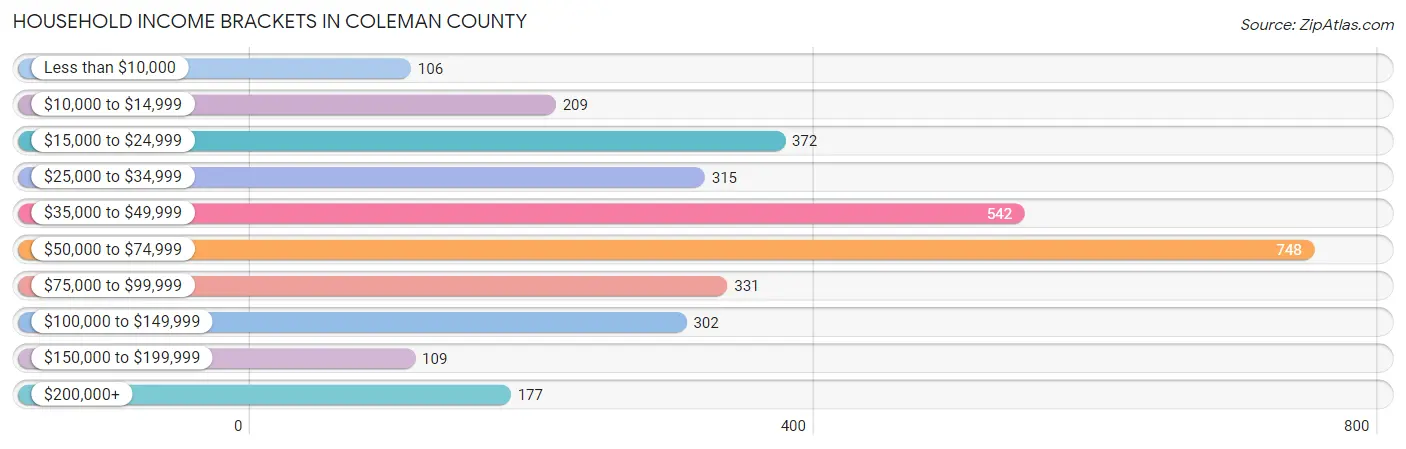
| Income Bracket | # Households | % Households |
| Less than $10,000 | 106 | 3.3% |
| $10,000 to $14,999 | 209 | 6.5% |
| $15,000 to $24,999 | 372 | 11.6% |
| $25,000 to $34,999 | 315 | 9.8% |
| $35,000 to $49,999 | 542 | 16.9% |
| $50,000 to $74,999 | 748 | 23.3% |
| $75,000 to $99,999 | 331 | 10.3% |
| $100,000 to $149,999 | 302 | 9.4% |
| $150,000 to $199,999 | 109 | 3.4% |
| $200,000+ | 177 | 5.5% |
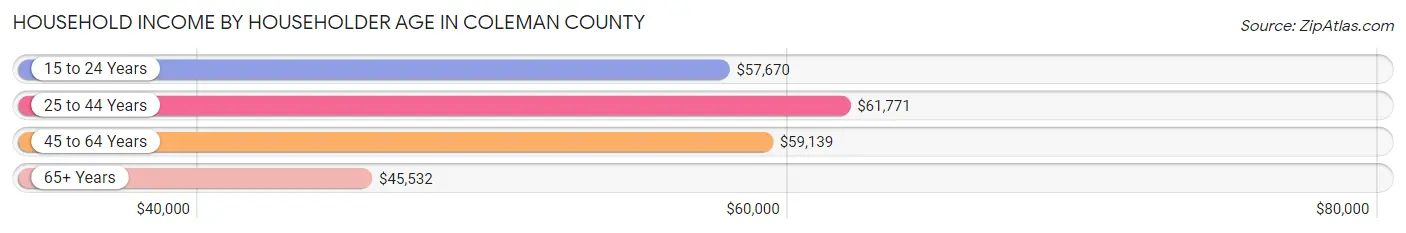
Household Income by Householder Age in Coleman County
The median household income in Coleman County is $51,034, with the highest median household income of $61,771 found in the 25 to 44 years age bracket for the primary householder. A total of 626 households (19.5%) fall into this category. Meanwhile, the 65+ years age bracket for the primary householder has the lowest median household income of $45,532, with 1,352 households (42.1%) in this group.
| Income Bracket | # Households | Median Income |
| 15 to 24 Years | 127 (4.0%) | $57,670 |
| 25 to 44 Years | 626 (19.5%) | $61,771 |
| 45 to 64 Years | 1,105 (34.4%) | $59,139 |
| 65+ Years | 1,352 (42.1%) | $45,532 |
| Total | 3,210 (100.0%) | $51,034 |
Poverty in Coleman County
Income Below Poverty by Sex and Age in Coleman County
With 16.8% poverty level for males and 17.4% for females among the residents of Coleman County, 18 to 24 year old males and under 5 year old females are the most vulnerable to poverty, with 134 males (45.9%) and 96 females (71.1%) in their respective age groups living below the poverty level.
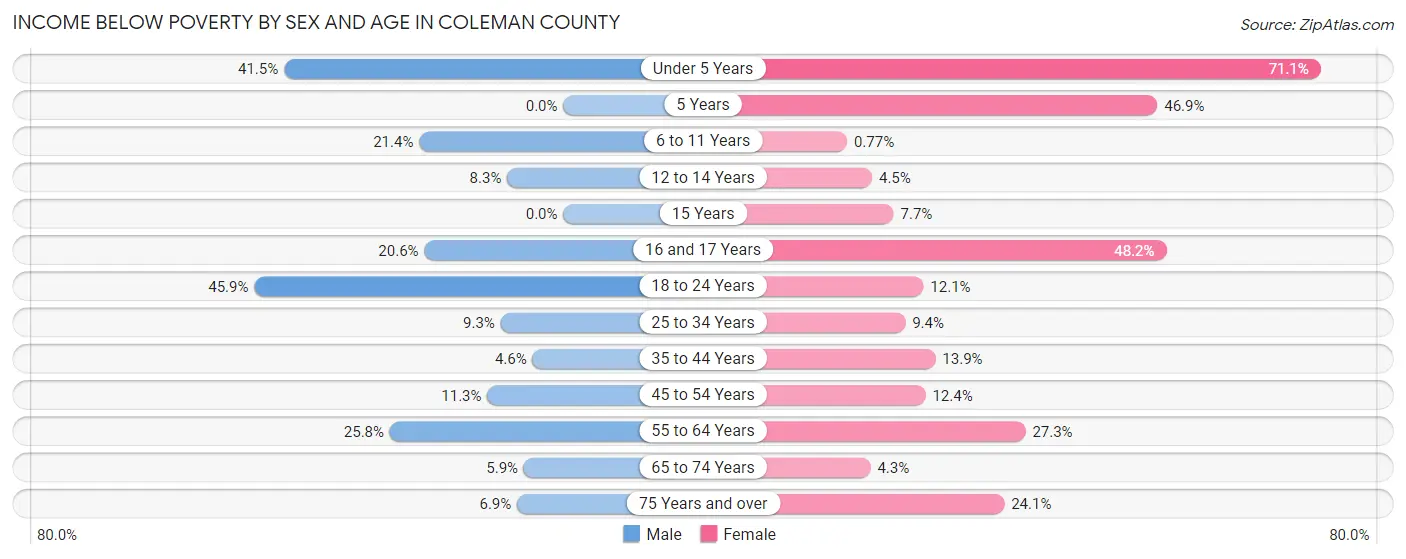
| Age Bracket | Male | Female |
| Under 5 Years | 90 (41.5%) | 96 (71.1%) |
| 5 Years | 0 (0.0%) | 52 (46.9%) |
| 6 to 11 Years | 61 (21.4%) | 2 (0.8%) |
| 12 to 14 Years | 9 (8.3%) | 7 (4.5%) |
| 15 Years | 0 (0.0%) | 10 (7.7%) |
| 16 and 17 Years | 13 (20.6%) | 40 (48.2%) |
| 18 to 24 Years | 134 (45.9%) | 28 (12.1%) |
| 25 to 34 Years | 27 (9.3%) | 31 (9.4%) |
| 35 to 44 Years | 15 (4.6%) | 61 (13.9%) |
| 45 to 54 Years | 60 (11.3%) | 45 (12.4%) |
| 55 to 64 Years | 179 (25.8%) | 168 (27.3%) |
| 65 to 74 Years | 32 (5.9%) | 24 (4.3%) |
| 75 Years and over | 27 (6.9%) | 110 (24.1%) |
| Total | 647 (16.8%) | 674 (17.4%) |
Income Above Poverty by Sex and Age in Coleman County
According to the poverty statistics in Coleman County, males aged 5 years and females aged 6 to 11 years are the age groups that are most secure financially, with 100.0% of males and 99.2% of females in these age groups living above the poverty line.
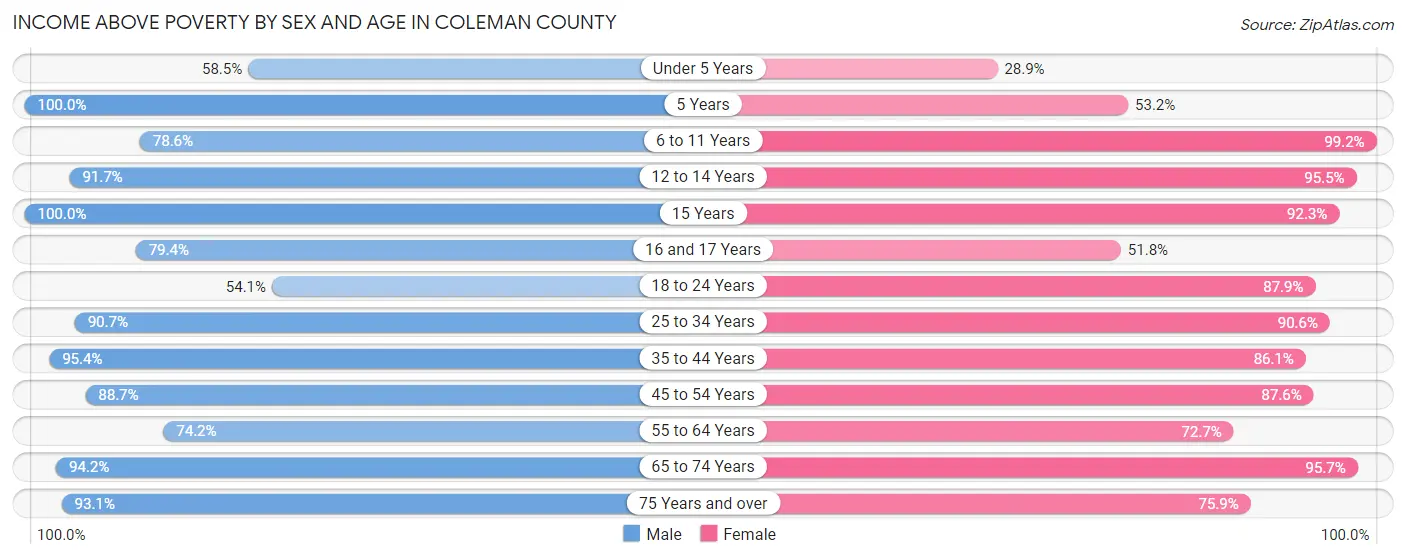
| Age Bracket | Male | Female |
| Under 5 Years | 127 (58.5%) | 39 (28.9%) |
| 5 Years | 4 (100.0%) | 59 (53.1%) |
| 6 to 11 Years | 224 (78.6%) | 257 (99.2%) |
| 12 to 14 Years | 99 (91.7%) | 149 (95.5%) |
| 15 Years | 95 (100.0%) | 120 (92.3%) |
| 16 and 17 Years | 50 (79.4%) | 43 (51.8%) |
| 18 to 24 Years | 158 (54.1%) | 203 (87.9%) |
| 25 to 34 Years | 263 (90.7%) | 298 (90.6%) |
| 35 to 44 Years | 313 (95.4%) | 378 (86.1%) |
| 45 to 54 Years | 472 (88.7%) | 317 (87.6%) |
| 55 to 64 Years | 516 (74.2%) | 448 (72.7%) |
| 65 to 74 Years | 515 (94.2%) | 539 (95.7%) |
| 75 Years and over | 366 (93.1%) | 346 (75.9%) |
| Total | 3,202 (83.2%) | 3,196 (82.6%) |
Income Below Poverty Among Married-Couple Families in Coleman County
The poverty statistics for married-couple families in Coleman County show that 4.8% or 72 of the total 1,501 families live below the poverty line. Families with 1 or 2 children have the highest poverty rate of 7.8%, comprising of 32 families. On the other hand, families with 3 or 4 children have the lowest poverty rate of 0.0%, which includes 0 families.
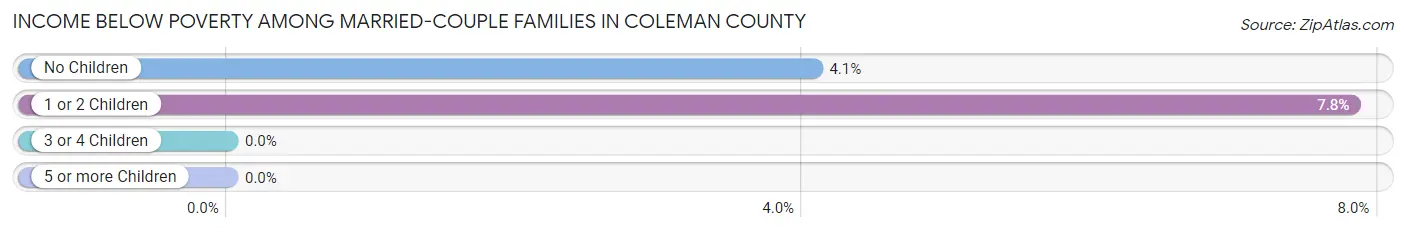
| Children | Above Poverty | Below Poverty |
| No Children | 943 (95.9%) | 40 (4.1%) |
| 1 or 2 Children | 377 (92.2%) | 32 (7.8%) |
| 3 or 4 Children | 100 (100.0%) | 0 (0.0%) |
| 5 or more Children | 9 (100.0%) | 0 (0.0%) |
| Total | 1,429 (95.2%) | 72 (4.8%) |
Income Below Poverty Among Single-Parent Households in Coleman County
According to the poverty data in Coleman County, 12.4% or 11 single-father households and 68.0% or 170 single-mother households are living below the poverty line. Among single-father households, those with no children have the highest poverty rate, with 11 households (16.2%) experiencing poverty. Likewise, among single-mother households, those with 3 or 4 children have the highest poverty rate, with 70 households (100.0%) falling below the poverty line.
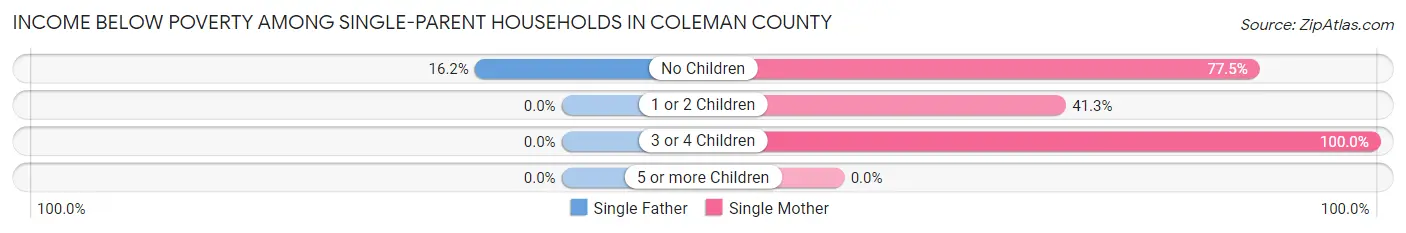
| Children | Single Father | Single Mother |
| No Children | 11 (16.2%) | 55 (77.5%) |
| 1 or 2 Children | 0 (0.0%) | 45 (41.3%) |
| 3 or 4 Children | 0 (0.0%) | 70 (100.0%) |
| 5 or more Children | 0 (0.0%) | 0 (0.0%) |
| Total | 11 (12.4%) | 170 (68.0%) |
Income Below Poverty Among Married-Couple vs Single-Parent Households in Coleman County
The poverty data for Coleman County shows that 72 of the married-couple family households (4.8%) and 181 of the single-parent households (53.4%) are living below the poverty level. Within the married-couple family households, those with 1 or 2 children have the highest poverty rate, with 32 households (7.8%) falling below the poverty line. Among the single-parent households, those with 3 or 4 children have the highest poverty rate, with 70 household (100.0%) living below poverty.
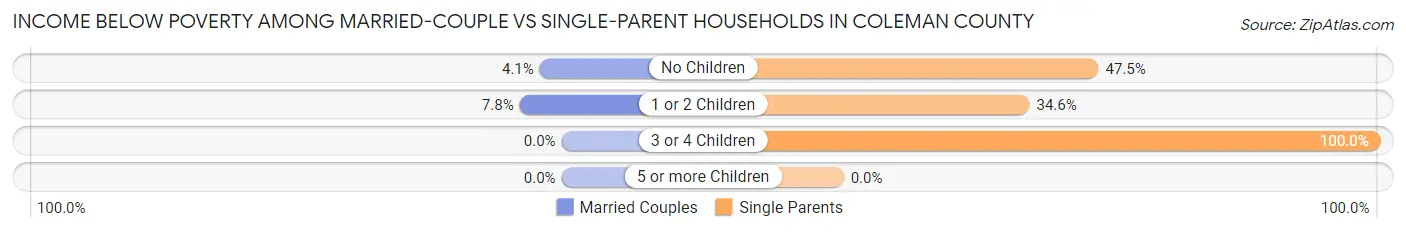
| Children | Married-Couple Families | Single-Parent Households |
| No Children | 40 (4.1%) | 66 (47.5%) |
| 1 or 2 Children | 32 (7.8%) | 45 (34.6%) |
| 3 or 4 Children | 0 (0.0%) | 70 (100.0%) |
| 5 or more Children | 0 (0.0%) | 0 (0.0%) |
| Total | 72 (4.8%) | 181 (53.4%) |
Race in Coleman County
The most populous races in Coleman County are White / Caucasian (6,306 | 80.8%), Hispanic or Latino (1,428 | 18.3%), and Two or more Races (694 | 8.9%).
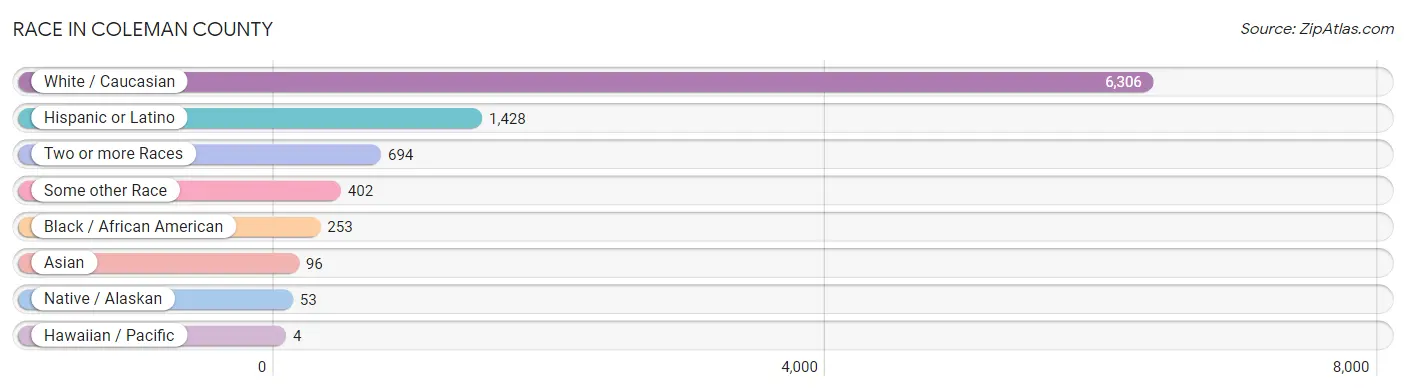
| Race | # Population | % Population |
| Asian | 96 | 1.2% |
| Black / African American | 253 | 3.2% |
| Hawaiian / Pacific | 4 | 0.1% |
| Hispanic or Latino | 1,428 | 18.3% |
| Native / Alaskan | 53 | 0.7% |
| White / Caucasian | 6,306 | 80.8% |
| Two or more Races | 694 | 8.9% |
| Some other Race | 402 | 5.1% |
| Total | 7,808 | 100.0% |
Ancestry in Coleman County
The most populous ancestries reported in Coleman County are European (1,268 | 16.2%), Mexican (1,264 | 16.2%), German (971 | 12.4%), English (833 | 10.7%), and Irish (562 | 7.2%), together accounting for 62.7% of all Coleman County residents.
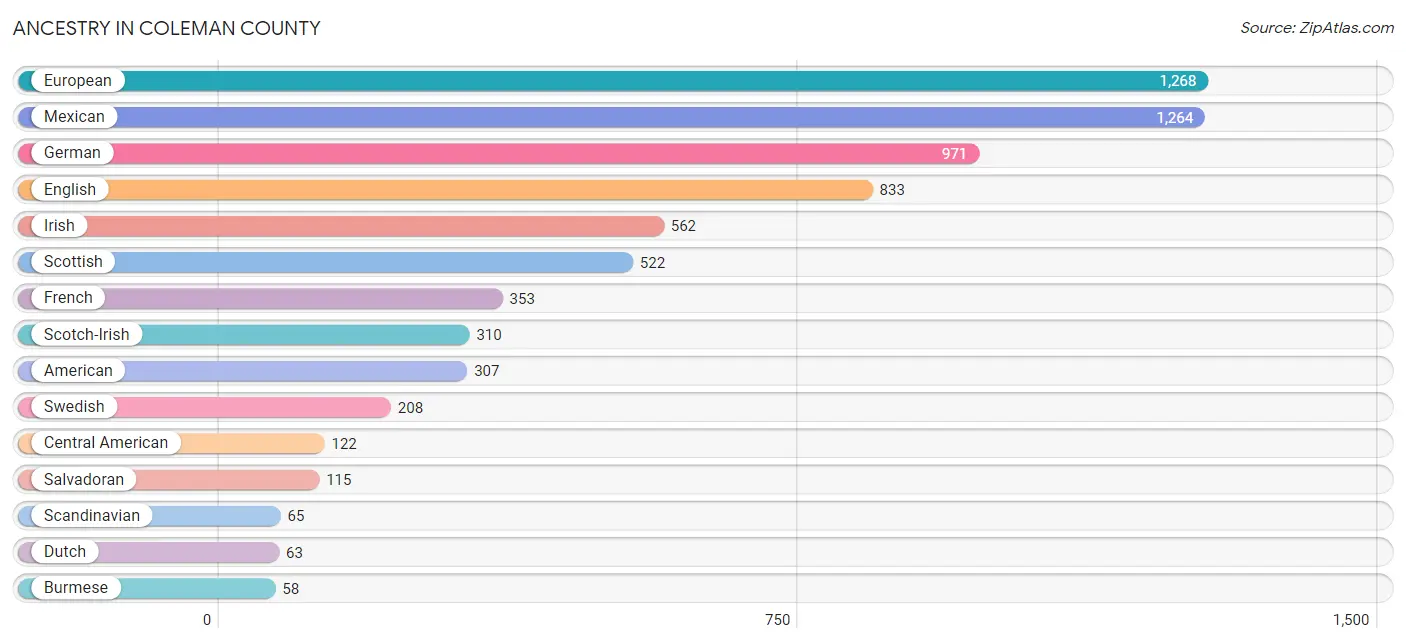
| Ancestry | # Population | % Population |
| African | 5 | 0.1% |
| American | 307 | 3.9% |
| Apache | 20 | 0.3% |
| Arab | 12 | 0.2% |
| Austrian | 4 | 0.1% |
| Belgian | 9 | 0.1% |
| Bhutanese | 48 | 0.6% |
| Blackfeet | 3 | 0.0% |
| British | 49 | 0.6% |
| Burmese | 58 | 0.7% |
| Central American | 122 | 1.6% |
| Cherokee | 8 | 0.1% |
| Cheyenne | 3 | 0.0% |
| Chickasaw | 7 | 0.1% |
| Choctaw | 1 | 0.0% |
| Comanche | 10 | 0.1% |
| Czech | 3 | 0.0% |
| Danish | 16 | 0.2% |
| Dutch | 63 | 0.8% |
| Egyptian | 4 | 0.1% |
| English | 833 | 10.7% |
| European | 1,268 | 16.2% |
| French | 353 | 4.5% |
| French Canadian | 5 | 0.1% |
| German | 971 | 12.4% |
| Guamanian / Chamorro | 4 | 0.1% |
| Guatemalan | 4 | 0.1% |
| Hungarian | 6 | 0.1% |
| Irish | 562 | 7.2% |
| Italian | 11 | 0.1% |
| Korean | 35 | 0.4% |
| Mexican | 1,264 | 16.2% |
| Mexican American Indian | 17 | 0.2% |
| Navajo | 23 | 0.3% |
| Northern European | 12 | 0.2% |
| Norwegian | 43 | 0.5% |
| Pakistani | 13 | 0.2% |
| Panamanian | 3 | 0.0% |
| Puerto Rican | 6 | 0.1% |
| Russian | 15 | 0.2% |
| Salvadoran | 115 | 1.5% |
| Scandinavian | 65 | 0.8% |
| Scotch-Irish | 310 | 4.0% |
| Scottish | 522 | 6.7% |
| Sioux | 3 | 0.0% |
| Spaniard | 12 | 0.2% |
| Spanish | 4 | 0.1% |
| Subsaharan African | 5 | 0.1% |
| Swedish | 208 | 2.7% |
| Welsh | 53 | 0.7% | View All 50 Rows |
Immigrants in Coleman County
The most numerous immigrant groups reported in Coleman County came from Central America (386 | 4.9%), Latin America (386 | 4.9%), Mexico (280 | 3.6%), El Salvador (103 | 1.3%), and Asia (58 | 0.7%), together accounting for 15.5% of all Coleman County residents.
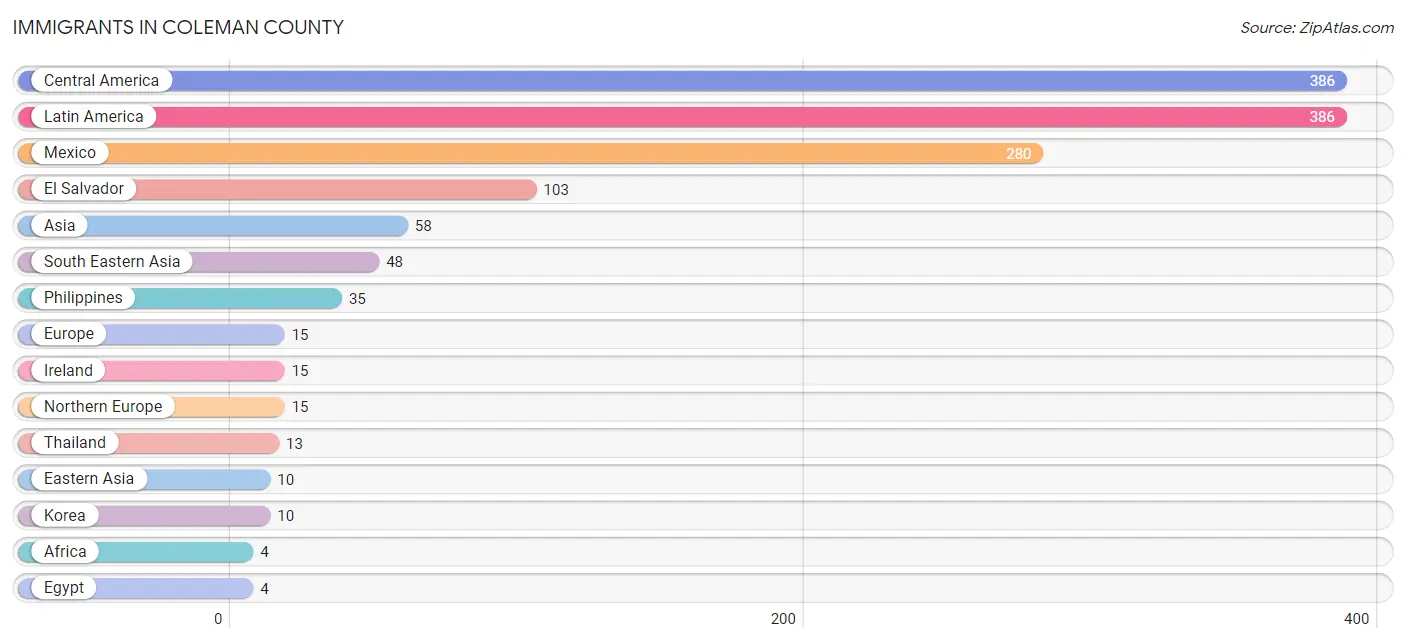
| Immigration Origin | # Population | % Population |
| Africa | 4 | 0.1% |
| Asia | 58 | 0.7% |
| Central America | 386 | 4.9% |
| Eastern Asia | 10 | 0.1% |
| Egypt | 4 | 0.1% |
| El Salvador | 103 | 1.3% |
| Europe | 15 | 0.2% |
| Ireland | 15 | 0.2% |
| Korea | 10 | 0.1% |
| Latin America | 386 | 4.9% |
| Mexico | 280 | 3.6% |
| Northern Africa | 4 | 0.1% |
| Northern Europe | 15 | 0.2% |
| Panama | 3 | 0.0% |
| Philippines | 35 | 0.4% |
| South Eastern Asia | 48 | 0.6% |
| Thailand | 13 | 0.2% | View All 17 Rows |
Sex and Age in Coleman County
Sex and Age in Coleman County
The most populous age groups in Coleman County are 55 to 59 Years (382 | 9.8%) for men and 70 to 74 Years (358 | 9.2%) for women.
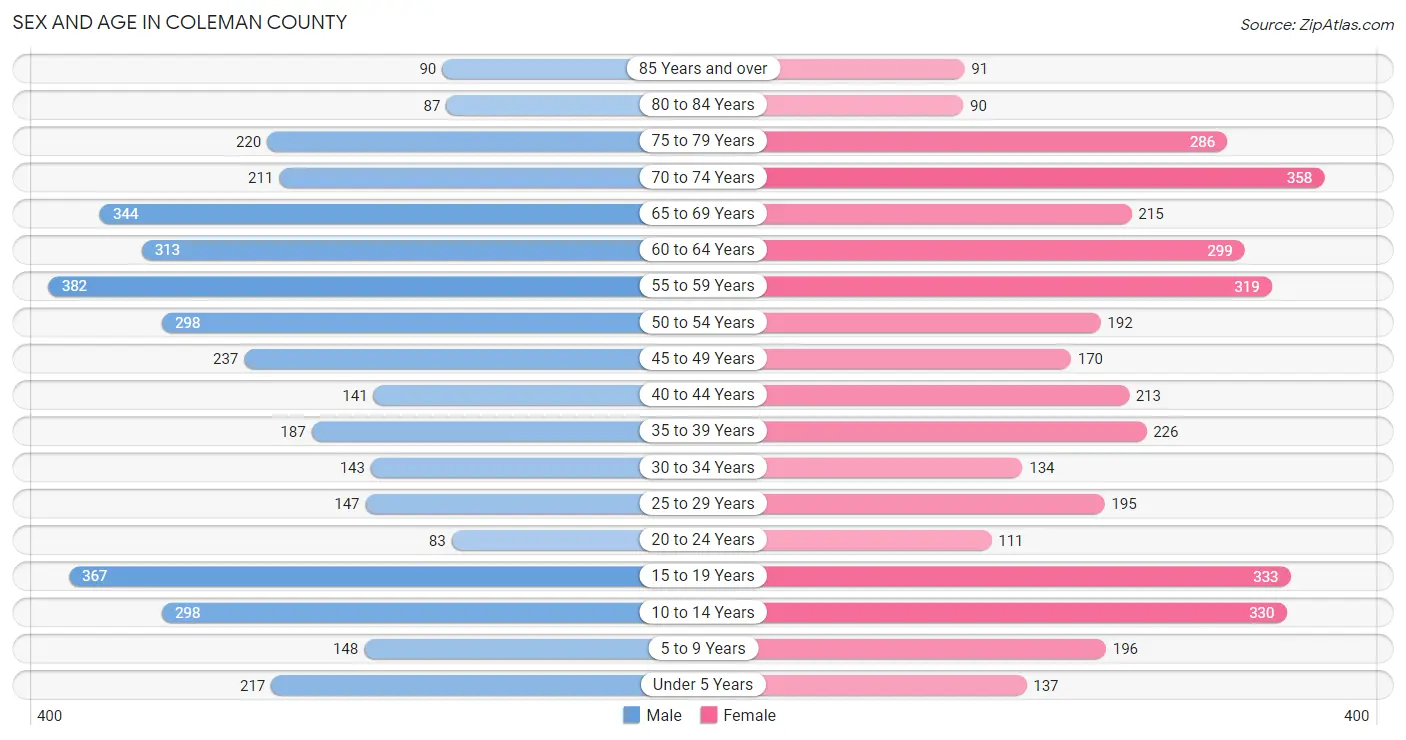
| Age Bracket | Male | Female |
| Under 5 Years | 217 (5.6%) | 137 (3.5%) |
| 5 to 9 Years | 148 (3.8%) | 196 (5.0%) |
| 10 to 14 Years | 298 (7.6%) | 330 (8.5%) |
| 15 to 19 Years | 367 (9.4%) | 333 (8.6%) |
| 20 to 24 Years | 83 (2.1%) | 111 (2.9%) |
| 25 to 29 Years | 147 (3.8%) | 195 (5.0%) |
| 30 to 34 Years | 143 (3.6%) | 134 (3.4%) |
| 35 to 39 Years | 187 (4.8%) | 226 (5.8%) |
| 40 to 44 Years | 141 (3.6%) | 213 (5.5%) |
| 45 to 49 Years | 237 (6.1%) | 170 (4.4%) |
| 50 to 54 Years | 298 (7.6%) | 192 (4.9%) |
| 55 to 59 Years | 382 (9.8%) | 319 (8.2%) |
| 60 to 64 Years | 313 (8.0%) | 299 (7.7%) |
| 65 to 69 Years | 344 (8.8%) | 215 (5.5%) |
| 70 to 74 Years | 211 (5.4%) | 358 (9.2%) |
| 75 to 79 Years | 220 (5.6%) | 286 (7.3%) |
| 80 to 84 Years | 87 (2.2%) | 90 (2.3%) |
| 85 Years and over | 90 (2.3%) | 91 (2.3%) |
| Total | 3,913 (100.0%) | 3,895 (100.0%) |
Families and Households in Coleman County
Median Family Size in Coleman County
The median family size in Coleman County is 3.23 persons per family, with single female/mother families (250 | 13.6%) accounting for the largest median family size of 4.2 persons per family. On the other hand, married-couple families (1,501 | 81.6%) represent the smallest median family size with 3.05 persons per family.
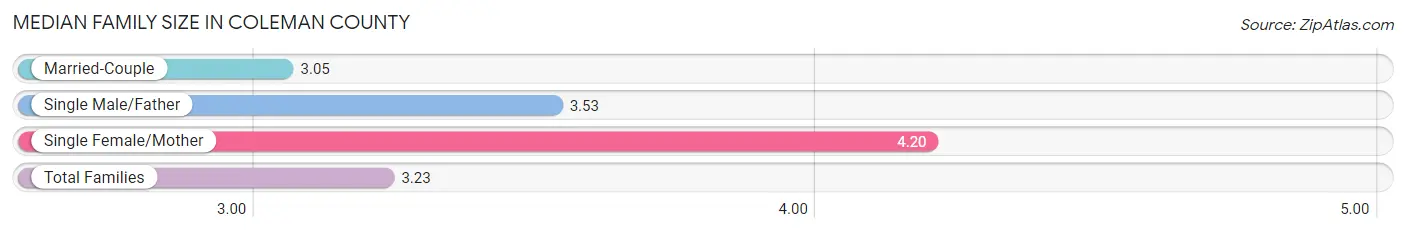
| Family Type | # Families | Family Size |
| Married-Couple | 1,501 (81.6%) | 3.05 |
| Single Male/Father | 89 (4.8%) | 3.53 |
| Single Female/Mother | 250 (13.6%) | 4.20 |
| Total Families | 1,840 (100.0%) | 3.23 |
Median Household Size in Coleman County
The median household size in Coleman County is 2.41 persons per household, with single female/mother households (250 | 7.8%) accounting for the largest median household size of 4.28 persons per household. non-family households (1,370 | 42.7%) represent the smallest median household size with 1.27 persons per household.
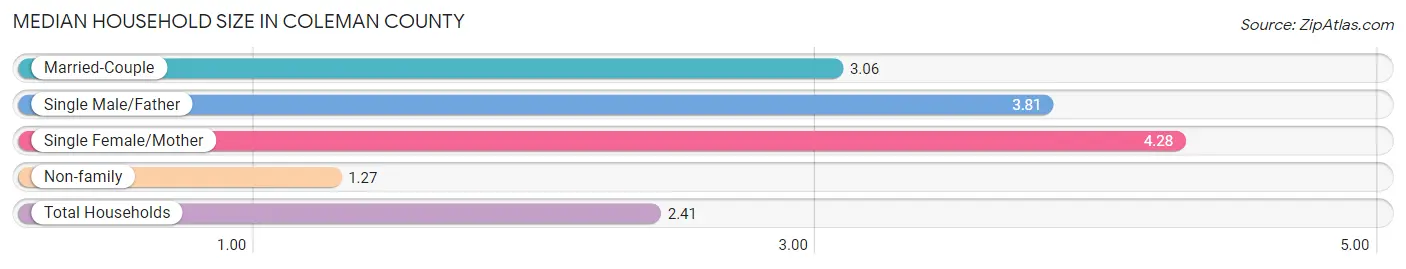
| Household Type | # Households | Household Size |
| Married-Couple | 1,501 (46.8%) | 3.06 |
| Single Male/Father | 89 (2.8%) | 3.81 |
| Single Female/Mother | 250 (7.8%) | 4.28 |
| Non-family | 1,370 (42.7%) | 1.27 |
| Total Households | 3,210 (100.0%) | 2.41 |
Household Size by Marriage Status in Coleman County
Out of a total of 3,210 households in Coleman County, 1,840 (57.3%) are family households, while 1,370 (42.7%) are nonfamily households. The most numerous type of family households are 2-person households, comprising 1,068, and the most common type of nonfamily households are 1-person households, comprising 1,115.
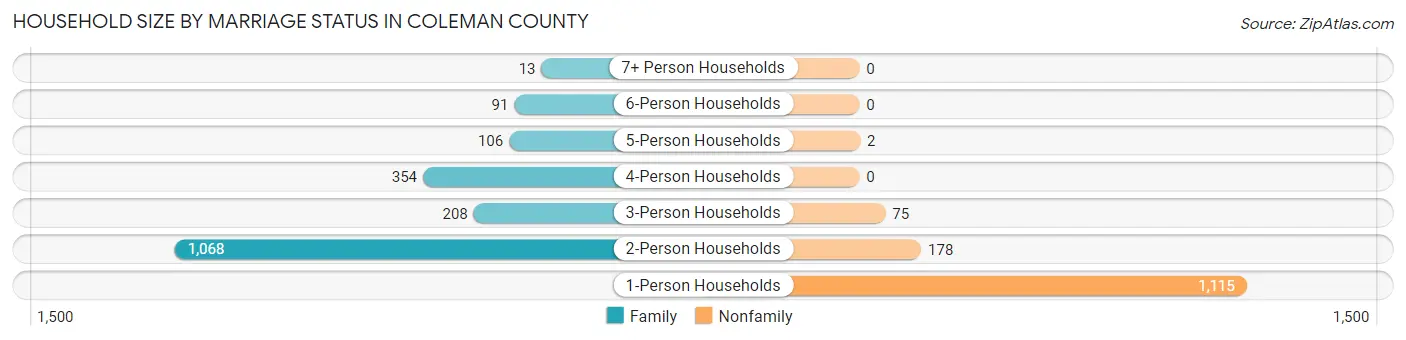
| Household Size | Family Households | Nonfamily Households |
| 1-Person Households | - | 1,115 (34.7%) |
| 2-Person Households | 1,068 (33.3%) | 178 (5.6%) |
| 3-Person Households | 208 (6.5%) | 75 (2.3%) |
| 4-Person Households | 354 (11.0%) | 0 (0.0%) |
| 5-Person Households | 106 (3.3%) | 2 (0.1%) |
| 6-Person Households | 91 (2.8%) | 0 (0.0%) |
| 7+ Person Households | 13 (0.4%) | 0 (0.0%) |
| Total | 1,840 (57.3%) | 1,370 (42.7%) |
Female Fertility in Coleman County
Fertility by Age in Coleman County
Average fertility rate in Coleman County is 69.0 births per 1,000 women. Women in the age bracket of 35 to 50 years have the highest fertility rate with 115.0 births per 1,000 women. Women in the age bracket of 35 to 50 years acount for 77.0% of all women with births.
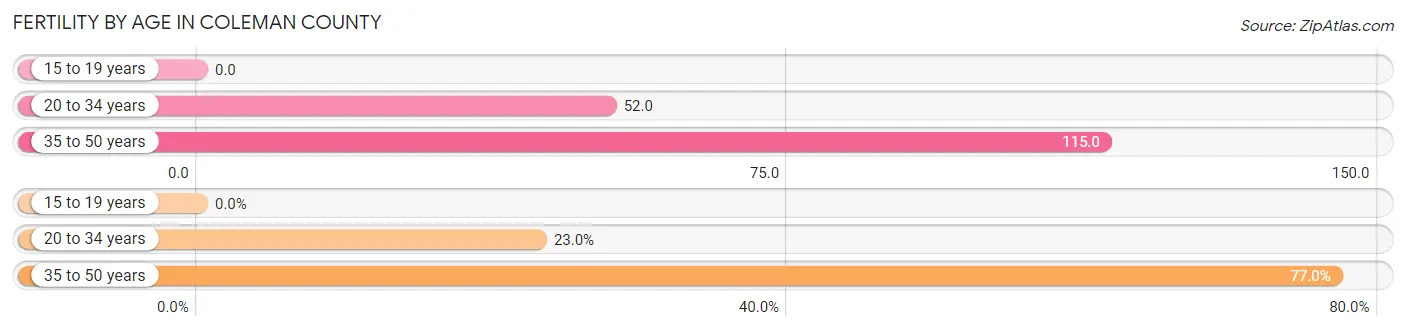
| Age Bracket | Women with Births | Births / 1,000 Women |
| 15 to 19 years | 0 (0.0%) | 0.0 |
| 20 to 34 years | 23 (23.0%) | 52.0 |
| 35 to 50 years | 77 (77.0%) | 115.0 |
| Total | 100 (100.0%) | 69.0 |
Fertility by Age by Marriage Status in Coleman County
28.0% of women with births (100) in Coleman County are married. The highest percentage of unmarried women with births falls into 35 to 50 years age bracket with 89.6% of them unmarried at the time of birth, while the lowest percentage of unmarried women with births belong to 20 to 34 years age bracket with 13.0% of them unmarried.
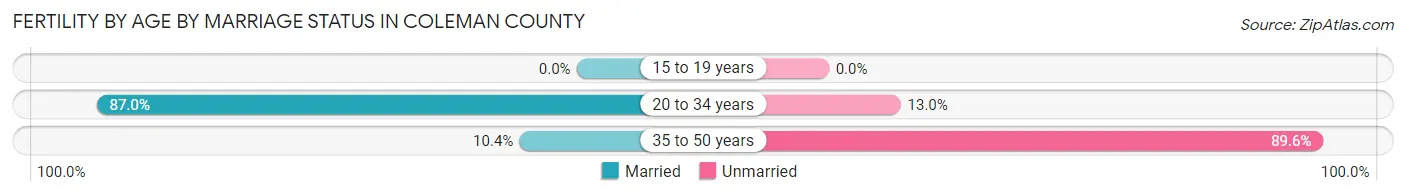
| Age Bracket | Married | Unmarried |
| 15 to 19 years | 0 (0.0%) | 0 (0.0%) |
| 20 to 34 years | 20 (87.0%) | 3 (13.0%) |
| 35 to 50 years | 8 (10.4%) | 69 (89.6%) |
| Total | 28 (28.0%) | 72 (72.0%) |
Fertility by Education in Coleman County
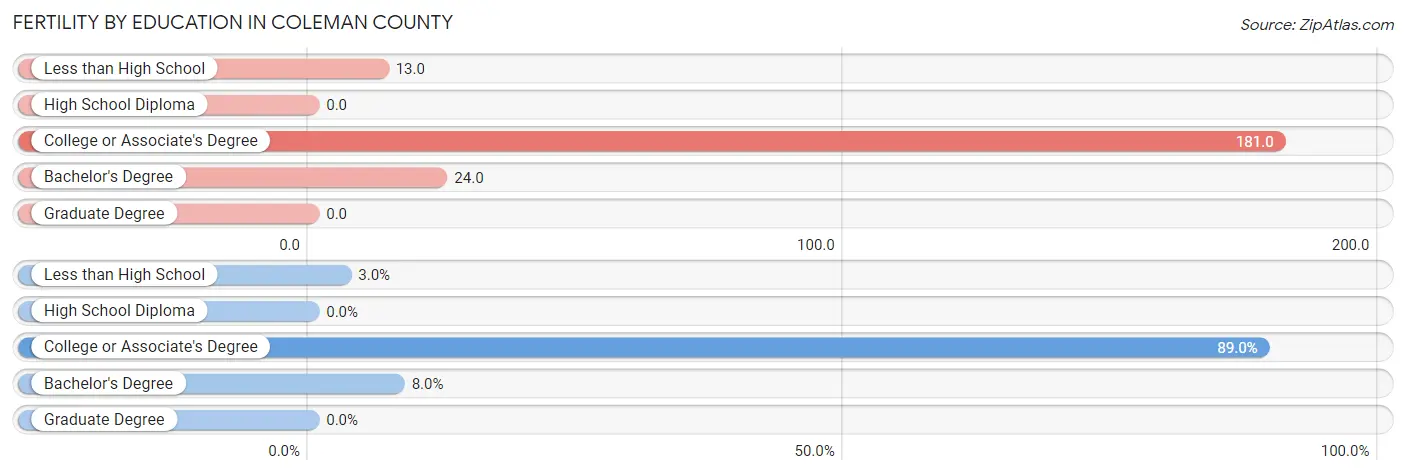
| Educational Attainment | Women with Births | Births / 1,000 Women |
| Less than High School | 3 (3.0%) | 13.0 |
| High School Diploma | 0 (0.0%) | 0.0 |
| College or Associate's Degree | 89 (89.0%) | 181.0 |
| Bachelor's Degree | 8 (8.0%) | 24.0 |
| Graduate Degree | 0 (0.0%) | 0.0 |
| Total | 100 (100.0%) | 69.0 |
Fertility by Education by Marriage Status in Coleman County
72.0% of women with births in Coleman County are unmarried. Women with the educational attainment of bachelor's degree are most likely to be married with 100.0% of them married at childbirth, while women with the educational attainment of less than high school are least likely to be married with 100.0% of them unmarried at childbirth.
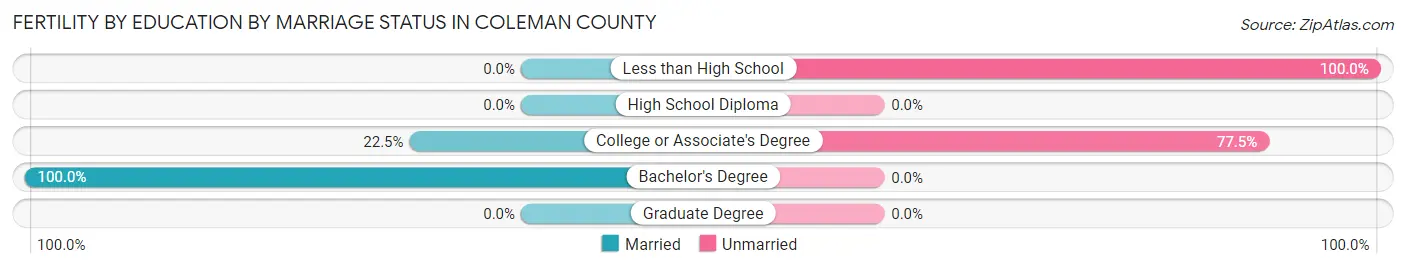
| Educational Attainment | Married | Unmarried |
| Less than High School | 0 (0.0%) | 3 (100.0%) |
| High School Diploma | 0 (0.0%) | 0 (0.0%) |
| College or Associate's Degree | 20 (22.5%) | 69 (77.5%) |
| Bachelor's Degree | 8 (100.0%) | 0 (0.0%) |
| Graduate Degree | 0 (0.0%) | 0 (0.0%) |
| Total | 28 (28.0%) | 72 (72.0%) |
Employment Characteristics in Coleman County
Employment by Class of Employer in Coleman County
Among the 3,361 employed individuals in Coleman County, private company employees (2,086 | 62.1%), self-employed (not incorporated) (372 | 11.1%), and not-for-profit organizations (334 | 9.9%) make up the most common classes of employment.
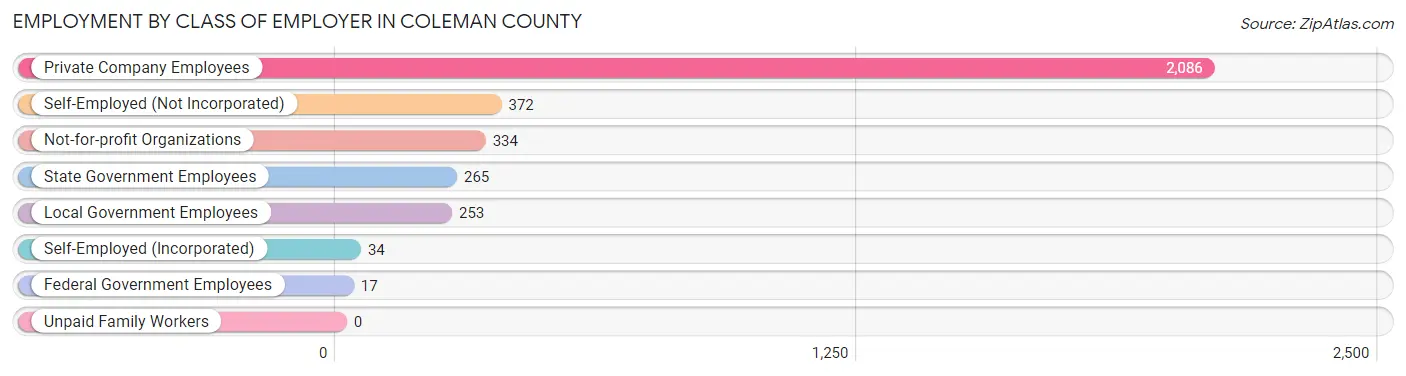
| Employer Class | # Employees | % Employees |
| Private Company Employees | 2,086 | 62.1% |
| Self-Employed (Incorporated) | 34 | 1.0% |
| Self-Employed (Not Incorporated) | 372 | 11.1% |
| Not-for-profit Organizations | 334 | 9.9% |
| Local Government Employees | 253 | 7.5% |
| State Government Employees | 265 | 7.9% |
| Federal Government Employees | 17 | 0.5% |
| Unpaid Family Workers | 0 | 0.0% |
| Total | 3,361 | 100.0% |
Employment Status by Age in Coleman County
According to the labor force statistics for Coleman County, out of the total population over 16 years of age (6,257), 57.5% or 3,598 individuals are in the labor force, with 6.3% or 227 of them unemployed. The age group with the highest labor force participation rate is 25 to 29 years, with 91.8% or 314 individuals in the labor force. Within the labor force, the 60 to 64 years age range has the highest percentage of unemployed individuals, with 21.5% or 67 of them being unemployed.
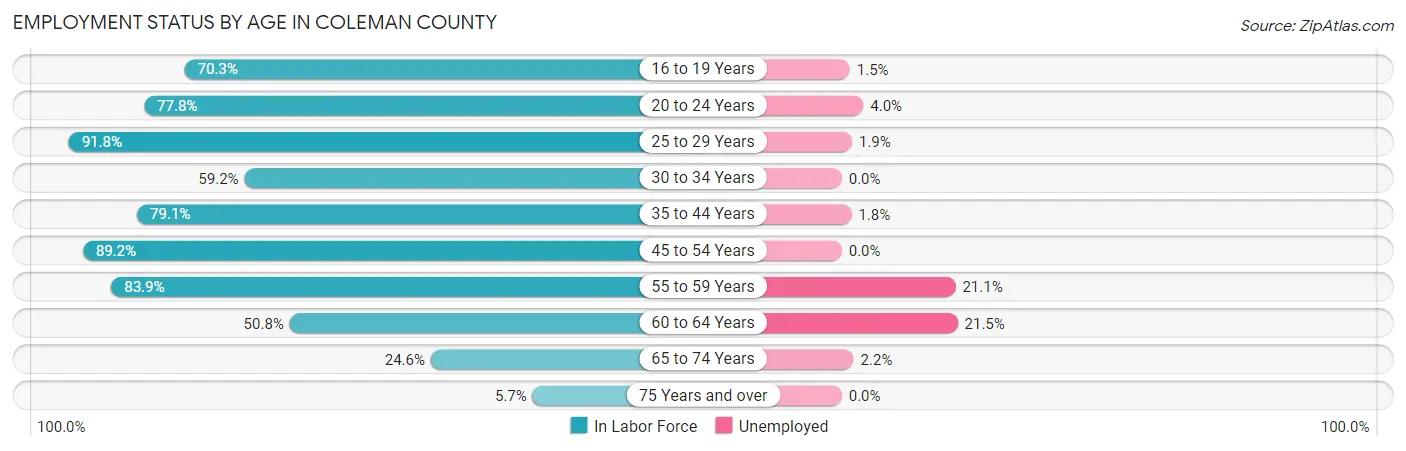
| Age Bracket | In Labor Force | Unemployed |
| 16 to 19 Years | 334 (70.3%) | 5 (1.5%) |
| 20 to 24 Years | 151 (77.8%) | 6 (4.0%) |
| 25 to 29 Years | 314 (91.8%) | 6 (1.9%) |
| 30 to 34 Years | 164 (59.2%) | 0 (0.0%) |
| 35 to 44 Years | 607 (79.1%) | 11 (1.8%) |
| 45 to 54 Years | 800 (89.2%) | 0 (0.0%) |
| 55 to 59 Years | 588 (83.9%) | 124 (21.1%) |
| 60 to 64 Years | 311 (50.8%) | 67 (21.5%) |
| 65 to 74 Years | 277 (24.6%) | 6 (2.2%) |
| 75 Years and over | 49 (5.7%) | 0 (0.0%) |
| Total | 3,598 (57.5%) | 227 (6.3%) |
Employment Status by Educational Attainment in Coleman County
According to labor force statistics for Coleman County, 77.4% of individuals (2,783) out of the total population between 25 and 64 years of age (3,596) are in the labor force, with 7.5% or 209 of them being unemployed. The group with the highest labor force participation rate are those with the educational attainment of less than high school, with 91.2% or 351 individuals in the labor force. Within the labor force, individuals with less than high school education have the highest percentage of unemployment, with 16.0% or 56 of them being unemployed.
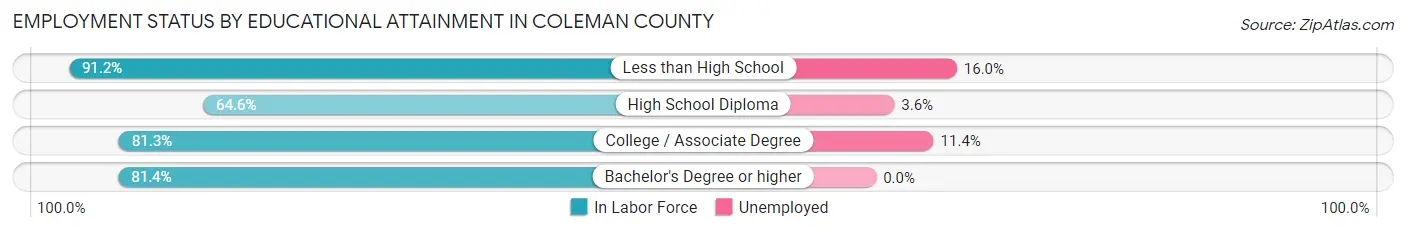
| Educational Attainment | In Labor Force | Unemployed |
| Less than High School | 351 (91.2%) | 62 (16.0%) |
| High School Diploma | 689 (64.6%) | 38 (3.6%) |
| College / Associate Degree | 1,114 (81.3%) | 156 (11.4%) |
| Bachelor's Degree or higher | 630 (81.4%) | 0 (0.0%) |
| Total | 2,783 (77.4%) | 270 (7.5%) |
Employment Occupations by Sex in Coleman County
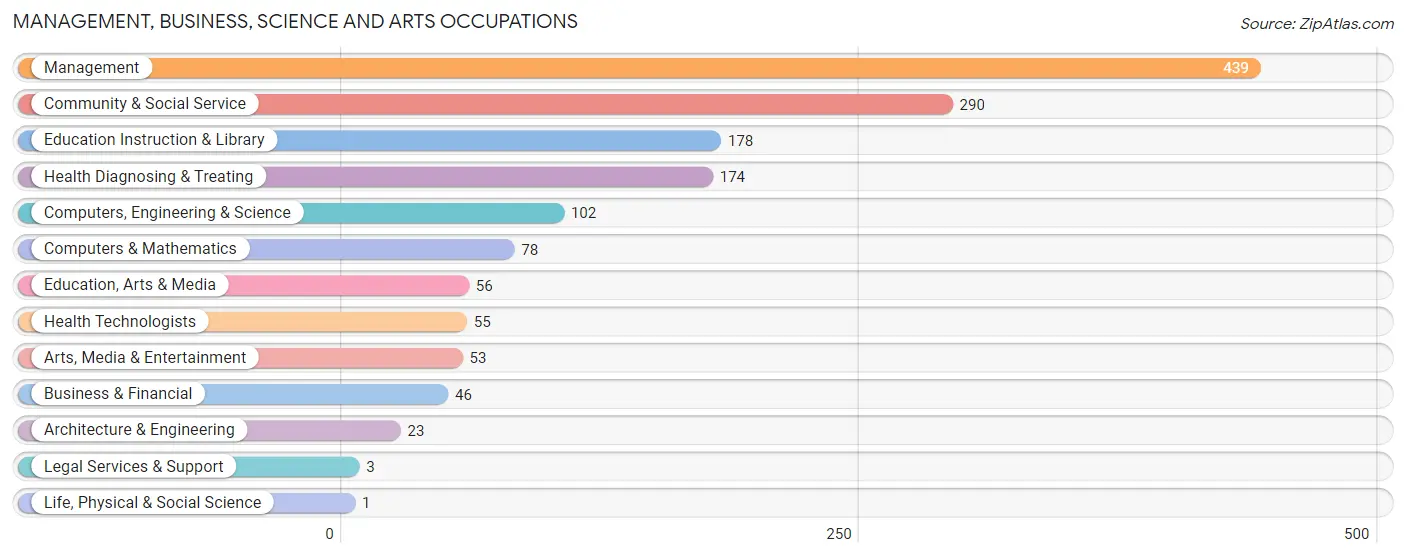
Management, Business, Science and Arts Occupations
The most common Management, Business, Science and Arts occupations in Coleman County are Management (439 | 13.0%), Community & Social Service (290 | 8.6%), Education Instruction & Library (178 | 5.3%), Health Diagnosing & Treating (174 | 5.2%), and Computers, Engineering & Science (102 | 3.0%).
Management, Business, Science and Arts Occupations by Sex
Within the Management, Business, Science and Arts occupations in Coleman County, the most male-oriented occupations are Computers & Mathematics (78.2%), Computers, Engineering & Science (75.5%), and Architecture & Engineering (69.6%), while the most female-oriented occupations are Life, Physical & Social Science (100.0%), Health Diagnosing & Treating (96.0%), and Health Technologists (90.9%).
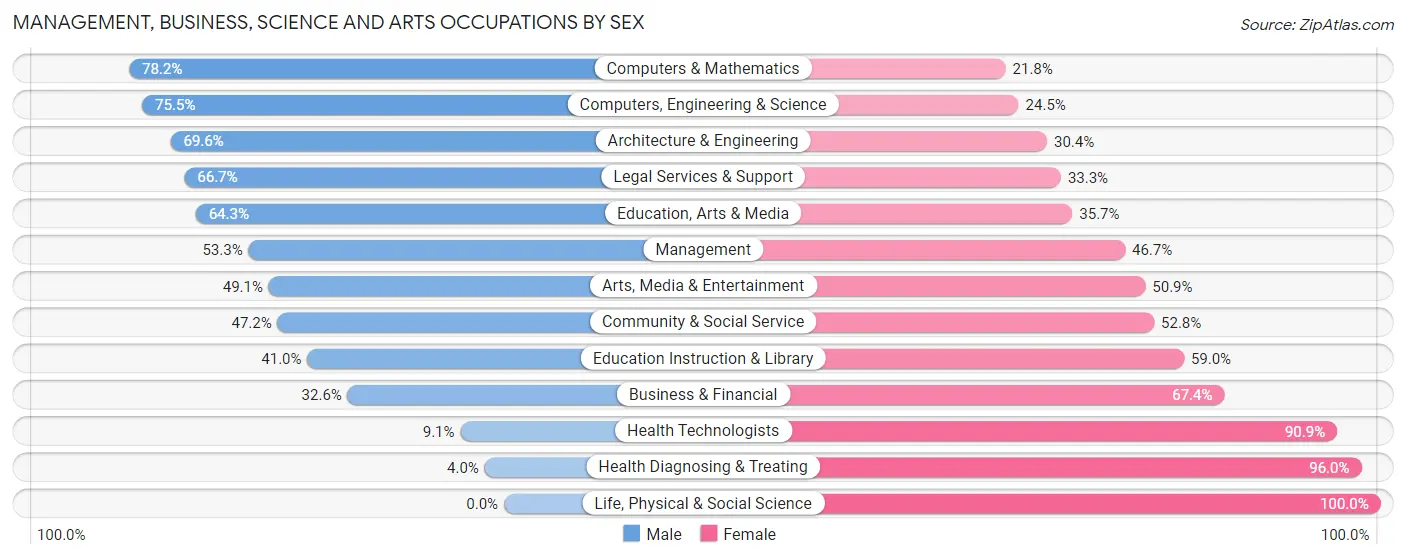
| Occupation | Male | Female |
| Management | 234 (53.3%) | 205 (46.7%) |
| Business & Financial | 15 (32.6%) | 31 (67.4%) |
| Computers, Engineering & Science | 77 (75.5%) | 25 (24.5%) |
| Computers & Mathematics | 61 (78.2%) | 17 (21.8%) |
| Architecture & Engineering | 16 (69.6%) | 7 (30.4%) |
| Life, Physical & Social Science | 0 (0.0%) | 1 (100.0%) |
| Community & Social Service | 137 (47.2%) | 153 (52.8%) |
| Education, Arts & Media | 36 (64.3%) | 20 (35.7%) |
| Legal Services & Support | 2 (66.7%) | 1 (33.3%) |
| Education Instruction & Library | 73 (41.0%) | 105 (59.0%) |
| Arts, Media & Entertainment | 26 (49.1%) | 27 (50.9%) |
| Health Diagnosing & Treating | 7 (4.0%) | 167 (96.0%) |
| Health Technologists | 5 (9.1%) | 50 (90.9%) |
| Total (Category) | 470 (44.7%) | 581 (55.3%) |
| Total (Overall) | 1,798 (53.3%) | 1,573 (46.7%) |
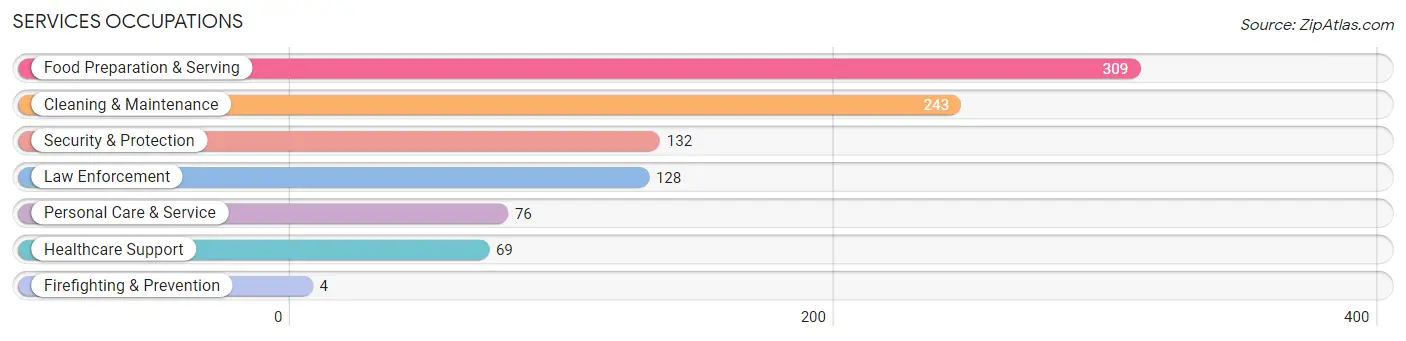
Services Occupations
The most common Services occupations in Coleman County are Food Preparation & Serving (309 | 9.2%), Cleaning & Maintenance (243 | 7.2%), Security & Protection (132 | 3.9%), Law Enforcement (128 | 3.8%), and Personal Care & Service (76 | 2.2%).
Services Occupations by Sex
Within the Services occupations in Coleman County, the most male-oriented occupations are Cleaning & Maintenance (58.9%), Food Preparation & Serving (42.1%), and Law Enforcement (8.6%), while the most female-oriented occupations are Firefighting & Prevention (100.0%), Healthcare Support (97.1%), and Personal Care & Service (92.1%).
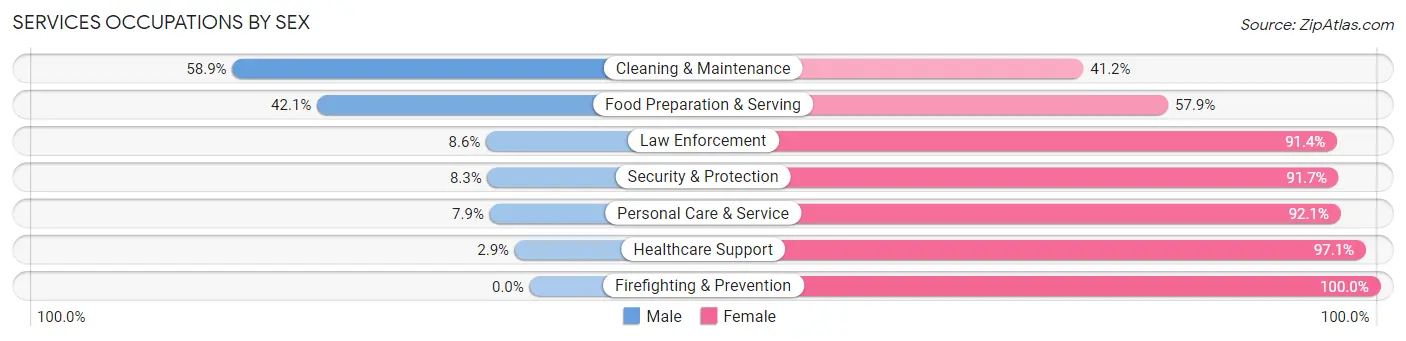
| Occupation | Male | Female |
| Healthcare Support | 2 (2.9%) | 67 (97.1%) |
| Security & Protection | 11 (8.3%) | 121 (91.7%) |
| Firefighting & Prevention | 0 (0.0%) | 4 (100.0%) |
| Law Enforcement | 11 (8.6%) | 117 (91.4%) |
| Food Preparation & Serving | 130 (42.1%) | 179 (57.9%) |
| Cleaning & Maintenance | 143 (58.9%) | 100 (41.1%) |
| Personal Care & Service | 6 (7.9%) | 70 (92.1%) |
| Total (Category) | 292 (35.2%) | 537 (64.8%) |
| Total (Overall) | 1,798 (53.3%) | 1,573 (46.7%) |
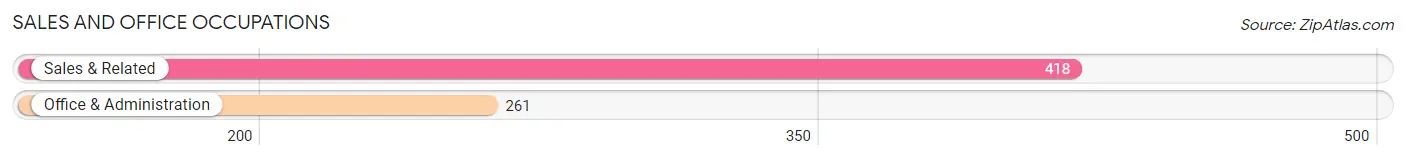
Sales and Office Occupations
The most common Sales and Office occupations in Coleman County are Sales & Related (418 | 12.4%), and Office & Administration (261 | 7.7%).
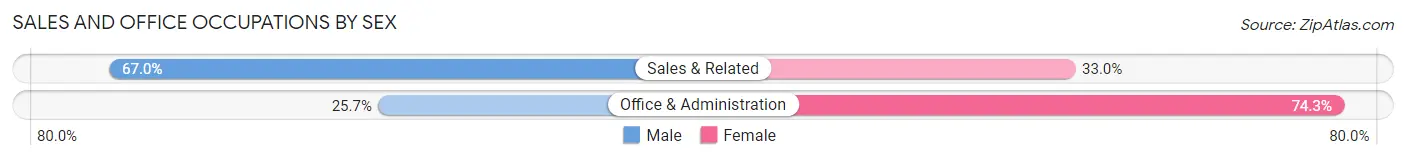
Sales and Office Occupations by Sex
| Occupation | Male | Female |
| Sales & Related | 280 (67.0%) | 138 (33.0%) |
| Office & Administration | 67 (25.7%) | 194 (74.3%) |
| Total (Category) | 347 (51.1%) | 332 (48.9%) |
| Total (Overall) | 1,798 (53.3%) | 1,573 (46.7%) |
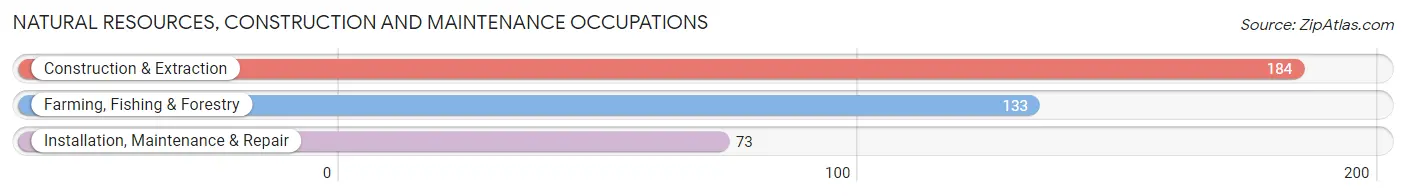
Natural Resources, Construction and Maintenance Occupations
The most common Natural Resources, Construction and Maintenance occupations in Coleman County are Construction & Extraction (184 | 5.5%), Farming, Fishing & Forestry (133 | 4.0%), and Installation, Maintenance & Repair (73 | 2.2%).
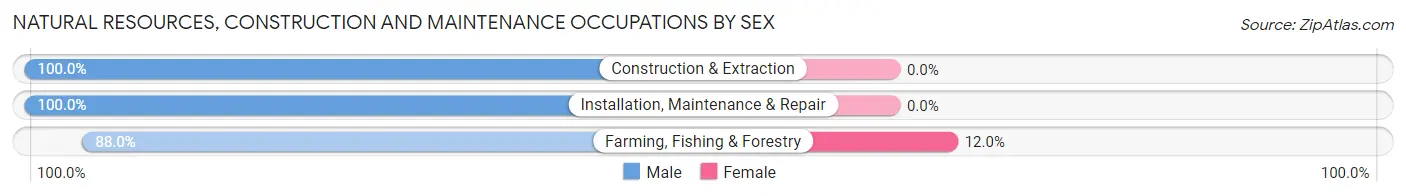
Natural Resources, Construction and Maintenance Occupations by Sex
| Occupation | Male | Female |
| Farming, Fishing & Forestry | 117 (88.0%) | 16 (12.0%) |
| Construction & Extraction | 184 (100.0%) | 0 (0.0%) |
| Installation, Maintenance & Repair | 73 (100.0%) | 0 (0.0%) |
| Total (Category) | 374 (95.9%) | 16 (4.1%) |
| Total (Overall) | 1,798 (53.3%) | 1,573 (46.7%) |
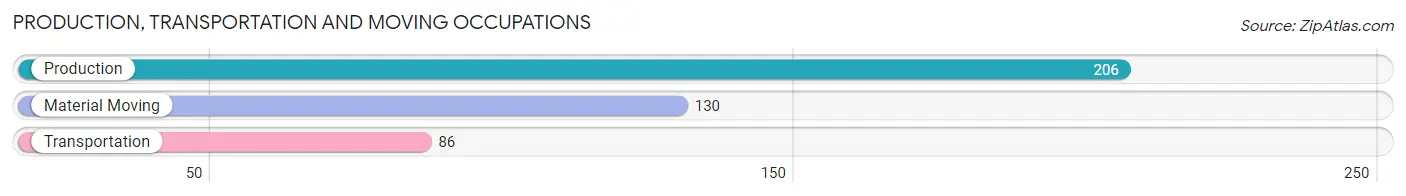
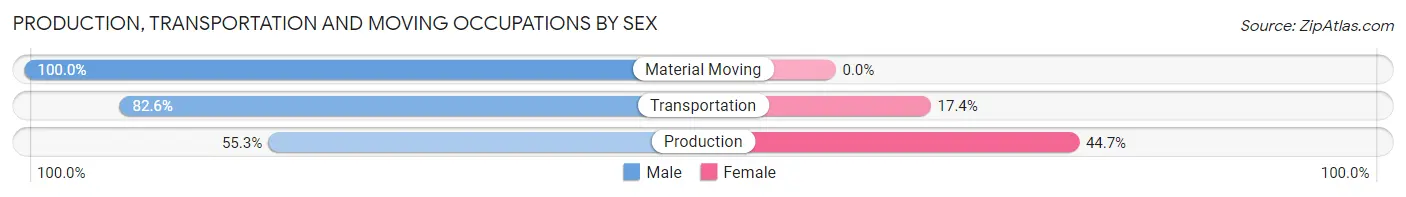
Production, Transportation and Moving Occupations
The most common Production, Transportation and Moving occupations in Coleman County are Production (206 | 6.1%), Material Moving (130 | 3.9%), and Transportation (86 | 2.5%).
Production, Transportation and Moving Occupations by Sex
| Occupation | Male | Female |
| Production | 114 (55.3%) | 92 (44.7%) |
| Transportation | 71 (82.6%) | 15 (17.4%) |
| Material Moving | 130 (100.0%) | 0 (0.0%) |
| Total (Category) | 315 (74.6%) | 107 (25.4%) |
| Total (Overall) | 1,798 (53.3%) | 1,573 (46.7%) |
Employment Industries by Sex in Coleman County
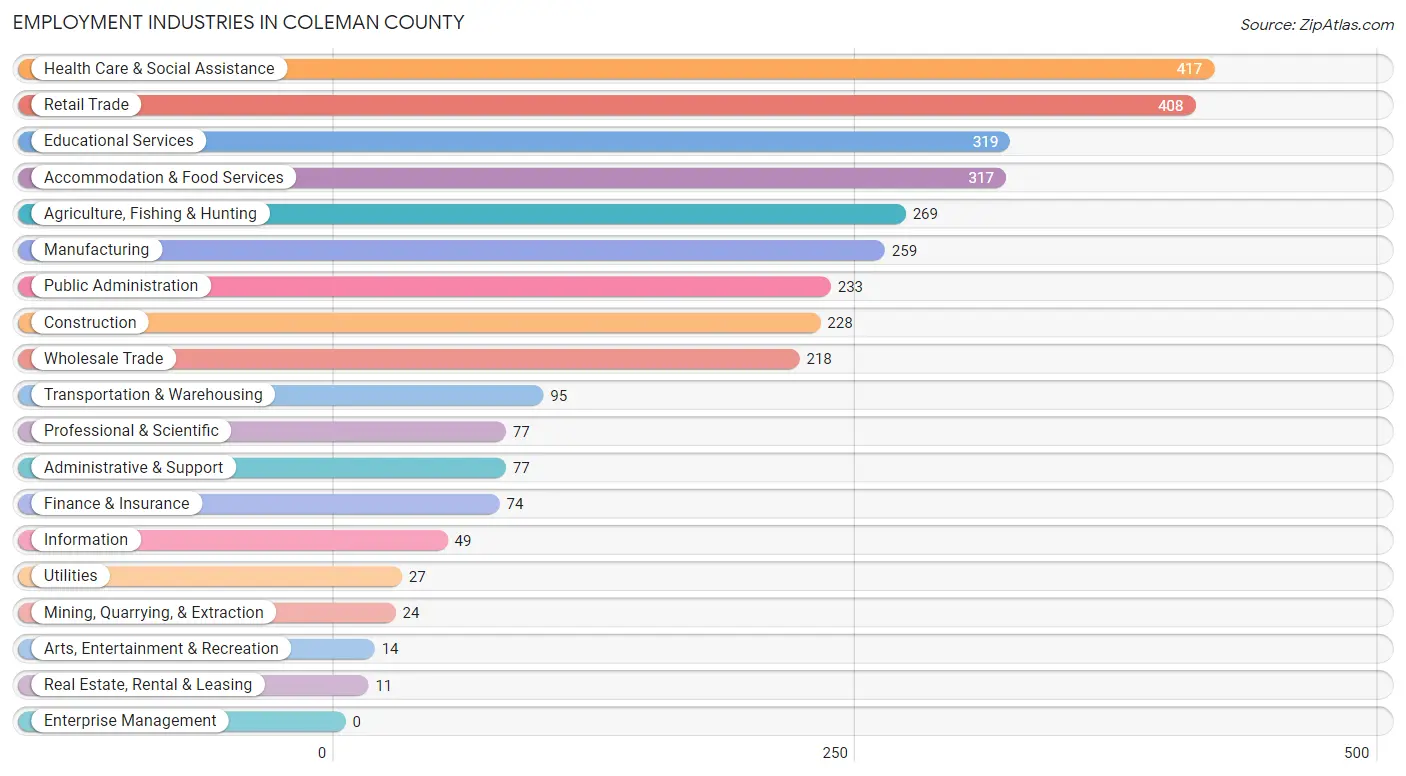
Employment Industries in Coleman County
The major employment industries in Coleman County include Health Care & Social Assistance (417 | 12.4%), Retail Trade (408 | 12.1%), Educational Services (319 | 9.5%), Accommodation & Food Services (317 | 9.4%), and Agriculture, Fishing & Hunting (269 | 8.0%).
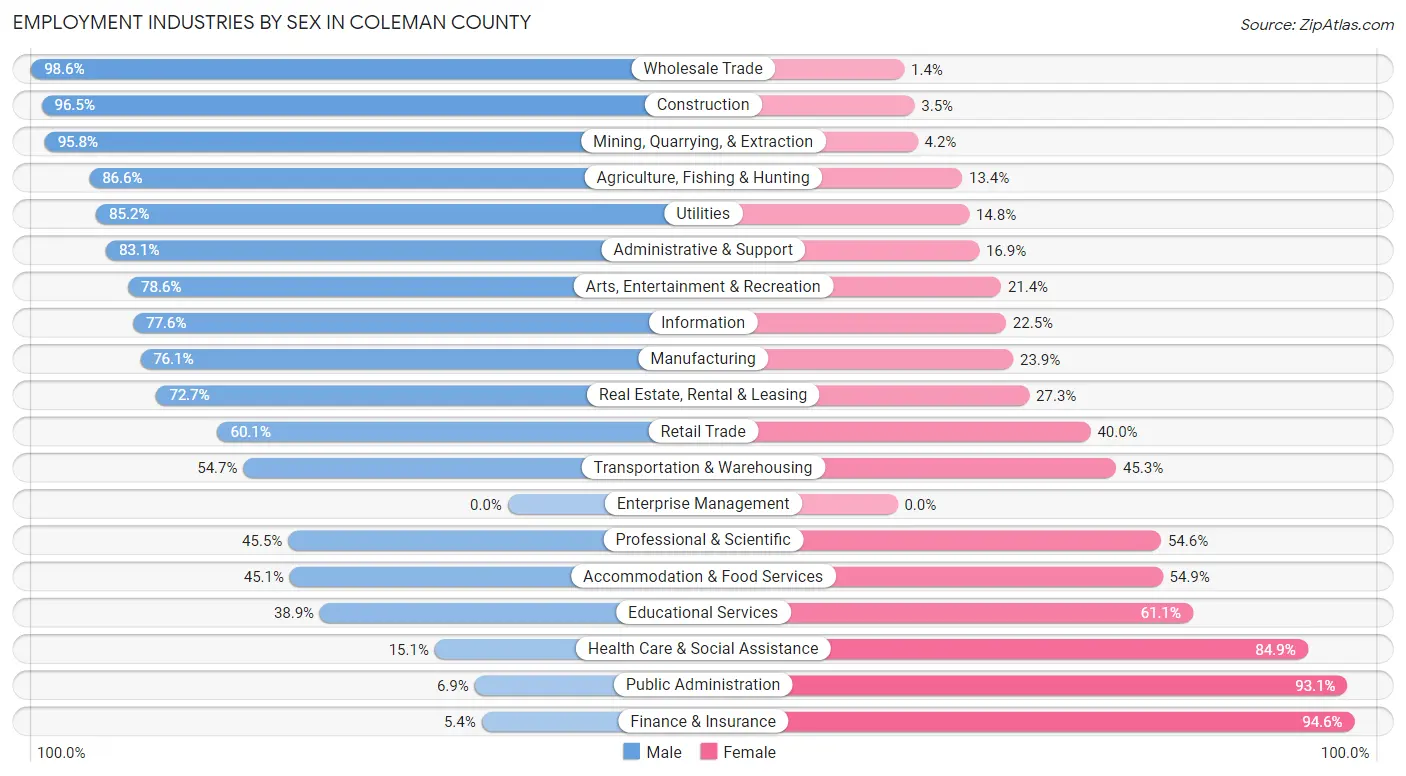
Employment Industries by Sex in Coleman County
The Coleman County industries that see more men than women are Wholesale Trade (98.6%), Construction (96.5%), and Mining, Quarrying, & Extraction (95.8%), whereas the industries that tend to have a higher number of women are Finance & Insurance (94.6%), Public Administration (93.1%), and Health Care & Social Assistance (84.9%).
| Industry | Male | Female |
| Agriculture, Fishing & Hunting | 233 (86.6%) | 36 (13.4%) |
| Mining, Quarrying, & Extraction | 23 (95.8%) | 1 (4.2%) |
| Construction | 220 (96.5%) | 8 (3.5%) |
| Manufacturing | 197 (76.1%) | 62 (23.9%) |
| Wholesale Trade | 215 (98.6%) | 3 (1.4%) |
| Retail Trade | 245 (60.1%) | 163 (40.0%) |
| Transportation & Warehousing | 52 (54.7%) | 43 (45.3%) |
| Utilities | 23 (85.2%) | 4 (14.8%) |
| Information | 38 (77.5%) | 11 (22.5%) |
| Finance & Insurance | 4 (5.4%) | 70 (94.6%) |
| Real Estate, Rental & Leasing | 8 (72.7%) | 3 (27.3%) |
| Professional & Scientific | 35 (45.5%) | 42 (54.5%) |
| Enterprise Management | 0 (0.0%) | 0 (0.0%) |
| Administrative & Support | 64 (83.1%) | 13 (16.9%) |
| Educational Services | 124 (38.9%) | 195 (61.1%) |
| Health Care & Social Assistance | 63 (15.1%) | 354 (84.9%) |
| Arts, Entertainment & Recreation | 11 (78.6%) | 3 (21.4%) |
| Accommodation & Food Services | 143 (45.1%) | 174 (54.9%) |
| Public Administration | 16 (6.9%) | 217 (93.1%) |
| Total | 1,798 (53.3%) | 1,573 (46.7%) |
Education in Coleman County
School Enrollment in Coleman County
The most common levels of schooling among the 1,535 students in Coleman County are middle school (467 | 30.4%), high school (453 | 29.5%), and elementary school (271 | 17.6%).
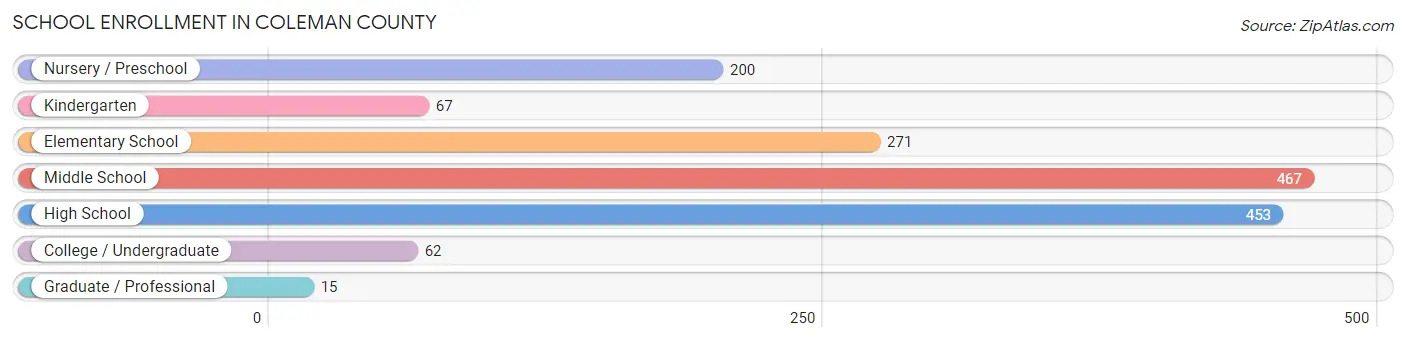
| School Level | # Students | % Students |
| Nursery / Preschool | 200 | 13.0% |
| Kindergarten | 67 | 4.4% |
| Elementary School | 271 | 17.6% |
| Middle School | 467 | 30.4% |
| High School | 453 | 29.5% |
| College / Undergraduate | 62 | 4.0% |
| Graduate / Professional | 15 | 1.0% |
| Total | 1,535 | 100.0% |
School Enrollment by Age by Funding Source in Coleman County
Out of a total of 1,535 students who are enrolled in schools in Coleman County, 78 (5.1%) attend a private institution, while the remaining 1,457 (94.9%) are enrolled in public schools. The age group of 35 years and over has the highest likelihood of being enrolled in private schools, with 9 (56.2% in the age bracket) enrolled. Conversely, the age group of 15 to 17 year olds has the lowest likelihood of being enrolled in a private school, with 346 (100.0% in the age bracket) attending a public institution.
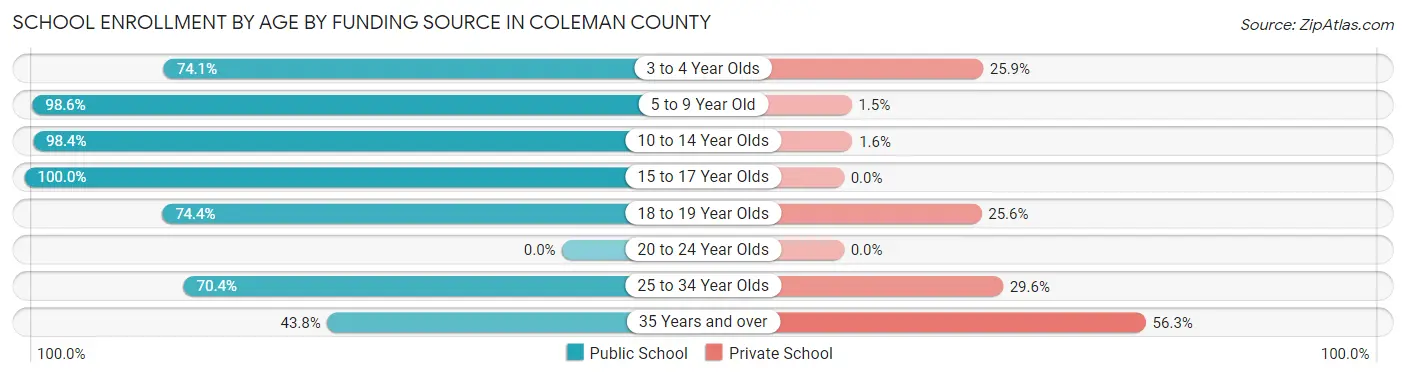
| Age Bracket | Public School | Private School |
| 3 to 4 Year Olds | 80 (74.1%) | 28 (25.9%) |
| 5 to 9 Year Old | 339 (98.6%) | 5 (1.5%) |
| 10 to 14 Year Olds | 618 (98.4%) | 10 (1.6%) |
| 15 to 17 Year Olds | 346 (100.0%) | 0 (0.0%) |
| 18 to 19 Year Olds | 29 (74.4%) | 10 (25.6%) |
| 20 to 24 Year Olds | 0 (0.0%) | 0 (0.0%) |
| 25 to 34 Year Olds | 38 (70.4%) | 16 (29.6%) |
| 35 Years and over | 7 (43.8%) | 9 (56.2%) |
| Total | 1,457 (94.9%) | 78 (5.1%) |
Educational Attainment by Field of Study in Coleman County
Bio, nature & agricultural (235 | 19.3%), education (196 | 16.1%), business (193 | 15.8%), arts & humanities (96 | 7.9%), and science & technology (87 | 7.1%) are the most common fields of study among 1,220 individuals in Coleman County who have obtained a bachelor's degree or higher.
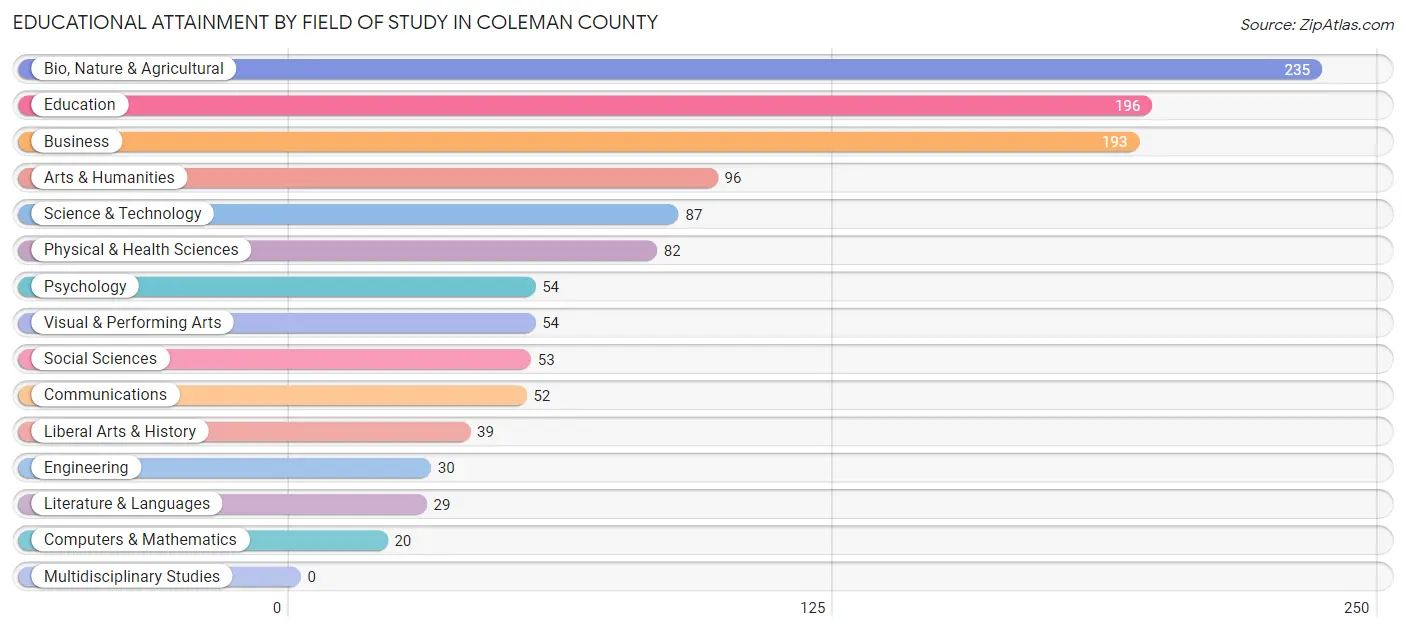
| Field of Study | # Graduates | % Graduates |
| Computers & Mathematics | 20 | 1.6% |
| Bio, Nature & Agricultural | 235 | 19.3% |
| Physical & Health Sciences | 82 | 6.7% |
| Psychology | 54 | 4.4% |
| Social Sciences | 53 | 4.3% |
| Engineering | 30 | 2.5% |
| Multidisciplinary Studies | 0 | 0.0% |
| Science & Technology | 87 | 7.1% |
| Business | 193 | 15.8% |
| Education | 196 | 16.1% |
| Literature & Languages | 29 | 2.4% |
| Liberal Arts & History | 39 | 3.2% |
| Visual & Performing Arts | 54 | 4.4% |
| Communications | 52 | 4.3% |
| Arts & Humanities | 96 | 7.9% |
| Total | 1,220 | 100.0% |
Transportation & Commute in Coleman County
Vehicle Availability by Sex in Coleman County
The most prevalent vehicle ownership categories in Coleman County are males with 2 vehicles (804, accounting for 45.0%) and females with 2 vehicles (679, making up 51.3%).
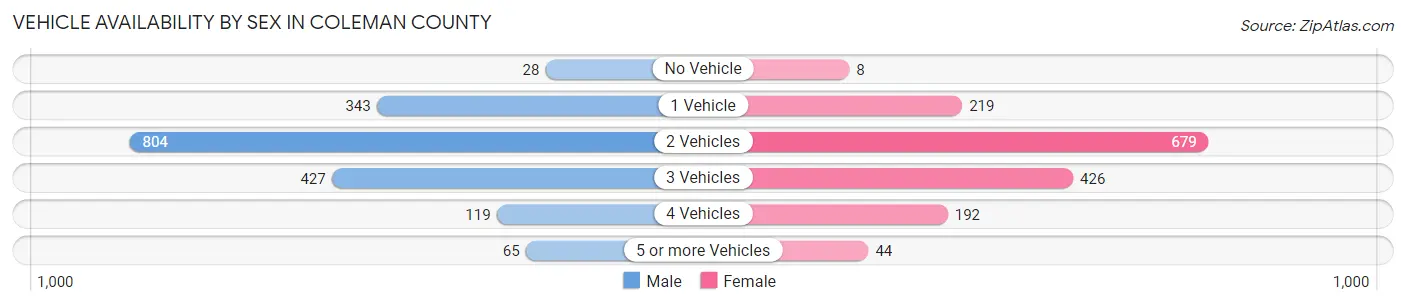
| Vehicles Available | Male | Female |
| No Vehicle | 28 (1.6%) | 8 (0.5%) |
| 1 Vehicle | 343 (19.2%) | 219 (14.0%) |
| 2 Vehicles | 804 (45.0%) | 679 (43.3%) |
| 3 Vehicles | 427 (23.9%) | 426 (27.2%) |
| 4 Vehicles | 119 (6.7%) | 192 (12.2%) |
| 5 or more Vehicles | 65 (3.6%) | 44 (2.8%) |
| Total | 1,786 (100.0%) | 1,568 (100.0%) |
Commute Time in Coleman County
The most frequently occuring commute durations in Coleman County are 5 to 9 minutes (788 commuters, 24.9%), 10 to 14 minutes (375 commuters, 11.8%), and 30 to 34 minutes (360 commuters, 11.4%).
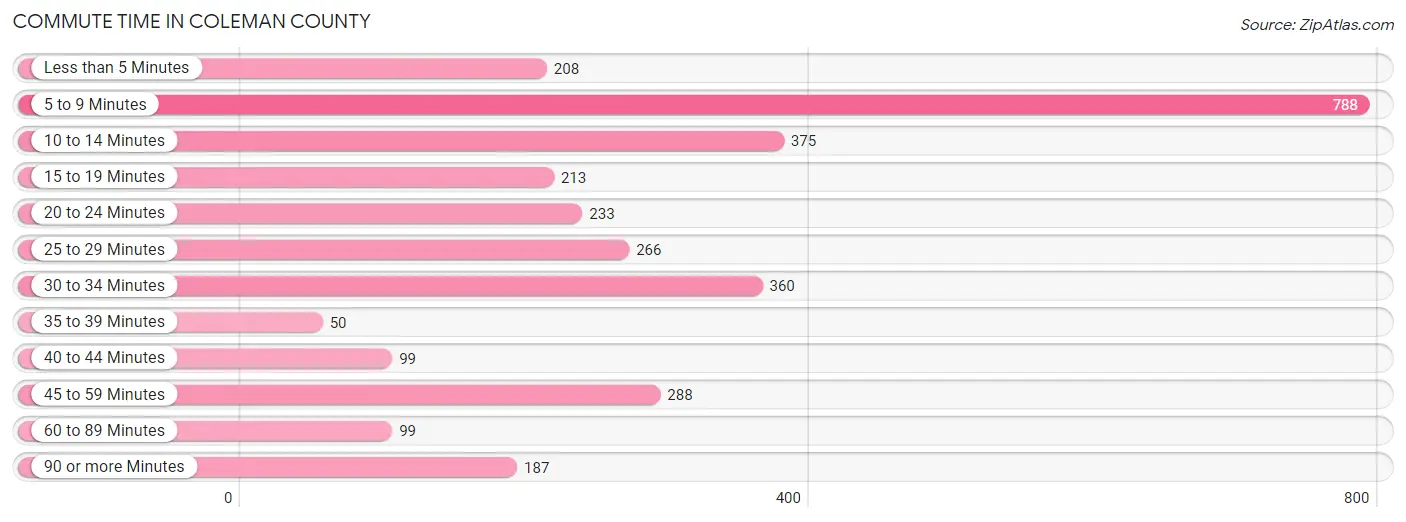
| Commute Time | # Commuters | % Commuters |
| Less than 5 Minutes | 208 | 6.6% |
| 5 to 9 Minutes | 788 | 24.9% |
| 10 to 14 Minutes | 375 | 11.8% |
| 15 to 19 Minutes | 213 | 6.7% |
| 20 to 24 Minutes | 233 | 7.4% |
| 25 to 29 Minutes | 266 | 8.4% |
| 30 to 34 Minutes | 360 | 11.4% |
| 35 to 39 Minutes | 50 | 1.6% |
| 40 to 44 Minutes | 99 | 3.1% |
| 45 to 59 Minutes | 288 | 9.1% |
| 60 to 89 Minutes | 99 | 3.1% |
| 90 or more Minutes | 187 | 5.9% |
Commute Time by Sex in Coleman County
The most common commute times in Coleman County are 5 to 9 minutes (361 commuters, 21.6%) for males and 5 to 9 minutes (427 commuters, 28.6%) for females.
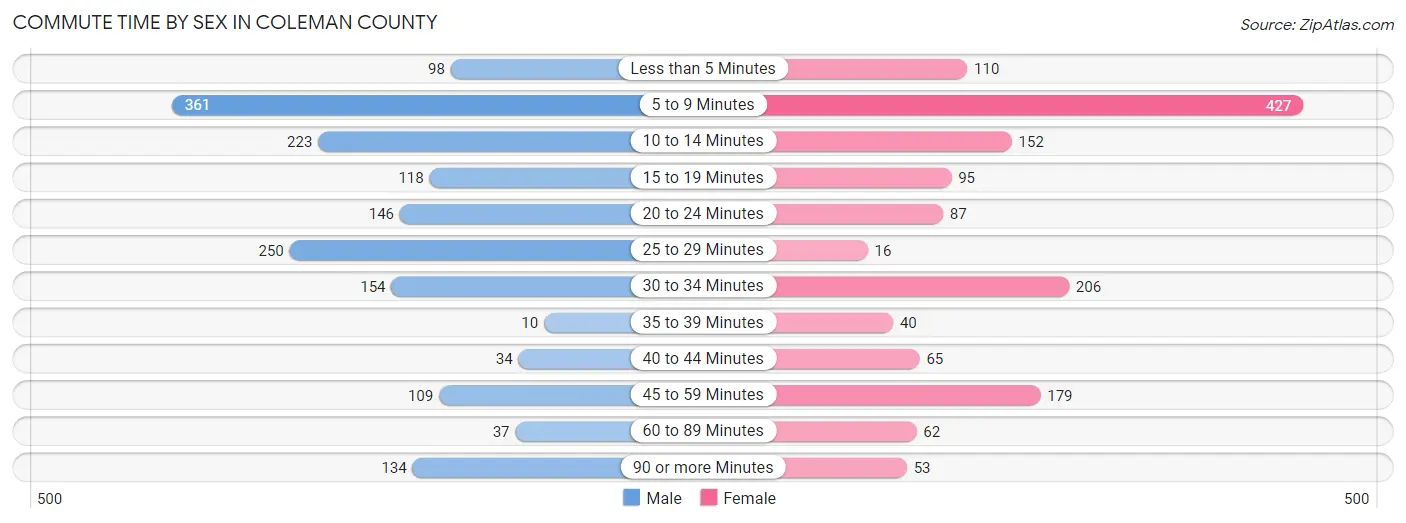
| Commute Time | Male | Female |
| Less than 5 Minutes | 98 (5.9%) | 110 (7.4%) |
| 5 to 9 Minutes | 361 (21.6%) | 427 (28.6%) |
| 10 to 14 Minutes | 223 (13.3%) | 152 (10.2%) |
| 15 to 19 Minutes | 118 (7.0%) | 95 (6.4%) |
| 20 to 24 Minutes | 146 (8.7%) | 87 (5.8%) |
| 25 to 29 Minutes | 250 (14.9%) | 16 (1.1%) |
| 30 to 34 Minutes | 154 (9.2%) | 206 (13.8%) |
| 35 to 39 Minutes | 10 (0.6%) | 40 (2.7%) |
| 40 to 44 Minutes | 34 (2.0%) | 65 (4.4%) |
| 45 to 59 Minutes | 109 (6.5%) | 179 (12.0%) |
| 60 to 89 Minutes | 37 (2.2%) | 62 (4.2%) |
| 90 or more Minutes | 134 (8.0%) | 53 (3.5%) |
Time of Departure to Work by Sex in Coleman County
The most frequent times of departure to work in Coleman County are 7:30 AM to 7:59 AM (348, 20.8%) for males and 8:00 AM to 8:29 AM (371, 24.9%) for females.
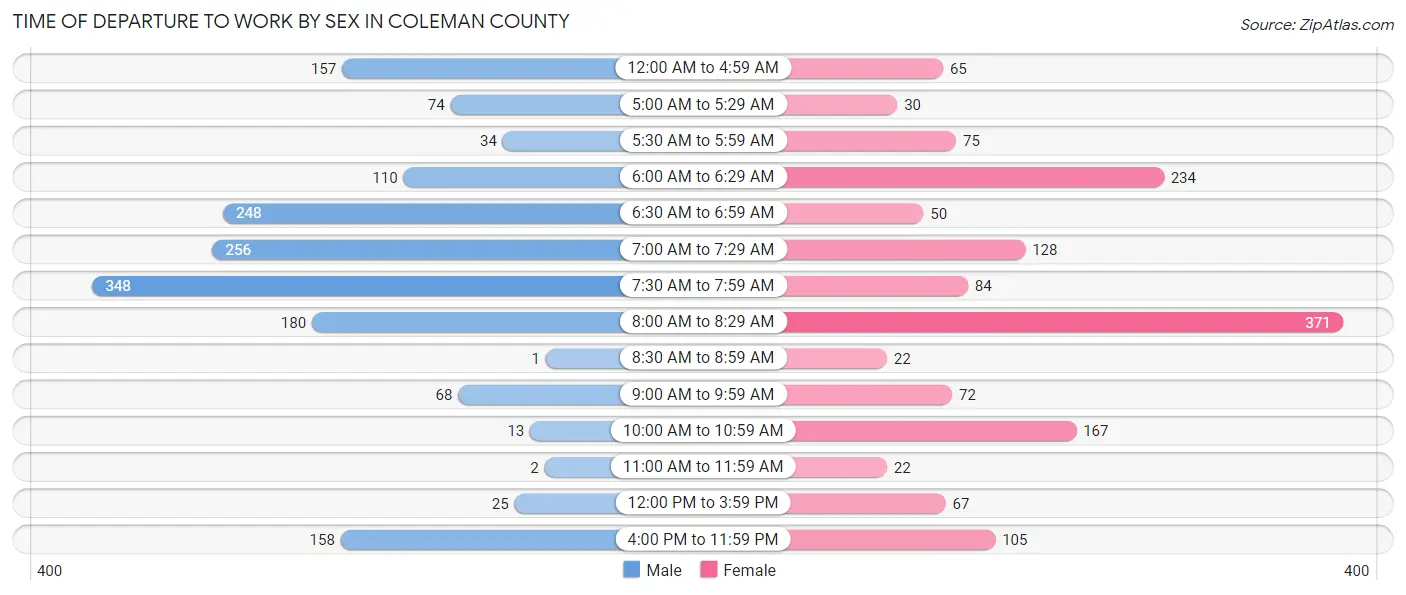
| Time of Departure | Male | Female |
| 12:00 AM to 4:59 AM | 157 (9.4%) | 65 (4.4%) |
| 5:00 AM to 5:29 AM | 74 (4.4%) | 30 (2.0%) |
| 5:30 AM to 5:59 AM | 34 (2.0%) | 75 (5.0%) |
| 6:00 AM to 6:29 AM | 110 (6.6%) | 234 (15.7%) |
| 6:30 AM to 6:59 AM | 248 (14.8%) | 50 (3.4%) |
| 7:00 AM to 7:29 AM | 256 (15.3%) | 128 (8.6%) |
| 7:30 AM to 7:59 AM | 348 (20.8%) | 84 (5.6%) |
| 8:00 AM to 8:29 AM | 180 (10.7%) | 371 (24.9%) |
| 8:30 AM to 8:59 AM | 1 (0.1%) | 22 (1.5%) |
| 9:00 AM to 9:59 AM | 68 (4.1%) | 72 (4.8%) |
| 10:00 AM to 10:59 AM | 13 (0.8%) | 167 (11.2%) |
| 11:00 AM to 11:59 AM | 2 (0.1%) | 22 (1.5%) |
| 12:00 PM to 3:59 PM | 25 (1.5%) | 67 (4.5%) |
| 4:00 PM to 11:59 PM | 158 (9.4%) | 105 (7.0%) |
| Total | 1,674 (100.0%) | 1,492 (100.0%) |
Housing Occupancy in Coleman County
Occupancy by Ownership in Coleman County
Of the total 3,210 dwellings in Coleman County, owner-occupied units account for 2,314 (72.1%), while renter-occupied units make up 896 (27.9%).
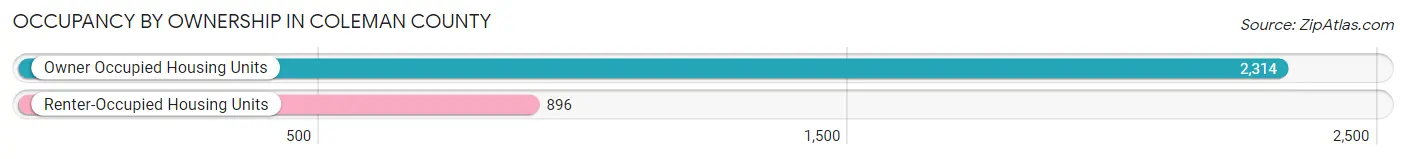
| Occupancy | # Housing Units | % Housing Units |
| Owner Occupied Housing Units | 2,314 | 72.1% |
| Renter-Occupied Housing Units | 896 | 27.9% |
| Total Occupied Housing Units | 3,210 | 100.0% |
Occupancy by Household Size in Coleman County
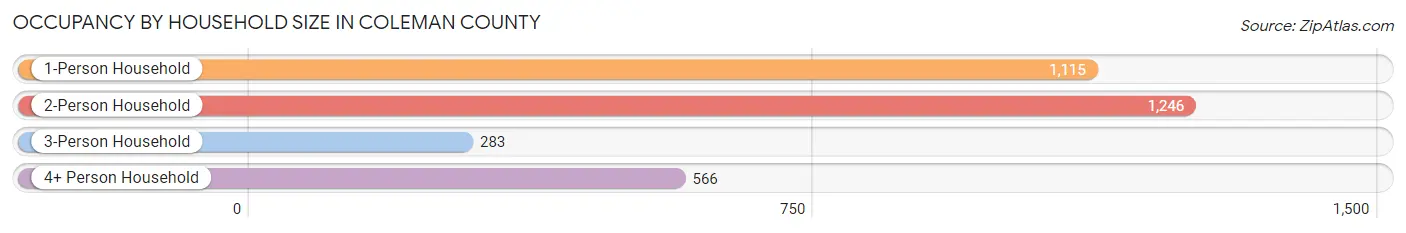
| Household Size | # Housing Units | % Housing Units |
| 1-Person Household | 1,115 | 34.7% |
| 2-Person Household | 1,246 | 38.8% |
| 3-Person Household | 283 | 8.8% |
| 4+ Person Household | 566 | 17.6% |
| Total Housing Units | 3,210 | 100.0% |
Occupancy by Ownership by Household Size in Coleman County
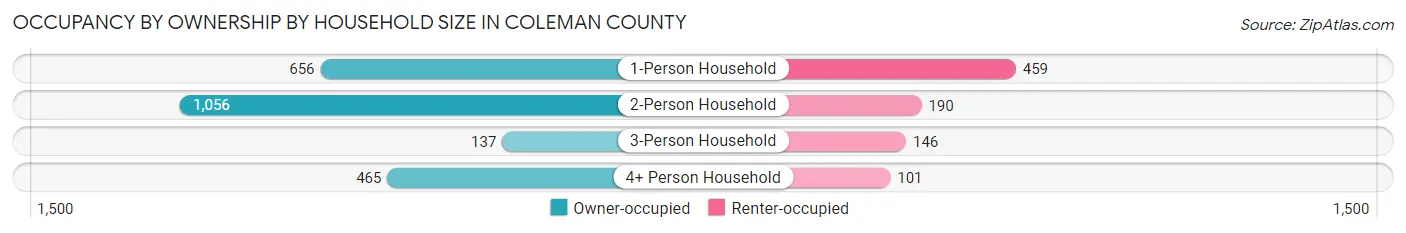
| Household Size | Owner-occupied | Renter-occupied |
| 1-Person Household | 656 (58.8%) | 459 (41.2%) |
| 2-Person Household | 1,056 (84.8%) | 190 (15.2%) |
| 3-Person Household | 137 (48.4%) | 146 (51.6%) |
| 4+ Person Household | 465 (82.2%) | 101 (17.8%) |
| Total Housing Units | 2,314 (72.1%) | 896 (27.9%) |
Occupancy by Educational Attainment in Coleman County
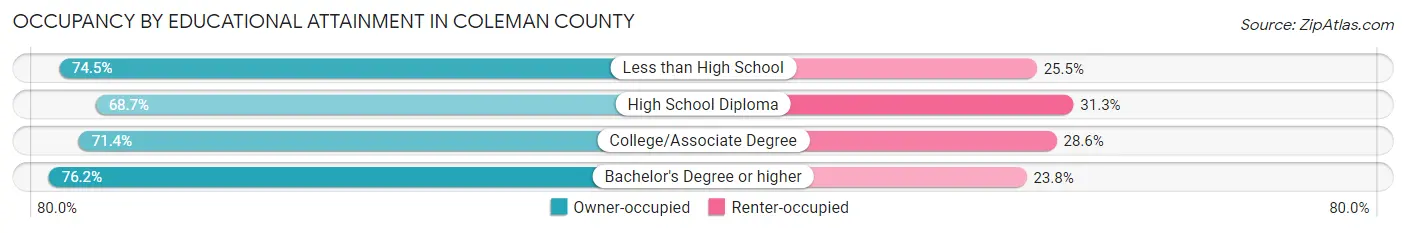
| Household Size | Owner-occupied | Renter-occupied |
| Less than High School | 275 (74.5%) | 94 (25.5%) |
| High School Diploma | 624 (68.7%) | 284 (31.3%) |
| College/Associate Degree | 856 (71.4%) | 343 (28.6%) |
| Bachelor's Degree or higher | 559 (76.2%) | 175 (23.8%) |
Occupancy by Age of Householder in Coleman County
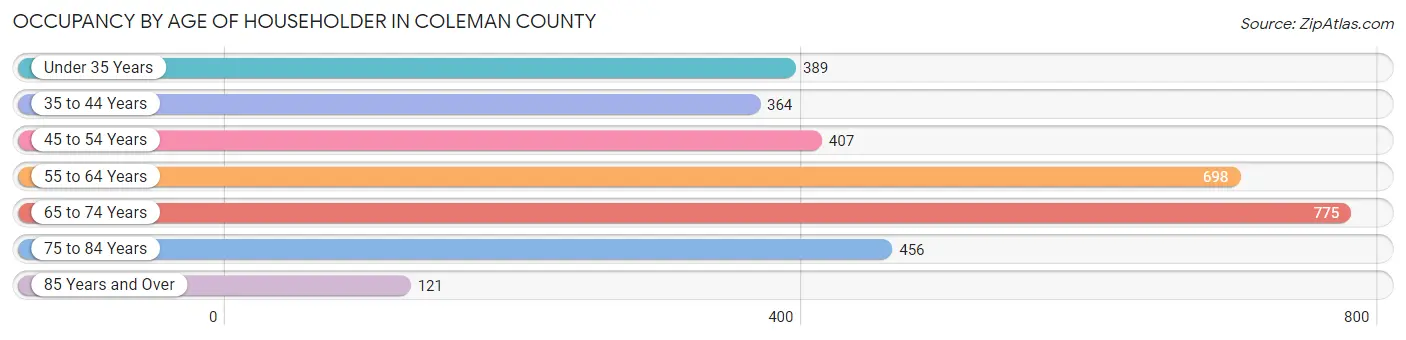
| Age Bracket | # Households | % Households |
| Under 35 Years | 389 | 12.1% |
| 35 to 44 Years | 364 | 11.3% |
| 45 to 54 Years | 407 | 12.7% |
| 55 to 64 Years | 698 | 21.7% |
| 65 to 74 Years | 775 | 24.1% |
| 75 to 84 Years | 456 | 14.2% |
| 85 Years and Over | 121 | 3.8% |
| Total | 3,210 | 100.0% |
Housing Finances in Coleman County
Median Income by Occupancy in Coleman County
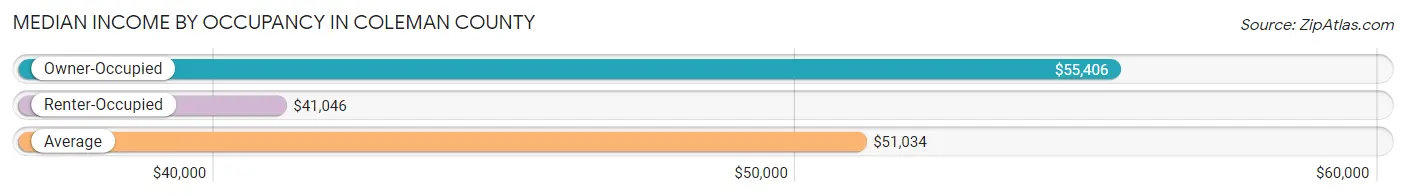
| Occupancy Type | # Households | Median Income |
| Owner-Occupied | 2,314 (72.1%) | $55,406 |
| Renter-Occupied | 896 (27.9%) | $41,046 |
| Average | 3,210 (100.0%) | $51,034 |
Occupancy by Householder Income Bracket in Coleman County
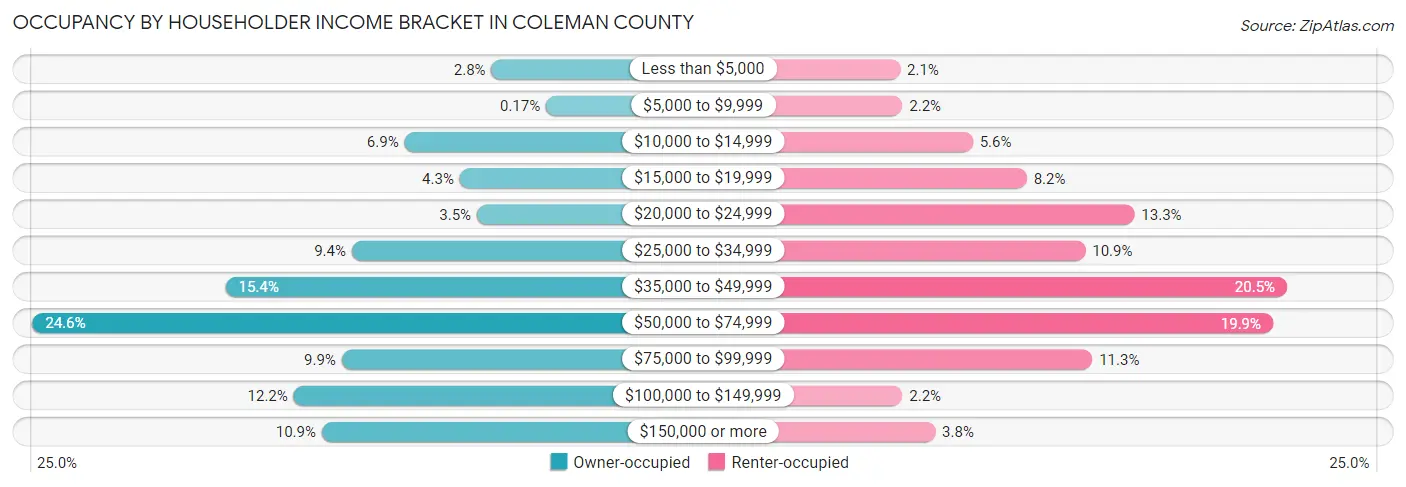
| Income Bracket | Owner-occupied | Renter-occupied |
| Less than $5,000 | 64 (2.8%) | 19 (2.1%) |
| $5,000 to $9,999 | 4 (0.2%) | 20 (2.2%) |
| $10,000 to $14,999 | 160 (6.9%) | 50 (5.6%) |
| $15,000 to $19,999 | 99 (4.3%) | 73 (8.2%) |
| $20,000 to $24,999 | 80 (3.5%) | 119 (13.3%) |
| $25,000 to $34,999 | 218 (9.4%) | 98 (10.9%) |
| $35,000 to $49,999 | 357 (15.4%) | 184 (20.5%) |
| $50,000 to $74,999 | 570 (24.6%) | 178 (19.9%) |
| $75,000 to $99,999 | 229 (9.9%) | 101 (11.3%) |
| $100,000 to $149,999 | 282 (12.2%) | 20 (2.2%) |
| $150,000 or more | 251 (10.8%) | 34 (3.8%) |
| Total | 2,314 (100.0%) | 896 (100.0%) |
Monthly Housing Cost Tiers in Coleman County
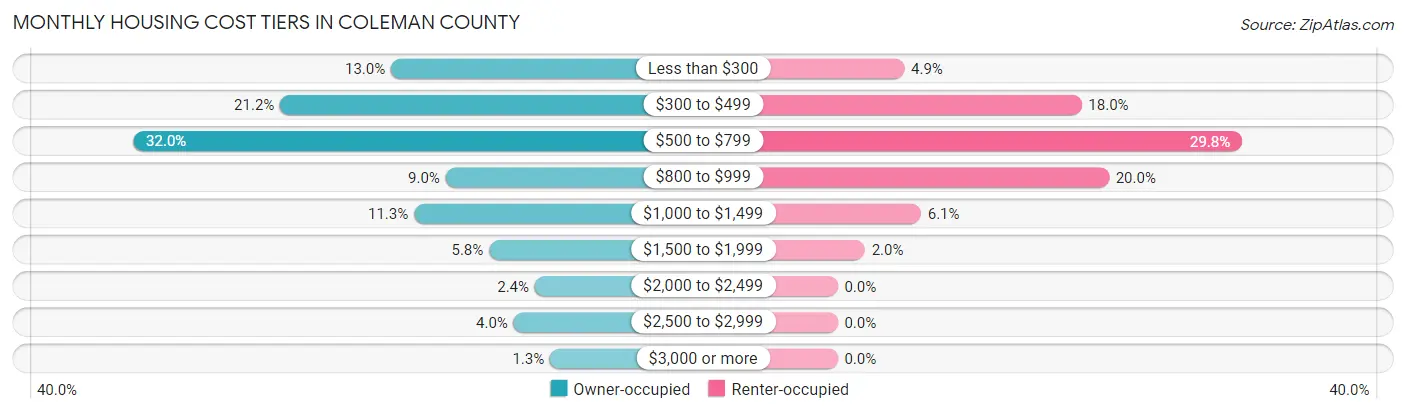
| Monthly Cost | Owner-occupied | Renter-occupied |
| Less than $300 | 301 (13.0%) | 44 (4.9%) |
| $300 to $499 | 490 (21.2%) | 161 (18.0%) |
| $500 to $799 | 741 (32.0%) | 267 (29.8%) |
| $800 to $999 | 208 (9.0%) | 179 (20.0%) |
| $1,000 to $1,499 | 262 (11.3%) | 55 (6.1%) |
| $1,500 to $1,999 | 134 (5.8%) | 18 (2.0%) |
| $2,000 to $2,499 | 56 (2.4%) | 0 (0.0%) |
| $2,500 to $2,999 | 92 (4.0%) | 0 (0.0%) |
| $3,000 or more | 30 (1.3%) | 0 (0.0%) |
| Total | 2,314 (100.0%) | 896 (100.0%) |
Physical Housing Characteristics in Coleman County
Housing Structures in Coleman County
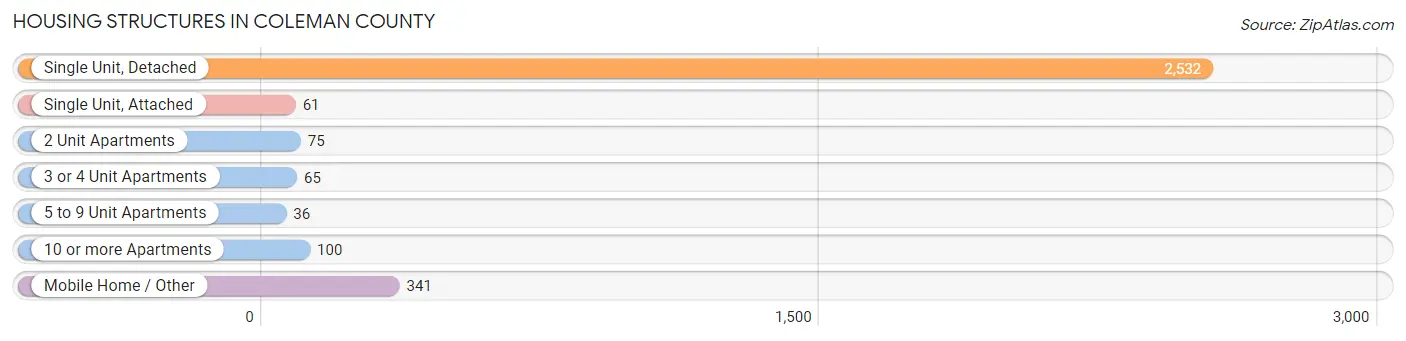
| Structure Type | # Housing Units | % Housing Units |
| Single Unit, Detached | 2,532 | 78.9% |
| Single Unit, Attached | 61 | 1.9% |
| 2 Unit Apartments | 75 | 2.3% |
| 3 or 4 Unit Apartments | 65 | 2.0% |
| 5 to 9 Unit Apartments | 36 | 1.1% |
| 10 or more Apartments | 100 | 3.1% |
| Mobile Home / Other | 341 | 10.6% |
| Total | 3,210 | 100.0% |
Housing Structures by Occupancy in Coleman County
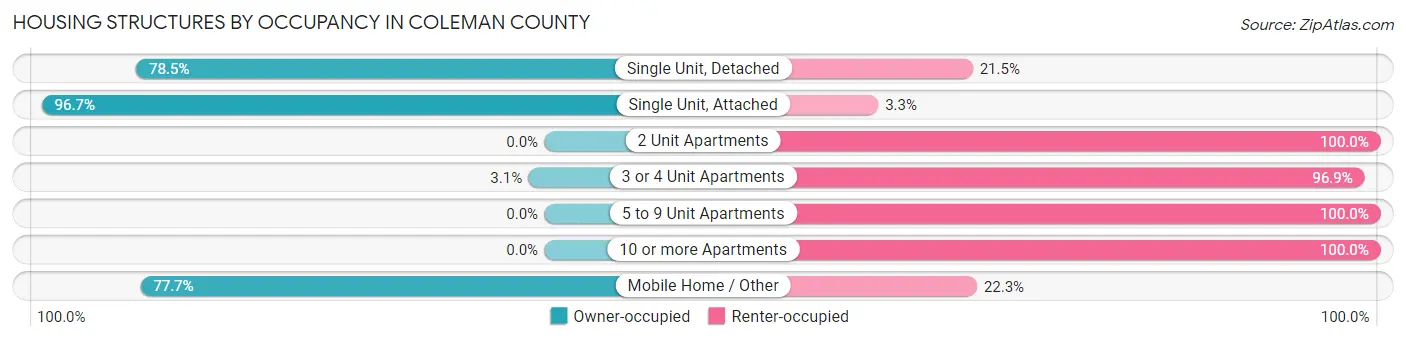
| Structure Type | Owner-occupied | Renter-occupied |
| Single Unit, Detached | 1,988 (78.5%) | 544 (21.5%) |
| Single Unit, Attached | 59 (96.7%) | 2 (3.3%) |
| 2 Unit Apartments | 0 (0.0%) | 75 (100.0%) |
| 3 or 4 Unit Apartments | 2 (3.1%) | 63 (96.9%) |
| 5 to 9 Unit Apartments | 0 (0.0%) | 36 (100.0%) |
| 10 or more Apartments | 0 (0.0%) | 100 (100.0%) |
| Mobile Home / Other | 265 (77.7%) | 76 (22.3%) |
| Total | 2,314 (72.1%) | 896 (27.9%) |
Housing Structures by Number of Rooms in Coleman County
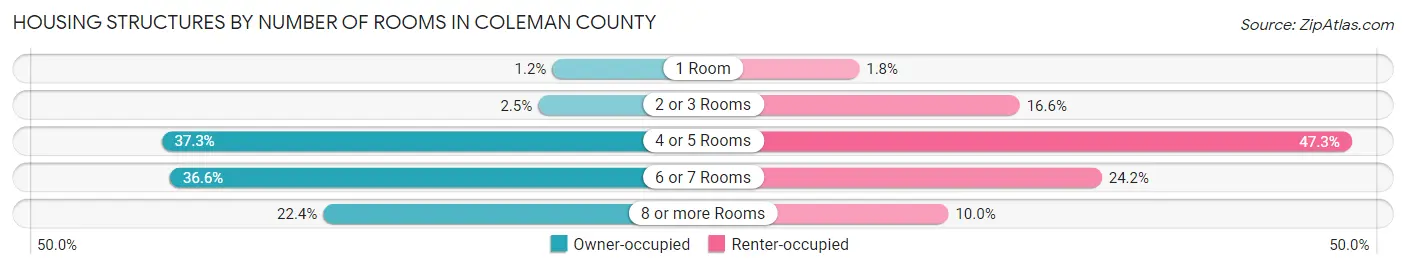
| Number of Rooms | Owner-occupied | Renter-occupied |
| 1 Room | 28 (1.2%) | 16 (1.8%) |
| 2 or 3 Rooms | 58 (2.5%) | 149 (16.6%) |
| 4 or 5 Rooms | 864 (37.3%) | 424 (47.3%) |
| 6 or 7 Rooms | 846 (36.6%) | 217 (24.2%) |
| 8 or more Rooms | 518 (22.4%) | 90 (10.0%) |
| Total | 2,314 (100.0%) | 896 (100.0%) |
Housing Structure by Heating Type in Coleman County
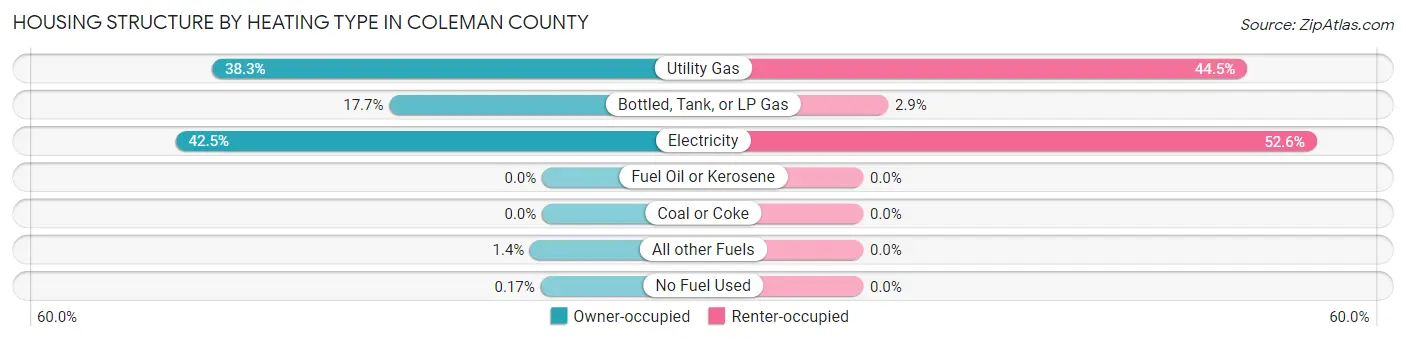
| Heating Type | Owner-occupied | Renter-occupied |
| Utility Gas | 885 (38.3%) | 399 (44.5%) |
| Bottled, Tank, or LP Gas | 410 (17.7%) | 26 (2.9%) |
| Electricity | 983 (42.5%) | 471 (52.6%) |
| Fuel Oil or Kerosene | 0 (0.0%) | 0 (0.0%) |
| Coal or Coke | 0 (0.0%) | 0 (0.0%) |
| All other Fuels | 32 (1.4%) | 0 (0.0%) |
| No Fuel Used | 4 (0.2%) | 0 (0.0%) |
| Total | 2,314 (100.0%) | 896 (100.0%) |
Household Vehicle Usage in Coleman County
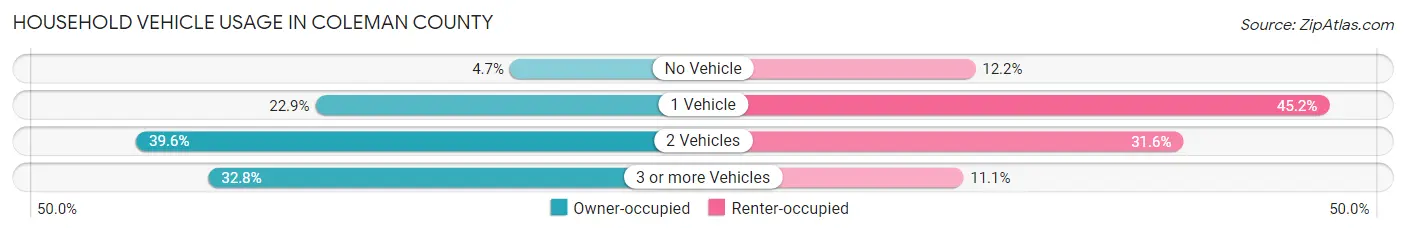
| Vehicles per Household | Owner-occupied | Renter-occupied |
| No Vehicle | 109 (4.7%) | 109 (12.2%) |
| 1 Vehicle | 529 (22.9%) | 405 (45.2%) |
| 2 Vehicles | 916 (39.6%) | 283 (31.6%) |
| 3 or more Vehicles | 760 (32.8%) | 99 (11.1%) |
| Total | 2,314 (100.0%) | 896 (100.0%) |
Real Estate & Mortgages in Coleman County
Real Estate and Mortgage Overview in Coleman County
| Characteristic | Without Mortgage | With Mortgage |
| Housing Units | 1,567 | 747 |
| Median Property Value | $80,900 | $134,600 |
| Median Household Income | $50,510 | $137 |
| Monthly Housing Costs | $503 | $27 |
| Real Estate Taxes | $1,138 | $31 |
Property Value by Mortgage Status in Coleman County
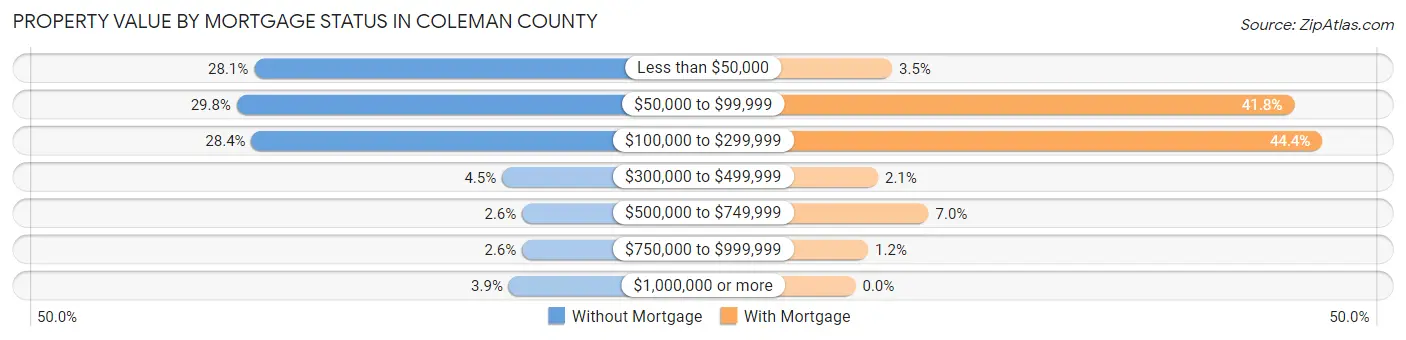
| Property Value | Without Mortgage | With Mortgage |
| Less than $50,000 | 441 (28.1%) | 26 (3.5%) |
| $50,000 to $99,999 | 467 (29.8%) | 312 (41.8%) |
| $100,000 to $299,999 | 445 (28.4%) | 332 (44.4%) |
| $300,000 to $499,999 | 71 (4.5%) | 16 (2.1%) |
| $500,000 to $749,999 | 41 (2.6%) | 52 (7.0%) |
| $750,000 to $999,999 | 41 (2.6%) | 9 (1.2%) |
| $1,000,000 or more | 61 (3.9%) | 0 (0.0%) |
| Total | 1,567 (100.0%) | 747 (100.0%) |
Household Income by Mortgage Status in Coleman County
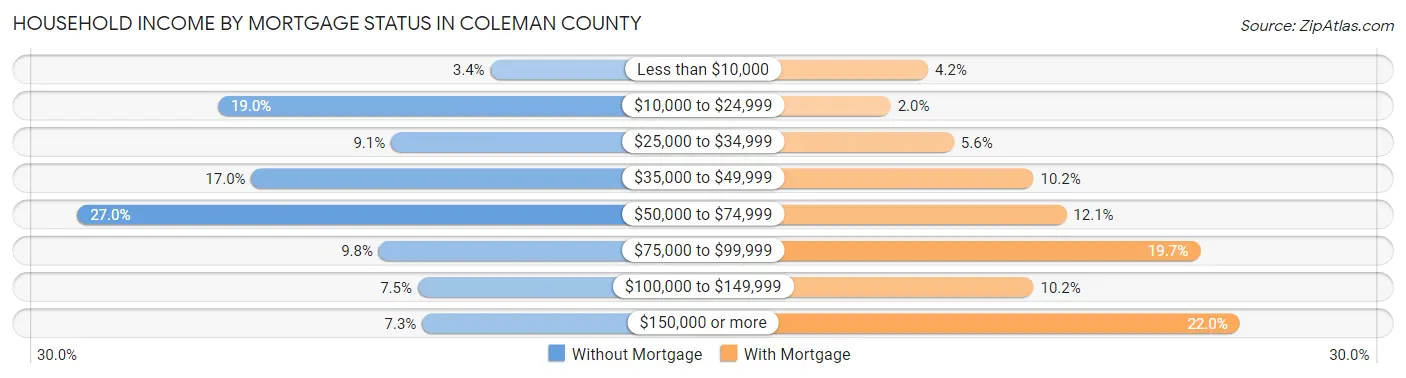
| Household Income | Without Mortgage | With Mortgage |
| Less than $10,000 | 53 (3.4%) | 31 (4.2%) |
| $10,000 to $24,999 | 297 (19.0%) | 15 (2.0%) |
| $25,000 to $34,999 | 142 (9.1%) | 42 (5.6%) |
| $35,000 to $49,999 | 267 (17.0%) | 76 (10.2%) |
| $50,000 to $74,999 | 423 (27.0%) | 90 (12.0%) |
| $75,000 to $99,999 | 153 (9.8%) | 147 (19.7%) |
| $100,000 to $149,999 | 118 (7.5%) | 76 (10.2%) |
| $150,000 or more | 114 (7.3%) | 164 (22.0%) |
| Total | 1,567 (100.0%) | 747 (100.0%) |
Property Value to Household Income Ratio in Coleman County
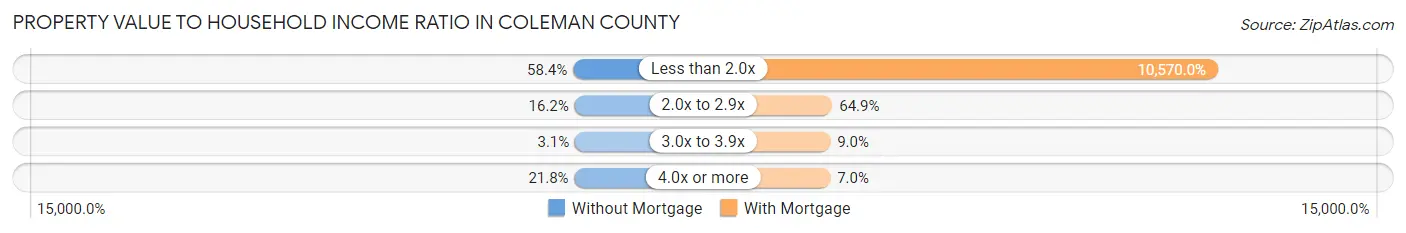
| Value-to-Income Ratio | Without Mortgage | With Mortgage |
| Less than 2.0x | 915 (58.4%) | 78,958 (10,570.0%) |
| 2.0x to 2.9x | 254 (16.2%) | 485 (64.9%) |
| 3.0x to 3.9x | 49 (3.1%) | 67 (9.0%) |
| 4.0x or more | 341 (21.8%) | 52 (7.0%) |
| Total | 1,567 (100.0%) | 747 (100.0%) |
Real Estate Taxes by Mortgage Status in Coleman County
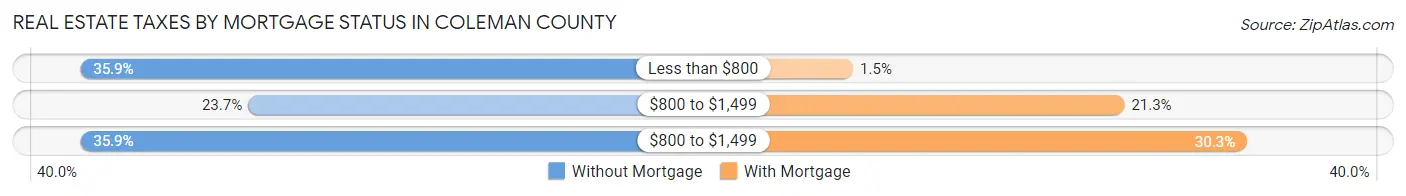
| Property Taxes | Without Mortgage | With Mortgage |
| Less than $800 | 563 (35.9%) | 11 (1.5%) |
| $800 to $1,499 | 371 (23.7%) | 159 (21.3%) |
| $800 to $1,499 | 563 (35.9%) | 226 (30.2%) |
| Total | 1,567 (100.0%) | 747 (100.0%) |
Health & Disability in Coleman County
Health Insurance Coverage by Age in Coleman County
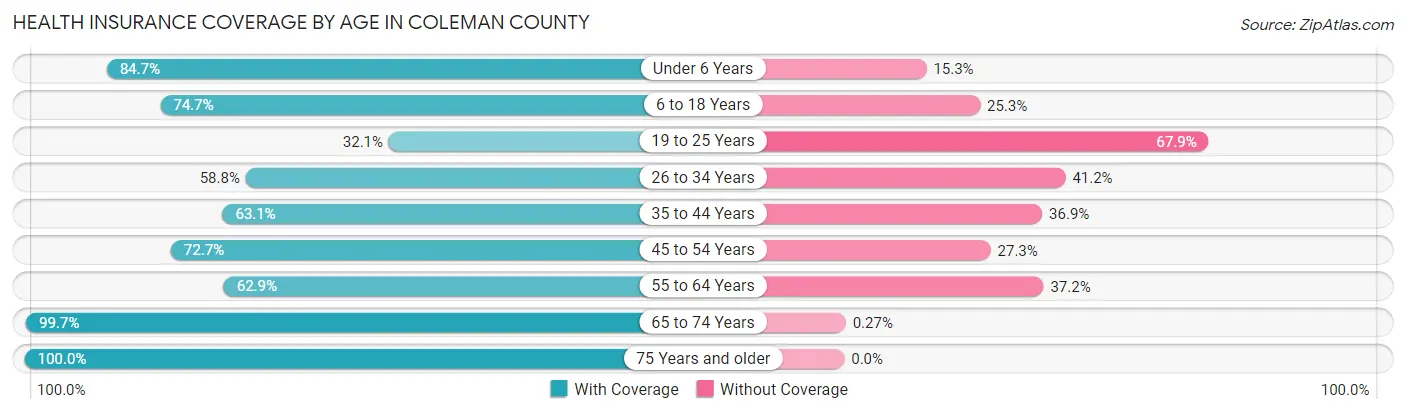
| Age Bracket | With Coverage | Without Coverage |
| Under 6 Years | 431 (84.7%) | 78 (15.3%) |
| 6 to 18 Years | 1,009 (74.7%) | 342 (25.3%) |
| 19 to 25 Years | 118 (32.1%) | 250 (67.9%) |
| 26 to 34 Years | 359 (58.8%) | 252 (41.2%) |
| 35 to 44 Years | 484 (63.1%) | 283 (36.9%) |
| 45 to 54 Years | 650 (72.7%) | 244 (27.3%) |
| 55 to 64 Years | 824 (62.8%) | 487 (37.1%) |
| 65 to 74 Years | 1,107 (99.7%) | 3 (0.3%) |
| 75 Years and older | 849 (100.0%) | 0 (0.0%) |
| Total | 5,831 (75.0%) | 1,939 (24.9%) |
Health Insurance Coverage by Citizenship Status in Coleman County
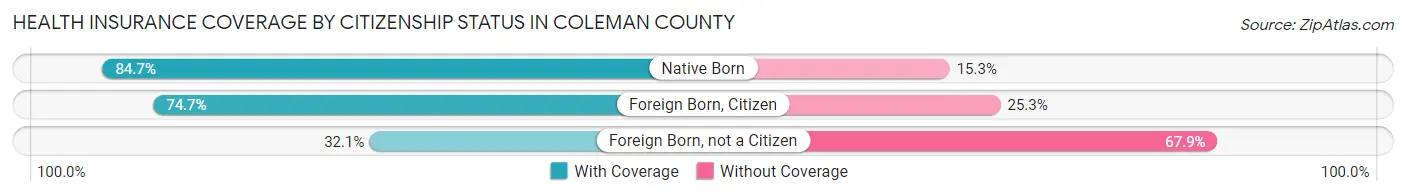
| Citizenship Status | With Coverage | Without Coverage |
| Native Born | 431 (84.7%) | 78 (15.3%) |
| Foreign Born, Citizen | 1,009 (74.7%) | 342 (25.3%) |
| Foreign Born, not a Citizen | 118 (32.1%) | 250 (67.9%) |
Health Insurance Coverage by Household Income in Coleman County
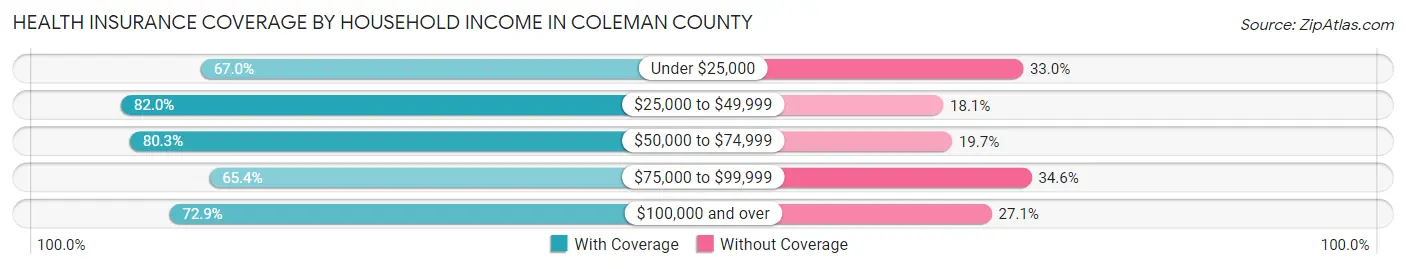
| Household Income | With Coverage | Without Coverage |
| Under $25,000 | 749 (67.0%) | 369 (33.0%) |
| $25,000 to $49,999 | 1,625 (82.0%) | 358 (18.0%) |
| $50,000 to $74,999 | 1,373 (80.3%) | 337 (19.7%) |
| $75,000 to $99,999 | 656 (65.4%) | 347 (34.6%) |
| $100,000 and over | 1,407 (72.9%) | 524 (27.1%) |
Public vs Private Health Insurance Coverage by Age in Coleman County
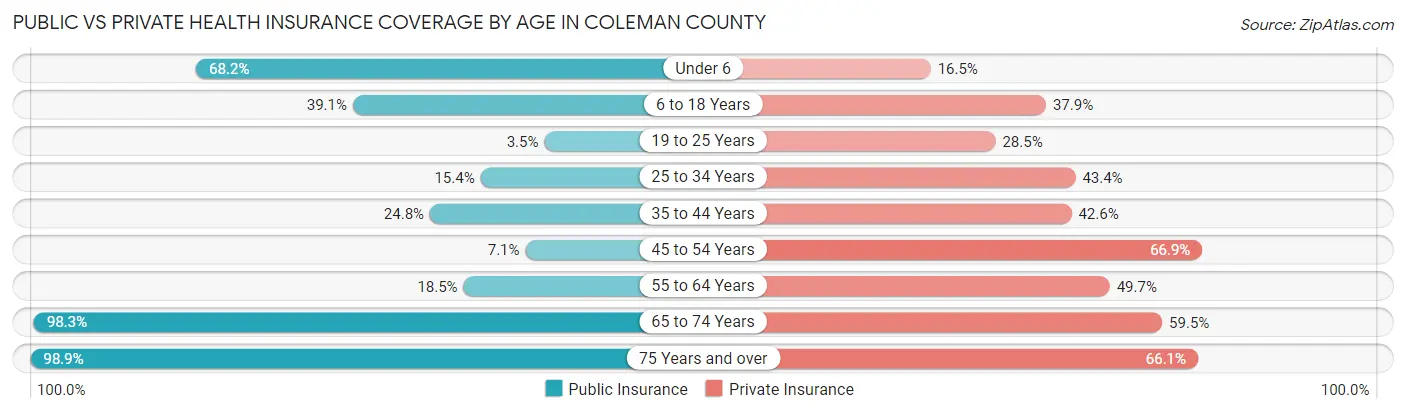
| Age Bracket | Public Insurance | Private Insurance |
| Under 6 | 347 (68.2%) | 84 (16.5%) |
| 6 to 18 Years | 528 (39.1%) | 512 (37.9%) |
| 19 to 25 Years | 13 (3.5%) | 105 (28.5%) |
| 25 to 34 Years | 94 (15.4%) | 265 (43.4%) |
| 35 to 44 Years | 190 (24.8%) | 327 (42.6%) |
| 45 to 54 Years | 63 (7.0%) | 598 (66.9%) |
| 55 to 64 Years | 243 (18.5%) | 652 (49.7%) |
| 65 to 74 Years | 1,091 (98.3%) | 660 (59.5%) |
| 75 Years and over | 840 (98.9%) | 561 (66.1%) |
| Total | 3,409 (43.9%) | 3,764 (48.4%) |
Disability Status by Sex by Age in Coleman County
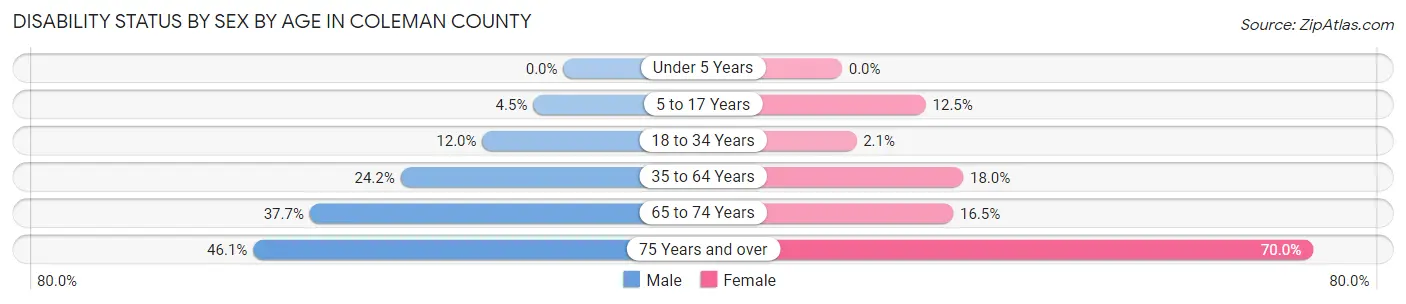
| Age Bracket | Male | Female |
| Under 5 Years | 0 (0.0%) | 0 (0.0%) |
| 5 to 17 Years | 27 (4.5%) | 92 (12.4%) |
| 18 to 34 Years | 70 (12.0%) | 12 (2.1%) |
| 35 to 64 Years | 376 (24.2%) | 255 (18.0%) |
| 65 to 74 Years | 206 (37.7%) | 93 (16.5%) |
| 75 Years and over | 181 (46.1%) | 319 (70.0%) |
Disability Class by Sex by Age in Coleman County
Disability Class: Hearing Difficulty
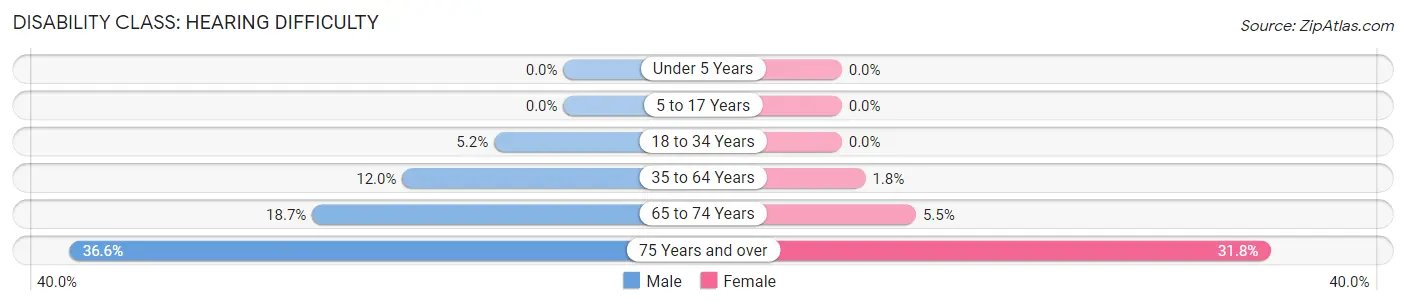
| Age Bracket | Male | Female |
| Under 5 Years | 0 (0.0%) | 0 (0.0%) |
| 5 to 17 Years | 0 (0.0%) | 0 (0.0%) |
| 18 to 34 Years | 30 (5.1%) | 0 (0.0%) |
| 35 to 64 Years | 186 (12.0%) | 25 (1.8%) |
| 65 to 74 Years | 102 (18.6%) | 31 (5.5%) |
| 75 Years and over | 144 (36.6%) | 145 (31.8%) |
Disability Class: Vision Difficulty
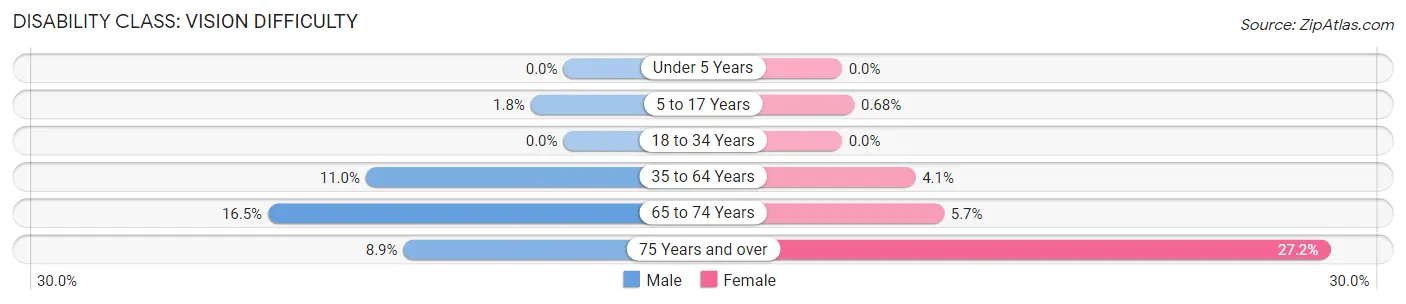
| Age Bracket | Male | Female |
| Under 5 Years | 0 (0.0%) | 0 (0.0%) |
| 5 to 17 Years | 11 (1.8%) | 5 (0.7%) |
| 18 to 34 Years | 0 (0.0%) | 0 (0.0%) |
| 35 to 64 Years | 171 (11.0%) | 58 (4.1%) |
| 65 to 74 Years | 90 (16.5%) | 32 (5.7%) |
| 75 Years and over | 35 (8.9%) | 124 (27.2%) |
Disability Class: Cognitive Difficulty
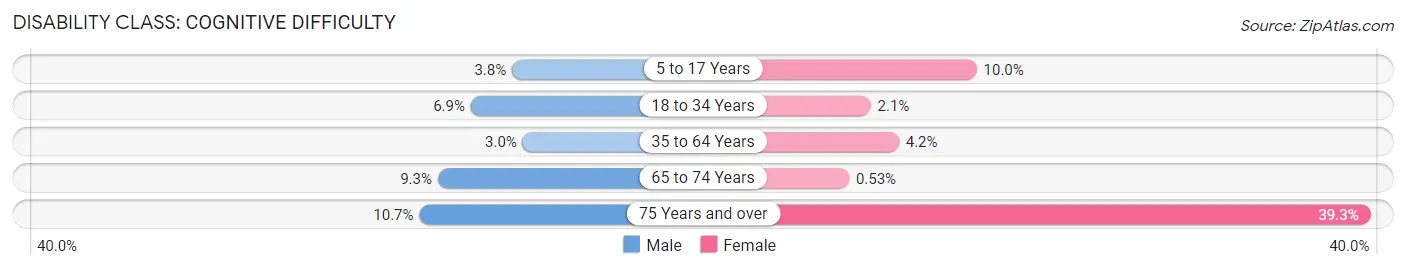
| Age Bracket | Male | Female |
| 5 to 17 Years | 23 (3.8%) | 74 (10.0%) |
| 18 to 34 Years | 40 (6.9%) | 12 (2.1%) |
| 35 to 64 Years | 47 (3.0%) | 60 (4.2%) |
| 65 to 74 Years | 51 (9.3%) | 3 (0.5%) |
| 75 Years and over | 42 (10.7%) | 179 (39.3%) |
Disability Class: Ambulatory Difficulty
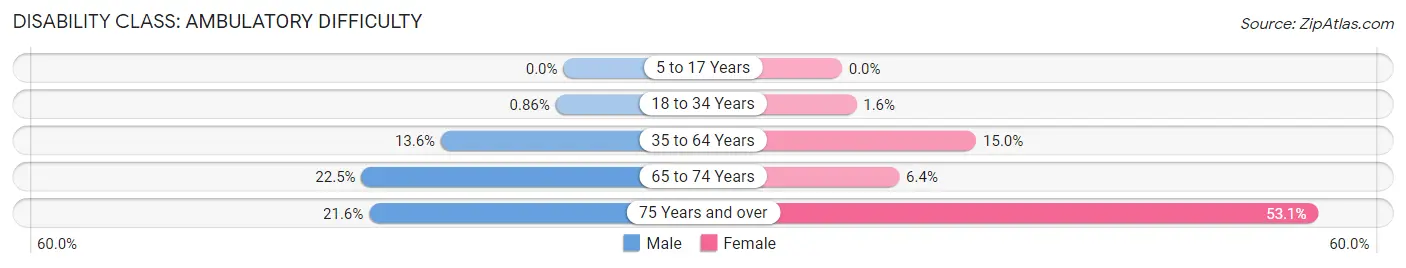
| Age Bracket | Male | Female |
| 5 to 17 Years | 0 (0.0%) | 0 (0.0%) |
| 18 to 34 Years | 5 (0.9%) | 9 (1.6%) |
| 35 to 64 Years | 212 (13.6%) | 212 (15.0%) |
| 65 to 74 Years | 123 (22.5%) | 36 (6.4%) |
| 75 Years and over | 85 (21.6%) | 242 (53.1%) |
Disability Class: Self-Care Difficulty
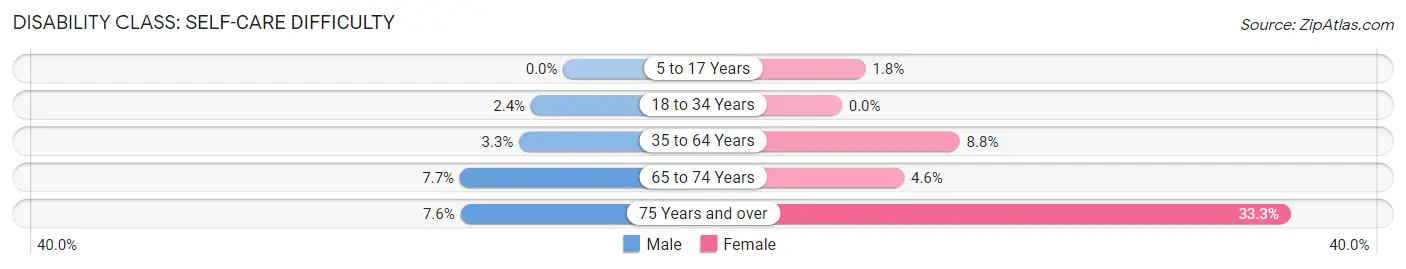
| Age Bracket | Male | Female |
| 5 to 17 Years | 0 (0.0%) | 13 (1.8%) |
| 18 to 34 Years | 14 (2.4%) | 0 (0.0%) |
| 35 to 64 Years | 51 (3.3%) | 124 (8.7%) |
| 65 to 74 Years | 42 (7.7%) | 26 (4.6%) |
| 75 Years and over | 30 (7.6%) | 152 (33.3%) |
Technology Access in Coleman County
Computing Device Access in Coleman County
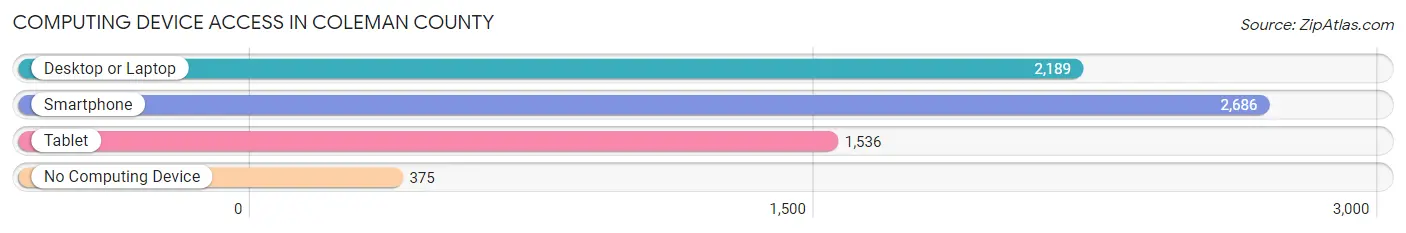
| Device Type | # Households | % Households |
| Desktop or Laptop | 2,189 | 68.2% |
| Smartphone | 2,686 | 83.7% |
| Tablet | 1,536 | 47.8% |
| No Computing Device | 375 | 11.7% |
| Total | 3,210 | 100.0% |
Internet Access in Coleman County
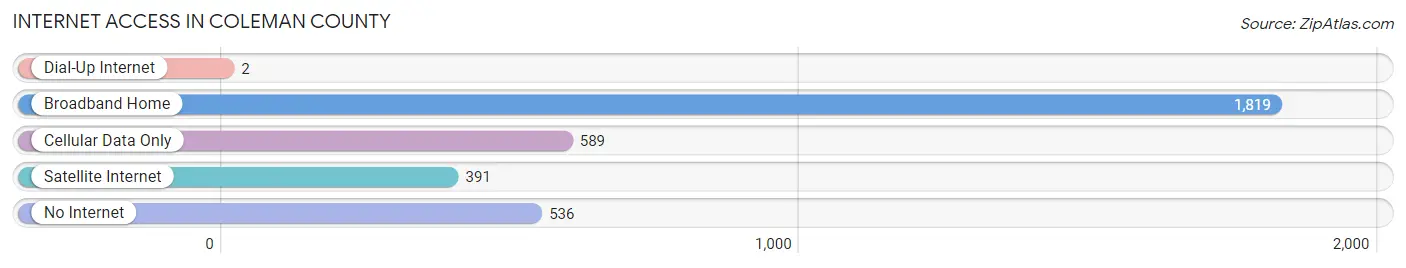
| Internet Type | # Households | % Households |
| Dial-Up Internet | 2 | 0.1% |
| Broadband Home | 1,819 | 56.7% |
| Cellular Data Only | 589 | 18.3% |
| Satellite Internet | 391 | 12.2% |
| No Internet | 536 | 16.7% |
| Total | 3,210 | 100.0% |
Coleman County Summary
Coleman County is located in the central part of Texas, in the western part of the state. It is bordered by Brown, Runnels, and Taylor counties to the north, Concho and McCulloch counties to the east, San Saba and Mason counties to the south, and Callahan and Shackelford counties to the west. The county seat is Coleman, and the county has a total area of 902 square miles.
History
Coleman County was established in 1858 and named after Robert M. Coleman, a signer of the Texas Declaration of Independence. The county was originally part of Brown County, and was organized in 1876. The first settlers in the area were mostly ranchers and farmers, and the county was largely rural until the early 20th century.
In the early 1900s, the Santa Fe Railroad was built through the county, and this led to the development of several small towns, including Coleman, Santa Anna, and Talpa. The railroad also brought an influx of new settlers to the area, and the population of the county grew rapidly.
Geography
Coleman County is located in the western part of Texas, in the central part of the state. It is bordered by Brown, Runnels, and Taylor counties to the north, Concho and McCulloch counties to the east, San Saba and Mason counties to the south, and Callahan and Shackelford counties to the west. The county has a total area of 902 square miles, and is mostly flat, with some rolling hills in the eastern part of the county. The county is drained by the Colorado River, which flows through the western part of the county.
The climate of Coleman County is generally hot and dry, with temperatures ranging from the low 90s in the summer to the low 40s in the winter. The county receives an average of 24 inches of precipitation per year, with most of it falling in the spring and summer months.
Economy
The economy of Coleman County is largely based on agriculture and ranching. The county is home to several large ranches, and the main crops grown in the area are cotton, corn, wheat, and hay. The county also has a thriving oil and gas industry, and there are several oil and gas wells in the area.
In addition to agriculture and ranching, Coleman County also has a growing tourism industry. The county is home to several state parks, including the Coleman State Park, which is located on the banks of the Colorado River. The county also has several historic sites, including the Coleman County Courthouse, which was built in 1876.
Demographics
As of the 2010 census, Coleman County had a population of 8,895. The population was spread out, with 48.3% male and 51.7% female. The median age was 41.2 years, and the median household income was $41,945. The racial makeup of the county was 87.3% White, 0.7% African American, 0.7% Native American, 0.3% Asian, 0.1% Pacific Islander, 9.7% from other races, and 1.2% from two or more races. Hispanic or Latino of any race were 18.3% of the population.
Conclusion
Coleman County is a rural county located in the western part of Texas. It has a long history, and its economy is largely based on agriculture and ranching. The county has a diverse population, and is home to several state parks and historic sites. Coleman County is a great place to live and work, and offers a variety of opportunities for those looking to make a home in the area.
Common Questions
What is Per Capita Income in Coleman County?
Per Capita income in Coleman County is $31,249.
What is the Median Family Income in Coleman County?
Median Family Income in Coleman County is $59,681.
What is the Median Household income in Coleman County?
Median Household Income in Coleman County is $51,034.
What is Income or Wage Gap in Coleman County?
Income or Wage Gap in Coleman County is 9.0%.
Women in Coleman County earn 91.0 cents for every dollar earned by a man.
What is Inequality or Gini Index in Coleman County?
Inequality or Gini Index in Coleman County is 0.48.
What is the Total Population of Coleman County?
Total Population of Coleman County is 7,808.
What is the Total Male Population of Coleman County?
Total Male Population of Coleman County is 3,913.
What is the Total Female Population of Coleman County?
Total Female Population of Coleman County is 3,895.
What is the Ratio of Males per 100 Females in Coleman County?
There are 100.46 Males per 100 Females in Coleman County.
What is the Ratio of Females per 100 Males in Coleman County?
There are 99.54 Females per 100 Males in Coleman County.
What is the Median Population Age in Coleman County?
Median Population Age in Coleman County is 48.4 Years.
What is the Average Family Size in Coleman County
Average Family Size in Coleman County is 3.2 People.
What is the Average Household Size in Coleman County
Average Household Size in Coleman County is 2.4 People.
How Large is the Labor Force in Coleman County?
There are 3,598 People in the Labor Forcein in Coleman County.
What is the Percentage of People in the Labor Force in Coleman County?
57.5% of People are in the Labor Force in Coleman County.
What is the Unemployment Rate in Coleman County?
Unemployment Rate in Coleman County is 6.3%.