Coke County, TX Map & Demographics
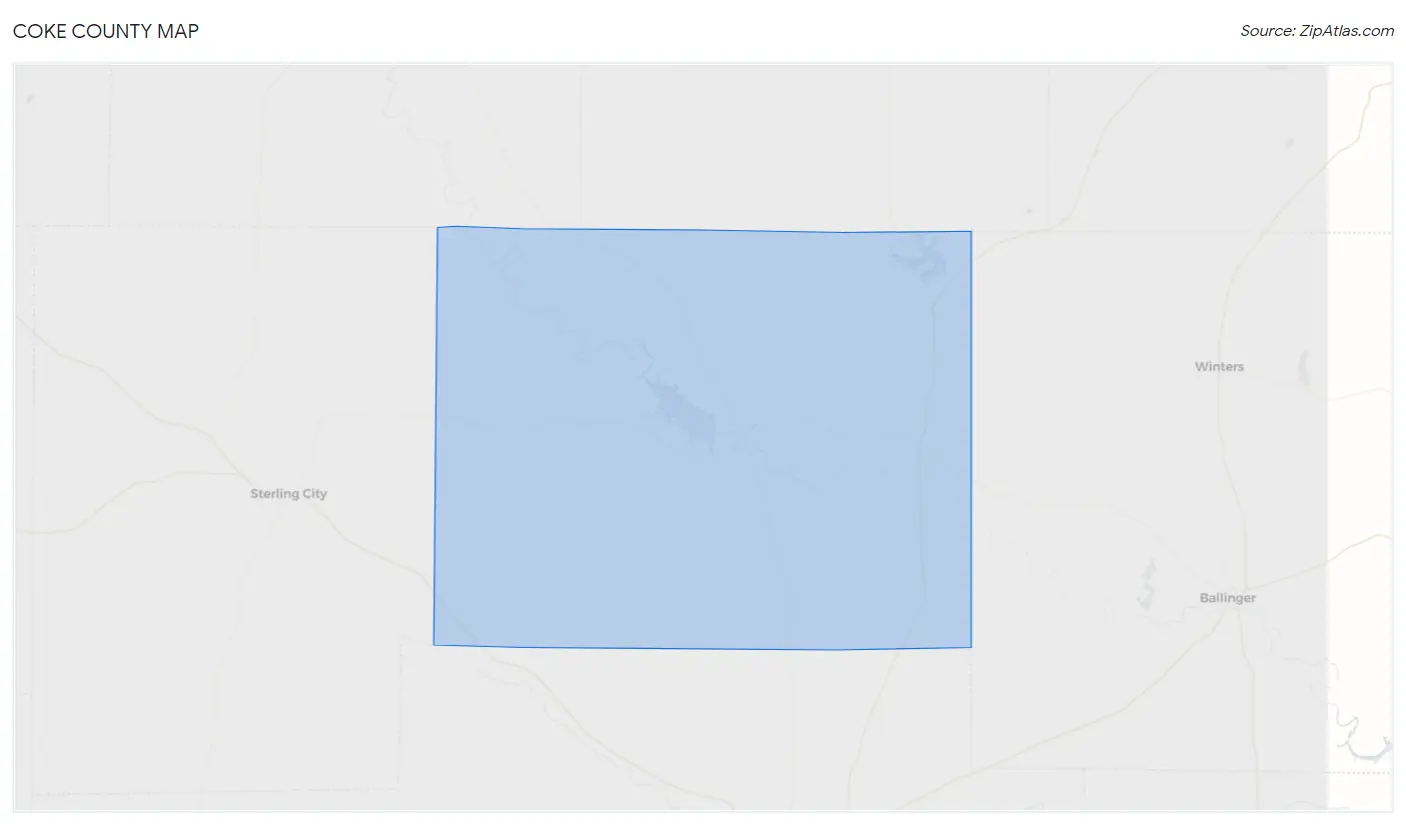
Coke County Map
Coke County Overview
$28,397
PER CAPITA INCOME
$69,609
AVG FAMILY INCOME
$40,230
AVG HOUSEHOLD INCOME
48.4%
WAGE / INCOME GAP [ % ]
51.6¢/ $1
WAGE / INCOME GAP [ $ ]
0.47
INEQUALITY / GINI INDEX
3,305
TOTAL POPULATION
1,645
MALE POPULATION
1,660
FEMALE POPULATION
99.10
MALES / 100 FEMALES
100.91
FEMALES / 100 MALES
47.1
MEDIAN AGE
2.8
AVG FAMILY SIZE
2.1
AVG HOUSEHOLD SIZE
1,384
LABOR FORCE [ PEOPLE ]
52.0%
PERCENT IN LABOR FORCE
3.0%
UNEMPLOYMENT RATE
Coke County Area Codes
Income in Coke County
Income Overview in Coke County
Per Capita Income in Coke County is $28,397, while median incomes of families and households are $69,609 and $40,230 respectively.
| Characteristic | Number | Measure |
| Per Capita Income | 3,305 | $28,397 |
| Median Family Income | 859 | $69,609 |
| Mean Family Income | 859 | $82,518 |
| Median Household Income | 1,487 | $40,230 |
| Mean Household Income | 1,487 | $59,150 |
| Income Deficit | 859 | $0 |
| Wage / Income Gap (%) | 3,305 | 48.43% |
| Wage / Income Gap ($) | 3,305 | 51.57¢ per $1 |
| Gini / Inequality Index | 3,305 | 0.47 |
Earnings by Sex in Coke County
Average Earnings in Coke County are $28,766, $45,096 for men and $23,257 for women, a difference of 48.4%.
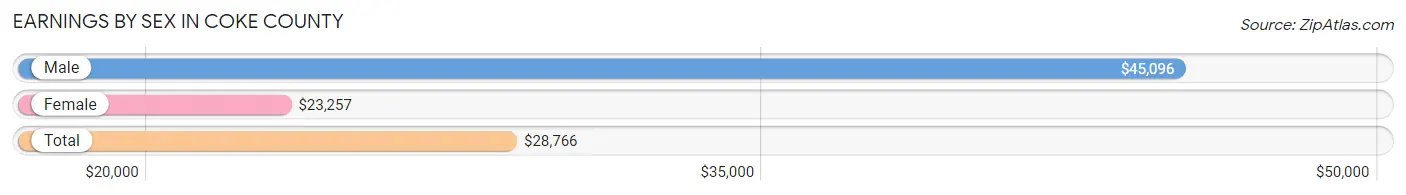
| Sex | Number | Average Earnings |
| Male | 740 (49.4%) | $45,096 |
| Female | 758 (50.6%) | $23,257 |
| Total | 1,498 (100.0%) | $28,766 |
Earnings by Sex by Income Bracket in Coke County
The most common earnings brackets in Coke County are $100,000+ for men (97 | 13.1%) and $2,499 or less for women (126 | 16.6%).
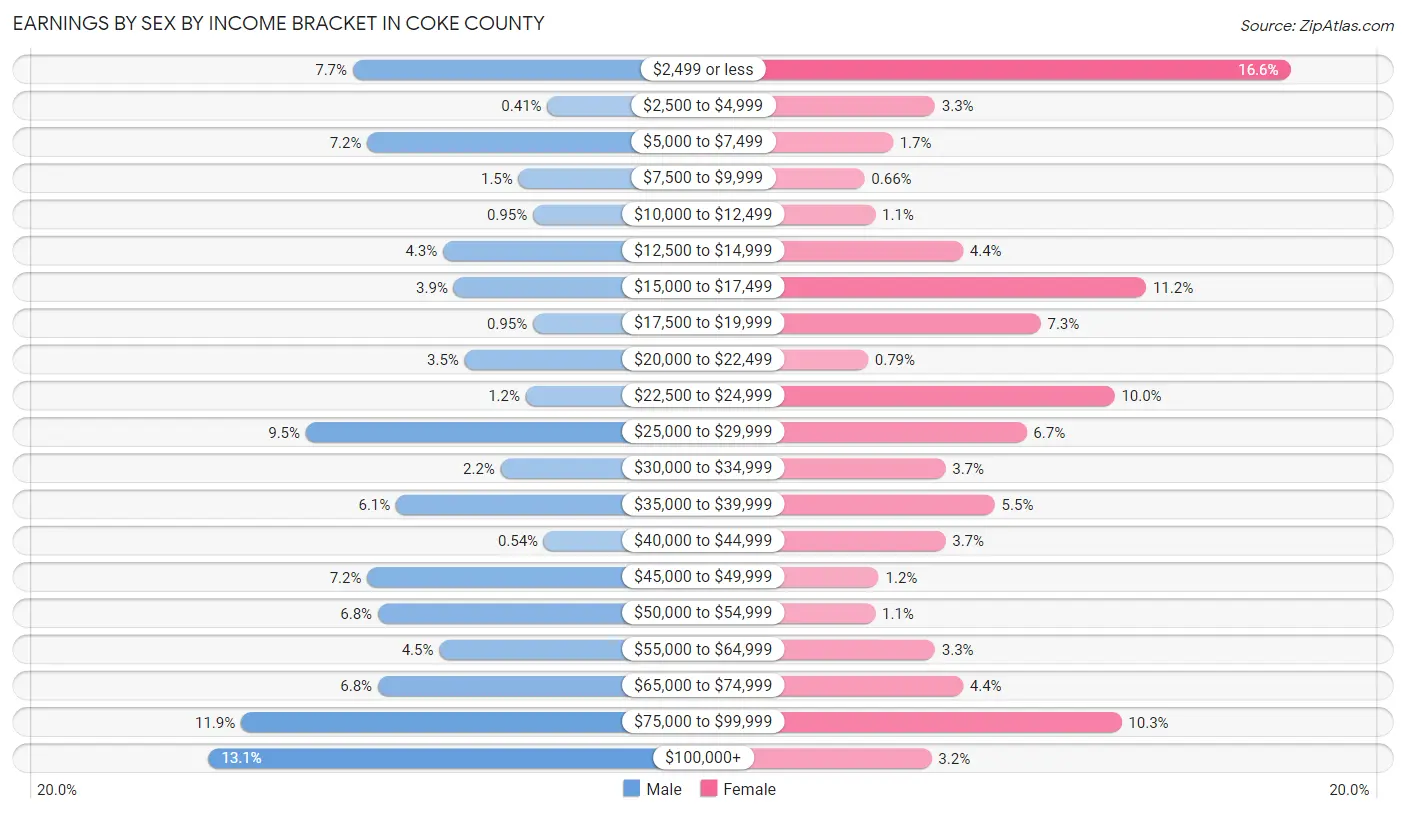
| Income | Male | Female |
| $2,499 or less | 57 (7.7%) | 126 (16.6%) |
| $2,500 to $4,999 | 3 (0.4%) | 25 (3.3%) |
| $5,000 to $7,499 | 53 (7.2%) | 13 (1.7%) |
| $7,500 to $9,999 | 11 (1.5%) | 5 (0.7%) |
| $10,000 to $12,499 | 7 (0.9%) | 8 (1.1%) |
| $12,500 to $14,999 | 32 (4.3%) | 33 (4.3%) |
| $15,000 to $17,499 | 29 (3.9%) | 85 (11.2%) |
| $17,500 to $19,999 | 7 (0.9%) | 55 (7.3%) |
| $20,000 to $22,499 | 26 (3.5%) | 6 (0.8%) |
| $22,500 to $24,999 | 9 (1.2%) | 76 (10.0%) |
| $25,000 to $29,999 | 70 (9.5%) | 51 (6.7%) |
| $30,000 to $34,999 | 16 (2.2%) | 28 (3.7%) |
| $35,000 to $39,999 | 45 (6.1%) | 42 (5.5%) |
| $40,000 to $44,999 | 4 (0.5%) | 28 (3.7%) |
| $45,000 to $49,999 | 53 (7.2%) | 9 (1.2%) |
| $50,000 to $54,999 | 50 (6.8%) | 8 (1.1%) |
| $55,000 to $64,999 | 33 (4.5%) | 25 (3.3%) |
| $65,000 to $74,999 | 50 (6.8%) | 33 (4.3%) |
| $75,000 to $99,999 | 88 (11.9%) | 78 (10.3%) |
| $100,000+ | 97 (13.1%) | 24 (3.2%) |
| Total | 740 (100.0%) | 758 (100.0%) |
Earnings by Sex by Educational Attainment in Coke County
Average earnings in Coke County are $48,102 for men and $24,803 for women, a difference of 48.4%. Men with an educational attainment of college or associate's degree enjoy the highest average annual earnings of $54,531, while those with high school diploma education earn the least with $30,417. Women with an educational attainment of graduate degree earn the most with the average annual earnings of $95,200, while those with high school diploma education have the smallest earnings of $17,071.
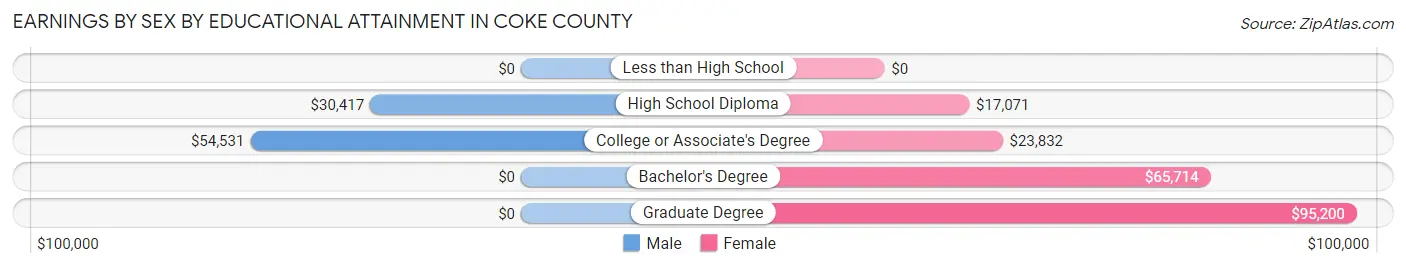
| Educational Attainment | Male Income | Female Income |
| Less than High School | - | - |
| High School Diploma | $30,417 | $17,071 |
| College or Associate's Degree | $54,531 | $23,832 |
| Bachelor's Degree | - | - |
| Graduate Degree | - | - |
| Total | $48,102 | $24,803 |
Family Income in Coke County
Family Income Brackets in Coke County
According to the Coke County family income data, there are 166 families falling into the $100,000 to $149,999 income range, which is the most common income bracket and makes up 19.3% of all families. Conversely, the less than $10,000 income bracket is the least frequent group with only 19 families (2.2%) belonging to this category.
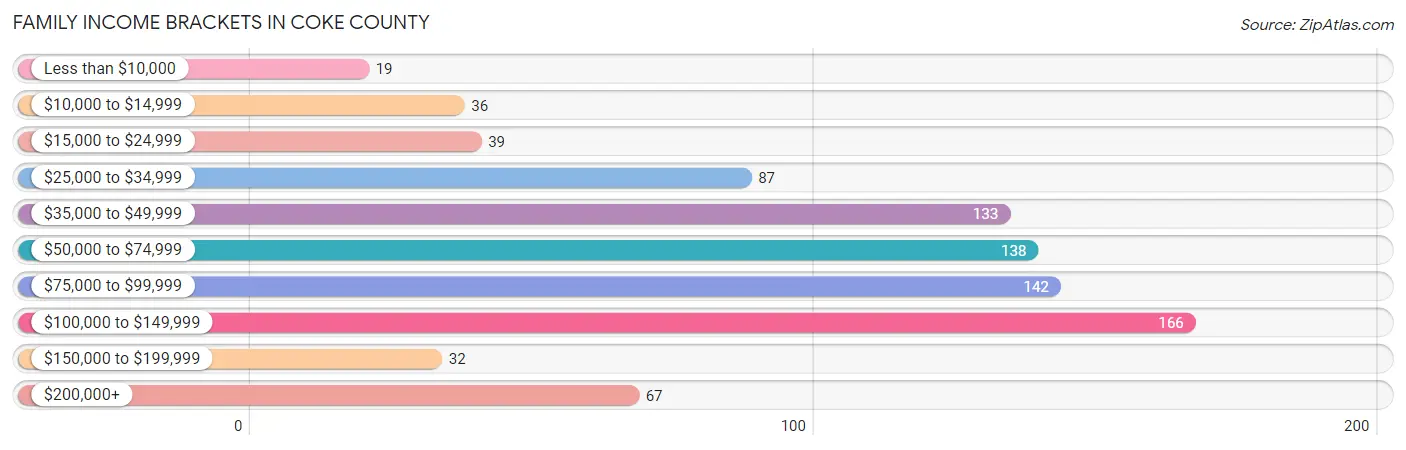
| Income Bracket | # Families | % Families |
| Less than $10,000 | 19 | 2.2% |
| $10,000 to $14,999 | 36 | 4.2% |
| $15,000 to $24,999 | 39 | 4.5% |
| $25,000 to $34,999 | 87 | 10.1% |
| $35,000 to $49,999 | 133 | 15.5% |
| $50,000 to $74,999 | 138 | 16.1% |
| $75,000 to $99,999 | 142 | 16.5% |
| $100,000 to $149,999 | 166 | 19.3% |
| $150,000 to $199,999 | 32 | 3.7% |
| $200,000+ | 67 | 7.8% |
Family Income by Famaliy Size in Coke County
6-person families (18 | 2.1%) account for the highest median family income in Coke County with $92,500 per family, while 2-person families (561 | 65.3%) have the highest median income of $34,336 per family member.
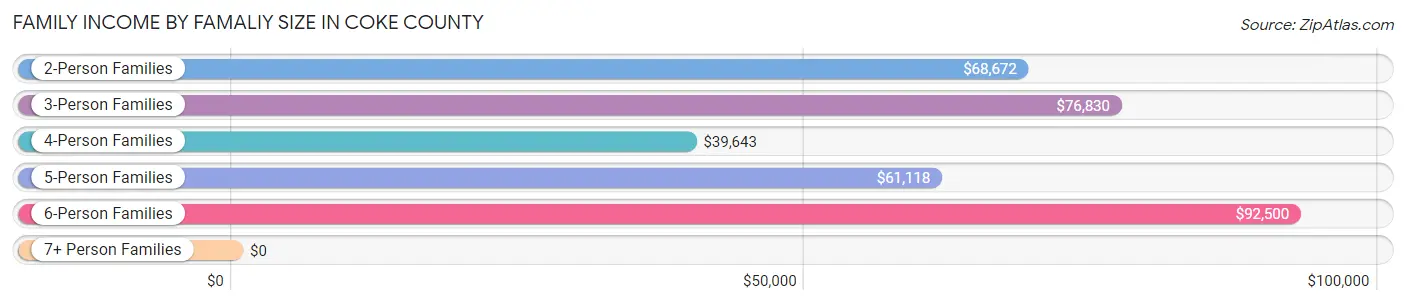
| Income Bracket | # Families | Median Income |
| 2-Person Families | 561 (65.3%) | $68,672 |
| 3-Person Families | 131 (15.2%) | $76,830 |
| 4-Person Families | 86 (10.0%) | $39,643 |
| 5-Person Families | 59 (6.9%) | $61,118 |
| 6-Person Families | 18 (2.1%) | $92,500 |
| 7+ Person Families | 4 (0.5%) | $0 |
| Total | 859 (100.0%) | $69,609 |
Family Income by Number of Earners in Coke County
The median family income in Coke County is $69,609, with families comprising 3+ earners (59) having the highest median family income of $110,511, while families with no earners (170) have the lowest median family income of $33,750, accounting for 6.9% and 19.8% of families, respectively.
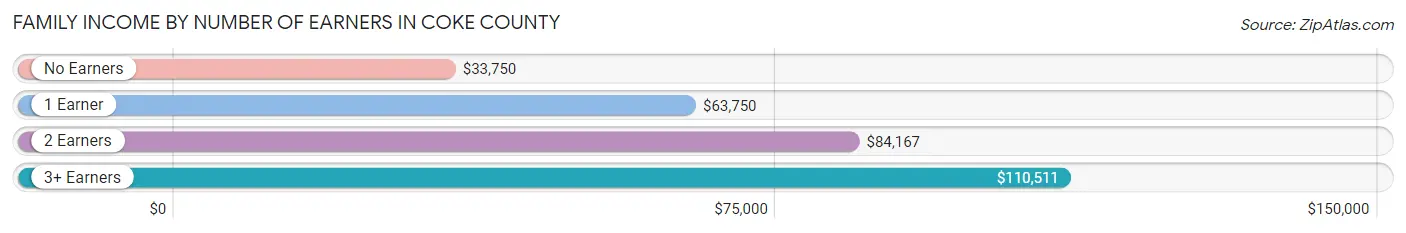
| Number of Earners | # Families | Median Income |
| No Earners | 170 (19.8%) | $33,750 |
| 1 Earner | 268 (31.2%) | $63,750 |
| 2 Earners | 362 (42.1%) | $84,167 |
| 3+ Earners | 59 (6.9%) | $110,511 |
| Total | 859 (100.0%) | $69,609 |
Household Income in Coke County
Household Income Brackets in Coke County
With 216 households falling in the category, the $35,000 to $49,999 income range is the most frequent in Coke County, accounting for 14.5% of all households. In contrast, only 33 households (2.2%) fall into the $150,000 to $199,999 income bracket, making it the least populous group.
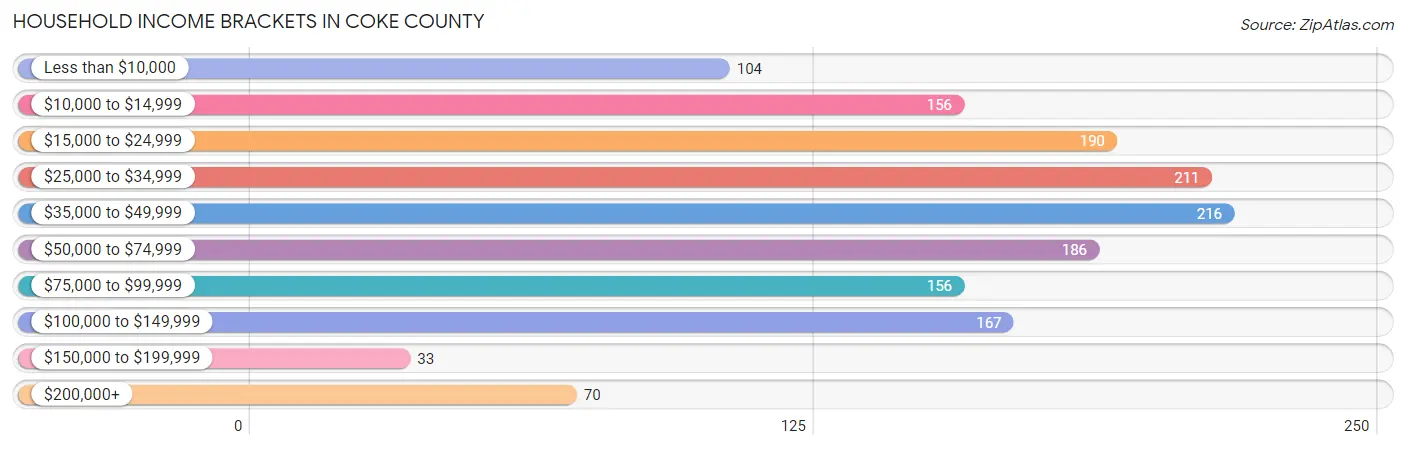
| Income Bracket | # Households | % Households |
| Less than $10,000 | 104 | 7.0% |
| $10,000 to $14,999 | 156 | 10.5% |
| $15,000 to $24,999 | 190 | 12.8% |
| $25,000 to $34,999 | 211 | 14.2% |
| $35,000 to $49,999 | 216 | 14.5% |
| $50,000 to $74,999 | 186 | 12.5% |
| $75,000 to $99,999 | 156 | 10.5% |
| $100,000 to $149,999 | 167 | 11.2% |
| $150,000 to $199,999 | 33 | 2.2% |
| $200,000+ | 70 | 4.7% |
Household Income by Householder Age in Coke County
The median household income in Coke County is $40,230, with the highest median household income of $67,656 found in the 45 to 64 years age bracket for the primary householder. A total of 526 households (35.4%) fall into this category. Meanwhile, the 15 to 24 years age bracket for the primary householder has the lowest median household income of $0, with 12 households (0.8%) in this group.
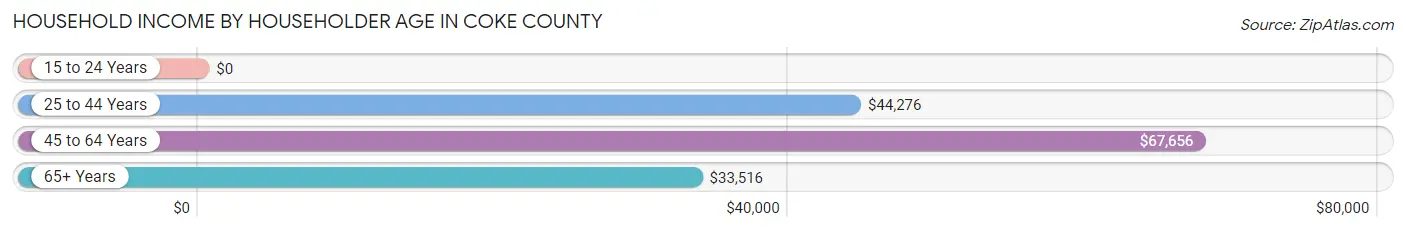
| Income Bracket | # Households | Median Income |
| 15 to 24 Years | 12 (0.8%) | $0 |
| 25 to 44 Years | 331 (22.3%) | $44,276 |
| 45 to 64 Years | 526 (35.4%) | $67,656 |
| 65+ Years | 618 (41.6%) | $33,516 |
| Total | 1,487 (100.0%) | $40,230 |
Poverty in Coke County
Income Below Poverty by Sex and Age in Coke County
With 14.4% poverty level for males and 18.5% for females among the residents of Coke County, 35 to 44 year old males and 18 to 24 year old females are the most vulnerable to poverty, with 43 males (29.4%) and 47 females (38.2%) in their respective age groups living below the poverty level.
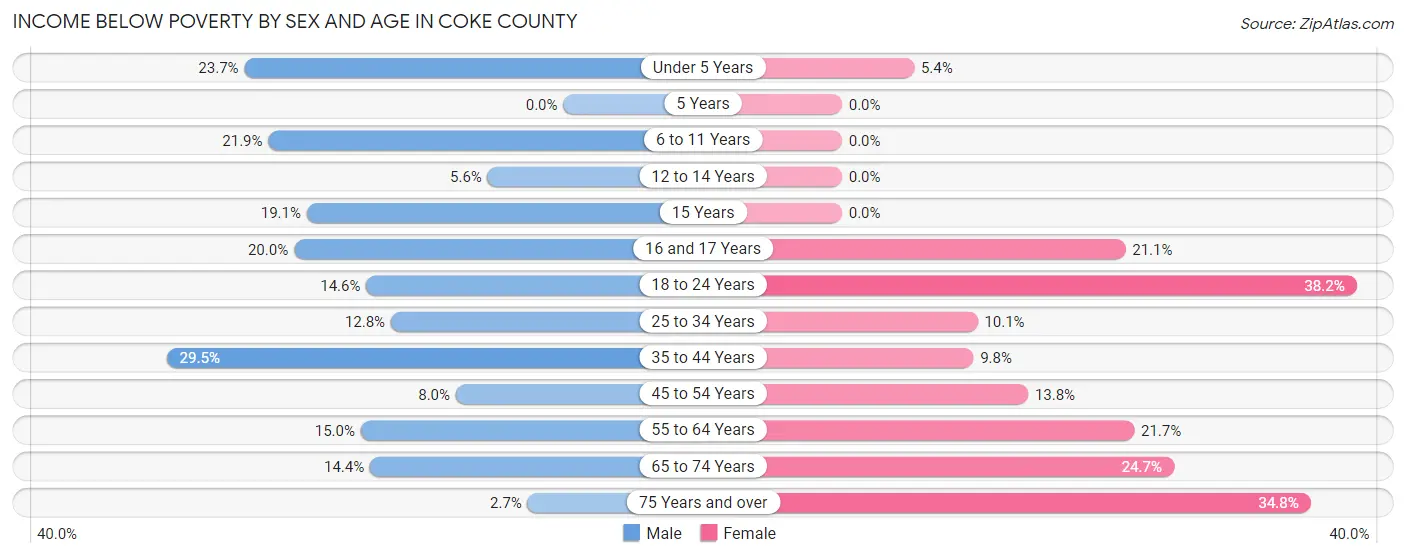
| Age Bracket | Male | Female |
| Under 5 Years | 18 (23.7%) | 3 (5.4%) |
| 5 Years | 0 (0.0%) | 0 (0.0%) |
| 6 to 11 Years | 30 (21.9%) | 0 (0.0%) |
| 12 to 14 Years | 5 (5.6%) | 0 (0.0%) |
| 15 Years | 4 (19.1%) | 0 (0.0%) |
| 16 and 17 Years | 3 (20.0%) | 4 (21.0%) |
| 18 to 24 Years | 12 (14.6%) | 47 (38.2%) |
| 25 to 34 Years | 21 (12.8%) | 14 (10.1%) |
| 35 to 44 Years | 43 (29.4%) | 20 (9.8%) |
| 45 to 54 Years | 17 (8.0%) | 21 (13.8%) |
| 55 to 64 Years | 34 (15.0%) | 51 (21.7%) |
| 65 to 74 Years | 31 (14.3%) | 71 (24.6%) |
| 75 Years and over | 4 (2.6%) | 71 (34.8%) |
| Total | 222 (14.4%) | 302 (18.5%) |
Income Above Poverty by Sex and Age in Coke County
According to the poverty statistics in Coke County, males aged 5 years and females aged 6 to 11 years are the age groups that are most secure financially, with 100.0% of males and 100.0% of females in these age groups living above the poverty line.
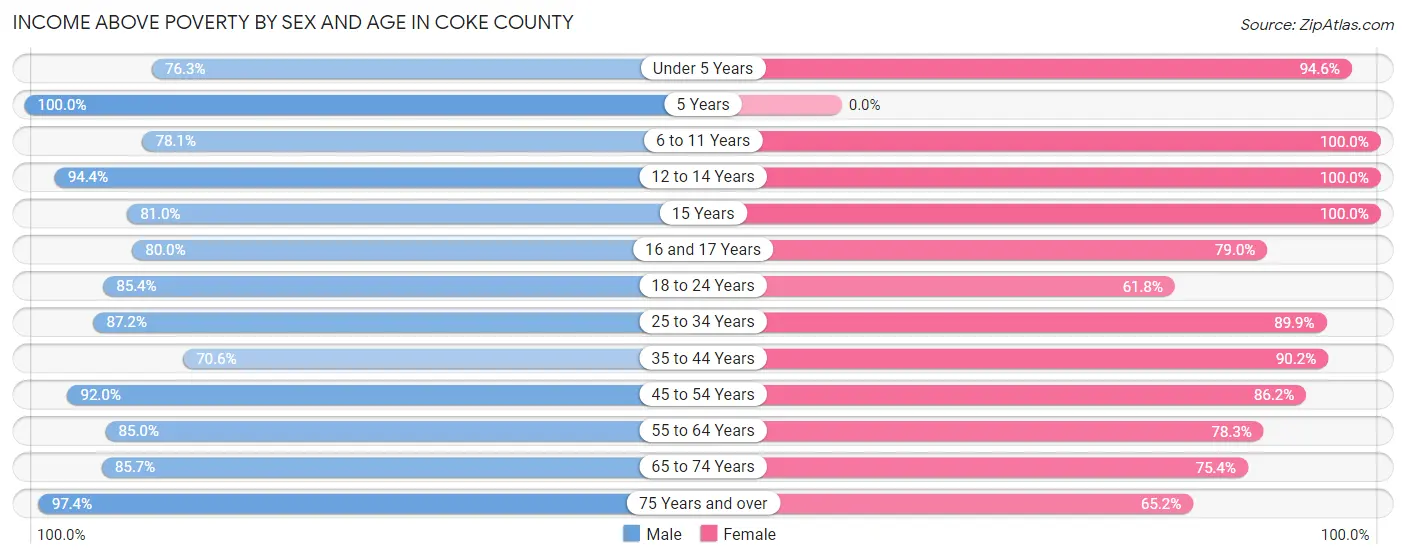
| Age Bracket | Male | Female |
| Under 5 Years | 58 (76.3%) | 53 (94.6%) |
| 5 Years | 9 (100.0%) | 0 (0.0%) |
| 6 to 11 Years | 107 (78.1%) | 95 (100.0%) |
| 12 to 14 Years | 84 (94.4%) | 101 (100.0%) |
| 15 Years | 17 (80.9%) | 12 (100.0%) |
| 16 and 17 Years | 12 (80.0%) | 15 (78.9%) |
| 18 to 24 Years | 70 (85.4%) | 76 (61.8%) |
| 25 to 34 Years | 143 (87.2%) | 125 (89.9%) |
| 35 to 44 Years | 103 (70.6%) | 185 (90.2%) |
| 45 to 54 Years | 196 (92.0%) | 131 (86.2%) |
| 55 to 64 Years | 192 (85.0%) | 184 (78.3%) |
| 65 to 74 Years | 185 (85.7%) | 217 (75.3%) |
| 75 Years and over | 147 (97.4%) | 133 (65.2%) |
| Total | 1,323 (85.6%) | 1,327 (81.5%) |
Income Below Poverty Among Married-Couple Families in Coke County
The poverty statistics for married-couple families in Coke County show that 8.5% or 60 of the total 705 families live below the poverty line. Families with 1 or 2 children have the highest poverty rate of 10.2%, comprising of 13 families. On the other hand, families with no children have the lowest poverty rate of 8.0%, which includes 43 families.
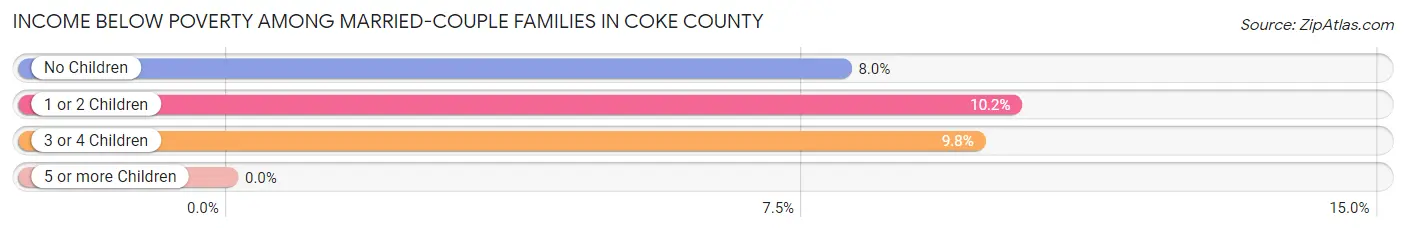
| Children | Above Poverty | Below Poverty |
| No Children | 494 (92.0%) | 43 (8.0%) |
| 1 or 2 Children | 114 (89.8%) | 13 (10.2%) |
| 3 or 4 Children | 37 (90.2%) | 4 (9.8%) |
| 5 or more Children | 0 (0.0%) | 0 (0.0%) |
| Total | 645 (91.5%) | 60 (8.5%) |
Income Below Poverty Among Single-Parent Households in Coke County
According to the poverty data in Coke County, 30.3% or 10 single-father households and 10.7% or 13 single-mother households are living below the poverty line. Among single-father households, those with no children have the highest poverty rate, with 10 households (55.6%) experiencing poverty. Likewise, among single-mother households, those with 3 or 4 children have the highest poverty rate, with 2 households (100.0%) falling below the poverty line.
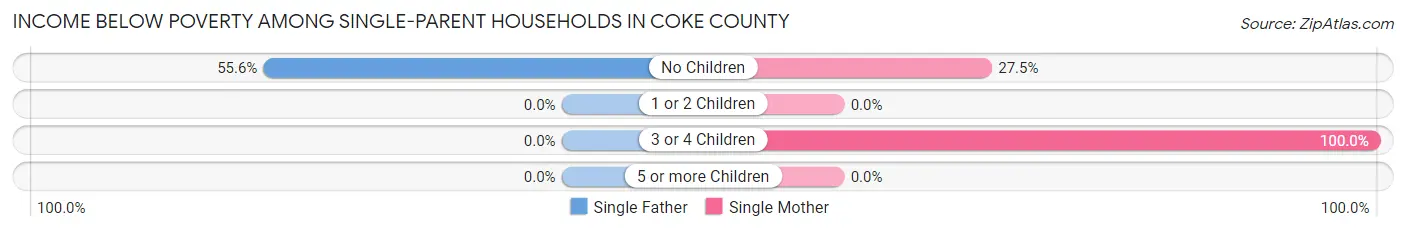
| Children | Single Father | Single Mother |
| No Children | 10 (55.6%) | 11 (27.5%) |
| 1 or 2 Children | 0 (0.0%) | 0 (0.0%) |
| 3 or 4 Children | 0 (0.0%) | 2 (100.0%) |
| 5 or more Children | 0 (0.0%) | 0 (0.0%) |
| Total | 10 (30.3%) | 13 (10.7%) |
Income Below Poverty Among Married-Couple vs Single-Parent Households in Coke County
The poverty data for Coke County shows that 60 of the married-couple family households (8.5%) and 23 of the single-parent households (14.9%) are living below the poverty level. Within the married-couple family households, those with 1 or 2 children have the highest poverty rate, with 13 households (10.2%) falling below the poverty line. Among the single-parent households, those with 3 or 4 children have the highest poverty rate, with 2 household (100.0%) living below poverty.
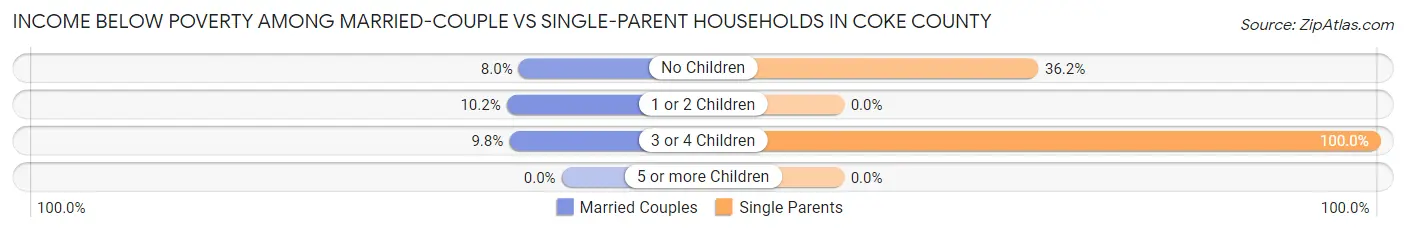
| Children | Married-Couple Families | Single-Parent Households |
| No Children | 43 (8.0%) | 21 (36.2%) |
| 1 or 2 Children | 13 (10.2%) | 0 (0.0%) |
| 3 or 4 Children | 4 (9.8%) | 2 (100.0%) |
| 5 or more Children | 0 (0.0%) | 0 (0.0%) |
| Total | 60 (8.5%) | 23 (14.9%) |
Race in Coke County
The most populous races in Coke County are White / Caucasian (2,853 | 86.3%), Hispanic or Latino (762 | 23.1%), and Two or more Races (281 | 8.5%).
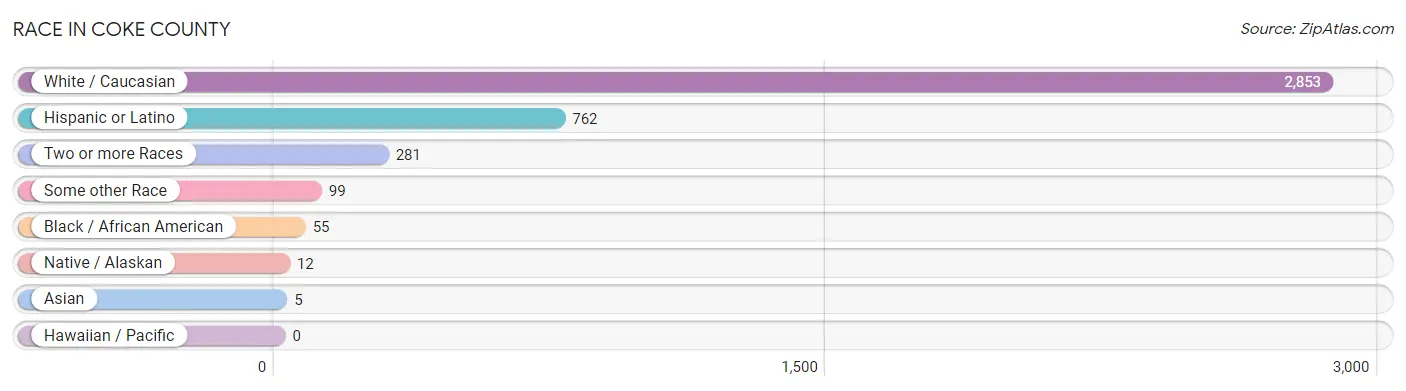
| Race | # Population | % Population |
| Asian | 5 | 0.2% |
| Black / African American | 55 | 1.7% |
| Hawaiian / Pacific | 0 | 0.0% |
| Hispanic or Latino | 762 | 23.1% |
| Native / Alaskan | 12 | 0.4% |
| White / Caucasian | 2,853 | 86.3% |
| Two or more Races | 281 | 8.5% |
| Some other Race | 99 | 3.0% |
| Total | 3,305 | 100.0% |
Ancestry in Coke County
The most populous ancestries reported in Coke County are Mexican (665 | 20.1%), German (471 | 14.2%), English (420 | 12.7%), American (314 | 9.5%), and Irish (293 | 8.9%), together accounting for 65.4% of all Coke County residents.
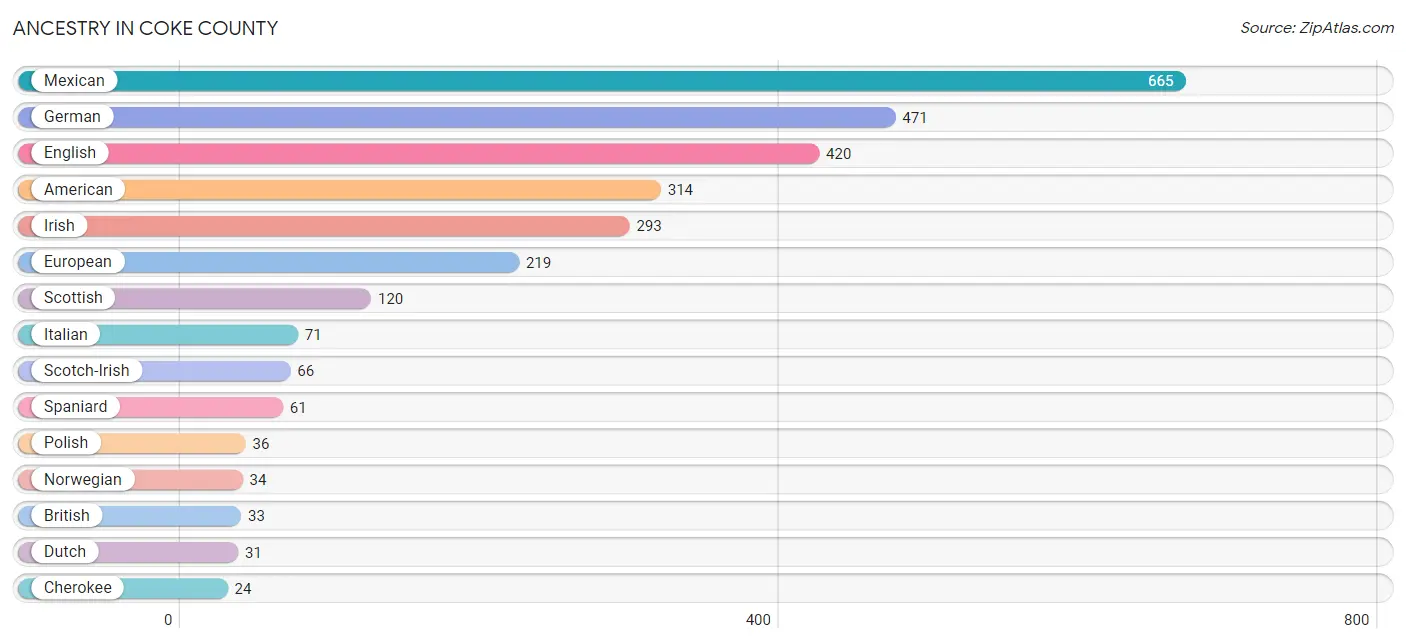
| Ancestry | # Population | % Population |
| American | 314 | 9.5% |
| British | 33 | 1.0% |
| Central American Indian | 7 | 0.2% |
| Cherokee | 24 | 0.7% |
| Choctaw | 7 | 0.2% |
| Comanche | 7 | 0.2% |
| Croatian | 2 | 0.1% |
| Dutch | 31 | 0.9% |
| Dutch West Indian | 7 | 0.2% |
| English | 420 | 12.7% |
| European | 219 | 6.6% |
| French | 4 | 0.1% |
| French Canadian | 2 | 0.1% |
| German | 471 | 14.2% |
| Irish | 293 | 8.9% |
| Italian | 71 | 2.1% |
| Korean | 3 | 0.1% |
| Malaysian | 10 | 0.3% |
| Mexican | 665 | 20.1% |
| Mexican American Indian | 7 | 0.2% |
| Native Hawaiian | 3 | 0.1% |
| Northern European | 12 | 0.4% |
| Norwegian | 34 | 1.0% |
| Pakistani | 11 | 0.3% |
| Polish | 36 | 1.1% |
| Potawatomi | 2 | 0.1% |
| Scandinavian | 4 | 0.1% |
| Scotch-Irish | 66 | 2.0% |
| Scottish | 120 | 3.6% |
| Spaniard | 61 | 1.8% |
| Swedish | 4 | 0.1% |
| Swiss | 9 | 0.3% | View All 32 Rows |
Immigrants in Coke County
The most numerous immigrant groups reported in Coke County came from Central America (101 | 3.1%), Latin America (101 | 3.1%), Mexico (98 | 3.0%), Asia (21 | 0.6%), and South Eastern Asia (21 | 0.6%), together accounting for 10.4% of all Coke County residents.
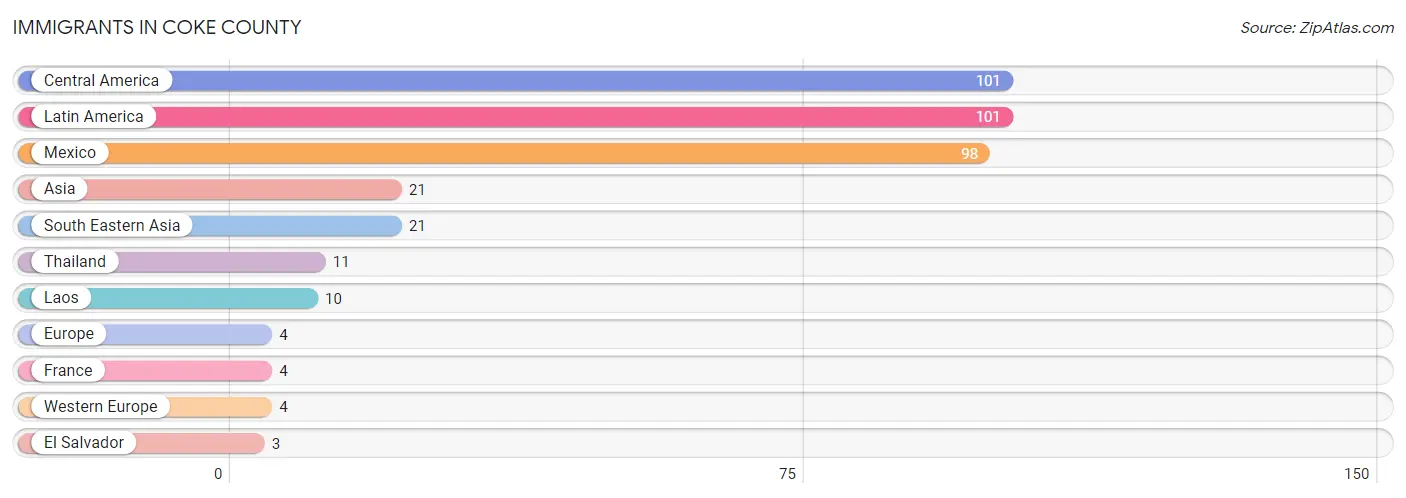
| Immigration Origin | # Population | % Population |
| Asia | 21 | 0.6% |
| Central America | 101 | 3.1% |
| El Salvador | 3 | 0.1% |
| Europe | 4 | 0.1% |
| France | 4 | 0.1% |
| Laos | 10 | 0.3% |
| Latin America | 101 | 3.1% |
| Mexico | 98 | 3.0% |
| South Eastern Asia | 21 | 0.6% |
| Thailand | 11 | 0.3% |
| Western Europe | 4 | 0.1% | View All 11 Rows |
Sex and Age in Coke County
Sex and Age in Coke County
The most populous age groups in Coke County are 10 to 14 Years (139 | 8.5%) for men and 65 to 69 Years (217 | 13.1%) for women.
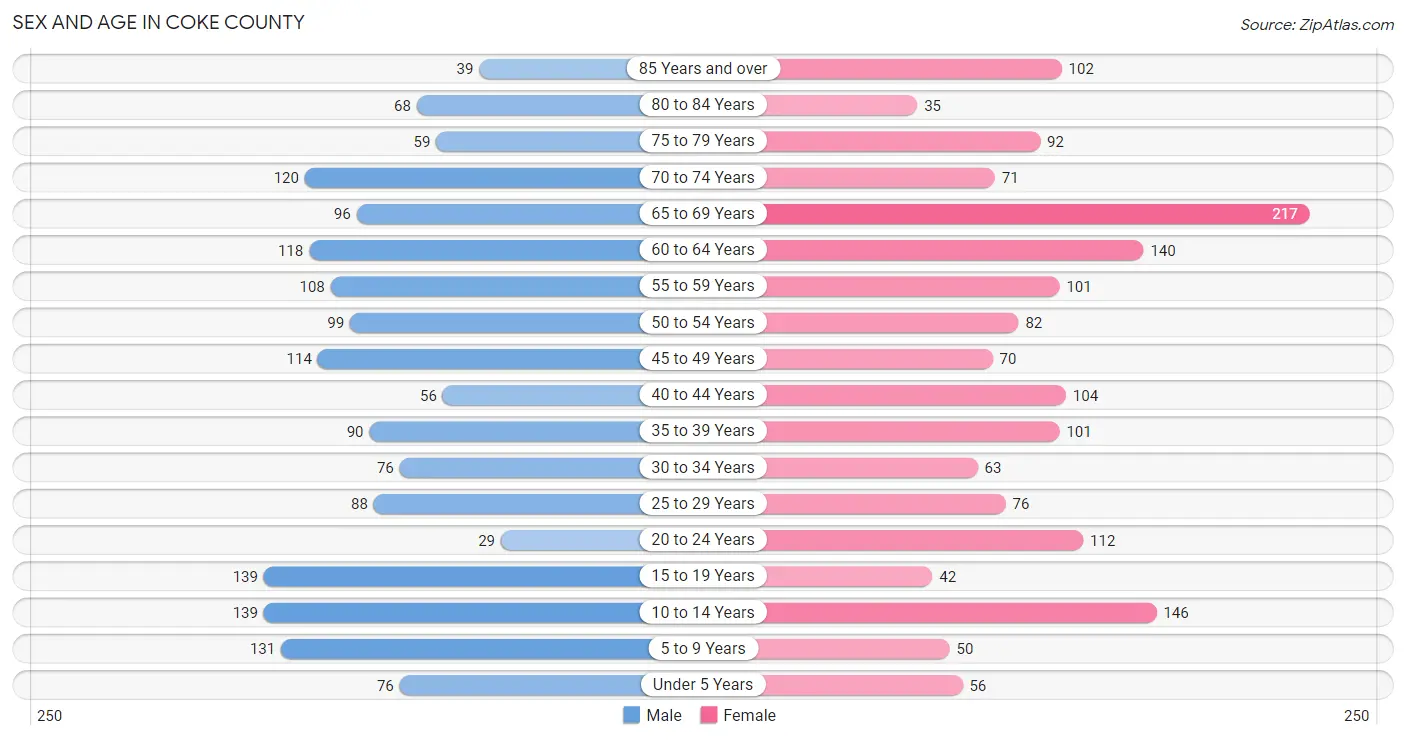
| Age Bracket | Male | Female |
| Under 5 Years | 76 (4.6%) | 56 (3.4%) |
| 5 to 9 Years | 131 (8.0%) | 50 (3.0%) |
| 10 to 14 Years | 139 (8.5%) | 146 (8.8%) |
| 15 to 19 Years | 139 (8.5%) | 42 (2.5%) |
| 20 to 24 Years | 29 (1.8%) | 112 (6.8%) |
| 25 to 29 Years | 88 (5.3%) | 76 (4.6%) |
| 30 to 34 Years | 76 (4.6%) | 63 (3.8%) |
| 35 to 39 Years | 90 (5.5%) | 101 (6.1%) |
| 40 to 44 Years | 56 (3.4%) | 104 (6.3%) |
| 45 to 49 Years | 114 (6.9%) | 70 (4.2%) |
| 50 to 54 Years | 99 (6.0%) | 82 (4.9%) |
| 55 to 59 Years | 108 (6.6%) | 101 (6.1%) |
| 60 to 64 Years | 118 (7.2%) | 140 (8.4%) |
| 65 to 69 Years | 96 (5.8%) | 217 (13.1%) |
| 70 to 74 Years | 120 (7.3%) | 71 (4.3%) |
| 75 to 79 Years | 59 (3.6%) | 92 (5.5%) |
| 80 to 84 Years | 68 (4.1%) | 35 (2.1%) |
| 85 Years and over | 39 (2.4%) | 102 (6.1%) |
| Total | 1,645 (100.0%) | 1,660 (100.0%) |
Families and Households in Coke County
Median Family Size in Coke County
The median family size in Coke County is 2.83 persons per family, with married-couple families (705 | 82.1%) accounting for the largest median family size of 2.85 persons per family. On the other hand, single male/father families (33 | 3.8%) represent the smallest median family size with 2.39 persons per family.
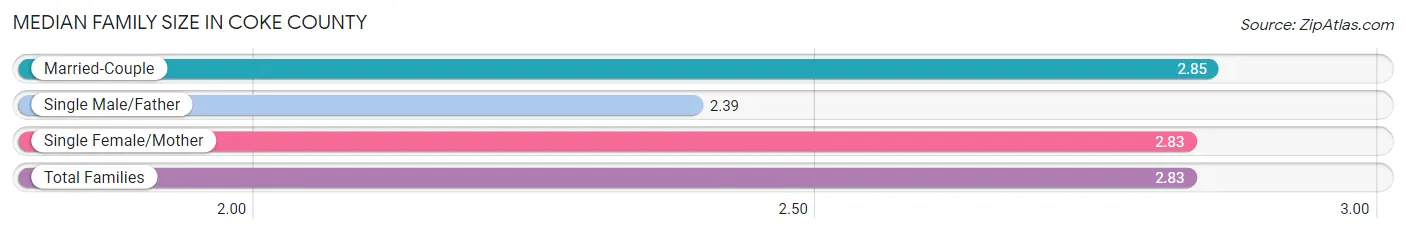
| Family Type | # Families | Family Size |
| Married-Couple | 705 (82.1%) | 2.85 |
| Single Male/Father | 33 (3.8%) | 2.39 |
| Single Female/Mother | 121 (14.1%) | 2.83 |
| Total Families | 859 (100.0%) | 2.83 |
Median Household Size in Coke County
The median household size in Coke County is 2.15 persons per household, with single female/mother households (121 | 8.1%) accounting for the largest median household size of 3.46 persons per household. non-family households (628 | 42.2%) represent the smallest median household size with 1.10 persons per household.
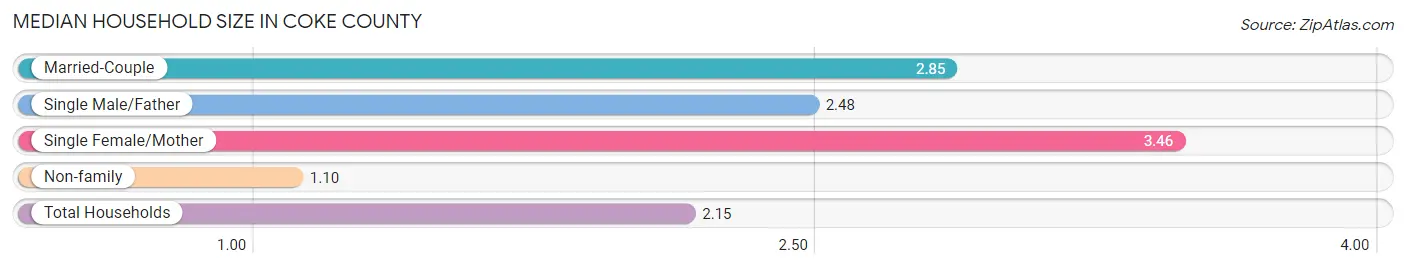
| Household Type | # Households | Household Size |
| Married-Couple | 705 (47.4%) | 2.85 |
| Single Male/Father | 33 (2.2%) | 2.48 |
| Single Female/Mother | 121 (8.1%) | 3.46 |
| Non-family | 628 (42.2%) | 1.10 |
| Total Households | 1,487 (100.0%) | 2.15 |
Household Size by Marriage Status in Coke County
Out of a total of 1,487 households in Coke County, 859 (57.8%) are family households, while 628 (42.2%) are nonfamily households. The most numerous type of family households are 2-person households, comprising 548, and the most common type of nonfamily households are 1-person households, comprising 570.
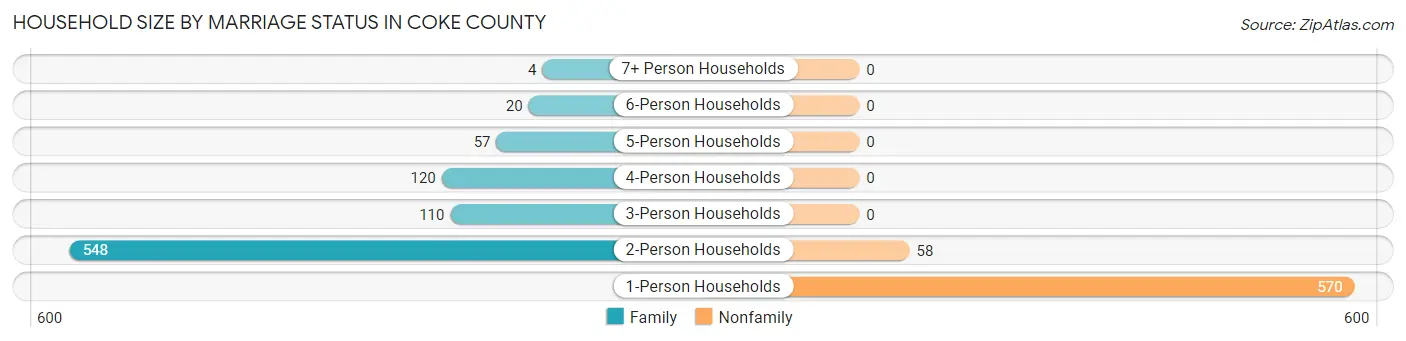
| Household Size | Family Households | Nonfamily Households |
| 1-Person Households | - | 570 (38.3%) |
| 2-Person Households | 548 (36.8%) | 58 (3.9%) |
| 3-Person Households | 110 (7.4%) | 0 (0.0%) |
| 4-Person Households | 120 (8.1%) | 0 (0.0%) |
| 5-Person Households | 57 (3.8%) | 0 (0.0%) |
| 6-Person Households | 20 (1.3%) | 0 (0.0%) |
| 7+ Person Households | 4 (0.3%) | 0 (0.0%) |
| Total | 859 (57.8%) | 628 (42.2%) |
Female Fertility in Coke County
Fertility by Age in Coke County
Average fertility rate in Coke County is 46.0 births per 1,000 women. Women in the age bracket of 20 to 34 years have the highest fertility rate with 64.0 births per 1,000 women. Women in the age bracket of 20 to 34 years acount for 59.3% of all women with births.
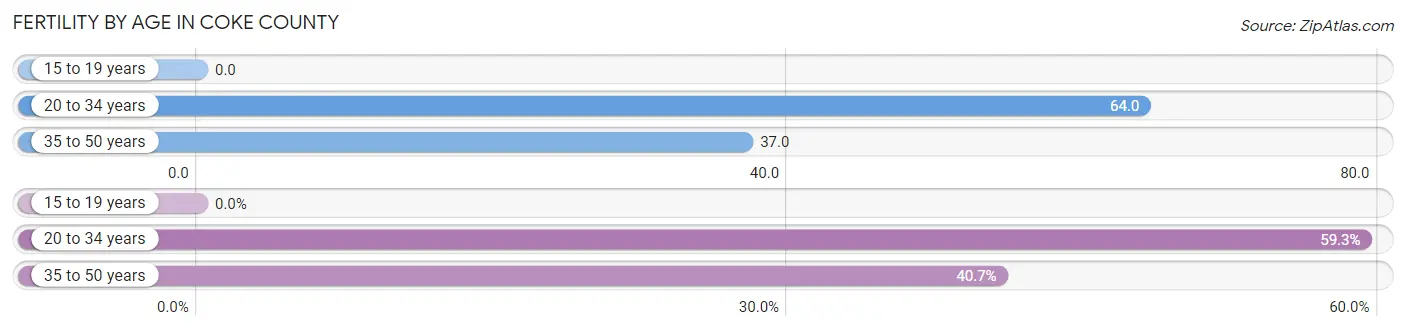
| Age Bracket | Women with Births | Births / 1,000 Women |
| 15 to 19 years | 0 (0.0%) | 0.0 |
| 20 to 34 years | 16 (59.3%) | 64.0 |
| 35 to 50 years | 11 (40.7%) | 37.0 |
| Total | 27 (100.0%) | 46.0 |
Fertility by Age by Marriage Status in Coke County
96.3% of women with births (27) in Coke County are married. The highest percentage of unmarried women with births falls into 20 to 34 years age bracket with 6.2% of them unmarried at the time of birth, while the lowest percentage of unmarried women with births belong to 35 to 50 years age bracket with 0.0% of them unmarried.
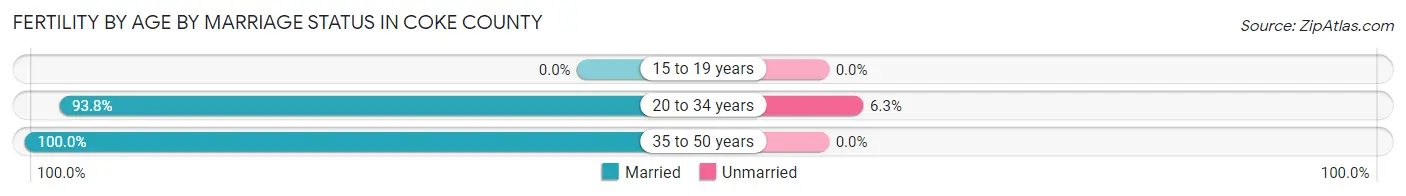
| Age Bracket | Married | Unmarried |
| 15 to 19 years | 0 (0.0%) | 0 (0.0%) |
| 20 to 34 years | 15 (93.8%) | 1 (6.2%) |
| 35 to 50 years | 11 (100.0%) | 0 (0.0%) |
| Total | 26 (96.3%) | 1 (3.7%) |
Fertility by Education in Coke County
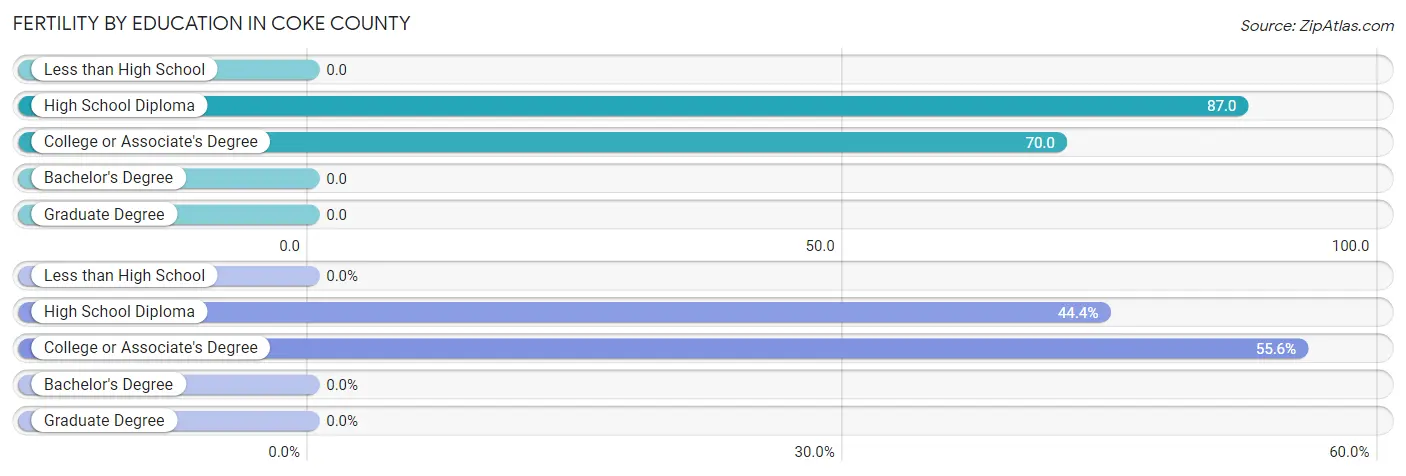
| Educational Attainment | Women with Births | Births / 1,000 Women |
| Less than High School | 0 (0.0%) | 0.0 |
| High School Diploma | 12 (44.4%) | 87.0 |
| College or Associate's Degree | 15 (55.6%) | 70.0 |
| Bachelor's Degree | 0 (0.0%) | 0.0 |
| Graduate Degree | 0 (0.0%) | 0.0 |
| Total | 27 (100.0%) | 46.0 |
Fertility by Education by Marriage Status in Coke County
3.7% of women with births in Coke County are unmarried. Women with the educational attainment of college or associate's degree are most likely to be married with 100.0% of them married at childbirth, while women with the educational attainment of high school diploma are least likely to be married with 8.3% of them unmarried at childbirth.
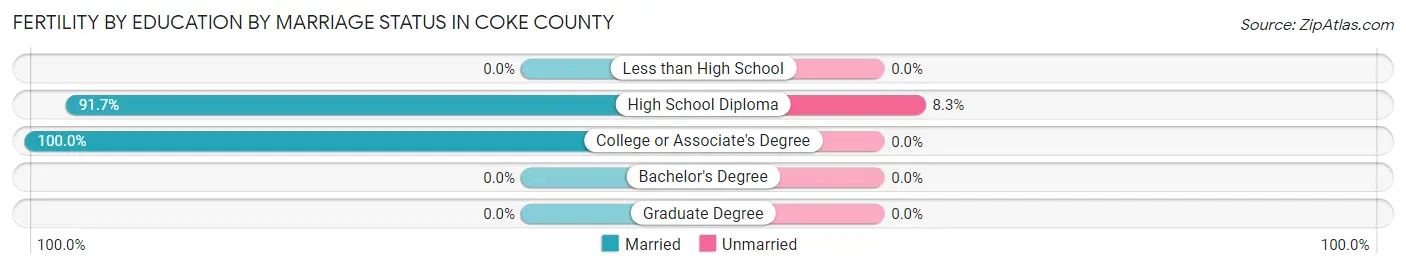
| Educational Attainment | Married | Unmarried |
| Less than High School | 0 (0.0%) | 0 (0.0%) |
| High School Diploma | 11 (91.7%) | 1 (8.3%) |
| College or Associate's Degree | 15 (100.0%) | 0 (0.0%) |
| Bachelor's Degree | 0 (0.0%) | 0 (0.0%) |
| Graduate Degree | 0 (0.0%) | 0 (0.0%) |
| Total | 26 (96.3%) | 1 (3.7%) |
Employment Characteristics in Coke County
Employment by Class of Employer in Coke County
Among the 1,325 employed individuals in Coke County, private company employees (772 | 58.3%), local government employees (196 | 14.8%), and not-for-profit organizations (141 | 10.6%) make up the most common classes of employment.
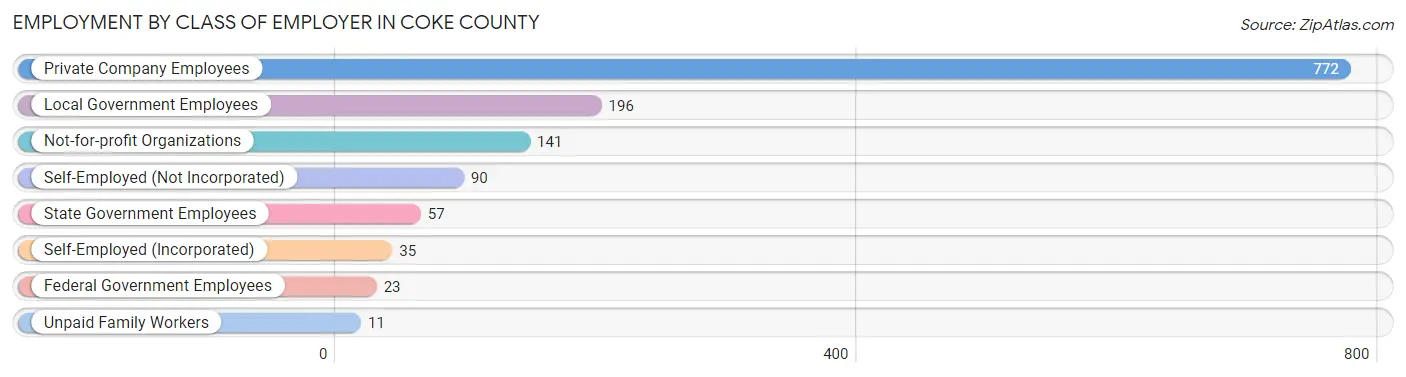
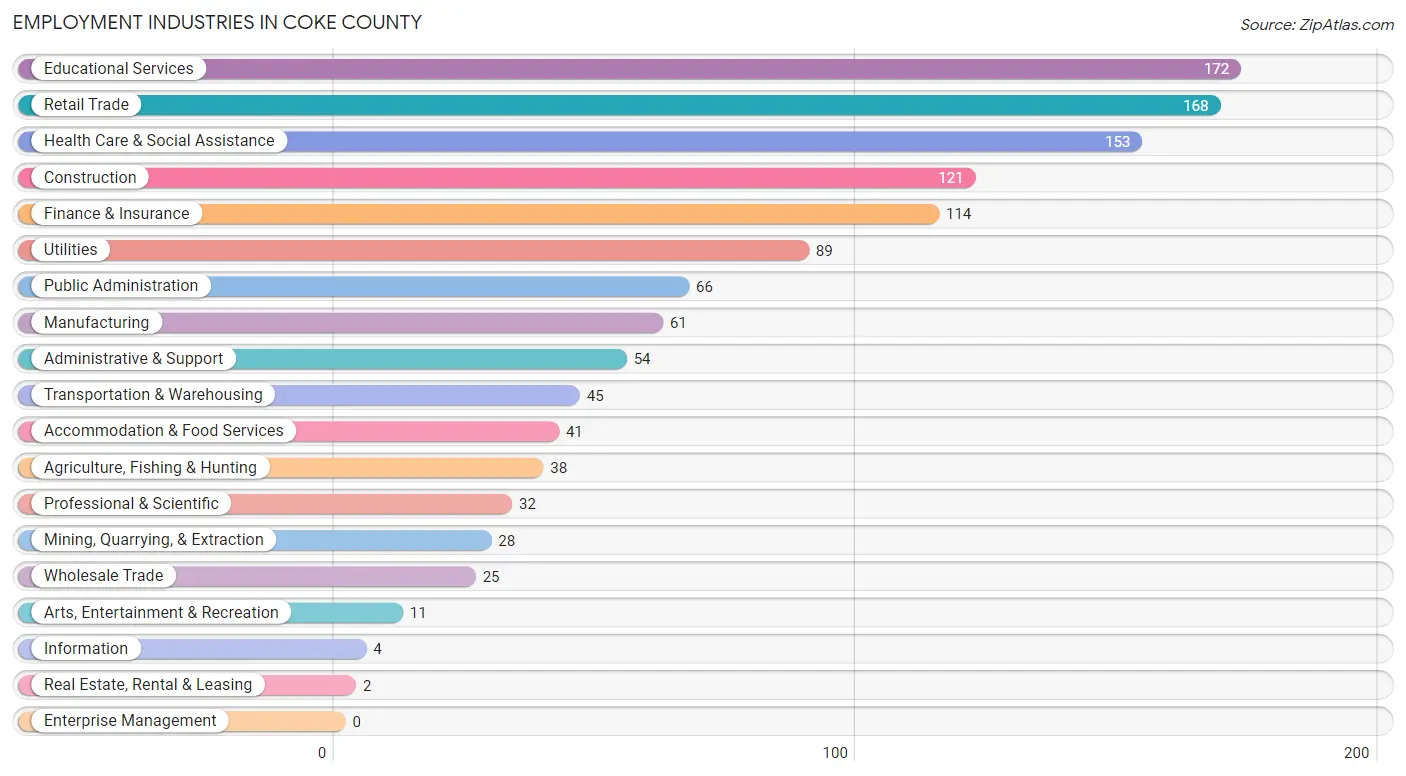
| Employer Class | # Employees | % Employees |
| Private Company Employees | 772 | 58.3% |
| Self-Employed (Incorporated) | 35 | 2.6% |
| Self-Employed (Not Incorporated) | 90 | 6.8% |
| Not-for-profit Organizations | 141 | 10.6% |
| Local Government Employees | 196 | 14.8% |
| State Government Employees | 57 | 4.3% |
| Federal Government Employees | 23 | 1.7% |
| Unpaid Family Workers | 11 | 0.8% |
| Total | 1,325 | 100.0% |
Employment Status by Age in Coke County
According to the labor force statistics for Coke County, out of the total population over 16 years of age (2,662), 52.0% or 1,384 individuals are in the labor force, with 3.0% or 42 of them unemployed. The age group with the highest labor force participation rate is 20 to 24 years, with 88.7% or 125 individuals in the labor force. Within the labor force, the 75 years and over age range has the highest percentage of unemployed individuals, with 25.0% or 2 of them being unemployed.
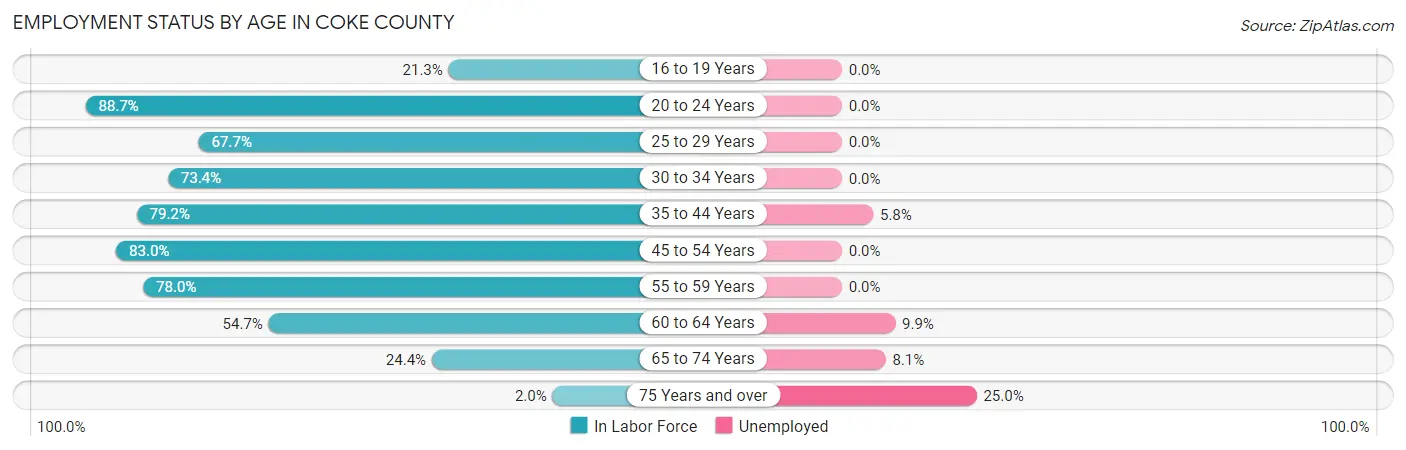
| Age Bracket | In Labor Force | Unemployed |
| 16 to 19 Years | 29 (21.3%) | 0 (0.0%) |
| 20 to 24 Years | 125 (88.7%) | 0 (0.0%) |
| 25 to 29 Years | 111 (67.7%) | 0 (0.0%) |
| 30 to 34 Years | 102 (73.4%) | 0 (0.0%) |
| 35 to 44 Years | 278 (79.2%) | 16 (5.8%) |
| 45 to 54 Years | 303 (83.0%) | 0 (0.0%) |
| 55 to 59 Years | 163 (78.0%) | 0 (0.0%) |
| 60 to 64 Years | 141 (54.7%) | 14 (9.9%) |
| 65 to 74 Years | 123 (24.4%) | 10 (8.1%) |
| 75 Years and over | 8 (2.0%) | 2 (25.0%) |
| Total | 1,384 (52.0%) | 42 (3.0%) |
Employment Status by Educational Attainment in Coke County
According to labor force statistics for Coke County, 73.9% of individuals (1,098) out of the total population between 25 and 64 years of age (1,486) are in the labor force, with 2.7% or 30 of them being unemployed. The group with the highest labor force participation rate are those with the educational attainment of bachelor's degree or higher, with 88.4% or 244 individuals in the labor force. Within the labor force, individuals with less than high school education have the highest percentage of unemployment, with 15.2% or 16 of them being unemployed.
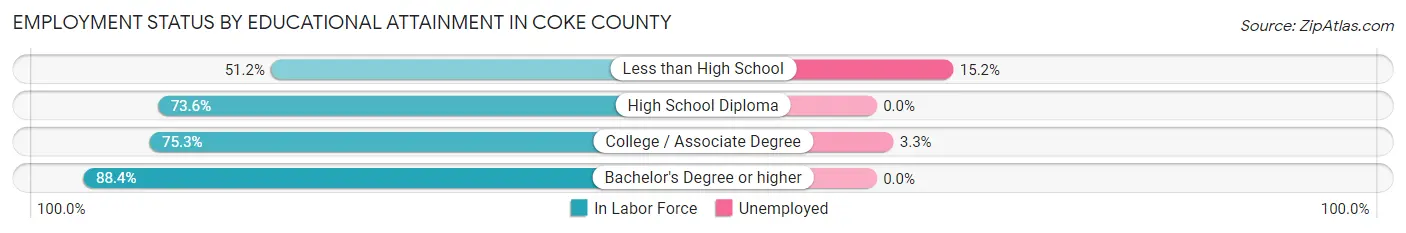
| Educational Attainment | In Labor Force | Unemployed |
| Less than High School | 105 (51.2%) | 31 (15.2%) |
| High School Diploma | 331 (73.6%) | 0 (0.0%) |
| College / Associate Degree | 418 (75.3%) | 18 (3.3%) |
| Bachelor's Degree or higher | 244 (88.4%) | 0 (0.0%) |
| Total | 1,098 (73.9%) | 40 (2.7%) |
Employment Occupations by Sex in Coke County
Management, Business, Science and Arts Occupations
The most common Management, Business, Science and Arts occupations in Coke County are Community & Social Service (217 | 16.2%), Education Instruction & Library (98 | 7.3%), Legal Services & Support (90 | 6.7%), Management (66 | 4.9%), and Health Diagnosing & Treating (30 | 2.2%).
Management, Business, Science and Arts Occupations by Sex
Within the Management, Business, Science and Arts occupations in Coke County, the most male-oriented occupations are Computers, Engineering & Science (100.0%), Computers & Mathematics (100.0%), and Architecture & Engineering (100.0%), while the most female-oriented occupations are Education, Arts & Media (100.0%), Arts, Media & Entertainment (100.0%), and Education Instruction & Library (96.9%).
| Occupation | Male | Female |
| Management | 52 (78.8%) | 14 (21.2%) |
| Business & Financial | 2 (33.3%) | 4 (66.7%) |
| Computers, Engineering & Science | 20 (100.0%) | 0 (0.0%) |
| Computers & Mathematics | 11 (100.0%) | 0 (0.0%) |
| Architecture & Engineering | 3 (100.0%) | 0 (0.0%) |
| Life, Physical & Social Science | 6 (100.0%) | 0 (0.0%) |
| Community & Social Service | 36 (16.6%) | 181 (83.4%) |
| Education, Arts & Media | 0 (0.0%) | 14 (100.0%) |
| Legal Services & Support | 33 (36.7%) | 57 (63.3%) |
| Education Instruction & Library | 3 (3.1%) | 95 (96.9%) |
| Arts, Media & Entertainment | 0 (0.0%) | 15 (100.0%) |
| Health Diagnosing & Treating | 1 (3.3%) | 29 (96.7%) |
| Health Technologists | 1 (5.6%) | 17 (94.4%) |
| Total (Category) | 111 (32.7%) | 228 (67.3%) |
| Total (Overall) | 651 (48.5%) | 690 (51.4%) |
Services Occupations
The most common Services occupations in Coke County are Cleaning & Maintenance (107 | 8.0%), Healthcare Support (95 | 7.1%), Security & Protection (61 | 4.5%), Food Preparation & Serving (58 | 4.3%), and Personal Care & Service (46 | 3.4%).
Services Occupations by Sex
Within the Services occupations in Coke County, the most male-oriented occupations are Security & Protection (100.0%), Firefighting & Prevention (100.0%), and Law Enforcement (100.0%), while the most female-oriented occupations are Healthcare Support (100.0%), Food Preparation & Serving (100.0%), and Personal Care & Service (76.1%).
| Occupation | Male | Female |
| Healthcare Support | 0 (0.0%) | 95 (100.0%) |
| Security & Protection | 61 (100.0%) | 0 (0.0%) |
| Firefighting & Prevention | 20 (100.0%) | 0 (0.0%) |
| Law Enforcement | 41 (100.0%) | 0 (0.0%) |
| Food Preparation & Serving | 0 (0.0%) | 58 (100.0%) |
| Cleaning & Maintenance | 39 (36.4%) | 68 (63.5%) |
| Personal Care & Service | 11 (23.9%) | 35 (76.1%) |
| Total (Category) | 111 (30.2%) | 256 (69.8%) |
| Total (Overall) | 651 (48.5%) | 690 (51.4%) |
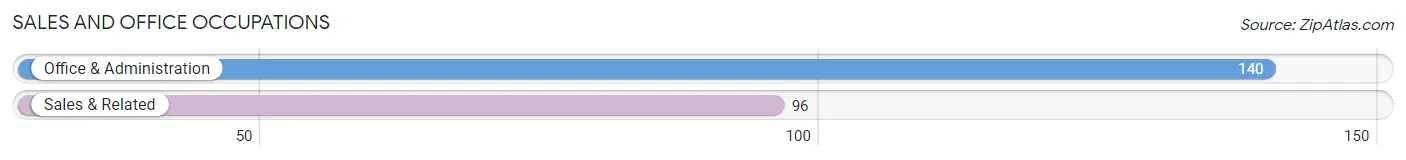
Sales and Office Occupations
The most common Sales and Office occupations in Coke County are Office & Administration (140 | 10.4%), and Sales & Related (96 | 7.2%).
Sales and Office Occupations by Sex

| Occupation | Male | Female |
| Sales & Related | 50 (52.1%) | 46 (47.9%) |
| Office & Administration | 22 (15.7%) | 118 (84.3%) |
| Total (Category) | 72 (30.5%) | 164 (69.5%) |
| Total (Overall) | 651 (48.5%) | 690 (51.4%) |
Natural Resources, Construction and Maintenance Occupations
The most common Natural Resources, Construction and Maintenance occupations in Coke County are Construction & Extraction (124 | 9.2%), Installation, Maintenance & Repair (85 | 6.3%), and Farming, Fishing & Forestry (12 | 0.9%).
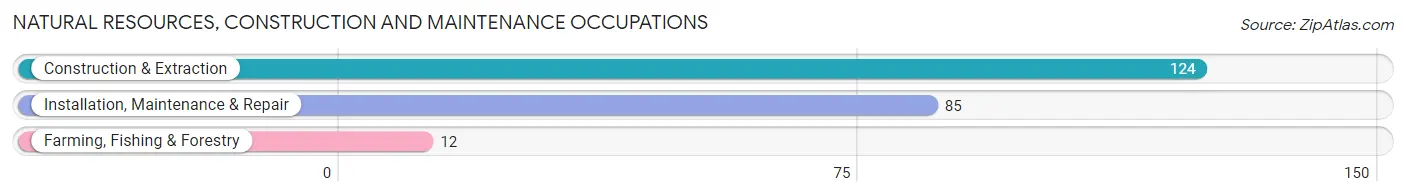
Natural Resources, Construction and Maintenance Occupations by Sex
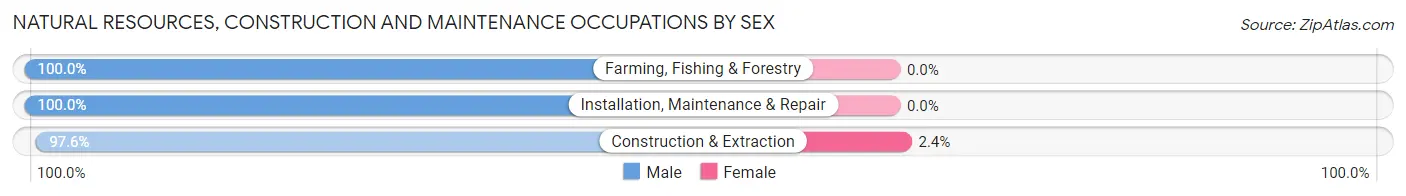
| Occupation | Male | Female |
| Farming, Fishing & Forestry | 12 (100.0%) | 0 (0.0%) |
| Construction & Extraction | 121 (97.6%) | 3 (2.4%) |
| Installation, Maintenance & Repair | 85 (100.0%) | 0 (0.0%) |
| Total (Category) | 218 (98.6%) | 3 (1.4%) |
| Total (Overall) | 651 (48.5%) | 690 (51.4%) |
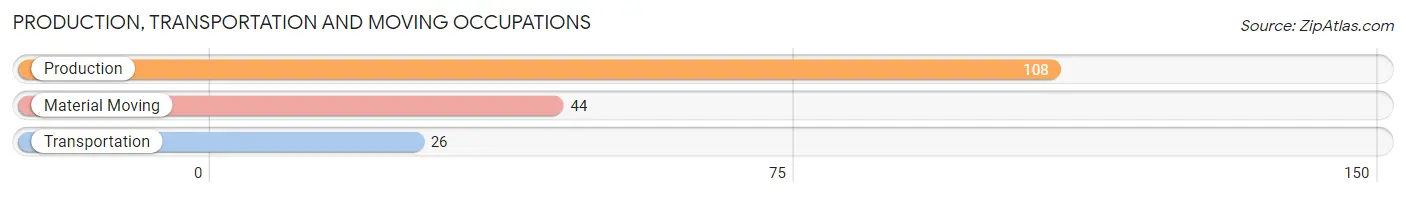
Production, Transportation and Moving Occupations
The most common Production, Transportation and Moving occupations in Coke County are Production (108 | 8.1%), Material Moving (44 | 3.3%), and Transportation (26 | 1.9%).
Production, Transportation and Moving Occupations by Sex
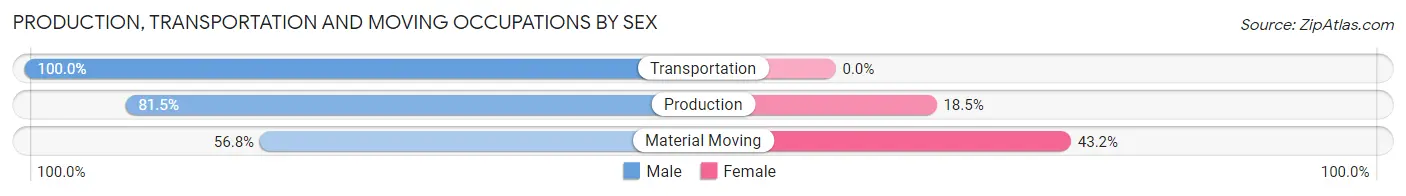
| Occupation | Male | Female |
| Production | 88 (81.5%) | 20 (18.5%) |
| Transportation | 26 (100.0%) | 0 (0.0%) |
| Material Moving | 25 (56.8%) | 19 (43.2%) |
| Total (Category) | 139 (78.1%) | 39 (21.9%) |
| Total (Overall) | 651 (48.5%) | 690 (51.4%) |
Employment Industries by Sex in Coke County
Employment Industries in Coke County
The major employment industries in Coke County include Educational Services (172 | 12.8%), Retail Trade (168 | 12.5%), Health Care & Social Assistance (153 | 11.4%), Construction (121 | 9.0%), and Finance & Insurance (114 | 8.5%).
Employment Industries by Sex in Coke County
The Coke County industries that see more men than women are Agriculture, Fishing & Hunting (100.0%), Wholesale Trade (100.0%), and Information (100.0%), whereas the industries that tend to have a higher number of women are Health Care & Social Assistance (96.1%), Accommodation & Food Services (92.7%), and Educational Services (87.2%).
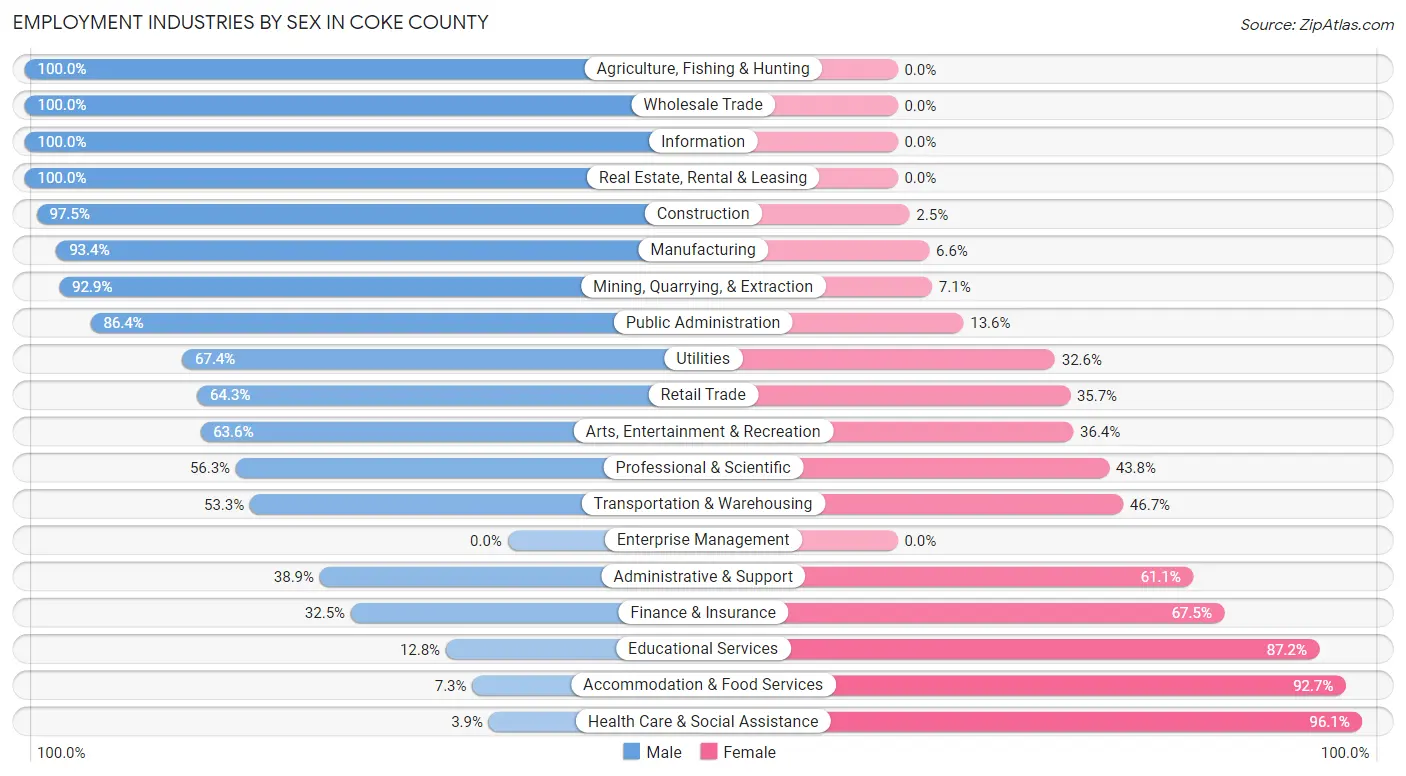
| Industry | Male | Female |
| Agriculture, Fishing & Hunting | 38 (100.0%) | 0 (0.0%) |
| Mining, Quarrying, & Extraction | 26 (92.9%) | 2 (7.1%) |
| Construction | 118 (97.5%) | 3 (2.5%) |
| Manufacturing | 57 (93.4%) | 4 (6.6%) |
| Wholesale Trade | 25 (100.0%) | 0 (0.0%) |
| Retail Trade | 108 (64.3%) | 60 (35.7%) |
| Transportation & Warehousing | 24 (53.3%) | 21 (46.7%) |
| Utilities | 60 (67.4%) | 29 (32.6%) |
| Information | 4 (100.0%) | 0 (0.0%) |
| Finance & Insurance | 37 (32.5%) | 77 (67.5%) |
| Real Estate, Rental & Leasing | 2 (100.0%) | 0 (0.0%) |
| Professional & Scientific | 18 (56.2%) | 14 (43.8%) |
| Enterprise Management | 0 (0.0%) | 0 (0.0%) |
| Administrative & Support | 21 (38.9%) | 33 (61.1%) |
| Educational Services | 22 (12.8%) | 150 (87.2%) |
| Health Care & Social Assistance | 6 (3.9%) | 147 (96.1%) |
| Arts, Entertainment & Recreation | 7 (63.6%) | 4 (36.4%) |
| Accommodation & Food Services | 3 (7.3%) | 38 (92.7%) |
| Public Administration | 57 (86.4%) | 9 (13.6%) |
| Total | 651 (48.5%) | 690 (51.4%) |
Education in Coke County
School Enrollment in Coke County
The most common levels of schooling among the 743 students in Coke County are middle school (203 | 27.3%), elementary school (186 | 25.0%), and high school (176 | 23.7%).
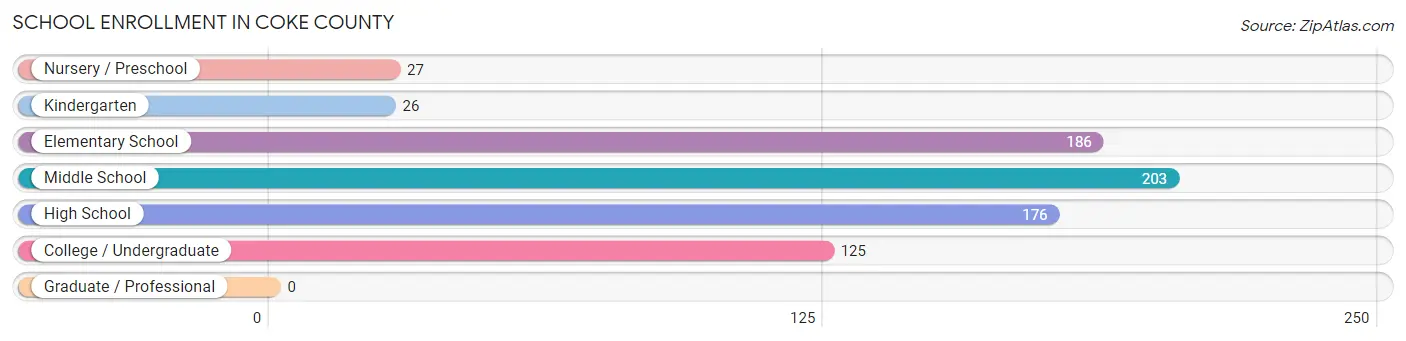
| School Level | # Students | % Students |
| Nursery / Preschool | 27 | 3.6% |
| Kindergarten | 26 | 3.5% |
| Elementary School | 186 | 25.0% |
| Middle School | 203 | 27.3% |
| High School | 176 | 23.7% |
| College / Undergraduate | 125 | 16.8% |
| Graduate / Professional | 0 | 0.0% |
| Total | 743 | 100.0% |
School Enrollment by Age by Funding Source in Coke County
Out of a total of 743 students who are enrolled in schools in Coke County, 72 (9.7%) attend a private institution, while the remaining 671 (90.3%) are enrolled in public schools. The age group of 35 years and over has the highest likelihood of being enrolled in private schools, with 43 (79.6% in the age bracket) enrolled. Conversely, the age group of 3 to 4 year olds has the lowest likelihood of being enrolled in a private school, with 9 (100.0% in the age bracket) attending a public institution.
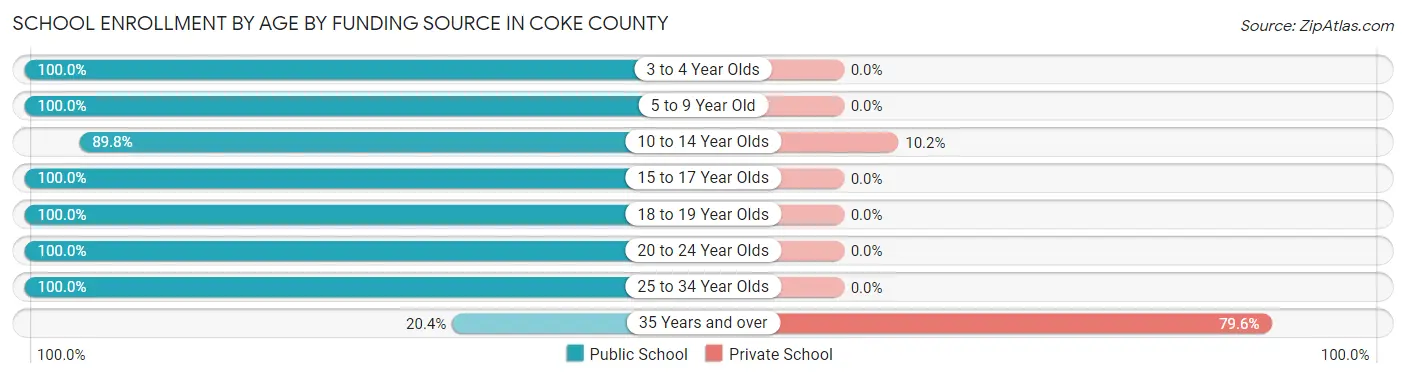
| Age Bracket | Public School | Private School |
| 3 to 4 Year Olds | 9 (100.0%) | 0 (0.0%) |
| 5 to 9 Year Old | 181 (100.0%) | 0 (0.0%) |
| 10 to 14 Year Olds | 256 (89.8%) | 29 (10.2%) |
| 15 to 17 Year Olds | 117 (100.0%) | 0 (0.0%) |
| 18 to 19 Year Olds | 51 (100.0%) | 0 (0.0%) |
| 20 to 24 Year Olds | 33 (100.0%) | 0 (0.0%) |
| 25 to 34 Year Olds | 13 (100.0%) | 0 (0.0%) |
| 35 Years and over | 11 (20.4%) | 43 (79.6%) |
| Total | 671 (90.3%) | 72 (9.7%) |
Educational Attainment by Field of Study in Coke County
Business (118 | 22.6%), education (118 | 22.6%), bio, nature & agricultural (63 | 12.0%), arts & humanities (45 | 8.6%), and physical & health sciences (42 | 8.0%) are the most common fields of study among 523 individuals in Coke County who have obtained a bachelor's degree or higher.
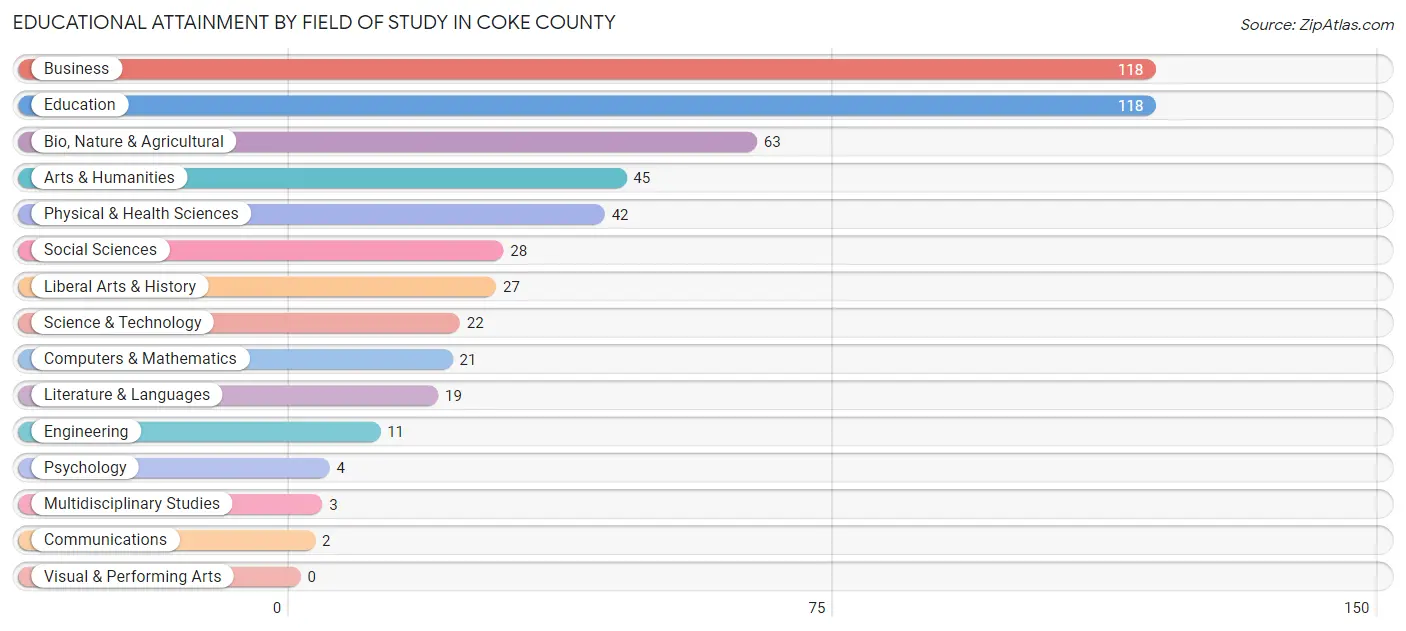
| Field of Study | # Graduates | % Graduates |
| Computers & Mathematics | 21 | 4.0% |
| Bio, Nature & Agricultural | 63 | 12.0% |
| Physical & Health Sciences | 42 | 8.0% |
| Psychology | 4 | 0.8% |
| Social Sciences | 28 | 5.3% |
| Engineering | 11 | 2.1% |
| Multidisciplinary Studies | 3 | 0.6% |
| Science & Technology | 22 | 4.2% |
| Business | 118 | 22.6% |
| Education | 118 | 22.6% |
| Literature & Languages | 19 | 3.6% |
| Liberal Arts & History | 27 | 5.2% |
| Visual & Performing Arts | 0 | 0.0% |
| Communications | 2 | 0.4% |
| Arts & Humanities | 45 | 8.6% |
| Total | 523 | 100.0% |
Transportation & Commute in Coke County
Vehicle Availability by Sex in Coke County
The most prevalent vehicle ownership categories in Coke County are males with 2 vehicles (251, accounting for 38.7%) and females with 2 vehicles (229, making up 37.1%).
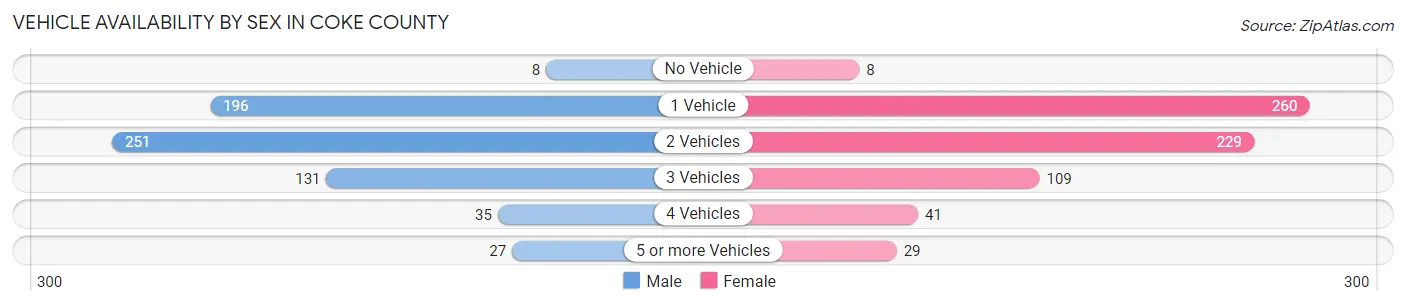
| Vehicles Available | Male | Female |
| No Vehicle | 8 (1.2%) | 8 (1.2%) |
| 1 Vehicle | 196 (30.2%) | 260 (38.5%) |
| 2 Vehicles | 251 (38.7%) | 229 (33.9%) |
| 3 Vehicles | 131 (20.2%) | 109 (16.1%) |
| 4 Vehicles | 35 (5.4%) | 41 (6.1%) |
| 5 or more Vehicles | 27 (4.2%) | 29 (4.3%) |
| Total | 648 (100.0%) | 676 (100.0%) |
Commute Time in Coke County
The most frequently occuring commute durations in Coke County are 5 to 9 minutes (242 commuters, 18.8%), less than 5 minutes (181 commuters, 14.1%), and 30 to 34 minutes (149 commuters, 11.6%).
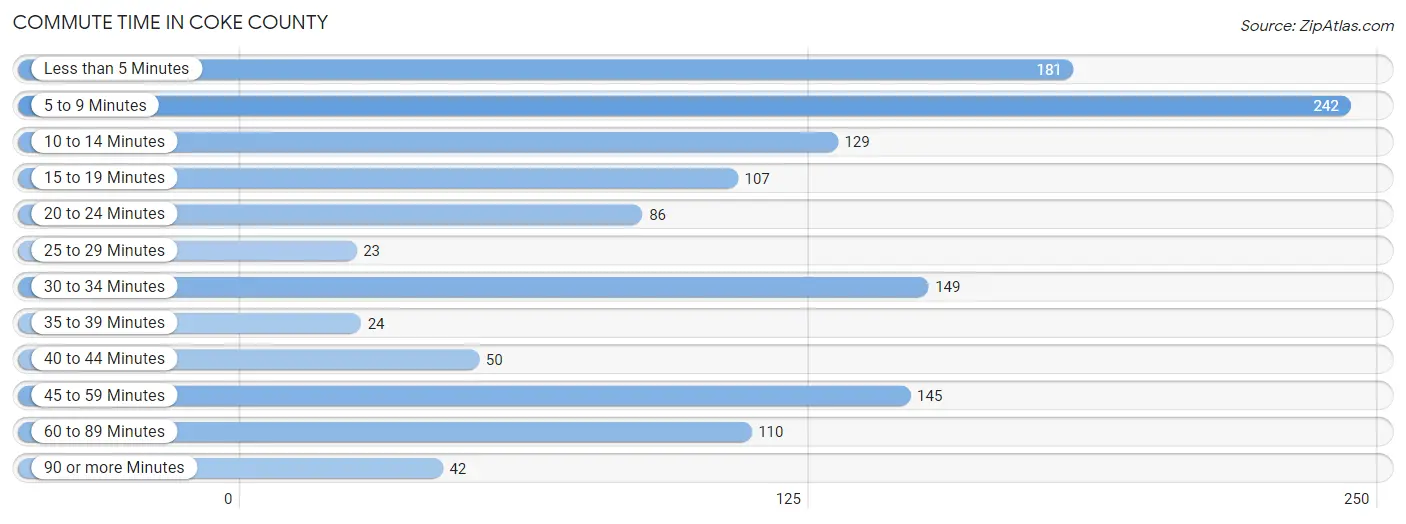
| Commute Time | # Commuters | % Commuters |
| Less than 5 Minutes | 181 | 14.1% |
| 5 to 9 Minutes | 242 | 18.8% |
| 10 to 14 Minutes | 129 | 10.0% |
| 15 to 19 Minutes | 107 | 8.3% |
| 20 to 24 Minutes | 86 | 6.7% |
| 25 to 29 Minutes | 23 | 1.8% |
| 30 to 34 Minutes | 149 | 11.6% |
| 35 to 39 Minutes | 24 | 1.9% |
| 40 to 44 Minutes | 50 | 3.9% |
| 45 to 59 Minutes | 145 | 11.3% |
| 60 to 89 Minutes | 110 | 8.5% |
| 90 or more Minutes | 42 | 3.3% |
Commute Time by Sex in Coke County
The most common commute times in Coke County are 30 to 34 minutes (123 commuters, 19.2%) for males and 5 to 9 minutes (203 commuters, 31.4%) for females.
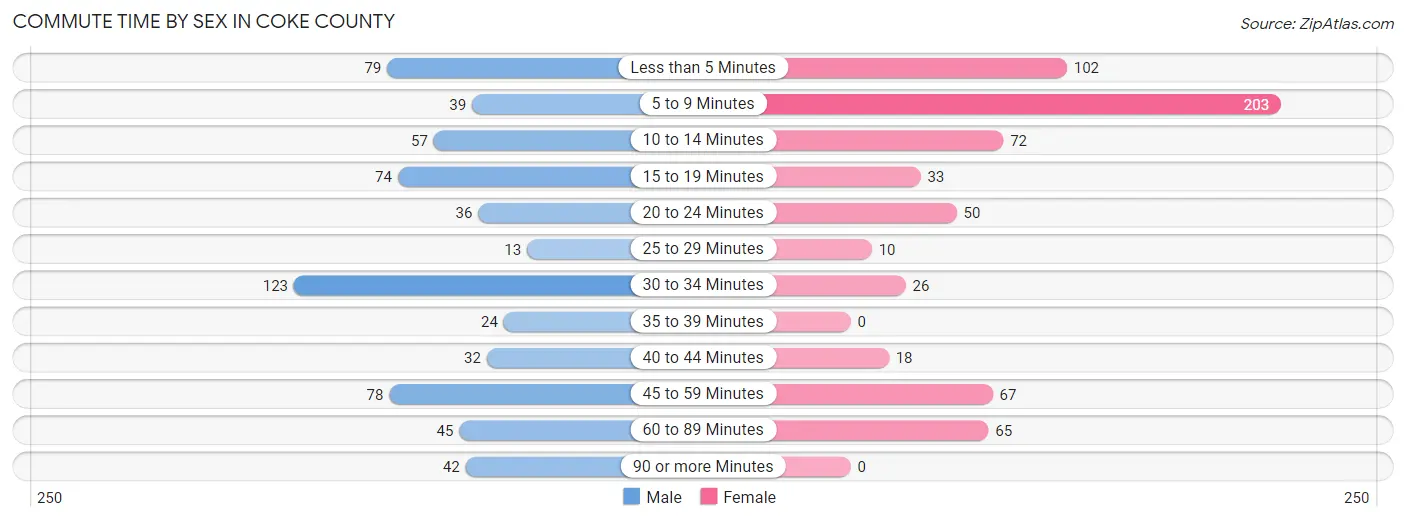
| Commute Time | Male | Female |
| Less than 5 Minutes | 79 (12.3%) | 102 (15.8%) |
| 5 to 9 Minutes | 39 (6.1%) | 203 (31.4%) |
| 10 to 14 Minutes | 57 (8.9%) | 72 (11.2%) |
| 15 to 19 Minutes | 74 (11.5%) | 33 (5.1%) |
| 20 to 24 Minutes | 36 (5.6%) | 50 (7.7%) |
| 25 to 29 Minutes | 13 (2.0%) | 10 (1.5%) |
| 30 to 34 Minutes | 123 (19.2%) | 26 (4.0%) |
| 35 to 39 Minutes | 24 (3.7%) | 0 (0.0%) |
| 40 to 44 Minutes | 32 (5.0%) | 18 (2.8%) |
| 45 to 59 Minutes | 78 (12.1%) | 67 (10.4%) |
| 60 to 89 Minutes | 45 (7.0%) | 65 (10.1%) |
| 90 or more Minutes | 42 (6.5%) | 0 (0.0%) |
Time of Departure to Work by Sex in Coke County
The most frequent times of departure to work in Coke County are 7:00 AM to 7:29 AM (174, 27.1%) for males and 7:00 AM to 7:29 AM (171, 26.5%) for females.
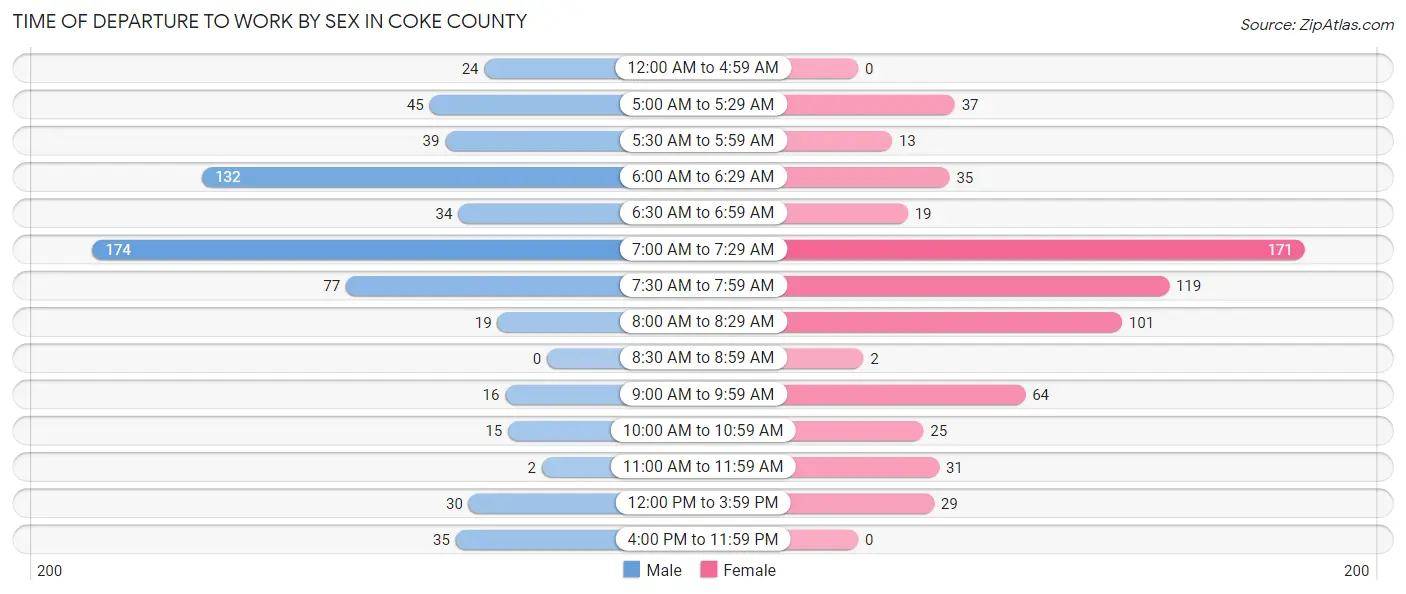
| Time of Departure | Male | Female |
| 12:00 AM to 4:59 AM | 24 (3.7%) | 0 (0.0%) |
| 5:00 AM to 5:29 AM | 45 (7.0%) | 37 (5.7%) |
| 5:30 AM to 5:59 AM | 39 (6.1%) | 13 (2.0%) |
| 6:00 AM to 6:29 AM | 132 (20.6%) | 35 (5.4%) |
| 6:30 AM to 6:59 AM | 34 (5.3%) | 19 (2.9%) |
| 7:00 AM to 7:29 AM | 174 (27.1%) | 171 (26.5%) |
| 7:30 AM to 7:59 AM | 77 (12.0%) | 119 (18.4%) |
| 8:00 AM to 8:29 AM | 19 (3.0%) | 101 (15.6%) |
| 8:30 AM to 8:59 AM | 0 (0.0%) | 2 (0.3%) |
| 9:00 AM to 9:59 AM | 16 (2.5%) | 64 (9.9%) |
| 10:00 AM to 10:59 AM | 15 (2.3%) | 25 (3.9%) |
| 11:00 AM to 11:59 AM | 2 (0.3%) | 31 (4.8%) |
| 12:00 PM to 3:59 PM | 30 (4.7%) | 29 (4.5%) |
| 4:00 PM to 11:59 PM | 35 (5.4%) | 0 (0.0%) |
| Total | 642 (100.0%) | 646 (100.0%) |
Housing Occupancy in Coke County
Occupancy by Ownership in Coke County
Of the total 1,487 dwellings in Coke County, owner-occupied units account for 1,036 (69.7%), while renter-occupied units make up 451 (30.3%).
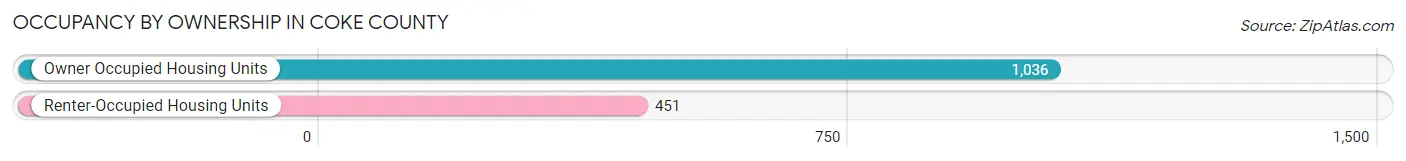
| Occupancy | # Housing Units | % Housing Units |
| Owner Occupied Housing Units | 1,036 | 69.7% |
| Renter-Occupied Housing Units | 451 | 30.3% |
| Total Occupied Housing Units | 1,487 | 100.0% |
Occupancy by Household Size in Coke County
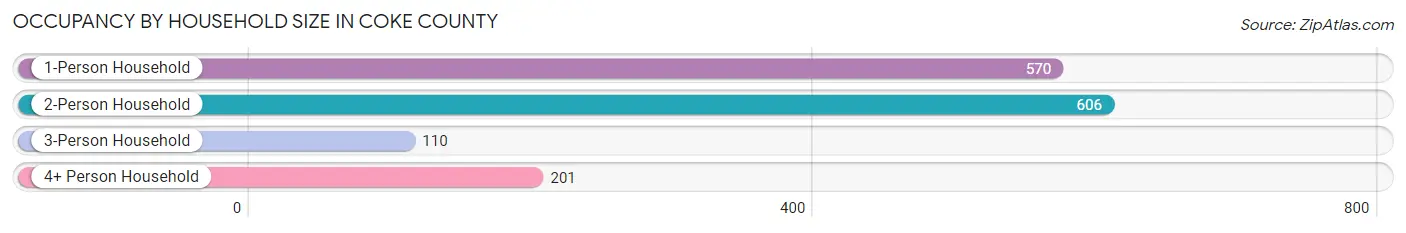
| Household Size | # Housing Units | % Housing Units |
| 1-Person Household | 570 | 38.3% |
| 2-Person Household | 606 | 40.7% |
| 3-Person Household | 110 | 7.4% |
| 4+ Person Household | 201 | 13.5% |
| Total Housing Units | 1,487 | 100.0% |
Occupancy by Ownership by Household Size in Coke County
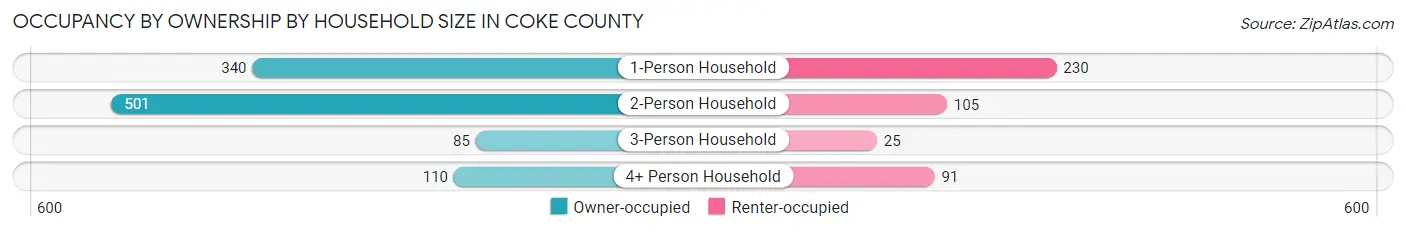
| Household Size | Owner-occupied | Renter-occupied |
| 1-Person Household | 340 (59.7%) | 230 (40.4%) |
| 2-Person Household | 501 (82.7%) | 105 (17.3%) |
| 3-Person Household | 85 (77.3%) | 25 (22.7%) |
| 4+ Person Household | 110 (54.7%) | 91 (45.3%) |
| Total Housing Units | 1,036 (69.7%) | 451 (30.3%) |
Occupancy by Educational Attainment in Coke County
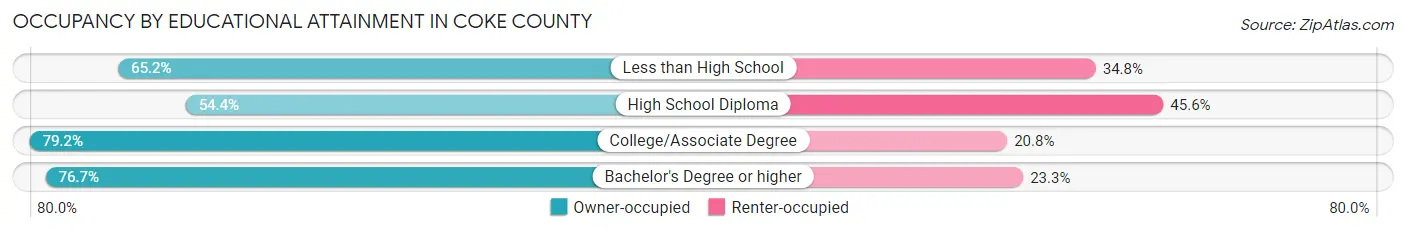
| Household Size | Owner-occupied | Renter-occupied |
| Less than High School | 131 (65.2%) | 70 (34.8%) |
| High School Diploma | 233 (54.4%) | 195 (45.6%) |
| College/Associate Degree | 442 (79.2%) | 116 (20.8%) |
| Bachelor's Degree or higher | 230 (76.7%) | 70 (23.3%) |
Occupancy by Age of Householder in Coke County
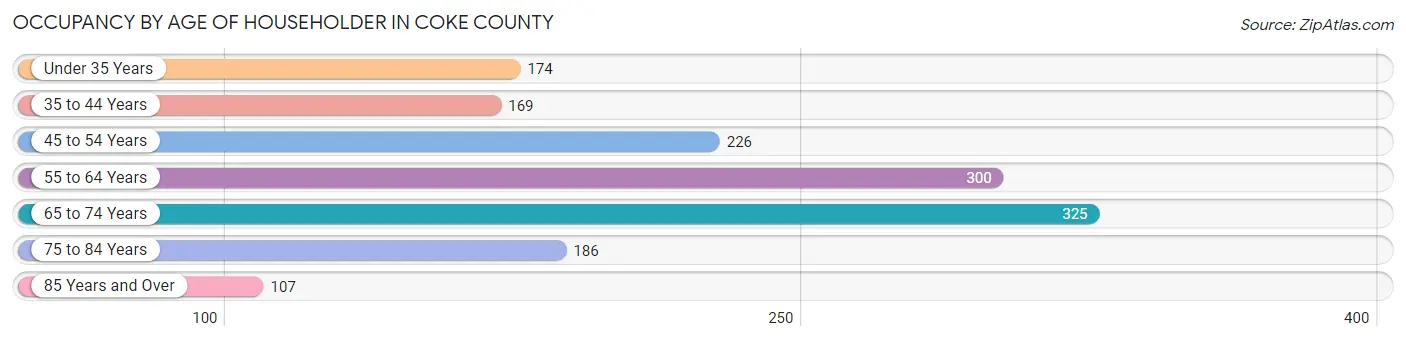
| Age Bracket | # Households | % Households |
| Under 35 Years | 174 | 11.7% |
| 35 to 44 Years | 169 | 11.4% |
| 45 to 54 Years | 226 | 15.2% |
| 55 to 64 Years | 300 | 20.2% |
| 65 to 74 Years | 325 | 21.9% |
| 75 to 84 Years | 186 | 12.5% |
| 85 Years and Over | 107 | 7.2% |
| Total | 1,487 | 100.0% |
Housing Finances in Coke County
Median Income by Occupancy in Coke County
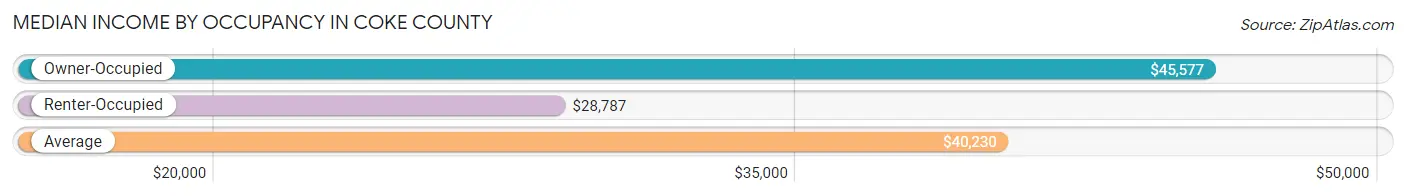
| Occupancy Type | # Households | Median Income |
| Owner-Occupied | 1,036 (69.7%) | $45,577 |
| Renter-Occupied | 451 (30.3%) | $28,787 |
| Average | 1,487 (100.0%) | $40,230 |
Occupancy by Householder Income Bracket in Coke County
| Income Bracket | Owner-occupied | Renter-occupied |
| Less than $5,000 | 55 (5.3%) | 37 (8.2%) |
| $5,000 to $9,999 | 12 (1.2%) | 0 (0.0%) |
| $10,000 to $14,999 | 66 (6.4%) | 90 (20.0%) |
| $15,000 to $19,999 | 50 (4.8%) | 31 (6.9%) |
| $20,000 to $24,999 | 60 (5.8%) | 50 (11.1%) |
| $25,000 to $34,999 | 174 (16.8%) | 37 (8.2%) |
| $35,000 to $49,999 | 136 (13.1%) | 79 (17.5%) |
| $50,000 to $74,999 | 138 (13.3%) | 48 (10.6%) |
| $75,000 to $99,999 | 125 (12.1%) | 31 (6.9%) |
| $100,000 to $149,999 | 153 (14.8%) | 13 (2.9%) |
| $150,000 or more | 67 (6.5%) | 35 (7.8%) |
| Total | 1,036 (100.0%) | 451 (100.0%) |
Monthly Housing Cost Tiers in Coke County
| Monthly Cost | Owner-occupied | Renter-occupied |
| Less than $300 | 191 (18.4%) | 59 (13.1%) |
| $300 to $499 | 270 (26.1%) | 79 (17.5%) |
| $500 to $799 | 304 (29.3%) | 91 (20.2%) |
| $800 to $999 | 118 (11.4%) | 89 (19.7%) |
| $1,000 to $1,499 | 85 (8.2%) | 37 (8.2%) |
| $1,500 to $1,999 | 45 (4.3%) | 2 (0.4%) |
| $2,000 to $2,499 | 20 (1.9%) | 0 (0.0%) |
| $2,500 to $2,999 | 0 (0.0%) | 0 (0.0%) |
| $3,000 or more | 3 (0.3%) | 0 (0.0%) |
| Total | 1,036 (100.0%) | 451 (100.0%) |
Physical Housing Characteristics in Coke County
Housing Structures in Coke County
| Structure Type | # Housing Units | % Housing Units |
| Single Unit, Detached | 1,078 | 72.5% |
| Single Unit, Attached | 55 | 3.7% |
| 2 Unit Apartments | 81 | 5.4% |
| 3 or 4 Unit Apartments | 0 | 0.0% |
| 5 to 9 Unit Apartments | 69 | 4.6% |
| 10 or more Apartments | 0 | 0.0% |
| Mobile Home / Other | 204 | 13.7% |
| Total | 1,487 | 100.0% |
Housing Structures by Occupancy in Coke County
| Structure Type | Owner-occupied | Renter-occupied |
| Single Unit, Detached | 851 (78.9%) | 227 (21.1%) |
| Single Unit, Attached | 21 (38.2%) | 34 (61.8%) |
| 2 Unit Apartments | 0 (0.0%) | 81 (100.0%) |
| 3 or 4 Unit Apartments | 0 (0.0%) | 0 (0.0%) |
| 5 to 9 Unit Apartments | 0 (0.0%) | 69 (100.0%) |
| 10 or more Apartments | 0 (0.0%) | 0 (0.0%) |
| Mobile Home / Other | 164 (80.4%) | 40 (19.6%) |
| Total | 1,036 (69.7%) | 451 (30.3%) |
Housing Structures by Number of Rooms in Coke County
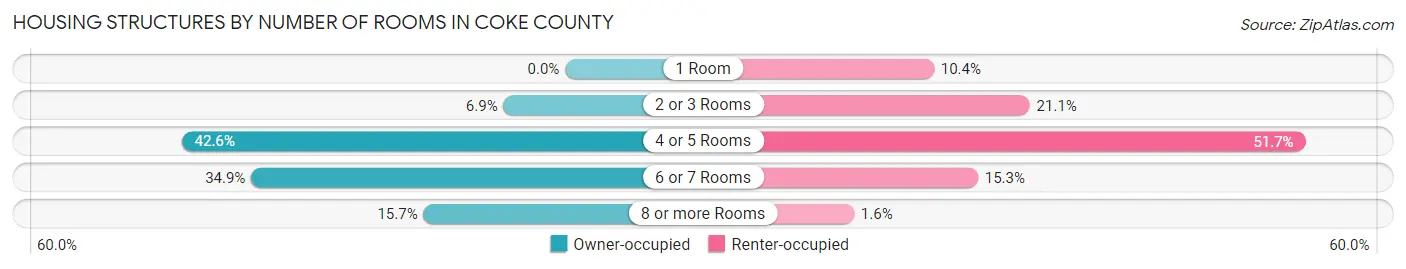
| Number of Rooms | Owner-occupied | Renter-occupied |
| 1 Room | 0 (0.0%) | 47 (10.4%) |
| 2 or 3 Rooms | 71 (6.9%) | 95 (21.1%) |
| 4 or 5 Rooms | 441 (42.6%) | 233 (51.7%) |
| 6 or 7 Rooms | 361 (34.8%) | 69 (15.3%) |
| 8 or more Rooms | 163 (15.7%) | 7 (1.5%) |
| Total | 1,036 (100.0%) | 451 (100.0%) |
Housing Structure by Heating Type in Coke County
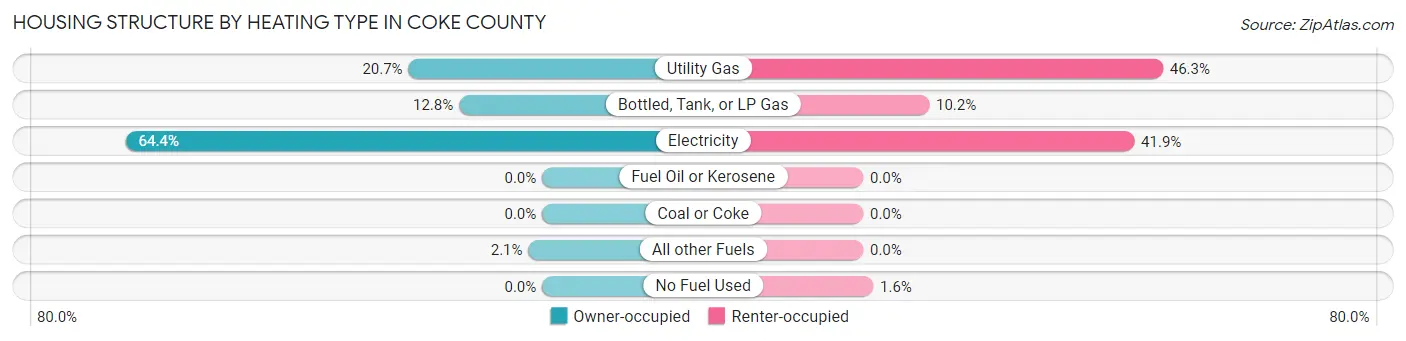
| Heating Type | Owner-occupied | Renter-occupied |
| Utility Gas | 214 (20.7%) | 209 (46.3%) |
| Bottled, Tank, or LP Gas | 133 (12.8%) | 46 (10.2%) |
| Electricity | 667 (64.4%) | 189 (41.9%) |
| Fuel Oil or Kerosene | 0 (0.0%) | 0 (0.0%) |
| Coal or Coke | 0 (0.0%) | 0 (0.0%) |
| All other Fuels | 22 (2.1%) | 0 (0.0%) |
| No Fuel Used | 0 (0.0%) | 7 (1.5%) |
| Total | 1,036 (100.0%) | 451 (100.0%) |
Household Vehicle Usage in Coke County
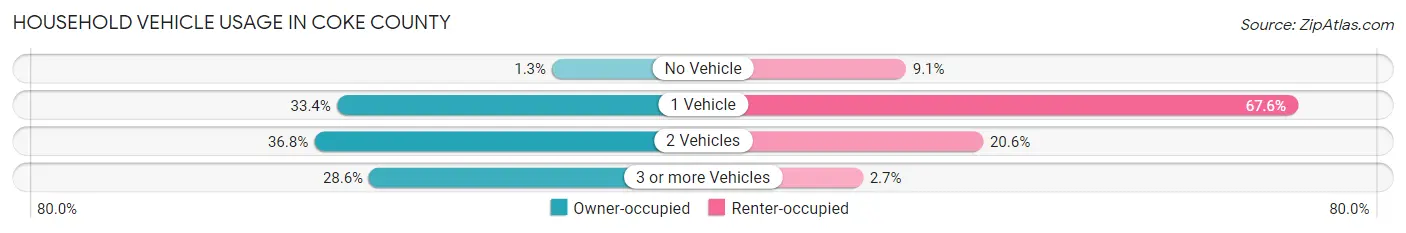
| Vehicles per Household | Owner-occupied | Renter-occupied |
| No Vehicle | 13 (1.3%) | 41 (9.1%) |
| 1 Vehicle | 346 (33.4%) | 305 (67.6%) |
| 2 Vehicles | 381 (36.8%) | 93 (20.6%) |
| 3 or more Vehicles | 296 (28.6%) | 12 (2.7%) |
| Total | 1,036 (100.0%) | 451 (100.0%) |
Real Estate & Mortgages in Coke County
Real Estate and Mortgage Overview in Coke County
| Characteristic | Without Mortgage | With Mortgage |
| Housing Units | 742 | 294 |
| Median Property Value | $95,000 | $94,800 |
| Median Household Income | $42,500 | $26 |
| Monthly Housing Costs | $445 | $3 |
| Real Estate Taxes | $1,270 | $39 |
Property Value by Mortgage Status in Coke County
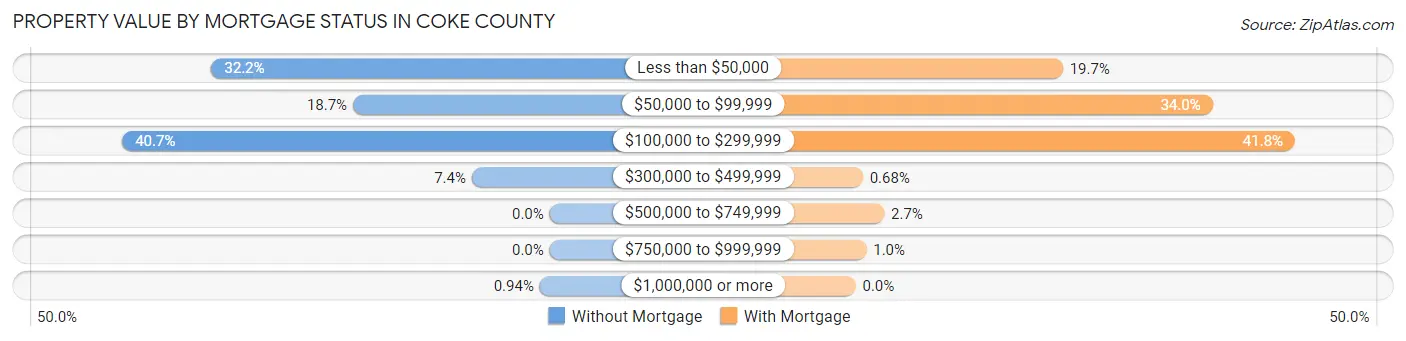
| Property Value | Without Mortgage | With Mortgage |
| Less than $50,000 | 239 (32.2%) | 58 (19.7%) |
| $50,000 to $99,999 | 139 (18.7%) | 100 (34.0%) |
| $100,000 to $299,999 | 302 (40.7%) | 123 (41.8%) |
| $300,000 to $499,999 | 55 (7.4%) | 2 (0.7%) |
| $500,000 to $749,999 | 0 (0.0%) | 8 (2.7%) |
| $750,000 to $999,999 | 0 (0.0%) | 3 (1.0%) |
| $1,000,000 or more | 7 (0.9%) | 0 (0.0%) |
| Total | 742 (100.0%) | 294 (100.0%) |
Household Income by Mortgage Status in Coke County
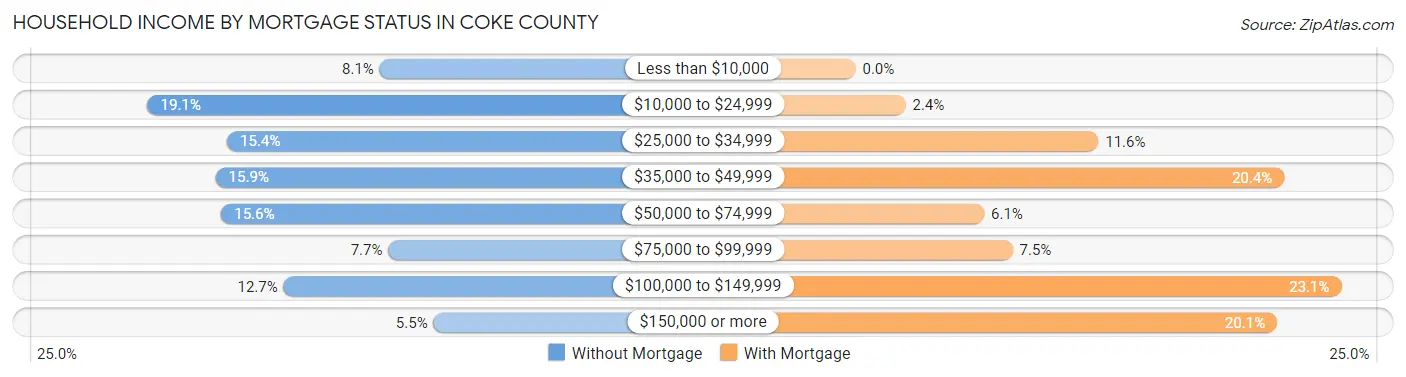
| Household Income | Without Mortgage | With Mortgage |
| Less than $10,000 | 60 (8.1%) | 0 (0.0%) |
| $10,000 to $24,999 | 142 (19.1%) | 7 (2.4%) |
| $25,000 to $34,999 | 114 (15.4%) | 34 (11.6%) |
| $35,000 to $49,999 | 118 (15.9%) | 60 (20.4%) |
| $50,000 to $74,999 | 116 (15.6%) | 18 (6.1%) |
| $75,000 to $99,999 | 57 (7.7%) | 22 (7.5%) |
| $100,000 to $149,999 | 94 (12.7%) | 68 (23.1%) |
| $150,000 or more | 41 (5.5%) | 59 (20.1%) |
| Total | 742 (100.0%) | 294 (100.0%) |
Property Value to Household Income Ratio in Coke County
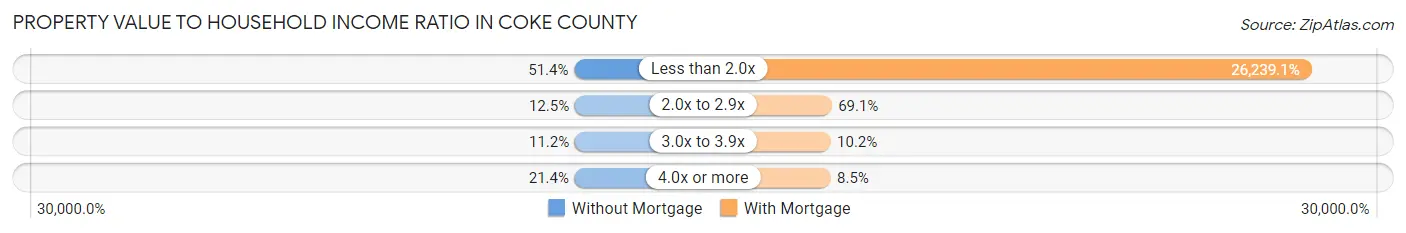
| Value-to-Income Ratio | Without Mortgage | With Mortgage |
| Less than 2.0x | 381 (51.3%) | 77,143 (26,239.1%) |
| 2.0x to 2.9x | 93 (12.5%) | 203 (69.1%) |
| 3.0x to 3.9x | 83 (11.2%) | 30 (10.2%) |
| 4.0x or more | 159 (21.4%) | 25 (8.5%) |
| Total | 742 (100.0%) | 294 (100.0%) |
Real Estate Taxes by Mortgage Status in Coke County
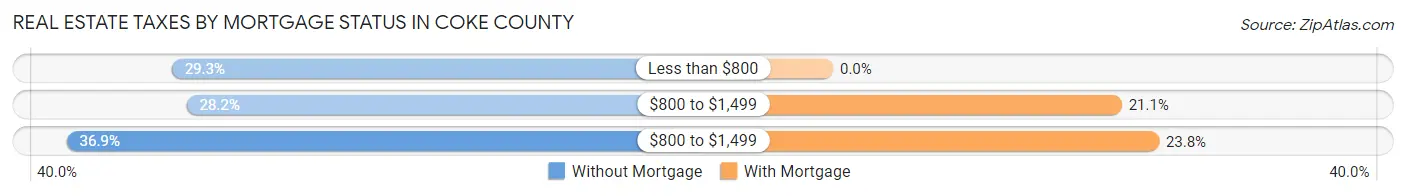
| Property Taxes | Without Mortgage | With Mortgage |
| Less than $800 | 217 (29.2%) | 0 (0.0%) |
| $800 to $1,499 | 209 (28.2%) | 62 (21.1%) |
| $800 to $1,499 | 274 (36.9%) | 70 (23.8%) |
| Total | 742 (100.0%) | 294 (100.0%) |
Health & Disability in Coke County
Health Insurance Coverage by Age in Coke County
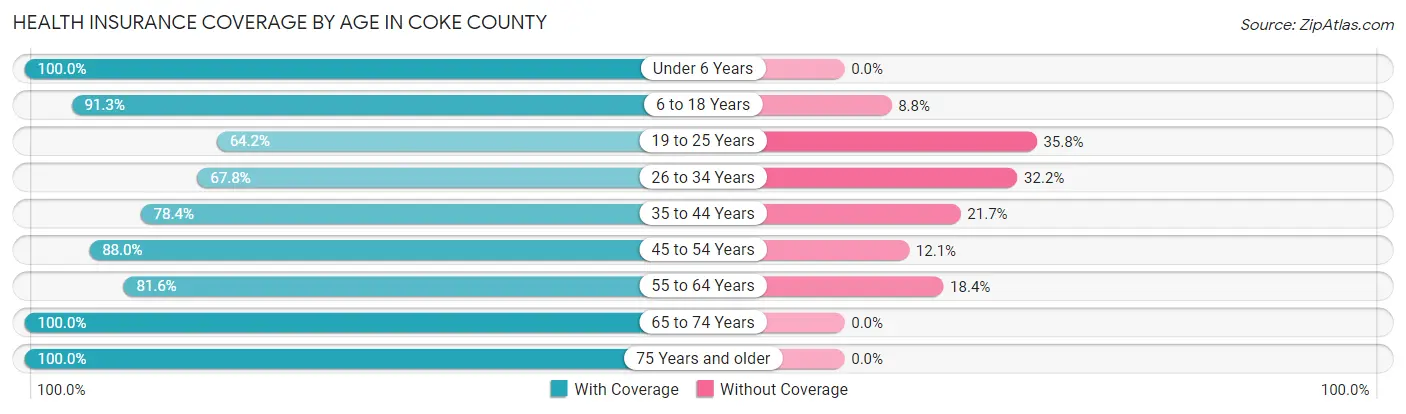
| Age Bracket | With Coverage | Without Coverage |
| Under 6 Years | 173 (100.0%) | 0 (0.0%) |
| 6 to 18 Years | 490 (91.2%) | 47 (8.7%) |
| 19 to 25 Years | 120 (64.2%) | 67 (35.8%) |
| 26 to 34 Years | 185 (67.8%) | 88 (32.2%) |
| 35 to 44 Years | 275 (78.3%) | 76 (21.6%) |
| 45 to 54 Years | 321 (87.9%) | 44 (12.0%) |
| 55 to 64 Years | 376 (81.6%) | 85 (18.4%) |
| 65 to 74 Years | 504 (100.0%) | 0 (0.0%) |
| 75 Years and older | 355 (100.0%) | 0 (0.0%) |
| Total | 2,799 (87.3%) | 407 (12.7%) |
Health Insurance Coverage by Citizenship Status in Coke County
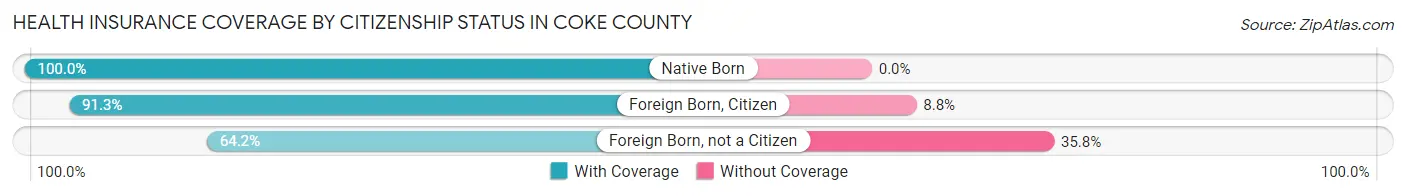
| Citizenship Status | With Coverage | Without Coverage |
| Native Born | 173 (100.0%) | 0 (0.0%) |
| Foreign Born, Citizen | 490 (91.2%) | 47 (8.7%) |
| Foreign Born, not a Citizen | 120 (64.2%) | 67 (35.8%) |
Health Insurance Coverage by Household Income in Coke County
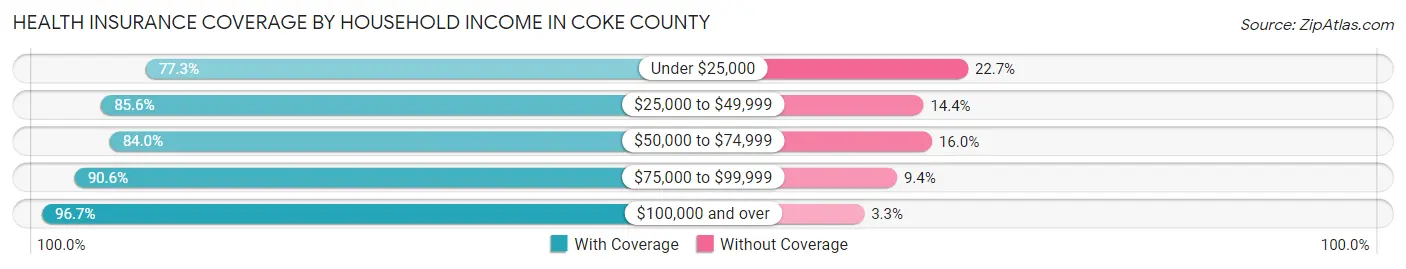
| Household Income | With Coverage | Without Coverage |
| Under $25,000 | 453 (77.3%) | 133 (22.7%) |
| $25,000 to $49,999 | 698 (85.6%) | 117 (14.4%) |
| $50,000 to $74,999 | 453 (84.0%) | 86 (16.0%) |
| $75,000 to $99,999 | 395 (90.6%) | 41 (9.4%) |
| $100,000 and over | 798 (96.7%) | 27 (3.3%) |
Public vs Private Health Insurance Coverage by Age in Coke County
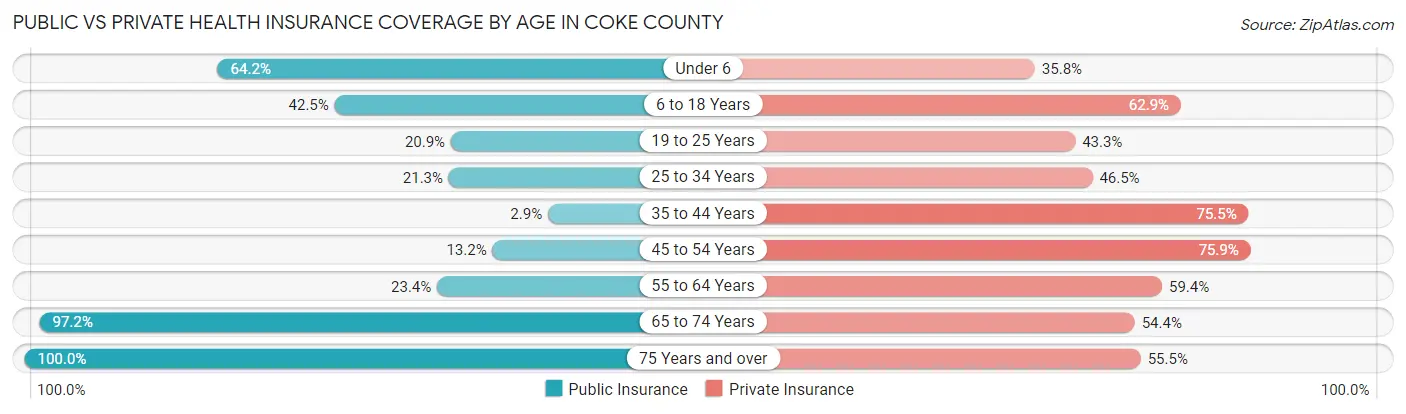
| Age Bracket | Public Insurance | Private Insurance |
| Under 6 | 111 (64.2%) | 62 (35.8%) |
| 6 to 18 Years | 228 (42.5%) | 338 (62.9%) |
| 19 to 25 Years | 39 (20.9%) | 81 (43.3%) |
| 25 to 34 Years | 58 (21.2%) | 127 (46.5%) |
| 35 to 44 Years | 10 (2.9%) | 265 (75.5%) |
| 45 to 54 Years | 48 (13.2%) | 277 (75.9%) |
| 55 to 64 Years | 108 (23.4%) | 274 (59.4%) |
| 65 to 74 Years | 490 (97.2%) | 274 (54.4%) |
| 75 Years and over | 355 (100.0%) | 197 (55.5%) |
| Total | 1,447 (45.1%) | 1,895 (59.1%) |
Disability Status by Sex by Age in Coke County
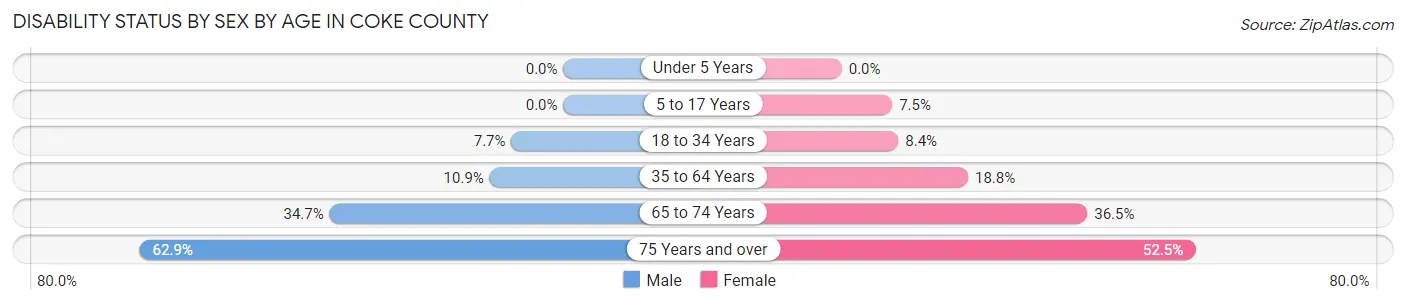
| Age Bracket | Male | Female |
| Under 5 Years | 0 (0.0%) | 0 (0.0%) |
| 5 to 17 Years | 0 (0.0%) | 17 (7.5%) |
| 18 to 34 Years | 19 (7.7%) | 22 (8.4%) |
| 35 to 64 Years | 64 (10.9%) | 111 (18.8%) |
| 65 to 74 Years | 75 (34.7%) | 105 (36.5%) |
| 75 Years and over | 95 (62.9%) | 107 (52.4%) |
Disability Class by Sex by Age in Coke County
Disability Class: Hearing Difficulty
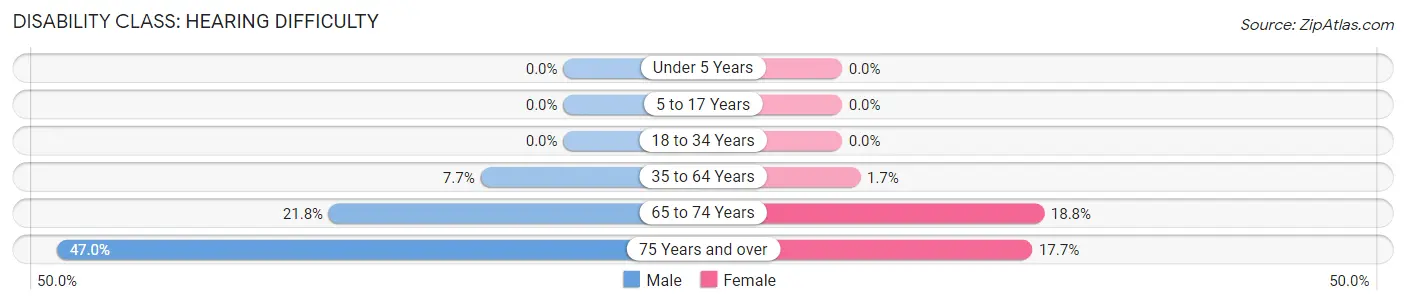
| Age Bracket | Male | Female |
| Under 5 Years | 0 (0.0%) | 0 (0.0%) |
| 5 to 17 Years | 0 (0.0%) | 0 (0.0%) |
| 18 to 34 Years | 0 (0.0%) | 0 (0.0%) |
| 35 to 64 Years | 45 (7.7%) | 10 (1.7%) |
| 65 to 74 Years | 47 (21.8%) | 54 (18.8%) |
| 75 Years and over | 71 (47.0%) | 36 (17.6%) |
Disability Class: Vision Difficulty
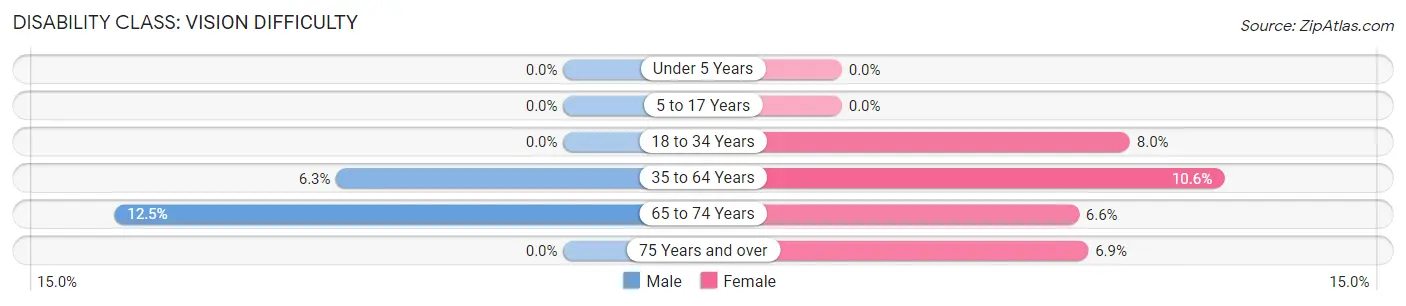
| Age Bracket | Male | Female |
| Under 5 Years | 0 (0.0%) | 0 (0.0%) |
| 5 to 17 Years | 0 (0.0%) | 0 (0.0%) |
| 18 to 34 Years | 0 (0.0%) | 21 (8.0%) |
| 35 to 64 Years | 37 (6.3%) | 63 (10.6%) |
| 65 to 74 Years | 27 (12.5%) | 19 (6.6%) |
| 75 Years and over | 0 (0.0%) | 14 (6.9%) |
Disability Class: Cognitive Difficulty
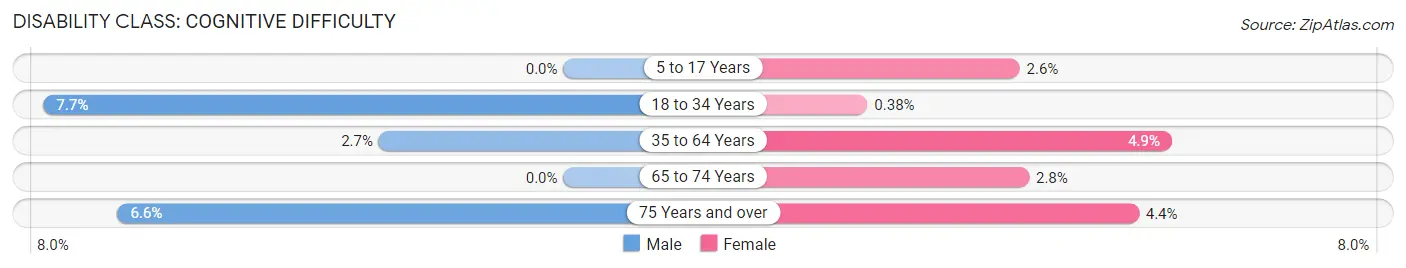
| Age Bracket | Male | Female |
| 5 to 17 Years | 0 (0.0%) | 6 (2.6%) |
| 18 to 34 Years | 19 (7.7%) | 1 (0.4%) |
| 35 to 64 Years | 16 (2.7%) | 29 (4.9%) |
| 65 to 74 Years | 0 (0.0%) | 8 (2.8%) |
| 75 Years and over | 10 (6.6%) | 9 (4.4%) |
Disability Class: Ambulatory Difficulty
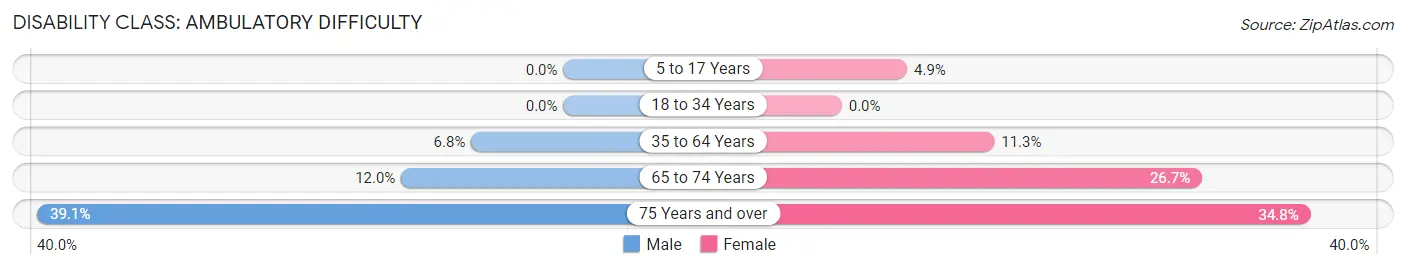
| Age Bracket | Male | Female |
| 5 to 17 Years | 0 (0.0%) | 11 (4.9%) |
| 18 to 34 Years | 0 (0.0%) | 0 (0.0%) |
| 35 to 64 Years | 40 (6.8%) | 67 (11.3%) |
| 65 to 74 Years | 26 (12.0%) | 77 (26.7%) |
| 75 Years and over | 59 (39.1%) | 71 (34.8%) |
Disability Class: Self-Care Difficulty
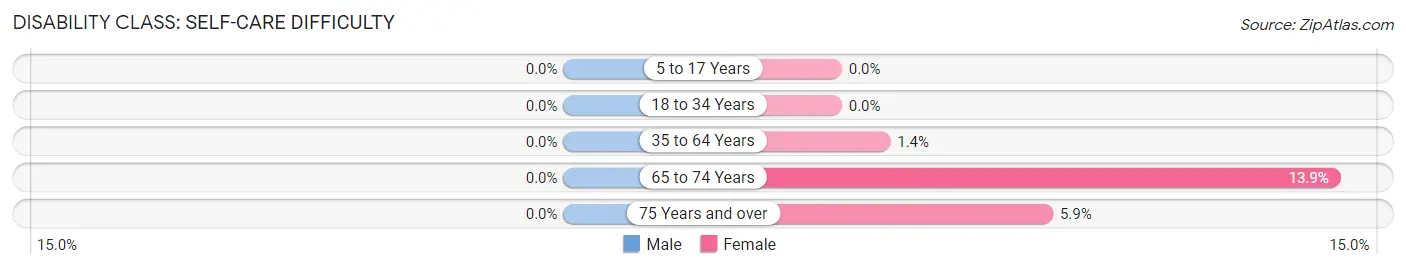
| Age Bracket | Male | Female |
| 5 to 17 Years | 0 (0.0%) | 0 (0.0%) |
| 18 to 34 Years | 0 (0.0%) | 0 (0.0%) |
| 35 to 64 Years | 0 (0.0%) | 8 (1.3%) |
| 65 to 74 Years | 0 (0.0%) | 40 (13.9%) |
| 75 Years and over | 0 (0.0%) | 12 (5.9%) |
Technology Access in Coke County
Computing Device Access in Coke County
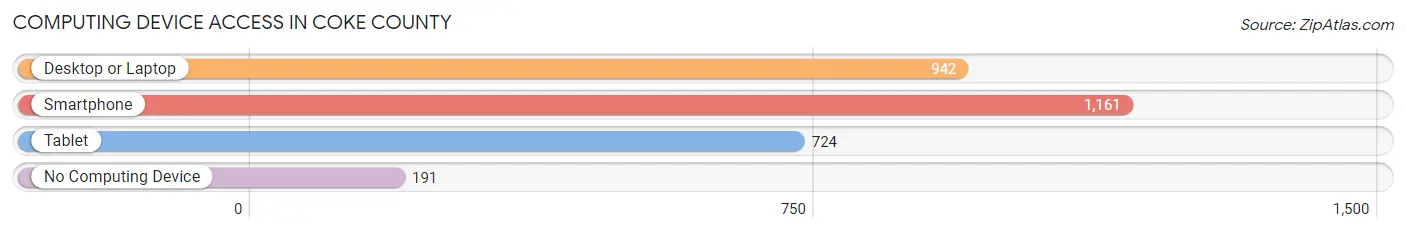
| Device Type | # Households | % Households |
| Desktop or Laptop | 942 | 63.3% |
| Smartphone | 1,161 | 78.1% |
| Tablet | 724 | 48.7% |
| No Computing Device | 191 | 12.8% |
| Total | 1,487 | 100.0% |
Internet Access in Coke County
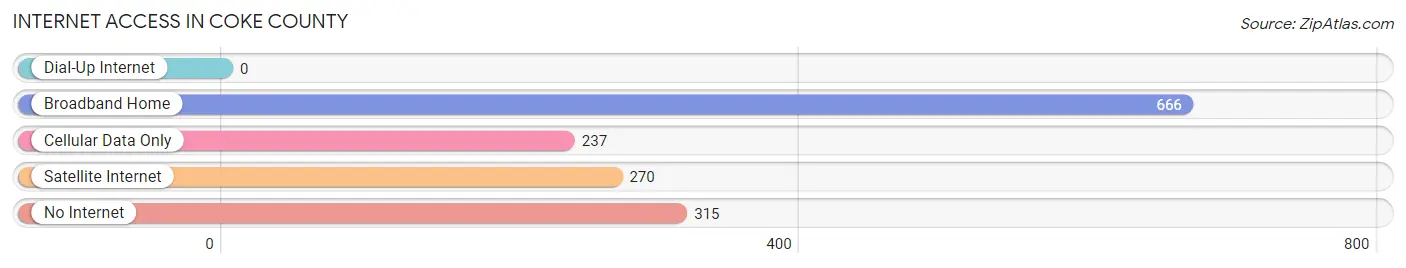
| Internet Type | # Households | % Households |
| Dial-Up Internet | 0 | 0.0% |
| Broadband Home | 666 | 44.8% |
| Cellular Data Only | 237 | 15.9% |
| Satellite Internet | 270 | 18.2% |
| No Internet | 315 | 21.2% |
| Total | 1,487 | 100.0% |
Coke County Summary
Coke County is located in the western part of the state of Texas, in the United States. It is part of the Big Country region of the state and is bordered by Tom Green County to the north, Runnels County to the east, Concho County to the south, and Sterling County to the west. The county seat is Robert Lee, and the largest city is Bronte.
History
Coke County was established in 1889 from Tom Green County. It was named for Richard Coke, the fifteenth governor of Texas. The county was originally part of the Edwards Plateau, and the area was home to several Native American tribes, including the Comanche, Apache, and Kiowa.
The first settlers in the area were ranchers, who began arriving in the late 1800s. The first town in the county was Robert Lee, which was established in 1891. The town was named for Robert E. Lee, the Confederate general.
In the early 1900s, the county began to develop as an agricultural center. Cotton was the main crop, and the county was home to several cotton gins. The county also had several oil and gas wells, which were developed in the 1920s.
Geography
Coke County covers an area of 1,072 square miles. The terrain is mostly flat, with some rolling hills in the western part of the county. The county is part of the Edwards Plateau, and the soil is mostly sandy loam.
The county is drained by the Colorado River, which forms the northern border of the county. The Concho River also flows through the county, and there are several small lakes and reservoirs in the area.
The climate is semi-arid, with hot summers and mild winters. The average annual temperature is 68 degrees Fahrenheit, and the average annual precipitation is 19 inches.
Economy
The economy of Coke County is largely based on agriculture and oil and gas production. Cotton is the main crop, and the county is also home to several cattle ranches.
Oil and gas production is also an important part of the economy. There are several oil and gas wells in the county, and the county is home to several oil and gas companies.
The county also has a growing tourism industry. The county is home to several state parks, including the San Angelo State Park and the Colorado Bend State Park.
Demographics
As of the 2010 census, the population of Coke County was 3,320. The population is mostly white (90.2%), with small percentages of African American (3.2%), Hispanic (3.1%), and Native American (1.2%) residents.
The median household income in the county is $37,917, and the median family income is $45,938. The per capita income is $19,845. The unemployment rate is 4.2%.
The largest city in the county is Bronte, with a population of 1,092. Other cities in the county include Robert Lee (population 890) and Tennyson (population 538).
Common Questions
What is Per Capita Income in Coke County?
Per Capita income in Coke County is $28,397.
What is the Median Family Income in Coke County?
Median Family Income in Coke County is $69,609.
What is the Median Household income in Coke County?
Median Household Income in Coke County is $40,230.
What is Income or Wage Gap in Coke County?
Income or Wage Gap in Coke County is 48.4%.
Women in Coke County earn 51.6 cents for every dollar earned by a man.
What is Inequality or Gini Index in Coke County?
Inequality or Gini Index in Coke County is 0.47.
What is the Total Population of Coke County?
Total Population of Coke County is 3,305.
What is the Total Male Population of Coke County?
Total Male Population of Coke County is 1,645.
What is the Total Female Population of Coke County?
Total Female Population of Coke County is 1,660.
What is the Ratio of Males per 100 Females in Coke County?
There are 99.10 Males per 100 Females in Coke County.
What is the Ratio of Females per 100 Males in Coke County?
There are 100.91 Females per 100 Males in Coke County.
What is the Median Population Age in Coke County?
Median Population Age in Coke County is 47.1 Years.
What is the Average Family Size in Coke County
Average Family Size in Coke County is 2.8 People.
What is the Average Household Size in Coke County
Average Household Size in Coke County is 2.1 People.
How Large is the Labor Force in Coke County?
There are 1,384 People in the Labor Forcein in Coke County.
What is the Percentage of People in the Labor Force in Coke County?
52.0% of People are in the Labor Force in Coke County.
What is the Unemployment Rate in Coke County?
Unemployment Rate in Coke County is 3.0%.