Cochran County, TX Map & Demographics
Cochran County Map
Cochran County Overview
$23,748
PER CAPITA INCOME
$53,068
AVG FAMILY INCOME
$41,597
AVG HOUSEHOLD INCOME
40.4%
WAGE / INCOME GAP [ % ]
59.6¢/ $1
WAGE / INCOME GAP [ $ ]
0.47
INEQUALITY / GINI INDEX
2,529
TOTAL POPULATION
1,305
MALE POPULATION
1,224
FEMALE POPULATION
106.62
MALES / 100 FEMALES
93.79
FEMALES / 100 MALES
37.4
MEDIAN AGE
3.0
AVG FAMILY SIZE
2.5
AVG HOUSEHOLD SIZE
1,152
LABOR FORCE [ PEOPLE ]
59.8%
PERCENT IN LABOR FORCE
7.1%
UNEMPLOYMENT RATE
Cochran County Area Codes
Income in Cochran County
Income Overview in Cochran County
Per Capita Income in Cochran County is $23,748, while median incomes of families and households are $53,068 and $41,597 respectively.
| Characteristic | Number | Measure |
| Per Capita Income | 2,529 | $23,748 |
| Median Family Income | 648 | $53,068 |
| Mean Family Income | 648 | $71,178 |
| Median Household Income | 959 | $41,597 |
| Mean Household Income | 959 | $59,334 |
| Income Deficit | 648 | $0 |
| Wage / Income Gap (%) | 2,529 | 40.36% |
| Wage / Income Gap ($) | 2,529 | 59.64¢ per $1 |
| Gini / Inequality Index | 2,529 | 0.47 |
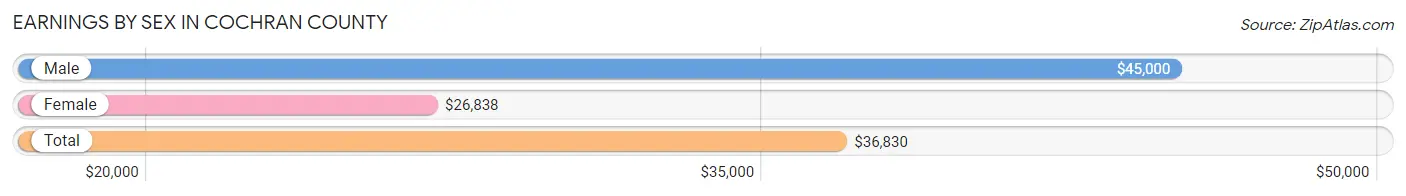
Earnings by Sex in Cochran County
Average Earnings in Cochran County are $36,830, $45,000 for men and $26,838 for women, a difference of 40.4%.
| Sex | Number | Average Earnings |
| Male | 664 (57.0%) | $45,000 |
| Female | 502 (43.0%) | $26,838 |
| Total | 1,166 (100.0%) | $36,830 |
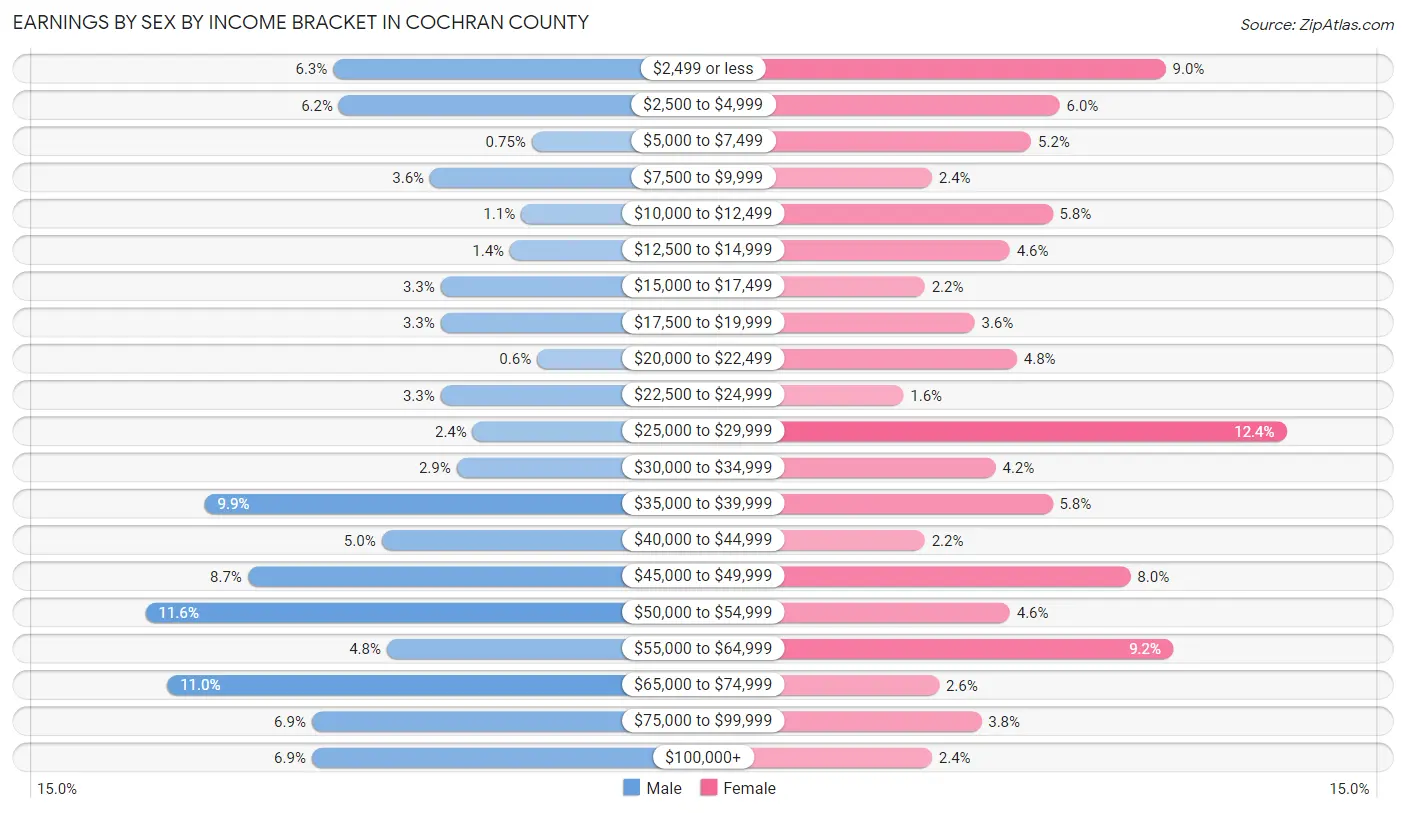
Earnings by Sex by Income Bracket in Cochran County
The most common earnings brackets in Cochran County are $50,000 to $54,999 for men (77 | 11.6%) and $25,000 to $29,999 for women (62 | 12.3%).
| Income | Male | Female |
| $2,499 or less | 42 (6.3%) | 45 (9.0%) |
| $2,500 to $4,999 | 41 (6.2%) | 30 (6.0%) |
| $5,000 to $7,499 | 5 (0.7%) | 26 (5.2%) |
| $7,500 to $9,999 | 24 (3.6%) | 12 (2.4%) |
| $10,000 to $12,499 | 7 (1.1%) | 29 (5.8%) |
| $12,500 to $14,999 | 9 (1.4%) | 23 (4.6%) |
| $15,000 to $17,499 | 22 (3.3%) | 11 (2.2%) |
| $17,500 to $19,999 | 22 (3.3%) | 18 (3.6%) |
| $20,000 to $22,499 | 4 (0.6%) | 24 (4.8%) |
| $22,500 to $24,999 | 22 (3.3%) | 8 (1.6%) |
| $25,000 to $29,999 | 16 (2.4%) | 62 (12.3%) |
| $30,000 to $34,999 | 19 (2.9%) | 21 (4.2%) |
| $35,000 to $39,999 | 66 (9.9%) | 29 (5.8%) |
| $40,000 to $44,999 | 33 (5.0%) | 11 (2.2%) |
| $45,000 to $49,999 | 58 (8.7%) | 40 (8.0%) |
| $50,000 to $54,999 | 77 (11.6%) | 23 (4.6%) |
| $55,000 to $64,999 | 32 (4.8%) | 46 (9.2%) |
| $65,000 to $74,999 | 73 (11.0%) | 13 (2.6%) |
| $75,000 to $99,999 | 46 (6.9%) | 19 (3.8%) |
| $100,000+ | 46 (6.9%) | 12 (2.4%) |
| Total | 664 (100.0%) | 502 (100.0%) |
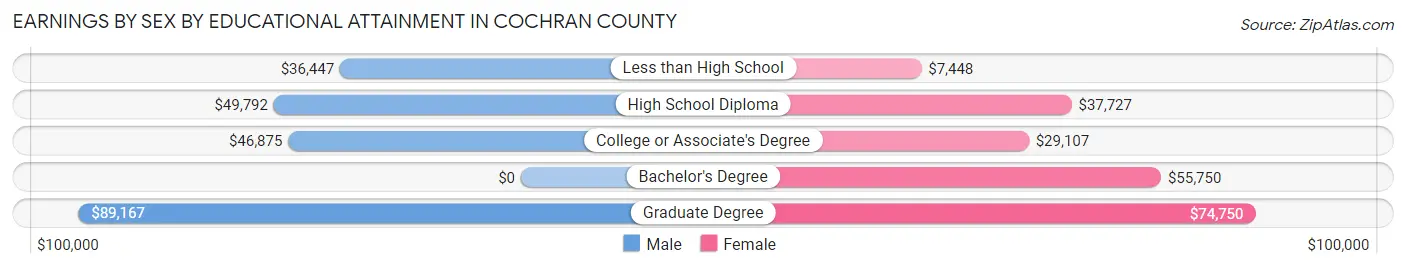
Earnings by Sex by Educational Attainment in Cochran County
Average earnings in Cochran County are $48,239 for men and $29,107 for women, a difference of 39.7%. Men with an educational attainment of graduate degree enjoy the highest average annual earnings of $89,167, while those with less than high school education earn the least with $36,447. Women with an educational attainment of graduate degree earn the most with the average annual earnings of $74,750, while those with less than high school education have the smallest earnings of $7,448.
| Educational Attainment | Male Income | Female Income |
| Less than High School | $36,447 | $7,448 |
| High School Diploma | $49,792 | $37,727 |
| College or Associate's Degree | $46,875 | $29,107 |
| Bachelor's Degree | - | - |
| Graduate Degree | $89,167 | $74,750 |
| Total | $48,239 | $29,107 |
Family Income in Cochran County
Family Income Brackets in Cochran County
According to the Cochran County family income data, there are 127 families falling into the $35,000 to $49,999 income range, which is the most common income bracket and makes up 19.6% of all families. Conversely, the $200,000+ income bracket is the least frequent group with only 12 families (1.8%) belonging to this category.
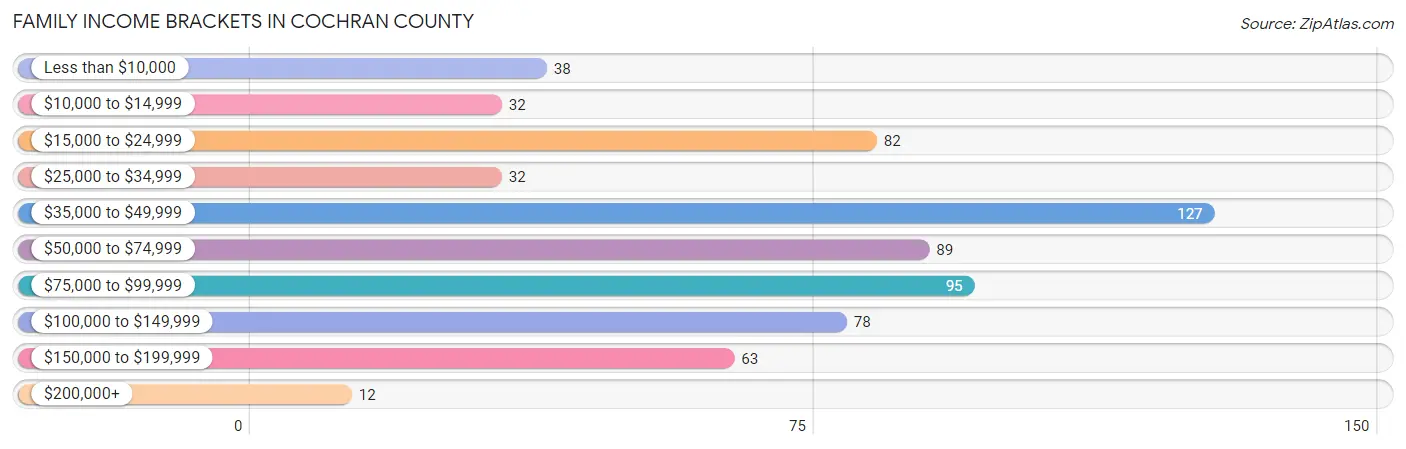
| Income Bracket | # Families | % Families |
| Less than $10,000 | 38 | 5.9% |
| $10,000 to $14,999 | 32 | 4.9% |
| $15,000 to $24,999 | 82 | 12.7% |
| $25,000 to $34,999 | 32 | 4.9% |
| $35,000 to $49,999 | 127 | 19.6% |
| $50,000 to $74,999 | 89 | 13.7% |
| $75,000 to $99,999 | 95 | 14.7% |
| $100,000 to $149,999 | 78 | 12.0% |
| $150,000 to $199,999 | 63 | 9.7% |
| $200,000+ | 12 | 1.9% |
Family Income by Famaliy Size in Cochran County
3-person families (149 | 23.0%) account for the highest median family income in Cochran County with $92,604 per family, while 3-person families (149 | 23.0%) have the highest median income of $30,868 per family member.
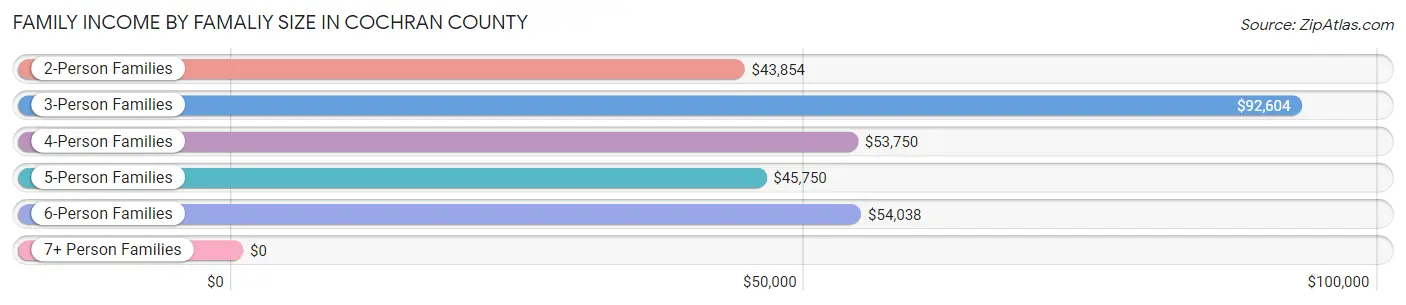
| Income Bracket | # Families | Median Income |
| 2-Person Families | 259 (40.0%) | $43,854 |
| 3-Person Families | 149 (23.0%) | $92,604 |
| 4-Person Families | 127 (19.6%) | $53,750 |
| 5-Person Families | 60 (9.3%) | $45,750 |
| 6-Person Families | 30 (4.6%) | $54,038 |
| 7+ Person Families | 23 (3.5%) | $0 |
| Total | 648 (100.0%) | $53,068 |
Family Income by Number of Earners in Cochran County
The median family income in Cochran County is $53,068, with families comprising 3+ earners (45) having the highest median family income of $100,417, while families with no earners (115) have the lowest median family income of $29,531, accounting for 6.9% and 17.7% of families, respectively.
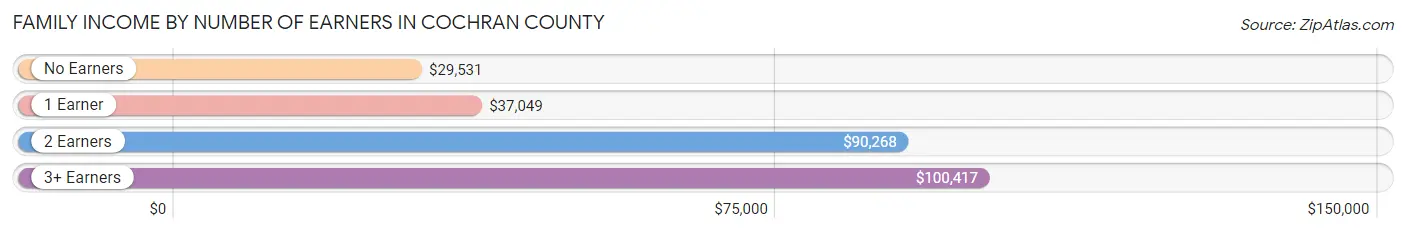
| Number of Earners | # Families | Median Income |
| No Earners | 115 (17.7%) | $29,531 |
| 1 Earner | 233 (36.0%) | $37,049 |
| 2 Earners | 255 (39.4%) | $90,268 |
| 3+ Earners | 45 (6.9%) | $100,417 |
| Total | 648 (100.0%) | $53,068 |
Household Income in Cochran County
Household Income Brackets in Cochran County
With 187 households falling in the category, the $35,000 to $49,999 income range is the most frequent in Cochran County, accounting for 19.5% of all households. In contrast, only 29 households (3.0%) fall into the $200,000+ income bracket, making it the least populous group.
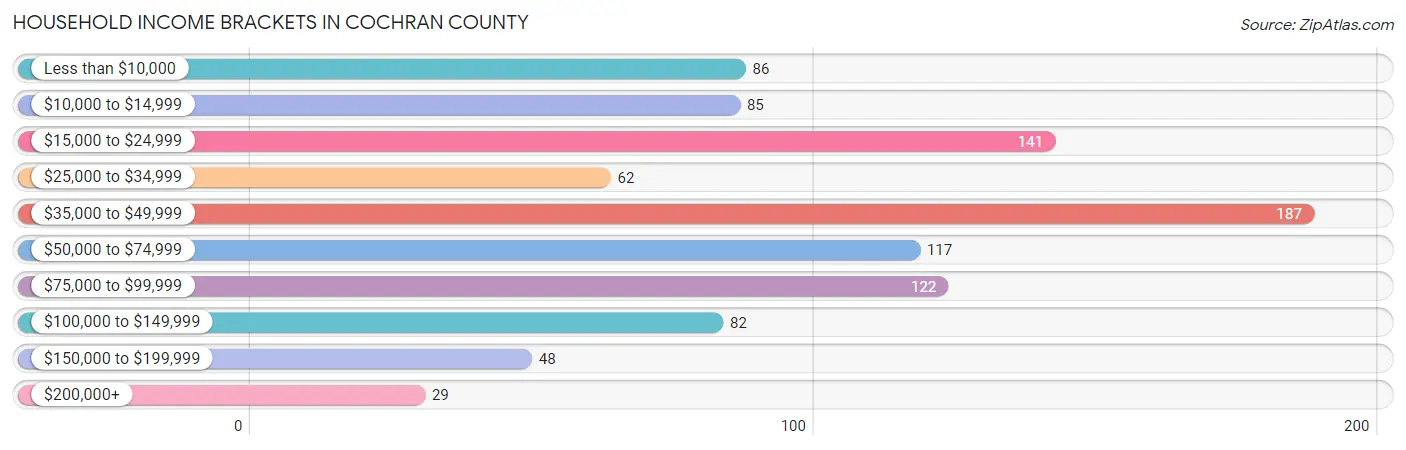
| Income Bracket | # Households | % Households |
| Less than $10,000 | 86 | 9.0% |
| $10,000 to $14,999 | 85 | 8.9% |
| $15,000 to $24,999 | 141 | 14.7% |
| $25,000 to $34,999 | 62 | 6.5% |
| $35,000 to $49,999 | 187 | 19.5% |
| $50,000 to $74,999 | 117 | 12.2% |
| $75,000 to $99,999 | 122 | 12.7% |
| $100,000 to $149,999 | 82 | 8.6% |
| $150,000 to $199,999 | 48 | 5.0% |
| $200,000+ | 29 | 3.0% |
Household Income by Householder Age in Cochran County
The median household income in Cochran County is $41,597, with the highest median household income of $54,904 found in the 45 to 64 years age bracket for the primary householder. A total of 306 households (31.9%) fall into this category. Meanwhile, the 65+ years age bracket for the primary householder has the lowest median household income of $22,813, with 258 households (26.9%) in this group.
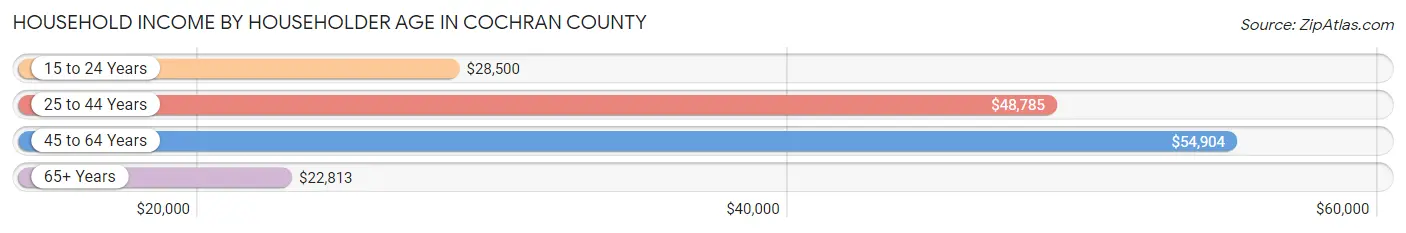
| Income Bracket | # Households | Median Income |
| 15 to 24 Years | 14 (1.5%) | $28,500 |
| 25 to 44 Years | 381 (39.7%) | $48,785 |
| 45 to 64 Years | 306 (31.9%) | $54,904 |
| 65+ Years | 258 (26.9%) | $22,813 |
| Total | 959 (100.0%) | $41,597 |
Poverty in Cochran County
Income Below Poverty by Sex and Age in Cochran County
With 26.4% poverty level for males and 25.2% for females among the residents of Cochran County, 16 and 17 year old males and 5 year old females are the most vulnerable to poverty, with 22 males (78.6%) and 11 females (64.7%) in their respective age groups living below the poverty level.
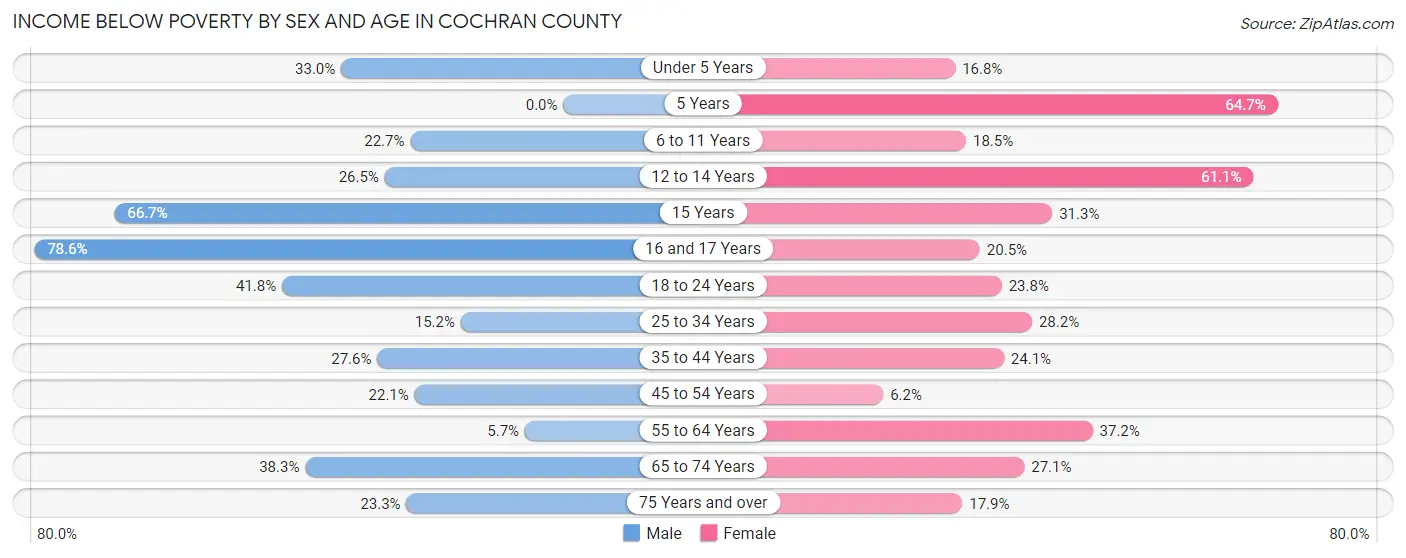
| Age Bracket | Male | Female |
| Under 5 Years | 33 (33.0%) | 16 (16.8%) |
| 5 Years | 0 (0.0%) | 11 (64.7%) |
| 6 to 11 Years | 30 (22.7%) | 19 (18.4%) |
| 12 to 14 Years | 13 (26.5%) | 33 (61.1%) |
| 15 Years | 12 (66.7%) | 5 (31.2%) |
| 16 and 17 Years | 22 (78.6%) | 8 (20.5%) |
| 18 to 24 Years | 33 (41.8%) | 19 (23.7%) |
| 25 to 34 Years | 23 (15.2%) | 48 (28.2%) |
| 35 to 44 Years | 71 (27.6%) | 39 (24.1%) |
| 45 to 54 Years | 19 (22.1%) | 8 (6.1%) |
| 55 to 64 Years | 8 (5.7%) | 54 (37.2%) |
| 65 to 74 Years | 46 (38.3%) | 29 (27.1%) |
| 75 Years and over | 24 (23.3%) | 17 (17.9%) |
| Total | 334 (26.4%) | 306 (25.2%) |
Income Above Poverty by Sex and Age in Cochran County
According to the poverty statistics in Cochran County, males aged 55 to 64 years and females aged 45 to 54 years are the age groups that are most secure financially, with 94.3% of males and 93.9% of females in these age groups living above the poverty line.
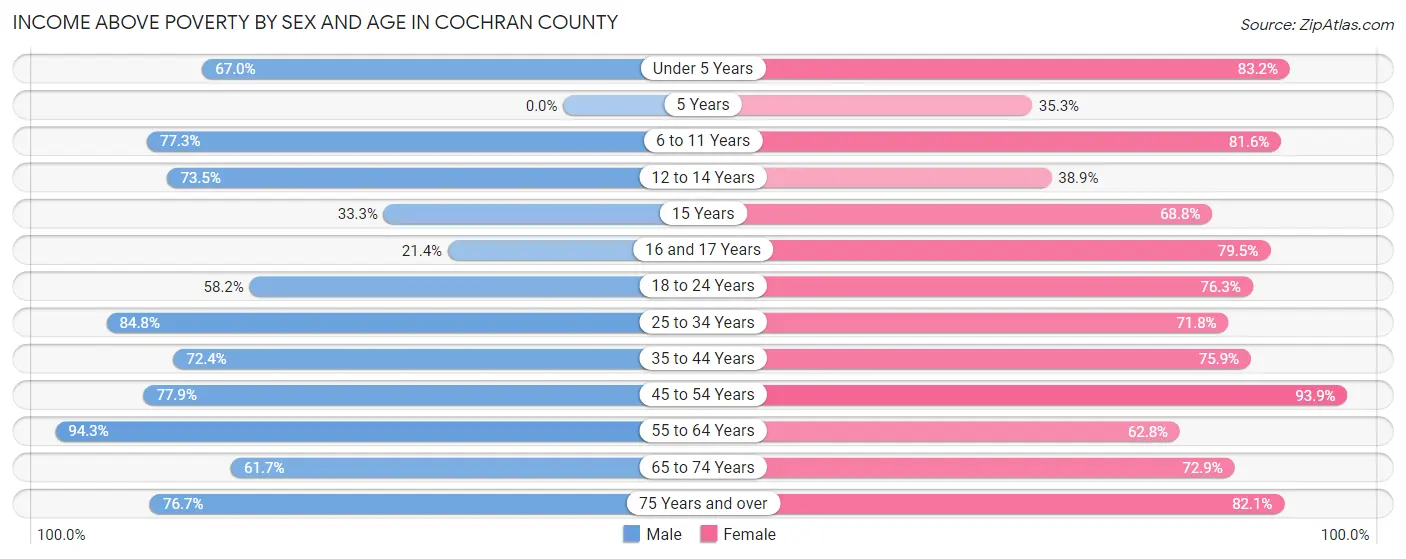
| Age Bracket | Male | Female |
| Under 5 Years | 67 (67.0%) | 79 (83.2%) |
| 5 Years | 0 (0.0%) | 6 (35.3%) |
| 6 to 11 Years | 102 (77.3%) | 84 (81.6%) |
| 12 to 14 Years | 36 (73.5%) | 21 (38.9%) |
| 15 Years | 6 (33.3%) | 11 (68.8%) |
| 16 and 17 Years | 6 (21.4%) | 31 (79.5%) |
| 18 to 24 Years | 46 (58.2%) | 61 (76.2%) |
| 25 to 34 Years | 128 (84.8%) | 122 (71.8%) |
| 35 to 44 Years | 186 (72.4%) | 123 (75.9%) |
| 45 to 54 Years | 67 (77.9%) | 122 (93.9%) |
| 55 to 64 Years | 132 (94.3%) | 91 (62.8%) |
| 65 to 74 Years | 74 (61.7%) | 78 (72.9%) |
| 75 Years and over | 79 (76.7%) | 78 (82.1%) |
| Total | 929 (73.6%) | 907 (74.8%) |
Income Below Poverty Among Married-Couple Families in Cochran County
The poverty statistics for married-couple families in Cochran County show that 14.4% or 64 of the total 445 families live below the poverty line. Families with 5 or more children have the highest poverty rate of 80.0%, comprising of 16 families. On the other hand, families with no children have the lowest poverty rate of 3.8%, which includes 8 families.
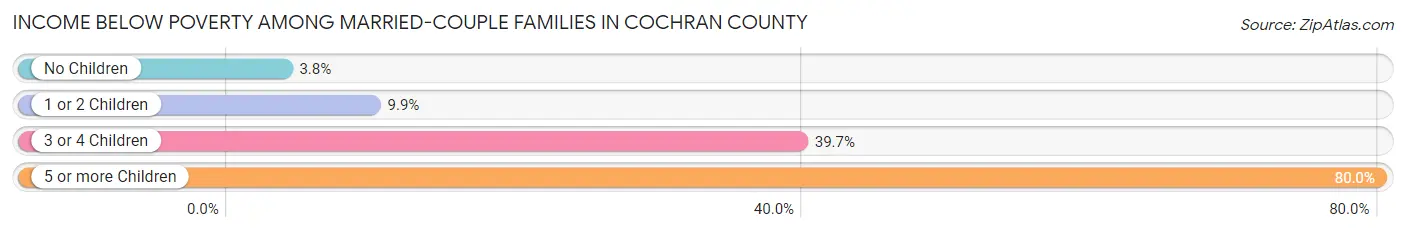
| Children | Above Poverty | Below Poverty |
| No Children | 203 (96.2%) | 8 (3.8%) |
| 1 or 2 Children | 136 (90.1%) | 15 (9.9%) |
| 3 or 4 Children | 38 (60.3%) | 25 (39.7%) |
| 5 or more Children | 4 (20.0%) | 16 (80.0%) |
| Total | 381 (85.6%) | 64 (14.4%) |
Income Below Poverty Among Single-Parent Households in Cochran County
According to the poverty data in Cochran County, 12.5% or 9 single-father households and 52.7% or 69 single-mother households are living below the poverty line. Among single-father households, those with no children have the highest poverty rate, with 9 households (81.8%) experiencing poverty. Likewise, among single-mother households, those with 3 or 4 children have the highest poverty rate, with 3 households (100.0%) falling below the poverty line.
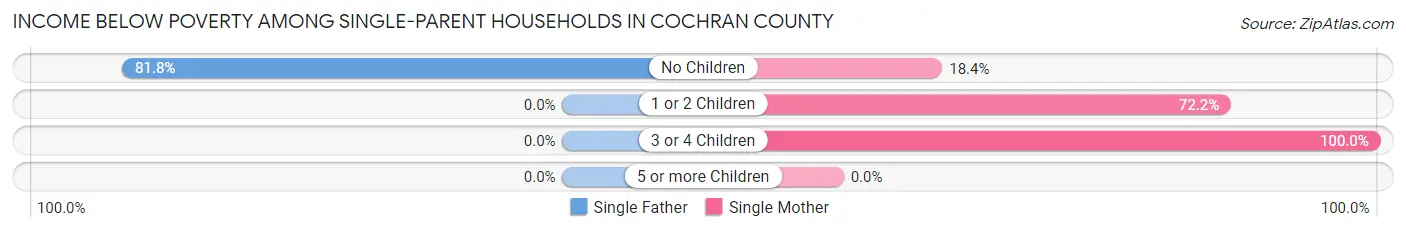
| Children | Single Father | Single Mother |
| No Children | 9 (81.8%) | 9 (18.4%) |
| 1 or 2 Children | 0 (0.0%) | 57 (72.2%) |
| 3 or 4 Children | 0 (0.0%) | 3 (100.0%) |
| 5 or more Children | 0 (0.0%) | 0 (0.0%) |
| Total | 9 (12.5%) | 69 (52.7%) |
Income Below Poverty Among Married-Couple vs Single-Parent Households in Cochran County
The poverty data for Cochran County shows that 64 of the married-couple family households (14.4%) and 78 of the single-parent households (38.4%) are living below the poverty level. Within the married-couple family households, those with 5 or more children have the highest poverty rate, with 16 households (80.0%) falling below the poverty line. Among the single-parent households, those with 3 or 4 children have the highest poverty rate, with 3 household (100.0%) living below poverty.
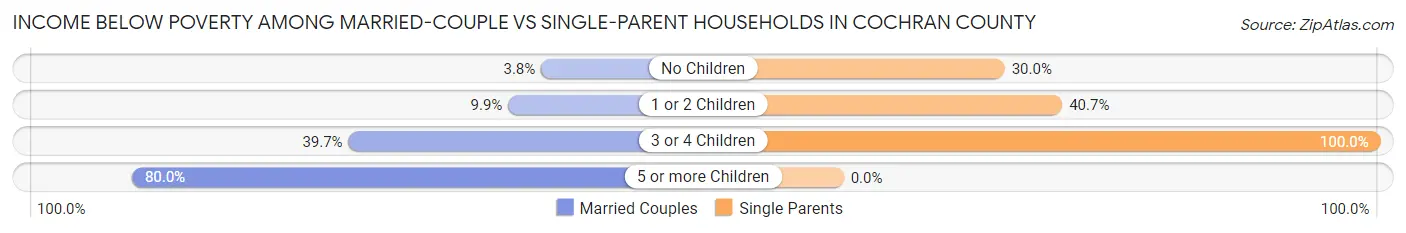
| Children | Married-Couple Families | Single-Parent Households |
| No Children | 8 (3.8%) | 18 (30.0%) |
| 1 or 2 Children | 15 (9.9%) | 57 (40.7%) |
| 3 or 4 Children | 25 (39.7%) | 3 (100.0%) |
| 5 or more Children | 16 (80.0%) | 0 (0.0%) |
| Total | 64 (14.4%) | 78 (38.4%) |
Race in Cochran County
The most populous races in Cochran County are Hispanic or Latino (1,539 | 60.9%), White / Caucasian (1,462 | 57.8%), and Two or more Races (715 | 28.3%).
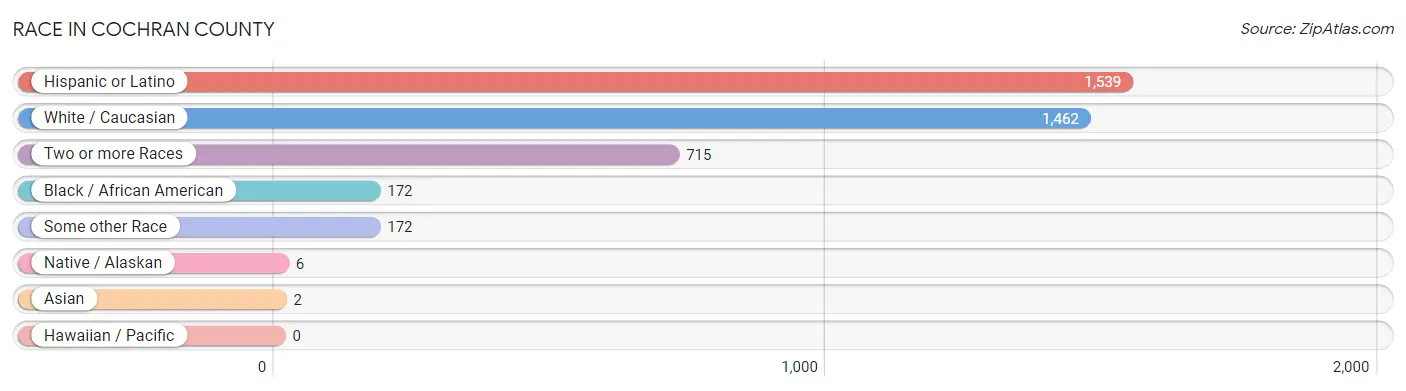
| Race | # Population | % Population |
| Asian | 2 | 0.1% |
| Black / African American | 172 | 6.8% |
| Hawaiian / Pacific | 0 | 0.0% |
| Hispanic or Latino | 1,539 | 60.9% |
| Native / Alaskan | 6 | 0.2% |
| White / Caucasian | 1,462 | 57.8% |
| Two or more Races | 715 | 28.3% |
| Some other Race | 172 | 6.8% |
| Total | 2,529 | 100.0% |
Ancestry in Cochran County
The most populous ancestries reported in Cochran County are Mexican (1,412 | 55.8%), German (220 | 8.7%), Irish (182 | 7.2%), American (168 | 6.6%), and English (89 | 3.5%), together accounting for 81.9% of all Cochran County residents.
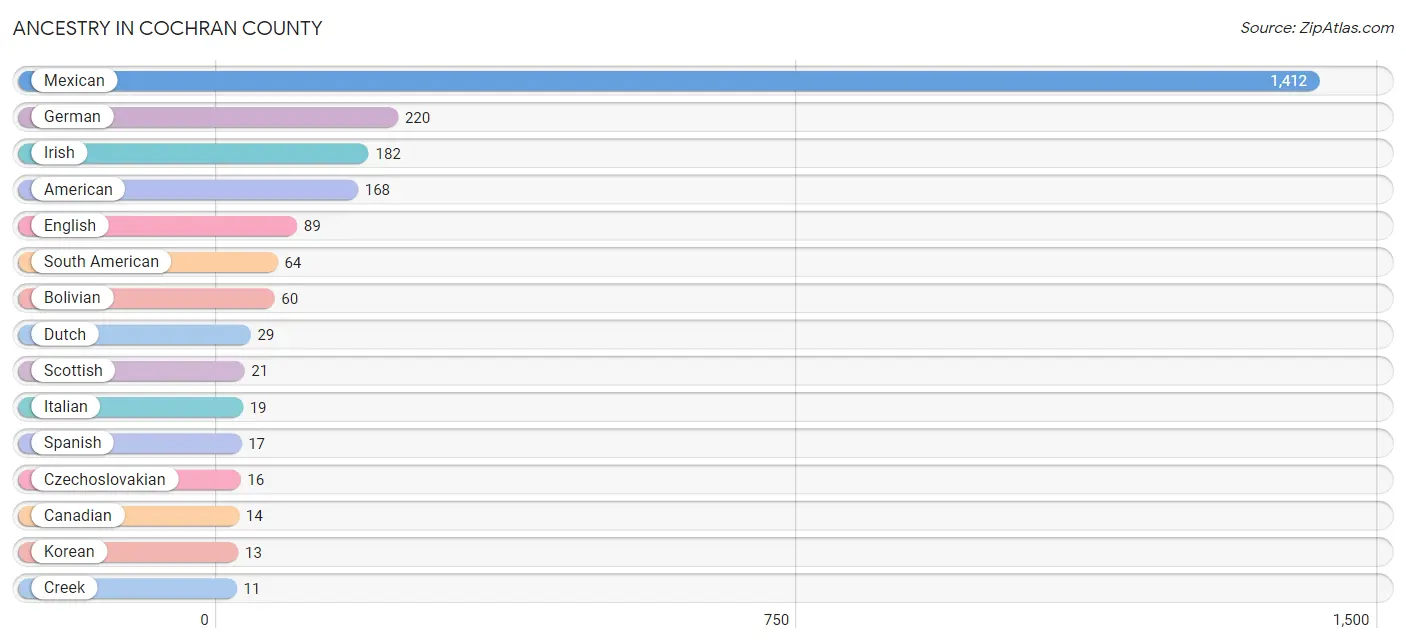
| Ancestry | # Population | % Population |
| African | 7 | 0.3% |
| American | 168 | 6.6% |
| Belizean | 8 | 0.3% |
| Bolivian | 60 | 2.4% |
| Burmese | 9 | 0.4% |
| Canadian | 14 | 0.5% |
| Cherokee | 1 | 0.0% |
| Choctaw | 1 | 0.0% |
| Creek | 11 | 0.4% |
| Czech | 4 | 0.2% |
| Czechoslovakian | 16 | 0.6% |
| Dutch | 29 | 1.1% |
| English | 89 | 3.5% |
| European | 6 | 0.2% |
| French | 4 | 0.2% |
| German | 220 | 8.7% |
| Irish | 182 | 7.2% |
| Italian | 19 | 0.7% |
| Korean | 13 | 0.5% |
| Mexican | 1,412 | 55.8% |
| Mexican American Indian | 1 | 0.0% |
| Norwegian | 3 | 0.1% |
| Russian | 3 | 0.1% |
| Scandinavian | 6 | 0.2% |
| Scotch-Irish | 6 | 0.2% |
| Scottish | 21 | 0.8% |
| Slovak | 1 | 0.0% |
| South American | 64 | 2.5% |
| Spanish | 17 | 0.7% |
| Subsaharan African | 7 | 0.3% |
| Swedish | 1 | 0.0% |
| Swiss | 6 | 0.2% |
| Venezuelan | 4 | 0.2% |
| Welsh | 3 | 0.1% | View All 34 Rows |
Immigrants in Cochran County
The most numerous immigrant groups reported in Cochran County came from Latin America (390 | 15.4%), Central America (344 | 13.6%), Mexico (344 | 13.6%), South America (46 | 1.8%), and Bolivia (42 | 1.7%), together accounting for 46.1% of all Cochran County residents.
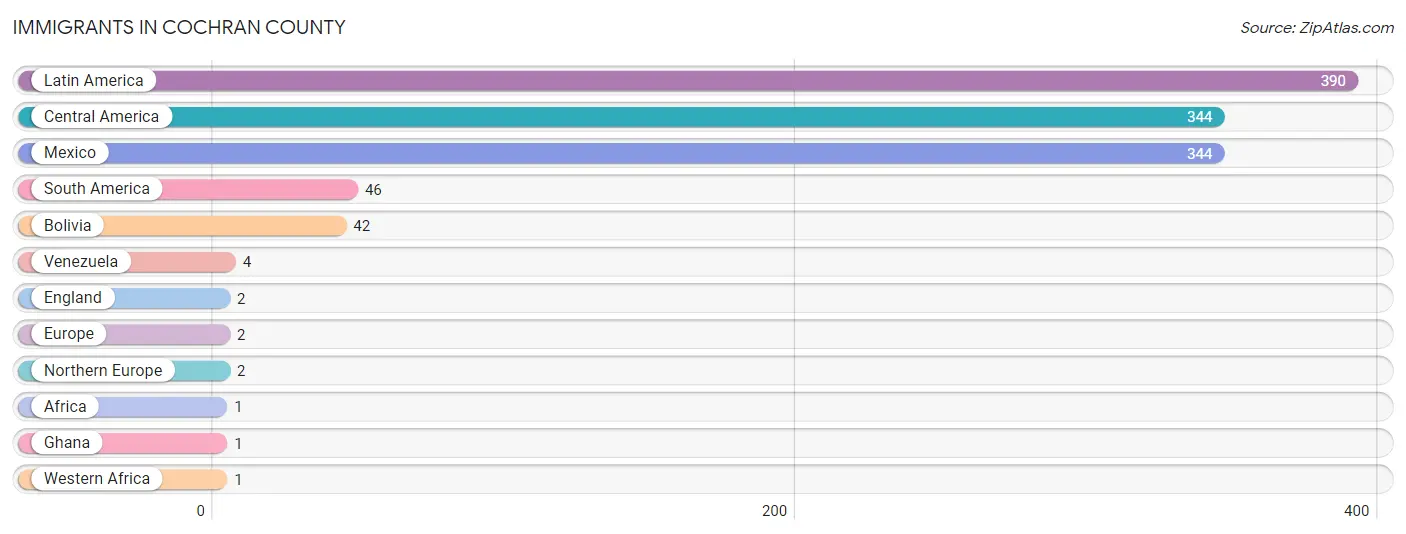
| Immigration Origin | # Population | % Population |
| Africa | 1 | 0.0% |
| Bolivia | 42 | 1.7% |
| Central America | 344 | 13.6% |
| England | 2 | 0.1% |
| Europe | 2 | 0.1% |
| Ghana | 1 | 0.0% |
| Latin America | 390 | 15.4% |
| Mexico | 344 | 13.6% |
| Northern Europe | 2 | 0.1% |
| South America | 46 | 1.8% |
| Venezuela | 4 | 0.2% |
| Western Africa | 1 | 0.0% | View All 12 Rows |
Sex and Age in Cochran County
Sex and Age in Cochran County
The most populous age groups in Cochran County are 40 to 44 Years (152 | 11.7%) for men and 15 to 19 Years (105 | 8.6%) for women.
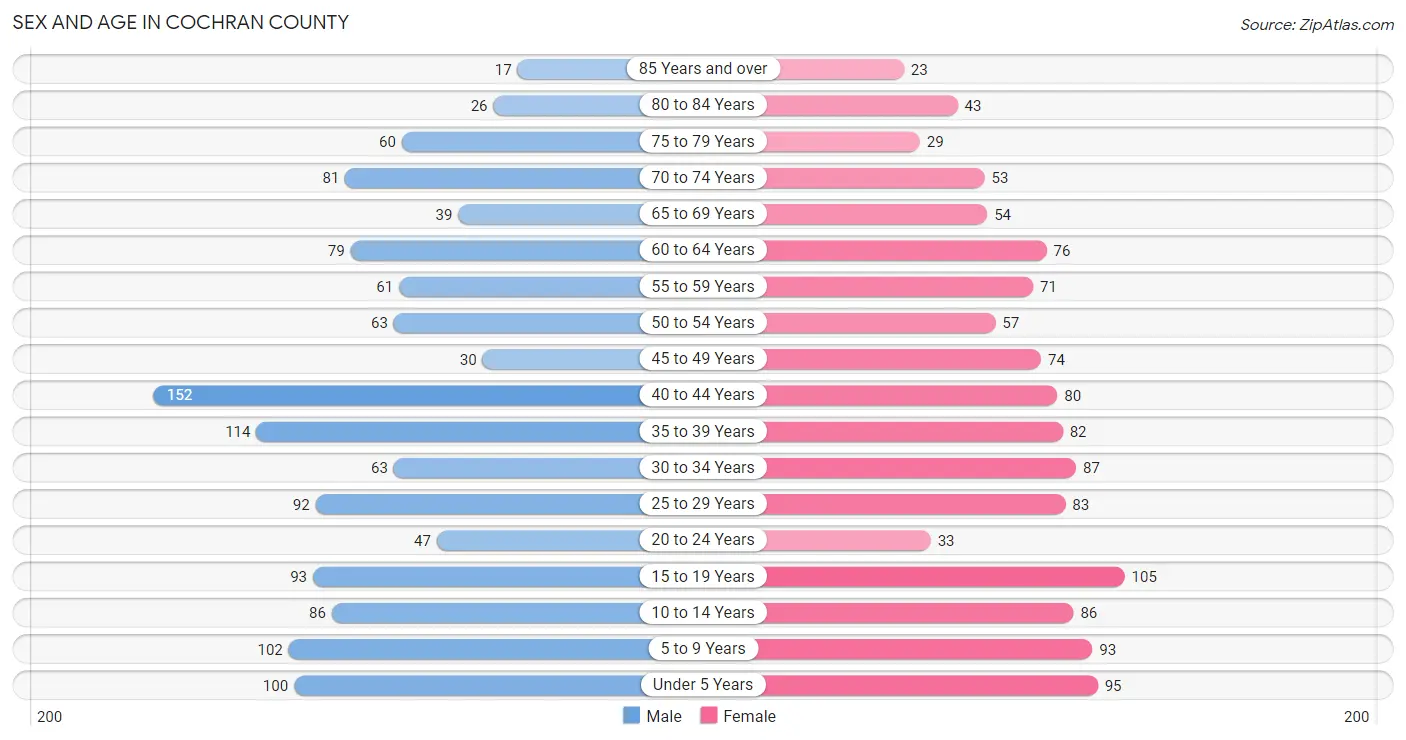
| Age Bracket | Male | Female |
| Under 5 Years | 100 (7.7%) | 95 (7.8%) |
| 5 to 9 Years | 102 (7.8%) | 93 (7.6%) |
| 10 to 14 Years | 86 (6.6%) | 86 (7.0%) |
| 15 to 19 Years | 93 (7.1%) | 105 (8.6%) |
| 20 to 24 Years | 47 (3.6%) | 33 (2.7%) |
| 25 to 29 Years | 92 (7.0%) | 83 (6.8%) |
| 30 to 34 Years | 63 (4.8%) | 87 (7.1%) |
| 35 to 39 Years | 114 (8.7%) | 82 (6.7%) |
| 40 to 44 Years | 152 (11.7%) | 80 (6.5%) |
| 45 to 49 Years | 30 (2.3%) | 74 (6.0%) |
| 50 to 54 Years | 63 (4.8%) | 57 (4.7%) |
| 55 to 59 Years | 61 (4.7%) | 71 (5.8%) |
| 60 to 64 Years | 79 (6.0%) | 76 (6.2%) |
| 65 to 69 Years | 39 (3.0%) | 54 (4.4%) |
| 70 to 74 Years | 81 (6.2%) | 53 (4.3%) |
| 75 to 79 Years | 60 (4.6%) | 29 (2.4%) |
| 80 to 84 Years | 26 (2.0%) | 43 (3.5%) |
| 85 Years and over | 17 (1.3%) | 23 (1.9%) |
| Total | 1,305 (100.0%) | 1,224 (100.0%) |
Families and Households in Cochran County
Median Family Size in Cochran County
The median family size in Cochran County is 3.04 persons per family, with married-couple families (445 | 68.7%) accounting for the largest median family size of 3.3 persons per family. On the other hand, single female/mother families (131 | 20.2%) represent the smallest median family size with 2.42 persons per family.
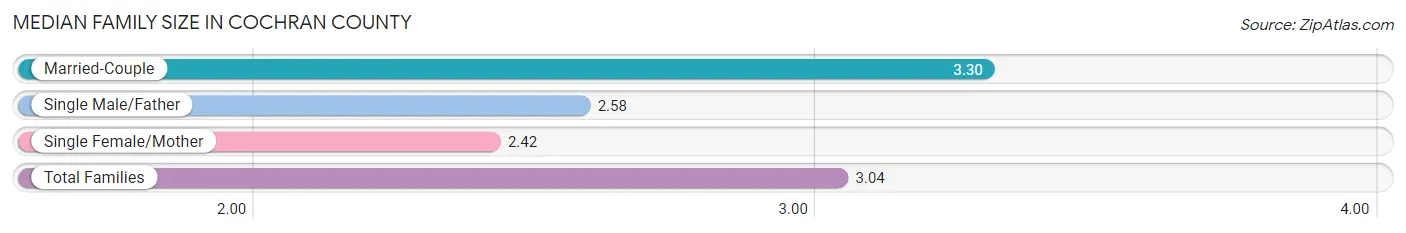
| Family Type | # Families | Family Size |
| Married-Couple | 445 (68.7%) | 3.30 |
| Single Male/Father | 72 (11.1%) | 2.58 |
| Single Female/Mother | 131 (20.2%) | 2.42 |
| Total Families | 648 (100.0%) | 3.04 |
Median Household Size in Cochran County
The median household size in Cochran County is 2.47 persons per household, with married-couple households (445 | 46.4%) accounting for the largest median household size of 3.3 persons per household. non-family households (311 | 32.4%) represent the smallest median household size with 1.06 persons per household.
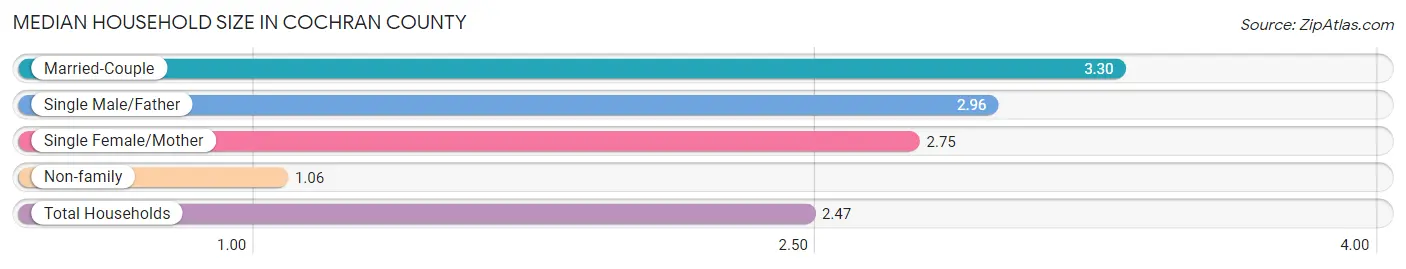
| Household Type | # Households | Household Size |
| Married-Couple | 445 (46.4%) | 3.30 |
| Single Male/Father | 72 (7.5%) | 2.96 |
| Single Female/Mother | 131 (13.7%) | 2.75 |
| Non-family | 311 (32.4%) | 1.06 |
| Total Households | 959 (100.0%) | 2.47 |
Household Size by Marriage Status in Cochran County
Out of a total of 959 households in Cochran County, 648 (67.6%) are family households, while 311 (32.4%) are nonfamily households. The most numerous type of family households are 2-person households, comprising 218, and the most common type of nonfamily households are 1-person households, comprising 291.
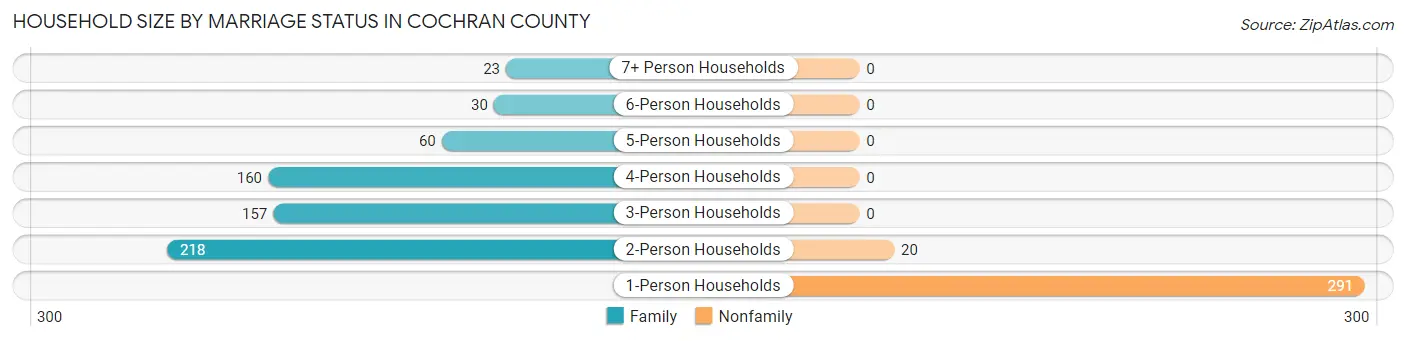
| Household Size | Family Households | Nonfamily Households |
| 1-Person Households | - | 291 (30.3%) |
| 2-Person Households | 218 (22.7%) | 20 (2.1%) |
| 3-Person Households | 157 (16.4%) | 0 (0.0%) |
| 4-Person Households | 160 (16.7%) | 0 (0.0%) |
| 5-Person Households | 60 (6.3%) | 0 (0.0%) |
| 6-Person Households | 30 (3.1%) | 0 (0.0%) |
| 7+ Person Households | 23 (2.4%) | 0 (0.0%) |
| Total | 648 (67.6%) | 311 (32.4%) |
Female Fertility in Cochran County
Fertility by Age in Cochran County
Average fertility rate in Cochran County is 134.0 births per 1,000 women. Women in the age bracket of 15 to 19 years have the highest fertility rate with 257.0 births per 1,000 women. Women in the age bracket of 20 to 34 years acount for 63.0% of all women with births.
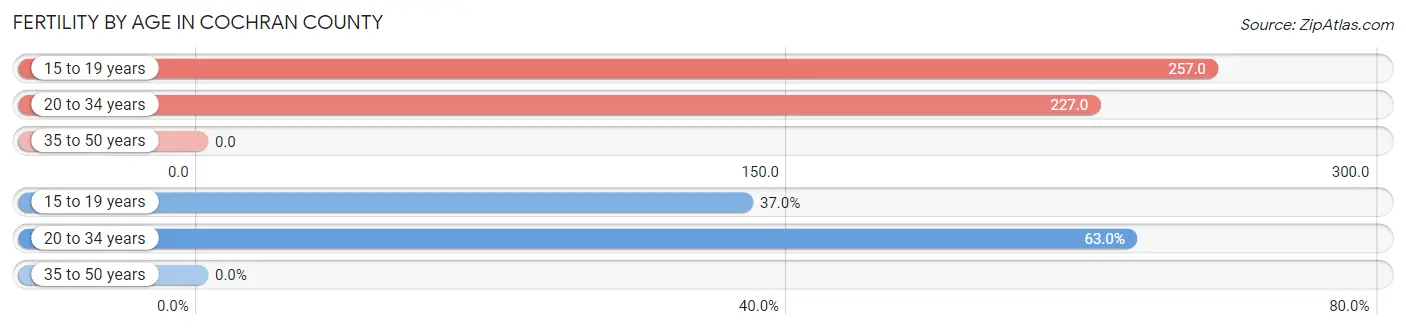
| Age Bracket | Women with Births | Births / 1,000 Women |
| 15 to 19 years | 27 (37.0%) | 257.0 |
| 20 to 34 years | 46 (63.0%) | 227.0 |
| 35 to 50 years | 0 (0.0%) | 0.0 |
| Total | 73 (100.0%) | 134.0 |
Fertility by Age by Marriage Status in Cochran County
27.4% of women with births (73) in Cochran County are married. The highest percentage of unmarried women with births falls into 15 to 19 years age bracket with 100.0% of them unmarried at the time of birth, while the lowest percentage of unmarried women with births belong to 20 to 34 years age bracket with 56.5% of them unmarried.
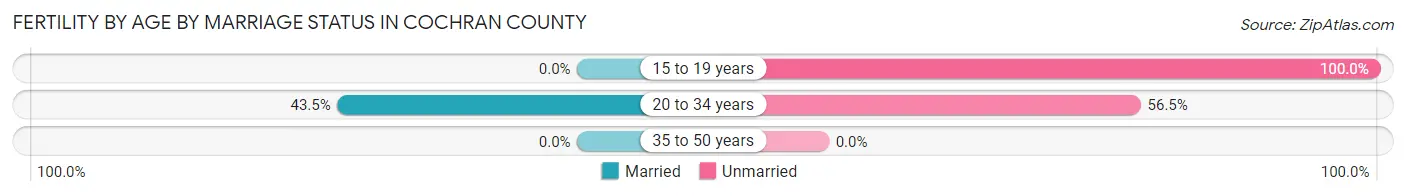
| Age Bracket | Married | Unmarried |
| 15 to 19 years | 0 (0.0%) | 27 (100.0%) |
| 20 to 34 years | 20 (43.5%) | 26 (56.5%) |
| 35 to 50 years | 0 (0.0%) | 0 (0.0%) |
| Total | 20 (27.4%) | 53 (72.6%) |
Fertility by Education in Cochran County
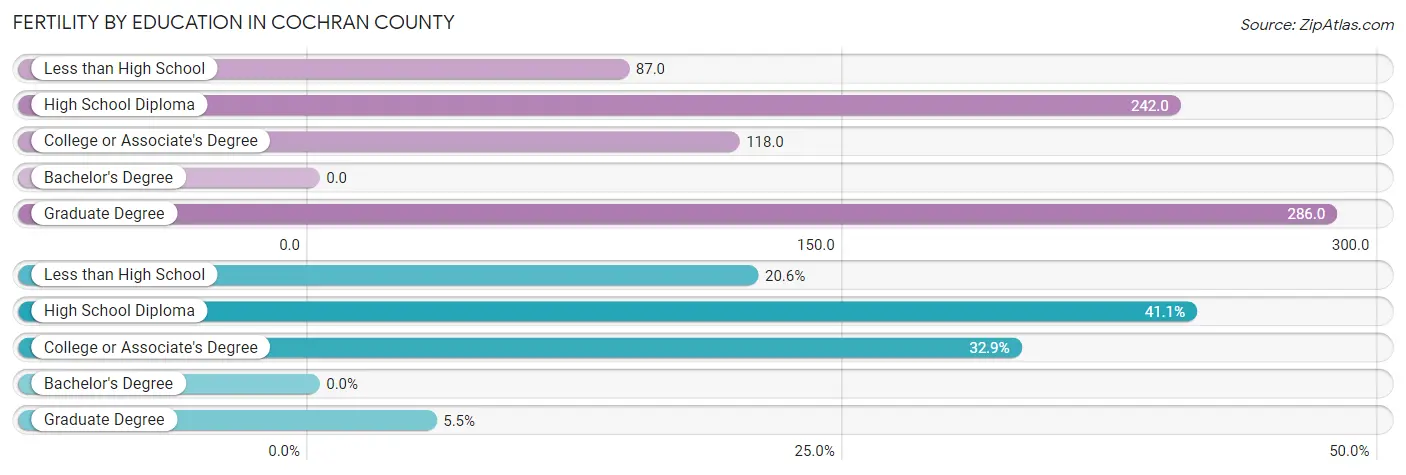
| Educational Attainment | Women with Births | Births / 1,000 Women |
| Less than High School | 15 (20.5%) | 87.0 |
| High School Diploma | 30 (41.1%) | 242.0 |
| College or Associate's Degree | 24 (32.9%) | 118.0 |
| Bachelor's Degree | 0 (0.0%) | 0.0 |
| Graduate Degree | 4 (5.5%) | 286.0 |
| Total | 73 (100.0%) | 134.0 |
Fertility by Education by Marriage Status in Cochran County
72.6% of women with births in Cochran County are unmarried. Women with the educational attainment of less than high school are most likely to be married with 100.0% of them married at childbirth, while women with the educational attainment of high school diploma are least likely to be married with 100.0% of them unmarried at childbirth.
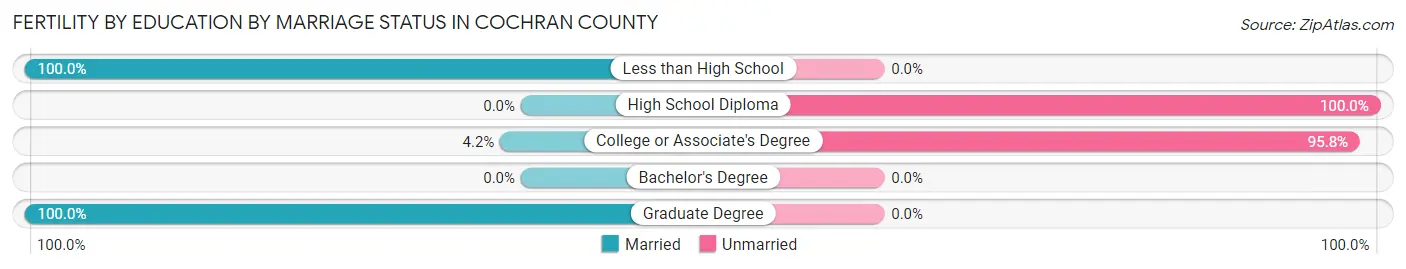
| Educational Attainment | Married | Unmarried |
| Less than High School | 15 (100.0%) | 0 (0.0%) |
| High School Diploma | 0 (0.0%) | 30 (100.0%) |
| College or Associate's Degree | 1 (4.2%) | 23 (95.8%) |
| Bachelor's Degree | 0 (0.0%) | 0 (0.0%) |
| Graduate Degree | 4 (100.0%) | 0 (0.0%) |
| Total | 20 (27.4%) | 53 (72.6%) |
Employment Characteristics in Cochran County
Employment by Class of Employer in Cochran County
Among the 1,036 employed individuals in Cochran County, private company employees (622 | 60.0%), local government employees (176 | 17.0%), and self-employed (not incorporated) (80 | 7.7%) make up the most common classes of employment.
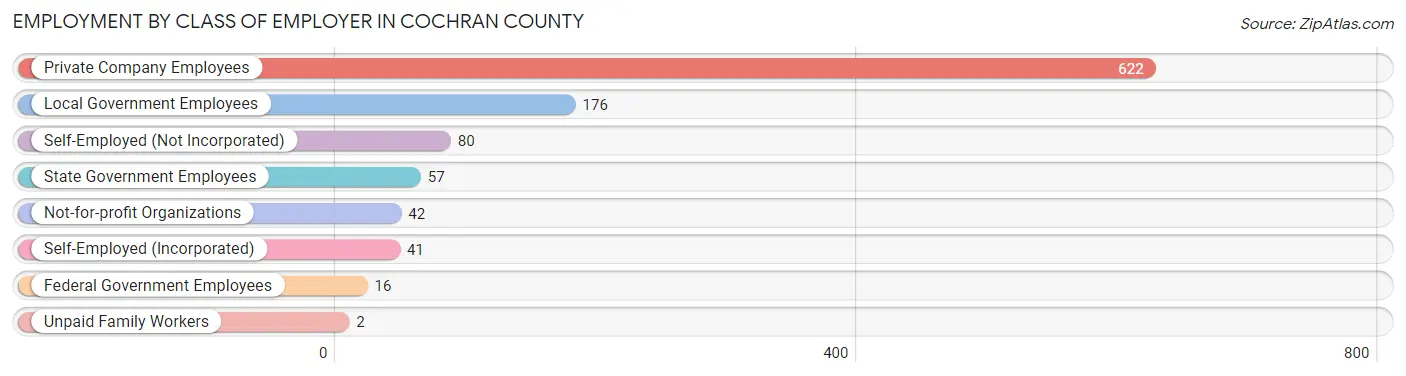
| Employer Class | # Employees | % Employees |
| Private Company Employees | 622 | 60.0% |
| Self-Employed (Incorporated) | 41 | 4.0% |
| Self-Employed (Not Incorporated) | 80 | 7.7% |
| Not-for-profit Organizations | 42 | 4.1% |
| Local Government Employees | 176 | 17.0% |
| State Government Employees | 57 | 5.5% |
| Federal Government Employees | 16 | 1.5% |
| Unpaid Family Workers | 2 | 0.2% |
| Total | 1,036 | 100.0% |
Employment Status by Age in Cochran County
According to the labor force statistics for Cochran County, out of the total population over 16 years of age (1,926), 59.8% or 1,152 individuals are in the labor force, with 7.1% or 82 of them unemployed. The age group with the highest labor force participation rate is 25 to 29 years, with 86.3% or 151 individuals in the labor force. Within the labor force, the 16 to 19 years age range has the highest percentage of unemployed individuals, with 36.1% or 22 of them being unemployed.
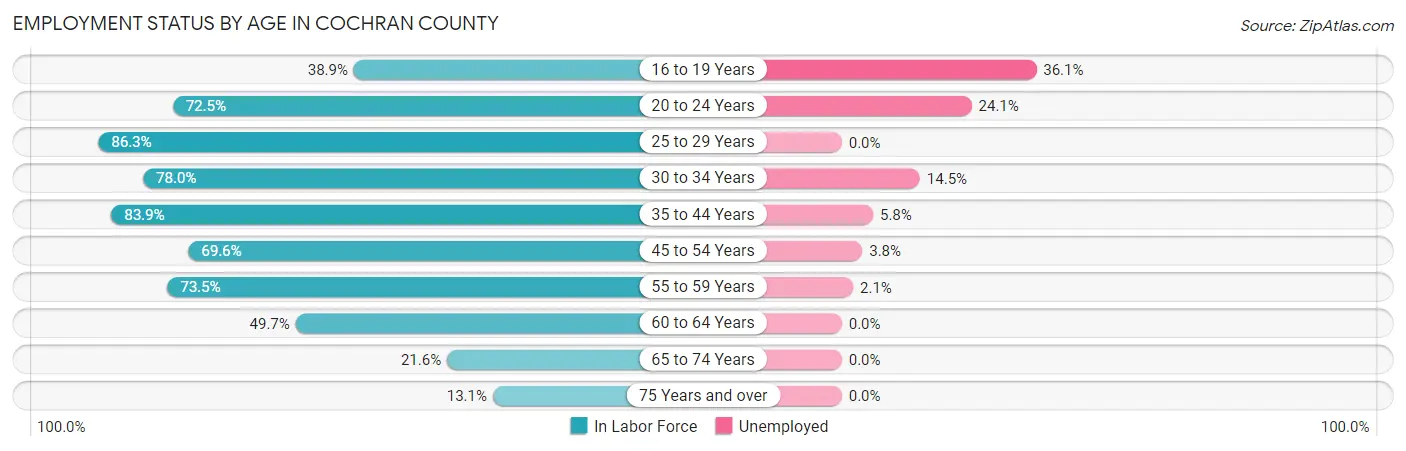
| Age Bracket | In Labor Force | Unemployed |
| 16 to 19 Years | 61 (38.9%) | 22 (36.1%) |
| 20 to 24 Years | 58 (72.5%) | 14 (24.1%) |
| 25 to 29 Years | 151 (86.3%) | 0 (0.0%) |
| 30 to 34 Years | 117 (78.0%) | 17 (14.5%) |
| 35 to 44 Years | 359 (83.9%) | 21 (5.8%) |
| 45 to 54 Years | 156 (69.6%) | 6 (3.8%) |
| 55 to 59 Years | 97 (73.5%) | 2 (2.1%) |
| 60 to 64 Years | 77 (49.7%) | 0 (0.0%) |
| 65 to 74 Years | 49 (21.6%) | 0 (0.0%) |
| 75 Years and over | 26 (13.1%) | 0 (0.0%) |
| Total | 1,152 (59.8%) | 82 (7.1%) |
Employment Status by Educational Attainment in Cochran County
According to labor force statistics for Cochran County, 75.7% of individuals (957) out of the total population between 25 and 64 years of age (1,264) are in the labor force, with 4.8% or 46 of them being unemployed. The group with the highest labor force participation rate are those with the educational attainment of college / associate degree, with 86.2% or 325 individuals in the labor force. Within the labor force, individuals with college / associate degree education have the highest percentage of unemployment, with 12.3% or 40 of them being unemployed.
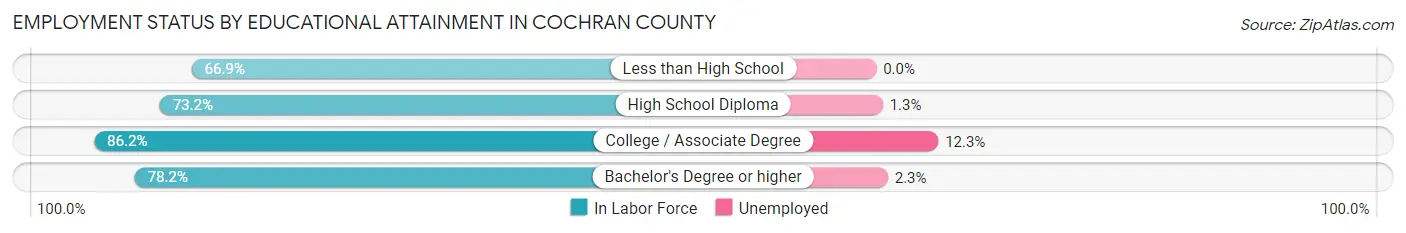
| Educational Attainment | In Labor Force | Unemployed |
| Less than High School | 243 (66.9%) | 0 (0.0%) |
| High School Diploma | 303 (73.2%) | 5 (1.3%) |
| College / Associate Degree | 325 (86.2%) | 46 (12.3%) |
| Bachelor's Degree or higher | 86 (78.2%) | 3 (2.3%) |
| Total | 957 (75.7%) | 61 (4.8%) |
Employment Occupations by Sex in Cochran County
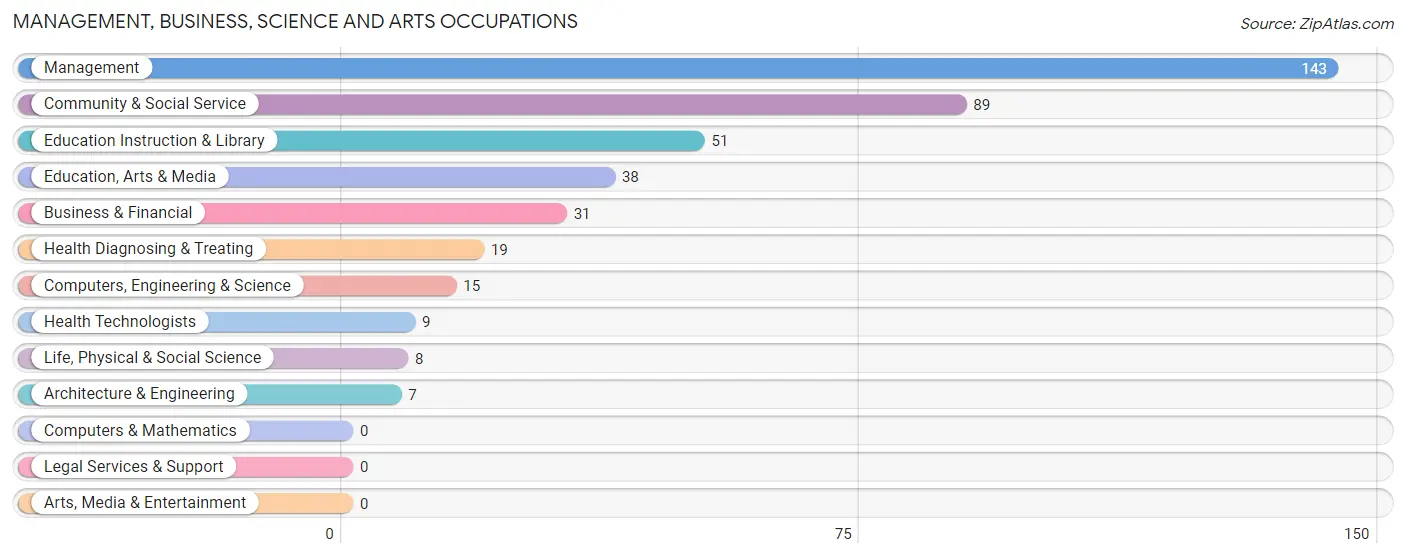
Management, Business, Science and Arts Occupations
The most common Management, Business, Science and Arts occupations in Cochran County are Management (143 | 13.4%), Community & Social Service (89 | 8.3%), Education Instruction & Library (51 | 4.8%), Education, Arts & Media (38 | 3.5%), and Business & Financial (31 | 2.9%).
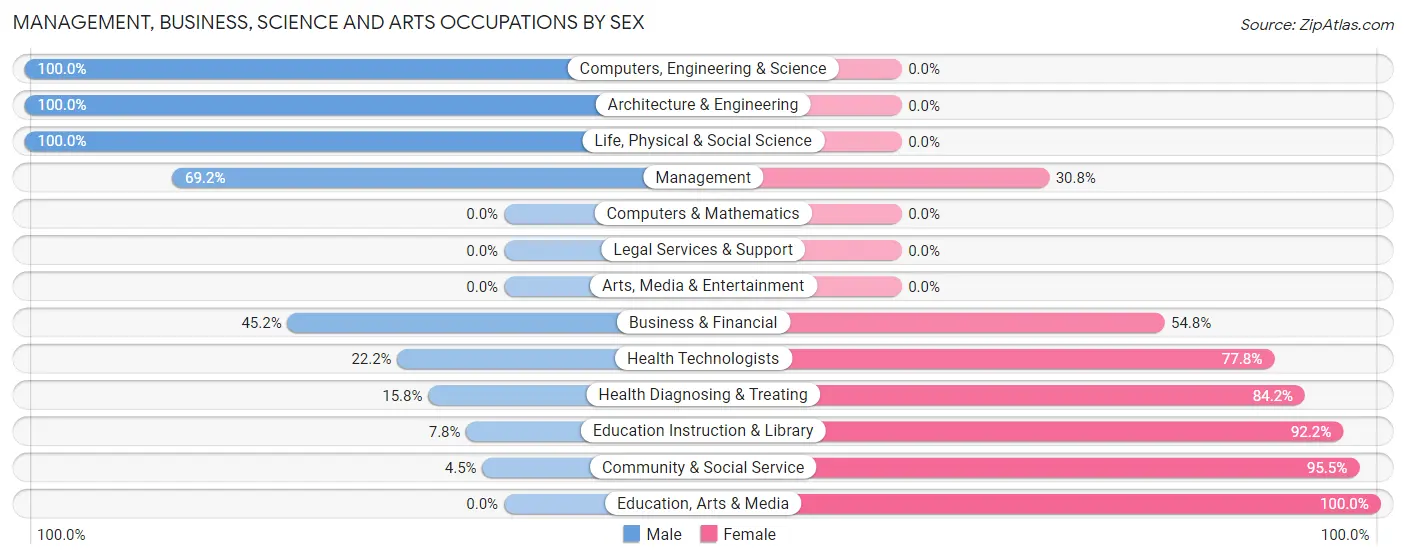
Management, Business, Science and Arts Occupations by Sex
Within the Management, Business, Science and Arts occupations in Cochran County, the most male-oriented occupations are Computers, Engineering & Science (100.0%), Architecture & Engineering (100.0%), and Life, Physical & Social Science (100.0%), while the most female-oriented occupations are Education, Arts & Media (100.0%), Community & Social Service (95.5%), and Education Instruction & Library (92.2%).
| Occupation | Male | Female |
| Management | 99 (69.2%) | 44 (30.8%) |
| Business & Financial | 14 (45.2%) | 17 (54.8%) |
| Computers, Engineering & Science | 15 (100.0%) | 0 (0.0%) |
| Computers & Mathematics | 0 (0.0%) | 0 (0.0%) |
| Architecture & Engineering | 7 (100.0%) | 0 (0.0%) |
| Life, Physical & Social Science | 8 (100.0%) | 0 (0.0%) |
| Community & Social Service | 4 (4.5%) | 85 (95.5%) |
| Education, Arts & Media | 0 (0.0%) | 38 (100.0%) |
| Legal Services & Support | 0 (0.0%) | 0 (0.0%) |
| Education Instruction & Library | 4 (7.8%) | 47 (92.2%) |
| Arts, Media & Entertainment | 0 (0.0%) | 0 (0.0%) |
| Health Diagnosing & Treating | 3 (15.8%) | 16 (84.2%) |
| Health Technologists | 2 (22.2%) | 7 (77.8%) |
| Total (Category) | 135 (45.5%) | 162 (54.5%) |
| Total (Overall) | 625 (58.5%) | 444 (41.5%) |
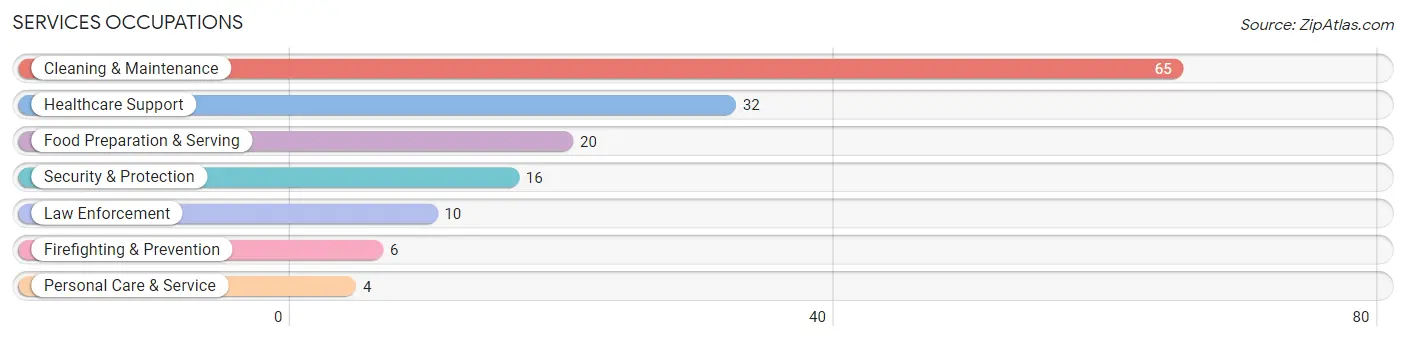
Services Occupations
The most common Services occupations in Cochran County are Cleaning & Maintenance (65 | 6.1%), Healthcare Support (32 | 3.0%), Food Preparation & Serving (20 | 1.9%), Security & Protection (16 | 1.5%), and Law Enforcement (10 | 0.9%).
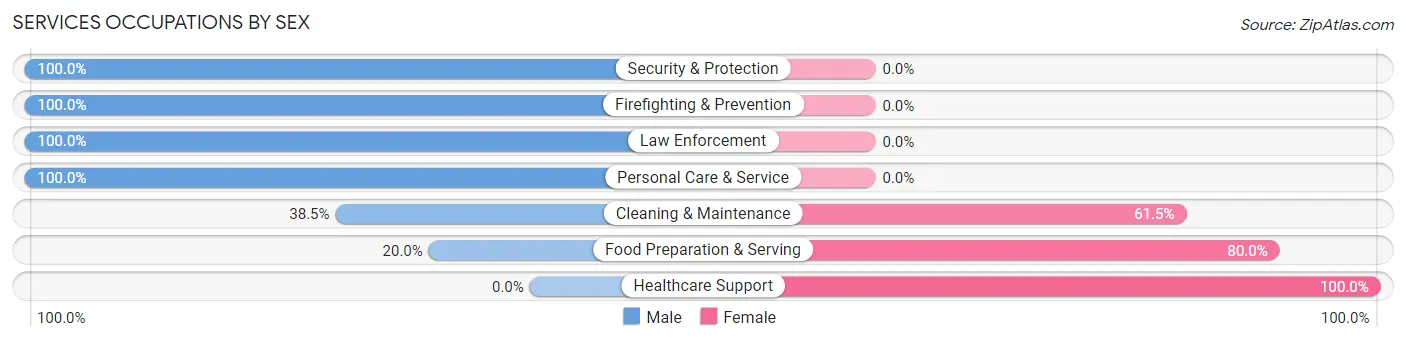
Services Occupations by Sex
Within the Services occupations in Cochran County, the most male-oriented occupations are Security & Protection (100.0%), Firefighting & Prevention (100.0%), and Law Enforcement (100.0%), while the most female-oriented occupations are Healthcare Support (100.0%), Food Preparation & Serving (80.0%), and Cleaning & Maintenance (61.5%).
| Occupation | Male | Female |
| Healthcare Support | 0 (0.0%) | 32 (100.0%) |
| Security & Protection | 16 (100.0%) | 0 (0.0%) |
| Firefighting & Prevention | 6 (100.0%) | 0 (0.0%) |
| Law Enforcement | 10 (100.0%) | 0 (0.0%) |
| Food Preparation & Serving | 4 (20.0%) | 16 (80.0%) |
| Cleaning & Maintenance | 25 (38.5%) | 40 (61.5%) |
| Personal Care & Service | 4 (100.0%) | 0 (0.0%) |
| Total (Category) | 49 (35.8%) | 88 (64.2%) |
| Total (Overall) | 625 (58.5%) | 444 (41.5%) |
Sales and Office Occupations
The most common Sales and Office occupations in Cochran County are Office & Administration (130 | 12.2%), and Sales & Related (82 | 7.7%).
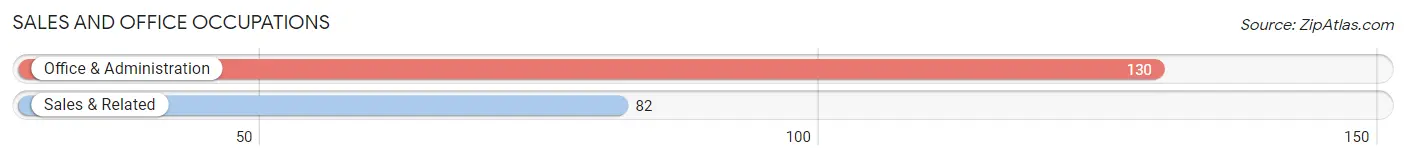
Sales and Office Occupations by Sex
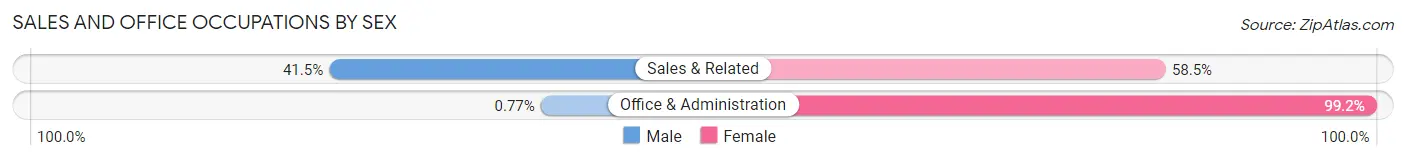
| Occupation | Male | Female |
| Sales & Related | 34 (41.5%) | 48 (58.5%) |
| Office & Administration | 1 (0.8%) | 129 (99.2%) |
| Total (Category) | 35 (16.5%) | 177 (83.5%) |
| Total (Overall) | 625 (58.5%) | 444 (41.5%) |
Natural Resources, Construction and Maintenance Occupations
The most common Natural Resources, Construction and Maintenance occupations in Cochran County are Farming, Fishing & Forestry (100 | 9.3%), Construction & Extraction (97 | 9.1%), and Installation, Maintenance & Repair (18 | 1.7%).
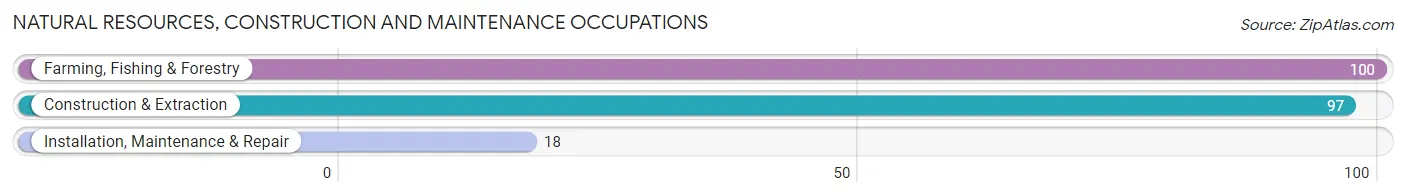
Natural Resources, Construction and Maintenance Occupations by Sex
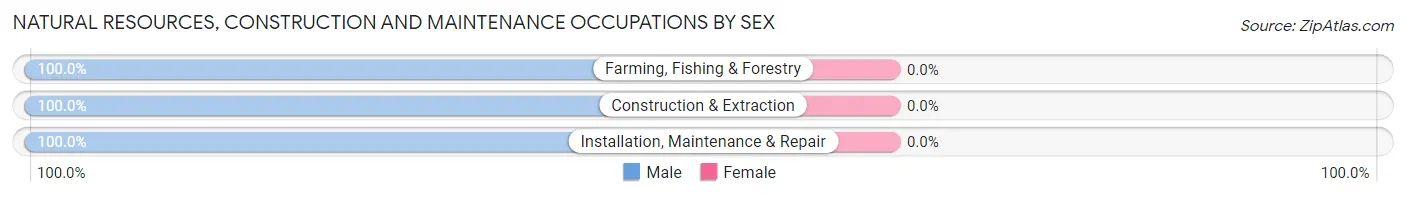
| Occupation | Male | Female |
| Farming, Fishing & Forestry | 100 (100.0%) | 0 (0.0%) |
| Construction & Extraction | 97 (100.0%) | 0 (0.0%) |
| Installation, Maintenance & Repair | 18 (100.0%) | 0 (0.0%) |
| Total (Category) | 215 (100.0%) | 0 (0.0%) |
| Total (Overall) | 625 (58.5%) | 444 (41.5%) |
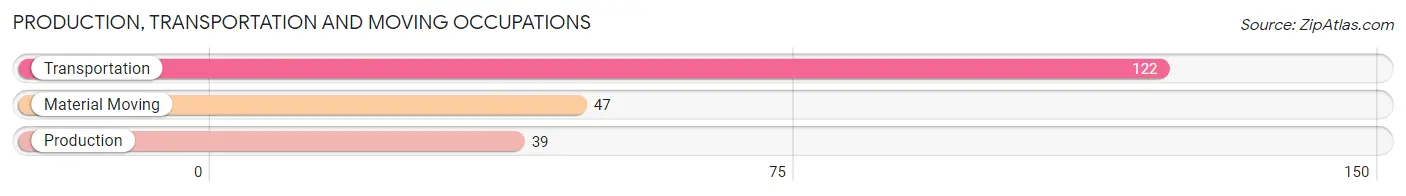
Production, Transportation and Moving Occupations
The most common Production, Transportation and Moving occupations in Cochran County are Transportation (122 | 11.4%), Material Moving (47 | 4.4%), and Production (39 | 3.6%).
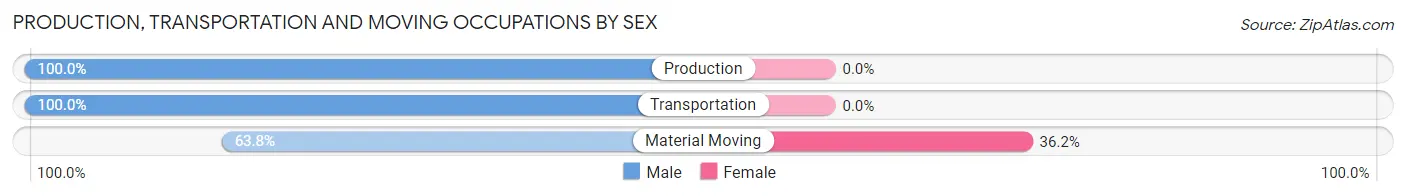
Production, Transportation and Moving Occupations by Sex
| Occupation | Male | Female |
| Production | 39 (100.0%) | 0 (0.0%) |
| Transportation | 122 (100.0%) | 0 (0.0%) |
| Material Moving | 30 (63.8%) | 17 (36.2%) |
| Total (Category) | 191 (91.8%) | 17 (8.2%) |
| Total (Overall) | 625 (58.5%) | 444 (41.5%) |
Employment Industries by Sex in Cochran County
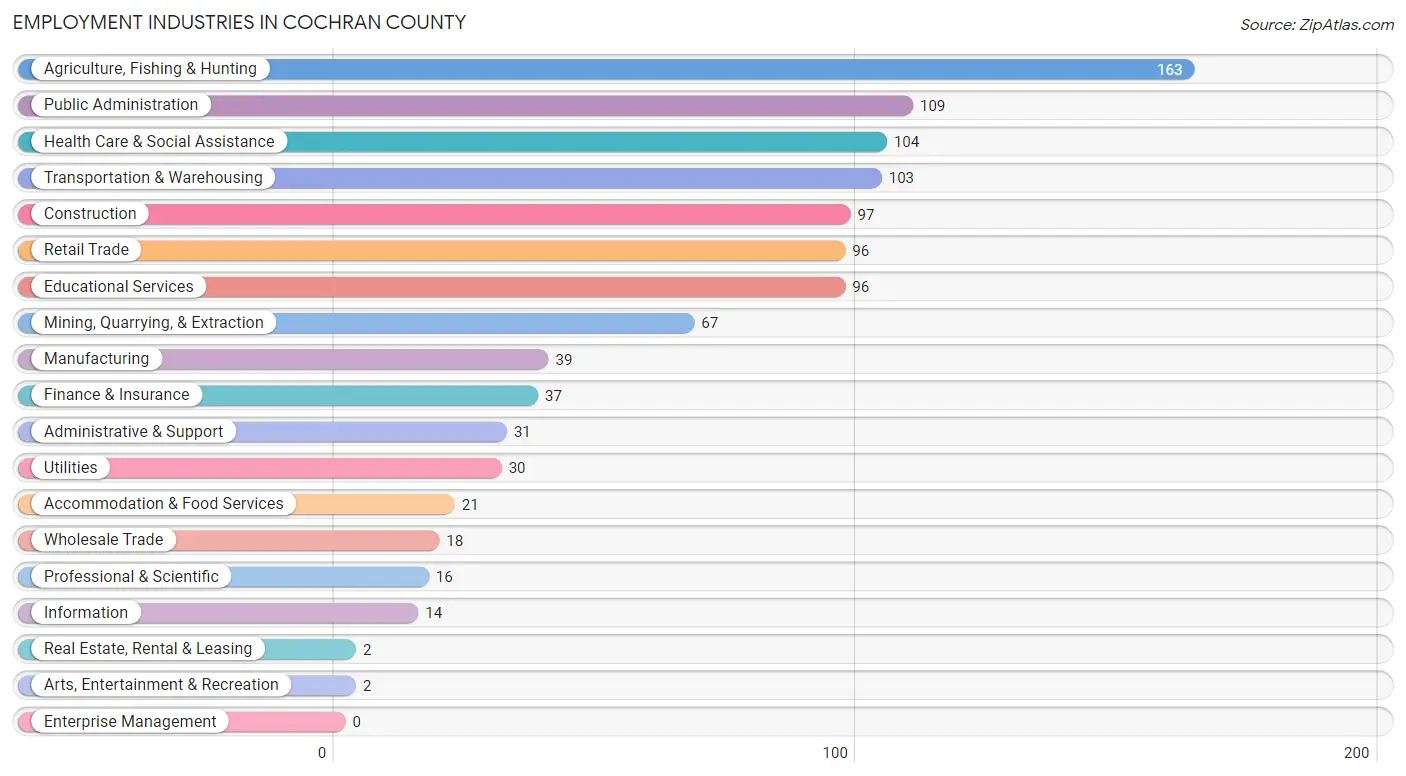
Employment Industries in Cochran County
The major employment industries in Cochran County include Agriculture, Fishing & Hunting (163 | 15.2%), Public Administration (109 | 10.2%), Health Care & Social Assistance (104 | 9.7%), Transportation & Warehousing (103 | 9.6%), and Construction (97 | 9.1%).
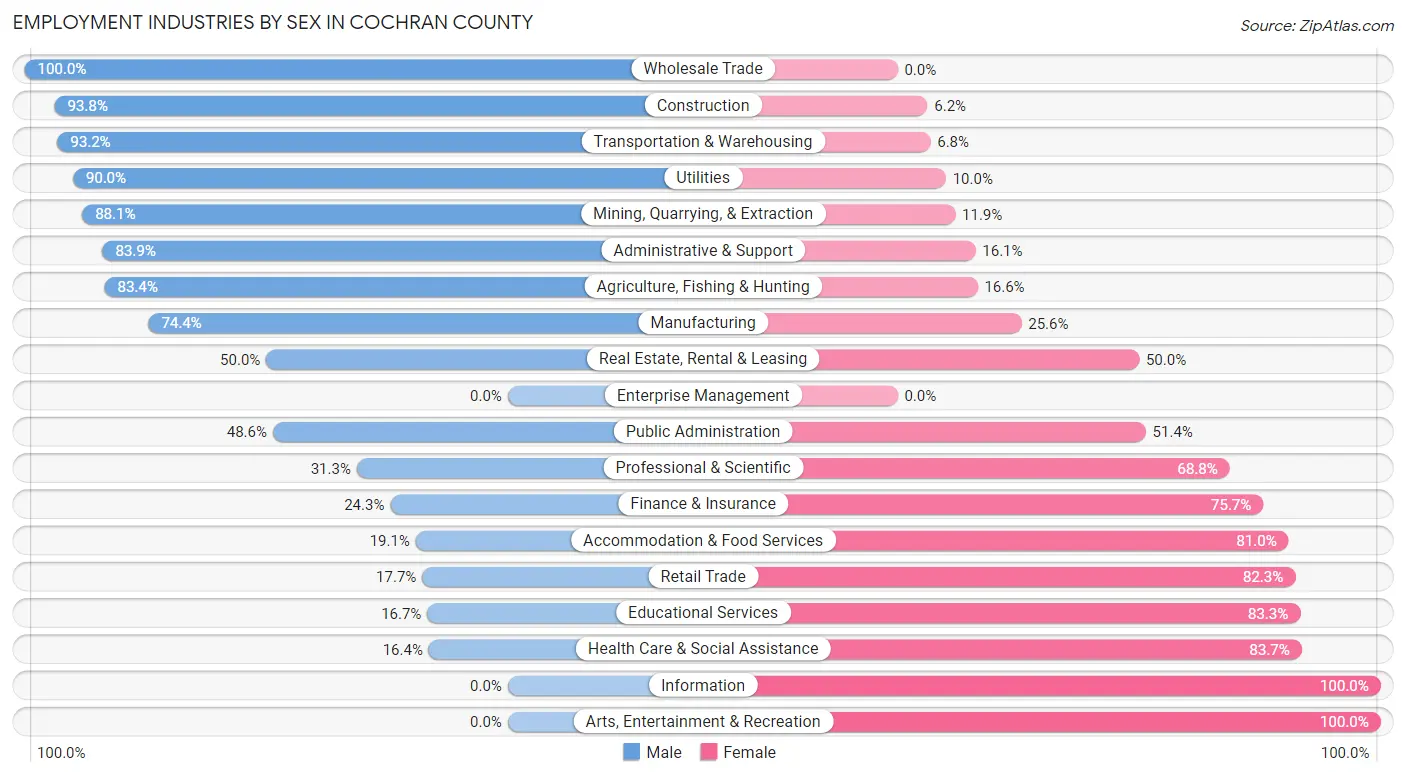
Employment Industries by Sex in Cochran County
The Cochran County industries that see more men than women are Wholesale Trade (100.0%), Construction (93.8%), and Transportation & Warehousing (93.2%), whereas the industries that tend to have a higher number of women are Information (100.0%), Arts, Entertainment & Recreation (100.0%), and Health Care & Social Assistance (83.7%).
| Industry | Male | Female |
| Agriculture, Fishing & Hunting | 136 (83.4%) | 27 (16.6%) |
| Mining, Quarrying, & Extraction | 59 (88.1%) | 8 (11.9%) |
| Construction | 91 (93.8%) | 6 (6.2%) |
| Manufacturing | 29 (74.4%) | 10 (25.6%) |
| Wholesale Trade | 18 (100.0%) | 0 (0.0%) |
| Retail Trade | 17 (17.7%) | 79 (82.3%) |
| Transportation & Warehousing | 96 (93.2%) | 7 (6.8%) |
| Utilities | 27 (90.0%) | 3 (10.0%) |
| Information | 0 (0.0%) | 14 (100.0%) |
| Finance & Insurance | 9 (24.3%) | 28 (75.7%) |
| Real Estate, Rental & Leasing | 1 (50.0%) | 1 (50.0%) |
| Professional & Scientific | 5 (31.2%) | 11 (68.8%) |
| Enterprise Management | 0 (0.0%) | 0 (0.0%) |
| Administrative & Support | 26 (83.9%) | 5 (16.1%) |
| Educational Services | 16 (16.7%) | 80 (83.3%) |
| Health Care & Social Assistance | 17 (16.4%) | 87 (83.7%) |
| Arts, Entertainment & Recreation | 0 (0.0%) | 2 (100.0%) |
| Accommodation & Food Services | 4 (19.1%) | 17 (80.9%) |
| Public Administration | 53 (48.6%) | 56 (51.4%) |
| Total | 625 (58.5%) | 444 (41.5%) |
Education in Cochran County
School Enrollment in Cochran County
The most common levels of schooling among the 585 students in Cochran County are elementary school (151 | 25.8%), middle school (149 | 25.5%), and high school (127 | 21.7%).
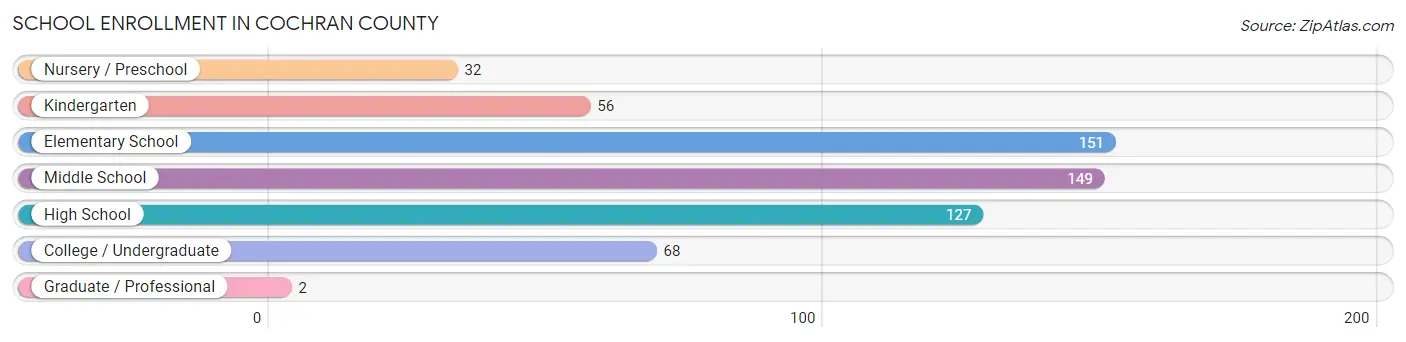
| School Level | # Students | % Students |
| Nursery / Preschool | 32 | 5.5% |
| Kindergarten | 56 | 9.6% |
| Elementary School | 151 | 25.8% |
| Middle School | 149 | 25.5% |
| High School | 127 | 21.7% |
| College / Undergraduate | 68 | 11.6% |
| Graduate / Professional | 2 | 0.3% |
| Total | 585 | 100.0% |
School Enrollment by Age by Funding Source in Cochran County
Out of a total of 585 students who are enrolled in schools in Cochran County, 30 (5.1%) attend a private institution, while the remaining 555 (94.9%) are enrolled in public schools. The age group of 35 years and over has the highest likelihood of being enrolled in private schools, with 19 (76.0% in the age bracket) enrolled. Conversely, the age group of 3 to 4 year olds has the lowest likelihood of being enrolled in a private school, with 29 (100.0% in the age bracket) attending a public institution.
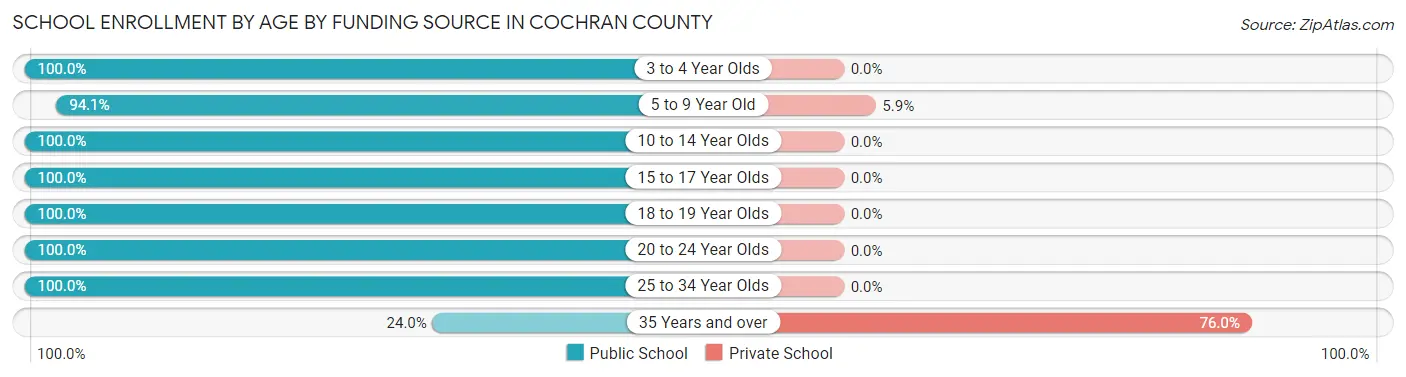
| Age Bracket | Public School | Private School |
| 3 to 4 Year Olds | 29 (100.0%) | 0 (0.0%) |
| 5 to 9 Year Old | 175 (94.1%) | 11 (5.9%) |
| 10 to 14 Year Olds | 167 (100.0%) | 0 (0.0%) |
| 15 to 17 Year Olds | 119 (100.0%) | 0 (0.0%) |
| 18 to 19 Year Olds | 19 (100.0%) | 0 (0.0%) |
| 20 to 24 Year Olds | 14 (100.0%) | 0 (0.0%) |
| 25 to 34 Year Olds | 26 (100.0%) | 0 (0.0%) |
| 35 Years and over | 6 (24.0%) | 19 (76.0%) |
| Total | 555 (94.9%) | 30 (5.1%) |
Educational Attainment by Field of Study in Cochran County
Education (31 | 19.9%), arts & humanities (31 | 19.9%), business (28 | 17.9%), bio, nature & agricultural (27 | 17.3%), and science & technology (15 | 9.6%) are the most common fields of study among 156 individuals in Cochran County who have obtained a bachelor's degree or higher.
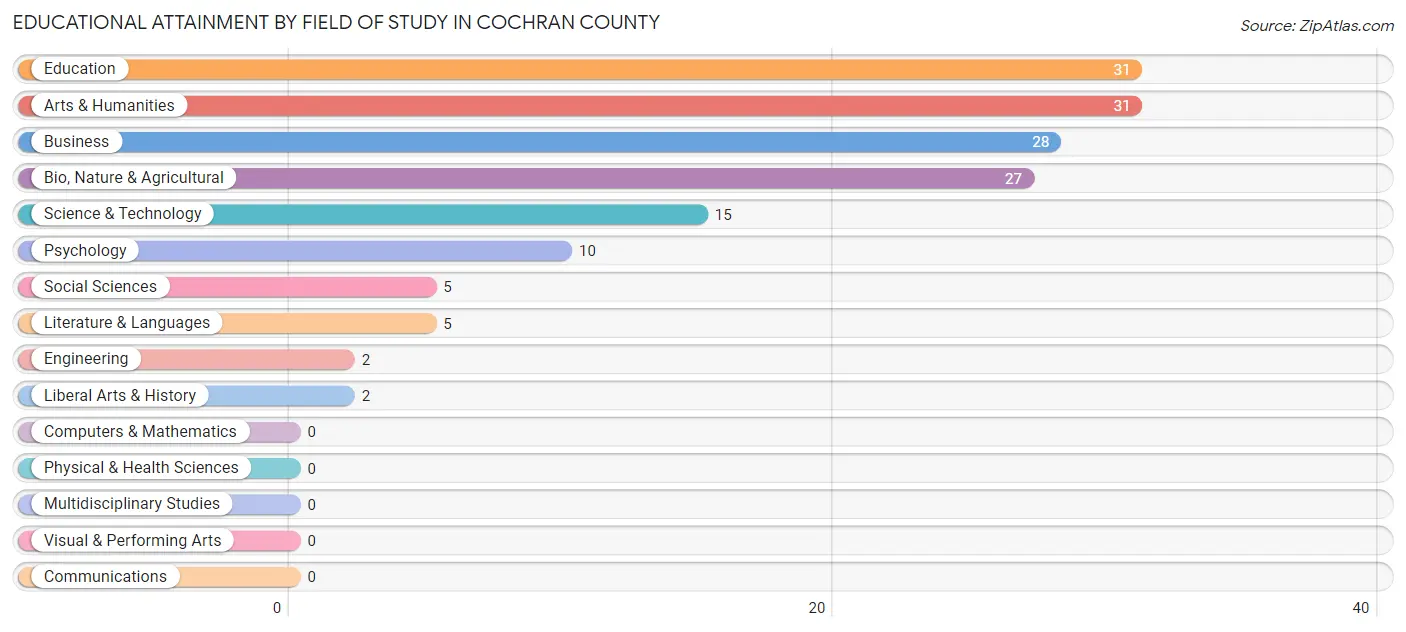
| Field of Study | # Graduates | % Graduates |
| Computers & Mathematics | 0 | 0.0% |
| Bio, Nature & Agricultural | 27 | 17.3% |
| Physical & Health Sciences | 0 | 0.0% |
| Psychology | 10 | 6.4% |
| Social Sciences | 5 | 3.2% |
| Engineering | 2 | 1.3% |
| Multidisciplinary Studies | 0 | 0.0% |
| Science & Technology | 15 | 9.6% |
| Business | 28 | 17.9% |
| Education | 31 | 19.9% |
| Literature & Languages | 5 | 3.2% |
| Liberal Arts & History | 2 | 1.3% |
| Visual & Performing Arts | 0 | 0.0% |
| Communications | 0 | 0.0% |
| Arts & Humanities | 31 | 19.9% |
| Total | 156 | 100.0% |
Transportation & Commute in Cochran County
Vehicle Availability by Sex in Cochran County
The most prevalent vehicle ownership categories in Cochran County are males with 2 vehicles (281, accounting for 47.2%) and females with 2 vehicles (226, making up 63.7%).
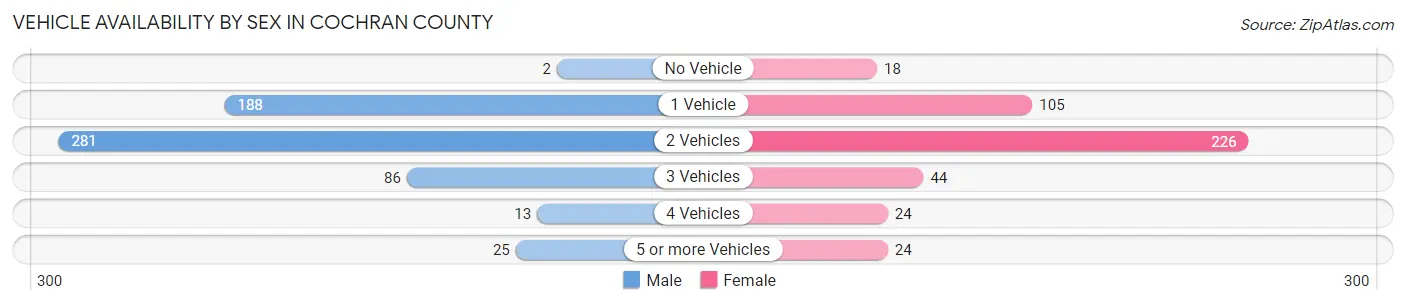
| Vehicles Available | Male | Female |
| No Vehicle | 2 (0.3%) | 18 (4.1%) |
| 1 Vehicle | 188 (31.6%) | 105 (23.8%) |
| 2 Vehicles | 281 (47.2%) | 226 (51.2%) |
| 3 Vehicles | 86 (14.4%) | 44 (10.0%) |
| 4 Vehicles | 13 (2.2%) | 24 (5.4%) |
| 5 or more Vehicles | 25 (4.2%) | 24 (5.4%) |
| Total | 595 (100.0%) | 441 (100.0%) |
Commute Time in Cochran County
The most frequently occuring commute durations in Cochran County are 30 to 34 minutes (197 commuters, 19.4%), less than 5 minutes (154 commuters, 15.1%), and 5 to 9 minutes (139 commuters, 13.7%).
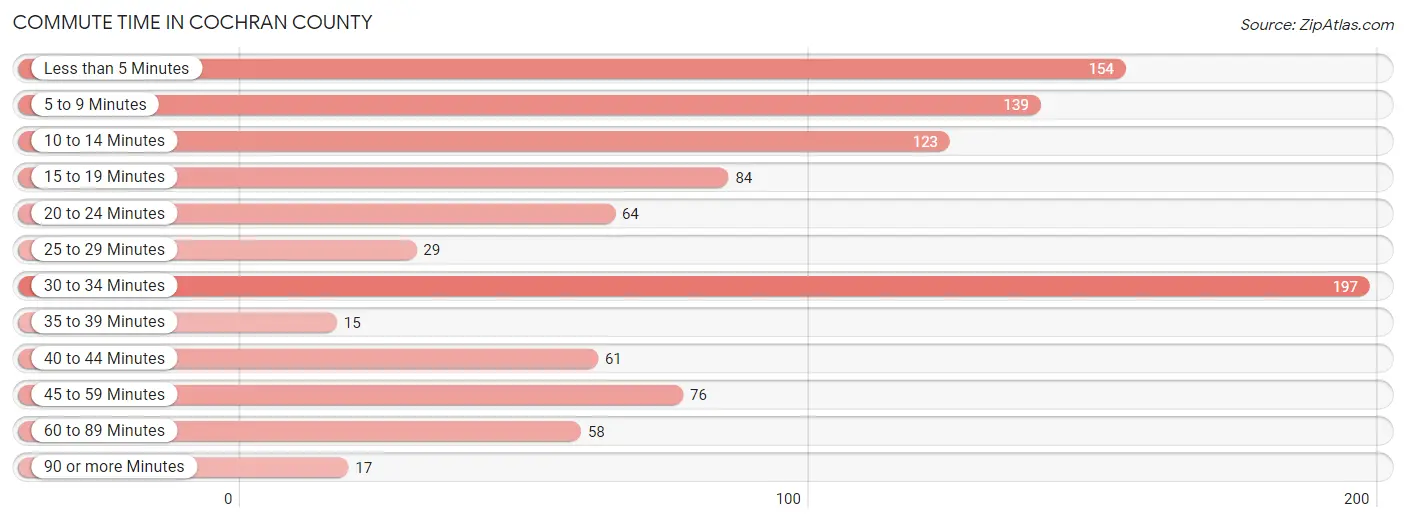
| Commute Time | # Commuters | % Commuters |
| Less than 5 Minutes | 154 | 15.1% |
| 5 to 9 Minutes | 139 | 13.7% |
| 10 to 14 Minutes | 123 | 12.1% |
| 15 to 19 Minutes | 84 | 8.3% |
| 20 to 24 Minutes | 64 | 6.3% |
| 25 to 29 Minutes | 29 | 2.9% |
| 30 to 34 Minutes | 197 | 19.4% |
| 35 to 39 Minutes | 15 | 1.5% |
| 40 to 44 Minutes | 61 | 6.0% |
| 45 to 59 Minutes | 76 | 7.5% |
| 60 to 89 Minutes | 58 | 5.7% |
| 90 or more Minutes | 17 | 1.7% |
Commute Time by Sex in Cochran County
The most common commute times in Cochran County are 30 to 34 minutes (156 commuters, 26.3%) for males and 5 to 9 minutes (103 commuters, 24.3%) for females.
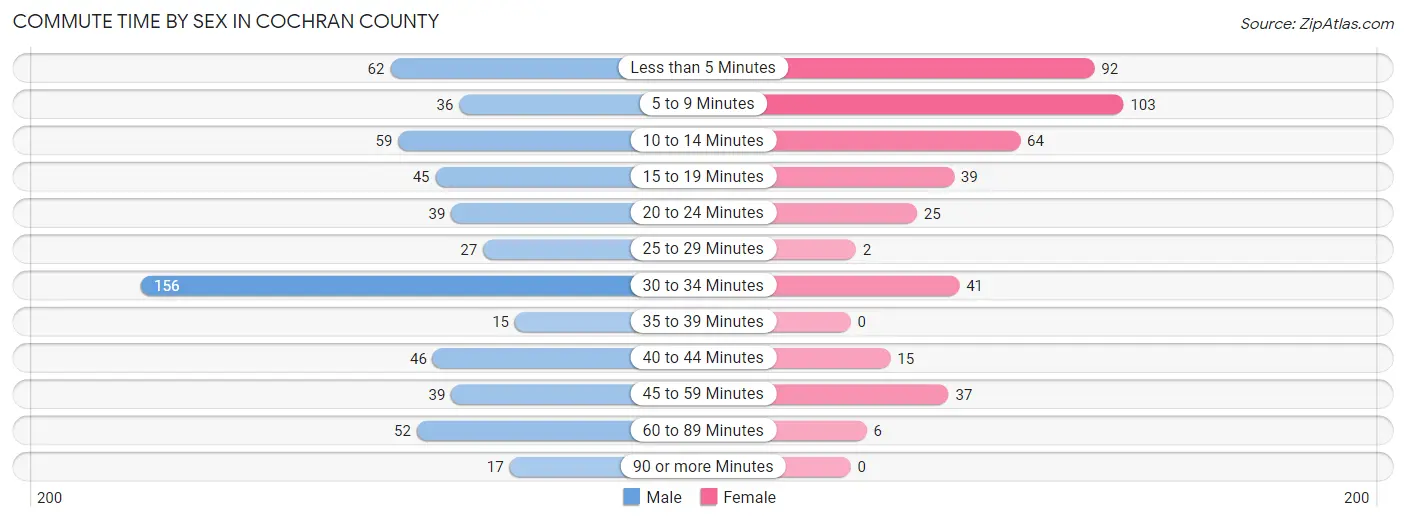
| Commute Time | Male | Female |
| Less than 5 Minutes | 62 (10.5%) | 92 (21.7%) |
| 5 to 9 Minutes | 36 (6.1%) | 103 (24.3%) |
| 10 to 14 Minutes | 59 (10.0%) | 64 (15.1%) |
| 15 to 19 Minutes | 45 (7.6%) | 39 (9.2%) |
| 20 to 24 Minutes | 39 (6.6%) | 25 (5.9%) |
| 25 to 29 Minutes | 27 (4.5%) | 2 (0.5%) |
| 30 to 34 Minutes | 156 (26.3%) | 41 (9.7%) |
| 35 to 39 Minutes | 15 (2.5%) | 0 (0.0%) |
| 40 to 44 Minutes | 46 (7.8%) | 15 (3.5%) |
| 45 to 59 Minutes | 39 (6.6%) | 37 (8.7%) |
| 60 to 89 Minutes | 52 (8.8%) | 6 (1.4%) |
| 90 or more Minutes | 17 (2.9%) | 0 (0.0%) |
Time of Departure to Work by Sex in Cochran County
The most frequent times of departure to work in Cochran County are 6:00 AM to 6:29 AM (125, 21.1%) for males and 7:00 AM to 7:29 AM (118, 27.8%) for females.
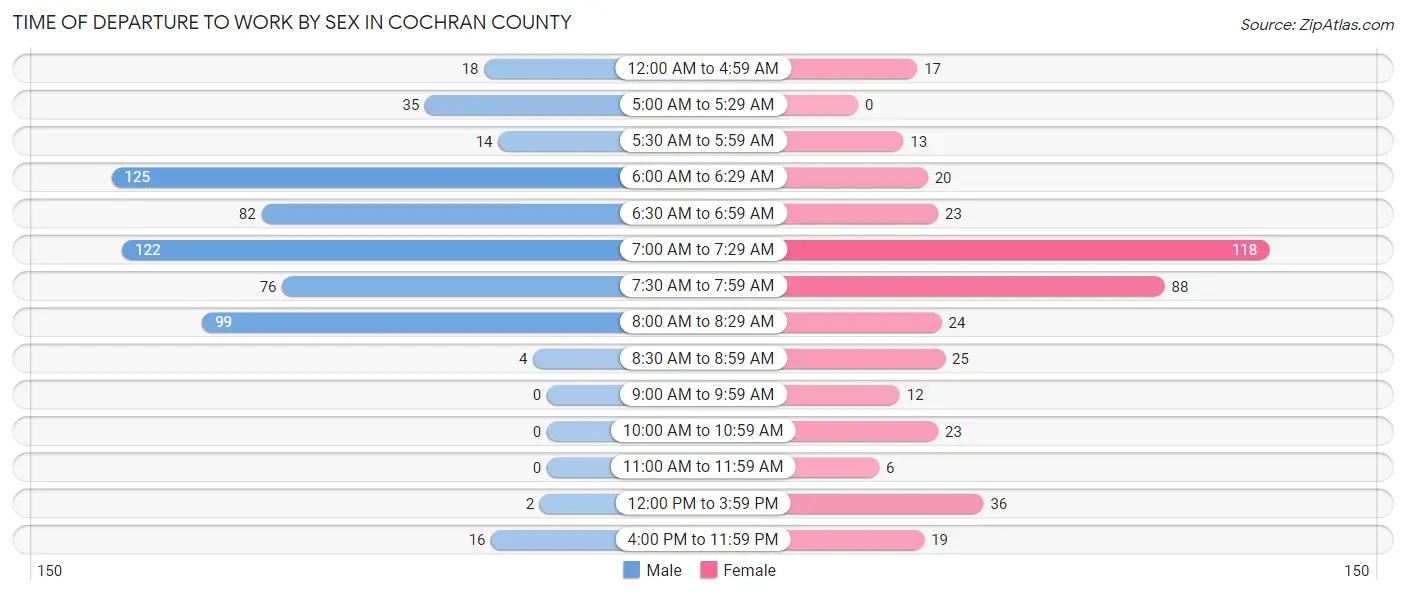
| Time of Departure | Male | Female |
| 12:00 AM to 4:59 AM | 18 (3.0%) | 17 (4.0%) |
| 5:00 AM to 5:29 AM | 35 (5.9%) | 0 (0.0%) |
| 5:30 AM to 5:59 AM | 14 (2.4%) | 13 (3.1%) |
| 6:00 AM to 6:29 AM | 125 (21.1%) | 20 (4.7%) |
| 6:30 AM to 6:59 AM | 82 (13.8%) | 23 (5.4%) |
| 7:00 AM to 7:29 AM | 122 (20.6%) | 118 (27.8%) |
| 7:30 AM to 7:59 AM | 76 (12.8%) | 88 (20.7%) |
| 8:00 AM to 8:29 AM | 99 (16.7%) | 24 (5.7%) |
| 8:30 AM to 8:59 AM | 4 (0.7%) | 25 (5.9%) |
| 9:00 AM to 9:59 AM | 0 (0.0%) | 12 (2.8%) |
| 10:00 AM to 10:59 AM | 0 (0.0%) | 23 (5.4%) |
| 11:00 AM to 11:59 AM | 0 (0.0%) | 6 (1.4%) |
| 12:00 PM to 3:59 PM | 2 (0.3%) | 36 (8.5%) |
| 4:00 PM to 11:59 PM | 16 (2.7%) | 19 (4.5%) |
| Total | 593 (100.0%) | 424 (100.0%) |
Housing Occupancy in Cochran County
Occupancy by Ownership in Cochran County
Of the total 959 dwellings in Cochran County, owner-occupied units account for 647 (67.5%), while renter-occupied units make up 312 (32.5%).
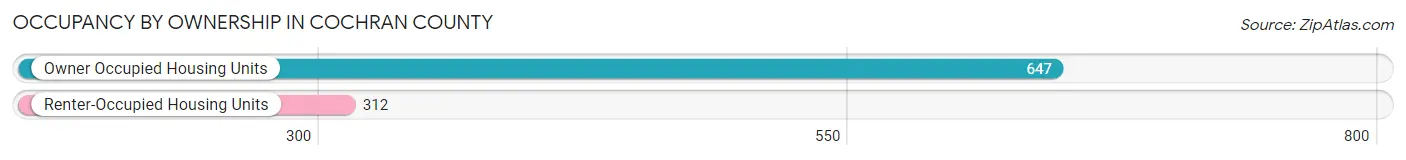
| Occupancy | # Housing Units | % Housing Units |
| Owner Occupied Housing Units | 647 | 67.5% |
| Renter-Occupied Housing Units | 312 | 32.5% |
| Total Occupied Housing Units | 959 | 100.0% |
Occupancy by Household Size in Cochran County
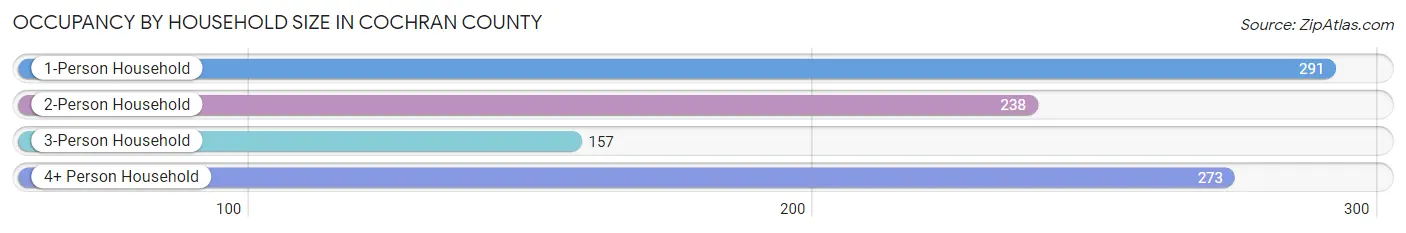
| Household Size | # Housing Units | % Housing Units |
| 1-Person Household | 291 | 30.3% |
| 2-Person Household | 238 | 24.8% |
| 3-Person Household | 157 | 16.4% |
| 4+ Person Household | 273 | 28.5% |
| Total Housing Units | 959 | 100.0% |
Occupancy by Ownership by Household Size in Cochran County
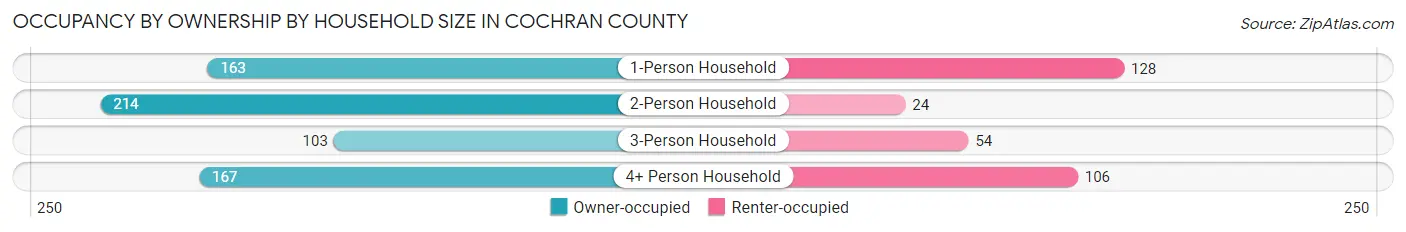
| Household Size | Owner-occupied | Renter-occupied |
| 1-Person Household | 163 (56.0%) | 128 (44.0%) |
| 2-Person Household | 214 (89.9%) | 24 (10.1%) |
| 3-Person Household | 103 (65.6%) | 54 (34.4%) |
| 4+ Person Household | 167 (61.2%) | 106 (38.8%) |
| Total Housing Units | 647 (67.5%) | 312 (32.5%) |
Occupancy by Educational Attainment in Cochran County
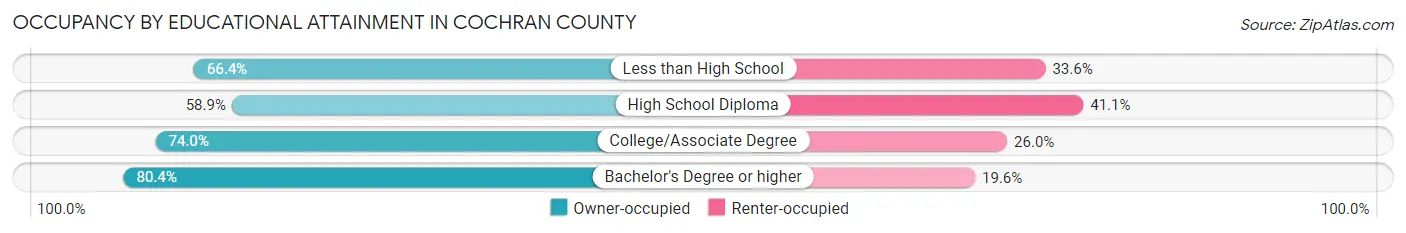
| Household Size | Owner-occupied | Renter-occupied |
| Less than High School | 186 (66.4%) | 94 (33.6%) |
| High School Diploma | 188 (58.9%) | 131 (41.1%) |
| College/Associate Degree | 191 (74.0%) | 67 (26.0%) |
| Bachelor's Degree or higher | 82 (80.4%) | 20 (19.6%) |
Occupancy by Age of Householder in Cochran County
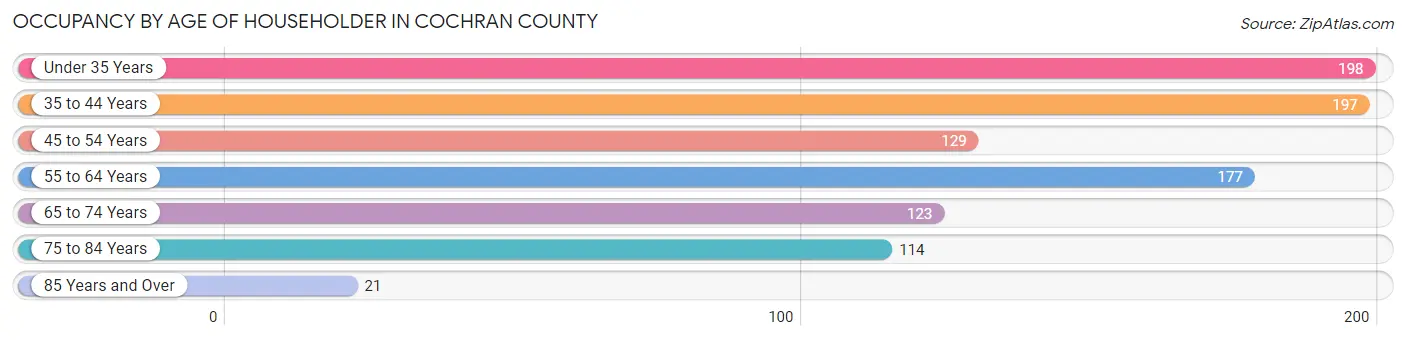
| Age Bracket | # Households | % Households |
| Under 35 Years | 198 | 20.6% |
| 35 to 44 Years | 197 | 20.5% |
| 45 to 54 Years | 129 | 13.5% |
| 55 to 64 Years | 177 | 18.5% |
| 65 to 74 Years | 123 | 12.8% |
| 75 to 84 Years | 114 | 11.9% |
| 85 Years and Over | 21 | 2.2% |
| Total | 959 | 100.0% |
Housing Finances in Cochran County
Median Income by Occupancy in Cochran County
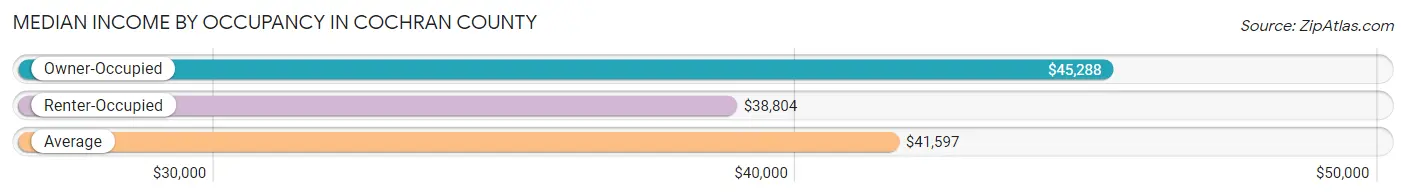
| Occupancy Type | # Households | Median Income |
| Owner-Occupied | 647 (67.5%) | $45,288 |
| Renter-Occupied | 312 (32.5%) | $38,804 |
| Average | 959 (100.0%) | $41,597 |
Occupancy by Householder Income Bracket in Cochran County
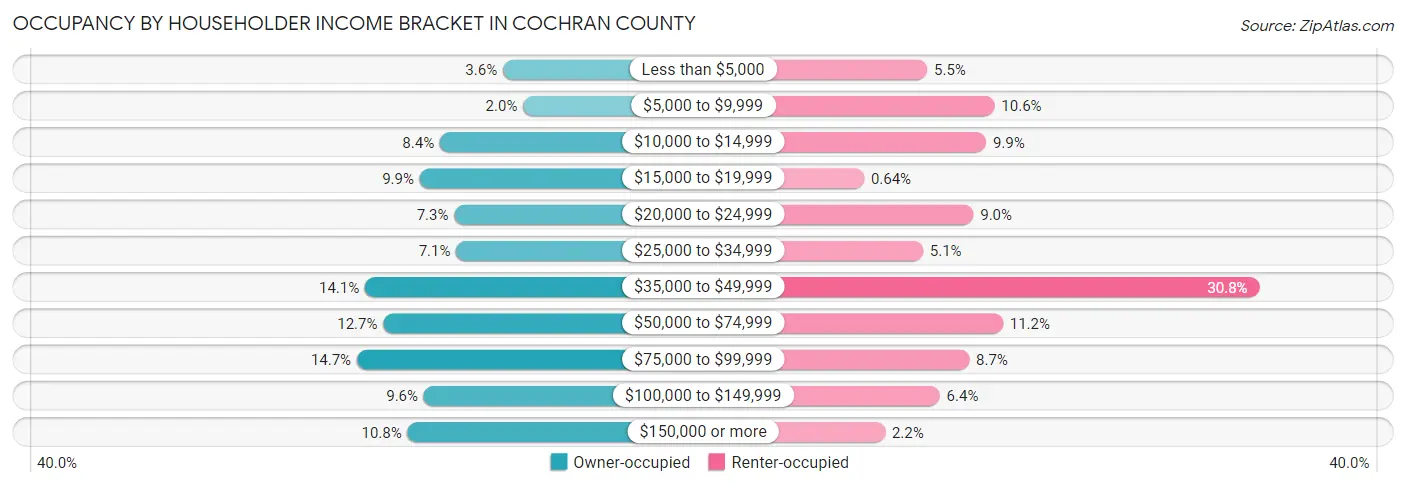
| Income Bracket | Owner-occupied | Renter-occupied |
| Less than $5,000 | 23 (3.5%) | 17 (5.4%) |
| $5,000 to $9,999 | 13 (2.0%) | 33 (10.6%) |
| $10,000 to $14,999 | 54 (8.4%) | 31 (9.9%) |
| $15,000 to $19,999 | 64 (9.9%) | 2 (0.6%) |
| $20,000 to $24,999 | 47 (7.3%) | 28 (9.0%) |
| $25,000 to $34,999 | 46 (7.1%) | 16 (5.1%) |
| $35,000 to $49,999 | 91 (14.1%) | 96 (30.8%) |
| $50,000 to $74,999 | 82 (12.7%) | 35 (11.2%) |
| $75,000 to $99,999 | 95 (14.7%) | 27 (8.6%) |
| $100,000 to $149,999 | 62 (9.6%) | 20 (6.4%) |
| $150,000 or more | 70 (10.8%) | 7 (2.2%) |
| Total | 647 (100.0%) | 312 (100.0%) |
Monthly Housing Cost Tiers in Cochran County
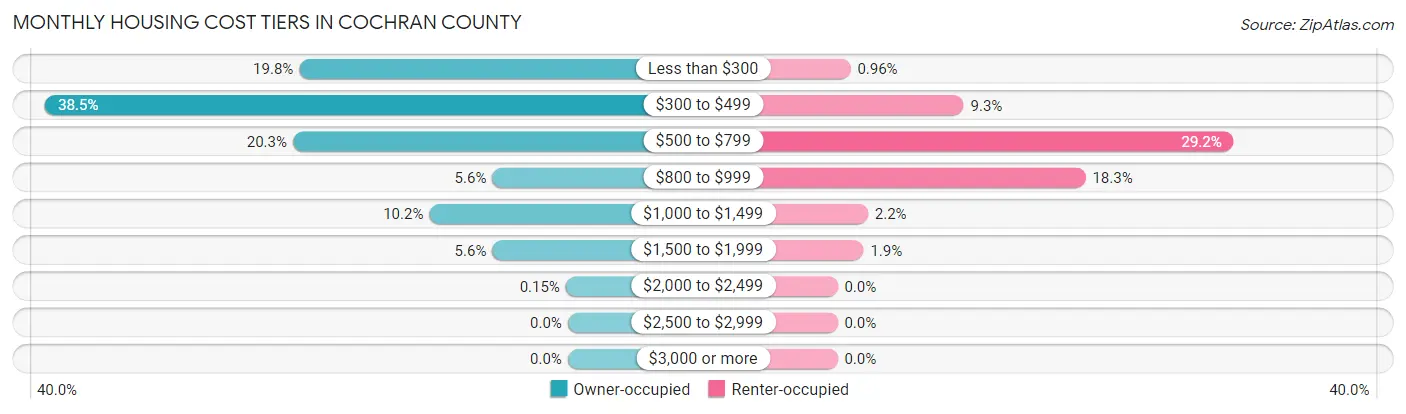
| Monthly Cost | Owner-occupied | Renter-occupied |
| Less than $300 | 128 (19.8%) | 3 (1.0%) |
| $300 to $499 | 249 (38.5%) | 29 (9.3%) |
| $500 to $799 | 131 (20.3%) | 91 (29.2%) |
| $800 to $999 | 36 (5.6%) | 57 (18.3%) |
| $1,000 to $1,499 | 66 (10.2%) | 7 (2.2%) |
| $1,500 to $1,999 | 36 (5.6%) | 6 (1.9%) |
| $2,000 to $2,499 | 1 (0.2%) | 0 (0.0%) |
| $2,500 to $2,999 | 0 (0.0%) | 0 (0.0%) |
| $3,000 or more | 0 (0.0%) | 0 (0.0%) |
| Total | 647 (100.0%) | 312 (100.0%) |
Physical Housing Characteristics in Cochran County
Housing Structures in Cochran County
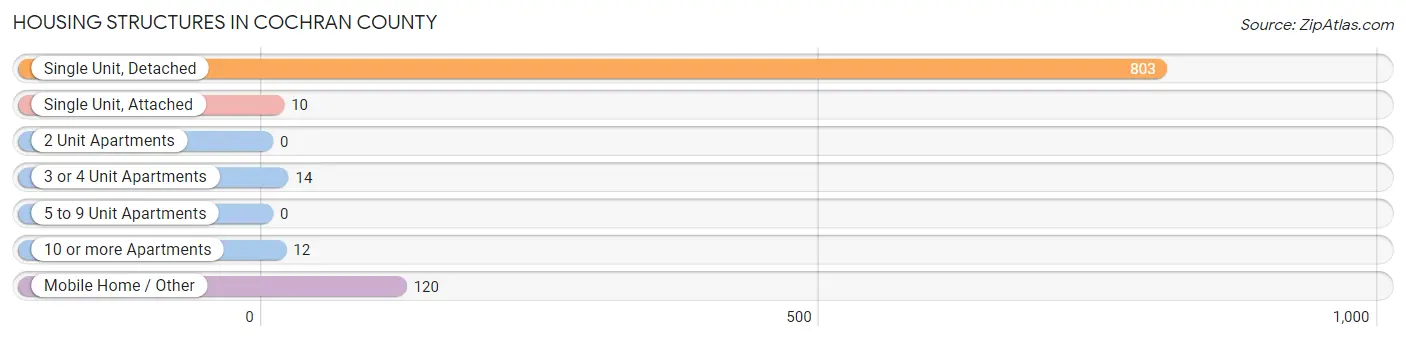
| Structure Type | # Housing Units | % Housing Units |
| Single Unit, Detached | 803 | 83.7% |
| Single Unit, Attached | 10 | 1.0% |
| 2 Unit Apartments | 0 | 0.0% |
| 3 or 4 Unit Apartments | 14 | 1.5% |
| 5 to 9 Unit Apartments | 0 | 0.0% |
| 10 or more Apartments | 12 | 1.3% |
| Mobile Home / Other | 120 | 12.5% |
| Total | 959 | 100.0% |
Housing Structures by Occupancy in Cochran County
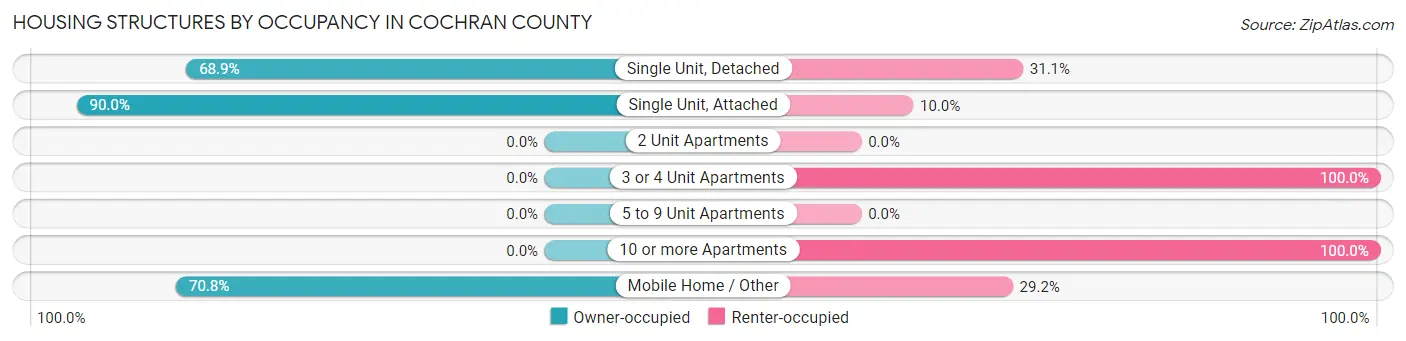
| Structure Type | Owner-occupied | Renter-occupied |
| Single Unit, Detached | 553 (68.9%) | 250 (31.1%) |
| Single Unit, Attached | 9 (90.0%) | 1 (10.0%) |
| 2 Unit Apartments | 0 (0.0%) | 0 (0.0%) |
| 3 or 4 Unit Apartments | 0 (0.0%) | 14 (100.0%) |
| 5 to 9 Unit Apartments | 0 (0.0%) | 0 (0.0%) |
| 10 or more Apartments | 0 (0.0%) | 12 (100.0%) |
| Mobile Home / Other | 85 (70.8%) | 35 (29.2%) |
| Total | 647 (67.5%) | 312 (32.5%) |
Housing Structures by Number of Rooms in Cochran County
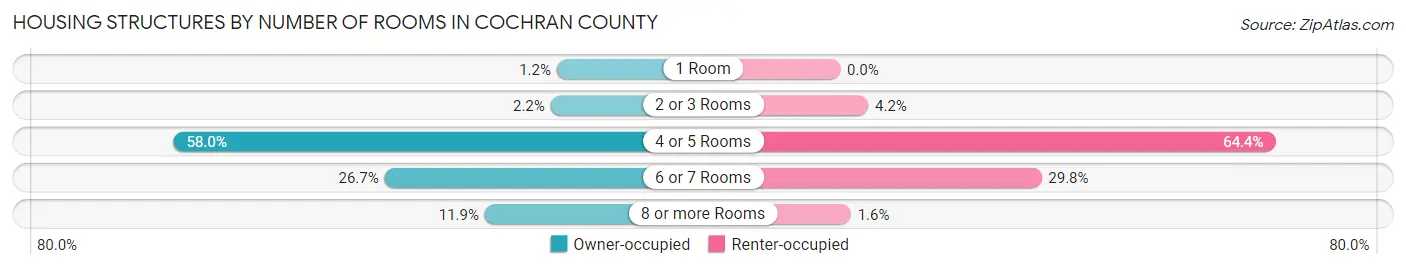
| Number of Rooms | Owner-occupied | Renter-occupied |
| 1 Room | 8 (1.2%) | 0 (0.0%) |
| 2 or 3 Rooms | 14 (2.2%) | 13 (4.2%) |
| 4 or 5 Rooms | 375 (58.0%) | 201 (64.4%) |
| 6 or 7 Rooms | 173 (26.7%) | 93 (29.8%) |
| 8 or more Rooms | 77 (11.9%) | 5 (1.6%) |
| Total | 647 (100.0%) | 312 (100.0%) |
Housing Structure by Heating Type in Cochran County
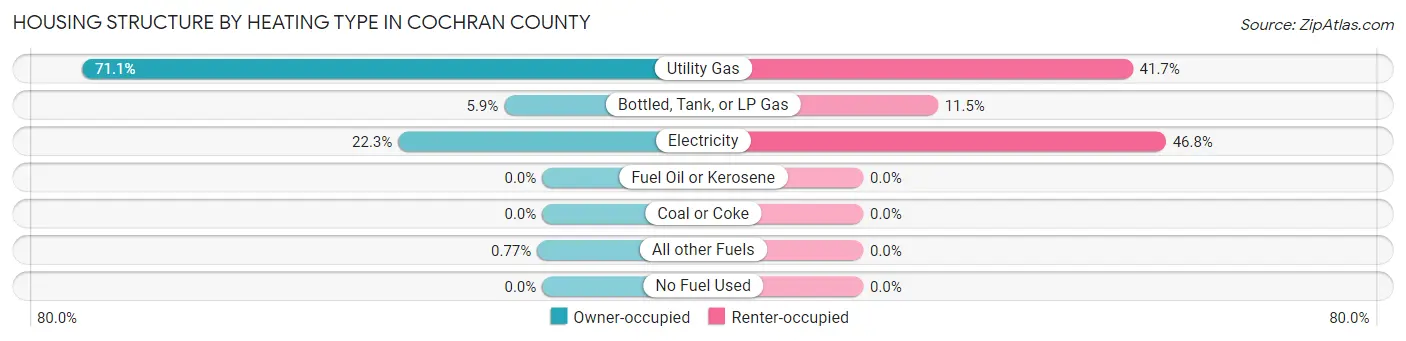
| Heating Type | Owner-occupied | Renter-occupied |
| Utility Gas | 460 (71.1%) | 130 (41.7%) |
| Bottled, Tank, or LP Gas | 38 (5.9%) | 36 (11.5%) |
| Electricity | 144 (22.3%) | 146 (46.8%) |
| Fuel Oil or Kerosene | 0 (0.0%) | 0 (0.0%) |
| Coal or Coke | 0 (0.0%) | 0 (0.0%) |
| All other Fuels | 5 (0.8%) | 0 (0.0%) |
| No Fuel Used | 0 (0.0%) | 0 (0.0%) |
| Total | 647 (100.0%) | 312 (100.0%) |
Household Vehicle Usage in Cochran County
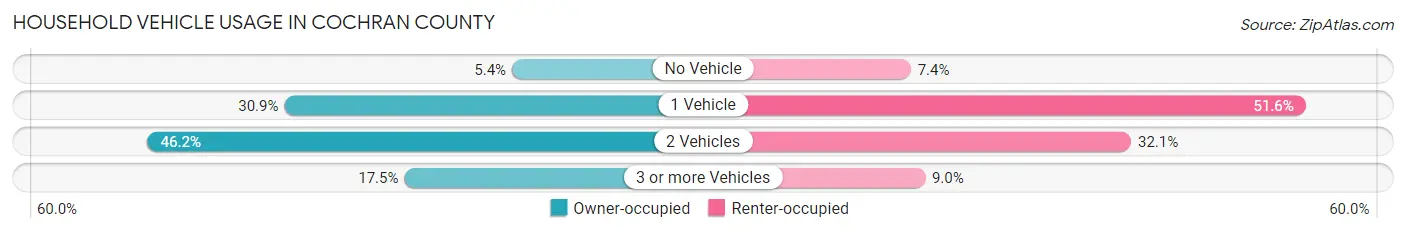
| Vehicles per Household | Owner-occupied | Renter-occupied |
| No Vehicle | 35 (5.4%) | 23 (7.4%) |
| 1 Vehicle | 200 (30.9%) | 161 (51.6%) |
| 2 Vehicles | 299 (46.2%) | 100 (32.1%) |
| 3 or more Vehicles | 113 (17.5%) | 28 (9.0%) |
| Total | 647 (100.0%) | 312 (100.0%) |
Real Estate & Mortgages in Cochran County
Real Estate and Mortgage Overview in Cochran County
| Characteristic | Without Mortgage | With Mortgage |
| Housing Units | 470 | 177 |
| Median Property Value | $32,000 | $95,300 |
| Median Household Income | $36,522 | $37 |
| Monthly Housing Costs | $372 | $0 |
| Real Estate Taxes | $561 | $14 |
Property Value by Mortgage Status in Cochran County
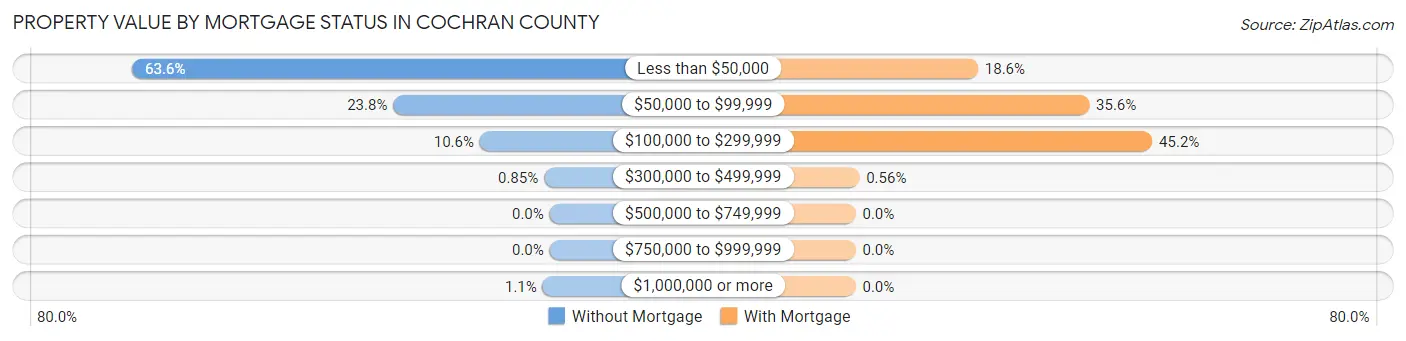
| Property Value | Without Mortgage | With Mortgage |
| Less than $50,000 | 299 (63.6%) | 33 (18.6%) |
| $50,000 to $99,999 | 112 (23.8%) | 63 (35.6%) |
| $100,000 to $299,999 | 50 (10.6%) | 80 (45.2%) |
| $300,000 to $499,999 | 4 (0.9%) | 1 (0.6%) |
| $500,000 to $749,999 | 0 (0.0%) | 0 (0.0%) |
| $750,000 to $999,999 | 0 (0.0%) | 0 (0.0%) |
| $1,000,000 or more | 5 (1.1%) | 0 (0.0%) |
| Total | 470 (100.0%) | 177 (100.0%) |
Household Income by Mortgage Status in Cochran County
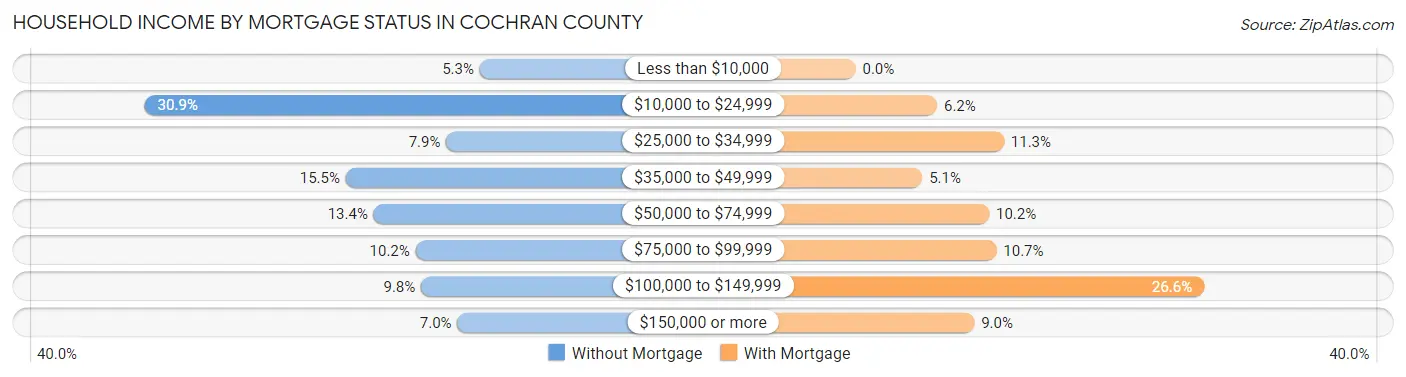
| Household Income | Without Mortgage | With Mortgage |
| Less than $10,000 | 25 (5.3%) | 0 (0.0%) |
| $10,000 to $24,999 | 145 (30.8%) | 11 (6.2%) |
| $25,000 to $34,999 | 37 (7.9%) | 20 (11.3%) |
| $35,000 to $49,999 | 73 (15.5%) | 9 (5.1%) |
| $50,000 to $74,999 | 63 (13.4%) | 18 (10.2%) |
| $75,000 to $99,999 | 48 (10.2%) | 19 (10.7%) |
| $100,000 to $149,999 | 46 (9.8%) | 47 (26.6%) |
| $150,000 or more | 33 (7.0%) | 16 (9.0%) |
| Total | 470 (100.0%) | 177 (100.0%) |
Property Value to Household Income Ratio in Cochran County
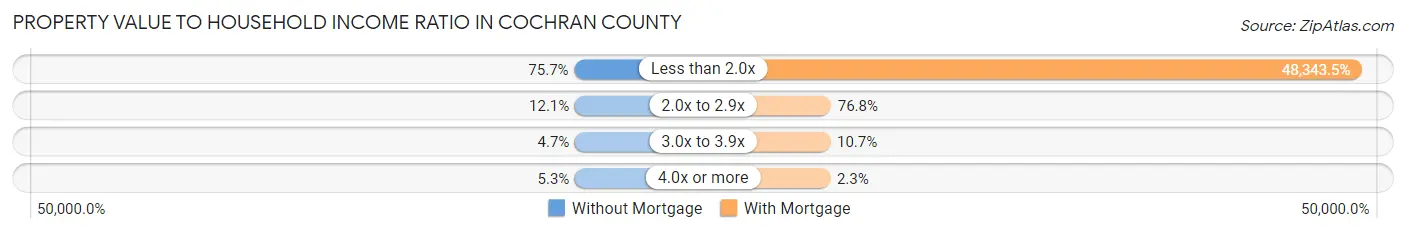
| Value-to-Income Ratio | Without Mortgage | With Mortgage |
| Less than 2.0x | 356 (75.7%) | 85,568 (48,343.5%) |
| 2.0x to 2.9x | 57 (12.1%) | 136 (76.8%) |
| 3.0x to 3.9x | 22 (4.7%) | 19 (10.7%) |
| 4.0x or more | 25 (5.3%) | 4 (2.3%) |
| Total | 470 (100.0%) | 177 (100.0%) |
Real Estate Taxes by Mortgage Status in Cochran County
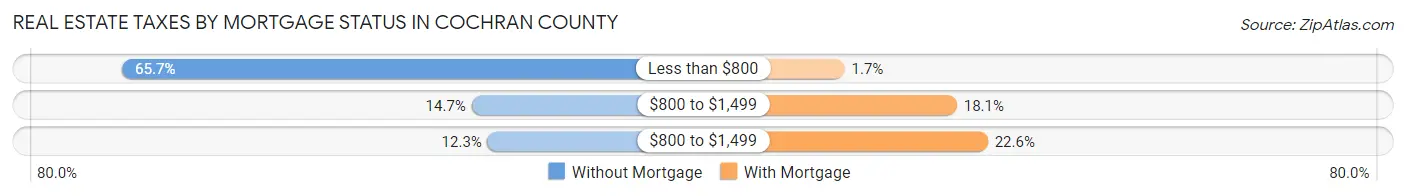
| Property Taxes | Without Mortgage | With Mortgage |
| Less than $800 | 309 (65.7%) | 3 (1.7%) |
| $800 to $1,499 | 69 (14.7%) | 32 (18.1%) |
| $800 to $1,499 | 58 (12.3%) | 40 (22.6%) |
| Total | 470 (100.0%) | 177 (100.0%) |
Health & Disability in Cochran County
Health Insurance Coverage by Age in Cochran County
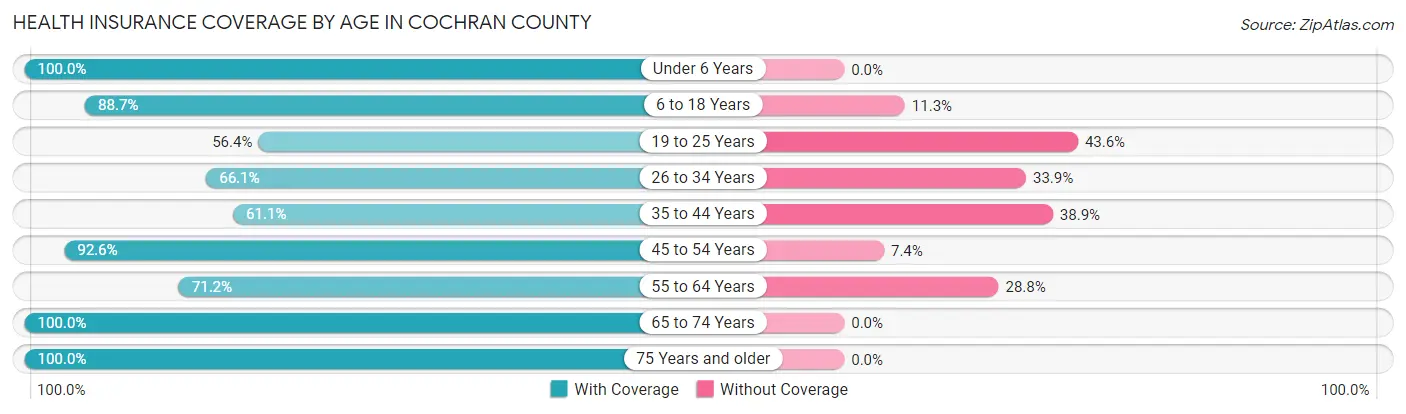
| Age Bracket | With Coverage | Without Coverage |
| Under 6 Years | 212 (100.0%) | 0 (0.0%) |
| 6 to 18 Years | 424 (88.7%) | 54 (11.3%) |
| 19 to 25 Years | 79 (56.4%) | 61 (43.6%) |
| 26 to 34 Years | 199 (66.1%) | 102 (33.9%) |
| 35 to 44 Years | 256 (61.1%) | 163 (38.9%) |
| 45 to 54 Years | 200 (92.6%) | 16 (7.4%) |
| 55 to 64 Years | 203 (71.2%) | 82 (28.8%) |
| 65 to 74 Years | 227 (100.0%) | 0 (0.0%) |
| 75 Years and older | 198 (100.0%) | 0 (0.0%) |
| Total | 1,998 (80.7%) | 478 (19.3%) |
Health Insurance Coverage by Citizenship Status in Cochran County
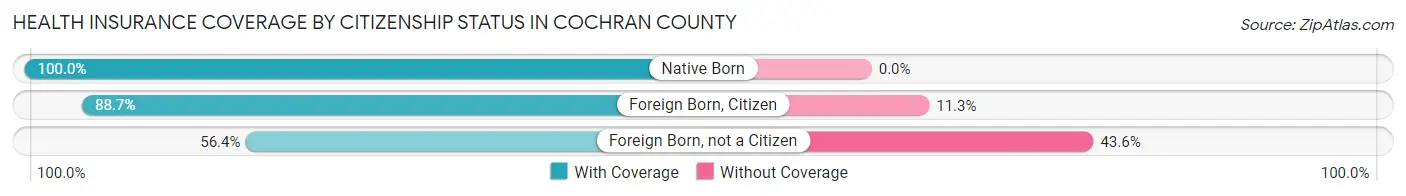
| Citizenship Status | With Coverage | Without Coverage |
| Native Born | 212 (100.0%) | 0 (0.0%) |
| Foreign Born, Citizen | 424 (88.7%) | 54 (11.3%) |
| Foreign Born, not a Citizen | 79 (56.4%) | 61 (43.6%) |
Health Insurance Coverage by Household Income in Cochran County
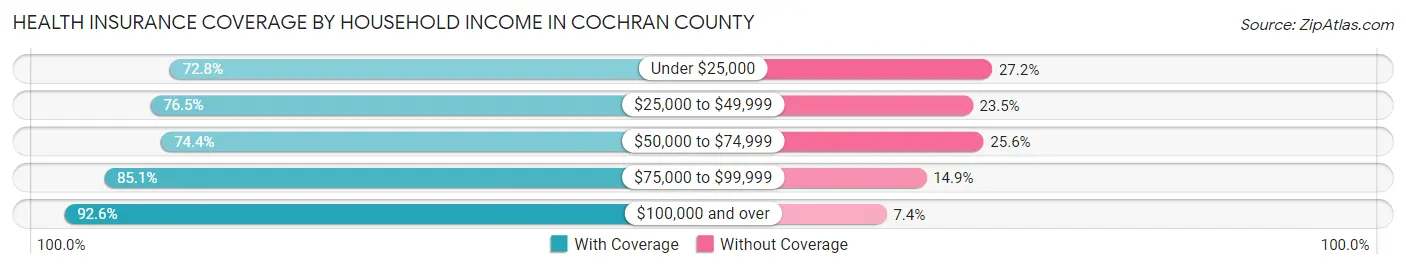
| Household Income | With Coverage | Without Coverage |
| Under $25,000 | 447 (72.8%) | 167 (27.2%) |
| $25,000 to $49,999 | 432 (76.5%) | 133 (23.5%) |
| $50,000 to $74,999 | 247 (74.4%) | 85 (25.6%) |
| $75,000 to $99,999 | 286 (85.1%) | 50 (14.9%) |
| $100,000 and over | 486 (92.6%) | 39 (7.4%) |
Public vs Private Health Insurance Coverage by Age in Cochran County
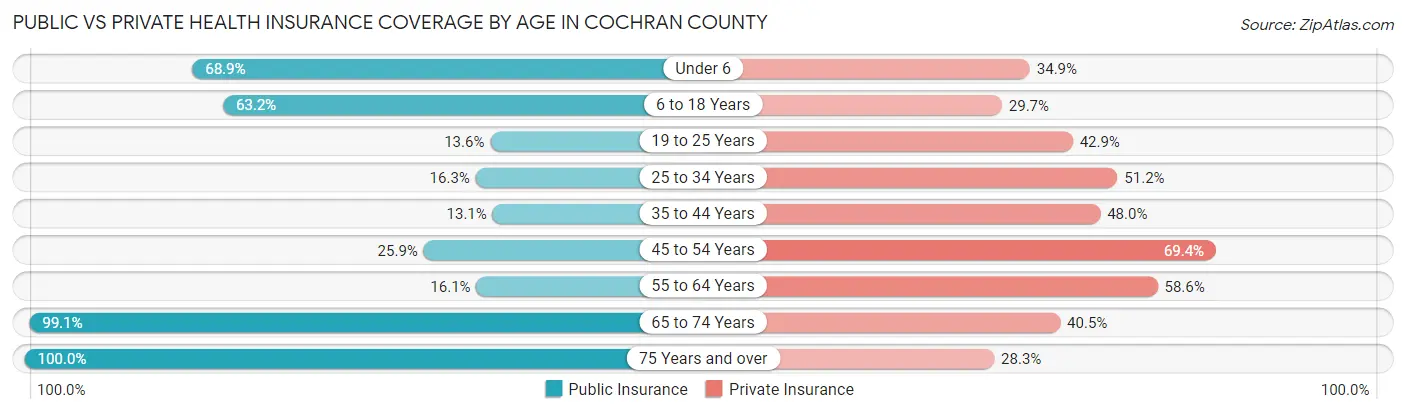
| Age Bracket | Public Insurance | Private Insurance |
| Under 6 | 146 (68.9%) | 74 (34.9%) |
| 6 to 18 Years | 302 (63.2%) | 142 (29.7%) |
| 19 to 25 Years | 19 (13.6%) | 60 (42.9%) |
| 25 to 34 Years | 49 (16.3%) | 154 (51.2%) |
| 35 to 44 Years | 55 (13.1%) | 201 (48.0%) |
| 45 to 54 Years | 56 (25.9%) | 150 (69.4%) |
| 55 to 64 Years | 46 (16.1%) | 167 (58.6%) |
| 65 to 74 Years | 225 (99.1%) | 92 (40.5%) |
| 75 Years and over | 198 (100.0%) | 56 (28.3%) |
| Total | 1,096 (44.3%) | 1,096 (44.3%) |
Disability Status by Sex by Age in Cochran County
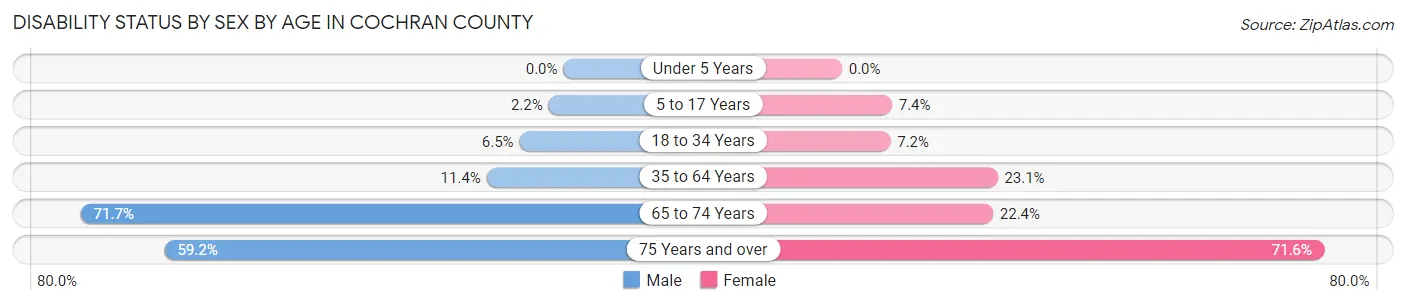
| Age Bracket | Male | Female |
| Under 5 Years | 0 (0.0%) | 0 (0.0%) |
| 5 to 17 Years | 5 (2.2%) | 17 (7.4%) |
| 18 to 34 Years | 15 (6.5%) | 18 (7.2%) |
| 35 to 64 Years | 55 (11.4%) | 101 (23.1%) |
| 65 to 74 Years | 86 (71.7%) | 24 (22.4%) |
| 75 Years and over | 61 (59.2%) | 68 (71.6%) |
Disability Class by Sex by Age in Cochran County
Disability Class: Hearing Difficulty
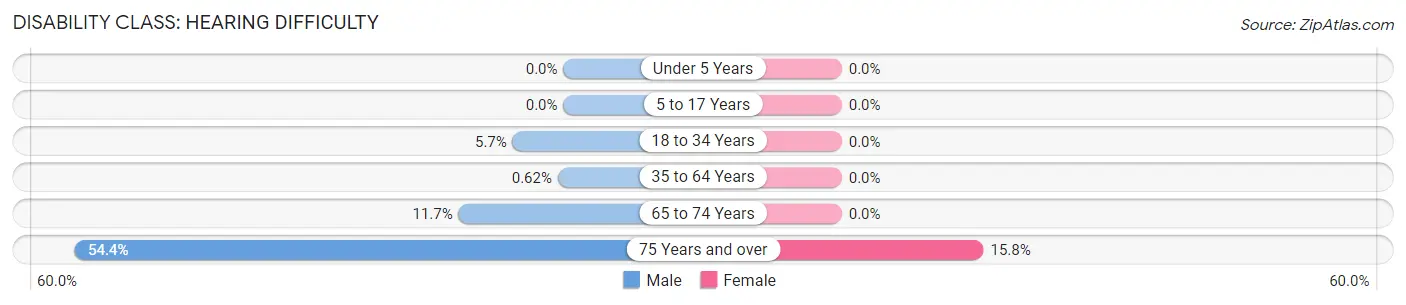
| Age Bracket | Male | Female |
| Under 5 Years | 0 (0.0%) | 0 (0.0%) |
| 5 to 17 Years | 0 (0.0%) | 0 (0.0%) |
| 18 to 34 Years | 13 (5.7%) | 0 (0.0%) |
| 35 to 64 Years | 3 (0.6%) | 0 (0.0%) |
| 65 to 74 Years | 14 (11.7%) | 0 (0.0%) |
| 75 Years and over | 56 (54.4%) | 15 (15.8%) |
Disability Class: Vision Difficulty
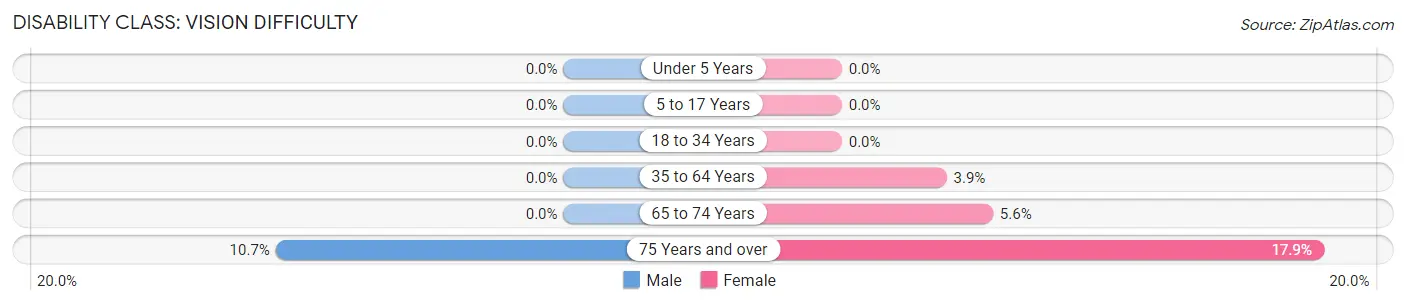
| Age Bracket | Male | Female |
| Under 5 Years | 0 (0.0%) | 0 (0.0%) |
| 5 to 17 Years | 0 (0.0%) | 0 (0.0%) |
| 18 to 34 Years | 0 (0.0%) | 0 (0.0%) |
| 35 to 64 Years | 0 (0.0%) | 17 (3.9%) |
| 65 to 74 Years | 0 (0.0%) | 6 (5.6%) |
| 75 Years and over | 11 (10.7%) | 17 (17.9%) |
Disability Class: Cognitive Difficulty
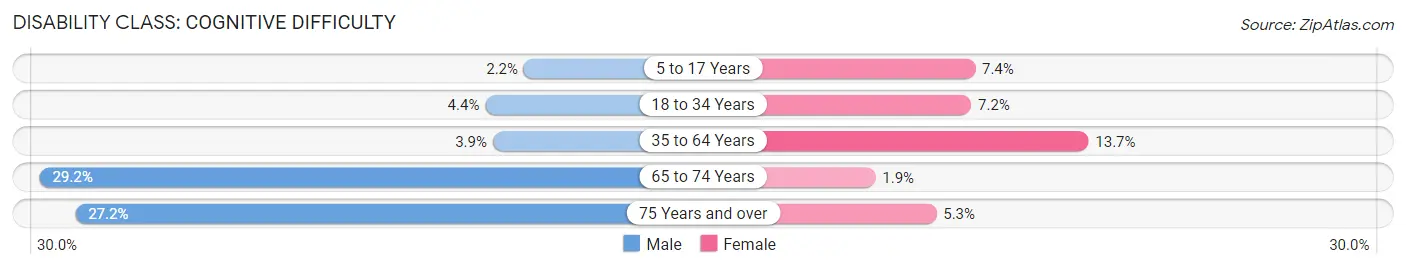
| Age Bracket | Male | Female |
| 5 to 17 Years | 5 (2.2%) | 17 (7.4%) |
| 18 to 34 Years | 10 (4.3%) | 18 (7.2%) |
| 35 to 64 Years | 19 (3.9%) | 60 (13.7%) |
| 65 to 74 Years | 35 (29.2%) | 2 (1.9%) |
| 75 Years and over | 28 (27.2%) | 5 (5.3%) |
Disability Class: Ambulatory Difficulty
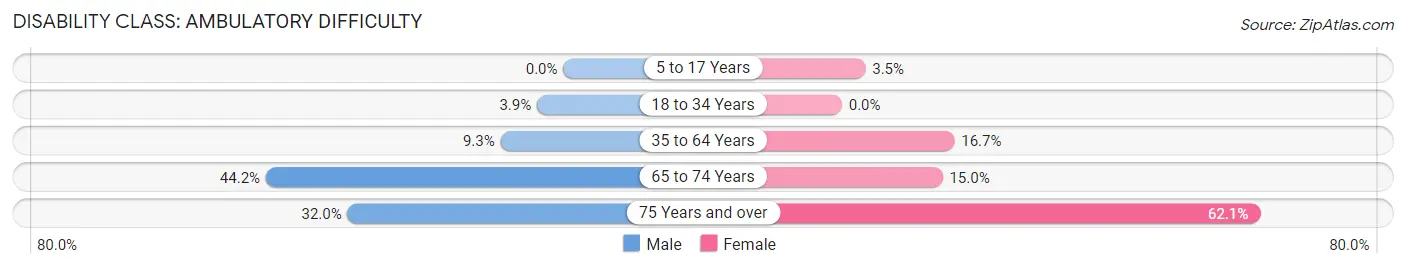
| Age Bracket | Male | Female |
| 5 to 17 Years | 0 (0.0%) | 8 (3.5%) |
| 18 to 34 Years | 9 (3.9%) | 0 (0.0%) |
| 35 to 64 Years | 45 (9.3%) | 73 (16.7%) |
| 65 to 74 Years | 53 (44.2%) | 16 (14.9%) |
| 75 Years and over | 33 (32.0%) | 59 (62.1%) |
Disability Class: Self-Care Difficulty
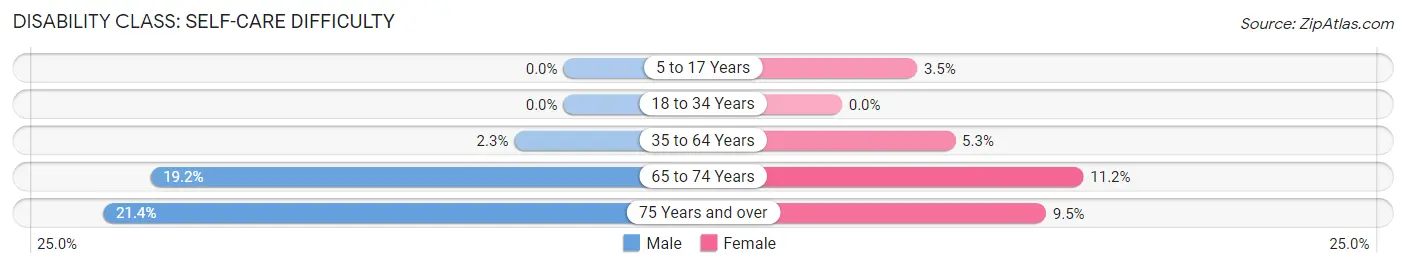
| Age Bracket | Male | Female |
| 5 to 17 Years | 0 (0.0%) | 8 (3.5%) |
| 18 to 34 Years | 0 (0.0%) | 0 (0.0%) |
| 35 to 64 Years | 11 (2.3%) | 23 (5.3%) |
| 65 to 74 Years | 23 (19.2%) | 12 (11.2%) |
| 75 Years and over | 22 (21.4%) | 9 (9.5%) |
Technology Access in Cochran County
Computing Device Access in Cochran County
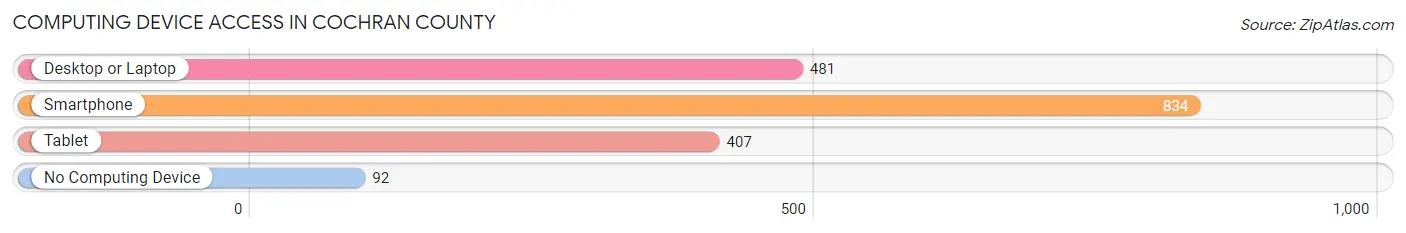
| Device Type | # Households | % Households |
| Desktop or Laptop | 481 | 50.2% |
| Smartphone | 834 | 87.0% |
| Tablet | 407 | 42.4% |
| No Computing Device | 92 | 9.6% |
| Total | 959 | 100.0% |
Internet Access in Cochran County
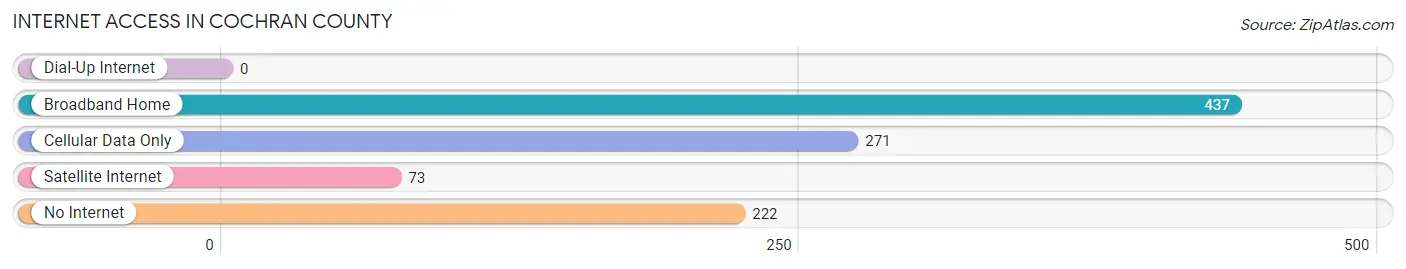
| Internet Type | # Households | % Households |
| Dial-Up Internet | 0 | 0.0% |
| Broadband Home | 437 | 45.6% |
| Cellular Data Only | 271 | 28.3% |
| Satellite Internet | 73 | 7.6% |
| No Internet | 222 | 23.2% |
| Total | 959 | 100.0% |
Cochran County Summary
Cochran County is located in the northwestern part of the state of Texas, in the South Plains region of the state. It is bordered by Yoakum County to the north, Hockley County to the east, Terry County to the south, and Gaines County to the west. The county seat is Morton, and the county has a total area of 890 square miles.
History
Cochran County was established in 1876 and named for Robert E. Cochran, a Texas state senator. The county was originally part of the Bexar District, which was created in 1858. The county was organized in 1876 and the first county seat was located in Whiteface. In 1891, the county seat was moved to Morton.
Geography
Cochran County is located in the South Plains region of Texas. The county is mostly flat, with some rolling hills in the northern part of the county. The terrain is mostly covered in grasslands, with some areas of mesquite and cactus. The county is drained by the White River and its tributaries.
The climate of Cochran County is semi-arid, with hot summers and mild winters. The average annual precipitation is about 18 inches.
Economy
The economy of Cochran County is largely based on agriculture. The county is one of the leading producers of cotton in the state, and other crops grown in the county include corn, sorghum, wheat, and hay. Livestock production is also important to the economy, with cattle, sheep, and goats being raised in the county.
The county also has some oil and gas production, and there are several wind farms located in the county.
Demographics
As of the 2010 census, the population of Cochran County was 3,127. The population is mostly white (83.3%), with a small Hispanic population (14.2%). The median household income in the county is $37,917, and the median age is 37.7 years.
Conclusion
Cochran County is located in the northwestern part of Texas, in the South Plains region of the state. The county was established in 1876 and named for Robert E. Cochran, a Texas state senator. The economy of the county is largely based on agriculture, with cotton, corn, sorghum, wheat, and hay being the main crops. The population of the county is mostly white, with a small Hispanic population. The median household income in the county is $37,917, and the median age is 37.7 years.
Common Questions
What is Per Capita Income in Cochran County?
Per Capita income in Cochran County is $23,748.
What is the Median Family Income in Cochran County?
Median Family Income in Cochran County is $53,068.
What is the Median Household income in Cochran County?
Median Household Income in Cochran County is $41,597.
What is Income or Wage Gap in Cochran County?
Income or Wage Gap in Cochran County is 40.4%.
Women in Cochran County earn 59.6 cents for every dollar earned by a man.
What is Inequality or Gini Index in Cochran County?
Inequality or Gini Index in Cochran County is 0.47.
What is the Total Population of Cochran County?
Total Population of Cochran County is 2,529.
What is the Total Male Population of Cochran County?
Total Male Population of Cochran County is 1,305.
What is the Total Female Population of Cochran County?
Total Female Population of Cochran County is 1,224.
What is the Ratio of Males per 100 Females in Cochran County?
There are 106.62 Males per 100 Females in Cochran County.
What is the Ratio of Females per 100 Males in Cochran County?
There are 93.79 Females per 100 Males in Cochran County.
What is the Median Population Age in Cochran County?
Median Population Age in Cochran County is 37.4 Years.
What is the Average Family Size in Cochran County
Average Family Size in Cochran County is 3.0 People.
What is the Average Household Size in Cochran County
Average Household Size in Cochran County is 2.5 People.
How Large is the Labor Force in Cochran County?
There are 1,152 People in the Labor Forcein in Cochran County.
What is the Percentage of People in the Labor Force in Cochran County?
59.8% of People are in the Labor Force in Cochran County.
What is the Unemployment Rate in Cochran County?
Unemployment Rate in Cochran County is 7.1%.