Childress County, TX Map & Demographics
Childress County Map
Childress County Overview
$27,466
PER CAPITA INCOME
$57,031
AVG FAMILY INCOME
$56,063
AVG HOUSEHOLD INCOME
36.6%
WAGE / INCOME GAP [ % ]
63.4¢/ $1
WAGE / INCOME GAP [ $ ]
0.47
INEQUALITY / GINI INDEX
6,781
TOTAL POPULATION
4,393
MALE POPULATION
2,388
FEMALE POPULATION
183.96
MALES / 100 FEMALES
54.36
FEMALES / 100 MALES
32.6
MEDIAN AGE
3.0
AVG FAMILY SIZE
2.8
AVG HOUSEHOLD SIZE
3,121
LABOR FORCE [ PEOPLE ]
55.2%
PERCENT IN LABOR FORCE
8.6%
UNEMPLOYMENT RATE
Income in Childress County
Income Overview in Childress County
Per Capita Income in Childress County is $27,466, while median incomes of families and households are $57,031 and $56,063 respectively.
| Characteristic | Number | Measure |
| Per Capita Income | 6,781 | $27,466 |
| Median Family Income | 1,427 | $57,031 |
| Mean Family Income | 1,427 | $74,761 |
| Median Household Income | 1,892 | $56,063 |
| Mean Household Income | 1,892 | $76,358 |
| Income Deficit | 1,427 | $0 |
| Wage / Income Gap (%) | 6,781 | 36.65% |
| Wage / Income Gap ($) | 6,781 | 63.35¢ per $1 |
| Gini / Inequality Index | 6,781 | 0.47 |
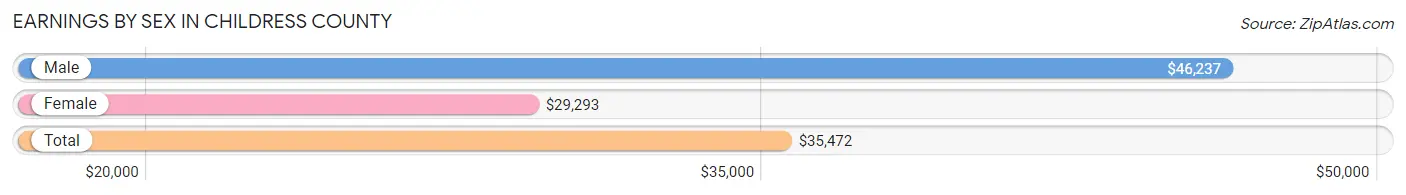
Earnings by Sex in Childress County
Average Earnings in Childress County are $35,472, $46,237 for men and $29,293 for women, a difference of 36.6%.
| Sex | Number | Average Earnings |
| Male | 2,013 (62.5%) | $46,237 |
| Female | 1,206 (37.5%) | $29,293 |
| Total | 3,219 (100.0%) | $35,472 |
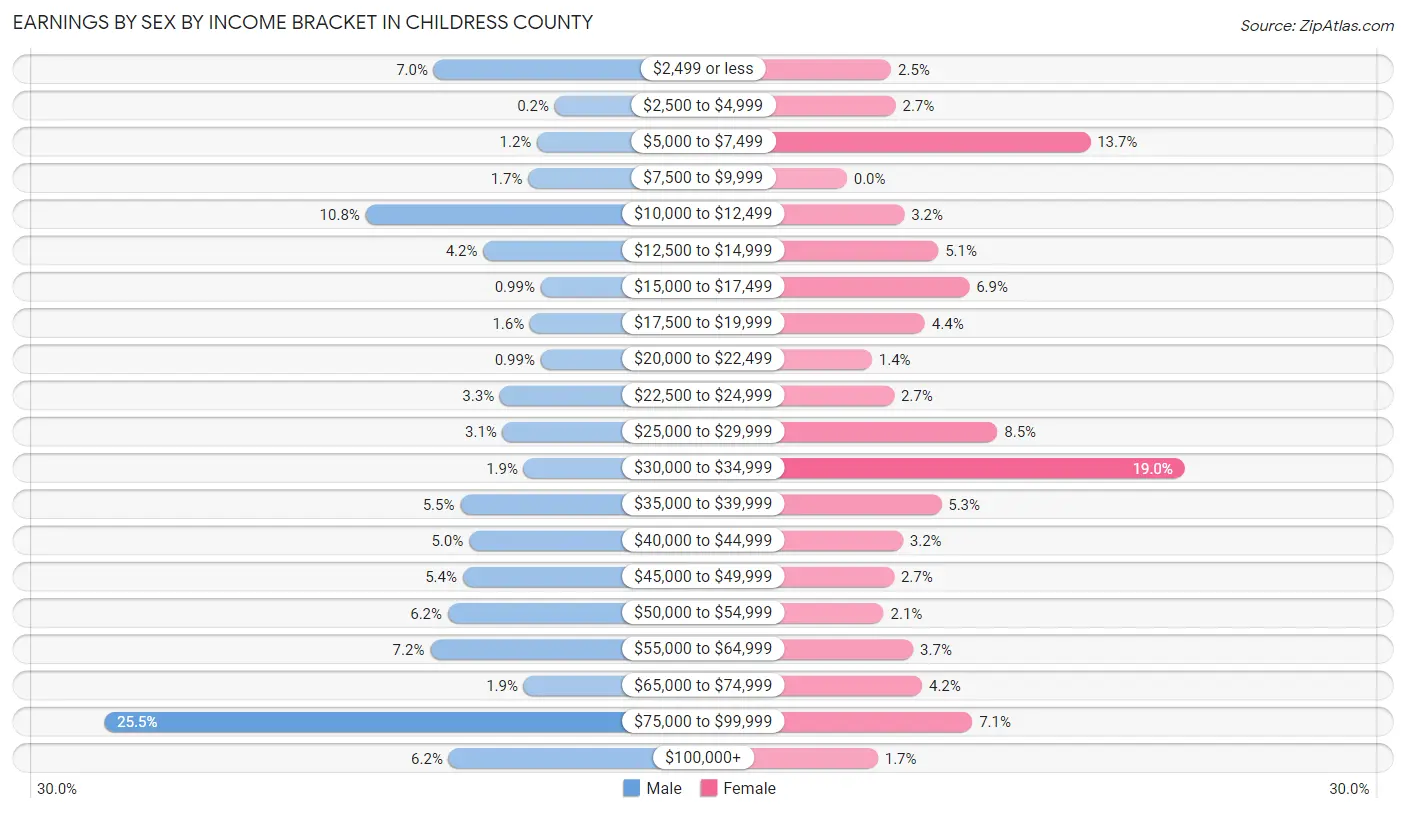
Earnings by Sex by Income Bracket in Childress County
The most common earnings brackets in Childress County are $75,000 to $99,999 for men (514 | 25.5%) and $30,000 to $34,999 for women (229 | 19.0%).
| Income | Male | Female |
| $2,499 or less | 141 (7.0%) | 30 (2.5%) |
| $2,500 to $4,999 | 4 (0.2%) | 33 (2.7%) |
| $5,000 to $7,499 | 24 (1.2%) | 165 (13.7%) |
| $7,500 to $9,999 | 34 (1.7%) | 0 (0.0%) |
| $10,000 to $12,499 | 218 (10.8%) | 39 (3.2%) |
| $12,500 to $14,999 | 85 (4.2%) | 62 (5.1%) |
| $15,000 to $17,499 | 20 (1.0%) | 83 (6.9%) |
| $17,500 to $19,999 | 32 (1.6%) | 53 (4.4%) |
| $20,000 to $22,499 | 20 (1.0%) | 17 (1.4%) |
| $22,500 to $24,999 | 66 (3.3%) | 32 (2.6%) |
| $25,000 to $29,999 | 63 (3.1%) | 102 (8.5%) |
| $30,000 to $34,999 | 39 (1.9%) | 229 (19.0%) |
| $35,000 to $39,999 | 111 (5.5%) | 64 (5.3%) |
| $40,000 to $44,999 | 101 (5.0%) | 38 (3.2%) |
| $45,000 to $49,999 | 108 (5.4%) | 32 (2.6%) |
| $50,000 to $54,999 | 125 (6.2%) | 25 (2.1%) |
| $55,000 to $64,999 | 145 (7.2%) | 45 (3.7%) |
| $65,000 to $74,999 | 39 (1.9%) | 51 (4.2%) |
| $75,000 to $99,999 | 514 (25.5%) | 85 (7.0%) |
| $100,000+ | 124 (6.2%) | 21 (1.7%) |
| Total | 2,013 (100.0%) | 1,206 (100.0%) |
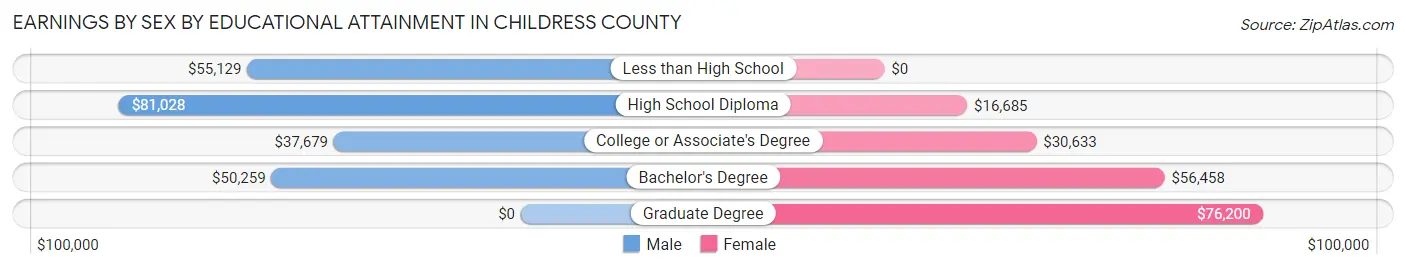
Earnings by Sex by Educational Attainment in Childress County
Average earnings in Childress County are $50,670 for men and $28,995 for women, a difference of 42.8%. Men with an educational attainment of high school diploma enjoy the highest average annual earnings of $81,028, while those with college or associate's degree education earn the least with $37,679. Women with an educational attainment of graduate degree earn the most with the average annual earnings of $76,200, while those with high school diploma education have the smallest earnings of $16,685.
| Educational Attainment | Male Income | Female Income |
| Less than High School | $55,129 | $0 |
| High School Diploma | $81,028 | $16,685 |
| College or Associate's Degree | $37,679 | $30,633 |
| Bachelor's Degree | $50,259 | $56,458 |
| Graduate Degree | - | - |
| Total | $50,670 | $28,995 |
Family Income in Childress County
Family Income Brackets in Childress County
According to the Childress County family income data, there are 260 families falling into the $50,000 to $74,999 income range, which is the most common income bracket and makes up 18.2% of all families. Conversely, the less than $10,000 income bracket is the least frequent group with only 4 families (0.3%) belonging to this category.
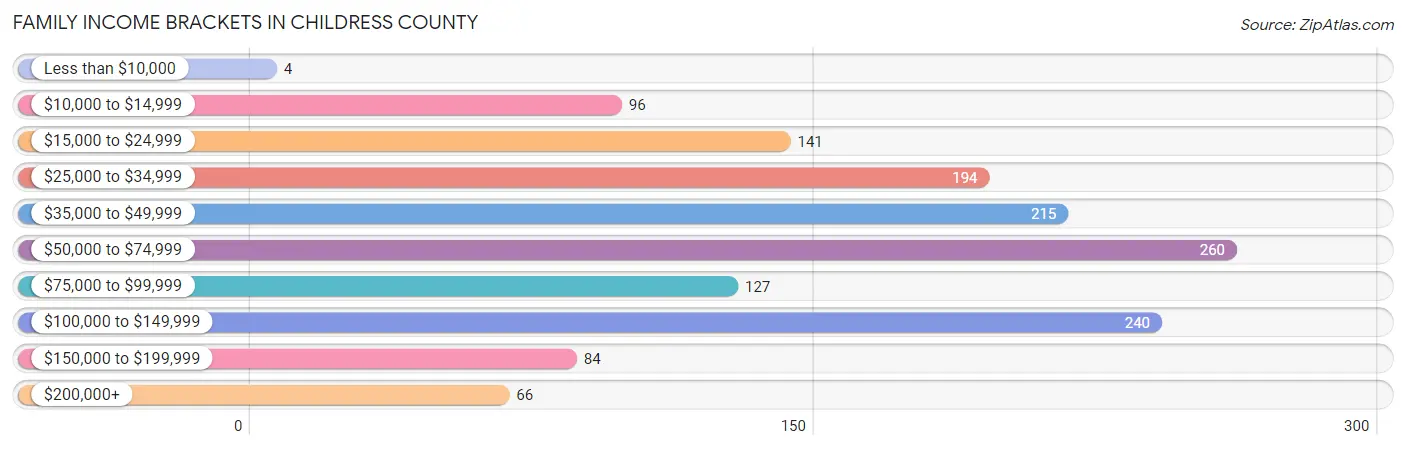
| Income Bracket | # Families | % Families |
| Less than $10,000 | 4 | 0.3% |
| $10,000 to $14,999 | 96 | 6.7% |
| $15,000 to $24,999 | 141 | 9.9% |
| $25,000 to $34,999 | 194 | 13.6% |
| $35,000 to $49,999 | 215 | 15.1% |
| $50,000 to $74,999 | 260 | 18.2% |
| $75,000 to $99,999 | 127 | 8.9% |
| $100,000 to $149,999 | 240 | 16.8% |
| $150,000 to $199,999 | 84 | 5.9% |
| $200,000+ | 66 | 4.6% |
Family Income by Famaliy Size in Childress County
4-person families (167 | 11.7%) account for the highest median family income in Childress County with $70,172 per family, while 2-person families (746 | 52.3%) have the highest median income of $32,438 per family member.
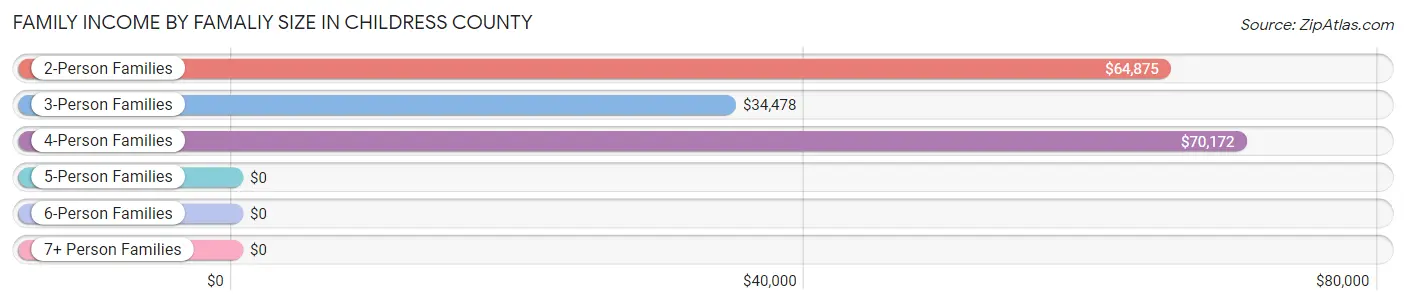
| Income Bracket | # Families | Median Income |
| 2-Person Families | 746 (52.3%) | $64,875 |
| 3-Person Families | 424 (29.7%) | $34,478 |
| 4-Person Families | 167 (11.7%) | $70,172 |
| 5-Person Families | 56 (3.9%) | $0 |
| 6-Person Families | 27 (1.9%) | $0 |
| 7+ Person Families | 7 (0.5%) | $0 |
| Total | 1,427 (100.0%) | $57,031 |
Family Income by Number of Earners in Childress County
The median family income in Childress County is $57,031, with families comprising 3+ earners (88) having the highest median family income of $173,611, while families with 1 earner (743) have the lowest median family income of $36,745, accounting for 6.2% and 52.1% of families, respectively.
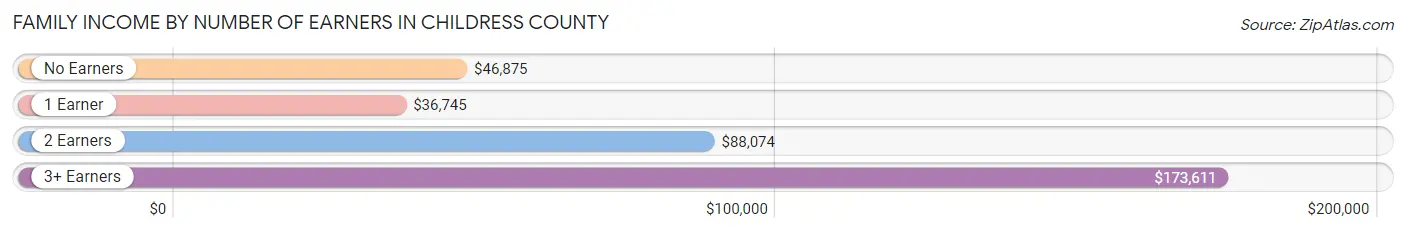
| Number of Earners | # Families | Median Income |
| No Earners | 123 (8.6%) | $46,875 |
| 1 Earner | 743 (52.1%) | $36,745 |
| 2 Earners | 473 (33.2%) | $88,074 |
| 3+ Earners | 88 (6.2%) | $173,611 |
| Total | 1,427 (100.0%) | $57,031 |
Household Income in Childress County
Household Income Brackets in Childress County
With 331 households falling in the category, the $100,000 to $149,999 income range is the most frequent in Childress County, accounting for 17.5% of all households. In contrast, only 87 households (4.6%) fall into the $200,000+ income bracket, making it the least populous group.
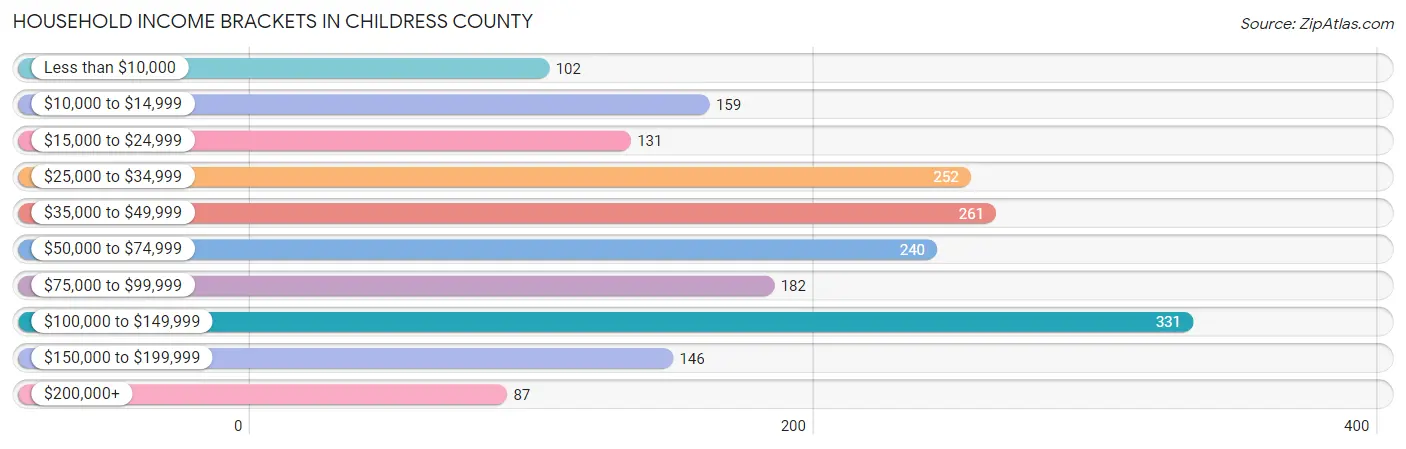
| Income Bracket | # Households | % Households |
| Less than $10,000 | 102 | 5.4% |
| $10,000 to $14,999 | 159 | 8.4% |
| $15,000 to $24,999 | 131 | 6.9% |
| $25,000 to $34,999 | 252 | 13.3% |
| $35,000 to $49,999 | 261 | 13.8% |
| $50,000 to $74,999 | 240 | 12.7% |
| $75,000 to $99,999 | 182 | 9.6% |
| $100,000 to $149,999 | 331 | 17.5% |
| $150,000 to $199,999 | 146 | 7.7% |
| $200,000+ | 87 | 4.6% |
Household Income by Householder Age in Childress County
The median household income in Childress County is $56,063, with the highest median household income of $58,125 found in the 25 to 44 years age bracket for the primary householder. A total of 624 households (33.0%) fall into this category. Meanwhile, the 15 to 24 years age bracket for the primary householder has the lowest median household income of $0, with 33 households (1.7%) in this group.
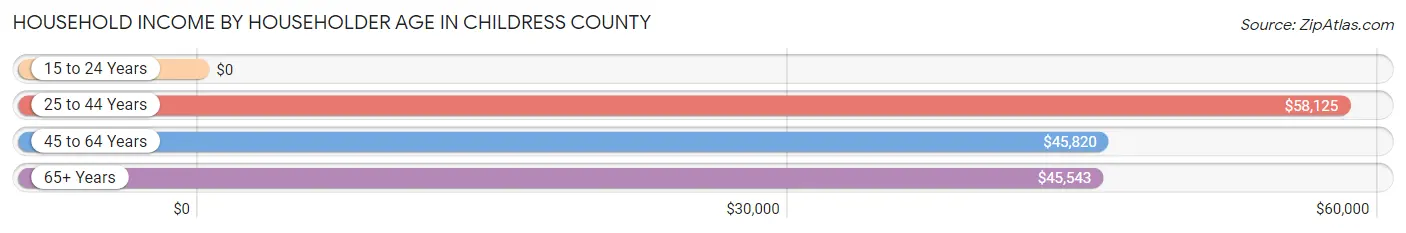
| Income Bracket | # Households | Median Income |
| 15 to 24 Years | 33 (1.7%) | $0 |
| 25 to 44 Years | 624 (33.0%) | $58,125 |
| 45 to 64 Years | 589 (31.1%) | $45,820 |
| 65+ Years | 646 (34.1%) | $45,543 |
| Total | 1,892 (100.0%) | $56,063 |
Poverty in Childress County
Income Below Poverty by Sex and Age in Childress County
With 16.4% poverty level for males and 13.4% for females among the residents of Childress County, under 5 year old males and 35 to 44 year old females are the most vulnerable to poverty, with 116 males (50.2%) and 130 females (28.1%) in their respective age groups living below the poverty level.
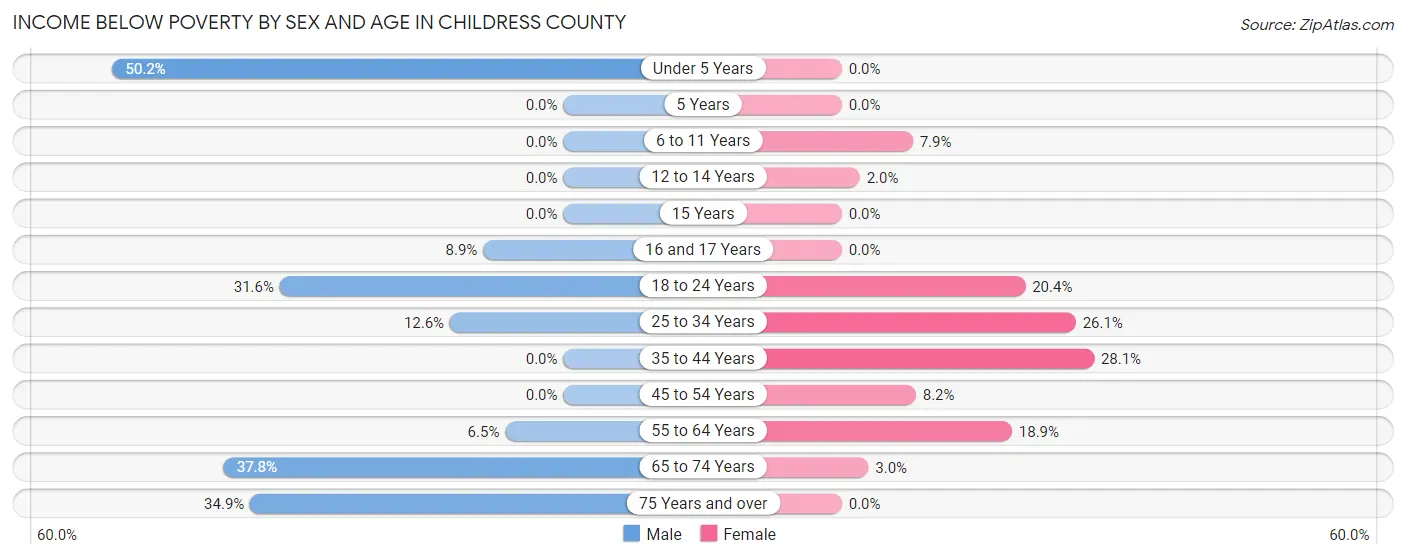
| Age Bracket | Male | Female |
| Under 5 Years | 116 (50.2%) | 0 (0.0%) |
| 5 Years | 0 (0.0%) | 0 (0.0%) |
| 6 to 11 Years | 0 (0.0%) | 26 (7.9%) |
| 12 to 14 Years | 0 (0.0%) | 2 (2.0%) |
| 15 Years | 0 (0.0%) | 0 (0.0%) |
| 16 and 17 Years | 10 (8.9%) | 0 (0.0%) |
| 18 to 24 Years | 48 (31.6%) | 19 (20.4%) |
| 25 to 34 Years | 130 (12.6%) | 62 (26.1%) |
| 35 to 44 Years | 0 (0.0%) | 130 (28.1%) |
| 45 to 54 Years | 0 (0.0%) | 21 (8.2%) |
| 55 to 64 Years | 20 (6.5%) | 43 (18.9%) |
| 65 to 74 Years | 107 (37.8%) | 8 (3.0%) |
| 75 Years and over | 60 (34.9%) | 0 (0.0%) |
| Total | 491 (16.4%) | 311 (13.4%) |
Income Above Poverty by Sex and Age in Childress County
According to the poverty statistics in Childress County, males aged 5 years and females aged under 5 years are the age groups that are most secure financially, with 100.0% of males and 100.0% of females in these age groups living above the poverty line.
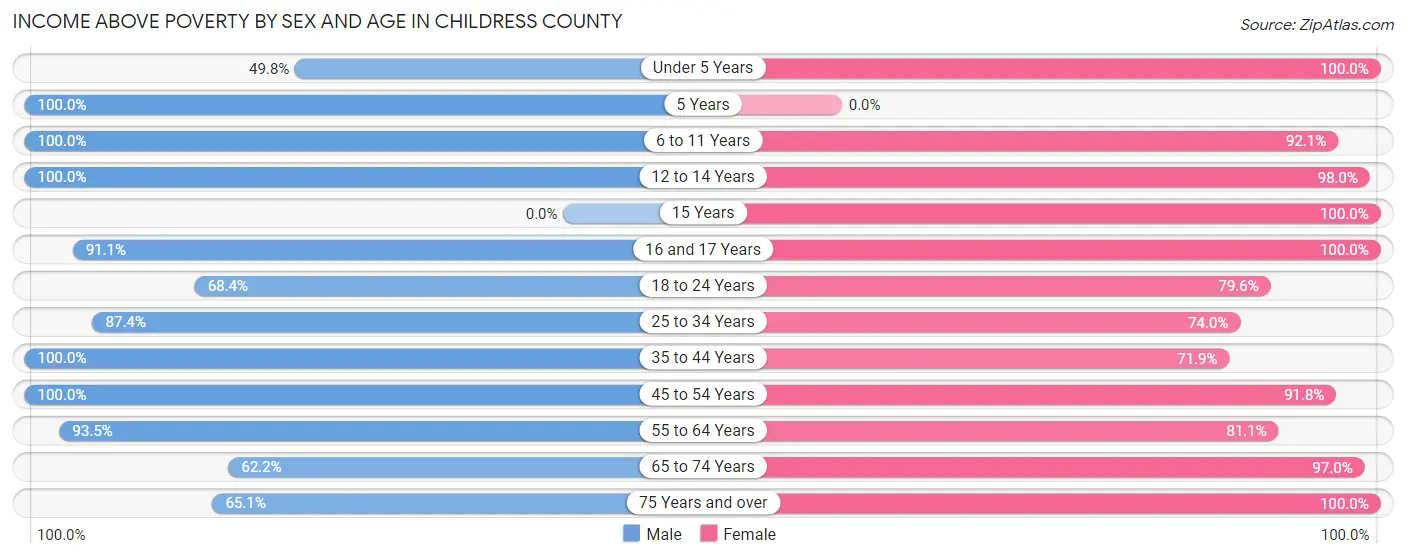
| Age Bracket | Male | Female |
| Under 5 Years | 115 (49.8%) | 134 (100.0%) |
| 5 Years | 14 (100.0%) | 0 (0.0%) |
| 6 to 11 Years | 206 (100.0%) | 303 (92.1%) |
| 12 to 14 Years | 63 (100.0%) | 98 (98.0%) |
| 15 Years | 0 (0.0%) | 36 (100.0%) |
| 16 and 17 Years | 102 (91.1%) | 18 (100.0%) |
| 18 to 24 Years | 104 (68.4%) | 74 (79.6%) |
| 25 to 34 Years | 899 (87.4%) | 176 (74.0%) |
| 35 to 44 Years | 231 (100.0%) | 333 (71.9%) |
| 45 to 54 Years | 197 (100.0%) | 234 (91.8%) |
| 55 to 64 Years | 289 (93.5%) | 184 (81.1%) |
| 65 to 74 Years | 176 (62.2%) | 262 (97.0%) |
| 75 Years and over | 112 (65.1%) | 155 (100.0%) |
| Total | 2,508 (83.6%) | 2,007 (86.6%) |
Income Below Poverty Among Married-Couple Families in Childress County
The poverty statistics for married-couple families in Childress County show that 11.6% or 107 of the total 922 families live below the poverty line. Families with 1 or 2 children have the highest poverty rate of 35.9%, comprising of 103 families. On the other hand, families with 3 or 4 children have the lowest poverty rate of 0.0%, which includes 0 families.
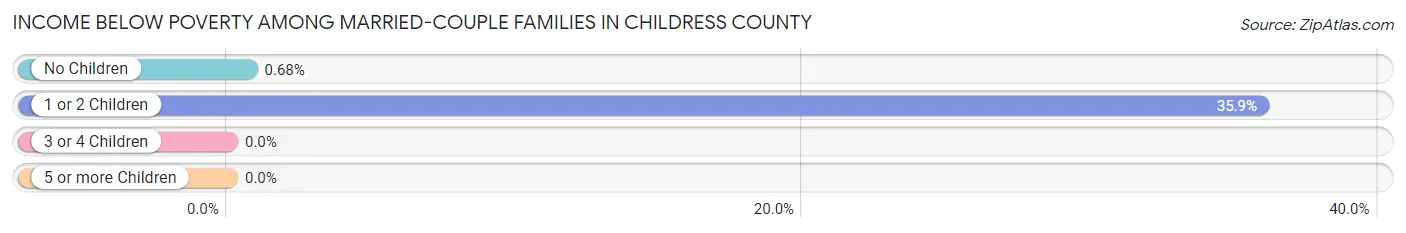
| Children | Above Poverty | Below Poverty |
| No Children | 586 (99.3%) | 4 (0.7%) |
| 1 or 2 Children | 184 (64.1%) | 103 (35.9%) |
| 3 or 4 Children | 45 (100.0%) | 0 (0.0%) |
| 5 or more Children | 0 (0.0%) | 0 (0.0%) |
| Total | 815 (88.4%) | 107 (11.6%) |
Income Below Poverty Among Single-Parent Households in Childress County
According to the poverty data in Childress County, 29.7% or 74 single-father households and 24.2% or 62 single-mother households are living below the poverty line. Among single-father households, those with no children have the highest poverty rate, with 74 households (77.9%) experiencing poverty. Likewise, among single-mother households, those with 1 or 2 children have the highest poverty rate, with 41 households (32.8%) falling below the poverty line.
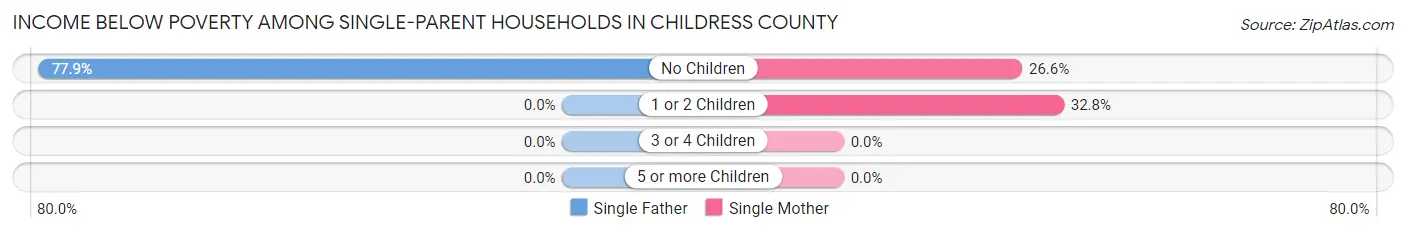
| Children | Single Father | Single Mother |
| No Children | 74 (77.9%) | 21 (26.6%) |
| 1 or 2 Children | 0 (0.0%) | 41 (32.8%) |
| 3 or 4 Children | 0 (0.0%) | 0 (0.0%) |
| 5 or more Children | 0 (0.0%) | 0 (0.0%) |
| Total | 74 (29.7%) | 62 (24.2%) |
Income Below Poverty Among Married-Couple vs Single-Parent Households in Childress County
The poverty data for Childress County shows that 107 of the married-couple family households (11.6%) and 136 of the single-parent households (26.9%) are living below the poverty level. Within the married-couple family households, those with 1 or 2 children have the highest poverty rate, with 103 households (35.9%) falling below the poverty line. Among the single-parent households, those with no children have the highest poverty rate, with 95 household (54.6%) living below poverty.
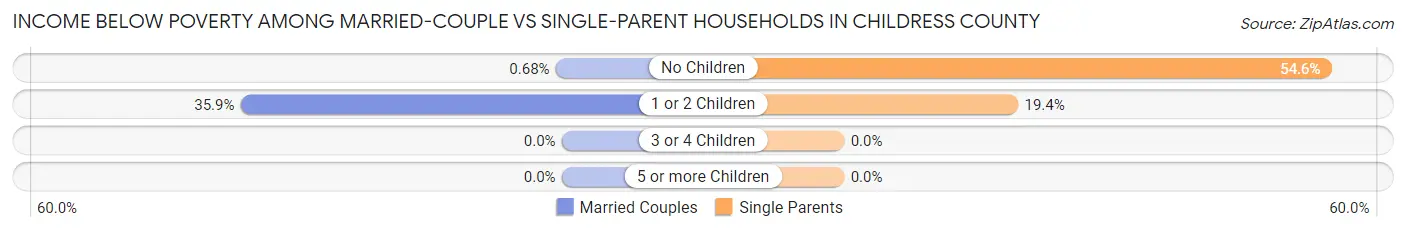
| Children | Married-Couple Families | Single-Parent Households |
| No Children | 4 (0.7%) | 95 (54.6%) |
| 1 or 2 Children | 103 (35.9%) | 41 (19.4%) |
| 3 or 4 Children | 0 (0.0%) | 0 (0.0%) |
| 5 or more Children | 0 (0.0%) | 0 (0.0%) |
| Total | 107 (11.6%) | 136 (26.9%) |
Race in Childress County
The most populous races in Childress County are White / Caucasian (4,793 | 70.7%), Hispanic or Latino (2,533 | 37.3%), and Two or more Races (1,121 | 16.5%).
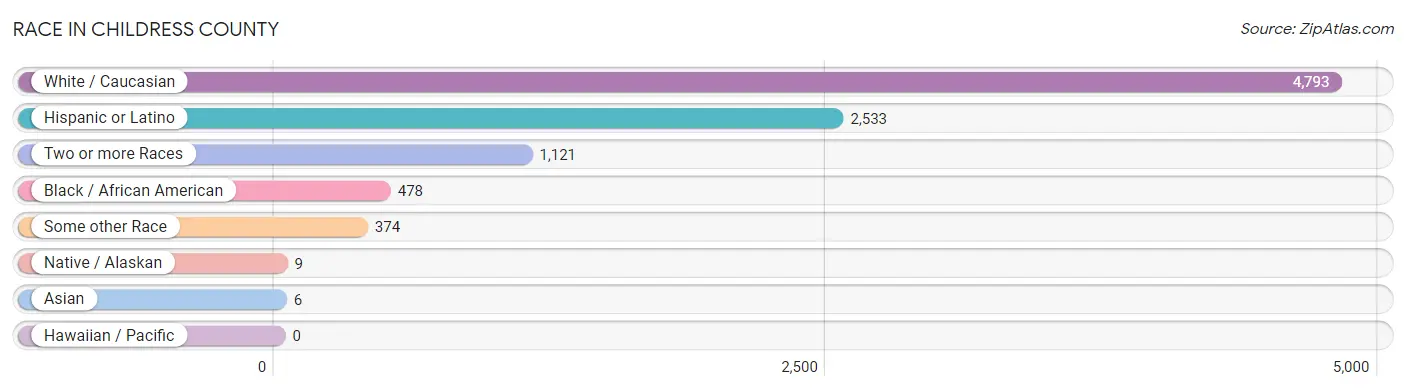
| Race | # Population | % Population |
| Asian | 6 | 0.1% |
| Black / African American | 478 | 7.0% |
| Hawaiian / Pacific | 0 | 0.0% |
| Hispanic or Latino | 2,533 | 37.3% |
| Native / Alaskan | 9 | 0.1% |
| White / Caucasian | 4,793 | 70.7% |
| Two or more Races | 1,121 | 16.5% |
| Some other Race | 374 | 5.5% |
| Total | 6,781 | 100.0% |
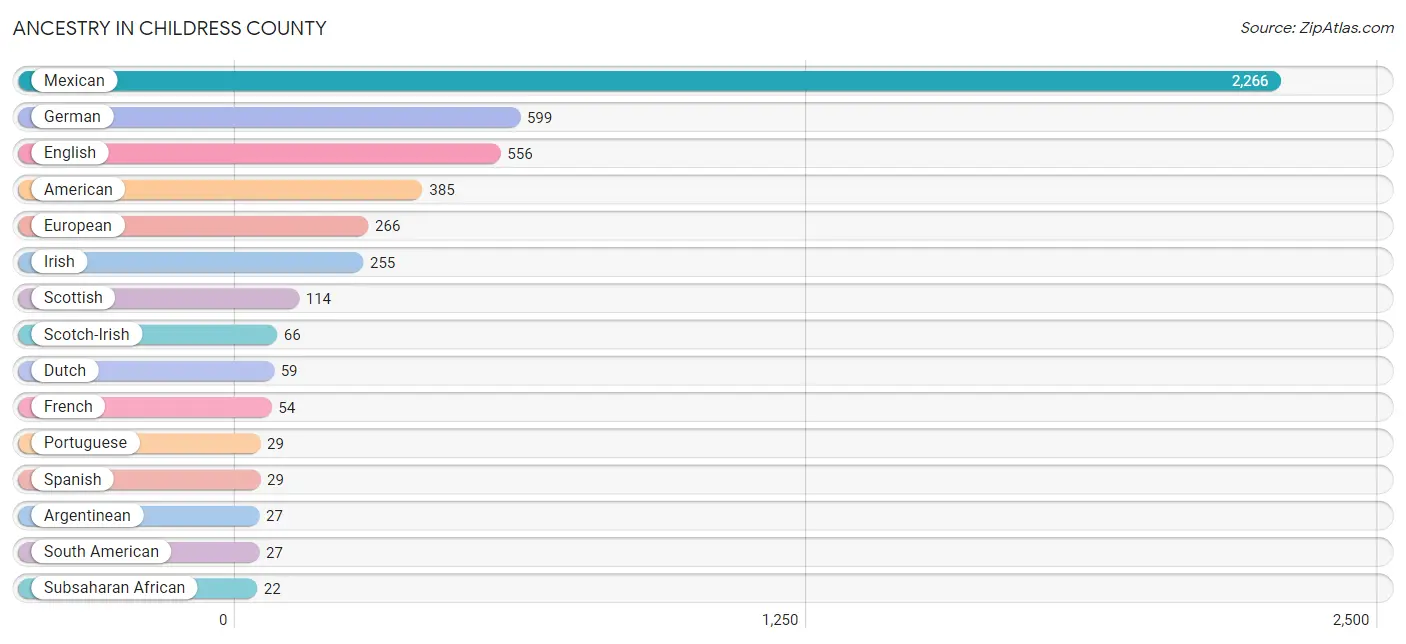
Ancestry in Childress County
The most populous ancestries reported in Childress County are Mexican (2,266 | 33.4%), German (599 | 8.8%), English (556 | 8.2%), American (385 | 5.7%), and European (266 | 3.9%), together accounting for 60.0% of all Childress County residents.
| Ancestry | # Population | % Population |
| African | 17 | 0.3% |
| American | 385 | 5.7% |
| Apache | 4 | 0.1% |
| Arab | 4 | 0.1% |
| Argentinean | 27 | 0.4% |
| Belgian | 7 | 0.1% |
| Blackfeet | 4 | 0.1% |
| British | 4 | 0.1% |
| Burmese | 6 | 0.1% |
| Central American | 9 | 0.1% |
| Cherokee | 11 | 0.2% |
| Choctaw | 2 | 0.0% |
| Dutch | 59 | 0.9% |
| English | 556 | 8.2% |
| European | 266 | 3.9% |
| French | 54 | 0.8% |
| German | 599 | 8.8% |
| Haitian | 3 | 0.0% |
| Irish | 255 | 3.8% |
| Italian | 7 | 0.1% |
| Kiowa | 8 | 0.1% |
| Lebanese | 4 | 0.1% |
| Mexican | 2,266 | 33.4% |
| Norwegian | 4 | 0.1% |
| Polish | 20 | 0.3% |
| Portuguese | 29 | 0.4% |
| Puerto Rican | 2 | 0.0% |
| Salvadoran | 9 | 0.1% |
| Scotch-Irish | 66 | 1.0% |
| Scottish | 114 | 1.7% |
| South American | 27 | 0.4% |
| Spanish | 29 | 0.4% |
| Subsaharan African | 22 | 0.3% |
| Swedish | 13 | 0.2% | View All 34 Rows |
Immigrants in Childress County
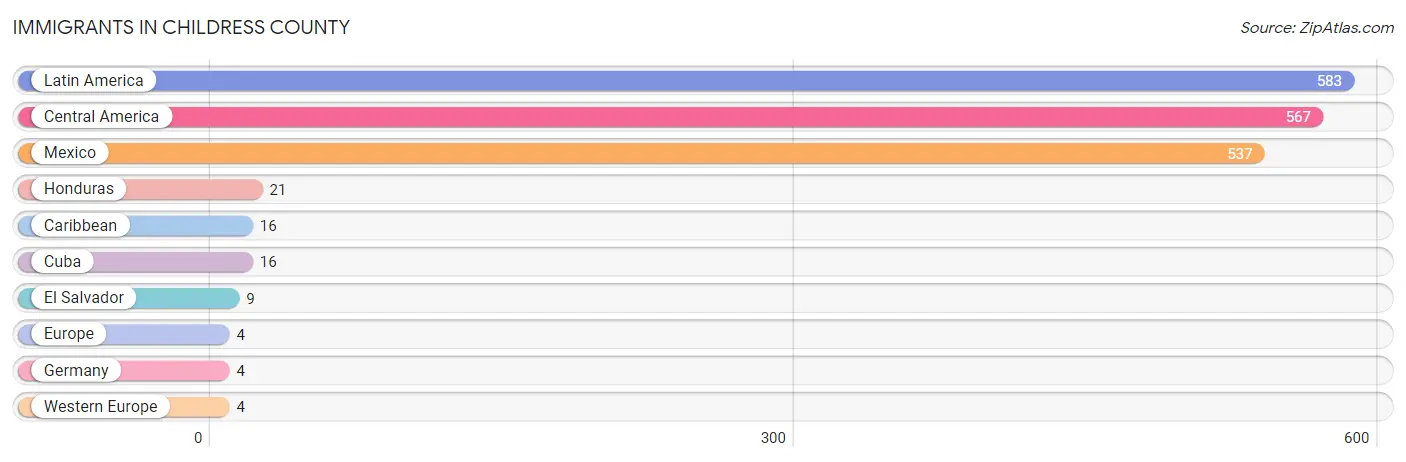
The most numerous immigrant groups reported in Childress County came from Latin America (583 | 8.6%), Central America (567 | 8.4%), Mexico (537 | 7.9%), Honduras (21 | 0.3%), and Caribbean (16 | 0.2%), together accounting for 25.4% of all Childress County residents.
| Immigration Origin | # Population | % Population |
| Caribbean | 16 | 0.2% |
| Central America | 567 | 8.4% |
| Cuba | 16 | 0.2% |
| El Salvador | 9 | 0.1% |
| Europe | 4 | 0.1% |
| Germany | 4 | 0.1% |
| Honduras | 21 | 0.3% |
| Latin America | 583 | 8.6% |
| Mexico | 537 | 7.9% |
| Western Europe | 4 | 0.1% | View All 10 Rows |
Sex and Age in Childress County
Sex and Age in Childress County
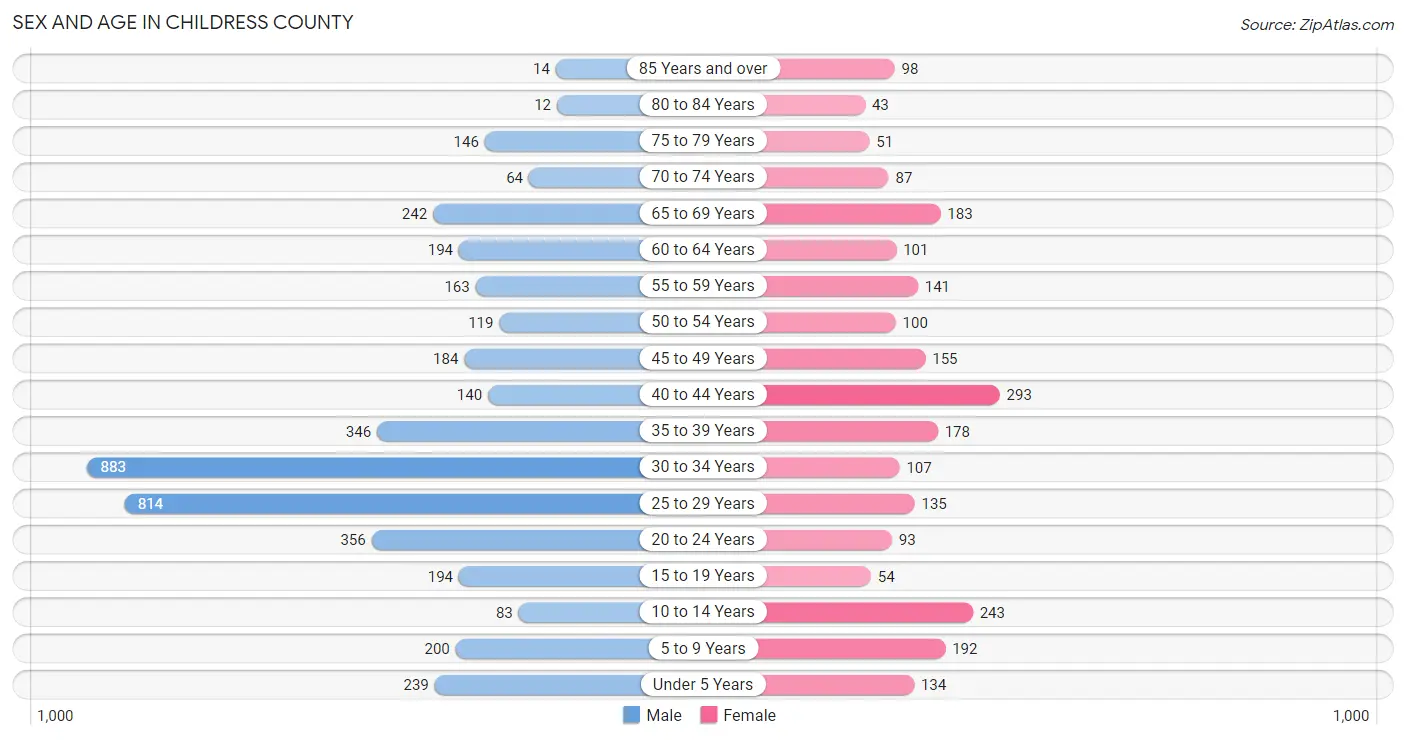
The most populous age groups in Childress County are 30 to 34 Years (883 | 20.1%) for men and 40 to 44 Years (293 | 12.3%) for women.
| Age Bracket | Male | Female |
| Under 5 Years | 239 (5.4%) | 134 (5.6%) |
| 5 to 9 Years | 200 (4.5%) | 192 (8.0%) |
| 10 to 14 Years | 83 (1.9%) | 243 (10.2%) |
| 15 to 19 Years | 194 (4.4%) | 54 (2.3%) |
| 20 to 24 Years | 356 (8.1%) | 93 (3.9%) |
| 25 to 29 Years | 814 (18.5%) | 135 (5.7%) |
| 30 to 34 Years | 883 (20.1%) | 107 (4.5%) |
| 35 to 39 Years | 346 (7.9%) | 178 (7.4%) |
| 40 to 44 Years | 140 (3.2%) | 293 (12.3%) |
| 45 to 49 Years | 184 (4.2%) | 155 (6.5%) |
| 50 to 54 Years | 119 (2.7%) | 100 (4.2%) |
| 55 to 59 Years | 163 (3.7%) | 141 (5.9%) |
| 60 to 64 Years | 194 (4.4%) | 101 (4.2%) |
| 65 to 69 Years | 242 (5.5%) | 183 (7.7%) |
| 70 to 74 Years | 64 (1.5%) | 87 (3.6%) |
| 75 to 79 Years | 146 (3.3%) | 51 (2.1%) |
| 80 to 84 Years | 12 (0.3%) | 43 (1.8%) |
| 85 Years and over | 14 (0.3%) | 98 (4.1%) |
| Total | 4,393 (100.0%) | 2,388 (100.0%) |
Families and Households in Childress County
Median Family Size in Childress County
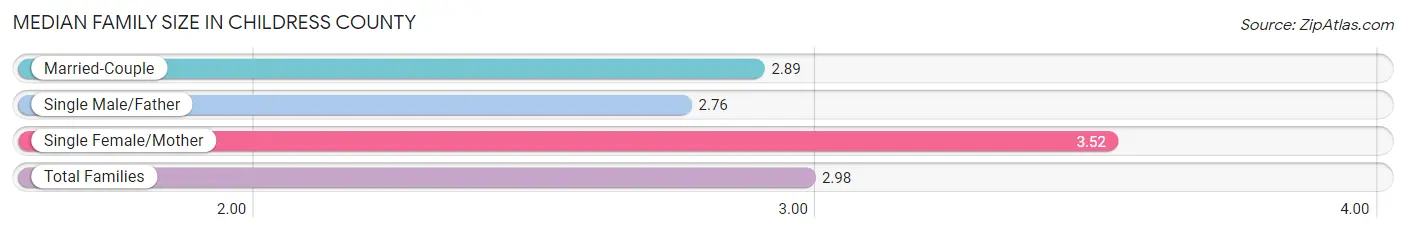
The median family size in Childress County is 2.98 persons per family, with single female/mother families (256 | 17.9%) accounting for the largest median family size of 3.52 persons per family. On the other hand, single male/father families (249 | 17.4%) represent the smallest median family size with 2.76 persons per family.
| Family Type | # Families | Family Size |
| Married-Couple | 922 (64.6%) | 2.89 |
| Single Male/Father | 249 (17.4%) | 2.76 |
| Single Female/Mother | 256 (17.9%) | 3.52 |
| Total Families | 1,427 (100.0%) | 2.98 |
Median Household Size in Childress County
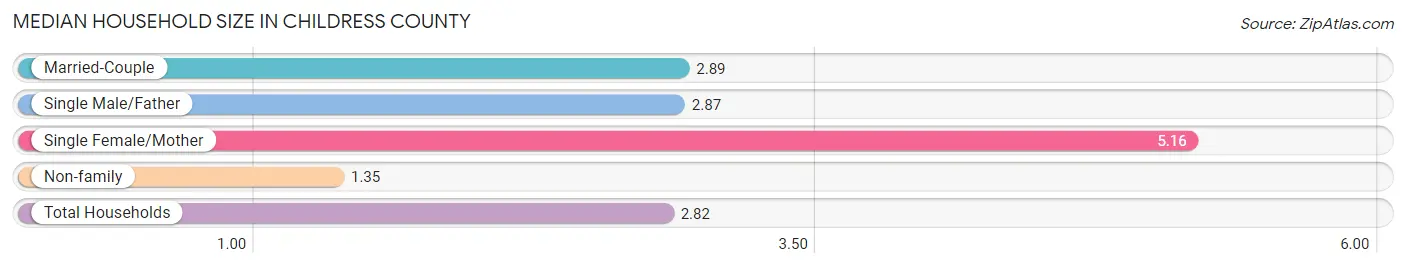
The median household size in Childress County is 2.82 persons per household, with single female/mother households (256 | 13.5%) accounting for the largest median household size of 5.16 persons per household. non-family households (465 | 24.6%) represent the smallest median household size with 1.35 persons per household.
| Household Type | # Households | Household Size |
| Married-Couple | 922 (48.7%) | 2.89 |
| Single Male/Father | 249 (13.2%) | 2.87 |
| Single Female/Mother | 256 (13.5%) | 5.16 |
| Non-family | 465 (24.6%) | 1.35 |
| Total Households | 1,892 (100.0%) | 2.82 |
Household Size by Marriage Status in Childress County
Out of a total of 1,892 households in Childress County, 1,427 (75.4%) are family households, while 465 (24.6%) are nonfamily households. The most numerous type of family households are 2-person households, comprising 743, and the most common type of nonfamily households are 1-person households, comprising 449.
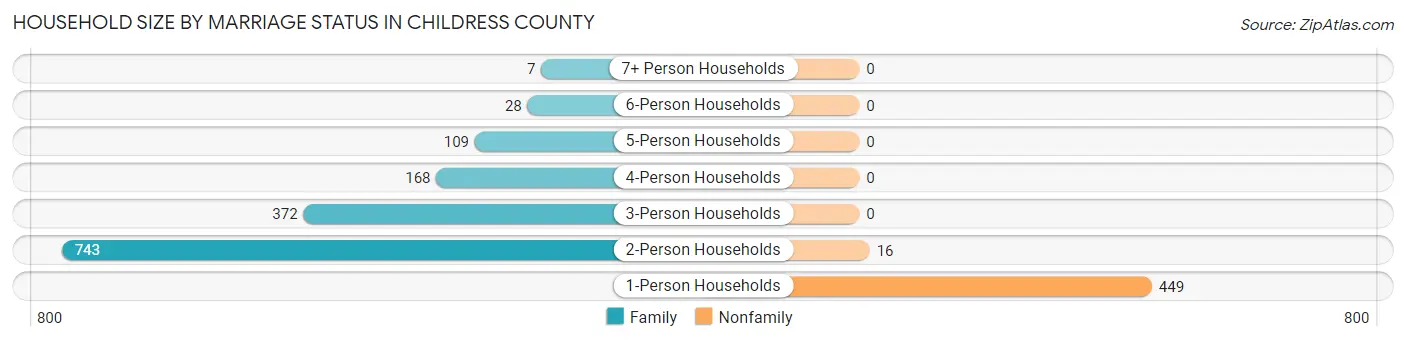
| Household Size | Family Households | Nonfamily Households |
| 1-Person Households | - | 449 (23.7%) |
| 2-Person Households | 743 (39.3%) | 16 (0.9%) |
| 3-Person Households | 372 (19.7%) | 0 (0.0%) |
| 4-Person Households | 168 (8.9%) | 0 (0.0%) |
| 5-Person Households | 109 (5.8%) | 0 (0.0%) |
| 6-Person Households | 28 (1.5%) | 0 (0.0%) |
| 7+ Person Households | 7 (0.4%) | 0 (0.0%) |
| Total | 1,427 (75.4%) | 465 (24.6%) |
Female Fertility in Childress County
Fertility by Age in Childress County
Average fertility rate in Childress County is 65.0 births per 1,000 women. Women in the age bracket of 20 to 34 years have the highest fertility rate with 155.0 births per 1,000 women. Women in the age bracket of 20 to 34 years acount for 78.8% of all women with births.
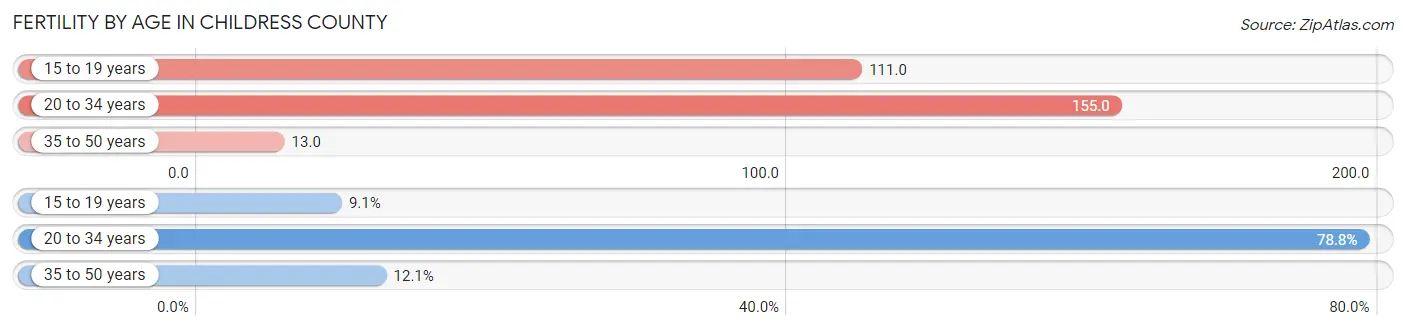
| Age Bracket | Women with Births | Births / 1,000 Women |
| 15 to 19 years | 6 (9.1%) | 111.0 |
| 20 to 34 years | 52 (78.8%) | 155.0 |
| 35 to 50 years | 8 (12.1%) | 13.0 |
| Total | 66 (100.0%) | 65.0 |
Fertility by Age by Marriage Status in Childress County
78.8% of women with births (66) in Childress County are married. The highest percentage of unmarried women with births falls into 15 to 19 years age bracket with 100.0% of them unmarried at the time of birth, while the lowest percentage of unmarried women with births belong to 20 to 34 years age bracket with 0.0% of them unmarried.
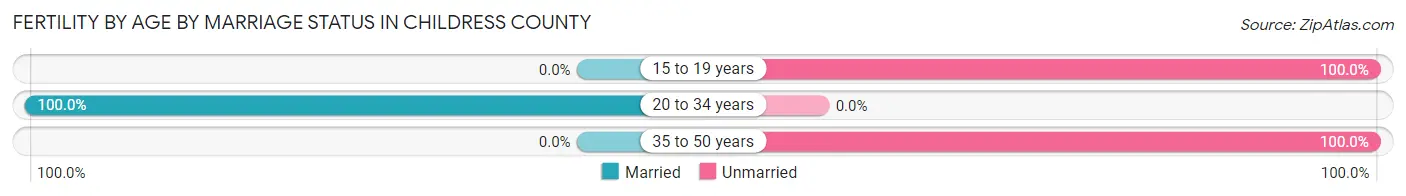
| Age Bracket | Married | Unmarried |
| 15 to 19 years | 0 (0.0%) | 6 (100.0%) |
| 20 to 34 years | 52 (100.0%) | 0 (0.0%) |
| 35 to 50 years | 0 (0.0%) | 8 (100.0%) |
| Total | 52 (78.8%) | 14 (21.2%) |
Fertility by Education in Childress County
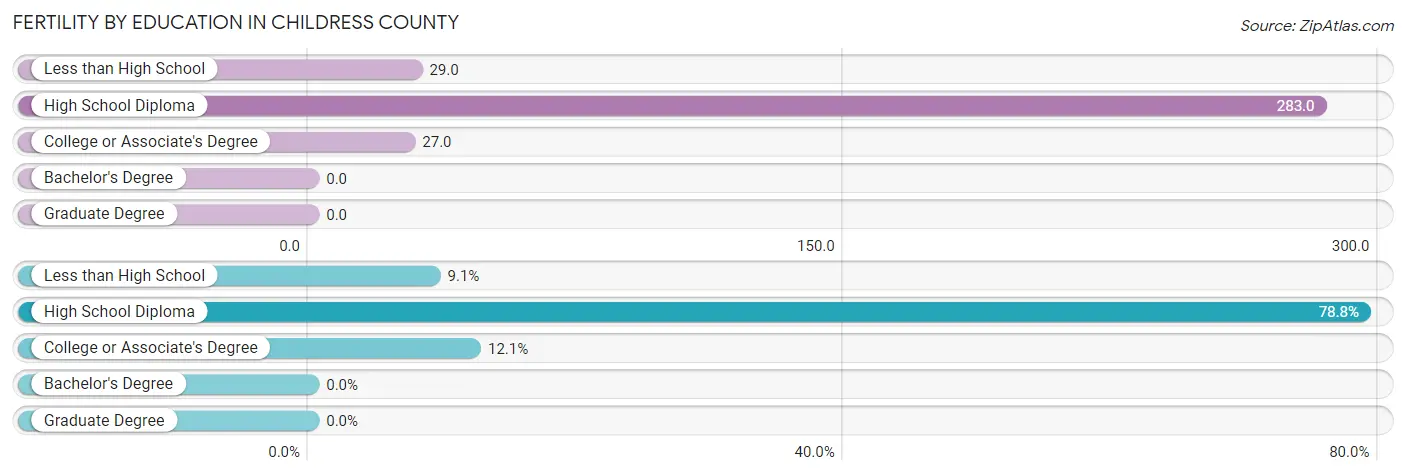
| Educational Attainment | Women with Births | Births / 1,000 Women |
| Less than High School | 6 (9.1%) | 29.0 |
| High School Diploma | 52 (78.8%) | 283.0 |
| College or Associate's Degree | 8 (12.1%) | 27.0 |
| Bachelor's Degree | 0 (0.0%) | 0.0 |
| Graduate Degree | 0 (0.0%) | 0.0 |
| Total | 66 (100.0%) | 65.0 |
Fertility by Education by Marriage Status in Childress County
21.2% of women with births in Childress County are unmarried. Women with the educational attainment of high school diploma are most likely to be married with 100.0% of them married at childbirth, while women with the educational attainment of less than high school are least likely to be married with 100.0% of them unmarried at childbirth.
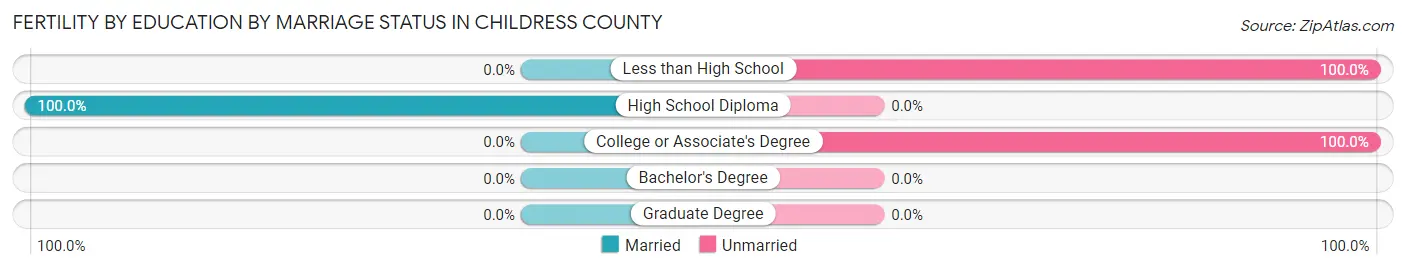
| Educational Attainment | Married | Unmarried |
| Less than High School | 0 (0.0%) | 6 (100.0%) |
| High School Diploma | 52 (100.0%) | 0 (0.0%) |
| College or Associate's Degree | 0 (0.0%) | 8 (100.0%) |
| Bachelor's Degree | 0 (0.0%) | 0 (0.0%) |
| Graduate Degree | 0 (0.0%) | 0 (0.0%) |
| Total | 52 (78.8%) | 14 (21.2%) |
Employment Characteristics in Childress County
Employment by Class of Employer in Childress County
Among the 2,840 employed individuals in Childress County, private company employees (1,567 | 55.2%), local government employees (377 | 13.3%), and self-employed (not incorporated) (349 | 12.3%) make up the most common classes of employment.
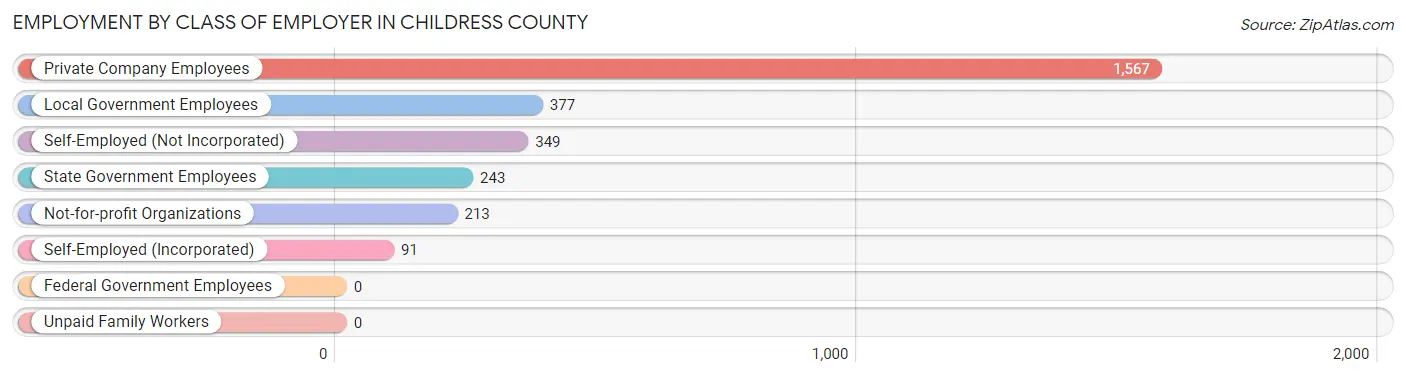
| Employer Class | # Employees | % Employees |
| Private Company Employees | 1,567 | 55.2% |
| Self-Employed (Incorporated) | 91 | 3.2% |
| Self-Employed (Not Incorporated) | 349 | 12.3% |
| Not-for-profit Organizations | 213 | 7.5% |
| Local Government Employees | 377 | 13.3% |
| State Government Employees | 243 | 8.6% |
| Federal Government Employees | 0 | 0.0% |
| Unpaid Family Workers | 0 | 0.0% |
| Total | 2,840 | 100.0% |
Employment Status by Age in Childress County
According to the labor force statistics for Childress County, out of the total population over 16 years of age (5,654), 55.2% or 3,121 individuals are in the labor force, with 8.6% or 268 of them unemployed. The age group with the highest labor force participation rate is 16 to 19 years, with 78.8% or 167 individuals in the labor force. Within the labor force, the 20 to 24 years age range has the highest percentage of unemployed individuals, with 53.3% or 48 of them being unemployed.
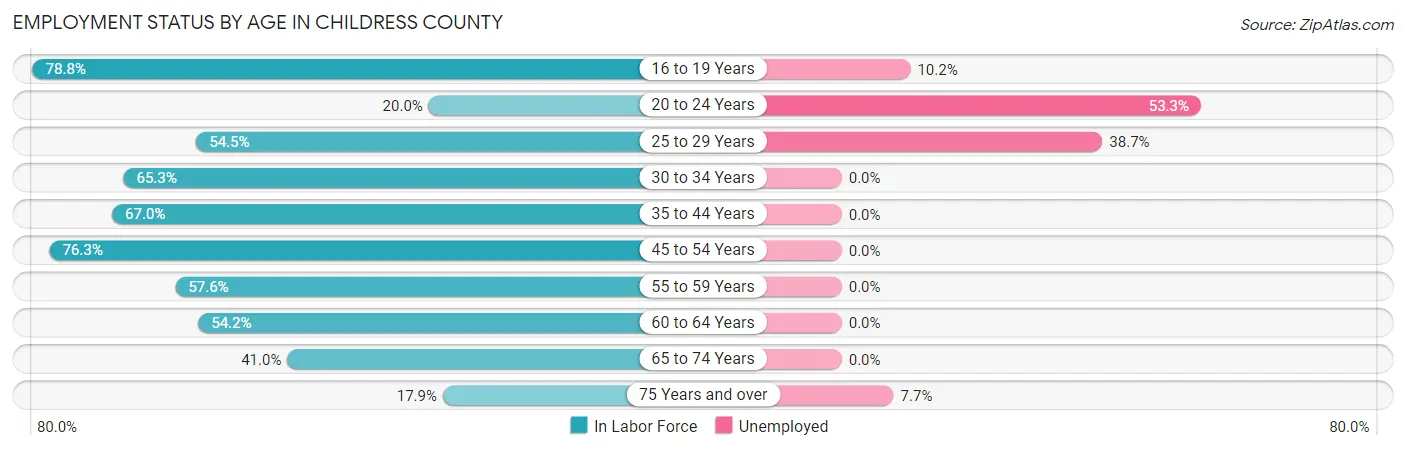
| Age Bracket | In Labor Force | Unemployed |
| 16 to 19 Years | 167 (78.8%) | 17 (10.2%) |
| 20 to 24 Years | 90 (20.0%) | 48 (53.3%) |
| 25 to 29 Years | 517 (54.5%) | 200 (38.7%) |
| 30 to 34 Years | 646 (65.3%) | 0 (0.0%) |
| 35 to 44 Years | 641 (67.0%) | 0 (0.0%) |
| 45 to 54 Years | 426 (76.3%) | 0 (0.0%) |
| 55 to 59 Years | 175 (57.6%) | 0 (0.0%) |
| 60 to 64 Years | 160 (54.2%) | 0 (0.0%) |
| 65 to 74 Years | 236 (41.0%) | 0 (0.0%) |
| 75 Years and over | 65 (17.9%) | 5 (7.7%) |
| Total | 3,121 (55.2%) | 268 (8.6%) |
Employment Status by Educational Attainment in Childress County
According to labor force statistics for Childress County, 63.3% of individuals (2,566) out of the total population between 25 and 64 years of age (4,053) are in the labor force, with 7.8% or 200 of them being unemployed. The group with the highest labor force participation rate are those with the educational attainment of bachelor's degree or higher, with 73.3% or 406 individuals in the labor force. Within the labor force, individuals with high school diploma education have the highest percentage of unemployment, with 19.8% or 200 of them being unemployed.
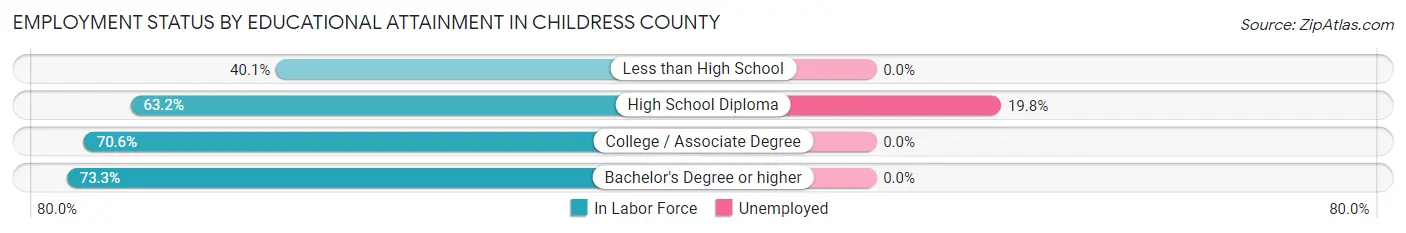
| Educational Attainment | In Labor Force | Unemployed |
| Less than High School | 255 (40.1%) | 0 (0.0%) |
| High School Diploma | 1,009 (63.2%) | 316 (19.8%) |
| College / Associate Degree | 894 (70.6%) | 0 (0.0%) |
| Bachelor's Degree or higher | 406 (73.3%) | 0 (0.0%) |
| Total | 2,566 (63.3%) | 316 (7.8%) |
Employment Occupations by Sex in Childress County
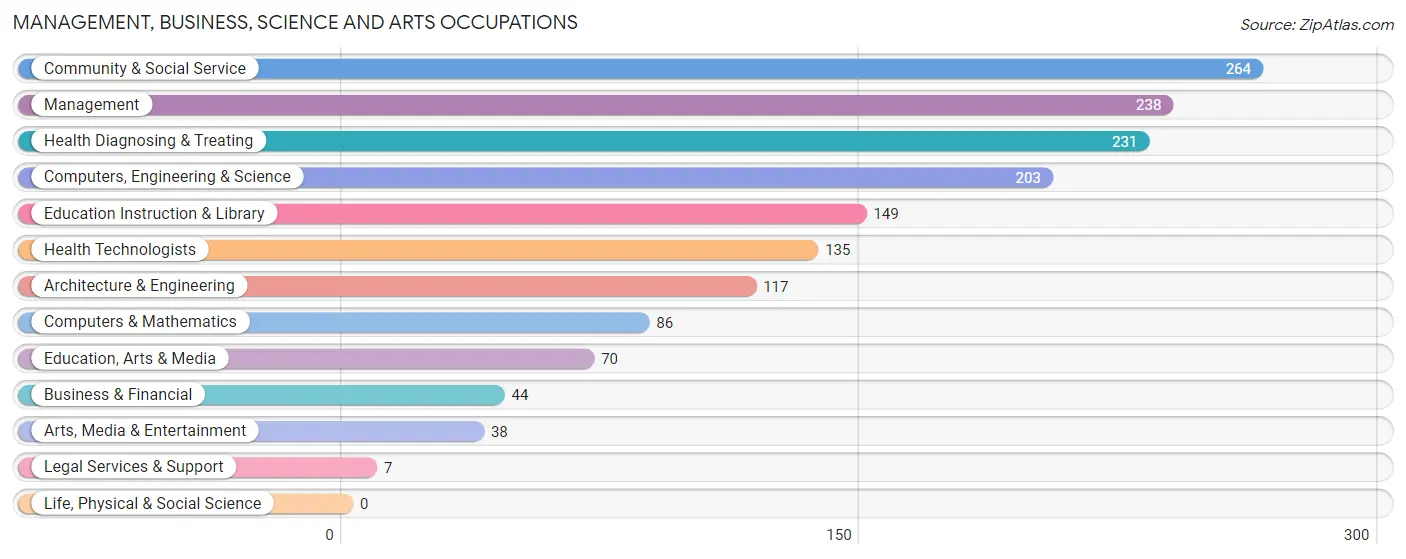
Management, Business, Science and Arts Occupations
The most common Management, Business, Science and Arts occupations in Childress County are Community & Social Service (264 | 9.2%), Management (238 | 8.3%), Health Diagnosing & Treating (231 | 8.1%), Computers, Engineering & Science (203 | 7.1%), and Education Instruction & Library (149 | 5.2%).
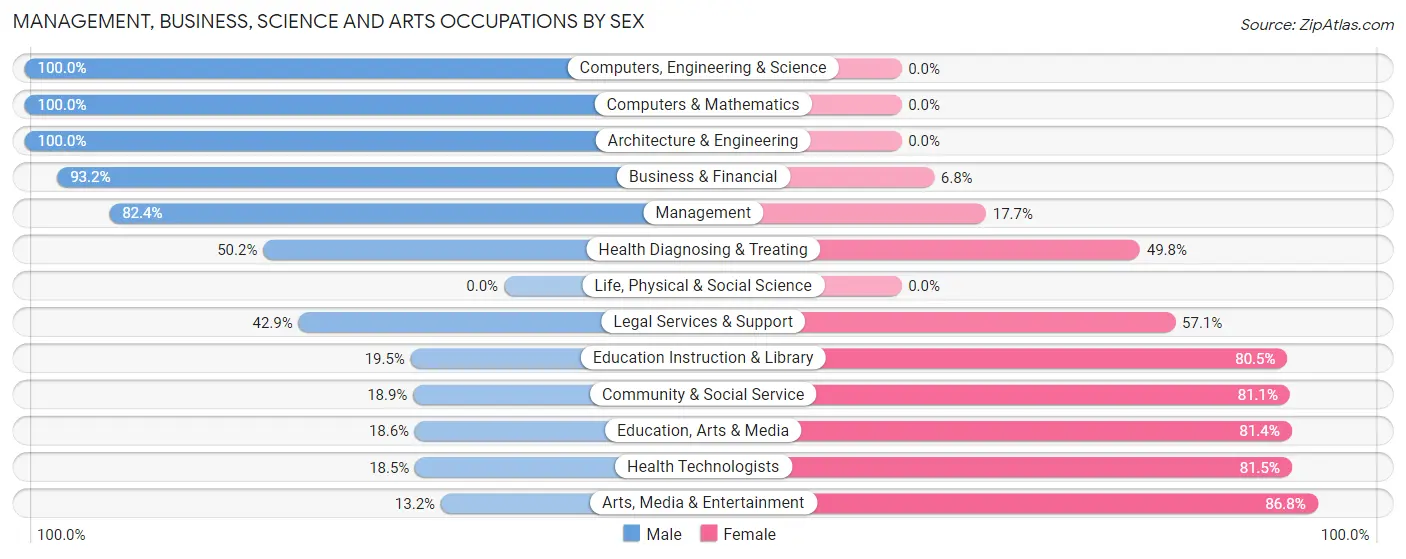
Management, Business, Science and Arts Occupations by Sex
Within the Management, Business, Science and Arts occupations in Childress County, the most male-oriented occupations are Computers, Engineering & Science (100.0%), Computers & Mathematics (100.0%), and Architecture & Engineering (100.0%), while the most female-oriented occupations are Arts, Media & Entertainment (86.8%), Health Technologists (81.5%), and Education, Arts & Media (81.4%).
| Occupation | Male | Female |
| Management | 196 (82.4%) | 42 (17.6%) |
| Business & Financial | 41 (93.2%) | 3 (6.8%) |
| Computers, Engineering & Science | 203 (100.0%) | 0 (0.0%) |
| Computers & Mathematics | 86 (100.0%) | 0 (0.0%) |
| Architecture & Engineering | 117 (100.0%) | 0 (0.0%) |
| Life, Physical & Social Science | 0 (0.0%) | 0 (0.0%) |
| Community & Social Service | 50 (18.9%) | 214 (81.1%) |
| Education, Arts & Media | 13 (18.6%) | 57 (81.4%) |
| Legal Services & Support | 3 (42.9%) | 4 (57.1%) |
| Education Instruction & Library | 29 (19.5%) | 120 (80.5%) |
| Arts, Media & Entertainment | 5 (13.2%) | 33 (86.8%) |
| Health Diagnosing & Treating | 116 (50.2%) | 115 (49.8%) |
| Health Technologists | 25 (18.5%) | 110 (81.5%) |
| Total (Category) | 606 (61.8%) | 374 (38.2%) |
| Total (Overall) | 1,706 (59.8%) | 1,147 (40.2%) |
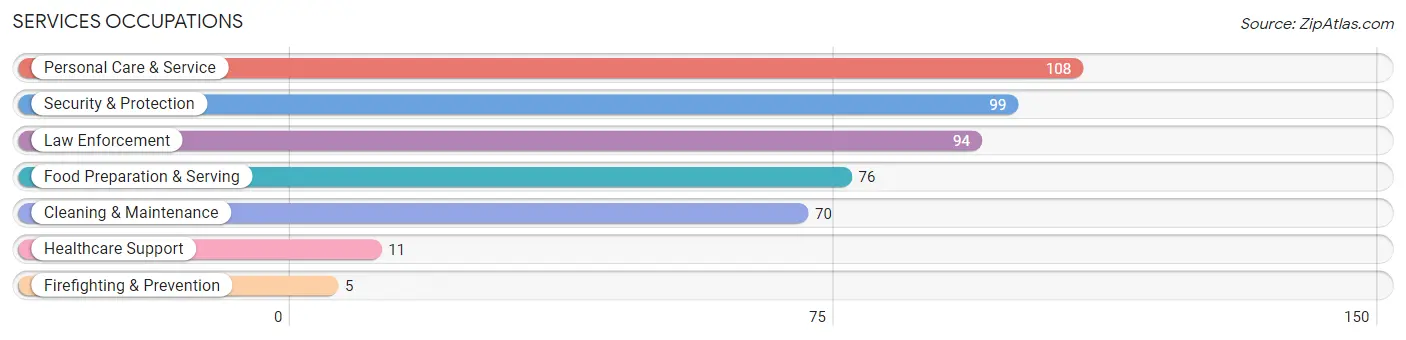
Services Occupations
The most common Services occupations in Childress County are Personal Care & Service (108 | 3.8%), Security & Protection (99 | 3.5%), Law Enforcement (94 | 3.3%), Food Preparation & Serving (76 | 2.7%), and Cleaning & Maintenance (70 | 2.5%).
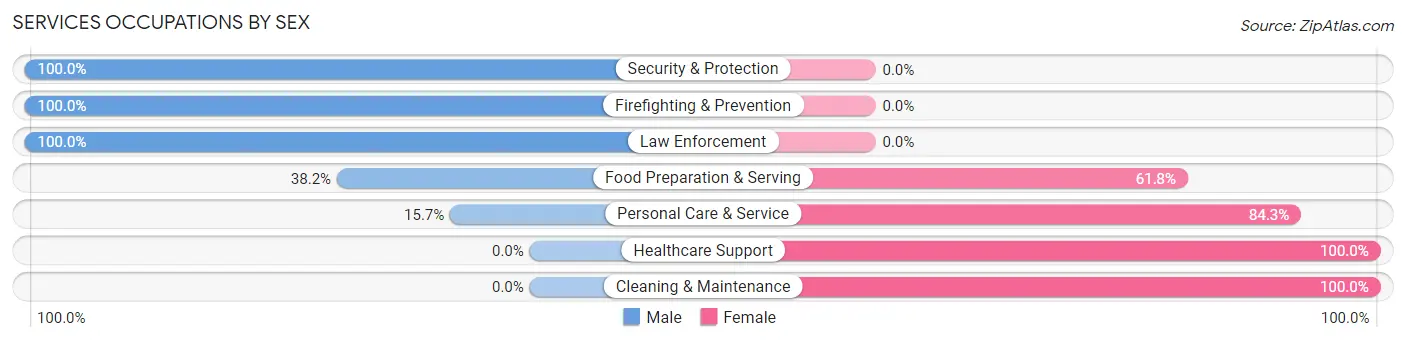
Services Occupations by Sex
Within the Services occupations in Childress County, the most male-oriented occupations are Security & Protection (100.0%), Firefighting & Prevention (100.0%), and Law Enforcement (100.0%), while the most female-oriented occupations are Healthcare Support (100.0%), Cleaning & Maintenance (100.0%), and Personal Care & Service (84.3%).
| Occupation | Male | Female |
| Healthcare Support | 0 (0.0%) | 11 (100.0%) |
| Security & Protection | 99 (100.0%) | 0 (0.0%) |
| Firefighting & Prevention | 5 (100.0%) | 0 (0.0%) |
| Law Enforcement | 94 (100.0%) | 0 (0.0%) |
| Food Preparation & Serving | 29 (38.2%) | 47 (61.8%) |
| Cleaning & Maintenance | 0 (0.0%) | 70 (100.0%) |
| Personal Care & Service | 17 (15.7%) | 91 (84.3%) |
| Total (Category) | 145 (39.8%) | 219 (60.2%) |
| Total (Overall) | 1,706 (59.8%) | 1,147 (40.2%) |
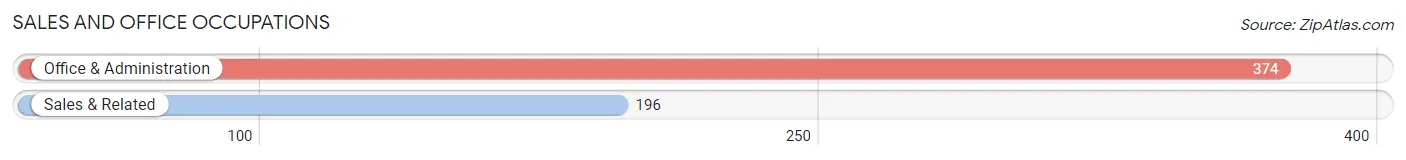
Sales and Office Occupations
The most common Sales and Office occupations in Childress County are Office & Administration (374 | 13.1%), and Sales & Related (196 | 6.9%).
Sales and Office Occupations by Sex
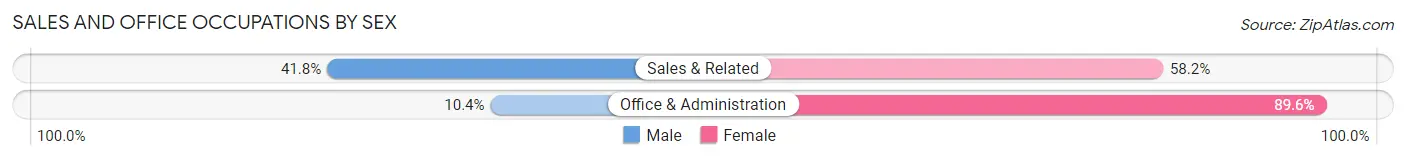
| Occupation | Male | Female |
| Sales & Related | 82 (41.8%) | 114 (58.2%) |
| Office & Administration | 39 (10.4%) | 335 (89.6%) |
| Total (Category) | 121 (21.2%) | 449 (78.8%) |
| Total (Overall) | 1,706 (59.8%) | 1,147 (40.2%) |
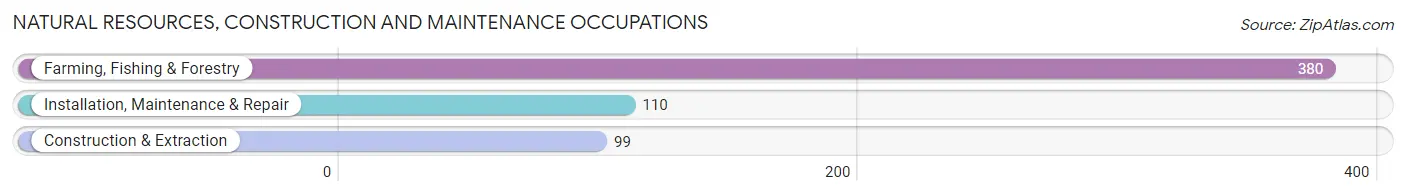
Natural Resources, Construction and Maintenance Occupations
The most common Natural Resources, Construction and Maintenance occupations in Childress County are Farming, Fishing & Forestry (380 | 13.3%), Installation, Maintenance & Repair (110 | 3.9%), and Construction & Extraction (99 | 3.5%).
Natural Resources, Construction and Maintenance Occupations by Sex
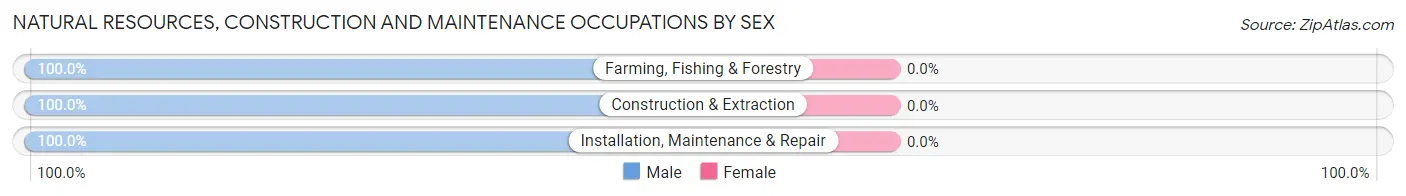
| Occupation | Male | Female |
| Farming, Fishing & Forestry | 380 (100.0%) | 0 (0.0%) |
| Construction & Extraction | 99 (100.0%) | 0 (0.0%) |
| Installation, Maintenance & Repair | 110 (100.0%) | 0 (0.0%) |
| Total (Category) | 589 (100.0%) | 0 (0.0%) |
| Total (Overall) | 1,706 (59.8%) | 1,147 (40.2%) |
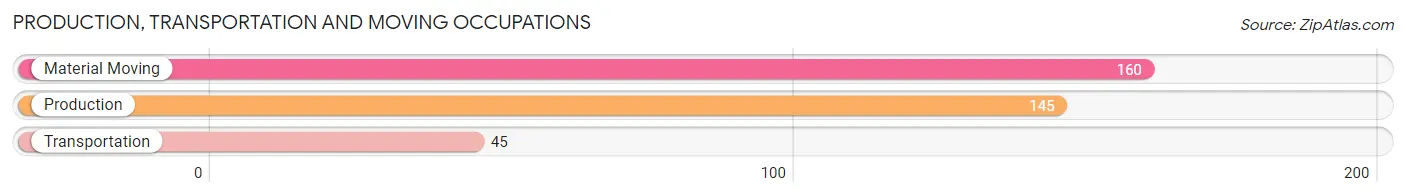
Production, Transportation and Moving Occupations
The most common Production, Transportation and Moving occupations in Childress County are Material Moving (160 | 5.6%), Production (145 | 5.1%), and Transportation (45 | 1.6%).
Production, Transportation and Moving Occupations by Sex
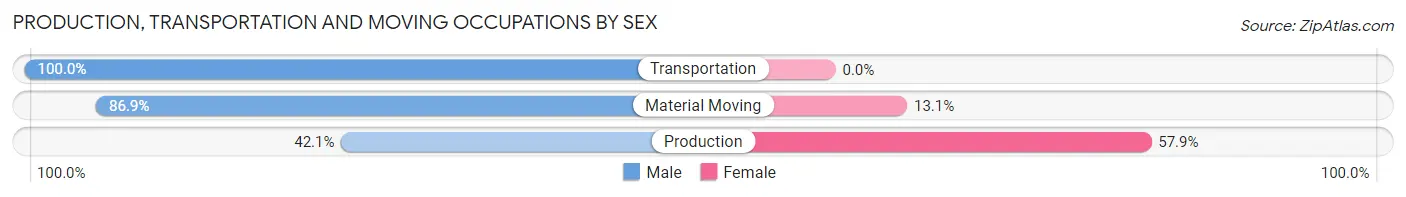
| Occupation | Male | Female |
| Production | 61 (42.1%) | 84 (57.9%) |
| Transportation | 45 (100.0%) | 0 (0.0%) |
| Material Moving | 139 (86.9%) | 21 (13.1%) |
| Total (Category) | 245 (70.0%) | 105 (30.0%) |
| Total (Overall) | 1,706 (59.8%) | 1,147 (40.2%) |
Employment Industries by Sex in Childress County
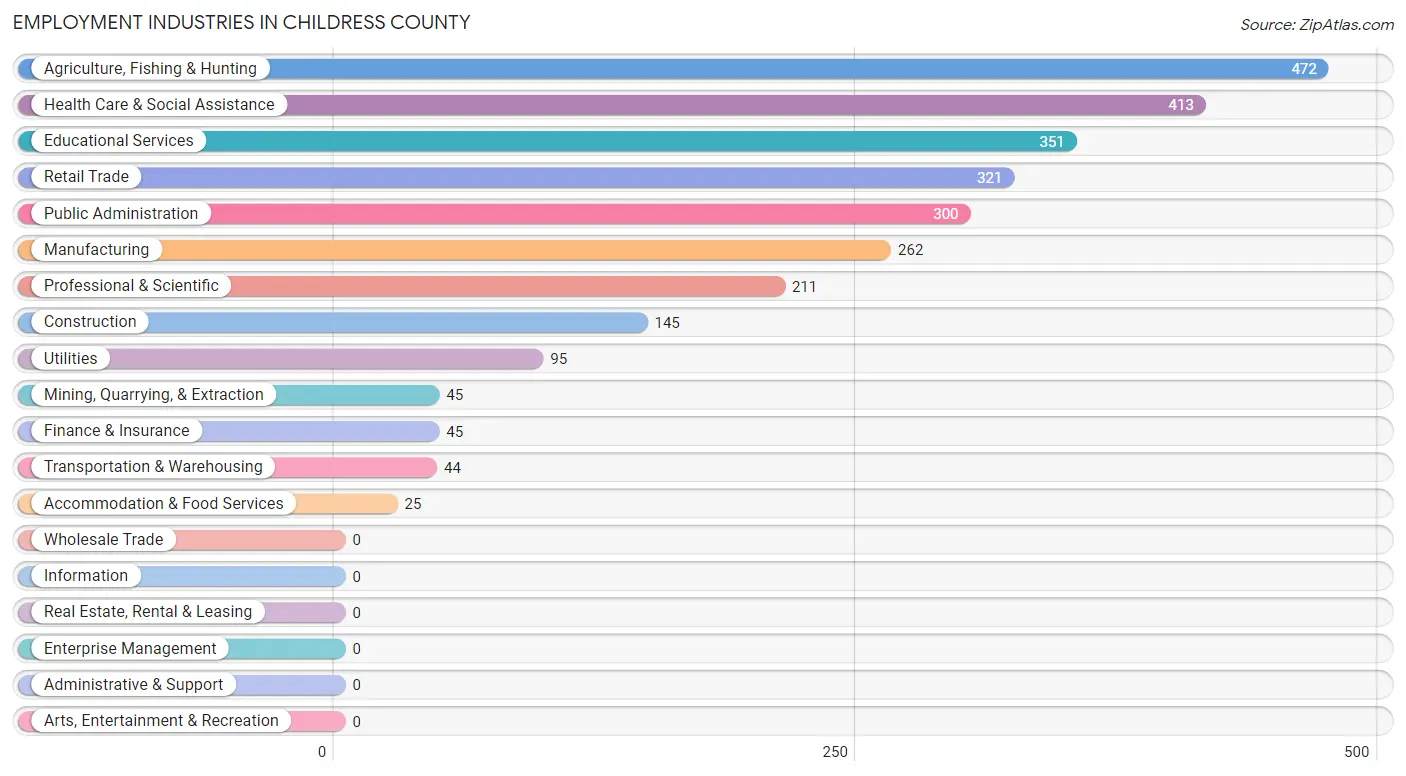
Employment Industries in Childress County
The major employment industries in Childress County include Agriculture, Fishing & Hunting (472 | 16.5%), Health Care & Social Assistance (413 | 14.5%), Educational Services (351 | 12.3%), Retail Trade (321 | 11.3%), and Public Administration (300 | 10.5%).
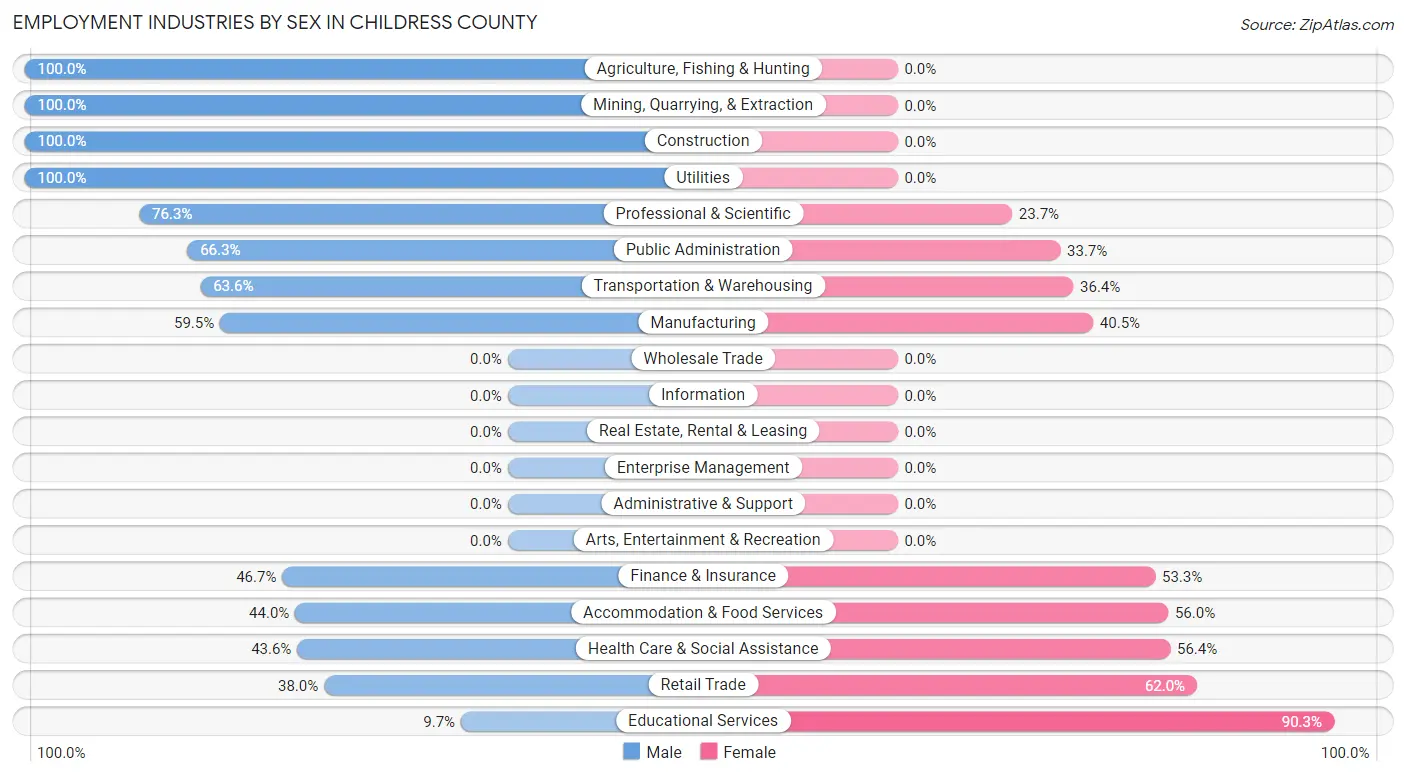
Employment Industries by Sex in Childress County
The Childress County industries that see more men than women are Agriculture, Fishing & Hunting (100.0%), Mining, Quarrying, & Extraction (100.0%), and Construction (100.0%), whereas the industries that tend to have a higher number of women are Educational Services (90.3%), Retail Trade (62.0%), and Health Care & Social Assistance (56.4%).
| Industry | Male | Female |
| Agriculture, Fishing & Hunting | 472 (100.0%) | 0 (0.0%) |
| Mining, Quarrying, & Extraction | 45 (100.0%) | 0 (0.0%) |
| Construction | 145 (100.0%) | 0 (0.0%) |
| Manufacturing | 156 (59.5%) | 106 (40.5%) |
| Wholesale Trade | 0 (0.0%) | 0 (0.0%) |
| Retail Trade | 122 (38.0%) | 199 (62.0%) |
| Transportation & Warehousing | 28 (63.6%) | 16 (36.4%) |
| Utilities | 95 (100.0%) | 0 (0.0%) |
| Information | 0 (0.0%) | 0 (0.0%) |
| Finance & Insurance | 21 (46.7%) | 24 (53.3%) |
| Real Estate, Rental & Leasing | 0 (0.0%) | 0 (0.0%) |
| Professional & Scientific | 161 (76.3%) | 50 (23.7%) |
| Enterprise Management | 0 (0.0%) | 0 (0.0%) |
| Administrative & Support | 0 (0.0%) | 0 (0.0%) |
| Educational Services | 34 (9.7%) | 317 (90.3%) |
| Health Care & Social Assistance | 180 (43.6%) | 233 (56.4%) |
| Arts, Entertainment & Recreation | 0 (0.0%) | 0 (0.0%) |
| Accommodation & Food Services | 11 (44.0%) | 14 (56.0%) |
| Public Administration | 199 (66.3%) | 101 (33.7%) |
| Total | 1,706 (59.8%) | 1,147 (40.2%) |
Education in Childress County
School Enrollment in Childress County
The most common levels of schooling among the 857 students in Childress County are high school (294 | 34.3%), elementary school (244 | 28.5%), and middle school (200 | 23.3%).
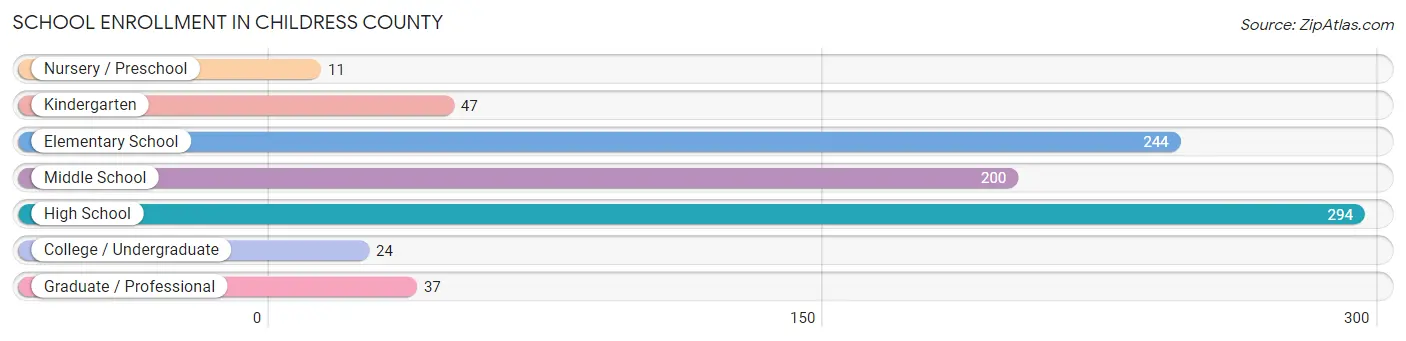
| School Level | # Students | % Students |
| Nursery / Preschool | 11 | 1.3% |
| Kindergarten | 47 | 5.5% |
| Elementary School | 244 | 28.5% |
| Middle School | 200 | 23.3% |
| High School | 294 | 34.3% |
| College / Undergraduate | 24 | 2.8% |
| Graduate / Professional | 37 | 4.3% |
| Total | 857 | 100.0% |
School Enrollment by Age by Funding Source in Childress County
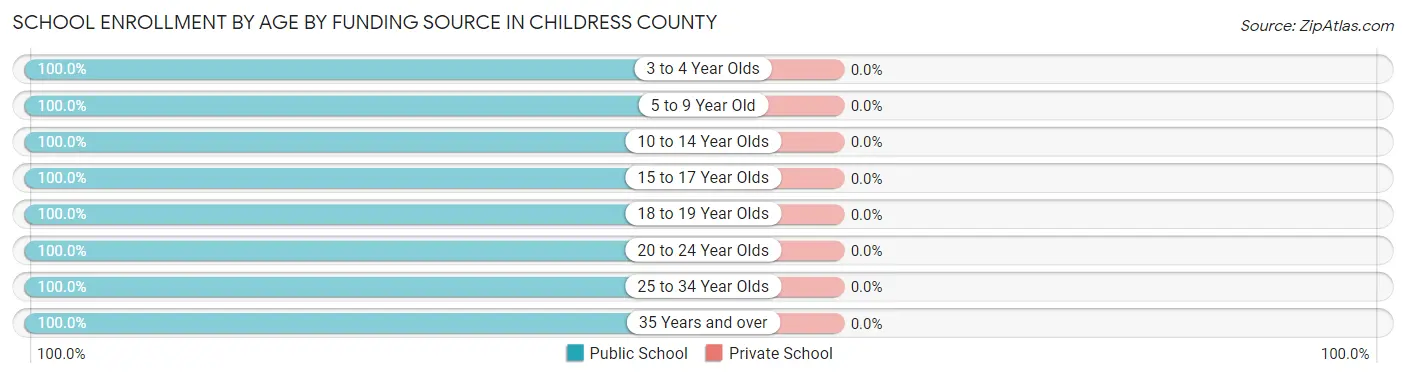
| Age Bracket | Public School | Private School |
| 3 to 4 Year Olds | 11 (100.0%) | 0 (0.0%) |
| 5 to 9 Year Old | 271 (100.0%) | 0 (0.0%) |
| 10 to 14 Year Olds | 253 (100.0%) | 0 (0.0%) |
| 15 to 17 Year Olds | 155 (100.0%) | 0 (0.0%) |
| 18 to 19 Year Olds | 82 (100.0%) | 0 (0.0%) |
| 20 to 24 Year Olds | 9 (100.0%) | 0 (0.0%) |
| 25 to 34 Year Olds | 21 (100.0%) | 0 (0.0%) |
| 35 Years and over | 55 (100.0%) | 0 (0.0%) |
| Total | 857 (100.0%) | 0 (0.0%) |
Educational Attainment by Field of Study in Childress County
Education (212 | 28.3%), business (150 | 20.1%), science & technology (114 | 15.2%), arts & humanities (58 | 7.7%), and engineering (45 | 6.0%) are the most common fields of study among 748 individuals in Childress County who have obtained a bachelor's degree or higher.
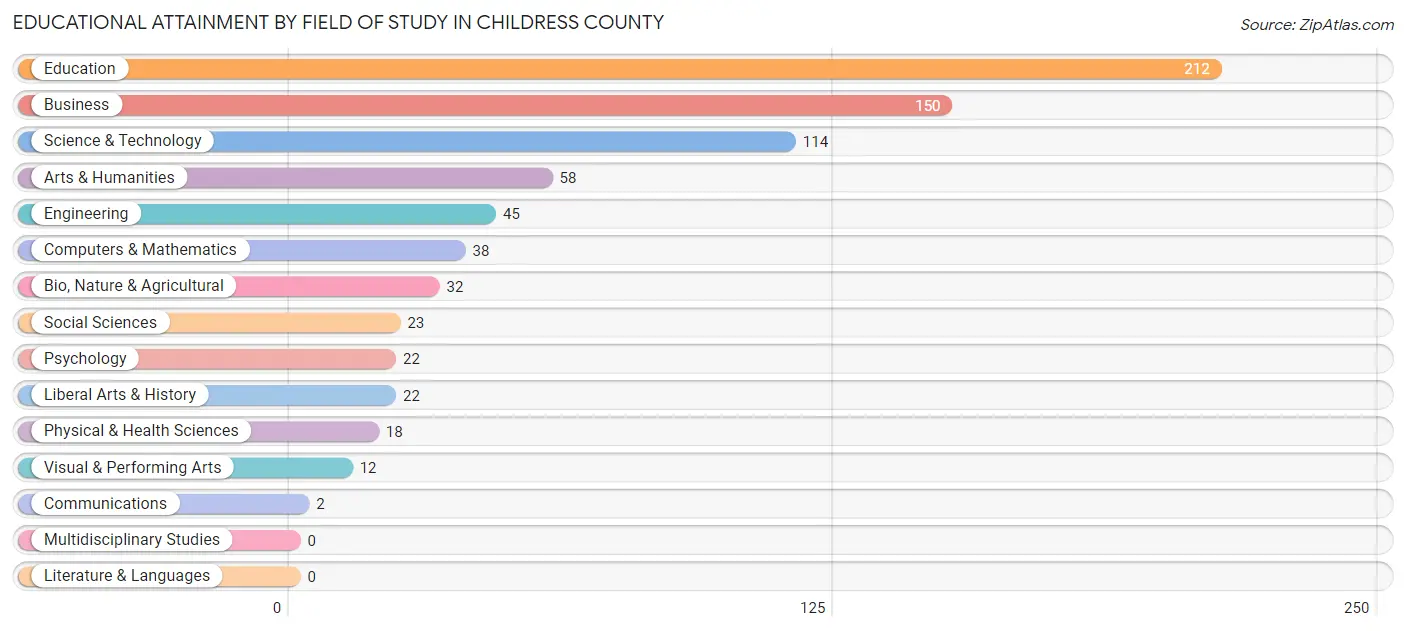
| Field of Study | # Graduates | % Graduates |
| Computers & Mathematics | 38 | 5.1% |
| Bio, Nature & Agricultural | 32 | 4.3% |
| Physical & Health Sciences | 18 | 2.4% |
| Psychology | 22 | 2.9% |
| Social Sciences | 23 | 3.1% |
| Engineering | 45 | 6.0% |
| Multidisciplinary Studies | 0 | 0.0% |
| Science & Technology | 114 | 15.2% |
| Business | 150 | 20.1% |
| Education | 212 | 28.3% |
| Literature & Languages | 0 | 0.0% |
| Liberal Arts & History | 22 | 2.9% |
| Visual & Performing Arts | 12 | 1.6% |
| Communications | 2 | 0.3% |
| Arts & Humanities | 58 | 7.7% |
| Total | 748 | 100.0% |
Transportation & Commute in Childress County
Vehicle Availability by Sex in Childress County
The most prevalent vehicle ownership categories in Childress County are males with 2 vehicles (794, accounting for 46.7%) and females with 2 vehicles (318, making up 69.8%).
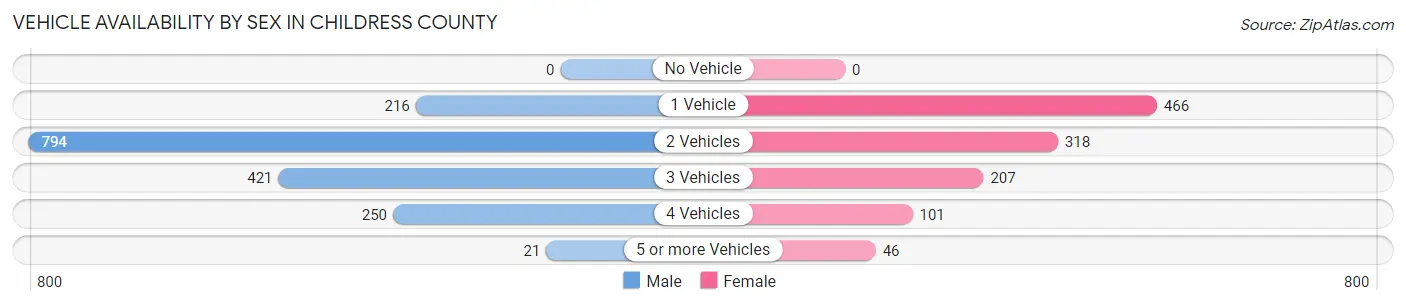
| Vehicles Available | Male | Female |
| No Vehicle | 0 (0.0%) | 0 (0.0%) |
| 1 Vehicle | 216 (12.7%) | 466 (40.9%) |
| 2 Vehicles | 794 (46.7%) | 318 (27.9%) |
| 3 Vehicles | 421 (24.7%) | 207 (18.2%) |
| 4 Vehicles | 250 (14.7%) | 101 (8.9%) |
| 5 or more Vehicles | 21 (1.2%) | 46 (4.0%) |
| Total | 1,702 (100.0%) | 1,138 (100.0%) |
Commute Time in Childress County
The most frequently occuring commute durations in Childress County are 5 to 9 minutes (790 commuters, 28.3%), less than 5 minutes (544 commuters, 19.5%), and 30 to 34 minutes (535 commuters, 19.2%).
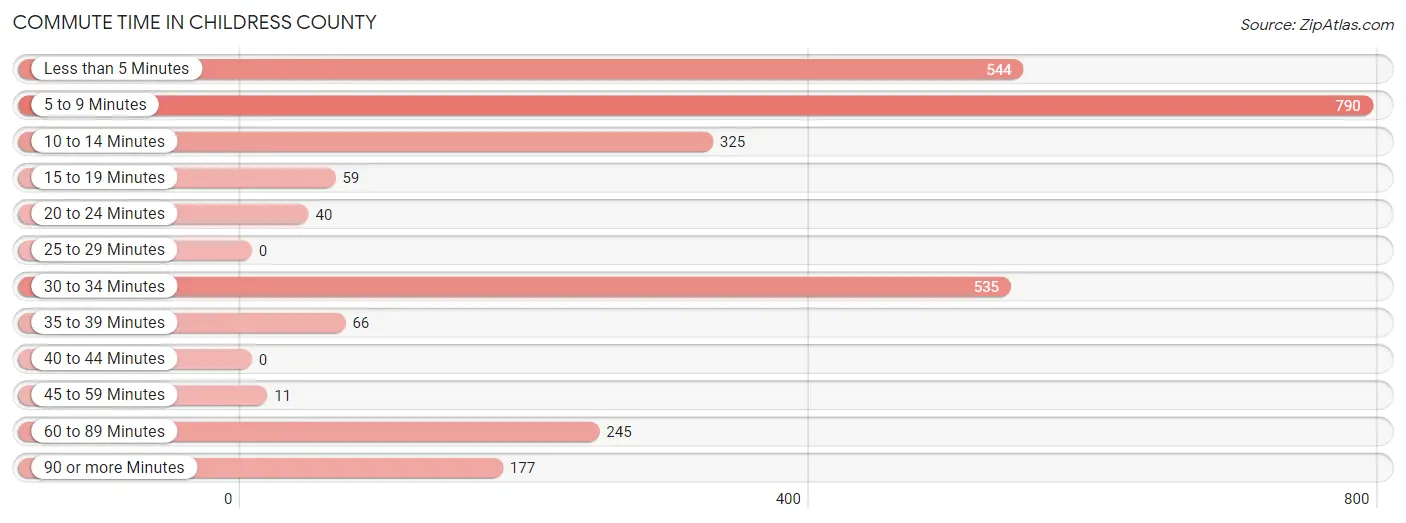
| Commute Time | # Commuters | % Commuters |
| Less than 5 Minutes | 544 | 19.5% |
| 5 to 9 Minutes | 790 | 28.3% |
| 10 to 14 Minutes | 325 | 11.6% |
| 15 to 19 Minutes | 59 | 2.1% |
| 20 to 24 Minutes | 40 | 1.4% |
| 25 to 29 Minutes | 0 | 0.0% |
| 30 to 34 Minutes | 535 | 19.2% |
| 35 to 39 Minutes | 66 | 2.4% |
| 40 to 44 Minutes | 0 | 0.0% |
| 45 to 59 Minutes | 11 | 0.4% |
| 60 to 89 Minutes | 245 | 8.8% |
| 90 or more Minutes | 177 | 6.3% |
Commute Time by Sex in Childress County
The most common commute times in Childress County are 30 to 34 minutes (488 commuters, 29.5%) for males and 5 to 9 minutes (401 commuters, 35.2%) for females.
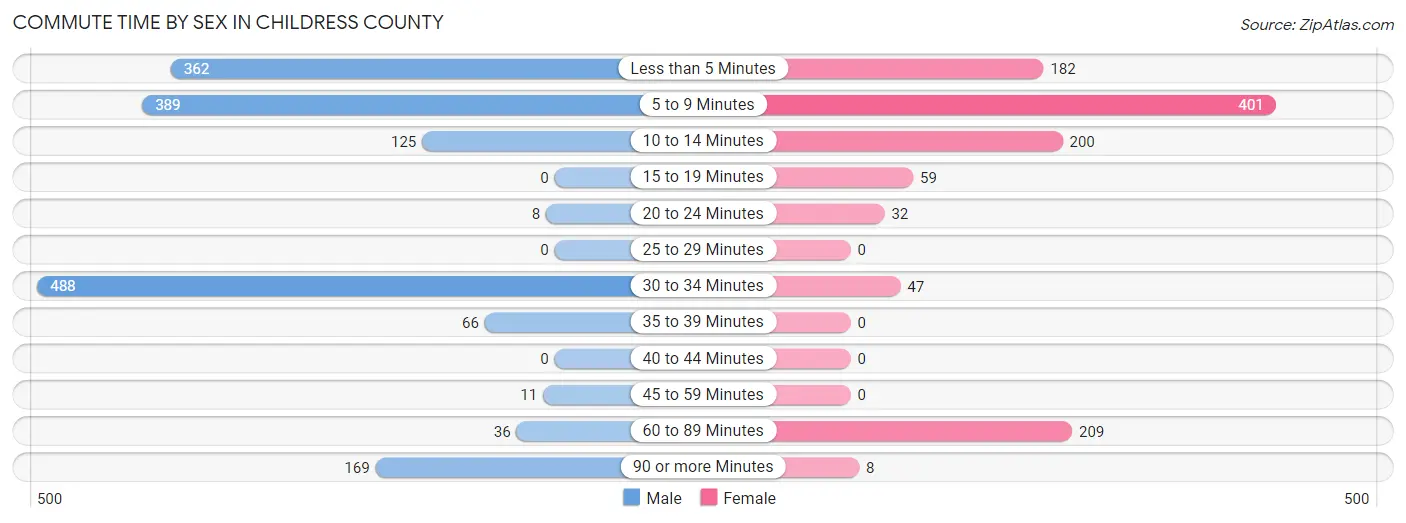
| Commute Time | Male | Female |
| Less than 5 Minutes | 362 (21.9%) | 182 (16.0%) |
| 5 to 9 Minutes | 389 (23.5%) | 401 (35.2%) |
| 10 to 14 Minutes | 125 (7.6%) | 200 (17.6%) |
| 15 to 19 Minutes | 0 (0.0%) | 59 (5.2%) |
| 20 to 24 Minutes | 8 (0.5%) | 32 (2.8%) |
| 25 to 29 Minutes | 0 (0.0%) | 0 (0.0%) |
| 30 to 34 Minutes | 488 (29.5%) | 47 (4.1%) |
| 35 to 39 Minutes | 66 (4.0%) | 0 (0.0%) |
| 40 to 44 Minutes | 0 (0.0%) | 0 (0.0%) |
| 45 to 59 Minutes | 11 (0.7%) | 0 (0.0%) |
| 60 to 89 Minutes | 36 (2.2%) | 209 (18.4%) |
| 90 or more Minutes | 169 (10.2%) | 8 (0.7%) |
Time of Departure to Work by Sex in Childress County
The most frequent times of departure to work in Childress County are 7:00 AM to 7:29 AM (422, 25.5%) for males and 6:30 AM to 6:59 AM (237, 20.8%) for females.
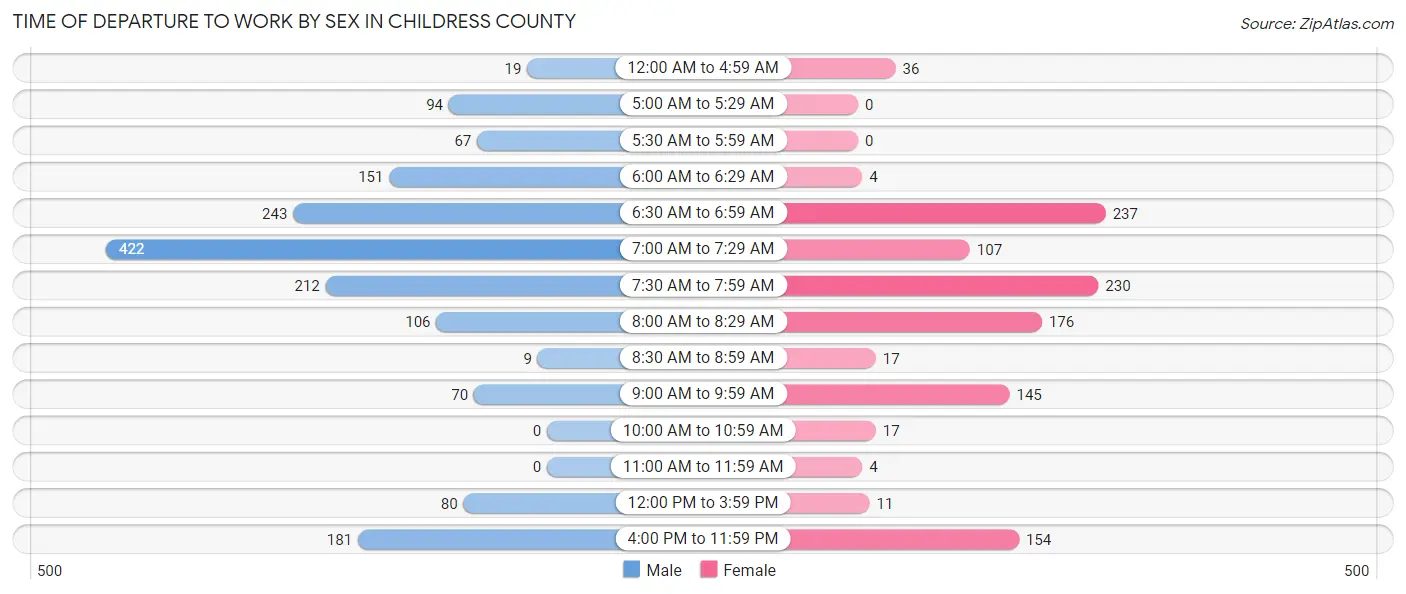
| Time of Departure | Male | Female |
| 12:00 AM to 4:59 AM | 19 (1.1%) | 36 (3.2%) |
| 5:00 AM to 5:29 AM | 94 (5.7%) | 0 (0.0%) |
| 5:30 AM to 5:59 AM | 67 (4.1%) | 0 (0.0%) |
| 6:00 AM to 6:29 AM | 151 (9.1%) | 4 (0.4%) |
| 6:30 AM to 6:59 AM | 243 (14.7%) | 237 (20.8%) |
| 7:00 AM to 7:29 AM | 422 (25.5%) | 107 (9.4%) |
| 7:30 AM to 7:59 AM | 212 (12.8%) | 230 (20.2%) |
| 8:00 AM to 8:29 AM | 106 (6.4%) | 176 (15.5%) |
| 8:30 AM to 8:59 AM | 9 (0.5%) | 17 (1.5%) |
| 9:00 AM to 9:59 AM | 70 (4.2%) | 145 (12.7%) |
| 10:00 AM to 10:59 AM | 0 (0.0%) | 17 (1.5%) |
| 11:00 AM to 11:59 AM | 0 (0.0%) | 4 (0.4%) |
| 12:00 PM to 3:59 PM | 80 (4.8%) | 11 (1.0%) |
| 4:00 PM to 11:59 PM | 181 (10.9%) | 154 (13.5%) |
| Total | 1,654 (100.0%) | 1,138 (100.0%) |
Housing Occupancy in Childress County
Occupancy by Ownership in Childress County
Of the total 1,892 dwellings in Childress County, owner-occupied units account for 1,346 (71.1%), while renter-occupied units make up 546 (28.9%).
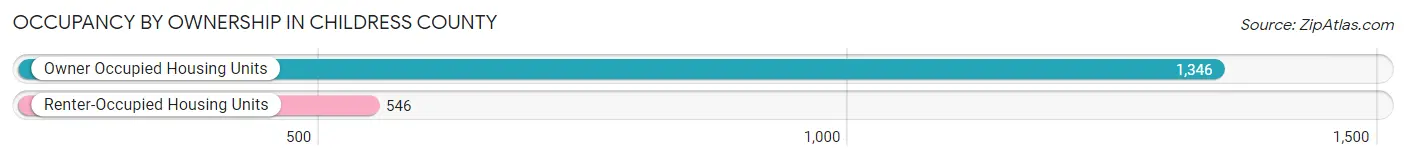
| Occupancy | # Housing Units | % Housing Units |
| Owner Occupied Housing Units | 1,346 | 71.1% |
| Renter-Occupied Housing Units | 546 | 28.9% |
| Total Occupied Housing Units | 1,892 | 100.0% |
Occupancy by Household Size in Childress County
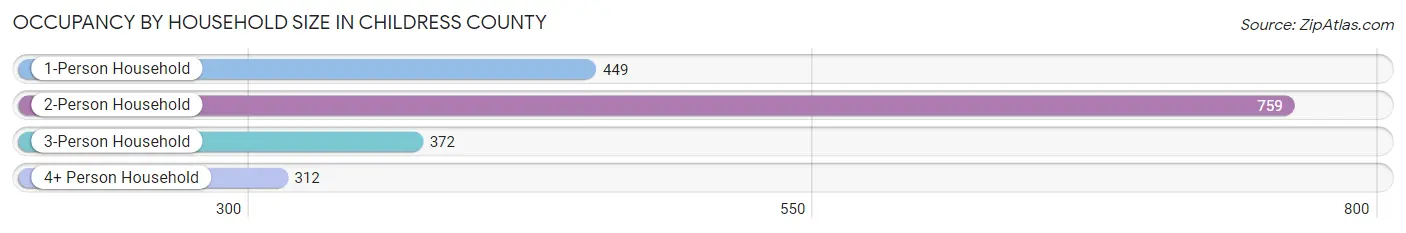
| Household Size | # Housing Units | % Housing Units |
| 1-Person Household | 449 | 23.7% |
| 2-Person Household | 759 | 40.1% |
| 3-Person Household | 372 | 19.7% |
| 4+ Person Household | 312 | 16.5% |
| Total Housing Units | 1,892 | 100.0% |
Occupancy by Ownership by Household Size in Childress County
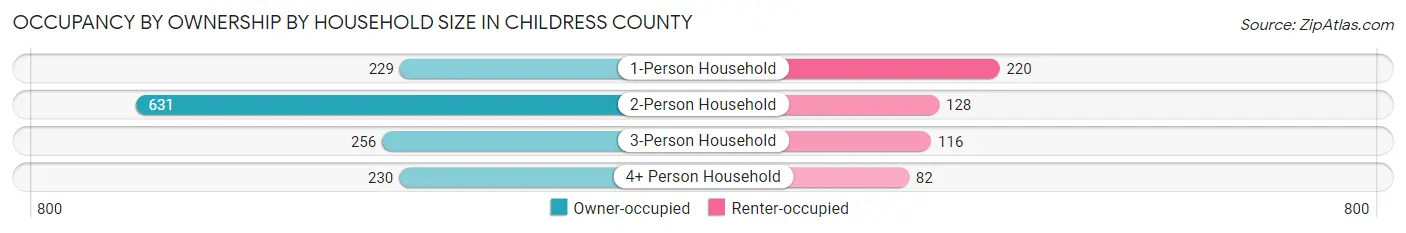
| Household Size | Owner-occupied | Renter-occupied |
| 1-Person Household | 229 (51.0%) | 220 (49.0%) |
| 2-Person Household | 631 (83.1%) | 128 (16.9%) |
| 3-Person Household | 256 (68.8%) | 116 (31.2%) |
| 4+ Person Household | 230 (73.7%) | 82 (26.3%) |
| Total Housing Units | 1,346 (71.1%) | 546 (28.9%) |
Occupancy by Educational Attainment in Childress County
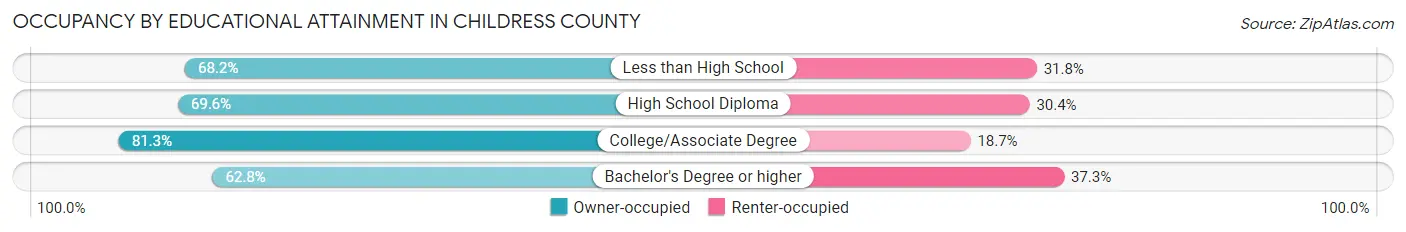
| Household Size | Owner-occupied | Renter-occupied |
| Less than High School | 227 (68.2%) | 106 (31.8%) |
| High School Diploma | 339 (69.6%) | 148 (30.4%) |
| College/Associate Degree | 470 (81.3%) | 108 (18.7%) |
| Bachelor's Degree or higher | 310 (62.7%) | 184 (37.2%) |
Occupancy by Age of Householder in Childress County
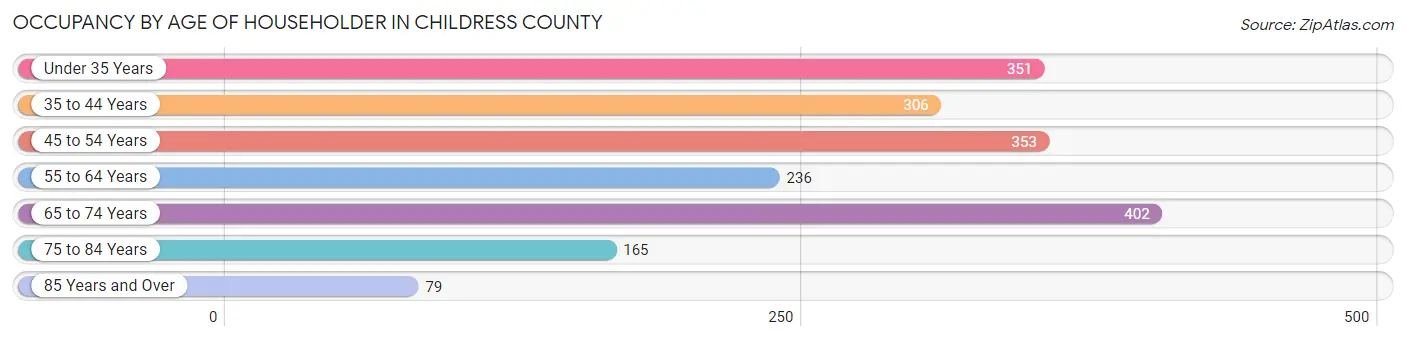
| Age Bracket | # Households | % Households |
| Under 35 Years | 351 | 18.5% |
| 35 to 44 Years | 306 | 16.2% |
| 45 to 54 Years | 353 | 18.7% |
| 55 to 64 Years | 236 | 12.5% |
| 65 to 74 Years | 402 | 21.2% |
| 75 to 84 Years | 165 | 8.7% |
| 85 Years and Over | 79 | 4.2% |
| Total | 1,892 | 100.0% |
Housing Finances in Childress County
Median Income by Occupancy in Childress County
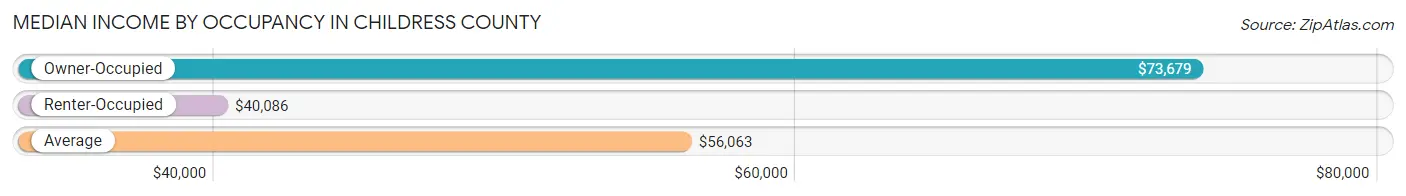
| Occupancy Type | # Households | Median Income |
| Owner-Occupied | 1,346 (71.1%) | $73,679 |
| Renter-Occupied | 546 (28.9%) | $40,086 |
| Average | 1,892 (100.0%) | $56,063 |
Occupancy by Householder Income Bracket in Childress County
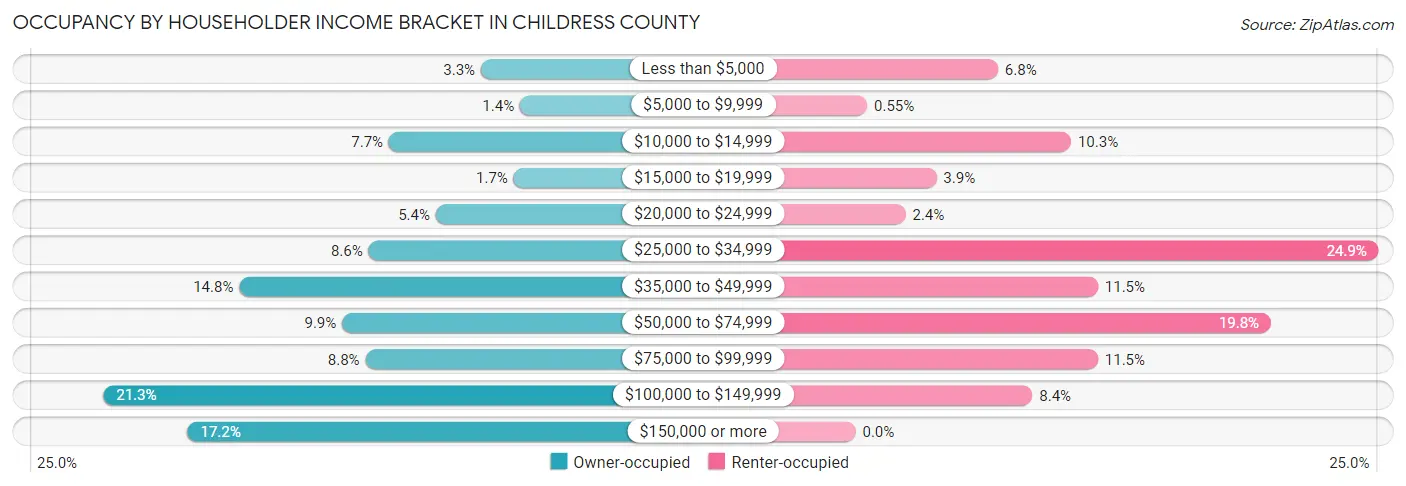
| Income Bracket | Owner-occupied | Renter-occupied |
| Less than $5,000 | 44 (3.3%) | 37 (6.8%) |
| $5,000 to $9,999 | 19 (1.4%) | 3 (0.5%) |
| $10,000 to $14,999 | 103 (7.6%) | 56 (10.3%) |
| $15,000 to $19,999 | 23 (1.7%) | 21 (3.8%) |
| $20,000 to $24,999 | 73 (5.4%) | 13 (2.4%) |
| $25,000 to $34,999 | 116 (8.6%) | 136 (24.9%) |
| $35,000 to $49,999 | 199 (14.8%) | 63 (11.5%) |
| $50,000 to $74,999 | 133 (9.9%) | 108 (19.8%) |
| $75,000 to $99,999 | 118 (8.8%) | 63 (11.5%) |
| $100,000 to $149,999 | 286 (21.2%) | 46 (8.4%) |
| $150,000 or more | 232 (17.2%) | 0 (0.0%) |
| Total | 1,346 (100.0%) | 546 (100.0%) |
Monthly Housing Cost Tiers in Childress County
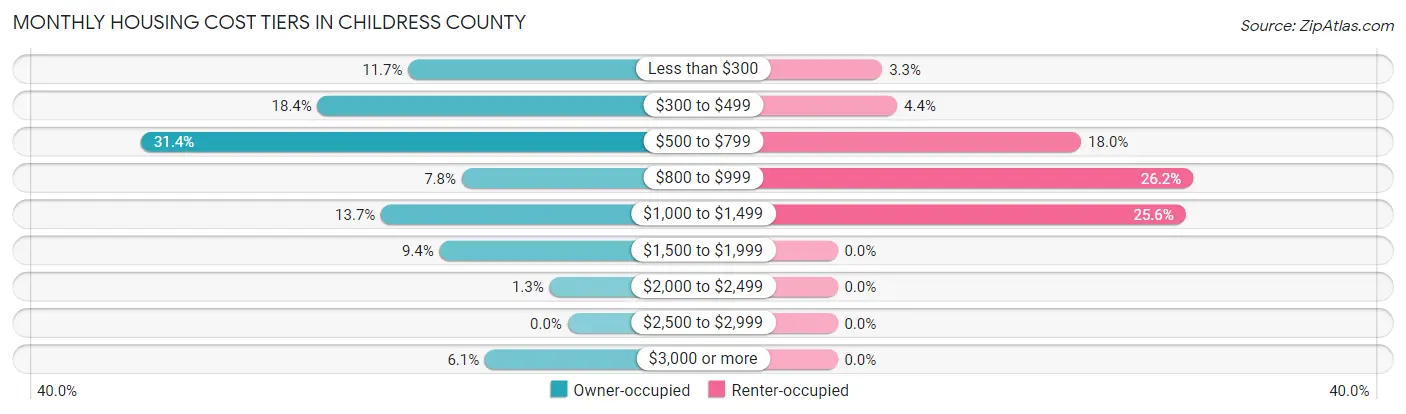
| Monthly Cost | Owner-occupied | Renter-occupied |
| Less than $300 | 158 (11.7%) | 18 (3.3%) |
| $300 to $499 | 248 (18.4%) | 24 (4.4%) |
| $500 to $799 | 423 (31.4%) | 98 (17.9%) |
| $800 to $999 | 105 (7.8%) | 143 (26.2%) |
| $1,000 to $1,499 | 185 (13.7%) | 140 (25.6%) |
| $1,500 to $1,999 | 127 (9.4%) | 0 (0.0%) |
| $2,000 to $2,499 | 18 (1.3%) | 0 (0.0%) |
| $2,500 to $2,999 | 0 (0.0%) | 0 (0.0%) |
| $3,000 or more | 82 (6.1%) | 0 (0.0%) |
| Total | 1,346 (100.0%) | 546 (100.0%) |
Physical Housing Characteristics in Childress County
Housing Structures in Childress County
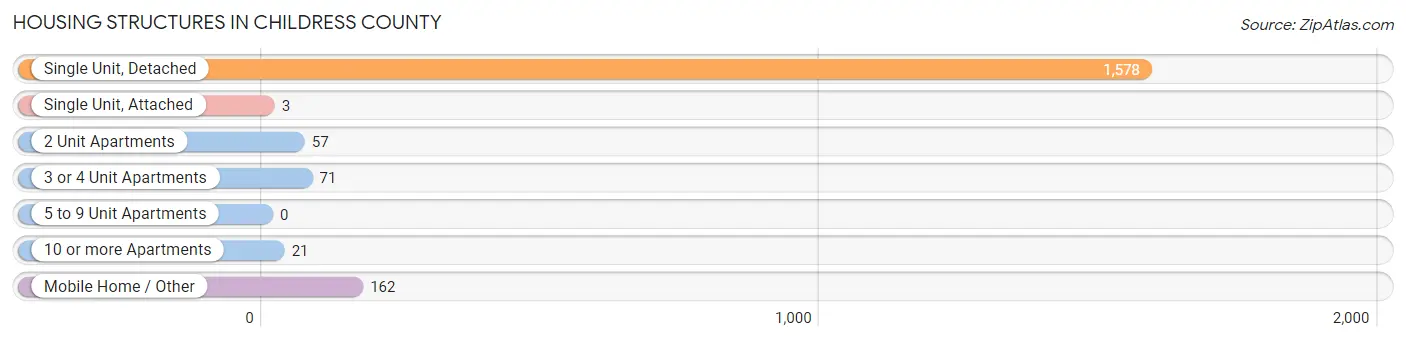
| Structure Type | # Housing Units | % Housing Units |
| Single Unit, Detached | 1,578 | 83.4% |
| Single Unit, Attached | 3 | 0.2% |
| 2 Unit Apartments | 57 | 3.0% |
| 3 or 4 Unit Apartments | 71 | 3.7% |
| 5 to 9 Unit Apartments | 0 | 0.0% |
| 10 or more Apartments | 21 | 1.1% |
| Mobile Home / Other | 162 | 8.6% |
| Total | 1,892 | 100.0% |
Housing Structures by Occupancy in Childress County
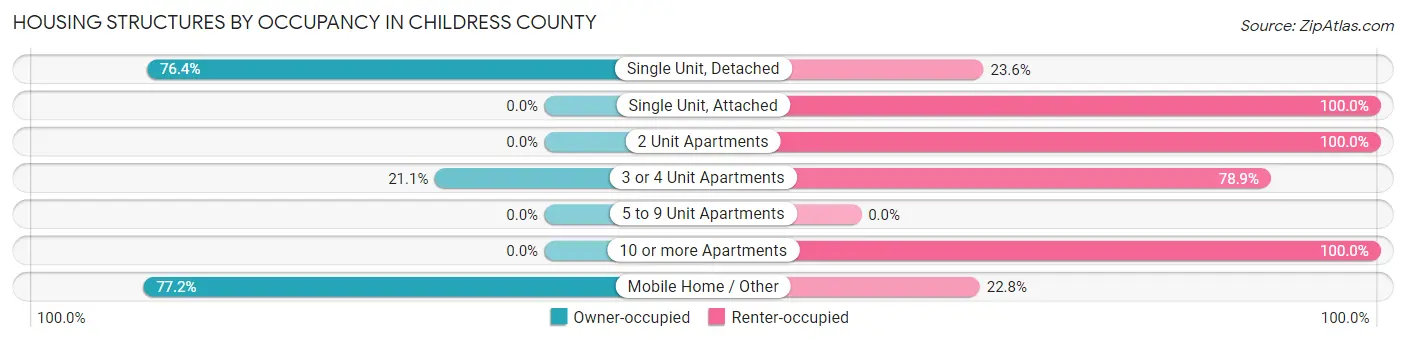
| Structure Type | Owner-occupied | Renter-occupied |
| Single Unit, Detached | 1,206 (76.4%) | 372 (23.6%) |
| Single Unit, Attached | 0 (0.0%) | 3 (100.0%) |
| 2 Unit Apartments | 0 (0.0%) | 57 (100.0%) |
| 3 or 4 Unit Apartments | 15 (21.1%) | 56 (78.9%) |
| 5 to 9 Unit Apartments | 0 (0.0%) | 0 (0.0%) |
| 10 or more Apartments | 0 (0.0%) | 21 (100.0%) |
| Mobile Home / Other | 125 (77.2%) | 37 (22.8%) |
| Total | 1,346 (71.1%) | 546 (28.9%) |
Housing Structures by Number of Rooms in Childress County
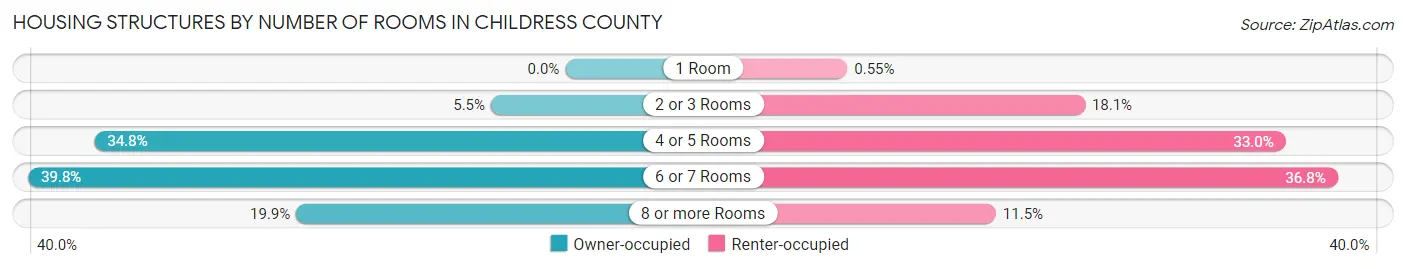
| Number of Rooms | Owner-occupied | Renter-occupied |
| 1 Room | 0 (0.0%) | 3 (0.5%) |
| 2 or 3 Rooms | 74 (5.5%) | 99 (18.1%) |
| 4 or 5 Rooms | 469 (34.8%) | 180 (33.0%) |
| 6 or 7 Rooms | 535 (39.8%) | 201 (36.8%) |
| 8 or more Rooms | 268 (19.9%) | 63 (11.5%) |
| Total | 1,346 (100.0%) | 546 (100.0%) |
Housing Structure by Heating Type in Childress County
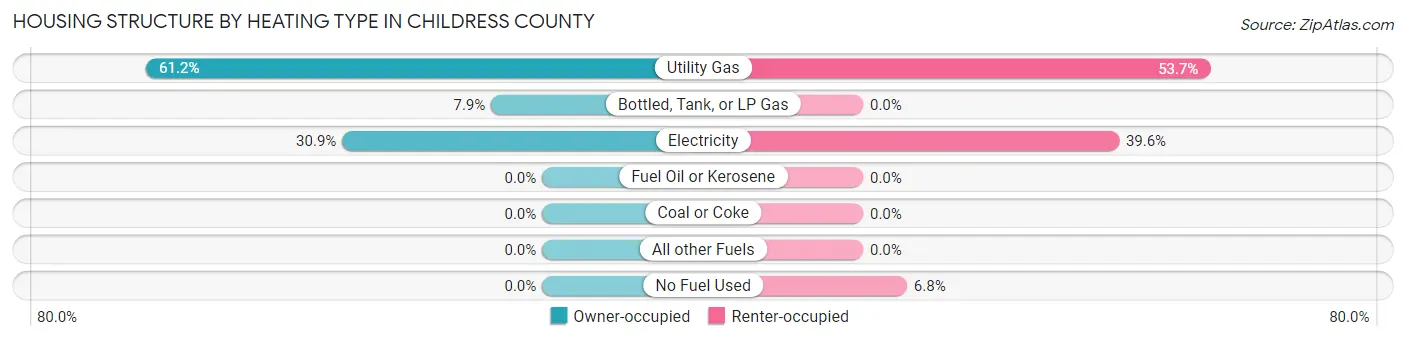
| Heating Type | Owner-occupied | Renter-occupied |
| Utility Gas | 824 (61.2%) | 293 (53.7%) |
| Bottled, Tank, or LP Gas | 106 (7.9%) | 0 (0.0%) |
| Electricity | 416 (30.9%) | 216 (39.6%) |
| Fuel Oil or Kerosene | 0 (0.0%) | 0 (0.0%) |
| Coal or Coke | 0 (0.0%) | 0 (0.0%) |
| All other Fuels | 0 (0.0%) | 0 (0.0%) |
| No Fuel Used | 0 (0.0%) | 37 (6.8%) |
| Total | 1,346 (100.0%) | 546 (100.0%) |
Household Vehicle Usage in Childress County
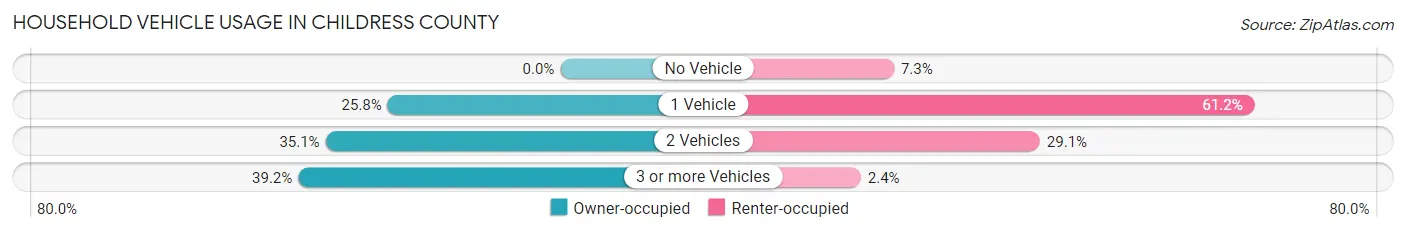
| Vehicles per Household | Owner-occupied | Renter-occupied |
| No Vehicle | 0 (0.0%) | 40 (7.3%) |
| 1 Vehicle | 347 (25.8%) | 334 (61.2%) |
| 2 Vehicles | 472 (35.1%) | 159 (29.1%) |
| 3 or more Vehicles | 527 (39.2%) | 13 (2.4%) |
| Total | 1,346 (100.0%) | 546 (100.0%) |
Real Estate & Mortgages in Childress County
Real Estate and Mortgage Overview in Childress County
| Characteristic | Without Mortgage | With Mortgage |
| Housing Units | 885 | 461 |
| Median Property Value | $87,000 | $144,400 |
| Median Household Income | $63,188 | $75 |
| Monthly Housing Costs | $515 | $82 |
| Real Estate Taxes | $1,451 | $0 |
Property Value by Mortgage Status in Childress County
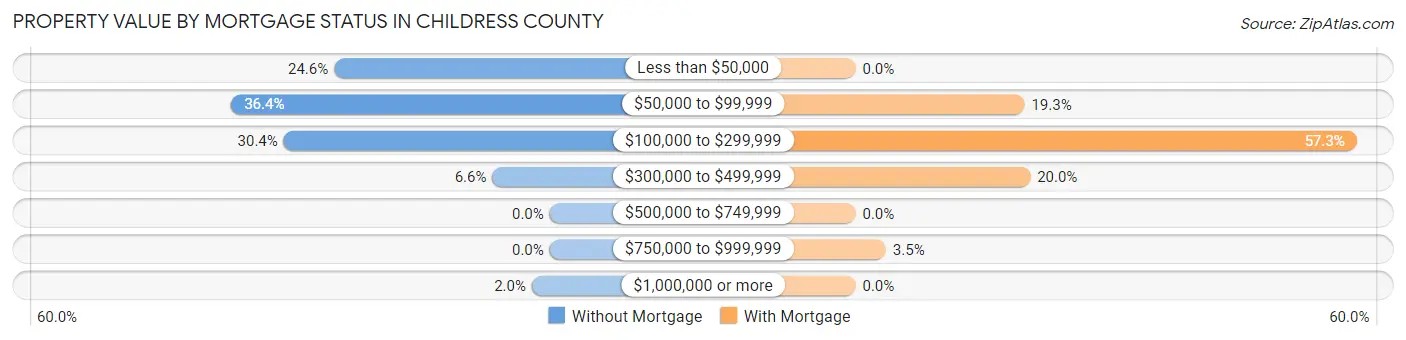
| Property Value | Without Mortgage | With Mortgage |
| Less than $50,000 | 218 (24.6%) | 0 (0.0%) |
| $50,000 to $99,999 | 322 (36.4%) | 89 (19.3%) |
| $100,000 to $299,999 | 269 (30.4%) | 264 (57.3%) |
| $300,000 to $499,999 | 58 (6.6%) | 92 (20.0%) |
| $500,000 to $749,999 | 0 (0.0%) | 0 (0.0%) |
| $750,000 to $999,999 | 0 (0.0%) | 16 (3.5%) |
| $1,000,000 or more | 18 (2.0%) | 0 (0.0%) |
| Total | 885 (100.0%) | 461 (100.0%) |
Household Income by Mortgage Status in Childress County
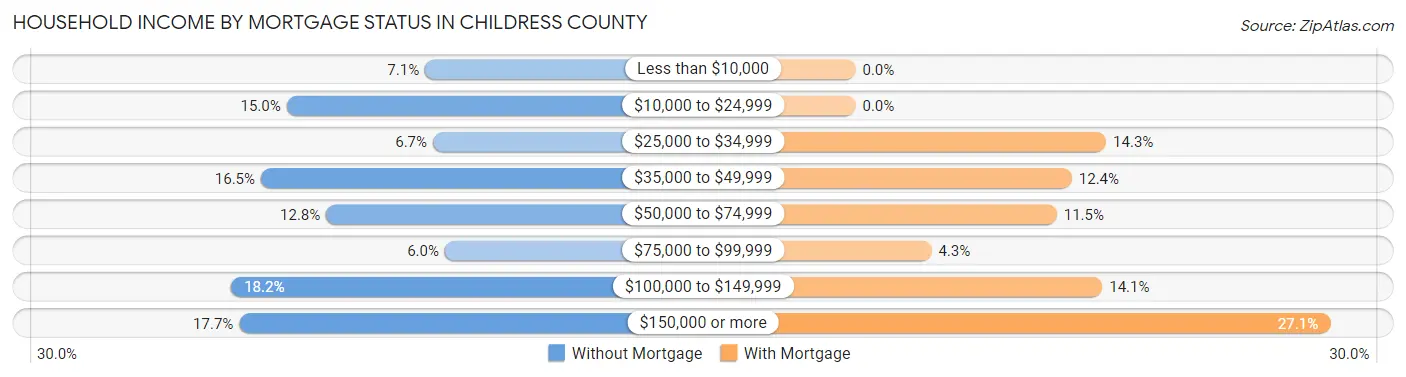
| Household Income | Without Mortgage | With Mortgage |
| Less than $10,000 | 63 (7.1%) | 0 (0.0%) |
| $10,000 to $24,999 | 133 (15.0%) | 0 (0.0%) |
| $25,000 to $34,999 | 59 (6.7%) | 66 (14.3%) |
| $35,000 to $49,999 | 146 (16.5%) | 57 (12.4%) |
| $50,000 to $74,999 | 113 (12.8%) | 53 (11.5%) |
| $75,000 to $99,999 | 53 (6.0%) | 20 (4.3%) |
| $100,000 to $149,999 | 161 (18.2%) | 65 (14.1%) |
| $150,000 or more | 157 (17.7%) | 125 (27.1%) |
| Total | 885 (100.0%) | 461 (100.0%) |
Property Value to Household Income Ratio in Childress County
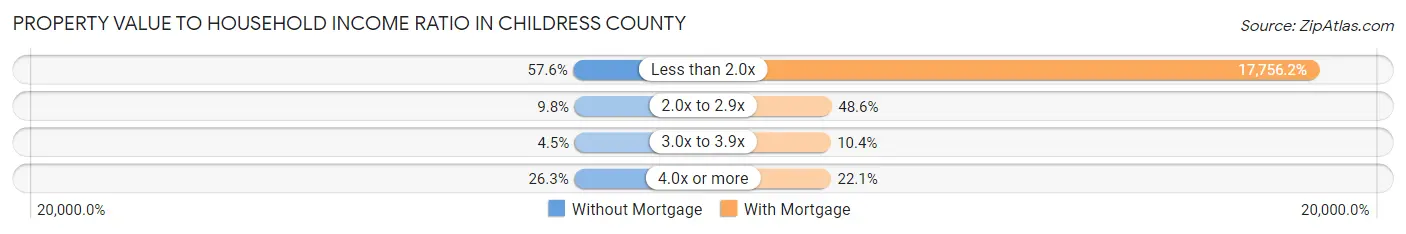
| Value-to-Income Ratio | Without Mortgage | With Mortgage |
| Less than 2.0x | 510 (57.6%) | 81,856 (17,756.2%) |
| 2.0x to 2.9x | 87 (9.8%) | 224 (48.6%) |
| 3.0x to 3.9x | 40 (4.5%) | 48 (10.4%) |
| 4.0x or more | 233 (26.3%) | 102 (22.1%) |
| Total | 885 (100.0%) | 461 (100.0%) |
Real Estate Taxes by Mortgage Status in Childress County
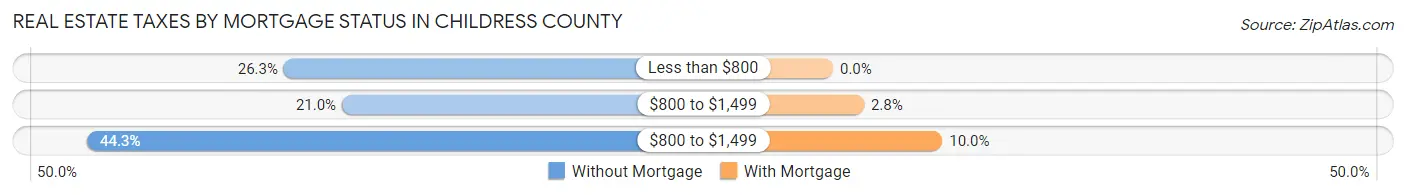
| Property Taxes | Without Mortgage | With Mortgage |
| Less than $800 | 233 (26.3%) | 0 (0.0%) |
| $800 to $1,499 | 186 (21.0%) | 13 (2.8%) |
| $800 to $1,499 | 392 (44.3%) | 46 (10.0%) |
| Total | 885 (100.0%) | 461 (100.0%) |
Health & Disability in Childress County
Health Insurance Coverage by Age in Childress County
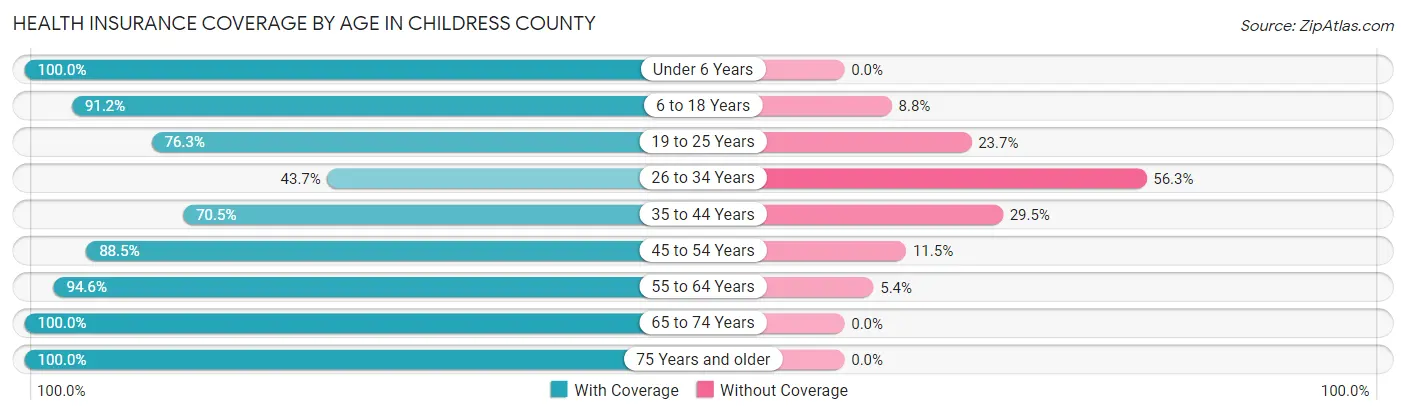
| Age Bracket | With Coverage | Without Coverage |
| Under 6 Years | 387 (100.0%) | 0 (0.0%) |
| 6 to 18 Years | 868 (91.2%) | 84 (8.8%) |
| 19 to 25 Years | 216 (76.3%) | 67 (23.7%) |
| 26 to 34 Years | 501 (43.7%) | 646 (56.3%) |
| 35 to 44 Years | 489 (70.5%) | 205 (29.5%) |
| 45 to 54 Years | 400 (88.5%) | 52 (11.5%) |
| 55 to 64 Years | 507 (94.6%) | 29 (5.4%) |
| 65 to 74 Years | 553 (100.0%) | 0 (0.0%) |
| 75 Years and older | 327 (100.0%) | 0 (0.0%) |
| Total | 4,248 (79.7%) | 1,083 (20.3%) |
Health Insurance Coverage by Citizenship Status in Childress County
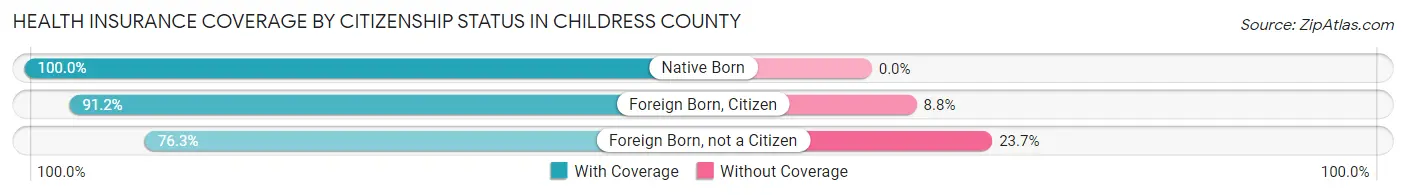
| Citizenship Status | With Coverage | Without Coverage |
| Native Born | 387 (100.0%) | 0 (0.0%) |
| Foreign Born, Citizen | 868 (91.2%) | 84 (8.8%) |
| Foreign Born, not a Citizen | 216 (76.3%) | 67 (23.7%) |
Health Insurance Coverage by Household Income in Childress County
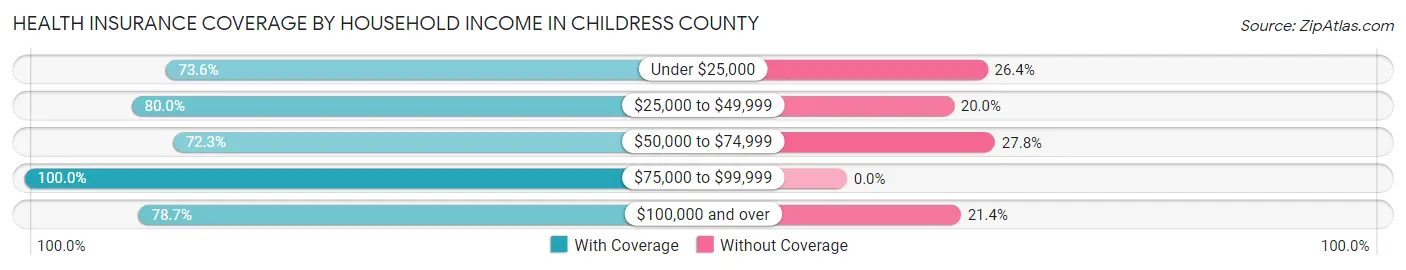
| Household Income | With Coverage | Without Coverage |
| Under $25,000 | 469 (73.6%) | 168 (26.4%) |
| $25,000 to $49,999 | 1,153 (80.0%) | 289 (20.0%) |
| $50,000 to $74,999 | 375 (72.3%) | 144 (27.8%) |
| $75,000 to $99,999 | 475 (100.0%) | 0 (0.0%) |
| $100,000 and over | 1,776 (78.6%) | 482 (21.3%) |
Public vs Private Health Insurance Coverage by Age in Childress County
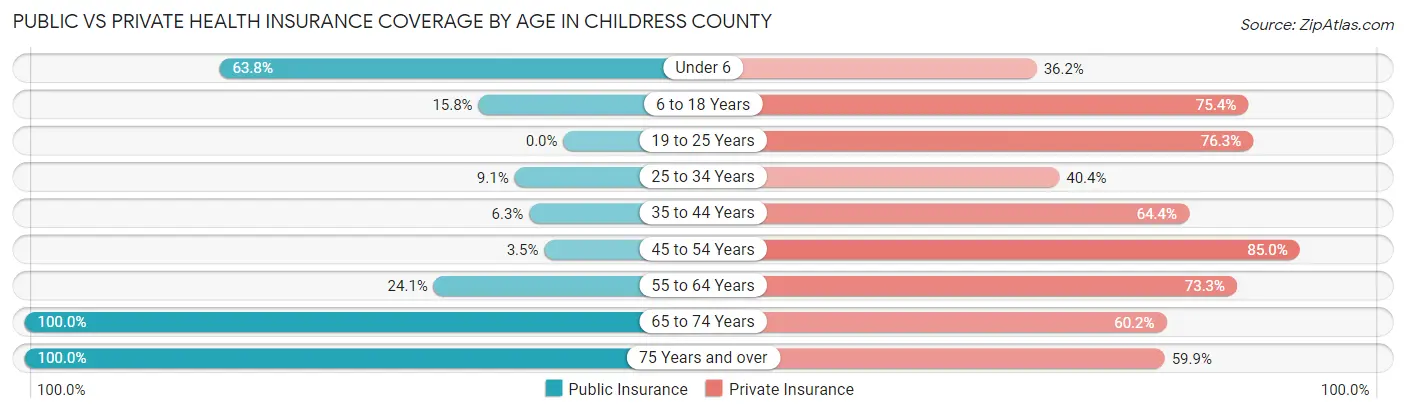
| Age Bracket | Public Insurance | Private Insurance |
| Under 6 | 247 (63.8%) | 140 (36.2%) |
| 6 to 18 Years | 150 (15.8%) | 718 (75.4%) |
| 19 to 25 Years | 0 (0.0%) | 216 (76.3%) |
| 25 to 34 Years | 104 (9.1%) | 463 (40.4%) |
| 35 to 44 Years | 44 (6.3%) | 447 (64.4%) |
| 45 to 54 Years | 16 (3.5%) | 384 (85.0%) |
| 55 to 64 Years | 129 (24.1%) | 393 (73.3%) |
| 65 to 74 Years | 553 (100.0%) | 333 (60.2%) |
| 75 Years and over | 327 (100.0%) | 196 (59.9%) |
| Total | 1,570 (29.4%) | 3,290 (61.7%) |
Disability Status by Sex by Age in Childress County
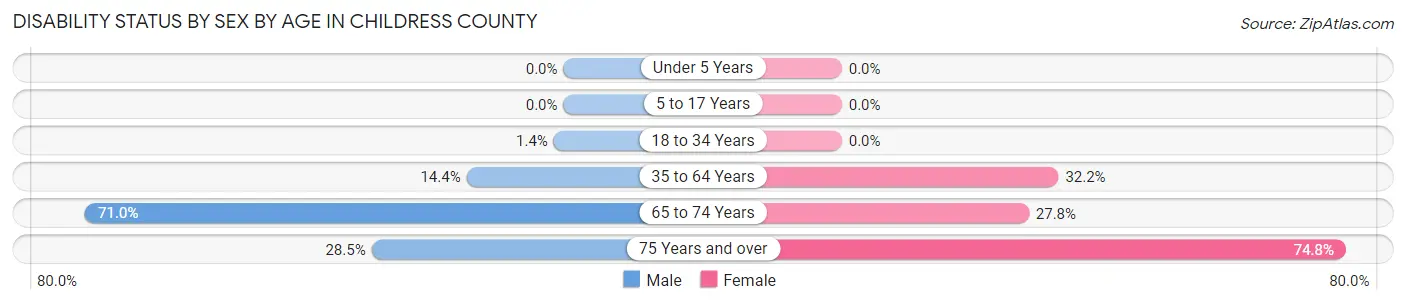
| Age Bracket | Male | Female |
| Under 5 Years | 0 (0.0%) | 0 (0.0%) |
| 5 to 17 Years | 0 (0.0%) | 0 (0.0%) |
| 18 to 34 Years | 17 (1.4%) | 0 (0.0%) |
| 35 to 64 Years | 106 (14.4%) | 304 (32.2%) |
| 65 to 74 Years | 201 (71.0%) | 75 (27.8%) |
| 75 Years and over | 49 (28.5%) | 116 (74.8%) |
Disability Class by Sex by Age in Childress County
Disability Class: Hearing Difficulty
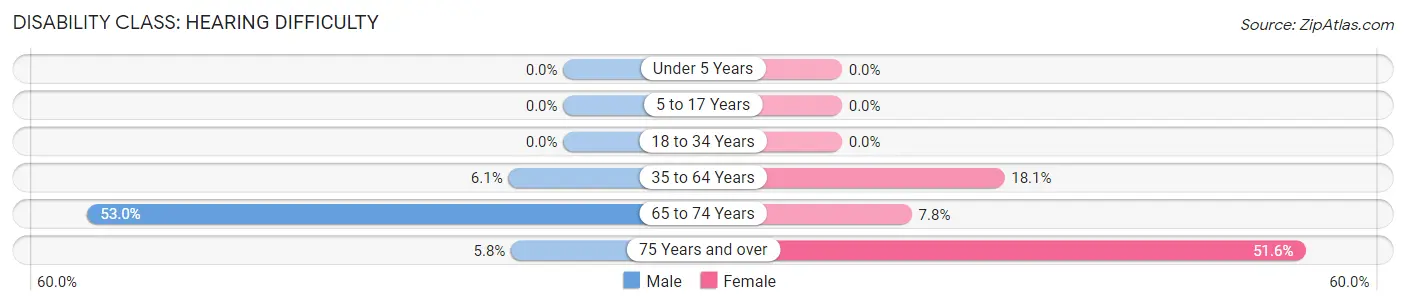
| Age Bracket | Male | Female |
| Under 5 Years | 0 (0.0%) | 0 (0.0%) |
| 5 to 17 Years | 0 (0.0%) | 0 (0.0%) |
| 18 to 34 Years | 0 (0.0%) | 0 (0.0%) |
| 35 to 64 Years | 45 (6.1%) | 171 (18.1%) |
| 65 to 74 Years | 150 (53.0%) | 21 (7.8%) |
| 75 Years and over | 10 (5.8%) | 80 (51.6%) |
Disability Class: Vision Difficulty
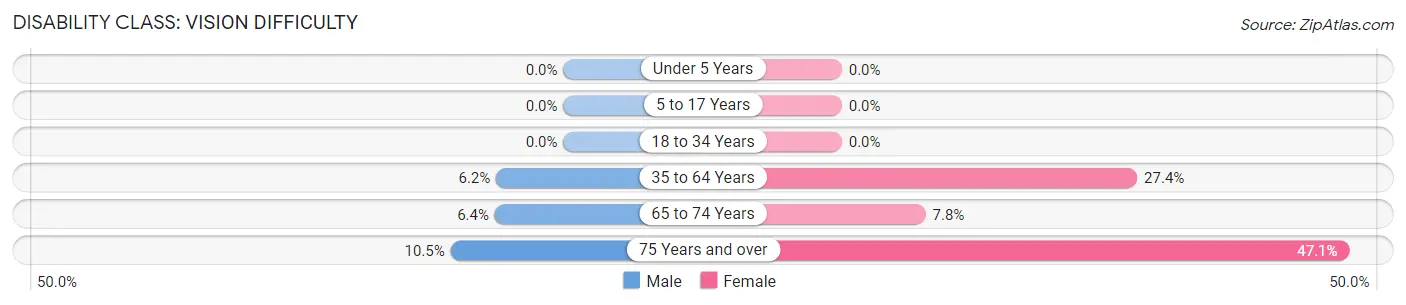
| Age Bracket | Male | Female |
| Under 5 Years | 0 (0.0%) | 0 (0.0%) |
| 5 to 17 Years | 0 (0.0%) | 0 (0.0%) |
| 18 to 34 Years | 0 (0.0%) | 0 (0.0%) |
| 35 to 64 Years | 46 (6.2%) | 259 (27.4%) |
| 65 to 74 Years | 18 (6.4%) | 21 (7.8%) |
| 75 Years and over | 18 (10.5%) | 73 (47.1%) |
Disability Class: Cognitive Difficulty
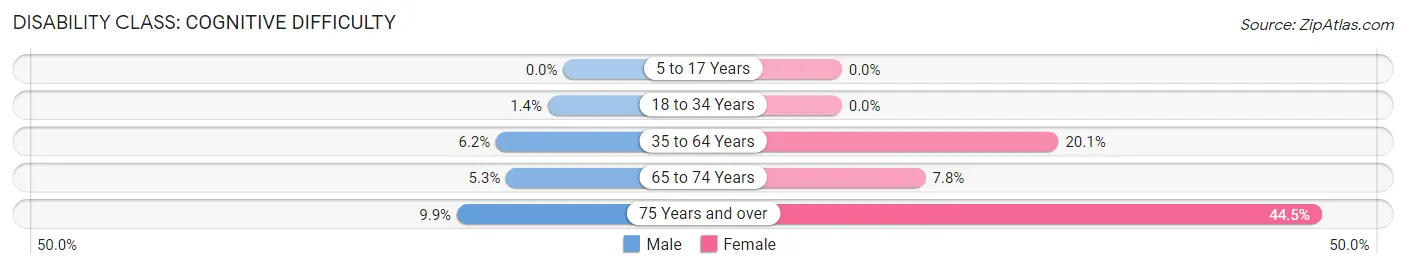
| Age Bracket | Male | Female |
| 5 to 17 Years | 0 (0.0%) | 0 (0.0%) |
| 18 to 34 Years | 17 (1.4%) | 0 (0.0%) |
| 35 to 64 Years | 46 (6.2%) | 190 (20.1%) |
| 65 to 74 Years | 15 (5.3%) | 21 (7.8%) |
| 75 Years and over | 17 (9.9%) | 69 (44.5%) |
Disability Class: Ambulatory Difficulty
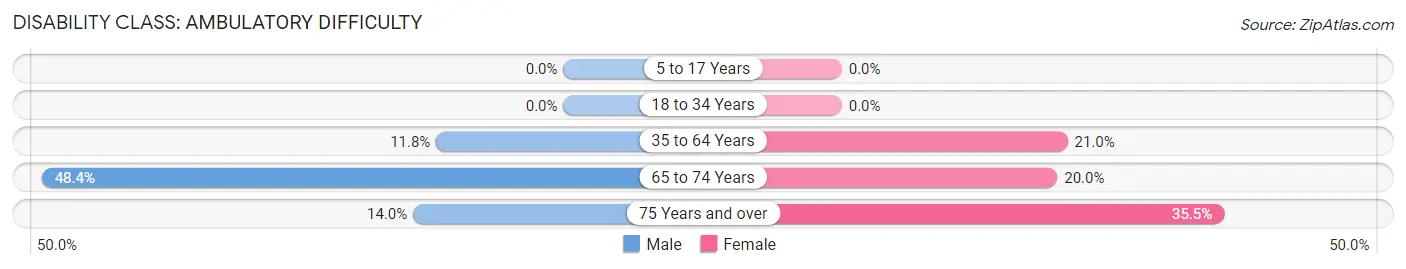
| Age Bracket | Male | Female |
| 5 to 17 Years | 0 (0.0%) | 0 (0.0%) |
| 18 to 34 Years | 0 (0.0%) | 0 (0.0%) |
| 35 to 64 Years | 87 (11.8%) | 198 (20.9%) |
| 65 to 74 Years | 137 (48.4%) | 54 (20.0%) |
| 75 Years and over | 24 (14.0%) | 55 (35.5%) |
Disability Class: Self-Care Difficulty
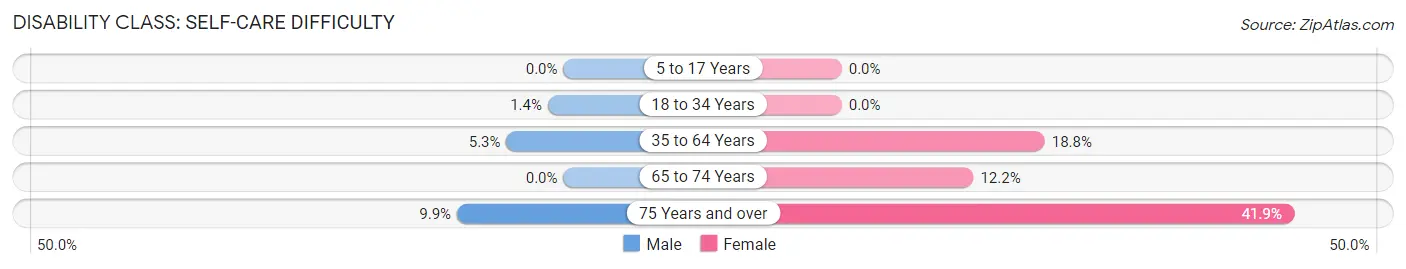
| Age Bracket | Male | Female |
| 5 to 17 Years | 0 (0.0%) | 0 (0.0%) |
| 18 to 34 Years | 17 (1.4%) | 0 (0.0%) |
| 35 to 64 Years | 39 (5.3%) | 178 (18.8%) |
| 65 to 74 Years | 0 (0.0%) | 33 (12.2%) |
| 75 Years and over | 17 (9.9%) | 65 (41.9%) |
Technology Access in Childress County
Computing Device Access in Childress County
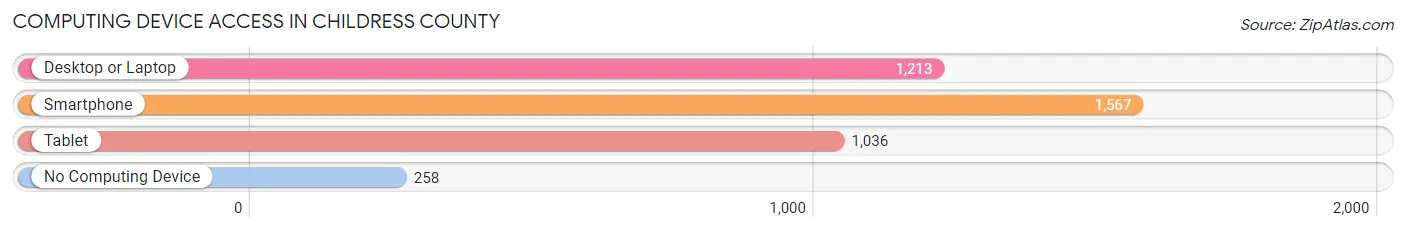
| Device Type | # Households | % Households |
| Desktop or Laptop | 1,213 | 64.1% |
| Smartphone | 1,567 | 82.8% |
| Tablet | 1,036 | 54.8% |
| No Computing Device | 258 | 13.6% |
| Total | 1,892 | 100.0% |
Internet Access in Childress County
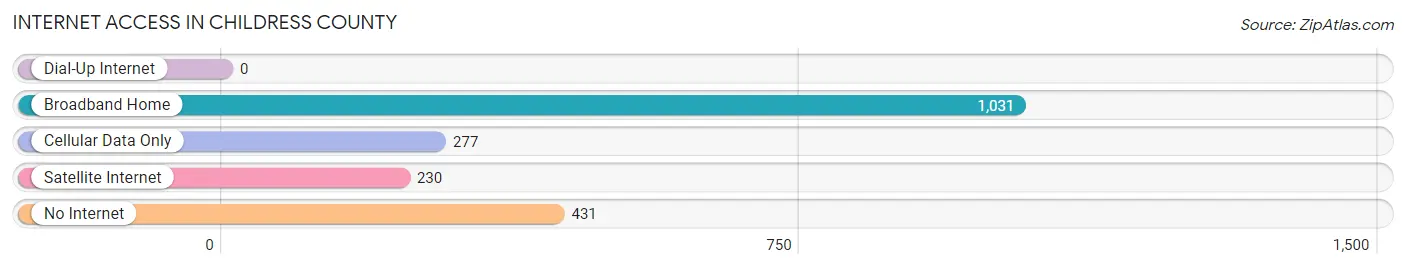
| Internet Type | # Households | % Households |
| Dial-Up Internet | 0 | 0.0% |
| Broadband Home | 1,031 | 54.5% |
| Cellular Data Only | 277 | 14.6% |
| Satellite Internet | 230 | 12.2% |
| No Internet | 431 | 22.8% |
| Total | 1,892 | 100.0% |
Childress County Summary
Childress County is located in the northern part of the state of Texas, in the United States. It is bordered by Hardeman County to the north, Hall County to the east, Cottle County to the south, and Collingsworth County to the west. The county seat is Childress, and the county has a total area of 902 square miles. As of the 2010 census, the population was 7,041.
History
Childress County was established in 1876 and named for George Campbell Childress, a signer of the Texas Declaration of Independence. The county was originally part of Bexar County, but was later divided into several smaller counties. The first settlers in the area were ranchers, who established large cattle ranches in the area. The county was also home to several Native American tribes, including the Comanche, Kiowa, and Apache.
Geography
Childress County is located in the northern part of the state of Texas. It is bordered by Hardeman County to the north, Hall County to the east, Cottle County to the south, and Collingsworth County to the west. The county has a total area of 902 square miles, of which 899 square miles is land and 3 square miles is water. The terrain is mostly flat, with some rolling hills in the western part of the county. The county is part of the High Plains region of Texas, and is located in the Central Time Zone.
Economy
The economy of Childress County is largely based on agriculture. The county is home to several large ranches, and the main crops grown in the area are wheat, corn, sorghum, and cotton. The county also has a large oil and gas industry, and is home to several oil and gas wells. The county is also home to several manufacturing companies, including a large poultry processing plant.
Demographics
As of the 2010 census, the population of Childress County was 7,041. The racial makeup of the county was 79.3% White, 0.7% African American, 0.7% Native American, 0.2% Asian, 0.1% Pacific Islander, 17.3% from other races, and 1.9% from two or more races. Hispanic or Latino of any race were 33.2% of the population.
The median income for a household in the county was $31,944, and the median income for a family was $37,917. The per capita income for the county was $15,945. About 17.2% of families and 21.3% of the population were below the poverty line, including 28.2% of those under age 18 and 14.2% of those age 65 or over.
Common Questions
What is Per Capita Income in Childress County?
Per Capita income in Childress County is $27,466.
What is the Median Family Income in Childress County?
Median Family Income in Childress County is $57,031.
What is the Median Household income in Childress County?
Median Household Income in Childress County is $56,063.
What is Income or Wage Gap in Childress County?
Income or Wage Gap in Childress County is 36.6%.
Women in Childress County earn 63.4 cents for every dollar earned by a man.
What is Inequality or Gini Index in Childress County?
Inequality or Gini Index in Childress County is 0.47.
What is the Total Population of Childress County?
Total Population of Childress County is 6,781.
What is the Total Male Population of Childress County?
Total Male Population of Childress County is 4,393.
What is the Total Female Population of Childress County?
Total Female Population of Childress County is 2,388.
What is the Ratio of Males per 100 Females in Childress County?
There are 183.96 Males per 100 Females in Childress County.
What is the Ratio of Females per 100 Males in Childress County?
There are 54.36 Females per 100 Males in Childress County.
What is the Median Population Age in Childress County?
Median Population Age in Childress County is 32.6 Years.
What is the Average Family Size in Childress County
Average Family Size in Childress County is 3.0 People.
What is the Average Household Size in Childress County
Average Household Size in Childress County is 2.8 People.
How Large is the Labor Force in Childress County?
There are 3,121 People in the Labor Forcein in Childress County.
What is the Percentage of People in the Labor Force in Childress County?
55.2% of People are in the Labor Force in Childress County.
What is the Unemployment Rate in Childress County?
Unemployment Rate in Childress County is 8.6%.