Cherokee County, TX Map & Demographics
Cherokee County Map
Cherokee County Overview
$26,790
PER CAPITA INCOME
$63,731
AVG FAMILY INCOME
$56,971
AVG HOUSEHOLD INCOME
41.0%
WAGE / INCOME GAP [ % ]
59.0¢/ $1
WAGE / INCOME GAP [ $ ]
$9,723
FAMILY INCOME DEFICIT
0.44
INEQUALITY / GINI INDEX
50,824
TOTAL POPULATION
25,996
MALE POPULATION
24,828
FEMALE POPULATION
104.70
MALES / 100 FEMALES
95.51
FEMALES / 100 MALES
38.2
MEDIAN AGE
3.0
AVG FAMILY SIZE
2.6
AVG HOUSEHOLD SIZE
21,297
LABOR FORCE [ PEOPLE ]
54.0%
PERCENT IN LABOR FORCE
5.8%
UNEMPLOYMENT RATE
Income in Cherokee County
Income Overview in Cherokee County
Per Capita Income in Cherokee County is $26,790, while median incomes of families and households are $63,731 and $56,971 respectively.
| Characteristic | Number | Measure |
| Per Capita Income | 50,824 | $26,790 |
| Median Family Income | 13,597 | $63,731 |
| Mean Family Income | 13,597 | $83,114 |
| Median Household Income | 18,069 | $56,971 |
| Mean Household Income | 18,069 | $75,104 |
| Income Deficit | 13,597 | $9,723 |
| Wage / Income Gap (%) | 50,824 | 41.00% |
| Wage / Income Gap ($) | 50,824 | 59.00¢ per $1 |
| Gini / Inequality Index | 50,824 | 0.44 |
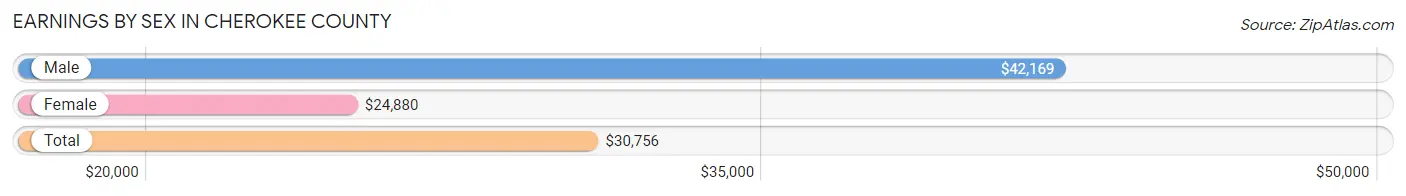
Earnings by Sex in Cherokee County
Average Earnings in Cherokee County are $30,756, $42,169 for men and $24,880 for women, a difference of 41.0%.
| Sex | Number | Average Earnings |
| Male | 12,228 (53.3%) | $42,169 |
| Female | 10,719 (46.7%) | $24,880 |
| Total | 22,947 (100.0%) | $30,756 |
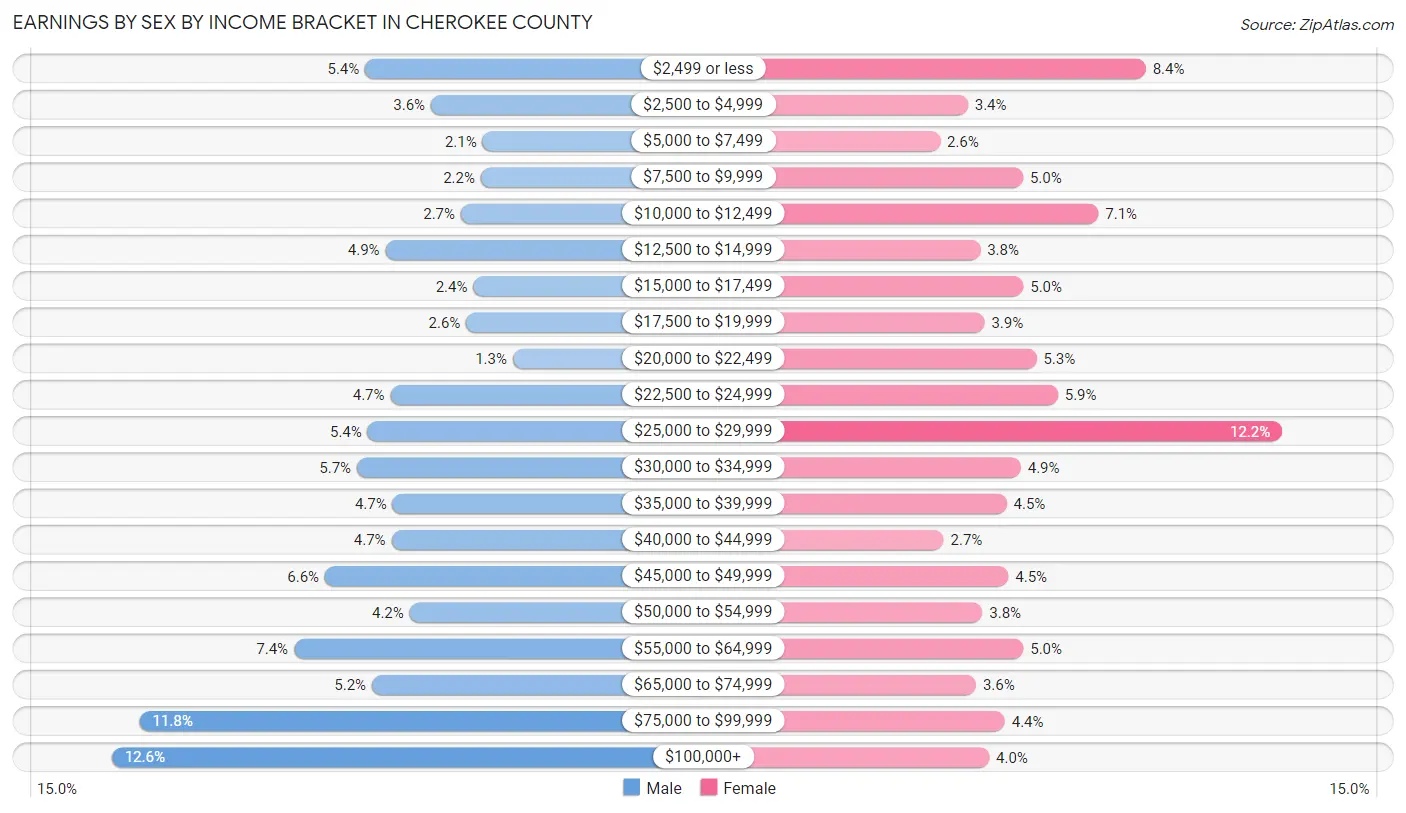
Earnings by Sex by Income Bracket in Cherokee County
The most common earnings brackets in Cherokee County are $100,000+ for men (1,535 | 12.6%) and $25,000 to $29,999 for women (1,311 | 12.2%).
| Income | Male | Female |
| $2,499 or less | 664 (5.4%) | 900 (8.4%) |
| $2,500 to $4,999 | 438 (3.6%) | 364 (3.4%) |
| $5,000 to $7,499 | 261 (2.1%) | 281 (2.6%) |
| $7,500 to $9,999 | 267 (2.2%) | 531 (5.0%) |
| $10,000 to $12,499 | 335 (2.7%) | 758 (7.1%) |
| $12,500 to $14,999 | 594 (4.9%) | 402 (3.7%) |
| $15,000 to $17,499 | 292 (2.4%) | 532 (5.0%) |
| $17,500 to $19,999 | 317 (2.6%) | 415 (3.9%) |
| $20,000 to $22,499 | 156 (1.3%) | 571 (5.3%) |
| $22,500 to $24,999 | 577 (4.7%) | 636 (5.9%) |
| $25,000 to $29,999 | 656 (5.4%) | 1,311 (12.2%) |
| $30,000 to $34,999 | 692 (5.7%) | 524 (4.9%) |
| $35,000 to $39,999 | 570 (4.7%) | 481 (4.5%) |
| $40,000 to $44,999 | 573 (4.7%) | 292 (2.7%) |
| $45,000 to $49,999 | 802 (6.6%) | 487 (4.5%) |
| $50,000 to $54,999 | 511 (4.2%) | 408 (3.8%) |
| $55,000 to $64,999 | 908 (7.4%) | 532 (5.0%) |
| $65,000 to $74,999 | 641 (5.2%) | 389 (3.6%) |
| $75,000 to $99,999 | 1,439 (11.8%) | 476 (4.4%) |
| $100,000+ | 1,535 (12.6%) | 429 (4.0%) |
| Total | 12,228 (100.0%) | 10,719 (100.0%) |
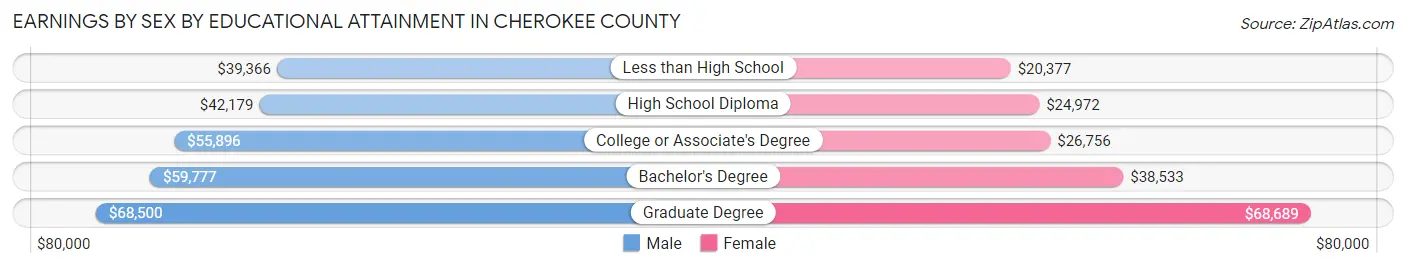
Earnings by Sex by Educational Attainment in Cherokee County
Average earnings in Cherokee County are $48,347 for men and $28,038 for women, a difference of 42.0%. Men with an educational attainment of graduate degree enjoy the highest average annual earnings of $68,500, while those with less than high school education earn the least with $39,366. Women with an educational attainment of graduate degree earn the most with the average annual earnings of $68,689, while those with less than high school education have the smallest earnings of $20,377.
| Educational Attainment | Male Income | Female Income |
| Less than High School | $39,366 | $20,377 |
| High School Diploma | $42,179 | $24,972 |
| College or Associate's Degree | $55,896 | $26,756 |
| Bachelor's Degree | $59,777 | $38,533 |
| Graduate Degree | $68,500 | $68,689 |
| Total | $48,347 | $28,038 |
Family Income in Cherokee County
Family Income Brackets in Cherokee County
According to the Cherokee County family income data, there are 2,801 families falling into the $50,000 to $74,999 income range, which is the most common income bracket and makes up 20.6% of all families. Conversely, the $10,000 to $14,999 income bracket is the least frequent group with only 367 families (2.7%) belonging to this category.
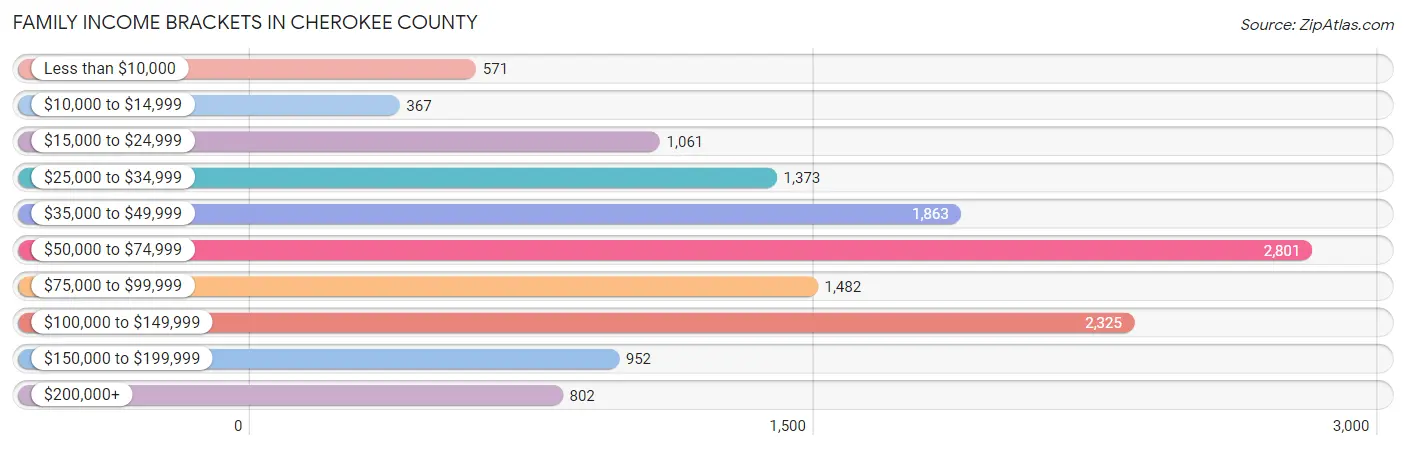
| Income Bracket | # Families | % Families |
| Less than $10,000 | 571 | 4.2% |
| $10,000 to $14,999 | 367 | 2.7% |
| $15,000 to $24,999 | 1,061 | 7.8% |
| $25,000 to $34,999 | 1,373 | 10.1% |
| $35,000 to $49,999 | 1,863 | 13.7% |
| $50,000 to $74,999 | 2,801 | 20.6% |
| $75,000 to $99,999 | 1,482 | 10.9% |
| $100,000 to $149,999 | 2,325 | 17.1% |
| $150,000 to $199,999 | 952 | 7.0% |
| $200,000+ | 802 | 5.9% |
Family Income by Famaliy Size in Cherokee County
6-person families (591 | 4.3%) account for the highest median family income in Cherokee County with $115,353 per family, while 2-person families (6,459 | 47.5%) have the highest median income of $28,014 per family member.
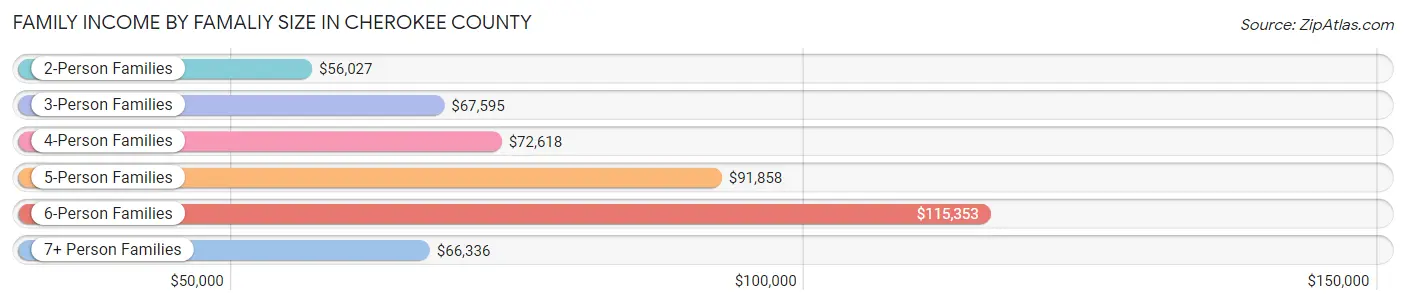
| Income Bracket | # Families | Median Income |
| 2-Person Families | 6,459 (47.5%) | $56,027 |
| 3-Person Families | 2,964 (21.8%) | $67,595 |
| 4-Person Families | 2,156 (15.9%) | $72,618 |
| 5-Person Families | 1,125 (8.3%) | $91,858 |
| 6-Person Families | 591 (4.3%) | $115,353 |
| 7+ Person Families | 302 (2.2%) | $66,336 |
| Total | 13,597 (100.0%) | $63,731 |
Family Income by Number of Earners in Cherokee County
The median family income in Cherokee County is $63,731, with families comprising 3+ earners (1,539) having the highest median family income of $133,488, while families with no earners (2,295) have the lowest median family income of $39,162, accounting for 11.3% and 16.9% of families, respectively.
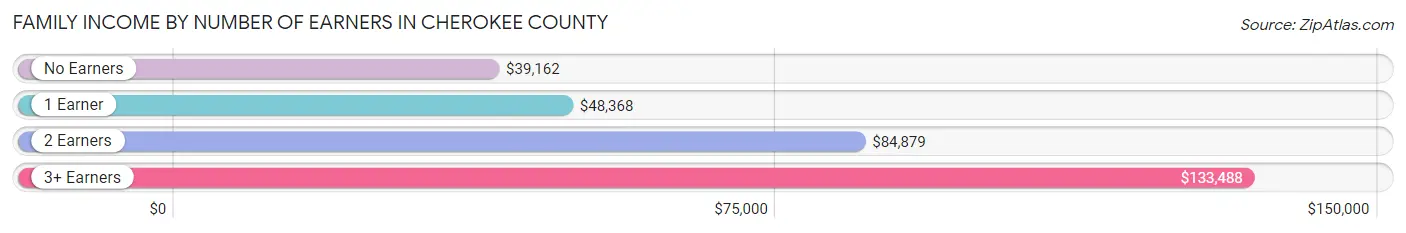
| Number of Earners | # Families | Median Income |
| No Earners | 2,295 (16.9%) | $39,162 |
| 1 Earner | 5,241 (38.6%) | $48,368 |
| 2 Earners | 4,522 (33.3%) | $84,879 |
| 3+ Earners | 1,539 (11.3%) | $133,488 |
| Total | 13,597 (100.0%) | $63,731 |
Household Income in Cherokee County
Household Income Brackets in Cherokee County
With 3,216 households falling in the category, the $50,000 to $74,999 income range is the most frequent in Cherokee County, accounting for 17.8% of all households. In contrast, only 687 households (3.8%) fall into the $10,000 to $14,999 income bracket, making it the least populous group.
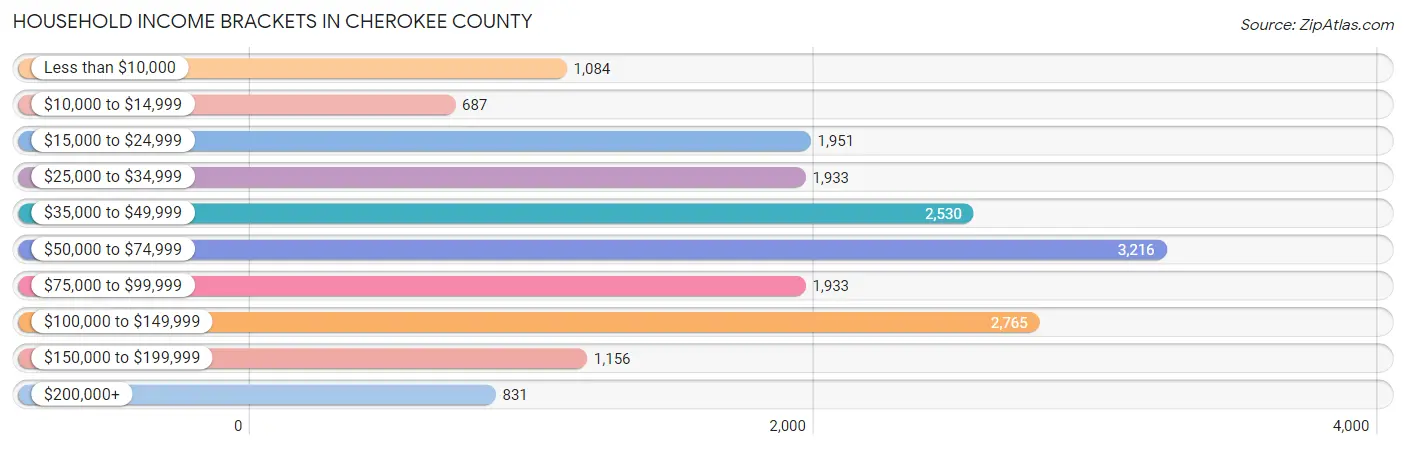
| Income Bracket | # Households | % Households |
| Less than $10,000 | 1,084 | 6.0% |
| $10,000 to $14,999 | 687 | 3.8% |
| $15,000 to $24,999 | 1,951 | 10.8% |
| $25,000 to $34,999 | 1,933 | 10.7% |
| $35,000 to $49,999 | 2,530 | 14.0% |
| $50,000 to $74,999 | 3,216 | 17.8% |
| $75,000 to $99,999 | 1,933 | 10.7% |
| $100,000 to $149,999 | 2,765 | 15.3% |
| $150,000 to $199,999 | 1,156 | 6.4% |
| $200,000+ | 831 | 4.6% |
Household Income by Householder Age in Cherokee County
The median household income in Cherokee County is $56,971, with the highest median household income of $77,538 found in the 45 to 64 years age bracket for the primary householder. A total of 6,885 households (38.1%) fall into this category. Meanwhile, the 15 to 24 years age bracket for the primary householder has the lowest median household income of $36,034, with 504 households (2.8%) in this group.
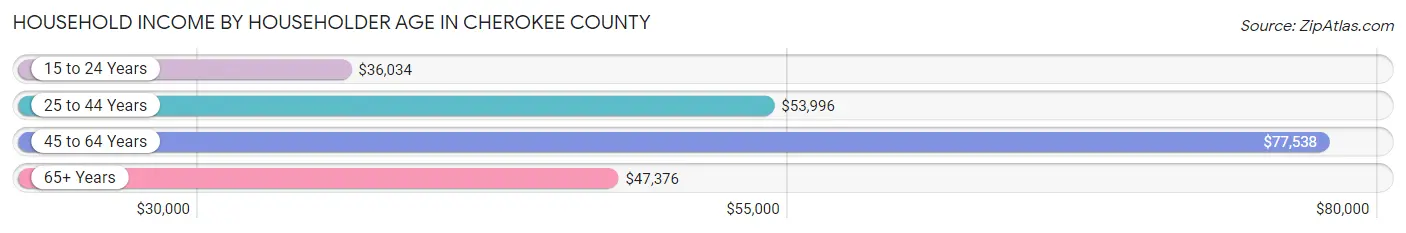
| Income Bracket | # Households | Median Income |
| 15 to 24 Years | 504 (2.8%) | $36,034 |
| 25 to 44 Years | 5,329 (29.5%) | $53,996 |
| 45 to 64 Years | 6,885 (38.1%) | $77,538 |
| 65+ Years | 5,351 (29.6%) | $47,376 |
| Total | 18,069 (100.0%) | $56,971 |
Poverty in Cherokee County
Income Below Poverty by Sex and Age in Cherokee County
With 15.8% poverty level for males and 17.3% for females among the residents of Cherokee County, under 5 year old males and 5 year old females are the most vulnerable to poverty, with 534 males (31.0%) and 72 females (61.0%) in their respective age groups living below the poverty level.
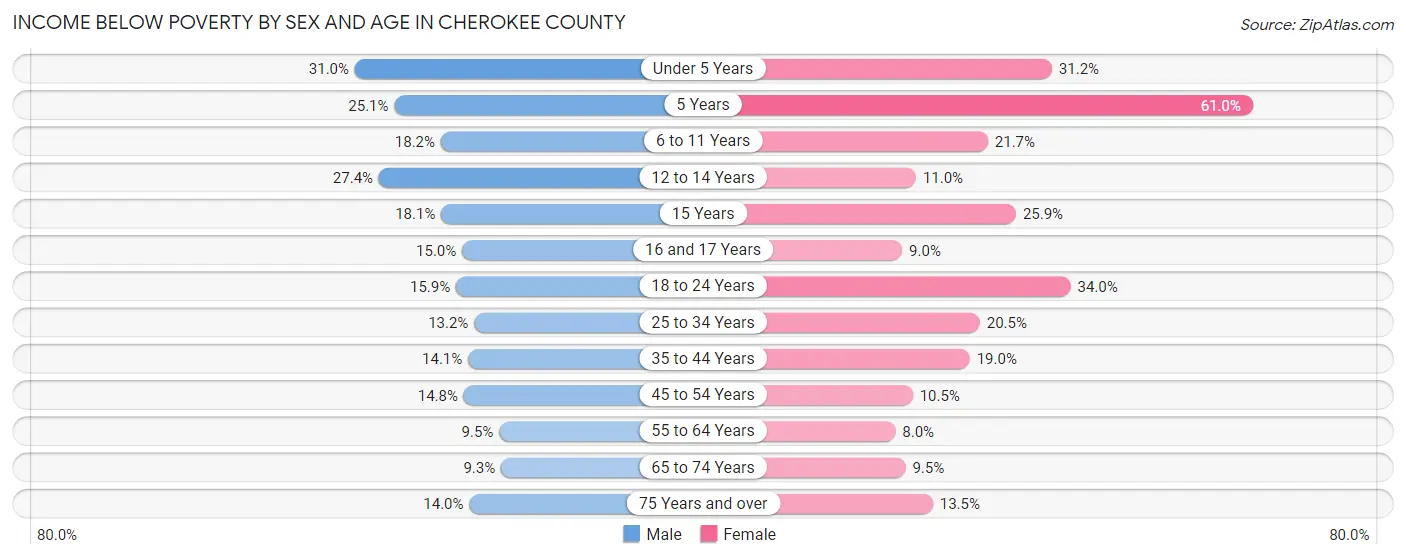
| Age Bracket | Male | Female |
| Under 5 Years | 534 (31.0%) | 537 (31.2%) |
| 5 Years | 73 (25.1%) | 72 (61.0%) |
| 6 to 11 Years | 438 (18.2%) | 473 (21.7%) |
| 12 to 14 Years | 281 (27.4%) | 122 (11.0%) |
| 15 Years | 70 (18.1%) | 90 (25.9%) |
| 16 and 17 Years | 104 (15.0%) | 72 (9.0%) |
| 18 to 24 Years | 337 (15.9%) | 674 (34.0%) |
| 25 to 34 Years | 345 (13.2%) | 577 (20.5%) |
| 35 to 44 Years | 347 (14.1%) | 559 (19.0%) |
| 45 to 54 Years | 444 (14.8%) | 284 (10.5%) |
| 55 to 64 Years | 244 (9.5%) | 235 (8.0%) |
| 65 to 74 Years | 207 (9.2%) | 260 (9.5%) |
| 75 Years and over | 225 (14.0%) | 243 (13.5%) |
| Total | 3,649 (15.8%) | 4,198 (17.3%) |
Income Above Poverty by Sex and Age in Cherokee County
According to the poverty statistics in Cherokee County, males aged 65 to 74 years and females aged 55 to 64 years are the age groups that are most secure financially, with 90.7% of males and 92.0% of females in these age groups living above the poverty line.
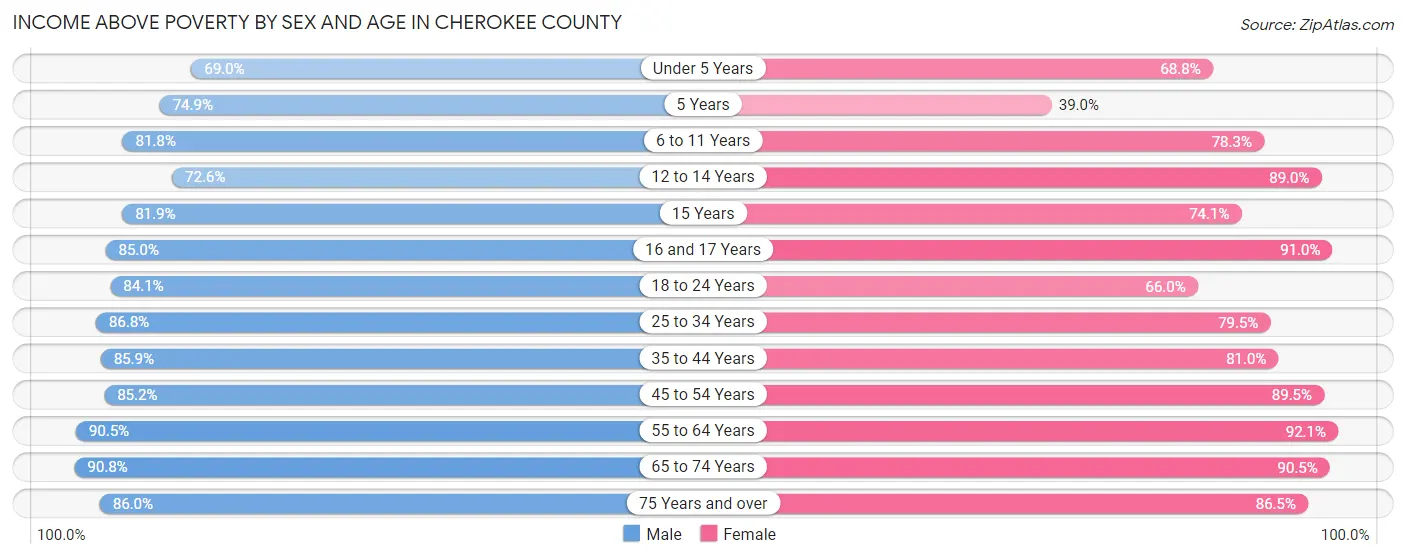
| Age Bracket | Male | Female |
| Under 5 Years | 1,191 (69.0%) | 1,184 (68.8%) |
| 5 Years | 218 (74.9%) | 46 (39.0%) |
| 6 to 11 Years | 1,970 (81.8%) | 1,708 (78.3%) |
| 12 to 14 Years | 745 (72.6%) | 986 (89.0%) |
| 15 Years | 316 (81.9%) | 258 (74.1%) |
| 16 and 17 Years | 588 (85.0%) | 732 (91.0%) |
| 18 to 24 Years | 1,778 (84.1%) | 1,310 (66.0%) |
| 25 to 34 Years | 2,261 (86.8%) | 2,239 (79.5%) |
| 35 to 44 Years | 2,107 (85.9%) | 2,383 (81.0%) |
| 45 to 54 Years | 2,561 (85.2%) | 2,412 (89.5%) |
| 55 to 64 Years | 2,315 (90.5%) | 2,721 (92.0%) |
| 65 to 74 Years | 2,031 (90.7%) | 2,487 (90.5%) |
| 75 Years and over | 1,387 (86.0%) | 1,556 (86.5%) |
| Total | 19,468 (84.2%) | 20,022 (82.7%) |
Income Below Poverty Among Married-Couple Families in Cherokee County
The poverty statistics for married-couple families in Cherokee County show that 7.1% or 671 of the total 9,455 families live below the poverty line. Families with 3 or 4 children have the highest poverty rate of 20.6%, comprising of 219 families. On the other hand, families with 1 or 2 children have the lowest poverty rate of 4.4%, which includes 123 families.
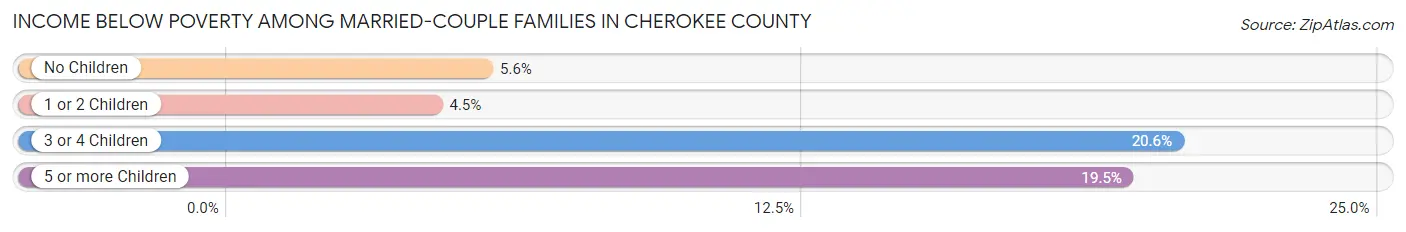
| Children | Above Poverty | Below Poverty |
| No Children | 5,203 (94.5%) | 306 (5.6%) |
| 1 or 2 Children | 2,641 (95.6%) | 123 (4.4%) |
| 3 or 4 Children | 845 (79.4%) | 219 (20.6%) |
| 5 or more Children | 95 (80.5%) | 23 (19.5%) |
| Total | 8,784 (92.9%) | 671 (7.1%) |
Income Below Poverty Among Single-Parent Households in Cherokee County
According to the poverty data in Cherokee County, 13.0% or 147 single-father households and 35.6% or 1,070 single-mother households are living below the poverty line. Among single-father households, those with 3 or 4 children have the highest poverty rate, with 37 households (29.4%) experiencing poverty. Likewise, among single-mother households, those with 3 or 4 children have the highest poverty rate, with 229 households (66.6%) falling below the poverty line.
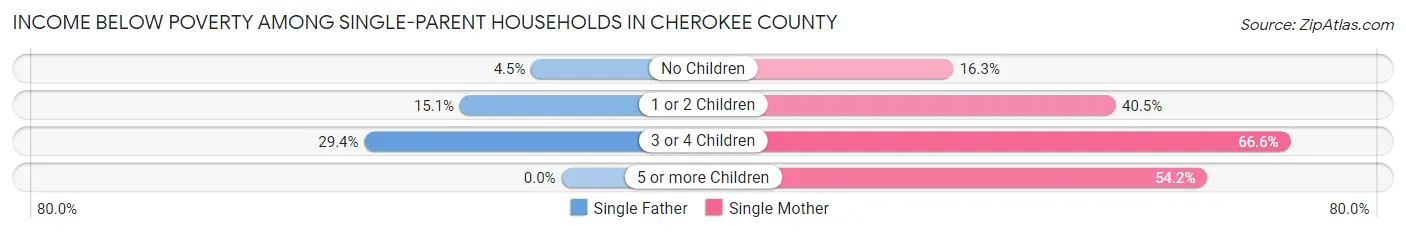
| Children | Single Father | Single Mother |
| No Children | 18 (4.5%) | 161 (16.3%) |
| 1 or 2 Children | 92 (15.1%) | 667 (40.5%) |
| 3 or 4 Children | 37 (29.4%) | 229 (66.6%) |
| 5 or more Children | 0 (0.0%) | 13 (54.2%) |
| Total | 147 (13.0%) | 1,070 (35.6%) |
Income Below Poverty Among Married-Couple vs Single-Parent Households in Cherokee County
The poverty data for Cherokee County shows that 671 of the married-couple family households (7.1%) and 1,217 of the single-parent households (29.4%) are living below the poverty level. Within the married-couple family households, those with 3 or 4 children have the highest poverty rate, with 219 households (20.6%) falling below the poverty line. Among the single-parent households, those with 3 or 4 children have the highest poverty rate, with 266 household (56.6%) living below poverty.
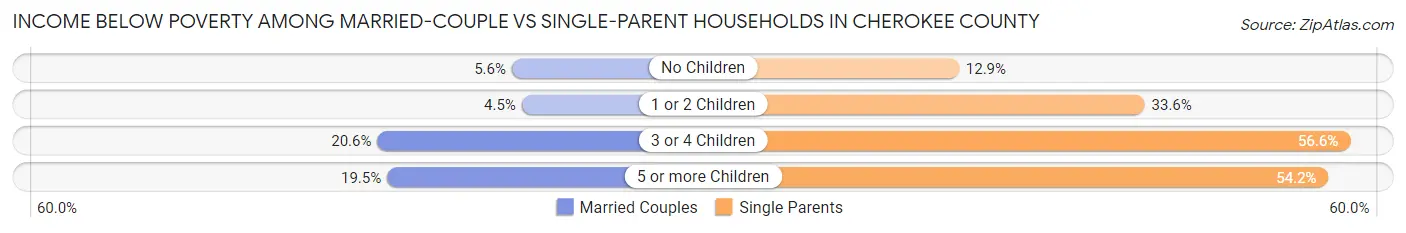
| Children | Married-Couple Families | Single-Parent Households |
| No Children | 306 (5.6%) | 179 (12.9%) |
| 1 or 2 Children | 123 (4.4%) | 759 (33.6%) |
| 3 or 4 Children | 219 (20.6%) | 266 (56.6%) |
| 5 or more Children | 23 (19.5%) | 13 (54.2%) |
| Total | 671 (7.1%) | 1,217 (29.4%) |
Race in Cherokee County
The most populous races in Cherokee County are White / Caucasian (35,699 | 70.2%), Hispanic or Latino (12,351 | 24.3%), and Black / African American (6,678 | 13.1%).
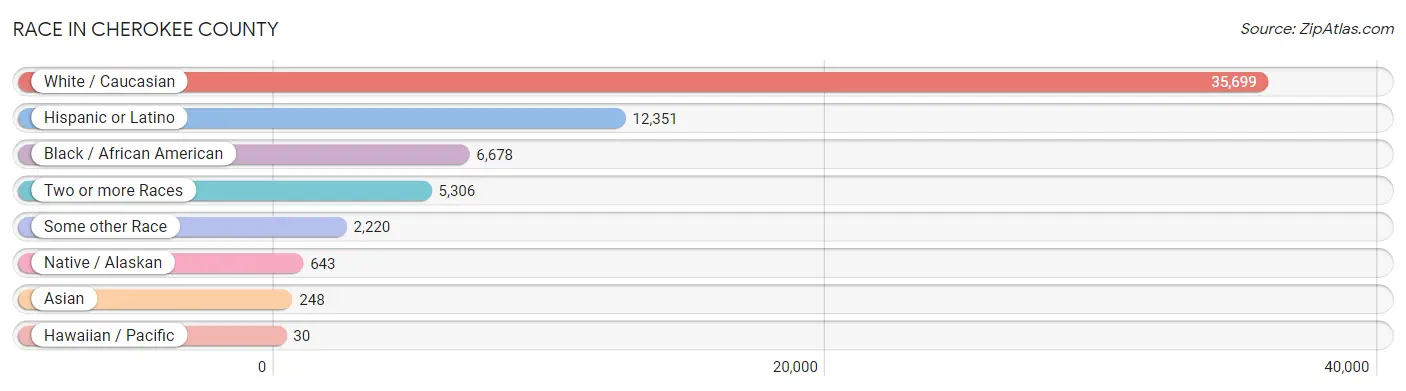
| Race | # Population | % Population |
| Asian | 248 | 0.5% |
| Black / African American | 6,678 | 13.1% |
| Hawaiian / Pacific | 30 | 0.1% |
| Hispanic or Latino | 12,351 | 24.3% |
| Native / Alaskan | 643 | 1.3% |
| White / Caucasian | 35,699 | 70.2% |
| Two or more Races | 5,306 | 10.4% |
| Some other Race | 2,220 | 4.4% |
| Total | 50,824 | 100.0% |
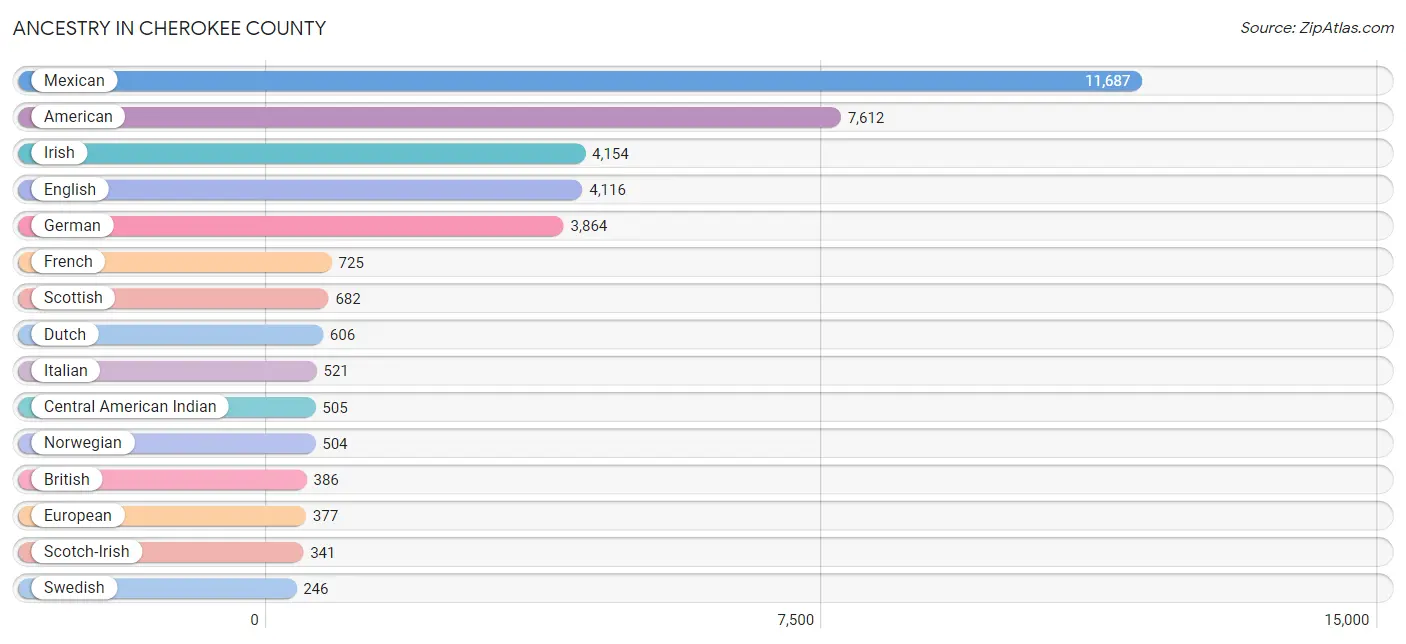
Ancestry in Cherokee County
The most populous ancestries reported in Cherokee County are Mexican (11,687 | 23.0%), American (7,612 | 15.0%), Irish (4,154 | 8.2%), English (4,116 | 8.1%), and German (3,864 | 7.6%), together accounting for 61.8% of all Cherokee County residents.
| Ancestry | # Population | % Population |
| African | 159 | 0.3% |
| American | 7,612 | 15.0% |
| Arab | 26 | 0.1% |
| Australian | 38 | 0.1% |
| Bhutanese | 53 | 0.1% |
| Blackfeet | 1 | 0.0% |
| Brazilian | 17 | 0.0% |
| British | 386 | 0.8% |
| Burmese | 4 | 0.0% |
| Cajun | 119 | 0.2% |
| Canadian | 18 | 0.0% |
| Celtic | 16 | 0.0% |
| Central American | 235 | 0.5% |
| Central American Indian | 505 | 1.0% |
| Cherokee | 165 | 0.3% |
| Choctaw | 80 | 0.2% |
| Colombian | 17 | 0.0% |
| Crow | 11 | 0.0% |
| Czech | 43 | 0.1% |
| Czechoslovakian | 39 | 0.1% |
| Danish | 13 | 0.0% |
| Dominican | 3 | 0.0% |
| Dutch | 606 | 1.2% |
| Eastern European | 88 | 0.2% |
| English | 4,116 | 8.1% |
| European | 377 | 0.7% |
| Filipino | 10 | 0.0% |
| Finnish | 22 | 0.0% |
| French | 725 | 1.4% |
| French Canadian | 18 | 0.0% |
| German | 3,864 | 7.6% |
| Greek | 16 | 0.0% |
| Guamanian / Chamorro | 9 | 0.0% |
| Guatemalan | 155 | 0.3% |
| Honduran | 23 | 0.1% |
| Icelander | 173 | 0.3% |
| Indian (Asian) | 55 | 0.1% |
| Irish | 4,154 | 8.2% |
| Italian | 521 | 1.0% |
| Jamaican | 7 | 0.0% |
| Korean | 212 | 0.4% |
| Lebanese | 20 | 0.0% |
| Mexican | 11,687 | 23.0% |
| Mexican American Indian | 95 | 0.2% |
| Native Hawaiian | 7 | 0.0% |
| Nicaraguan | 40 | 0.1% |
| Nigerian | 8 | 0.0% |
| Northern European | 43 | 0.1% |
| Norwegian | 504 | 1.0% |
| Pakistani | 4 | 0.0% |
| Polish | 131 | 0.3% |
| Portuguese | 10 | 0.0% |
| Potawatomi | 6 | 0.0% |
| Puerto Rican | 44 | 0.1% |
| Russian | 38 | 0.1% |
| Salvadoran | 17 | 0.0% |
| Samoan | 43 | 0.1% |
| Scandinavian | 8 | 0.0% |
| Scotch-Irish | 341 | 0.7% |
| Scottish | 682 | 1.3% |
| South American | 17 | 0.0% |
| Spaniard | 170 | 0.3% |
| Spanish | 82 | 0.2% |
| Spanish American | 10 | 0.0% |
| Sri Lankan | 35 | 0.1% |
| Subsaharan African | 167 | 0.3% |
| Swedish | 246 | 0.5% |
| Swiss | 76 | 0.2% |
| Thai | 2 | 0.0% |
| Welsh | 203 | 0.4% | View All 70 Rows |
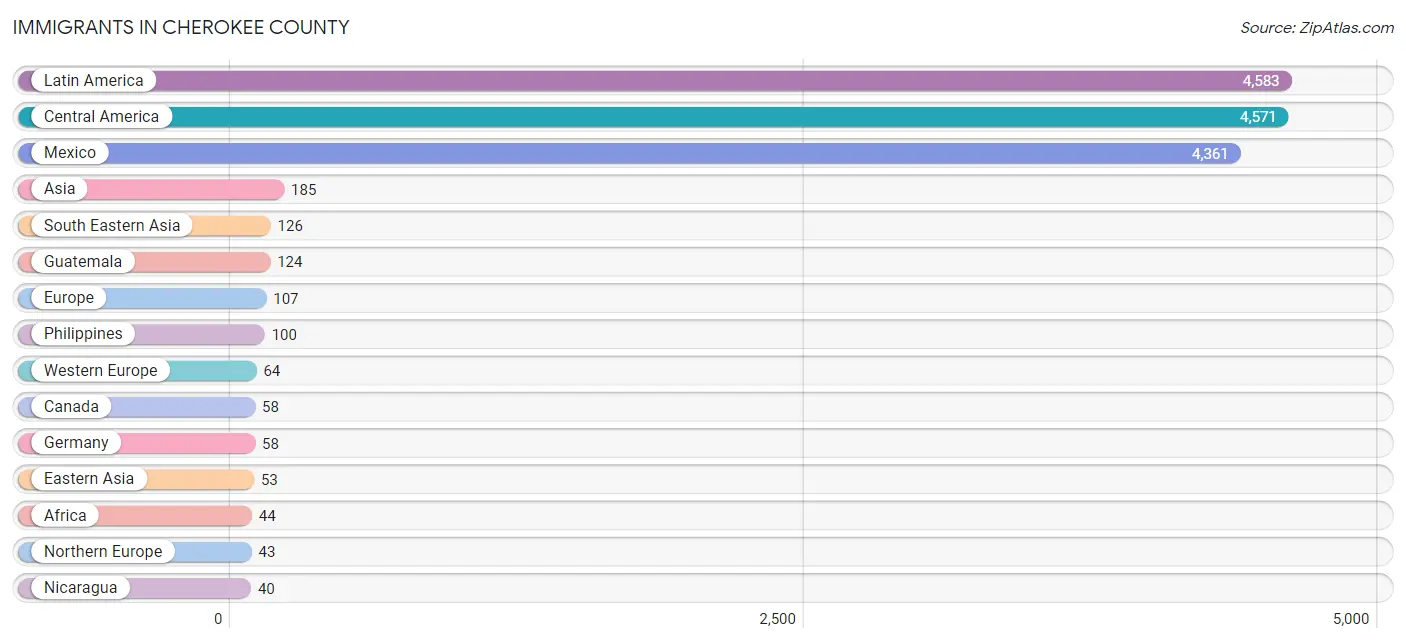
Immigrants in Cherokee County
The most numerous immigrant groups reported in Cherokee County came from Latin America (4,583 | 9.0%), Central America (4,571 | 9.0%), Mexico (4,361 | 8.6%), Asia (185 | 0.4%), and South Eastern Asia (126 | 0.3%), together accounting for 27.2% of all Cherokee County residents.
| Immigration Origin | # Population | % Population |
| Africa | 44 | 0.1% |
| Asia | 185 | 0.4% |
| Australia | 29 | 0.1% |
| Brazil | 6 | 0.0% |
| Canada | 58 | 0.1% |
| Caribbean | 6 | 0.0% |
| Central America | 4,571 | 9.0% |
| China | 25 | 0.1% |
| Eastern Africa | 33 | 0.1% |
| Eastern Asia | 53 | 0.1% |
| El Salvador | 35 | 0.1% |
| England | 34 | 0.1% |
| Eritrea | 16 | 0.0% |
| Ethiopia | 17 | 0.0% |
| Europe | 107 | 0.2% |
| France | 6 | 0.0% |
| Germany | 58 | 0.1% |
| Guatemala | 124 | 0.2% |
| Honduras | 11 | 0.0% |
| India | 2 | 0.0% |
| Jamaica | 6 | 0.0% |
| Japan | 24 | 0.1% |
| Korea | 4 | 0.0% |
| Latin America | 4,583 | 9.0% |
| Mexico | 4,361 | 8.6% |
| Nicaragua | 40 | 0.1% |
| Nigeria | 8 | 0.0% |
| Northern Europe | 43 | 0.1% |
| Oceania | 29 | 0.1% |
| Pakistan | 4 | 0.0% |
| Philippines | 100 | 0.2% |
| South America | 6 | 0.0% |
| South Central Asia | 6 | 0.0% |
| South Eastern Asia | 126 | 0.3% |
| Thailand | 4 | 0.0% |
| Vietnam | 22 | 0.0% |
| Western Africa | 8 | 0.0% |
| Western Europe | 64 | 0.1% | View All 38 Rows |
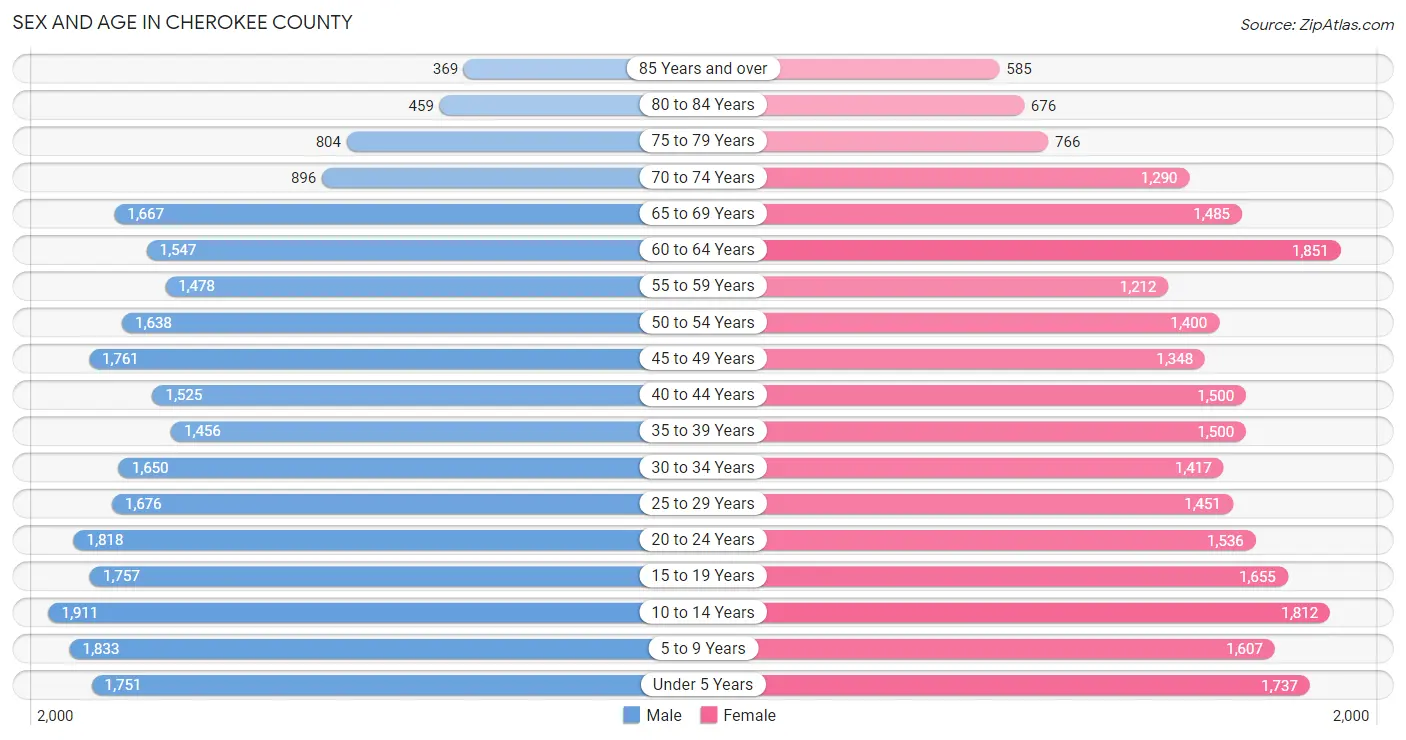
Sex and Age in Cherokee County
Sex and Age in Cherokee County
The most populous age groups in Cherokee County are 10 to 14 Years (1,911 | 7.3%) for men and 60 to 64 Years (1,851 | 7.5%) for women.
| Age Bracket | Male | Female |
| Under 5 Years | 1,751 (6.7%) | 1,737 (7.0%) |
| 5 to 9 Years | 1,833 (7.0%) | 1,607 (6.5%) |
| 10 to 14 Years | 1,911 (7.3%) | 1,812 (7.3%) |
| 15 to 19 Years | 1,757 (6.8%) | 1,655 (6.7%) |
| 20 to 24 Years | 1,818 (7.0%) | 1,536 (6.2%) |
| 25 to 29 Years | 1,676 (6.5%) | 1,451 (5.8%) |
| 30 to 34 Years | 1,650 (6.4%) | 1,417 (5.7%) |
| 35 to 39 Years | 1,456 (5.6%) | 1,500 (6.0%) |
| 40 to 44 Years | 1,525 (5.9%) | 1,500 (6.0%) |
| 45 to 49 Years | 1,761 (6.8%) | 1,348 (5.4%) |
| 50 to 54 Years | 1,638 (6.3%) | 1,400 (5.6%) |
| 55 to 59 Years | 1,478 (5.7%) | 1,212 (4.9%) |
| 60 to 64 Years | 1,547 (5.9%) | 1,851 (7.5%) |
| 65 to 69 Years | 1,667 (6.4%) | 1,485 (6.0%) |
| 70 to 74 Years | 896 (3.5%) | 1,290 (5.2%) |
| 75 to 79 Years | 804 (3.1%) | 766 (3.1%) |
| 80 to 84 Years | 459 (1.8%) | 676 (2.7%) |
| 85 Years and over | 369 (1.4%) | 585 (2.4%) |
| Total | 25,996 (100.0%) | 24,828 (100.0%) |
Families and Households in Cherokee County
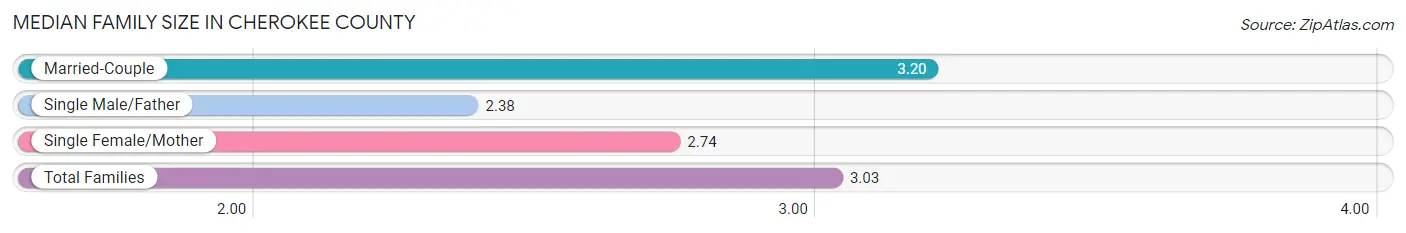
Median Family Size in Cherokee County
The median family size in Cherokee County is 3.03 persons per family, with married-couple families (9,455 | 69.5%) accounting for the largest median family size of 3.2 persons per family. On the other hand, single male/father families (1,134 | 8.3%) represent the smallest median family size with 2.38 persons per family.
| Family Type | # Families | Family Size |
| Married-Couple | 9,455 (69.5%) | 3.20 |
| Single Male/Father | 1,134 (8.3%) | 2.38 |
| Single Female/Mother | 3,008 (22.1%) | 2.74 |
| Total Families | 13,597 (100.0%) | 3.03 |
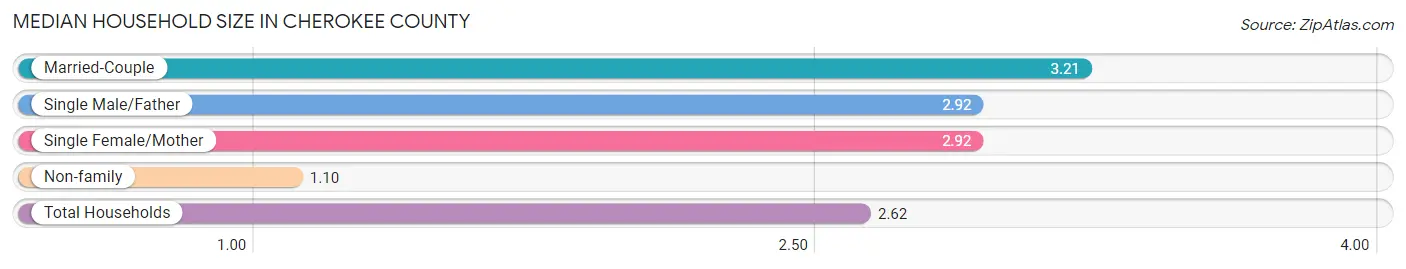
Median Household Size in Cherokee County
The median household size in Cherokee County is 2.62 persons per household, with married-couple households (9,455 | 52.3%) accounting for the largest median household size of 3.21 persons per household. non-family households (4,472 | 24.7%) represent the smallest median household size with 1.10 persons per household.
| Household Type | # Households | Household Size |
| Married-Couple | 9,455 (52.3%) | 3.21 |
| Single Male/Father | 1,134 (6.3%) | 2.92 |
| Single Female/Mother | 3,008 (16.7%) | 2.92 |
| Non-family | 4,472 (24.7%) | 1.10 |
| Total Households | 18,069 (100.0%) | 2.62 |
Household Size by Marriage Status in Cherokee County
Out of a total of 18,069 households in Cherokee County, 13,597 (75.2%) are family households, while 4,472 (24.7%) are nonfamily households. The most numerous type of family households are 2-person households, comprising 5,941, and the most common type of nonfamily households are 1-person households, comprising 4,040.
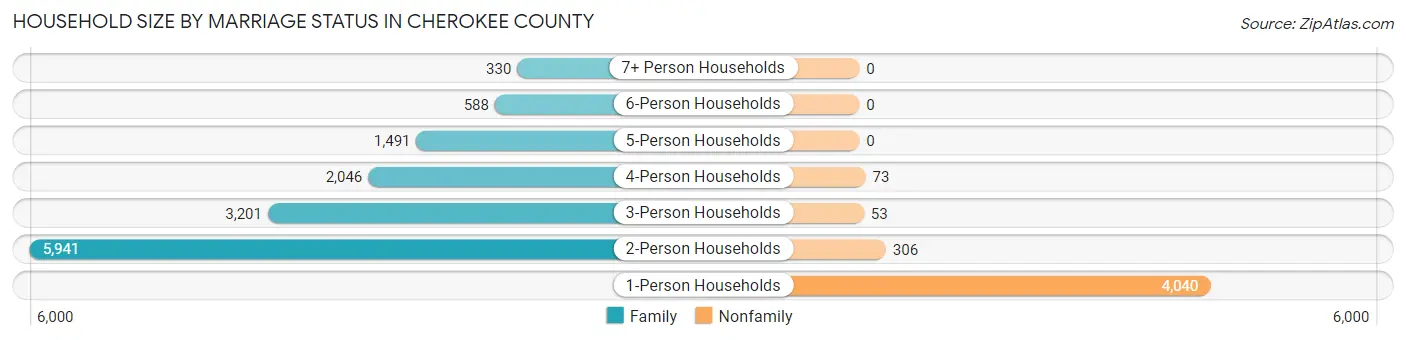
| Household Size | Family Households | Nonfamily Households |
| 1-Person Households | - | 4,040 (22.4%) |
| 2-Person Households | 5,941 (32.9%) | 306 (1.7%) |
| 3-Person Households | 3,201 (17.7%) | 53 (0.3%) |
| 4-Person Households | 2,046 (11.3%) | 73 (0.4%) |
| 5-Person Households | 1,491 (8.3%) | 0 (0.0%) |
| 6-Person Households | 588 (3.3%) | 0 (0.0%) |
| 7+ Person Households | 330 (1.8%) | 0 (0.0%) |
| Total | 13,597 (75.2%) | 4,472 (24.7%) |
Female Fertility in Cherokee County
Fertility by Age in Cherokee County
Average fertility rate in Cherokee County is 113.0 births per 1,000 women. Women in the age bracket of 20 to 34 years have the highest fertility rate with 199.0 births per 1,000 women. Women in the age bracket of 20 to 34 years acount for 71.8% of all women with births.
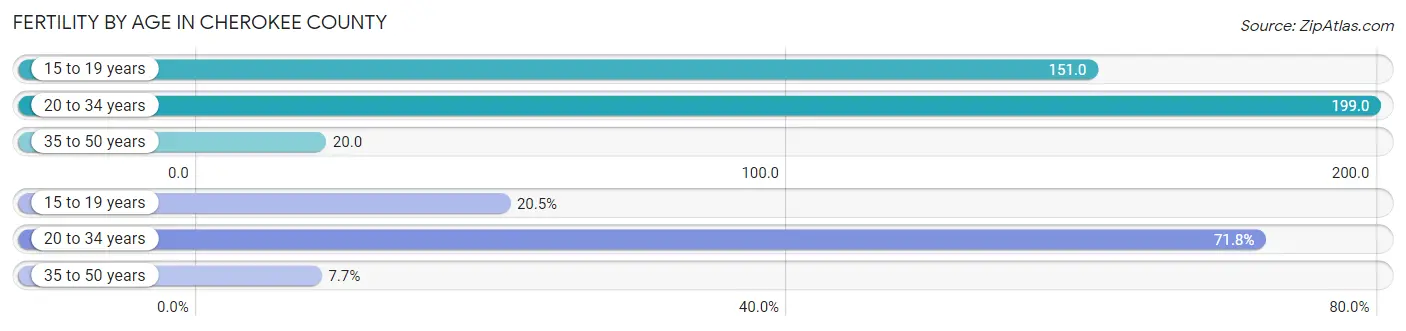
| Age Bracket | Women with Births | Births / 1,000 Women |
| 15 to 19 years | 250 (20.5%) | 151.0 |
| 20 to 34 years | 876 (71.8%) | 199.0 |
| 35 to 50 years | 94 (7.7%) | 20.0 |
| Total | 1,220 (100.0%) | 113.0 |
Fertility by Age by Marriage Status in Cherokee County
53.8% of women with births (1,220) in Cherokee County are married. The highest percentage of unmarried women with births falls into 15 to 19 years age bracket with 100.0% of them unmarried at the time of birth, while the lowest percentage of unmarried women with births belong to 20 to 34 years age bracket with 30.9% of them unmarried.
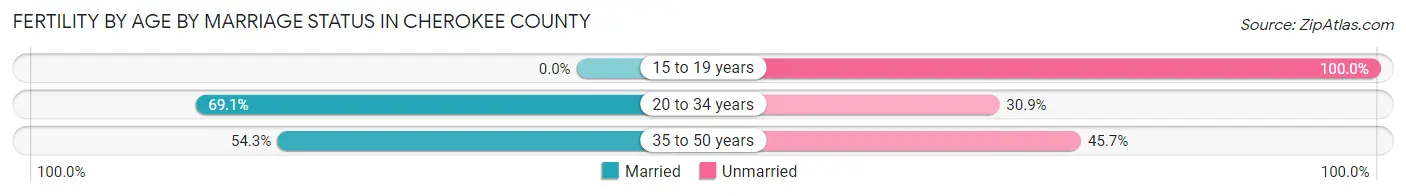
| Age Bracket | Married | Unmarried |
| 15 to 19 years | 0 (0.0%) | 250 (100.0%) |
| 20 to 34 years | 605 (69.1%) | 271 (30.9%) |
| 35 to 50 years | 51 (54.3%) | 43 (45.7%) |
| Total | 656 (53.8%) | 564 (46.2%) |
Fertility by Education in Cherokee County
Average fertility rate in Cherokee County is 113.0 births per 1,000 women. Women with the education attainment of graduate degree have the highest fertility rate of 176.0 births per 1,000 women, while women with the education attainment of high school diploma have the lowest fertility at 96.0 births per 1,000 women. Women with the education attainment of college or associate's degree represent 31.7% of all women with births.
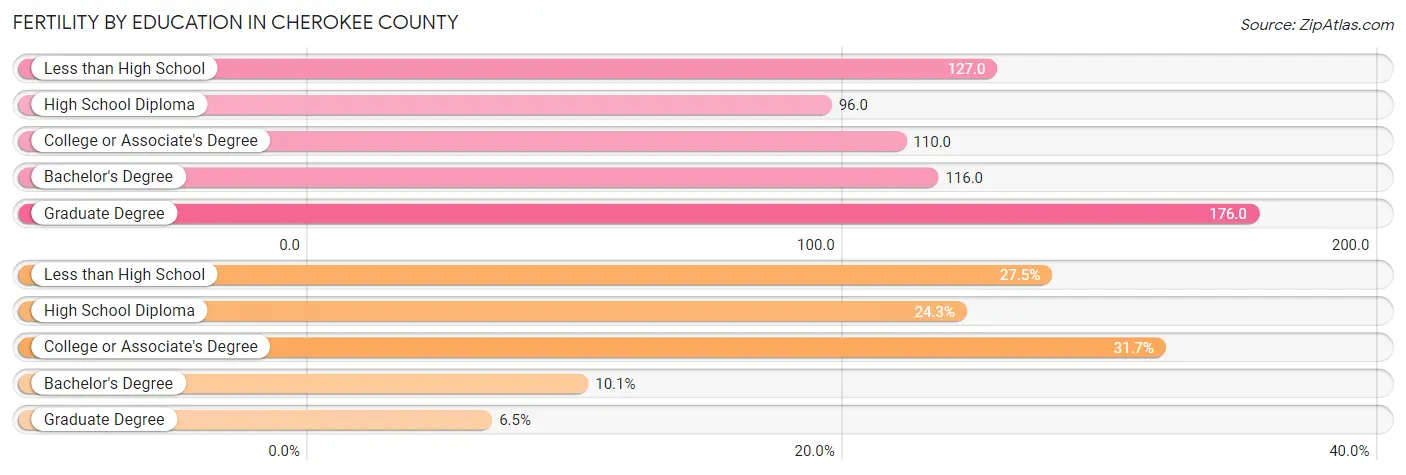
| Educational Attainment | Women with Births | Births / 1,000 Women |
| Less than High School | 335 (27.5%) | 127.0 |
| High School Diploma | 296 (24.3%) | 96.0 |
| College or Associate's Degree | 387 (31.7%) | 110.0 |
| Bachelor's Degree | 123 (10.1%) | 116.0 |
| Graduate Degree | 79 (6.5%) | 176.0 |
| Total | 1,220 (100.0%) | 113.0 |
Fertility by Education by Marriage Status in Cherokee County
46.2% of women with births in Cherokee County are unmarried. Women with the educational attainment of graduate degree are most likely to be married with 100.0% of them married at childbirth, while women with the educational attainment of high school diploma are least likely to be married with 70.6% of them unmarried at childbirth.
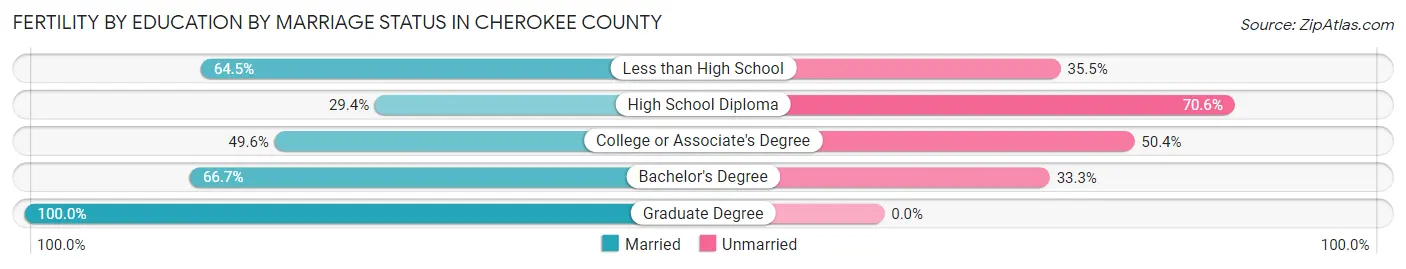
| Educational Attainment | Married | Unmarried |
| Less than High School | 216 (64.5%) | 119 (35.5%) |
| High School Diploma | 87 (29.4%) | 209 (70.6%) |
| College or Associate's Degree | 192 (49.6%) | 195 (50.4%) |
| Bachelor's Degree | 82 (66.7%) | 41 (33.3%) |
| Graduate Degree | 79 (100.0%) | 0 (0.0%) |
| Total | 656 (53.8%) | 564 (46.2%) |
Employment Characteristics in Cherokee County
Employment by Class of Employer in Cherokee County
Among the 19,699 employed individuals in Cherokee County, private company employees (12,028 | 61.1%), self-employed (not incorporated) (2,020 | 10.2%), and local government employees (1,963 | 10.0%) make up the most common classes of employment.
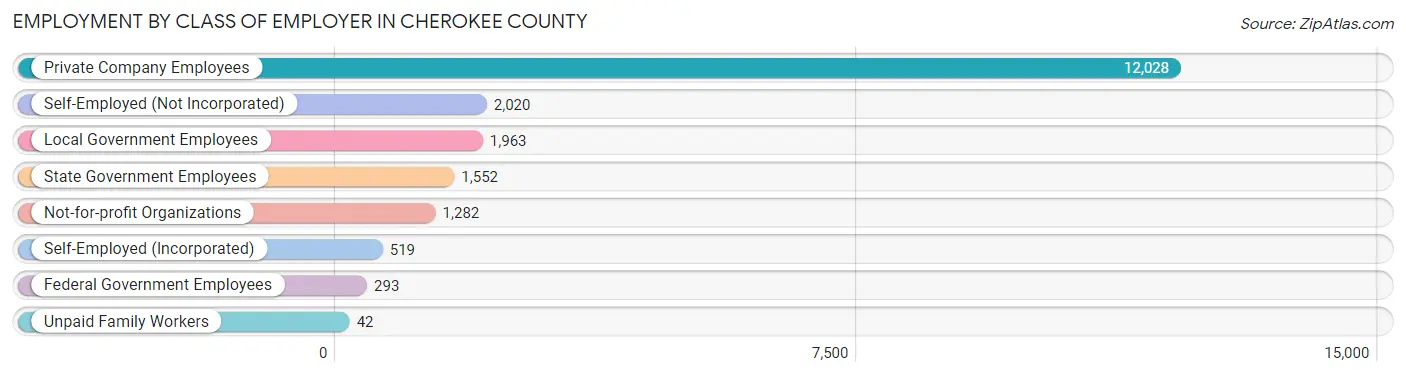
| Employer Class | # Employees | % Employees |
| Private Company Employees | 12,028 | 61.1% |
| Self-Employed (Incorporated) | 519 | 2.6% |
| Self-Employed (Not Incorporated) | 2,020 | 10.2% |
| Not-for-profit Organizations | 1,282 | 6.5% |
| Local Government Employees | 1,963 | 10.0% |
| State Government Employees | 1,552 | 7.9% |
| Federal Government Employees | 293 | 1.5% |
| Unpaid Family Workers | 42 | 0.2% |
| Total | 19,699 | 100.0% |
Employment Status by Age in Cherokee County
According to the labor force statistics for Cherokee County, out of the total population over 16 years of age (39,439), 54.0% or 21,297 individuals are in the labor force, with 5.8% or 1,235 of them unemployed. The age group with the highest labor force participation rate is 20 to 24 years, with 75.1% or 2,519 individuals in the labor force. Within the labor force, the 16 to 19 years age range has the highest percentage of unemployed individuals, with 15.0% or 142 of them being unemployed.
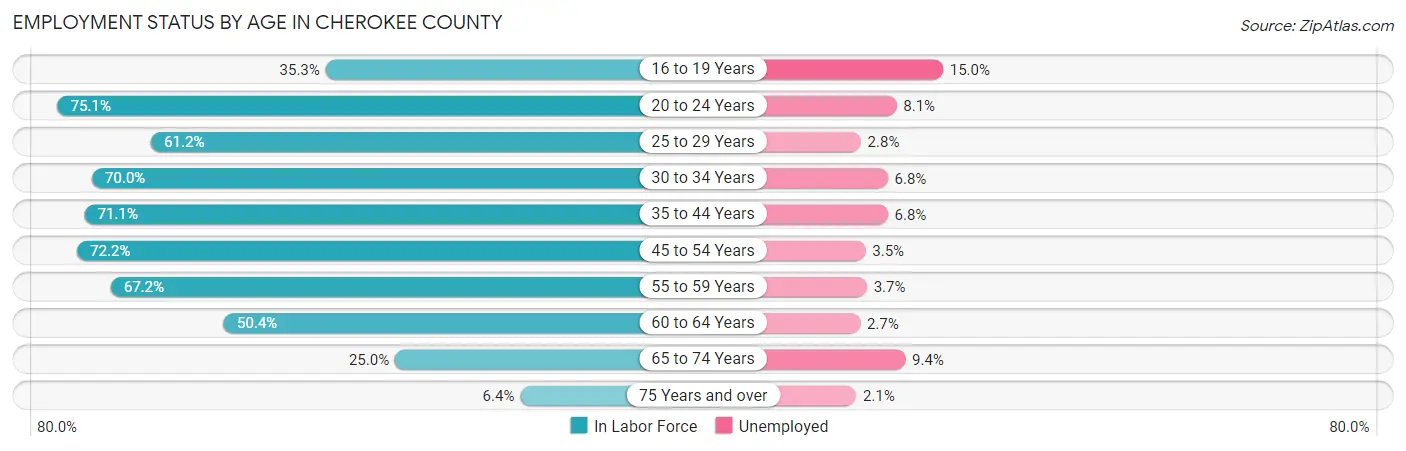
| Age Bracket | In Labor Force | Unemployed |
| 16 to 19 Years | 945 (35.3%) | 142 (15.0%) |
| 20 to 24 Years | 2,519 (75.1%) | 204 (8.1%) |
| 25 to 29 Years | 1,914 (61.2%) | 54 (2.8%) |
| 30 to 34 Years | 2,147 (70.0%) | 146 (6.8%) |
| 35 to 44 Years | 4,252 (71.1%) | 289 (6.8%) |
| 45 to 54 Years | 4,438 (72.2%) | 155 (3.5%) |
| 55 to 59 Years | 1,808 (67.2%) | 67 (3.7%) |
| 60 to 64 Years | 1,713 (50.4%) | 46 (2.7%) |
| 65 to 74 Years | 1,334 (25.0%) | 125 (9.4%) |
| 75 Years and over | 234 (6.4%) | 5 (2.1%) |
| Total | 21,297 (54.0%) | 1,235 (5.8%) |
Employment Status by Educational Attainment in Cherokee County
According to labor force statistics for Cherokee County, 66.7% of individuals (16,281) out of the total population between 25 and 64 years of age (24,410) are in the labor force, with 4.6% or 749 of them being unemployed. The group with the highest labor force participation rate are those with the educational attainment of bachelor's degree or higher, with 87.0% or 3,088 individuals in the labor force. Within the labor force, individuals with less than high school education have the highest percentage of unemployment, with 10.1% or 291 of them being unemployed.
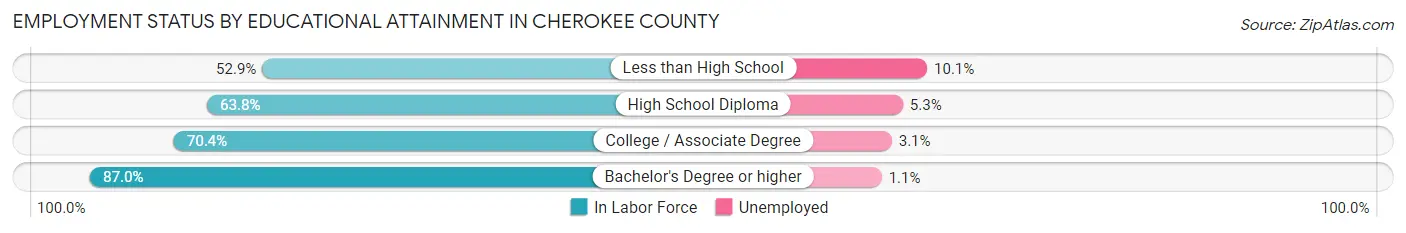
| Educational Attainment | In Labor Force | Unemployed |
| Less than High School | 2,878 (52.9%) | 550 (10.1%) |
| High School Diploma | 5,241 (63.8%) | 435 (5.3%) |
| College / Associate Degree | 5,072 (70.4%) | 223 (3.1%) |
| Bachelor's Degree or higher | 3,088 (87.0%) | 39 (1.1%) |
| Total | 16,281 (66.7%) | 1,123 (4.6%) |
Employment Occupations by Sex in Cherokee County
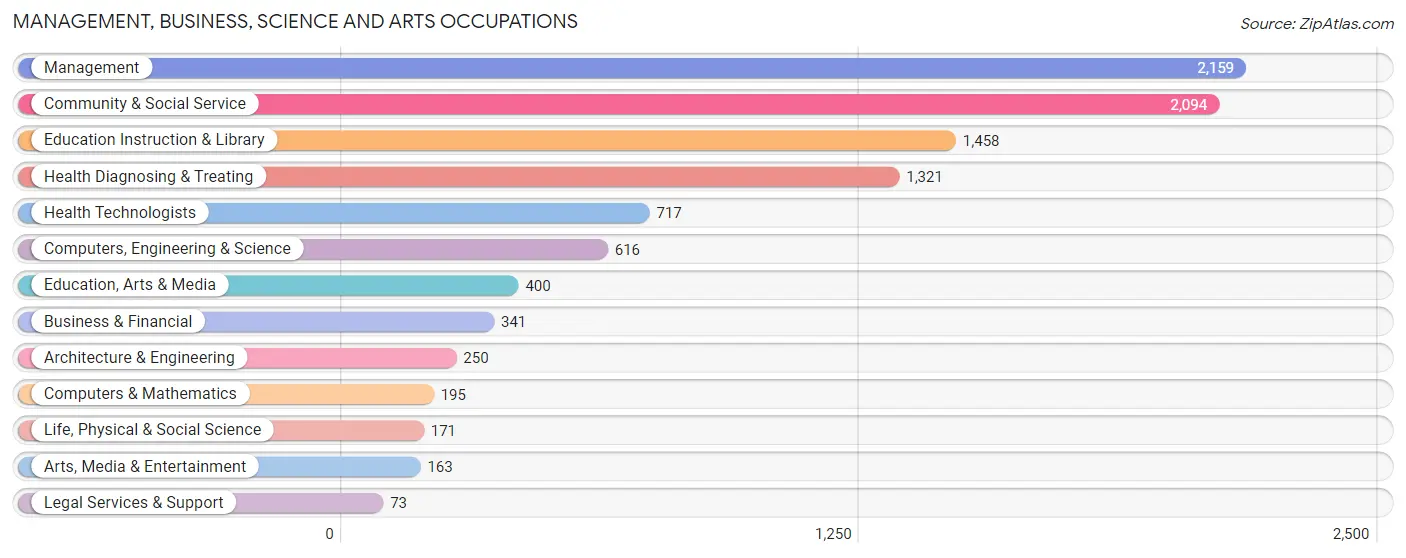
Management, Business, Science and Arts Occupations
The most common Management, Business, Science and Arts occupations in Cherokee County are Management (2,159 | 10.7%), Community & Social Service (2,094 | 10.4%), Education Instruction & Library (1,458 | 7.3%), Health Diagnosing & Treating (1,321 | 6.6%), and Health Technologists (717 | 3.6%).
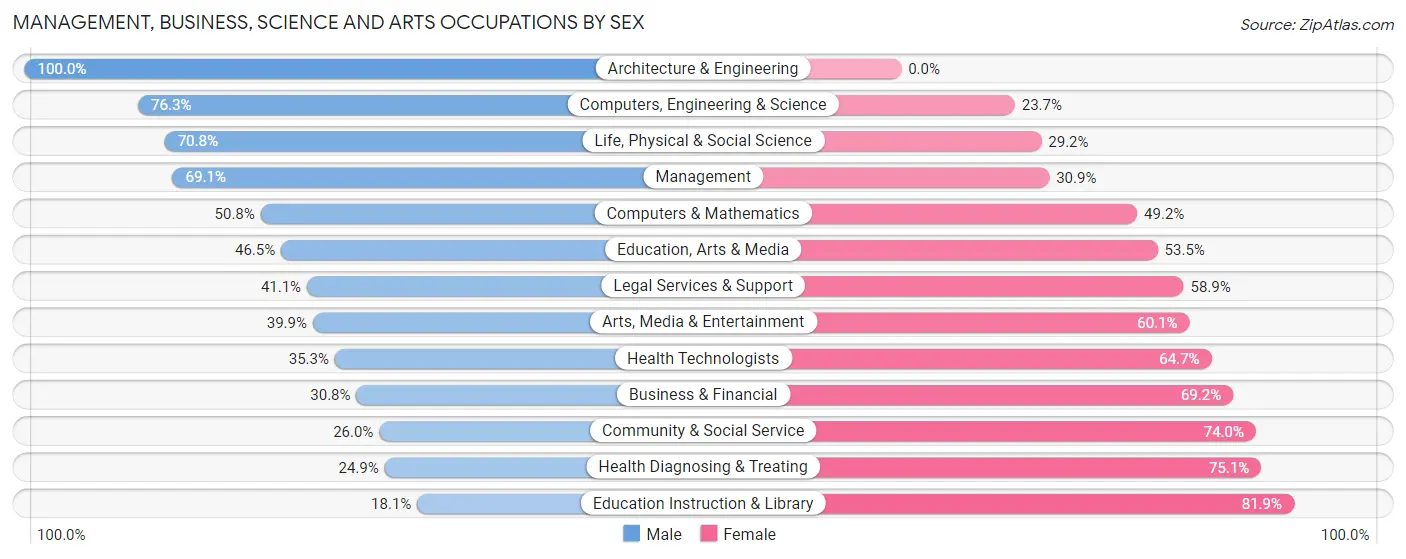
Management, Business, Science and Arts Occupations by Sex
Within the Management, Business, Science and Arts occupations in Cherokee County, the most male-oriented occupations are Architecture & Engineering (100.0%), Computers, Engineering & Science (76.3%), and Life, Physical & Social Science (70.8%), while the most female-oriented occupations are Education Instruction & Library (81.9%), Health Diagnosing & Treating (75.1%), and Community & Social Service (74.0%).
| Occupation | Male | Female |
| Management | 1,492 (69.1%) | 667 (30.9%) |
| Business & Financial | 105 (30.8%) | 236 (69.2%) |
| Computers, Engineering & Science | 470 (76.3%) | 146 (23.7%) |
| Computers & Mathematics | 99 (50.8%) | 96 (49.2%) |
| Architecture & Engineering | 250 (100.0%) | 0 (0.0%) |
| Life, Physical & Social Science | 121 (70.8%) | 50 (29.2%) |
| Community & Social Service | 545 (26.0%) | 1,549 (74.0%) |
| Education, Arts & Media | 186 (46.5%) | 214 (53.5%) |
| Legal Services & Support | 30 (41.1%) | 43 (58.9%) |
| Education Instruction & Library | 264 (18.1%) | 1,194 (81.9%) |
| Arts, Media & Entertainment | 65 (39.9%) | 98 (60.1%) |
| Health Diagnosing & Treating | 329 (24.9%) | 992 (75.1%) |
| Health Technologists | 253 (35.3%) | 464 (64.7%) |
| Total (Category) | 2,941 (45.0%) | 3,590 (55.0%) |
| Total (Overall) | 10,864 (54.1%) | 9,216 (45.9%) |
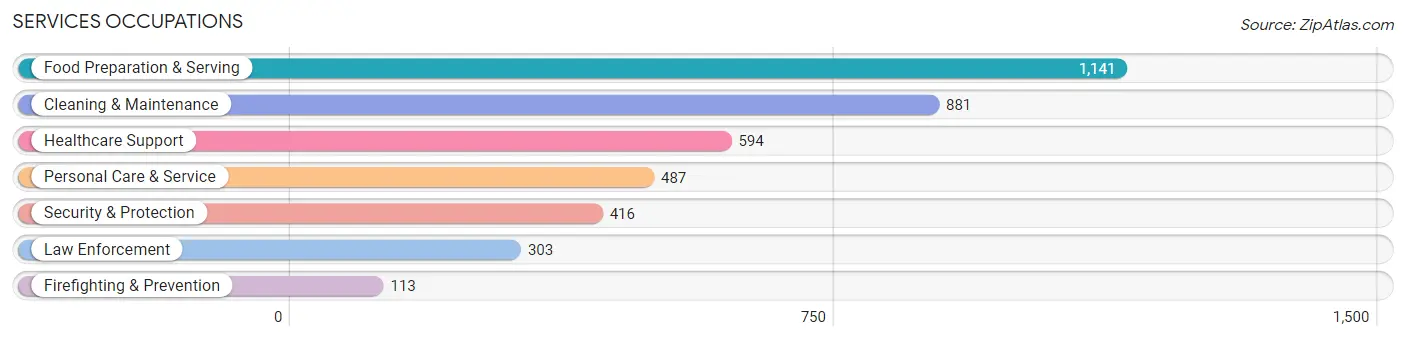
Services Occupations
The most common Services occupations in Cherokee County are Food Preparation & Serving (1,141 | 5.7%), Cleaning & Maintenance (881 | 4.4%), Healthcare Support (594 | 3.0%), Personal Care & Service (487 | 2.4%), and Security & Protection (416 | 2.1%).
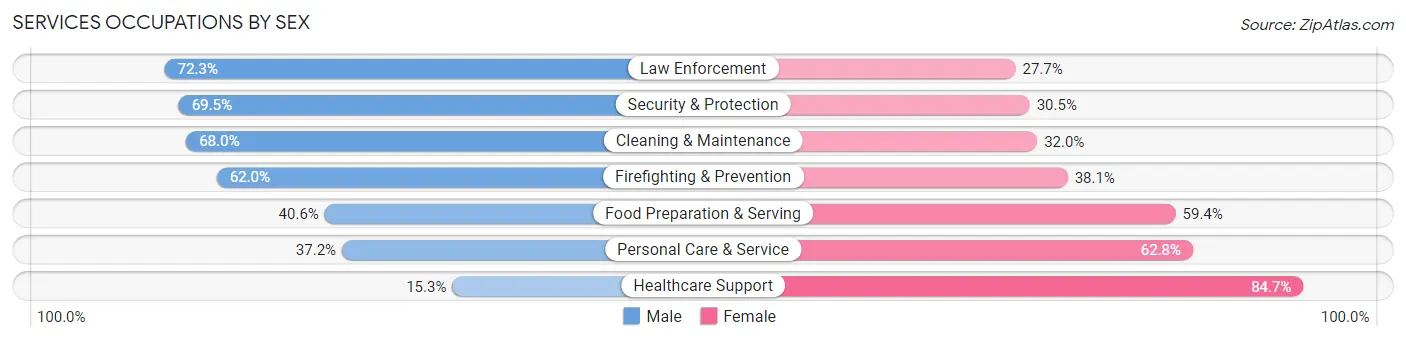
Services Occupations by Sex
Within the Services occupations in Cherokee County, the most male-oriented occupations are Law Enforcement (72.3%), Security & Protection (69.5%), and Cleaning & Maintenance (68.0%), while the most female-oriented occupations are Healthcare Support (84.7%), Personal Care & Service (62.8%), and Food Preparation & Serving (59.4%).
| Occupation | Male | Female |
| Healthcare Support | 91 (15.3%) | 503 (84.7%) |
| Security & Protection | 289 (69.5%) | 127 (30.5%) |
| Firefighting & Prevention | 70 (62.0%) | 43 (38.1%) |
| Law Enforcement | 219 (72.3%) | 84 (27.7%) |
| Food Preparation & Serving | 463 (40.6%) | 678 (59.4%) |
| Cleaning & Maintenance | 599 (68.0%) | 282 (32.0%) |
| Personal Care & Service | 181 (37.2%) | 306 (62.8%) |
| Total (Category) | 1,623 (46.1%) | 1,896 (53.9%) |
| Total (Overall) | 10,864 (54.1%) | 9,216 (45.9%) |
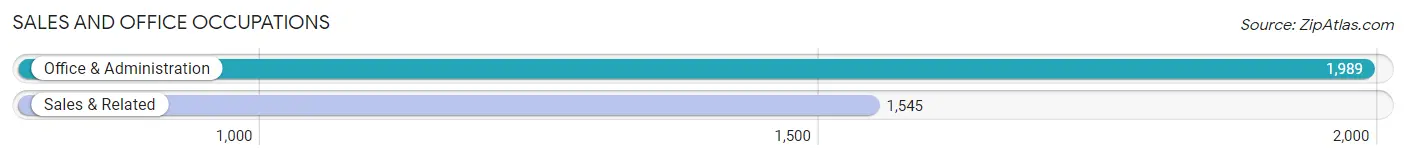
Sales and Office Occupations
The most common Sales and Office occupations in Cherokee County are Office & Administration (1,989 | 9.9%), and Sales & Related (1,545 | 7.7%).
Sales and Office Occupations by Sex
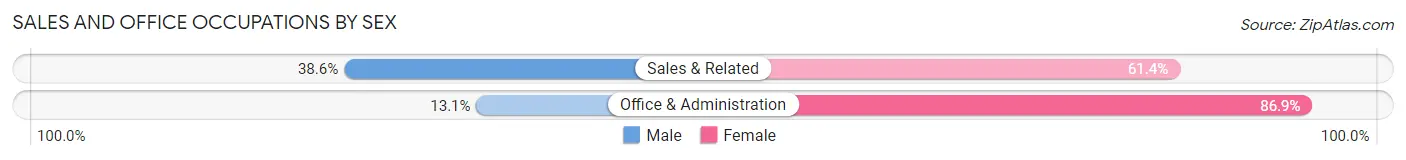
| Occupation | Male | Female |
| Sales & Related | 596 (38.6%) | 949 (61.4%) |
| Office & Administration | 261 (13.1%) | 1,728 (86.9%) |
| Total (Category) | 857 (24.2%) | 2,677 (75.7%) |
| Total (Overall) | 10,864 (54.1%) | 9,216 (45.9%) |
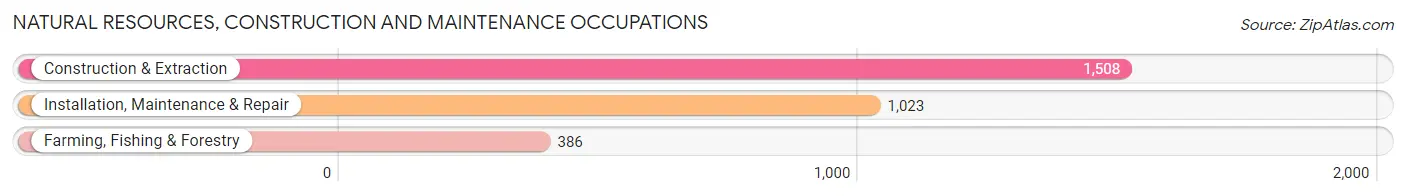
Natural Resources, Construction and Maintenance Occupations
The most common Natural Resources, Construction and Maintenance occupations in Cherokee County are Construction & Extraction (1,508 | 7.5%), Installation, Maintenance & Repair (1,023 | 5.1%), and Farming, Fishing & Forestry (386 | 1.9%).
Natural Resources, Construction and Maintenance Occupations by Sex
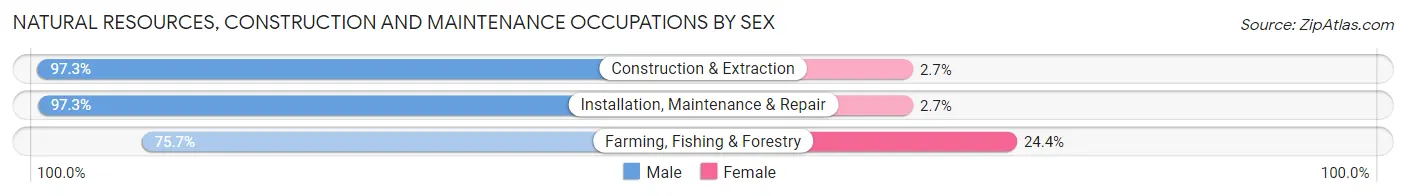
| Occupation | Male | Female |
| Farming, Fishing & Forestry | 292 (75.6%) | 94 (24.3%) |
| Construction & Extraction | 1,467 (97.3%) | 41 (2.7%) |
| Installation, Maintenance & Repair | 995 (97.3%) | 28 (2.7%) |
| Total (Category) | 2,754 (94.4%) | 163 (5.6%) |
| Total (Overall) | 10,864 (54.1%) | 9,216 (45.9%) |
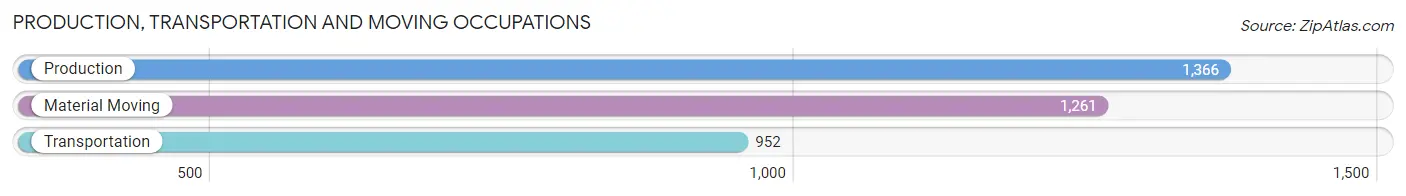
Production, Transportation and Moving Occupations
The most common Production, Transportation and Moving occupations in Cherokee County are Production (1,366 | 6.8%), Material Moving (1,261 | 6.3%), and Transportation (952 | 4.7%).
Production, Transportation and Moving Occupations by Sex
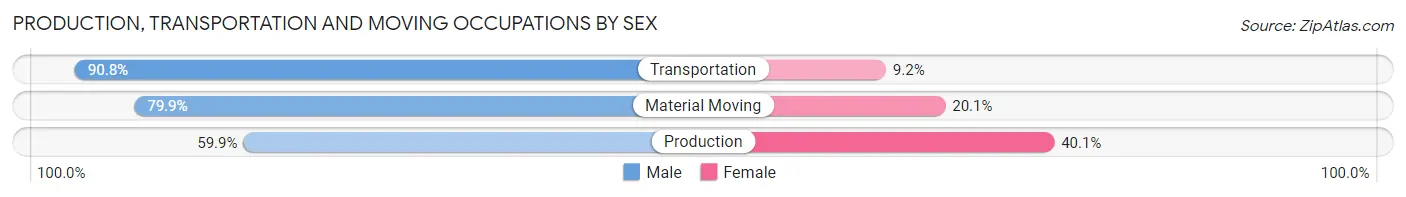
| Occupation | Male | Female |
| Production | 818 (59.9%) | 548 (40.1%) |
| Transportation | 864 (90.8%) | 88 (9.2%) |
| Material Moving | 1,007 (79.9%) | 254 (20.1%) |
| Total (Category) | 2,689 (75.1%) | 890 (24.9%) |
| Total (Overall) | 10,864 (54.1%) | 9,216 (45.9%) |
Employment Industries by Sex in Cherokee County
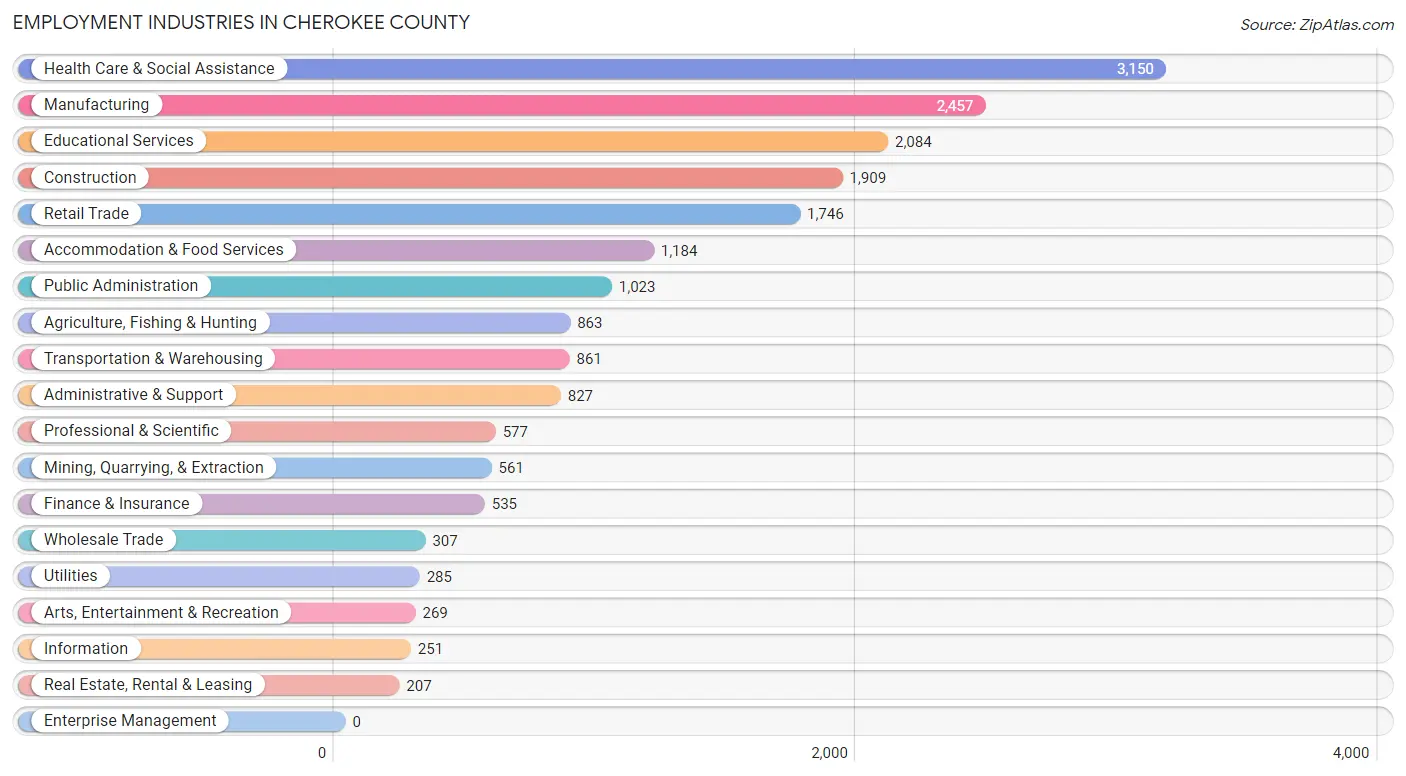
Employment Industries in Cherokee County
The major employment industries in Cherokee County include Health Care & Social Assistance (3,150 | 15.7%), Manufacturing (2,457 | 12.2%), Educational Services (2,084 | 10.4%), Construction (1,909 | 9.5%), and Retail Trade (1,746 | 8.7%).
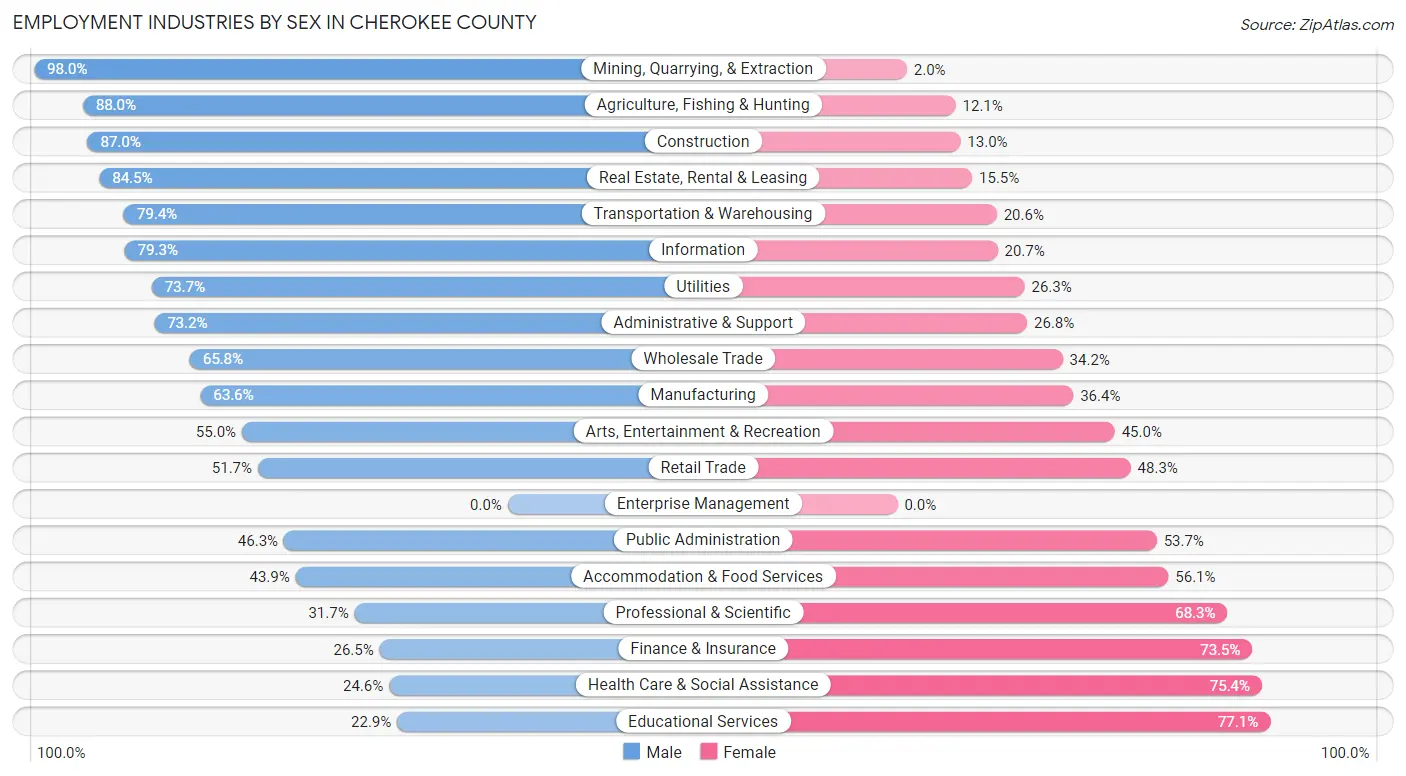
Employment Industries by Sex in Cherokee County
The Cherokee County industries that see more men than women are Mining, Quarrying, & Extraction (98.0%), Agriculture, Fishing & Hunting (87.9%), and Construction (87.0%), whereas the industries that tend to have a higher number of women are Educational Services (77.1%), Health Care & Social Assistance (75.4%), and Finance & Insurance (73.5%).
| Industry | Male | Female |
| Agriculture, Fishing & Hunting | 759 (87.9%) | 104 (12.0%) |
| Mining, Quarrying, & Extraction | 550 (98.0%) | 11 (2.0%) |
| Construction | 1,660 (87.0%) | 249 (13.0%) |
| Manufacturing | 1,563 (63.6%) | 894 (36.4%) |
| Wholesale Trade | 202 (65.8%) | 105 (34.2%) |
| Retail Trade | 903 (51.7%) | 843 (48.3%) |
| Transportation & Warehousing | 684 (79.4%) | 177 (20.6%) |
| Utilities | 210 (73.7%) | 75 (26.3%) |
| Information | 199 (79.3%) | 52 (20.7%) |
| Finance & Insurance | 142 (26.5%) | 393 (73.5%) |
| Real Estate, Rental & Leasing | 175 (84.5%) | 32 (15.5%) |
| Professional & Scientific | 183 (31.7%) | 394 (68.3%) |
| Enterprise Management | 0 (0.0%) | 0 (0.0%) |
| Administrative & Support | 605 (73.2%) | 222 (26.8%) |
| Educational Services | 477 (22.9%) | 1,607 (77.1%) |
| Health Care & Social Assistance | 774 (24.6%) | 2,376 (75.4%) |
| Arts, Entertainment & Recreation | 148 (55.0%) | 121 (45.0%) |
| Accommodation & Food Services | 520 (43.9%) | 664 (56.1%) |
| Public Administration | 474 (46.3%) | 549 (53.7%) |
| Total | 10,864 (54.1%) | 9,216 (45.9%) |
Education in Cherokee County
School Enrollment in Cherokee County
The most common levels of schooling among the 12,248 students in Cherokee County are middle school (3,084 | 25.2%), elementary school (3,042 | 24.8%), and high school (2,650 | 21.6%).
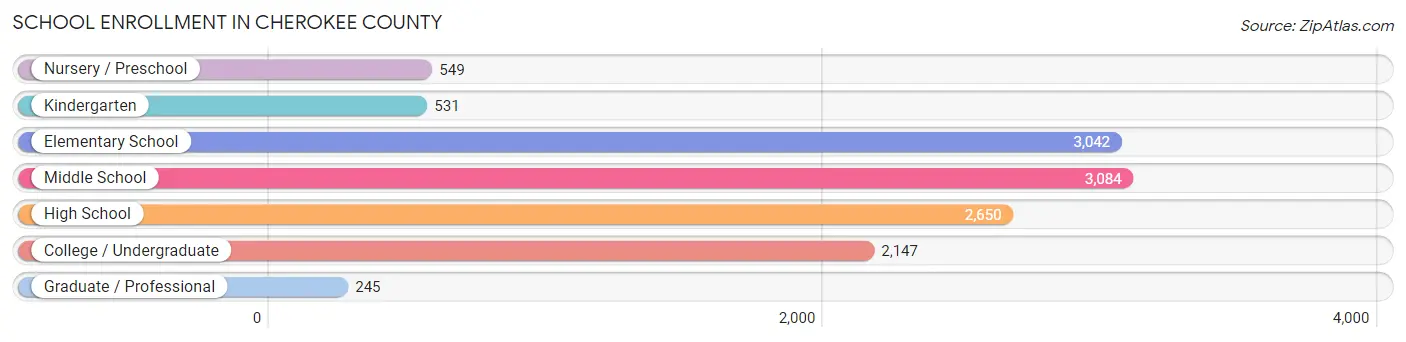
| School Level | # Students | % Students |
| Nursery / Preschool | 549 | 4.5% |
| Kindergarten | 531 | 4.3% |
| Elementary School | 3,042 | 24.8% |
| Middle School | 3,084 | 25.2% |
| High School | 2,650 | 21.6% |
| College / Undergraduate | 2,147 | 17.5% |
| Graduate / Professional | 245 | 2.0% |
| Total | 12,248 | 100.0% |
School Enrollment by Age by Funding Source in Cherokee County
Out of a total of 12,248 students who are enrolled in schools in Cherokee County, 1,029 (8.4%) attend a private institution, while the remaining 11,219 (91.6%) are enrolled in public schools. The age group of 18 to 19 year olds has the highest likelihood of being enrolled in private schools, with 179 (25.6% in the age bracket) enrolled. Conversely, the age group of 5 to 9 year old has the lowest likelihood of being enrolled in a private school, with 3,185 (95.5% in the age bracket) attending a public institution.
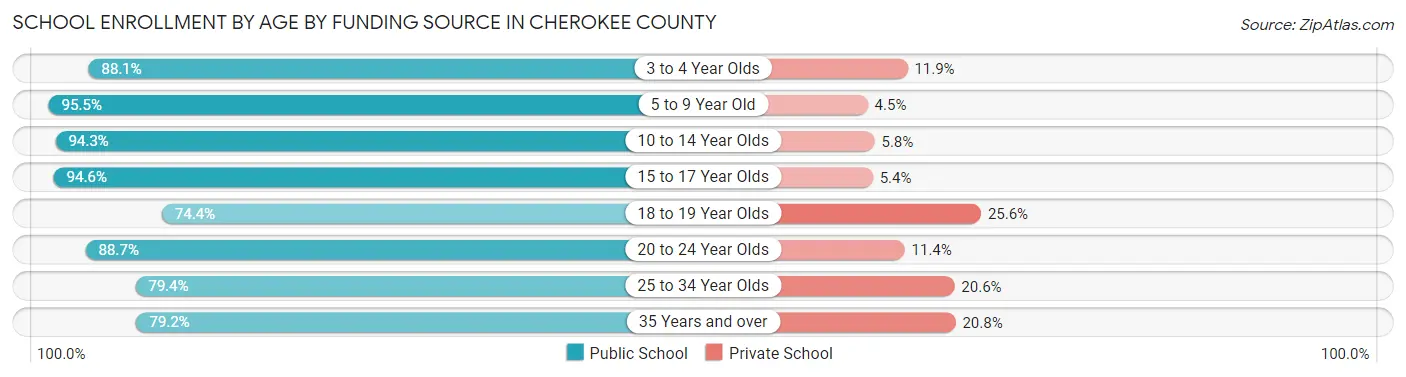
| Age Bracket | Public School | Private School |
| 3 to 4 Year Olds | 356 (88.1%) | 48 (11.9%) |
| 5 to 9 Year Old | 3,185 (95.5%) | 149 (4.5%) |
| 10 to 14 Year Olds | 3,509 (94.3%) | 214 (5.8%) |
| 15 to 17 Year Olds | 2,030 (94.6%) | 116 (5.4%) |
| 18 to 19 Year Olds | 521 (74.4%) | 179 (25.6%) |
| 20 to 24 Year Olds | 742 (88.6%) | 95 (11.4%) |
| 25 to 34 Year Olds | 400 (79.4%) | 104 (20.6%) |
| 35 Years and over | 475 (79.2%) | 125 (20.8%) |
| Total | 11,219 (91.6%) | 1,029 (8.4%) |
Educational Attainment by Field of Study in Cherokee County
Education (1,110 | 19.6%), business (994 | 17.5%), science & technology (727 | 12.8%), arts & humanities (545 | 9.6%), and liberal arts & history (475 | 8.4%) are the most common fields of study among 5,665 individuals in Cherokee County who have obtained a bachelor's degree or higher.
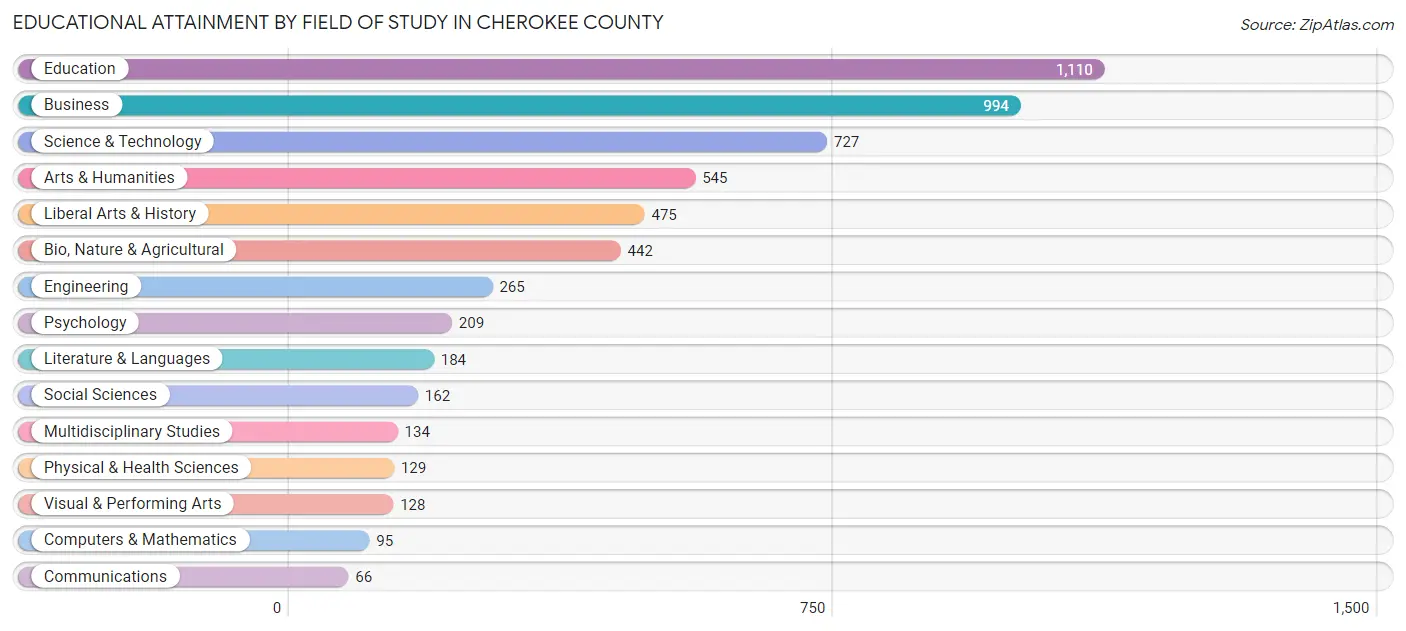
| Field of Study | # Graduates | % Graduates |
| Computers & Mathematics | 95 | 1.7% |
| Bio, Nature & Agricultural | 442 | 7.8% |
| Physical & Health Sciences | 129 | 2.3% |
| Psychology | 209 | 3.7% |
| Social Sciences | 162 | 2.9% |
| Engineering | 265 | 4.7% |
| Multidisciplinary Studies | 134 | 2.4% |
| Science & Technology | 727 | 12.8% |
| Business | 994 | 17.5% |
| Education | 1,110 | 19.6% |
| Literature & Languages | 184 | 3.3% |
| Liberal Arts & History | 475 | 8.4% |
| Visual & Performing Arts | 128 | 2.3% |
| Communications | 66 | 1.2% |
| Arts & Humanities | 545 | 9.6% |
| Total | 5,665 | 100.0% |
Transportation & Commute in Cherokee County
Vehicle Availability by Sex in Cherokee County
The most prevalent vehicle ownership categories in Cherokee County are males with 2 vehicles (4,031, accounting for 38.3%) and females with 2 vehicles (3,290, making up 44.5%).
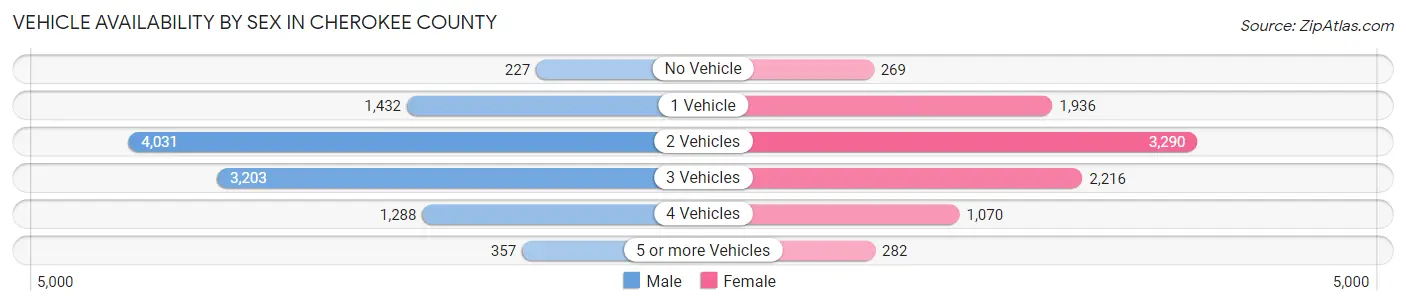
| Vehicles Available | Male | Female |
| No Vehicle | 227 (2.1%) | 269 (3.0%) |
| 1 Vehicle | 1,432 (13.6%) | 1,936 (21.4%) |
| 2 Vehicles | 4,031 (38.3%) | 3,290 (36.3%) |
| 3 Vehicles | 3,203 (30.4%) | 2,216 (24.4%) |
| 4 Vehicles | 1,288 (12.2%) | 1,070 (11.8%) |
| 5 or more Vehicles | 357 (3.4%) | 282 (3.1%) |
| Total | 10,538 (100.0%) | 9,063 (100.0%) |
Commute Time in Cherokee County
The most frequently occuring commute durations in Cherokee County are 5 to 9 minutes (3,064 commuters, 17.1%), 15 to 19 minutes (2,945 commuters, 16.4%), and 10 to 14 minutes (2,727 commuters, 15.2%).
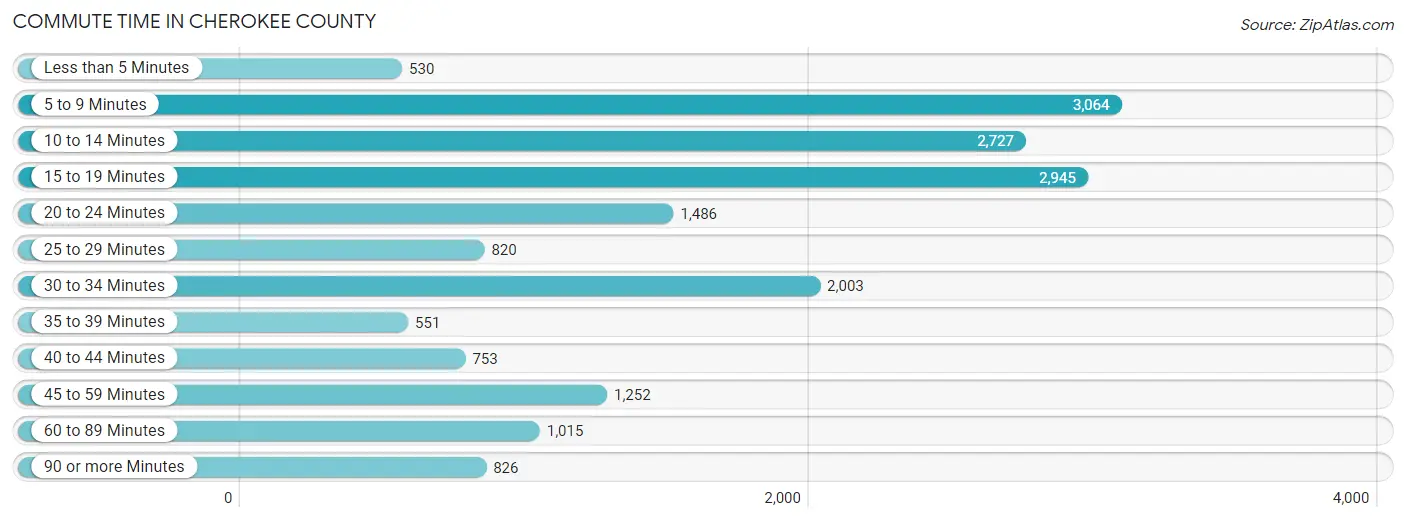
| Commute Time | # Commuters | % Commuters |
| Less than 5 Minutes | 530 | 2.9% |
| 5 to 9 Minutes | 3,064 | 17.1% |
| 10 to 14 Minutes | 2,727 | 15.2% |
| 15 to 19 Minutes | 2,945 | 16.4% |
| 20 to 24 Minutes | 1,486 | 8.3% |
| 25 to 29 Minutes | 820 | 4.6% |
| 30 to 34 Minutes | 2,003 | 11.2% |
| 35 to 39 Minutes | 551 | 3.1% |
| 40 to 44 Minutes | 753 | 4.2% |
| 45 to 59 Minutes | 1,252 | 7.0% |
| 60 to 89 Minutes | 1,015 | 5.7% |
| 90 or more Minutes | 826 | 4.6% |
Commute Time by Sex in Cherokee County
The most common commute times in Cherokee County are 5 to 9 minutes (1,566 commuters, 16.0%) for males and 5 to 9 minutes (1,498 commuters, 18.3%) for females.
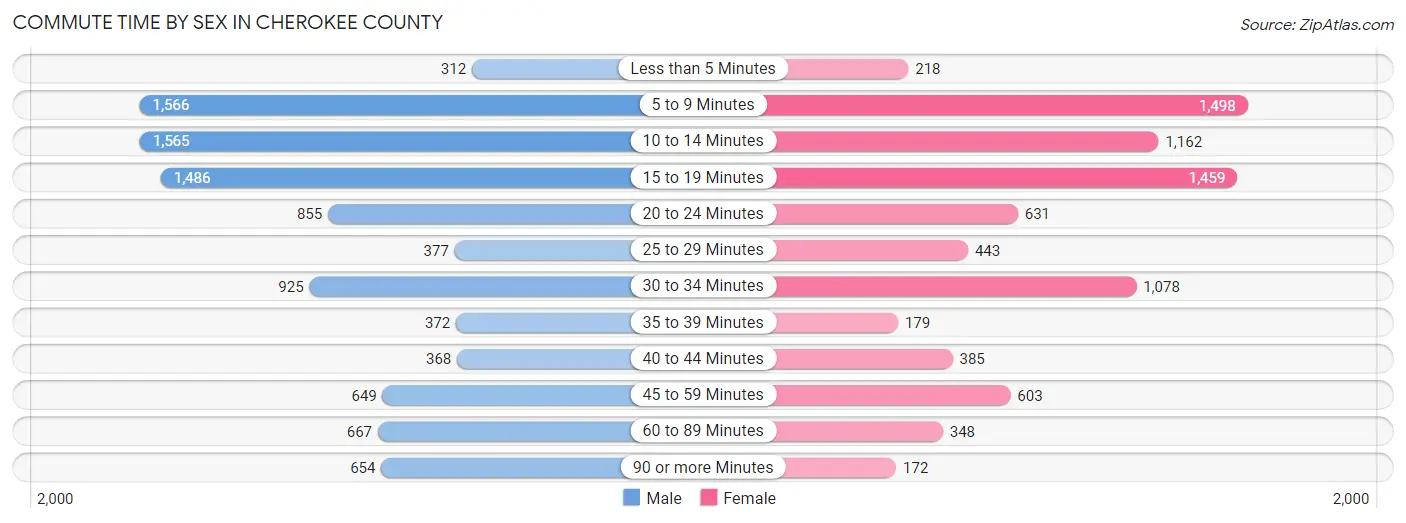
| Commute Time | Male | Female |
| Less than 5 Minutes | 312 (3.2%) | 218 (2.7%) |
| 5 to 9 Minutes | 1,566 (16.0%) | 1,498 (18.3%) |
| 10 to 14 Minutes | 1,565 (16.0%) | 1,162 (14.2%) |
| 15 to 19 Minutes | 1,486 (15.2%) | 1,459 (17.8%) |
| 20 to 24 Minutes | 855 (8.7%) | 631 (7.7%) |
| 25 to 29 Minutes | 377 (3.8%) | 443 (5.4%) |
| 30 to 34 Minutes | 925 (9.4%) | 1,078 (13.2%) |
| 35 to 39 Minutes | 372 (3.8%) | 179 (2.2%) |
| 40 to 44 Minutes | 368 (3.8%) | 385 (4.7%) |
| 45 to 59 Minutes | 649 (6.6%) | 603 (7.4%) |
| 60 to 89 Minutes | 667 (6.8%) | 348 (4.3%) |
| 90 or more Minutes | 654 (6.7%) | 172 (2.1%) |
Time of Departure to Work by Sex in Cherokee County
The most frequent times of departure to work in Cherokee County are 7:00 AM to 7:29 AM (1,872, 19.1%) for males and 7:00 AM to 7:29 AM (2,015, 24.6%) for females.
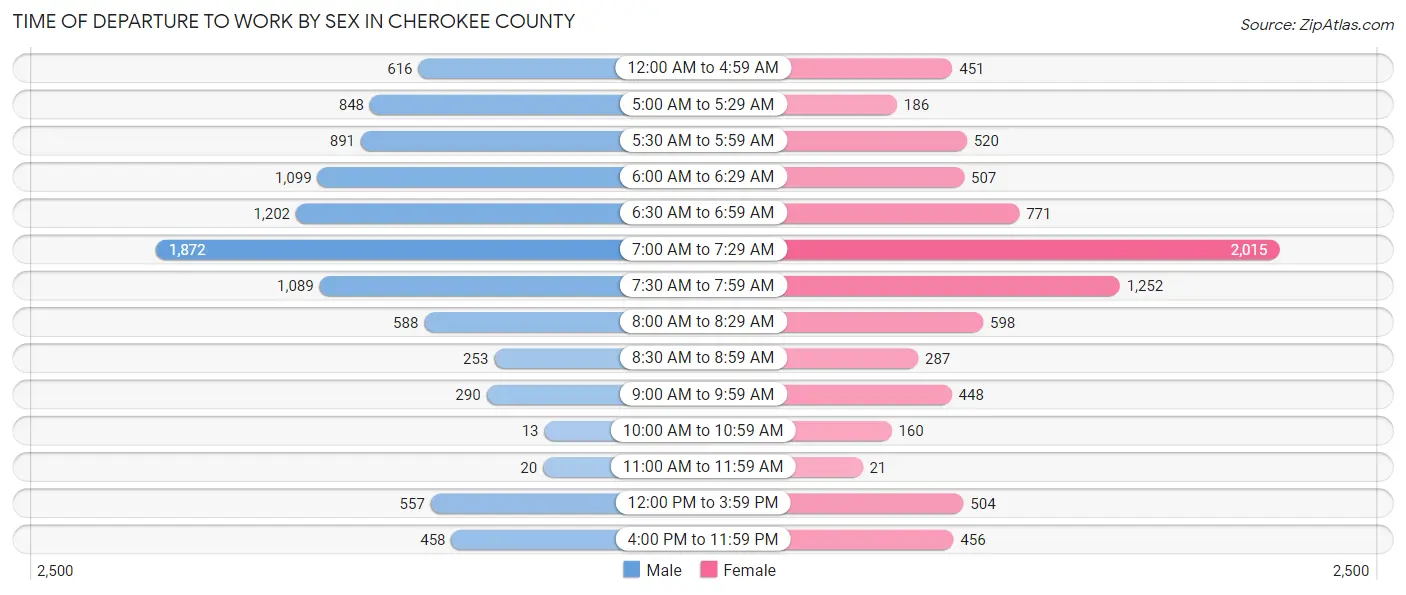
| Time of Departure | Male | Female |
| 12:00 AM to 4:59 AM | 616 (6.3%) | 451 (5.5%) |
| 5:00 AM to 5:29 AM | 848 (8.7%) | 186 (2.3%) |
| 5:30 AM to 5:59 AM | 891 (9.1%) | 520 (6.4%) |
| 6:00 AM to 6:29 AM | 1,099 (11.2%) | 507 (6.2%) |
| 6:30 AM to 6:59 AM | 1,202 (12.3%) | 771 (9.4%) |
| 7:00 AM to 7:29 AM | 1,872 (19.1%) | 2,015 (24.6%) |
| 7:30 AM to 7:59 AM | 1,089 (11.1%) | 1,252 (15.3%) |
| 8:00 AM to 8:29 AM | 588 (6.0%) | 598 (7.3%) |
| 8:30 AM to 8:59 AM | 253 (2.6%) | 287 (3.5%) |
| 9:00 AM to 9:59 AM | 290 (3.0%) | 448 (5.5%) |
| 10:00 AM to 10:59 AM | 13 (0.1%) | 160 (2.0%) |
| 11:00 AM to 11:59 AM | 20 (0.2%) | 21 (0.3%) |
| 12:00 PM to 3:59 PM | 557 (5.7%) | 504 (6.2%) |
| 4:00 PM to 11:59 PM | 458 (4.7%) | 456 (5.6%) |
| Total | 9,796 (100.0%) | 8,176 (100.0%) |
Housing Occupancy in Cherokee County
Occupancy by Ownership in Cherokee County
Of the total 18,069 dwellings in Cherokee County, owner-occupied units account for 13,002 (72.0%), while renter-occupied units make up 5,067 (28.0%).
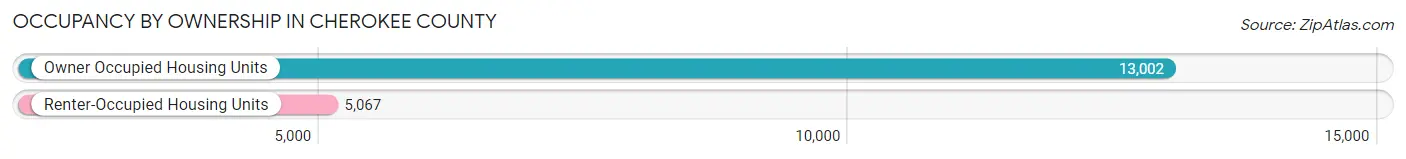
| Occupancy | # Housing Units | % Housing Units |
| Owner Occupied Housing Units | 13,002 | 72.0% |
| Renter-Occupied Housing Units | 5,067 | 28.0% |
| Total Occupied Housing Units | 18,069 | 100.0% |
Occupancy by Household Size in Cherokee County
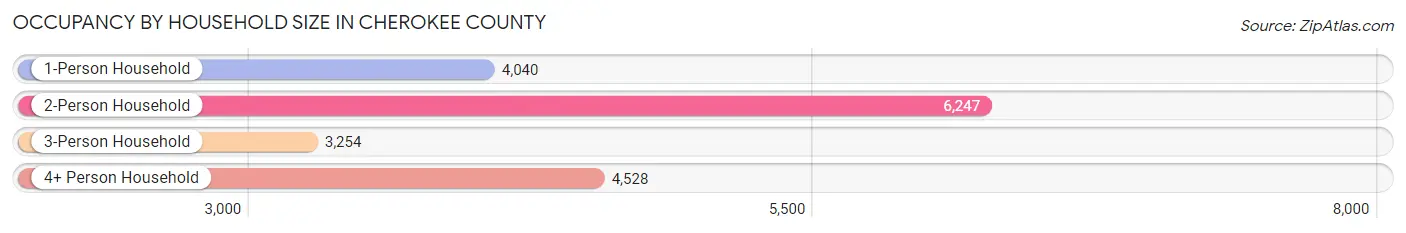
| Household Size | # Housing Units | % Housing Units |
| 1-Person Household | 4,040 | 22.4% |
| 2-Person Household | 6,247 | 34.6% |
| 3-Person Household | 3,254 | 18.0% |
| 4+ Person Household | 4,528 | 25.1% |
| Total Housing Units | 18,069 | 100.0% |
Occupancy by Ownership by Household Size in Cherokee County
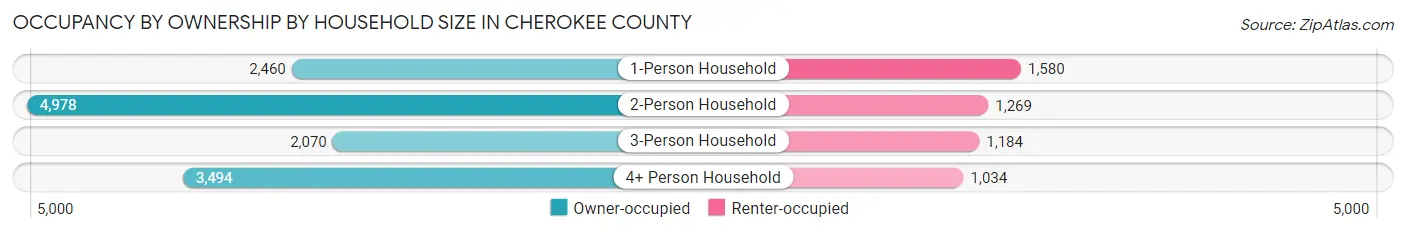
| Household Size | Owner-occupied | Renter-occupied |
| 1-Person Household | 2,460 (60.9%) | 1,580 (39.1%) |
| 2-Person Household | 4,978 (79.7%) | 1,269 (20.3%) |
| 3-Person Household | 2,070 (63.6%) | 1,184 (36.4%) |
| 4+ Person Household | 3,494 (77.2%) | 1,034 (22.8%) |
| Total Housing Units | 13,002 (72.0%) | 5,067 (28.0%) |
Occupancy by Educational Attainment in Cherokee County
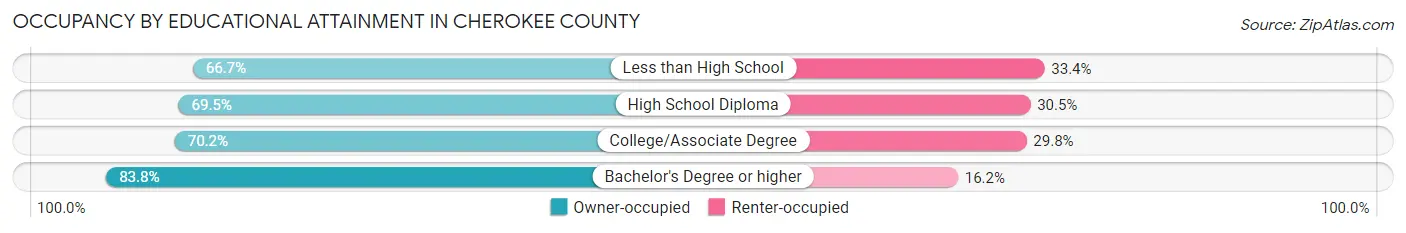
| Household Size | Owner-occupied | Renter-occupied |
| Less than High School | 2,124 (66.6%) | 1,063 (33.4%) |
| High School Diploma | 3,503 (69.5%) | 1,540 (30.5%) |
| College/Associate Degree | 4,497 (70.2%) | 1,908 (29.8%) |
| Bachelor's Degree or higher | 2,878 (83.8%) | 556 (16.2%) |
Occupancy by Age of Householder in Cherokee County
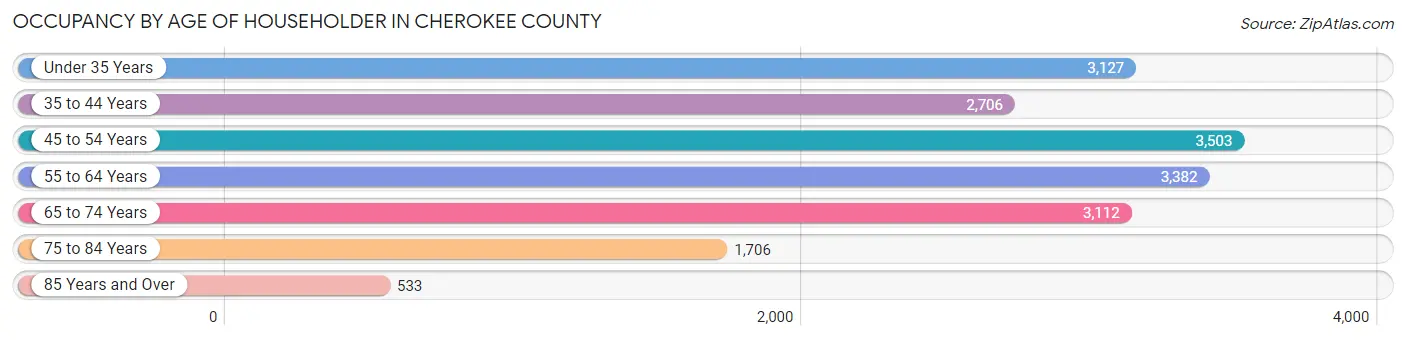
| Age Bracket | # Households | % Households |
| Under 35 Years | 3,127 | 17.3% |
| 35 to 44 Years | 2,706 | 15.0% |
| 45 to 54 Years | 3,503 | 19.4% |
| 55 to 64 Years | 3,382 | 18.7% |
| 65 to 74 Years | 3,112 | 17.2% |
| 75 to 84 Years | 1,706 | 9.4% |
| 85 Years and Over | 533 | 2.9% |
| Total | 18,069 | 100.0% |
Housing Finances in Cherokee County
Median Income by Occupancy in Cherokee County
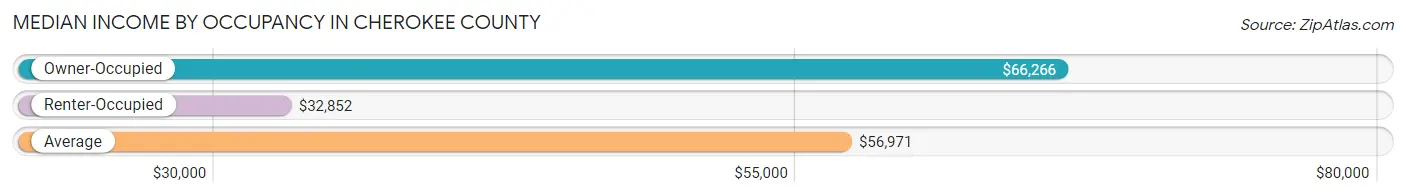
| Occupancy Type | # Households | Median Income |
| Owner-Occupied | 13,002 (72.0%) | $66,266 |
| Renter-Occupied | 5,067 (28.0%) | $32,852 |
| Average | 18,069 (100.0%) | $56,971 |
Occupancy by Householder Income Bracket in Cherokee County
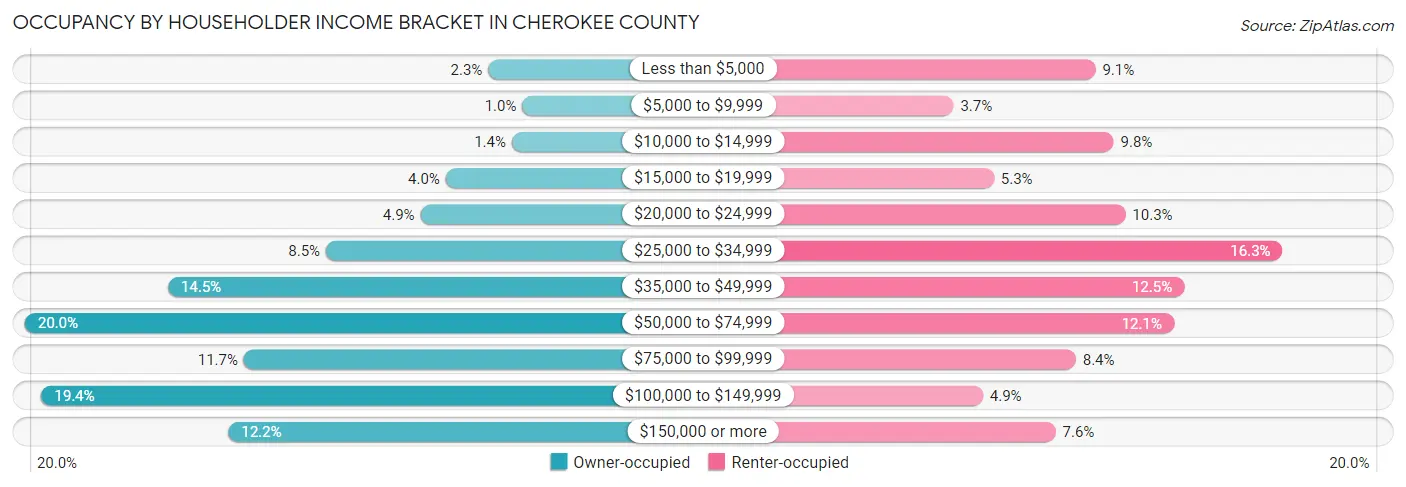
| Income Bracket | Owner-occupied | Renter-occupied |
| Less than $5,000 | 304 (2.3%) | 463 (9.1%) |
| $5,000 to $9,999 | 135 (1.0%) | 189 (3.7%) |
| $10,000 to $14,999 | 187 (1.4%) | 498 (9.8%) |
| $15,000 to $19,999 | 515 (4.0%) | 267 (5.3%) |
| $20,000 to $24,999 | 640 (4.9%) | 521 (10.3%) |
| $25,000 to $34,999 | 1,108 (8.5%) | 824 (16.3%) |
| $35,000 to $49,999 | 1,890 (14.5%) | 634 (12.5%) |
| $50,000 to $74,999 | 2,599 (20.0%) | 614 (12.1%) |
| $75,000 to $99,999 | 1,515 (11.7%) | 425 (8.4%) |
| $100,000 to $149,999 | 2,517 (19.4%) | 246 (4.9%) |
| $150,000 or more | 1,592 (12.2%) | 386 (7.6%) |
| Total | 13,002 (100.0%) | 5,067 (100.0%) |
Monthly Housing Cost Tiers in Cherokee County
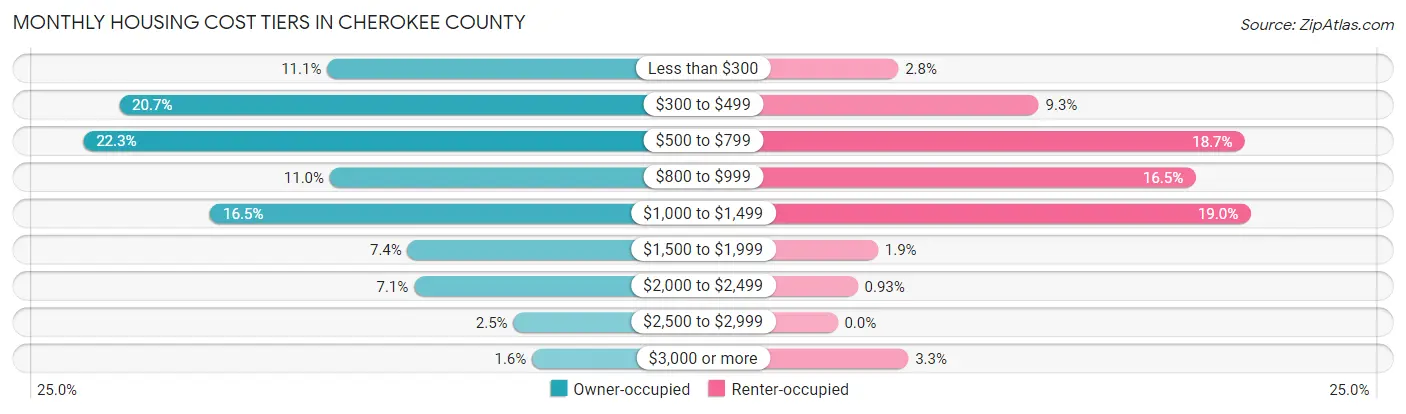
| Monthly Cost | Owner-occupied | Renter-occupied |
| Less than $300 | 1,439 (11.1%) | 142 (2.8%) |
| $300 to $499 | 2,685 (20.6%) | 469 (9.3%) |
| $500 to $799 | 2,899 (22.3%) | 949 (18.7%) |
| $800 to $999 | 1,424 (11.0%) | 834 (16.5%) |
| $1,000 to $1,499 | 2,140 (16.5%) | 962 (19.0%) |
| $1,500 to $1,999 | 958 (7.4%) | 94 (1.9%) |
| $2,000 to $2,499 | 919 (7.1%) | 47 (0.9%) |
| $2,500 to $2,999 | 325 (2.5%) | 0 (0.0%) |
| $3,000 or more | 213 (1.6%) | 165 (3.3%) |
| Total | 13,002 (100.0%) | 5,067 (100.0%) |
Physical Housing Characteristics in Cherokee County
Housing Structures in Cherokee County
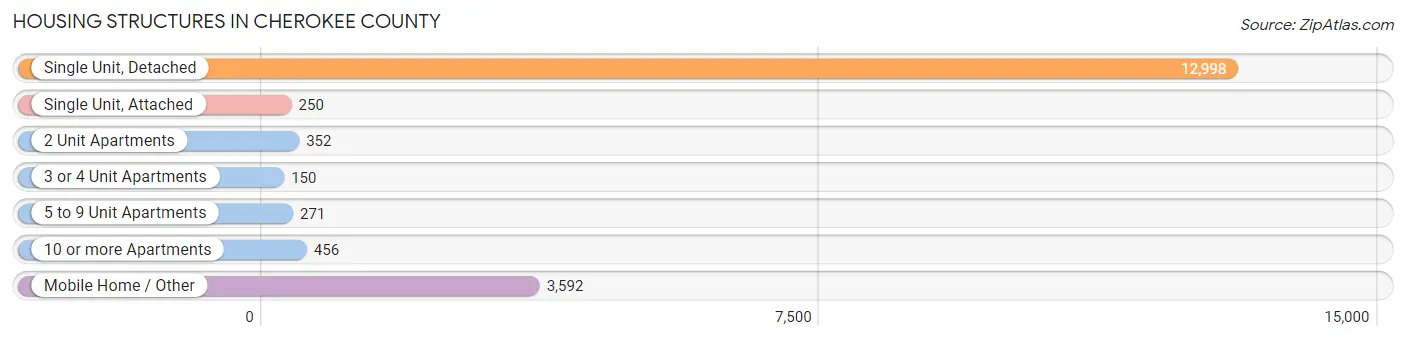
| Structure Type | # Housing Units | % Housing Units |
| Single Unit, Detached | 12,998 | 71.9% |
| Single Unit, Attached | 250 | 1.4% |
| 2 Unit Apartments | 352 | 1.9% |
| 3 or 4 Unit Apartments | 150 | 0.8% |
| 5 to 9 Unit Apartments | 271 | 1.5% |
| 10 or more Apartments | 456 | 2.5% |
| Mobile Home / Other | 3,592 | 19.9% |
| Total | 18,069 | 100.0% |
Housing Structures by Occupancy in Cherokee County
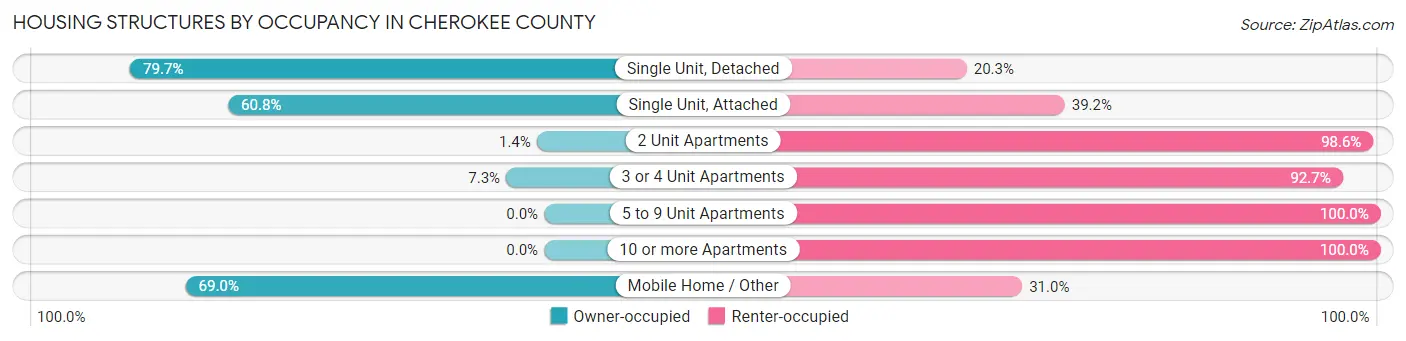
| Structure Type | Owner-occupied | Renter-occupied |
| Single Unit, Detached | 10,356 (79.7%) | 2,642 (20.3%) |
| Single Unit, Attached | 152 (60.8%) | 98 (39.2%) |
| 2 Unit Apartments | 5 (1.4%) | 347 (98.6%) |
| 3 or 4 Unit Apartments | 11 (7.3%) | 139 (92.7%) |
| 5 to 9 Unit Apartments | 0 (0.0%) | 271 (100.0%) |
| 10 or more Apartments | 0 (0.0%) | 456 (100.0%) |
| Mobile Home / Other | 2,478 (69.0%) | 1,114 (31.0%) |
| Total | 13,002 (72.0%) | 5,067 (28.0%) |
Housing Structures by Number of Rooms in Cherokee County
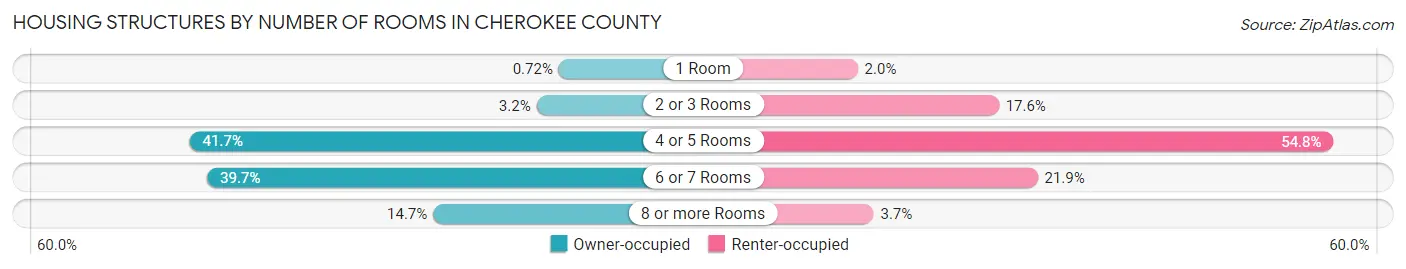
| Number of Rooms | Owner-occupied | Renter-occupied |
| 1 Room | 93 (0.7%) | 100 (2.0%) |
| 2 or 3 Rooms | 415 (3.2%) | 893 (17.6%) |
| 4 or 5 Rooms | 5,421 (41.7%) | 2,774 (54.7%) |
| 6 or 7 Rooms | 5,167 (39.7%) | 1,111 (21.9%) |
| 8 or more Rooms | 1,906 (14.7%) | 189 (3.7%) |
| Total | 13,002 (100.0%) | 5,067 (100.0%) |
Housing Structure by Heating Type in Cherokee County
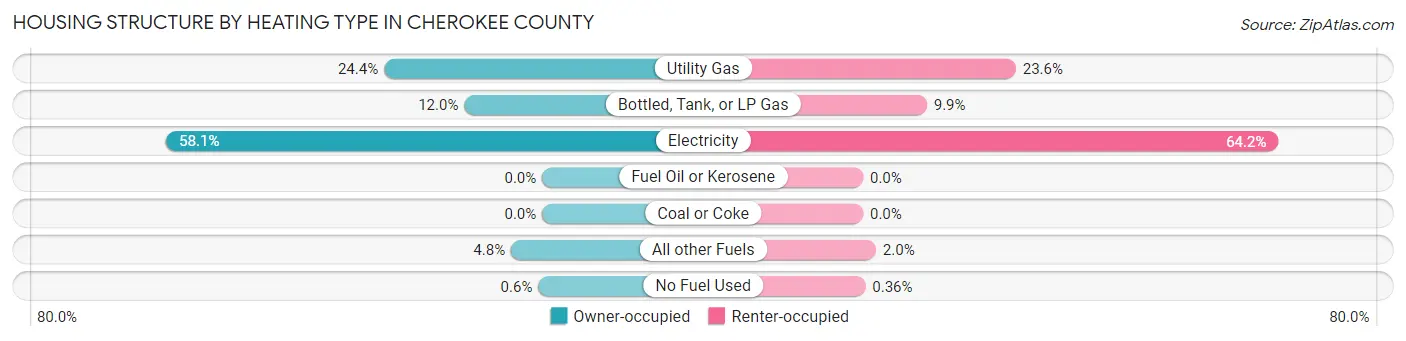
| Heating Type | Owner-occupied | Renter-occupied |
| Utility Gas | 3,178 (24.4%) | 1,197 (23.6%) |
| Bottled, Tank, or LP Gas | 1,565 (12.0%) | 499 (9.9%) |
| Electricity | 7,555 (58.1%) | 3,252 (64.2%) |
| Fuel Oil or Kerosene | 0 (0.0%) | 0 (0.0%) |
| Coal or Coke | 0 (0.0%) | 0 (0.0%) |
| All other Fuels | 626 (4.8%) | 101 (2.0%) |
| No Fuel Used | 78 (0.6%) | 18 (0.4%) |
| Total | 13,002 (100.0%) | 5,067 (100.0%) |
Household Vehicle Usage in Cherokee County
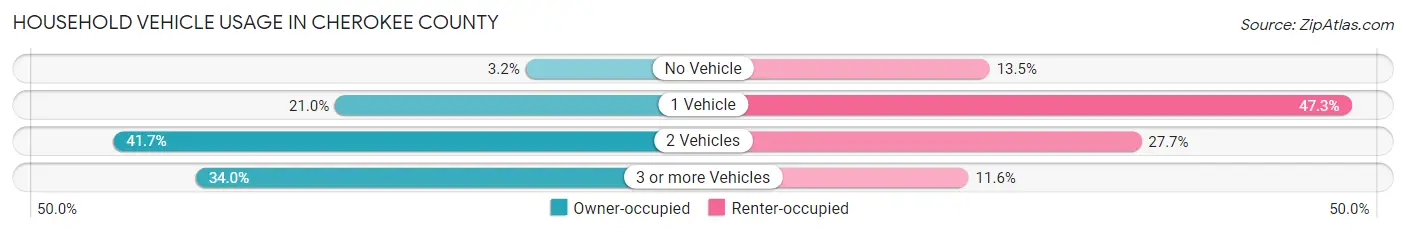
| Vehicles per Household | Owner-occupied | Renter-occupied |
| No Vehicle | 421 (3.2%) | 685 (13.5%) |
| 1 Vehicle | 2,733 (21.0%) | 2,395 (47.3%) |
| 2 Vehicles | 5,425 (41.7%) | 1,402 (27.7%) |
| 3 or more Vehicles | 4,423 (34.0%) | 585 (11.6%) |
| Total | 13,002 (100.0%) | 5,067 (100.0%) |
Real Estate & Mortgages in Cherokee County
Real Estate and Mortgage Overview in Cherokee County
| Characteristic | Without Mortgage | With Mortgage |
| Housing Units | 7,758 | 5,244 |
| Median Property Value | $115,800 | $175,900 |
| Median Household Income | $56,495 | $852 |
| Monthly Housing Costs | $483 | $203 |
| Real Estate Taxes | $1,331 | $205 |
Property Value by Mortgage Status in Cherokee County
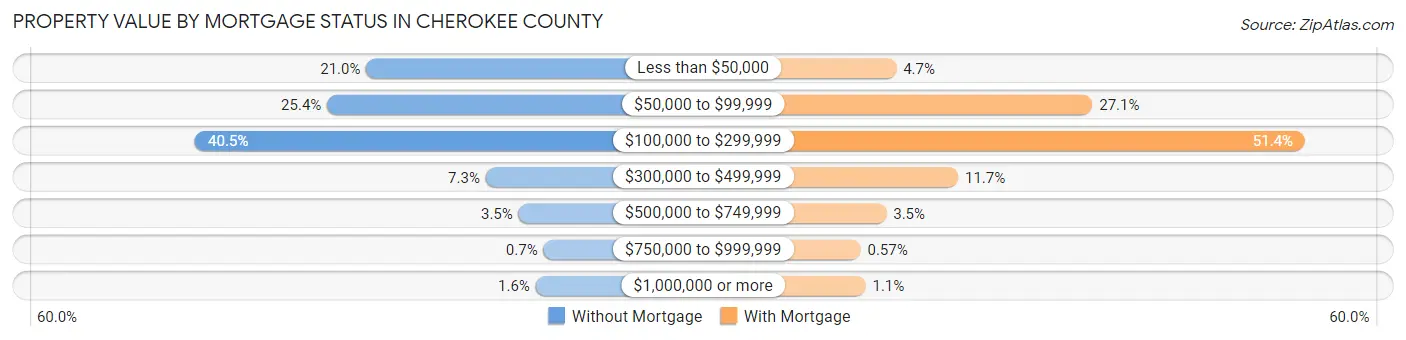
| Property Value | Without Mortgage | With Mortgage |
| Less than $50,000 | 1,625 (20.9%) | 244 (4.6%) |
| $50,000 to $99,999 | 1,972 (25.4%) | 1,419 (27.1%) |
| $100,000 to $299,999 | 3,143 (40.5%) | 2,693 (51.3%) |
| $300,000 to $499,999 | 566 (7.3%) | 614 (11.7%) |
| $500,000 to $749,999 | 275 (3.5%) | 184 (3.5%) |
| $750,000 to $999,999 | 54 (0.7%) | 30 (0.6%) |
| $1,000,000 or more | 123 (1.6%) | 60 (1.1%) |
| Total | 7,758 (100.0%) | 5,244 (100.0%) |
Household Income by Mortgage Status in Cherokee County
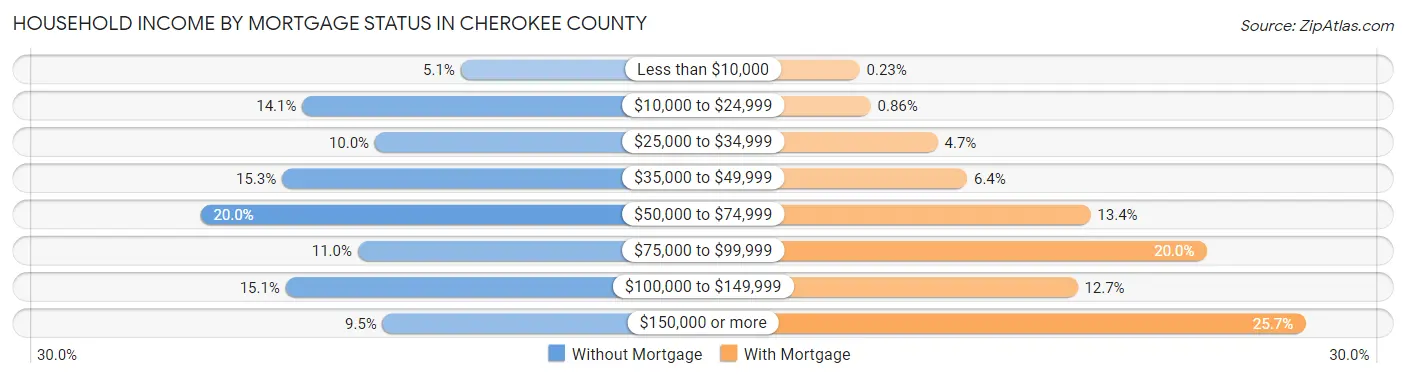
| Household Income | Without Mortgage | With Mortgage |
| Less than $10,000 | 394 (5.1%) | 12 (0.2%) |
| $10,000 to $24,999 | 1,096 (14.1%) | 45 (0.9%) |
| $25,000 to $34,999 | 774 (10.0%) | 246 (4.7%) |
| $35,000 to $49,999 | 1,186 (15.3%) | 334 (6.4%) |
| $50,000 to $74,999 | 1,548 (20.0%) | 704 (13.4%) |
| $75,000 to $99,999 | 850 (11.0%) | 1,051 (20.0%) |
| $100,000 to $149,999 | 1,170 (15.1%) | 665 (12.7%) |
| $150,000 or more | 740 (9.5%) | 1,347 (25.7%) |
| Total | 7,758 (100.0%) | 5,244 (100.0%) |
Property Value to Household Income Ratio in Cherokee County
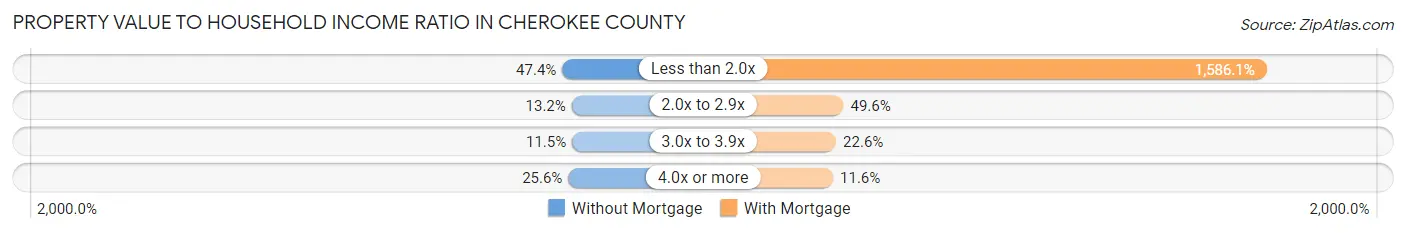
| Value-to-Income Ratio | Without Mortgage | With Mortgage |
| Less than 2.0x | 3,679 (47.4%) | 83,176 (1,586.1%) |
| 2.0x to 2.9x | 1,022 (13.2%) | 2,603 (49.6%) |
| 3.0x to 3.9x | 891 (11.5%) | 1,183 (22.6%) |
| 4.0x or more | 1,982 (25.6%) | 608 (11.6%) |
| Total | 7,758 (100.0%) | 5,244 (100.0%) |
Real Estate Taxes by Mortgage Status in Cherokee County
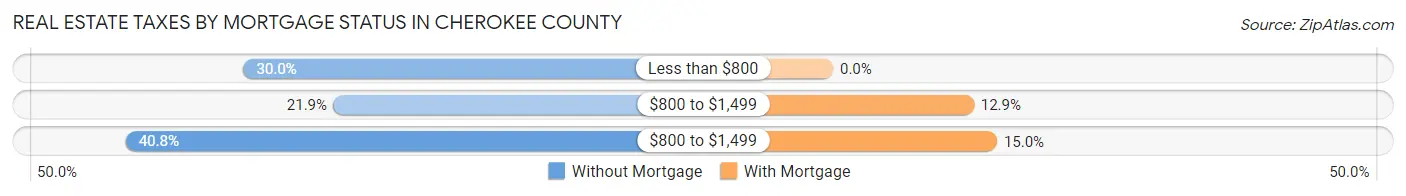
| Property Taxes | Without Mortgage | With Mortgage |
| Less than $800 | 2,328 (30.0%) | 0 (0.0%) |
| $800 to $1,499 | 1,695 (21.8%) | 674 (12.9%) |
| $800 to $1,499 | 3,162 (40.8%) | 785 (15.0%) |
| Total | 7,758 (100.0%) | 5,244 (100.0%) |
Health & Disability in Cherokee County
Health Insurance Coverage by Age in Cherokee County
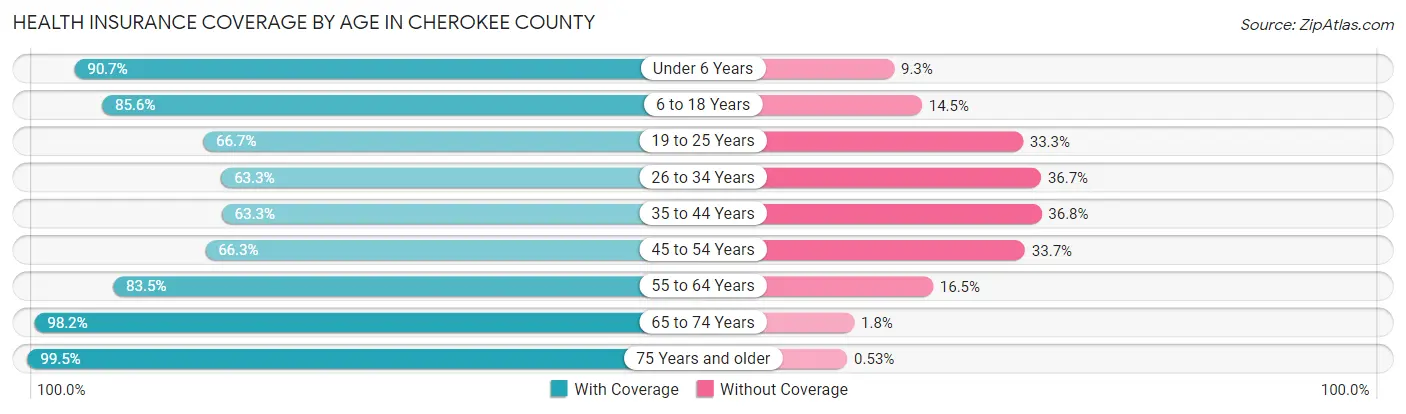
| Age Bracket | With Coverage | Without Coverage |
| Under 6 Years | 3,541 (90.7%) | 362 (9.3%) |
| 6 to 18 Years | 8,023 (85.6%) | 1,355 (14.4%) |
| 19 to 25 Years | 2,954 (66.7%) | 1,474 (33.3%) |
| 26 to 34 Years | 3,143 (63.3%) | 1,820 (36.7%) |
| 35 to 44 Years | 3,413 (63.2%) | 1,983 (36.7%) |
| 45 to 54 Years | 3,781 (66.3%) | 1,920 (33.7%) |
| 55 to 64 Years | 4,604 (83.5%) | 911 (16.5%) |
| 65 to 74 Years | 4,894 (98.2%) | 91 (1.8%) |
| 75 Years and older | 3,393 (99.5%) | 18 (0.5%) |
| Total | 37,746 (79.2%) | 9,934 (20.8%) |
Health Insurance Coverage by Citizenship Status in Cherokee County
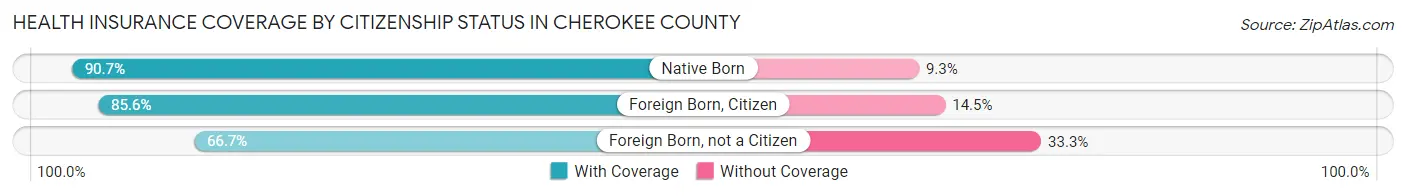
| Citizenship Status | With Coverage | Without Coverage |
| Native Born | 3,541 (90.7%) | 362 (9.3%) |
| Foreign Born, Citizen | 8,023 (85.6%) | 1,355 (14.4%) |
| Foreign Born, not a Citizen | 2,954 (66.7%) | 1,474 (33.3%) |
Health Insurance Coverage by Household Income in Cherokee County
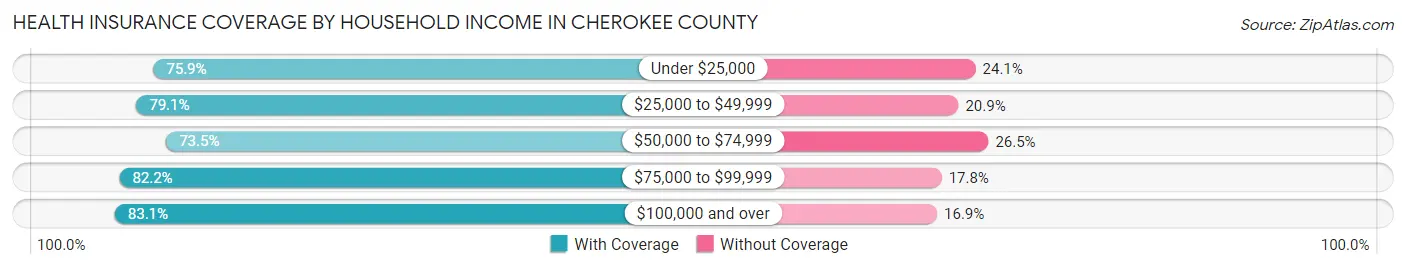
| Household Income | With Coverage | Without Coverage |
| Under $25,000 | 5,005 (75.9%) | 1,592 (24.1%) |
| $25,000 to $49,999 | 8,970 (79.1%) | 2,374 (20.9%) |
| $50,000 to $74,999 | 6,712 (73.5%) | 2,425 (26.5%) |
| $75,000 to $99,999 | 4,699 (82.2%) | 1,016 (17.8%) |
| $100,000 and over | 12,116 (83.1%) | 2,468 (16.9%) |
Public vs Private Health Insurance Coverage by Age in Cherokee County
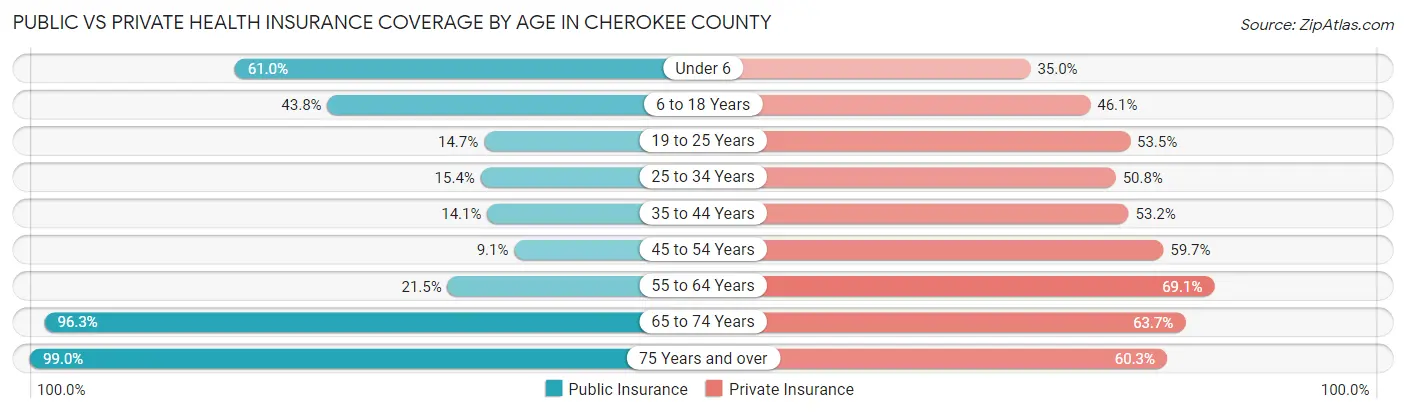
| Age Bracket | Public Insurance | Private Insurance |
| Under 6 | 2,380 (61.0%) | 1,367 (35.0%) |
| 6 to 18 Years | 4,107 (43.8%) | 4,326 (46.1%) |
| 19 to 25 Years | 652 (14.7%) | 2,369 (53.5%) |
| 25 to 34 Years | 762 (15.3%) | 2,523 (50.8%) |
| 35 to 44 Years | 762 (14.1%) | 2,873 (53.2%) |
| 45 to 54 Years | 519 (9.1%) | 3,402 (59.7%) |
| 55 to 64 Years | 1,185 (21.5%) | 3,812 (69.1%) |
| 65 to 74 Years | 4,801 (96.3%) | 3,177 (63.7%) |
| 75 Years and over | 3,377 (99.0%) | 2,058 (60.3%) |
| Total | 18,545 (38.9%) | 25,907 (54.3%) |
Disability Status by Sex by Age in Cherokee County
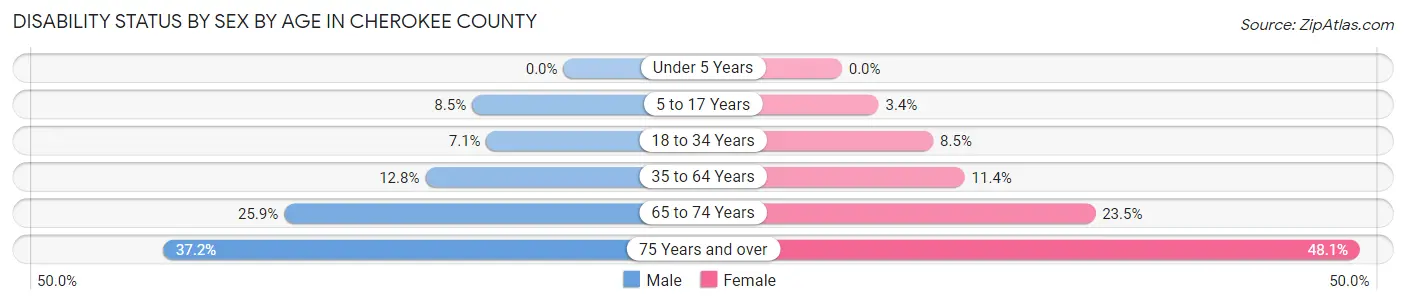
| Age Bracket | Male | Female |
| Under 5 Years | 0 (0.0%) | 0 (0.0%) |
| 5 to 17 Years | 409 (8.5%) | 156 (3.4%) |
| 18 to 34 Years | 353 (7.1%) | 411 (8.5%) |
| 35 to 64 Years | 1,028 (12.8%) | 980 (11.4%) |
| 65 to 74 Years | 580 (25.9%) | 646 (23.5%) |
| 75 Years and over | 599 (37.2%) | 865 (48.1%) |
Disability Class by Sex by Age in Cherokee County
Disability Class: Hearing Difficulty
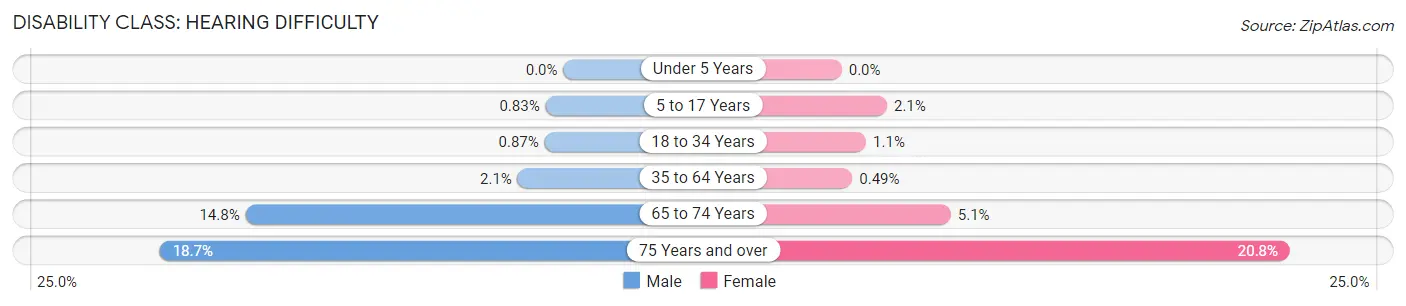
| Age Bracket | Male | Female |
| Under 5 Years | 0 (0.0%) | 0 (0.0%) |
| 5 to 17 Years | 40 (0.8%) | 96 (2.1%) |
| 18 to 34 Years | 43 (0.9%) | 55 (1.1%) |
| 35 to 64 Years | 170 (2.1%) | 42 (0.5%) |
| 65 to 74 Years | 330 (14.7%) | 139 (5.1%) |
| 75 Years and over | 302 (18.7%) | 374 (20.8%) |
Disability Class: Vision Difficulty
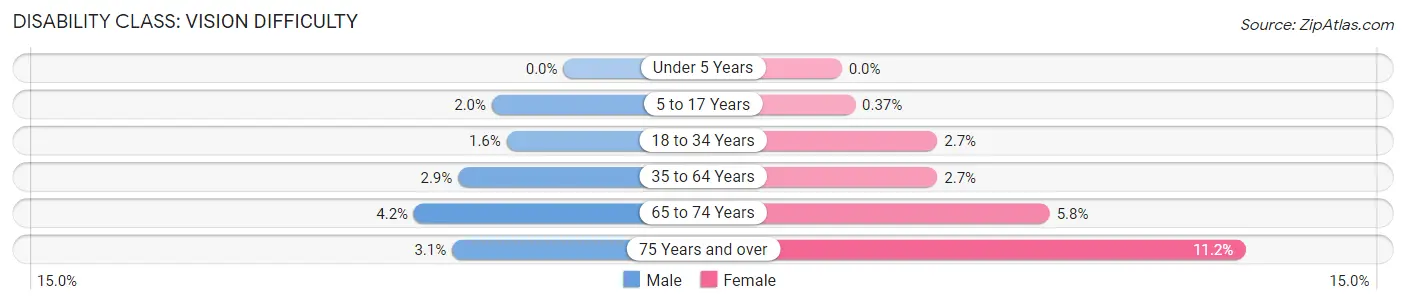
| Age Bracket | Male | Female |
| Under 5 Years | 0 (0.0%) | 0 (0.0%) |
| 5 to 17 Years | 96 (2.0%) | 17 (0.4%) |
| 18 to 34 Years | 78 (1.6%) | 129 (2.7%) |
| 35 to 64 Years | 235 (2.9%) | 229 (2.7%) |
| 65 to 74 Years | 93 (4.2%) | 159 (5.8%) |
| 75 Years and over | 50 (3.1%) | 202 (11.2%) |
Disability Class: Cognitive Difficulty
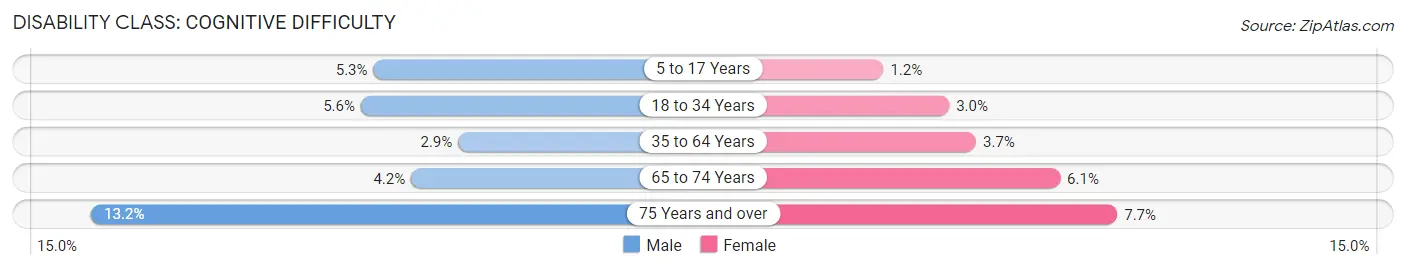
| Age Bracket | Male | Female |
| 5 to 17 Years | 255 (5.3%) | 53 (1.2%) |
| 18 to 34 Years | 279 (5.6%) | 145 (3.0%) |
| 35 to 64 Years | 235 (2.9%) | 321 (3.7%) |
| 65 to 74 Years | 95 (4.2%) | 167 (6.1%) |
| 75 Years and over | 212 (13.2%) | 138 (7.7%) |
Disability Class: Ambulatory Difficulty
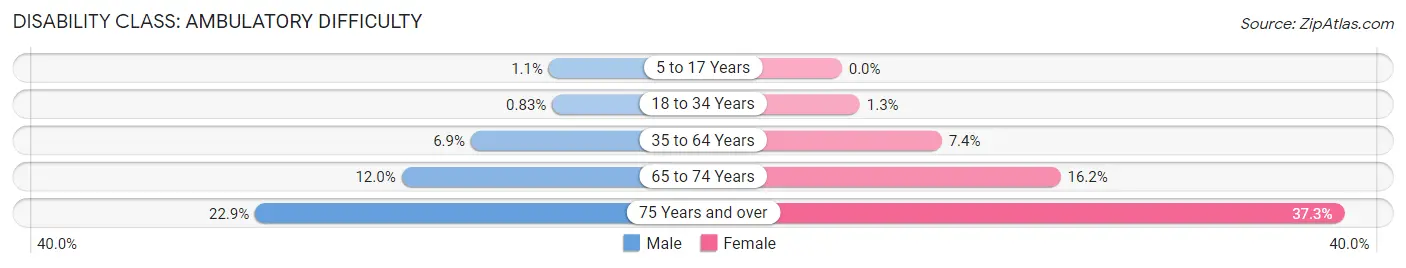
| Age Bracket | Male | Female |
| 5 to 17 Years | 52 (1.1%) | 0 (0.0%) |
| 18 to 34 Years | 41 (0.8%) | 65 (1.3%) |
| 35 to 64 Years | 551 (6.9%) | 638 (7.4%) |
| 65 to 74 Years | 269 (12.0%) | 446 (16.2%) |
| 75 Years and over | 369 (22.9%) | 671 (37.3%) |
Disability Class: Self-Care Difficulty
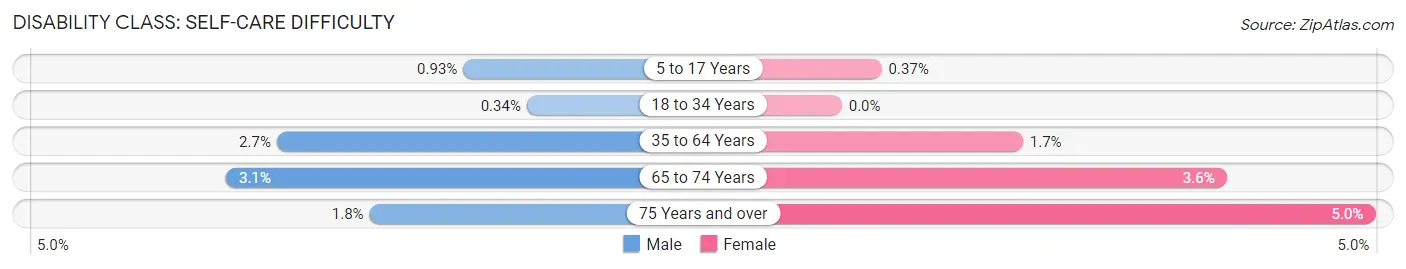
| Age Bracket | Male | Female |
| 5 to 17 Years | 45 (0.9%) | 17 (0.4%) |
| 18 to 34 Years | 17 (0.3%) | 0 (0.0%) |
| 35 to 64 Years | 213 (2.7%) | 144 (1.7%) |
| 65 to 74 Years | 70 (3.1%) | 98 (3.6%) |
| 75 Years and over | 29 (1.8%) | 89 (5.0%) |
Technology Access in Cherokee County
Computing Device Access in Cherokee County
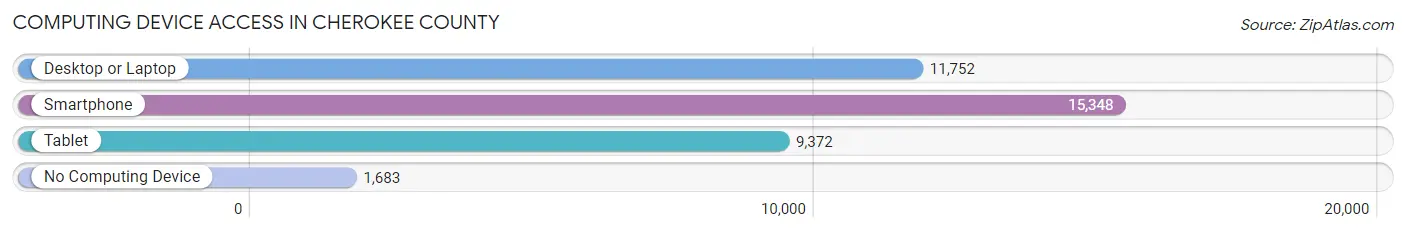
| Device Type | # Households | % Households |
| Desktop or Laptop | 11,752 | 65.0% |
| Smartphone | 15,348 | 84.9% |
| Tablet | 9,372 | 51.9% |
| No Computing Device | 1,683 | 9.3% |
| Total | 18,069 | 100.0% |
Internet Access in Cherokee County
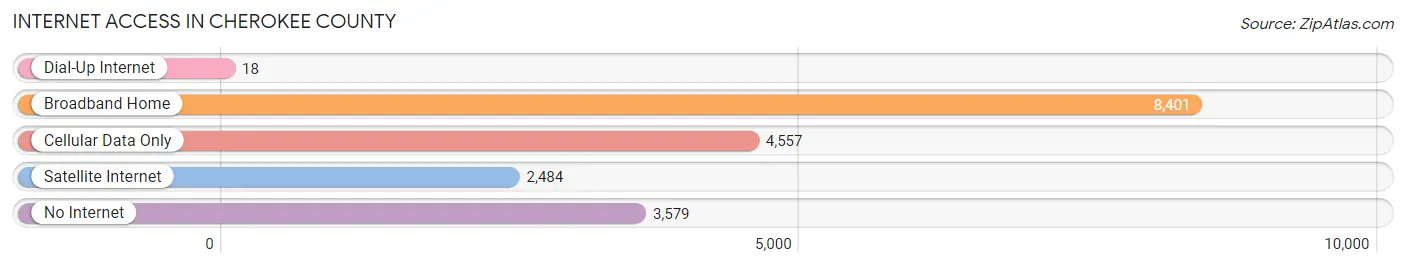
| Internet Type | # Households | % Households |
| Dial-Up Internet | 18 | 0.1% |
| Broadband Home | 8,401 | 46.5% |
| Cellular Data Only | 4,557 | 25.2% |
| Satellite Internet | 2,484 | 13.8% |
| No Internet | 3,579 | 19.8% |
| Total | 18,069 | 100.0% |
Cherokee County Summary
Cherokee County, Texas is located in the eastern part of the state, and is part of the Tyler-Longview-Marshall Metropolitan Statistical Area. It is bordered by Smith, Anderson, Henderson, and Rusk counties. The county seat is Rusk, and the largest city is Jacksonville. The county was named for the Cherokee Indians who once lived in the area.
Geography
Cherokee County covers an area of 890 square miles, and is mostly rural. The terrain is mostly flat, with some rolling hills in the northern part of the county. The county is drained by the Neches River, which flows through the western part of the county. The county is also home to several small lakes, including Lake Jacksonville, Lake Striker, and Lake Palestine. The climate is humid subtropical, with hot summers and mild winters.
Demographics
As of the 2010 census, the population of Cherokee County was 50,845. The racial makeup of the county was 79.2% White, 15.7% African American, 0.6% Native American, 0.7% Asian, 0.1% Pacific Islander, 2.3% from other races, and 1.4% from two or more races. Hispanic or Latino of any race were 6.3% of the population.
The median household income was $37,945, and the median family income was $45,945. The per capita income was $19,845. About 15.2% of the population was below the poverty line.
Economy
Cherokee County is largely rural, and the economy is based on agriculture and timber. The county is home to several large timber companies, including Weyerhaeuser and International Paper. The county is also home to several large poultry farms, and is a major producer of eggs.
The county is also home to several manufacturing companies, including a large paper mill in Jacksonville. The county is also home to several oil and gas companies, and is a major producer of oil and natural gas.
The county is home to several colleges and universities, including Jacksonville College, Texas A&M University-Commerce, and the University of Texas at Tyler.
Conclusion
Cherokee County, Texas is a rural county located in the eastern part of the state. It is home to several large timber and poultry farms, and is a major producer of oil and natural gas. The county is also home to several colleges and universities, and has a diverse economy.
Common Questions
What is Per Capita Income in Cherokee County?
Per Capita income in Cherokee County is $26,790.
What is the Median Family Income in Cherokee County?
Median Family Income in Cherokee County is $63,731.
What is the Median Household income in Cherokee County?
Median Household Income in Cherokee County is $56,971.
What is Income or Wage Gap in Cherokee County?
Income or Wage Gap in Cherokee County is 41.0%.
Women in Cherokee County earn 59.0 cents for every dollar earned by a man.
What is Family Income Deficit in Cherokee County?
Family Income Deficit in Cherokee County is $9,723.
Families that are below poverty line in Cherokee County earn $9,723 less on average than the poverty threshold level.
What is Inequality or Gini Index in Cherokee County?
Inequality or Gini Index in Cherokee County is 0.44.
What is the Total Population of Cherokee County?
Total Population of Cherokee County is 50,824.
What is the Total Male Population of Cherokee County?
Total Male Population of Cherokee County is 25,996.
What is the Total Female Population of Cherokee County?
Total Female Population of Cherokee County is 24,828.
What is the Ratio of Males per 100 Females in Cherokee County?
There are 104.70 Males per 100 Females in Cherokee County.
What is the Ratio of Females per 100 Males in Cherokee County?
There are 95.51 Females per 100 Males in Cherokee County.
What is the Median Population Age in Cherokee County?
Median Population Age in Cherokee County is 38.2 Years.
What is the Average Family Size in Cherokee County
Average Family Size in Cherokee County is 3.0 People.
What is the Average Household Size in Cherokee County
Average Household Size in Cherokee County is 2.6 People.
How Large is the Labor Force in Cherokee County?
There are 21,297 People in the Labor Forcein in Cherokee County.
What is the Percentage of People in the Labor Force in Cherokee County?
54.0% of People are in the Labor Force in Cherokee County.
What is the Unemployment Rate in Cherokee County?
Unemployment Rate in Cherokee County is 5.8%.