Chambers County, TX Map & Demographics
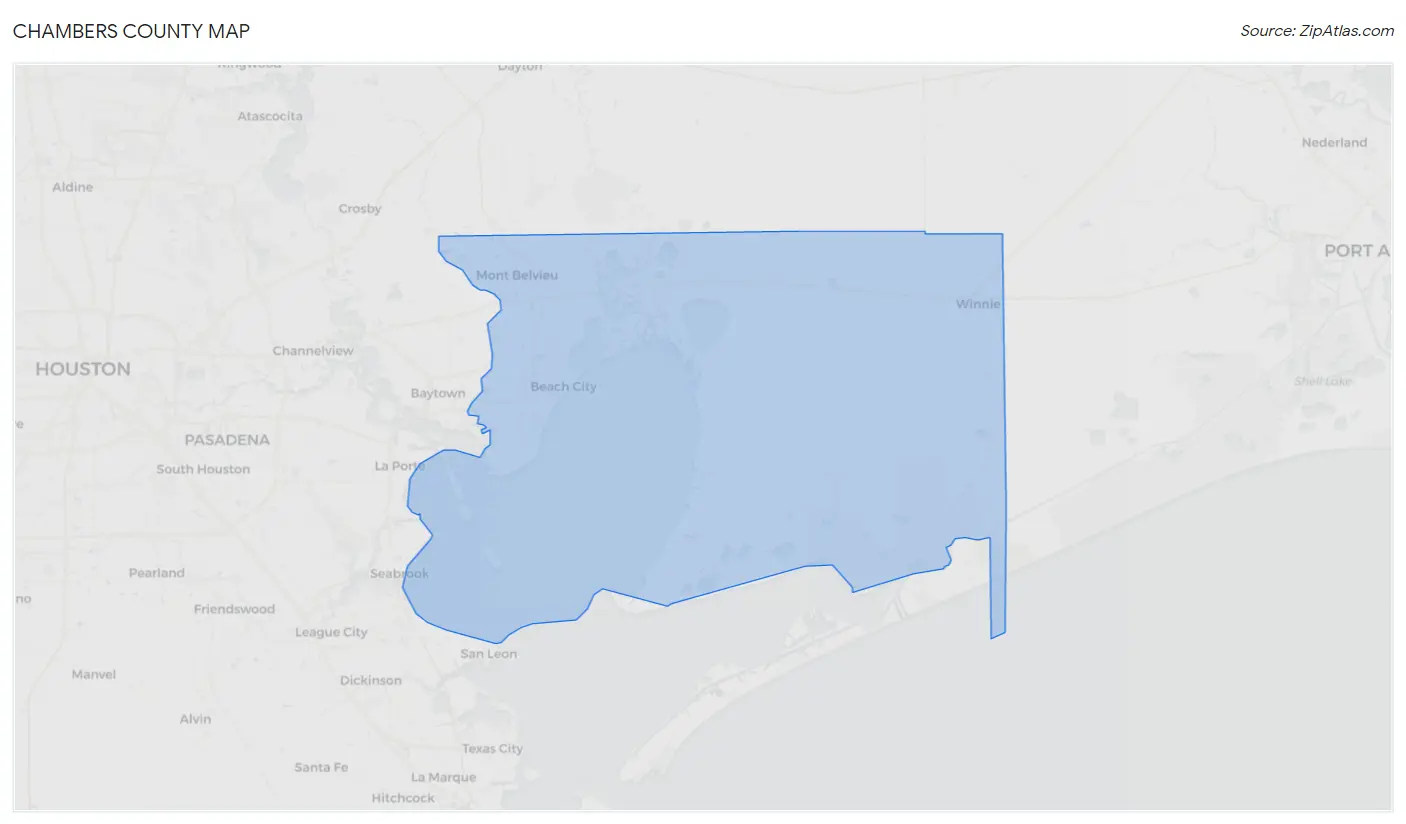
Chambers County Map
Chambers County Overview
$42,628
PER CAPITA INCOME
$130,195
AVG FAMILY INCOME
$106,103
AVG HOUSEHOLD INCOME
42.6%
WAGE / INCOME GAP [ % ]
57.4¢/ $1
WAGE / INCOME GAP [ $ ]
$14,339
FAMILY INCOME DEFICIT
0.42
INEQUALITY / GINI INDEX
47,037
TOTAL POPULATION
24,269
MALE POPULATION
22,768
FEMALE POPULATION
106.59
MALES / 100 FEMALES
93.82
FEMALES / 100 MALES
35.4
MEDIAN AGE
3.3
AVG FAMILY SIZE
3.0
AVG HOUSEHOLD SIZE
23,812
LABOR FORCE [ PEOPLE ]
67.0%
PERCENT IN LABOR FORCE
7.5%
UNEMPLOYMENT RATE
Income in Chambers County
Income Overview in Chambers County
Per Capita Income in Chambers County is $42,628, while median incomes of families and households are $130,195 and $106,103 respectively.
| Characteristic | Number | Measure |
| Per Capita Income | 47,037 | $42,628 |
| Median Family Income | 12,454 | $130,195 |
| Mean Family Income | 12,454 | $131,431 |
| Median Household Income | 15,744 | $106,103 |
| Mean Household Income | 15,744 | $123,951 |
| Income Deficit | 12,454 | $14,339 |
| Wage / Income Gap (%) | 47,037 | 42.61% |
| Wage / Income Gap ($) | 47,037 | 57.39¢ per $1 |
| Gini / Inequality Index | 47,037 | 0.42 |
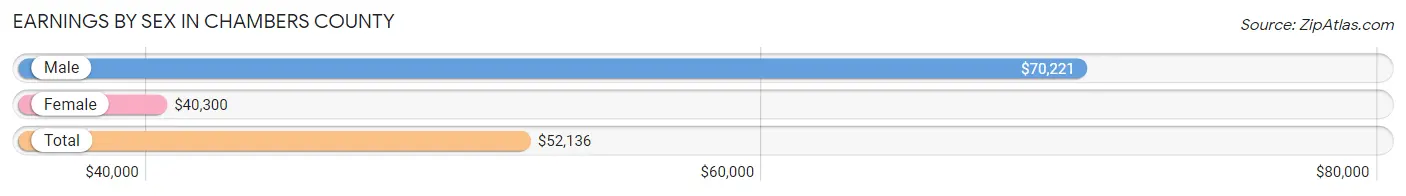
Earnings by Sex in Chambers County
Average Earnings in Chambers County are $52,136, $70,221 for men and $40,300 for women, a difference of 42.6%.
| Sex | Number | Average Earnings |
| Male | 14,049 (58.6%) | $70,221 |
| Female | 9,919 (41.4%) | $40,300 |
| Total | 23,968 (100.0%) | $52,136 |
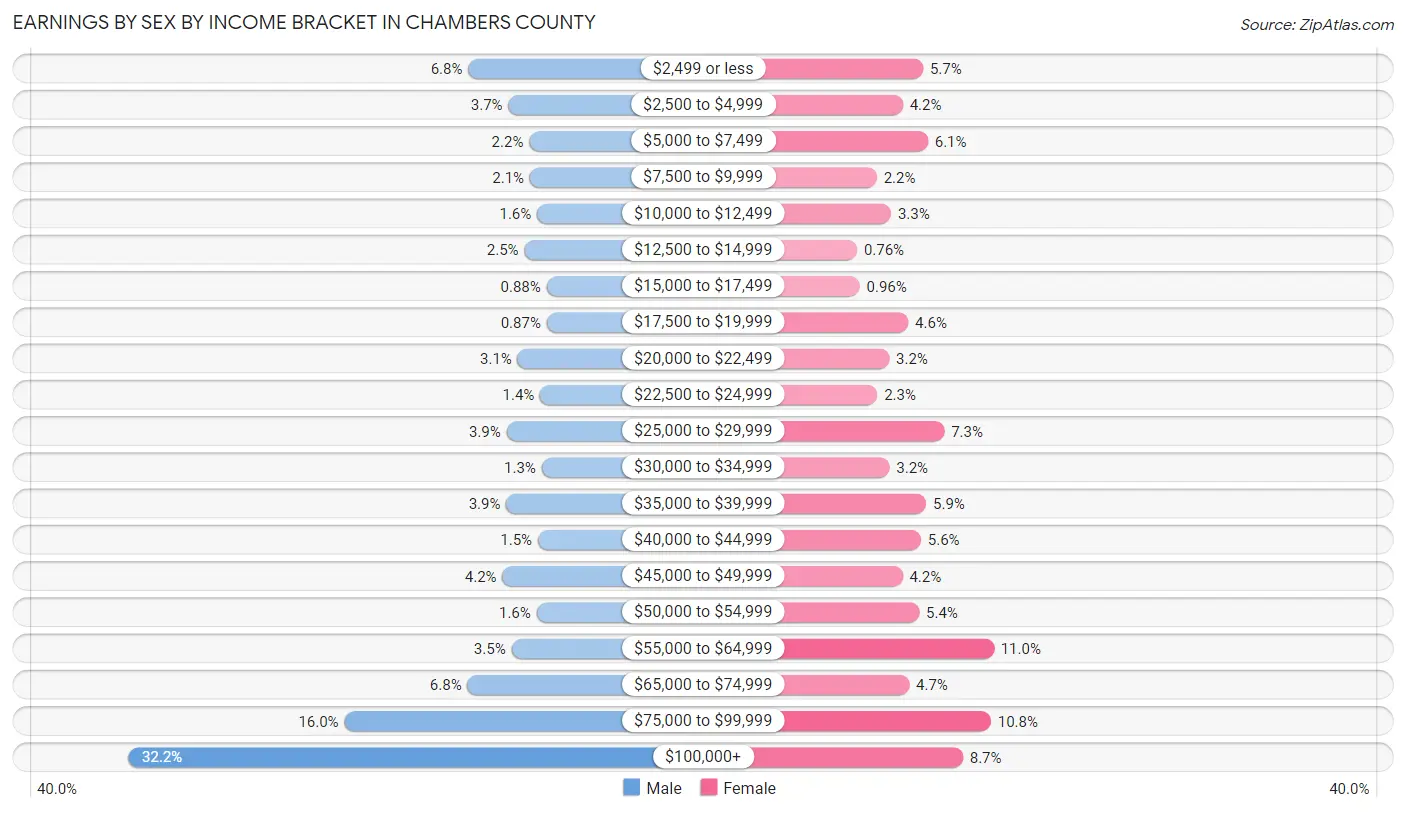
Earnings by Sex by Income Bracket in Chambers County
The most common earnings brackets in Chambers County are $100,000+ for men (4,521 | 32.2%) and $55,000 to $64,999 for women (1,092 | 11.0%).
| Income | Male | Female |
| $2,499 or less | 949 (6.8%) | 566 (5.7%) |
| $2,500 to $4,999 | 525 (3.7%) | 416 (4.2%) |
| $5,000 to $7,499 | 306 (2.2%) | 602 (6.1%) |
| $7,500 to $9,999 | 299 (2.1%) | 222 (2.2%) |
| $10,000 to $12,499 | 224 (1.6%) | 328 (3.3%) |
| $12,500 to $14,999 | 357 (2.5%) | 75 (0.8%) |
| $15,000 to $17,499 | 124 (0.9%) | 95 (1.0%) |
| $17,500 to $19,999 | 122 (0.9%) | 456 (4.6%) |
| $20,000 to $22,499 | 428 (3.0%) | 314 (3.2%) |
| $22,500 to $24,999 | 191 (1.4%) | 226 (2.3%) |
| $25,000 to $29,999 | 545 (3.9%) | 724 (7.3%) |
| $30,000 to $34,999 | 176 (1.3%) | 316 (3.2%) |
| $35,000 to $39,999 | 548 (3.9%) | 589 (5.9%) |
| $40,000 to $44,999 | 215 (1.5%) | 551 (5.6%) |
| $45,000 to $49,999 | 588 (4.2%) | 414 (4.2%) |
| $50,000 to $54,999 | 229 (1.6%) | 538 (5.4%) |
| $55,000 to $64,999 | 493 (3.5%) | 1,092 (11.0%) |
| $65,000 to $74,999 | 957 (6.8%) | 463 (4.7%) |
| $75,000 to $99,999 | 2,252 (16.0%) | 1,070 (10.8%) |
| $100,000+ | 4,521 (32.2%) | 862 (8.7%) |
| Total | 14,049 (100.0%) | 9,919 (100.0%) |
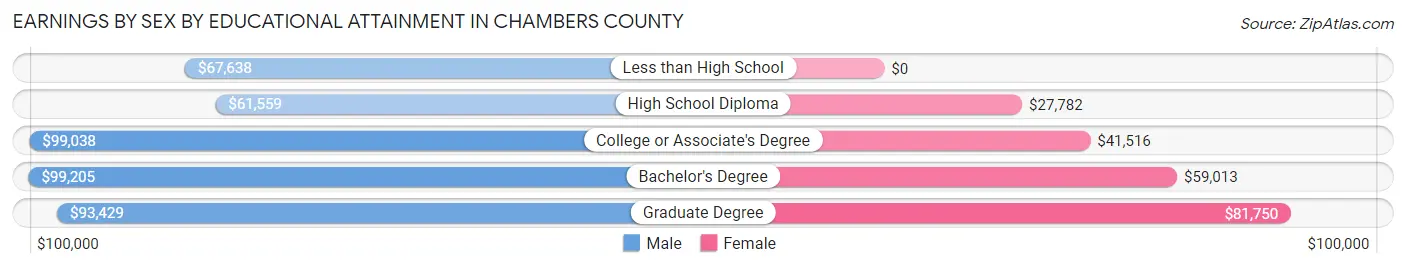
Earnings by Sex by Educational Attainment in Chambers County
Average earnings in Chambers County are $85,584 for men and $47,210 for women, a difference of 44.8%. Men with an educational attainment of bachelor's degree enjoy the highest average annual earnings of $99,205, while those with high school diploma education earn the least with $61,559. Women with an educational attainment of graduate degree earn the most with the average annual earnings of $81,750, while those with high school diploma education have the smallest earnings of $27,782.
| Educational Attainment | Male Income | Female Income |
| Less than High School | $67,638 | $0 |
| High School Diploma | $61,559 | $27,782 |
| College or Associate's Degree | $99,038 | $41,516 |
| Bachelor's Degree | $99,205 | $59,013 |
| Graduate Degree | $93,429 | $81,750 |
| Total | $85,584 | $47,210 |
Family Income in Chambers County
Family Income Brackets in Chambers County
According to the Chambers County family income data, there are 2,952 families falling into the $100,000 to $149,999 income range, which is the most common income bracket and makes up 23.7% of all families. Conversely, the $10,000 to $14,999 income bracket is the least frequent group with only 237 families (1.9%) belonging to this category.
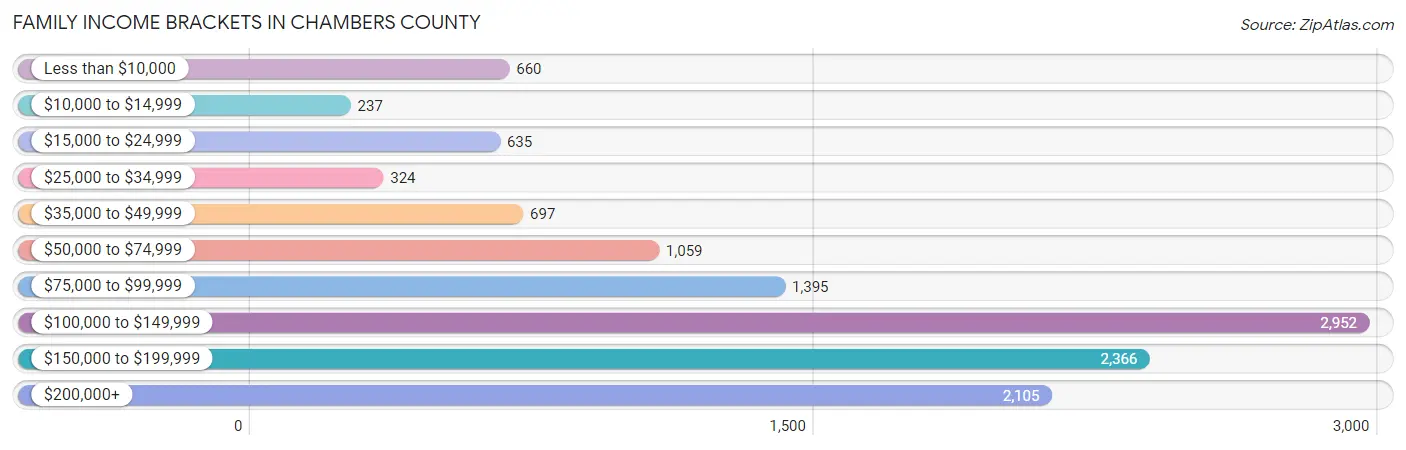
| Income Bracket | # Families | % Families |
| Less than $10,000 | 660 | 5.3% |
| $10,000 to $14,999 | 237 | 1.9% |
| $15,000 to $24,999 | 635 | 5.1% |
| $25,000 to $34,999 | 324 | 2.6% |
| $35,000 to $49,999 | 697 | 5.6% |
| $50,000 to $74,999 | 1,059 | 8.5% |
| $75,000 to $99,999 | 1,395 | 11.2% |
| $100,000 to $149,999 | 2,952 | 23.7% |
| $150,000 to $199,999 | 2,366 | 19.0% |
| $200,000+ | 2,105 | 16.9% |
Family Income by Famaliy Size in Chambers County
5-person families (1,132 | 9.1%) account for the highest median family income in Chambers County with $150,426 per family, while 2-person families (5,019 | 40.3%) have the highest median income of $50,984 per family member.
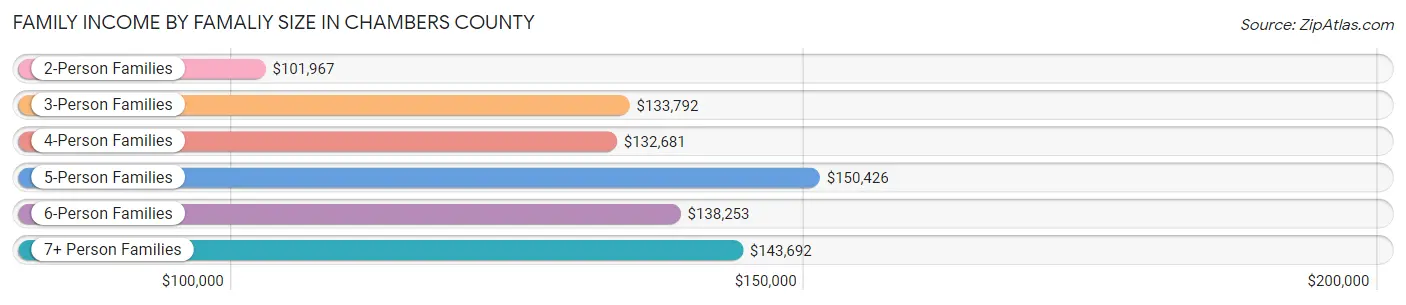
| Income Bracket | # Families | Median Income |
| 2-Person Families | 5,019 (40.3%) | $101,967 |
| 3-Person Families | 2,825 (22.7%) | $133,792 |
| 4-Person Families | 2,963 (23.8%) | $132,681 |
| 5-Person Families | 1,132 (9.1%) | $150,426 |
| 6-Person Families | 413 (3.3%) | $138,253 |
| 7+ Person Families | 102 (0.8%) | $143,692 |
| Total | 12,454 (100.0%) | $130,195 |
Family Income by Number of Earners in Chambers County
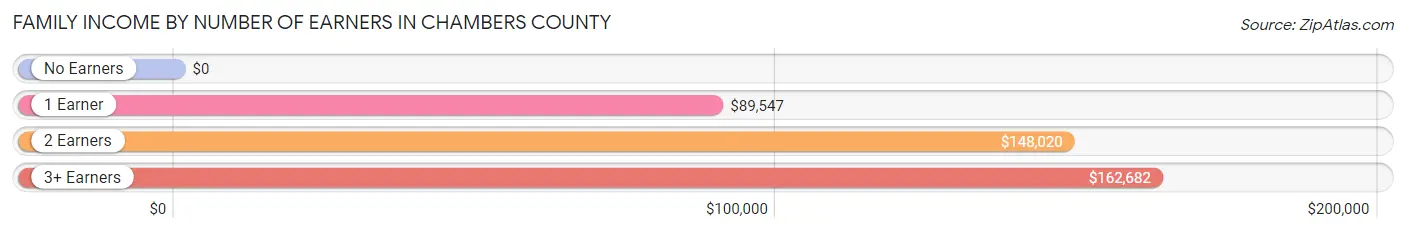
| Number of Earners | # Families | Median Income |
| No Earners | 2,072 (16.6%) | $0 |
| 1 Earner | 3,843 (30.9%) | $89,547 |
| 2 Earners | 4,915 (39.5%) | $148,020 |
| 3+ Earners | 1,624 (13.0%) | $162,682 |
| Total | 12,454 (100.0%) | $130,195 |
Household Income in Chambers County
Household Income Brackets in Chambers County
With 3,259 households falling in the category, the $100,000 to $149,999 income range is the most frequent in Chambers County, accounting for 20.7% of all households. In contrast, only 520 households (3.3%) fall into the less than $10,000 income bracket, making it the least populous group.
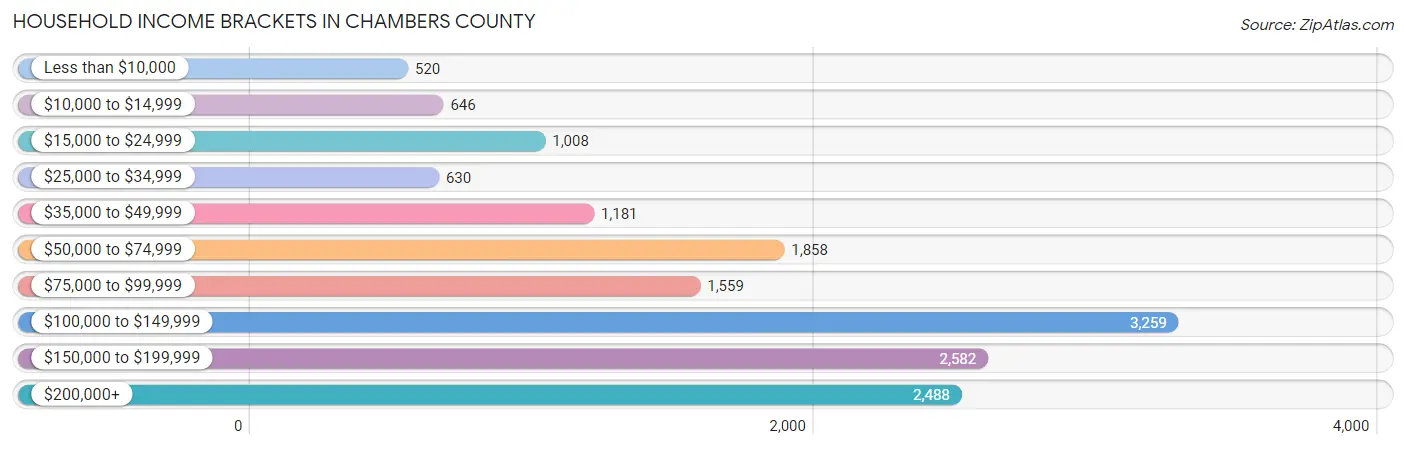
| Income Bracket | # Households | % Households |
| Less than $10,000 | 520 | 3.3% |
| $10,000 to $14,999 | 646 | 4.1% |
| $15,000 to $24,999 | 1,008 | 6.4% |
| $25,000 to $34,999 | 630 | 4.0% |
| $35,000 to $49,999 | 1,181 | 7.5% |
| $50,000 to $74,999 | 1,858 | 11.8% |
| $75,000 to $99,999 | 1,559 | 9.9% |
| $100,000 to $149,999 | 3,259 | 20.7% |
| $150,000 to $199,999 | 2,582 | 16.4% |
| $200,000+ | 2,488 | 15.8% |
Household Income by Householder Age in Chambers County
The median household income in Chambers County is $106,103, with the highest median household income of $132,039 found in the 25 to 44 years age bracket for the primary householder. A total of 6,268 households (39.8%) fall into this category. Meanwhile, the 65+ years age bracket for the primary householder has the lowest median household income of $68,080, with 3,263 households (20.7%) in this group.
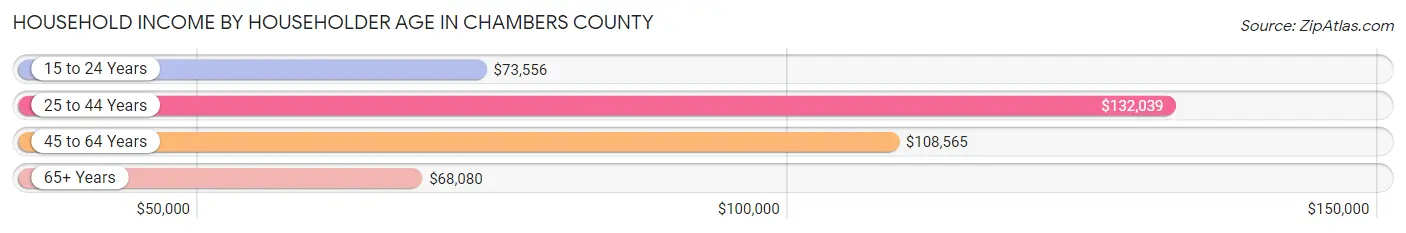
| Income Bracket | # Households | Median Income |
| 15 to 24 Years | 239 (1.5%) | $73,556 |
| 25 to 44 Years | 6,268 (39.8%) | $132,039 |
| 45 to 64 Years | 5,974 (37.9%) | $108,565 |
| 65+ Years | 3,263 (20.7%) | $68,080 |
| Total | 15,744 (100.0%) | $106,103 |
Poverty in Chambers County
Income Below Poverty by Sex and Age in Chambers County
With 13.0% poverty level for males and 14.5% for females among the residents of Chambers County, 15 year old males and 5 year old females are the most vulnerable to poverty, with 117 males (25.8%) and 276 females (38.0%) in their respective age groups living below the poverty level.
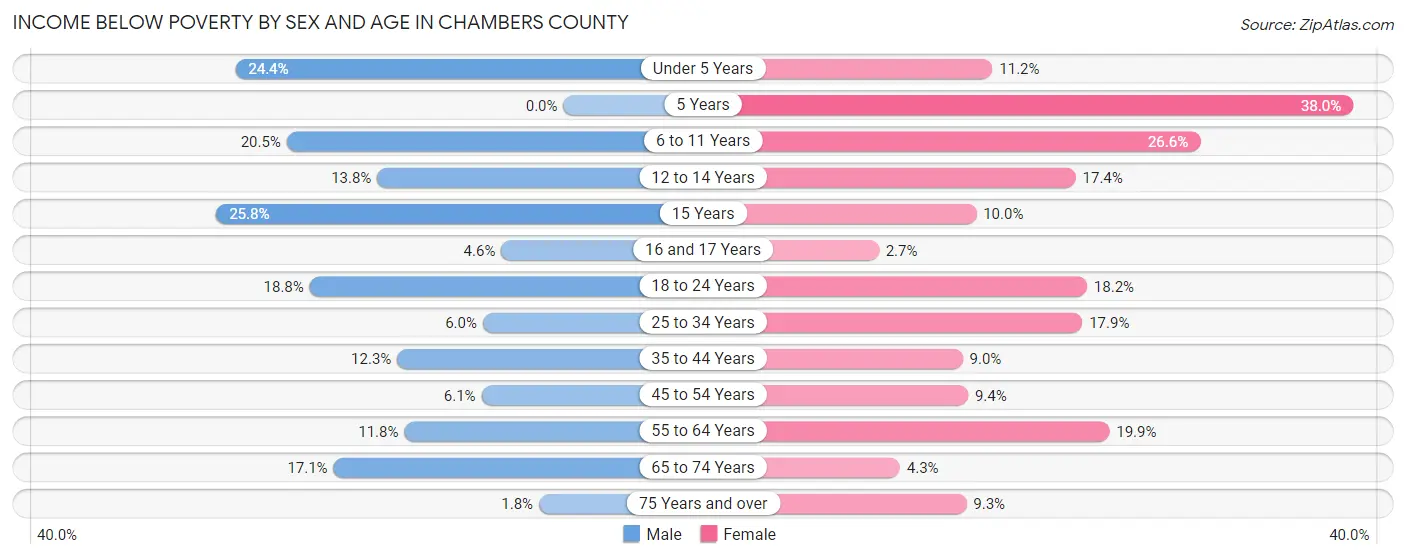
| Age Bracket | Male | Female |
| Under 5 Years | 392 (24.3%) | 165 (11.2%) |
| 5 Years | 0 (0.0%) | 276 (38.0%) |
| 6 to 11 Years | 489 (20.5%) | 497 (26.6%) |
| 12 to 14 Years | 207 (13.8%) | 141 (17.4%) |
| 15 Years | 117 (25.8%) | 41 (10.0%) |
| 16 and 17 Years | 29 (4.6%) | 20 (2.7%) |
| 18 to 24 Years | 424 (18.8%) | 363 (18.2%) |
| 25 to 34 Years | 177 (6.0%) | 550 (17.8%) |
| 35 to 44 Years | 423 (12.3%) | 313 (9.0%) |
| 45 to 54 Years | 188 (6.1%) | 284 (9.4%) |
| 55 to 64 Years | 319 (11.8%) | 469 (19.9%) |
| 65 to 74 Years | 346 (17.1%) | 76 (4.3%) |
| 75 Years and over | 15 (1.8%) | 85 (9.2%) |
| Total | 3,126 (13.0%) | 3,280 (14.5%) |
Income Above Poverty by Sex and Age in Chambers County
According to the poverty statistics in Chambers County, males aged 5 years and females aged 16 and 17 years are the age groups that are most secure financially, with 100.0% of males and 97.3% of females in these age groups living above the poverty line.
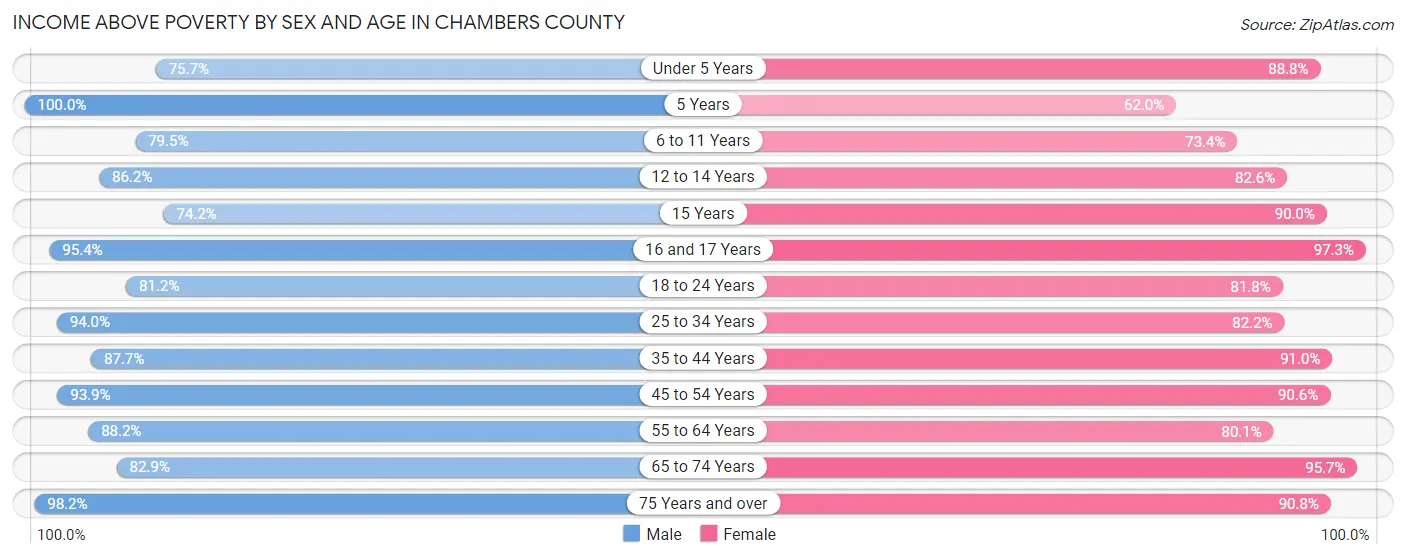
| Age Bracket | Male | Female |
| Under 5 Years | 1,218 (75.6%) | 1,311 (88.8%) |
| 5 Years | 222 (100.0%) | 451 (62.0%) |
| 6 to 11 Years | 1,892 (79.5%) | 1,372 (73.4%) |
| 12 to 14 Years | 1,291 (86.2%) | 671 (82.6%) |
| 15 Years | 337 (74.2%) | 370 (90.0%) |
| 16 and 17 Years | 600 (95.4%) | 710 (97.3%) |
| 18 to 24 Years | 1,826 (81.2%) | 1,632 (81.8%) |
| 25 to 34 Years | 2,782 (94.0%) | 2,532 (82.2%) |
| 35 to 44 Years | 3,006 (87.7%) | 3,177 (91.0%) |
| 45 to 54 Years | 2,902 (93.9%) | 2,748 (90.6%) |
| 55 to 64 Years | 2,383 (88.2%) | 1,893 (80.1%) |
| 65 to 74 Years | 1,681 (82.9%) | 1,688 (95.7%) |
| 75 Years and over | 816 (98.2%) | 834 (90.7%) |
| Total | 20,956 (87.0%) | 19,389 (85.5%) |
Income Below Poverty Among Married-Couple Families in Chambers County
The poverty statistics for married-couple families in Chambers County show that 6.3% or 623 of the total 9,889 families live below the poverty line. Families with 3 or 4 children have the highest poverty rate of 10.1%, comprising of 78 families. On the other hand, families with 5 or more children have the lowest poverty rate of 0.0%, which includes 0 families.
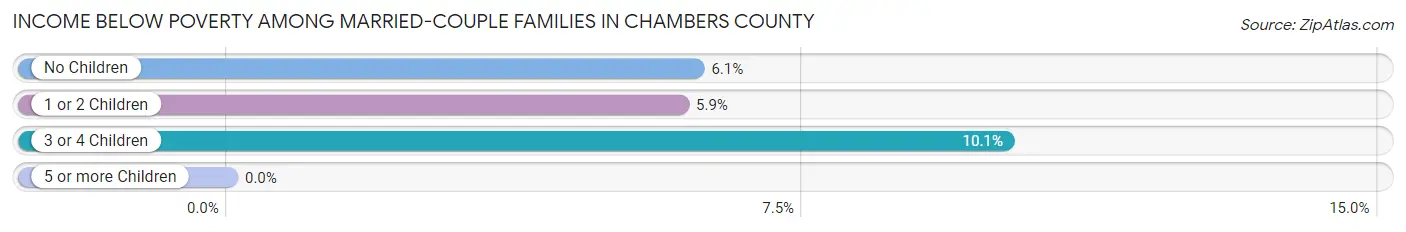
| Children | Above Poverty | Below Poverty |
| No Children | 4,676 (93.9%) | 303 (6.1%) |
| 1 or 2 Children | 3,867 (94.1%) | 242 (5.9%) |
| 3 or 4 Children | 691 (89.9%) | 78 (10.1%) |
| 5 or more Children | 32 (100.0%) | 0 (0.0%) |
| Total | 9,266 (93.7%) | 623 (6.3%) |
Income Below Poverty Among Single-Parent Households in Chambers County
According to the poverty data in Chambers County, 12.6% or 118 single-father households and 44.0% or 716 single-mother households are living below the poverty line. Among single-father households, those with 3 or 4 children have the highest poverty rate, with 14 households (19.7%) experiencing poverty. Likewise, among single-mother households, those with 3 or 4 children have the highest poverty rate, with 298 households (87.6%) falling below the poverty line.
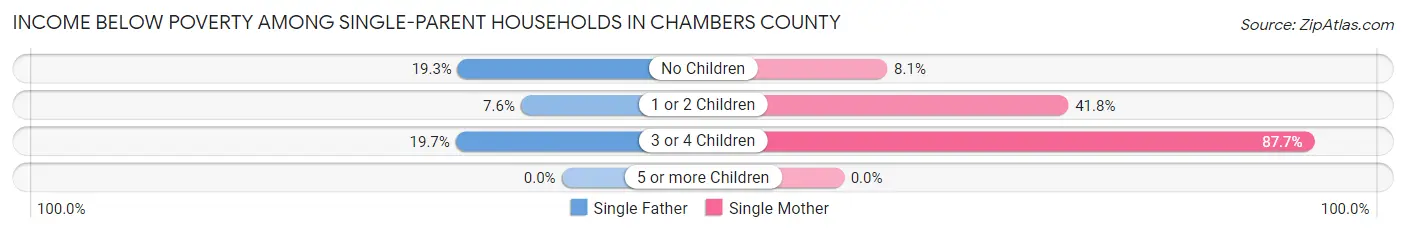
| Children | Single Father | Single Mother |
| No Children | 63 (19.3%) | 29 (8.1%) |
| 1 or 2 Children | 41 (7.6%) | 389 (41.8%) |
| 3 or 4 Children | 14 (19.7%) | 298 (87.6%) |
| 5 or more Children | 0 (0.0%) | 0 (0.0%) |
| Total | 118 (12.6%) | 716 (44.0%) |
Income Below Poverty Among Married-Couple vs Single-Parent Households in Chambers County
The poverty data for Chambers County shows that 623 of the married-couple family households (6.3%) and 834 of the single-parent households (32.5%) are living below the poverty level. Within the married-couple family households, those with 3 or 4 children have the highest poverty rate, with 78 households (10.1%) falling below the poverty line. Among the single-parent households, those with 3 or 4 children have the highest poverty rate, with 312 household (75.9%) living below poverty.
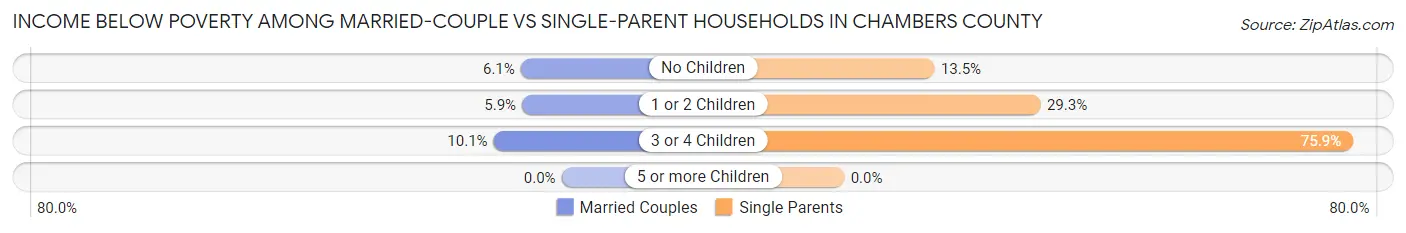
| Children | Married-Couple Families | Single-Parent Households |
| No Children | 303 (6.1%) | 92 (13.5%) |
| 1 or 2 Children | 242 (5.9%) | 430 (29.2%) |
| 3 or 4 Children | 78 (10.1%) | 312 (75.9%) |
| 5 or more Children | 0 (0.0%) | 0 (0.0%) |
| Total | 623 (6.3%) | 834 (32.5%) |
Race in Chambers County
The most populous races in Chambers County are White / Caucasian (35,262 | 75.0%), Hispanic or Latino (11,860 | 25.2%), and Some other Race (3,945 | 8.4%).
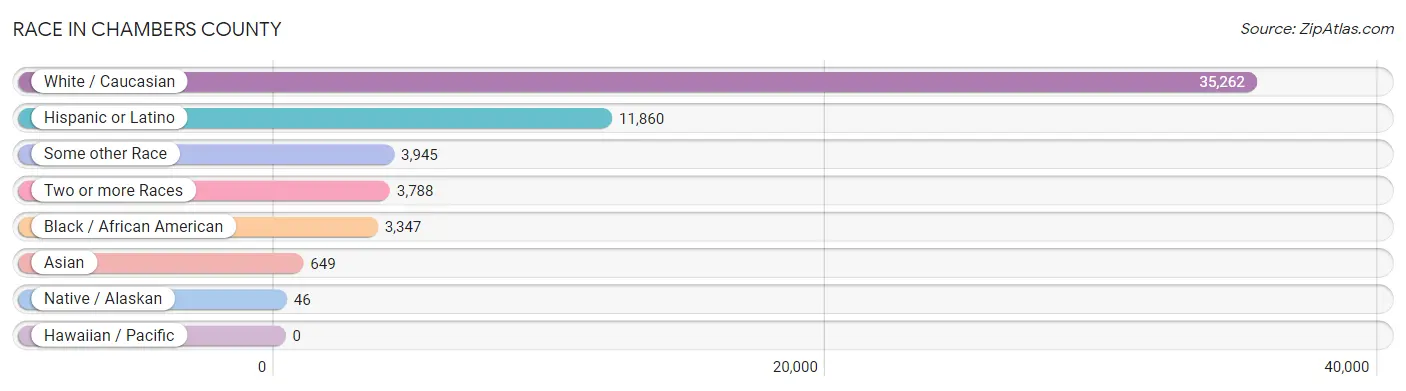
| Race | # Population | % Population |
| Asian | 649 | 1.4% |
| Black / African American | 3,347 | 7.1% |
| Hawaiian / Pacific | 0 | 0.0% |
| Hispanic or Latino | 11,860 | 25.2% |
| Native / Alaskan | 46 | 0.1% |
| White / Caucasian | 35,262 | 75.0% |
| Two or more Races | 3,788 | 8.1% |
| Some other Race | 3,945 | 8.4% |
| Total | 47,037 | 100.0% |
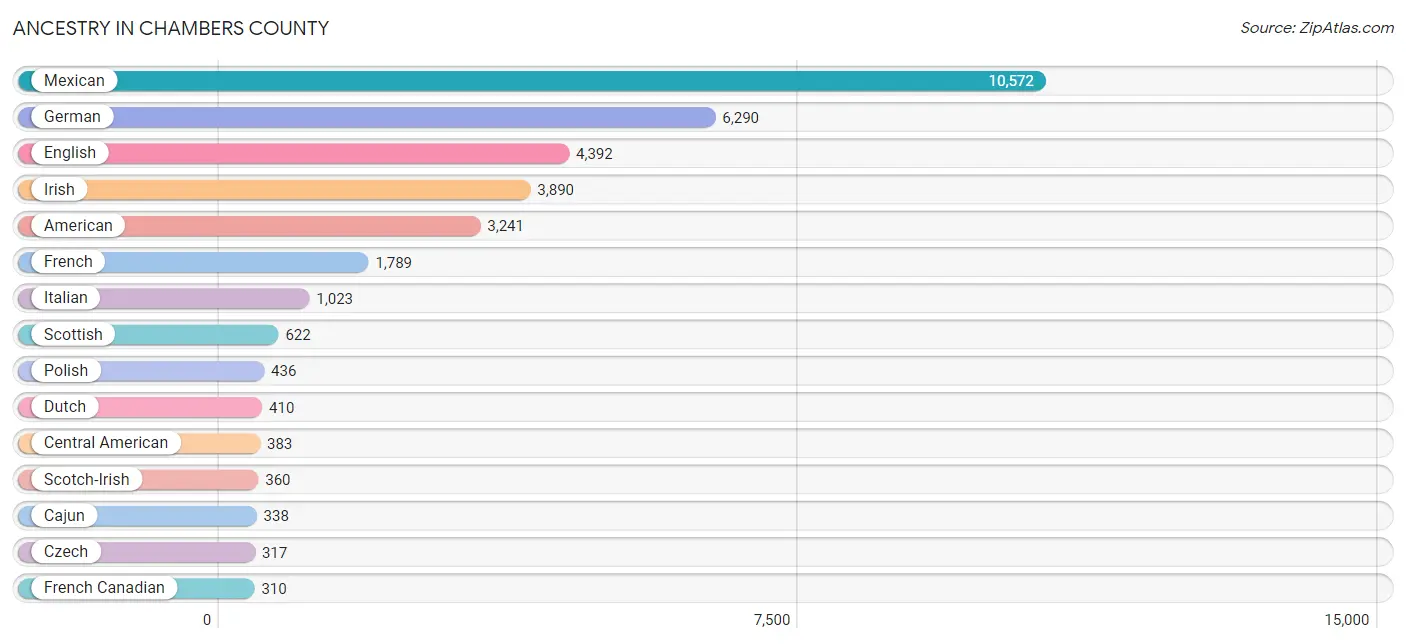
Ancestry in Chambers County
The most populous ancestries reported in Chambers County are Mexican (10,572 | 22.5%), German (6,290 | 13.4%), English (4,392 | 9.3%), Irish (3,890 | 8.3%), and American (3,241 | 6.9%), together accounting for 60.3% of all Chambers County residents.
| Ancestry | # Population | % Population |
| African | 48 | 0.1% |
| Alsatian | 12 | 0.0% |
| American | 3,241 | 6.9% |
| Arab | 80 | 0.2% |
| Austrian | 109 | 0.2% |
| Blackfeet | 8 | 0.0% |
| Bolivian | 58 | 0.1% |
| British | 107 | 0.2% |
| Cajun | 338 | 0.7% |
| Canadian | 12 | 0.0% |
| Central American | 383 | 0.8% |
| Cherokee | 113 | 0.2% |
| Cheyenne | 38 | 0.1% |
| Choctaw | 41 | 0.1% |
| Czech | 317 | 0.7% |
| Czechoslovakian | 13 | 0.0% |
| Danish | 110 | 0.2% |
| Dominican | 116 | 0.3% |
| Dutch | 410 | 0.9% |
| Eastern European | 75 | 0.2% |
| English | 4,392 | 9.3% |
| Estonian | 20 | 0.0% |
| European | 287 | 0.6% |
| Finnish | 99 | 0.2% |
| French | 1,789 | 3.8% |
| French Canadian | 310 | 0.7% |
| German | 6,290 | 13.4% |
| Greek | 112 | 0.2% |
| Guatemalan | 144 | 0.3% |
| Honduran | 214 | 0.4% |
| Hungarian | 13 | 0.0% |
| Indian (Asian) | 66 | 0.1% |
| Iranian | 52 | 0.1% |
| Irish | 3,890 | 8.3% |
| Italian | 1,023 | 2.2% |
| Japanese | 8 | 0.0% |
| Korean | 144 | 0.3% |
| Latvian | 20 | 0.0% |
| Lebanese | 60 | 0.1% |
| Malaysian | 103 | 0.2% |
| Mexican | 10,572 | 22.5% |
| Northern European | 15 | 0.0% |
| Norwegian | 240 | 0.5% |
| Peruvian | 221 | 0.5% |
| Polish | 436 | 0.9% |
| Portuguese | 12 | 0.0% |
| Puerto Rican | 64 | 0.1% |
| Russian | 9 | 0.0% |
| Salvadoran | 25 | 0.1% |
| Scandinavian | 119 | 0.3% |
| Scotch-Irish | 360 | 0.8% |
| Scottish | 622 | 1.3% |
| Sioux | 6 | 0.0% |
| Slovene | 5 | 0.0% |
| South American | 279 | 0.6% |
| Spaniard | 167 | 0.4% |
| Spanish | 64 | 0.1% |
| Sri Lankan | 143 | 0.3% |
| Subsaharan African | 48 | 0.1% |
| Swedish | 145 | 0.3% |
| Thai | 82 | 0.2% |
| Trinidadian and Tobagonian | 102 | 0.2% |
| U.S. Virgin Islander | 76 | 0.2% |
| Welsh | 263 | 0.6% |
| Yugoslavian | 33 | 0.1% | View All 65 Rows |
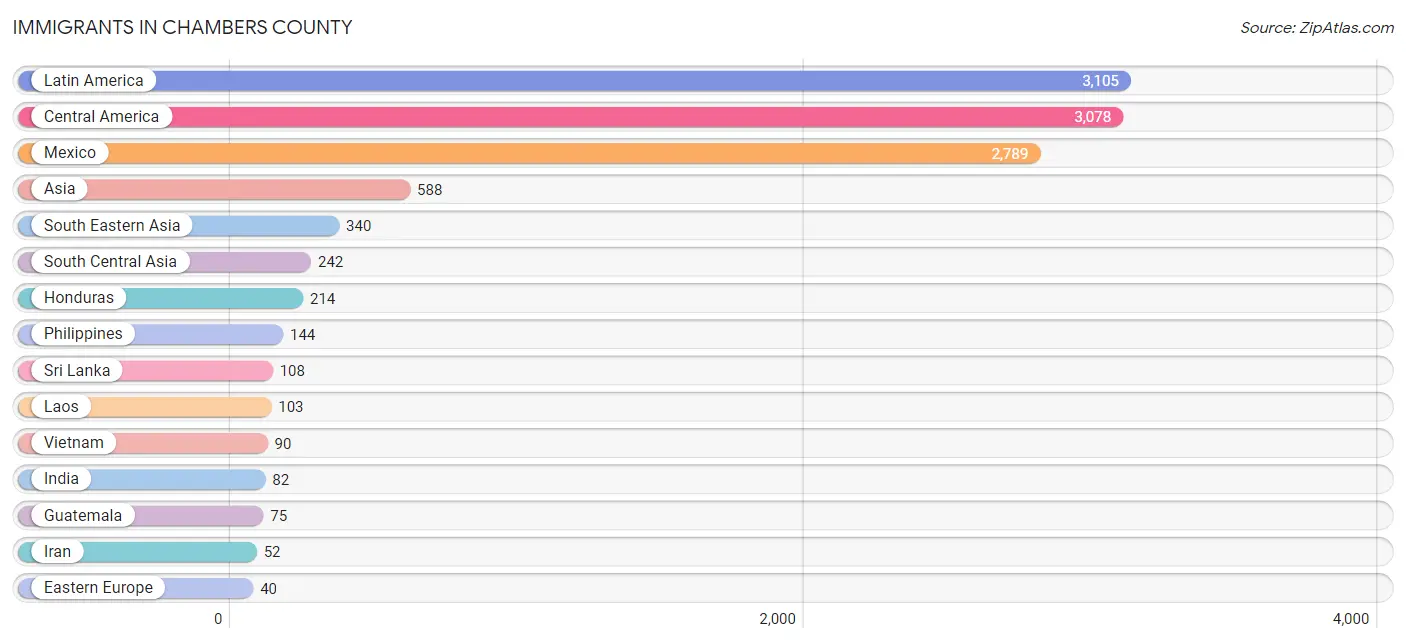
Immigrants in Chambers County
The most numerous immigrant groups reported in Chambers County came from Latin America (3,105 | 6.6%), Central America (3,078 | 6.5%), Mexico (2,789 | 5.9%), Asia (588 | 1.3%), and South Eastern Asia (340 | 0.7%), together accounting for 21.0% of all Chambers County residents.
| Immigration Origin | # Population | % Population |
| Asia | 588 | 1.3% |
| Cambodia | 3 | 0.0% |
| Canada | 33 | 0.1% |
| Caribbean | 27 | 0.1% |
| Central America | 3,078 | 6.5% |
| Dominican Republic | 27 | 0.1% |
| Eastern Europe | 40 | 0.1% |
| Europe | 40 | 0.1% |
| Guatemala | 75 | 0.2% |
| Honduras | 214 | 0.4% |
| India | 82 | 0.2% |
| Iran | 52 | 0.1% |
| Laos | 103 | 0.2% |
| Latin America | 3,105 | 6.6% |
| Latvia | 20 | 0.0% |
| Mexico | 2,789 | 5.9% |
| Philippines | 144 | 0.3% |
| Saudi Arabia | 6 | 0.0% |
| South Central Asia | 242 | 0.5% |
| South Eastern Asia | 340 | 0.7% |
| Sri Lanka | 108 | 0.2% |
| Vietnam | 90 | 0.2% |
| Western Asia | 6 | 0.0% | View All 23 Rows |
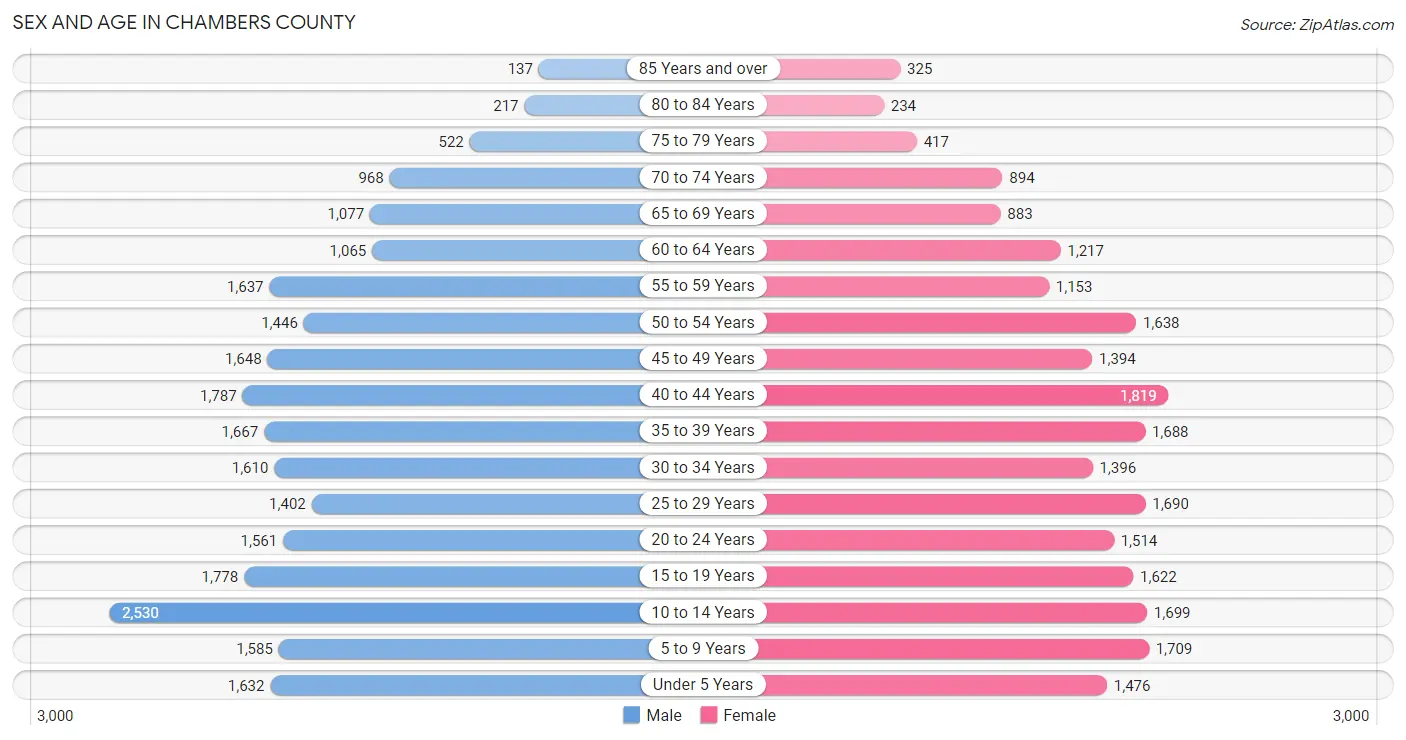
Sex and Age in Chambers County
Sex and Age in Chambers County
The most populous age groups in Chambers County are 10 to 14 Years (2,530 | 10.4%) for men and 40 to 44 Years (1,819 | 8.0%) for women.
| Age Bracket | Male | Female |
| Under 5 Years | 1,632 (6.7%) | 1,476 (6.5%) |
| 5 to 9 Years | 1,585 (6.5%) | 1,709 (7.5%) |
| 10 to 14 Years | 2,530 (10.4%) | 1,699 (7.5%) |
| 15 to 19 Years | 1,778 (7.3%) | 1,622 (7.1%) |
| 20 to 24 Years | 1,561 (6.4%) | 1,514 (6.7%) |
| 25 to 29 Years | 1,402 (5.8%) | 1,690 (7.4%) |
| 30 to 34 Years | 1,610 (6.6%) | 1,396 (6.1%) |
| 35 to 39 Years | 1,667 (6.9%) | 1,688 (7.4%) |
| 40 to 44 Years | 1,787 (7.4%) | 1,819 (8.0%) |
| 45 to 49 Years | 1,648 (6.8%) | 1,394 (6.1%) |
| 50 to 54 Years | 1,446 (6.0%) | 1,638 (7.2%) |
| 55 to 59 Years | 1,637 (6.8%) | 1,153 (5.1%) |
| 60 to 64 Years | 1,065 (4.4%) | 1,217 (5.3%) |
| 65 to 69 Years | 1,077 (4.4%) | 883 (3.9%) |
| 70 to 74 Years | 968 (4.0%) | 894 (3.9%) |
| 75 to 79 Years | 522 (2.1%) | 417 (1.8%) |
| 80 to 84 Years | 217 (0.9%) | 234 (1.0%) |
| 85 Years and over | 137 (0.6%) | 325 (1.4%) |
| Total | 24,269 (100.0%) | 22,768 (100.0%) |
Families and Households in Chambers County
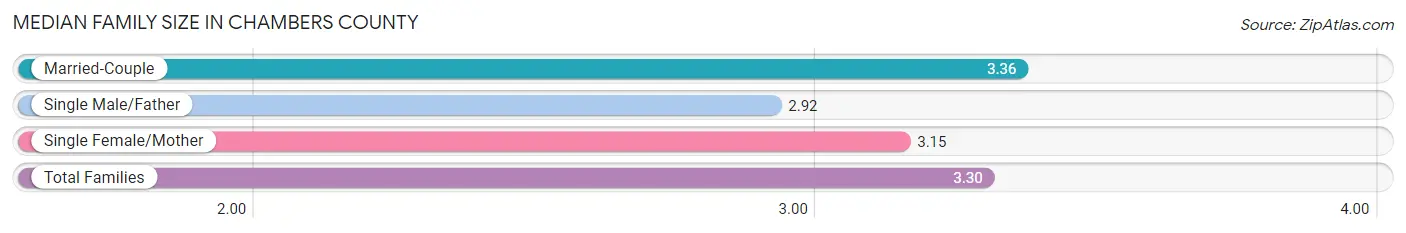
Median Family Size in Chambers County
The median family size in Chambers County is 3.30 persons per family, with married-couple families (9,889 | 79.4%) accounting for the largest median family size of 3.36 persons per family. On the other hand, single male/father families (937 | 7.5%) represent the smallest median family size with 2.92 persons per family.
| Family Type | # Families | Family Size |
| Married-Couple | 9,889 (79.4%) | 3.36 |
| Single Male/Father | 937 (7.5%) | 2.92 |
| Single Female/Mother | 1,628 (13.1%) | 3.15 |
| Total Families | 12,454 (100.0%) | 3.30 |
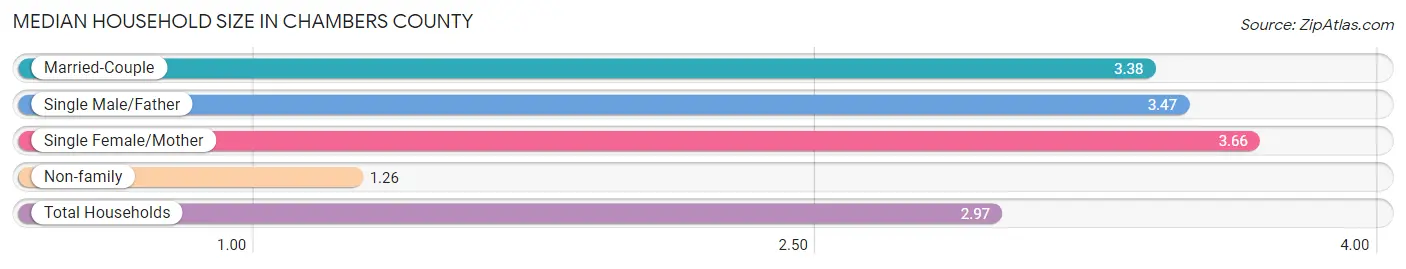
Median Household Size in Chambers County
The median household size in Chambers County is 2.97 persons per household, with single female/mother households (1,628 | 10.3%) accounting for the largest median household size of 3.66 persons per household. non-family households (3,290 | 20.9%) represent the smallest median household size with 1.26 persons per household.
| Household Type | # Households | Household Size |
| Married-Couple | 9,889 (62.8%) | 3.38 |
| Single Male/Father | 937 (5.9%) | 3.47 |
| Single Female/Mother | 1,628 (10.3%) | 3.66 |
| Non-family | 3,290 (20.9%) | 1.26 |
| Total Households | 15,744 (100.0%) | 2.97 |
Household Size by Marriage Status in Chambers County
Out of a total of 15,744 households in Chambers County, 12,454 (79.1%) are family households, while 3,290 (20.9%) are nonfamily households. The most numerous type of family households are 2-person households, comprising 4,452, and the most common type of nonfamily households are 1-person households, comprising 2,631.
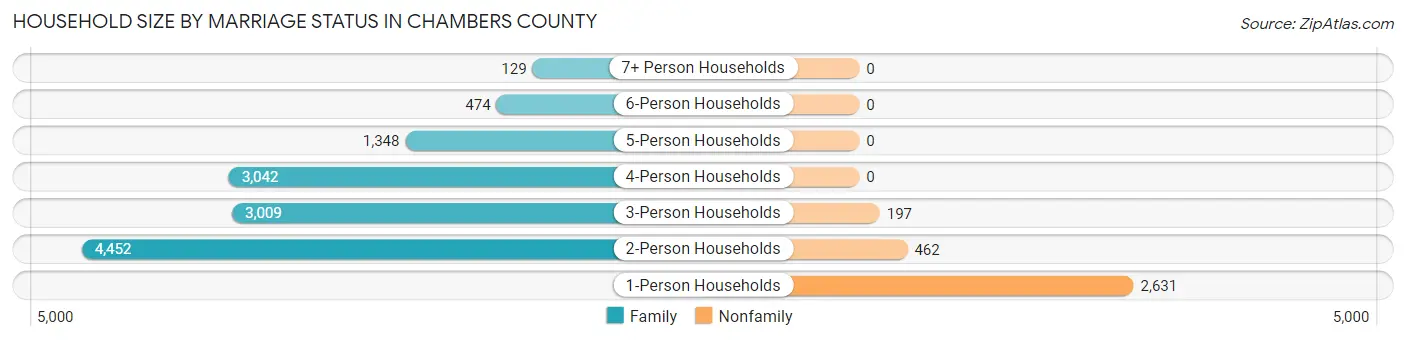
| Household Size | Family Households | Nonfamily Households |
| 1-Person Households | - | 2,631 (16.7%) |
| 2-Person Households | 4,452 (28.3%) | 462 (2.9%) |
| 3-Person Households | 3,009 (19.1%) | 197 (1.3%) |
| 4-Person Households | 3,042 (19.3%) | 0 (0.0%) |
| 5-Person Households | 1,348 (8.6%) | 0 (0.0%) |
| 6-Person Households | 474 (3.0%) | 0 (0.0%) |
| 7+ Person Households | 129 (0.8%) | 0 (0.0%) |
| Total | 12,454 (79.1%) | 3,290 (20.9%) |
Female Fertility in Chambers County
Fertility by Age in Chambers County
Average fertility rate in Chambers County is 100.0 births per 1,000 women. Women in the age bracket of 20 to 34 years have the highest fertility rate with 196.0 births per 1,000 women. Women in the age bracket of 20 to 34 years acount for 80.0% of all women with births.
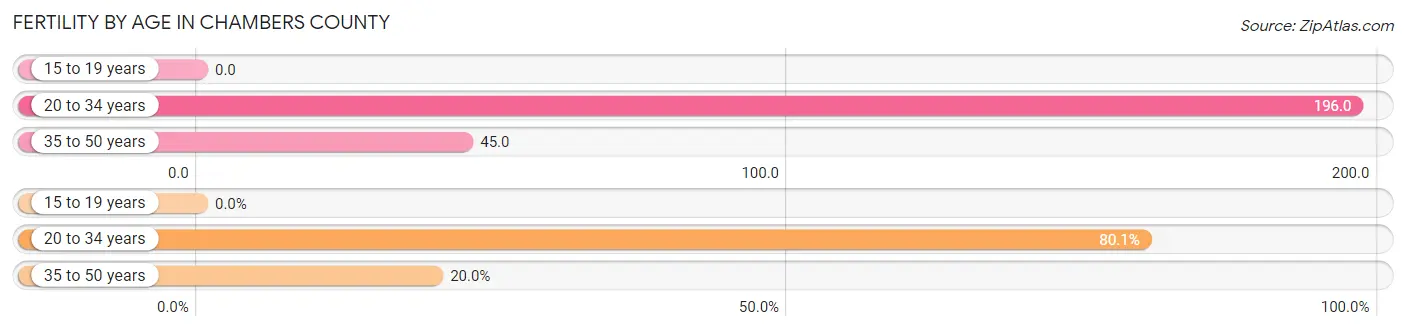
| Age Bracket | Women with Births | Births / 1,000 Women |
| 15 to 19 years | 0 (0.0%) | 0.0 |
| 20 to 34 years | 903 (80.0%) | 196.0 |
| 35 to 50 years | 225 (20.0%) | 45.0 |
| Total | 1,128 (100.0%) | 100.0 |
Fertility by Age by Marriage Status in Chambers County
80.9% of women with births (1,128) in Chambers County are married. The highest percentage of unmarried women with births falls into 20 to 34 years age bracket with 23.9% of them unmarried at the time of birth, while the lowest percentage of unmarried women with births belong to 35 to 50 years age bracket with 0.0% of them unmarried.
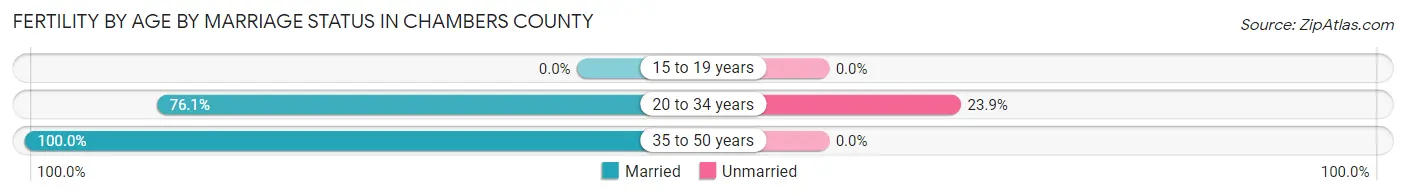
| Age Bracket | Married | Unmarried |
| 15 to 19 years | 0 (0.0%) | 0 (0.0%) |
| 20 to 34 years | 687 (76.1%) | 216 (23.9%) |
| 35 to 50 years | 225 (100.0%) | 0 (0.0%) |
| Total | 913 (80.9%) | 215 (19.1%) |
Fertility by Education in Chambers County
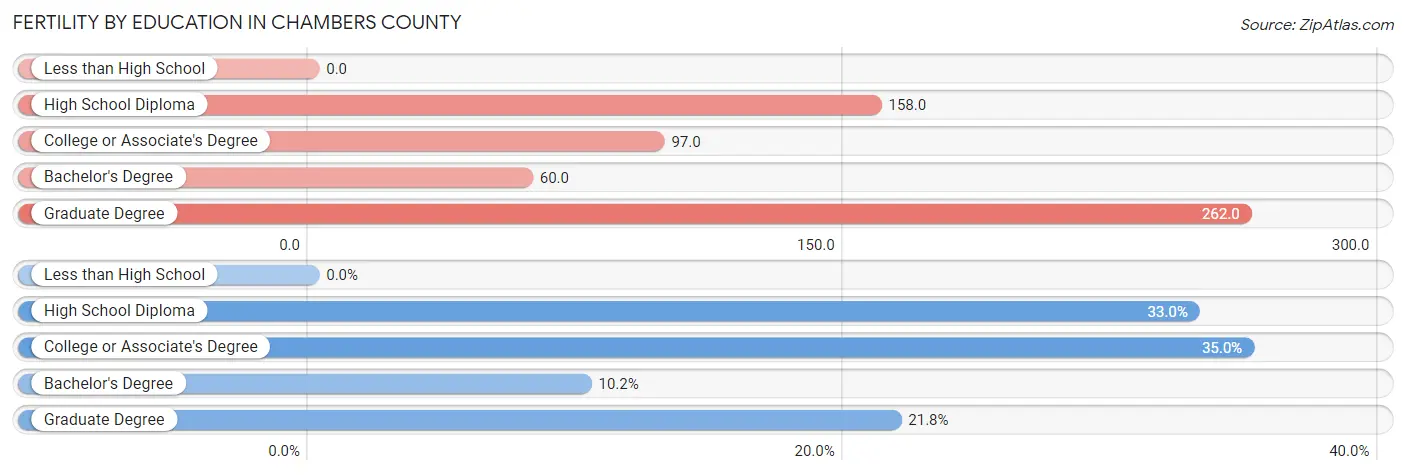
| Educational Attainment | Women with Births | Births / 1,000 Women |
| Less than High School | 0 (0.0%) | 0.0 |
| High School Diploma | 372 (33.0%) | 158.0 |
| College or Associate's Degree | 395 (35.0%) | 97.0 |
| Bachelor's Degree | 115 (10.2%) | 60.0 |
| Graduate Degree | 246 (21.8%) | 262.0 |
| Total | 1,128 (100.0%) | 100.0 |
Fertility by Education by Marriage Status in Chambers County
19.1% of women with births in Chambers County are unmarried. Women with the educational attainment of bachelor's degree are most likely to be married with 100.0% of them married at childbirth, while women with the educational attainment of college or associate's degree are least likely to be married with 29.6% of them unmarried at childbirth.
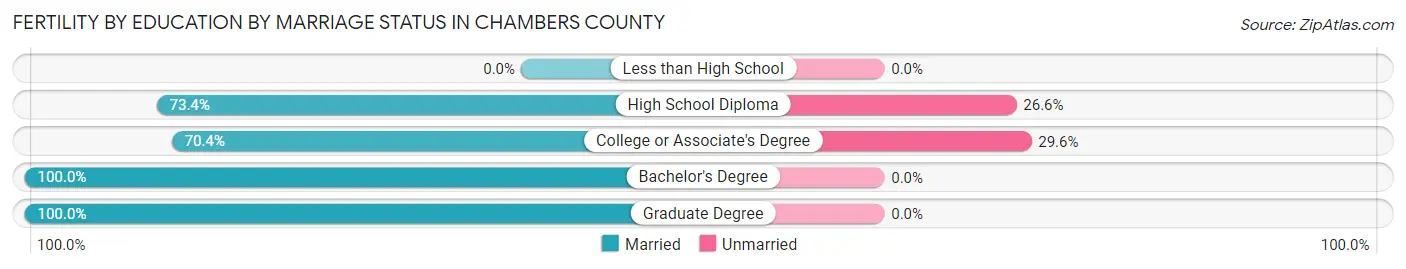
| Educational Attainment | Married | Unmarried |
| Less than High School | 0 (0.0%) | 0 (0.0%) |
| High School Diploma | 273 (73.4%) | 99 (26.6%) |
| College or Associate's Degree | 278 (70.4%) | 117 (29.6%) |
| Bachelor's Degree | 115 (100.0%) | 0 (0.0%) |
| Graduate Degree | 246 (100.0%) | 0 (0.0%) |
| Total | 913 (80.9%) | 215 (19.1%) |
Employment Characteristics in Chambers County
Employment by Class of Employer in Chambers County
Among the 21,825 employed individuals in Chambers County, private company employees (15,643 | 71.7%), local government employees (2,445 | 11.2%), and self-employed (not incorporated) (1,434 | 6.6%) make up the most common classes of employment.
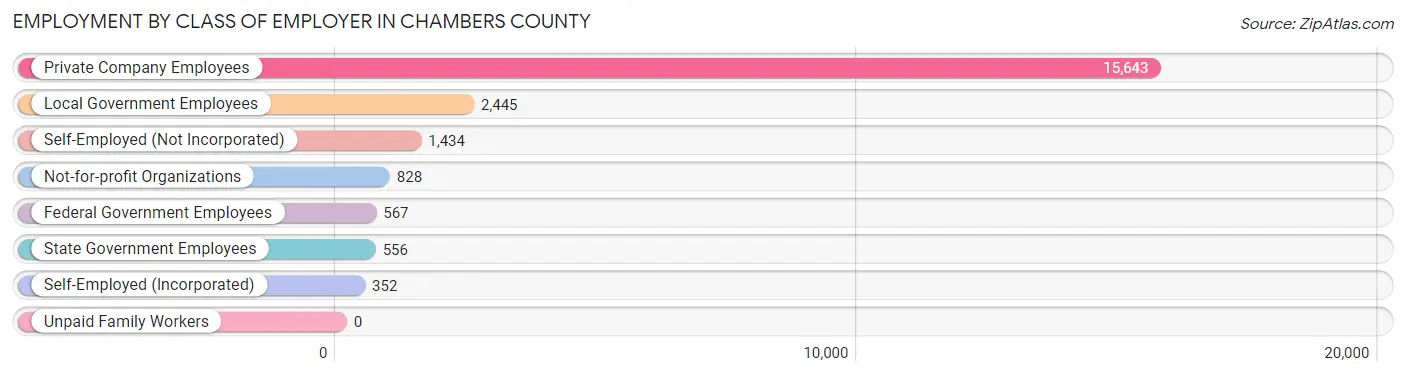
| Employer Class | # Employees | % Employees |
| Private Company Employees | 15,643 | 71.7% |
| Self-Employed (Incorporated) | 352 | 1.6% |
| Self-Employed (Not Incorporated) | 1,434 | 6.6% |
| Not-for-profit Organizations | 828 | 3.8% |
| Local Government Employees | 2,445 | 11.2% |
| State Government Employees | 556 | 2.5% |
| Federal Government Employees | 567 | 2.6% |
| Unpaid Family Workers | 0 | 0.0% |
| Total | 21,825 | 100.0% |
Employment Status by Age in Chambers County
According to the labor force statistics for Chambers County, out of the total population over 16 years of age (35,541), 67.0% or 23,812 individuals are in the labor force, with 7.5% or 1,786 of them unemployed. The age group with the highest labor force participation rate is 25 to 29 years, with 87.5% or 2,706 individuals in the labor force. Within the labor force, the 60 to 64 years age range has the highest percentage of unemployed individuals, with 19.5% or 244 of them being unemployed.
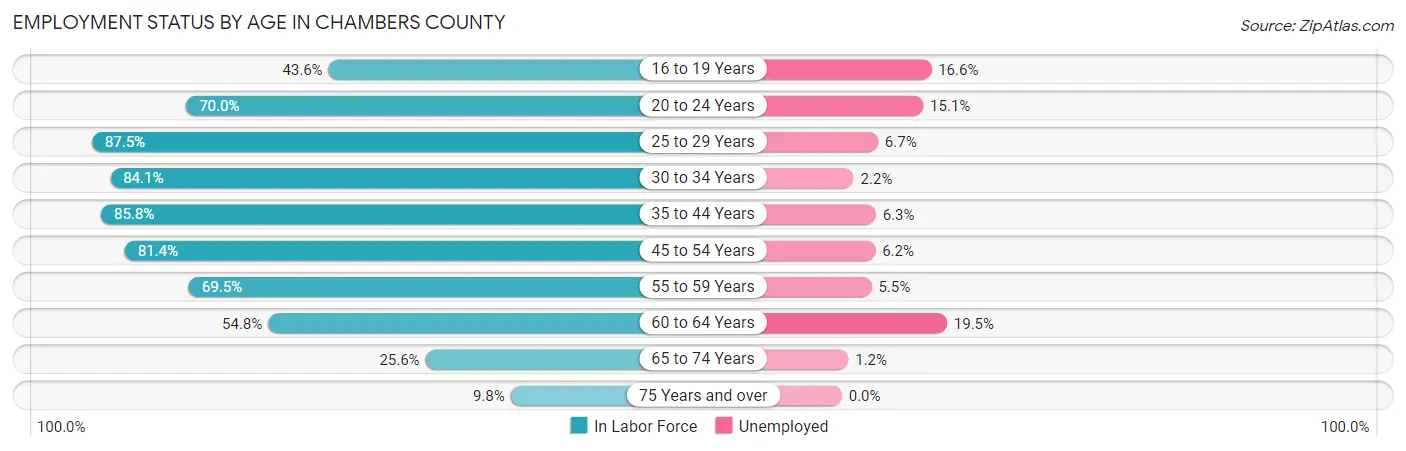
| Age Bracket | In Labor Force | Unemployed |
| 16 to 19 Years | 1,105 (43.6%) | 183 (16.6%) |
| 20 to 24 Years | 2,152 (70.0%) | 325 (15.1%) |
| 25 to 29 Years | 2,706 (87.5%) | 181 (6.7%) |
| 30 to 34 Years | 2,528 (84.1%) | 56 (2.2%) |
| 35 to 44 Years | 5,973 (85.8%) | 376 (6.3%) |
| 45 to 54 Years | 4,987 (81.4%) | 309 (6.2%) |
| 55 to 59 Years | 1,939 (69.5%) | 107 (5.5%) |
| 60 to 64 Years | 1,251 (54.8%) | 244 (19.5%) |
| 65 to 74 Years | 978 (25.6%) | 12 (1.2%) |
| 75 Years and over | 181 (9.8%) | 0 (0.0%) |
| Total | 23,812 (67.0%) | 1,786 (7.5%) |
Employment Status by Educational Attainment in Chambers County
According to labor force statistics for Chambers County, 79.9% of individuals (19,381) out of the total population between 25 and 64 years of age (24,257) are in the labor force, with 6.6% or 1,279 of them being unemployed. The group with the highest labor force participation rate are those with the educational attainment of bachelor's degree or higher, with 87.9% or 4,925 individuals in the labor force. Within the labor force, individuals with high school diploma education have the highest percentage of unemployment, with 15.8% or 694 of them being unemployed.
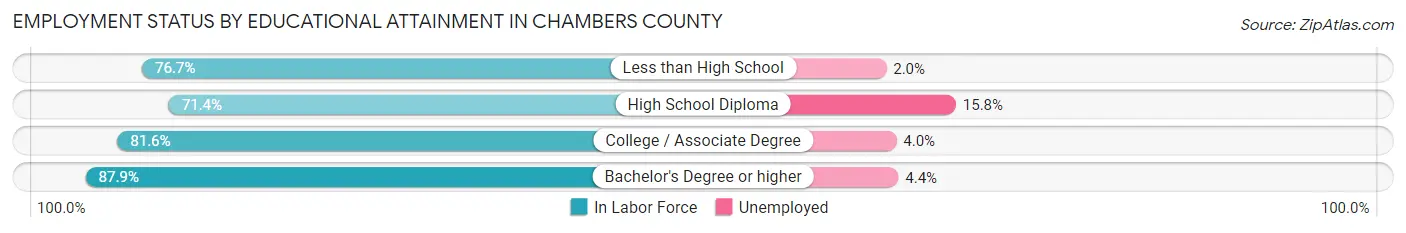
| Educational Attainment | In Labor Force | Unemployed |
| Less than High School | 2,097 (76.7%) | 55 (2.0%) |
| High School Diploma | 4,395 (71.4%) | 972 (15.8%) |
| College / Associate Degree | 7,968 (81.6%) | 391 (4.0%) |
| Bachelor's Degree or higher | 4,925 (87.9%) | 247 (4.4%) |
| Total | 19,381 (79.9%) | 1,601 (6.6%) |
Employment Occupations by Sex in Chambers County
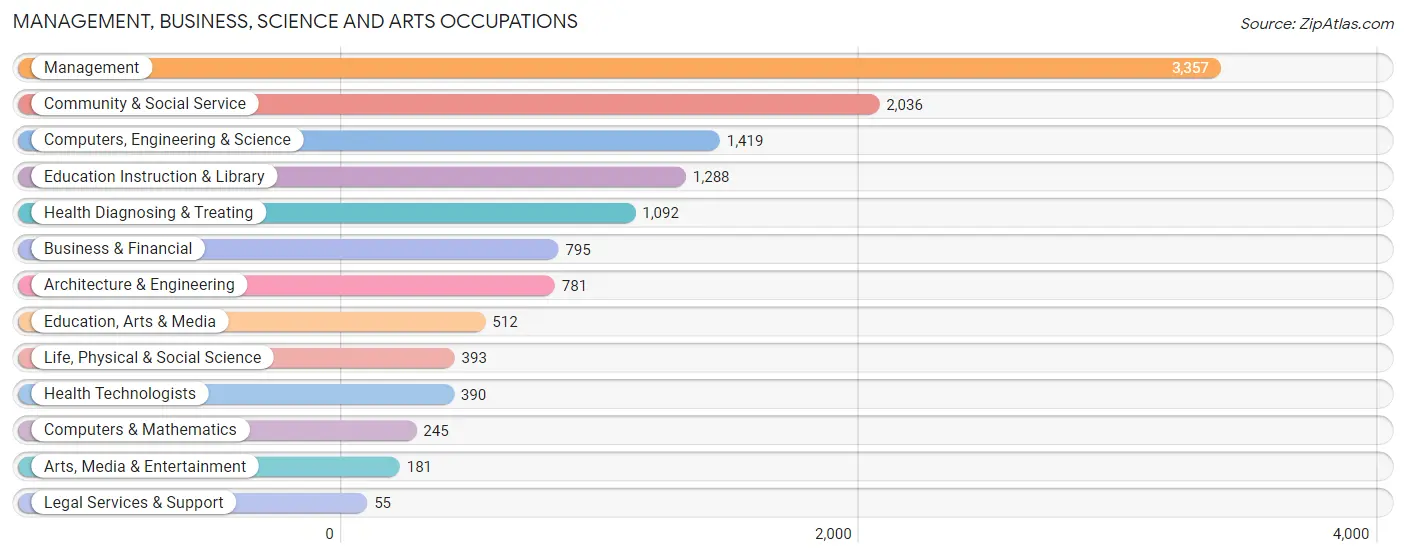
Management, Business, Science and Arts Occupations
The most common Management, Business, Science and Arts occupations in Chambers County are Management (3,357 | 15.3%), Community & Social Service (2,036 | 9.3%), Computers, Engineering & Science (1,419 | 6.5%), Education Instruction & Library (1,288 | 5.9%), and Health Diagnosing & Treating (1,092 | 5.0%).
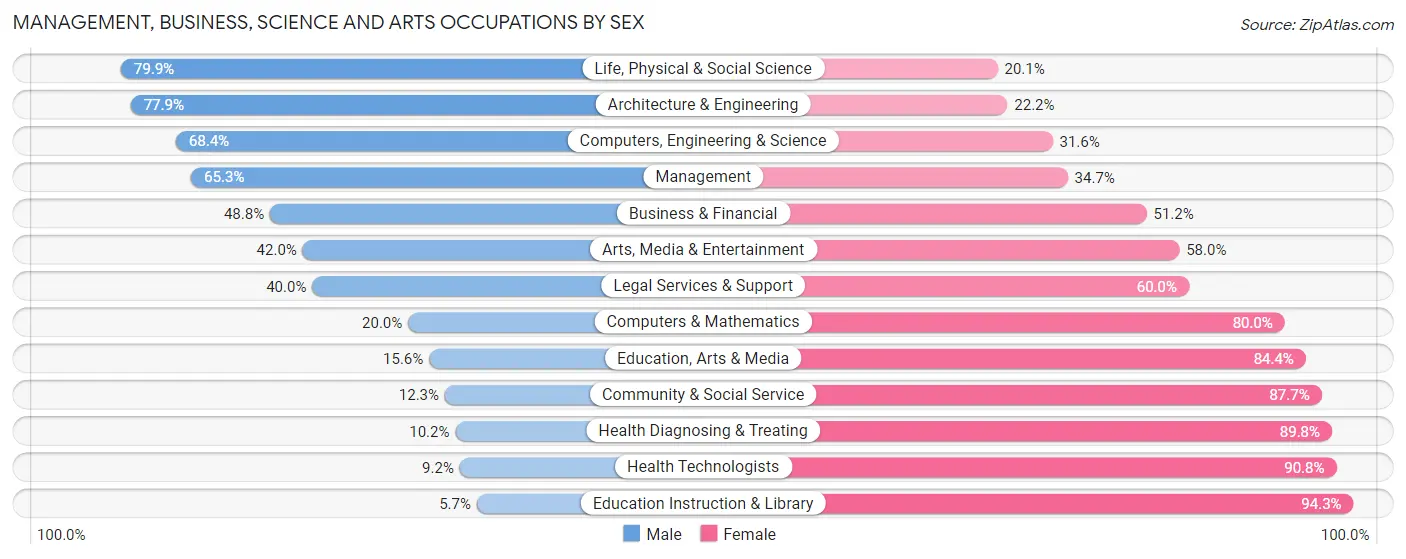
Management, Business, Science and Arts Occupations by Sex
Within the Management, Business, Science and Arts occupations in Chambers County, the most male-oriented occupations are Life, Physical & Social Science (79.9%), Architecture & Engineering (77.8%), and Computers, Engineering & Science (68.4%), while the most female-oriented occupations are Education Instruction & Library (94.3%), Health Technologists (90.8%), and Health Diagnosing & Treating (89.8%).
| Occupation | Male | Female |
| Management | 2,191 (65.3%) | 1,166 (34.7%) |
| Business & Financial | 388 (48.8%) | 407 (51.2%) |
| Computers, Engineering & Science | 971 (68.4%) | 448 (31.6%) |
| Computers & Mathematics | 49 (20.0%) | 196 (80.0%) |
| Architecture & Engineering | 608 (77.8%) | 173 (22.2%) |
| Life, Physical & Social Science | 314 (79.9%) | 79 (20.1%) |
| Community & Social Service | 251 (12.3%) | 1,785 (87.7%) |
| Education, Arts & Media | 80 (15.6%) | 432 (84.4%) |
| Legal Services & Support | 22 (40.0%) | 33 (60.0%) |
| Education Instruction & Library | 73 (5.7%) | 1,215 (94.3%) |
| Arts, Media & Entertainment | 76 (42.0%) | 105 (58.0%) |
| Health Diagnosing & Treating | 111 (10.2%) | 981 (89.8%) |
| Health Technologists | 36 (9.2%) | 354 (90.8%) |
| Total (Category) | 3,912 (45.0%) | 4,787 (55.0%) |
| Total (Overall) | 12,584 (57.4%) | 9,332 (42.6%) |
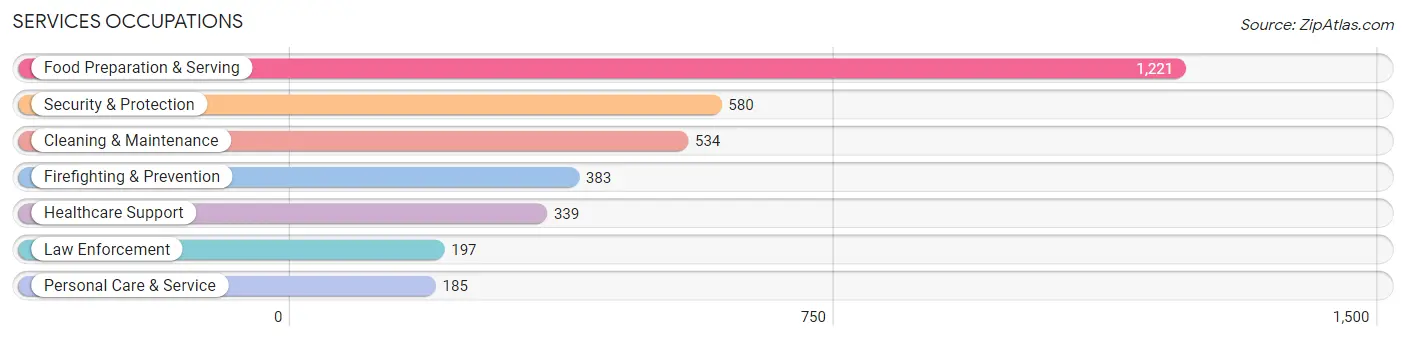
Services Occupations
The most common Services occupations in Chambers County are Food Preparation & Serving (1,221 | 5.6%), Security & Protection (580 | 2.6%), Cleaning & Maintenance (534 | 2.4%), Firefighting & Prevention (383 | 1.8%), and Healthcare Support (339 | 1.5%).
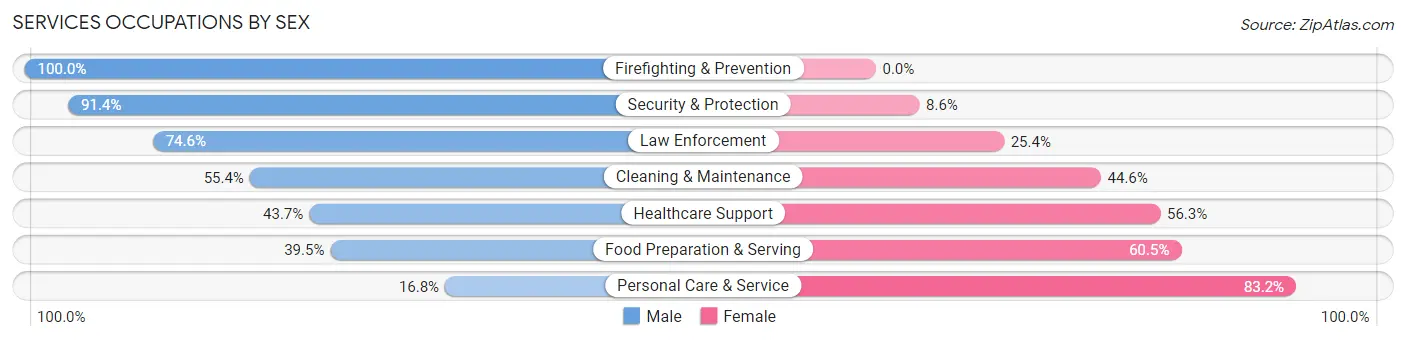
Services Occupations by Sex
Within the Services occupations in Chambers County, the most male-oriented occupations are Firefighting & Prevention (100.0%), Security & Protection (91.4%), and Law Enforcement (74.6%), while the most female-oriented occupations are Personal Care & Service (83.2%), Food Preparation & Serving (60.5%), and Healthcare Support (56.3%).
| Occupation | Male | Female |
| Healthcare Support | 148 (43.7%) | 191 (56.3%) |
| Security & Protection | 530 (91.4%) | 50 (8.6%) |
| Firefighting & Prevention | 383 (100.0%) | 0 (0.0%) |
| Law Enforcement | 147 (74.6%) | 50 (25.4%) |
| Food Preparation & Serving | 482 (39.5%) | 739 (60.5%) |
| Cleaning & Maintenance | 296 (55.4%) | 238 (44.6%) |
| Personal Care & Service | 31 (16.8%) | 154 (83.2%) |
| Total (Category) | 1,487 (52.0%) | 1,372 (48.0%) |
| Total (Overall) | 12,584 (57.4%) | 9,332 (42.6%) |
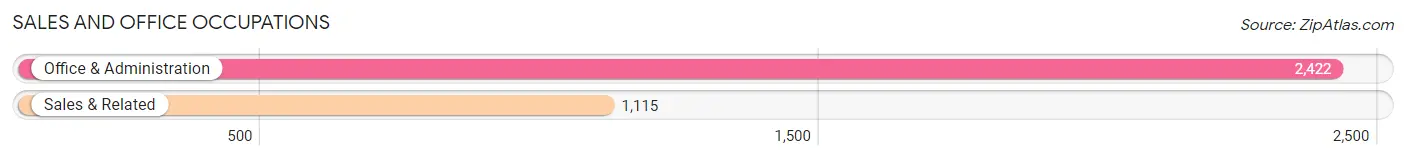
Sales and Office Occupations
The most common Sales and Office occupations in Chambers County are Office & Administration (2,422 | 11.1%), and Sales & Related (1,115 | 5.1%).
Sales and Office Occupations by Sex
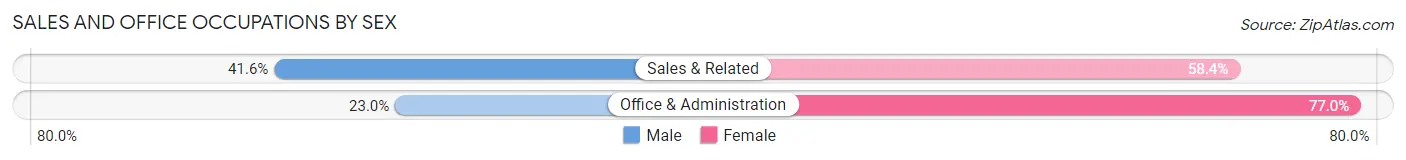
| Occupation | Male | Female |
| Sales & Related | 464 (41.6%) | 651 (58.4%) |
| Office & Administration | 557 (23.0%) | 1,865 (77.0%) |
| Total (Category) | 1,021 (28.9%) | 2,516 (71.1%) |
| Total (Overall) | 12,584 (57.4%) | 9,332 (42.6%) |
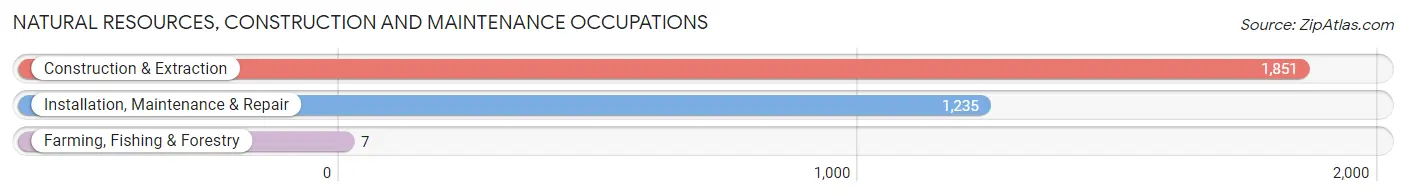
Natural Resources, Construction and Maintenance Occupations
The most common Natural Resources, Construction and Maintenance occupations in Chambers County are Construction & Extraction (1,851 | 8.5%), Installation, Maintenance & Repair (1,235 | 5.6%), and Farming, Fishing & Forestry (7 | 0.0%).
Natural Resources, Construction and Maintenance Occupations by Sex
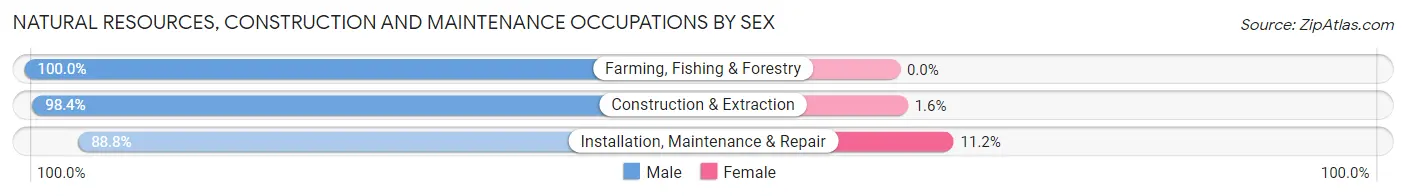
| Occupation | Male | Female |
| Farming, Fishing & Forestry | 7 (100.0%) | 0 (0.0%) |
| Construction & Extraction | 1,821 (98.4%) | 30 (1.6%) |
| Installation, Maintenance & Repair | 1,097 (88.8%) | 138 (11.2%) |
| Total (Category) | 2,925 (94.6%) | 168 (5.4%) |
| Total (Overall) | 12,584 (57.4%) | 9,332 (42.6%) |
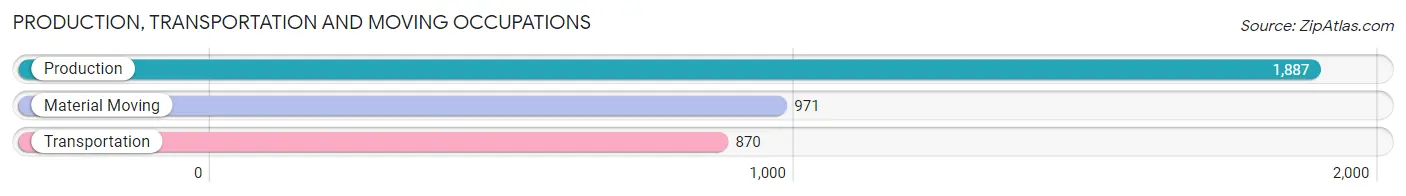
Production, Transportation and Moving Occupations
The most common Production, Transportation and Moving occupations in Chambers County are Production (1,887 | 8.6%), Material Moving (971 | 4.4%), and Transportation (870 | 4.0%).
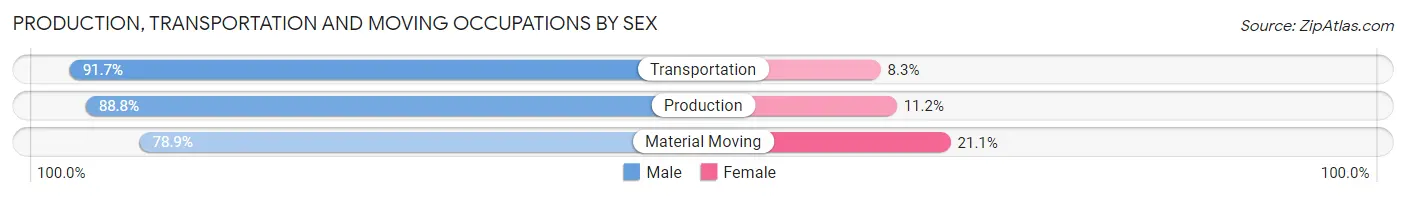
Production, Transportation and Moving Occupations by Sex
| Occupation | Male | Female |
| Production | 1,675 (88.8%) | 212 (11.2%) |
| Transportation | 798 (91.7%) | 72 (8.3%) |
| Material Moving | 766 (78.9%) | 205 (21.1%) |
| Total (Category) | 3,239 (86.9%) | 489 (13.1%) |
| Total (Overall) | 12,584 (57.4%) | 9,332 (42.6%) |
Employment Industries by Sex in Chambers County
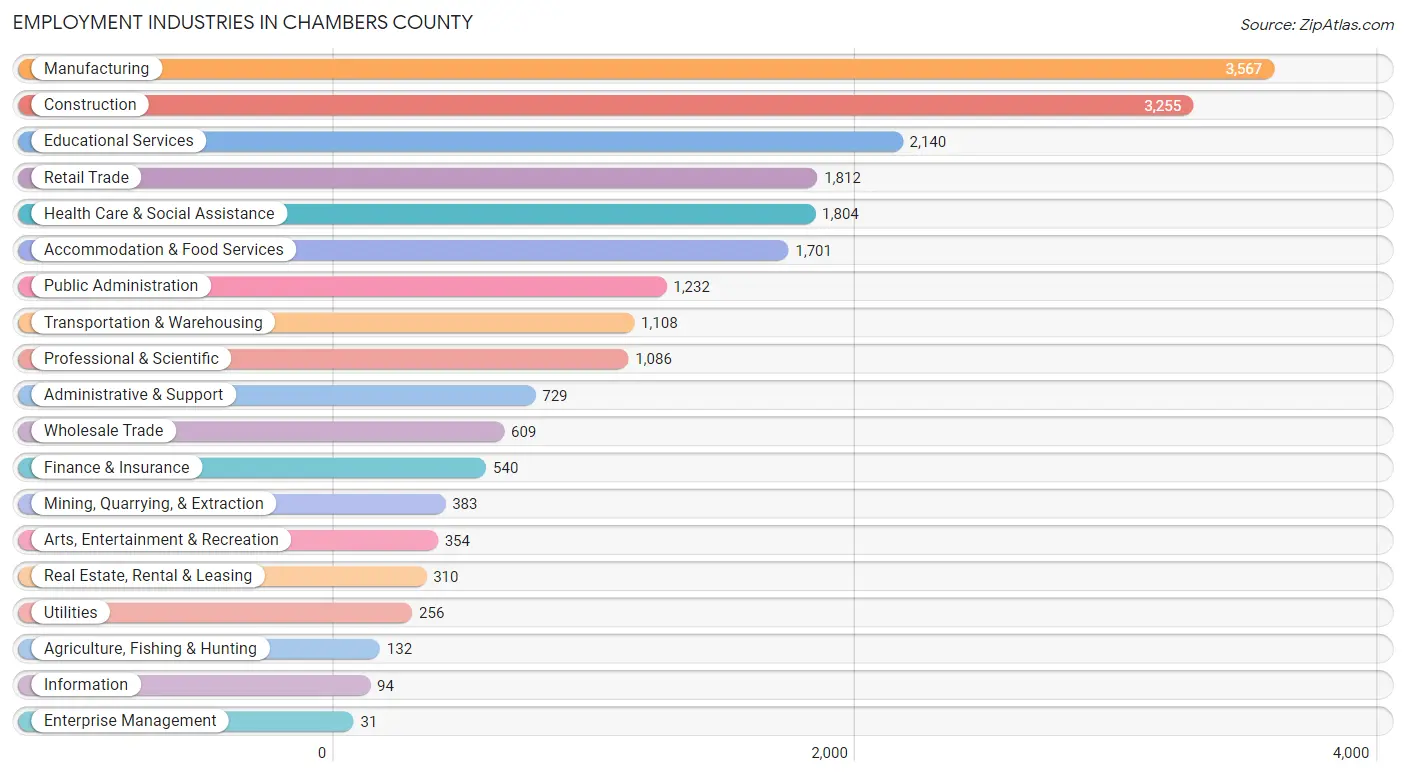
Employment Industries in Chambers County
The major employment industries in Chambers County include Manufacturing (3,567 | 16.3%), Construction (3,255 | 14.8%), Educational Services (2,140 | 9.8%), Retail Trade (1,812 | 8.3%), and Health Care & Social Assistance (1,804 | 8.2%).
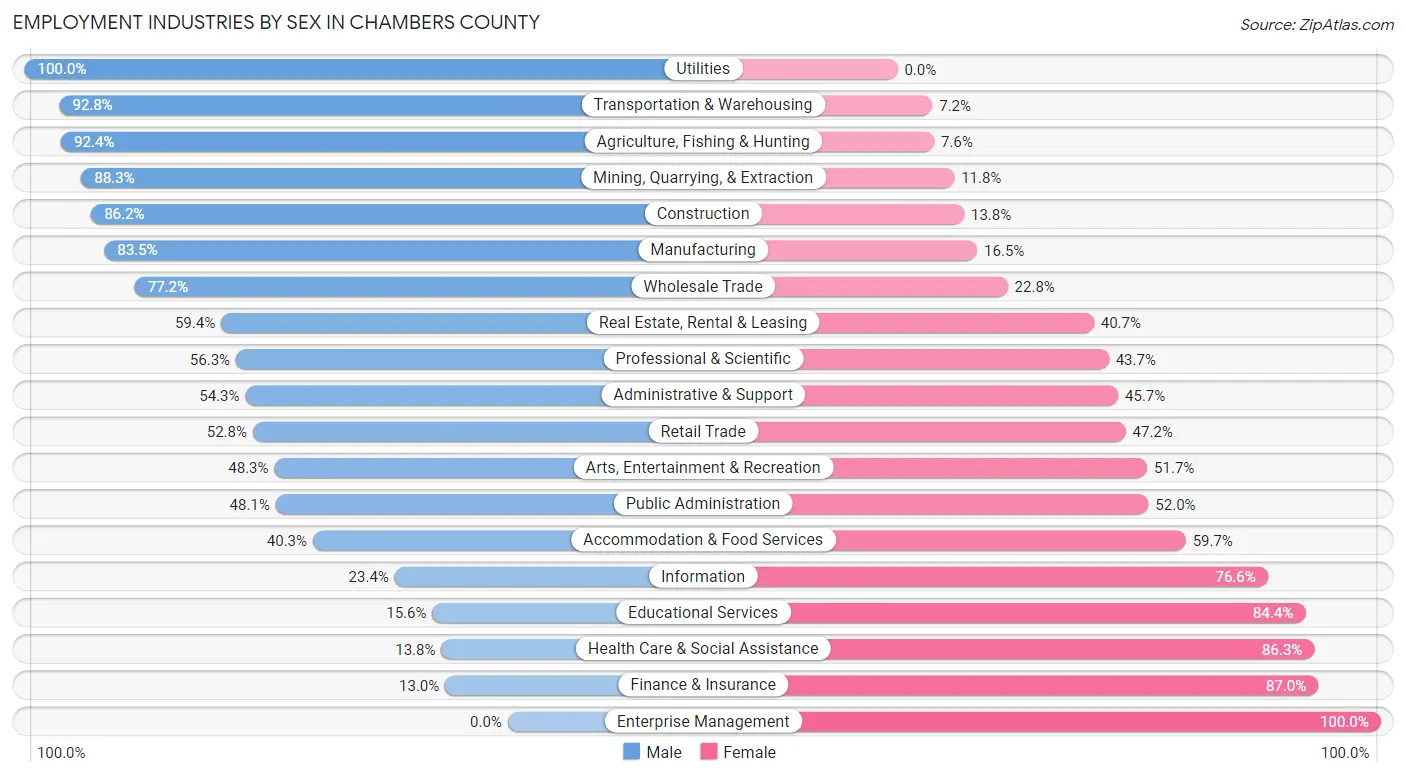
Employment Industries by Sex in Chambers County
The Chambers County industries that see more men than women are Utilities (100.0%), Transportation & Warehousing (92.8%), and Agriculture, Fishing & Hunting (92.4%), whereas the industries that tend to have a higher number of women are Enterprise Management (100.0%), Finance & Insurance (87.0%), and Health Care & Social Assistance (86.3%).
| Industry | Male | Female |
| Agriculture, Fishing & Hunting | 122 (92.4%) | 10 (7.6%) |
| Mining, Quarrying, & Extraction | 338 (88.2%) | 45 (11.7%) |
| Construction | 2,806 (86.2%) | 449 (13.8%) |
| Manufacturing | 2,978 (83.5%) | 589 (16.5%) |
| Wholesale Trade | 470 (77.2%) | 139 (22.8%) |
| Retail Trade | 956 (52.8%) | 856 (47.2%) |
| Transportation & Warehousing | 1,028 (92.8%) | 80 (7.2%) |
| Utilities | 256 (100.0%) | 0 (0.0%) |
| Information | 22 (23.4%) | 72 (76.6%) |
| Finance & Insurance | 70 (13.0%) | 470 (87.0%) |
| Real Estate, Rental & Leasing | 184 (59.4%) | 126 (40.6%) |
| Professional & Scientific | 611 (56.3%) | 475 (43.7%) |
| Enterprise Management | 0 (0.0%) | 31 (100.0%) |
| Administrative & Support | 396 (54.3%) | 333 (45.7%) |
| Educational Services | 334 (15.6%) | 1,806 (84.4%) |
| Health Care & Social Assistance | 248 (13.8%) | 1,556 (86.3%) |
| Arts, Entertainment & Recreation | 171 (48.3%) | 183 (51.7%) |
| Accommodation & Food Services | 686 (40.3%) | 1,015 (59.7%) |
| Public Administration | 592 (48.0%) | 640 (51.9%) |
| Total | 12,584 (57.4%) | 9,332 (42.6%) |
Education in Chambers County
School Enrollment in Chambers County
The most common levels of schooling among the 12,200 students in Chambers County are high school (3,062 | 25.1%), middle school (2,898 | 23.7%), and elementary school (2,452 | 20.1%).
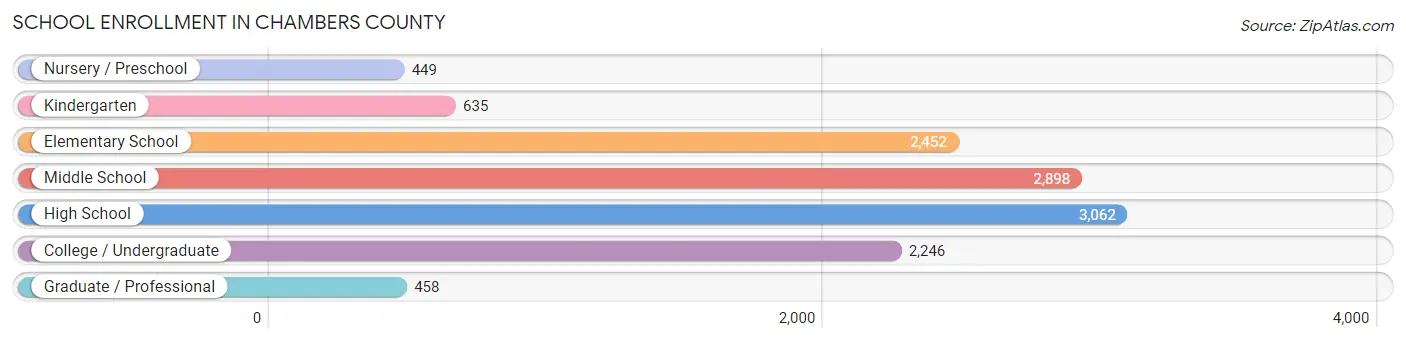
| School Level | # Students | % Students |
| Nursery / Preschool | 449 | 3.7% |
| Kindergarten | 635 | 5.2% |
| Elementary School | 2,452 | 20.1% |
| Middle School | 2,898 | 23.7% |
| High School | 3,062 | 25.1% |
| College / Undergraduate | 2,246 | 18.4% |
| Graduate / Professional | 458 | 3.7% |
| Total | 12,200 | 100.0% |
School Enrollment by Age by Funding Source in Chambers County
Out of a total of 12,200 students who are enrolled in schools in Chambers County, 1,013 (8.3%) attend a private institution, while the remaining 11,187 (91.7%) are enrolled in public schools. The age group of 25 to 34 year olds has the highest likelihood of being enrolled in private schools, with 292 (45.7% in the age bracket) enrolled. Conversely, the age group of 35 years and over has the lowest likelihood of being enrolled in a private school, with 618 (100.0% in the age bracket) attending a public institution.
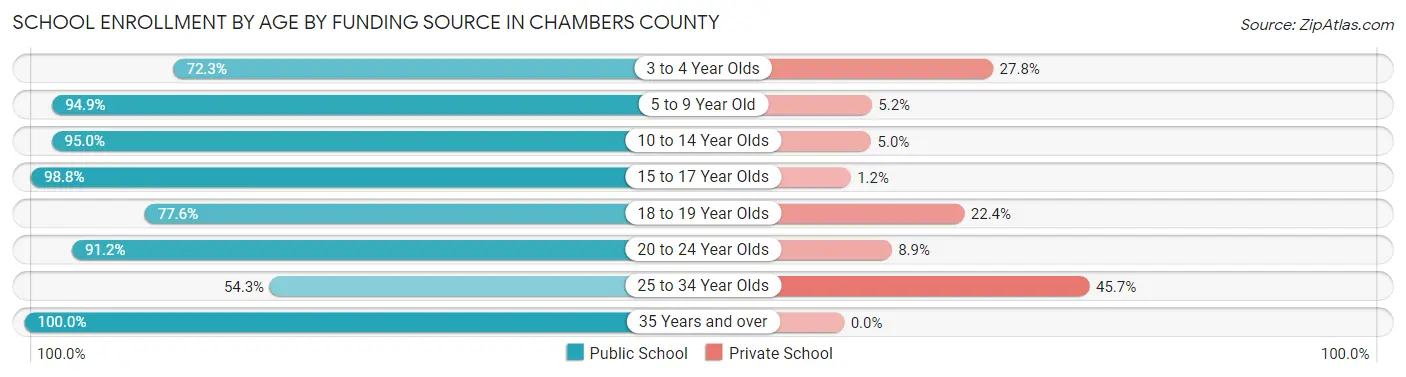
| Age Bracket | Public School | Private School |
| 3 to 4 Year Olds | 263 (72.3%) | 101 (27.8%) |
| 5 to 9 Year Old | 2,540 (94.9%) | 138 (5.1%) |
| 10 to 14 Year Olds | 3,800 (95.0%) | 201 (5.0%) |
| 15 to 17 Year Olds | 2,190 (98.8%) | 27 (1.2%) |
| 18 to 19 Year Olds | 631 (77.6%) | 182 (22.4%) |
| 20 to 24 Year Olds | 793 (91.1%) | 77 (8.8%) |
| 25 to 34 Year Olds | 347 (54.3%) | 292 (45.7%) |
| 35 Years and over | 618 (100.0%) | 0 (0.0%) |
| Total | 11,187 (91.7%) | 1,013 (8.3%) |
Educational Attainment by Field of Study in Chambers County
Business (1,520 | 21.3%), engineering (1,232 | 17.2%), education (886 | 12.4%), science & technology (607 | 8.5%), and social sciences (499 | 7.0%) are the most common fields of study among 7,148 individuals in Chambers County who have obtained a bachelor's degree or higher.
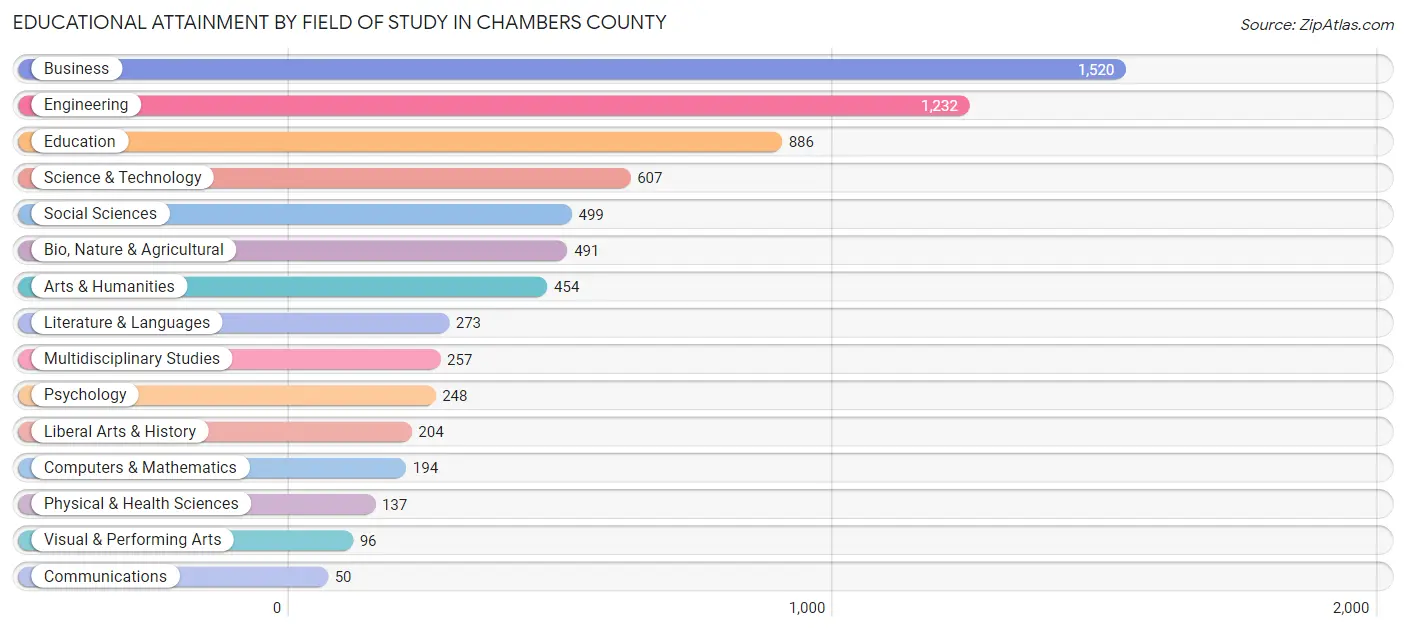
| Field of Study | # Graduates | % Graduates |
| Computers & Mathematics | 194 | 2.7% |
| Bio, Nature & Agricultural | 491 | 6.9% |
| Physical & Health Sciences | 137 | 1.9% |
| Psychology | 248 | 3.5% |
| Social Sciences | 499 | 7.0% |
| Engineering | 1,232 | 17.2% |
| Multidisciplinary Studies | 257 | 3.6% |
| Science & Technology | 607 | 8.5% |
| Business | 1,520 | 21.3% |
| Education | 886 | 12.4% |
| Literature & Languages | 273 | 3.8% |
| Liberal Arts & History | 204 | 2.9% |
| Visual & Performing Arts | 96 | 1.3% |
| Communications | 50 | 0.7% |
| Arts & Humanities | 454 | 6.4% |
| Total | 7,148 | 100.0% |
Transportation & Commute in Chambers County
Vehicle Availability by Sex in Chambers County
The most prevalent vehicle ownership categories in Chambers County are males with 2 vehicles (5,631, accounting for 44.6%) and females with 2 vehicles (3,373, making up 61.3%).
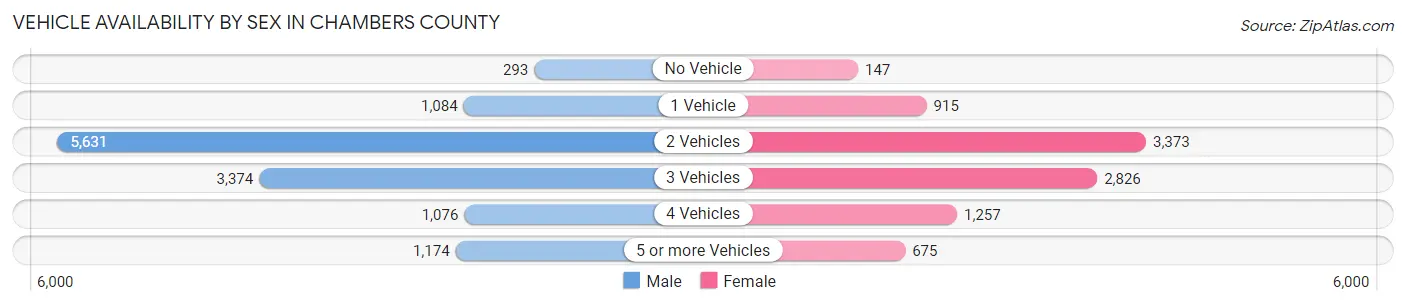
| Vehicles Available | Male | Female |
| No Vehicle | 293 (2.3%) | 147 (1.6%) |
| 1 Vehicle | 1,084 (8.6%) | 915 (10.0%) |
| 2 Vehicles | 5,631 (44.6%) | 3,373 (36.7%) |
| 3 Vehicles | 3,374 (26.7%) | 2,826 (30.7%) |
| 4 Vehicles | 1,076 (8.5%) | 1,257 (13.7%) |
| 5 or more Vehicles | 1,174 (9.3%) | 675 (7.3%) |
| Total | 12,632 (100.0%) | 9,193 (100.0%) |
Commute Time in Chambers County
The most frequently occuring commute durations in Chambers County are 30 to 34 minutes (3,253 commuters, 15.6%), 20 to 24 minutes (2,750 commuters, 13.2%), and 45 to 59 minutes (2,292 commuters, 11.0%).
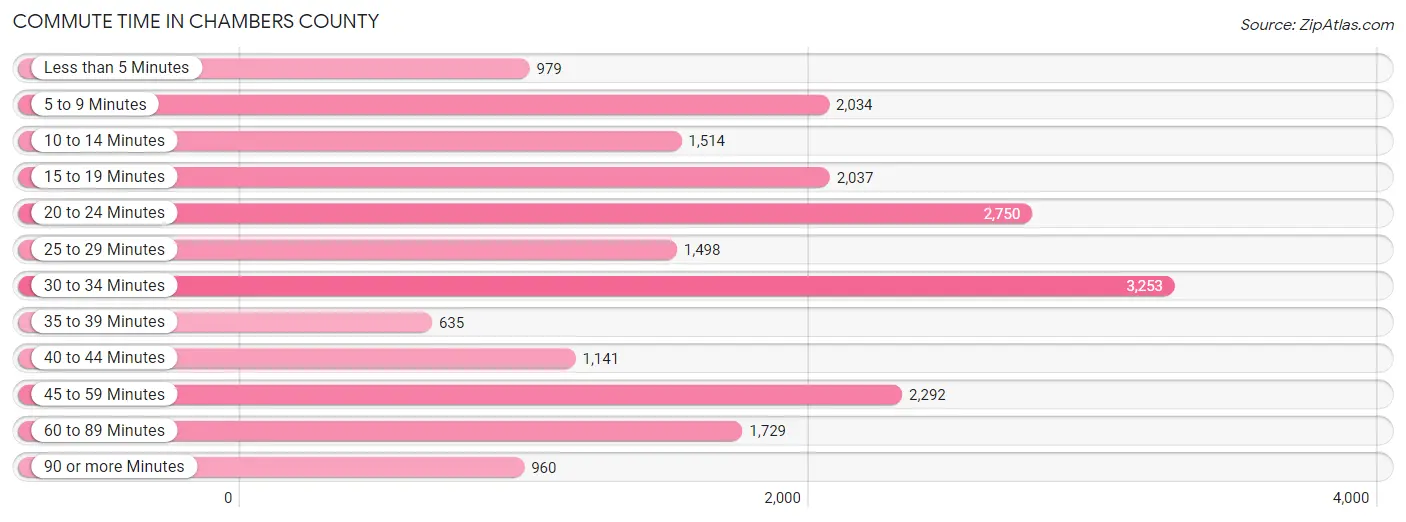
| Commute Time | # Commuters | % Commuters |
| Less than 5 Minutes | 979 | 4.7% |
| 5 to 9 Minutes | 2,034 | 9.8% |
| 10 to 14 Minutes | 1,514 | 7.3% |
| 15 to 19 Minutes | 2,037 | 9.8% |
| 20 to 24 Minutes | 2,750 | 13.2% |
| 25 to 29 Minutes | 1,498 | 7.2% |
| 30 to 34 Minutes | 3,253 | 15.6% |
| 35 to 39 Minutes | 635 | 3.0% |
| 40 to 44 Minutes | 1,141 | 5.5% |
| 45 to 59 Minutes | 2,292 | 11.0% |
| 60 to 89 Minutes | 1,729 | 8.3% |
| 90 or more Minutes | 960 | 4.6% |
Commute Time by Sex in Chambers County
The most common commute times in Chambers County are 30 to 34 minutes (2,159 commuters, 17.6%) for males and 20 to 24 minutes (1,436 commuters, 16.8%) for females.
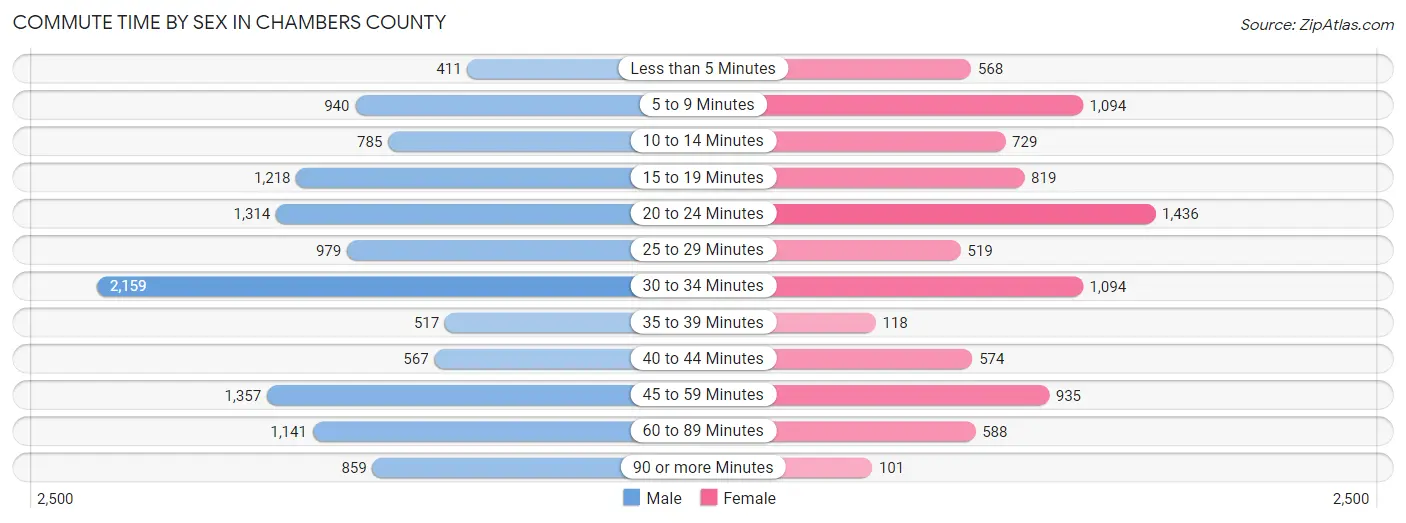
| Commute Time | Male | Female |
| Less than 5 Minutes | 411 (3.4%) | 568 (6.6%) |
| 5 to 9 Minutes | 940 (7.7%) | 1,094 (12.8%) |
| 10 to 14 Minutes | 785 (6.4%) | 729 (8.5%) |
| 15 to 19 Minutes | 1,218 (10.0%) | 819 (9.6%) |
| 20 to 24 Minutes | 1,314 (10.7%) | 1,436 (16.8%) |
| 25 to 29 Minutes | 979 (8.0%) | 519 (6.0%) |
| 30 to 34 Minutes | 2,159 (17.6%) | 1,094 (12.8%) |
| 35 to 39 Minutes | 517 (4.2%) | 118 (1.4%) |
| 40 to 44 Minutes | 567 (4.6%) | 574 (6.7%) |
| 45 to 59 Minutes | 1,357 (11.1%) | 935 (10.9%) |
| 60 to 89 Minutes | 1,141 (9.3%) | 588 (6.9%) |
| 90 or more Minutes | 859 (7.0%) | 101 (1.2%) |
Time of Departure to Work by Sex in Chambers County
The most frequent times of departure to work in Chambers County are 6:00 AM to 6:29 AM (2,182, 17.8%) for males and 7:00 AM to 7:29 AM (1,497, 17.5%) for females.
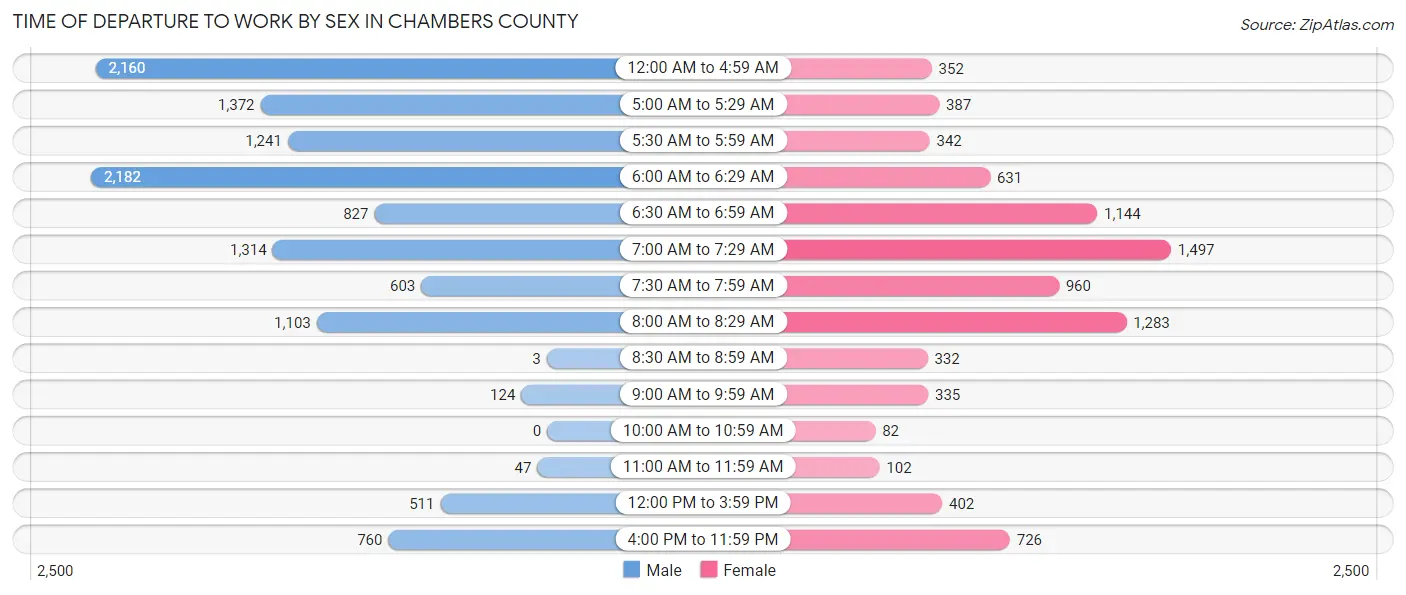
| Time of Departure | Male | Female |
| 12:00 AM to 4:59 AM | 2,160 (17.6%) | 352 (4.1%) |
| 5:00 AM to 5:29 AM | 1,372 (11.2%) | 387 (4.5%) |
| 5:30 AM to 5:59 AM | 1,241 (10.1%) | 342 (4.0%) |
| 6:00 AM to 6:29 AM | 2,182 (17.8%) | 631 (7.4%) |
| 6:30 AM to 6:59 AM | 827 (6.8%) | 1,144 (13.3%) |
| 7:00 AM to 7:29 AM | 1,314 (10.7%) | 1,497 (17.5%) |
| 7:30 AM to 7:59 AM | 603 (4.9%) | 960 (11.2%) |
| 8:00 AM to 8:29 AM | 1,103 (9.0%) | 1,283 (15.0%) |
| 8:30 AM to 8:59 AM | 3 (0.0%) | 332 (3.9%) |
| 9:00 AM to 9:59 AM | 124 (1.0%) | 335 (3.9%) |
| 10:00 AM to 10:59 AM | 0 (0.0%) | 82 (1.0%) |
| 11:00 AM to 11:59 AM | 47 (0.4%) | 102 (1.2%) |
| 12:00 PM to 3:59 PM | 511 (4.2%) | 402 (4.7%) |
| 4:00 PM to 11:59 PM | 760 (6.2%) | 726 (8.5%) |
| Total | 12,247 (100.0%) | 8,575 (100.0%) |
Housing Occupancy in Chambers County
Occupancy by Ownership in Chambers County
Of the total 15,744 dwellings in Chambers County, owner-occupied units account for 13,180 (83.7%), while renter-occupied units make up 2,564 (16.3%).
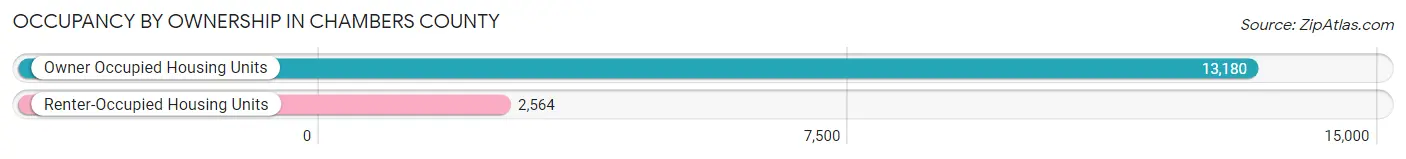
| Occupancy | # Housing Units | % Housing Units |
| Owner Occupied Housing Units | 13,180 | 83.7% |
| Renter-Occupied Housing Units | 2,564 | 16.3% |
| Total Occupied Housing Units | 15,744 | 100.0% |
Occupancy by Household Size in Chambers County
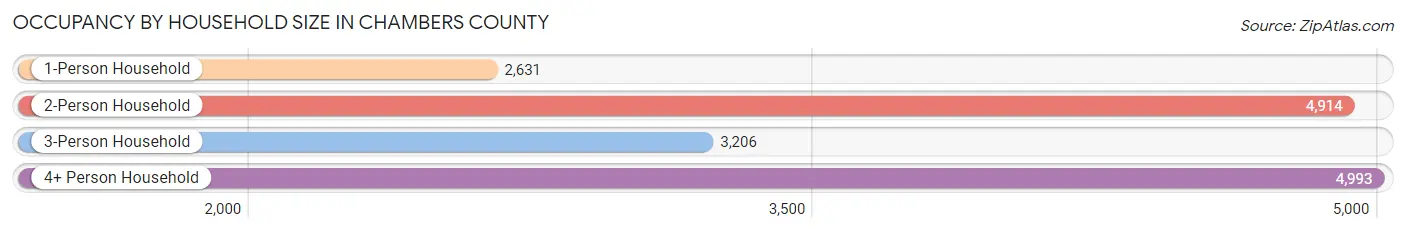
| Household Size | # Housing Units | % Housing Units |
| 1-Person Household | 2,631 | 16.7% |
| 2-Person Household | 4,914 | 31.2% |
| 3-Person Household | 3,206 | 20.4% |
| 4+ Person Household | 4,993 | 31.7% |
| Total Housing Units | 15,744 | 100.0% |
Occupancy by Ownership by Household Size in Chambers County
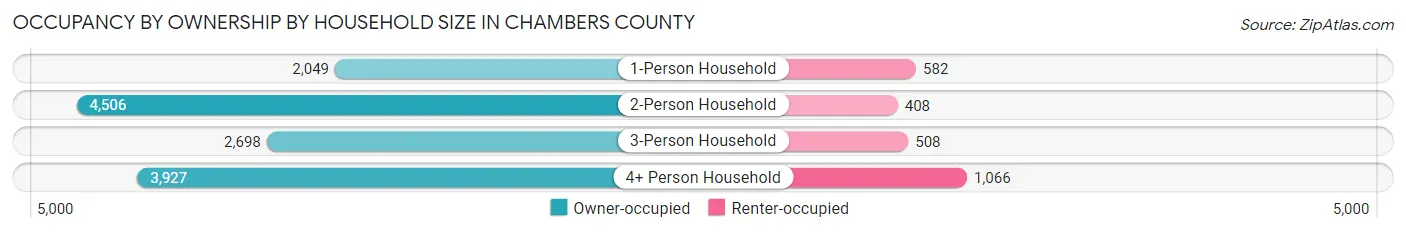
| Household Size | Owner-occupied | Renter-occupied |
| 1-Person Household | 2,049 (77.9%) | 582 (22.1%) |
| 2-Person Household | 4,506 (91.7%) | 408 (8.3%) |
| 3-Person Household | 2,698 (84.2%) | 508 (15.9%) |
| 4+ Person Household | 3,927 (78.6%) | 1,066 (21.3%) |
| Total Housing Units | 13,180 (83.7%) | 2,564 (16.3%) |
Occupancy by Educational Attainment in Chambers County
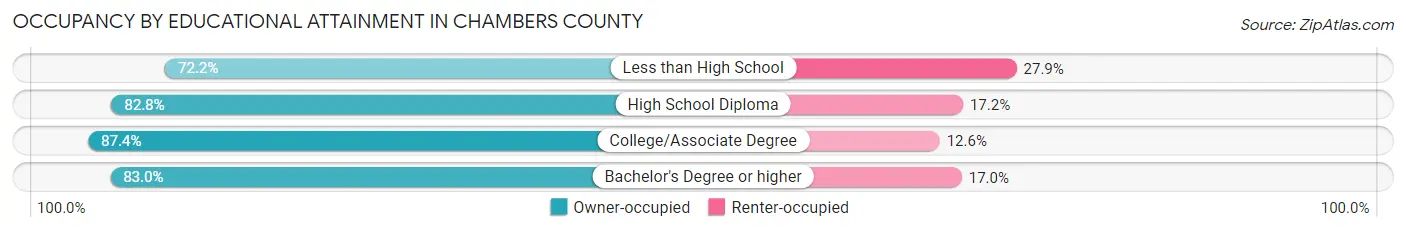
| Household Size | Owner-occupied | Renter-occupied |
| Less than High School | 1,018 (72.2%) | 393 (27.9%) |
| High School Diploma | 3,219 (82.8%) | 669 (17.2%) |
| College/Associate Degree | 5,418 (87.4%) | 781 (12.6%) |
| Bachelor's Degree or higher | 3,525 (83.0%) | 721 (17.0%) |
Occupancy by Age of Householder in Chambers County
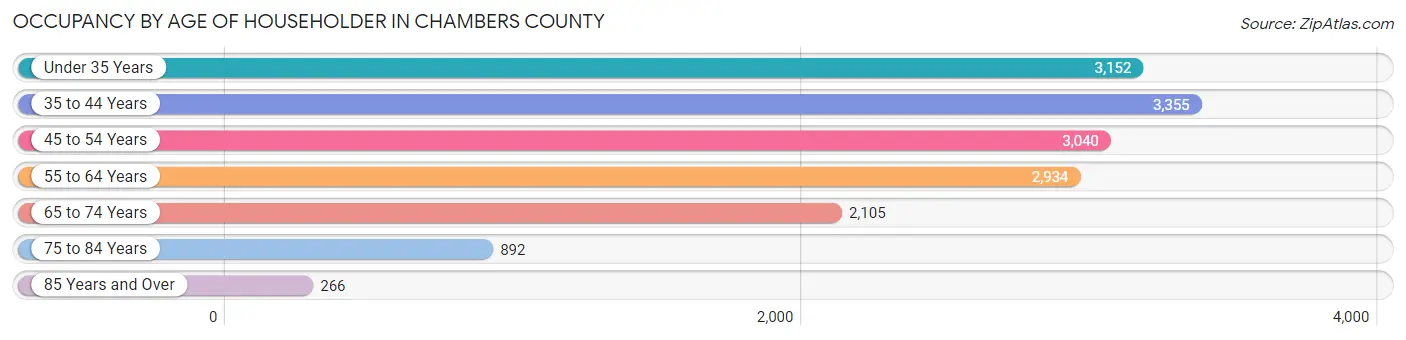
| Age Bracket | # Households | % Households |
| Under 35 Years | 3,152 | 20.0% |
| 35 to 44 Years | 3,355 | 21.3% |
| 45 to 54 Years | 3,040 | 19.3% |
| 55 to 64 Years | 2,934 | 18.6% |
| 65 to 74 Years | 2,105 | 13.4% |
| 75 to 84 Years | 892 | 5.7% |
| 85 Years and Over | 266 | 1.7% |
| Total | 15,744 | 100.0% |
Housing Finances in Chambers County
Median Income by Occupancy in Chambers County
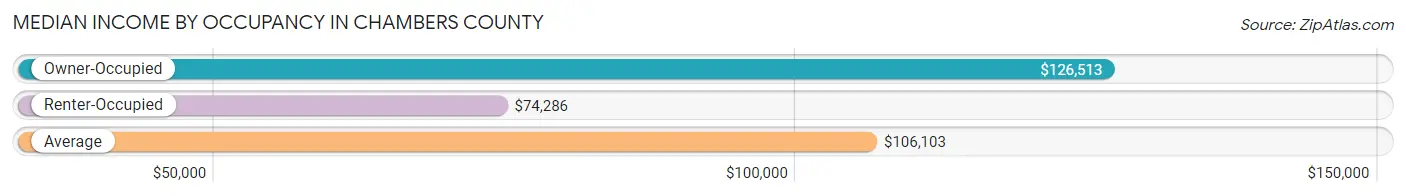
| Occupancy Type | # Households | Median Income |
| Owner-Occupied | 13,180 (83.7%) | $126,513 |
| Renter-Occupied | 2,564 (16.3%) | $74,286 |
| Average | 15,744 (100.0%) | $106,103 |
Occupancy by Householder Income Bracket in Chambers County
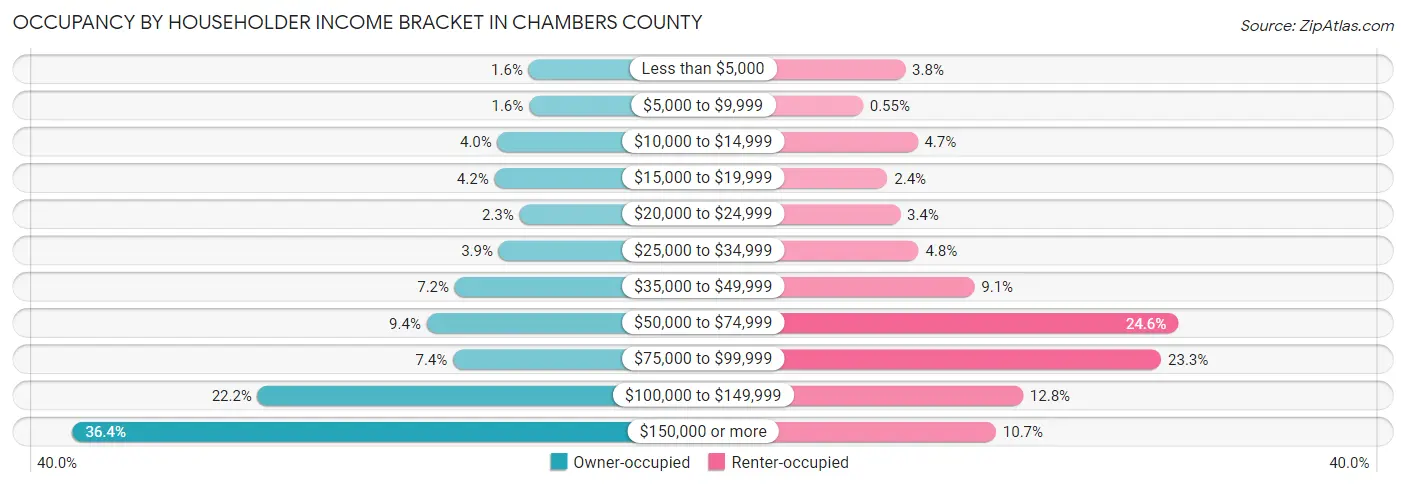
| Income Bracket | Owner-occupied | Renter-occupied |
| Less than $5,000 | 210 (1.6%) | 97 (3.8%) |
| $5,000 to $9,999 | 206 (1.6%) | 14 (0.5%) |
| $10,000 to $14,999 | 522 (4.0%) | 121 (4.7%) |
| $15,000 to $19,999 | 554 (4.2%) | 62 (2.4%) |
| $20,000 to $24,999 | 302 (2.3%) | 87 (3.4%) |
| $25,000 to $34,999 | 510 (3.9%) | 123 (4.8%) |
| $35,000 to $49,999 | 951 (7.2%) | 232 (9.0%) |
| $50,000 to $74,999 | 1,234 (9.4%) | 630 (24.6%) |
| $75,000 to $99,999 | 969 (7.3%) | 597 (23.3%) |
| $100,000 to $149,999 | 2,931 (22.2%) | 327 (12.8%) |
| $150,000 or more | 4,791 (36.3%) | 274 (10.7%) |
| Total | 13,180 (100.0%) | 2,564 (100.0%) |
Monthly Housing Cost Tiers in Chambers County
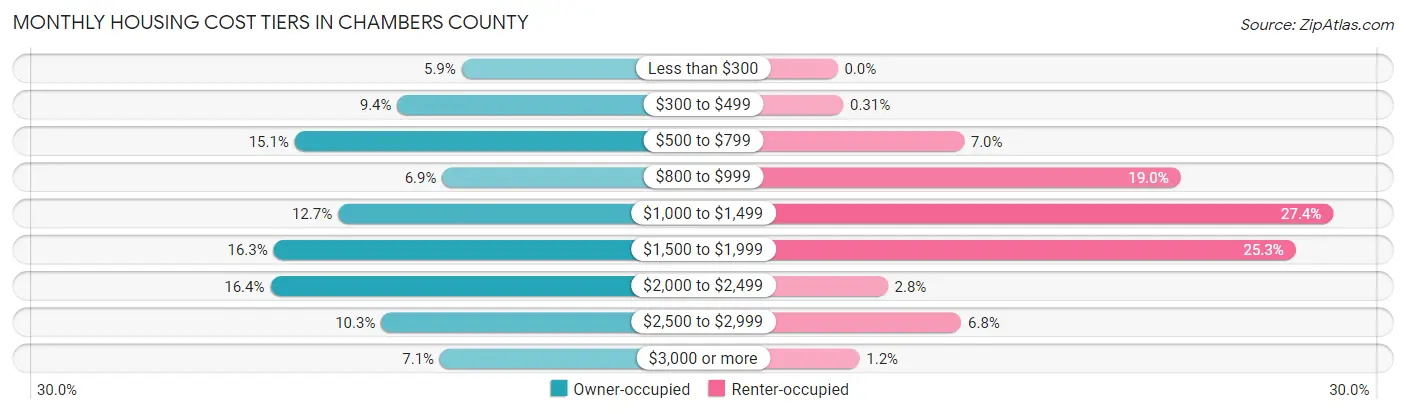
| Monthly Cost | Owner-occupied | Renter-occupied |
| Less than $300 | 772 (5.9%) | 0 (0.0%) |
| $300 to $499 | 1,240 (9.4%) | 8 (0.3%) |
| $500 to $799 | 1,987 (15.1%) | 179 (7.0%) |
| $800 to $999 | 914 (6.9%) | 486 (19.0%) |
| $1,000 to $1,499 | 1,672 (12.7%) | 702 (27.4%) |
| $1,500 to $1,999 | 2,142 (16.3%) | 649 (25.3%) |
| $2,000 to $2,499 | 2,166 (16.4%) | 71 (2.8%) |
| $2,500 to $2,999 | 1,357 (10.3%) | 175 (6.8%) |
| $3,000 or more | 930 (7.1%) | 31 (1.2%) |
| Total | 13,180 (100.0%) | 2,564 (100.0%) |
Physical Housing Characteristics in Chambers County
Housing Structures in Chambers County
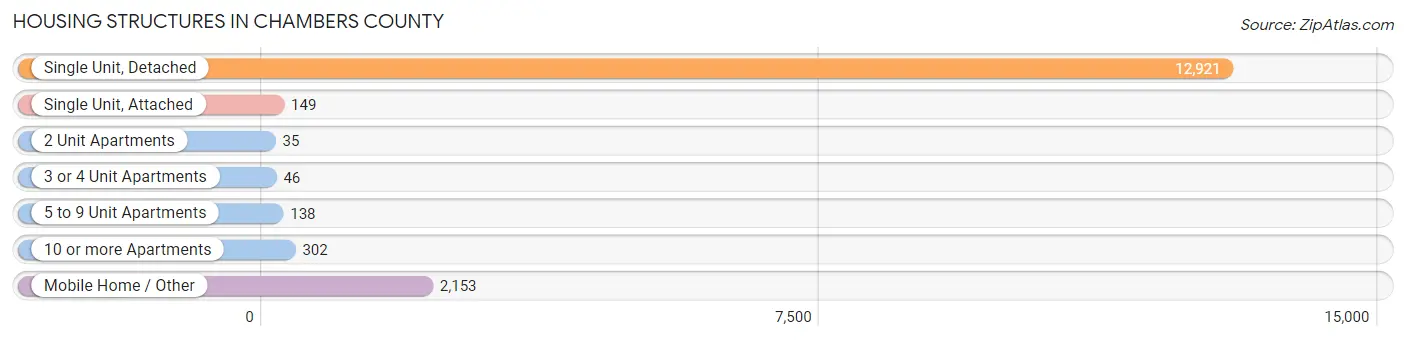
| Structure Type | # Housing Units | % Housing Units |
| Single Unit, Detached | 12,921 | 82.1% |
| Single Unit, Attached | 149 | 0.9% |
| 2 Unit Apartments | 35 | 0.2% |
| 3 or 4 Unit Apartments | 46 | 0.3% |
| 5 to 9 Unit Apartments | 138 | 0.9% |
| 10 or more Apartments | 302 | 1.9% |
| Mobile Home / Other | 2,153 | 13.7% |
| Total | 15,744 | 100.0% |
Housing Structures by Occupancy in Chambers County
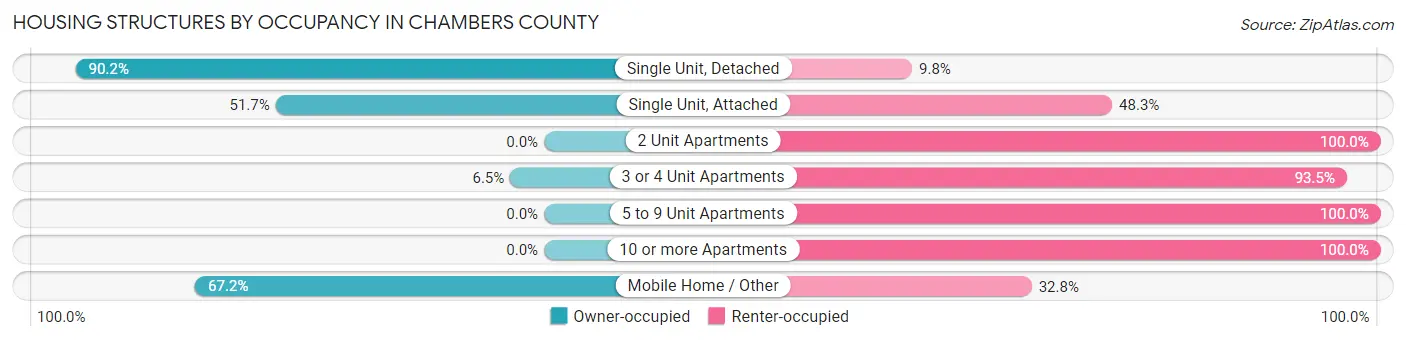
| Structure Type | Owner-occupied | Renter-occupied |
| Single Unit, Detached | 11,654 (90.2%) | 1,267 (9.8%) |
| Single Unit, Attached | 77 (51.7%) | 72 (48.3%) |
| 2 Unit Apartments | 0 (0.0%) | 35 (100.0%) |
| 3 or 4 Unit Apartments | 3 (6.5%) | 43 (93.5%) |
| 5 to 9 Unit Apartments | 0 (0.0%) | 138 (100.0%) |
| 10 or more Apartments | 0 (0.0%) | 302 (100.0%) |
| Mobile Home / Other | 1,446 (67.2%) | 707 (32.8%) |
| Total | 13,180 (83.7%) | 2,564 (16.3%) |
Housing Structures by Number of Rooms in Chambers County
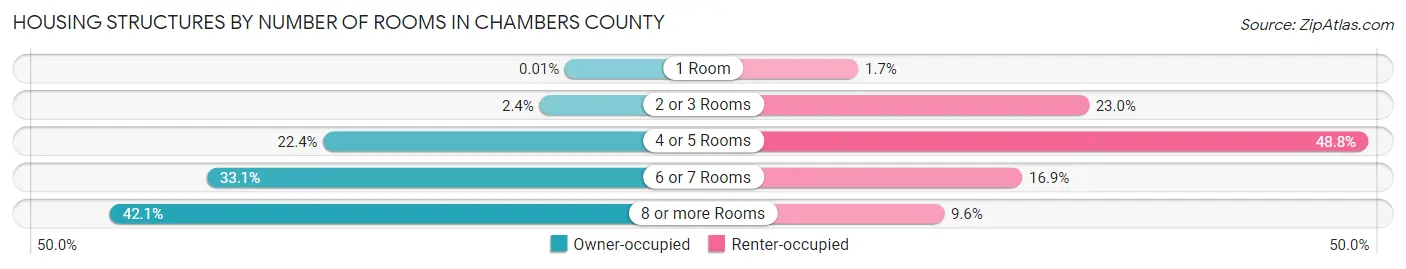
| Number of Rooms | Owner-occupied | Renter-occupied |
| 1 Room | 1 (0.0%) | 43 (1.7%) |
| 2 or 3 Rooms | 312 (2.4%) | 590 (23.0%) |
| 4 or 5 Rooms | 2,947 (22.4%) | 1,252 (48.8%) |
| 6 or 7 Rooms | 4,368 (33.1%) | 432 (16.9%) |
| 8 or more Rooms | 5,552 (42.1%) | 247 (9.6%) |
| Total | 13,180 (100.0%) | 2,564 (100.0%) |
Housing Structure by Heating Type in Chambers County
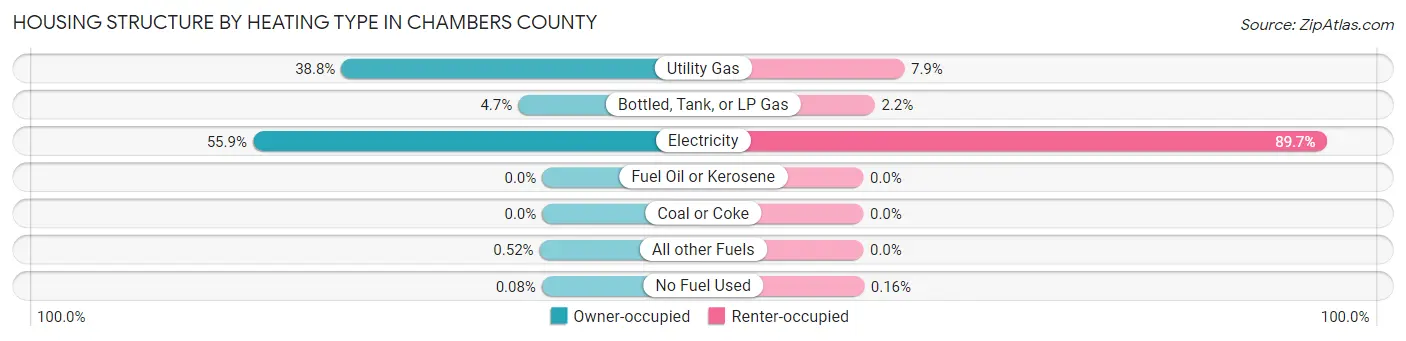
| Heating Type | Owner-occupied | Renter-occupied |
| Utility Gas | 5,117 (38.8%) | 203 (7.9%) |
| Bottled, Tank, or LP Gas | 613 (4.6%) | 57 (2.2%) |
| Electricity | 7,370 (55.9%) | 2,300 (89.7%) |
| Fuel Oil or Kerosene | 0 (0.0%) | 0 (0.0%) |
| Coal or Coke | 0 (0.0%) | 0 (0.0%) |
| All other Fuels | 69 (0.5%) | 0 (0.0%) |
| No Fuel Used | 11 (0.1%) | 4 (0.2%) |
| Total | 13,180 (100.0%) | 2,564 (100.0%) |
Household Vehicle Usage in Chambers County
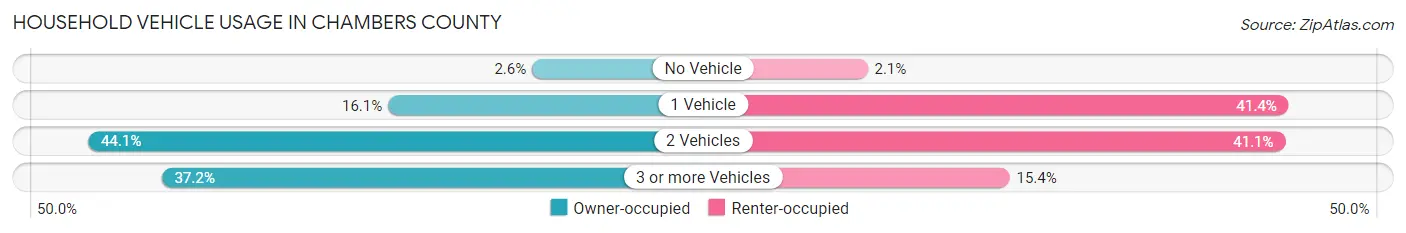
| Vehicles per Household | Owner-occupied | Renter-occupied |
| No Vehicle | 347 (2.6%) | 54 (2.1%) |
| 1 Vehicle | 2,118 (16.1%) | 1,062 (41.4%) |
| 2 Vehicles | 5,810 (44.1%) | 1,054 (41.1%) |
| 3 or more Vehicles | 4,905 (37.2%) | 394 (15.4%) |
| Total | 13,180 (100.0%) | 2,564 (100.0%) |
Real Estate & Mortgages in Chambers County
Real Estate and Mortgage Overview in Chambers County
| Characteristic | Without Mortgage | With Mortgage |
| Housing Units | 5,210 | 7,970 |
| Median Property Value | $219,500 | $302,300 |
| Median Household Income | $65,710 | $3,679 |
| Monthly Housing Costs | $575 | $920 |
| Real Estate Taxes | $1,725 | $309 |
Property Value by Mortgage Status in Chambers County
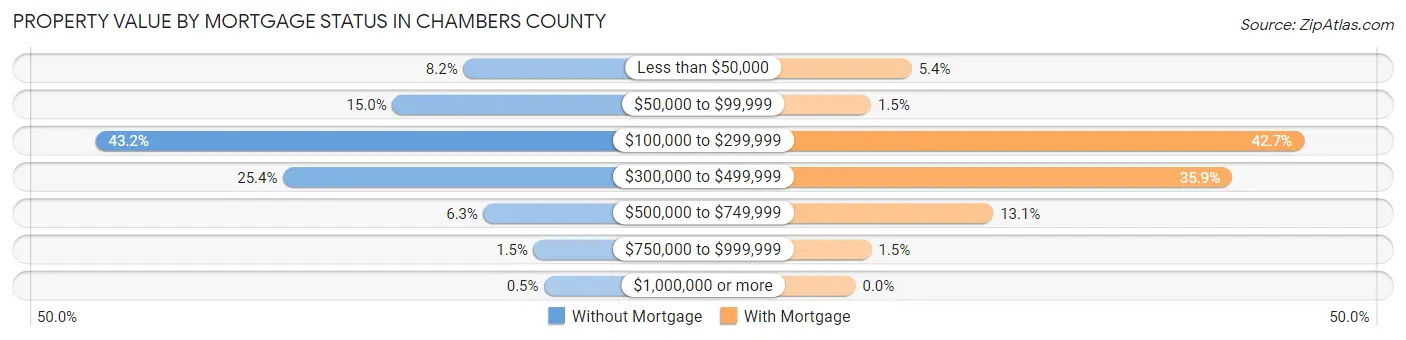
| Property Value | Without Mortgage | With Mortgage |
| Less than $50,000 | 427 (8.2%) | 426 (5.3%) |
| $50,000 to $99,999 | 779 (14.9%) | 117 (1.5%) |
| $100,000 to $299,999 | 2,253 (43.2%) | 3,403 (42.7%) |
| $300,000 to $499,999 | 1,321 (25.4%) | 2,858 (35.9%) |
| $500,000 to $749,999 | 326 (6.3%) | 1,045 (13.1%) |
| $750,000 to $999,999 | 78 (1.5%) | 121 (1.5%) |
| $1,000,000 or more | 26 (0.5%) | 0 (0.0%) |
| Total | 5,210 (100.0%) | 7,970 (100.0%) |
Household Income by Mortgage Status in Chambers County
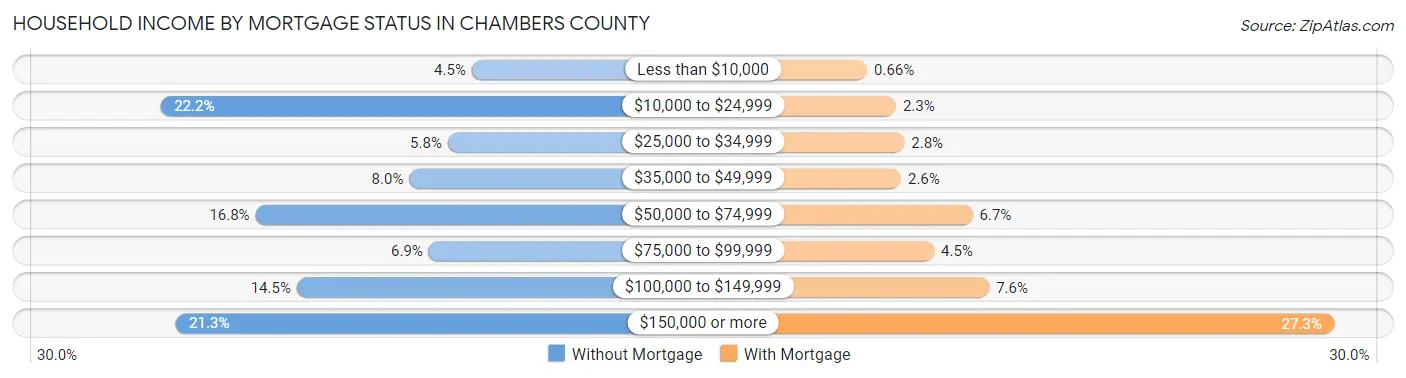
| Household Income | Without Mortgage | With Mortgage |
| Less than $10,000 | 232 (4.4%) | 53 (0.7%) |
| $10,000 to $24,999 | 1,156 (22.2%) | 184 (2.3%) |
| $25,000 to $34,999 | 303 (5.8%) | 222 (2.8%) |
| $35,000 to $49,999 | 418 (8.0%) | 207 (2.6%) |
| $50,000 to $74,999 | 876 (16.8%) | 533 (6.7%) |
| $75,000 to $99,999 | 360 (6.9%) | 358 (4.5%) |
| $100,000 to $149,999 | 753 (14.4%) | 609 (7.6%) |
| $150,000 or more | 1,112 (21.3%) | 2,178 (27.3%) |
| Total | 5,210 (100.0%) | 7,970 (100.0%) |
Property Value to Household Income Ratio in Chambers County
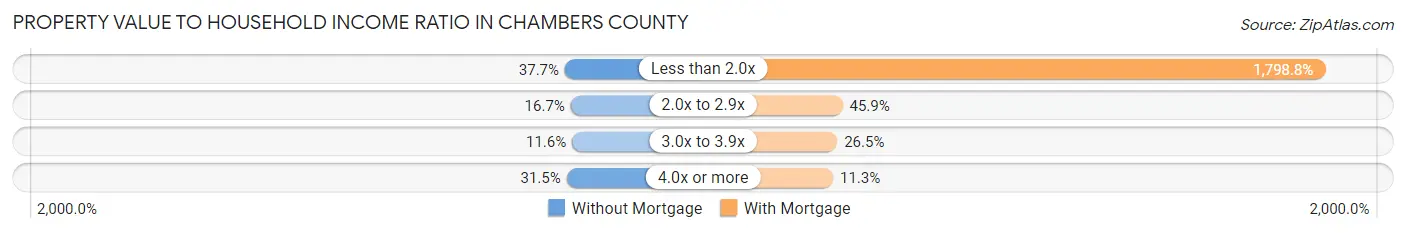
| Value-to-Income Ratio | Without Mortgage | With Mortgage |
| Less than 2.0x | 1,965 (37.7%) | 143,362 (1,798.8%) |
| 2.0x to 2.9x | 868 (16.7%) | 3,661 (45.9%) |
| 3.0x to 3.9x | 605 (11.6%) | 2,110 (26.5%) |
| 4.0x or more | 1,642 (31.5%) | 904 (11.3%) |
| Total | 5,210 (100.0%) | 7,970 (100.0%) |
Real Estate Taxes by Mortgage Status in Chambers County
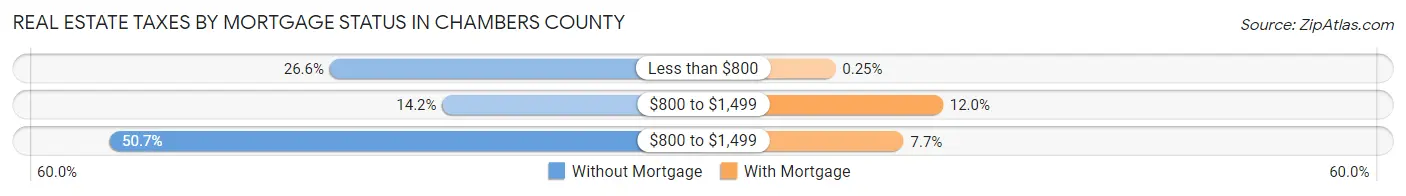
| Property Taxes | Without Mortgage | With Mortgage |
| Less than $800 | 1,383 (26.6%) | 20 (0.3%) |
| $800 to $1,499 | 741 (14.2%) | 959 (12.0%) |
| $800 to $1,499 | 2,643 (50.7%) | 616 (7.7%) |
| Total | 5,210 (100.0%) | 7,970 (100.0%) |
Health & Disability in Chambers County
Health Insurance Coverage by Age in Chambers County
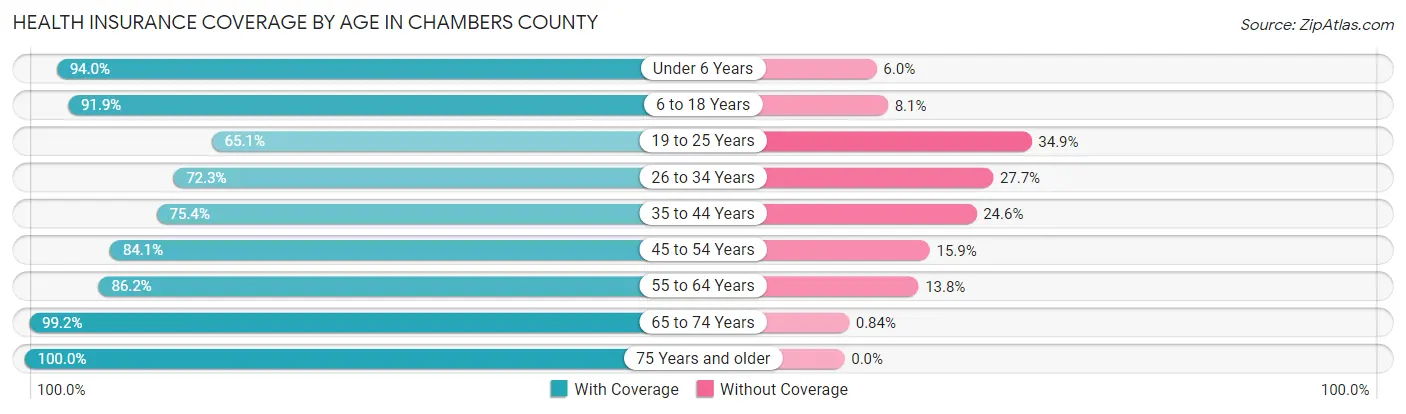
| Age Bracket | With Coverage | Without Coverage |
| Under 6 Years | 3,814 (94.0%) | 243 (6.0%) |
| 6 to 18 Years | 8,525 (91.9%) | 750 (8.1%) |
| 19 to 25 Years | 3,032 (65.1%) | 1,624 (34.9%) |
| 26 to 34 Years | 3,706 (72.3%) | 1,421 (27.7%) |
| 35 to 44 Years | 5,197 (75.4%) | 1,696 (24.6%) |
| 45 to 54 Years | 5,103 (84.1%) | 965 (15.9%) |
| 55 to 64 Years | 4,366 (86.2%) | 698 (13.8%) |
| 65 to 74 Years | 3,759 (99.2%) | 32 (0.8%) |
| 75 Years and older | 1,750 (100.0%) | 0 (0.0%) |
| Total | 39,252 (84.1%) | 7,429 (15.9%) |
Health Insurance Coverage by Citizenship Status in Chambers County
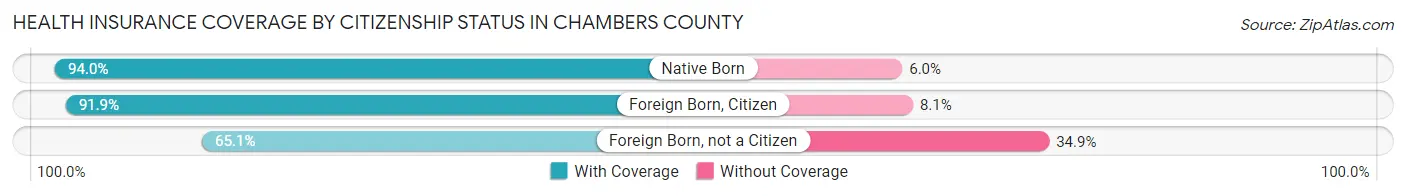
| Citizenship Status | With Coverage | Without Coverage |
| Native Born | 3,814 (94.0%) | 243 (6.0%) |
| Foreign Born, Citizen | 8,525 (91.9%) | 750 (8.1%) |
| Foreign Born, not a Citizen | 3,032 (65.1%) | 1,624 (34.9%) |
Health Insurance Coverage by Household Income in Chambers County
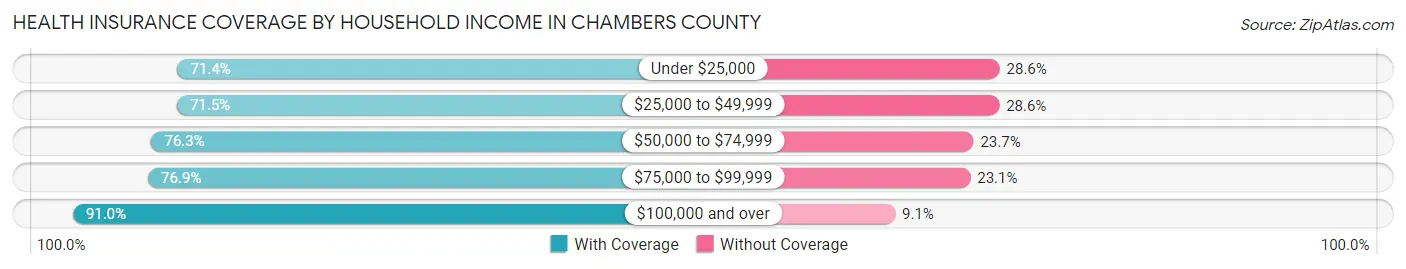
| Household Income | With Coverage | Without Coverage |
| Under $25,000 | 3,503 (71.4%) | 1,405 (28.6%) |
| $25,000 to $49,999 | 3,231 (71.5%) | 1,291 (28.5%) |
| $50,000 to $74,999 | 3,402 (76.3%) | 1,059 (23.7%) |
| $75,000 to $99,999 | 3,853 (76.9%) | 1,160 (23.1%) |
| $100,000 and over | 25,263 (90.9%) | 2,514 (9.0%) |
Public vs Private Health Insurance Coverage by Age in Chambers County
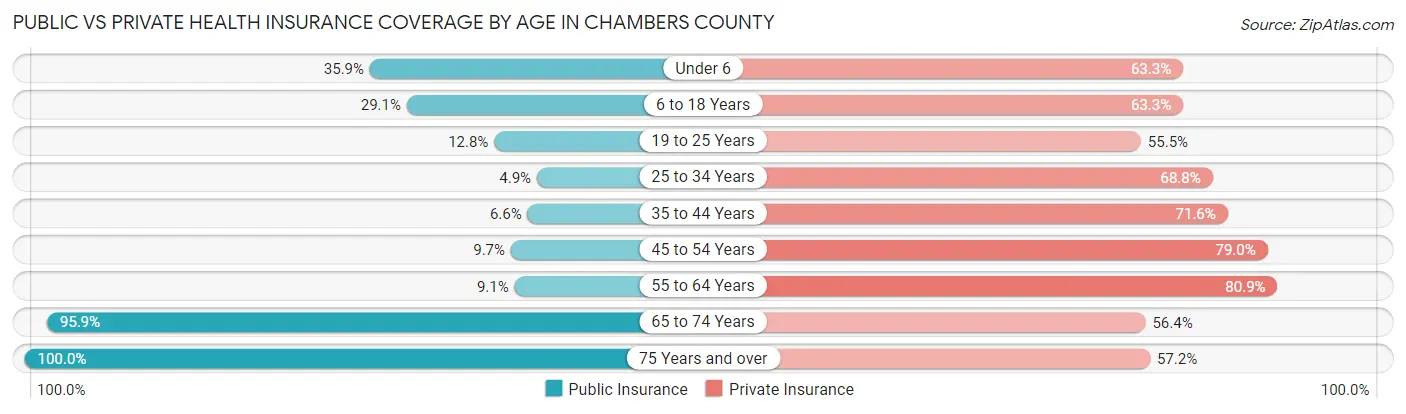
| Age Bracket | Public Insurance | Private Insurance |
| Under 6 | 1,457 (35.9%) | 2,569 (63.3%) |
| 6 to 18 Years | 2,695 (29.1%) | 5,874 (63.3%) |
| 19 to 25 Years | 598 (12.8%) | 2,585 (55.5%) |
| 25 to 34 Years | 251 (4.9%) | 3,528 (68.8%) |
| 35 to 44 Years | 458 (6.6%) | 4,936 (71.6%) |
| 45 to 54 Years | 591 (9.7%) | 4,795 (79.0%) |
| 55 to 64 Years | 459 (9.1%) | 4,094 (80.8%) |
| 65 to 74 Years | 3,634 (95.9%) | 2,137 (56.4%) |
| 75 Years and over | 1,750 (100.0%) | 1,001 (57.2%) |
| Total | 11,893 (25.5%) | 31,519 (67.5%) |
Disability Status by Sex by Age in Chambers County
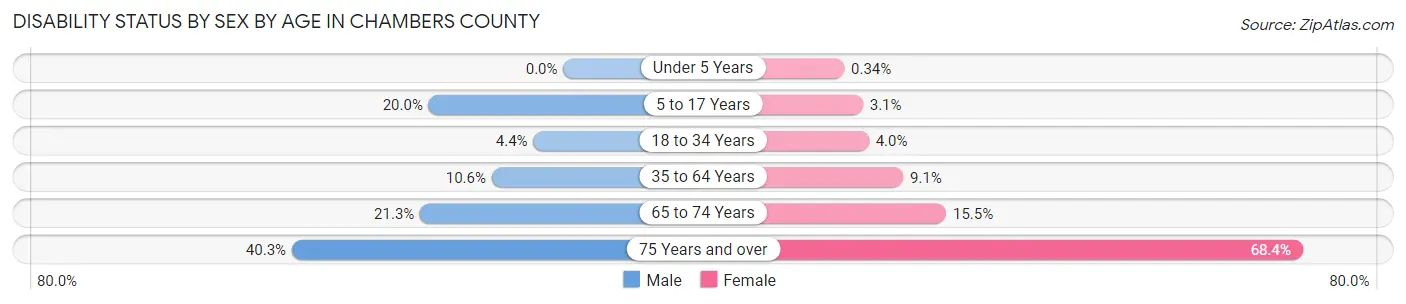
| Age Bracket | Male | Female |
| Under 5 Years | 0 (0.0%) | 5 (0.3%) |
| 5 to 17 Years | 1,039 (20.0%) | 142 (3.1%) |
| 18 to 34 Years | 230 (4.4%) | 203 (4.0%) |
| 35 to 64 Years | 972 (10.6%) | 808 (9.1%) |
| 65 to 74 Years | 431 (21.3%) | 273 (15.5%) |
| 75 Years and over | 335 (40.3%) | 629 (68.4%) |
Disability Class by Sex by Age in Chambers County
Disability Class: Hearing Difficulty
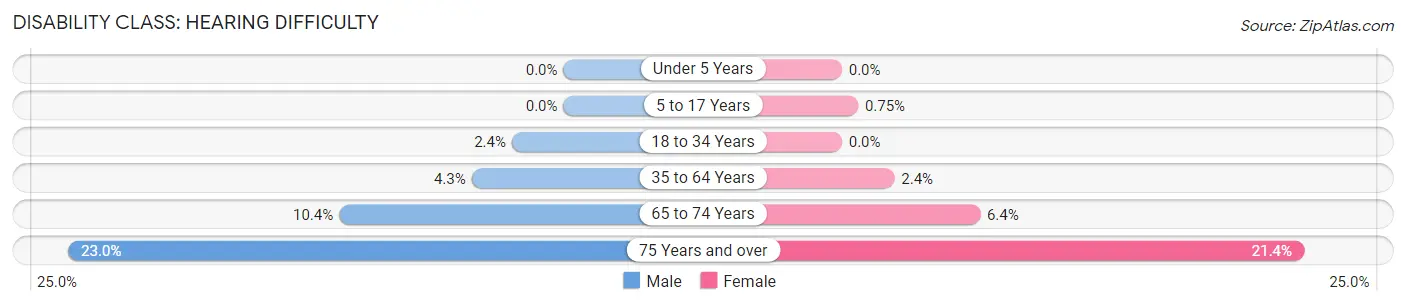
| Age Bracket | Male | Female |
| Under 5 Years | 0 (0.0%) | 0 (0.0%) |
| 5 to 17 Years | 0 (0.0%) | 34 (0.7%) |
| 18 to 34 Years | 124 (2.4%) | 0 (0.0%) |
| 35 to 64 Years | 389 (4.3%) | 217 (2.4%) |
| 65 to 74 Years | 211 (10.4%) | 113 (6.4%) |
| 75 Years and over | 191 (23.0%) | 197 (21.4%) |
Disability Class: Vision Difficulty
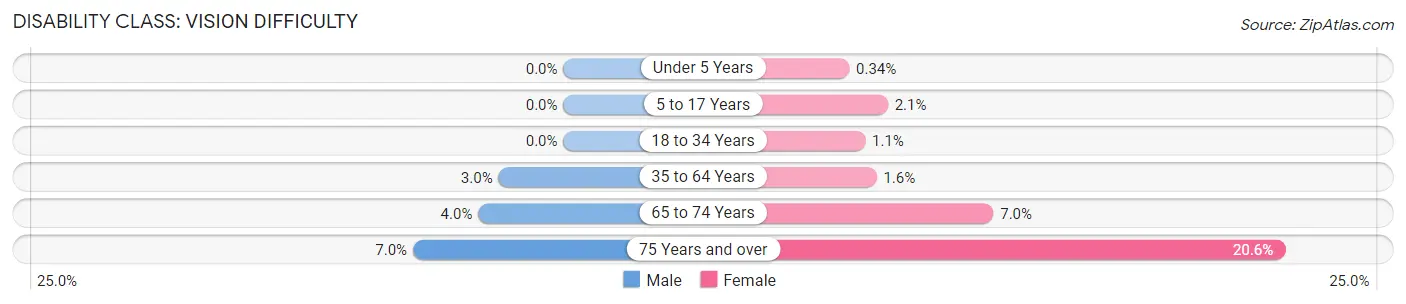
| Age Bracket | Male | Female |
| Under 5 Years | 0 (0.0%) | 5 (0.3%) |
| 5 to 17 Years | 0 (0.0%) | 97 (2.1%) |
| 18 to 34 Years | 0 (0.0%) | 55 (1.1%) |
| 35 to 64 Years | 275 (3.0%) | 143 (1.6%) |
| 65 to 74 Years | 80 (4.0%) | 124 (7.0%) |
| 75 Years and over | 58 (7.0%) | 189 (20.6%) |
Disability Class: Cognitive Difficulty
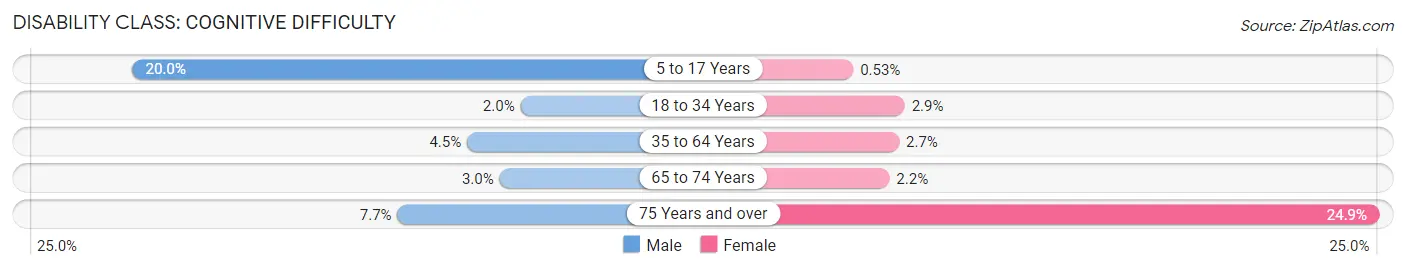
| Age Bracket | Male | Female |
| 5 to 17 Years | 1,039 (20.0%) | 24 (0.5%) |
| 18 to 34 Years | 103 (2.0%) | 148 (2.9%) |
| 35 to 64 Years | 409 (4.5%) | 236 (2.7%) |
| 65 to 74 Years | 60 (3.0%) | 39 (2.2%) |
| 75 Years and over | 64 (7.7%) | 229 (24.9%) |
Disability Class: Ambulatory Difficulty
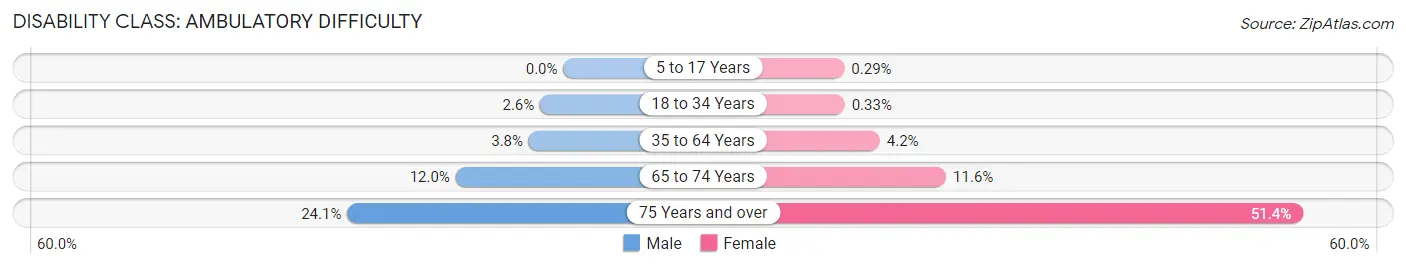
| Age Bracket | Male | Female |
| 5 to 17 Years | 0 (0.0%) | 13 (0.3%) |
| 18 to 34 Years | 134 (2.6%) | 17 (0.3%) |
| 35 to 64 Years | 351 (3.8%) | 377 (4.2%) |
| 65 to 74 Years | 243 (12.0%) | 205 (11.6%) |
| 75 Years and over | 200 (24.1%) | 472 (51.4%) |
Disability Class: Self-Care Difficulty
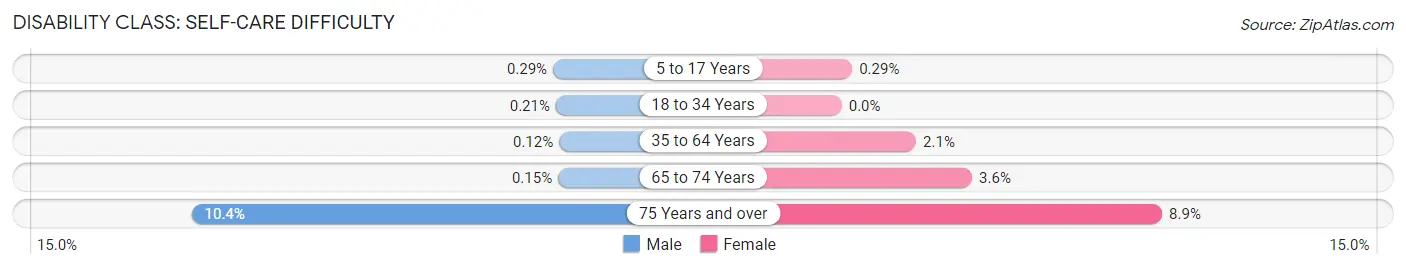
| Age Bracket | Male | Female |
| 5 to 17 Years | 15 (0.3%) | 13 (0.3%) |
| 18 to 34 Years | 11 (0.2%) | 0 (0.0%) |
| 35 to 64 Years | 11 (0.1%) | 184 (2.1%) |
| 65 to 74 Years | 3 (0.2%) | 64 (3.6%) |
| 75 Years and over | 86 (10.3%) | 82 (8.9%) |
Technology Access in Chambers County
Computing Device Access in Chambers County
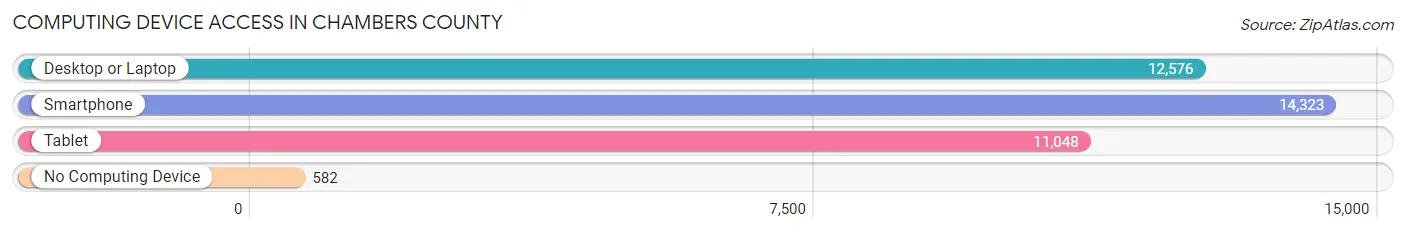
| Device Type | # Households | % Households |
| Desktop or Laptop | 12,576 | 79.9% |
| Smartphone | 14,323 | 91.0% |
| Tablet | 11,048 | 70.2% |
| No Computing Device | 582 | 3.7% |
| Total | 15,744 | 100.0% |
Internet Access in Chambers County
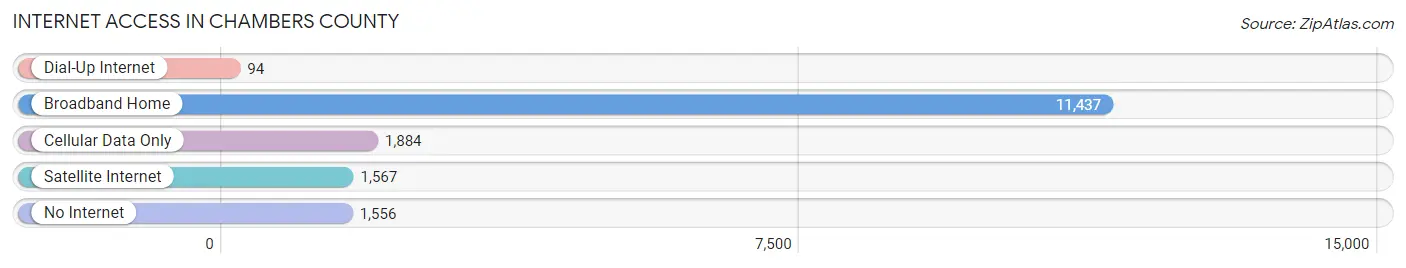
| Internet Type | # Households | % Households |
| Dial-Up Internet | 94 | 0.6% |
| Broadband Home | 11,437 | 72.6% |
| Cellular Data Only | 1,884 | 12.0% |
| Satellite Internet | 1,567 | 10.0% |
| No Internet | 1,556 | 9.9% |
| Total | 15,744 | 100.0% |
Chambers County Summary
Chambers County is located in the southeastern part of Texas, and is part of the Houston-The Woodlands-Sugar Land Metropolitan Statistical Area. The county is bordered by Harris County to the north, Liberty County to the east, Galveston County to the south, and Jefferson County to the west. Chambers County covers an area of 877 square miles and has a population of 35,096, according to the 2010 census.
History
Chambers County was established in 1858 and named after Thomas Jefferson Chambers, a signer of the Texas Declaration of Independence. The county was originally part of Liberty County, but was later divided into its own county. The county seat is Anahuac, which was named after the Mexican town of the same name.
The county was home to the Karankawa Indians, who were the first inhabitants of the area. The first European settlers arrived in the area in the early 1800s, and the county was officially established in 1858.
Geography
Chambers County is located in the southeastern part of Texas, and is part of the Houston-The Woodlands-Sugar Land Metropolitan Statistical Area. The county is bordered by Harris County to the north, Liberty County to the east, Galveston County to the south, and Jefferson County to the west. Chambers County covers an area of 877 square miles and has a population of 35,096, according to the 2010 census.
The terrain of Chambers County is mostly flat, with some rolling hills in the northern part of the county. The Trinity River forms the northern border of the county, and the San Jacinto River forms the eastern border. The county is home to several bayous, including the Trinity, San Jacinto, and East Bayou.
Economy
The economy of Chambers County is largely based on agriculture and oil and gas production. The county is home to several large oil and gas companies, including Chevron, Shell, and ExxonMobil. Agriculture is also an important part of the economy, with the county producing a variety of crops, including cotton, corn, soybeans, and wheat.
The county is also home to several manufacturing companies, including a paper mill, a chemical plant, and a steel mill. The county is also home to several retail stores, restaurants, and other businesses.
Demographics
According to the 2010 census, the population of Chambers County was 35,096. The population is made up of a variety of ethnic and racial groups, including White (63.3%), African American (17.2%), Hispanic or Latino (14.7%), and Asian (2.2%).
The median household income in Chambers County is $45,945, and the median family income is $54,945. The county has a poverty rate of 16.3%, and the unemployment rate is 5.2%.
Conclusion
Chambers County is located in the southeastern part of Texas, and is part of the Houston-The Woodlands-Sugar Land Metropolitan Statistical Area. The county was established in 1858 and is named after Thomas Jefferson Chambers, a signer of the Texas Declaration of Independence. The county covers an area of 877 square miles and has a population of 35,096, according to the 2010 census. The economy of Chambers County is largely based on agriculture and oil and gas production, and the county is home to a variety of ethnic and racial groups.
Common Questions
What is Per Capita Income in Chambers County?
Per Capita income in Chambers County is $42,628.
What is the Median Family Income in Chambers County?
Median Family Income in Chambers County is $130,195.
What is the Median Household income in Chambers County?
Median Household Income in Chambers County is $106,103.
What is Income or Wage Gap in Chambers County?
Income or Wage Gap in Chambers County is 42.6%.
Women in Chambers County earn 57.4 cents for every dollar earned by a man.
What is Family Income Deficit in Chambers County?
Family Income Deficit in Chambers County is $14,339.
Families that are below poverty line in Chambers County earn $14,339 less on average than the poverty threshold level.
What is Inequality or Gini Index in Chambers County?
Inequality or Gini Index in Chambers County is 0.42.
What is the Total Population of Chambers County?
Total Population of Chambers County is 47,037.
What is the Total Male Population of Chambers County?
Total Male Population of Chambers County is 24,269.
What is the Total Female Population of Chambers County?
Total Female Population of Chambers County is 22,768.
What is the Ratio of Males per 100 Females in Chambers County?
There are 106.59 Males per 100 Females in Chambers County.
What is the Ratio of Females per 100 Males in Chambers County?
There are 93.82 Females per 100 Males in Chambers County.
What is the Median Population Age in Chambers County?
Median Population Age in Chambers County is 35.4 Years.
What is the Average Family Size in Chambers County
Average Family Size in Chambers County is 3.3 People.
What is the Average Household Size in Chambers County
Average Household Size in Chambers County is 3.0 People.
How Large is the Labor Force in Chambers County?
There are 23,812 People in the Labor Forcein in Chambers County.
What is the Percentage of People in the Labor Force in Chambers County?
67.0% of People are in the Labor Force in Chambers County.
What is the Unemployment Rate in Chambers County?
Unemployment Rate in Chambers County is 7.5%.