Castro County, TX Map & Demographics
Castro County Map
Castro County Overview
$25,425
PER CAPITA INCOME
$61,098
AVG FAMILY INCOME
$59,886
AVG HOUSEHOLD INCOME
41.2%
WAGE / INCOME GAP [ % ]
58.8¢/ $1
WAGE / INCOME GAP [ $ ]
$12,900
FAMILY INCOME DEFICIT
0.42
INEQUALITY / GINI INDEX
7,381
TOTAL POPULATION
3,780
MALE POPULATION
3,601
FEMALE POPULATION
104.97
MALES / 100 FEMALES
95.26
FEMALES / 100 MALES
34.8
MEDIAN AGE
3.6
AVG FAMILY SIZE
3.1
AVG HOUSEHOLD SIZE
3,594
LABOR FORCE [ PEOPLE ]
66.5%
PERCENT IN LABOR FORCE
3.6%
UNEMPLOYMENT RATE
Castro County Area Codes
Income in Castro County
Income Overview in Castro County
Per Capita Income in Castro County is $25,425, while median incomes of families and households are $61,098 and $59,886 respectively.
| Characteristic | Number | Measure |
| Per Capita Income | 7,381 | $25,425 |
| Median Family Income | 1,828 | $61,098 |
| Mean Family Income | 1,828 | $79,554 |
| Median Household Income | 2,384 | $59,886 |
| Mean Household Income | 2,384 | $73,212 |
| Income Deficit | 1,828 | $12,900 |
| Wage / Income Gap (%) | 7,381 | 41.20% |
| Wage / Income Gap ($) | 7,381 | 58.80¢ per $1 |
| Gini / Inequality Index | 7,381 | 0.42 |
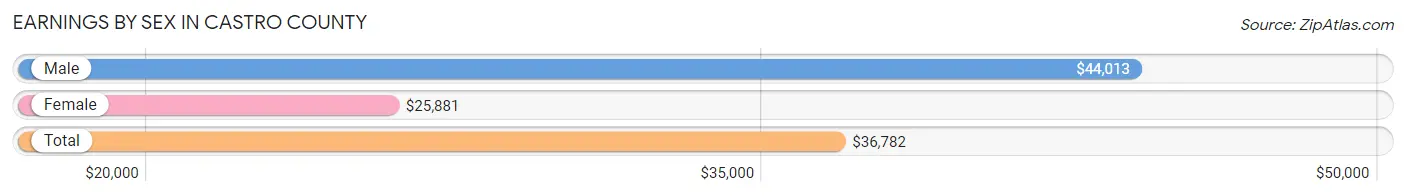
Earnings by Sex in Castro County
Average Earnings in Castro County are $36,782, $44,013 for men and $25,881 for women, a difference of 41.2%.
| Sex | Number | Average Earnings |
| Male | 2,212 (59.0%) | $44,013 |
| Female | 1,536 (41.0%) | $25,881 |
| Total | 3,748 (100.0%) | $36,782 |
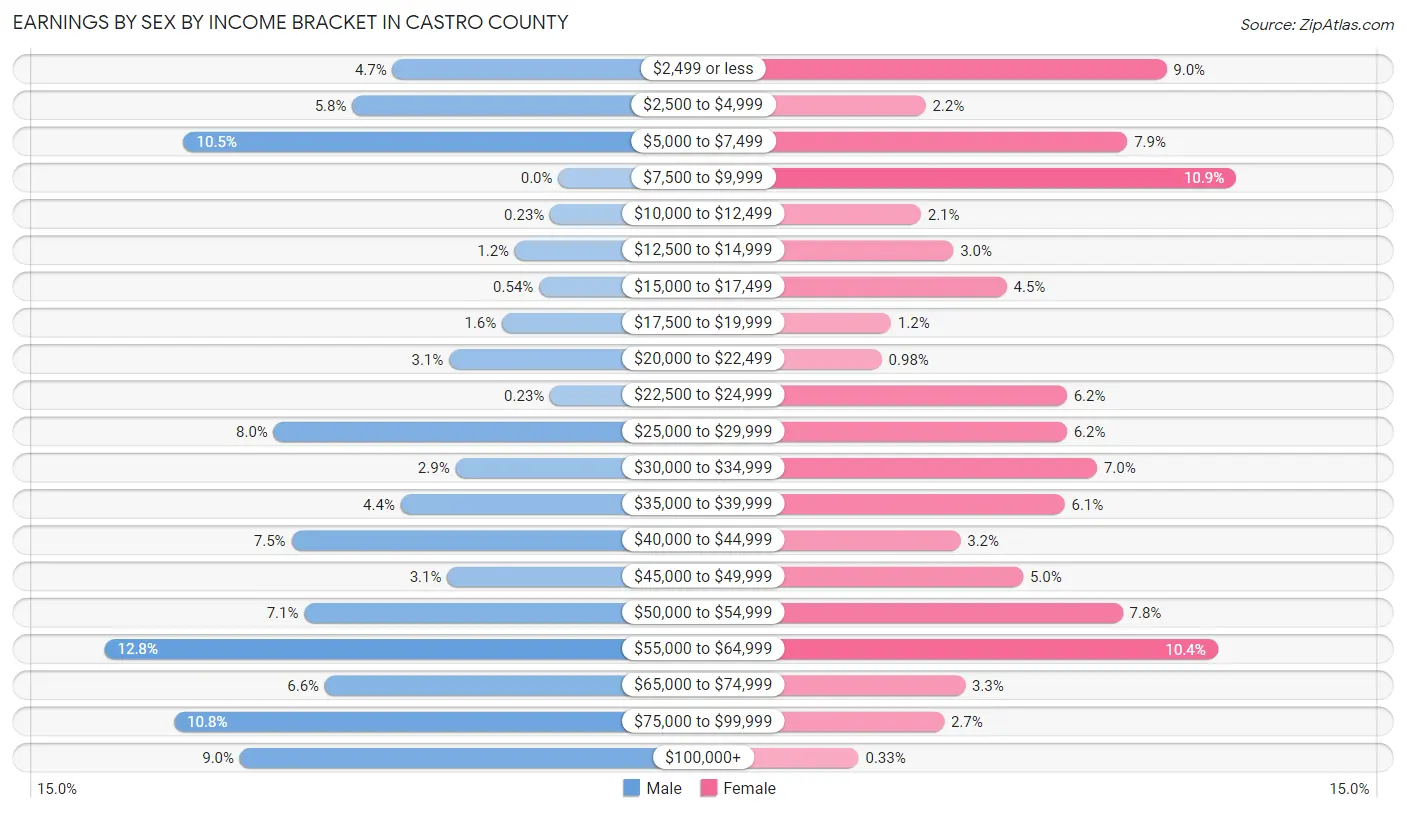
Earnings by Sex by Income Bracket in Castro County
The most common earnings brackets in Castro County are $55,000 to $64,999 for men (282 | 12.8%) and $7,500 to $9,999 for women (168 | 10.9%).
| Income | Male | Female |
| $2,499 or less | 103 (4.7%) | 138 (9.0%) |
| $2,500 to $4,999 | 128 (5.8%) | 34 (2.2%) |
| $5,000 to $7,499 | 233 (10.5%) | 121 (7.9%) |
| $7,500 to $9,999 | 0 (0.0%) | 168 (10.9%) |
| $10,000 to $12,499 | 5 (0.2%) | 32 (2.1%) |
| $12,500 to $14,999 | 27 (1.2%) | 46 (3.0%) |
| $15,000 to $17,499 | 12 (0.5%) | 69 (4.5%) |
| $17,500 to $19,999 | 35 (1.6%) | 19 (1.2%) |
| $20,000 to $22,499 | 68 (3.1%) | 15 (1.0%) |
| $22,500 to $24,999 | 5 (0.2%) | 95 (6.2%) |
| $25,000 to $29,999 | 177 (8.0%) | 95 (6.2%) |
| $30,000 to $34,999 | 64 (2.9%) | 108 (7.0%) |
| $35,000 to $39,999 | 98 (4.4%) | 94 (6.1%) |
| $40,000 to $44,999 | 166 (7.5%) | 49 (3.2%) |
| $45,000 to $49,999 | 69 (3.1%) | 76 (5.0%) |
| $50,000 to $54,999 | 158 (7.1%) | 119 (7.7%) |
| $55,000 to $64,999 | 282 (12.8%) | 160 (10.4%) |
| $65,000 to $74,999 | 145 (6.6%) | 51 (3.3%) |
| $75,000 to $99,999 | 239 (10.8%) | 42 (2.7%) |
| $100,000+ | 198 (8.9%) | 5 (0.3%) |
| Total | 2,212 (100.0%) | 1,536 (100.0%) |
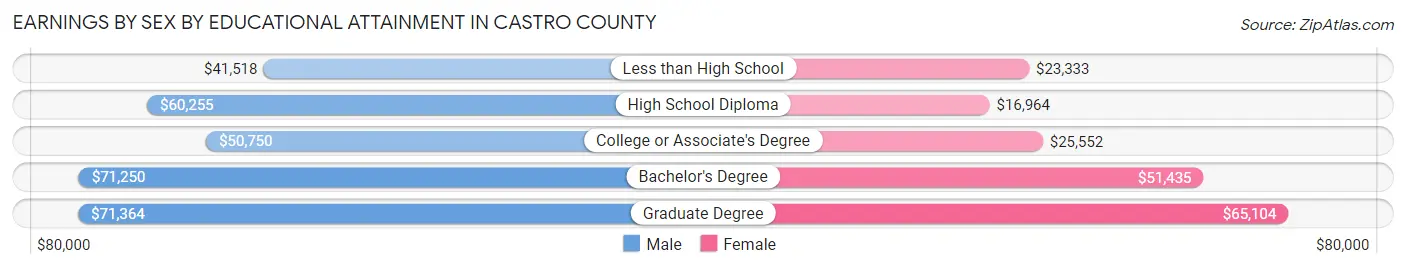
Earnings by Sex by Educational Attainment in Castro County
Average earnings in Castro County are $52,341 for men and $27,073 for women, a difference of 48.3%. Men with an educational attainment of graduate degree enjoy the highest average annual earnings of $71,364, while those with less than high school education earn the least with $41,518. Women with an educational attainment of graduate degree earn the most with the average annual earnings of $65,104, while those with high school diploma education have the smallest earnings of $16,964.
| Educational Attainment | Male Income | Female Income |
| Less than High School | $41,518 | $23,333 |
| High School Diploma | $60,255 | $16,964 |
| College or Associate's Degree | $50,750 | $25,552 |
| Bachelor's Degree | $71,250 | $51,435 |
| Graduate Degree | $71,364 | $65,104 |
| Total | $52,341 | $27,073 |
Family Income in Castro County
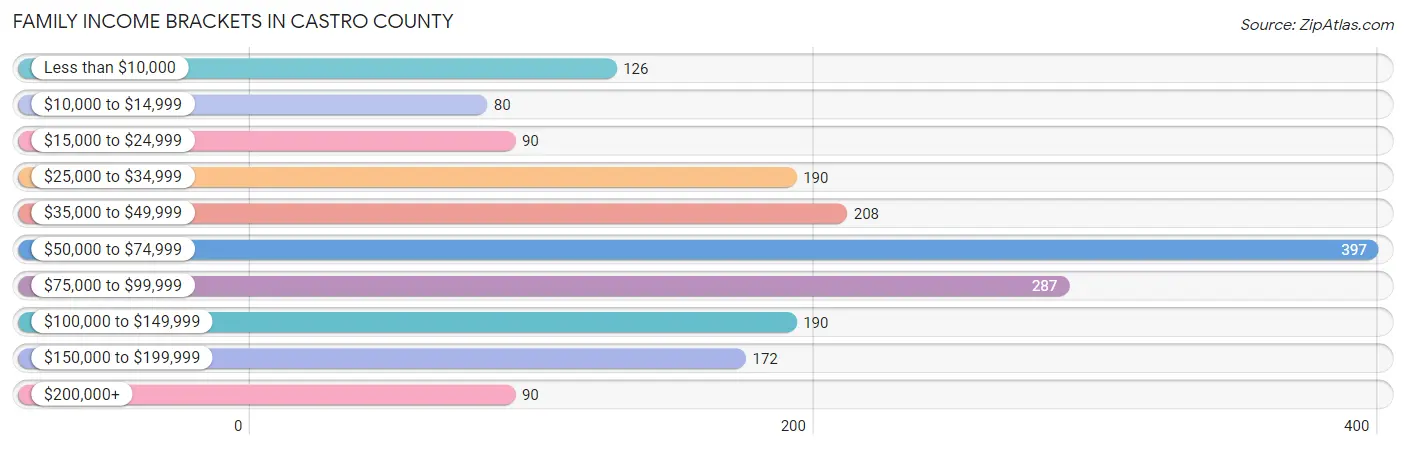
Family Income Brackets in Castro County
According to the Castro County family income data, there are 397 families falling into the $50,000 to $74,999 income range, which is the most common income bracket and makes up 21.7% of all families. Conversely, the $10,000 to $14,999 income bracket is the least frequent group with only 80 families (4.4%) belonging to this category.
| Income Bracket | # Families | % Families |
| Less than $10,000 | 126 | 6.9% |
| $10,000 to $14,999 | 80 | 4.4% |
| $15,000 to $24,999 | 90 | 4.9% |
| $25,000 to $34,999 | 190 | 10.4% |
| $35,000 to $49,999 | 208 | 11.4% |
| $50,000 to $74,999 | 397 | 21.7% |
| $75,000 to $99,999 | 287 | 15.7% |
| $100,000 to $149,999 | 190 | 10.4% |
| $150,000 to $199,999 | 172 | 9.4% |
| $200,000+ | 90 | 4.9% |
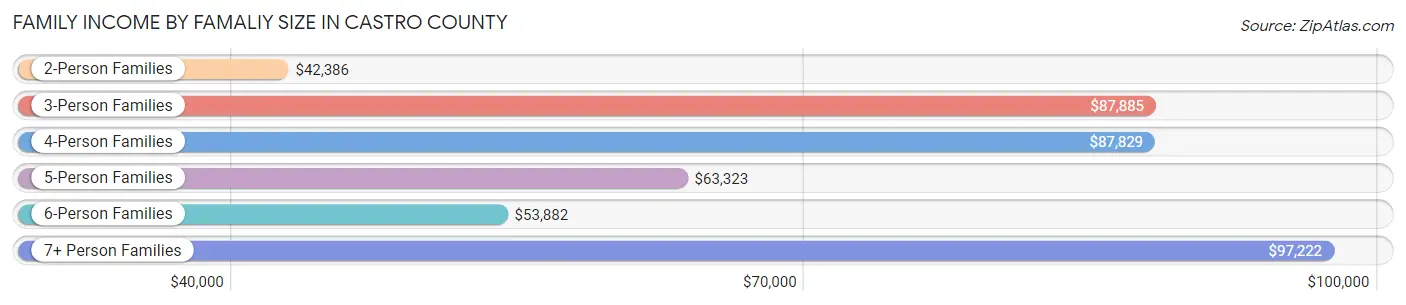
Family Income by Famaliy Size in Castro County
7+ person families (64 | 3.5%) account for the highest median family income in Castro County with $97,222 per family, while 3-person families (340 | 18.6%) have the highest median income of $29,295 per family member.
| Income Bracket | # Families | Median Income |
| 2-Person Families | 747 (40.9%) | $42,386 |
| 3-Person Families | 340 (18.6%) | $87,885 |
| 4-Person Families | 393 (21.5%) | $87,829 |
| 5-Person Families | 161 (8.8%) | $63,323 |
| 6-Person Families | 123 (6.7%) | $53,882 |
| 7+ Person Families | 64 (3.5%) | $97,222 |
| Total | 1,828 (100.0%) | $61,098 |
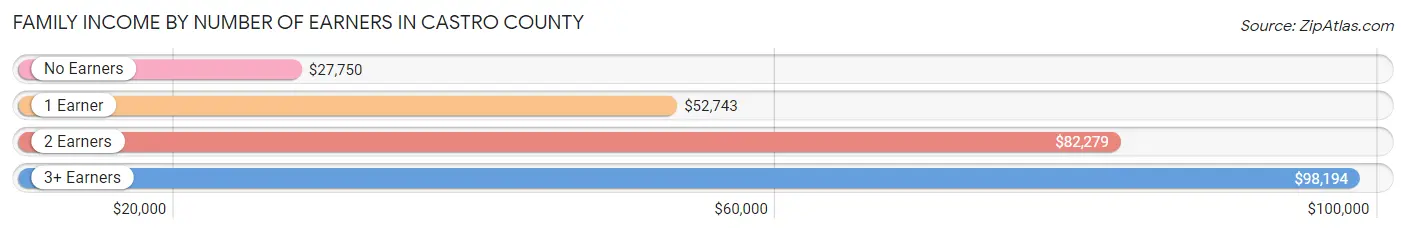
Family Income by Number of Earners in Castro County
The median family income in Castro County is $61,098, with families comprising 3+ earners (197) having the highest median family income of $98,194, while families with no earners (212) have the lowest median family income of $27,750, accounting for 10.8% and 11.6% of families, respectively.
| Number of Earners | # Families | Median Income |
| No Earners | 212 (11.6%) | $27,750 |
| 1 Earner | 625 (34.2%) | $52,743 |
| 2 Earners | 794 (43.4%) | $82,279 |
| 3+ Earners | 197 (10.8%) | $98,194 |
| Total | 1,828 (100.0%) | $61,098 |
Household Income in Castro County
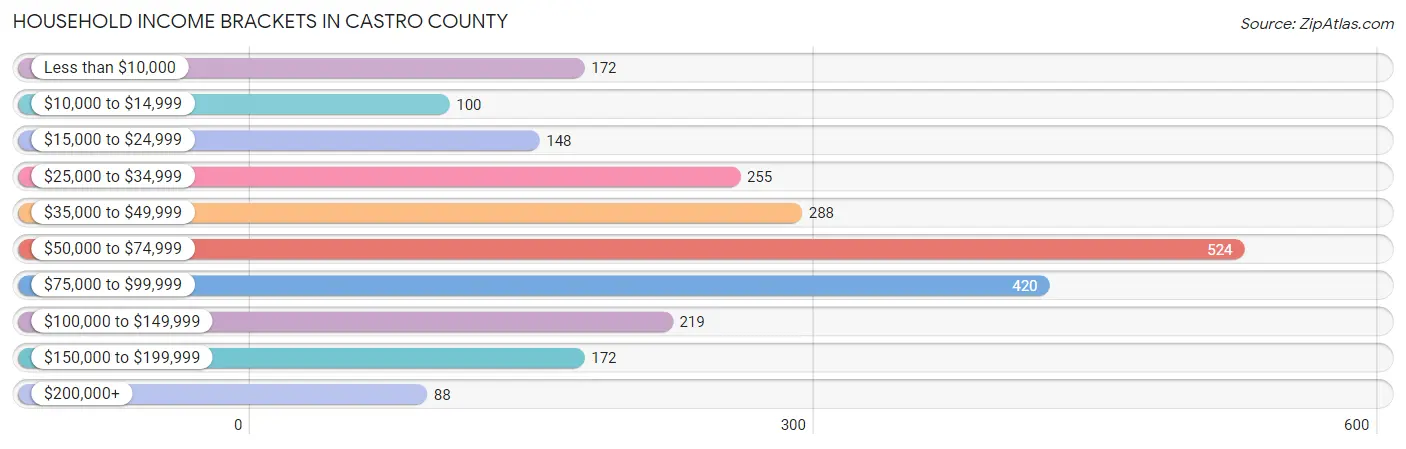
Household Income Brackets in Castro County
With 524 households falling in the category, the $50,000 to $74,999 income range is the most frequent in Castro County, accounting for 22.0% of all households. In contrast, only 88 households (3.7%) fall into the $200,000+ income bracket, making it the least populous group.
| Income Bracket | # Households | % Households |
| Less than $10,000 | 172 | 7.2% |
| $10,000 to $14,999 | 100 | 4.2% |
| $15,000 to $24,999 | 148 | 6.2% |
| $25,000 to $34,999 | 255 | 10.7% |
| $35,000 to $49,999 | 288 | 12.1% |
| $50,000 to $74,999 | 524 | 22.0% |
| $75,000 to $99,999 | 420 | 17.6% |
| $100,000 to $149,999 | 219 | 9.2% |
| $150,000 to $199,999 | 172 | 7.2% |
| $200,000+ | 88 | 3.7% |
Household Income by Householder Age in Castro County
The median household income in Castro County is $59,886, with the highest median household income of $63,618 found in the 25 to 44 years age bracket for the primary householder. A total of 874 households (36.7%) fall into this category. Meanwhile, the 65+ years age bracket for the primary householder has the lowest median household income of $38,313, with 633 households (26.6%) in this group.
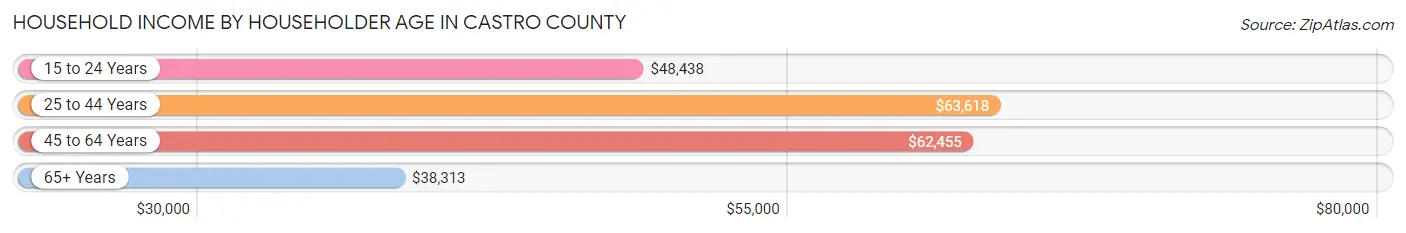
| Income Bracket | # Households | Median Income |
| 15 to 24 Years | 38 (1.6%) | $48,438 |
| 25 to 44 Years | 874 (36.7%) | $63,618 |
| 45 to 64 Years | 839 (35.2%) | $62,455 |
| 65+ Years | 633 (26.6%) | $38,313 |
| Total | 2,384 (100.0%) | $59,886 |
Poverty in Castro County
Income Below Poverty by Sex and Age in Castro County
With 12.2% poverty level for males and 12.7% for females among the residents of Castro County, under 5 year old males and 35 to 44 year old females are the most vulnerable to poverty, with 97 males (32.4%) and 111 females (30.0%) in their respective age groups living below the poverty level.
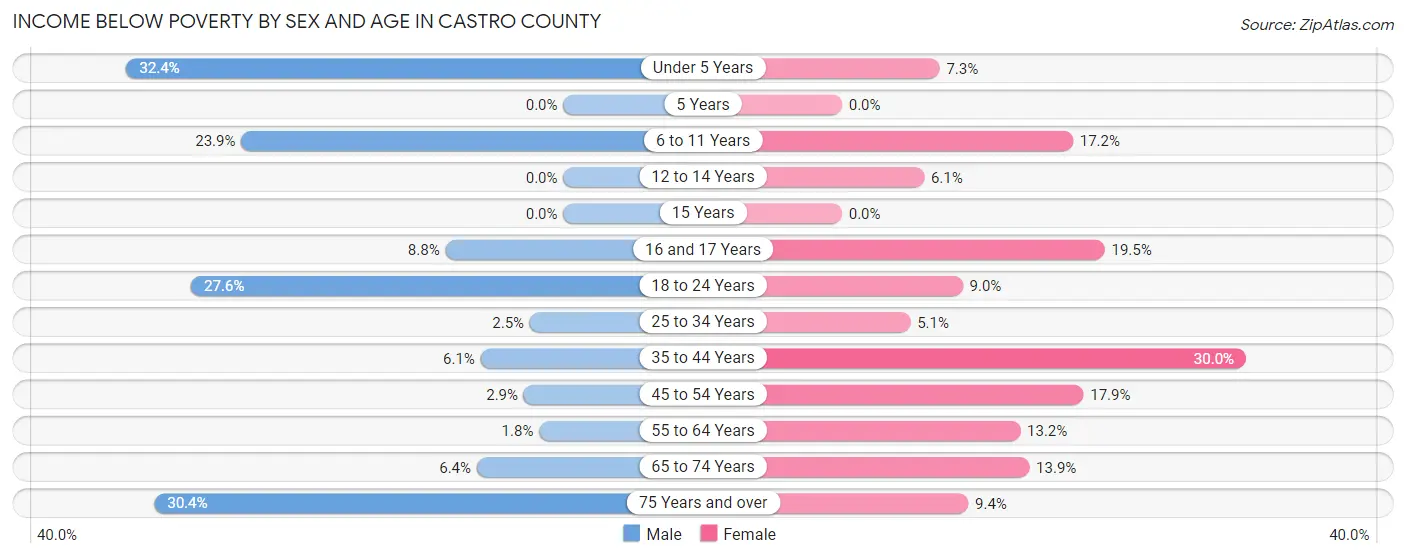
| Age Bracket | Male | Female |
| Under 5 Years | 97 (32.4%) | 20 (7.2%) |
| 5 Years | 0 (0.0%) | 0 (0.0%) |
| 6 to 11 Years | 110 (23.9%) | 53 (17.2%) |
| 12 to 14 Years | 0 (0.0%) | 10 (6.1%) |
| 15 Years | 0 (0.0%) | 0 (0.0%) |
| 16 and 17 Years | 7 (8.7%) | 16 (19.5%) |
| 18 to 24 Years | 97 (27.6%) | 35 (9.0%) |
| 25 to 34 Years | 11 (2.5%) | 20 (5.1%) |
| 35 to 44 Years | 27 (6.1%) | 111 (30.0%) |
| 45 to 54 Years | 12 (2.9%) | 64 (17.9%) |
| 55 to 64 Years | 8 (1.8%) | 49 (13.2%) |
| 65 to 74 Years | 24 (6.4%) | 48 (13.9%) |
| 75 Years and over | 65 (30.4%) | 24 (9.4%) |
| Total | 458 (12.2%) | 450 (12.7%) |
Income Above Poverty by Sex and Age in Castro County
According to the poverty statistics in Castro County, males aged 5 years and females aged 5 years are the age groups that are most secure financially, with 100.0% of males and 100.0% of females in these age groups living above the poverty line.
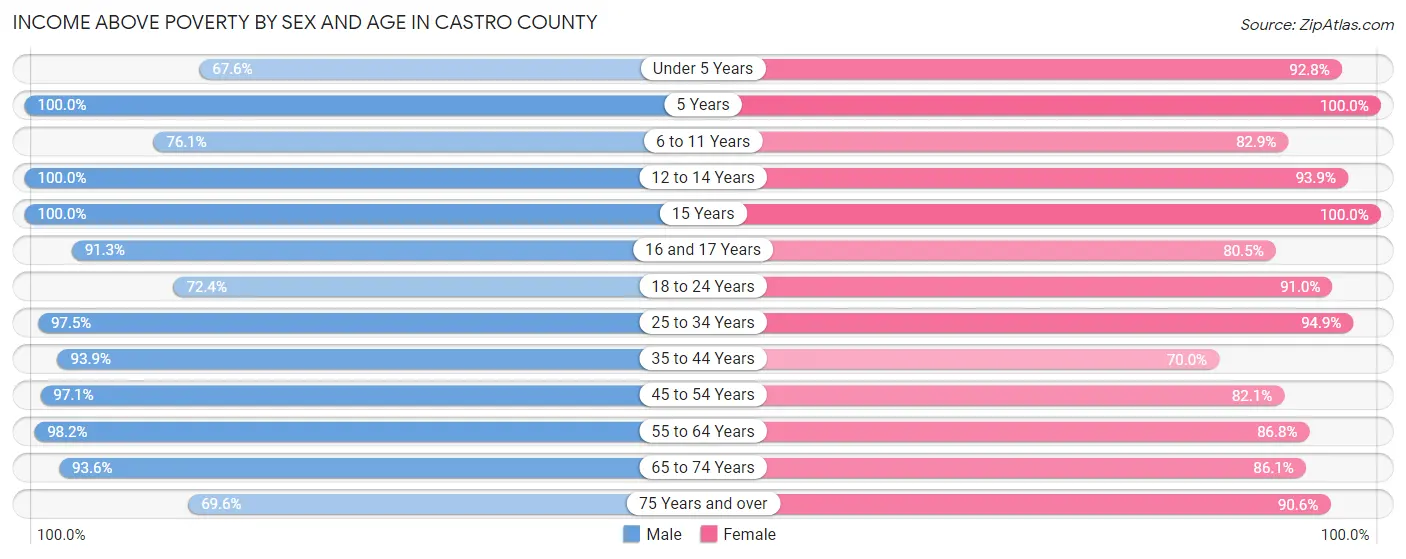
| Age Bracket | Male | Female |
| Under 5 Years | 202 (67.6%) | 256 (92.7%) |
| 5 Years | 55 (100.0%) | 94 (100.0%) |
| 6 to 11 Years | 350 (76.1%) | 256 (82.9%) |
| 12 to 14 Years | 117 (100.0%) | 154 (93.9%) |
| 15 Years | 74 (100.0%) | 129 (100.0%) |
| 16 and 17 Years | 73 (91.2%) | 66 (80.5%) |
| 18 to 24 Years | 254 (72.4%) | 355 (91.0%) |
| 25 to 34 Years | 432 (97.5%) | 374 (94.9%) |
| 35 to 44 Years | 413 (93.9%) | 259 (70.0%) |
| 45 to 54 Years | 397 (97.1%) | 293 (82.1%) |
| 55 to 64 Years | 439 (98.2%) | 321 (86.8%) |
| 65 to 74 Years | 350 (93.6%) | 297 (86.1%) |
| 75 Years and over | 149 (69.6%) | 232 (90.6%) |
| Total | 3,305 (87.8%) | 3,086 (87.3%) |
Income Below Poverty Among Married-Couple Families in Castro County
The poverty statistics for married-couple families in Castro County show that 4.8% or 65 of the total 1,365 families live below the poverty line. Families with no children have the highest poverty rate of 8.6%, comprising of 59 families. On the other hand, families with 1 or 2 children have the lowest poverty rate of 0.0%, which includes 0 families.
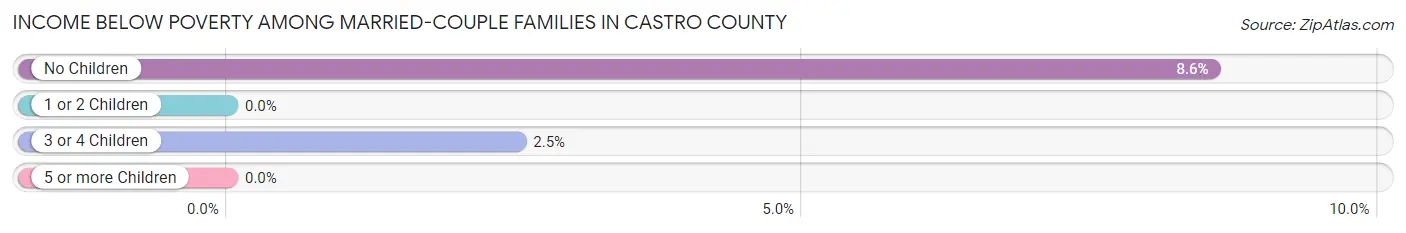
| Children | Above Poverty | Below Poverty |
| No Children | 631 (91.4%) | 59 (8.6%) |
| 1 or 2 Children | 431 (100.0%) | 0 (0.0%) |
| 3 or 4 Children | 233 (97.5%) | 6 (2.5%) |
| 5 or more Children | 5 (100.0%) | 0 (0.0%) |
| Total | 1,300 (95.2%) | 65 (4.8%) |
Income Below Poverty Among Single-Parent Households in Castro County
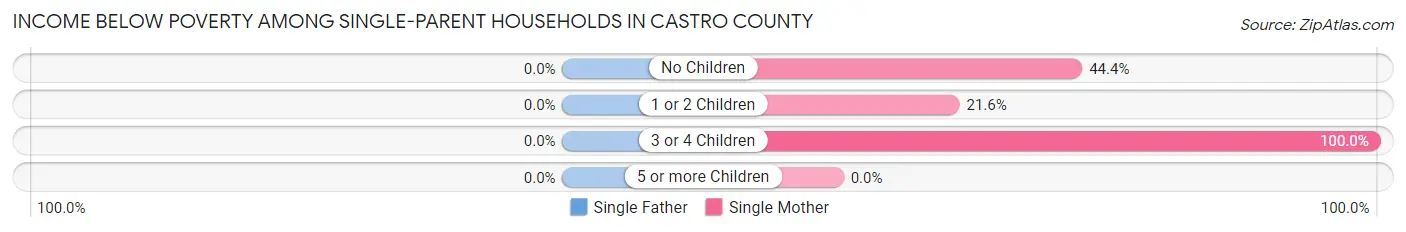
| Children | Single Father | Single Mother |
| No Children | 0 (0.0%) | 72 (44.4%) |
| 1 or 2 Children | 0 (0.0%) | 38 (21.6%) |
| 3 or 4 Children | 0 (0.0%) | 80 (100.0%) |
| 5 or more Children | 0 (0.0%) | 0 (0.0%) |
| Total | 0 (0.0%) | 190 (45.5%) |
Income Below Poverty Among Married-Couple vs Single-Parent Households in Castro County
The poverty data for Castro County shows that 65 of the married-couple family households (4.8%) and 190 of the single-parent households (41.0%) are living below the poverty level. Within the married-couple family households, those with no children have the highest poverty rate, with 59 households (8.6%) falling below the poverty line. Among the single-parent households, those with 3 or 4 children have the highest poverty rate, with 80 household (96.4%) living below poverty.
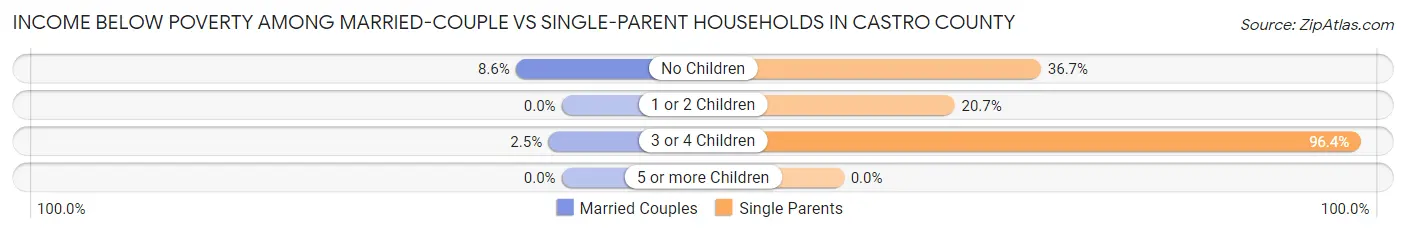
| Children | Married-Couple Families | Single-Parent Households |
| No Children | 59 (8.6%) | 72 (36.7%) |
| 1 or 2 Children | 0 (0.0%) | 38 (20.6%) |
| 3 or 4 Children | 6 (2.5%) | 80 (96.4%) |
| 5 or more Children | 0 (0.0%) | 0 (0.0%) |
| Total | 65 (4.8%) | 190 (41.0%) |
Race in Castro County
The most populous races in Castro County are White / Caucasian (4,899 | 66.4%), Hispanic or Latino (4,824 | 65.4%), and Two or more Races (1,802 | 24.4%).
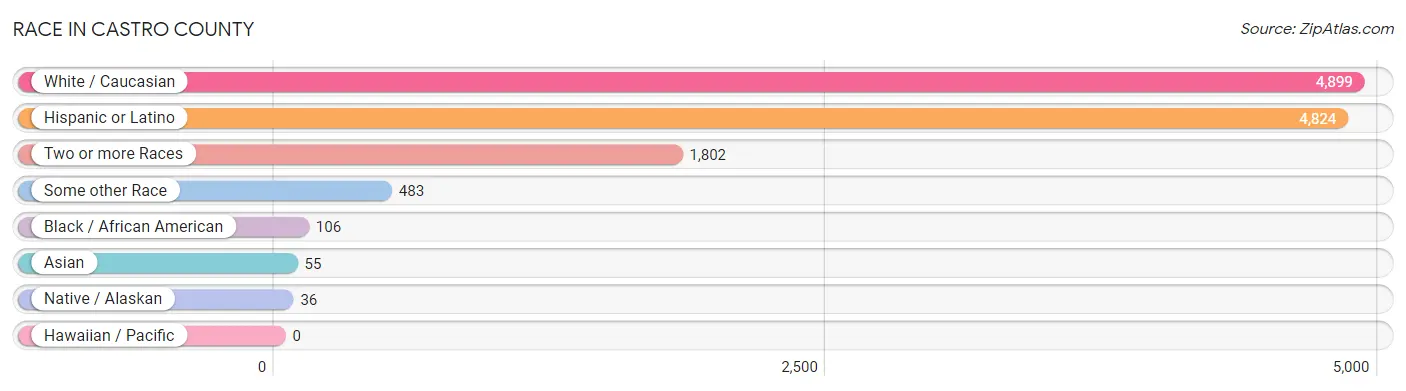
| Race | # Population | % Population |
| Asian | 55 | 0.7% |
| Black / African American | 106 | 1.4% |
| Hawaiian / Pacific | 0 | 0.0% |
| Hispanic or Latino | 4,824 | 65.4% |
| Native / Alaskan | 36 | 0.5% |
| White / Caucasian | 4,899 | 66.4% |
| Two or more Races | 1,802 | 24.4% |
| Some other Race | 483 | 6.5% |
| Total | 7,381 | 100.0% |
Ancestry in Castro County
The most populous ancestries reported in Castro County are Mexican (4,304 | 58.3%), German (745 | 10.1%), Spaniard (435 | 5.9%), American (400 | 5.4%), and English (318 | 4.3%), together accounting for 84.0% of all Castro County residents.
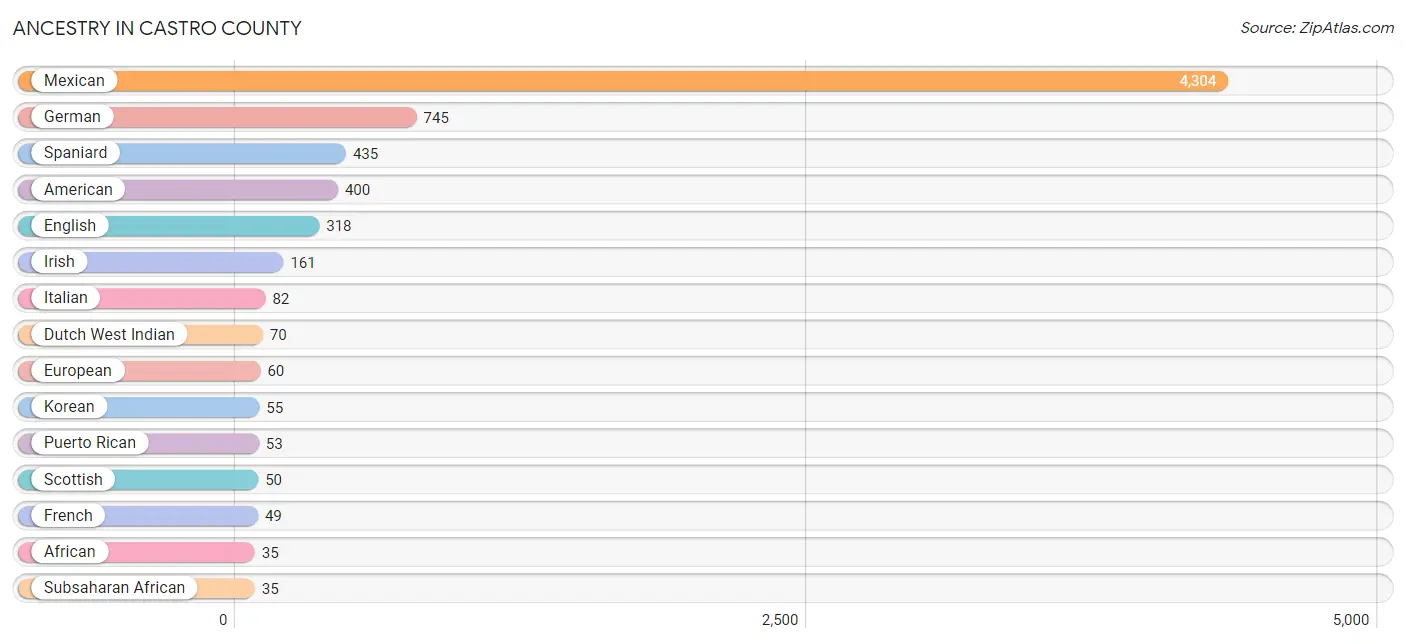
| Ancestry | # Population | % Population |
| African | 35 | 0.5% |
| American | 400 | 5.4% |
| British | 3 | 0.0% |
| Cajun | 16 | 0.2% |
| Cherokee | 11 | 0.2% |
| Choctaw | 31 | 0.4% |
| Crow | 16 | 0.2% |
| Dutch | 12 | 0.2% |
| Dutch West Indian | 70 | 0.9% |
| English | 318 | 4.3% |
| European | 60 | 0.8% |
| French | 49 | 0.7% |
| French American Indian | 5 | 0.1% |
| German | 745 | 10.1% |
| Irish | 161 | 2.2% |
| Italian | 82 | 1.1% |
| Korean | 55 | 0.7% |
| Mexican | 4,304 | 58.3% |
| Navajo | 8 | 0.1% |
| Norwegian | 8 | 0.1% |
| Polish | 9 | 0.1% |
| Puerto Rican | 53 | 0.7% |
| Scotch-Irish | 10 | 0.1% |
| Scottish | 50 | 0.7% |
| Spaniard | 435 | 5.9% |
| Spanish | 12 | 0.2% |
| Subsaharan African | 35 | 0.5% |
| Swedish | 1 | 0.0% |
| Welsh | 22 | 0.3% |
| Yaqui | 31 | 0.4% | View All 30 Rows |
Immigrants in Castro County
The most numerous immigrant groups reported in Castro County came from Latin America (1,154 | 15.6%), Central America (1,138 | 15.4%), Mexico (1,117 | 15.1%), Asia (55 | 0.7%), and Philippines (55 | 0.7%), together accounting for 47.7% of all Castro County residents.
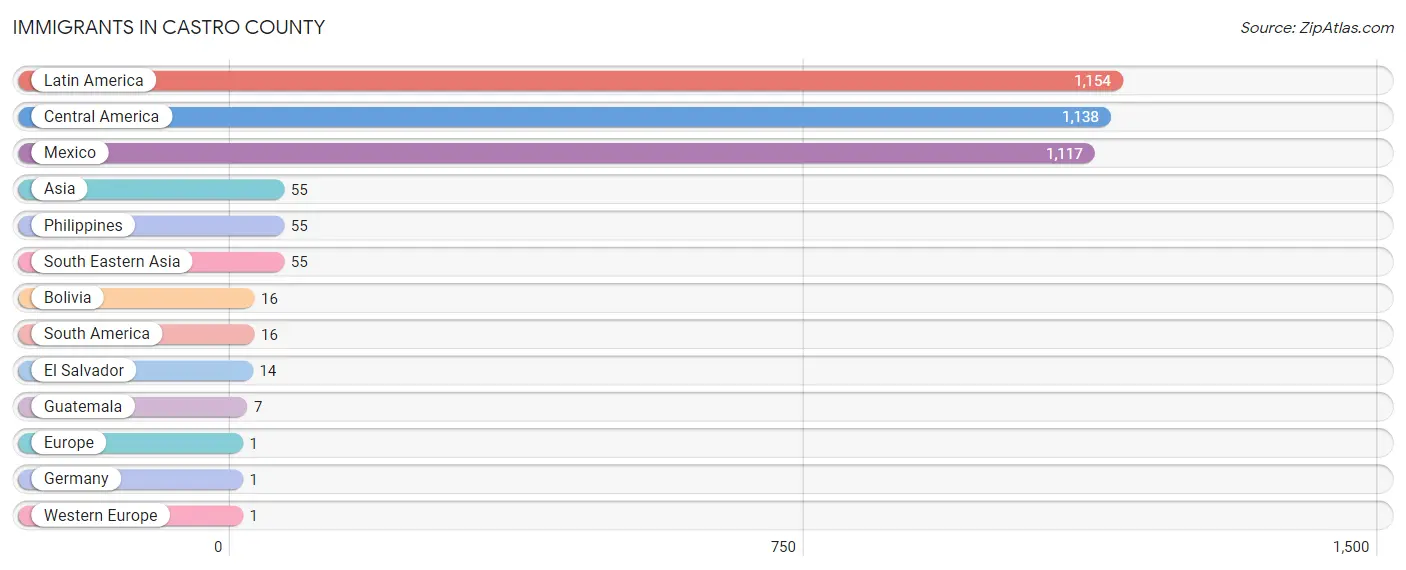
| Immigration Origin | # Population | % Population |
| Asia | 55 | 0.7% |
| Bolivia | 16 | 0.2% |
| Central America | 1,138 | 15.4% |
| El Salvador | 14 | 0.2% |
| Europe | 1 | 0.0% |
| Germany | 1 | 0.0% |
| Guatemala | 7 | 0.1% |
| Latin America | 1,154 | 15.6% |
| Mexico | 1,117 | 15.1% |
| Philippines | 55 | 0.7% |
| South America | 16 | 0.2% |
| South Eastern Asia | 55 | 0.7% |
| Western Europe | 1 | 0.0% | View All 13 Rows |
Sex and Age in Castro County
Sex and Age in Castro County
The most populous age groups in Castro County are 35 to 39 Years (364 | 9.6%) for men and 15 to 19 Years (362 | 10.1%) for women.
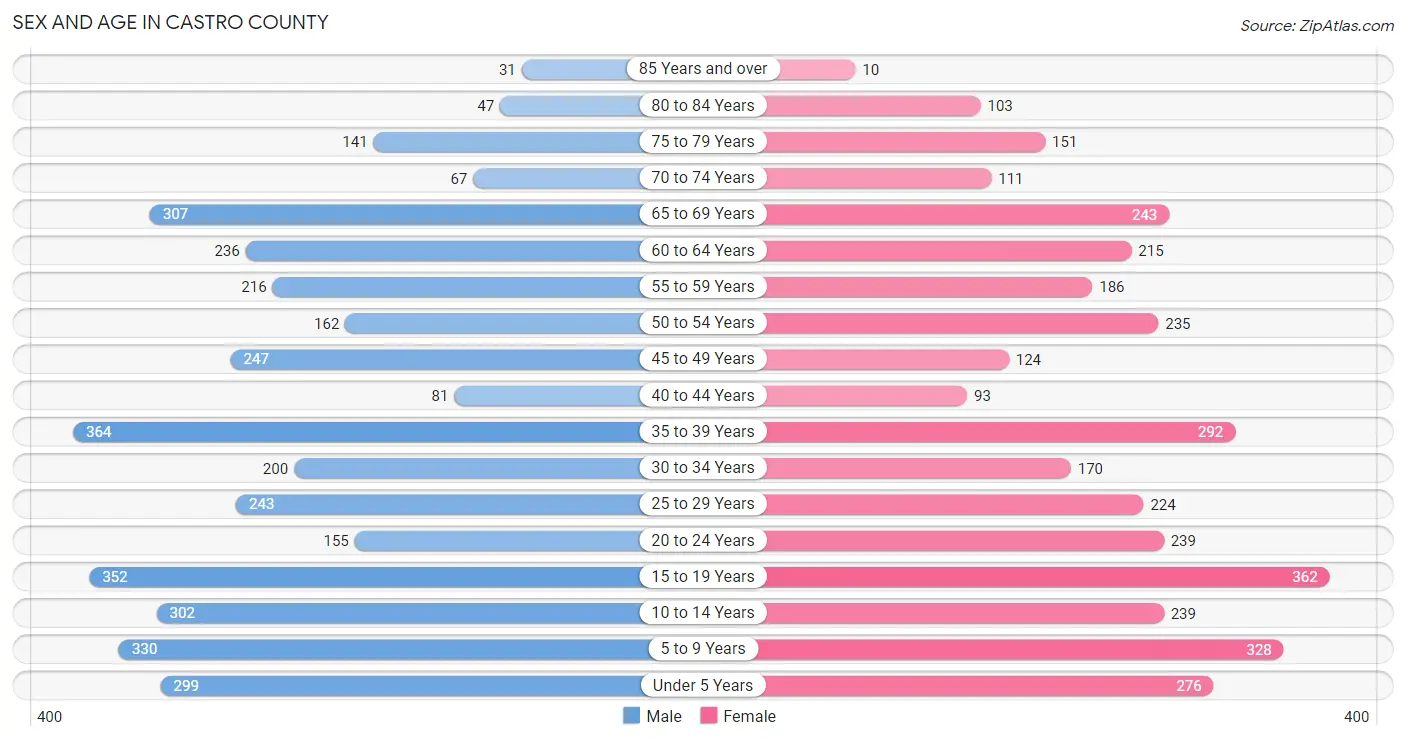
| Age Bracket | Male | Female |
| Under 5 Years | 299 (7.9%) | 276 (7.7%) |
| 5 to 9 Years | 330 (8.7%) | 328 (9.1%) |
| 10 to 14 Years | 302 (8.0%) | 239 (6.6%) |
| 15 to 19 Years | 352 (9.3%) | 362 (10.1%) |
| 20 to 24 Years | 155 (4.1%) | 239 (6.6%) |
| 25 to 29 Years | 243 (6.4%) | 224 (6.2%) |
| 30 to 34 Years | 200 (5.3%) | 170 (4.7%) |
| 35 to 39 Years | 364 (9.6%) | 292 (8.1%) |
| 40 to 44 Years | 81 (2.1%) | 93 (2.6%) |
| 45 to 49 Years | 247 (6.5%) | 124 (3.4%) |
| 50 to 54 Years | 162 (4.3%) | 235 (6.5%) |
| 55 to 59 Years | 216 (5.7%) | 186 (5.2%) |
| 60 to 64 Years | 236 (6.2%) | 215 (6.0%) |
| 65 to 69 Years | 307 (8.1%) | 243 (6.8%) |
| 70 to 74 Years | 67 (1.8%) | 111 (3.1%) |
| 75 to 79 Years | 141 (3.7%) | 151 (4.2%) |
| 80 to 84 Years | 47 (1.2%) | 103 (2.9%) |
| 85 Years and over | 31 (0.8%) | 10 (0.3%) |
| Total | 3,780 (100.0%) | 3,601 (100.0%) |
Families and Households in Castro County
Median Family Size in Castro County
The median family size in Castro County is 3.59 persons per family, with single male/father families (45 | 2.5%) accounting for the largest median family size of 4.09 persons per family. On the other hand, single female/mother families (418 | 22.9%) represent the smallest median family size with 3.52 persons per family.
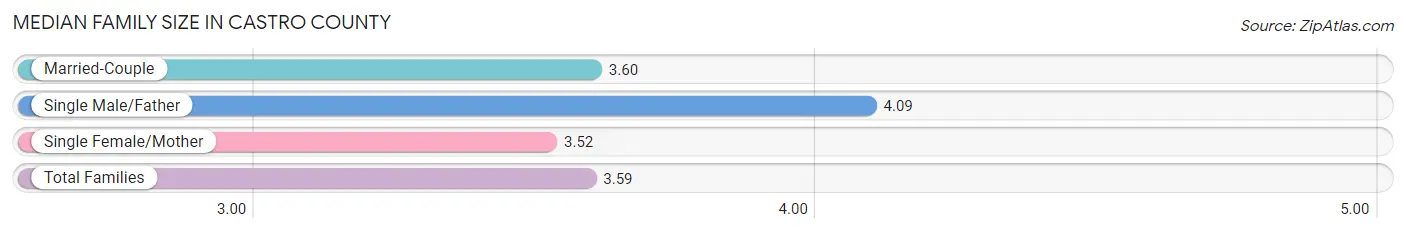
| Family Type | # Families | Family Size |
| Married-Couple | 1,365 (74.7%) | 3.60 |
| Single Male/Father | 45 (2.5%) | 4.09 |
| Single Female/Mother | 418 (22.9%) | 3.52 |
| Total Families | 1,828 (100.0%) | 3.59 |
Median Household Size in Castro County
The median household size in Castro County is 3.06 persons per household, with single male/father households (45 | 1.9%) accounting for the largest median household size of 4.2 persons per household. non-family households (556 | 23.3%) represent the smallest median household size with 1.20 persons per household.
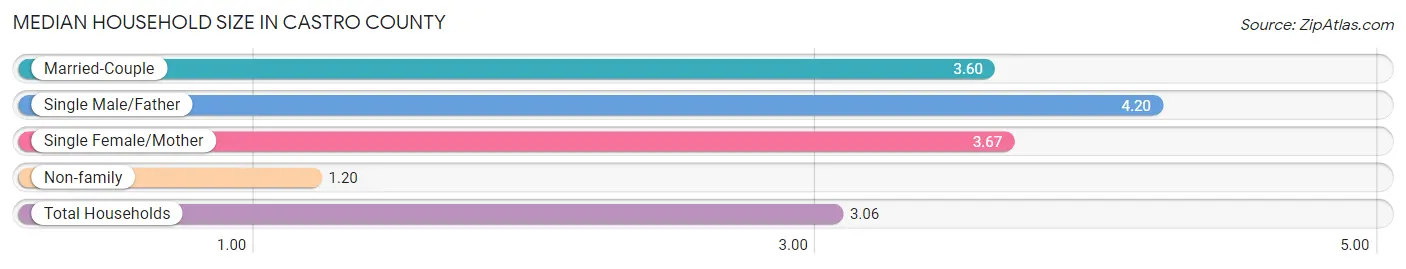
| Household Type | # Households | Household Size |
| Married-Couple | 1,365 (57.3%) | 3.60 |
| Single Male/Father | 45 (1.9%) | 4.20 |
| Single Female/Mother | 418 (17.5%) | 3.67 |
| Non-family | 556 (23.3%) | 1.20 |
| Total Households | 2,384 (100.0%) | 3.06 |
Household Size by Marriage Status in Castro County
Out of a total of 2,384 households in Castro County, 1,828 (76.7%) are family households, while 556 (23.3%) are nonfamily households. The most numerous type of family households are 2-person households, comprising 727, and the most common type of nonfamily households are 1-person households, comprising 444.
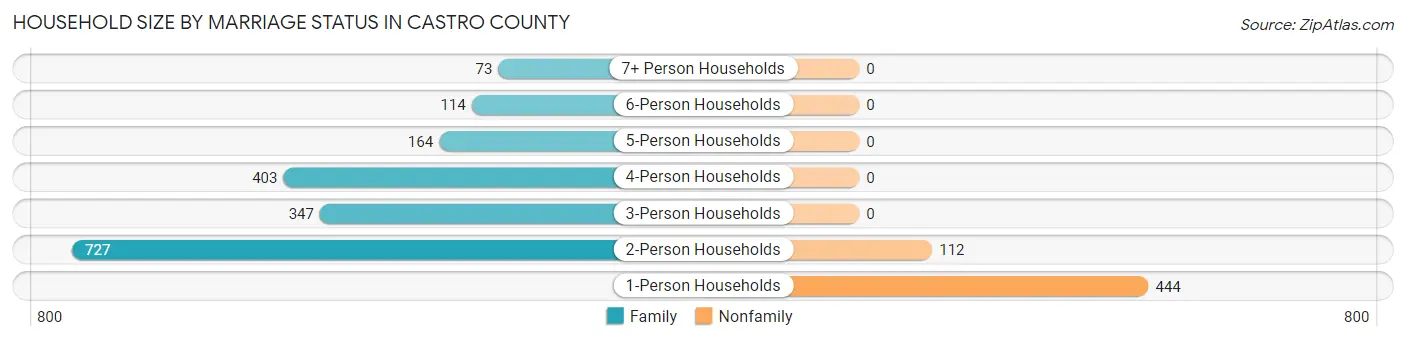
| Household Size | Family Households | Nonfamily Households |
| 1-Person Households | - | 444 (18.6%) |
| 2-Person Households | 727 (30.5%) | 112 (4.7%) |
| 3-Person Households | 347 (14.6%) | 0 (0.0%) |
| 4-Person Households | 403 (16.9%) | 0 (0.0%) |
| 5-Person Households | 164 (6.9%) | 0 (0.0%) |
| 6-Person Households | 114 (4.8%) | 0 (0.0%) |
| 7+ Person Households | 73 (3.1%) | 0 (0.0%) |
| Total | 1,828 (76.7%) | 556 (23.3%) |
Female Fertility in Castro County
Fertility by Age in Castro County
Average fertility rate in Castro County is 40.0 births per 1,000 women. Women in the age bracket of 20 to 34 years have the highest fertility rate with 95.0 births per 1,000 women. Women in the age bracket of 20 to 34 years acount for 93.8% of all women with births.
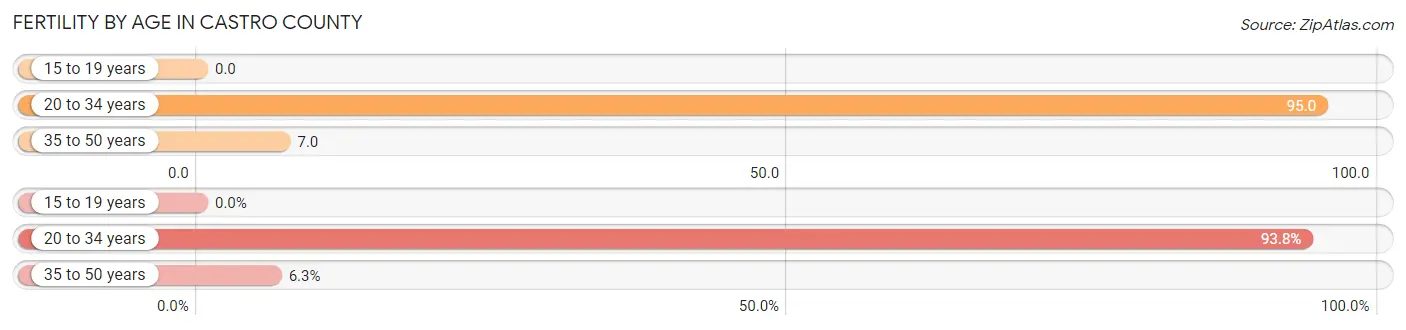
| Age Bracket | Women with Births | Births / 1,000 Women |
| 15 to 19 years | 0 (0.0%) | 0.0 |
| 20 to 34 years | 60 (93.8%) | 95.0 |
| 35 to 50 years | 4 (6.2%) | 7.0 |
| Total | 64 (100.0%) | 40.0 |
Fertility by Age by Marriage Status in Castro County
73.4% of women with births (64) in Castro County are married. The highest percentage of unmarried women with births falls into 20 to 34 years age bracket with 28.3% of them unmarried at the time of birth, while the lowest percentage of unmarried women with births belong to 35 to 50 years age bracket with 0.0% of them unmarried.
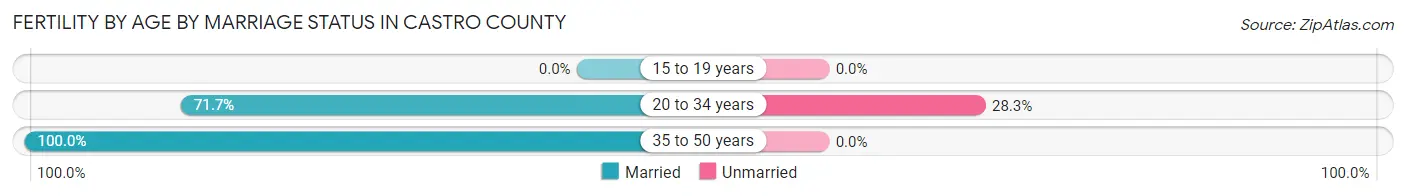
| Age Bracket | Married | Unmarried |
| 15 to 19 years | 0 (0.0%) | 0 (0.0%) |
| 20 to 34 years | 43 (71.7%) | 17 (28.3%) |
| 35 to 50 years | 4 (100.0%) | 0 (0.0%) |
| Total | 47 (73.4%) | 17 (26.6%) |
Fertility by Education in Castro County
Average fertility rate in Castro County is 40.0 births per 1,000 women. Women with the education attainment of bachelor's degree have the highest fertility rate of 67.0 births per 1,000 women, while women with the education attainment of college or associate's degree have the lowest fertility at 31.0 births per 1,000 women. Women with the education attainment of high school diploma represent 26.6% of all women with births.
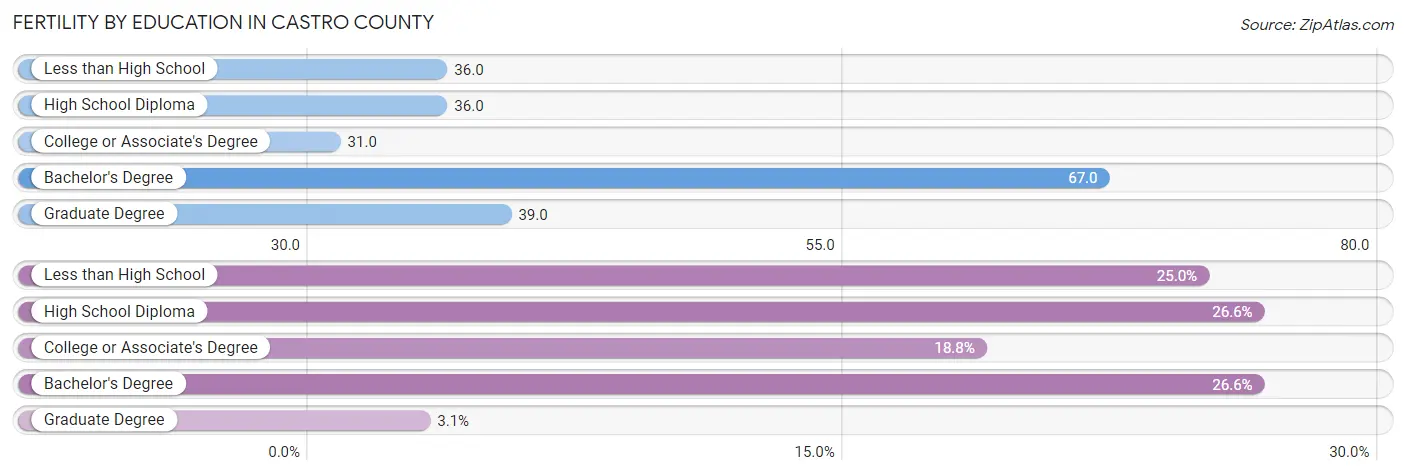
| Educational Attainment | Women with Births | Births / 1,000 Women |
| Less than High School | 16 (25.0%) | 36.0 |
| High School Diploma | 17 (26.6%) | 36.0 |
| College or Associate's Degree | 12 (18.8%) | 31.0 |
| Bachelor's Degree | 17 (26.6%) | 67.0 |
| Graduate Degree | 2 (3.1%) | 39.0 |
| Total | 64 (100.0%) | 40.0 |
Fertility by Education by Marriage Status in Castro County
26.6% of women with births in Castro County are unmarried. Women with the educational attainment of less than high school are most likely to be married with 100.0% of them married at childbirth, while women with the educational attainment of high school diploma are least likely to be married with 100.0% of them unmarried at childbirth.
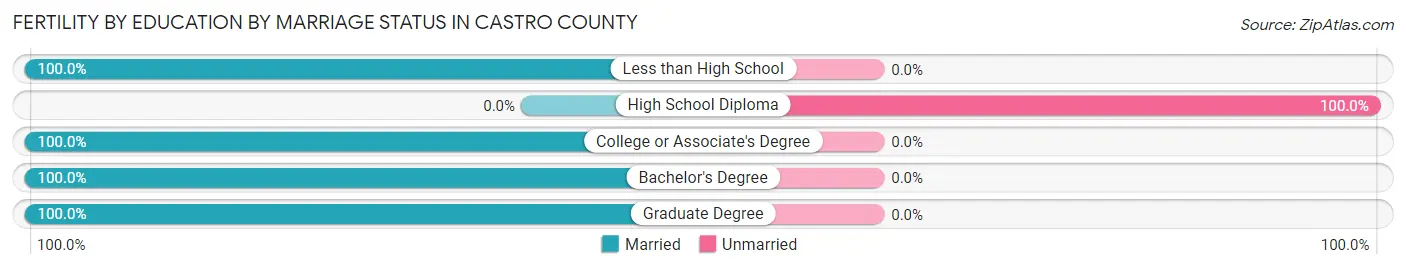
| Educational Attainment | Married | Unmarried |
| Less than High School | 16 (100.0%) | 0 (0.0%) |
| High School Diploma | 0 (0.0%) | 17 (100.0%) |
| College or Associate's Degree | 12 (100.0%) | 0 (0.0%) |
| Bachelor's Degree | 17 (100.0%) | 0 (0.0%) |
| Graduate Degree | 2 (100.0%) | 0 (0.0%) |
| Total | 47 (73.4%) | 17 (26.6%) |
Employment Characteristics in Castro County
Employment by Class of Employer in Castro County
Among the 3,364 employed individuals in Castro County, private company employees (2,335 | 69.4%), local government employees (338 | 10.1%), and state government employees (253 | 7.5%) make up the most common classes of employment.
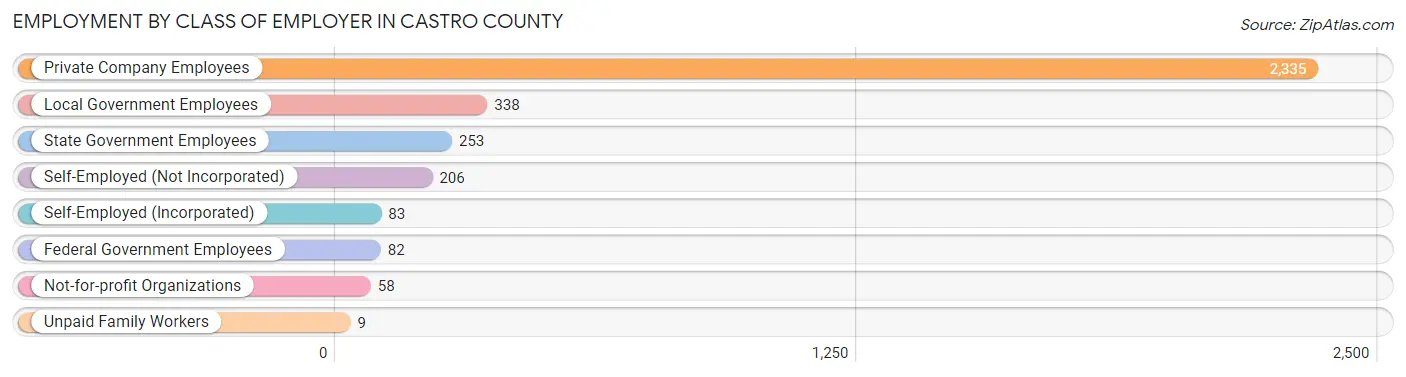
| Employer Class | # Employees | % Employees |
| Private Company Employees | 2,335 | 69.4% |
| Self-Employed (Incorporated) | 83 | 2.5% |
| Self-Employed (Not Incorporated) | 206 | 6.1% |
| Not-for-profit Organizations | 58 | 1.7% |
| Local Government Employees | 338 | 10.1% |
| State Government Employees | 253 | 7.5% |
| Federal Government Employees | 82 | 2.4% |
| Unpaid Family Workers | 9 | 0.3% |
| Total | 3,364 | 100.0% |
Employment Status by Age in Castro County
According to the labor force statistics for Castro County, out of the total population over 16 years of age (5,404), 66.5% or 3,594 individuals are in the labor force, with 3.6% or 129 of them unemployed. The age group with the highest labor force participation rate is 25 to 29 years, with 87.6% or 409 individuals in the labor force. Within the labor force, the 35 to 44 years age range has the highest percentage of unemployed individuals, with 11.7% or 82 of them being unemployed.
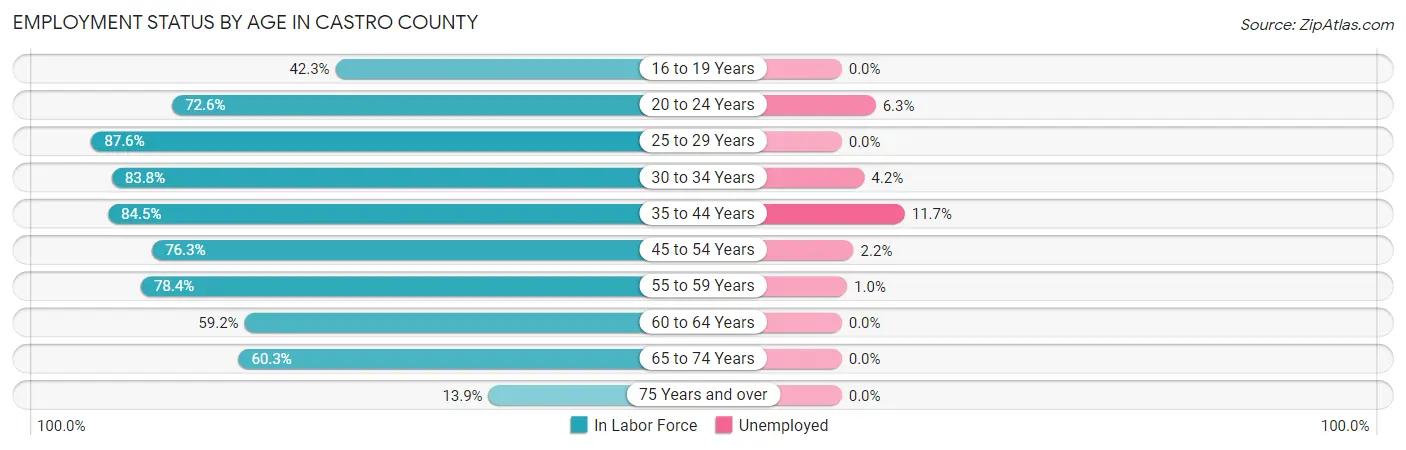
| Age Bracket | In Labor Force | Unemployed |
| 16 to 19 Years | 216 (42.3%) | 0 (0.0%) |
| 20 to 24 Years | 286 (72.6%) | 18 (6.3%) |
| 25 to 29 Years | 409 (87.6%) | 0 (0.0%) |
| 30 to 34 Years | 310 (83.8%) | 13 (4.2%) |
| 35 to 44 Years | 701 (84.5%) | 82 (11.7%) |
| 45 to 54 Years | 586 (76.3%) | 13 (2.2%) |
| 55 to 59 Years | 315 (78.4%) | 3 (1.0%) |
| 60 to 64 Years | 267 (59.2%) | 0 (0.0%) |
| 65 to 74 Years | 439 (60.3%) | 0 (0.0%) |
| 75 Years and over | 67 (13.9%) | 0 (0.0%) |
| Total | 3,594 (66.5%) | 129 (3.6%) |
Employment Status by Educational Attainment in Castro County
According to labor force statistics for Castro County, 78.7% of individuals (2,588) out of the total population between 25 and 64 years of age (3,288) are in the labor force, with 4.3% or 111 of them being unemployed. The group with the highest labor force participation rate are those with the educational attainment of high school diploma, with 82.0% or 968 individuals in the labor force. Within the labor force, individuals with bachelor's degree or higher education have the highest percentage of unemployment, with 9.6% or 55 of them being unemployed.
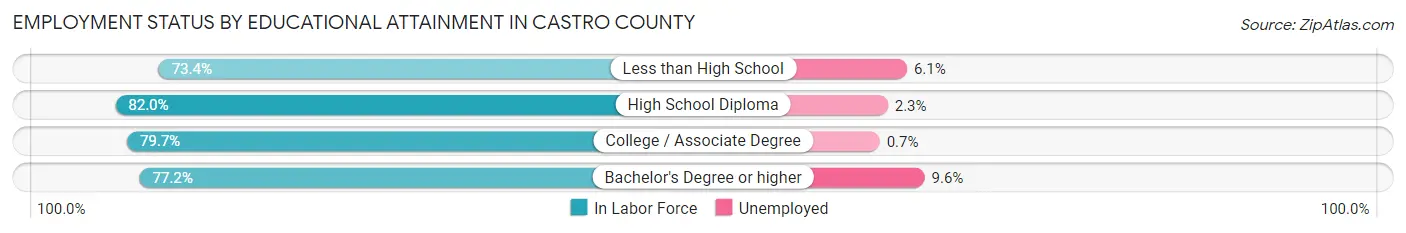
| Educational Attainment | In Labor Force | Unemployed |
| Less than High School | 488 (73.4%) | 41 (6.1%) |
| High School Diploma | 968 (82.0%) | 27 (2.3%) |
| College / Associate Degree | 559 (79.7%) | 5 (0.7%) |
| Bachelor's Degree or higher | 573 (77.2%) | 71 (9.6%) |
| Total | 2,588 (78.7%) | 141 (4.3%) |
Employment Occupations by Sex in Castro County
Management, Business, Science and Arts Occupations
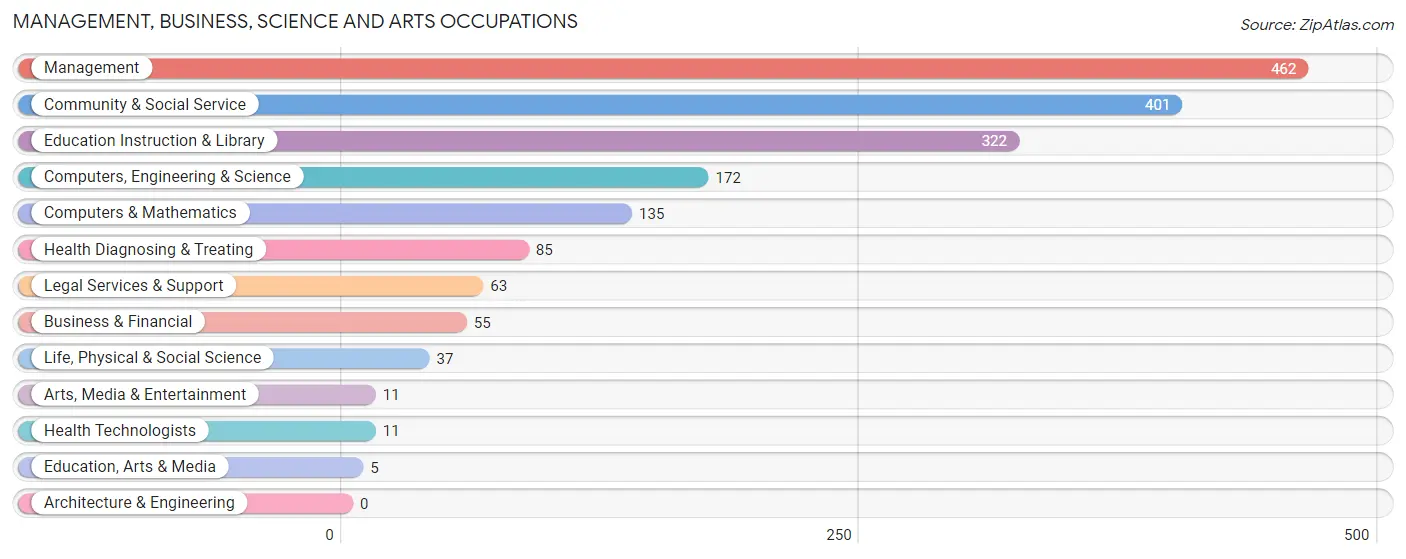
The most common Management, Business, Science and Arts occupations in Castro County are Management (462 | 13.3%), Community & Social Service (401 | 11.6%), Education Instruction & Library (322 | 9.3%), Computers, Engineering & Science (172 | 5.0%), and Computers & Mathematics (135 | 3.9%).
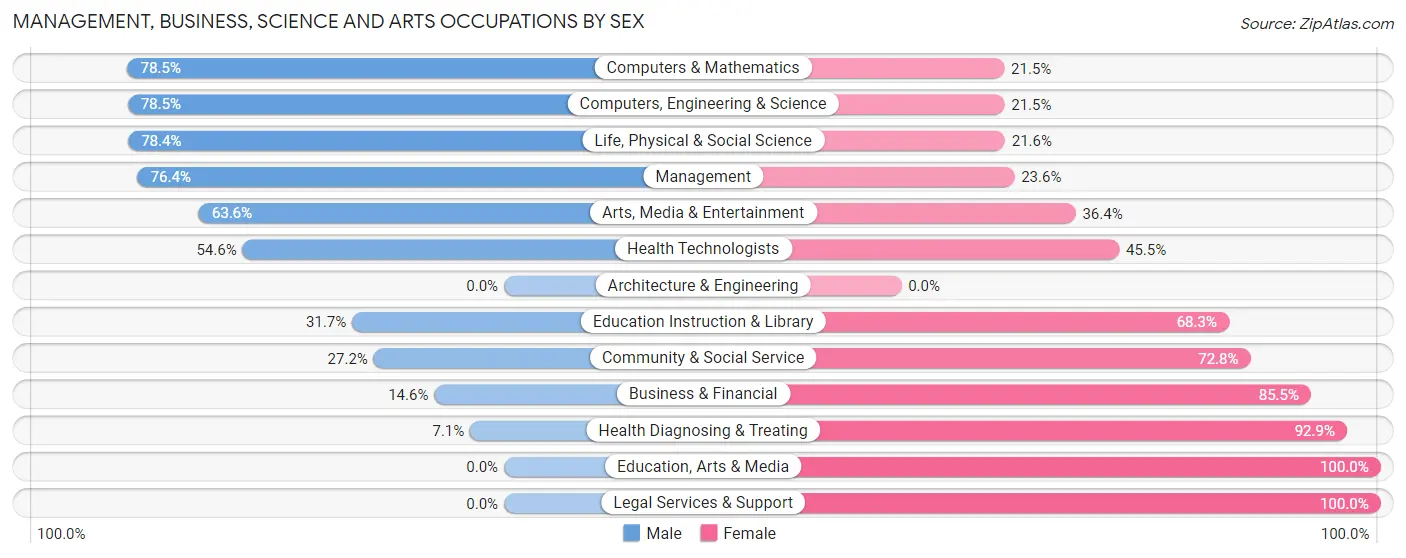
Management, Business, Science and Arts Occupations by Sex
Within the Management, Business, Science and Arts occupations in Castro County, the most male-oriented occupations are Computers & Mathematics (78.5%), Computers, Engineering & Science (78.5%), and Life, Physical & Social Science (78.4%), while the most female-oriented occupations are Education, Arts & Media (100.0%), Legal Services & Support (100.0%), and Health Diagnosing & Treating (92.9%).
| Occupation | Male | Female |
| Management | 353 (76.4%) | 109 (23.6%) |
| Business & Financial | 8 (14.5%) | 47 (85.5%) |
| Computers, Engineering & Science | 135 (78.5%) | 37 (21.5%) |
| Computers & Mathematics | 106 (78.5%) | 29 (21.5%) |
| Architecture & Engineering | 0 (0.0%) | 0 (0.0%) |
| Life, Physical & Social Science | 29 (78.4%) | 8 (21.6%) |
| Community & Social Service | 109 (27.2%) | 292 (72.8%) |
| Education, Arts & Media | 0 (0.0%) | 5 (100.0%) |
| Legal Services & Support | 0 (0.0%) | 63 (100.0%) |
| Education Instruction & Library | 102 (31.7%) | 220 (68.3%) |
| Arts, Media & Entertainment | 7 (63.6%) | 4 (36.4%) |
| Health Diagnosing & Treating | 6 (7.1%) | 79 (92.9%) |
| Health Technologists | 6 (54.5%) | 5 (45.5%) |
| Total (Category) | 611 (52.0%) | 564 (48.0%) |
| Total (Overall) | 2,127 (61.4%) | 1,340 (38.7%) |
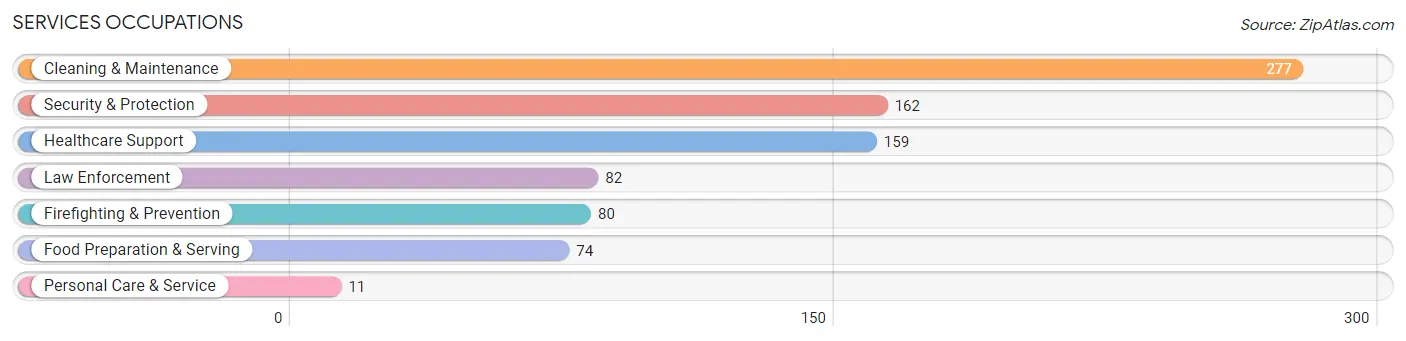
Services Occupations
The most common Services occupations in Castro County are Cleaning & Maintenance (277 | 8.0%), Security & Protection (162 | 4.7%), Healthcare Support (159 | 4.6%), Law Enforcement (82 | 2.4%), and Firefighting & Prevention (80 | 2.3%).
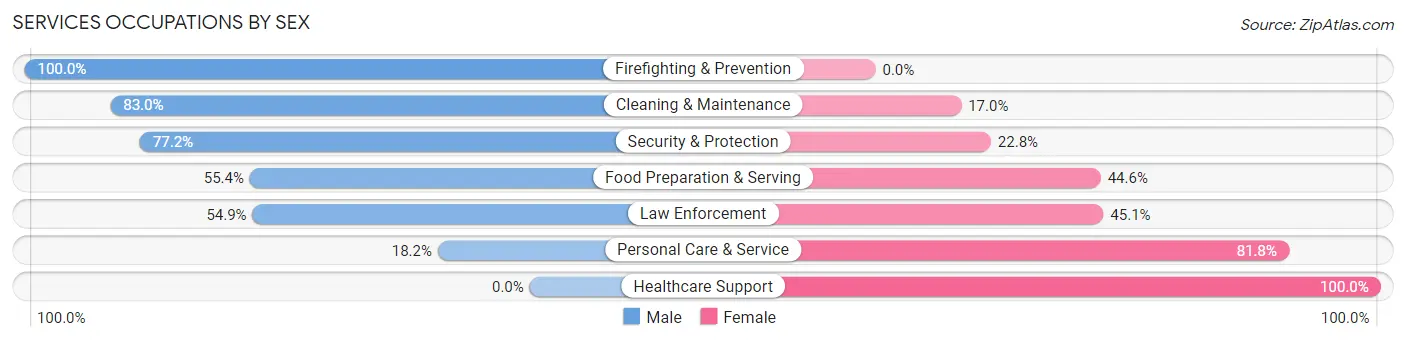
Services Occupations by Sex
Within the Services occupations in Castro County, the most male-oriented occupations are Firefighting & Prevention (100.0%), Cleaning & Maintenance (83.0%), and Security & Protection (77.2%), while the most female-oriented occupations are Healthcare Support (100.0%), Personal Care & Service (81.8%), and Law Enforcement (45.1%).
| Occupation | Male | Female |
| Healthcare Support | 0 (0.0%) | 159 (100.0%) |
| Security & Protection | 125 (77.2%) | 37 (22.8%) |
| Firefighting & Prevention | 80 (100.0%) | 0 (0.0%) |
| Law Enforcement | 45 (54.9%) | 37 (45.1%) |
| Food Preparation & Serving | 41 (55.4%) | 33 (44.6%) |
| Cleaning & Maintenance | 230 (83.0%) | 47 (17.0%) |
| Personal Care & Service | 2 (18.2%) | 9 (81.8%) |
| Total (Category) | 398 (58.3%) | 285 (41.7%) |
| Total (Overall) | 2,127 (61.4%) | 1,340 (38.7%) |
Sales and Office Occupations
The most common Sales and Office occupations in Castro County are Sales & Related (308 | 8.9%), and Office & Administration (255 | 7.4%).
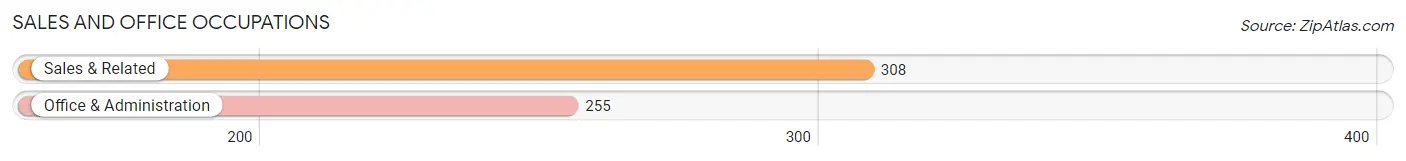
Sales and Office Occupations by Sex

| Occupation | Male | Female |
| Sales & Related | 177 (57.5%) | 131 (42.5%) |
| Office & Administration | 43 (16.9%) | 212 (83.1%) |
| Total (Category) | 220 (39.1%) | 343 (60.9%) |
| Total (Overall) | 2,127 (61.4%) | 1,340 (38.7%) |
Natural Resources, Construction and Maintenance Occupations
The most common Natural Resources, Construction and Maintenance occupations in Castro County are Farming, Fishing & Forestry (343 | 9.9%), Construction & Extraction (111 | 3.2%), and Installation, Maintenance & Repair (102 | 2.9%).

Natural Resources, Construction and Maintenance Occupations by Sex
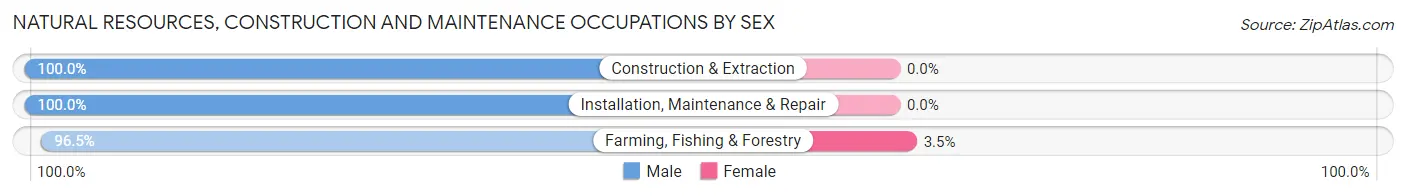
| Occupation | Male | Female |
| Farming, Fishing & Forestry | 331 (96.5%) | 12 (3.5%) |
| Construction & Extraction | 111 (100.0%) | 0 (0.0%) |
| Installation, Maintenance & Repair | 102 (100.0%) | 0 (0.0%) |
| Total (Category) | 544 (97.8%) | 12 (2.2%) |
| Total (Overall) | 2,127 (61.4%) | 1,340 (38.7%) |
Production, Transportation and Moving Occupations
The most common Production, Transportation and Moving occupations in Castro County are Production (247 | 7.1%), Transportation (139 | 4.0%), and Material Moving (104 | 3.0%).
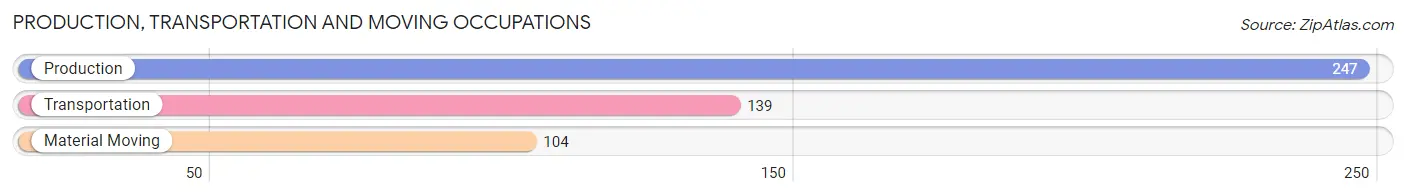
Production, Transportation and Moving Occupations by Sex
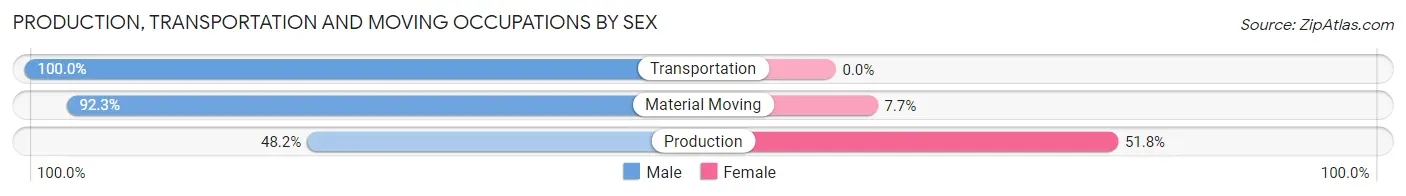
| Occupation | Male | Female |
| Production | 119 (48.2%) | 128 (51.8%) |
| Transportation | 139 (100.0%) | 0 (0.0%) |
| Material Moving | 96 (92.3%) | 8 (7.7%) |
| Total (Category) | 354 (72.2%) | 136 (27.8%) |
| Total (Overall) | 2,127 (61.4%) | 1,340 (38.7%) |
Employment Industries by Sex in Castro County
Employment Industries in Castro County
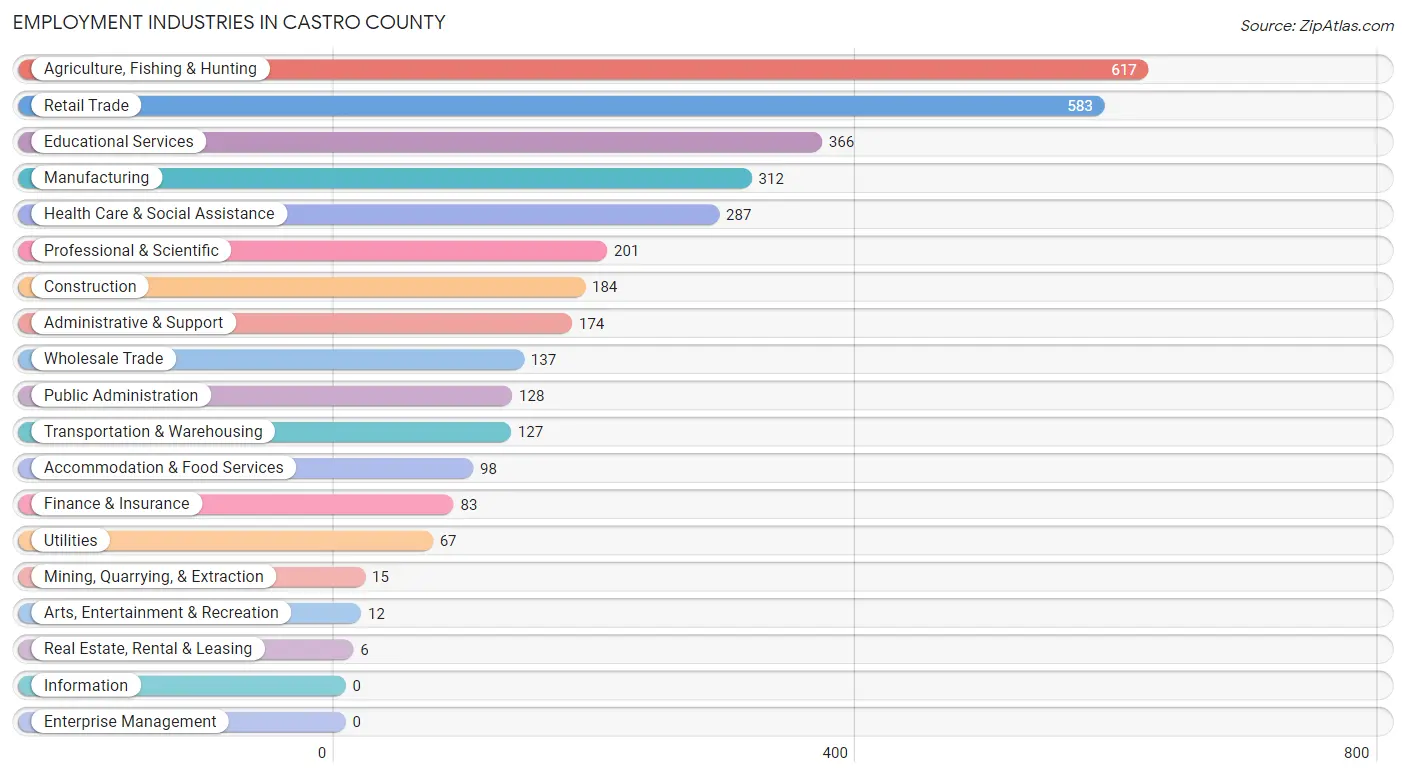
The major employment industries in Castro County include Agriculture, Fishing & Hunting (617 | 17.8%), Retail Trade (583 | 16.8%), Educational Services (366 | 10.6%), Manufacturing (312 | 9.0%), and Health Care & Social Assistance (287 | 8.3%).
Employment Industries by Sex in Castro County
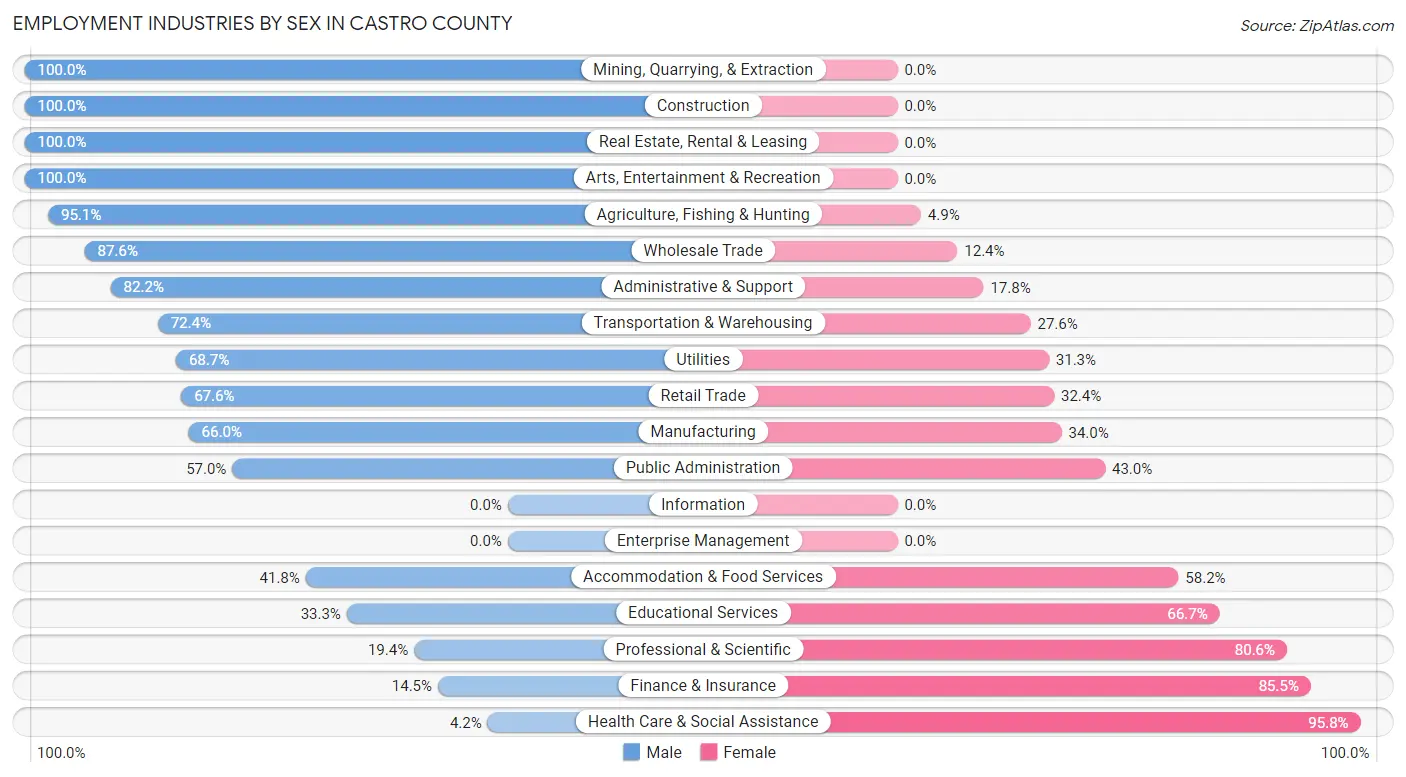
The Castro County industries that see more men than women are Mining, Quarrying, & Extraction (100.0%), Construction (100.0%), and Real Estate, Rental & Leasing (100.0%), whereas the industries that tend to have a higher number of women are Health Care & Social Assistance (95.8%), Finance & Insurance (85.5%), and Professional & Scientific (80.6%).
| Industry | Male | Female |
| Agriculture, Fishing & Hunting | 587 (95.1%) | 30 (4.9%) |
| Mining, Quarrying, & Extraction | 15 (100.0%) | 0 (0.0%) |
| Construction | 184 (100.0%) | 0 (0.0%) |
| Manufacturing | 206 (66.0%) | 106 (34.0%) |
| Wholesale Trade | 120 (87.6%) | 17 (12.4%) |
| Retail Trade | 394 (67.6%) | 189 (32.4%) |
| Transportation & Warehousing | 92 (72.4%) | 35 (27.6%) |
| Utilities | 46 (68.7%) | 21 (31.3%) |
| Information | 0 (0.0%) | 0 (0.0%) |
| Finance & Insurance | 12 (14.5%) | 71 (85.5%) |
| Real Estate, Rental & Leasing | 6 (100.0%) | 0 (0.0%) |
| Professional & Scientific | 39 (19.4%) | 162 (80.6%) |
| Enterprise Management | 0 (0.0%) | 0 (0.0%) |
| Administrative & Support | 143 (82.2%) | 31 (17.8%) |
| Educational Services | 122 (33.3%) | 244 (66.7%) |
| Health Care & Social Assistance | 12 (4.2%) | 275 (95.8%) |
| Arts, Entertainment & Recreation | 12 (100.0%) | 0 (0.0%) |
| Accommodation & Food Services | 41 (41.8%) | 57 (58.2%) |
| Public Administration | 73 (57.0%) | 55 (43.0%) |
| Total | 2,127 (61.4%) | 1,340 (38.7%) |
Education in Castro County
School Enrollment in Castro County
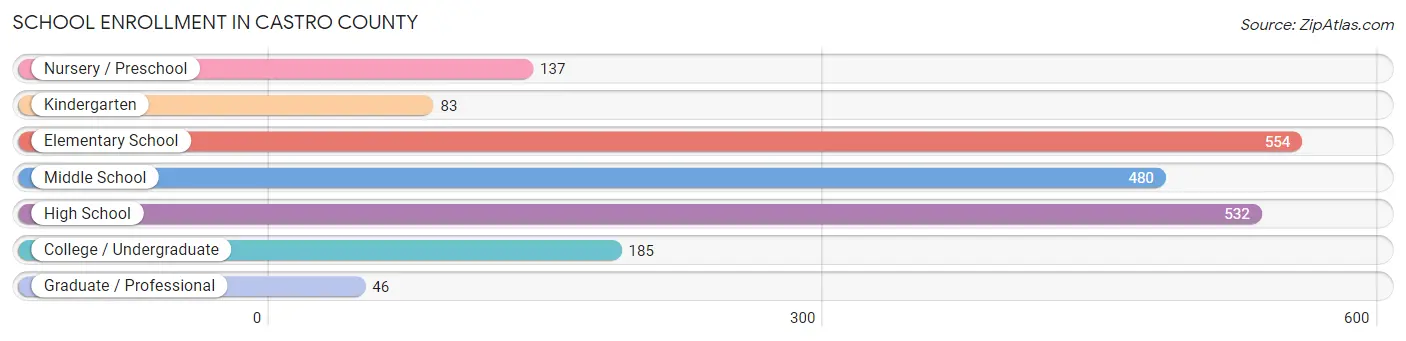
The most common levels of schooling among the 2,017 students in Castro County are elementary school (554 | 27.5%), high school (532 | 26.4%), and middle school (480 | 23.8%).
| School Level | # Students | % Students |
| Nursery / Preschool | 137 | 6.8% |
| Kindergarten | 83 | 4.1% |
| Elementary School | 554 | 27.5% |
| Middle School | 480 | 23.8% |
| High School | 532 | 26.4% |
| College / Undergraduate | 185 | 9.2% |
| Graduate / Professional | 46 | 2.3% |
| Total | 2,017 | 100.0% |
School Enrollment by Age by Funding Source in Castro County
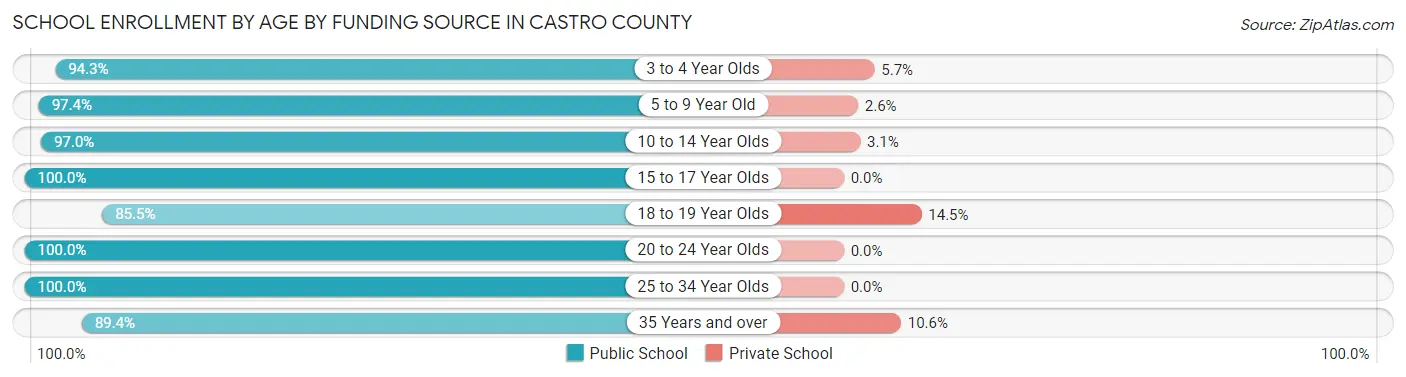
Out of a total of 2,017 students who are enrolled in schools in Castro County, 77 (3.8%) attend a private institution, while the remaining 1,940 (96.2%) are enrolled in public schools. The age group of 18 to 19 year olds has the highest likelihood of being enrolled in private schools, with 34 (14.5% in the age bracket) enrolled. Conversely, the age group of 15 to 17 year olds has the lowest likelihood of being enrolled in a private school, with 345 (100.0% in the age bracket) attending a public institution.
| Age Bracket | Public School | Private School |
| 3 to 4 Year Olds | 66 (94.3%) | 4 (5.7%) |
| 5 to 9 Year Old | 626 (97.4%) | 17 (2.6%) |
| 10 to 14 Year Olds | 509 (97.0%) | 16 (3.0%) |
| 15 to 17 Year Olds | 345 (100.0%) | 0 (0.0%) |
| 18 to 19 Year Olds | 201 (85.5%) | 34 (14.5%) |
| 20 to 24 Year Olds | 47 (100.0%) | 0 (0.0%) |
| 25 to 34 Year Olds | 105 (100.0%) | 0 (0.0%) |
| 35 Years and over | 42 (89.4%) | 5 (10.6%) |
| Total | 1,940 (96.2%) | 77 (3.8%) |
Educational Attainment by Field of Study in Castro County
Education (210 | 22.0%), bio, nature & agricultural (196 | 20.5%), psychology (124 | 13.0%), business (122 | 12.8%), and arts & humanities (72 | 7.5%) are the most common fields of study among 956 individuals in Castro County who have obtained a bachelor's degree or higher.
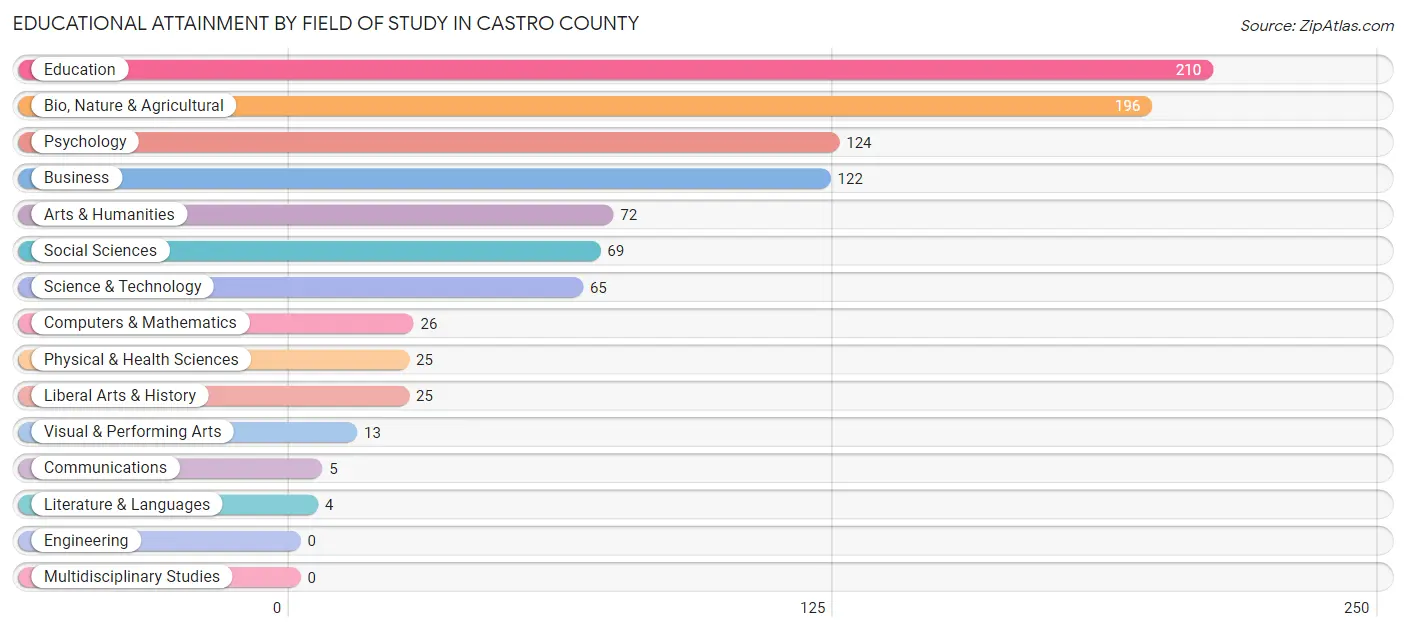
| Field of Study | # Graduates | % Graduates |
| Computers & Mathematics | 26 | 2.7% |
| Bio, Nature & Agricultural | 196 | 20.5% |
| Physical & Health Sciences | 25 | 2.6% |
| Psychology | 124 | 13.0% |
| Social Sciences | 69 | 7.2% |
| Engineering | 0 | 0.0% |
| Multidisciplinary Studies | 0 | 0.0% |
| Science & Technology | 65 | 6.8% |
| Business | 122 | 12.8% |
| Education | 210 | 22.0% |
| Literature & Languages | 4 | 0.4% |
| Liberal Arts & History | 25 | 2.6% |
| Visual & Performing Arts | 13 | 1.4% |
| Communications | 5 | 0.5% |
| Arts & Humanities | 72 | 7.5% |
| Total | 956 | 100.0% |
Transportation & Commute in Castro County
Vehicle Availability by Sex in Castro County
The most prevalent vehicle ownership categories in Castro County are males with 2 vehicles (652, accounting for 31.6%) and females with 2 vehicles (376, making up 50.1%).
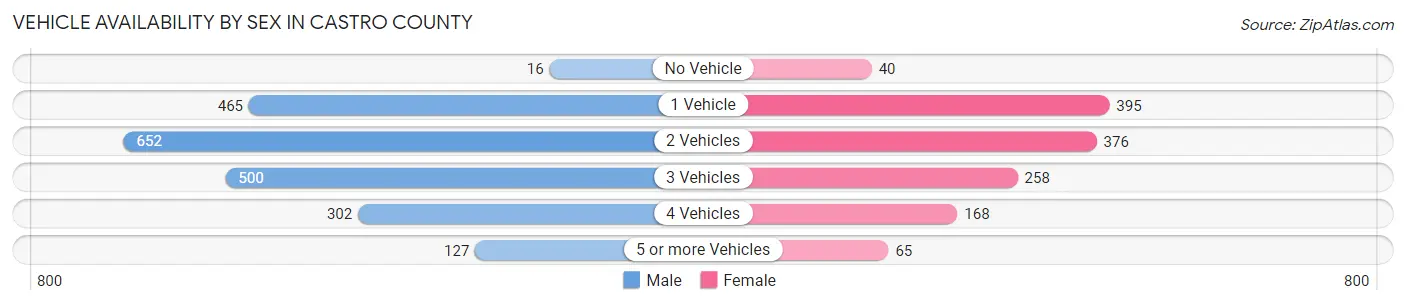
| Vehicles Available | Male | Female |
| No Vehicle | 16 (0.8%) | 40 (3.1%) |
| 1 Vehicle | 465 (22.6%) | 395 (30.3%) |
| 2 Vehicles | 652 (31.6%) | 376 (28.9%) |
| 3 Vehicles | 500 (24.2%) | 258 (19.8%) |
| 4 Vehicles | 302 (14.6%) | 168 (12.9%) |
| 5 or more Vehicles | 127 (6.2%) | 65 (5.0%) |
| Total | 2,062 (100.0%) | 1,302 (100.0%) |
Commute Time in Castro County
The most frequently occuring commute durations in Castro County are 5 to 9 minutes (1,171 commuters, 35.6%), less than 5 minutes (415 commuters, 12.6%), and 10 to 14 minutes (382 commuters, 11.6%).
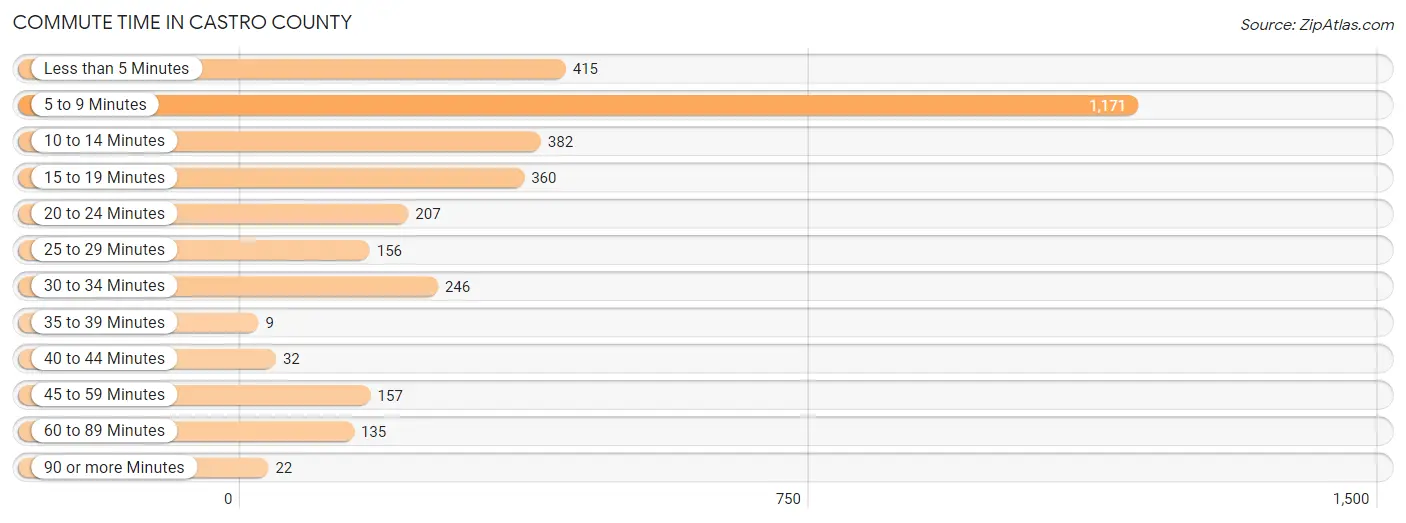
| Commute Time | # Commuters | % Commuters |
| Less than 5 Minutes | 415 | 12.6% |
| 5 to 9 Minutes | 1,171 | 35.6% |
| 10 to 14 Minutes | 382 | 11.6% |
| 15 to 19 Minutes | 360 | 10.9% |
| 20 to 24 Minutes | 207 | 6.3% |
| 25 to 29 Minutes | 156 | 4.7% |
| 30 to 34 Minutes | 246 | 7.5% |
| 35 to 39 Minutes | 9 | 0.3% |
| 40 to 44 Minutes | 32 | 1.0% |
| 45 to 59 Minutes | 157 | 4.8% |
| 60 to 89 Minutes | 135 | 4.1% |
| 90 or more Minutes | 22 | 0.7% |
Commute Time by Sex in Castro County
The most common commute times in Castro County are 5 to 9 minutes (724 commuters, 36.2%) for males and 5 to 9 minutes (447 commuters, 34.5%) for females.
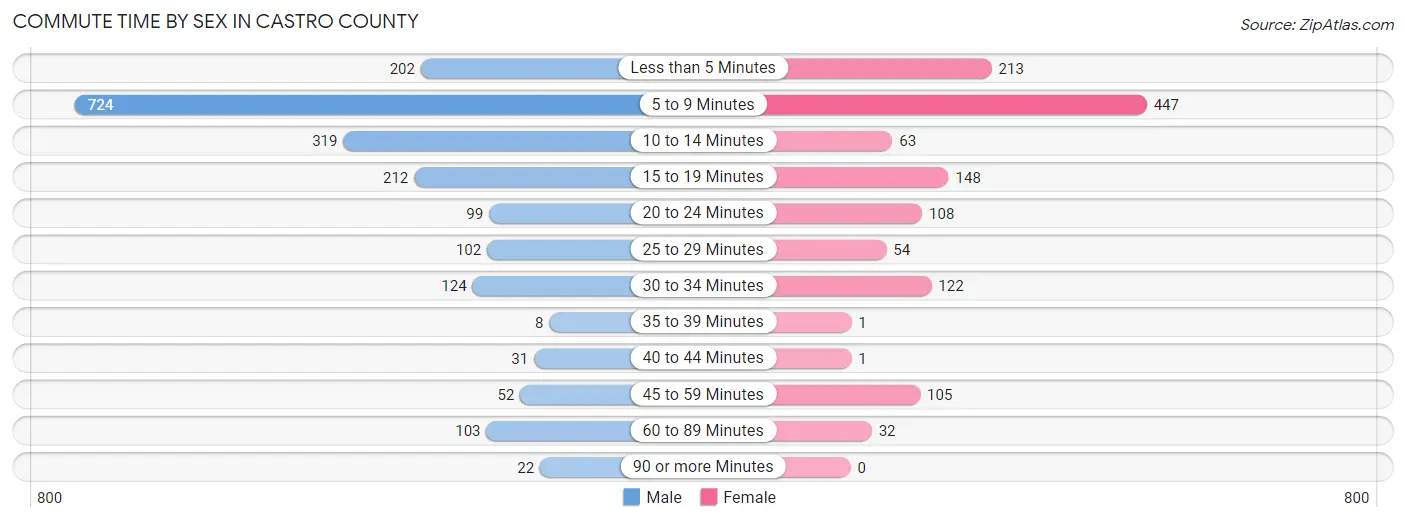
| Commute Time | Male | Female |
| Less than 5 Minutes | 202 (10.1%) | 213 (16.5%) |
| 5 to 9 Minutes | 724 (36.2%) | 447 (34.5%) |
| 10 to 14 Minutes | 319 (16.0%) | 63 (4.9%) |
| 15 to 19 Minutes | 212 (10.6%) | 148 (11.4%) |
| 20 to 24 Minutes | 99 (5.0%) | 108 (8.4%) |
| 25 to 29 Minutes | 102 (5.1%) | 54 (4.2%) |
| 30 to 34 Minutes | 124 (6.2%) | 122 (9.4%) |
| 35 to 39 Minutes | 8 (0.4%) | 1 (0.1%) |
| 40 to 44 Minutes | 31 (1.5%) | 1 (0.1%) |
| 45 to 59 Minutes | 52 (2.6%) | 105 (8.1%) |
| 60 to 89 Minutes | 103 (5.2%) | 32 (2.5%) |
| 90 or more Minutes | 22 (1.1%) | 0 (0.0%) |
Time of Departure to Work by Sex in Castro County
The most frequent times of departure to work in Castro County are 7:00 AM to 7:29 AM (281, 14.1%) for males and 7:30 AM to 7:59 AM (368, 28.4%) for females.
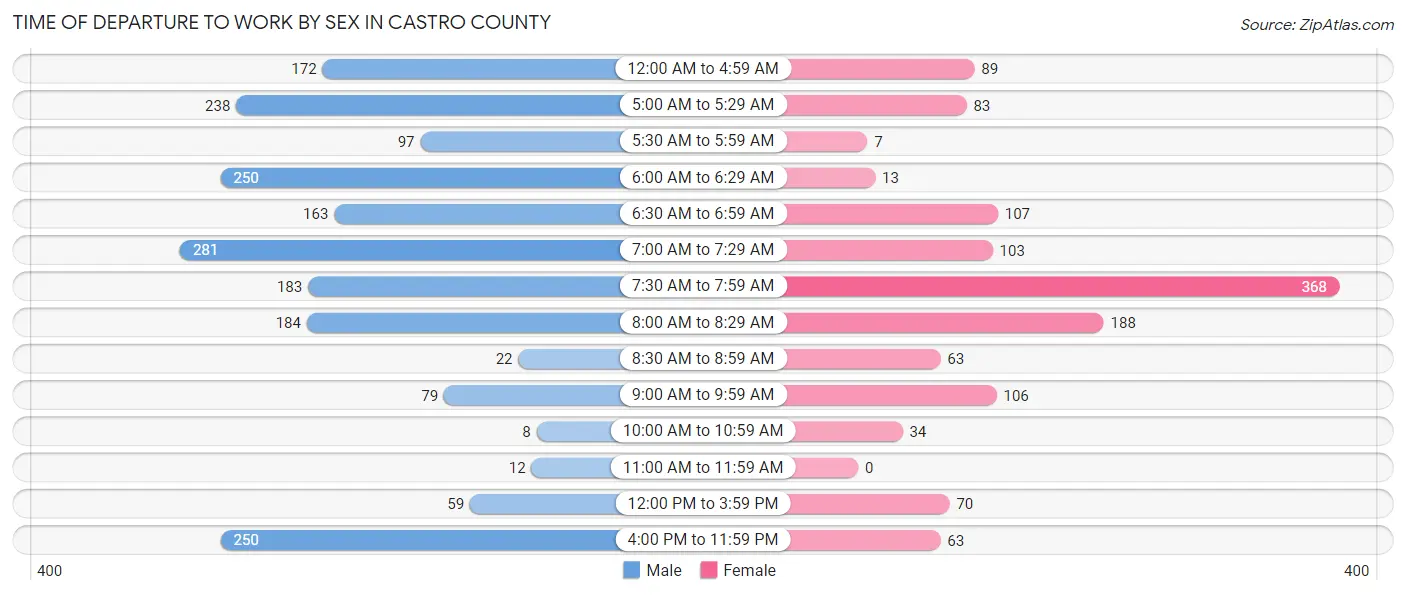
| Time of Departure | Male | Female |
| 12:00 AM to 4:59 AM | 172 (8.6%) | 89 (6.9%) |
| 5:00 AM to 5:29 AM | 238 (11.9%) | 83 (6.4%) |
| 5:30 AM to 5:59 AM | 97 (4.9%) | 7 (0.5%) |
| 6:00 AM to 6:29 AM | 250 (12.5%) | 13 (1.0%) |
| 6:30 AM to 6:59 AM | 163 (8.2%) | 107 (8.3%) |
| 7:00 AM to 7:29 AM | 281 (14.1%) | 103 (8.0%) |
| 7:30 AM to 7:59 AM | 183 (9.2%) | 368 (28.4%) |
| 8:00 AM to 8:29 AM | 184 (9.2%) | 188 (14.5%) |
| 8:30 AM to 8:59 AM | 22 (1.1%) | 63 (4.9%) |
| 9:00 AM to 9:59 AM | 79 (4.0%) | 106 (8.2%) |
| 10:00 AM to 10:59 AM | 8 (0.4%) | 34 (2.6%) |
| 11:00 AM to 11:59 AM | 12 (0.6%) | 0 (0.0%) |
| 12:00 PM to 3:59 PM | 59 (2.9%) | 70 (5.4%) |
| 4:00 PM to 11:59 PM | 250 (12.5%) | 63 (4.9%) |
| Total | 1,998 (100.0%) | 1,294 (100.0%) |
Housing Occupancy in Castro County
Occupancy by Ownership in Castro County
Of the total 2,384 dwellings in Castro County, owner-occupied units account for 1,540 (64.6%), while renter-occupied units make up 844 (35.4%).
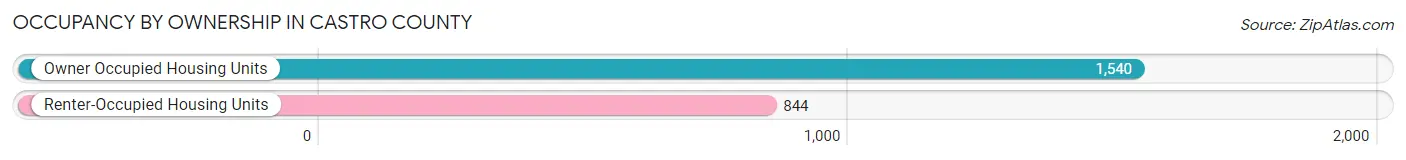
| Occupancy | # Housing Units | % Housing Units |
| Owner Occupied Housing Units | 1,540 | 64.6% |
| Renter-Occupied Housing Units | 844 | 35.4% |
| Total Occupied Housing Units | 2,384 | 100.0% |
Occupancy by Household Size in Castro County
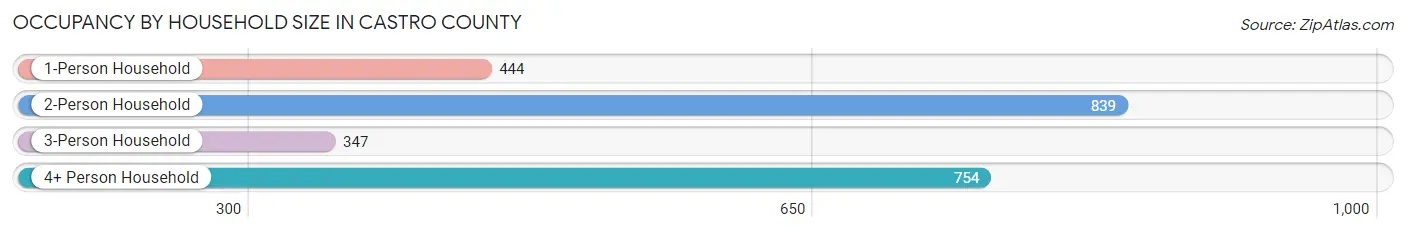
| Household Size | # Housing Units | % Housing Units |
| 1-Person Household | 444 | 18.6% |
| 2-Person Household | 839 | 35.2% |
| 3-Person Household | 347 | 14.6% |
| 4+ Person Household | 754 | 31.6% |
| Total Housing Units | 2,384 | 100.0% |
Occupancy by Ownership by Household Size in Castro County
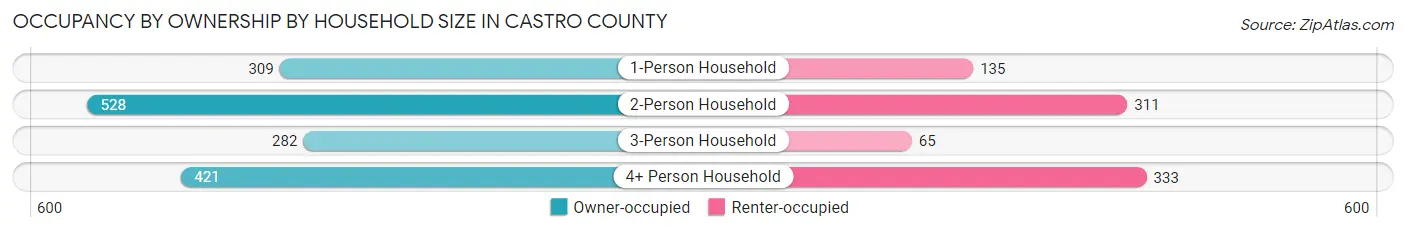
| Household Size | Owner-occupied | Renter-occupied |
| 1-Person Household | 309 (69.6%) | 135 (30.4%) |
| 2-Person Household | 528 (62.9%) | 311 (37.1%) |
| 3-Person Household | 282 (81.3%) | 65 (18.7%) |
| 4+ Person Household | 421 (55.8%) | 333 (44.2%) |
| Total Housing Units | 1,540 (64.6%) | 844 (35.4%) |
Occupancy by Educational Attainment in Castro County
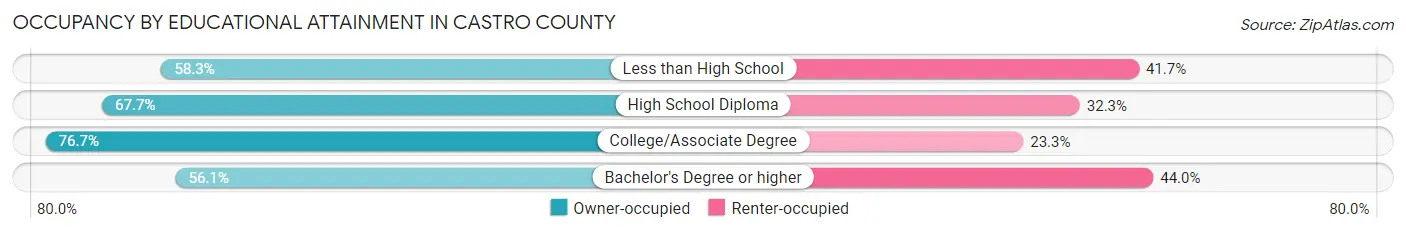
| Household Size | Owner-occupied | Renter-occupied |
| Less than High School | 330 (58.3%) | 236 (41.7%) |
| High School Diploma | 551 (67.7%) | 263 (32.3%) |
| College/Associate Degree | 358 (76.7%) | 109 (23.3%) |
| Bachelor's Degree or higher | 301 (56.0%) | 236 (44.0%) |
Occupancy by Age of Householder in Castro County
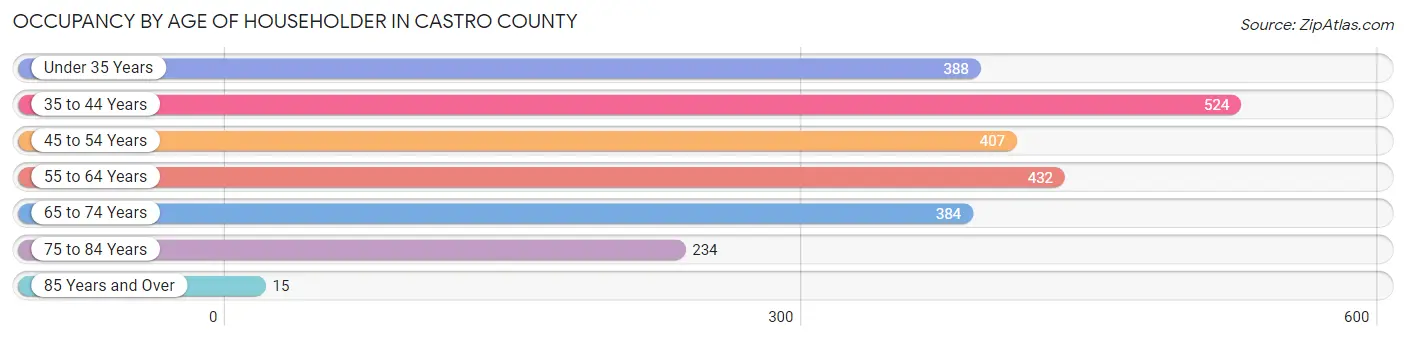
| Age Bracket | # Households | % Households |
| Under 35 Years | 388 | 16.3% |
| 35 to 44 Years | 524 | 22.0% |
| 45 to 54 Years | 407 | 17.1% |
| 55 to 64 Years | 432 | 18.1% |
| 65 to 74 Years | 384 | 16.1% |
| 75 to 84 Years | 234 | 9.8% |
| 85 Years and Over | 15 | 0.6% |
| Total | 2,384 | 100.0% |
Housing Finances in Castro County
Median Income by Occupancy in Castro County
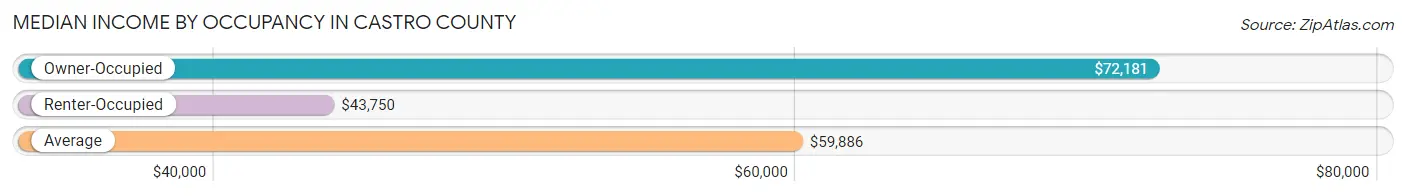
| Occupancy Type | # Households | Median Income |
| Owner-Occupied | 1,540 (64.6%) | $72,181 |
| Renter-Occupied | 844 (35.4%) | $43,750 |
| Average | 2,384 (100.0%) | $59,886 |
Occupancy by Householder Income Bracket in Castro County
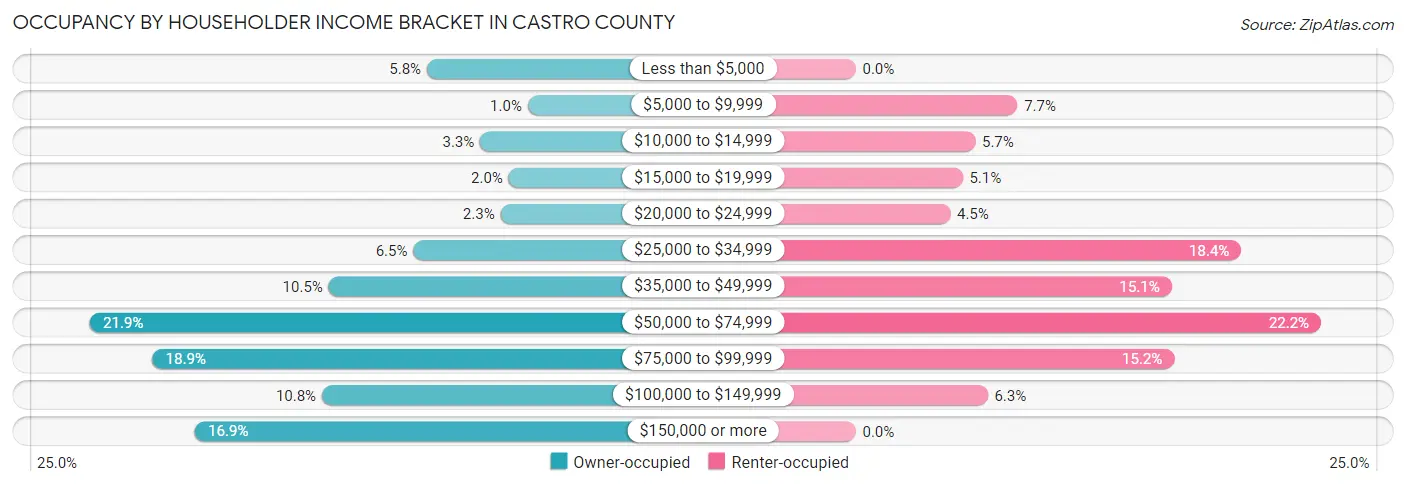
| Income Bracket | Owner-occupied | Renter-occupied |
| Less than $5,000 | 90 (5.8%) | 0 (0.0%) |
| $5,000 to $9,999 | 16 (1.0%) | 65 (7.7%) |
| $10,000 to $14,999 | 51 (3.3%) | 48 (5.7%) |
| $15,000 to $19,999 | 30 (1.9%) | 43 (5.1%) |
| $20,000 to $24,999 | 36 (2.3%) | 38 (4.5%) |
| $25,000 to $34,999 | 100 (6.5%) | 155 (18.4%) |
| $35,000 to $49,999 | 162 (10.5%) | 127 (15.0%) |
| $50,000 to $74,999 | 337 (21.9%) | 187 (22.2%) |
| $75,000 to $99,999 | 291 (18.9%) | 128 (15.2%) |
| $100,000 to $149,999 | 167 (10.8%) | 53 (6.3%) |
| $150,000 or more | 260 (16.9%) | 0 (0.0%) |
| Total | 1,540 (100.0%) | 844 (100.0%) |
Monthly Housing Cost Tiers in Castro County
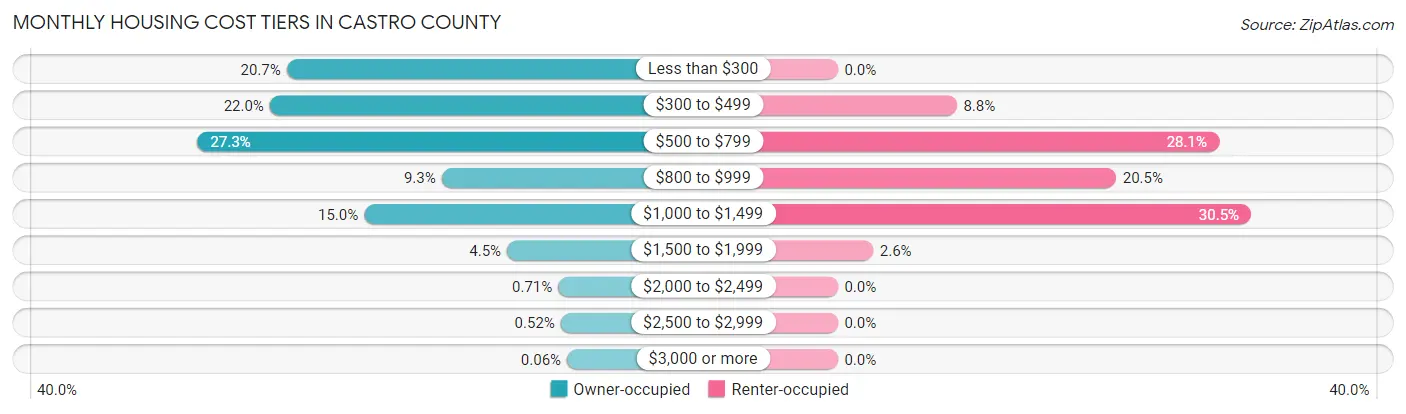
| Monthly Cost | Owner-occupied | Renter-occupied |
| Less than $300 | 319 (20.7%) | 0 (0.0%) |
| $300 to $499 | 338 (22.0%) | 74 (8.8%) |
| $500 to $799 | 420 (27.3%) | 237 (28.1%) |
| $800 to $999 | 143 (9.3%) | 173 (20.5%) |
| $1,000 to $1,499 | 231 (15.0%) | 257 (30.4%) |
| $1,500 to $1,999 | 69 (4.5%) | 22 (2.6%) |
| $2,000 to $2,499 | 11 (0.7%) | 0 (0.0%) |
| $2,500 to $2,999 | 8 (0.5%) | 0 (0.0%) |
| $3,000 or more | 1 (0.1%) | 0 (0.0%) |
| Total | 1,540 (100.0%) | 844 (100.0%) |
Physical Housing Characteristics in Castro County
Housing Structures in Castro County
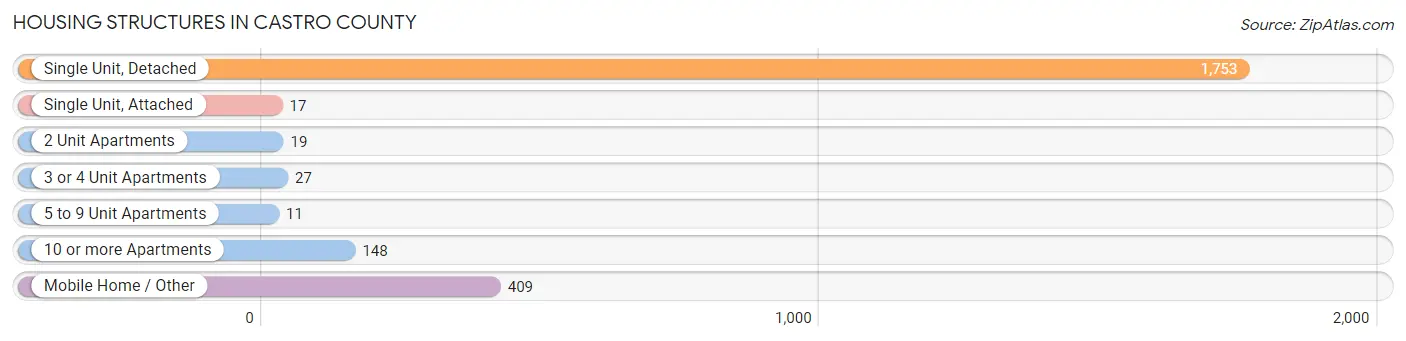
| Structure Type | # Housing Units | % Housing Units |
| Single Unit, Detached | 1,753 | 73.5% |
| Single Unit, Attached | 17 | 0.7% |
| 2 Unit Apartments | 19 | 0.8% |
| 3 or 4 Unit Apartments | 27 | 1.1% |
| 5 to 9 Unit Apartments | 11 | 0.5% |
| 10 or more Apartments | 148 | 6.2% |
| Mobile Home / Other | 409 | 17.2% |
| Total | 2,384 | 100.0% |
Housing Structures by Occupancy in Castro County
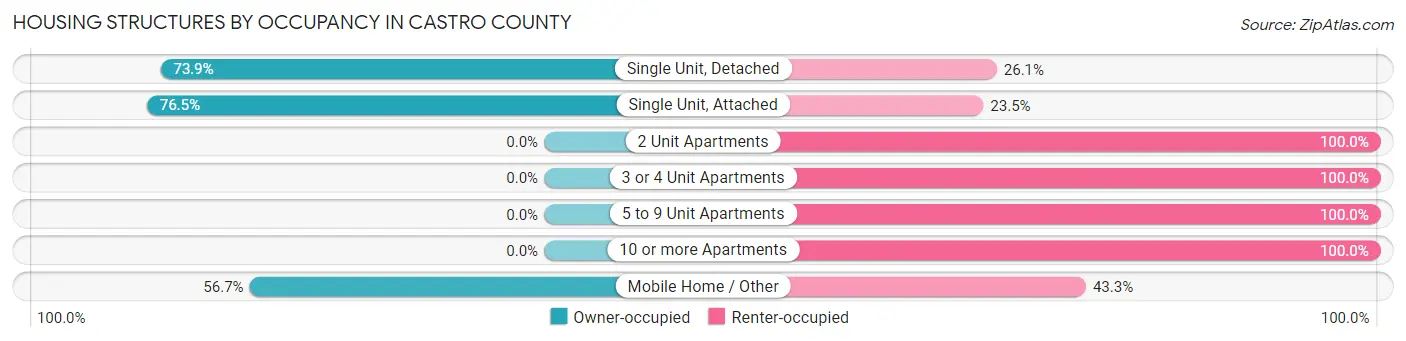
| Structure Type | Owner-occupied | Renter-occupied |
| Single Unit, Detached | 1,295 (73.9%) | 458 (26.1%) |
| Single Unit, Attached | 13 (76.5%) | 4 (23.5%) |
| 2 Unit Apartments | 0 (0.0%) | 19 (100.0%) |
| 3 or 4 Unit Apartments | 0 (0.0%) | 27 (100.0%) |
| 5 to 9 Unit Apartments | 0 (0.0%) | 11 (100.0%) |
| 10 or more Apartments | 0 (0.0%) | 148 (100.0%) |
| Mobile Home / Other | 232 (56.7%) | 177 (43.3%) |
| Total | 1,540 (64.6%) | 844 (35.4%) |
Housing Structures by Number of Rooms in Castro County
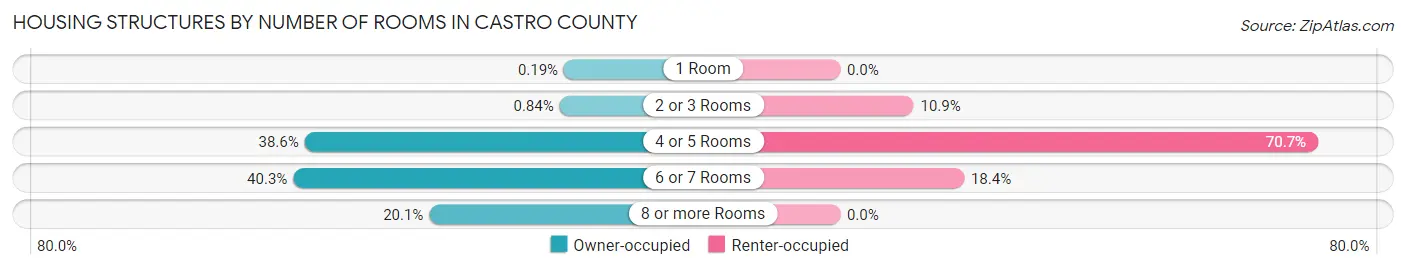
| Number of Rooms | Owner-occupied | Renter-occupied |
| 1 Room | 3 (0.2%) | 0 (0.0%) |
| 2 or 3 Rooms | 13 (0.8%) | 92 (10.9%) |
| 4 or 5 Rooms | 594 (38.6%) | 597 (70.7%) |
| 6 or 7 Rooms | 620 (40.3%) | 155 (18.4%) |
| 8 or more Rooms | 310 (20.1%) | 0 (0.0%) |
| Total | 1,540 (100.0%) | 844 (100.0%) |
Housing Structure by Heating Type in Castro County
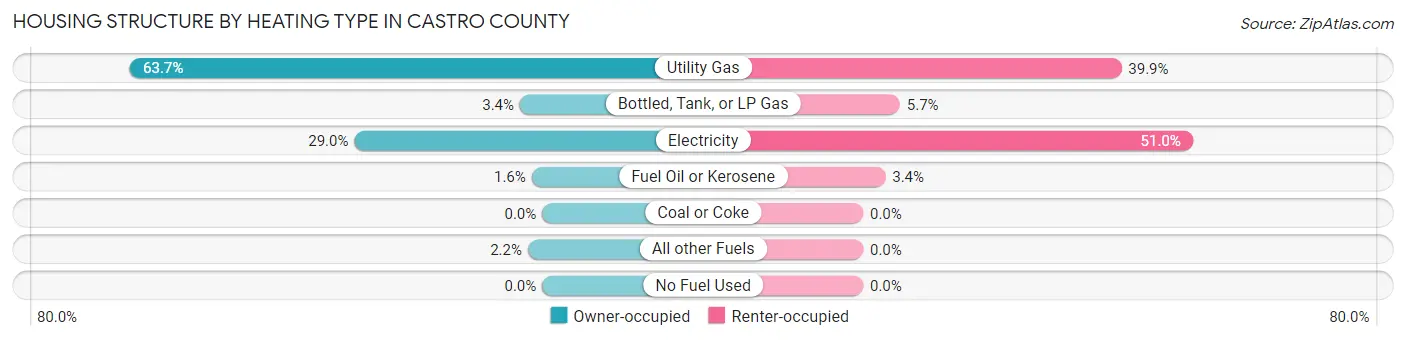
| Heating Type | Owner-occupied | Renter-occupied |
| Utility Gas | 981 (63.7%) | 337 (39.9%) |
| Bottled, Tank, or LP Gas | 53 (3.4%) | 48 (5.7%) |
| Electricity | 447 (29.0%) | 430 (50.9%) |
| Fuel Oil or Kerosene | 25 (1.6%) | 29 (3.4%) |
| Coal or Coke | 0 (0.0%) | 0 (0.0%) |
| All other Fuels | 34 (2.2%) | 0 (0.0%) |
| No Fuel Used | 0 (0.0%) | 0 (0.0%) |
| Total | 1,540 (100.0%) | 844 (100.0%) |
Household Vehicle Usage in Castro County
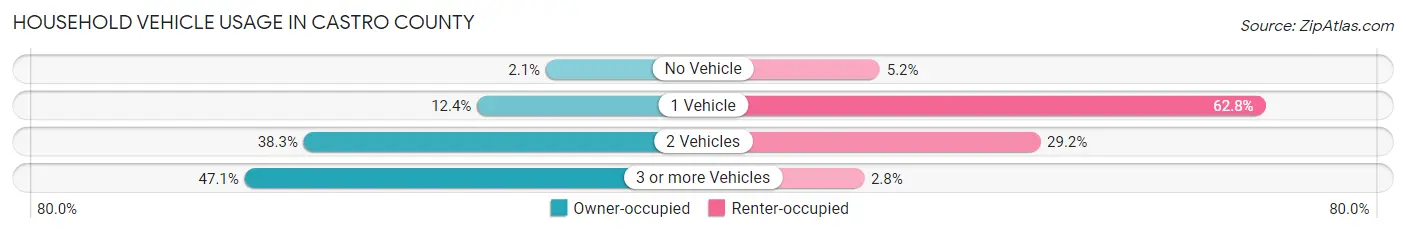
| Vehicles per Household | Owner-occupied | Renter-occupied |
| No Vehicle | 33 (2.1%) | 44 (5.2%) |
| 1 Vehicle | 191 (12.4%) | 530 (62.8%) |
| 2 Vehicles | 590 (38.3%) | 246 (29.1%) |
| 3 or more Vehicles | 726 (47.1%) | 24 (2.8%) |
| Total | 1,540 (100.0%) | 844 (100.0%) |
Real Estate & Mortgages in Castro County
Real Estate and Mortgage Overview in Castro County
| Characteristic | Without Mortgage | With Mortgage |
| Housing Units | 1,069 | 471 |
| Median Property Value | $76,100 | $111,800 |
| Median Household Income | $60,585 | $154 |
| Monthly Housing Costs | $406 | $1 |
| Real Estate Taxes | $796 | $4 |
Property Value by Mortgage Status in Castro County
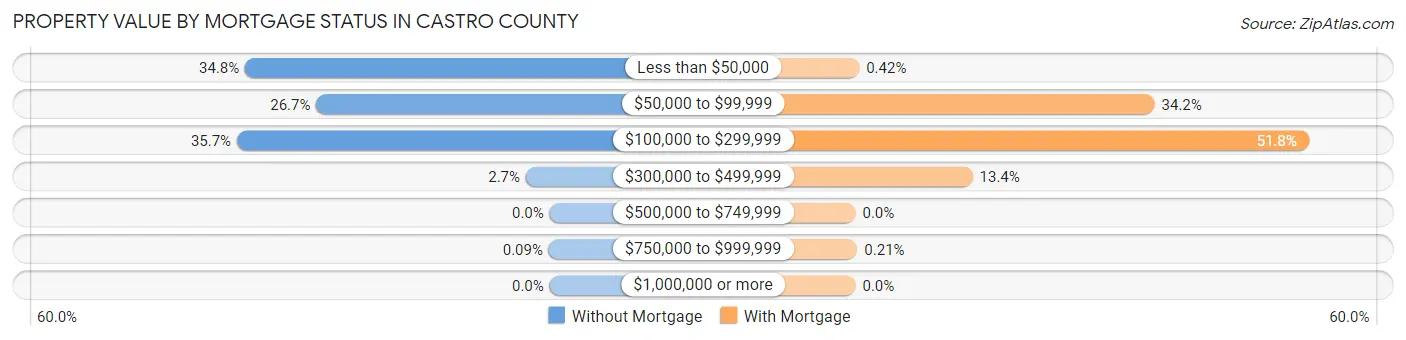
| Property Value | Without Mortgage | With Mortgage |
| Less than $50,000 | 372 (34.8%) | 2 (0.4%) |
| $50,000 to $99,999 | 285 (26.7%) | 161 (34.2%) |
| $100,000 to $299,999 | 382 (35.7%) | 244 (51.8%) |
| $300,000 to $499,999 | 29 (2.7%) | 63 (13.4%) |
| $500,000 to $749,999 | 0 (0.0%) | 0 (0.0%) |
| $750,000 to $999,999 | 1 (0.1%) | 1 (0.2%) |
| $1,000,000 or more | 0 (0.0%) | 0 (0.0%) |
| Total | 1,069 (100.0%) | 471 (100.0%) |
Household Income by Mortgage Status in Castro County
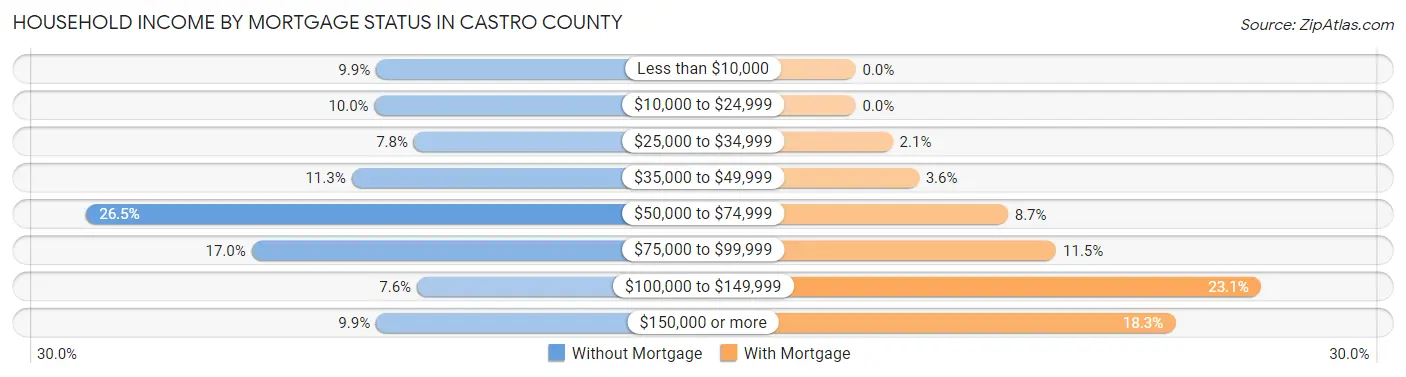
| Household Income | Without Mortgage | With Mortgage |
| Less than $10,000 | 106 (9.9%) | 0 (0.0%) |
| $10,000 to $24,999 | 107 (10.0%) | 0 (0.0%) |
| $25,000 to $34,999 | 83 (7.8%) | 10 (2.1%) |
| $35,000 to $49,999 | 121 (11.3%) | 17 (3.6%) |
| $50,000 to $74,999 | 283 (26.5%) | 41 (8.7%) |
| $75,000 to $99,999 | 182 (17.0%) | 54 (11.5%) |
| $100,000 to $149,999 | 81 (7.6%) | 109 (23.1%) |
| $150,000 or more | 106 (9.9%) | 86 (18.3%) |
| Total | 1,069 (100.0%) | 471 (100.0%) |
Property Value to Household Income Ratio in Castro County
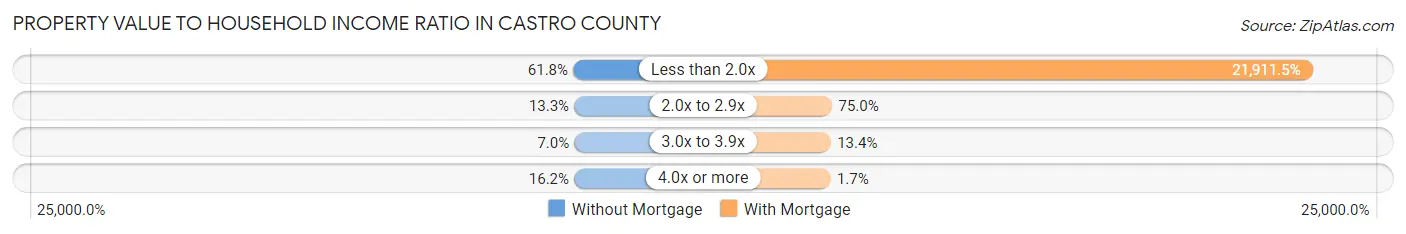
| Value-to-Income Ratio | Without Mortgage | With Mortgage |
| Less than 2.0x | 661 (61.8%) | 103,203 (21,911.5%) |
| 2.0x to 2.9x | 142 (13.3%) | 353 (75.0%) |
| 3.0x to 3.9x | 75 (7.0%) | 63 (13.4%) |
| 4.0x or more | 173 (16.2%) | 8 (1.7%) |
| Total | 1,069 (100.0%) | 471 (100.0%) |
Real Estate Taxes by Mortgage Status in Castro County

| Property Taxes | Without Mortgage | With Mortgage |
| Less than $800 | 518 (48.5%) | 0 (0.0%) |
| $800 to $1,499 | 195 (18.2%) | 49 (10.4%) |
| $800 to $1,499 | 317 (29.6%) | 120 (25.5%) |
| Total | 1,069 (100.0%) | 471 (100.0%) |
Health & Disability in Castro County
Health Insurance Coverage by Age in Castro County
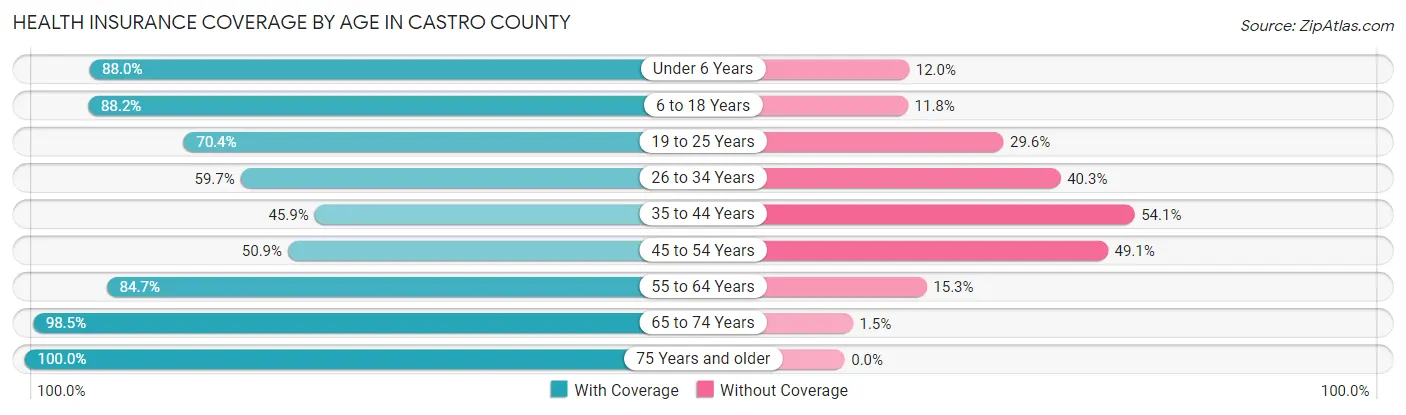
| Age Bracket | With Coverage | Without Coverage |
| Under 6 Years | 637 (88.0%) | 87 (12.0%) |
| 6 to 18 Years | 1,412 (88.2%) | 189 (11.8%) |
| 19 to 25 Years | 459 (70.4%) | 193 (29.6%) |
| 26 to 34 Years | 442 (59.7%) | 298 (40.3%) |
| 35 to 44 Years | 372 (45.9%) | 438 (54.1%) |
| 45 to 54 Years | 390 (50.9%) | 376 (49.1%) |
| 55 to 64 Years | 692 (84.7%) | 125 (15.3%) |
| 65 to 74 Years | 708 (98.5%) | 11 (1.5%) |
| 75 Years and older | 470 (100.0%) | 0 (0.0%) |
| Total | 5,582 (76.5%) | 1,717 (23.5%) |
Health Insurance Coverage by Citizenship Status in Castro County

| Citizenship Status | With Coverage | Without Coverage |
| Native Born | 637 (88.0%) | 87 (12.0%) |
| Foreign Born, Citizen | 1,412 (88.2%) | 189 (11.8%) |
| Foreign Born, not a Citizen | 459 (70.4%) | 193 (29.6%) |
Health Insurance Coverage by Household Income in Castro County
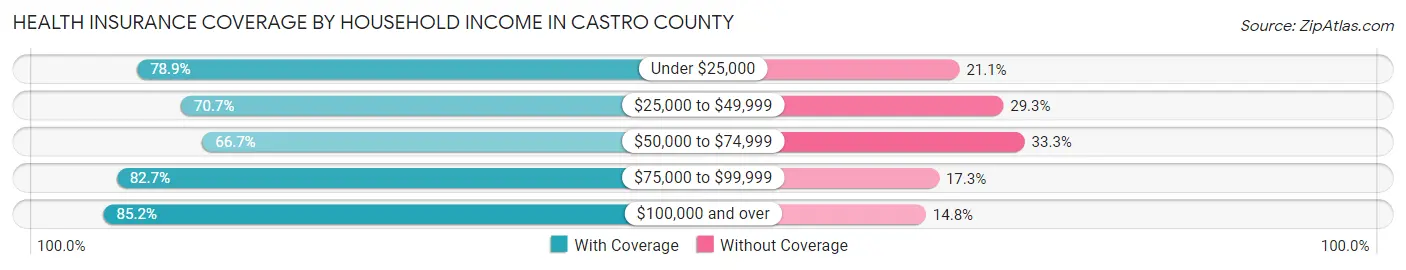
| Household Income | With Coverage | Without Coverage |
| Under $25,000 | 725 (78.9%) | 194 (21.1%) |
| $25,000 to $49,999 | 974 (70.7%) | 404 (29.3%) |
| $50,000 to $74,999 | 1,233 (66.7%) | 616 (33.3%) |
| $75,000 to $99,999 | 1,202 (82.7%) | 251 (17.3%) |
| $100,000 and over | 1,448 (85.2%) | 252 (14.8%) |
Public vs Private Health Insurance Coverage by Age in Castro County
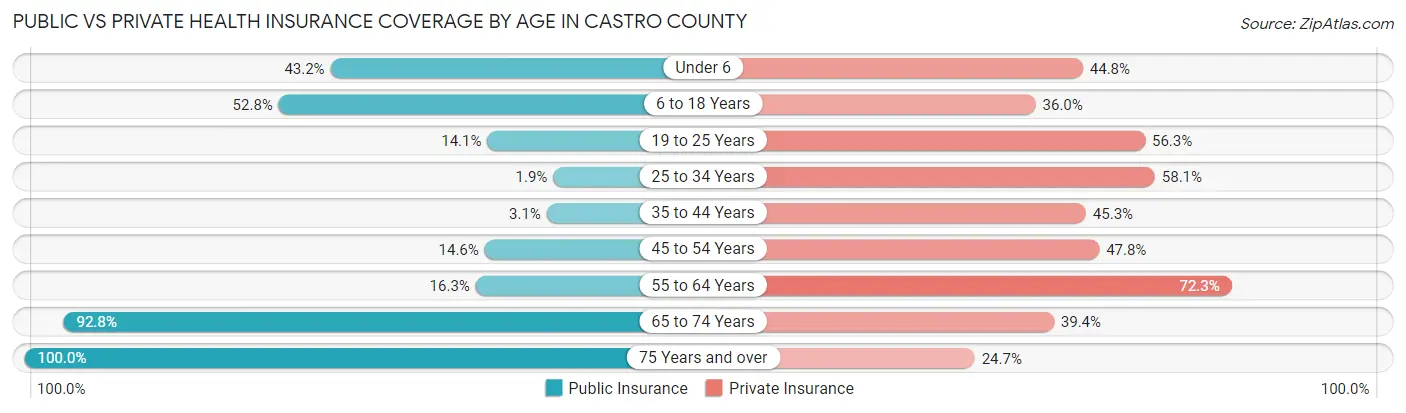
| Age Bracket | Public Insurance | Private Insurance |
| Under 6 | 313 (43.2%) | 324 (44.8%) |
| 6 to 18 Years | 846 (52.8%) | 576 (36.0%) |
| 19 to 25 Years | 92 (14.1%) | 367 (56.3%) |
| 25 to 34 Years | 14 (1.9%) | 430 (58.1%) |
| 35 to 44 Years | 25 (3.1%) | 367 (45.3%) |
| 45 to 54 Years | 112 (14.6%) | 366 (47.8%) |
| 55 to 64 Years | 133 (16.3%) | 591 (72.3%) |
| 65 to 74 Years | 667 (92.8%) | 283 (39.4%) |
| 75 Years and over | 470 (100.0%) | 116 (24.7%) |
| Total | 2,672 (36.6%) | 3,420 (46.9%) |
Disability Status by Sex by Age in Castro County
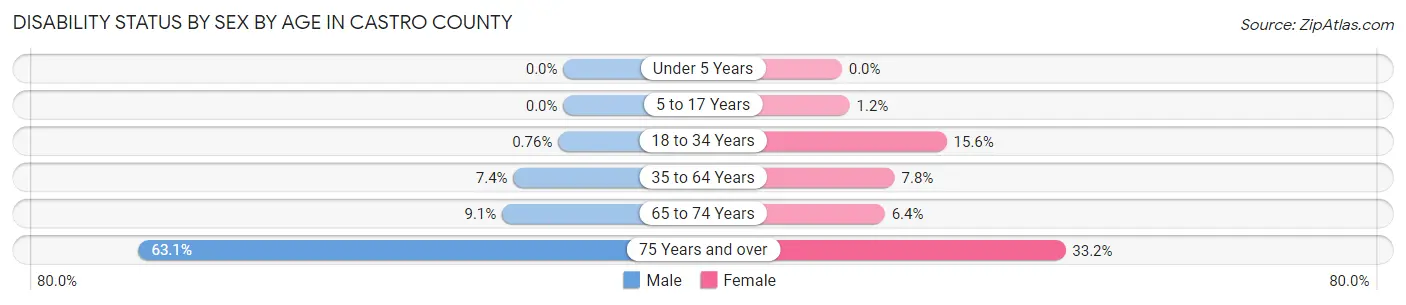
| Age Bracket | Male | Female |
| Under 5 Years | 0 (0.0%) | 0 (0.0%) |
| 5 to 17 Years | 0 (0.0%) | 9 (1.2%) |
| 18 to 34 Years | 6 (0.8%) | 122 (15.6%) |
| 35 to 64 Years | 96 (7.4%) | 86 (7.8%) |
| 65 to 74 Years | 34 (9.1%) | 22 (6.4%) |
| 75 Years and over | 135 (63.1%) | 85 (33.2%) |
Disability Class by Sex by Age in Castro County
Disability Class: Hearing Difficulty
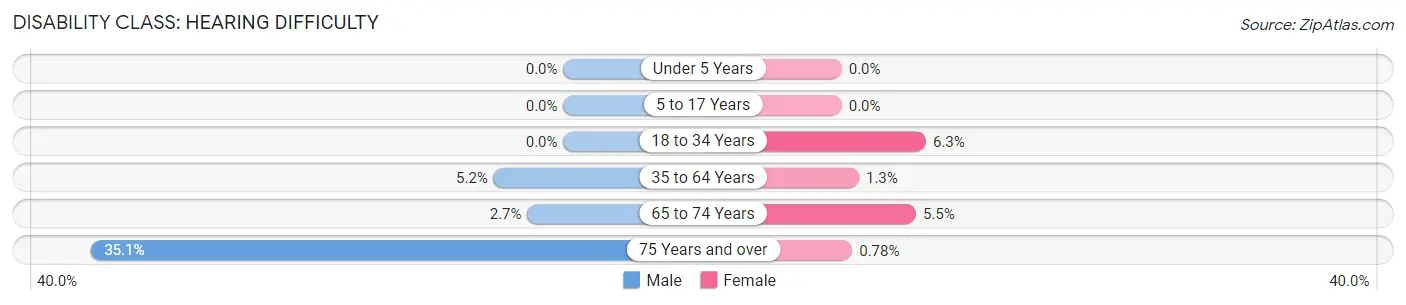
| Age Bracket | Male | Female |
| Under 5 Years | 0 (0.0%) | 0 (0.0%) |
| 5 to 17 Years | 0 (0.0%) | 0 (0.0%) |
| 18 to 34 Years | 0 (0.0%) | 49 (6.2%) |
| 35 to 64 Years | 67 (5.2%) | 14 (1.3%) |
| 65 to 74 Years | 10 (2.7%) | 19 (5.5%) |
| 75 Years and over | 75 (35.0%) | 2 (0.8%) |
Disability Class: Vision Difficulty
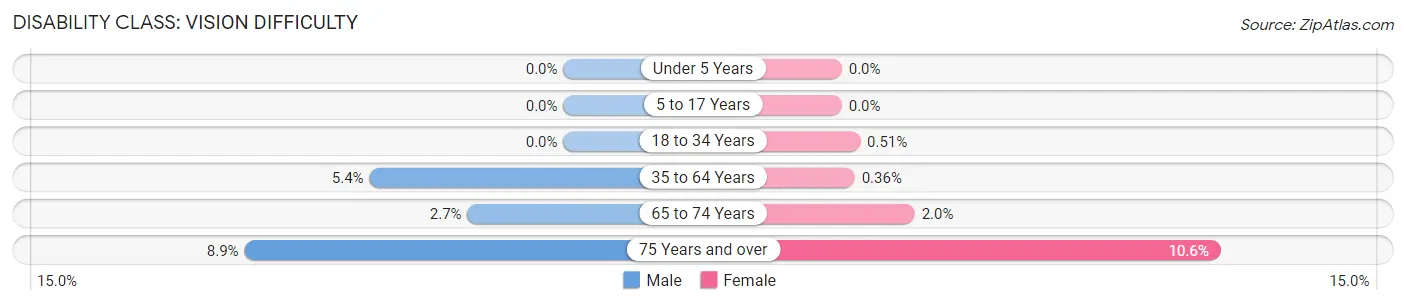
| Age Bracket | Male | Female |
| Under 5 Years | 0 (0.0%) | 0 (0.0%) |
| 5 to 17 Years | 0 (0.0%) | 0 (0.0%) |
| 18 to 34 Years | 0 (0.0%) | 4 (0.5%) |
| 35 to 64 Years | 70 (5.4%) | 4 (0.4%) |
| 65 to 74 Years | 10 (2.7%) | 7 (2.0%) |
| 75 Years and over | 19 (8.9%) | 27 (10.5%) |
Disability Class: Cognitive Difficulty
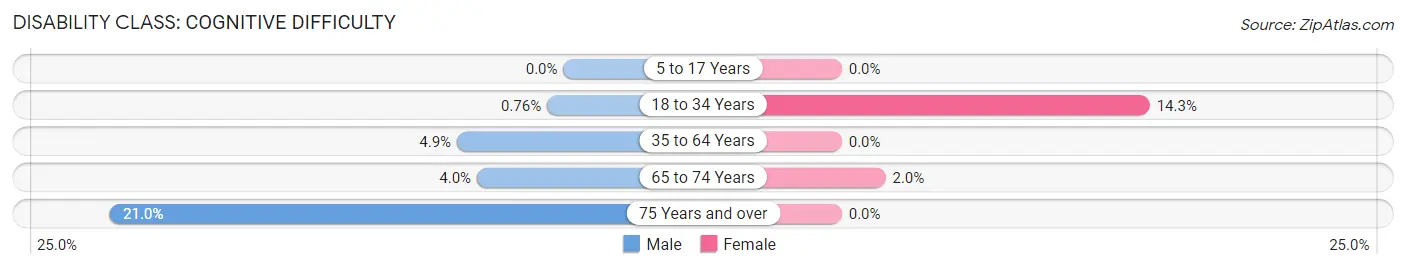
| Age Bracket | Male | Female |
| 5 to 17 Years | 0 (0.0%) | 0 (0.0%) |
| 18 to 34 Years | 6 (0.8%) | 112 (14.3%) |
| 35 to 64 Years | 64 (4.9%) | 0 (0.0%) |
| 65 to 74 Years | 15 (4.0%) | 7 (2.0%) |
| 75 Years and over | 45 (21.0%) | 0 (0.0%) |
Disability Class: Ambulatory Difficulty
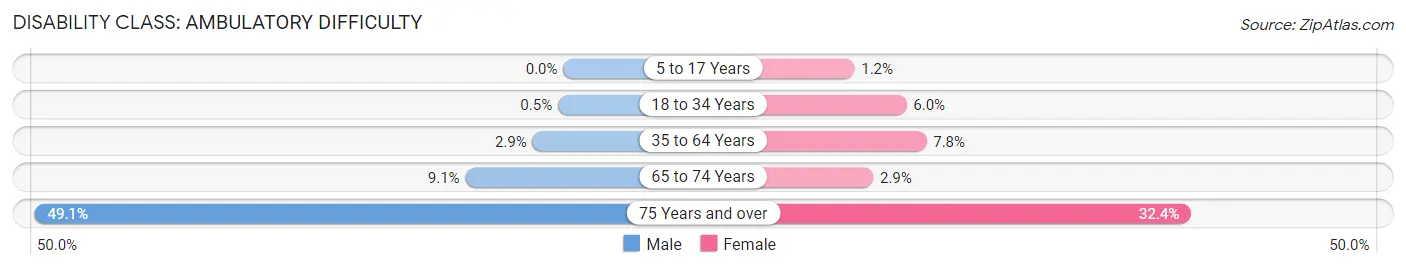
| Age Bracket | Male | Female |
| 5 to 17 Years | 0 (0.0%) | 9 (1.2%) |
| 18 to 34 Years | 4 (0.5%) | 47 (6.0%) |
| 35 to 64 Years | 37 (2.9%) | 86 (7.8%) |
| 65 to 74 Years | 34 (9.1%) | 10 (2.9%) |
| 75 Years and over | 105 (49.1%) | 83 (32.4%) |
Disability Class: Self-Care Difficulty
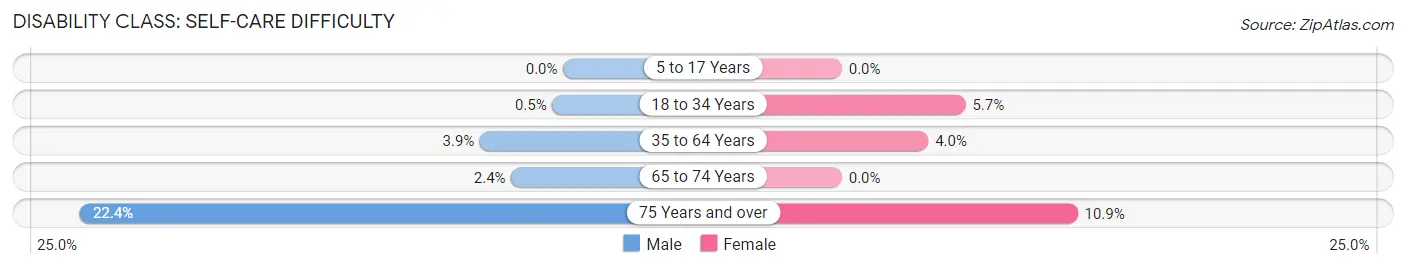
| Age Bracket | Male | Female |
| 5 to 17 Years | 0 (0.0%) | 0 (0.0%) |
| 18 to 34 Years | 4 (0.5%) | 45 (5.7%) |
| 35 to 64 Years | 50 (3.9%) | 44 (4.0%) |
| 65 to 74 Years | 9 (2.4%) | 0 (0.0%) |
| 75 Years and over | 48 (22.4%) | 28 (10.9%) |
Technology Access in Castro County
Computing Device Access in Castro County
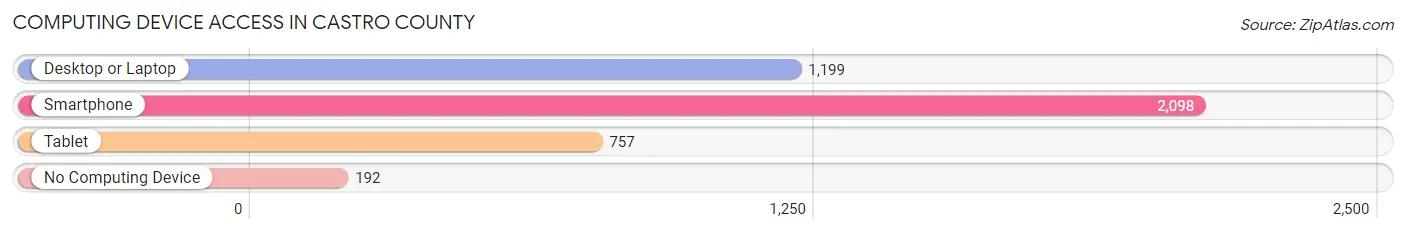
| Device Type | # Households | % Households |
| Desktop or Laptop | 1,199 | 50.3% |
| Smartphone | 2,098 | 88.0% |
| Tablet | 757 | 31.8% |
| No Computing Device | 192 | 8.1% |
| Total | 2,384 | 100.0% |
Internet Access in Castro County
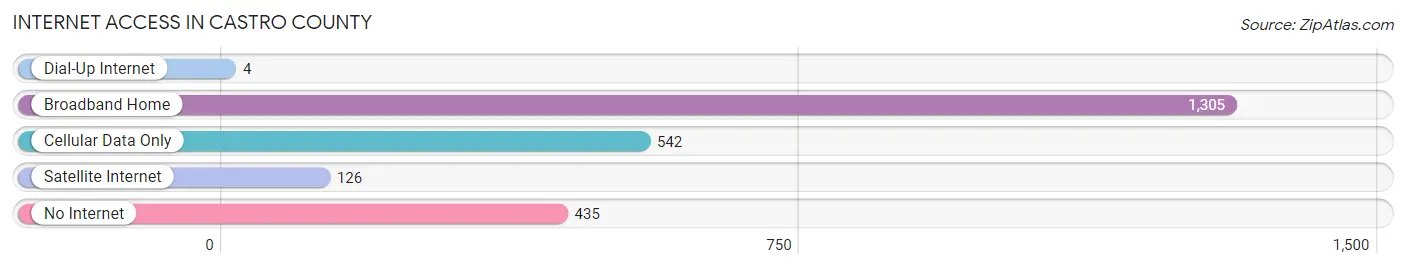
| Internet Type | # Households | % Households |
| Dial-Up Internet | 4 | 0.2% |
| Broadband Home | 1,305 | 54.7% |
| Cellular Data Only | 542 | 22.7% |
| Satellite Internet | 126 | 5.3% |
| No Internet | 435 | 18.2% |
| Total | 2,384 | 100.0% |
Castro County Summary
Castro County is a county located in the U.S. state of Texas. As of the 2010 census, its population was 8,062. The county seat is Dimmitt. The county was created in 1876 and organized in 1891. It is named for Henri Castro, who was a colonizer of the area.
Geography
Castro County is located in the northwestern part of the state of Texas. It is bordered by Parmer County to the north, Bailey County to the east, Lamb County to the south, and Swisher County to the west. The county has a total area of 890 square miles, of which 888 square miles is land and 2 square miles (0.2%) is water.
The county is located in the High Plains region of the state, and is mostly flat with some rolling hills. The landscape is mostly covered in grasslands, with some mesquite and cactus. The Canadian River runs through the county, and there are several small lakes and reservoirs.
Demographics
As of the 2010 census, there were 8,062 people, 2,845 households, and 2,092 families residing in the county. The population density was 9 people per square mile. There were 3,521 housing units at an average density of 4 per square mile. The racial makeup of the county was 73.2% White, 0.7% Black or African American, 0.7% Native American, 0.2% Asian, 0.1% Pacific Islander, 22.9% from other races, and 2.2% from two or more races. 44.2% of the population were Hispanic or Latino of any race.
There were 2,845 households, out of which 35.2% had children under the age of 18 living with them, 57.2% were married couples living together, 11.2% had a female householder with no husband present, and 26.2% were non-families. 22.7% of all households were made up of individuals, and 11.2% had someone living alone who was 65 years of age or older. The average household size was 2.78 and the average family size was 3.27.
In the county, the population was spread out, with 28.7% under the age of 18, 8.2% from 18 to 24, 25.2% from 25 to 44, 22.7% from 45 to 64, and 15.2% who were 65 years of age or older. The median age was 36 years. For every 100 females there were 97.2 males. For every 100 females age 18 and over, there were 94.2 males.
The median income for a household in the county was $30,917, and the median income for a family was $35,938. Males had a median income of $27,917 versus $20,917 for females. The per capita income for the county was $14,845. About 16.2% of families and 19.2% of the population were below the poverty line, including 25.2% of those under age 18 and 16.2% of those age 65 or over.
Economy
The economy of Castro County is largely based on agriculture. The county is home to a variety of crops, including cotton, corn, wheat, sorghum, and hay. Cattle and sheep are also raised in the area.
The county is also home to several oil and gas fields, and there are several oil and gas related businesses in the area. The county is also home to several manufacturing companies, including a plastics plant and a food processing plant.
The county is served by the Dimmitt Independent School District, which serves the towns of Dimmitt, Hart, Nazareth, and Summerfield. The county is also home to several churches, a library, and a museum.
Conclusion
Castro County is a rural county located in the northwestern part of the state of Texas. It is home to a variety of crops, cattle, and sheep, as well as several oil and gas fields. The county is served by the Dimmitt Independent School District, and is home to several churches, a library, and a museum. The population of the county is largely Hispanic or Latino, and the median household income is slightly below the state average.
Common Questions
What is Per Capita Income in Castro County?
Per Capita income in Castro County is $25,425.
What is the Median Family Income in Castro County?
Median Family Income in Castro County is $61,098.
What is the Median Household income in Castro County?
Median Household Income in Castro County is $59,886.
What is Income or Wage Gap in Castro County?
Income or Wage Gap in Castro County is 41.2%.
Women in Castro County earn 58.8 cents for every dollar earned by a man.
What is Family Income Deficit in Castro County?
Family Income Deficit in Castro County is $12,900.
Families that are below poverty line in Castro County earn $12,900 less on average than the poverty threshold level.
What is Inequality or Gini Index in Castro County?
Inequality or Gini Index in Castro County is 0.42.
What is the Total Population of Castro County?
Total Population of Castro County is 7,381.
What is the Total Male Population of Castro County?
Total Male Population of Castro County is 3,780.
What is the Total Female Population of Castro County?
Total Female Population of Castro County is 3,601.
What is the Ratio of Males per 100 Females in Castro County?
There are 104.97 Males per 100 Females in Castro County.
What is the Ratio of Females per 100 Males in Castro County?
There are 95.26 Females per 100 Males in Castro County.
What is the Median Population Age in Castro County?
Median Population Age in Castro County is 34.8 Years.
What is the Average Family Size in Castro County
Average Family Size in Castro County is 3.6 People.
What is the Average Household Size in Castro County
Average Household Size in Castro County is 3.1 People.
How Large is the Labor Force in Castro County?
There are 3,594 People in the Labor Forcein in Castro County.
What is the Percentage of People in the Labor Force in Castro County?
66.5% of People are in the Labor Force in Castro County.
What is the Unemployment Rate in Castro County?
Unemployment Rate in Castro County is 3.6%.