Carson County, TX Map & Demographics
Carson County Map
Carson County Overview
$40,192
PER CAPITA INCOME
$107,885
AVG FAMILY INCOME
$83,199
AVG HOUSEHOLD INCOME
48.7%
WAGE / INCOME GAP [ % ]
51.3¢/ $1
WAGE / INCOME GAP [ $ ]
0.39
INEQUALITY / GINI INDEX
5,801
TOTAL POPULATION
2,890
MALE POPULATION
2,911
FEMALE POPULATION
99.28
MALES / 100 FEMALES
100.73
FEMALES / 100 MALES
41.3
MEDIAN AGE
3.2
AVG FAMILY SIZE
2.5
AVG HOUSEHOLD SIZE
2,887
LABOR FORCE [ PEOPLE ]
62.3%
PERCENT IN LABOR FORCE
1.9%
UNEMPLOYMENT RATE
Carson County Area Codes
Income in Carson County
Income Overview in Carson County
Per Capita Income in Carson County is $40,192, while median incomes of families and households are $107,885 and $83,199 respectively.
| Characteristic | Number | Measure |
| Per Capita Income | 5,801 | $40,192 |
| Median Family Income | 1,466 | $107,885 |
| Mean Family Income | 1,466 | $119,968 |
| Median Household Income | 2,260 | $83,199 |
| Mean Household Income | 2,260 | $100,407 |
| Income Deficit | 1,466 | $0 |
| Wage / Income Gap (%) | 5,801 | 48.67% |
| Wage / Income Gap ($) | 5,801 | 51.33¢ per $1 |
| Gini / Inequality Index | 5,801 | 0.39 |
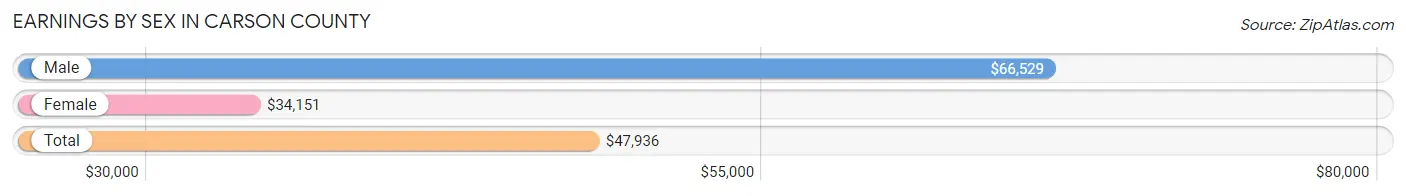
Earnings by Sex in Carson County
Average Earnings in Carson County are $47,936, $66,529 for men and $34,151 for women, a difference of 48.7%.
| Sex | Number | Average Earnings |
| Male | 1,628 (53.7%) | $66,529 |
| Female | 1,401 (46.3%) | $34,151 |
| Total | 3,029 (100.0%) | $47,936 |
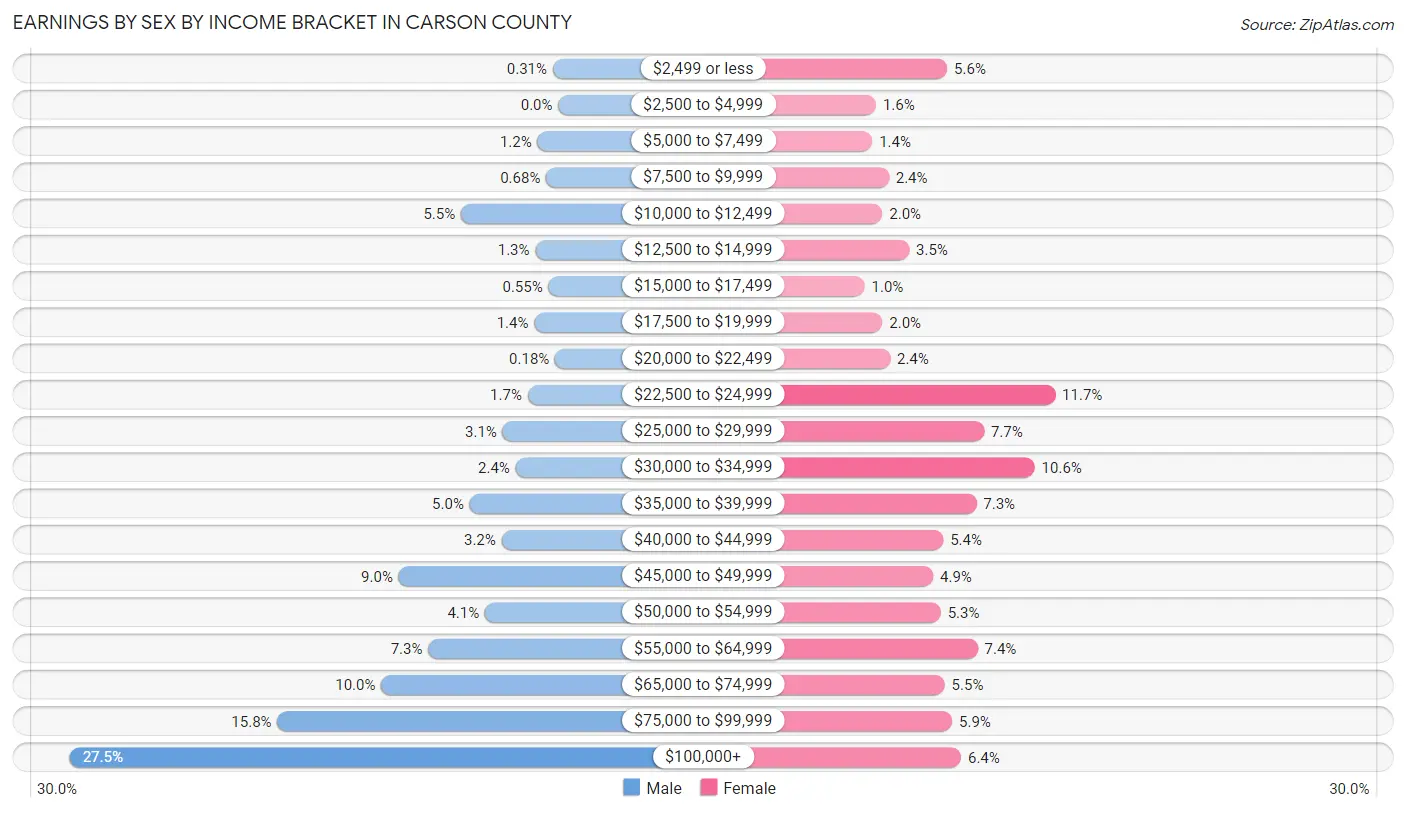
Earnings by Sex by Income Bracket in Carson County
The most common earnings brackets in Carson County are $100,000+ for men (447 | 27.5%) and $22,500 to $24,999 for women (164 | 11.7%).
| Income | Male | Female |
| $2,499 or less | 5 (0.3%) | 79 (5.6%) |
| $2,500 to $4,999 | 0 (0.0%) | 23 (1.6%) |
| $5,000 to $7,499 | 19 (1.2%) | 20 (1.4%) |
| $7,500 to $9,999 | 11 (0.7%) | 33 (2.4%) |
| $10,000 to $12,499 | 89 (5.5%) | 28 (2.0%) |
| $12,500 to $14,999 | 21 (1.3%) | 49 (3.5%) |
| $15,000 to $17,499 | 9 (0.5%) | 14 (1.0%) |
| $17,500 to $19,999 | 22 (1.3%) | 28 (2.0%) |
| $20,000 to $22,499 | 3 (0.2%) | 34 (2.4%) |
| $22,500 to $24,999 | 28 (1.7%) | 164 (11.7%) |
| $25,000 to $29,999 | 51 (3.1%) | 108 (7.7%) |
| $30,000 to $34,999 | 39 (2.4%) | 148 (10.6%) |
| $35,000 to $39,999 | 81 (5.0%) | 102 (7.3%) |
| $40,000 to $44,999 | 52 (3.2%) | 76 (5.4%) |
| $45,000 to $49,999 | 146 (9.0%) | 68 (4.9%) |
| $50,000 to $54,999 | 67 (4.1%) | 74 (5.3%) |
| $55,000 to $64,999 | 119 (7.3%) | 103 (7.3%) |
| $65,000 to $74,999 | 162 (10.0%) | 77 (5.5%) |
| $75,000 to $99,999 | 257 (15.8%) | 83 (5.9%) |
| $100,000+ | 447 (27.5%) | 90 (6.4%) |
| Total | 1,628 (100.0%) | 1,401 (100.0%) |
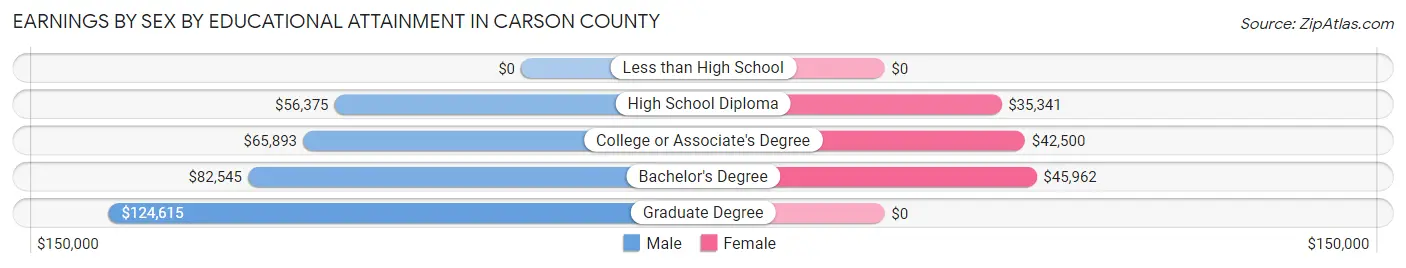
Earnings by Sex by Educational Attainment in Carson County
Average earnings in Carson County are $71,343 for men and $39,254 for women, a difference of 45.0%. Men with an educational attainment of graduate degree enjoy the highest average annual earnings of $124,615, while those with high school diploma education earn the least with $56,375. Women with an educational attainment of bachelor's degree earn the most with the average annual earnings of $45,962, while those with high school diploma education have the smallest earnings of $35,341.
| Educational Attainment | Male Income | Female Income |
| Less than High School | - | - |
| High School Diploma | $56,375 | $35,341 |
| College or Associate's Degree | $65,893 | $42,500 |
| Bachelor's Degree | $82,545 | $45,962 |
| Graduate Degree | $124,615 | $0 |
| Total | $71,343 | $39,254 |
Family Income in Carson County
Family Income Brackets in Carson County
According to the Carson County family income data, there are 408 families falling into the $100,000 to $149,999 income range, which is the most common income bracket and makes up 27.8% of all families. Conversely, the $10,000 to $14,999 income bracket is the least frequent group with only 7 families (0.5%) belonging to this category.
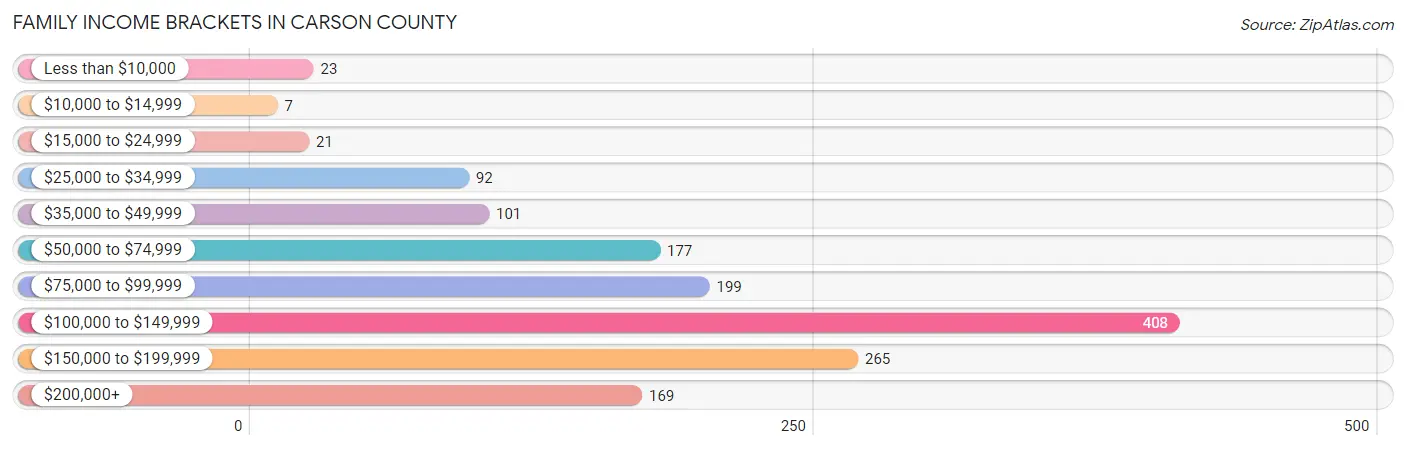
| Income Bracket | # Families | % Families |
| Less than $10,000 | 23 | 1.6% |
| $10,000 to $14,999 | 7 | 0.5% |
| $15,000 to $24,999 | 21 | 1.4% |
| $25,000 to $34,999 | 92 | 6.3% |
| $35,000 to $49,999 | 101 | 6.9% |
| $50,000 to $74,999 | 177 | 12.1% |
| $75,000 to $99,999 | 199 | 13.6% |
| $100,000 to $149,999 | 408 | 27.8% |
| $150,000 to $199,999 | 265 | 18.1% |
| $200,000+ | 169 | 11.5% |
Family Income by Famaliy Size in Carson County
3-person families (311 | 21.2%) account for the highest median family income in Carson County with $142,750 per family, while 3-person families (311 | 21.2%) have the highest median income of $47,583 per family member.
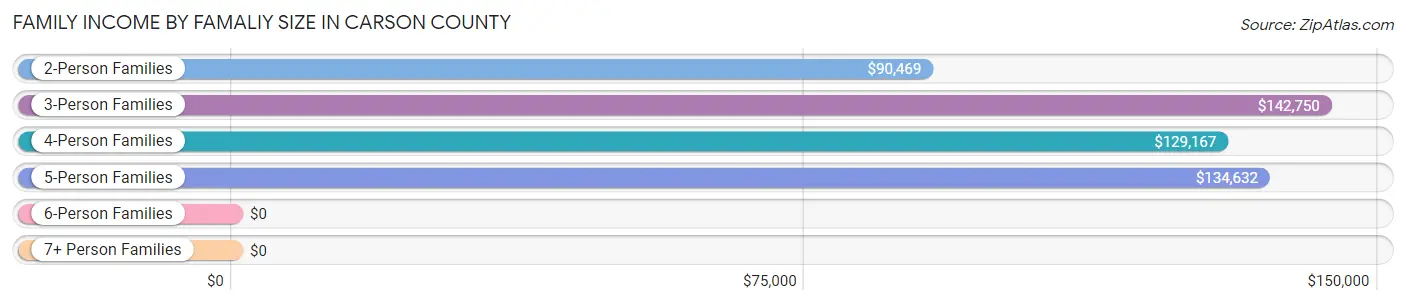
| Income Bracket | # Families | Median Income |
| 2-Person Families | 791 (54.0%) | $90,469 |
| 3-Person Families | 311 (21.2%) | $142,750 |
| 4-Person Families | 190 (13.0%) | $129,167 |
| 5-Person Families | 85 (5.8%) | $134,632 |
| 6-Person Families | 81 (5.5%) | $0 |
| 7+ Person Families | 8 (0.5%) | $0 |
| Total | 1,466 (100.0%) | $107,885 |
Family Income by Number of Earners in Carson County
The median family income in Carson County is $107,885, with families comprising 3+ earners (133) having the highest median family income of $150,444, while families with no earners (225) have the lowest median family income of $49,688, accounting for 9.1% and 15.3% of families, respectively.
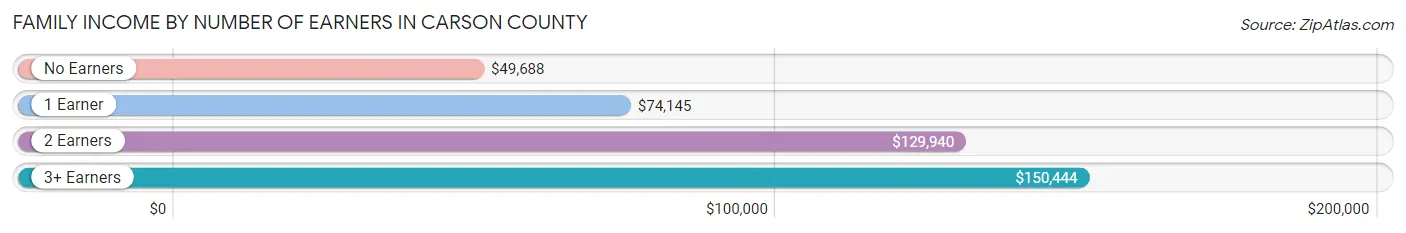
| Number of Earners | # Families | Median Income |
| No Earners | 225 (15.3%) | $49,688 |
| 1 Earner | 389 (26.5%) | $74,145 |
| 2 Earners | 719 (49.0%) | $129,940 |
| 3+ Earners | 133 (9.1%) | $150,444 |
| Total | 1,466 (100.0%) | $107,885 |
Household Income in Carson County
Household Income Brackets in Carson County
With 459 households falling in the category, the $100,000 to $149,999 income range is the most frequent in Carson County, accounting for 20.3% of all households. In contrast, only 11 households (0.5%) fall into the less than $10,000 income bracket, making it the least populous group.
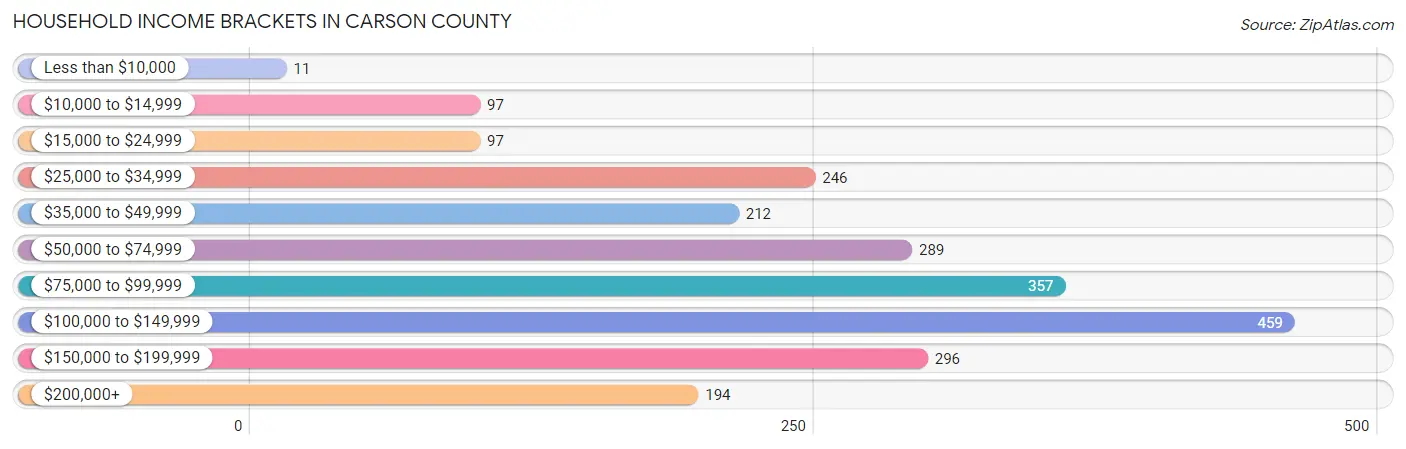
| Income Bracket | # Households | % Households |
| Less than $10,000 | 11 | 0.5% |
| $10,000 to $14,999 | 97 | 4.3% |
| $15,000 to $24,999 | 97 | 4.3% |
| $25,000 to $34,999 | 246 | 10.9% |
| $35,000 to $49,999 | 212 | 9.4% |
| $50,000 to $74,999 | 289 | 12.8% |
| $75,000 to $99,999 | 357 | 15.8% |
| $100,000 to $149,999 | 459 | 20.3% |
| $150,000 to $199,999 | 296 | 13.1% |
| $200,000+ | 194 | 8.6% |
Household Income by Householder Age in Carson County
The median household income in Carson County is $83,199, with the highest median household income of $112,981 found in the 25 to 44 years age bracket for the primary householder. A total of 624 households (27.6%) fall into this category. Meanwhile, the 65+ years age bracket for the primary householder has the lowest median household income of $52,500, with 762 households (33.7%) in this group.
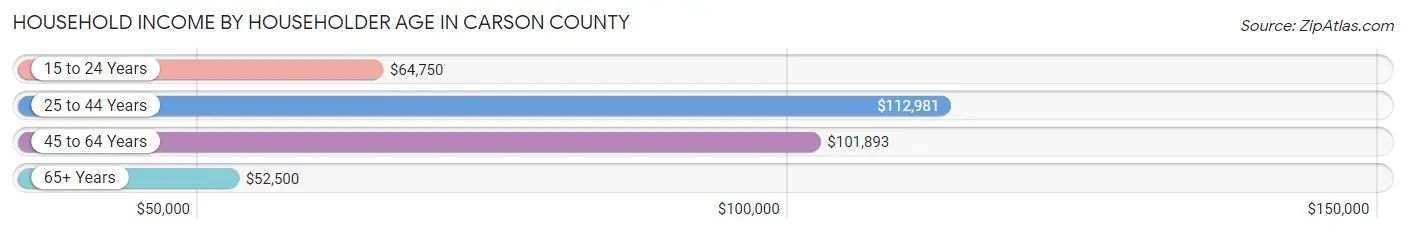
| Income Bracket | # Households | Median Income |
| 15 to 24 Years | 41 (1.8%) | $64,750 |
| 25 to 44 Years | 624 (27.6%) | $112,981 |
| 45 to 64 Years | 833 (36.9%) | $101,893 |
| 65+ Years | 762 (33.7%) | $52,500 |
| Total | 2,260 (100.0%) | $83,199 |
Poverty in Carson County
Income Below Poverty by Sex and Age in Carson County
With 4.7% poverty level for males and 10.2% for females among the residents of Carson County, 6 to 11 year old males and 18 to 24 year old females are the most vulnerable to poverty, with 49 males (22.8%) and 78 females (24.6%) in their respective age groups living below the poverty level.
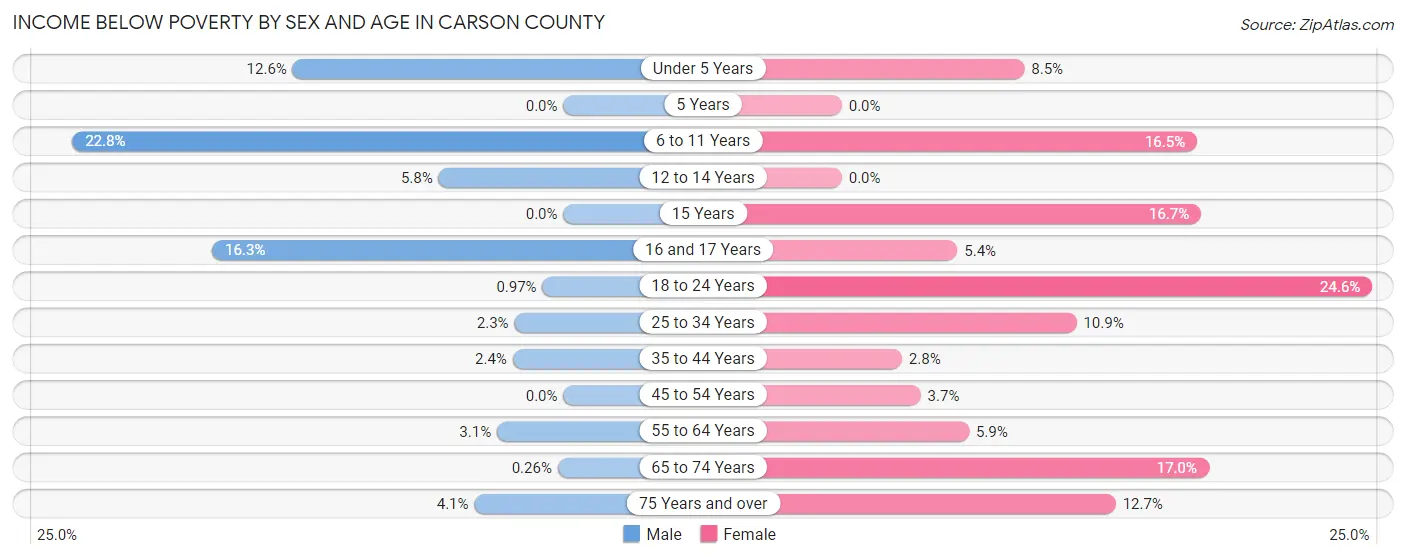
| Age Bracket | Male | Female |
| Under 5 Years | 25 (12.6%) | 15 (8.5%) |
| 5 Years | 0 (0.0%) | 0 (0.0%) |
| 6 to 11 Years | 49 (22.8%) | 29 (16.5%) |
| 12 to 14 Years | 7 (5.8%) | 0 (0.0%) |
| 15 Years | 0 (0.0%) | 6 (16.7%) |
| 16 and 17 Years | 15 (16.3%) | 6 (5.4%) |
| 18 to 24 Years | 2 (1.0%) | 78 (24.6%) |
| 25 to 34 Years | 7 (2.3%) | 28 (10.9%) |
| 35 to 44 Years | 8 (2.4%) | 10 (2.8%) |
| 45 to 54 Years | 0 (0.0%) | 12 (3.7%) |
| 55 to 64 Years | 12 (3.1%) | 21 (5.9%) |
| 65 to 74 Years | 1 (0.3%) | 55 (17.0%) |
| 75 Years and over | 9 (4.1%) | 37 (12.7%) |
| Total | 135 (4.7%) | 297 (10.2%) |
Income Above Poverty by Sex and Age in Carson County
According to the poverty statistics in Carson County, males aged 5 years and females aged 5 years are the age groups that are most secure financially, with 100.0% of males and 100.0% of females in these age groups living above the poverty line.
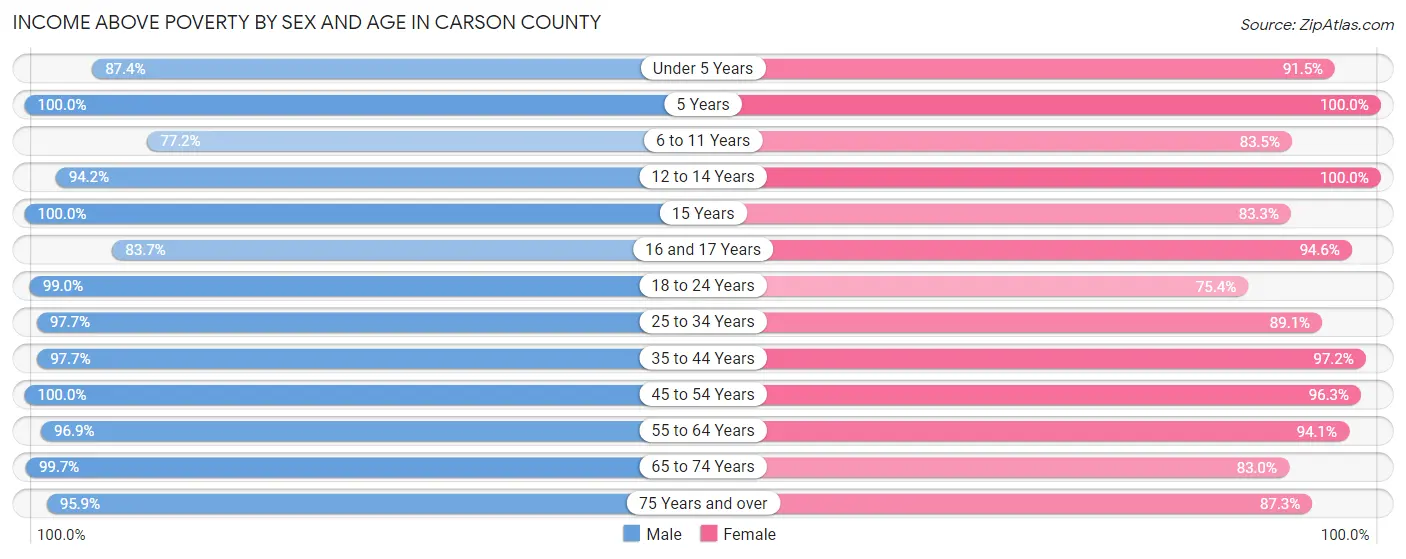
| Age Bracket | Male | Female |
| Under 5 Years | 174 (87.4%) | 162 (91.5%) |
| 5 Years | 16 (100.0%) | 37 (100.0%) |
| 6 to 11 Years | 166 (77.2%) | 147 (83.5%) |
| 12 to 14 Years | 114 (94.2%) | 142 (100.0%) |
| 15 Years | 48 (100.0%) | 30 (83.3%) |
| 16 and 17 Years | 77 (83.7%) | 106 (94.6%) |
| 18 to 24 Years | 205 (99.0%) | 239 (75.4%) |
| 25 to 34 Years | 301 (97.7%) | 229 (89.1%) |
| 35 to 44 Years | 332 (97.7%) | 348 (97.2%) |
| 45 to 54 Years | 312 (100.0%) | 316 (96.3%) |
| 55 to 64 Years | 378 (96.9%) | 335 (94.1%) |
| 65 to 74 Years | 381 (99.7%) | 268 (83.0%) |
| 75 Years and over | 209 (95.9%) | 254 (87.3%) |
| Total | 2,713 (95.3%) | 2,613 (89.8%) |
Income Below Poverty Among Married-Couple Families in Carson County
The poverty statistics for married-couple families in Carson County show that 0.7% or 9 of the total 1,216 families live below the poverty line. Families with 5 or more children have the highest poverty rate of 100.0%, comprising of 8 families. On the other hand, families with 1 or 2 children have the lowest poverty rate of 0.0%, which includes 0 families.
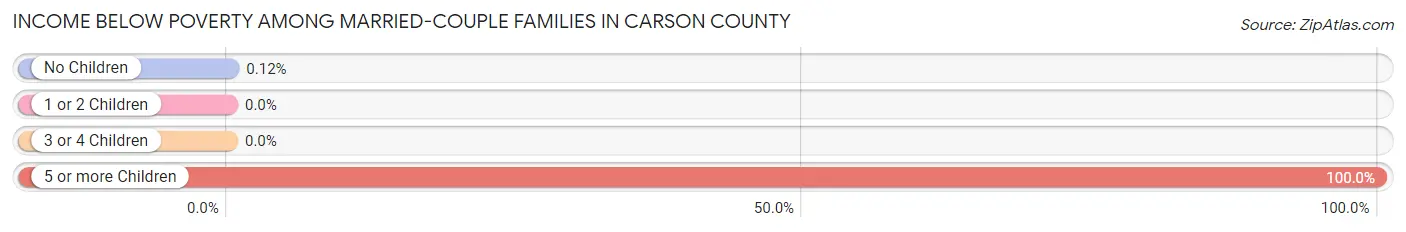
| Children | Above Poverty | Below Poverty |
| No Children | 832 (99.9%) | 1 (0.1%) |
| 1 or 2 Children | 259 (100.0%) | 0 (0.0%) |
| 3 or 4 Children | 116 (100.0%) | 0 (0.0%) |
| 5 or more Children | 0 (0.0%) | 8 (100.0%) |
| Total | 1,207 (99.3%) | 9 (0.7%) |
Income Below Poverty Among Single-Parent Households in Carson County
According to the poverty data in Carson County, 3.6% or 2 single-father households and 14.4% or 28 single-mother households are living below the poverty line. Among single-father households, those with 1 or 2 children have the highest poverty rate, with 2 households (4.2%) experiencing poverty. Likewise, among single-mother households, those with 5 or more children have the highest poverty rate, with 28 households (100.0%) falling below the poverty line.
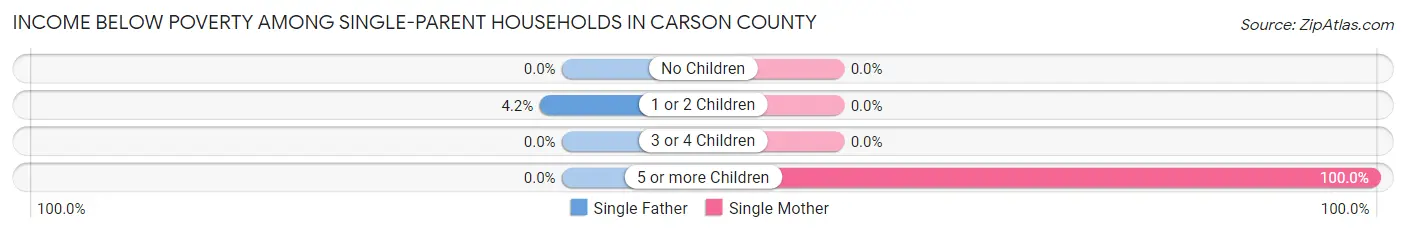
| Children | Single Father | Single Mother |
| No Children | 0 (0.0%) | 0 (0.0%) |
| 1 or 2 Children | 2 (4.2%) | 0 (0.0%) |
| 3 or 4 Children | 0 (0.0%) | 0 (0.0%) |
| 5 or more Children | 0 (0.0%) | 28 (100.0%) |
| Total | 2 (3.6%) | 28 (14.4%) |
Income Below Poverty Among Married-Couple vs Single-Parent Households in Carson County
The poverty data for Carson County shows that 9 of the married-couple family households (0.7%) and 30 of the single-parent households (12.0%) are living below the poverty level. Within the married-couple family households, those with 5 or more children have the highest poverty rate, with 8 households (100.0%) falling below the poverty line. Among the single-parent households, those with 5 or more children have the highest poverty rate, with 28 household (100.0%) living below poverty.
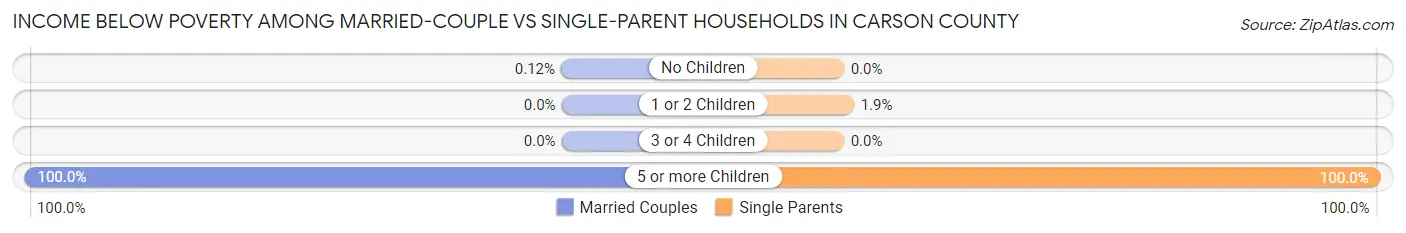
| Children | Married-Couple Families | Single-Parent Households |
| No Children | 1 (0.1%) | 0 (0.0%) |
| 1 or 2 Children | 0 (0.0%) | 2 (1.9%) |
| 3 or 4 Children | 0 (0.0%) | 0 (0.0%) |
| 5 or more Children | 8 (100.0%) | 28 (100.0%) |
| Total | 9 (0.7%) | 30 (12.0%) |
Race in Carson County
The most populous races in Carson County are White / Caucasian (5,284 | 91.1%), Hispanic or Latino (617 | 10.6%), and Native / Alaskan (148 | 2.5%).
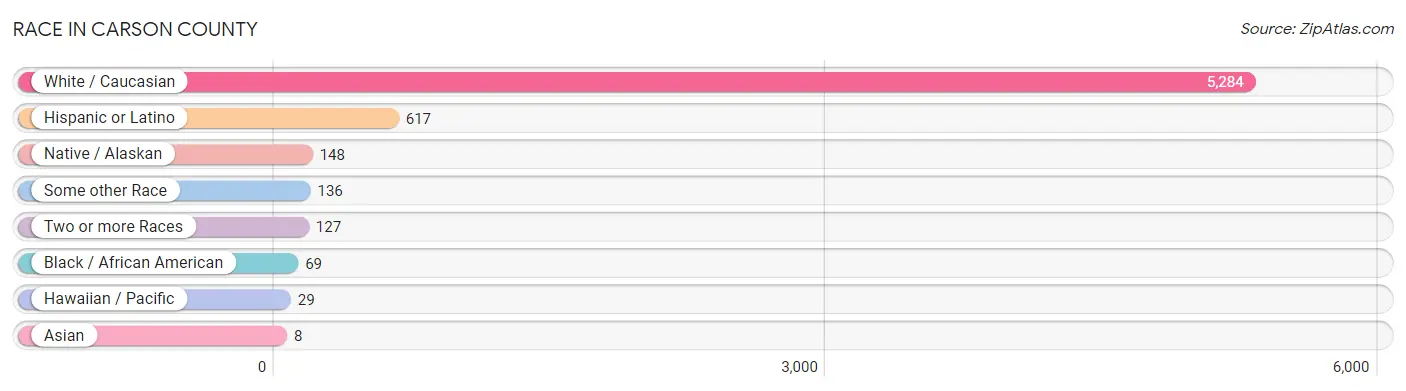
| Race | # Population | % Population |
| Asian | 8 | 0.1% |
| Black / African American | 69 | 1.2% |
| Hawaiian / Pacific | 29 | 0.5% |
| Hispanic or Latino | 617 | 10.6% |
| Native / Alaskan | 148 | 2.5% |
| White / Caucasian | 5,284 | 91.1% |
| Two or more Races | 127 | 2.2% |
| Some other Race | 136 | 2.3% |
| Total | 5,801 | 100.0% |
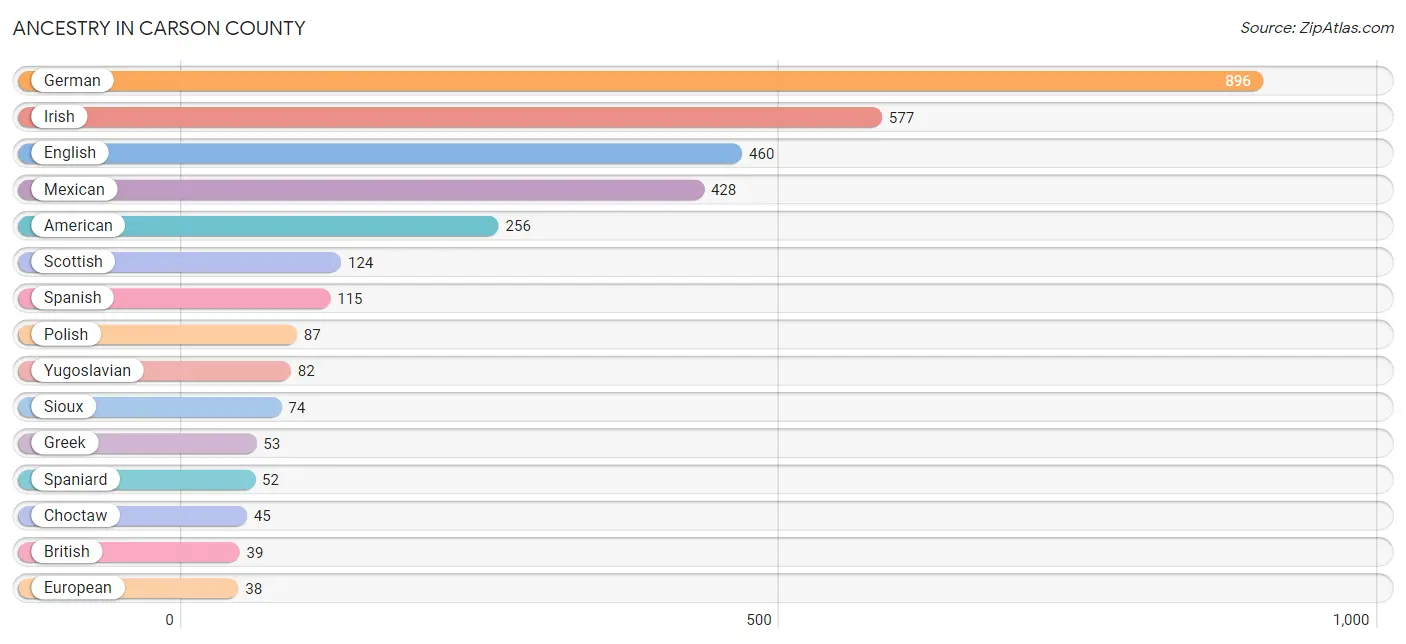
Ancestry in Carson County
The most populous ancestries reported in Carson County are German (896 | 15.4%), Irish (577 | 10.0%), English (460 | 7.9%), Mexican (428 | 7.4%), and American (256 | 4.4%), together accounting for 45.1% of all Carson County residents.
| Ancestry | # Population | % Population |
| American | 256 | 4.4% |
| Belgian | 1 | 0.0% |
| British | 39 | 0.7% |
| Central American | 1 | 0.0% |
| Cherokee | 2 | 0.0% |
| Chickasaw | 18 | 0.3% |
| Choctaw | 45 | 0.8% |
| Colombian | 3 | 0.1% |
| Comanche | 2 | 0.0% |
| Creek | 1 | 0.0% |
| Cuban | 14 | 0.2% |
| Czech | 6 | 0.1% |
| Czechoslovakian | 17 | 0.3% |
| Danish | 23 | 0.4% |
| Dutch West Indian | 9 | 0.2% |
| English | 460 | 7.9% |
| European | 38 | 0.7% |
| French | 21 | 0.4% |
| German | 896 | 15.4% |
| Greek | 53 | 0.9% |
| Guatemalan | 1 | 0.0% |
| Irish | 577 | 10.0% |
| Italian | 15 | 0.3% |
| Korean | 6 | 0.1% |
| Latvian | 1 | 0.0% |
| Mexican | 428 | 7.4% |
| Native Hawaiian | 29 | 0.5% |
| Navajo | 2 | 0.0% |
| Norwegian | 20 | 0.3% |
| Pakistani | 2 | 0.0% |
| Polish | 87 | 1.5% |
| Russian | 10 | 0.2% |
| Samoan | 20 | 0.3% |
| Scandinavian | 13 | 0.2% |
| Scotch-Irish | 25 | 0.4% |
| Scottish | 124 | 2.1% |
| Sioux | 74 | 1.3% |
| South American | 3 | 0.1% |
| Spaniard | 52 | 0.9% |
| Spanish | 115 | 2.0% |
| Swedish | 33 | 0.6% |
| Swiss | 14 | 0.2% |
| Welsh | 38 | 0.7% |
| Yugoslavian | 82 | 1.4% | View All 44 Rows |
Immigrants in Carson County
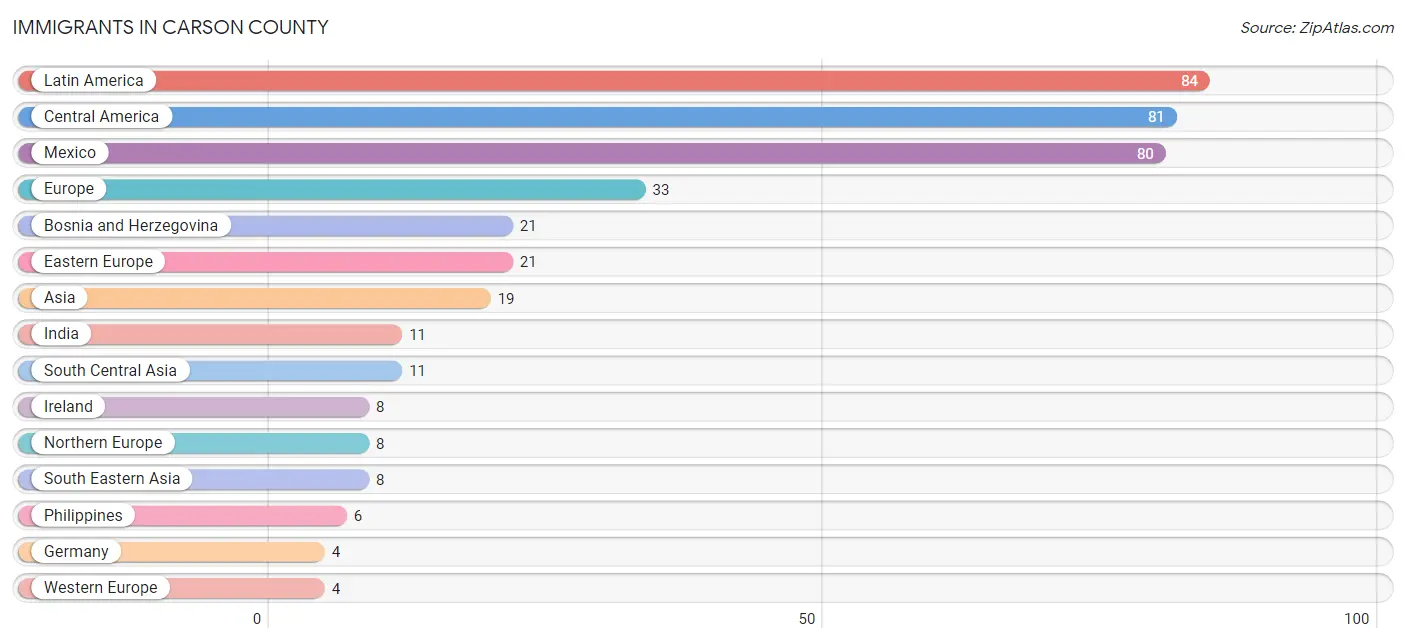
The most numerous immigrant groups reported in Carson County came from Latin America (84 | 1.5%), Central America (81 | 1.4%), Mexico (80 | 1.4%), Europe (33 | 0.6%), and Bosnia and Herzegovina (21 | 0.4%), together accounting for 5.2% of all Carson County residents.
| Immigration Origin | # Population | % Population |
| Asia | 19 | 0.3% |
| Bosnia and Herzegovina | 21 | 0.4% |
| Central America | 81 | 1.4% |
| Colombia | 3 | 0.1% |
| Eastern Europe | 21 | 0.4% |
| Europe | 33 | 0.6% |
| Germany | 4 | 0.1% |
| Guatemala | 1 | 0.0% |
| India | 11 | 0.2% |
| Ireland | 8 | 0.1% |
| Latin America | 84 | 1.5% |
| Mexico | 80 | 1.4% |
| Northern Europe | 8 | 0.1% |
| Philippines | 6 | 0.1% |
| South America | 3 | 0.1% |
| South Central Asia | 11 | 0.2% |
| South Eastern Asia | 8 | 0.1% |
| Thailand | 2 | 0.0% |
| Western Europe | 4 | 0.1% | View All 19 Rows |
Sex and Age in Carson County
Sex and Age in Carson County
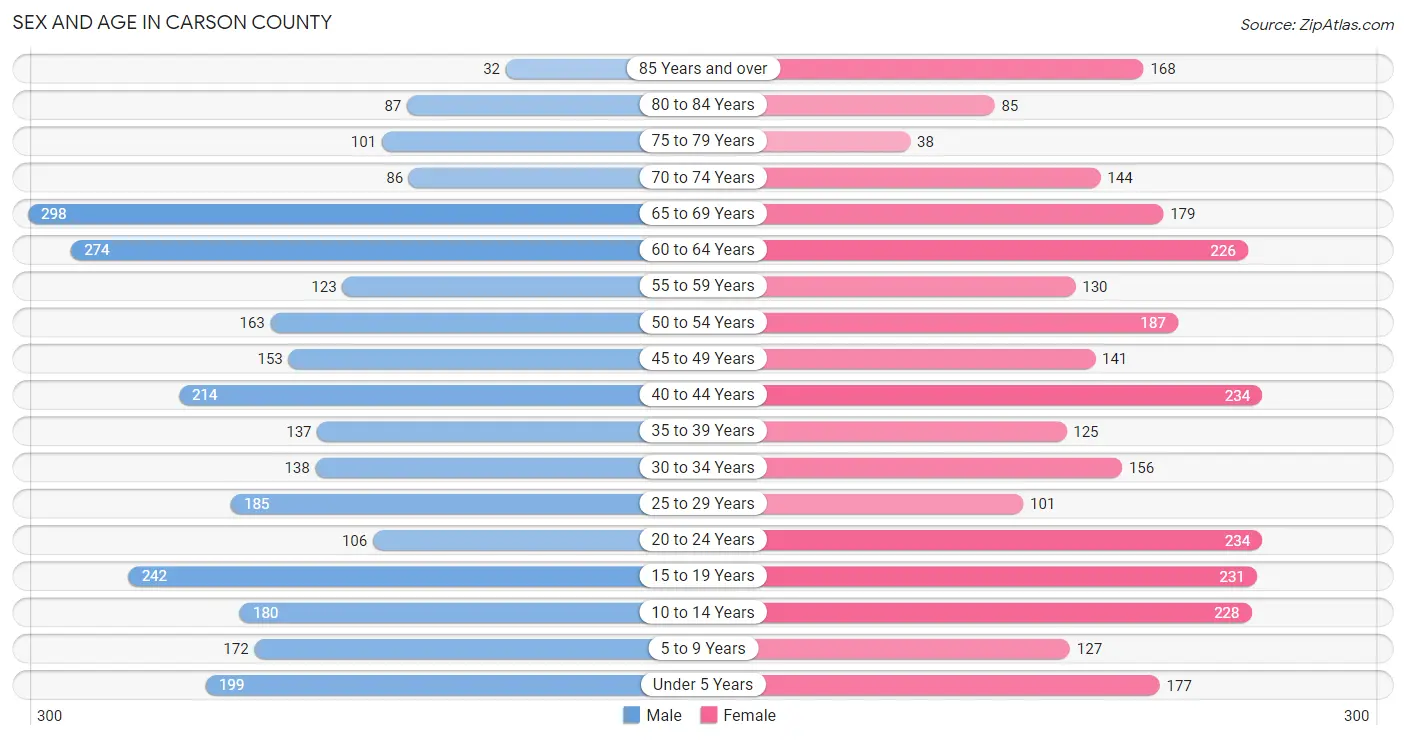
The most populous age groups in Carson County are 65 to 69 Years (298 | 10.3%) for men and 20 to 24 Years (234 | 8.0%) for women.
| Age Bracket | Male | Female |
| Under 5 Years | 199 (6.9%) | 177 (6.1%) |
| 5 to 9 Years | 172 (5.9%) | 127 (4.4%) |
| 10 to 14 Years | 180 (6.2%) | 228 (7.8%) |
| 15 to 19 Years | 242 (8.4%) | 231 (7.9%) |
| 20 to 24 Years | 106 (3.7%) | 234 (8.0%) |
| 25 to 29 Years | 185 (6.4%) | 101 (3.5%) |
| 30 to 34 Years | 138 (4.8%) | 156 (5.4%) |
| 35 to 39 Years | 137 (4.7%) | 125 (4.3%) |
| 40 to 44 Years | 214 (7.4%) | 234 (8.0%) |
| 45 to 49 Years | 153 (5.3%) | 141 (4.8%) |
| 50 to 54 Years | 163 (5.6%) | 187 (6.4%) |
| 55 to 59 Years | 123 (4.3%) | 130 (4.5%) |
| 60 to 64 Years | 274 (9.5%) | 226 (7.8%) |
| 65 to 69 Years | 298 (10.3%) | 179 (6.1%) |
| 70 to 74 Years | 86 (3.0%) | 144 (5.0%) |
| 75 to 79 Years | 101 (3.5%) | 38 (1.3%) |
| 80 to 84 Years | 87 (3.0%) | 85 (2.9%) |
| 85 Years and over | 32 (1.1%) | 168 (5.8%) |
| Total | 2,890 (100.0%) | 2,911 (100.0%) |
Families and Households in Carson County
Median Family Size in Carson County
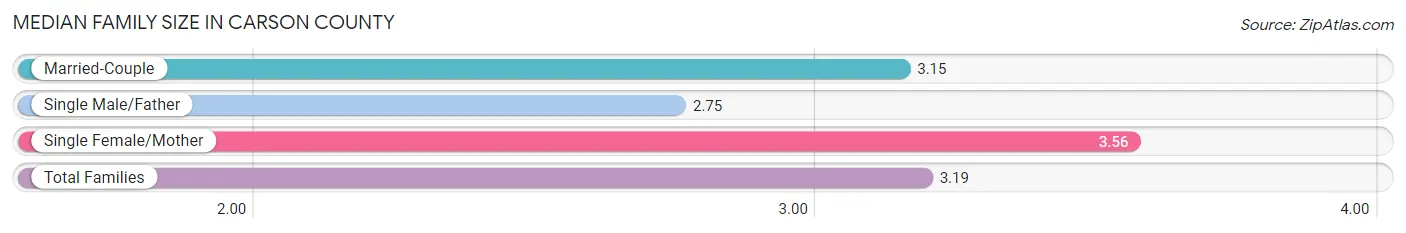
The median family size in Carson County is 3.19 persons per family, with single female/mother families (195 | 13.3%) accounting for the largest median family size of 3.56 persons per family. On the other hand, single male/father families (55 | 3.7%) represent the smallest median family size with 2.75 persons per family.
| Family Type | # Families | Family Size |
| Married-Couple | 1,216 (83.0%) | 3.15 |
| Single Male/Father | 55 (3.7%) | 2.75 |
| Single Female/Mother | 195 (13.3%) | 3.56 |
| Total Families | 1,466 (100.0%) | 3.19 |
Median Household Size in Carson County
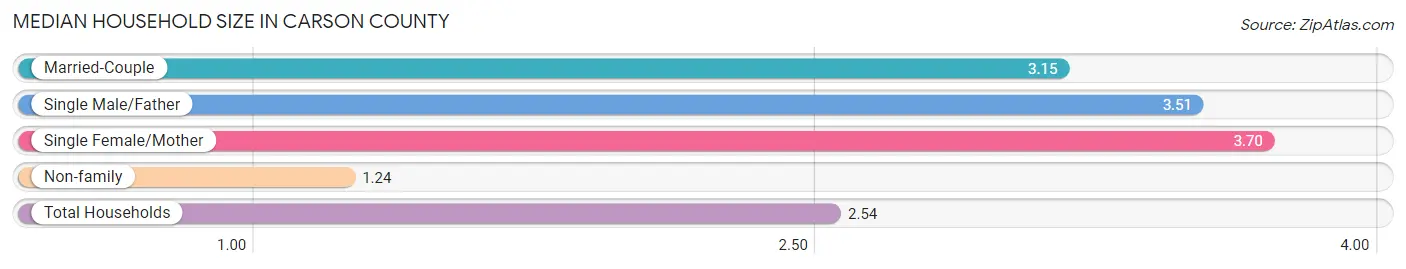
The median household size in Carson County is 2.54 persons per household, with single female/mother households (195 | 8.6%) accounting for the largest median household size of 3.7 persons per household. non-family households (794 | 35.1%) represent the smallest median household size with 1.24 persons per household.
| Household Type | # Households | Household Size |
| Married-Couple | 1,216 (53.8%) | 3.15 |
| Single Male/Father | 55 (2.4%) | 3.51 |
| Single Female/Mother | 195 (8.6%) | 3.70 |
| Non-family | 794 (35.1%) | 1.24 |
| Total Households | 2,260 (100.0%) | 2.54 |
Household Size by Marriage Status in Carson County
Out of a total of 2,260 households in Carson County, 1,466 (64.9%) are family households, while 794 (35.1%) are nonfamily households. The most numerous type of family households are 2-person households, comprising 784, and the most common type of nonfamily households are 1-person households, comprising 706.
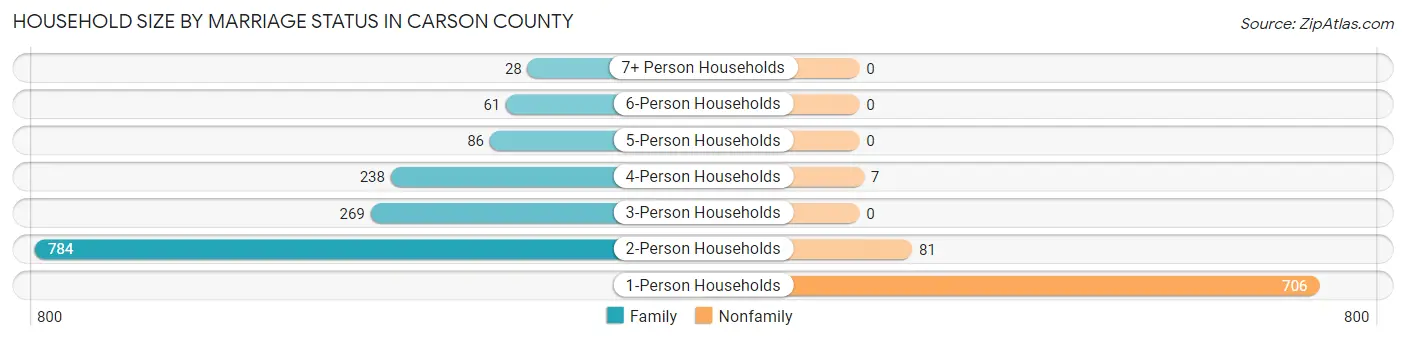
| Household Size | Family Households | Nonfamily Households |
| 1-Person Households | - | 706 (31.2%) |
| 2-Person Households | 784 (34.7%) | 81 (3.6%) |
| 3-Person Households | 269 (11.9%) | 0 (0.0%) |
| 4-Person Households | 238 (10.5%) | 7 (0.3%) |
| 5-Person Households | 86 (3.8%) | 0 (0.0%) |
| 6-Person Households | 61 (2.7%) | 0 (0.0%) |
| 7+ Person Households | 28 (1.2%) | 0 (0.0%) |
| Total | 1,466 (64.9%) | 794 (35.1%) |
Female Fertility in Carson County
Fertility by Age in Carson County
Average fertility rate in Carson County is 42.0 births per 1,000 women. Women in the age bracket of 20 to 34 years have the highest fertility rate with 96.0 births per 1,000 women. Women in the age bracket of 20 to 34 years acount for 90.4% of all women with births.
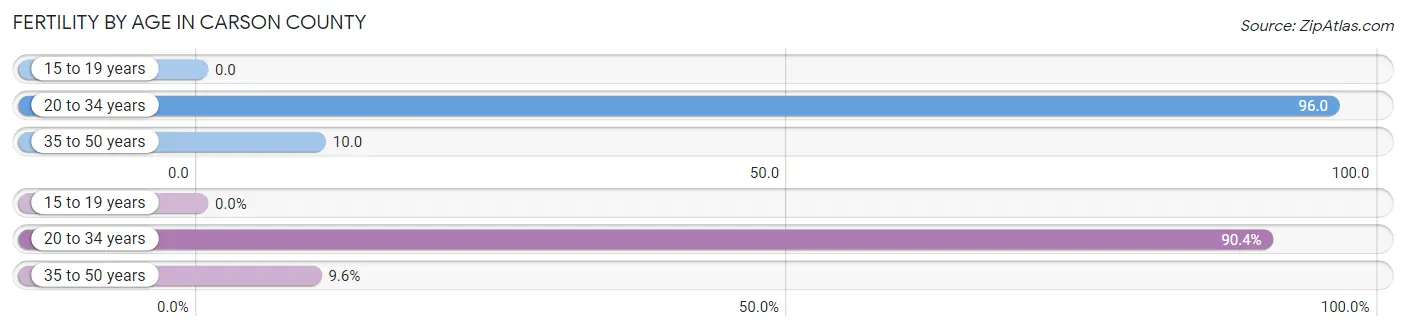
| Age Bracket | Women with Births | Births / 1,000 Women |
| 15 to 19 years | 0 (0.0%) | 0.0 |
| 20 to 34 years | 47 (90.4%) | 96.0 |
| 35 to 50 years | 5 (9.6%) | 10.0 |
| Total | 52 (100.0%) | 42.0 |
Fertility by Age by Marriage Status in Carson County
88.5% of women with births (52) in Carson County are married. The highest percentage of unmarried women with births falls into 20 to 34 years age bracket with 12.8% of them unmarried at the time of birth, while the lowest percentage of unmarried women with births belong to 35 to 50 years age bracket with 0.0% of them unmarried.
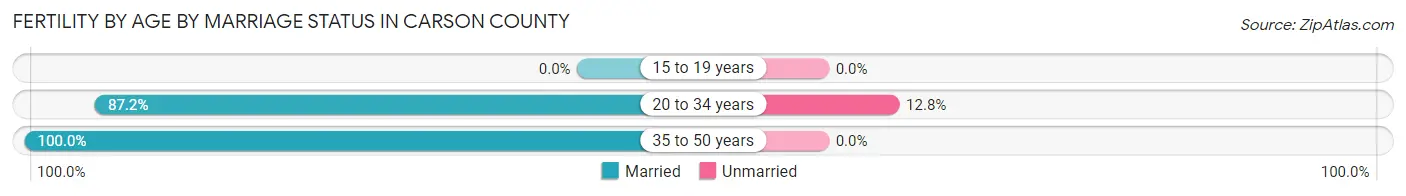
| Age Bracket | Married | Unmarried |
| 15 to 19 years | 0 (0.0%) | 0 (0.0%) |
| 20 to 34 years | 41 (87.2%) | 6 (12.8%) |
| 35 to 50 years | 5 (100.0%) | 0 (0.0%) |
| Total | 46 (88.5%) | 6 (11.5%) |
Fertility by Education in Carson County
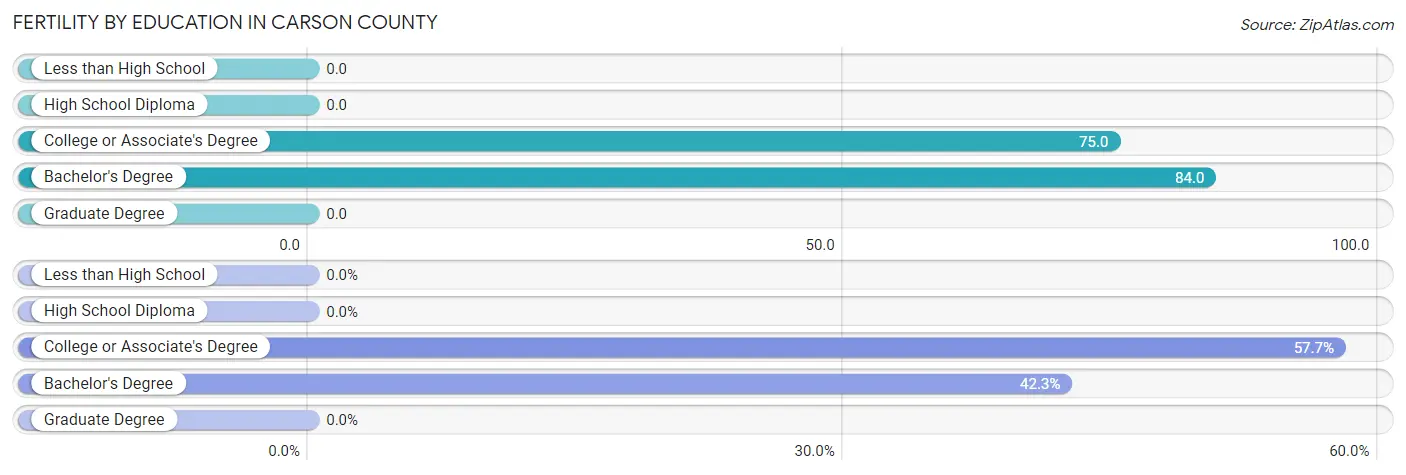
| Educational Attainment | Women with Births | Births / 1,000 Women |
| Less than High School | 0 (0.0%) | 0.0 |
| High School Diploma | 0 (0.0%) | 0.0 |
| College or Associate's Degree | 30 (57.7%) | 75.0 |
| Bachelor's Degree | 22 (42.3%) | 84.0 |
| Graduate Degree | 0 (0.0%) | 0.0 |
| Total | 52 (100.0%) | 42.0 |
Fertility by Education by Marriage Status in Carson County
11.5% of women with births in Carson County are unmarried. Women with the educational attainment of college or associate's degree are most likely to be married with 100.0% of them married at childbirth, while women with the educational attainment of bachelor's degree are least likely to be married with 27.3% of them unmarried at childbirth.
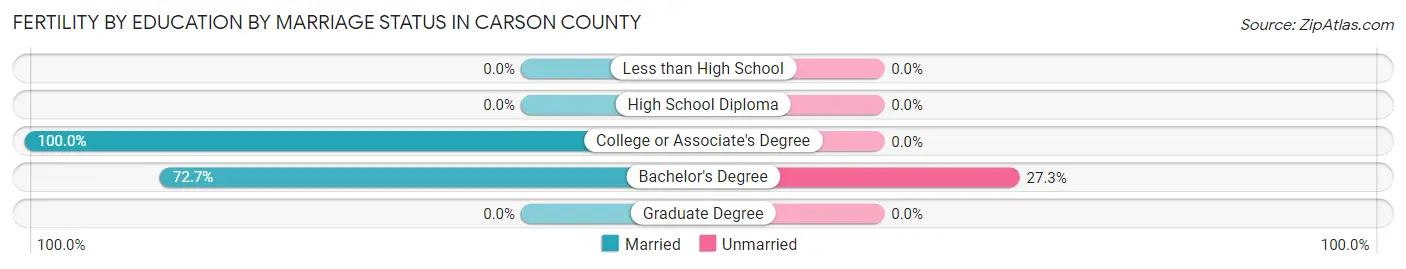
| Educational Attainment | Married | Unmarried |
| Less than High School | 0 (0.0%) | 0 (0.0%) |
| High School Diploma | 0 (0.0%) | 0 (0.0%) |
| College or Associate's Degree | 30 (100.0%) | 0 (0.0%) |
| Bachelor's Degree | 16 (72.7%) | 6 (27.3%) |
| Graduate Degree | 0 (0.0%) | 0 (0.0%) |
| Total | 46 (88.5%) | 6 (11.5%) |
Employment Characteristics in Carson County
Employment by Class of Employer in Carson County
Among the 2,820 employed individuals in Carson County, private company employees (1,655 | 58.7%), local government employees (315 | 11.2%), and state government employees (293 | 10.4%) make up the most common classes of employment.
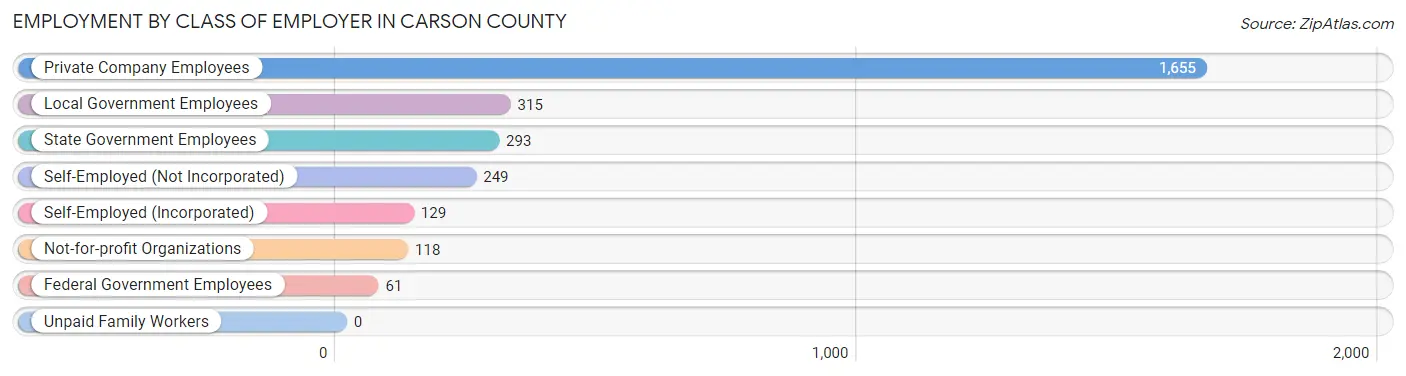
| Employer Class | # Employees | % Employees |
| Private Company Employees | 1,655 | 58.7% |
| Self-Employed (Incorporated) | 129 | 4.6% |
| Self-Employed (Not Incorporated) | 249 | 8.8% |
| Not-for-profit Organizations | 118 | 4.2% |
| Local Government Employees | 315 | 11.2% |
| State Government Employees | 293 | 10.4% |
| Federal Government Employees | 61 | 2.2% |
| Unpaid Family Workers | 0 | 0.0% |
| Total | 2,820 | 100.0% |
Employment Status by Age in Carson County
According to the labor force statistics for Carson County, out of the total population over 16 years of age (4,634), 62.3% or 2,887 individuals are in the labor force, with 1.9% or 55 of them unemployed. The age group with the highest labor force participation rate is 25 to 29 years, with 87.4% or 250 individuals in the labor force. Within the labor force, the 16 to 19 years age range has the highest percentage of unemployed individuals, with 18.4% or 19 of them being unemployed.
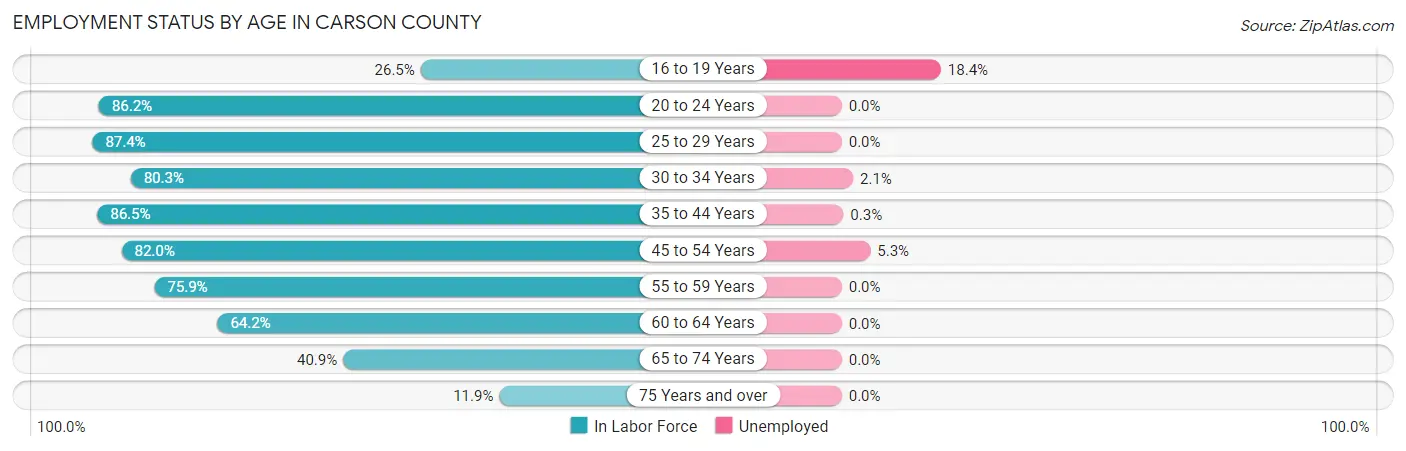
| Age Bracket | In Labor Force | Unemployed |
| 16 to 19 Years | 103 (26.5%) | 19 (18.4%) |
| 20 to 24 Years | 293 (86.2%) | 0 (0.0%) |
| 25 to 29 Years | 250 (87.4%) | 0 (0.0%) |
| 30 to 34 Years | 236 (80.3%) | 5 (2.1%) |
| 35 to 44 Years | 614 (86.5%) | 2 (0.3%) |
| 45 to 54 Years | 528 (82.0%) | 28 (5.3%) |
| 55 to 59 Years | 192 (75.9%) | 0 (0.0%) |
| 60 to 64 Years | 321 (64.2%) | 0 (0.0%) |
| 65 to 74 Years | 289 (40.9%) | 0 (0.0%) |
| 75 Years and over | 61 (11.9%) | 0 (0.0%) |
| Total | 2,887 (62.3%) | 55 (1.9%) |
Employment Status by Educational Attainment in Carson County
According to labor force statistics for Carson County, 79.7% of individuals (2,142) out of the total population between 25 and 64 years of age (2,687) are in the labor force, with 1.6% or 34 of them being unemployed. The group with the highest labor force participation rate are those with the educational attainment of bachelor's degree or higher, with 88.9% or 609 individuals in the labor force. Within the labor force, individuals with less than high school education have the highest percentage of unemployment, with 20.5% or 16 of them being unemployed.
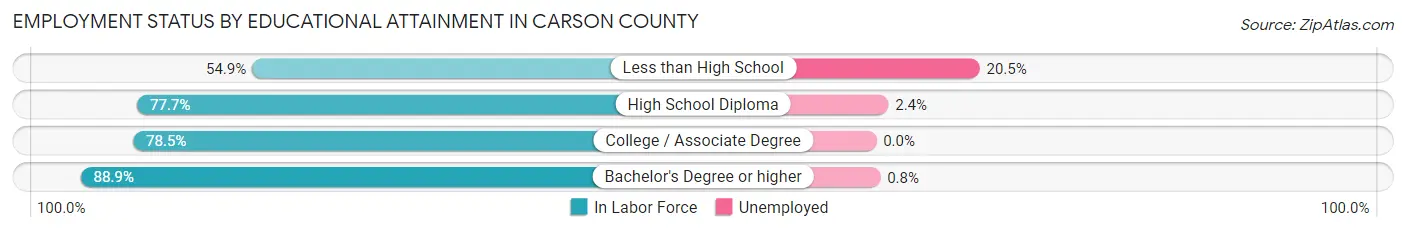
| Educational Attainment | In Labor Force | Unemployed |
| Less than High School | 78 (54.9%) | 29 (20.5%) |
| High School Diploma | 578 (77.7%) | 18 (2.4%) |
| College / Associate Degree | 876 (78.5%) | 0 (0.0%) |
| Bachelor's Degree or higher | 609 (88.9%) | 5 (0.8%) |
| Total | 2,142 (79.7%) | 43 (1.6%) |
Employment Occupations by Sex in Carson County
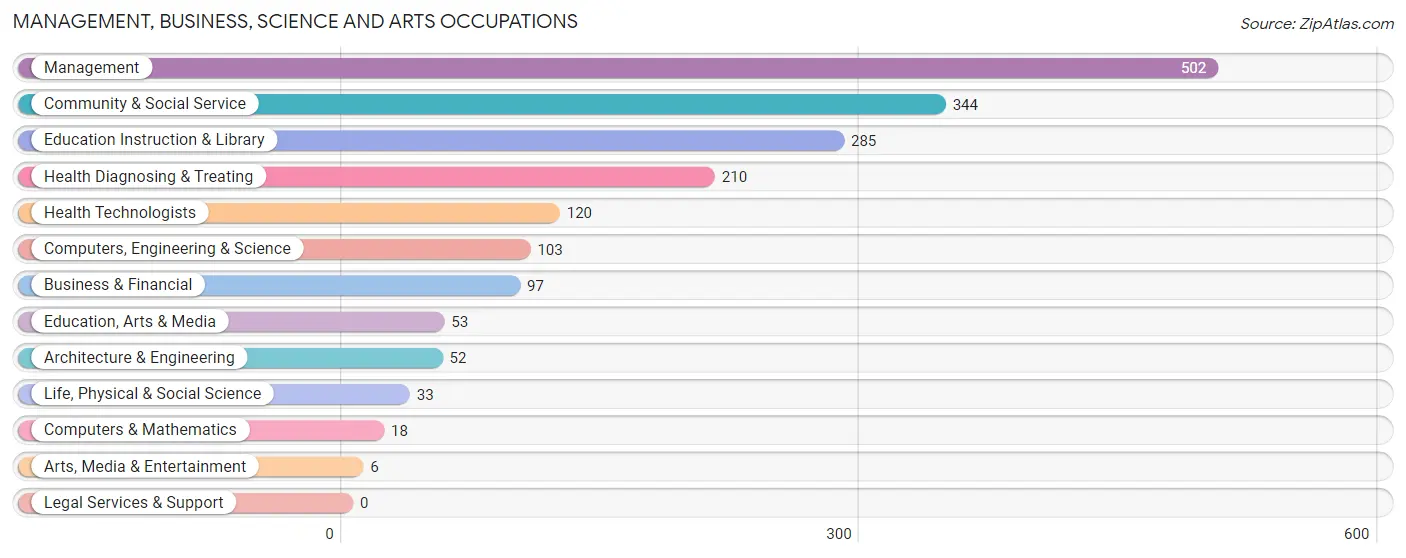
Management, Business, Science and Arts Occupations
The most common Management, Business, Science and Arts occupations in Carson County are Management (502 | 17.7%), Community & Social Service (344 | 12.1%), Education Instruction & Library (285 | 10.1%), Health Diagnosing & Treating (210 | 7.4%), and Health Technologists (120 | 4.2%).
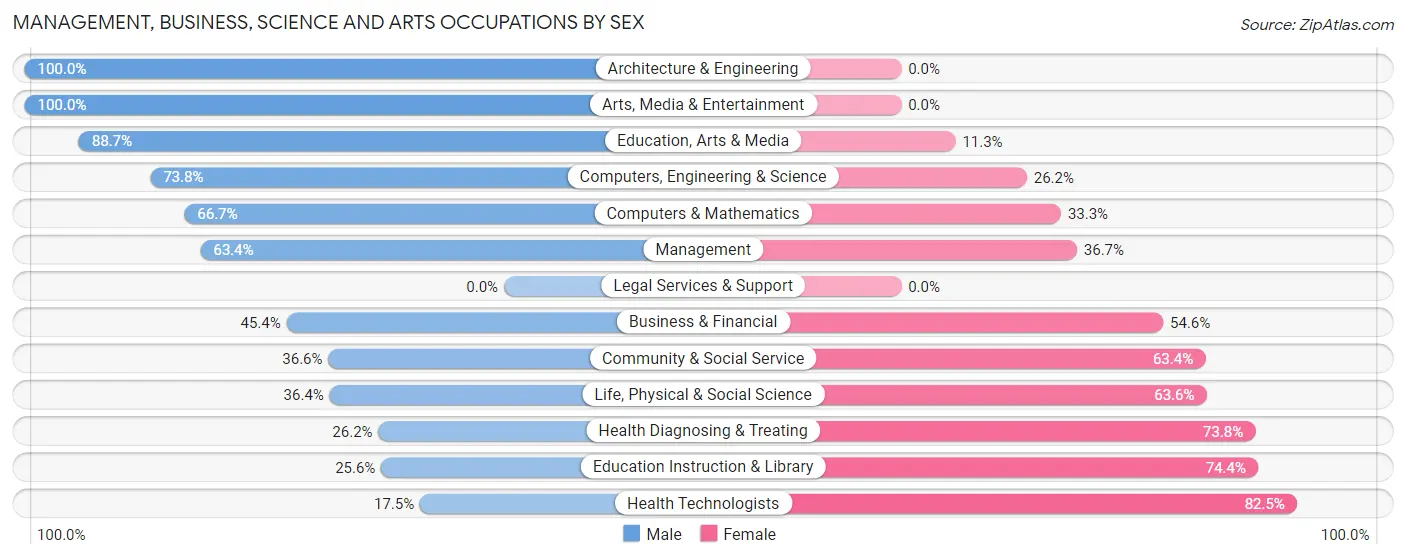
Management, Business, Science and Arts Occupations by Sex
Within the Management, Business, Science and Arts occupations in Carson County, the most male-oriented occupations are Architecture & Engineering (100.0%), Arts, Media & Entertainment (100.0%), and Education, Arts & Media (88.7%), while the most female-oriented occupations are Health Technologists (82.5%), Education Instruction & Library (74.4%), and Health Diagnosing & Treating (73.8%).
| Occupation | Male | Female |
| Management | 318 (63.3%) | 184 (36.6%) |
| Business & Financial | 44 (45.4%) | 53 (54.6%) |
| Computers, Engineering & Science | 76 (73.8%) | 27 (26.2%) |
| Computers & Mathematics | 12 (66.7%) | 6 (33.3%) |
| Architecture & Engineering | 52 (100.0%) | 0 (0.0%) |
| Life, Physical & Social Science | 12 (36.4%) | 21 (63.6%) |
| Community & Social Service | 126 (36.6%) | 218 (63.4%) |
| Education, Arts & Media | 47 (88.7%) | 6 (11.3%) |
| Legal Services & Support | 0 (0.0%) | 0 (0.0%) |
| Education Instruction & Library | 73 (25.6%) | 212 (74.4%) |
| Arts, Media & Entertainment | 6 (100.0%) | 0 (0.0%) |
| Health Diagnosing & Treating | 55 (26.2%) | 155 (73.8%) |
| Health Technologists | 21 (17.5%) | 99 (82.5%) |
| Total (Category) | 619 (49.3%) | 637 (50.7%) |
| Total (Overall) | 1,532 (54.1%) | 1,301 (45.9%) |
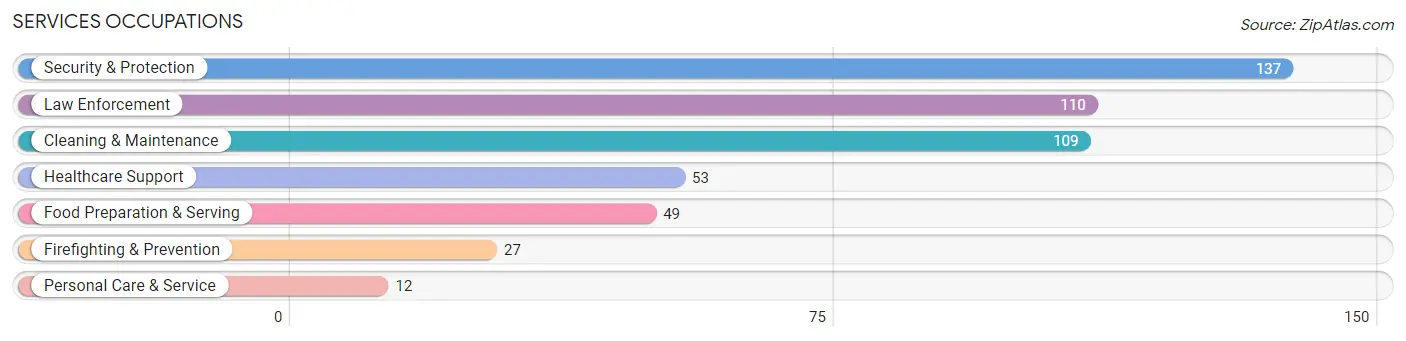
Services Occupations
The most common Services occupations in Carson County are Security & Protection (137 | 4.8%), Law Enforcement (110 | 3.9%), Cleaning & Maintenance (109 | 3.8%), Healthcare Support (53 | 1.9%), and Food Preparation & Serving (49 | 1.7%).
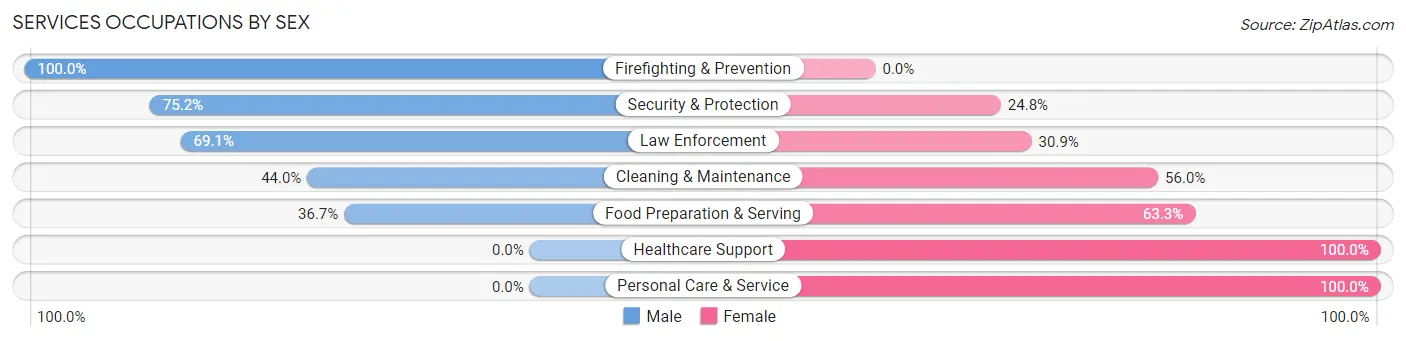
Services Occupations by Sex
Within the Services occupations in Carson County, the most male-oriented occupations are Firefighting & Prevention (100.0%), Security & Protection (75.2%), and Law Enforcement (69.1%), while the most female-oriented occupations are Healthcare Support (100.0%), Personal Care & Service (100.0%), and Food Preparation & Serving (63.3%).
| Occupation | Male | Female |
| Healthcare Support | 0 (0.0%) | 53 (100.0%) |
| Security & Protection | 103 (75.2%) | 34 (24.8%) |
| Firefighting & Prevention | 27 (100.0%) | 0 (0.0%) |
| Law Enforcement | 76 (69.1%) | 34 (30.9%) |
| Food Preparation & Serving | 18 (36.7%) | 31 (63.3%) |
| Cleaning & Maintenance | 48 (44.0%) | 61 (56.0%) |
| Personal Care & Service | 0 (0.0%) | 12 (100.0%) |
| Total (Category) | 169 (46.9%) | 191 (53.1%) |
| Total (Overall) | 1,532 (54.1%) | 1,301 (45.9%) |
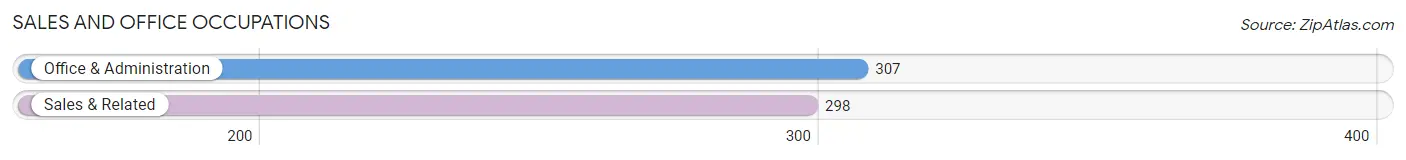
Sales and Office Occupations
The most common Sales and Office occupations in Carson County are Office & Administration (307 | 10.8%), and Sales & Related (298 | 10.5%).
Sales and Office Occupations by Sex
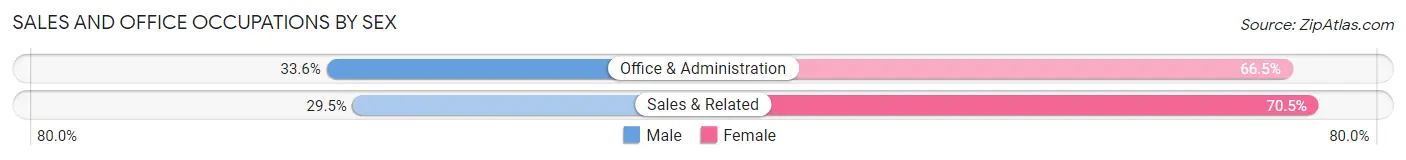
| Occupation | Male | Female |
| Sales & Related | 88 (29.5%) | 210 (70.5%) |
| Office & Administration | 103 (33.6%) | 204 (66.4%) |
| Total (Category) | 191 (31.6%) | 414 (68.4%) |
| Total (Overall) | 1,532 (54.1%) | 1,301 (45.9%) |
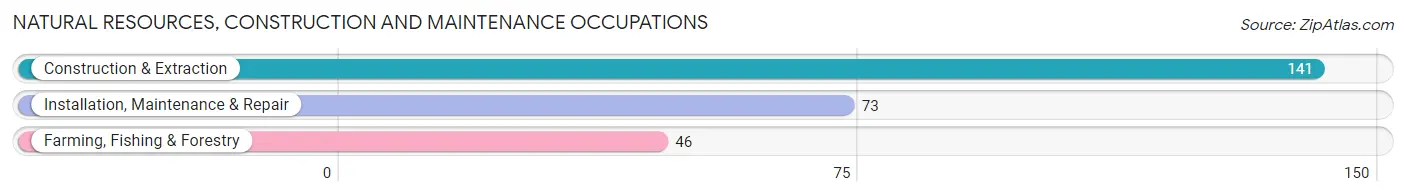
Natural Resources, Construction and Maintenance Occupations
The most common Natural Resources, Construction and Maintenance occupations in Carson County are Construction & Extraction (141 | 5.0%), Installation, Maintenance & Repair (73 | 2.6%), and Farming, Fishing & Forestry (46 | 1.6%).
Natural Resources, Construction and Maintenance Occupations by Sex
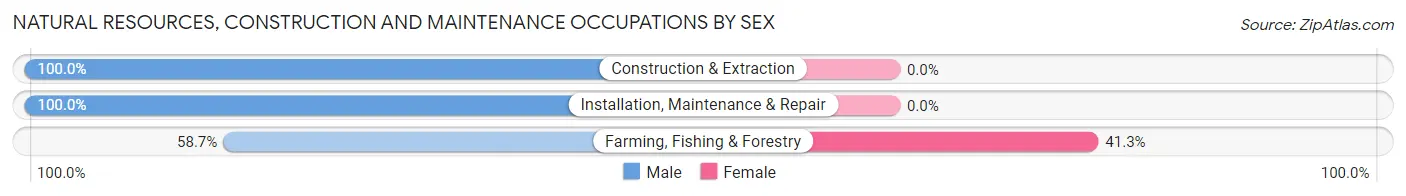
| Occupation | Male | Female |
| Farming, Fishing & Forestry | 27 (58.7%) | 19 (41.3%) |
| Construction & Extraction | 141 (100.0%) | 0 (0.0%) |
| Installation, Maintenance & Repair | 73 (100.0%) | 0 (0.0%) |
| Total (Category) | 241 (92.7%) | 19 (7.3%) |
| Total (Overall) | 1,532 (54.1%) | 1,301 (45.9%) |
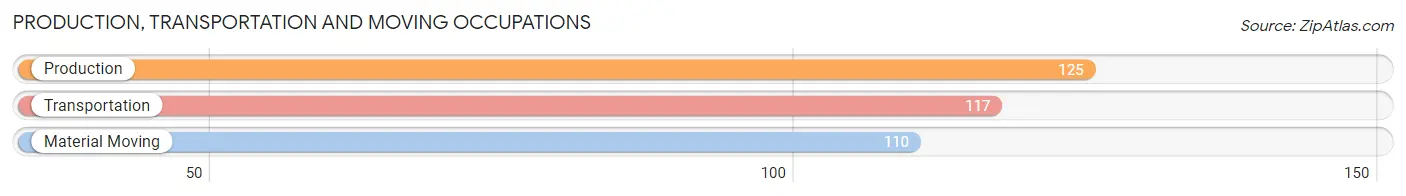
Production, Transportation and Moving Occupations
The most common Production, Transportation and Moving occupations in Carson County are Production (125 | 4.4%), Transportation (117 | 4.1%), and Material Moving (110 | 3.9%).
Production, Transportation and Moving Occupations by Sex
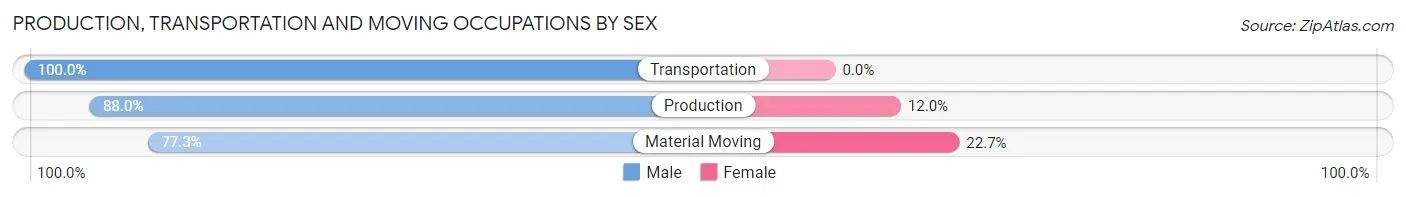
| Occupation | Male | Female |
| Production | 110 (88.0%) | 15 (12.0%) |
| Transportation | 117 (100.0%) | 0 (0.0%) |
| Material Moving | 85 (77.3%) | 25 (22.7%) |
| Total (Category) | 312 (88.6%) | 40 (11.4%) |
| Total (Overall) | 1,532 (54.1%) | 1,301 (45.9%) |
Employment Industries by Sex in Carson County
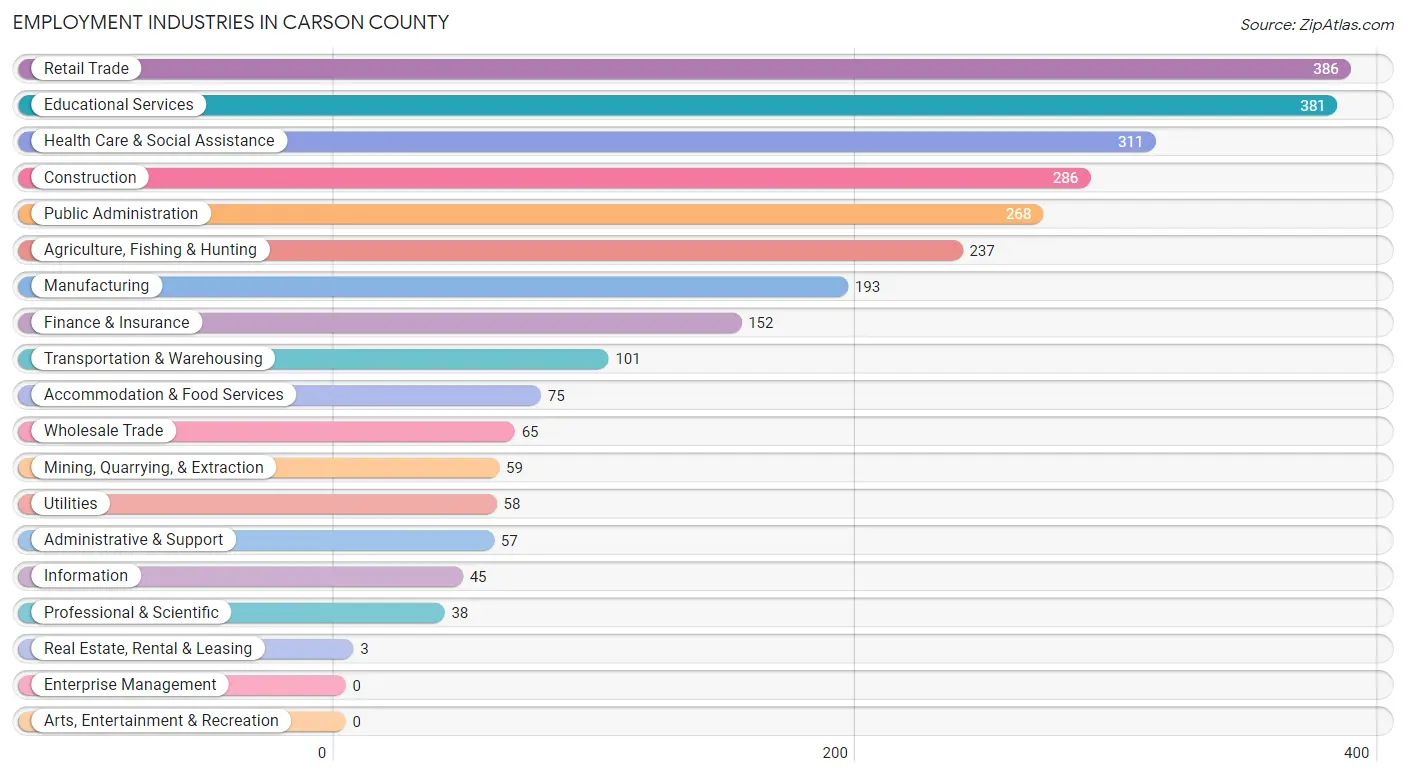
Employment Industries in Carson County
The major employment industries in Carson County include Retail Trade (386 | 13.6%), Educational Services (381 | 13.5%), Health Care & Social Assistance (311 | 11.0%), Construction (286 | 10.1%), and Public Administration (268 | 9.5%).
Employment Industries by Sex in Carson County
The Carson County industries that see more men than women are Mining, Quarrying, & Extraction (100.0%), Wholesale Trade (100.0%), and Transportation & Warehousing (96.0%), whereas the industries that tend to have a higher number of women are Finance & Insurance (92.1%), Health Care & Social Assistance (78.1%), and Educational Services (65.3%).

| Industry | Male | Female |
| Agriculture, Fishing & Hunting | 160 (67.5%) | 77 (32.5%) |
| Mining, Quarrying, & Extraction | 59 (100.0%) | 0 (0.0%) |
| Construction | 246 (86.0%) | 40 (14.0%) |
| Manufacturing | 140 (72.5%) | 53 (27.5%) |
| Wholesale Trade | 65 (100.0%) | 0 (0.0%) |
| Retail Trade | 193 (50.0%) | 193 (50.0%) |
| Transportation & Warehousing | 97 (96.0%) | 4 (4.0%) |
| Utilities | 34 (58.6%) | 24 (41.4%) |
| Information | 31 (68.9%) | 14 (31.1%) |
| Finance & Insurance | 12 (7.9%) | 140 (92.1%) |
| Real Estate, Rental & Leasing | 2 (66.7%) | 1 (33.3%) |
| Professional & Scientific | 31 (81.6%) | 7 (18.4%) |
| Enterprise Management | 0 (0.0%) | 0 (0.0%) |
| Administrative & Support | 41 (71.9%) | 16 (28.1%) |
| Educational Services | 132 (34.6%) | 249 (65.3%) |
| Health Care & Social Assistance | 68 (21.9%) | 243 (78.1%) |
| Arts, Entertainment & Recreation | 0 (0.0%) | 0 (0.0%) |
| Accommodation & Food Services | 27 (36.0%) | 48 (64.0%) |
| Public Administration | 136 (50.7%) | 132 (49.2%) |
| Total | 1,532 (54.1%) | 1,301 (45.9%) |
Education in Carson County
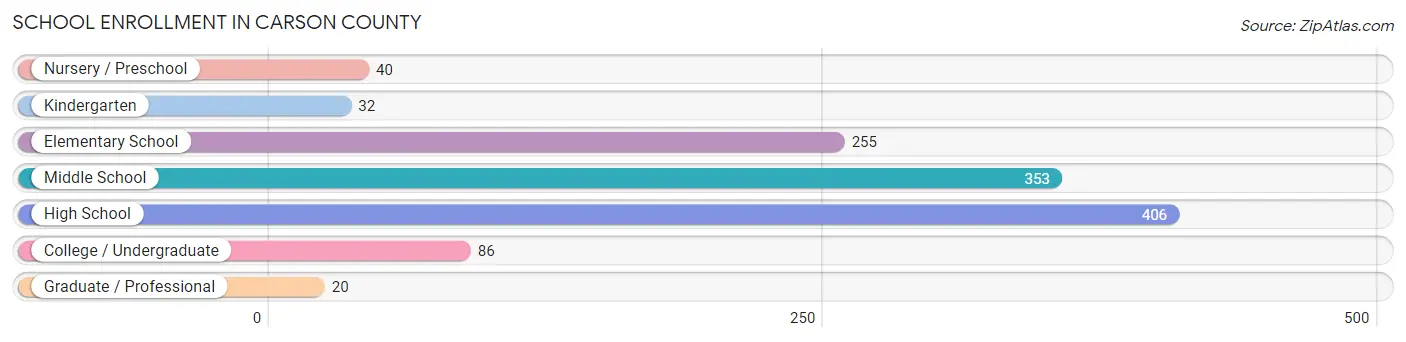
School Enrollment in Carson County
The most common levels of schooling among the 1,192 students in Carson County are high school (406 | 34.1%), middle school (353 | 29.6%), and elementary school (255 | 21.4%).
| School Level | # Students | % Students |
| Nursery / Preschool | 40 | 3.4% |
| Kindergarten | 32 | 2.7% |
| Elementary School | 255 | 21.4% |
| Middle School | 353 | 29.6% |
| High School | 406 | 34.1% |
| College / Undergraduate | 86 | 7.2% |
| Graduate / Professional | 20 | 1.7% |
| Total | 1,192 | 100.0% |
School Enrollment by Age by Funding Source in Carson County
Out of a total of 1,192 students who are enrolled in schools in Carson County, 128 (10.7%) attend a private institution, while the remaining 1,064 (89.3%) are enrolled in public schools. The age group of 35 years and over has the highest likelihood of being enrolled in private schools, with 43 (97.7% in the age bracket) enrolled. Conversely, the age group of 5 to 9 year old has the lowest likelihood of being enrolled in a private school, with 257 (97.0% in the age bracket) attending a public institution.
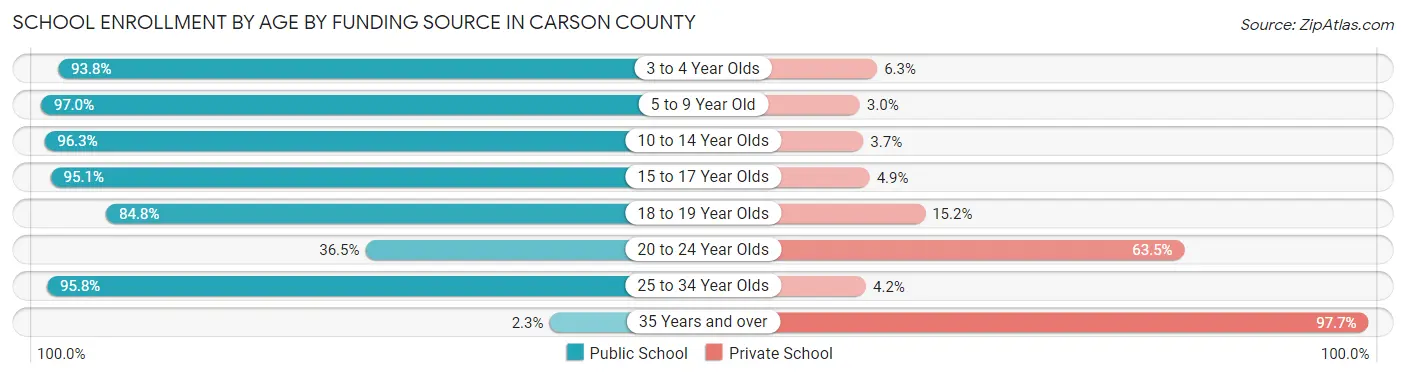
| Age Bracket | Public School | Private School |
| 3 to 4 Year Olds | 30 (93.8%) | 2 (6.2%) |
| 5 to 9 Year Old | 257 (97.0%) | 8 (3.0%) |
| 10 to 14 Year Olds | 393 (96.3%) | 15 (3.7%) |
| 15 to 17 Year Olds | 274 (95.1%) | 14 (4.9%) |
| 18 to 19 Year Olds | 67 (84.8%) | 12 (15.2%) |
| 20 to 24 Year Olds | 19 (36.5%) | 33 (63.5%) |
| 25 to 34 Year Olds | 23 (95.8%) | 1 (4.2%) |
| 35 Years and over | 1 (2.3%) | 43 (97.7%) |
| Total | 1,064 (89.3%) | 128 (10.7%) |
Educational Attainment by Field of Study in Carson County
Education (301 | 29.7%), business (174 | 17.2%), bio, nature & agricultural (126 | 12.4%), science & technology (84 | 8.3%), and physical & health sciences (81 | 8.0%) are the most common fields of study among 1,014 individuals in Carson County who have obtained a bachelor's degree or higher.
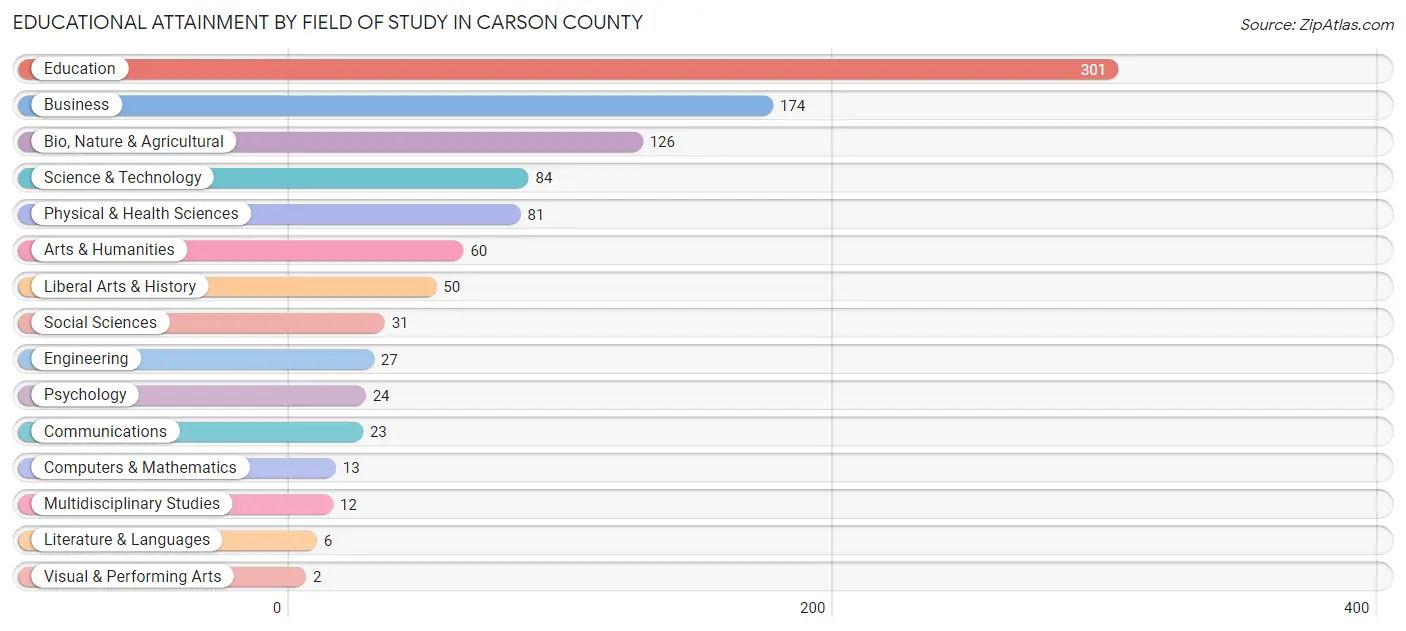
| Field of Study | # Graduates | % Graduates |
| Computers & Mathematics | 13 | 1.3% |
| Bio, Nature & Agricultural | 126 | 12.4% |
| Physical & Health Sciences | 81 | 8.0% |
| Psychology | 24 | 2.4% |
| Social Sciences | 31 | 3.1% |
| Engineering | 27 | 2.7% |
| Multidisciplinary Studies | 12 | 1.2% |
| Science & Technology | 84 | 8.3% |
| Business | 174 | 17.2% |
| Education | 301 | 29.7% |
| Literature & Languages | 6 | 0.6% |
| Liberal Arts & History | 50 | 4.9% |
| Visual & Performing Arts | 2 | 0.2% |
| Communications | 23 | 2.3% |
| Arts & Humanities | 60 | 5.9% |
| Total | 1,014 | 100.0% |
Transportation & Commute in Carson County
Vehicle Availability by Sex in Carson County
The most prevalent vehicle ownership categories in Carson County are males with 2 vehicles (745, accounting for 48.7%) and females with 2 vehicles (555, making up 58.4%).
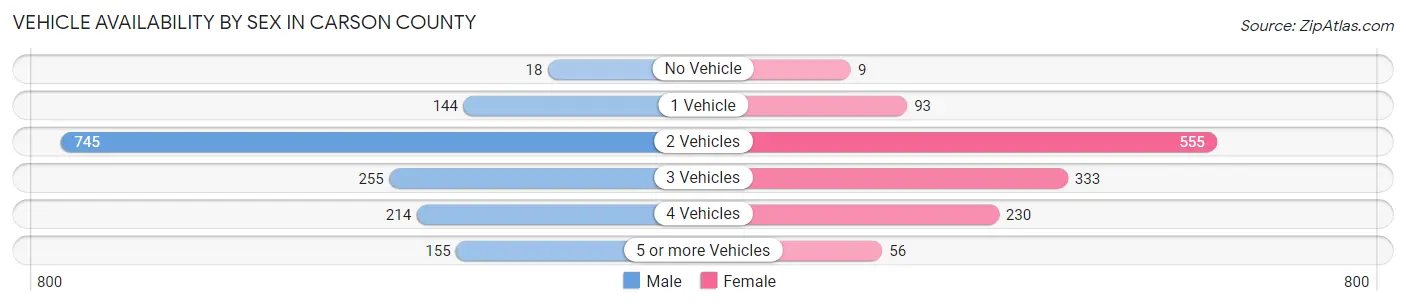
| Vehicles Available | Male | Female |
| No Vehicle | 18 (1.2%) | 9 (0.7%) |
| 1 Vehicle | 144 (9.4%) | 93 (7.3%) |
| 2 Vehicles | 745 (48.7%) | 555 (43.5%) |
| 3 Vehicles | 255 (16.7%) | 333 (26.1%) |
| 4 Vehicles | 214 (14.0%) | 230 (18.0%) |
| 5 or more Vehicles | 155 (10.1%) | 56 (4.4%) |
| Total | 1,531 (100.0%) | 1,276 (100.0%) |
Commute Time in Carson County
The most frequently occuring commute durations in Carson County are 30 to 34 minutes (446 commuters, 17.2%), less than 5 minutes (403 commuters, 15.6%), and 5 to 9 minutes (356 commuters, 13.8%).
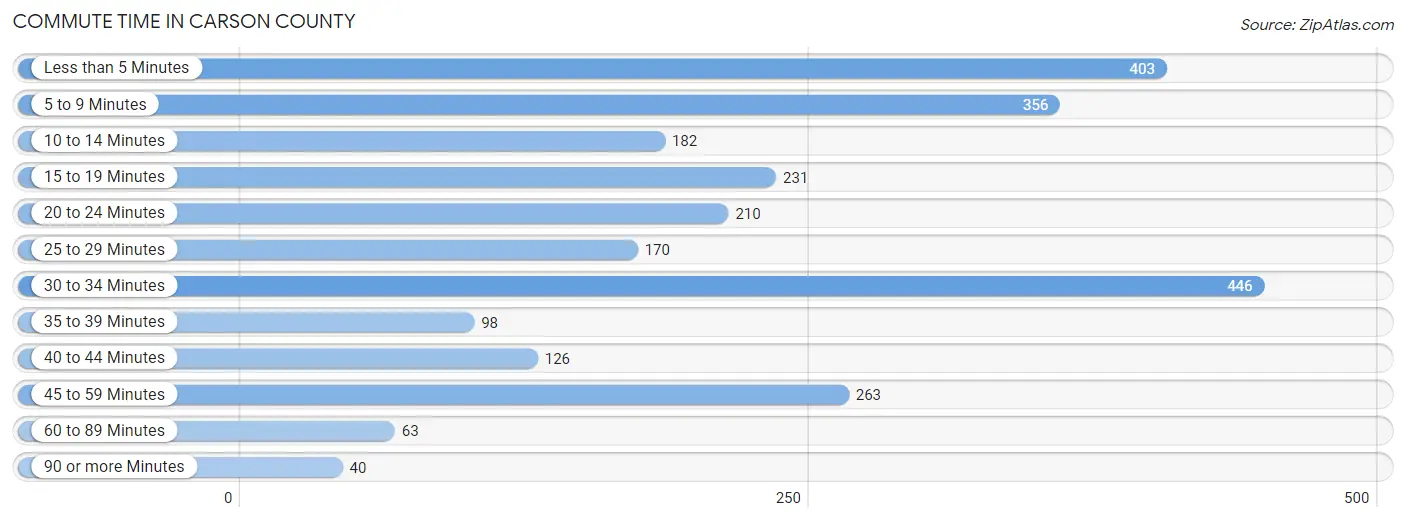
| Commute Time | # Commuters | % Commuters |
| Less than 5 Minutes | 403 | 15.6% |
| 5 to 9 Minutes | 356 | 13.8% |
| 10 to 14 Minutes | 182 | 7.0% |
| 15 to 19 Minutes | 231 | 8.9% |
| 20 to 24 Minutes | 210 | 8.1% |
| 25 to 29 Minutes | 170 | 6.6% |
| 30 to 34 Minutes | 446 | 17.2% |
| 35 to 39 Minutes | 98 | 3.8% |
| 40 to 44 Minutes | 126 | 4.9% |
| 45 to 59 Minutes | 263 | 10.2% |
| 60 to 89 Minutes | 63 | 2.4% |
| 90 or more Minutes | 40 | 1.5% |
Commute Time by Sex in Carson County
The most common commute times in Carson County are less than 5 minutes (243 commuters, 17.1%) for males and 30 to 34 minutes (243 commuters, 20.8%) for females.
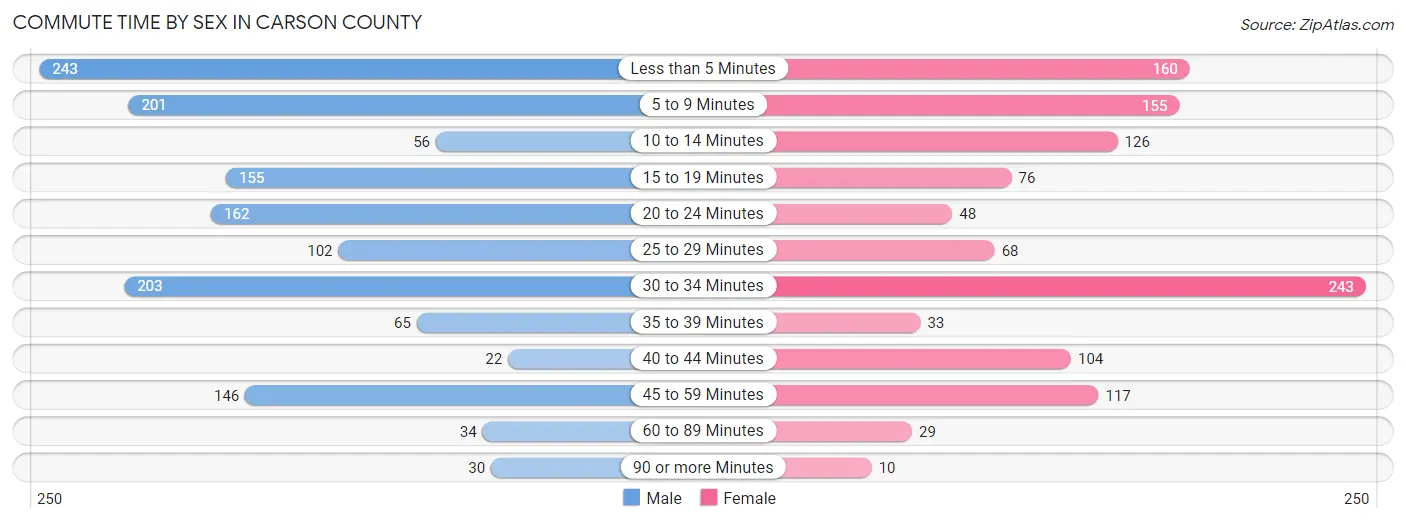
| Commute Time | Male | Female |
| Less than 5 Minutes | 243 (17.1%) | 160 (13.7%) |
| 5 to 9 Minutes | 201 (14.2%) | 155 (13.3%) |
| 10 to 14 Minutes | 56 (4.0%) | 126 (10.8%) |
| 15 to 19 Minutes | 155 (10.9%) | 76 (6.5%) |
| 20 to 24 Minutes | 162 (11.4%) | 48 (4.1%) |
| 25 to 29 Minutes | 102 (7.2%) | 68 (5.8%) |
| 30 to 34 Minutes | 203 (14.3%) | 243 (20.8%) |
| 35 to 39 Minutes | 65 (4.6%) | 33 (2.8%) |
| 40 to 44 Minutes | 22 (1.5%) | 104 (8.9%) |
| 45 to 59 Minutes | 146 (10.3%) | 117 (10.0%) |
| 60 to 89 Minutes | 34 (2.4%) | 29 (2.5%) |
| 90 or more Minutes | 30 (2.1%) | 10 (0.9%) |
Time of Departure to Work by Sex in Carson County
The most frequent times of departure to work in Carson County are 6:00 AM to 6:29 AM (288, 20.3%) for males and 7:00 AM to 7:29 AM (265, 22.7%) for females.
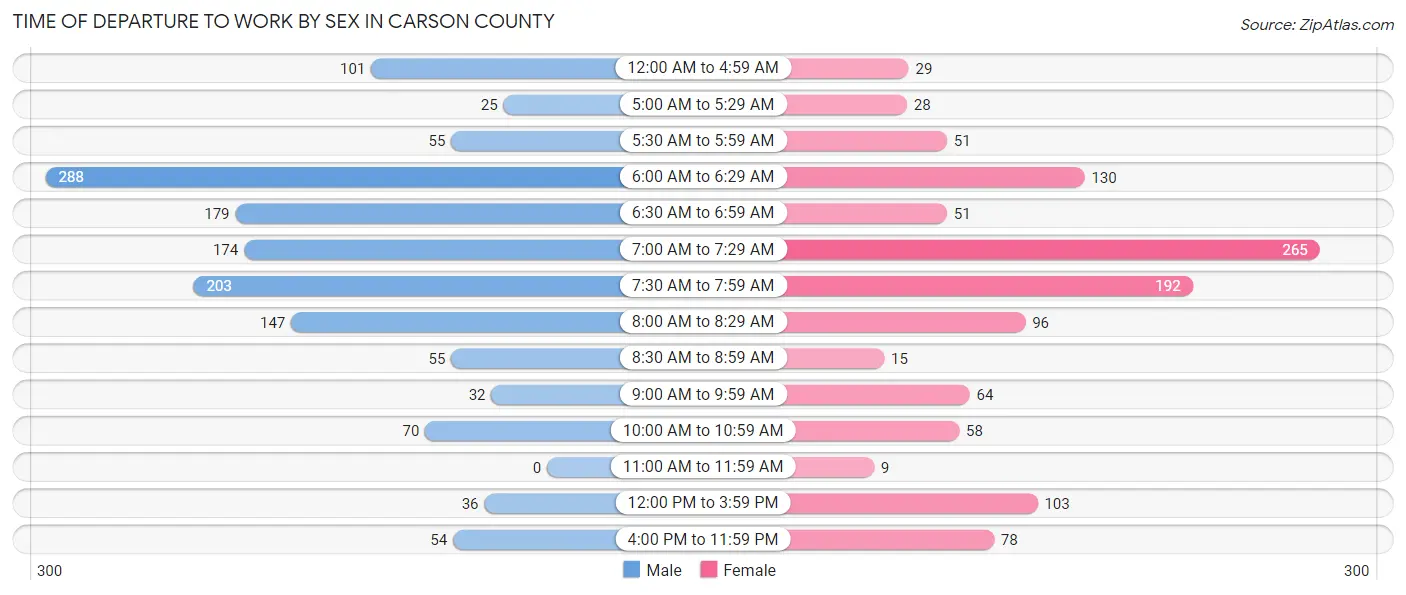
| Time of Departure | Male | Female |
| 12:00 AM to 4:59 AM | 101 (7.1%) | 29 (2.5%) |
| 5:00 AM to 5:29 AM | 25 (1.8%) | 28 (2.4%) |
| 5:30 AM to 5:59 AM | 55 (3.9%) | 51 (4.4%) |
| 6:00 AM to 6:29 AM | 288 (20.3%) | 130 (11.1%) |
| 6:30 AM to 6:59 AM | 179 (12.6%) | 51 (4.4%) |
| 7:00 AM to 7:29 AM | 174 (12.3%) | 265 (22.7%) |
| 7:30 AM to 7:59 AM | 203 (14.3%) | 192 (16.4%) |
| 8:00 AM to 8:29 AM | 147 (10.4%) | 96 (8.2%) |
| 8:30 AM to 8:59 AM | 55 (3.9%) | 15 (1.3%) |
| 9:00 AM to 9:59 AM | 32 (2.3%) | 64 (5.5%) |
| 10:00 AM to 10:59 AM | 70 (4.9%) | 58 (5.0%) |
| 11:00 AM to 11:59 AM | 0 (0.0%) | 9 (0.8%) |
| 12:00 PM to 3:59 PM | 36 (2.5%) | 103 (8.8%) |
| 4:00 PM to 11:59 PM | 54 (3.8%) | 78 (6.7%) |
| Total | 1,419 (100.0%) | 1,169 (100.0%) |
Housing Occupancy in Carson County
Occupancy by Ownership in Carson County
Of the total 2,260 dwellings in Carson County, owner-occupied units account for 1,893 (83.8%), while renter-occupied units make up 367 (16.2%).
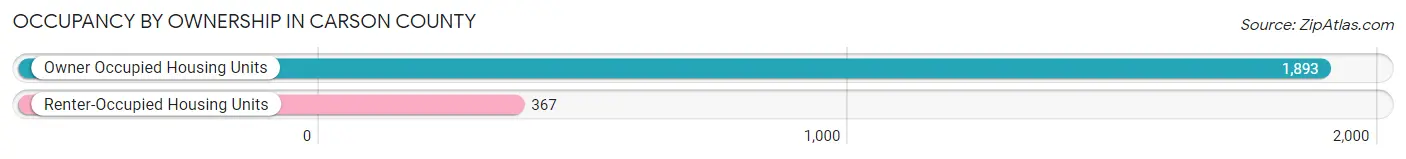
| Occupancy | # Housing Units | % Housing Units |
| Owner Occupied Housing Units | 1,893 | 83.8% |
| Renter-Occupied Housing Units | 367 | 16.2% |
| Total Occupied Housing Units | 2,260 | 100.0% |
Occupancy by Household Size in Carson County
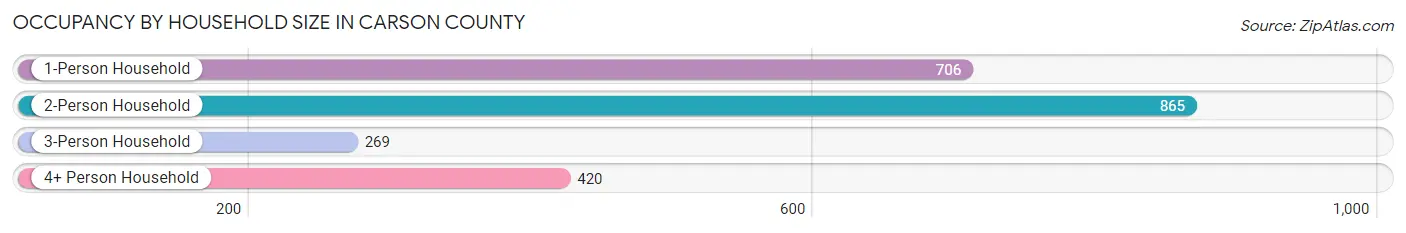
| Household Size | # Housing Units | % Housing Units |
| 1-Person Household | 706 | 31.2% |
| 2-Person Household | 865 | 38.3% |
| 3-Person Household | 269 | 11.9% |
| 4+ Person Household | 420 | 18.6% |
| Total Housing Units | 2,260 | 100.0% |
Occupancy by Ownership by Household Size in Carson County
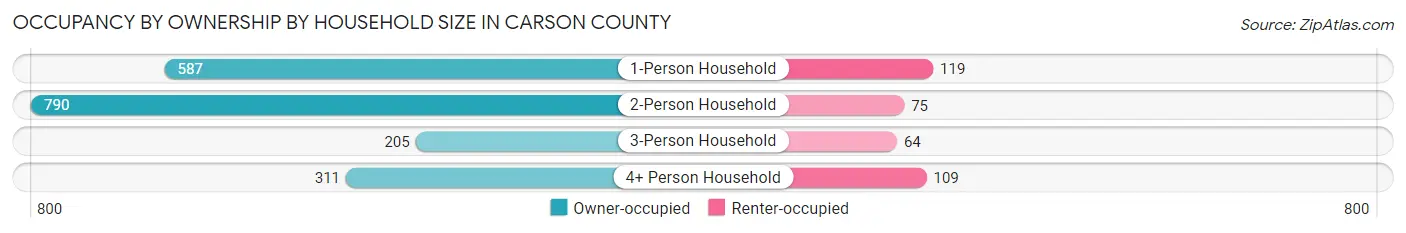
| Household Size | Owner-occupied | Renter-occupied |
| 1-Person Household | 587 (83.1%) | 119 (16.9%) |
| 2-Person Household | 790 (91.3%) | 75 (8.7%) |
| 3-Person Household | 205 (76.2%) | 64 (23.8%) |
| 4+ Person Household | 311 (74.1%) | 109 (26.0%) |
| Total Housing Units | 1,893 (83.8%) | 367 (16.2%) |
Occupancy by Educational Attainment in Carson County
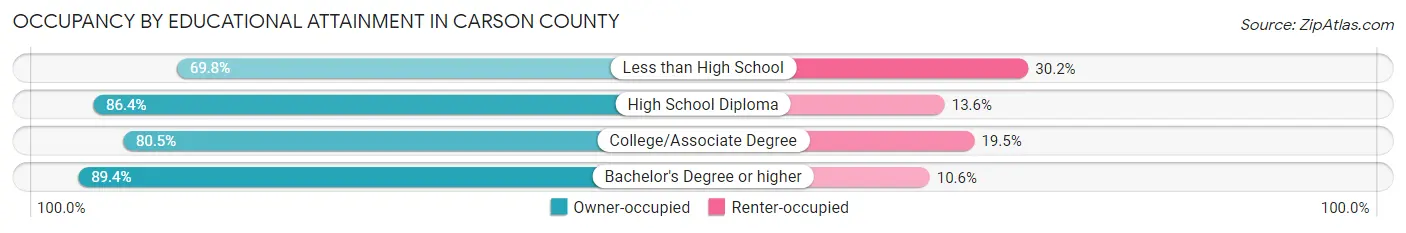
| Household Size | Owner-occupied | Renter-occupied |
| Less than High School | 118 (69.8%) | 51 (30.2%) |
| High School Diploma | 597 (86.4%) | 94 (13.6%) |
| College/Associate Degree | 665 (80.5%) | 161 (19.5%) |
| Bachelor's Degree or higher | 513 (89.4%) | 61 (10.6%) |
Occupancy by Age of Householder in Carson County
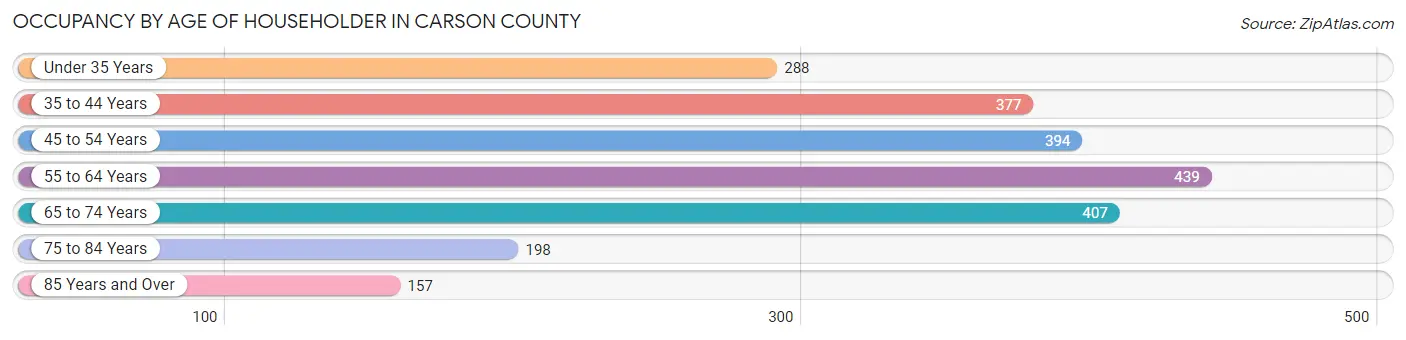
| Age Bracket | # Households | % Households |
| Under 35 Years | 288 | 12.7% |
| 35 to 44 Years | 377 | 16.7% |
| 45 to 54 Years | 394 | 17.4% |
| 55 to 64 Years | 439 | 19.4% |
| 65 to 74 Years | 407 | 18.0% |
| 75 to 84 Years | 198 | 8.8% |
| 85 Years and Over | 157 | 7.0% |
| Total | 2,260 | 100.0% |
Housing Finances in Carson County
Median Income by Occupancy in Carson County
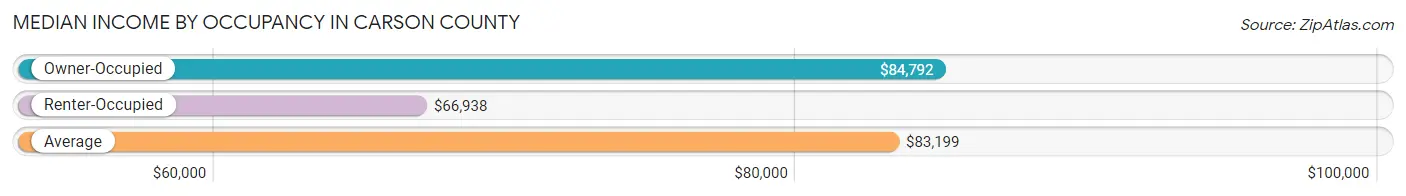
| Occupancy Type | # Households | Median Income |
| Owner-Occupied | 1,893 (83.8%) | $84,792 |
| Renter-Occupied | 367 (16.2%) | $66,938 |
| Average | 2,260 (100.0%) | $83,199 |
Occupancy by Householder Income Bracket in Carson County
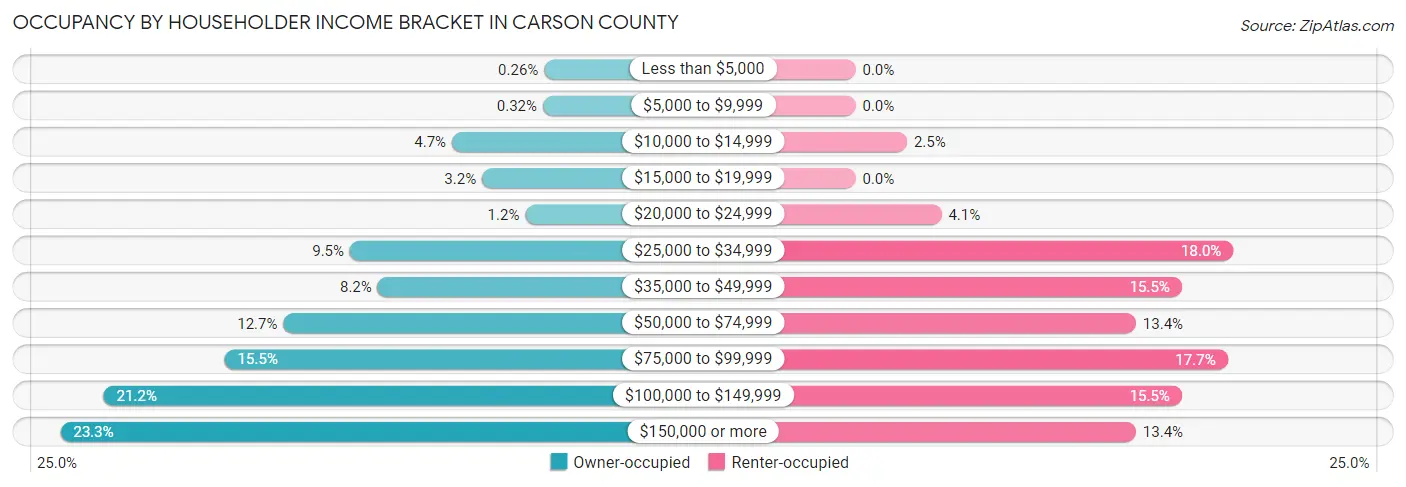
| Income Bracket | Owner-occupied | Renter-occupied |
| Less than $5,000 | 5 (0.3%) | 0 (0.0%) |
| $5,000 to $9,999 | 6 (0.3%) | 0 (0.0%) |
| $10,000 to $14,999 | 88 (4.6%) | 9 (2.5%) |
| $15,000 to $19,999 | 61 (3.2%) | 0 (0.0%) |
| $20,000 to $24,999 | 22 (1.2%) | 15 (4.1%) |
| $25,000 to $34,999 | 180 (9.5%) | 66 (18.0%) |
| $35,000 to $49,999 | 155 (8.2%) | 57 (15.5%) |
| $50,000 to $74,999 | 240 (12.7%) | 49 (13.4%) |
| $75,000 to $99,999 | 293 (15.5%) | 65 (17.7%) |
| $100,000 to $149,999 | 402 (21.2%) | 57 (15.5%) |
| $150,000 or more | 441 (23.3%) | 49 (13.4%) |
| Total | 1,893 (100.0%) | 367 (100.0%) |
Monthly Housing Cost Tiers in Carson County
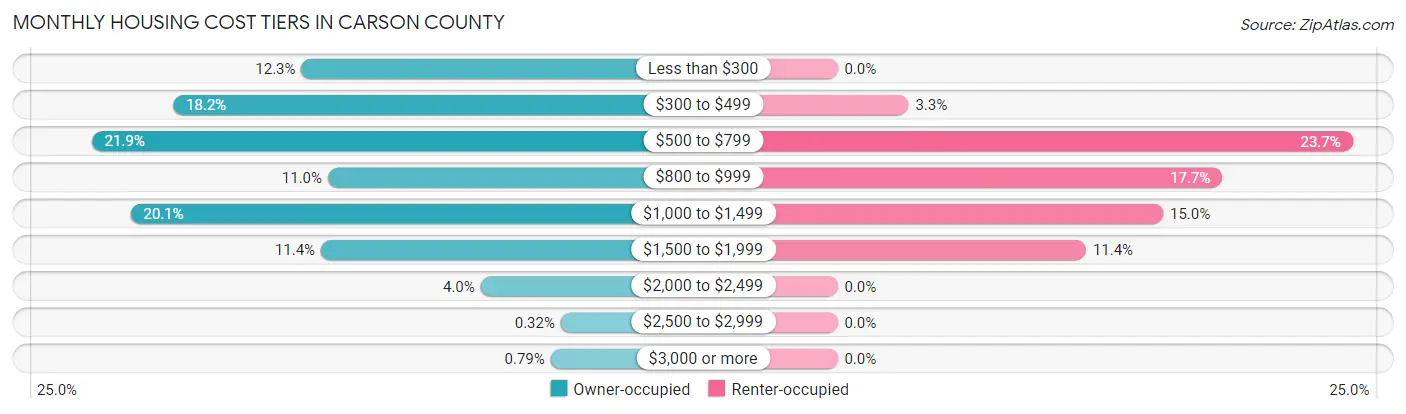
| Monthly Cost | Owner-occupied | Renter-occupied |
| Less than $300 | 232 (12.3%) | 0 (0.0%) |
| $300 to $499 | 344 (18.2%) | 12 (3.3%) |
| $500 to $799 | 415 (21.9%) | 87 (23.7%) |
| $800 to $999 | 209 (11.0%) | 65 (17.7%) |
| $1,000 to $1,499 | 381 (20.1%) | 55 (15.0%) |
| $1,500 to $1,999 | 215 (11.4%) | 42 (11.4%) |
| $2,000 to $2,499 | 76 (4.0%) | 0 (0.0%) |
| $2,500 to $2,999 | 6 (0.3%) | 0 (0.0%) |
| $3,000 or more | 15 (0.8%) | 0 (0.0%) |
| Total | 1,893 (100.0%) | 367 (100.0%) |
Physical Housing Characteristics in Carson County
Housing Structures in Carson County
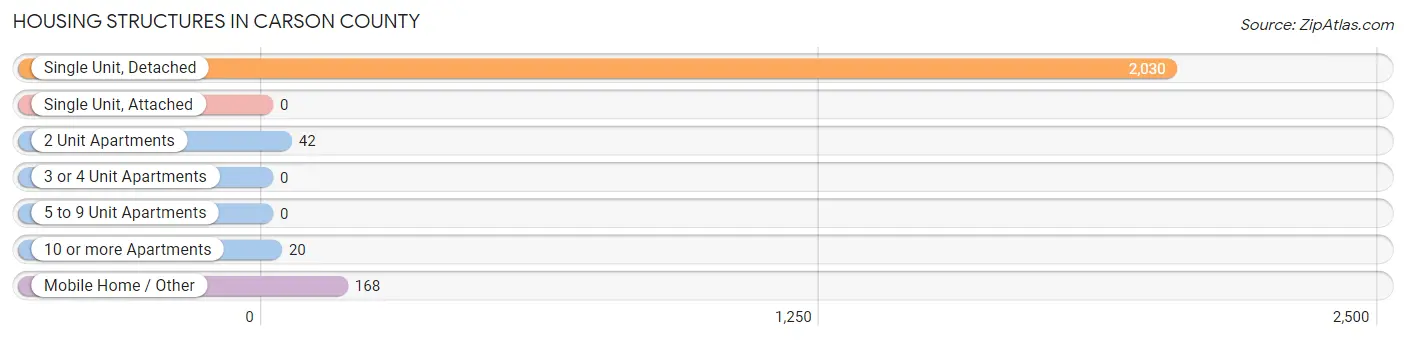
| Structure Type | # Housing Units | % Housing Units |
| Single Unit, Detached | 2,030 | 89.8% |
| Single Unit, Attached | 0 | 0.0% |
| 2 Unit Apartments | 42 | 1.9% |
| 3 or 4 Unit Apartments | 0 | 0.0% |
| 5 to 9 Unit Apartments | 0 | 0.0% |
| 10 or more Apartments | 20 | 0.9% |
| Mobile Home / Other | 168 | 7.4% |
| Total | 2,260 | 100.0% |
Housing Structures by Occupancy in Carson County
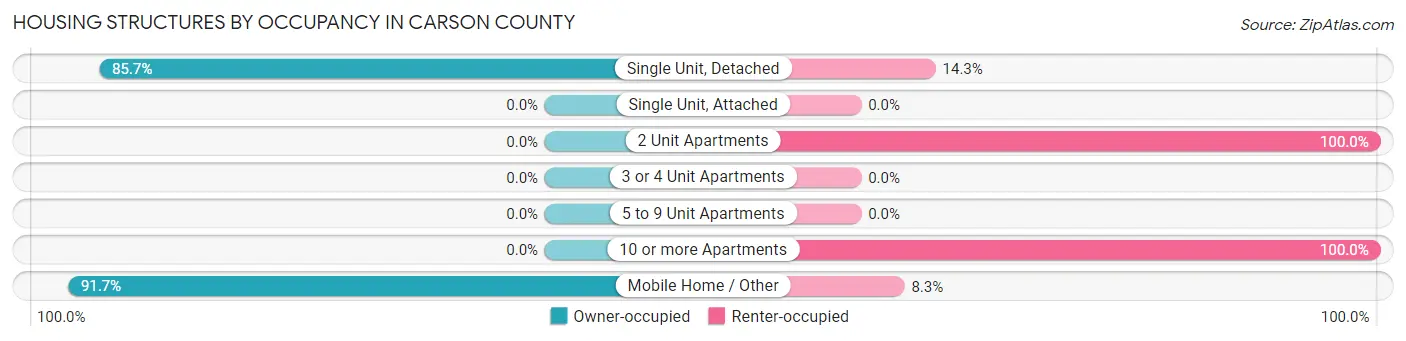
| Structure Type | Owner-occupied | Renter-occupied |
| Single Unit, Detached | 1,739 (85.7%) | 291 (14.3%) |
| Single Unit, Attached | 0 (0.0%) | 0 (0.0%) |
| 2 Unit Apartments | 0 (0.0%) | 42 (100.0%) |
| 3 or 4 Unit Apartments | 0 (0.0%) | 0 (0.0%) |
| 5 to 9 Unit Apartments | 0 (0.0%) | 0 (0.0%) |
| 10 or more Apartments | 0 (0.0%) | 20 (100.0%) |
| Mobile Home / Other | 154 (91.7%) | 14 (8.3%) |
| Total | 1,893 (83.8%) | 367 (16.2%) |
Housing Structures by Number of Rooms in Carson County
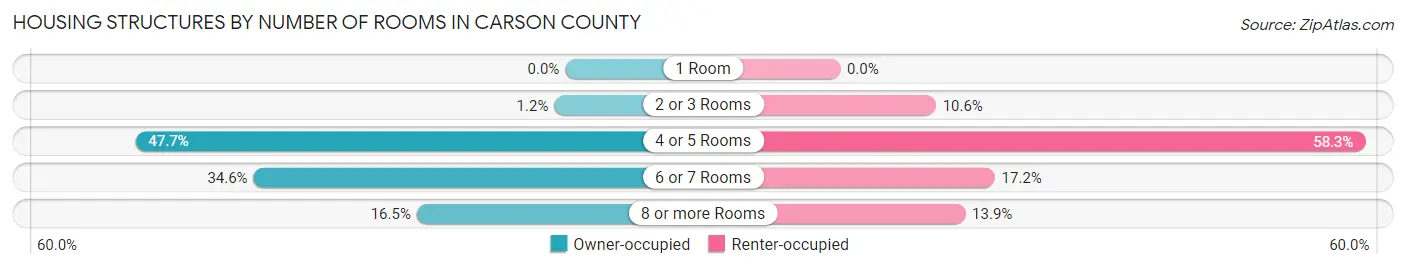
| Number of Rooms | Owner-occupied | Renter-occupied |
| 1 Room | 0 (0.0%) | 0 (0.0%) |
| 2 or 3 Rooms | 23 (1.2%) | 39 (10.6%) |
| 4 or 5 Rooms | 903 (47.7%) | 214 (58.3%) |
| 6 or 7 Rooms | 655 (34.6%) | 63 (17.2%) |
| 8 or more Rooms | 312 (16.5%) | 51 (13.9%) |
| Total | 1,893 (100.0%) | 367 (100.0%) |
Housing Structure by Heating Type in Carson County
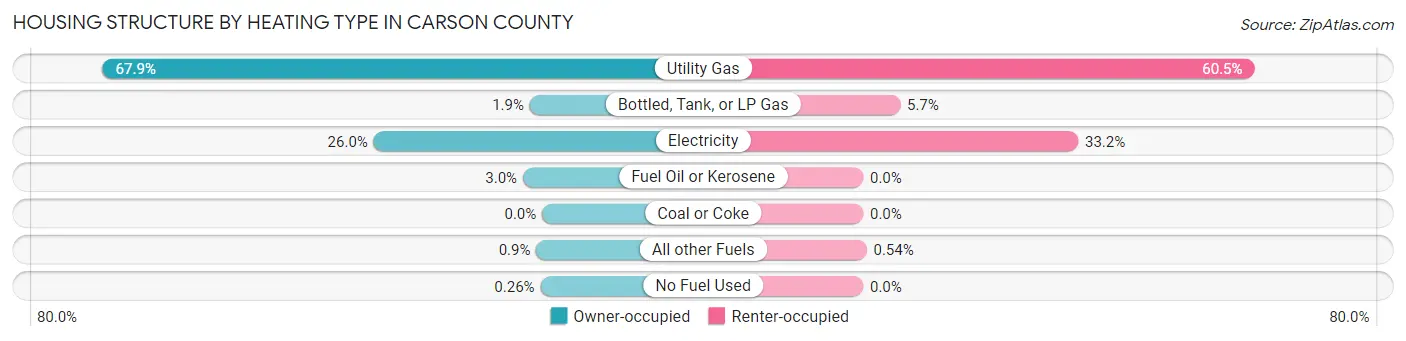
| Heating Type | Owner-occupied | Renter-occupied |
| Utility Gas | 1,286 (67.9%) | 222 (60.5%) |
| Bottled, Tank, or LP Gas | 36 (1.9%) | 21 (5.7%) |
| Electricity | 493 (26.0%) | 122 (33.2%) |
| Fuel Oil or Kerosene | 56 (3.0%) | 0 (0.0%) |
| Coal or Coke | 0 (0.0%) | 0 (0.0%) |
| All other Fuels | 17 (0.9%) | 2 (0.5%) |
| No Fuel Used | 5 (0.3%) | 0 (0.0%) |
| Total | 1,893 (100.0%) | 367 (100.0%) |
Household Vehicle Usage in Carson County
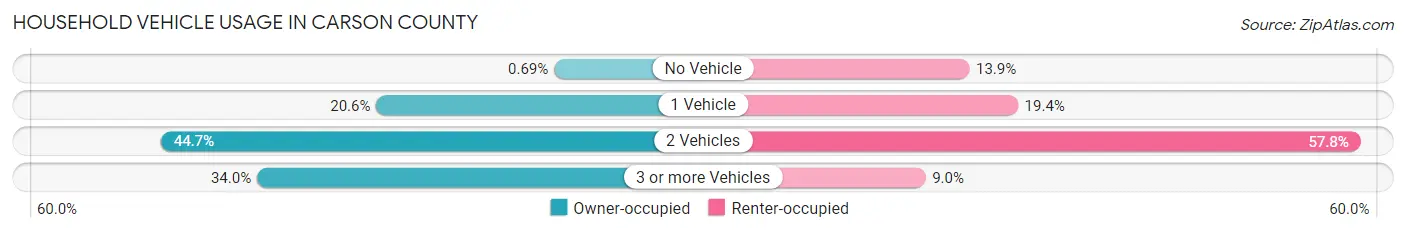
| Vehicles per Household | Owner-occupied | Renter-occupied |
| No Vehicle | 13 (0.7%) | 51 (13.9%) |
| 1 Vehicle | 390 (20.6%) | 71 (19.4%) |
| 2 Vehicles | 847 (44.7%) | 212 (57.8%) |
| 3 or more Vehicles | 643 (34.0%) | 33 (9.0%) |
| Total | 1,893 (100.0%) | 367 (100.0%) |
Real Estate & Mortgages in Carson County
Real Estate and Mortgage Overview in Carson County
| Characteristic | Without Mortgage | With Mortgage |
| Housing Units | 1,087 | 806 |
| Median Property Value | $107,200 | $149,500 |
| Median Household Income | $72,404 | $279 |
| Monthly Housing Costs | $483 | $15 |
| Real Estate Taxes | $1,455 | $13 |
Property Value by Mortgage Status in Carson County
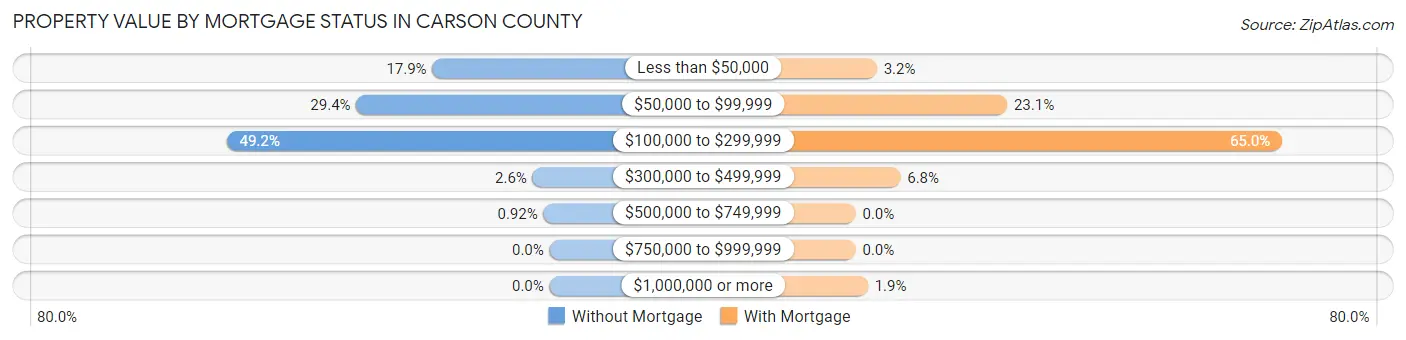
| Property Value | Without Mortgage | With Mortgage |
| Less than $50,000 | 194 (17.8%) | 26 (3.2%) |
| $50,000 to $99,999 | 320 (29.4%) | 186 (23.1%) |
| $100,000 to $299,999 | 535 (49.2%) | 524 (65.0%) |
| $300,000 to $499,999 | 28 (2.6%) | 55 (6.8%) |
| $500,000 to $749,999 | 10 (0.9%) | 0 (0.0%) |
| $750,000 to $999,999 | 0 (0.0%) | 0 (0.0%) |
| $1,000,000 or more | 0 (0.0%) | 15 (1.9%) |
| Total | 1,087 (100.0%) | 806 (100.0%) |
Household Income by Mortgage Status in Carson County
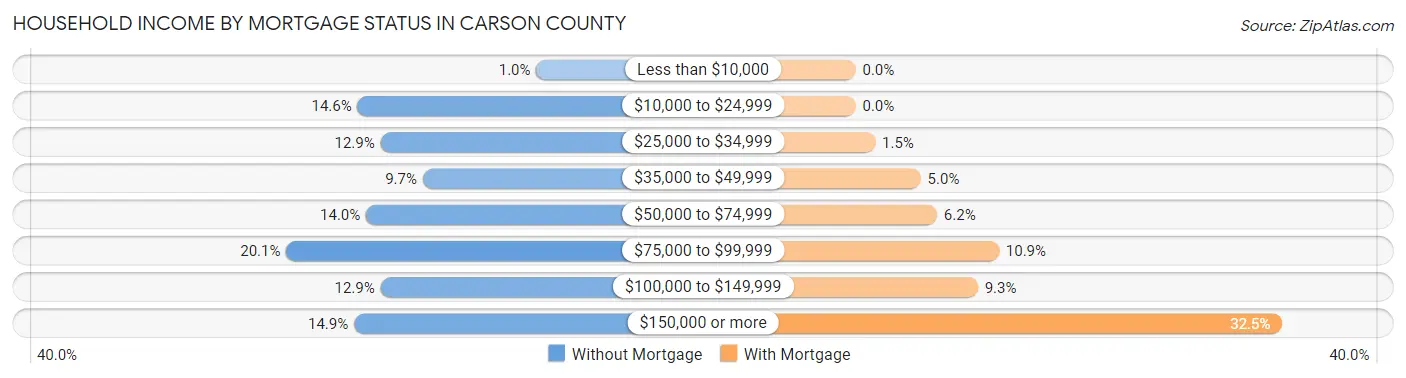
| Household Income | Without Mortgage | With Mortgage |
| Less than $10,000 | 11 (1.0%) | 0 (0.0%) |
| $10,000 to $24,999 | 159 (14.6%) | 0 (0.0%) |
| $25,000 to $34,999 | 140 (12.9%) | 12 (1.5%) |
| $35,000 to $49,999 | 105 (9.7%) | 40 (5.0%) |
| $50,000 to $74,999 | 152 (14.0%) | 50 (6.2%) |
| $75,000 to $99,999 | 218 (20.1%) | 88 (10.9%) |
| $100,000 to $149,999 | 140 (12.9%) | 75 (9.3%) |
| $150,000 or more | 162 (14.9%) | 262 (32.5%) |
| Total | 1,087 (100.0%) | 806 (100.0%) |
Property Value to Household Income Ratio in Carson County
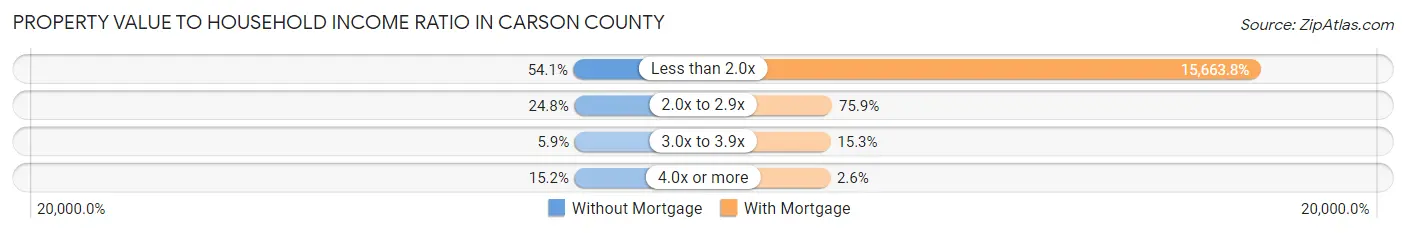
| Value-to-Income Ratio | Without Mortgage | With Mortgage |
| Less than 2.0x | 588 (54.1%) | 126,250 (15,663.8%) |
| 2.0x to 2.9x | 270 (24.8%) | 612 (75.9%) |
| 3.0x to 3.9x | 64 (5.9%) | 123 (15.3%) |
| 4.0x or more | 165 (15.2%) | 21 (2.6%) |
| Total | 1,087 (100.0%) | 806 (100.0%) |
Real Estate Taxes by Mortgage Status in Carson County
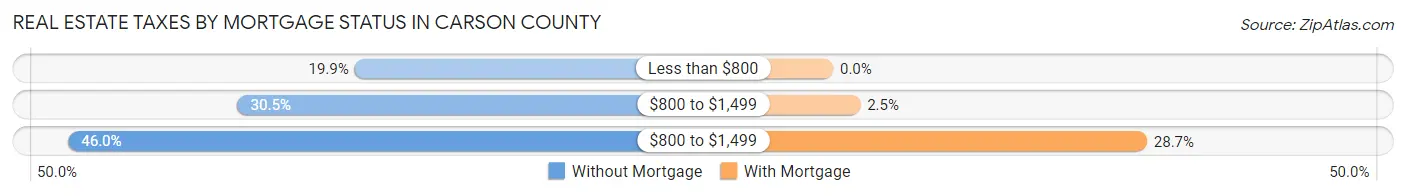
| Property Taxes | Without Mortgage | With Mortgage |
| Less than $800 | 216 (19.9%) | 0 (0.0%) |
| $800 to $1,499 | 332 (30.5%) | 20 (2.5%) |
| $800 to $1,499 | 500 (46.0%) | 231 (28.7%) |
| Total | 1,087 (100.0%) | 806 (100.0%) |
Health & Disability in Carson County
Health Insurance Coverage by Age in Carson County
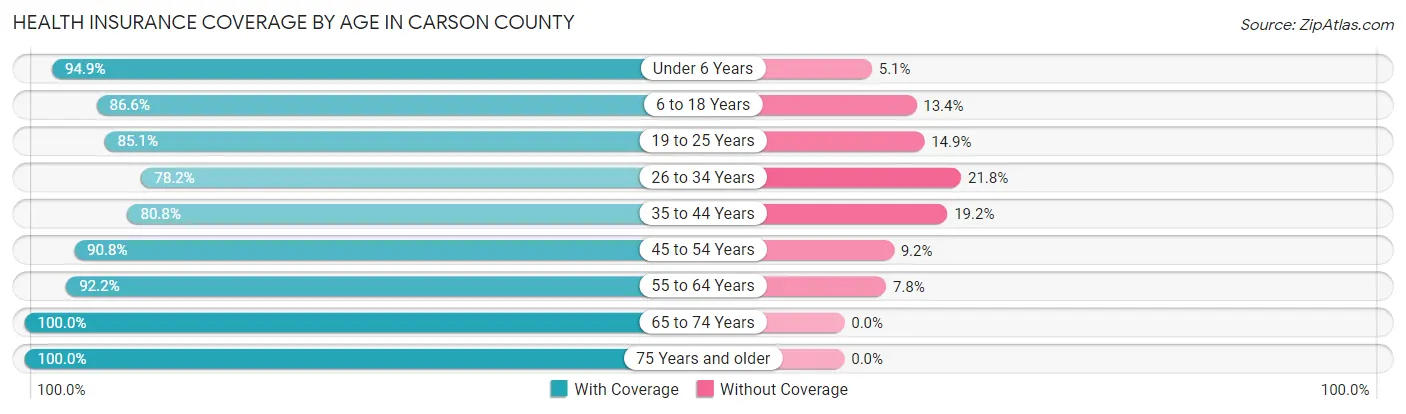
| Age Bracket | With Coverage | Without Coverage |
| Under 6 Years | 407 (94.9%) | 22 (5.1%) |
| 6 to 18 Years | 916 (86.6%) | 142 (13.4%) |
| 19 to 25 Years | 445 (85.1%) | 78 (14.9%) |
| 26 to 34 Years | 352 (78.2%) | 98 (21.8%) |
| 35 to 44 Years | 564 (80.8%) | 134 (19.2%) |
| 45 to 54 Years | 581 (90.8%) | 59 (9.2%) |
| 55 to 64 Years | 688 (92.2%) | 58 (7.8%) |
| 65 to 74 Years | 705 (100.0%) | 0 (0.0%) |
| 75 Years and older | 509 (100.0%) | 0 (0.0%) |
| Total | 5,167 (89.7%) | 591 (10.3%) |
Health Insurance Coverage by Citizenship Status in Carson County
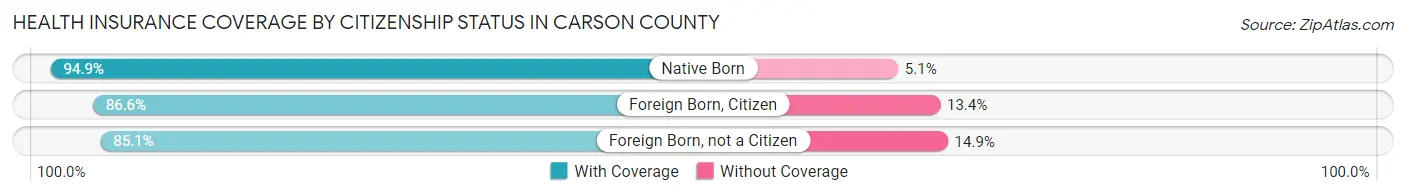
| Citizenship Status | With Coverage | Without Coverage |
| Native Born | 407 (94.9%) | 22 (5.1%) |
| Foreign Born, Citizen | 916 (86.6%) | 142 (13.4%) |
| Foreign Born, not a Citizen | 445 (85.1%) | 78 (14.9%) |
Health Insurance Coverage by Household Income in Carson County
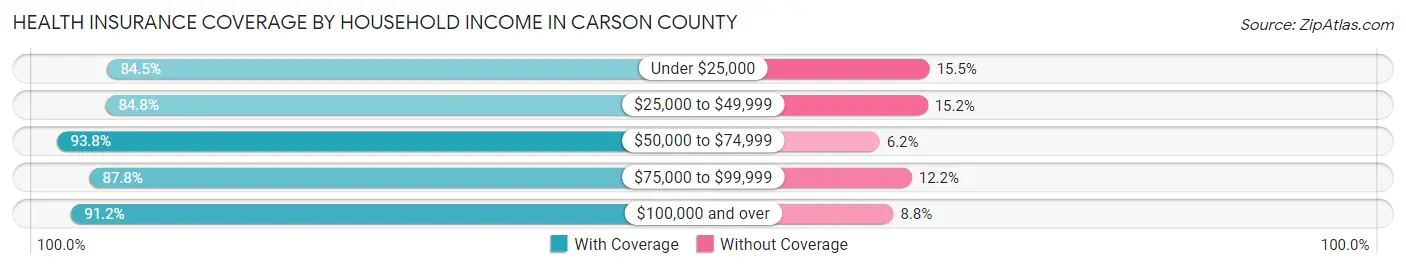
| Household Income | With Coverage | Without Coverage |
| Under $25,000 | 261 (84.5%) | 48 (15.5%) |
| $25,000 to $49,999 | 772 (84.8%) | 138 (15.2%) |
| $50,000 to $74,999 | 607 (93.8%) | 40 (6.2%) |
| $75,000 to $99,999 | 649 (87.8%) | 90 (12.2%) |
| $100,000 and over | 2,853 (91.2%) | 274 (8.8%) |
Public vs Private Health Insurance Coverage by Age in Carson County
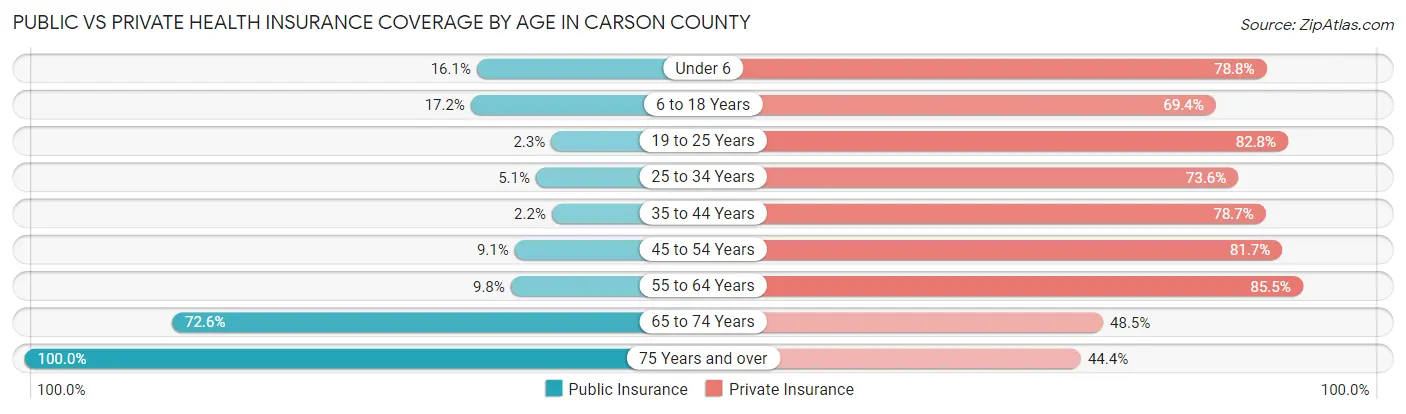
| Age Bracket | Public Insurance | Private Insurance |
| Under 6 | 69 (16.1%) | 338 (78.8%) |
| 6 to 18 Years | 182 (17.2%) | 734 (69.4%) |
| 19 to 25 Years | 12 (2.3%) | 433 (82.8%) |
| 25 to 34 Years | 23 (5.1%) | 331 (73.6%) |
| 35 to 44 Years | 15 (2.1%) | 549 (78.6%) |
| 45 to 54 Years | 58 (9.1%) | 523 (81.7%) |
| 55 to 64 Years | 73 (9.8%) | 638 (85.5%) |
| 65 to 74 Years | 512 (72.6%) | 342 (48.5%) |
| 75 Years and over | 509 (100.0%) | 226 (44.4%) |
| Total | 1,453 (25.2%) | 4,114 (71.5%) |
Disability Status by Sex by Age in Carson County
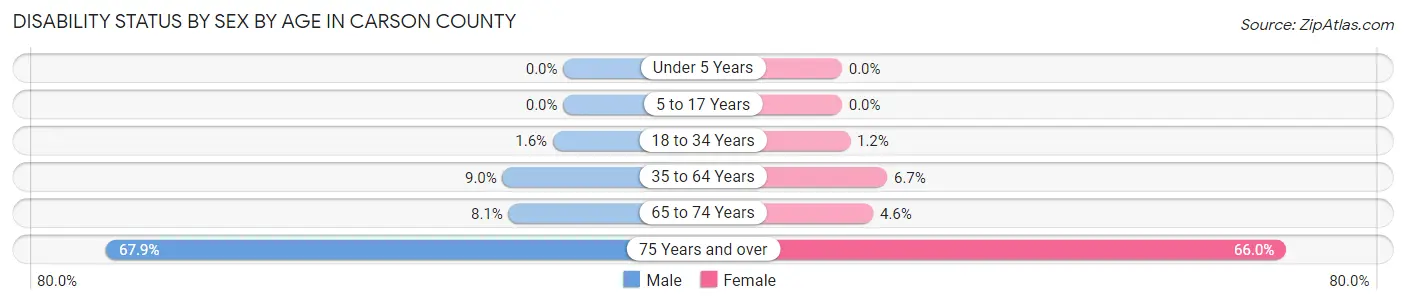
| Age Bracket | Male | Female |
| Under 5 Years | 0 (0.0%) | 0 (0.0%) |
| 5 to 17 Years | 0 (0.0%) | 0 (0.0%) |
| 18 to 34 Years | 8 (1.5%) | 7 (1.2%) |
| 35 to 64 Years | 94 (9.0%) | 70 (6.7%) |
| 65 to 74 Years | 31 (8.1%) | 15 (4.6%) |
| 75 Years and over | 148 (67.9%) | 192 (66.0%) |
Disability Class by Sex by Age in Carson County
Disability Class: Hearing Difficulty
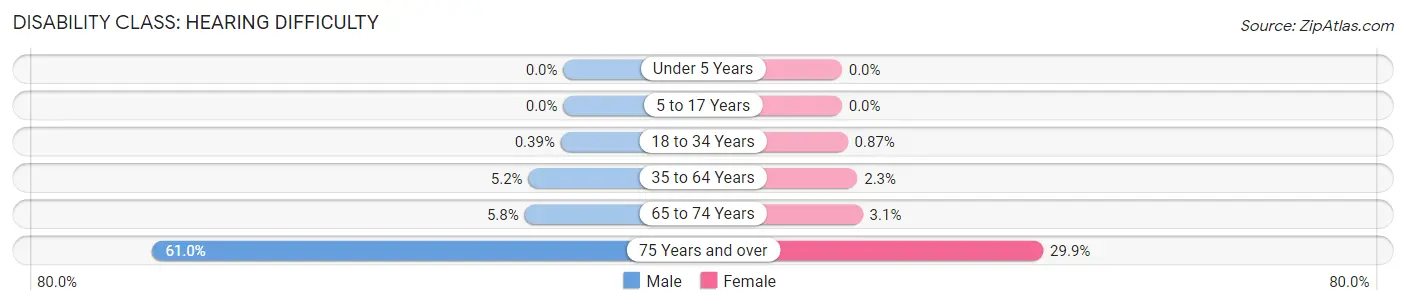
| Age Bracket | Male | Female |
| Under 5 Years | 0 (0.0%) | 0 (0.0%) |
| 5 to 17 Years | 0 (0.0%) | 0 (0.0%) |
| 18 to 34 Years | 2 (0.4%) | 5 (0.9%) |
| 35 to 64 Years | 54 (5.2%) | 24 (2.3%) |
| 65 to 74 Years | 22 (5.8%) | 10 (3.1%) |
| 75 Years and over | 133 (61.0%) | 87 (29.9%) |
Disability Class: Vision Difficulty
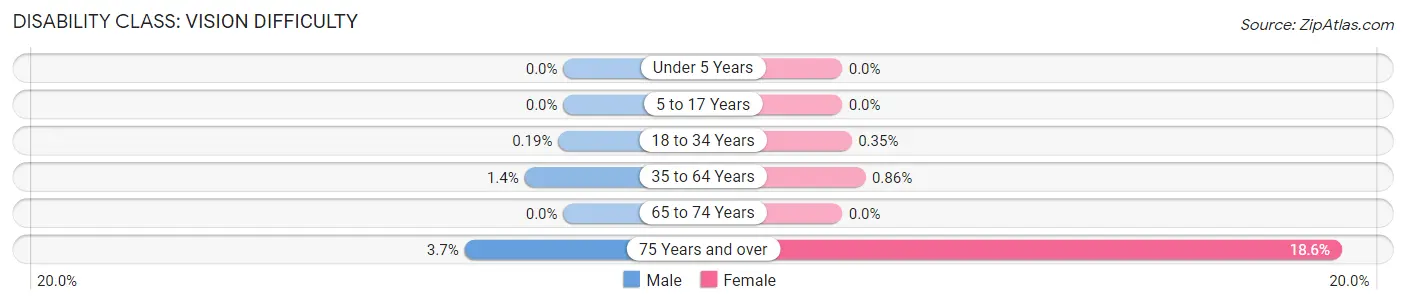
| Age Bracket | Male | Female |
| Under 5 Years | 0 (0.0%) | 0 (0.0%) |
| 5 to 17 Years | 0 (0.0%) | 0 (0.0%) |
| 18 to 34 Years | 1 (0.2%) | 2 (0.4%) |
| 35 to 64 Years | 15 (1.4%) | 9 (0.9%) |
| 65 to 74 Years | 0 (0.0%) | 0 (0.0%) |
| 75 Years and over | 8 (3.7%) | 54 (18.6%) |
Disability Class: Cognitive Difficulty

| Age Bracket | Male | Female |
| 5 to 17 Years | 0 (0.0%) | 0 (0.0%) |
| 18 to 34 Years | 7 (1.4%) | 2 (0.4%) |
| 35 to 64 Years | 13 (1.3%) | 13 (1.3%) |
| 65 to 74 Years | 3 (0.8%) | 0 (0.0%) |
| 75 Years and over | 35 (16.1%) | 62 (21.3%) |
Disability Class: Ambulatory Difficulty
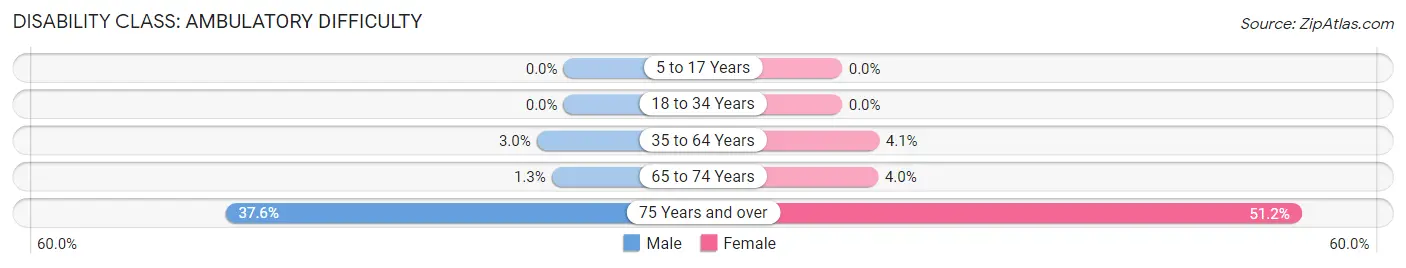
| Age Bracket | Male | Female |
| 5 to 17 Years | 0 (0.0%) | 0 (0.0%) |
| 18 to 34 Years | 0 (0.0%) | 0 (0.0%) |
| 35 to 64 Years | 31 (3.0%) | 43 (4.1%) |
| 65 to 74 Years | 5 (1.3%) | 13 (4.0%) |
| 75 Years and over | 82 (37.6%) | 149 (51.2%) |
Disability Class: Self-Care Difficulty
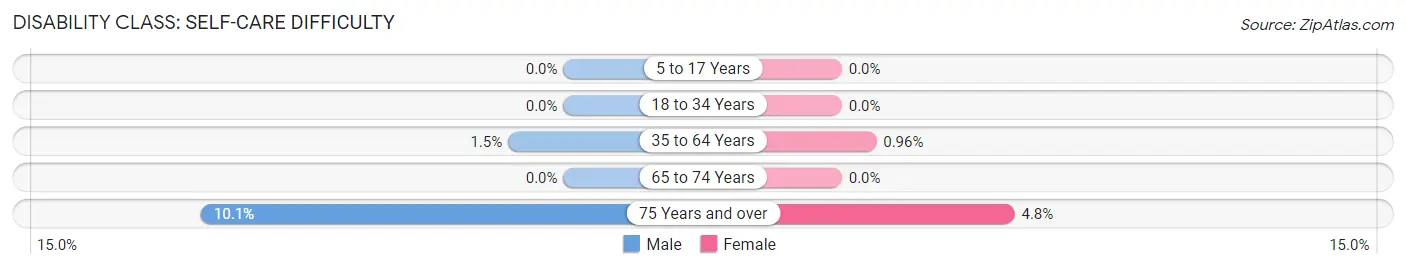
| Age Bracket | Male | Female |
| 5 to 17 Years | 0 (0.0%) | 0 (0.0%) |
| 18 to 34 Years | 0 (0.0%) | 0 (0.0%) |
| 35 to 64 Years | 16 (1.5%) | 10 (1.0%) |
| 65 to 74 Years | 0 (0.0%) | 0 (0.0%) |
| 75 Years and over | 22 (10.1%) | 14 (4.8%) |
Technology Access in Carson County
Computing Device Access in Carson County
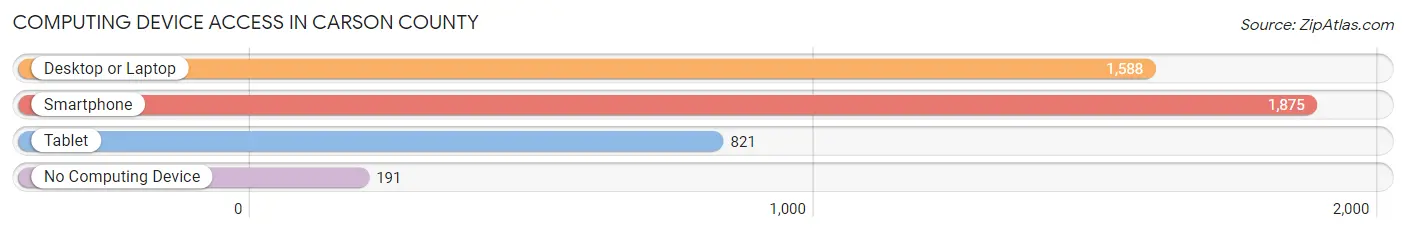
| Device Type | # Households | % Households |
| Desktop or Laptop | 1,588 | 70.3% |
| Smartphone | 1,875 | 83.0% |
| Tablet | 821 | 36.3% |
| No Computing Device | 191 | 8.5% |
| Total | 2,260 | 100.0% |
Internet Access in Carson County
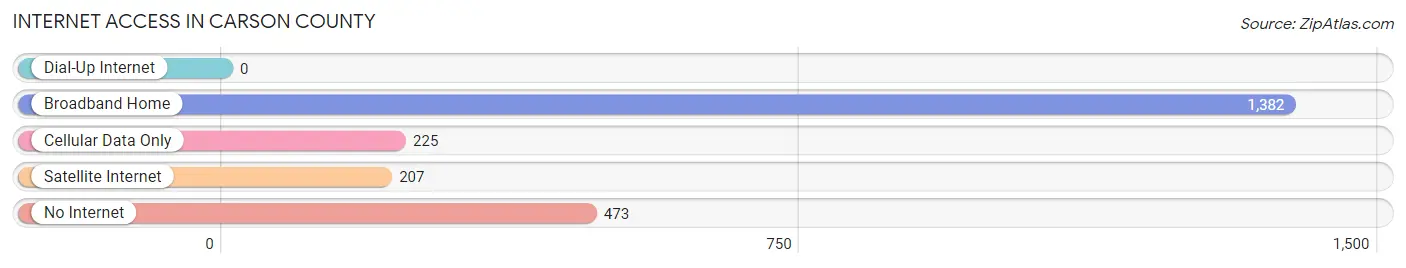
| Internet Type | # Households | % Households |
| Dial-Up Internet | 0 | 0.0% |
| Broadband Home | 1,382 | 61.2% |
| Cellular Data Only | 225 | 10.0% |
| Satellite Internet | 207 | 9.2% |
| No Internet | 473 | 20.9% |
| Total | 2,260 | 100.0% |
Carson County Summary
Carson County is located in the Texas Panhandle, in the northern part of the state. It is bordered by Hutchinson County to the north, Moore County to the east, Potter County to the south, and Deaf Smith County to the west. The county seat is Panhandle, and the largest city is White Deer.
History
Carson County was established in 1876, and was named for Samuel Price Carson, a Texas politician and soldier. The county was originally part of Bexar County, and was later part of the Young County. In 1876, the Texas legislature created Carson County from parts of Bexar and Young counties.
The first settlers in the area were ranchers, who were attracted by the abundance of grass and water. The first town in the county was Panhandle, which was established in 1887. The town was named for the nearby Panhandle of Texas, which is the northernmost part of the state.
The county was largely agricultural until the early 20th century, when oil was discovered in the area. The discovery of oil led to an economic boom in the county, and the population grew rapidly. The county seat was moved from Panhandle to White Deer in 1921.
Geography
Carson County is located in the Texas Panhandle, in the northern part of the state. It is bordered by Hutchinson County to the north, Moore County to the east, Potter County to the south, and Deaf Smith County to the west. The county covers an area of 902 square miles, and is mostly flat, with some rolling hills.
The county is drained by the Canadian River, which flows through the western part of the county. The county is also home to several small lakes, including Lake Meredith, Lake McClellan, and Lake White Deer.
Economy
Agriculture is the main economic activity in Carson County. The county is home to a large number of cattle ranches, and is one of the top producers of beef in the state. Other agricultural products include wheat, sorghum, hay, and cotton.
Oil and gas production is also an important part of the economy. The county is home to several oil and gas fields, and is one of the top producers of oil and gas in the state.
Demographics
As of the 2010 census, the population of Carson County was 6,182. The racial makeup of the county was 84.3% White, 0.7% African American, 0.7% Native American, 0.3% Asian, 11.7% from other races, and 2.1% from two or more races. Hispanic or Latino of any race were 22.2% of the population.
The median household income in the county was $41,944, and the median family income was $48,958. The per capita income was $19,945. About 14.2% of the population was below the poverty line.
Common Questions
What is Per Capita Income in Carson County?
Per Capita income in Carson County is $40,192.
What is the Median Family Income in Carson County?
Median Family Income in Carson County is $107,885.
What is the Median Household income in Carson County?
Median Household Income in Carson County is $83,199.
What is Income or Wage Gap in Carson County?
Income or Wage Gap in Carson County is 48.7%.
Women in Carson County earn 51.3 cents for every dollar earned by a man.
What is Inequality or Gini Index in Carson County?
Inequality or Gini Index in Carson County is 0.39.
What is the Total Population of Carson County?
Total Population of Carson County is 5,801.
What is the Total Male Population of Carson County?
Total Male Population of Carson County is 2,890.
What is the Total Female Population of Carson County?
Total Female Population of Carson County is 2,911.
What is the Ratio of Males per 100 Females in Carson County?
There are 99.28 Males per 100 Females in Carson County.
What is the Ratio of Females per 100 Males in Carson County?
There are 100.73 Females per 100 Males in Carson County.
What is the Median Population Age in Carson County?
Median Population Age in Carson County is 41.3 Years.
What is the Average Family Size in Carson County
Average Family Size in Carson County is 3.2 People.
What is the Average Household Size in Carson County
Average Household Size in Carson County is 2.5 People.
How Large is the Labor Force in Carson County?
There are 2,887 People in the Labor Forcein in Carson County.
What is the Percentage of People in the Labor Force in Carson County?
62.3% of People are in the Labor Force in Carson County.
What is the Unemployment Rate in Carson County?
Unemployment Rate in Carson County is 1.9%.