Camp County, TX Map & Demographics
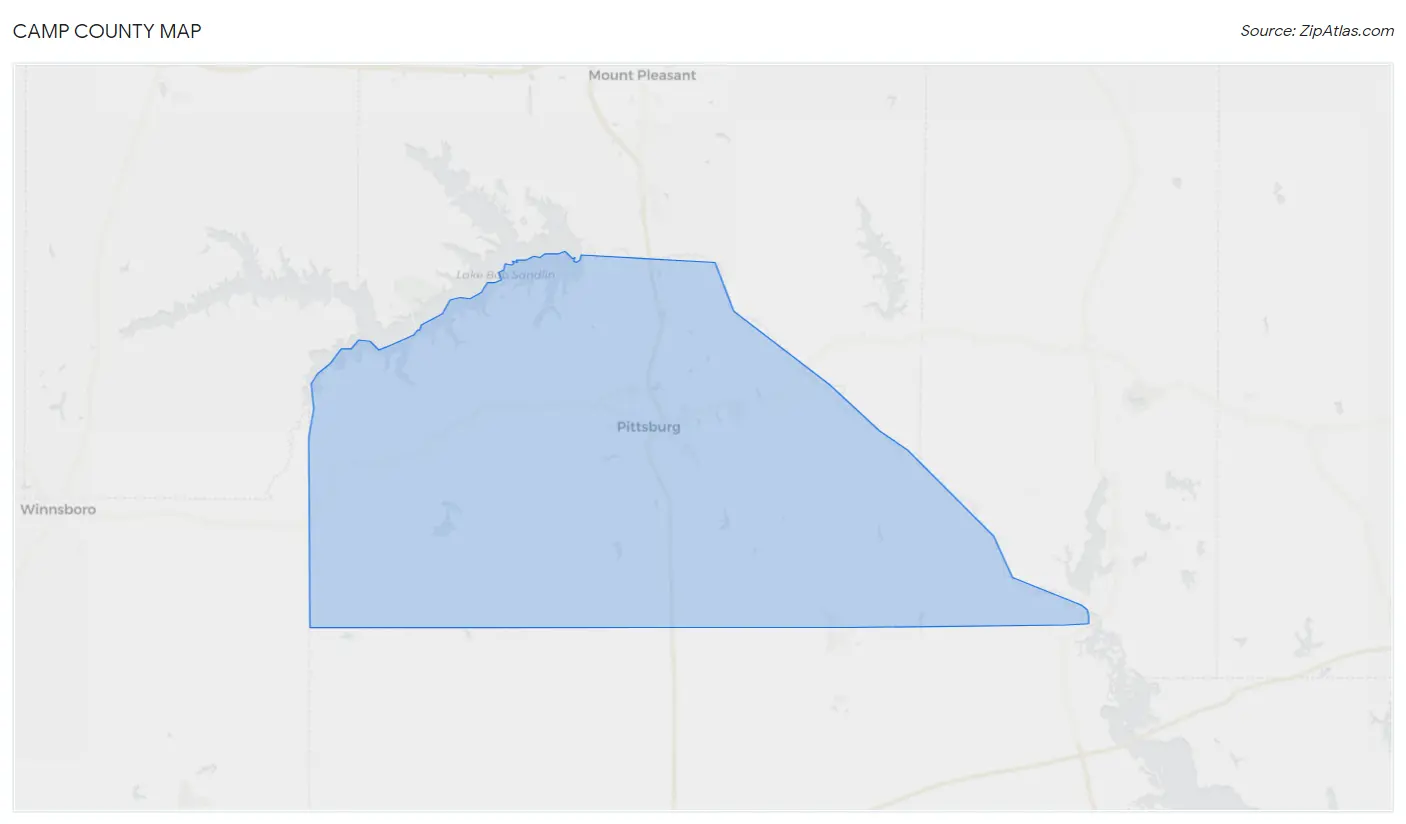
Camp County Map
Camp County Overview
$28,004
PER CAPITA INCOME
$63,868
AVG FAMILY INCOME
$53,968
AVG HOUSEHOLD INCOME
50.8%
WAGE / INCOME GAP [ % ]
49.2¢/ $1
WAGE / INCOME GAP [ $ ]
$9,463
FAMILY INCOME DEFICIT
0.48
INEQUALITY / GINI INDEX
12,543
TOTAL POPULATION
6,007
MALE POPULATION
6,536
FEMALE POPULATION
91.91
MALES / 100 FEMALES
108.81
FEMALES / 100 MALES
39.0
MEDIAN AGE
3.4
AVG FAMILY SIZE
2.8
AVG HOUSEHOLD SIZE
5,513
LABOR FORCE [ PEOPLE ]
57.6%
PERCENT IN LABOR FORCE
5.4%
UNEMPLOYMENT RATE
Camp County Area Codes
Income in Camp County
Income Overview in Camp County
Per Capita Income in Camp County is $28,004, while median incomes of families and households are $63,868 and $53,968 respectively.
| Characteristic | Number | Measure |
| Per Capita Income | 12,543 | $28,004 |
| Median Family Income | 3,114 | $63,868 |
| Mean Family Income | 3,114 | $88,444 |
| Median Household Income | 4,443 | $53,968 |
| Mean Household Income | 4,443 | $75,130 |
| Income Deficit | 3,114 | $9,463 |
| Wage / Income Gap (%) | 12,543 | 50.79% |
| Wage / Income Gap ($) | 12,543 | 49.21¢ per $1 |
| Gini / Inequality Index | 12,543 | 0.48 |
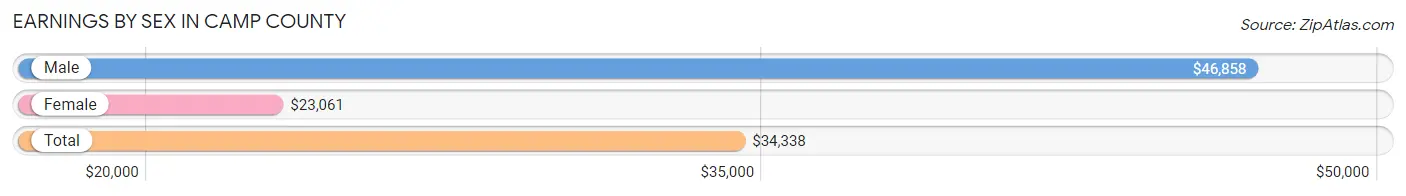
Earnings by Sex in Camp County
Average Earnings in Camp County are $34,338, $46,858 for men and $23,061 for women, a difference of 50.8%.
| Sex | Number | Average Earnings |
| Male | 2,868 (50.2%) | $46,858 |
| Female | 2,844 (49.8%) | $23,061 |
| Total | 5,712 (100.0%) | $34,338 |
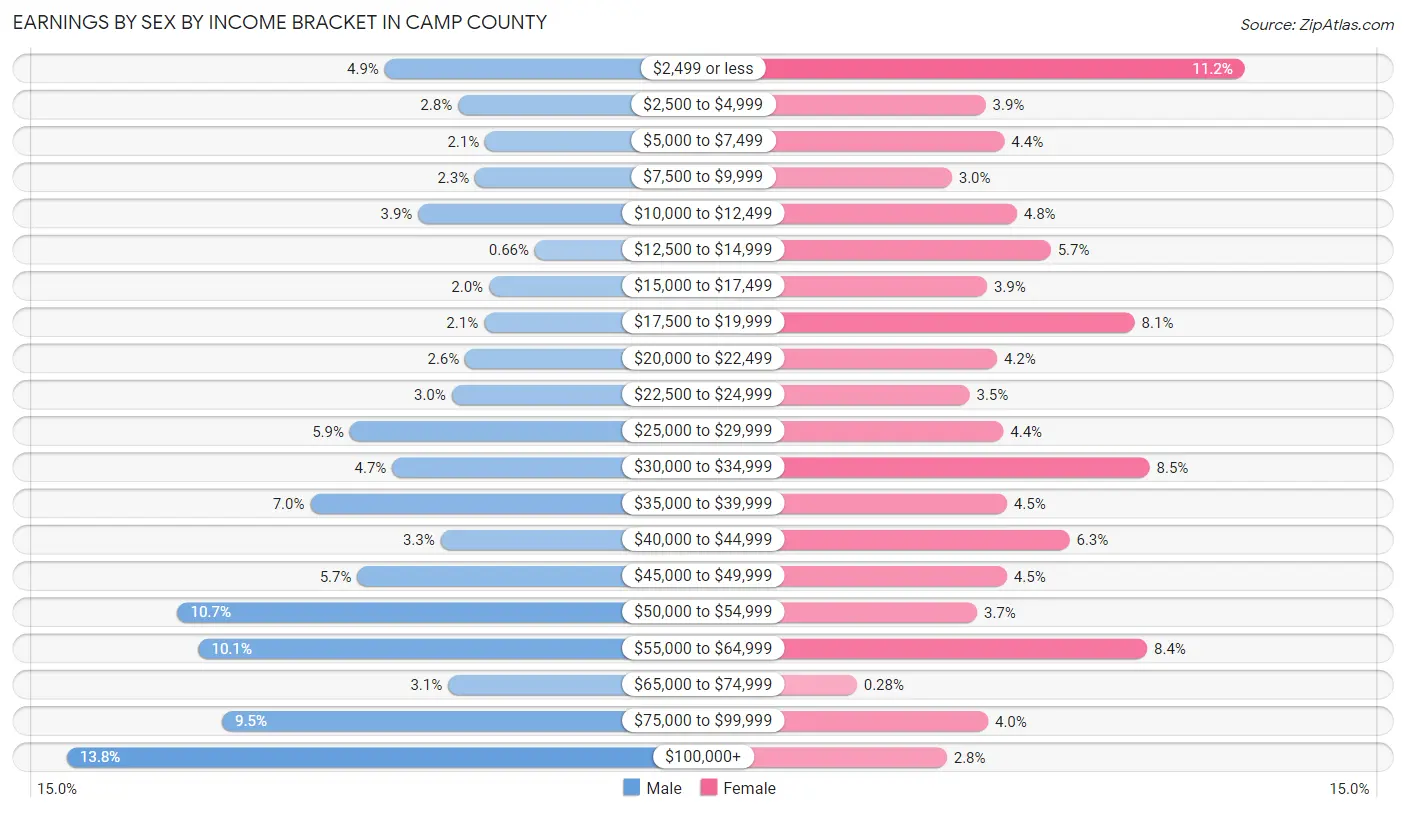
Earnings by Sex by Income Bracket in Camp County
The most common earnings brackets in Camp County are $100,000+ for men (396 | 13.8%) and $2,499 or less for women (318 | 11.2%).
| Income | Male | Female |
| $2,499 or less | 140 (4.9%) | 318 (11.2%) |
| $2,500 to $4,999 | 81 (2.8%) | 111 (3.9%) |
| $5,000 to $7,499 | 59 (2.1%) | 126 (4.4%) |
| $7,500 to $9,999 | 67 (2.3%) | 84 (2.9%) |
| $10,000 to $12,499 | 113 (3.9%) | 136 (4.8%) |
| $12,500 to $14,999 | 19 (0.7%) | 163 (5.7%) |
| $15,000 to $17,499 | 56 (1.9%) | 112 (3.9%) |
| $17,500 to $19,999 | 60 (2.1%) | 230 (8.1%) |
| $20,000 to $22,499 | 75 (2.6%) | 120 (4.2%) |
| $22,500 to $24,999 | 86 (3.0%) | 98 (3.5%) |
| $25,000 to $29,999 | 168 (5.9%) | 125 (4.4%) |
| $30,000 to $34,999 | 134 (4.7%) | 242 (8.5%) |
| $35,000 to $39,999 | 200 (7.0%) | 128 (4.5%) |
| $40,000 to $44,999 | 95 (3.3%) | 178 (6.3%) |
| $45,000 to $49,999 | 162 (5.7%) | 128 (4.5%) |
| $50,000 to $54,999 | 307 (10.7%) | 104 (3.7%) |
| $55,000 to $64,999 | 290 (10.1%) | 240 (8.4%) |
| $65,000 to $74,999 | 89 (3.1%) | 8 (0.3%) |
| $75,000 to $99,999 | 271 (9.5%) | 113 (4.0%) |
| $100,000+ | 396 (13.8%) | 80 (2.8%) |
| Total | 2,868 (100.0%) | 2,844 (100.0%) |
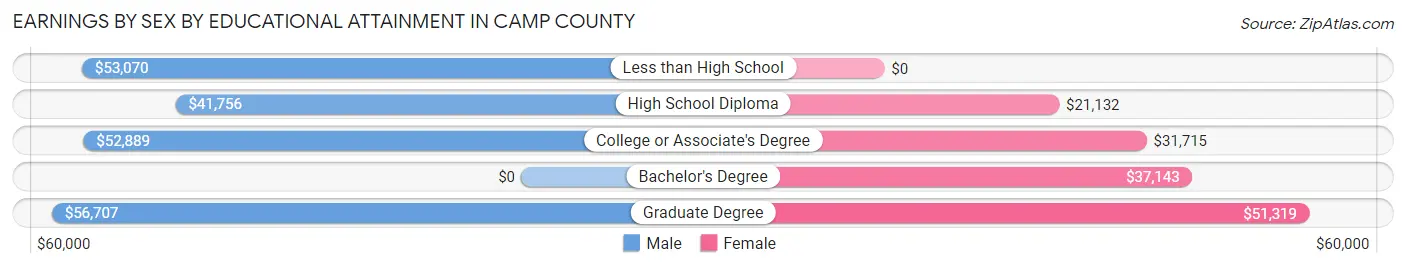
Earnings by Sex by Educational Attainment in Camp County
Average earnings in Camp County are $52,490 for men and $28,079 for women, a difference of 46.5%. Men with an educational attainment of graduate degree enjoy the highest average annual earnings of $56,707, while those with high school diploma education earn the least with $41,756. Women with an educational attainment of graduate degree earn the most with the average annual earnings of $51,319, while those with high school diploma education have the smallest earnings of $21,132.
| Educational Attainment | Male Income | Female Income |
| Less than High School | $53,070 | $0 |
| High School Diploma | $41,756 | $21,132 |
| College or Associate's Degree | $52,889 | $31,715 |
| Bachelor's Degree | - | - |
| Graduate Degree | $56,707 | $51,319 |
| Total | $52,490 | $28,079 |
Family Income in Camp County
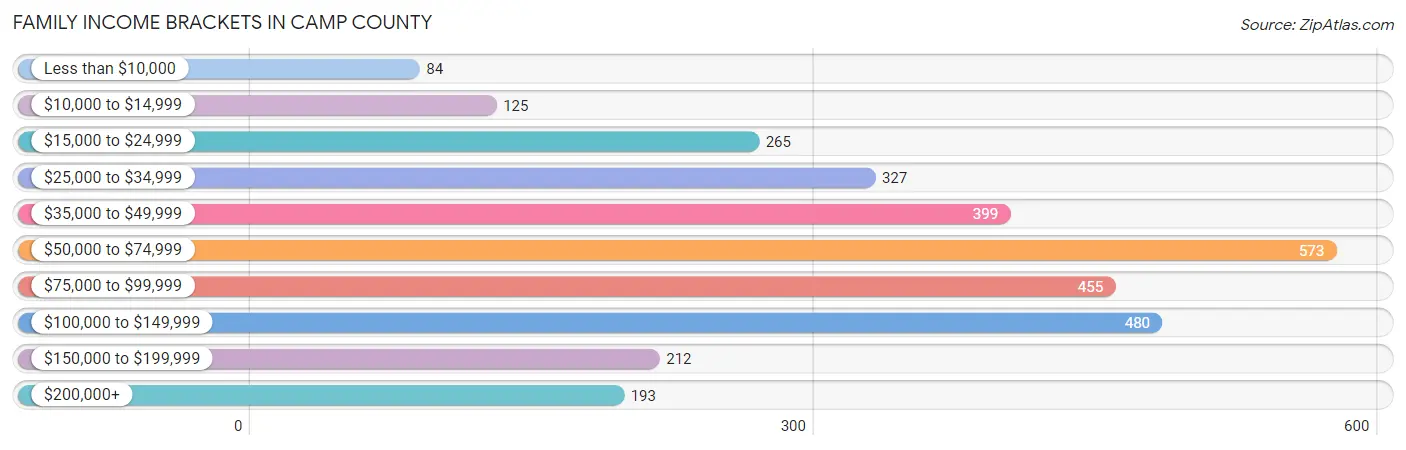
Family Income Brackets in Camp County
According to the Camp County family income data, there are 573 families falling into the $50,000 to $74,999 income range, which is the most common income bracket and makes up 18.4% of all families. Conversely, the less than $10,000 income bracket is the least frequent group with only 84 families (2.7%) belonging to this category.
| Income Bracket | # Families | % Families |
| Less than $10,000 | 84 | 2.7% |
| $10,000 to $14,999 | 125 | 4.0% |
| $15,000 to $24,999 | 265 | 8.5% |
| $25,000 to $34,999 | 327 | 10.5% |
| $35,000 to $49,999 | 399 | 12.8% |
| $50,000 to $74,999 | 573 | 18.4% |
| $75,000 to $99,999 | 455 | 14.6% |
| $100,000 to $149,999 | 480 | 15.4% |
| $150,000 to $199,999 | 212 | 6.8% |
| $200,000+ | 193 | 6.2% |
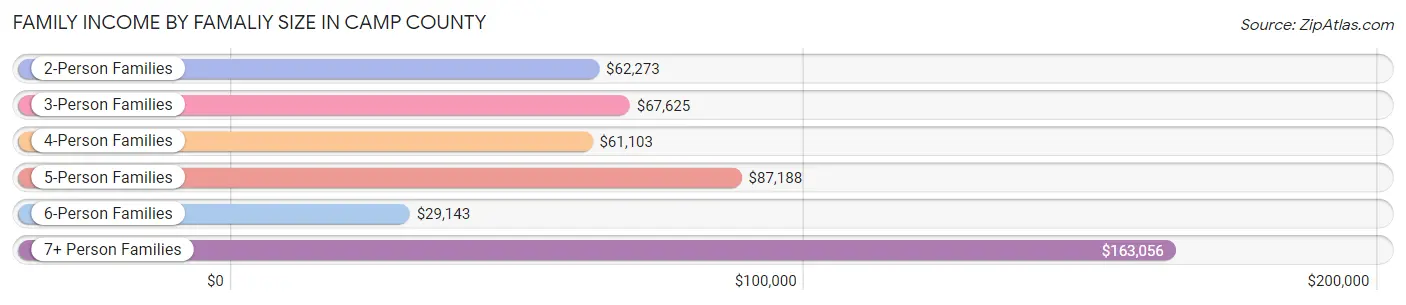
Family Income by Famaliy Size in Camp County
7+ person families (148 | 4.8%) account for the highest median family income in Camp County with $163,056 per family, while 2-person families (1,646 | 52.9%) have the highest median income of $31,136 per family member.
| Income Bracket | # Families | Median Income |
| 2-Person Families | 1,646 (52.9%) | $62,273 |
| 3-Person Families | 499 (16.0%) | $67,625 |
| 4-Person Families | 535 (17.2%) | $61,103 |
| 5-Person Families | 180 (5.8%) | $87,188 |
| 6-Person Families | 106 (3.4%) | $29,143 |
| 7+ Person Families | 148 (4.8%) | $163,056 |
| Total | 3,114 (100.0%) | $63,868 |
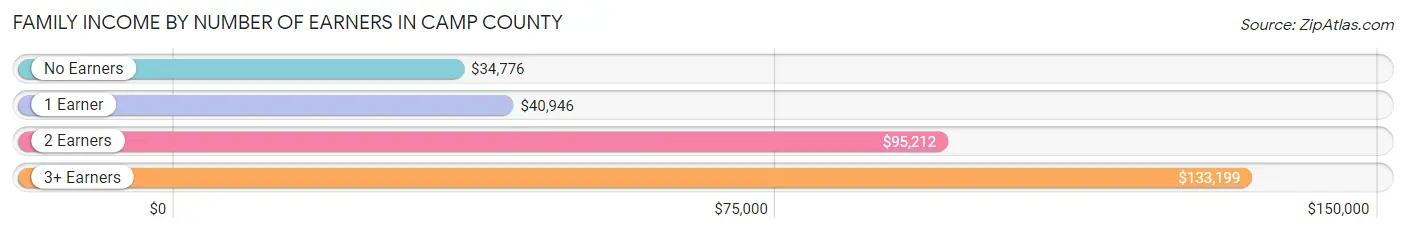
Family Income by Number of Earners in Camp County
The median family income in Camp County is $63,868, with families comprising 3+ earners (307) having the highest median family income of $133,199, while families with no earners (565) have the lowest median family income of $34,776, accounting for 9.9% and 18.1% of families, respectively.
| Number of Earners | # Families | Median Income |
| No Earners | 565 (18.1%) | $34,776 |
| 1 Earner | 1,048 (33.7%) | $40,946 |
| 2 Earners | 1,194 (38.3%) | $95,212 |
| 3+ Earners | 307 (9.9%) | $133,199 |
| Total | 3,114 (100.0%) | $63,868 |
Household Income in Camp County
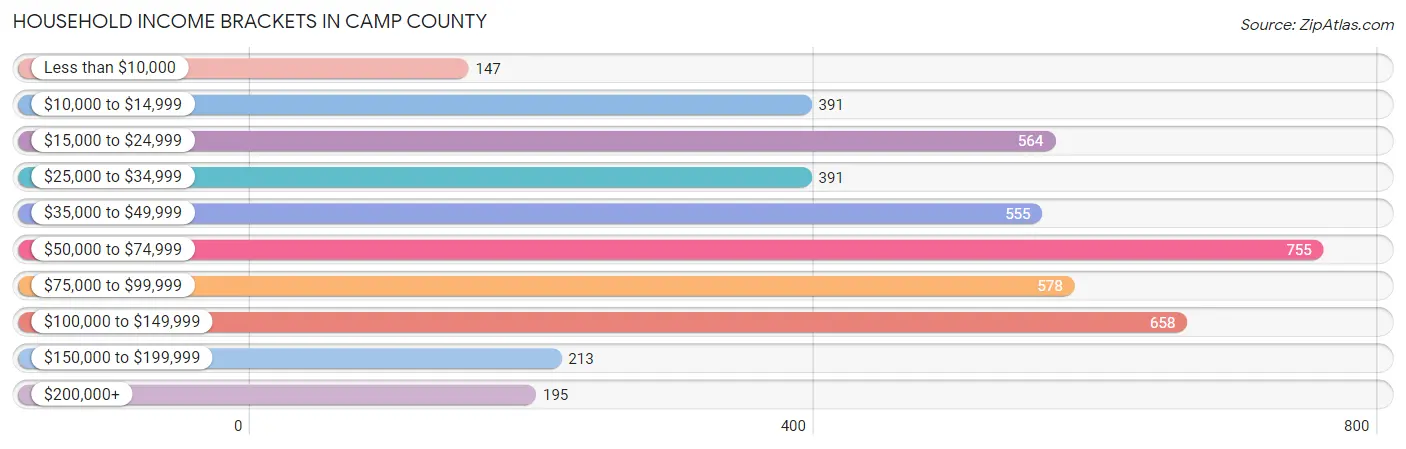
Household Income Brackets in Camp County
With 755 households falling in the category, the $50,000 to $74,999 income range is the most frequent in Camp County, accounting for 17.0% of all households. In contrast, only 147 households (3.3%) fall into the less than $10,000 income bracket, making it the least populous group.
| Income Bracket | # Households | % Households |
| Less than $10,000 | 147 | 3.3% |
| $10,000 to $14,999 | 391 | 8.8% |
| $15,000 to $24,999 | 564 | 12.7% |
| $25,000 to $34,999 | 391 | 8.8% |
| $35,000 to $49,999 | 555 | 12.5% |
| $50,000 to $74,999 | 755 | 17.0% |
| $75,000 to $99,999 | 578 | 13.0% |
| $100,000 to $149,999 | 658 | 14.8% |
| $150,000 to $199,999 | 213 | 4.8% |
| $200,000+ | 195 | 4.4% |
Household Income by Householder Age in Camp County
The median household income in Camp County is $53,968, with the highest median household income of $70,625 found in the 45 to 64 years age bracket for the primary householder. A total of 1,537 households (34.6%) fall into this category. Meanwhile, the 15 to 24 years age bracket for the primary householder has the lowest median household income of $0, with 68 households (1.5%) in this group.
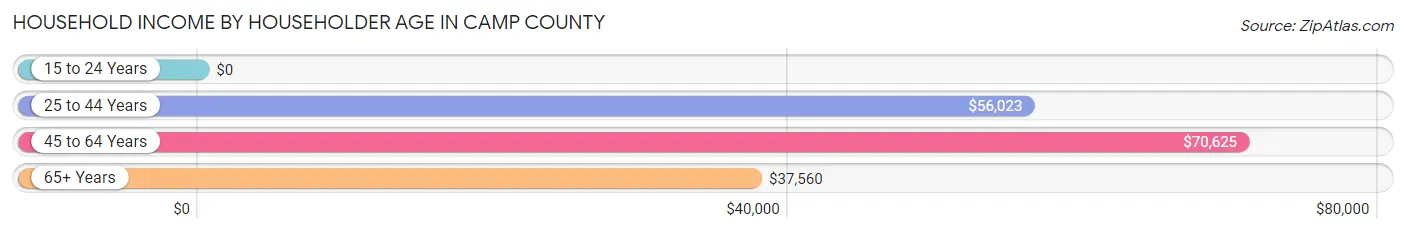
| Income Bracket | # Households | Median Income |
| 15 to 24 Years | 68 (1.5%) | $0 |
| 25 to 44 Years | 1,427 (32.1%) | $56,023 |
| 45 to 64 Years | 1,537 (34.6%) | $70,625 |
| 65+ Years | 1,411 (31.8%) | $37,560 |
| Total | 4,443 (100.0%) | $53,968 |
Poverty in Camp County
Income Below Poverty by Sex and Age in Camp County
With 17.8% poverty level for males and 25.0% for females among the residents of Camp County, under 5 year old males and 15 year old females are the most vulnerable to poverty, with 228 males (56.4%) and 115 females (54.0%) in their respective age groups living below the poverty level.
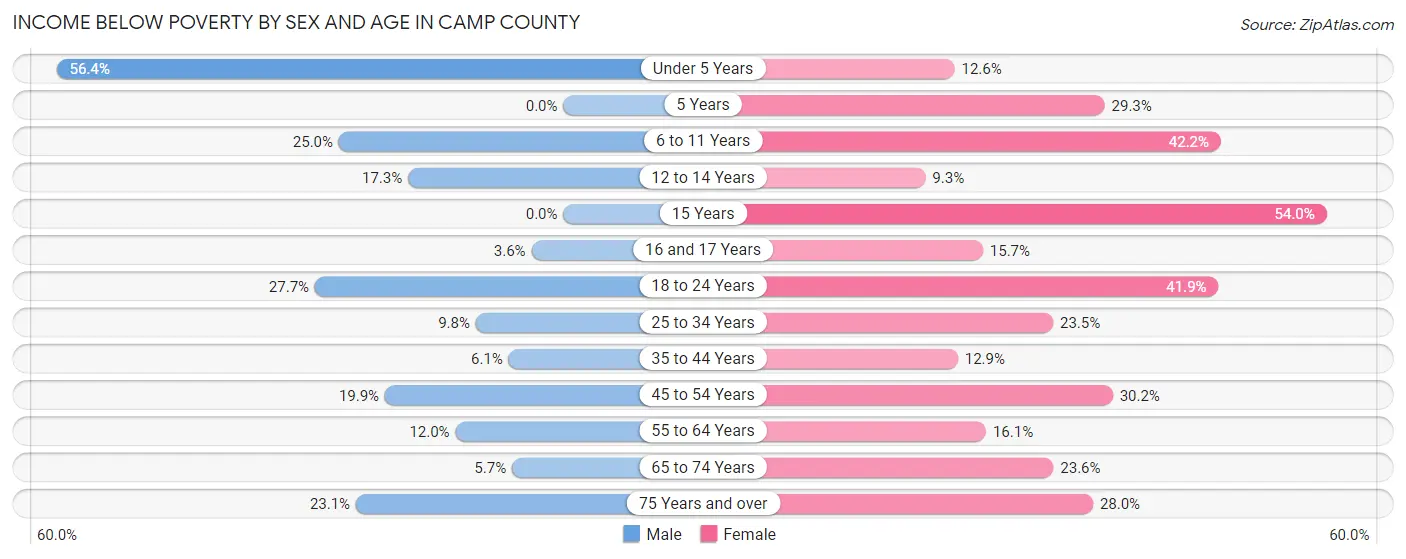
| Age Bracket | Male | Female |
| Under 5 Years | 228 (56.4%) | 52 (12.6%) |
| 5 Years | 0 (0.0%) | 36 (29.3%) |
| 6 to 11 Years | 152 (25.0%) | 222 (42.2%) |
| 12 to 14 Years | 59 (17.3%) | 27 (9.3%) |
| 15 Years | 0 (0.0%) | 115 (54.0%) |
| 16 and 17 Years | 7 (3.5%) | 22 (15.7%) |
| 18 to 24 Years | 163 (27.7%) | 190 (41.9%) |
| 25 to 34 Years | 59 (9.8%) | 192 (23.5%) |
| 35 to 44 Years | 44 (6.1%) | 89 (12.9%) |
| 45 to 54 Years | 125 (19.9%) | 245 (30.2%) |
| 55 to 64 Years | 91 (12.0%) | 137 (16.1%) |
| 65 to 74 Years | 37 (5.7%) | 168 (23.6%) |
| 75 Years and over | 97 (23.1%) | 132 (28.0%) |
| Total | 1,062 (17.8%) | 1,627 (25.0%) |
Income Above Poverty by Sex and Age in Camp County
According to the poverty statistics in Camp County, males aged 5 years and females aged 12 to 14 years are the age groups that are most secure financially, with 100.0% of males and 90.7% of females in these age groups living above the poverty line.
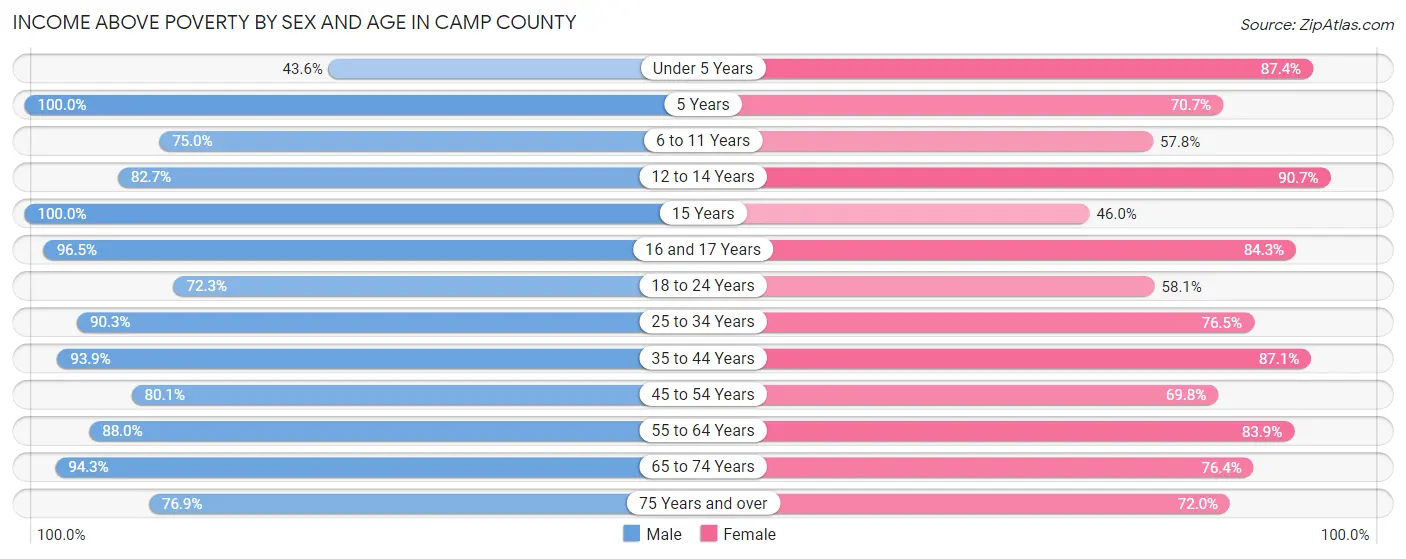
| Age Bracket | Male | Female |
| Under 5 Years | 176 (43.6%) | 362 (87.4%) |
| 5 Years | 44 (100.0%) | 87 (70.7%) |
| 6 to 11 Years | 456 (75.0%) | 304 (57.8%) |
| 12 to 14 Years | 282 (82.7%) | 263 (90.7%) |
| 15 Years | 9 (100.0%) | 98 (46.0%) |
| 16 and 17 Years | 190 (96.5%) | 118 (84.3%) |
| 18 to 24 Years | 426 (72.3%) | 263 (58.1%) |
| 25 to 34 Years | 546 (90.2%) | 624 (76.5%) |
| 35 to 44 Years | 679 (93.9%) | 600 (87.1%) |
| 45 to 54 Years | 504 (80.1%) | 567 (69.8%) |
| 55 to 64 Years | 666 (88.0%) | 716 (83.9%) |
| 65 to 74 Years | 610 (94.3%) | 545 (76.4%) |
| 75 Years and over | 323 (76.9%) | 340 (72.0%) |
| Total | 4,911 (82.2%) | 4,887 (75.0%) |
Income Below Poverty Among Married-Couple Families in Camp County
The poverty statistics for married-couple families in Camp County show that 10.7% or 236 of the total 2,200 families live below the poverty line. Families with 3 or 4 children have the highest poverty rate of 34.9%, comprising of 88 families. On the other hand, families with 5 or more children have the lowest poverty rate of 0.0%, which includes 0 families.
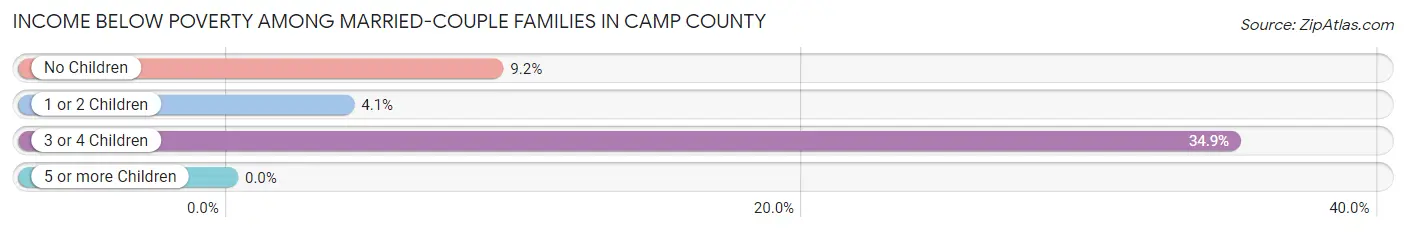
| Children | Above Poverty | Below Poverty |
| No Children | 1,238 (90.8%) | 126 (9.2%) |
| 1 or 2 Children | 521 (96.0%) | 22 (4.1%) |
| 3 or 4 Children | 164 (65.1%) | 88 (34.9%) |
| 5 or more Children | 41 (100.0%) | 0 (0.0%) |
| Total | 1,964 (89.3%) | 236 (10.7%) |
Income Below Poverty Among Single-Parent Households in Camp County
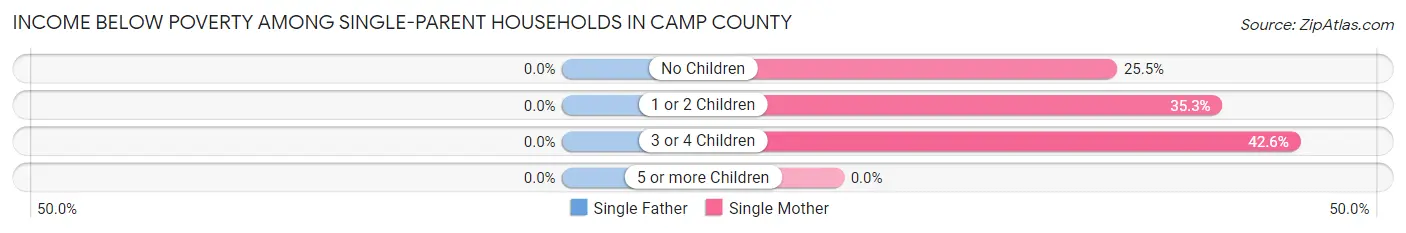
| Children | Single Father | Single Mother |
| No Children | 0 (0.0%) | 57 (25.5%) |
| 1 or 2 Children | 0 (0.0%) | 146 (35.3%) |
| 3 or 4 Children | 0 (0.0%) | 40 (42.5%) |
| 5 or more Children | 0 (0.0%) | 0 (0.0%) |
| Total | 0 (0.0%) | 243 (33.2%) |
Income Below Poverty Among Married-Couple vs Single-Parent Households in Camp County
The poverty data for Camp County shows that 236 of the married-couple family households (10.7%) and 243 of the single-parent households (26.6%) are living below the poverty level. Within the married-couple family households, those with 3 or 4 children have the highest poverty rate, with 88 households (34.9%) falling below the poverty line. Among the single-parent households, those with 3 or 4 children have the highest poverty rate, with 40 household (42.5%) living below poverty.
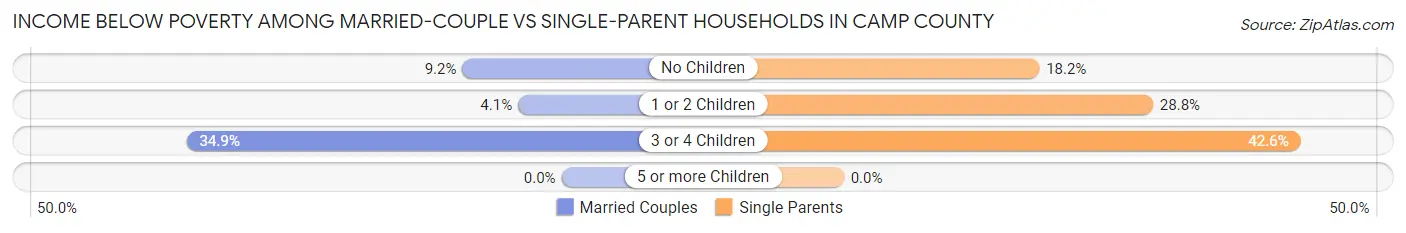
| Children | Married-Couple Families | Single-Parent Households |
| No Children | 126 (9.2%) | 57 (18.2%) |
| 1 or 2 Children | 22 (4.1%) | 146 (28.8%) |
| 3 or 4 Children | 88 (34.9%) | 40 (42.5%) |
| 5 or more Children | 0 (0.0%) | 0 (0.0%) |
| Total | 236 (10.7%) | 243 (26.6%) |
Race in Camp County
The most populous races in Camp County are White / Caucasian (8,194 | 65.3%), Hispanic or Latino (3,357 | 26.8%), and Black / African American (1,884 | 15.0%).
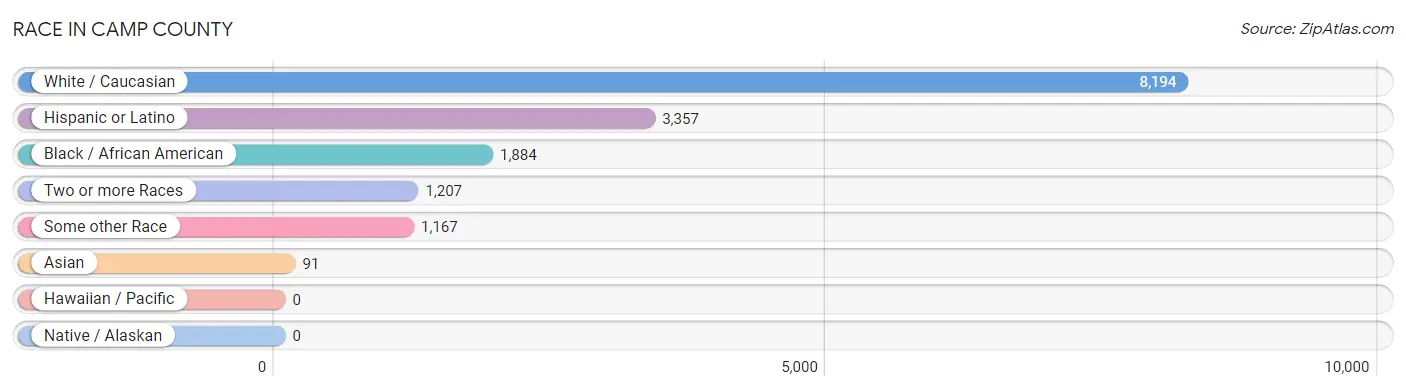
| Race | # Population | % Population |
| Asian | 91 | 0.7% |
| Black / African American | 1,884 | 15.0% |
| Hawaiian / Pacific | 0 | 0.0% |
| Hispanic or Latino | 3,357 | 26.8% |
| Native / Alaskan | 0 | 0.0% |
| White / Caucasian | 8,194 | 65.3% |
| Two or more Races | 1,207 | 9.6% |
| Some other Race | 1,167 | 9.3% |
| Total | 12,543 | 100.0% |
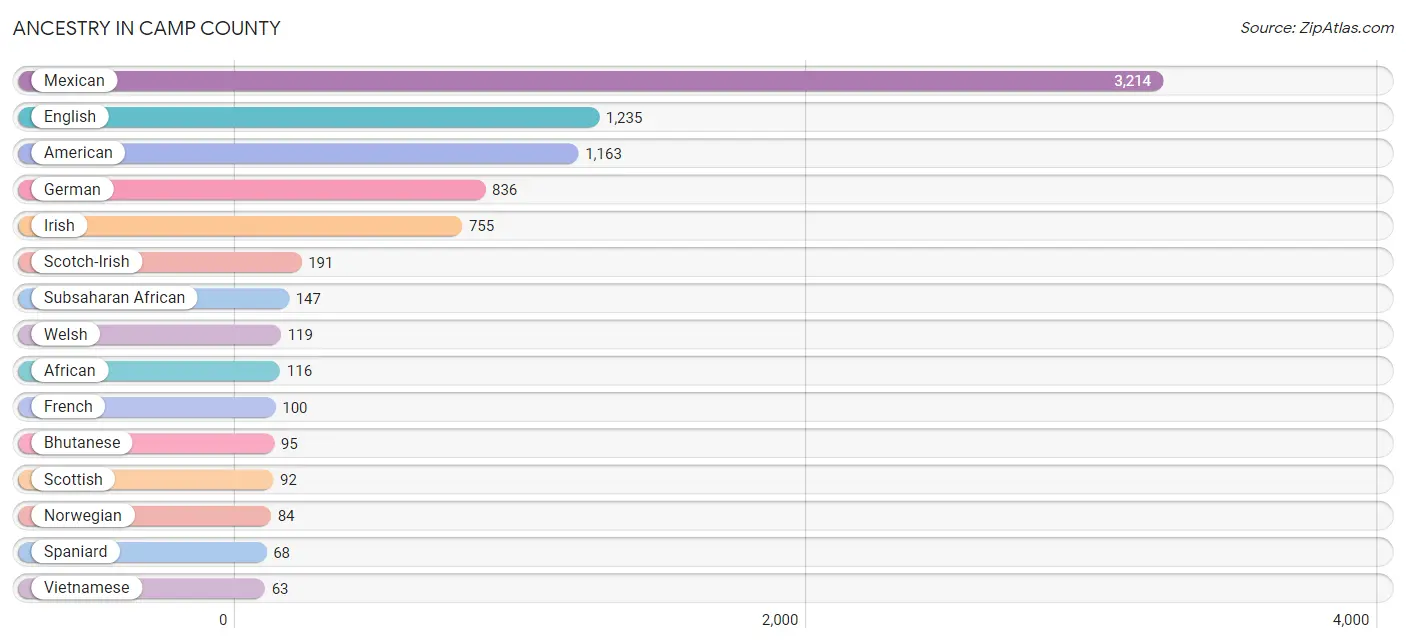
Ancestry in Camp County
The most populous ancestries reported in Camp County are Mexican (3,214 | 25.6%), English (1,235 | 9.9%), American (1,163 | 9.3%), German (836 | 6.7%), and Irish (755 | 6.0%), together accounting for 57.4% of all Camp County residents.
| Ancestry | # Population | % Population |
| African | 116 | 0.9% |
| American | 1,163 | 9.3% |
| Apache | 29 | 0.2% |
| Bhutanese | 95 | 0.8% |
| Blackfeet | 26 | 0.2% |
| British | 18 | 0.1% |
| Cajun | 9 | 0.1% |
| Canadian | 22 | 0.2% |
| Cherokee | 51 | 0.4% |
| Choctaw | 47 | 0.4% |
| Czech | 1 | 0.0% |
| Danish | 16 | 0.1% |
| Dominican | 31 | 0.3% |
| Dutch | 48 | 0.4% |
| Dutch West Indian | 6 | 0.1% |
| Eastern European | 12 | 0.1% |
| English | 1,235 | 9.9% |
| European | 56 | 0.4% |
| French | 100 | 0.8% |
| German | 836 | 6.7% |
| Greek | 10 | 0.1% |
| Hungarian | 12 | 0.1% |
| Irish | 755 | 6.0% |
| Italian | 27 | 0.2% |
| Korean | 1 | 0.0% |
| Mexican | 3,214 | 25.6% |
| Mexican American Indian | 16 | 0.1% |
| Navajo | 5 | 0.0% |
| Nigerian | 31 | 0.3% |
| Norwegian | 84 | 0.7% |
| Polish | 22 | 0.2% |
| Portuguese | 8 | 0.1% |
| Puerto Rican | 4 | 0.0% |
| Scotch-Irish | 191 | 1.5% |
| Scottish | 92 | 0.7% |
| Seminole | 3 | 0.0% |
| Spaniard | 68 | 0.5% |
| Sri Lankan | 27 | 0.2% |
| Subsaharan African | 147 | 1.2% |
| Swiss | 9 | 0.1% |
| Ukrainian | 14 | 0.1% |
| Vietnamese | 63 | 0.5% |
| Welsh | 119 | 0.9% | View All 43 Rows |
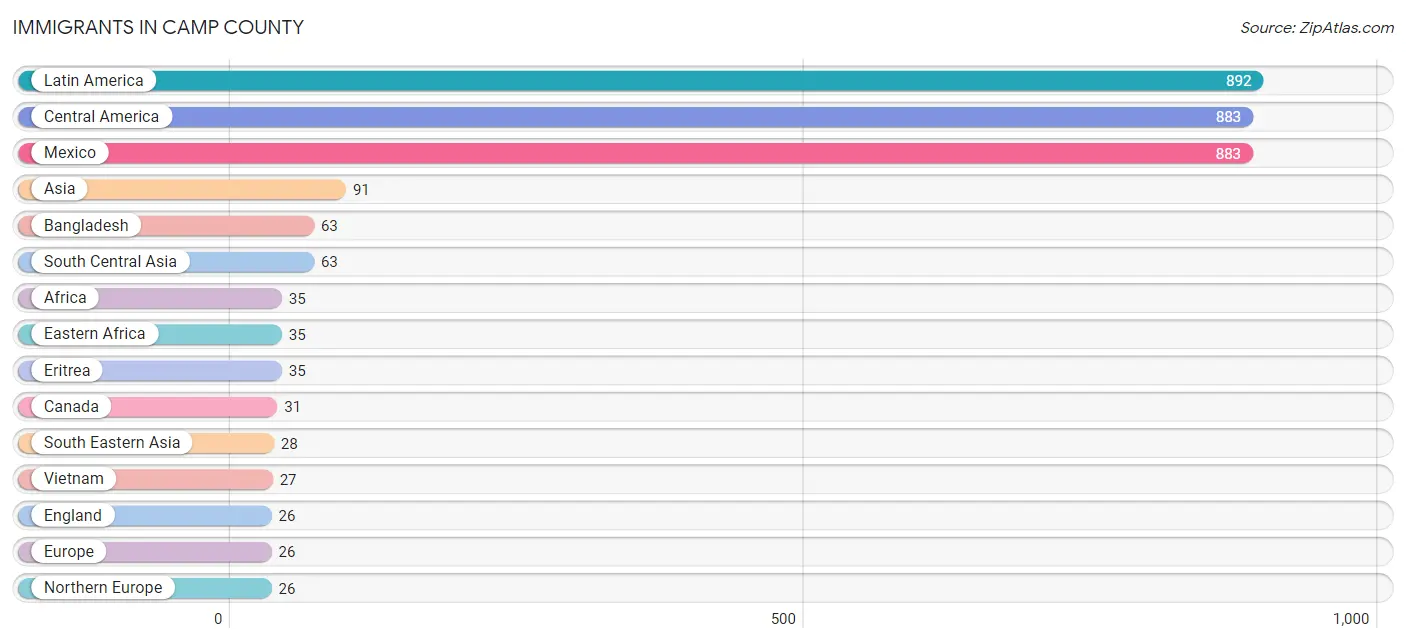
Immigrants in Camp County
The most numerous immigrant groups reported in Camp County came from Latin America (892 | 7.1%), Central America (883 | 7.0%), Mexico (883 | 7.0%), Asia (91 | 0.7%), and Bangladesh (63 | 0.5%), together accounting for 22.4% of all Camp County residents.
| Immigration Origin | # Population | % Population |
| Africa | 35 | 0.3% |
| Asia | 91 | 0.7% |
| Bangladesh | 63 | 0.5% |
| Canada | 31 | 0.3% |
| Caribbean | 9 | 0.1% |
| Central America | 883 | 7.0% |
| Dominican Republic | 9 | 0.1% |
| Eastern Africa | 35 | 0.3% |
| England | 26 | 0.2% |
| Eritrea | 35 | 0.3% |
| Europe | 26 | 0.2% |
| Latin America | 892 | 7.1% |
| Mexico | 883 | 7.0% |
| Northern Europe | 26 | 0.2% |
| Philippines | 1 | 0.0% |
| South Central Asia | 63 | 0.5% |
| South Eastern Asia | 28 | 0.2% |
| Vietnam | 27 | 0.2% | View All 18 Rows |
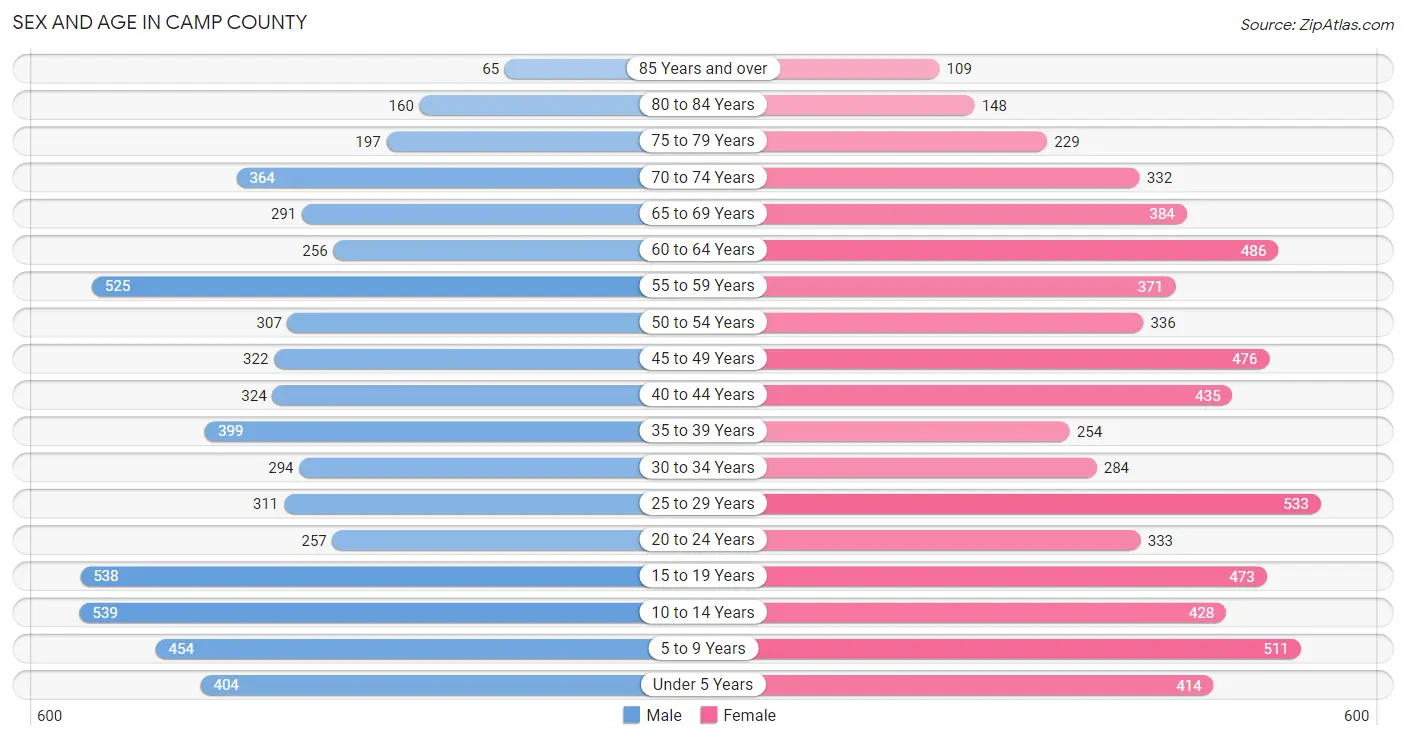
Sex and Age in Camp County
Sex and Age in Camp County
The most populous age groups in Camp County are 10 to 14 Years (539 | 9.0%) for men and 25 to 29 Years (533 | 8.2%) for women.
| Age Bracket | Male | Female |
| Under 5 Years | 404 (6.7%) | 414 (6.3%) |
| 5 to 9 Years | 454 (7.6%) | 511 (7.8%) |
| 10 to 14 Years | 539 (9.0%) | 428 (6.6%) |
| 15 to 19 Years | 538 (9.0%) | 473 (7.2%) |
| 20 to 24 Years | 257 (4.3%) | 333 (5.1%) |
| 25 to 29 Years | 311 (5.2%) | 533 (8.2%) |
| 30 to 34 Years | 294 (4.9%) | 284 (4.3%) |
| 35 to 39 Years | 399 (6.6%) | 254 (3.9%) |
| 40 to 44 Years | 324 (5.4%) | 435 (6.7%) |
| 45 to 49 Years | 322 (5.4%) | 476 (7.3%) |
| 50 to 54 Years | 307 (5.1%) | 336 (5.1%) |
| 55 to 59 Years | 525 (8.7%) | 371 (5.7%) |
| 60 to 64 Years | 256 (4.3%) | 486 (7.4%) |
| 65 to 69 Years | 291 (4.8%) | 384 (5.9%) |
| 70 to 74 Years | 364 (6.1%) | 332 (5.1%) |
| 75 to 79 Years | 197 (3.3%) | 229 (3.5%) |
| 80 to 84 Years | 160 (2.7%) | 148 (2.3%) |
| 85 Years and over | 65 (1.1%) | 109 (1.7%) |
| Total | 6,007 (100.0%) | 6,536 (100.0%) |
Families and Households in Camp County
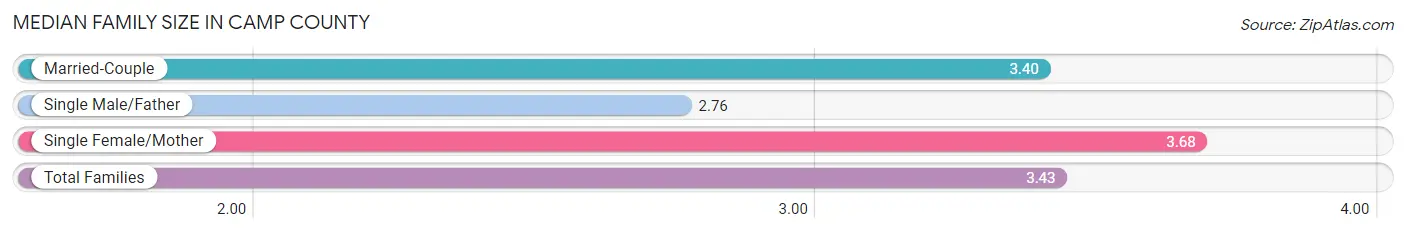
Median Family Size in Camp County
The median family size in Camp County is 3.43 persons per family, with single female/mother families (732 | 23.5%) accounting for the largest median family size of 3.68 persons per family. On the other hand, single male/father families (182 | 5.8%) represent the smallest median family size with 2.76 persons per family.
| Family Type | # Families | Family Size |
| Married-Couple | 2,200 (70.7%) | 3.40 |
| Single Male/Father | 182 (5.8%) | 2.76 |
| Single Female/Mother | 732 (23.5%) | 3.68 |
| Total Families | 3,114 (100.0%) | 3.43 |
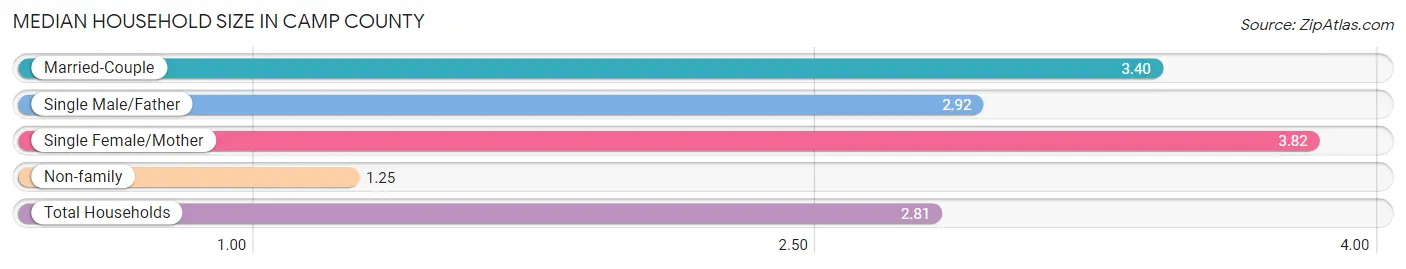
Median Household Size in Camp County
The median household size in Camp County is 2.81 persons per household, with single female/mother households (732 | 16.5%) accounting for the largest median household size of 3.82 persons per household. non-family households (1,329 | 29.9%) represent the smallest median household size with 1.25 persons per household.
| Household Type | # Households | Household Size |
| Married-Couple | 2,200 (49.5%) | 3.40 |
| Single Male/Father | 182 (4.1%) | 2.92 |
| Single Female/Mother | 732 (16.5%) | 3.82 |
| Non-family | 1,329 (29.9%) | 1.25 |
| Total Households | 4,443 (100.0%) | 2.81 |
Household Size by Marriage Status in Camp County
Out of a total of 4,443 households in Camp County, 3,114 (70.1%) are family households, while 1,329 (29.9%) are nonfamily households. The most numerous type of family households are 2-person households, comprising 1,530, and the most common type of nonfamily households are 1-person households, comprising 991.
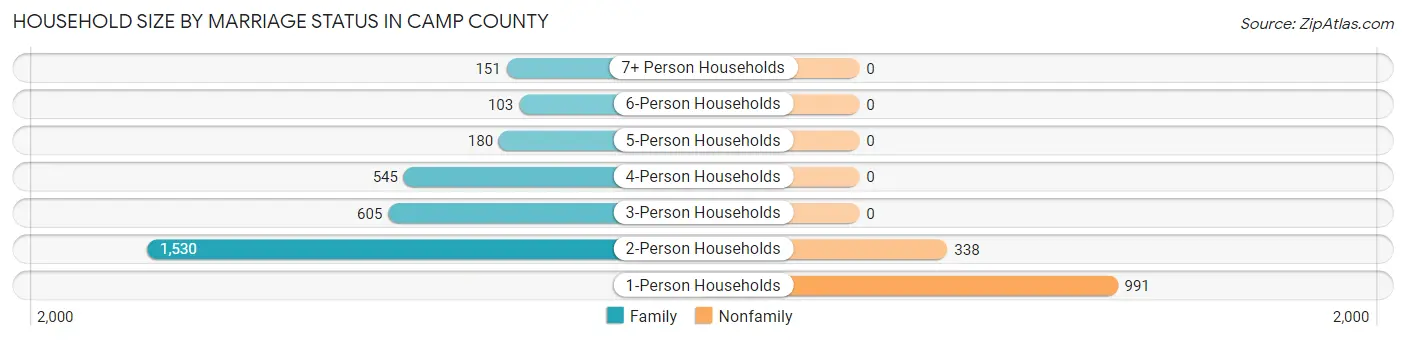
| Household Size | Family Households | Nonfamily Households |
| 1-Person Households | - | 991 (22.3%) |
| 2-Person Households | 1,530 (34.4%) | 338 (7.6%) |
| 3-Person Households | 605 (13.6%) | 0 (0.0%) |
| 4-Person Households | 545 (12.3%) | 0 (0.0%) |
| 5-Person Households | 180 (4.1%) | 0 (0.0%) |
| 6-Person Households | 103 (2.3%) | 0 (0.0%) |
| 7+ Person Households | 151 (3.4%) | 0 (0.0%) |
| Total | 3,114 (70.1%) | 1,329 (29.9%) |
Female Fertility in Camp County
Fertility by Age in Camp County
Average fertility rate in Camp County is 14.0 births per 1,000 women. Women in the age bracket of 20 to 34 years have the highest fertility rate with 35.0 births per 1,000 women. Women in the age bracket of 20 to 34 years acount for 100.0% of all women with births.
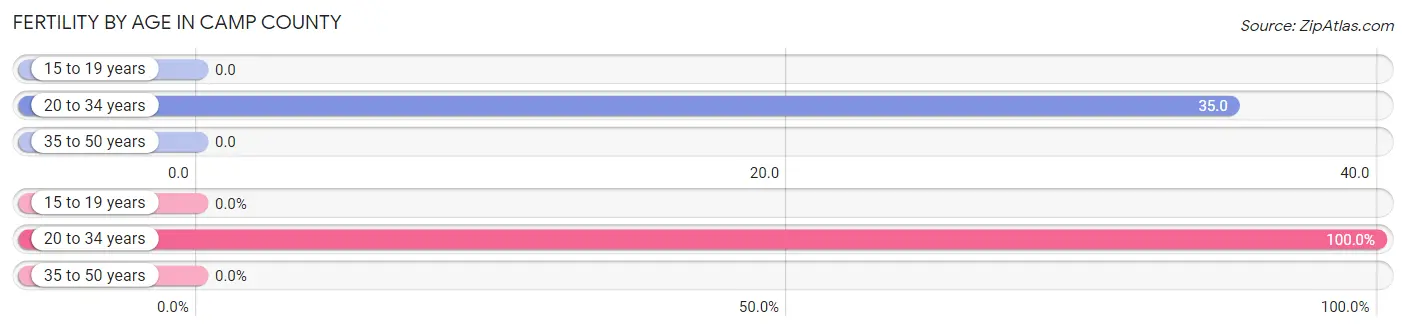
| Age Bracket | Women with Births | Births / 1,000 Women |
| 15 to 19 years | 0 (0.0%) | 0.0 |
| 20 to 34 years | 40 (100.0%) | 35.0 |
| 35 to 50 years | 0 (0.0%) | 0.0 |
| Total | 40 (100.0%) | 14.0 |
Fertility by Age by Marriage Status in Camp County
45.0% of women with births (40) in Camp County are married. The highest percentage of unmarried women with births falls into 20 to 34 years age bracket with 55.0% of them unmarried at the time of birth, while the lowest percentage of unmarried women with births belong to 20 to 34 years age bracket with 55.0% of them unmarried.
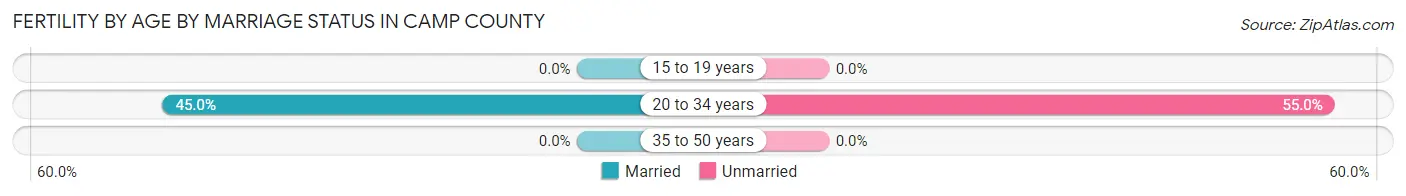
| Age Bracket | Married | Unmarried |
| 15 to 19 years | 0 (0.0%) | 0 (0.0%) |
| 20 to 34 years | 18 (45.0%) | 22 (55.0%) |
| 35 to 50 years | 0 (0.0%) | 0 (0.0%) |
| Total | 18 (45.0%) | 22 (55.0%) |
Fertility by Education in Camp County
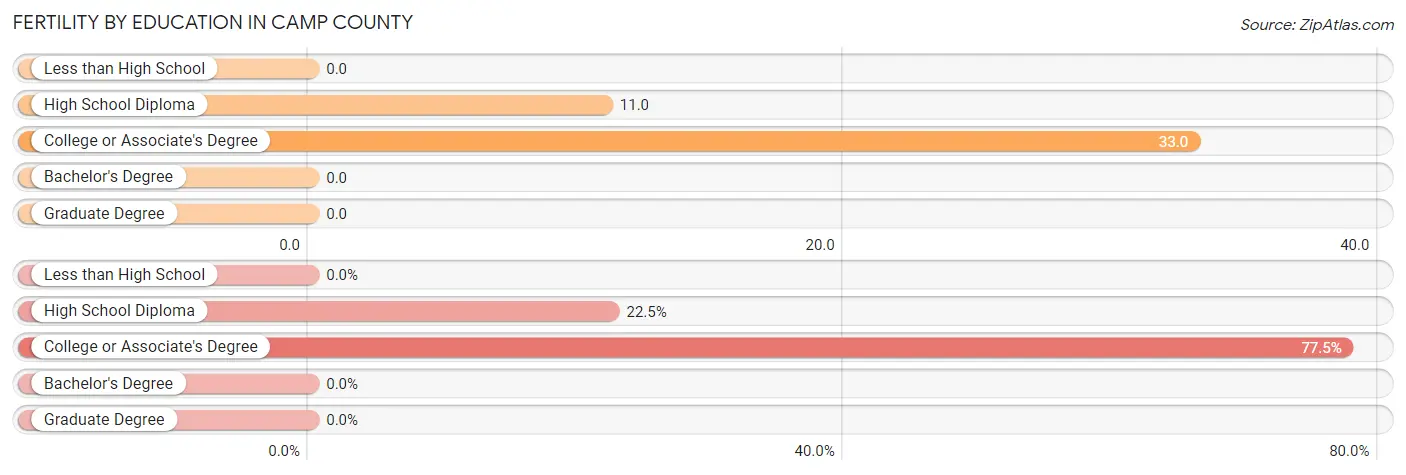
| Educational Attainment | Women with Births | Births / 1,000 Women |
| Less than High School | 0 (0.0%) | 0.0 |
| High School Diploma | 9 (22.5%) | 11.0 |
| College or Associate's Degree | 31 (77.5%) | 33.0 |
| Bachelor's Degree | 0 (0.0%) | 0.0 |
| Graduate Degree | 0 (0.0%) | 0.0 |
| Total | 40 (100.0%) | 14.0 |
Fertility by Education by Marriage Status in Camp County
55.0% of women with births in Camp County are unmarried. Women with the educational attainment of high school diploma are most likely to be married with 100.0% of them married at childbirth, while women with the educational attainment of college or associate's degree are least likely to be married with 71.0% of them unmarried at childbirth.
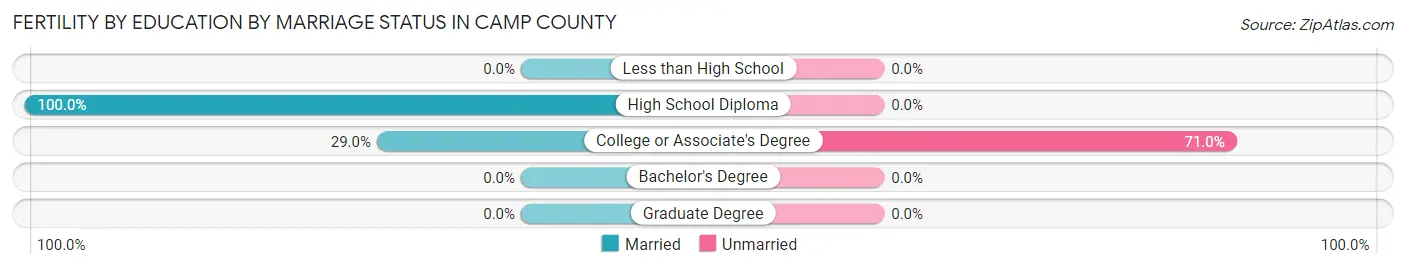
| Educational Attainment | Married | Unmarried |
| Less than High School | 0 (0.0%) | 0 (0.0%) |
| High School Diploma | 9 (100.0%) | 0 (0.0%) |
| College or Associate's Degree | 9 (29.0%) | 22 (71.0%) |
| Bachelor's Degree | 0 (0.0%) | 0 (0.0%) |
| Graduate Degree | 0 (0.0%) | 0 (0.0%) |
| Total | 18 (45.0%) | 22 (55.0%) |
Employment Characteristics in Camp County
Employment by Class of Employer in Camp County
Among the 5,171 employed individuals in Camp County, private company employees (3,744 | 72.4%), local government employees (448 | 8.7%), and self-employed (not incorporated) (355 | 6.9%) make up the most common classes of employment.
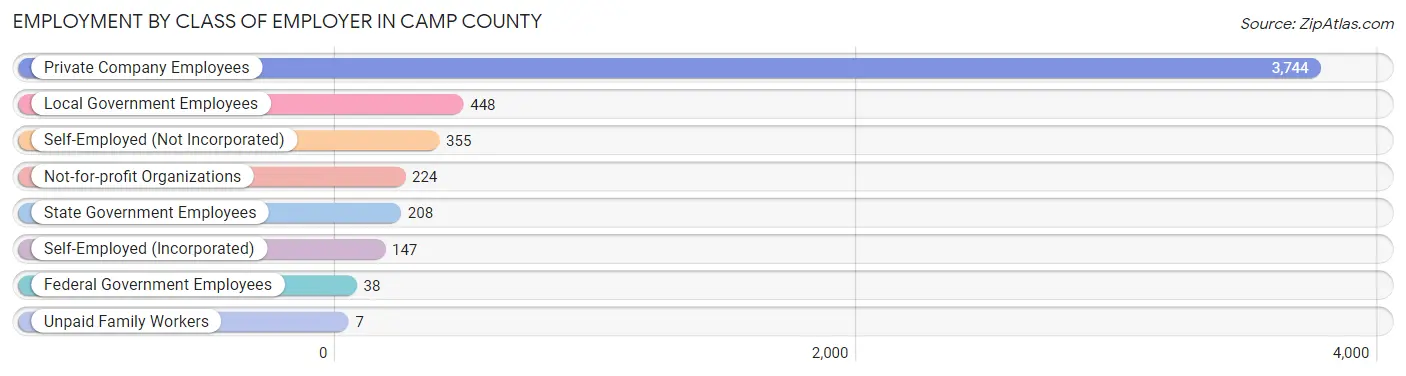
| Employer Class | # Employees | % Employees |
| Private Company Employees | 3,744 | 72.4% |
| Self-Employed (Incorporated) | 147 | 2.8% |
| Self-Employed (Not Incorporated) | 355 | 6.9% |
| Not-for-profit Organizations | 224 | 4.3% |
| Local Government Employees | 448 | 8.7% |
| State Government Employees | 208 | 4.0% |
| Federal Government Employees | 38 | 0.7% |
| Unpaid Family Workers | 7 | 0.1% |
| Total | 5,171 | 100.0% |
Employment Status by Age in Camp County
According to the labor force statistics for Camp County, out of the total population over 16 years of age (9,571), 57.6% or 5,513 individuals are in the labor force, with 5.4% or 298 of them unemployed. The age group with the highest labor force participation rate is 35 to 44 years, with 90.0% or 1,271 individuals in the labor force. Within the labor force, the 75 years and over age range has the highest percentage of unemployed individuals, with 18.4% or 7 of them being unemployed.
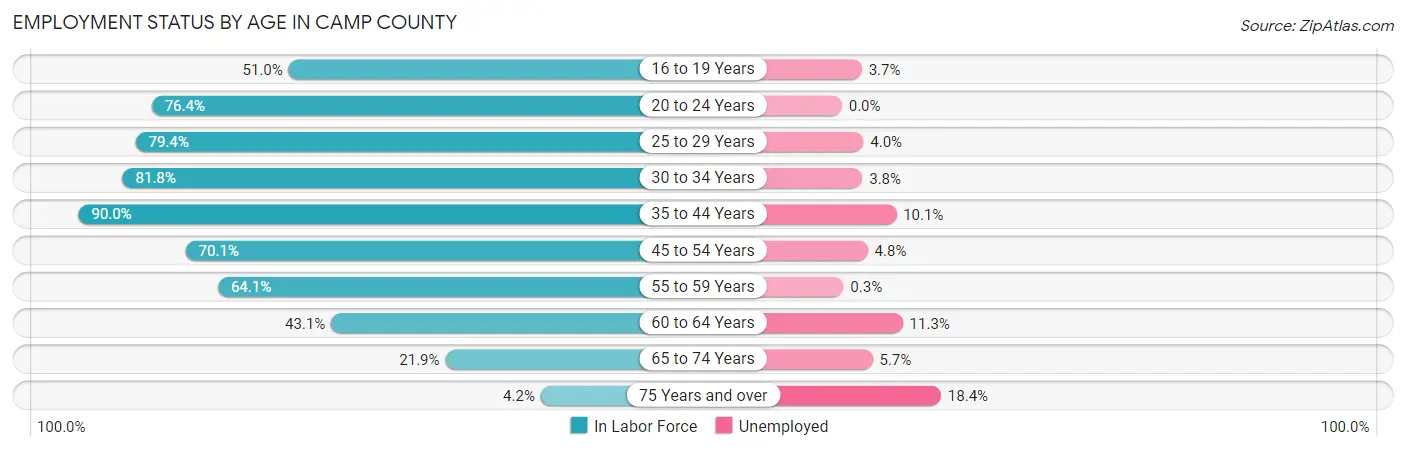
| Age Bracket | In Labor Force | Unemployed |
| 16 to 19 Years | 402 (51.0%) | 15 (3.7%) |
| 20 to 24 Years | 451 (76.4%) | 0 (0.0%) |
| 25 to 29 Years | 670 (79.4%) | 27 (4.0%) |
| 30 to 34 Years | 473 (81.8%) | 18 (3.8%) |
| 35 to 44 Years | 1,271 (90.0%) | 128 (10.1%) |
| 45 to 54 Years | 1,010 (70.1%) | 48 (4.8%) |
| 55 to 59 Years | 574 (64.1%) | 2 (0.3%) |
| 60 to 64 Years | 320 (43.1%) | 36 (11.3%) |
| 65 to 74 Years | 300 (21.9%) | 17 (5.7%) |
| 75 Years and over | 38 (4.2%) | 7 (18.4%) |
| Total | 5,513 (57.6%) | 298 (5.4%) |
Employment Status by Educational Attainment in Camp County
According to labor force statistics for Camp County, 73.0% of individuals (4,316) out of the total population between 25 and 64 years of age (5,913) are in the labor force, with 6.0% or 259 of them being unemployed. The group with the highest labor force participation rate are those with the educational attainment of bachelor's degree or higher, with 85.4% or 1,003 individuals in the labor force. Within the labor force, individuals with high school diploma education have the highest percentage of unemployment, with 8.1% or 122 of them being unemployed.
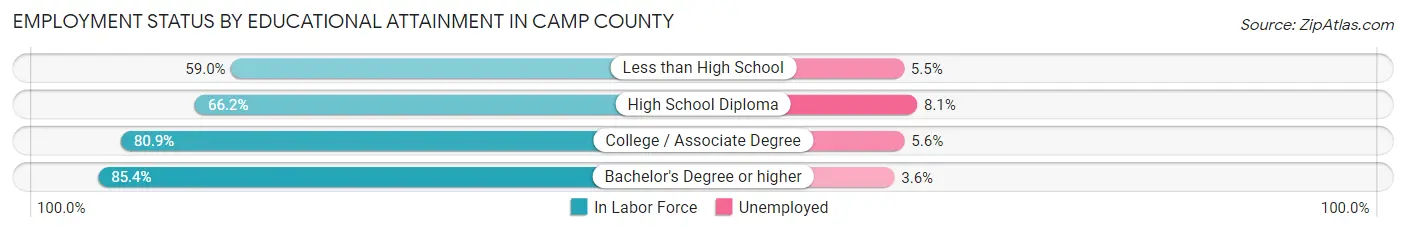
| Educational Attainment | In Labor Force | Unemployed |
| Less than High School | 494 (59.0%) | 46 (5.5%) |
| High School Diploma | 1,511 (66.2%) | 185 (8.1%) |
| College / Associate Degree | 1,310 (80.9%) | 91 (5.6%) |
| Bachelor's Degree or higher | 1,003 (85.4%) | 42 (3.6%) |
| Total | 4,316 (73.0%) | 355 (6.0%) |
Employment Occupations by Sex in Camp County
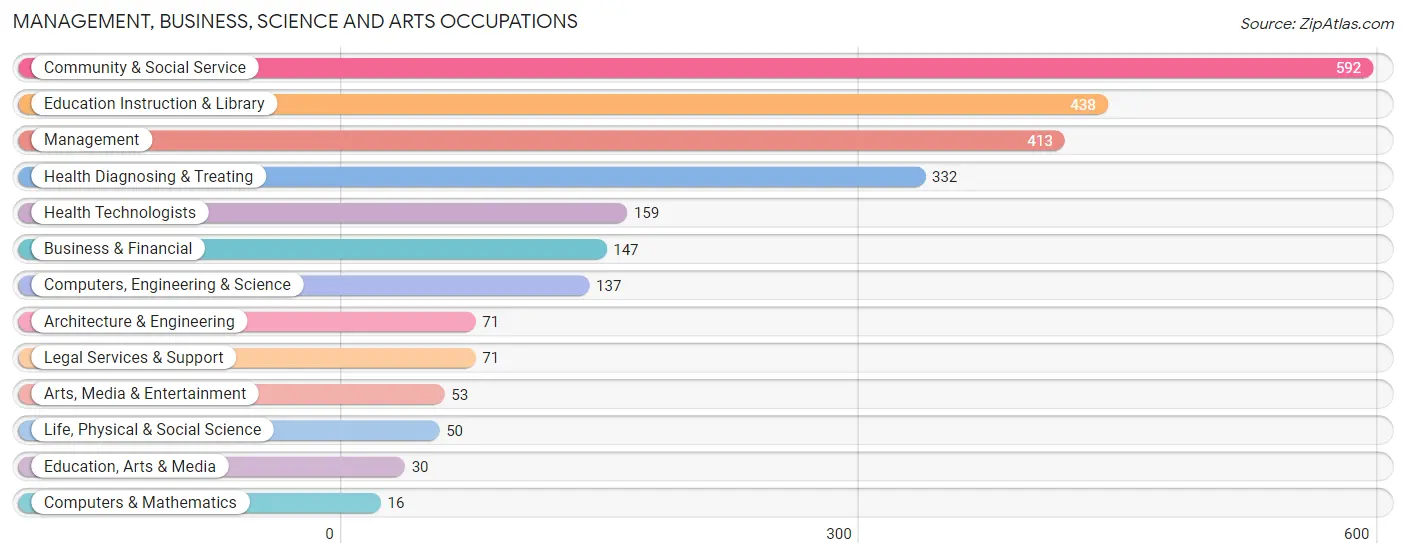
Management, Business, Science and Arts Occupations
The most common Management, Business, Science and Arts occupations in Camp County are Community & Social Service (592 | 11.4%), Education Instruction & Library (438 | 8.4%), Management (413 | 7.9%), Health Diagnosing & Treating (332 | 6.4%), and Health Technologists (159 | 3.0%).
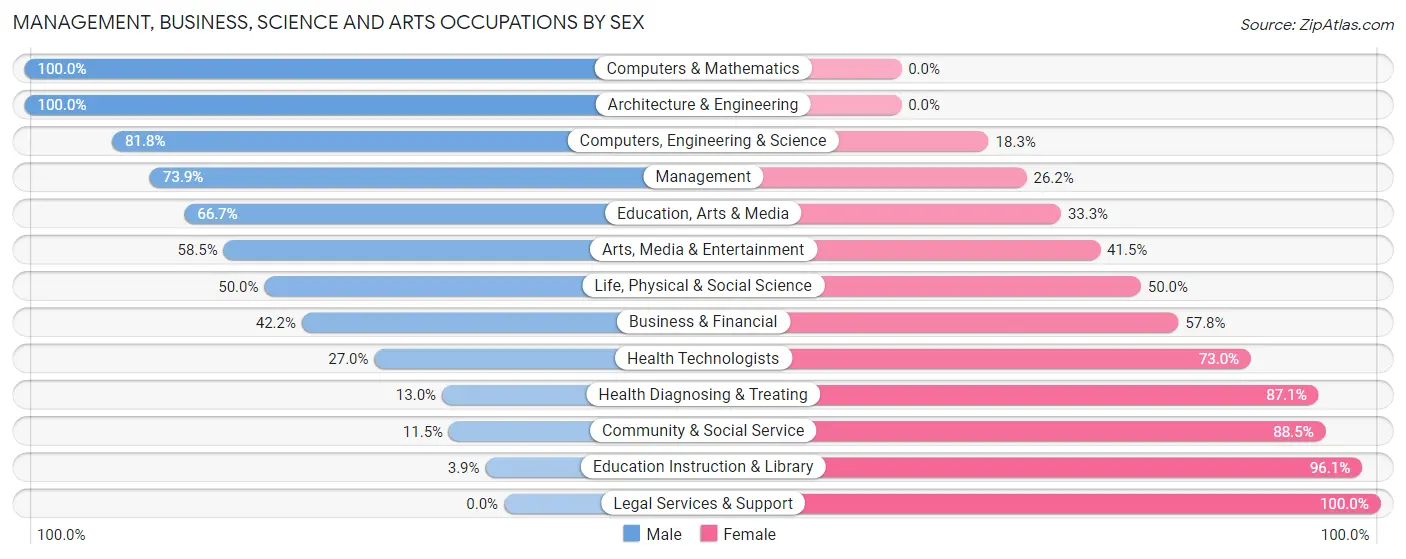
Management, Business, Science and Arts Occupations by Sex
Within the Management, Business, Science and Arts occupations in Camp County, the most male-oriented occupations are Computers & Mathematics (100.0%), Architecture & Engineering (100.0%), and Computers, Engineering & Science (81.8%), while the most female-oriented occupations are Legal Services & Support (100.0%), Education Instruction & Library (96.1%), and Community & Social Service (88.5%).
| Occupation | Male | Female |
| Management | 305 (73.9%) | 108 (26.2%) |
| Business & Financial | 62 (42.2%) | 85 (57.8%) |
| Computers, Engineering & Science | 112 (81.8%) | 25 (18.2%) |
| Computers & Mathematics | 16 (100.0%) | 0 (0.0%) |
| Architecture & Engineering | 71 (100.0%) | 0 (0.0%) |
| Life, Physical & Social Science | 25 (50.0%) | 25 (50.0%) |
| Community & Social Service | 68 (11.5%) | 524 (88.5%) |
| Education, Arts & Media | 20 (66.7%) | 10 (33.3%) |
| Legal Services & Support | 0 (0.0%) | 71 (100.0%) |
| Education Instruction & Library | 17 (3.9%) | 421 (96.1%) |
| Arts, Media & Entertainment | 31 (58.5%) | 22 (41.5%) |
| Health Diagnosing & Treating | 43 (13.0%) | 289 (87.1%) |
| Health Technologists | 43 (27.0%) | 116 (73.0%) |
| Total (Category) | 590 (36.4%) | 1,031 (63.6%) |
| Total (Overall) | 2,656 (51.0%) | 2,555 (49.0%) |
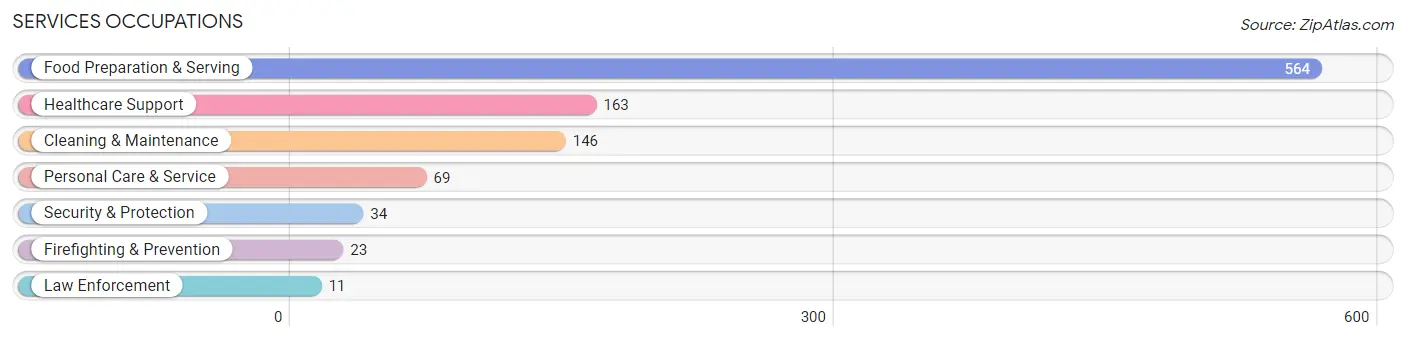
Services Occupations
The most common Services occupations in Camp County are Food Preparation & Serving (564 | 10.8%), Healthcare Support (163 | 3.1%), Cleaning & Maintenance (146 | 2.8%), Personal Care & Service (69 | 1.3%), and Security & Protection (34 | 0.6%).
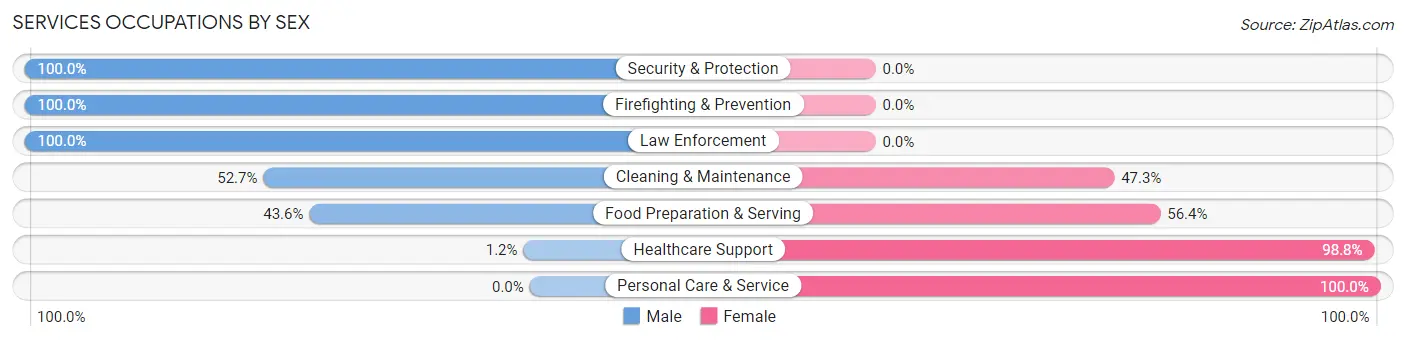
Services Occupations by Sex
Within the Services occupations in Camp County, the most male-oriented occupations are Security & Protection (100.0%), Firefighting & Prevention (100.0%), and Law Enforcement (100.0%), while the most female-oriented occupations are Personal Care & Service (100.0%), Healthcare Support (98.8%), and Food Preparation & Serving (56.4%).
| Occupation | Male | Female |
| Healthcare Support | 2 (1.2%) | 161 (98.8%) |
| Security & Protection | 34 (100.0%) | 0 (0.0%) |
| Firefighting & Prevention | 23 (100.0%) | 0 (0.0%) |
| Law Enforcement | 11 (100.0%) | 0 (0.0%) |
| Food Preparation & Serving | 246 (43.6%) | 318 (56.4%) |
| Cleaning & Maintenance | 77 (52.7%) | 69 (47.3%) |
| Personal Care & Service | 0 (0.0%) | 69 (100.0%) |
| Total (Category) | 359 (36.8%) | 617 (63.2%) |
| Total (Overall) | 2,656 (51.0%) | 2,555 (49.0%) |
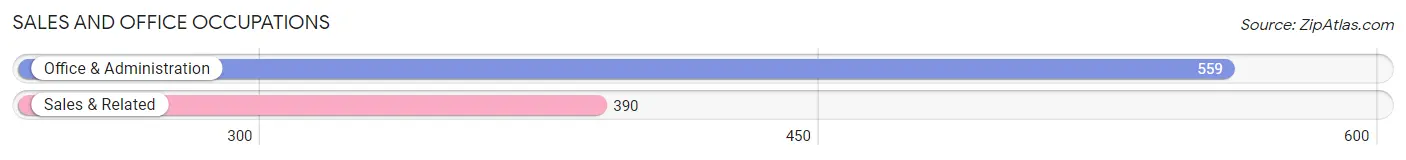
Sales and Office Occupations
The most common Sales and Office occupations in Camp County are Office & Administration (559 | 10.7%), and Sales & Related (390 | 7.5%).
Sales and Office Occupations by Sex
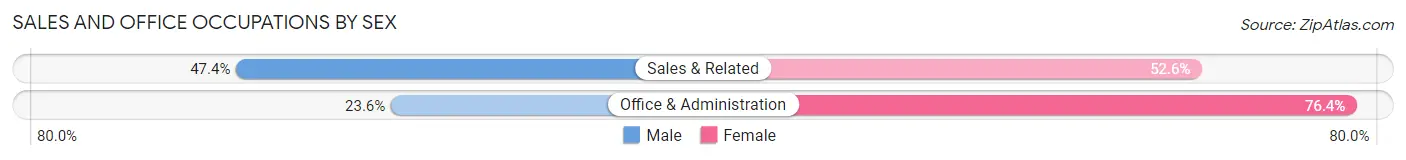
| Occupation | Male | Female |
| Sales & Related | 185 (47.4%) | 205 (52.6%) |
| Office & Administration | 132 (23.6%) | 427 (76.4%) |
| Total (Category) | 317 (33.4%) | 632 (66.6%) |
| Total (Overall) | 2,656 (51.0%) | 2,555 (49.0%) |
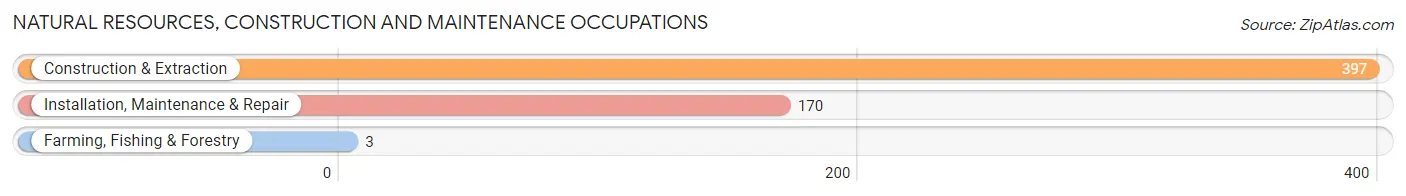
Natural Resources, Construction and Maintenance Occupations
The most common Natural Resources, Construction and Maintenance occupations in Camp County are Construction & Extraction (397 | 7.6%), Installation, Maintenance & Repair (170 | 3.3%), and Farming, Fishing & Forestry (3 | 0.1%).
Natural Resources, Construction and Maintenance Occupations by Sex

| Occupation | Male | Female |
| Farming, Fishing & Forestry | 3 (100.0%) | 0 (0.0%) |
| Construction & Extraction | 383 (96.5%) | 14 (3.5%) |
| Installation, Maintenance & Repair | 170 (100.0%) | 0 (0.0%) |
| Total (Category) | 556 (97.5%) | 14 (2.5%) |
| Total (Overall) | 2,656 (51.0%) | 2,555 (49.0%) |
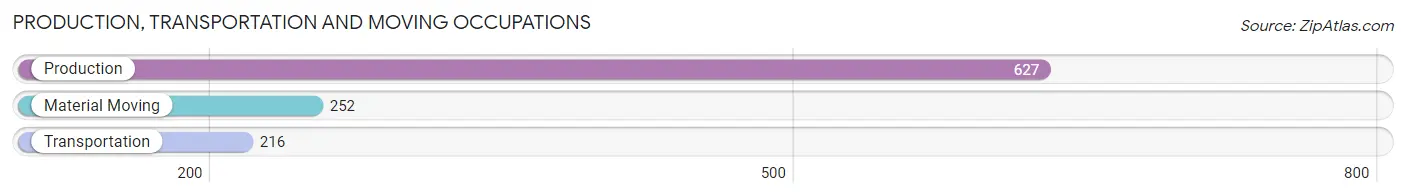
Production, Transportation and Moving Occupations
The most common Production, Transportation and Moving occupations in Camp County are Production (627 | 12.0%), Material Moving (252 | 4.8%), and Transportation (216 | 4.2%).
Production, Transportation and Moving Occupations by Sex
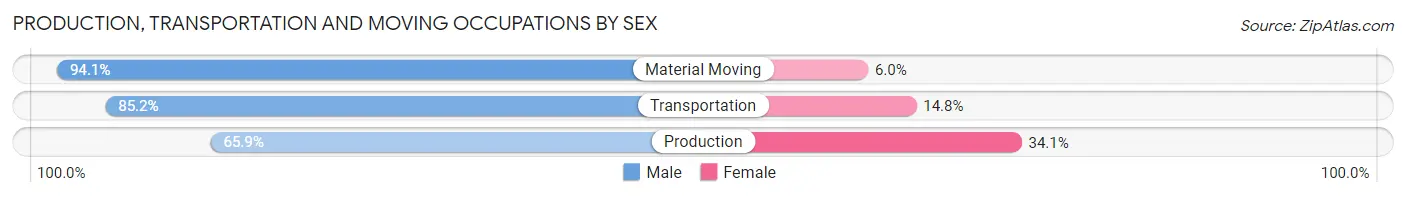
| Occupation | Male | Female |
| Production | 413 (65.9%) | 214 (34.1%) |
| Transportation | 184 (85.2%) | 32 (14.8%) |
| Material Moving | 237 (94.1%) | 15 (5.9%) |
| Total (Category) | 834 (76.2%) | 261 (23.8%) |
| Total (Overall) | 2,656 (51.0%) | 2,555 (49.0%) |
Employment Industries by Sex in Camp County
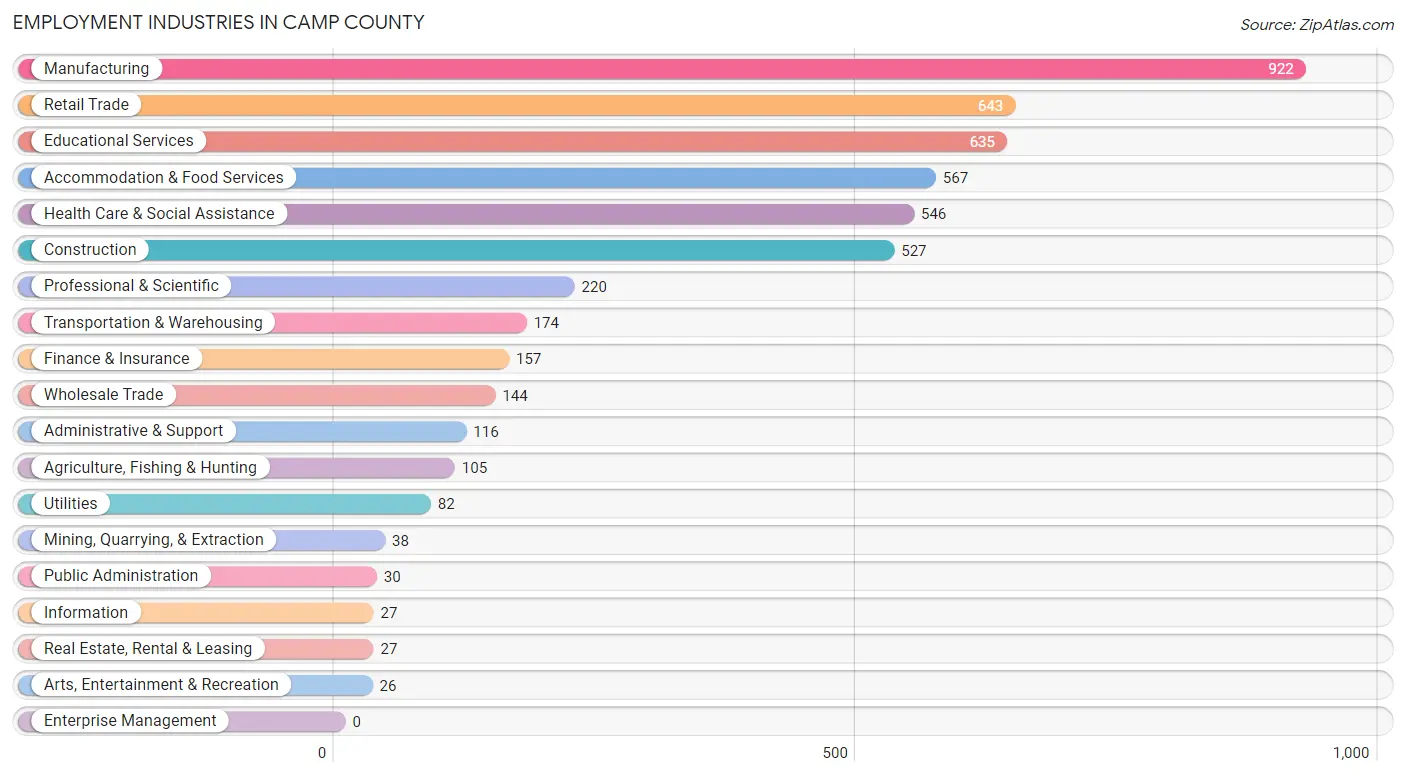
Employment Industries in Camp County
The major employment industries in Camp County include Manufacturing (922 | 17.7%), Retail Trade (643 | 12.3%), Educational Services (635 | 12.2%), Accommodation & Food Services (567 | 10.9%), and Health Care & Social Assistance (546 | 10.5%).
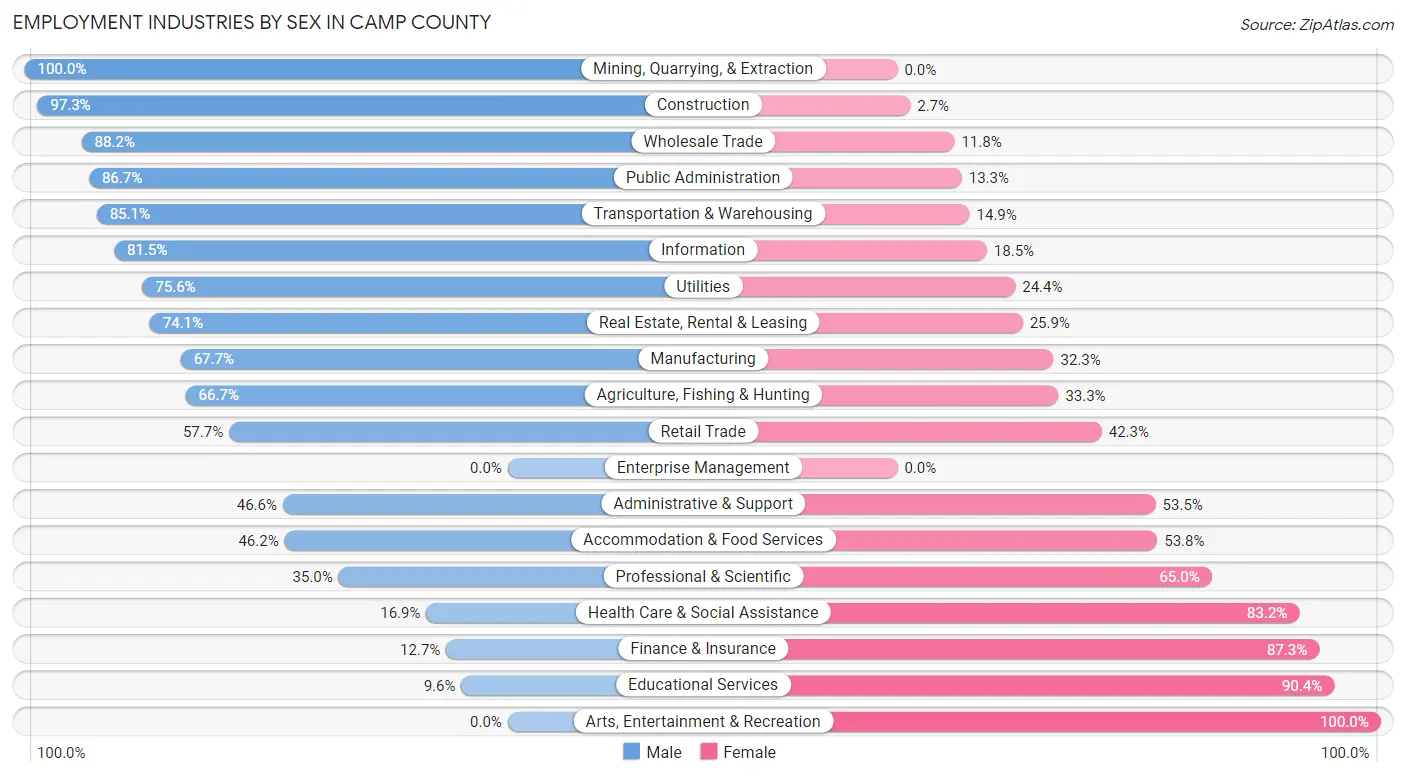
Employment Industries by Sex in Camp County
The Camp County industries that see more men than women are Mining, Quarrying, & Extraction (100.0%), Construction (97.3%), and Wholesale Trade (88.2%), whereas the industries that tend to have a higher number of women are Arts, Entertainment & Recreation (100.0%), Educational Services (90.4%), and Finance & Insurance (87.3%).
| Industry | Male | Female |
| Agriculture, Fishing & Hunting | 70 (66.7%) | 35 (33.3%) |
| Mining, Quarrying, & Extraction | 38 (100.0%) | 0 (0.0%) |
| Construction | 513 (97.3%) | 14 (2.7%) |
| Manufacturing | 624 (67.7%) | 298 (32.3%) |
| Wholesale Trade | 127 (88.2%) | 17 (11.8%) |
| Retail Trade | 371 (57.7%) | 272 (42.3%) |
| Transportation & Warehousing | 148 (85.1%) | 26 (14.9%) |
| Utilities | 62 (75.6%) | 20 (24.4%) |
| Information | 22 (81.5%) | 5 (18.5%) |
| Finance & Insurance | 20 (12.7%) | 137 (87.3%) |
| Real Estate, Rental & Leasing | 20 (74.1%) | 7 (25.9%) |
| Professional & Scientific | 77 (35.0%) | 143 (65.0%) |
| Enterprise Management | 0 (0.0%) | 0 (0.0%) |
| Administrative & Support | 54 (46.6%) | 62 (53.4%) |
| Educational Services | 61 (9.6%) | 574 (90.4%) |
| Health Care & Social Assistance | 92 (16.9%) | 454 (83.2%) |
| Arts, Entertainment & Recreation | 0 (0.0%) | 26 (100.0%) |
| Accommodation & Food Services | 262 (46.2%) | 305 (53.8%) |
| Public Administration | 26 (86.7%) | 4 (13.3%) |
| Total | 2,656 (51.0%) | 2,555 (49.0%) |
Education in Camp County
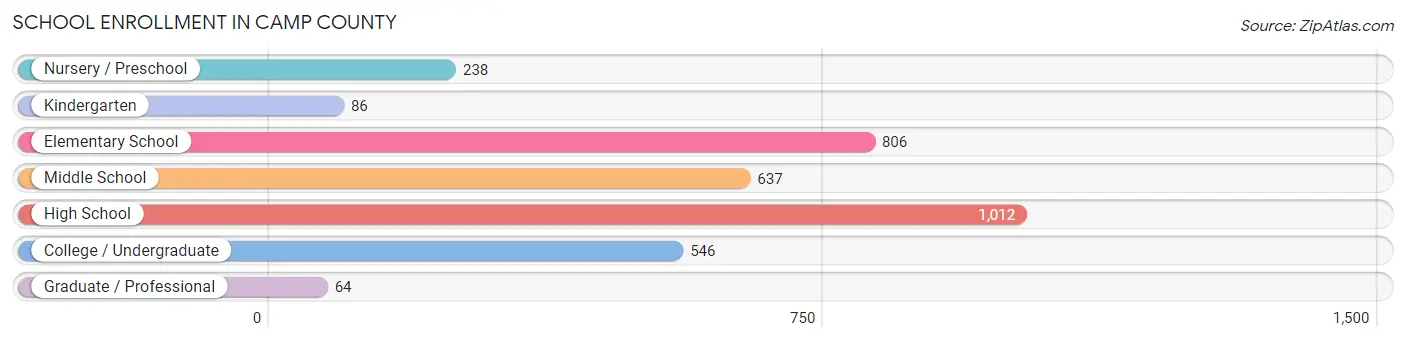
School Enrollment in Camp County
The most common levels of schooling among the 3,389 students in Camp County are high school (1,012 | 29.9%), elementary school (806 | 23.8%), and middle school (637 | 18.8%).
| School Level | # Students | % Students |
| Nursery / Preschool | 238 | 7.0% |
| Kindergarten | 86 | 2.5% |
| Elementary School | 806 | 23.8% |
| Middle School | 637 | 18.8% |
| High School | 1,012 | 29.9% |
| College / Undergraduate | 546 | 16.1% |
| Graduate / Professional | 64 | 1.9% |
| Total | 3,389 | 100.0% |
School Enrollment by Age by Funding Source in Camp County
Out of a total of 3,389 students who are enrolled in schools in Camp County, 491 (14.5%) attend a private institution, while the remaining 2,898 (85.5%) are enrolled in public schools. The age group of 3 to 4 year olds has the highest likelihood of being enrolled in private schools, with 64 (35.4% in the age bracket) enrolled. Conversely, the age group of 20 to 24 year olds has the lowest likelihood of being enrolled in a private school, with 277 (100.0% in the age bracket) attending a public institution.
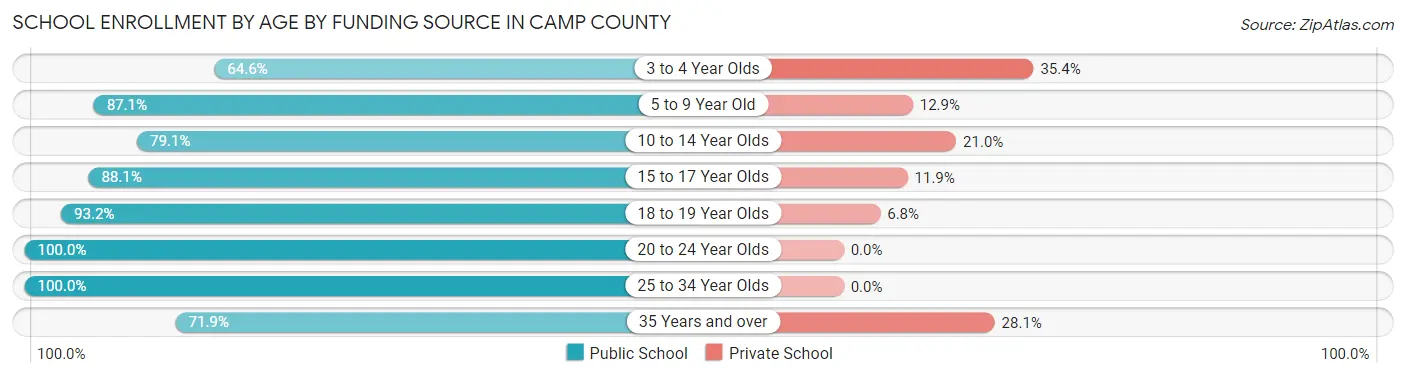
| Age Bracket | Public School | Private School |
| 3 to 4 Year Olds | 117 (64.6%) | 64 (35.4%) |
| 5 to 9 Year Old | 764 (87.1%) | 113 (12.9%) |
| 10 to 14 Year Olds | 717 (79.0%) | 190 (20.9%) |
| 15 to 17 Year Olds | 488 (88.1%) | 66 (11.9%) |
| 18 to 19 Year Olds | 328 (93.2%) | 24 (6.8%) |
| 20 to 24 Year Olds | 277 (100.0%) | 0 (0.0%) |
| 25 to 34 Year Olds | 113 (100.0%) | 0 (0.0%) |
| 35 Years and over | 92 (71.9%) | 36 (28.1%) |
| Total | 2,898 (85.5%) | 491 (14.5%) |
Educational Attainment by Field of Study in Camp County
Business (476 | 27.2%), education (287 | 16.4%), science & technology (193 | 11.0%), computers & mathematics (161 | 9.2%), and engineering (142 | 8.1%) are the most common fields of study among 1,752 individuals in Camp County who have obtained a bachelor's degree or higher.
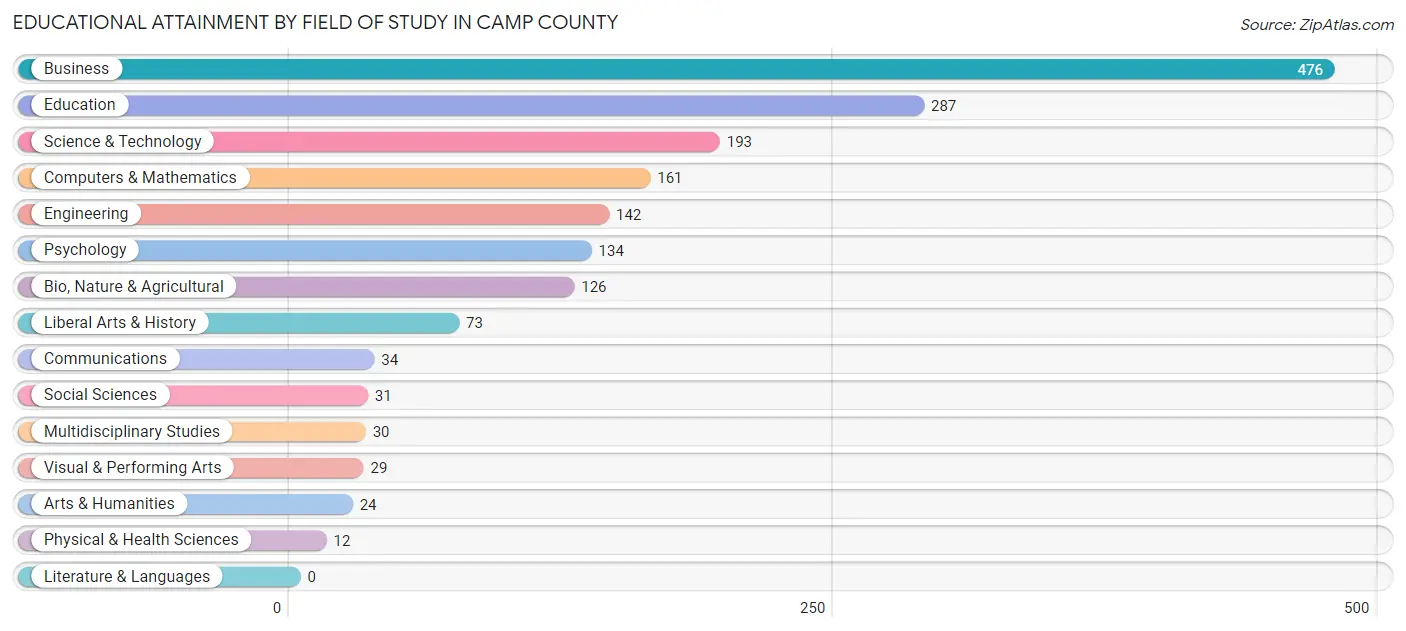
| Field of Study | # Graduates | % Graduates |
| Computers & Mathematics | 161 | 9.2% |
| Bio, Nature & Agricultural | 126 | 7.2% |
| Physical & Health Sciences | 12 | 0.7% |
| Psychology | 134 | 7.6% |
| Social Sciences | 31 | 1.8% |
| Engineering | 142 | 8.1% |
| Multidisciplinary Studies | 30 | 1.7% |
| Science & Technology | 193 | 11.0% |
| Business | 476 | 27.2% |
| Education | 287 | 16.4% |
| Literature & Languages | 0 | 0.0% |
| Liberal Arts & History | 73 | 4.2% |
| Visual & Performing Arts | 29 | 1.7% |
| Communications | 34 | 1.9% |
| Arts & Humanities | 24 | 1.4% |
| Total | 1,752 | 100.0% |
Transportation & Commute in Camp County
Vehicle Availability by Sex in Camp County
The most prevalent vehicle ownership categories in Camp County are males with 2 vehicles (1,183, accounting for 44.5%) and females with 2 vehicles (1,155, making up 47.1%).
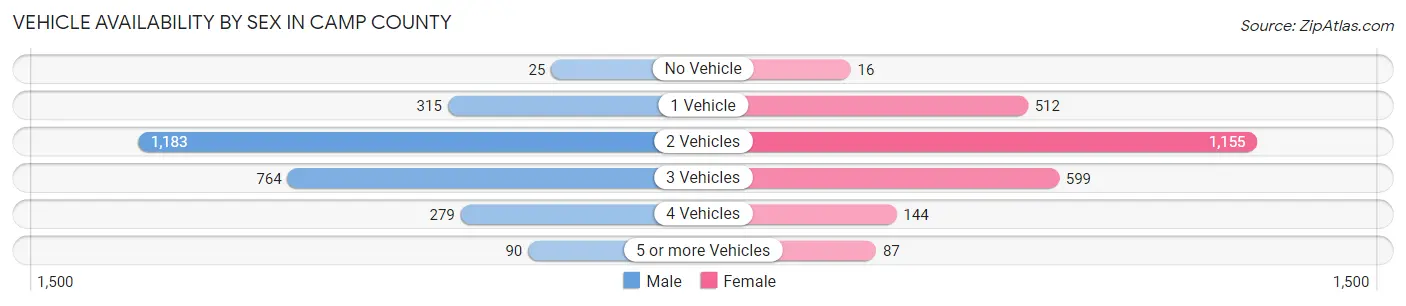
| Vehicles Available | Male | Female |
| No Vehicle | 25 (0.9%) | 16 (0.6%) |
| 1 Vehicle | 315 (11.9%) | 512 (20.4%) |
| 2 Vehicles | 1,183 (44.5%) | 1,155 (46.0%) |
| 3 Vehicles | 764 (28.8%) | 599 (23.8%) |
| 4 Vehicles | 279 (10.5%) | 144 (5.7%) |
| 5 or more Vehicles | 90 (3.4%) | 87 (3.5%) |
| Total | 2,656 (100.0%) | 2,513 (100.0%) |
Commute Time in Camp County
The most frequently occuring commute durations in Camp County are 20 to 24 minutes (972 commuters, 19.8%), 15 to 19 minutes (891 commuters, 18.1%), and 5 to 9 minutes (708 commuters, 14.4%).
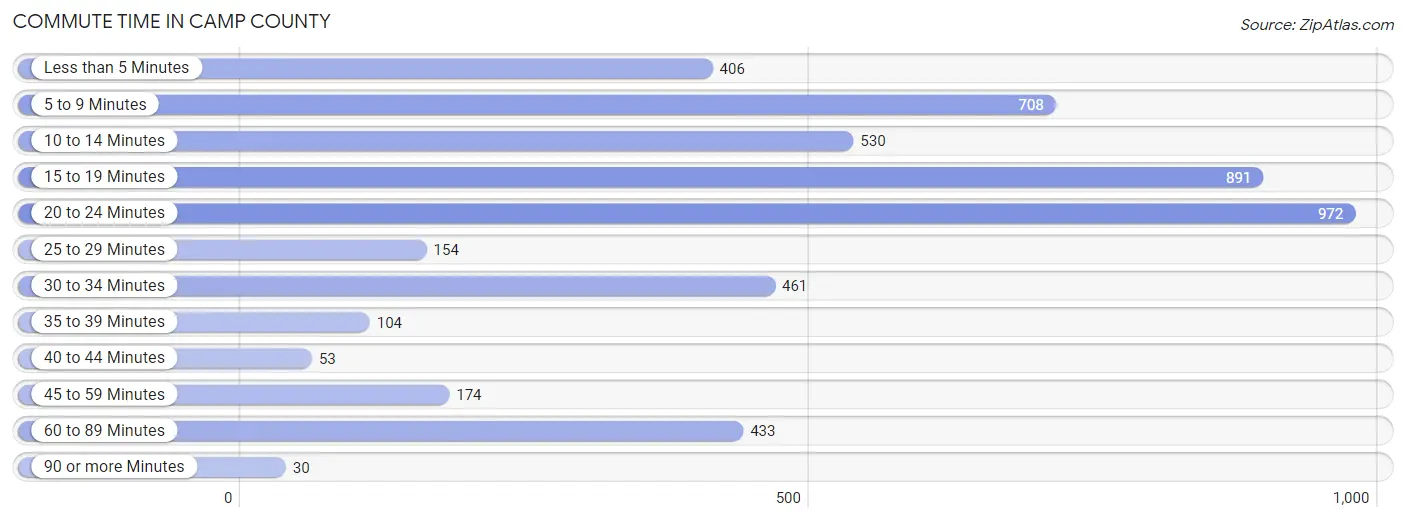
| Commute Time | # Commuters | % Commuters |
| Less than 5 Minutes | 406 | 8.3% |
| 5 to 9 Minutes | 708 | 14.4% |
| 10 to 14 Minutes | 530 | 10.8% |
| 15 to 19 Minutes | 891 | 18.1% |
| 20 to 24 Minutes | 972 | 19.8% |
| 25 to 29 Minutes | 154 | 3.1% |
| 30 to 34 Minutes | 461 | 9.4% |
| 35 to 39 Minutes | 104 | 2.1% |
| 40 to 44 Minutes | 53 | 1.1% |
| 45 to 59 Minutes | 174 | 3.5% |
| 60 to 89 Minutes | 433 | 8.8% |
| 90 or more Minutes | 30 | 0.6% |
Commute Time by Sex in Camp County
The most common commute times in Camp County are 20 to 24 minutes (520 commuters, 20.2%) for males and 20 to 24 minutes (452 commuters, 19.3%) for females.
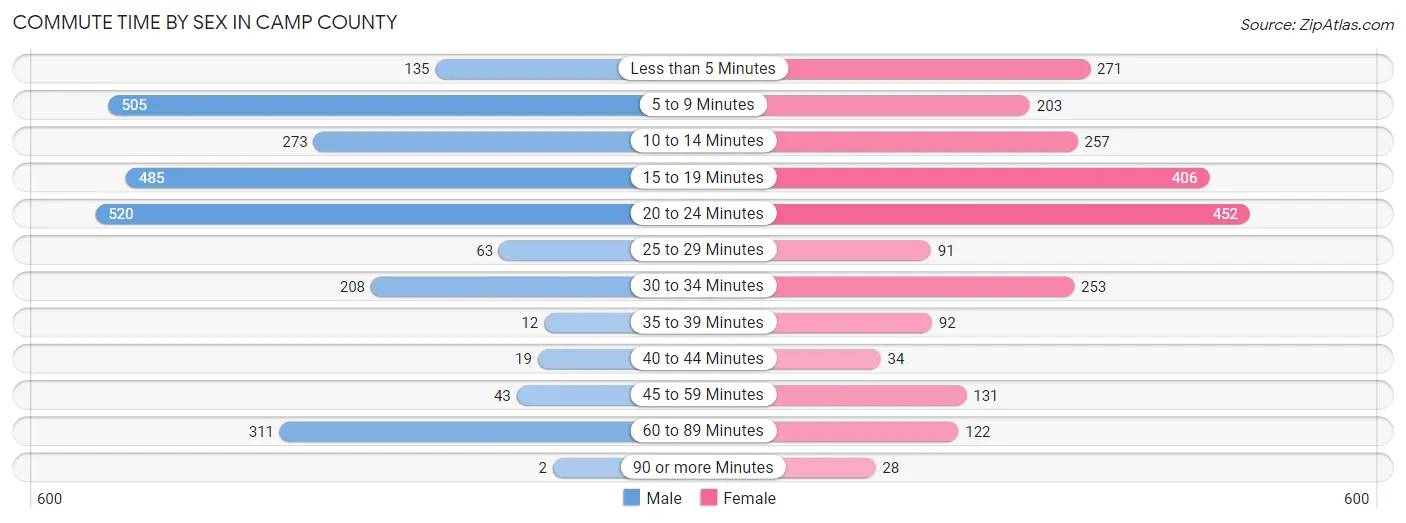
| Commute Time | Male | Female |
| Less than 5 Minutes | 135 (5.2%) | 271 (11.6%) |
| 5 to 9 Minutes | 505 (19.6%) | 203 (8.7%) |
| 10 to 14 Minutes | 273 (10.6%) | 257 (11.0%) |
| 15 to 19 Minutes | 485 (18.8%) | 406 (17.3%) |
| 20 to 24 Minutes | 520 (20.2%) | 452 (19.3%) |
| 25 to 29 Minutes | 63 (2.5%) | 91 (3.9%) |
| 30 to 34 Minutes | 208 (8.1%) | 253 (10.8%) |
| 35 to 39 Minutes | 12 (0.5%) | 92 (3.9%) |
| 40 to 44 Minutes | 19 (0.7%) | 34 (1.5%) |
| 45 to 59 Minutes | 43 (1.7%) | 131 (5.6%) |
| 60 to 89 Minutes | 311 (12.1%) | 122 (5.2%) |
| 90 or more Minutes | 2 (0.1%) | 28 (1.2%) |
Time of Departure to Work by Sex in Camp County
The most frequent times of departure to work in Camp County are 7:30 AM to 7:59 AM (528, 20.5%) for males and 7:30 AM to 7:59 AM (460, 19.7%) for females.
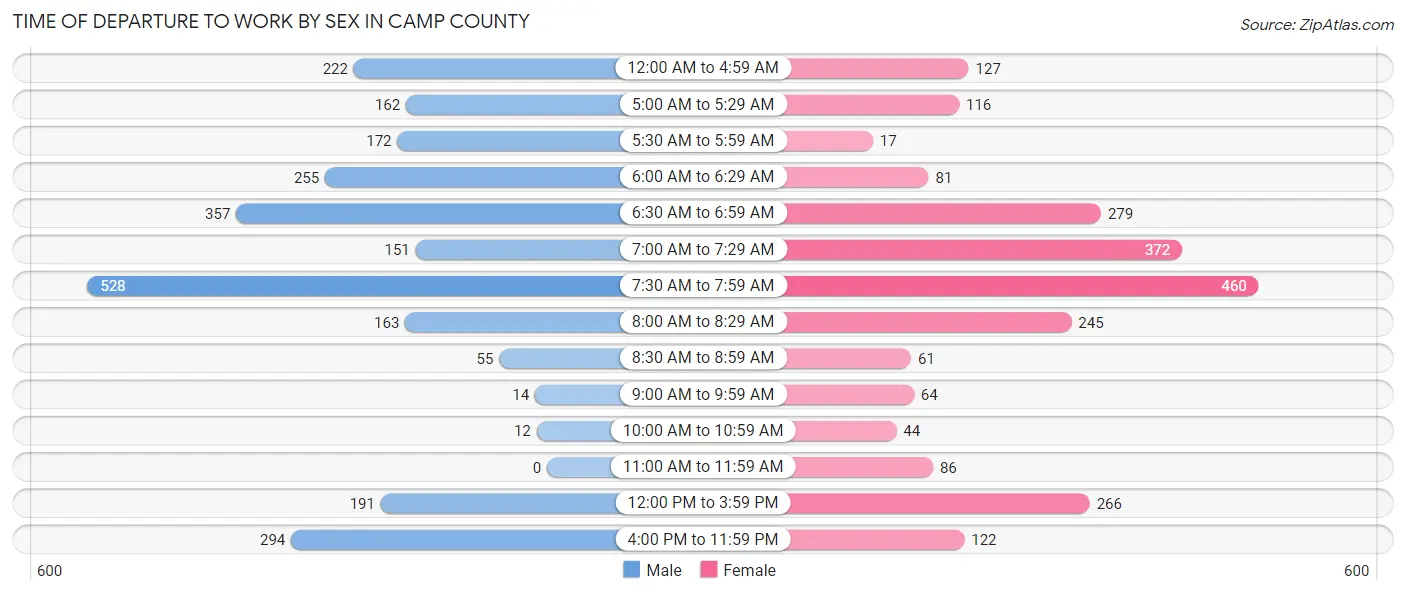
| Time of Departure | Male | Female |
| 12:00 AM to 4:59 AM | 222 (8.6%) | 127 (5.4%) |
| 5:00 AM to 5:29 AM | 162 (6.3%) | 116 (5.0%) |
| 5:30 AM to 5:59 AM | 172 (6.7%) | 17 (0.7%) |
| 6:00 AM to 6:29 AM | 255 (9.9%) | 81 (3.5%) |
| 6:30 AM to 6:59 AM | 357 (13.9%) | 279 (11.9%) |
| 7:00 AM to 7:29 AM | 151 (5.9%) | 372 (15.9%) |
| 7:30 AM to 7:59 AM | 528 (20.5%) | 460 (19.7%) |
| 8:00 AM to 8:29 AM | 163 (6.3%) | 245 (10.5%) |
| 8:30 AM to 8:59 AM | 55 (2.1%) | 61 (2.6%) |
| 9:00 AM to 9:59 AM | 14 (0.5%) | 64 (2.7%) |
| 10:00 AM to 10:59 AM | 12 (0.5%) | 44 (1.9%) |
| 11:00 AM to 11:59 AM | 0 (0.0%) | 86 (3.7%) |
| 12:00 PM to 3:59 PM | 191 (7.4%) | 266 (11.4%) |
| 4:00 PM to 11:59 PM | 294 (11.4%) | 122 (5.2%) |
| Total | 2,576 (100.0%) | 2,340 (100.0%) |
Housing Occupancy in Camp County
Occupancy by Ownership in Camp County
Of the total 4,443 dwellings in Camp County, owner-occupied units account for 3,479 (78.3%), while renter-occupied units make up 964 (21.7%).
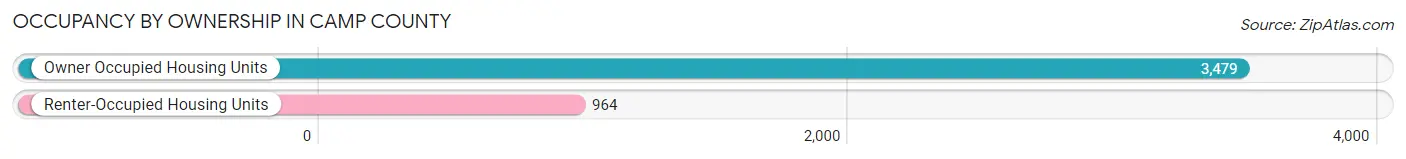
| Occupancy | # Housing Units | % Housing Units |
| Owner Occupied Housing Units | 3,479 | 78.3% |
| Renter-Occupied Housing Units | 964 | 21.7% |
| Total Occupied Housing Units | 4,443 | 100.0% |
Occupancy by Household Size in Camp County
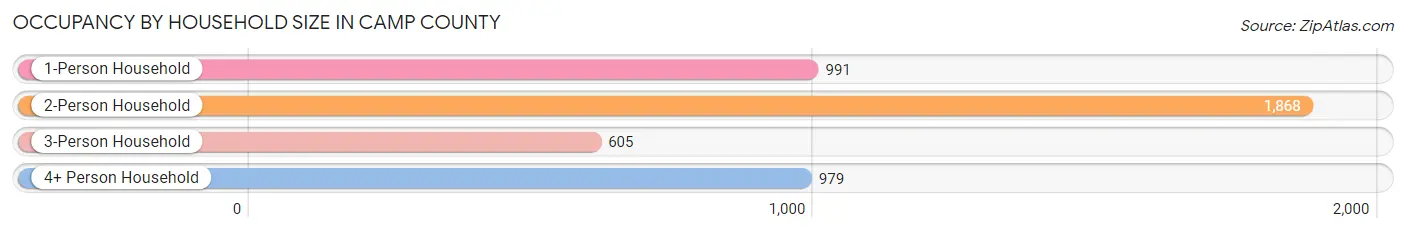
| Household Size | # Housing Units | % Housing Units |
| 1-Person Household | 991 | 22.3% |
| 2-Person Household | 1,868 | 42.0% |
| 3-Person Household | 605 | 13.6% |
| 4+ Person Household | 979 | 22.0% |
| Total Housing Units | 4,443 | 100.0% |
Occupancy by Ownership by Household Size in Camp County
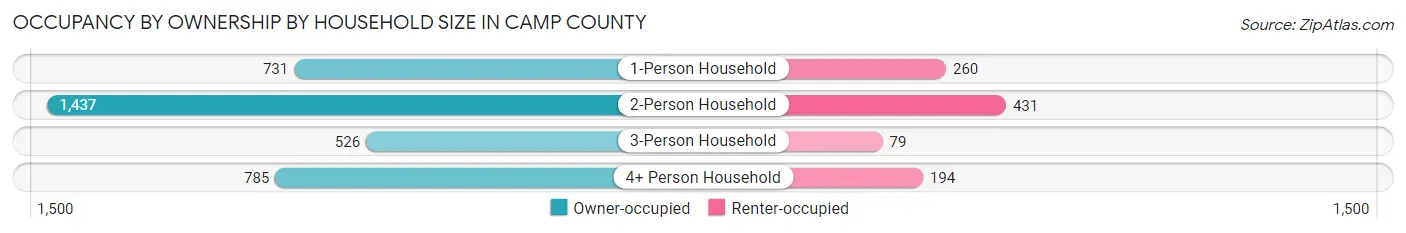
| Household Size | Owner-occupied | Renter-occupied |
| 1-Person Household | 731 (73.8%) | 260 (26.2%) |
| 2-Person Household | 1,437 (76.9%) | 431 (23.1%) |
| 3-Person Household | 526 (86.9%) | 79 (13.1%) |
| 4+ Person Household | 785 (80.2%) | 194 (19.8%) |
| Total Housing Units | 3,479 (78.3%) | 964 (21.7%) |
Occupancy by Educational Attainment in Camp County
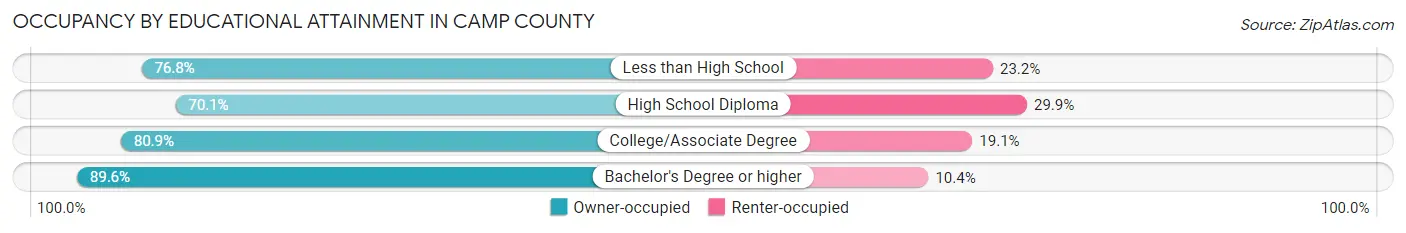
| Household Size | Owner-occupied | Renter-occupied |
| Less than High School | 388 (76.8%) | 117 (23.2%) |
| High School Diploma | 1,146 (70.1%) | 489 (29.9%) |
| College/Associate Degree | 1,107 (80.9%) | 261 (19.1%) |
| Bachelor's Degree or higher | 838 (89.6%) | 97 (10.4%) |
Occupancy by Age of Householder in Camp County
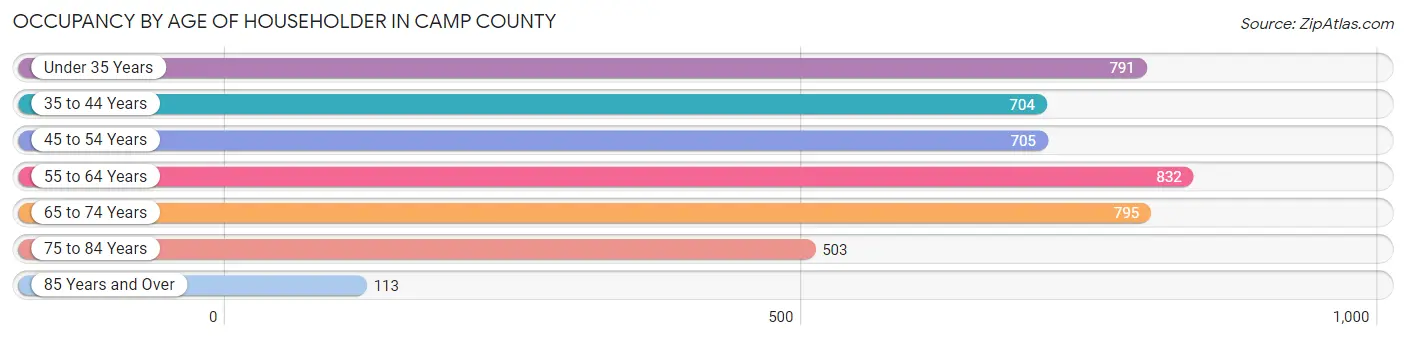
| Age Bracket | # Households | % Households |
| Under 35 Years | 791 | 17.8% |
| 35 to 44 Years | 704 | 15.9% |
| 45 to 54 Years | 705 | 15.9% |
| 55 to 64 Years | 832 | 18.7% |
| 65 to 74 Years | 795 | 17.9% |
| 75 to 84 Years | 503 | 11.3% |
| 85 Years and Over | 113 | 2.5% |
| Total | 4,443 | 100.0% |
Housing Finances in Camp County
Median Income by Occupancy in Camp County
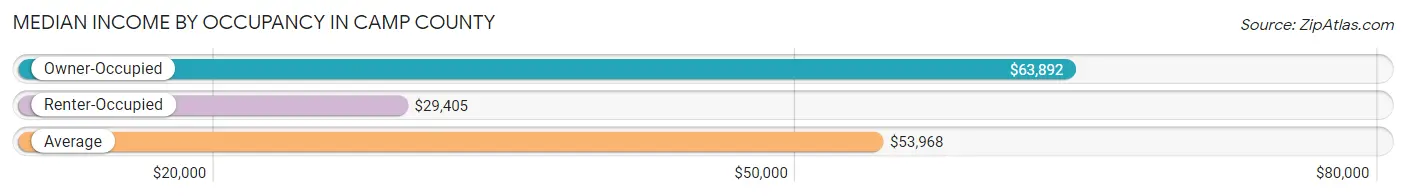
| Occupancy Type | # Households | Median Income |
| Owner-Occupied | 3,479 (78.3%) | $63,892 |
| Renter-Occupied | 964 (21.7%) | $29,405 |
| Average | 4,443 (100.0%) | $53,968 |
Occupancy by Householder Income Bracket in Camp County
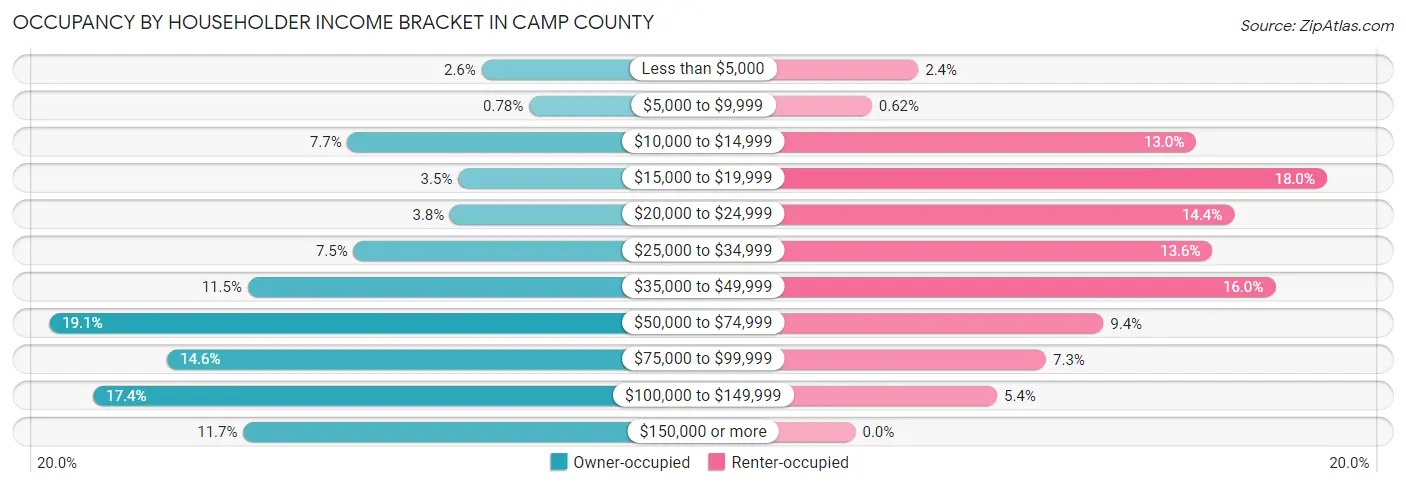
| Income Bracket | Owner-occupied | Renter-occupied |
| Less than $5,000 | 90 (2.6%) | 23 (2.4%) |
| $5,000 to $9,999 | 27 (0.8%) | 6 (0.6%) |
| $10,000 to $14,999 | 268 (7.7%) | 125 (13.0%) |
| $15,000 to $19,999 | 121 (3.5%) | 173 (17.9%) |
| $20,000 to $24,999 | 132 (3.8%) | 139 (14.4%) |
| $25,000 to $34,999 | 260 (7.5%) | 131 (13.6%) |
| $35,000 to $49,999 | 400 (11.5%) | 154 (16.0%) |
| $50,000 to $74,999 | 663 (19.1%) | 91 (9.4%) |
| $75,000 to $99,999 | 507 (14.6%) | 70 (7.3%) |
| $100,000 to $149,999 | 605 (17.4%) | 52 (5.4%) |
| $150,000 or more | 406 (11.7%) | 0 (0.0%) |
| Total | 3,479 (100.0%) | 964 (100.0%) |
Monthly Housing Cost Tiers in Camp County
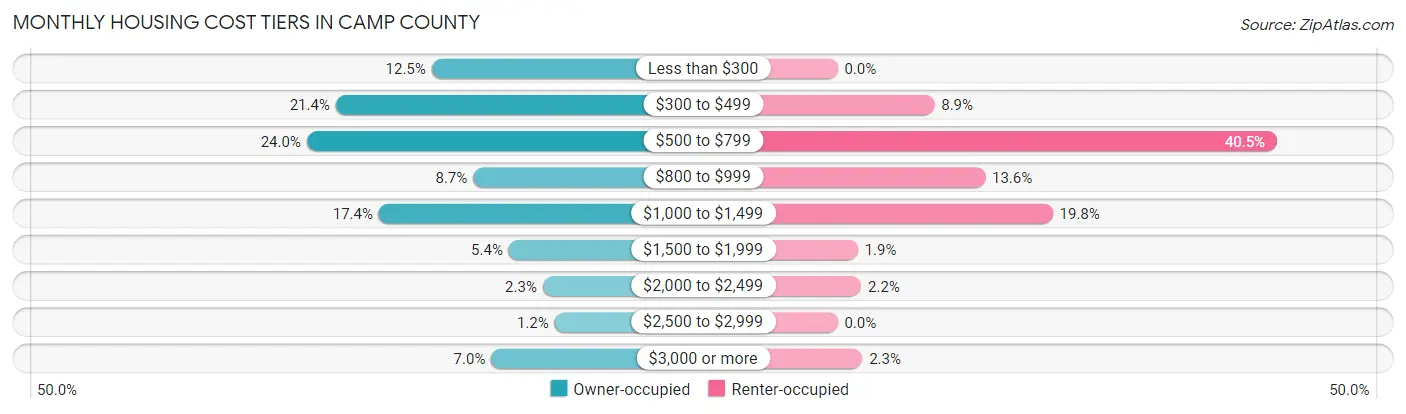
| Monthly Cost | Owner-occupied | Renter-occupied |
| Less than $300 | 436 (12.5%) | 0 (0.0%) |
| $300 to $499 | 743 (21.4%) | 86 (8.9%) |
| $500 to $799 | 836 (24.0%) | 390 (40.5%) |
| $800 to $999 | 303 (8.7%) | 131 (13.6%) |
| $1,000 to $1,499 | 605 (17.4%) | 191 (19.8%) |
| $1,500 to $1,999 | 189 (5.4%) | 18 (1.9%) |
| $2,000 to $2,499 | 80 (2.3%) | 21 (2.2%) |
| $2,500 to $2,999 | 42 (1.2%) | 0 (0.0%) |
| $3,000 or more | 245 (7.0%) | 22 (2.3%) |
| Total | 3,479 (100.0%) | 964 (100.0%) |
Physical Housing Characteristics in Camp County
Housing Structures in Camp County
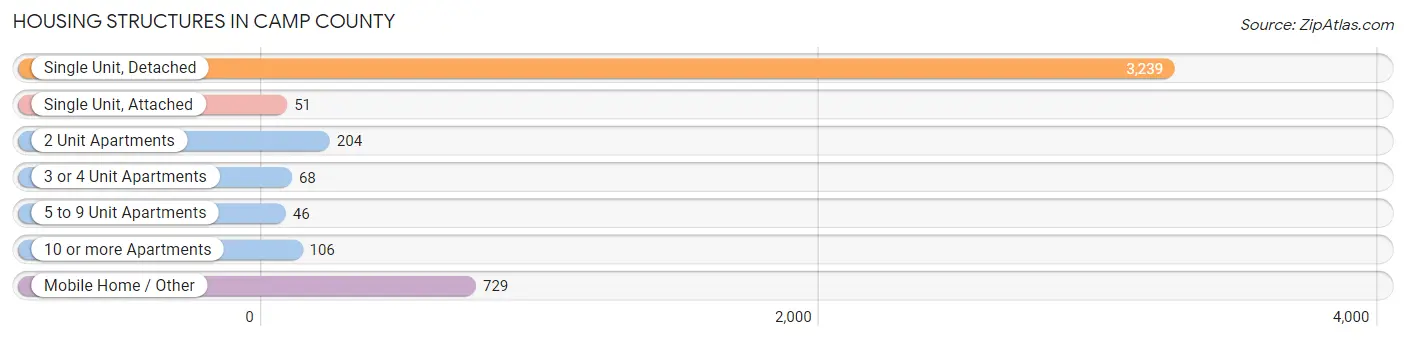
| Structure Type | # Housing Units | % Housing Units |
| Single Unit, Detached | 3,239 | 72.9% |
| Single Unit, Attached | 51 | 1.1% |
| 2 Unit Apartments | 204 | 4.6% |
| 3 or 4 Unit Apartments | 68 | 1.5% |
| 5 to 9 Unit Apartments | 46 | 1.0% |
| 10 or more Apartments | 106 | 2.4% |
| Mobile Home / Other | 729 | 16.4% |
| Total | 4,443 | 100.0% |
Housing Structures by Occupancy in Camp County
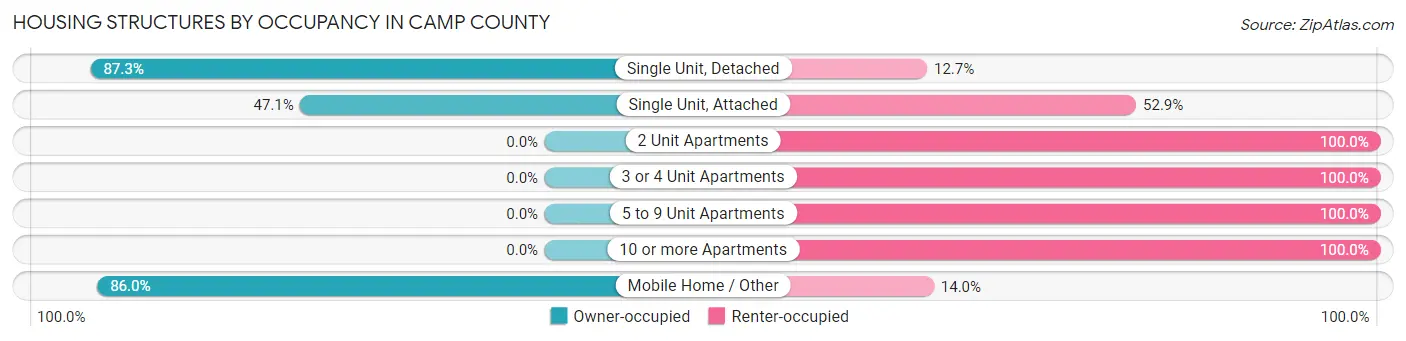
| Structure Type | Owner-occupied | Renter-occupied |
| Single Unit, Detached | 2,828 (87.3%) | 411 (12.7%) |
| Single Unit, Attached | 24 (47.1%) | 27 (52.9%) |
| 2 Unit Apartments | 0 (0.0%) | 204 (100.0%) |
| 3 or 4 Unit Apartments | 0 (0.0%) | 68 (100.0%) |
| 5 to 9 Unit Apartments | 0 (0.0%) | 46 (100.0%) |
| 10 or more Apartments | 0 (0.0%) | 106 (100.0%) |
| Mobile Home / Other | 627 (86.0%) | 102 (14.0%) |
| Total | 3,479 (78.3%) | 964 (21.7%) |
Housing Structures by Number of Rooms in Camp County
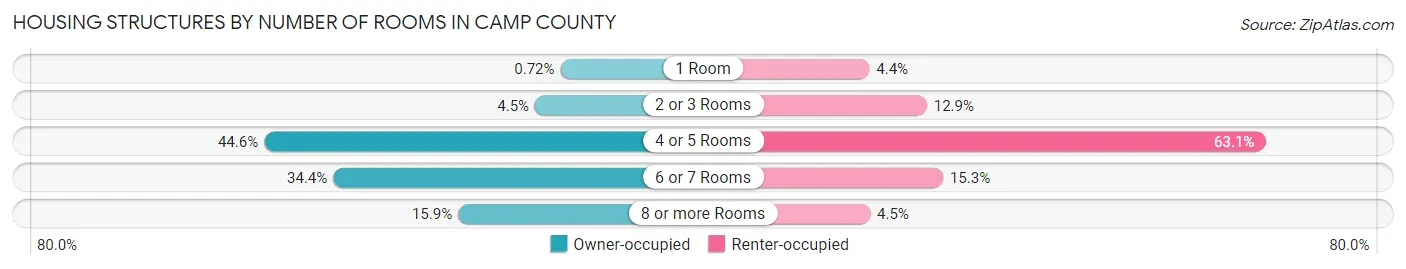
| Number of Rooms | Owner-occupied | Renter-occupied |
| 1 Room | 25 (0.7%) | 42 (4.4%) |
| 2 or 3 Rooms | 156 (4.5%) | 124 (12.9%) |
| 4 or 5 Rooms | 1,551 (44.6%) | 608 (63.1%) |
| 6 or 7 Rooms | 1,195 (34.4%) | 147 (15.2%) |
| 8 or more Rooms | 552 (15.9%) | 43 (4.5%) |
| Total | 3,479 (100.0%) | 964 (100.0%) |
Housing Structure by Heating Type in Camp County
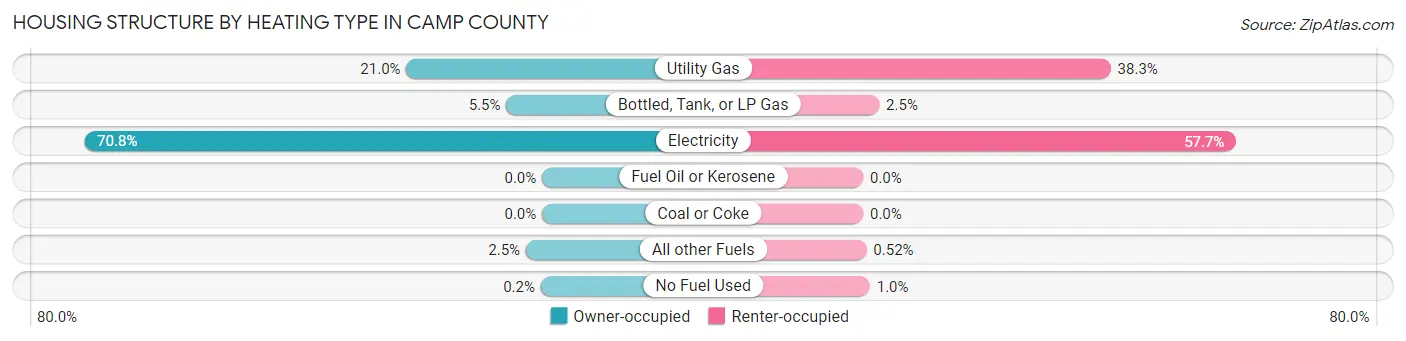
| Heating Type | Owner-occupied | Renter-occupied |
| Utility Gas | 730 (21.0%) | 369 (38.3%) |
| Bottled, Tank, or LP Gas | 192 (5.5%) | 24 (2.5%) |
| Electricity | 2,463 (70.8%) | 556 (57.7%) |
| Fuel Oil or Kerosene | 0 (0.0%) | 0 (0.0%) |
| Coal or Coke | 0 (0.0%) | 0 (0.0%) |
| All other Fuels | 87 (2.5%) | 5 (0.5%) |
| No Fuel Used | 7 (0.2%) | 10 (1.0%) |
| Total | 3,479 (100.0%) | 964 (100.0%) |
Household Vehicle Usage in Camp County
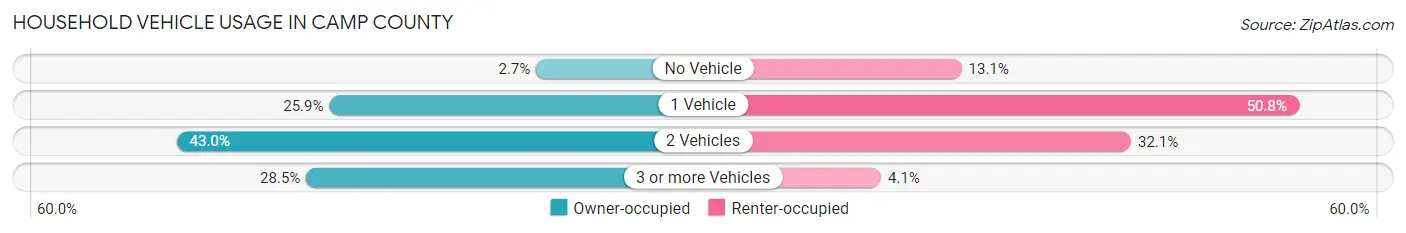
| Vehicles per Household | Owner-occupied | Renter-occupied |
| No Vehicle | 94 (2.7%) | 126 (13.1%) |
| 1 Vehicle | 900 (25.9%) | 490 (50.8%) |
| 2 Vehicles | 1,495 (43.0%) | 309 (32.1%) |
| 3 or more Vehicles | 990 (28.5%) | 39 (4.1%) |
| Total | 3,479 (100.0%) | 964 (100.0%) |
Real Estate & Mortgages in Camp County
Real Estate and Mortgage Overview in Camp County
| Characteristic | Without Mortgage | With Mortgage |
| Housing Units | 2,067 | 1,412 |
| Median Property Value | $129,100 | $171,200 |
| Median Household Income | $54,473 | $319 |
| Monthly Housing Costs | $470 | $216 |
| Real Estate Taxes | $1,393 | $16 |
Property Value by Mortgage Status in Camp County
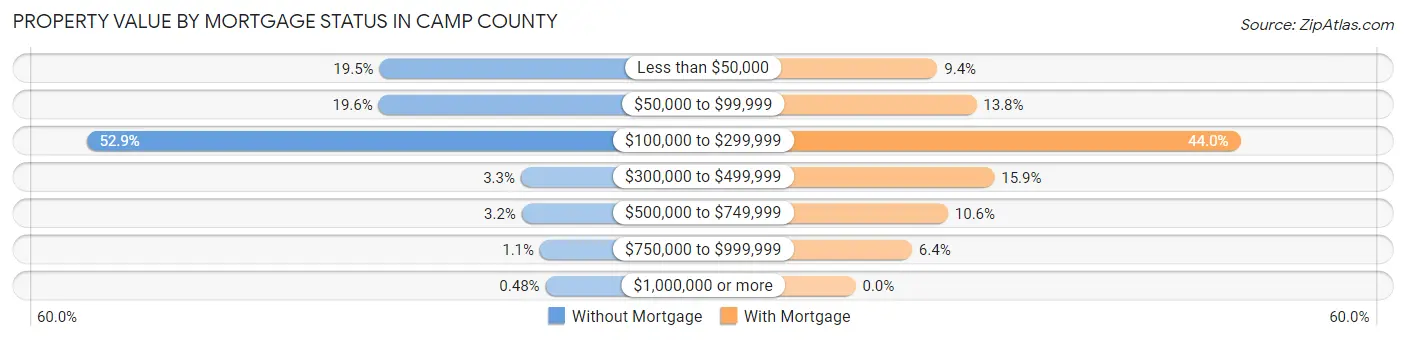
| Property Value | Without Mortgage | With Mortgage |
| Less than $50,000 | 402 (19.5%) | 132 (9.3%) |
| $50,000 to $99,999 | 404 (19.6%) | 195 (13.8%) |
| $100,000 to $299,999 | 1,094 (52.9%) | 621 (44.0%) |
| $300,000 to $499,999 | 68 (3.3%) | 224 (15.9%) |
| $500,000 to $749,999 | 66 (3.2%) | 149 (10.5%) |
| $750,000 to $999,999 | 23 (1.1%) | 91 (6.4%) |
| $1,000,000 or more | 10 (0.5%) | 0 (0.0%) |
| Total | 2,067 (100.0%) | 1,412 (100.0%) |
Household Income by Mortgage Status in Camp County
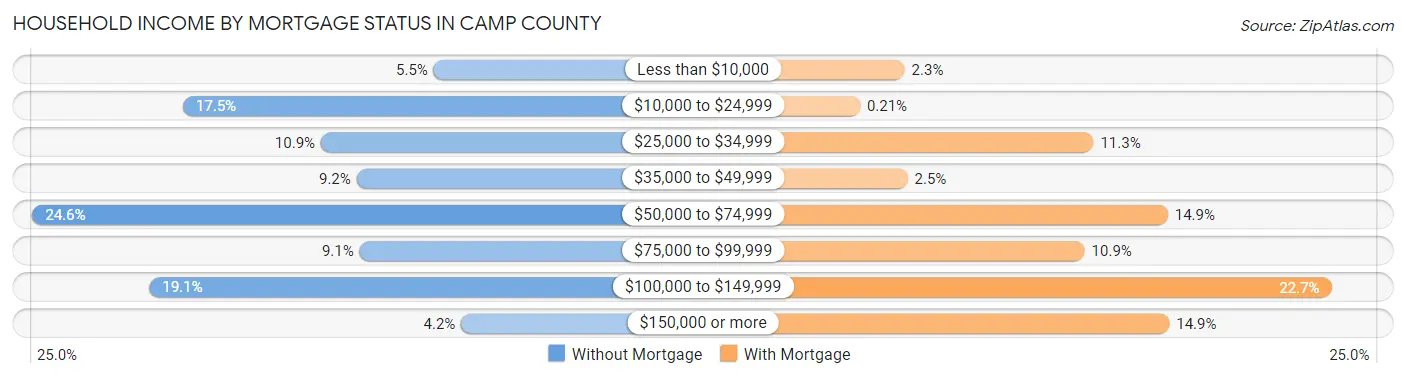
| Household Income | Without Mortgage | With Mortgage |
| Less than $10,000 | 114 (5.5%) | 33 (2.3%) |
| $10,000 to $24,999 | 361 (17.5%) | 3 (0.2%) |
| $25,000 to $34,999 | 225 (10.9%) | 160 (11.3%) |
| $35,000 to $49,999 | 190 (9.2%) | 35 (2.5%) |
| $50,000 to $74,999 | 509 (24.6%) | 210 (14.9%) |
| $75,000 to $99,999 | 187 (9.0%) | 154 (10.9%) |
| $100,000 to $149,999 | 394 (19.1%) | 320 (22.7%) |
| $150,000 or more | 87 (4.2%) | 211 (14.9%) |
| Total | 2,067 (100.0%) | 1,412 (100.0%) |
Property Value to Household Income Ratio in Camp County
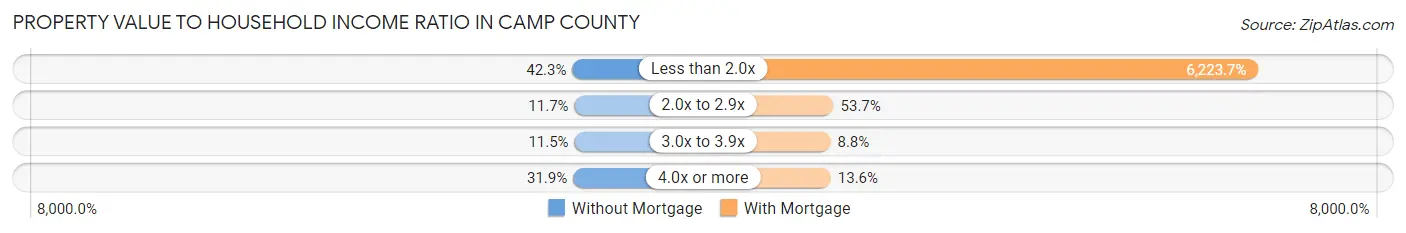
| Value-to-Income Ratio | Without Mortgage | With Mortgage |
| Less than 2.0x | 874 (42.3%) | 87,879 (6,223.7%) |
| 2.0x to 2.9x | 241 (11.7%) | 758 (53.7%) |
| 3.0x to 3.9x | 238 (11.5%) | 124 (8.8%) |
| 4.0x or more | 659 (31.9%) | 192 (13.6%) |
| Total | 2,067 (100.0%) | 1,412 (100.0%) |
Real Estate Taxes by Mortgage Status in Camp County
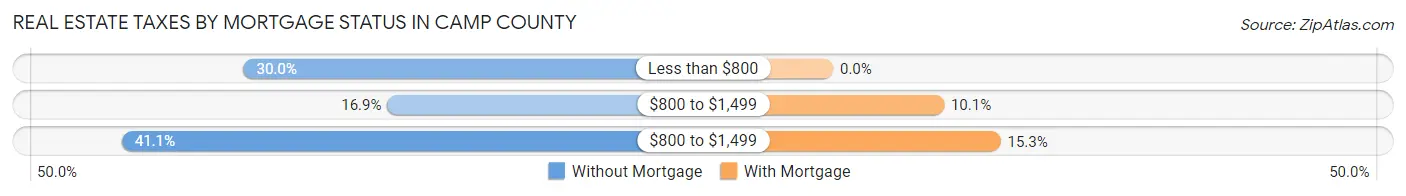
| Property Taxes | Without Mortgage | With Mortgage |
| Less than $800 | 620 (30.0%) | 0 (0.0%) |
| $800 to $1,499 | 349 (16.9%) | 143 (10.1%) |
| $800 to $1,499 | 850 (41.1%) | 216 (15.3%) |
| Total | 2,067 (100.0%) | 1,412 (100.0%) |
Health & Disability in Camp County
Health Insurance Coverage by Age in Camp County
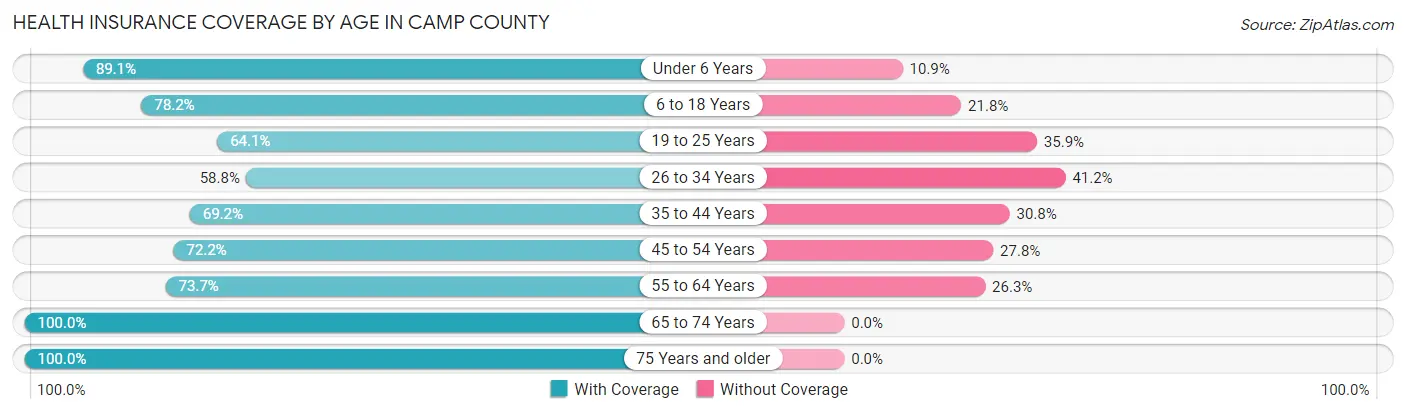
| Age Bracket | With Coverage | Without Coverage |
| Under 6 Years | 878 (89.1%) | 107 (10.9%) |
| 6 to 18 Years | 2,050 (78.2%) | 571 (21.8%) |
| 19 to 25 Years | 594 (64.1%) | 333 (35.9%) |
| 26 to 34 Years | 728 (58.8%) | 511 (41.2%) |
| 35 to 44 Years | 977 (69.2%) | 435 (30.8%) |
| 45 to 54 Years | 1,041 (72.2%) | 400 (27.8%) |
| 55 to 64 Years | 1,187 (73.7%) | 423 (26.3%) |
| 65 to 74 Years | 1,360 (100.0%) | 0 (0.0%) |
| 75 Years and older | 892 (100.0%) | 0 (0.0%) |
| Total | 9,707 (77.7%) | 2,780 (22.3%) |
Health Insurance Coverage by Citizenship Status in Camp County
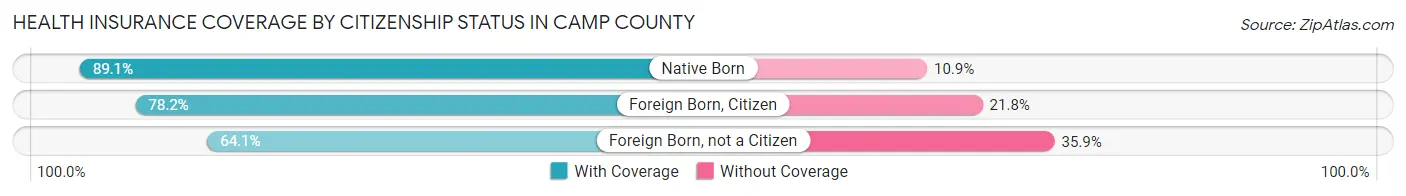
| Citizenship Status | With Coverage | Without Coverage |
| Native Born | 878 (89.1%) | 107 (10.9%) |
| Foreign Born, Citizen | 2,050 (78.2%) | 571 (21.8%) |
| Foreign Born, not a Citizen | 594 (64.1%) | 333 (35.9%) |
Health Insurance Coverage by Household Income in Camp County
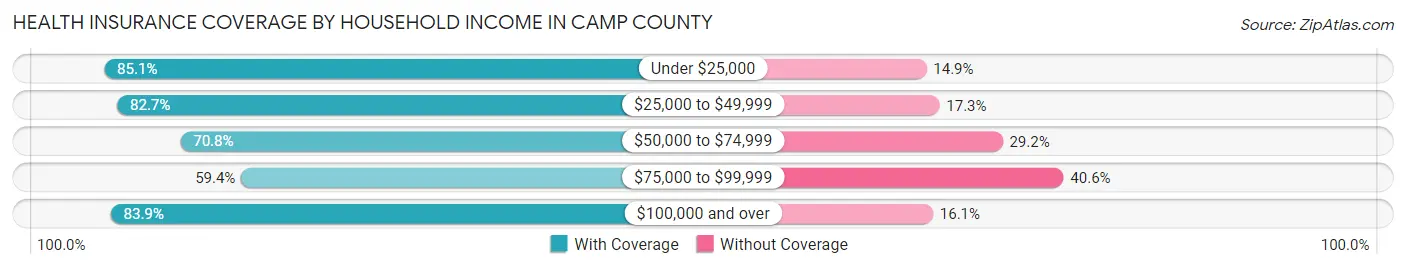
| Household Income | With Coverage | Without Coverage |
| Under $25,000 | 2,061 (85.1%) | 361 (14.9%) |
| $25,000 to $49,999 | 2,122 (82.7%) | 445 (17.3%) |
| $50,000 to $74,999 | 1,544 (70.8%) | 636 (29.2%) |
| $75,000 to $99,999 | 1,151 (59.4%) | 786 (40.6%) |
| $100,000 and over | 2,826 (83.9%) | 543 (16.1%) |
Public vs Private Health Insurance Coverage by Age in Camp County
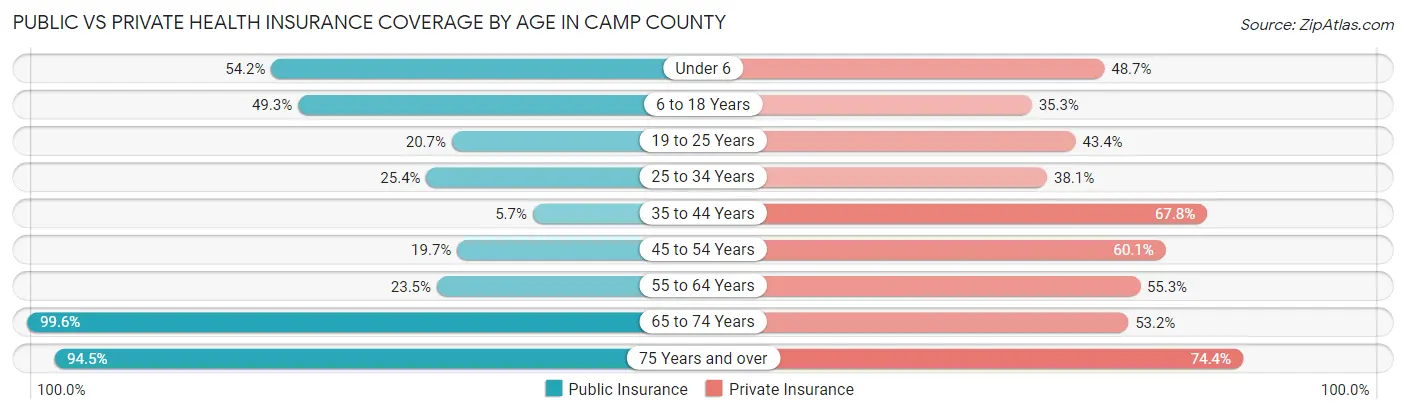
| Age Bracket | Public Insurance | Private Insurance |
| Under 6 | 534 (54.2%) | 480 (48.7%) |
| 6 to 18 Years | 1,291 (49.3%) | 924 (35.2%) |
| 19 to 25 Years | 192 (20.7%) | 402 (43.4%) |
| 25 to 34 Years | 315 (25.4%) | 472 (38.1%) |
| 35 to 44 Years | 80 (5.7%) | 957 (67.8%) |
| 45 to 54 Years | 284 (19.7%) | 866 (60.1%) |
| 55 to 64 Years | 378 (23.5%) | 891 (55.3%) |
| 65 to 74 Years | 1,354 (99.6%) | 723 (53.2%) |
| 75 Years and over | 843 (94.5%) | 664 (74.4%) |
| Total | 5,271 (42.2%) | 6,379 (51.1%) |
Disability Status by Sex by Age in Camp County
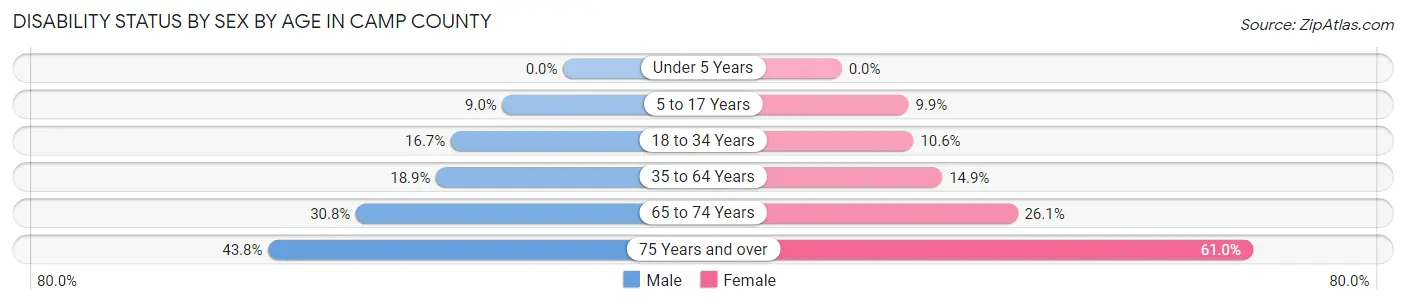
| Age Bracket | Male | Female |
| Under 5 Years | 0 (0.0%) | 0 (0.0%) |
| 5 to 17 Years | 108 (9.0%) | 128 (9.9%) |
| 18 to 34 Years | 199 (16.7%) | 135 (10.6%) |
| 35 to 64 Years | 398 (18.9%) | 351 (14.9%) |
| 65 to 74 Years | 199 (30.8%) | 186 (26.1%) |
| 75 Years and over | 184 (43.8%) | 288 (61.0%) |
Disability Class by Sex by Age in Camp County
Disability Class: Hearing Difficulty
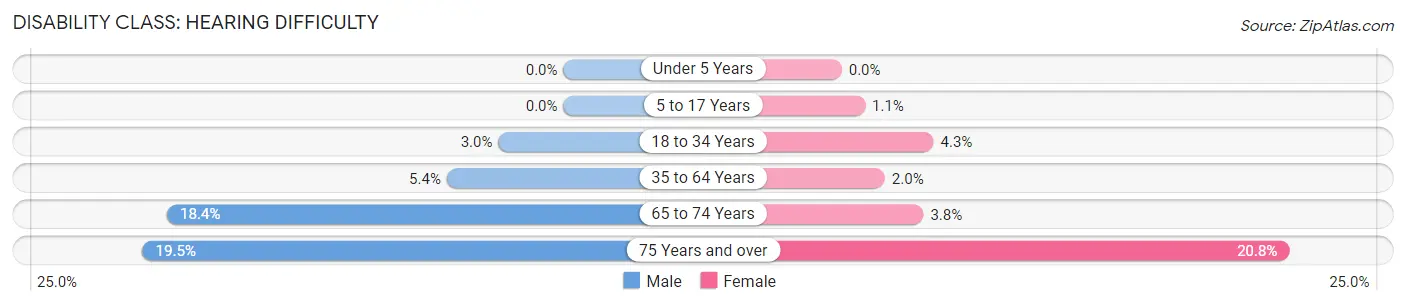
| Age Bracket | Male | Female |
| Under 5 Years | 0 (0.0%) | 0 (0.0%) |
| 5 to 17 Years | 0 (0.0%) | 14 (1.1%) |
| 18 to 34 Years | 36 (3.0%) | 54 (4.3%) |
| 35 to 64 Years | 114 (5.4%) | 47 (2.0%) |
| 65 to 74 Years | 119 (18.4%) | 27 (3.8%) |
| 75 Years and over | 82 (19.5%) | 98 (20.8%) |
Disability Class: Vision Difficulty
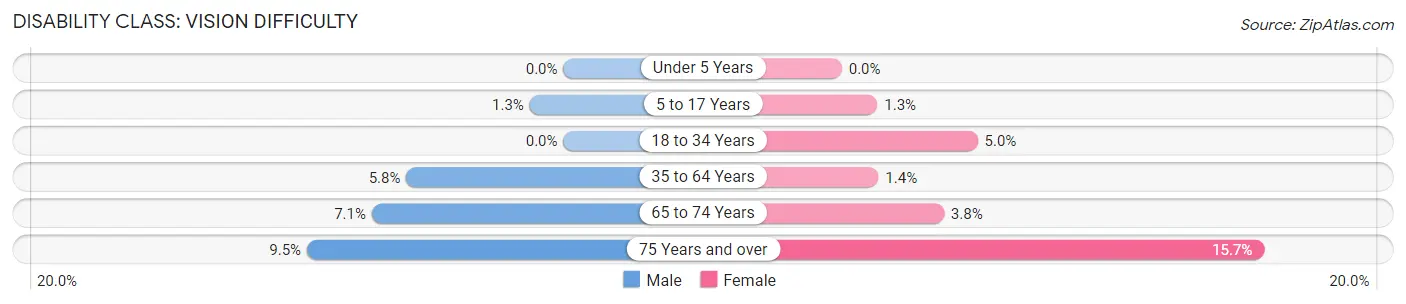
| Age Bracket | Male | Female |
| Under 5 Years | 0 (0.0%) | 0 (0.0%) |
| 5 to 17 Years | 15 (1.3%) | 17 (1.3%) |
| 18 to 34 Years | 0 (0.0%) | 64 (5.0%) |
| 35 to 64 Years | 123 (5.8%) | 32 (1.4%) |
| 65 to 74 Years | 46 (7.1%) | 27 (3.8%) |
| 75 Years and over | 40 (9.5%) | 74 (15.7%) |
Disability Class: Cognitive Difficulty
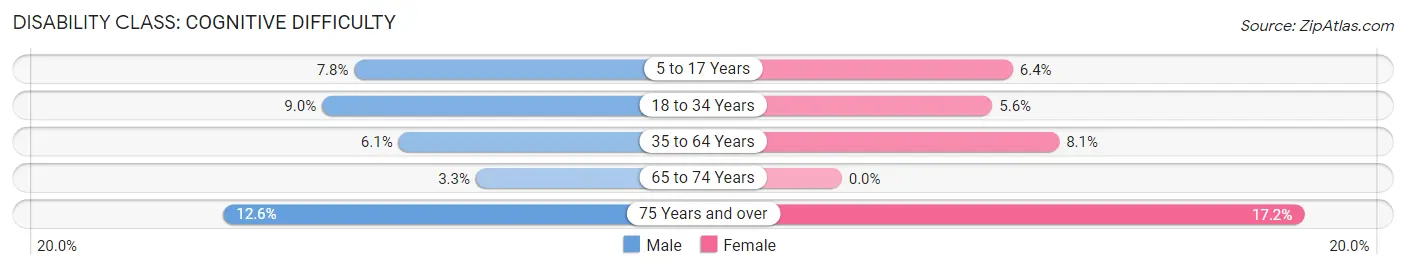
| Age Bracket | Male | Female |
| 5 to 17 Years | 93 (7.8%) | 82 (6.4%) |
| 18 to 34 Years | 107 (9.0%) | 71 (5.6%) |
| 35 to 64 Years | 129 (6.1%) | 190 (8.1%) |
| 65 to 74 Years | 21 (3.3%) | 0 (0.0%) |
| 75 Years and over | 53 (12.6%) | 81 (17.2%) |
Disability Class: Ambulatory Difficulty
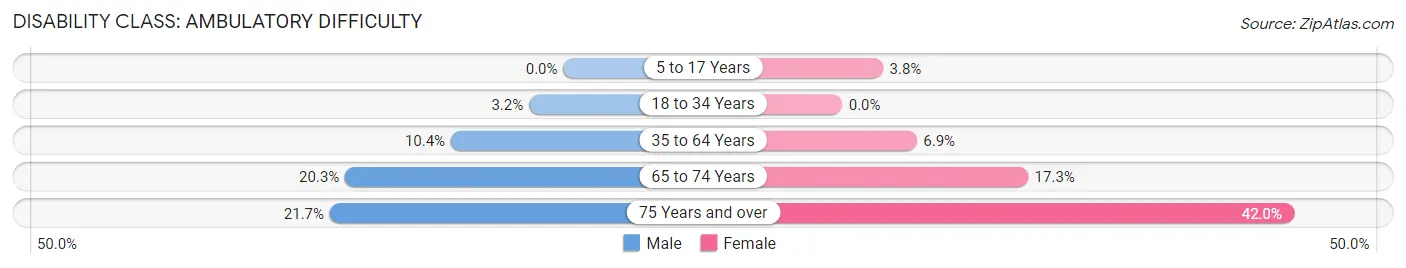
| Age Bracket | Male | Female |
| 5 to 17 Years | 0 (0.0%) | 49 (3.8%) |
| 18 to 34 Years | 38 (3.2%) | 0 (0.0%) |
| 35 to 64 Years | 220 (10.4%) | 163 (6.9%) |
| 65 to 74 Years | 131 (20.3%) | 123 (17.2%) |
| 75 Years and over | 91 (21.7%) | 198 (41.9%) |
Disability Class: Self-Care Difficulty
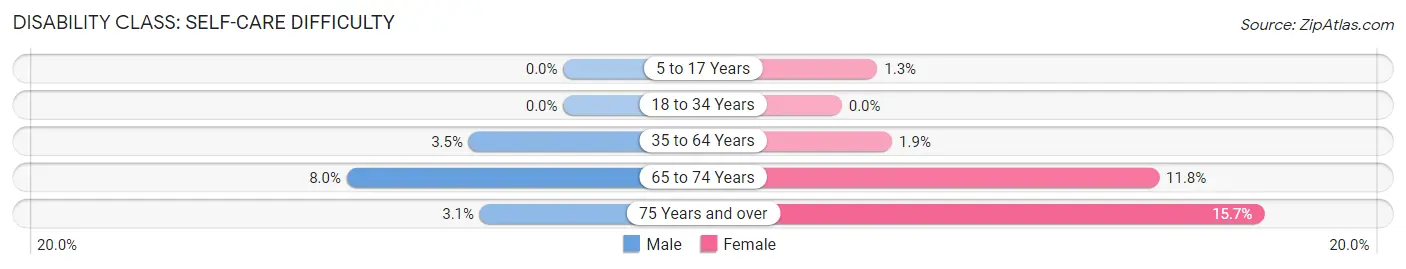
| Age Bracket | Male | Female |
| 5 to 17 Years | 0 (0.0%) | 17 (1.3%) |
| 18 to 34 Years | 0 (0.0%) | 0 (0.0%) |
| 35 to 64 Years | 74 (3.5%) | 44 (1.9%) |
| 65 to 74 Years | 52 (8.0%) | 84 (11.8%) |
| 75 Years and over | 13 (3.1%) | 74 (15.7%) |
Technology Access in Camp County
Computing Device Access in Camp County
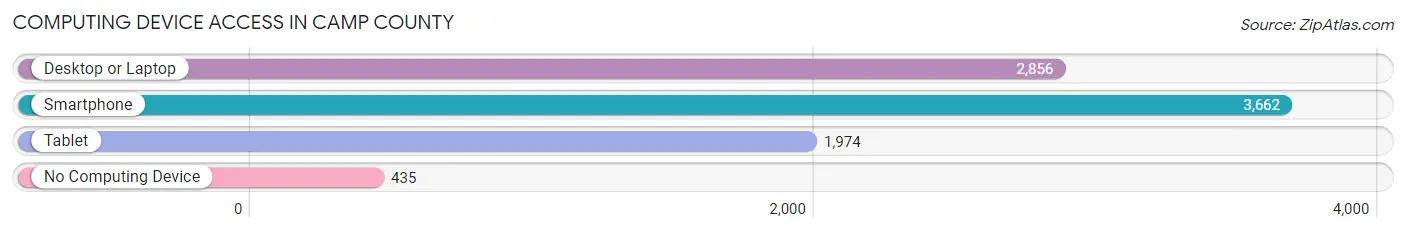
| Device Type | # Households | % Households |
| Desktop or Laptop | 2,856 | 64.3% |
| Smartphone | 3,662 | 82.4% |
| Tablet | 1,974 | 44.4% |
| No Computing Device | 435 | 9.8% |
| Total | 4,443 | 100.0% |
Internet Access in Camp County
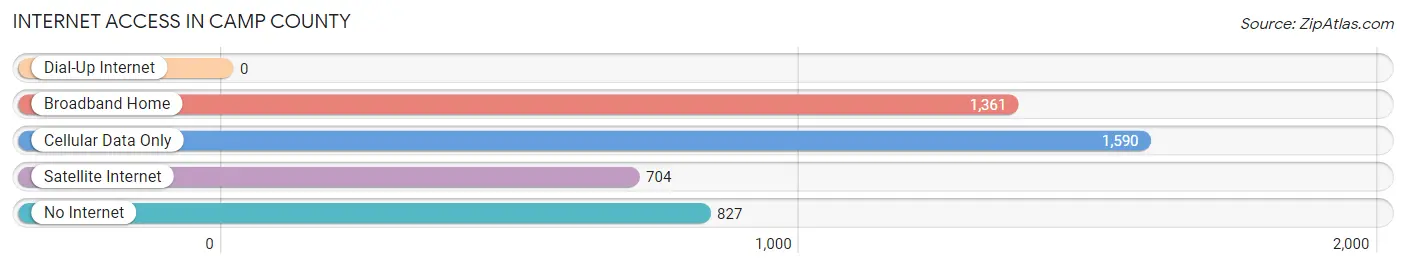
| Internet Type | # Households | % Households |
| Dial-Up Internet | 0 | 0.0% |
| Broadband Home | 1,361 | 30.6% |
| Cellular Data Only | 1,590 | 35.8% |
| Satellite Internet | 704 | 15.9% |
| No Internet | 827 | 18.6% |
| Total | 4,443 | 100.0% |
Camp County Summary
Introduction
Camp County is located in the northeastern corner of Texas, and is part of the Texarkana Metropolitan Statistical Area. It is bordered by Morris County to the north, Titus County to the east, Franklin County to the south, and Upshur County to the west. The county seat is Pittsburg, and the county has a total area of 545 square miles. As of the 2010 census, the population was 12,401.
History
Camp County was established in 1874 and named for John Lafayette Camp, a Confederate soldier and Texas state legislator. The county was originally part of Upshur County, but was later divided into its own county. The first settlers in the area were mostly farmers and ranchers, and the county was largely rural until the early 20th century.
In the early 1900s, the discovery of oil in the area led to an economic boom. The population of the county grew rapidly, and the town of Pittsburg was established in 1906. The oil industry continued to be a major part of the county’s economy until the mid-20th century, when it began to decline.
Geography
Camp County is located in the northeastern corner of Texas, and is part of the Texarkana Metropolitan Statistical Area. It is bordered by Morris County to the north, Titus County to the east, Franklin County to the south, and Upshur County to the west. The county has a total area of 545 square miles, and is mostly flat with some rolling hills. The terrain is mostly covered in pine and hardwood forests, with some open grasslands. The county is drained by the Sulphur River, which flows through the county from north to south.
Economy
Camp County’s economy is largely based on agriculture and forestry. The county is home to several large farms and ranches, and the timber industry is also an important part of the local economy. The county is also home to several manufacturing companies, including a paper mill and a furniture factory.
The county’s largest employer is the Pittsburg Independent School District, which employs over 1,000 people. Other major employers in the county include the Pittsburg Medical Center, the Pittsburg State University, and the Pittsburg County Courthouse.
Demographics
As of the 2010 census, the population of Camp County was 12,401. The population is largely white (83.3%), with small percentages of African American (11.2%), Hispanic (3.2%), and Native American (0.7%) residents. The median household income in the county is $37,945, and the median age is 40.
Conclusion
Camp County is a rural county located in the northeastern corner of Texas. It is bordered by Morris County to the north, Titus County to the east, Franklin County to the south, and Upshur County to the west. The county has a total area of 545 square miles, and is mostly flat with some rolling hills. The county’s economy is largely based on agriculture and forestry, and the largest employer is the Pittsburg Independent School District. As of the 2010 census, the population of Camp County was 12,401.
Common Questions
What is Per Capita Income in Camp County?
Per Capita income in Camp County is $28,004.
What is the Median Family Income in Camp County?
Median Family Income in Camp County is $63,868.
What is the Median Household income in Camp County?
Median Household Income in Camp County is $53,968.
What is Income or Wage Gap in Camp County?
Income or Wage Gap in Camp County is 50.8%.
Women in Camp County earn 49.2 cents for every dollar earned by a man.
What is Family Income Deficit in Camp County?
Family Income Deficit in Camp County is $9,463.
Families that are below poverty line in Camp County earn $9,463 less on average than the poverty threshold level.
What is Inequality or Gini Index in Camp County?
Inequality or Gini Index in Camp County is 0.48.
What is the Total Population of Camp County?
Total Population of Camp County is 12,543.
What is the Total Male Population of Camp County?
Total Male Population of Camp County is 6,007.
What is the Total Female Population of Camp County?
Total Female Population of Camp County is 6,536.
What is the Ratio of Males per 100 Females in Camp County?
There are 91.91 Males per 100 Females in Camp County.
What is the Ratio of Females per 100 Males in Camp County?
There are 108.81 Females per 100 Males in Camp County.
What is the Median Population Age in Camp County?
Median Population Age in Camp County is 39.0 Years.
What is the Average Family Size in Camp County
Average Family Size in Camp County is 3.4 People.
What is the Average Household Size in Camp County
Average Household Size in Camp County is 2.8 People.
How Large is the Labor Force in Camp County?
There are 5,513 People in the Labor Forcein in Camp County.
What is the Percentage of People in the Labor Force in Camp County?
57.6% of People are in the Labor Force in Camp County.
What is the Unemployment Rate in Camp County?
Unemployment Rate in Camp County is 5.4%.