Callahan County, TX Map & Demographics
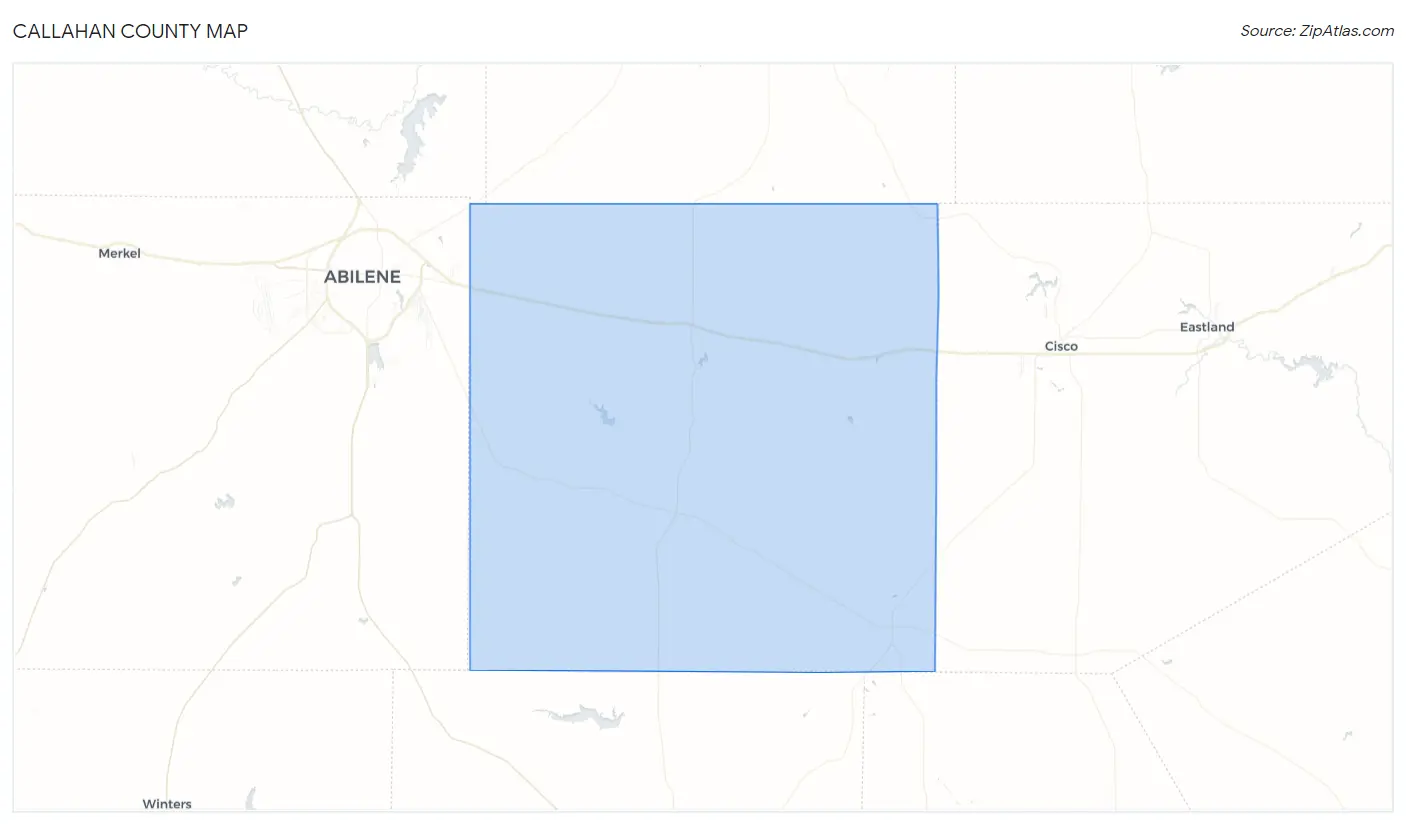
Callahan County Map
Callahan County Overview
$31,856
PER CAPITA INCOME
$71,302
AVG FAMILY INCOME
$63,906
AVG HOUSEHOLD INCOME
42.5%
WAGE / INCOME GAP [ % ]
57.5¢/ $1
WAGE / INCOME GAP [ $ ]
0.40
INEQUALITY / GINI INDEX
13,869
TOTAL POPULATION
6,917
MALE POPULATION
6,952
FEMALE POPULATION
99.50
MALES / 100 FEMALES
100.51
FEMALES / 100 MALES
43.5
MEDIAN AGE
3.2
AVG FAMILY SIZE
2.6
AVG HOUSEHOLD SIZE
6,559
LABOR FORCE [ PEOPLE ]
58.0%
PERCENT IN LABOR FORCE
4.8%
UNEMPLOYMENT RATE
Income in Callahan County
Income Overview in Callahan County
Per Capita Income in Callahan County is $31,856, while median incomes of families and households are $71,302 and $63,906 respectively.
| Characteristic | Number | Measure |
| Per Capita Income | 13,869 | $31,856 |
| Median Family Income | 3,542 | $71,302 |
| Mean Family Income | 3,542 | $90,846 |
| Median Household Income | 5,270 | $63,906 |
| Mean Household Income | 5,270 | $77,474 |
| Income Deficit | 3,542 | $0 |
| Wage / Income Gap (%) | 13,869 | 42.48% |
| Wage / Income Gap ($) | 13,869 | 57.52¢ per $1 |
| Gini / Inequality Index | 13,869 | 0.40 |
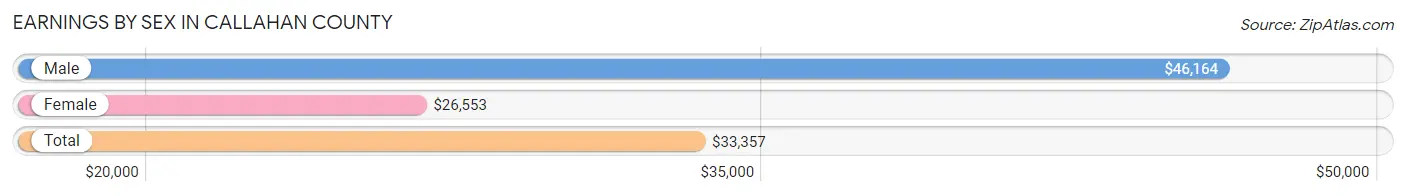
Earnings by Sex in Callahan County
Average Earnings in Callahan County are $33,357, $46,164 for men and $26,553 for women, a difference of 42.5%.
| Sex | Number | Average Earnings |
| Male | 3,732 (54.7%) | $46,164 |
| Female | 3,087 (45.3%) | $26,553 |
| Total | 6,819 (100.0%) | $33,357 |
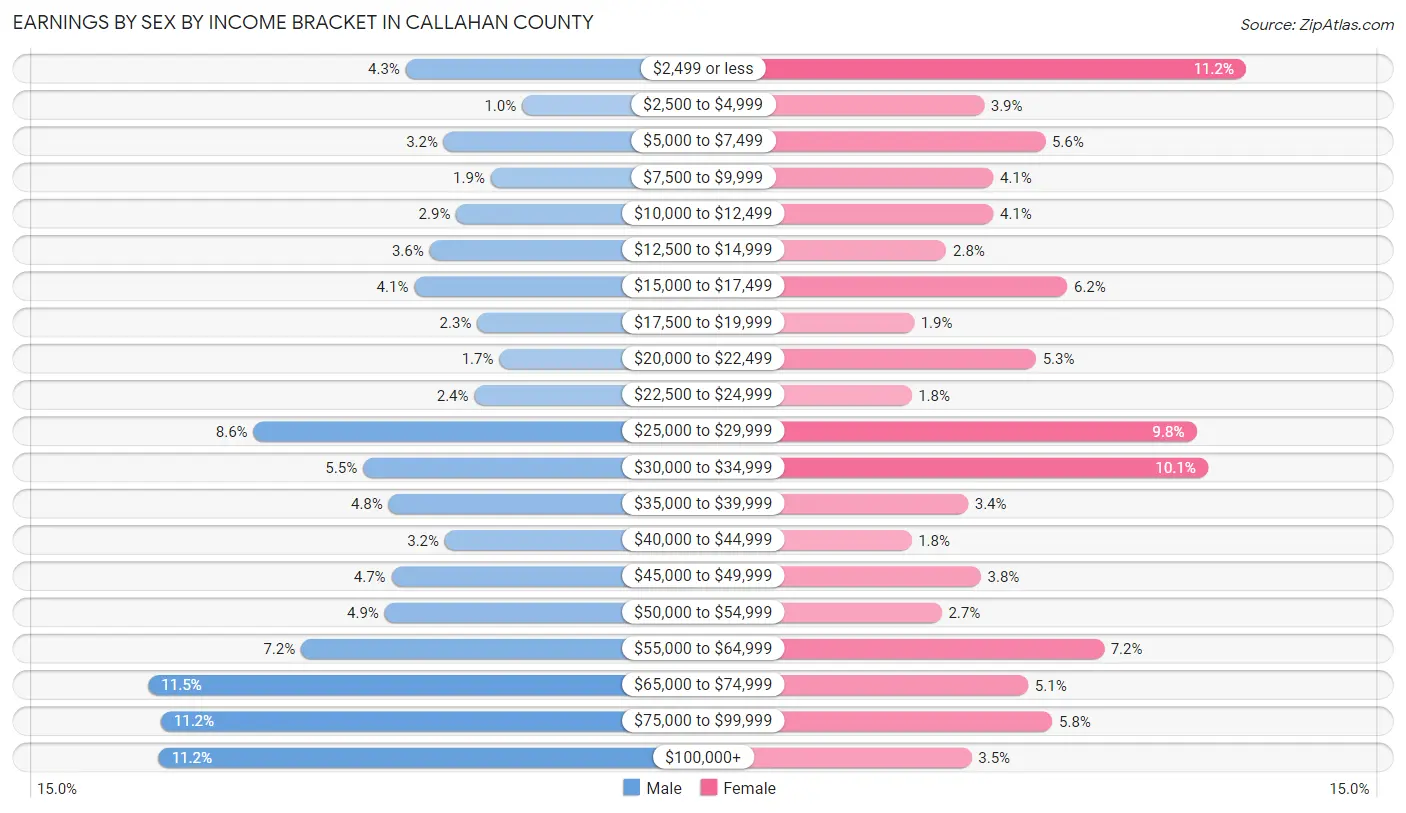
Earnings by Sex by Income Bracket in Callahan County
The most common earnings brackets in Callahan County are $65,000 to $74,999 for men (430 | 11.5%) and $2,499 or less for women (346 | 11.2%).
| Income | Male | Female |
| $2,499 or less | 160 (4.3%) | 346 (11.2%) |
| $2,500 to $4,999 | 38 (1.0%) | 119 (3.8%) |
| $5,000 to $7,499 | 120 (3.2%) | 172 (5.6%) |
| $7,500 to $9,999 | 71 (1.9%) | 127 (4.1%) |
| $10,000 to $12,499 | 107 (2.9%) | 127 (4.1%) |
| $12,500 to $14,999 | 135 (3.6%) | 86 (2.8%) |
| $15,000 to $17,499 | 151 (4.1%) | 191 (6.2%) |
| $17,500 to $19,999 | 85 (2.3%) | 58 (1.9%) |
| $20,000 to $22,499 | 62 (1.7%) | 164 (5.3%) |
| $22,500 to $24,999 | 88 (2.4%) | 56 (1.8%) |
| $25,000 to $29,999 | 320 (8.6%) | 303 (9.8%) |
| $30,000 to $34,999 | 205 (5.5%) | 313 (10.1%) |
| $35,000 to $39,999 | 178 (4.8%) | 105 (3.4%) |
| $40,000 to $44,999 | 119 (3.2%) | 56 (1.8%) |
| $45,000 to $49,999 | 175 (4.7%) | 116 (3.8%) |
| $50,000 to $54,999 | 182 (4.9%) | 82 (2.7%) |
| $55,000 to $64,999 | 270 (7.2%) | 223 (7.2%) |
| $65,000 to $74,999 | 430 (11.5%) | 157 (5.1%) |
| $75,000 to $99,999 | 417 (11.2%) | 178 (5.8%) |
| $100,000+ | 419 (11.2%) | 108 (3.5%) |
| Total | 3,732 (100.0%) | 3,087 (100.0%) |
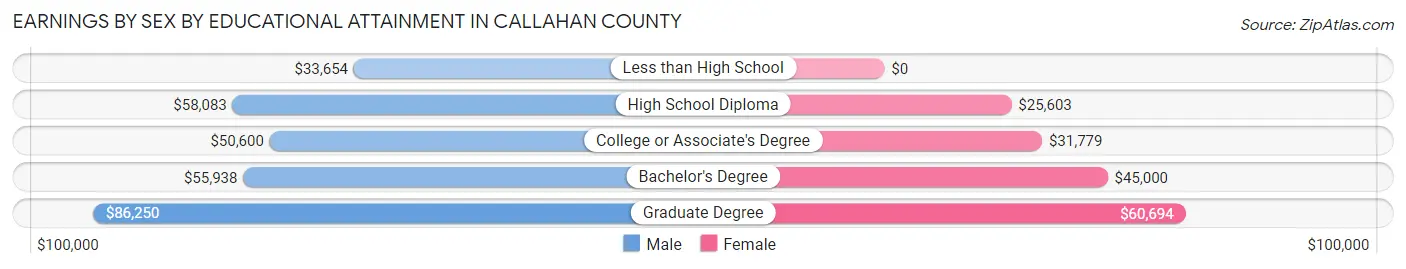
Earnings by Sex by Educational Attainment in Callahan County
Average earnings in Callahan County are $52,091 for men and $29,726 for women, a difference of 42.9%. Men with an educational attainment of graduate degree enjoy the highest average annual earnings of $86,250, while those with less than high school education earn the least with $33,654. Women with an educational attainment of graduate degree earn the most with the average annual earnings of $60,694, while those with high school diploma education have the smallest earnings of $25,603.
| Educational Attainment | Male Income | Female Income |
| Less than High School | $33,654 | $0 |
| High School Diploma | $58,083 | $25,603 |
| College or Associate's Degree | $50,600 | $31,779 |
| Bachelor's Degree | $55,938 | $45,000 |
| Graduate Degree | $86,250 | $60,694 |
| Total | $52,091 | $29,726 |
Family Income in Callahan County
Family Income Brackets in Callahan County
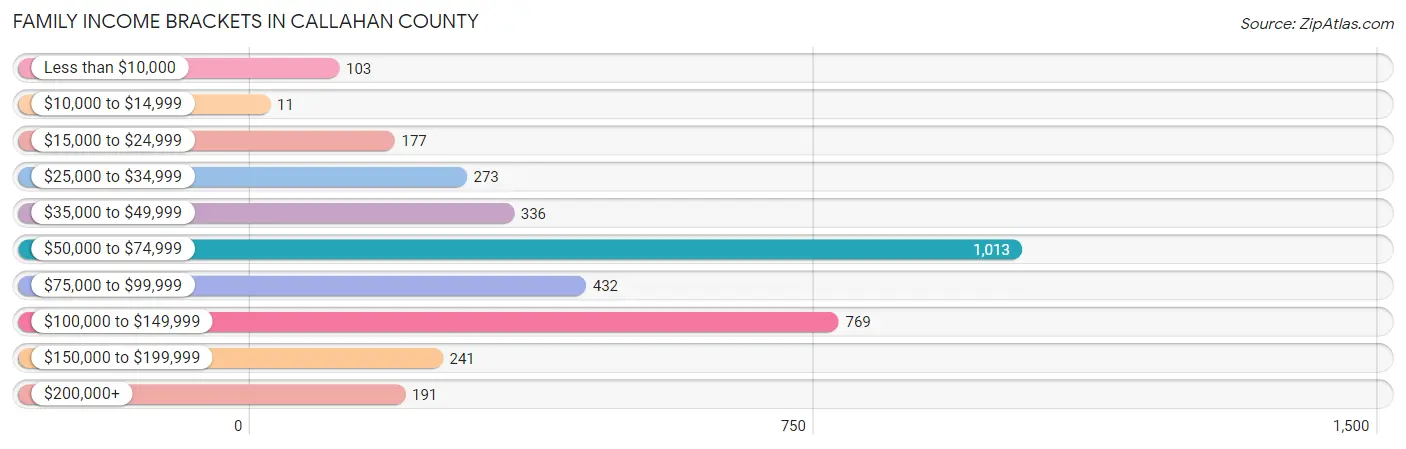
According to the Callahan County family income data, there are 1,013 families falling into the $50,000 to $74,999 income range, which is the most common income bracket and makes up 28.6% of all families. Conversely, the $10,000 to $14,999 income bracket is the least frequent group with only 11 families (0.3%) belonging to this category.
| Income Bracket | # Families | % Families |
| Less than $10,000 | 103 | 2.9% |
| $10,000 to $14,999 | 11 | 0.3% |
| $15,000 to $24,999 | 177 | 5.0% |
| $25,000 to $34,999 | 273 | 7.7% |
| $35,000 to $49,999 | 336 | 9.5% |
| $50,000 to $74,999 | 1,013 | 28.6% |
| $75,000 to $99,999 | 432 | 12.2% |
| $100,000 to $149,999 | 769 | 21.7% |
| $150,000 to $199,999 | 241 | 6.8% |
| $200,000+ | 191 | 5.4% |
Family Income by Famaliy Size in Callahan County
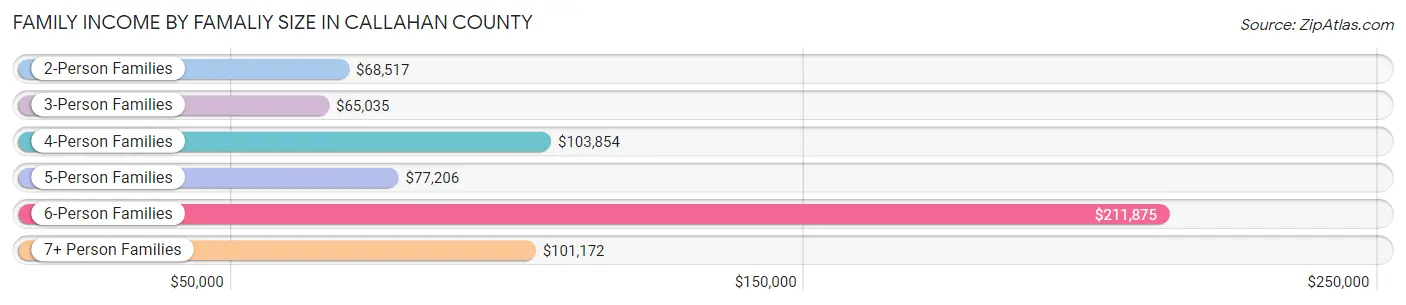
6-person families (44 | 1.2%) account for the highest median family income in Callahan County with $211,875 per family, while 6-person families (44 | 1.2%) have the highest median income of $35,312 per family member.
| Income Bracket | # Families | Median Income |
| 2-Person Families | 1,951 (55.1%) | $68,517 |
| 3-Person Families | 765 (21.6%) | $65,035 |
| 4-Person Families | 447 (12.6%) | $103,854 |
| 5-Person Families | 262 (7.4%) | $77,206 |
| 6-Person Families | 44 (1.2%) | $211,875 |
| 7+ Person Families | 73 (2.1%) | $101,172 |
| Total | 3,542 (100.0%) | $71,302 |
Family Income by Number of Earners in Callahan County
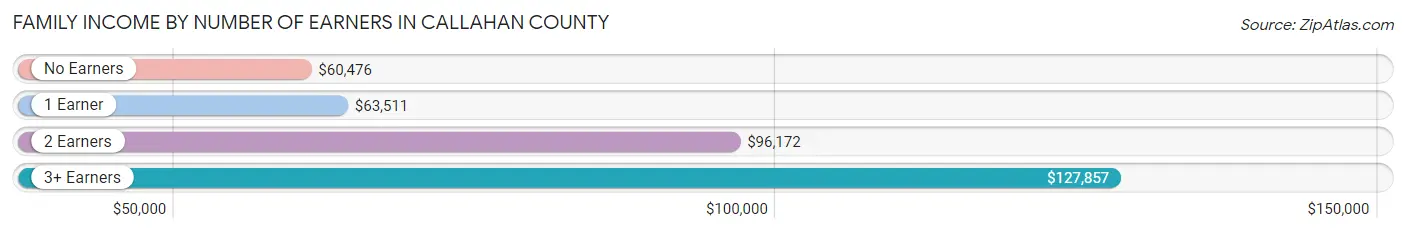
The median family income in Callahan County is $71,302, with families comprising 3+ earners (252) having the highest median family income of $127,857, while families with no earners (666) have the lowest median family income of $60,476, accounting for 7.1% and 18.8% of families, respectively.
| Number of Earners | # Families | Median Income |
| No Earners | 666 (18.8%) | $60,476 |
| 1 Earner | 1,312 (37.0%) | $63,511 |
| 2 Earners | 1,312 (37.0%) | $96,172 |
| 3+ Earners | 252 (7.1%) | $127,857 |
| Total | 3,542 (100.0%) | $71,302 |
Household Income in Callahan County
Household Income Brackets in Callahan County
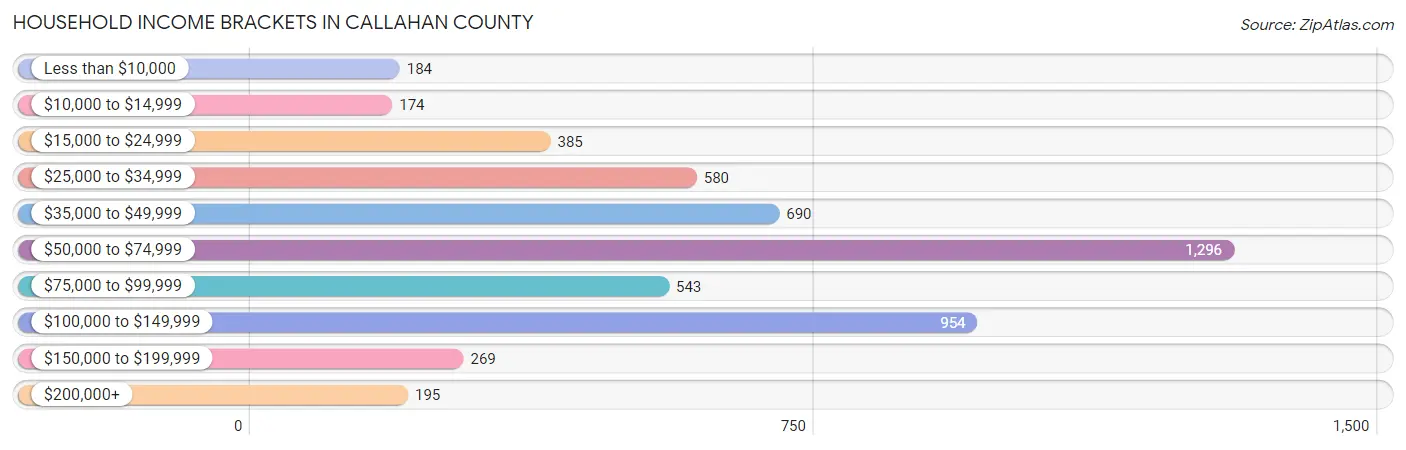
With 1,296 households falling in the category, the $50,000 to $74,999 income range is the most frequent in Callahan County, accounting for 24.6% of all households. In contrast, only 174 households (3.3%) fall into the $10,000 to $14,999 income bracket, making it the least populous group.
| Income Bracket | # Households | % Households |
| Less than $10,000 | 184 | 3.5% |
| $10,000 to $14,999 | 174 | 3.3% |
| $15,000 to $24,999 | 385 | 7.3% |
| $25,000 to $34,999 | 580 | 11.0% |
| $35,000 to $49,999 | 690 | 13.1% |
| $50,000 to $74,999 | 1,296 | 24.6% |
| $75,000 to $99,999 | 543 | 10.3% |
| $100,000 to $149,999 | 954 | 18.1% |
| $150,000 to $199,999 | 269 | 5.1% |
| $200,000+ | 195 | 3.7% |
Household Income by Householder Age in Callahan County
The median household income in Callahan County is $63,906, with the highest median household income of $72,524 found in the 25 to 44 years age bracket for the primary householder. A total of 1,250 households (23.7%) fall into this category. Meanwhile, the 15 to 24 years age bracket for the primary householder has the lowest median household income of $38,147, with 147 households (2.8%) in this group.
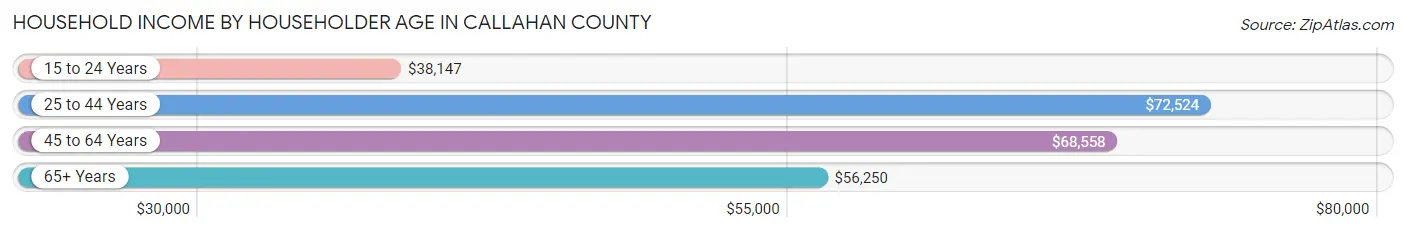
| Income Bracket | # Households | Median Income |
| 15 to 24 Years | 147 (2.8%) | $38,147 |
| 25 to 44 Years | 1,250 (23.7%) | $72,524 |
| 45 to 64 Years | 1,964 (37.3%) | $68,558 |
| 65+ Years | 1,909 (36.2%) | $56,250 |
| Total | 5,270 (100.0%) | $63,906 |
Poverty in Callahan County
Income Below Poverty by Sex and Age in Callahan County
With 7.5% poverty level for males and 10.1% for females among the residents of Callahan County, under 5 year old males and 15 year old females are the most vulnerable to poverty, with 83 males (22.9%) and 62 females (51.2%) in their respective age groups living below the poverty level.
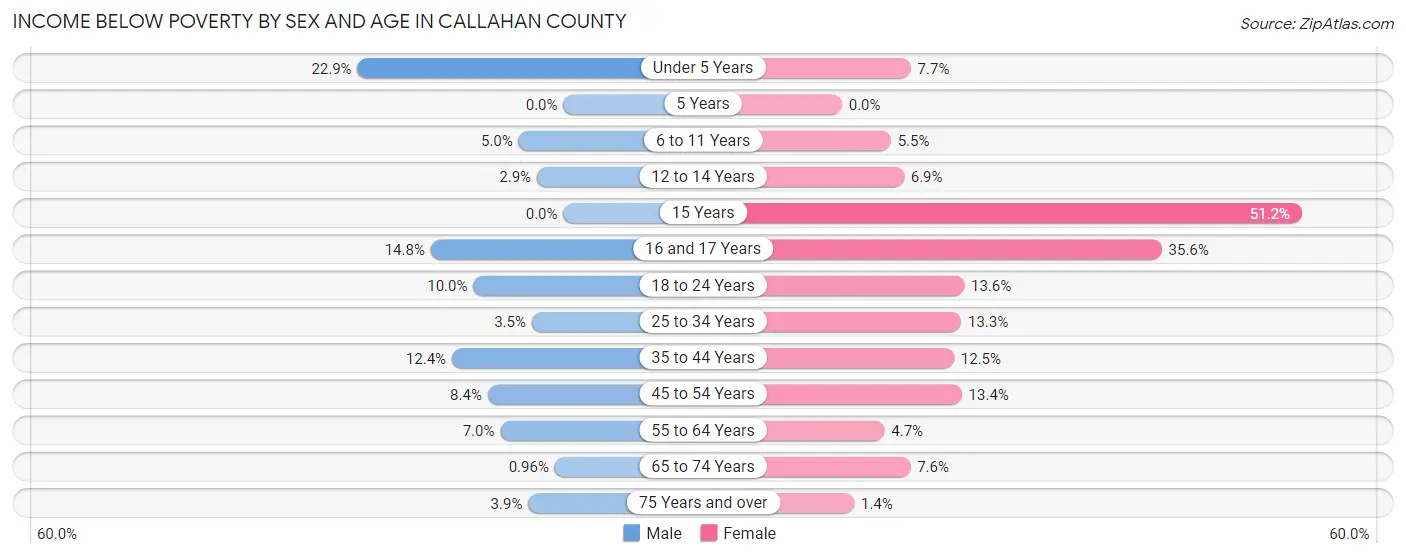
| Age Bracket | Male | Female |
| Under 5 Years | 83 (22.9%) | 28 (7.7%) |
| 5 Years | 0 (0.0%) | 0 (0.0%) |
| 6 to 11 Years | 26 (5.0%) | 23 (5.4%) |
| 12 to 14 Years | 7 (2.9%) | 14 (6.9%) |
| 15 Years | 0 (0.0%) | 62 (51.2%) |
| 16 and 17 Years | 39 (14.8%) | 52 (35.6%) |
| 18 to 24 Years | 59 (10.0%) | 79 (13.6%) |
| 25 to 34 Years | 25 (3.5%) | 98 (13.3%) |
| 35 to 44 Years | 102 (12.4%) | 99 (12.5%) |
| 45 to 54 Years | 71 (8.4%) | 112 (13.4%) |
| 55 to 64 Years | 72 (7.0%) | 51 (4.7%) |
| 65 to 74 Years | 8 (1.0%) | 65 (7.6%) |
| 75 Years and over | 20 (3.9%) | 8 (1.4%) |
| Total | 512 (7.5%) | 691 (10.1%) |
Income Above Poverty by Sex and Age in Callahan County
According to the poverty statistics in Callahan County, males aged 5 years and females aged 5 years are the age groups that are most secure financially, with 100.0% of males and 100.0% of females in these age groups living above the poverty line.
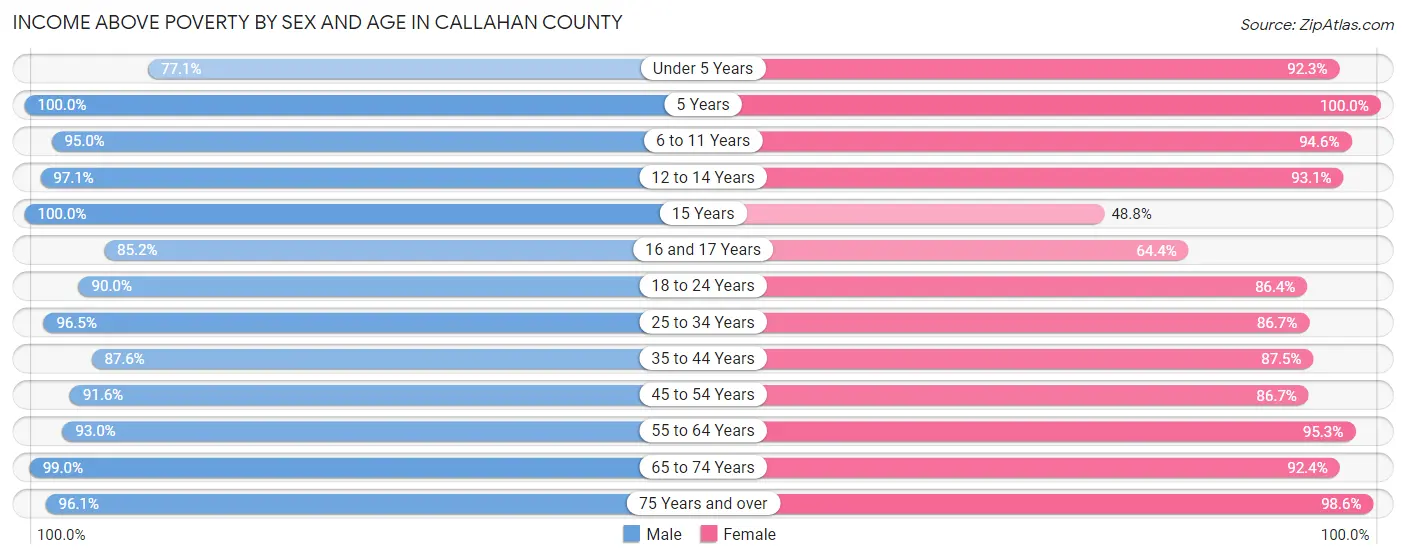
| Age Bracket | Male | Female |
| Under 5 Years | 279 (77.1%) | 337 (92.3%) |
| 5 Years | 51 (100.0%) | 154 (100.0%) |
| 6 to 11 Years | 495 (95.0%) | 399 (94.6%) |
| 12 to 14 Years | 231 (97.1%) | 189 (93.1%) |
| 15 Years | 30 (100.0%) | 59 (48.8%) |
| 16 and 17 Years | 225 (85.2%) | 94 (64.4%) |
| 18 to 24 Years | 529 (90.0%) | 501 (86.4%) |
| 25 to 34 Years | 688 (96.5%) | 640 (86.7%) |
| 35 to 44 Years | 720 (87.6%) | 694 (87.5%) |
| 45 to 54 Years | 772 (91.6%) | 727 (86.7%) |
| 55 to 64 Years | 954 (93.0%) | 1,024 (95.3%) |
| 65 to 74 Years | 829 (99.0%) | 788 (92.4%) |
| 75 Years and over | 492 (96.1%) | 581 (98.6%) |
| Total | 6,295 (92.5%) | 6,187 (89.9%) |
Income Below Poverty Among Married-Couple Families in Callahan County
The poverty statistics for married-couple families in Callahan County show that 2.4% or 67 of the total 2,842 families live below the poverty line. Families with 1 or 2 children have the highest poverty rate of 3.5%, comprising of 26 families. On the other hand, families with 5 or more children have the lowest poverty rate of 0.0%, which includes 0 families.
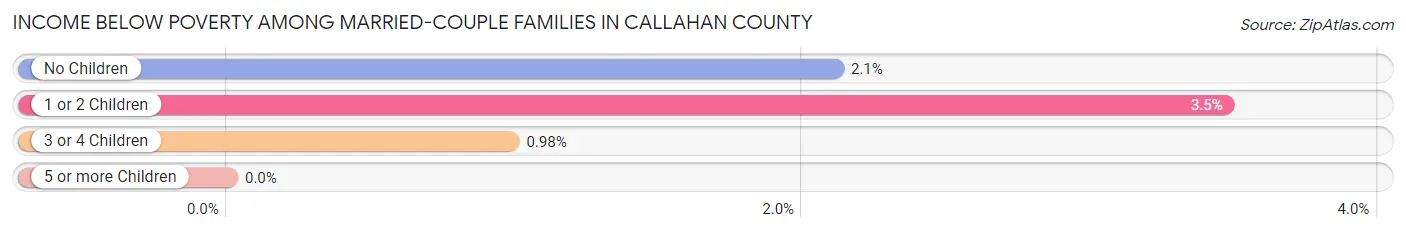
| Children | Above Poverty | Below Poverty |
| No Children | 1,807 (97.9%) | 39 (2.1%) |
| 1 or 2 Children | 724 (96.5%) | 26 (3.5%) |
| 3 or 4 Children | 202 (99.0%) | 2 (1.0%) |
| 5 or more Children | 42 (100.0%) | 0 (0.0%) |
| Total | 2,775 (97.6%) | 67 (2.4%) |
Income Below Poverty Among Single-Parent Households in Callahan County
According to the poverty data in Callahan County, 7.5% or 9 single-father households and 23.6% or 137 single-mother households are living below the poverty line. Among single-father households, those with 1 or 2 children have the highest poverty rate, with 4 households (18.2%) experiencing poverty. Likewise, among single-mother households, those with 3 or 4 children have the highest poverty rate, with 40 households (85.1%) falling below the poverty line.
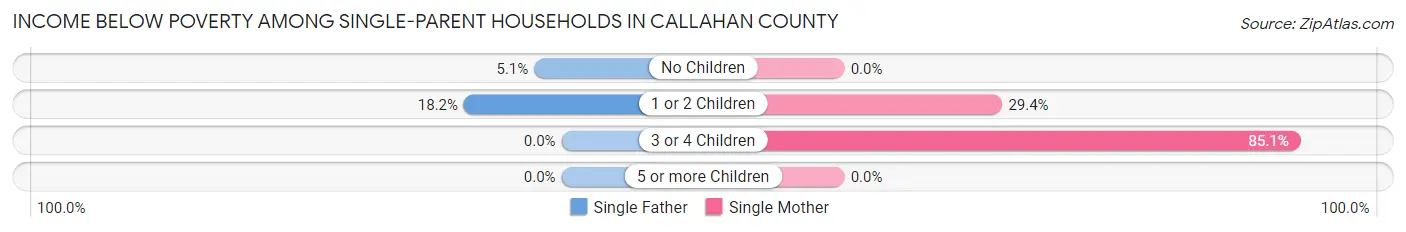
| Children | Single Father | Single Mother |
| No Children | 5 (5.1%) | 0 (0.0%) |
| 1 or 2 Children | 4 (18.2%) | 97 (29.4%) |
| 3 or 4 Children | 0 (0.0%) | 40 (85.1%) |
| 5 or more Children | 0 (0.0%) | 0 (0.0%) |
| Total | 9 (7.5%) | 137 (23.6%) |
Income Below Poverty Among Married-Couple vs Single-Parent Households in Callahan County
The poverty data for Callahan County shows that 67 of the married-couple family households (2.4%) and 146 of the single-parent households (20.9%) are living below the poverty level. Within the married-couple family households, those with 1 or 2 children have the highest poverty rate, with 26 households (3.5%) falling below the poverty line. Among the single-parent households, those with 3 or 4 children have the highest poverty rate, with 40 household (85.1%) living below poverty.
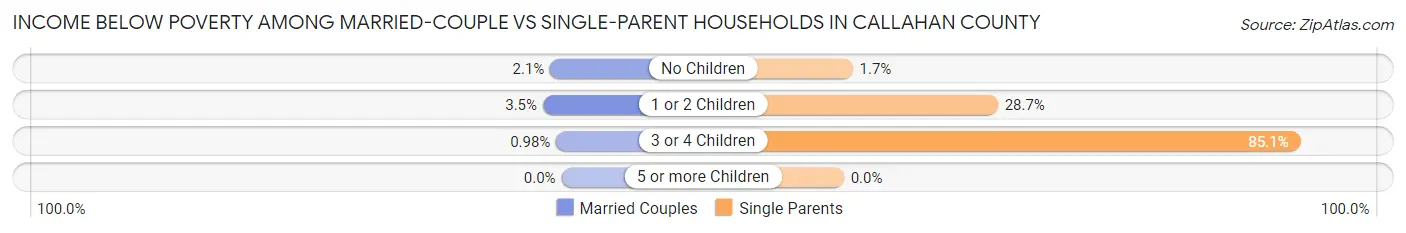
| Children | Married-Couple Families | Single-Parent Households |
| No Children | 39 (2.1%) | 5 (1.7%) |
| 1 or 2 Children | 26 (3.5%) | 101 (28.7%) |
| 3 or 4 Children | 2 (1.0%) | 40 (85.1%) |
| 5 or more Children | 0 (0.0%) | 0 (0.0%) |
| Total | 67 (2.4%) | 146 (20.9%) |
Race in Callahan County
The most populous races in Callahan County are White / Caucasian (12,261 | 88.4%), Hispanic or Latino (1,481 | 10.7%), and Two or more Races (1,098 | 7.9%).
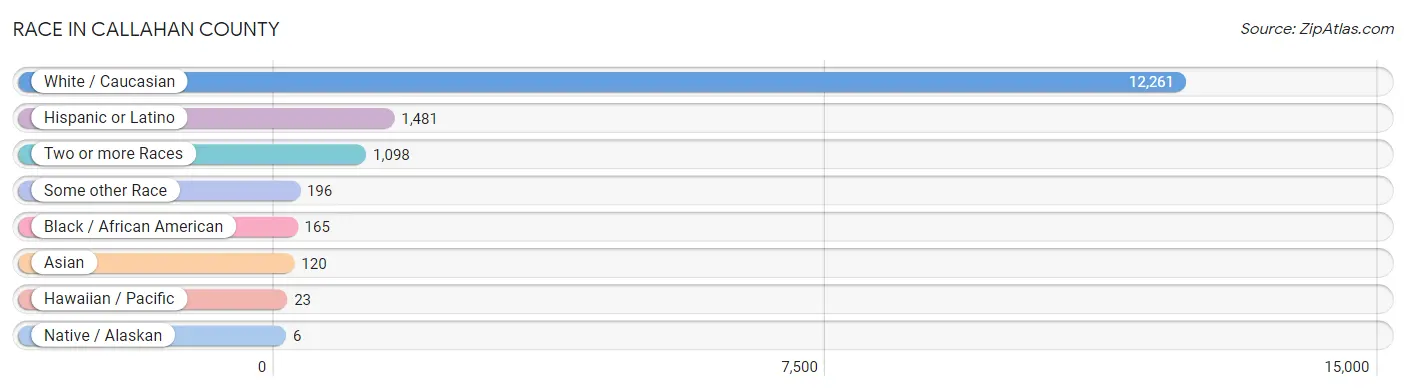
| Race | # Population | % Population |
| Asian | 120 | 0.9% |
| Black / African American | 165 | 1.2% |
| Hawaiian / Pacific | 23 | 0.2% |
| Hispanic or Latino | 1,481 | 10.7% |
| Native / Alaskan | 6 | 0.0% |
| White / Caucasian | 12,261 | 88.4% |
| Two or more Races | 1,098 | 7.9% |
| Some other Race | 196 | 1.4% |
| Total | 13,869 | 100.0% |
Ancestry in Callahan County
The most populous ancestries reported in Callahan County are Irish (1,910 | 13.8%), German (1,693 | 12.2%), English (1,485 | 10.7%), European (1,431 | 10.3%), and Mexican (1,382 | 10.0%), together accounting for 57.0% of all Callahan County residents.
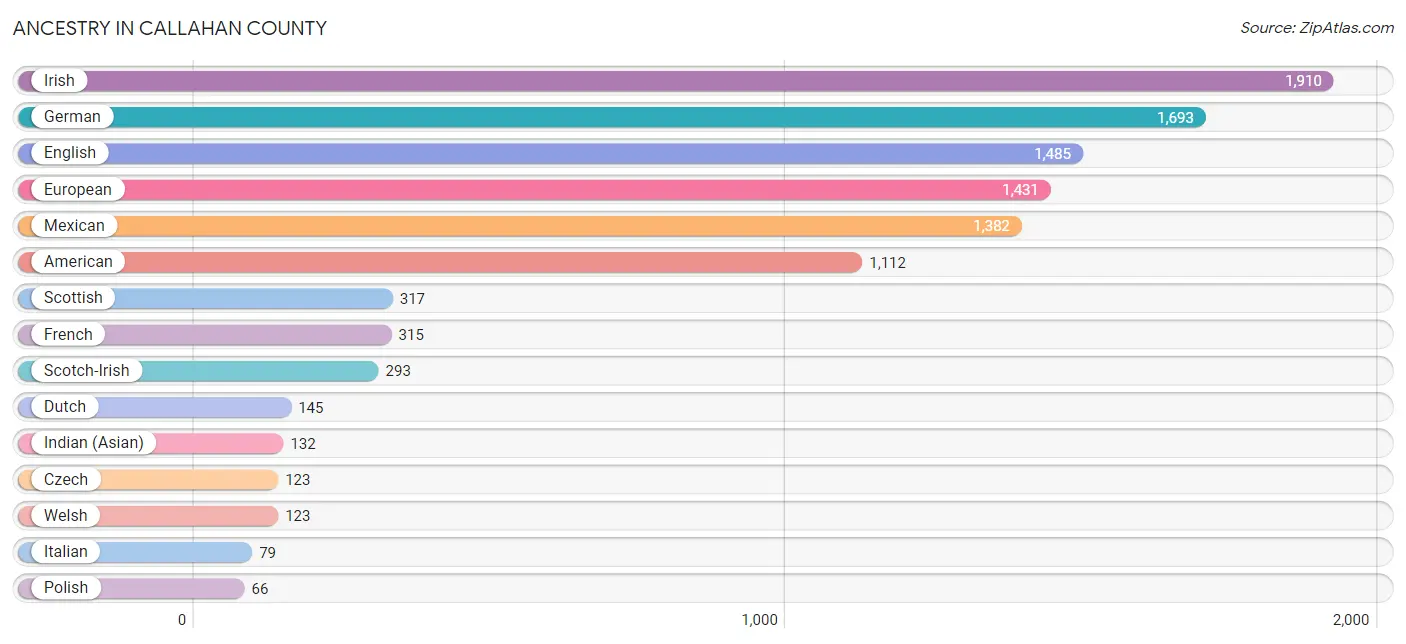
| Ancestry | # Population | % Population |
| American | 1,112 | 8.0% |
| Bhutanese | 35 | 0.3% |
| Blackfeet | 26 | 0.2% |
| British | 43 | 0.3% |
| Central American | 7 | 0.1% |
| Cherokee | 12 | 0.1% |
| Choctaw | 9 | 0.1% |
| Comanche | 3 | 0.0% |
| Czech | 123 | 0.9% |
| Danish | 3 | 0.0% |
| Dutch | 145 | 1.1% |
| Dutch West Indian | 20 | 0.1% |
| Eastern European | 8 | 0.1% |
| Ecuadorian | 23 | 0.2% |
| English | 1,485 | 10.7% |
| European | 1,431 | 10.3% |
| French | 315 | 2.3% |
| French Canadian | 39 | 0.3% |
| German | 1,693 | 12.2% |
| Guatemalan | 7 | 0.1% |
| Hungarian | 16 | 0.1% |
| Indian (Asian) | 132 | 0.9% |
| Irish | 1,910 | 13.8% |
| Italian | 79 | 0.6% |
| Lithuanian | 17 | 0.1% |
| Mexican | 1,382 | 10.0% |
| Native Hawaiian | 23 | 0.2% |
| Navajo | 10 | 0.1% |
| Northern European | 25 | 0.2% |
| Norwegian | 61 | 0.4% |
| Pennsylvania German | 34 | 0.3% |
| Polish | 66 | 0.5% |
| Portuguese | 1 | 0.0% |
| Puerto Rican | 19 | 0.1% |
| Russian | 28 | 0.2% |
| Scandinavian | 37 | 0.3% |
| Scotch-Irish | 293 | 2.1% |
| Scottish | 317 | 2.3% |
| South American | 23 | 0.2% |
| Spanish | 50 | 0.4% |
| Swedish | 12 | 0.1% |
| Welsh | 123 | 0.9% | View All 42 Rows |
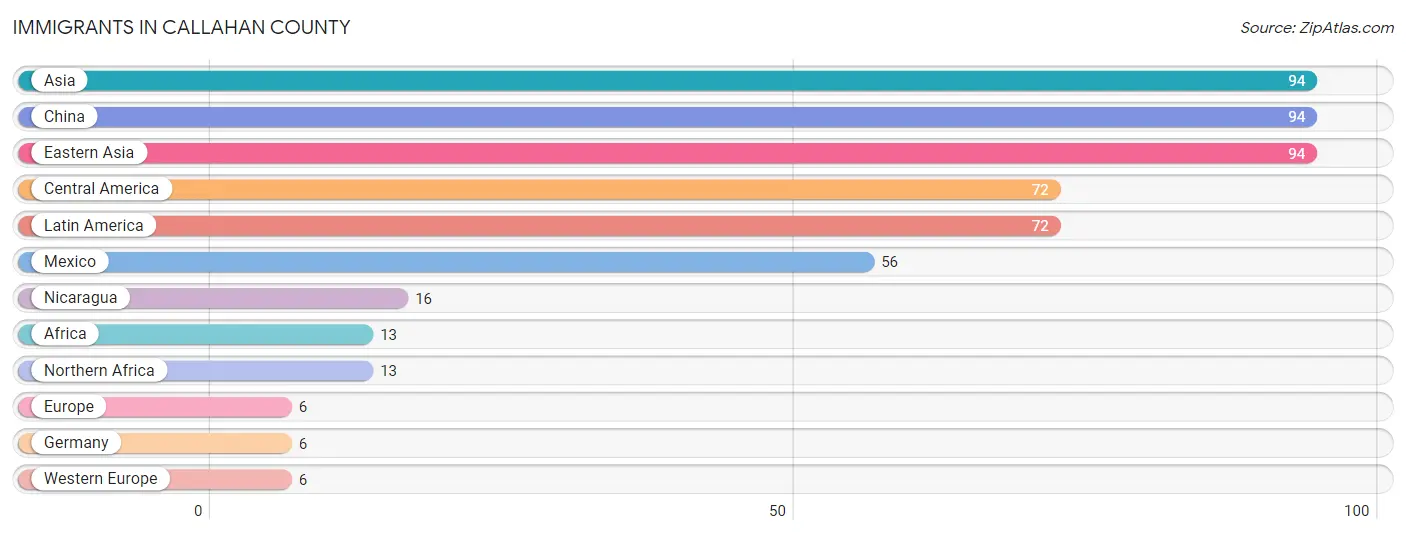
Immigrants in Callahan County
The most numerous immigrant groups reported in Callahan County came from Asia (94 | 0.7%), China (94 | 0.7%), Eastern Asia (94 | 0.7%), Central America (72 | 0.5%), and Latin America (72 | 0.5%), together accounting for 3.1% of all Callahan County residents.
| Immigration Origin | # Population | % Population |
| Africa | 13 | 0.1% |
| Asia | 94 | 0.7% |
| Central America | 72 | 0.5% |
| China | 94 | 0.7% |
| Eastern Asia | 94 | 0.7% |
| Europe | 6 | 0.0% |
| Germany | 6 | 0.0% |
| Latin America | 72 | 0.5% |
| Mexico | 56 | 0.4% |
| Nicaragua | 16 | 0.1% |
| Northern Africa | 13 | 0.1% |
| Western Europe | 6 | 0.0% | View All 12 Rows |
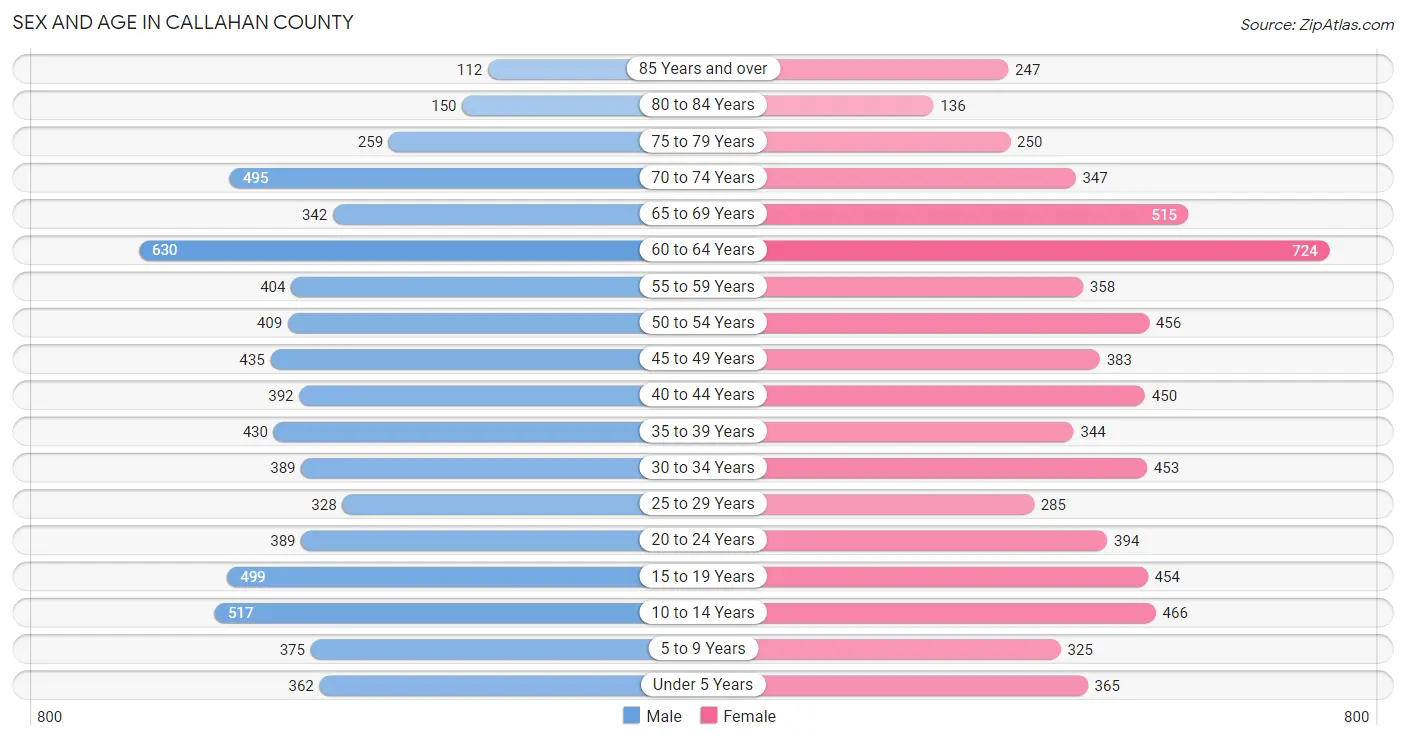
Sex and Age in Callahan County
Sex and Age in Callahan County
The most populous age groups in Callahan County are 60 to 64 Years (630 | 9.1%) for men and 60 to 64 Years (724 | 10.4%) for women.
| Age Bracket | Male | Female |
| Under 5 Years | 362 (5.2%) | 365 (5.2%) |
| 5 to 9 Years | 375 (5.4%) | 325 (4.7%) |
| 10 to 14 Years | 517 (7.5%) | 466 (6.7%) |
| 15 to 19 Years | 499 (7.2%) | 454 (6.5%) |
| 20 to 24 Years | 389 (5.6%) | 394 (5.7%) |
| 25 to 29 Years | 328 (4.7%) | 285 (4.1%) |
| 30 to 34 Years | 389 (5.6%) | 453 (6.5%) |
| 35 to 39 Years | 430 (6.2%) | 344 (5.0%) |
| 40 to 44 Years | 392 (5.7%) | 450 (6.5%) |
| 45 to 49 Years | 435 (6.3%) | 383 (5.5%) |
| 50 to 54 Years | 409 (5.9%) | 456 (6.6%) |
| 55 to 59 Years | 404 (5.8%) | 358 (5.1%) |
| 60 to 64 Years | 630 (9.1%) | 724 (10.4%) |
| 65 to 69 Years | 342 (4.9%) | 515 (7.4%) |
| 70 to 74 Years | 495 (7.2%) | 347 (5.0%) |
| 75 to 79 Years | 259 (3.7%) | 250 (3.6%) |
| 80 to 84 Years | 150 (2.2%) | 136 (2.0%) |
| 85 Years and over | 112 (1.6%) | 247 (3.5%) |
| Total | 6,917 (100.0%) | 6,952 (100.0%) |
Families and Households in Callahan County
Median Family Size in Callahan County
The median family size in Callahan County is 3.25 persons per family, with single female/mother families (580 | 16.4%) accounting for the largest median family size of 3.69 persons per family. On the other hand, married-couple families (2,842 | 80.2%) represent the smallest median family size with 3.16 persons per family.
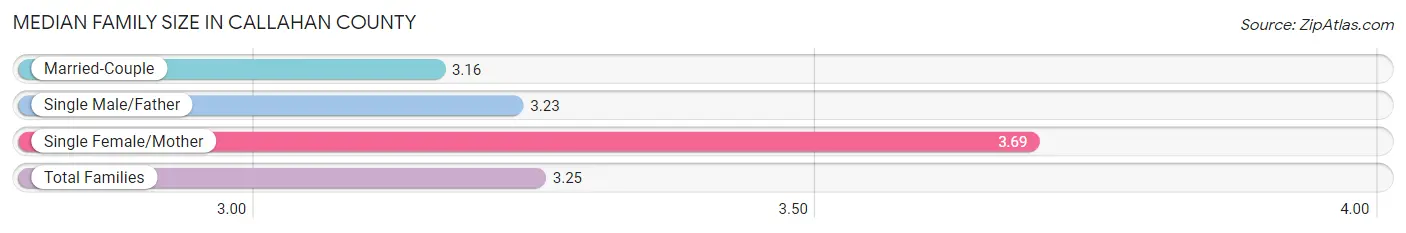
| Family Type | # Families | Family Size |
| Married-Couple | 2,842 (80.2%) | 3.16 |
| Single Male/Father | 120 (3.4%) | 3.23 |
| Single Female/Mother | 580 (16.4%) | 3.69 |
| Total Families | 3,542 (100.0%) | 3.25 |
Median Household Size in Callahan County
The median household size in Callahan County is 2.61 persons per household, with single female/mother households (580 | 11.0%) accounting for the largest median household size of 4.09 persons per household. non-family households (1,728 | 32.8%) represent the smallest median household size with 1.10 persons per household.
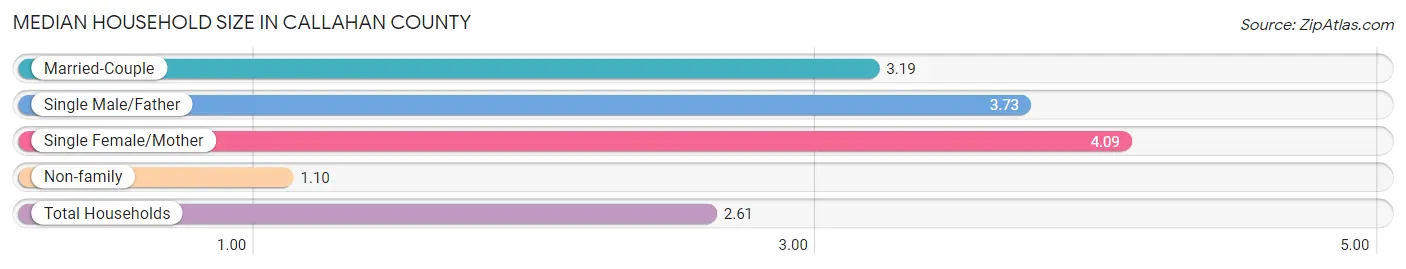
| Household Type | # Households | Household Size |
| Married-Couple | 2,842 (53.9%) | 3.19 |
| Single Male/Father | 120 (2.3%) | 3.73 |
| Single Female/Mother | 580 (11.0%) | 4.09 |
| Non-family | 1,728 (32.8%) | 1.10 |
| Total Households | 5,270 (100.0%) | 2.61 |
Household Size by Marriage Status in Callahan County
Out of a total of 5,270 households in Callahan County, 3,542 (67.2%) are family households, while 1,728 (32.8%) are nonfamily households. The most numerous type of family households are 2-person households, comprising 1,854, and the most common type of nonfamily households are 1-person households, comprising 1,598.
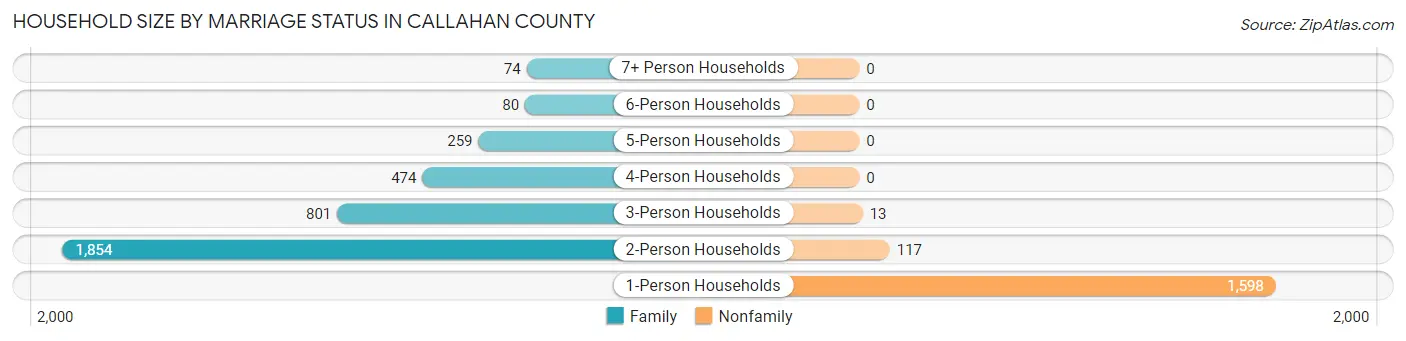
| Household Size | Family Households | Nonfamily Households |
| 1-Person Households | - | 1,598 (30.3%) |
| 2-Person Households | 1,854 (35.2%) | 117 (2.2%) |
| 3-Person Households | 801 (15.2%) | 13 (0.3%) |
| 4-Person Households | 474 (9.0%) | 0 (0.0%) |
| 5-Person Households | 259 (4.9%) | 0 (0.0%) |
| 6-Person Households | 80 (1.5%) | 0 (0.0%) |
| 7+ Person Households | 74 (1.4%) | 0 (0.0%) |
| Total | 3,542 (67.2%) | 1,728 (32.8%) |
Female Fertility in Callahan County
Fertility by Age in Callahan County
Average fertility rate in Callahan County is 93.0 births per 1,000 women. Women in the age bracket of 20 to 34 years have the highest fertility rate with 212.0 births per 1,000 women. Women in the age bracket of 20 to 34 years acount for 91.9% of all women with births.
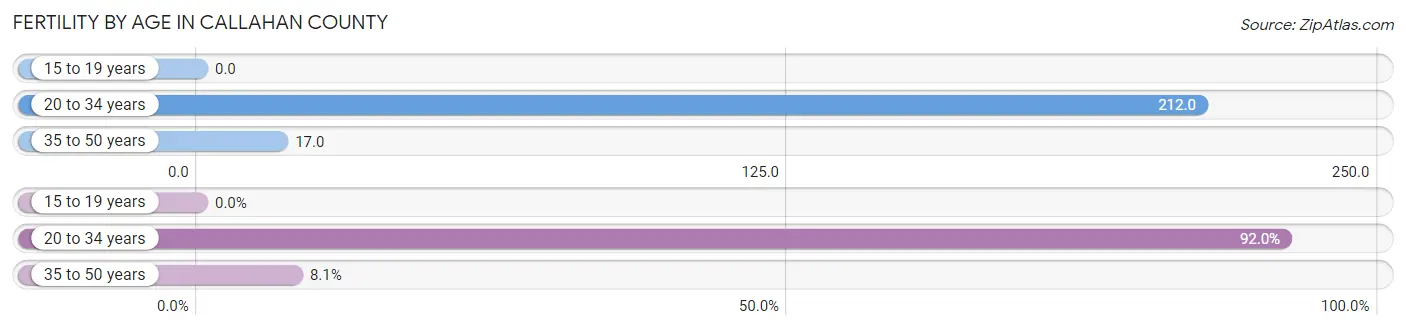
| Age Bracket | Women with Births | Births / 1,000 Women |
| 15 to 19 years | 0 (0.0%) | 0.0 |
| 20 to 34 years | 240 (91.9%) | 212.0 |
| 35 to 50 years | 21 (8.1%) | 17.0 |
| Total | 261 (100.0%) | 93.0 |
Fertility by Age by Marriage Status in Callahan County
44.8% of women with births (261) in Callahan County are married. The highest percentage of unmarried women with births falls into 20 to 34 years age bracket with 59.6% of them unmarried at the time of birth, while the lowest percentage of unmarried women with births belong to 35 to 50 years age bracket with 4.8% of them unmarried.
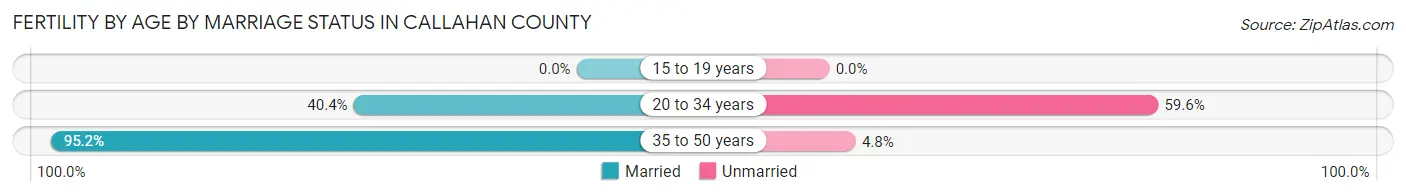
| Age Bracket | Married | Unmarried |
| 15 to 19 years | 0 (0.0%) | 0 (0.0%) |
| 20 to 34 years | 97 (40.4%) | 143 (59.6%) |
| 35 to 50 years | 20 (95.2%) | 1 (4.8%) |
| Total | 117 (44.8%) | 144 (55.2%) |
Fertility by Education in Callahan County
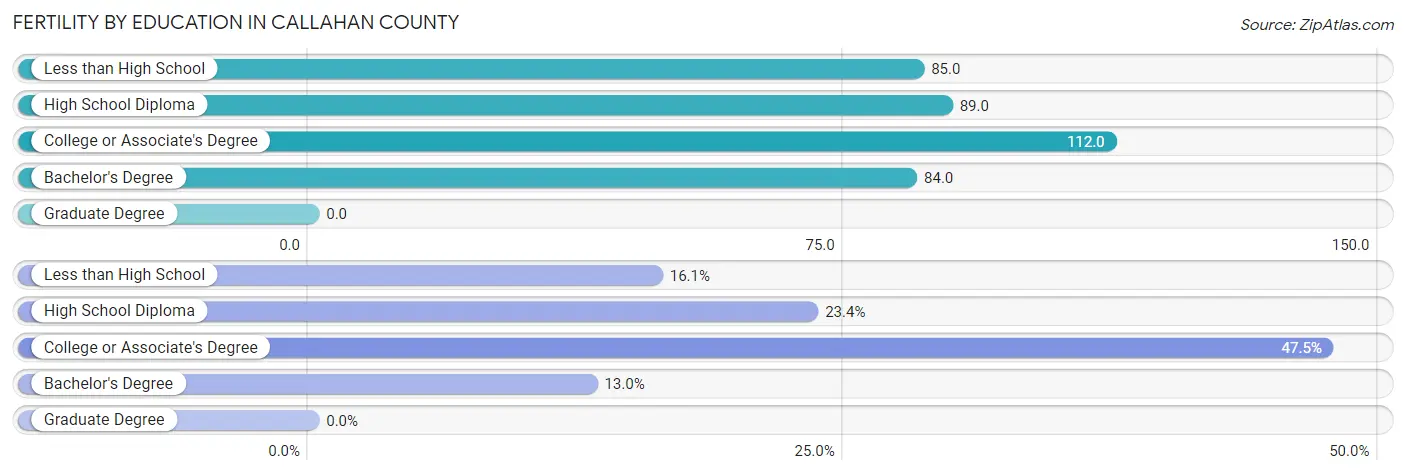
| Educational Attainment | Women with Births | Births / 1,000 Women |
| Less than High School | 42 (16.1%) | 85.0 |
| High School Diploma | 61 (23.4%) | 89.0 |
| College or Associate's Degree | 124 (47.5%) | 112.0 |
| Bachelor's Degree | 34 (13.0%) | 84.0 |
| Graduate Degree | 0 (0.0%) | 0.0 |
| Total | 261 (100.0%) | 93.0 |
Fertility by Education by Marriage Status in Callahan County
55.2% of women with births in Callahan County are unmarried. Women with the educational attainment of bachelor's degree are most likely to be married with 100.0% of them married at childbirth, while women with the educational attainment of college or associate's degree are least likely to be married with 73.4% of them unmarried at childbirth.
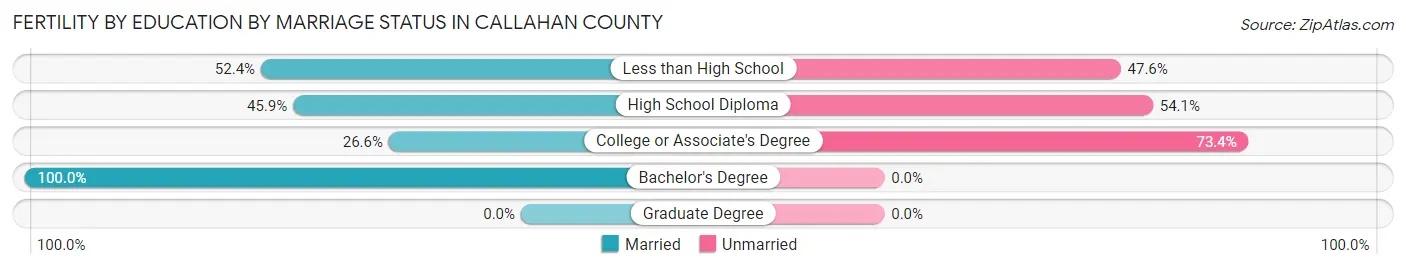
| Educational Attainment | Married | Unmarried |
| Less than High School | 22 (52.4%) | 20 (47.6%) |
| High School Diploma | 28 (45.9%) | 33 (54.1%) |
| College or Associate's Degree | 33 (26.6%) | 91 (73.4%) |
| Bachelor's Degree | 34 (100.0%) | 0 (0.0%) |
| Graduate Degree | 0 (0.0%) | 0 (0.0%) |
| Total | 117 (44.8%) | 144 (55.2%) |
Employment Characteristics in Callahan County
Employment by Class of Employer in Callahan County
Among the 6,157 employed individuals in Callahan County, private company employees (3,844 | 62.4%), self-employed (not incorporated) (712 | 11.6%), and local government employees (622 | 10.1%) make up the most common classes of employment.
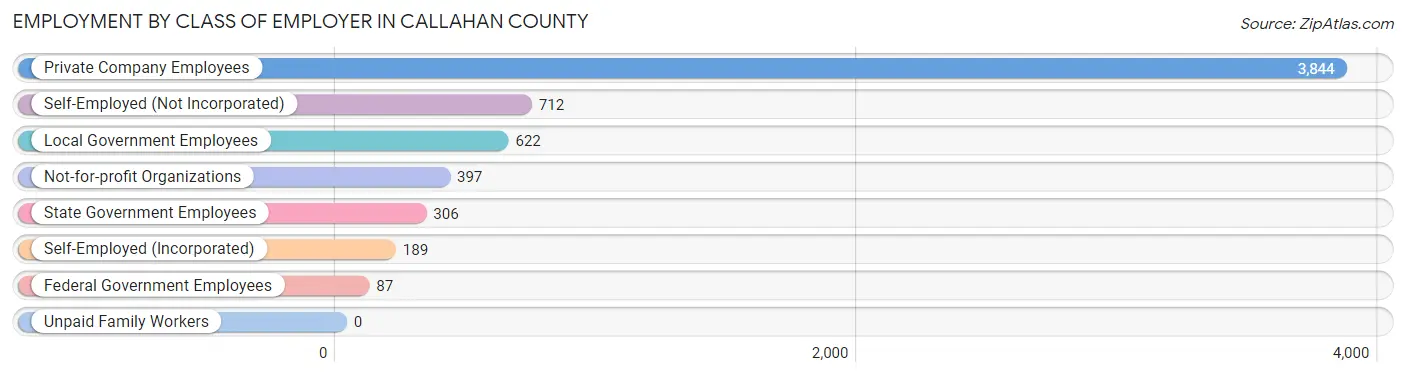
| Employer Class | # Employees | % Employees |
| Private Company Employees | 3,844 | 62.4% |
| Self-Employed (Incorporated) | 189 | 3.1% |
| Self-Employed (Not Incorporated) | 712 | 11.6% |
| Not-for-profit Organizations | 397 | 6.5% |
| Local Government Employees | 622 | 10.1% |
| State Government Employees | 306 | 5.0% |
| Federal Government Employees | 87 | 1.4% |
| Unpaid Family Workers | 0 | 0.0% |
| Total | 6,157 | 100.0% |
Employment Status by Age in Callahan County
According to the labor force statistics for Callahan County, out of the total population over 16 years of age (11,308), 58.0% or 6,559 individuals are in the labor force, with 4.8% or 315 of them unemployed. The age group with the highest labor force participation rate is 20 to 24 years, with 85.1% or 666 individuals in the labor force. Within the labor force, the 20 to 24 years age range has the highest percentage of unemployed individuals, with 17.0% or 113 of them being unemployed.
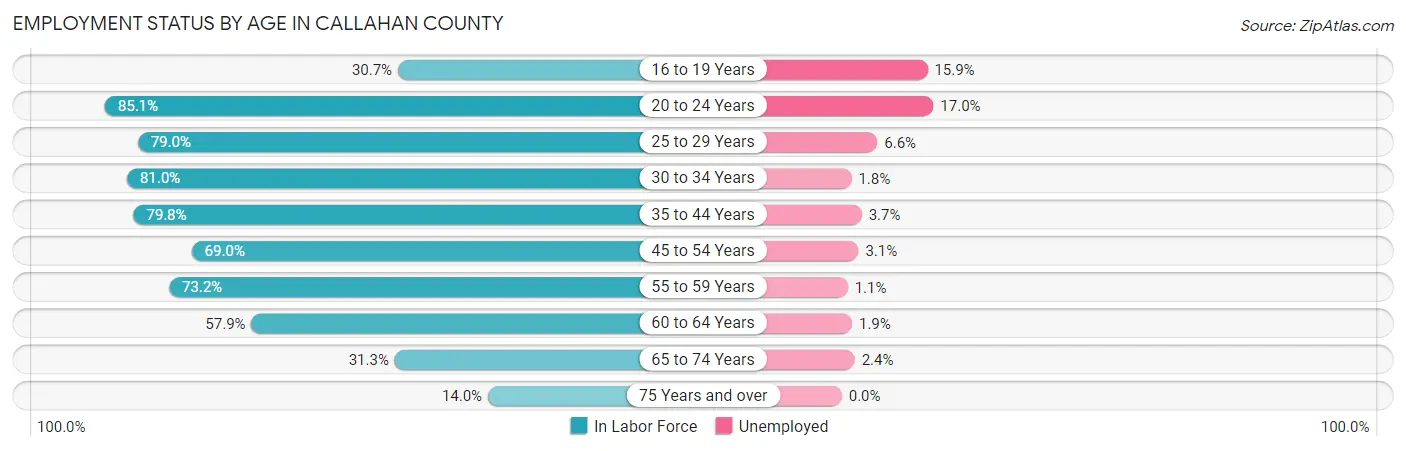
| Age Bracket | In Labor Force | Unemployed |
| 16 to 19 Years | 246 (30.7%) | 39 (15.9%) |
| 20 to 24 Years | 666 (85.1%) | 113 (17.0%) |
| 25 to 29 Years | 484 (79.0%) | 32 (6.6%) |
| 30 to 34 Years | 682 (81.0%) | 12 (1.8%) |
| 35 to 44 Years | 1,290 (79.8%) | 48 (3.7%) |
| 45 to 54 Years | 1,161 (69.0%) | 36 (3.1%) |
| 55 to 59 Years | 558 (73.2%) | 6 (1.1%) |
| 60 to 64 Years | 784 (57.9%) | 15 (1.9%) |
| 65 to 74 Years | 532 (31.3%) | 13 (2.4%) |
| 75 Years and over | 162 (14.0%) | 0 (0.0%) |
| Total | 6,559 (58.0%) | 315 (4.8%) |
Employment Status by Educational Attainment in Callahan County
According to labor force statistics for Callahan County, 72.2% of individuals (4,960) out of the total population between 25 and 64 years of age (6,870) are in the labor force, with 3.0% or 149 of them being unemployed. The group with the highest labor force participation rate are those with the educational attainment of bachelor's degree or higher, with 76.8% or 1,162 individuals in the labor force. Within the labor force, individuals with less than high school education have the highest percentage of unemployment, with 15.3% or 36 of them being unemployed.
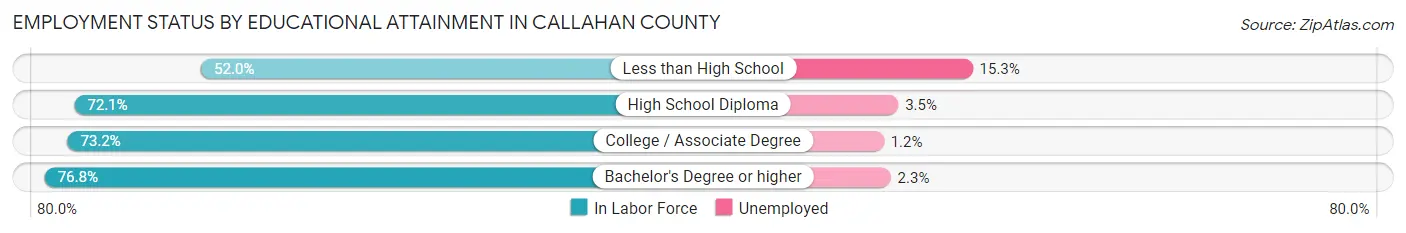
| Educational Attainment | In Labor Force | Unemployed |
| Less than High School | 235 (52.0%) | 69 (15.3%) |
| High School Diploma | 1,857 (72.1%) | 90 (3.5%) |
| College / Associate Degree | 1,705 (73.2%) | 28 (1.2%) |
| Bachelor's Degree or higher | 1,162 (76.8%) | 35 (2.3%) |
| Total | 4,960 (72.2%) | 206 (3.0%) |
Employment Occupations by Sex in Callahan County
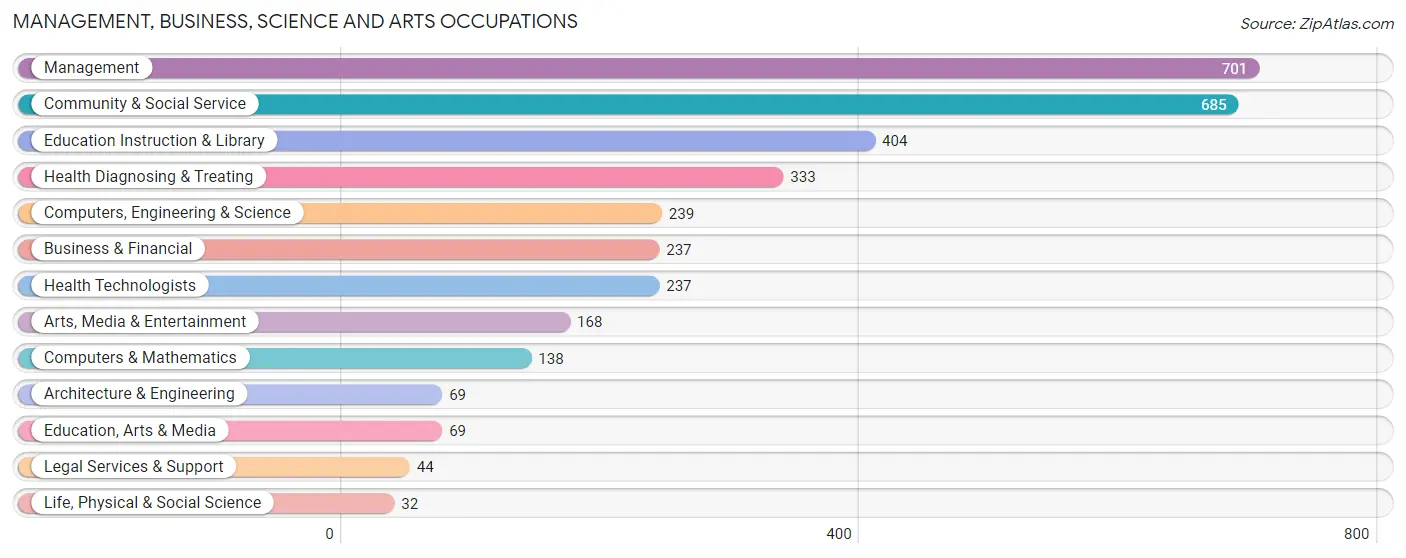
Management, Business, Science and Arts Occupations
The most common Management, Business, Science and Arts occupations in Callahan County are Management (701 | 11.2%), Community & Social Service (685 | 11.0%), Education Instruction & Library (404 | 6.5%), Health Diagnosing & Treating (333 | 5.3%), and Computers, Engineering & Science (239 | 3.8%).
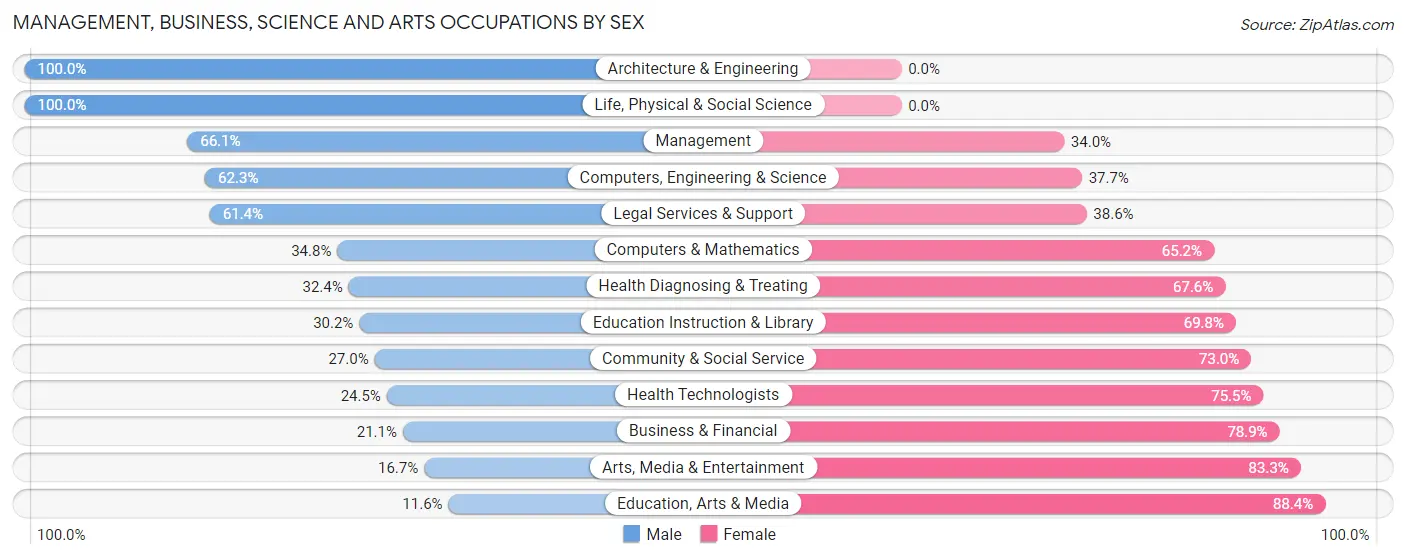
Management, Business, Science and Arts Occupations by Sex
Within the Management, Business, Science and Arts occupations in Callahan County, the most male-oriented occupations are Architecture & Engineering (100.0%), Life, Physical & Social Science (100.0%), and Management (66.0%), while the most female-oriented occupations are Education, Arts & Media (88.4%), Arts, Media & Entertainment (83.3%), and Business & Financial (78.9%).
| Occupation | Male | Female |
| Management | 463 (66.0%) | 238 (34.0%) |
| Business & Financial | 50 (21.1%) | 187 (78.9%) |
| Computers, Engineering & Science | 149 (62.3%) | 90 (37.7%) |
| Computers & Mathematics | 48 (34.8%) | 90 (65.2%) |
| Architecture & Engineering | 69 (100.0%) | 0 (0.0%) |
| Life, Physical & Social Science | 32 (100.0%) | 0 (0.0%) |
| Community & Social Service | 185 (27.0%) | 500 (73.0%) |
| Education, Arts & Media | 8 (11.6%) | 61 (88.4%) |
| Legal Services & Support | 27 (61.4%) | 17 (38.6%) |
| Education Instruction & Library | 122 (30.2%) | 282 (69.8%) |
| Arts, Media & Entertainment | 28 (16.7%) | 140 (83.3%) |
| Health Diagnosing & Treating | 108 (32.4%) | 225 (67.6%) |
| Health Technologists | 58 (24.5%) | 179 (75.5%) |
| Total (Category) | 955 (43.5%) | 1,240 (56.5%) |
| Total (Overall) | 3,409 (54.7%) | 2,828 (45.3%) |
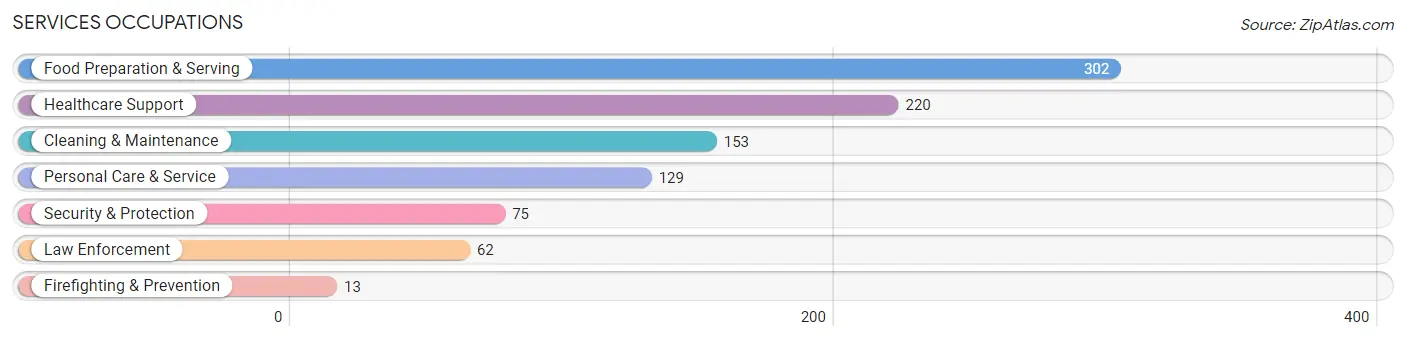
Services Occupations
The most common Services occupations in Callahan County are Food Preparation & Serving (302 | 4.8%), Healthcare Support (220 | 3.5%), Cleaning & Maintenance (153 | 2.5%), Personal Care & Service (129 | 2.1%), and Security & Protection (75 | 1.2%).
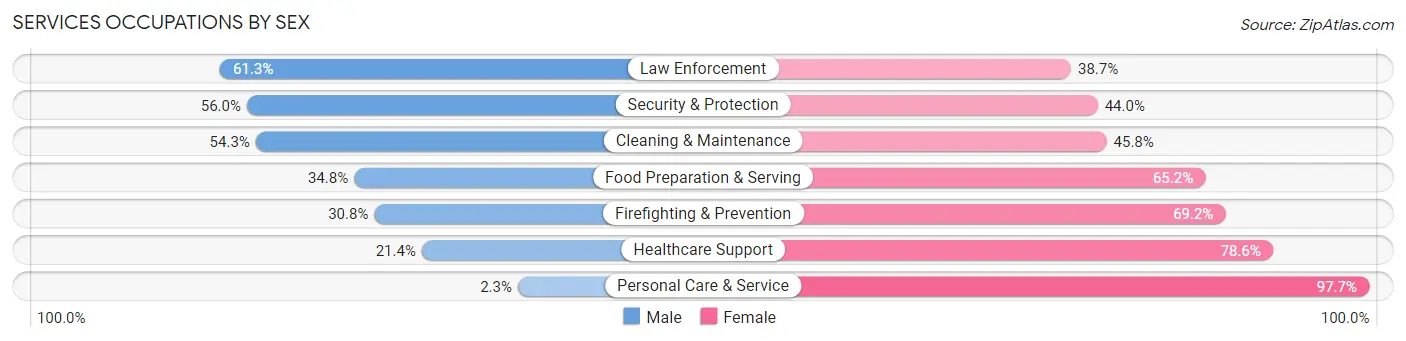
Services Occupations by Sex
Within the Services occupations in Callahan County, the most male-oriented occupations are Law Enforcement (61.3%), Security & Protection (56.0%), and Cleaning & Maintenance (54.2%), while the most female-oriented occupations are Personal Care & Service (97.7%), Healthcare Support (78.6%), and Firefighting & Prevention (69.2%).
| Occupation | Male | Female |
| Healthcare Support | 47 (21.4%) | 173 (78.6%) |
| Security & Protection | 42 (56.0%) | 33 (44.0%) |
| Firefighting & Prevention | 4 (30.8%) | 9 (69.2%) |
| Law Enforcement | 38 (61.3%) | 24 (38.7%) |
| Food Preparation & Serving | 105 (34.8%) | 197 (65.2%) |
| Cleaning & Maintenance | 83 (54.2%) | 70 (45.8%) |
| Personal Care & Service | 3 (2.3%) | 126 (97.7%) |
| Total (Category) | 280 (31.9%) | 599 (68.1%) |
| Total (Overall) | 3,409 (54.7%) | 2,828 (45.3%) |
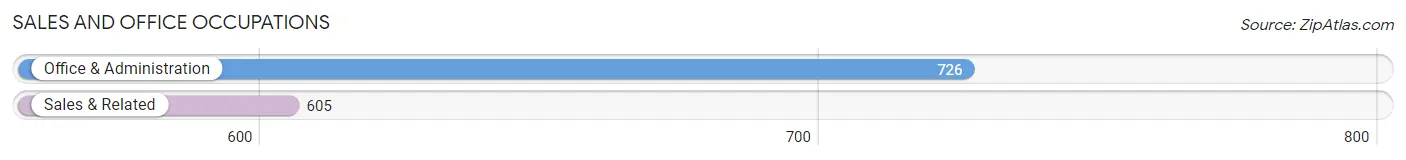
Sales and Office Occupations
The most common Sales and Office occupations in Callahan County are Office & Administration (726 | 11.6%), and Sales & Related (605 | 9.7%).
Sales and Office Occupations by Sex

| Occupation | Male | Female |
| Sales & Related | 349 (57.7%) | 256 (42.3%) |
| Office & Administration | 143 (19.7%) | 583 (80.3%) |
| Total (Category) | 492 (37.0%) | 839 (63.0%) |
| Total (Overall) | 3,409 (54.7%) | 2,828 (45.3%) |
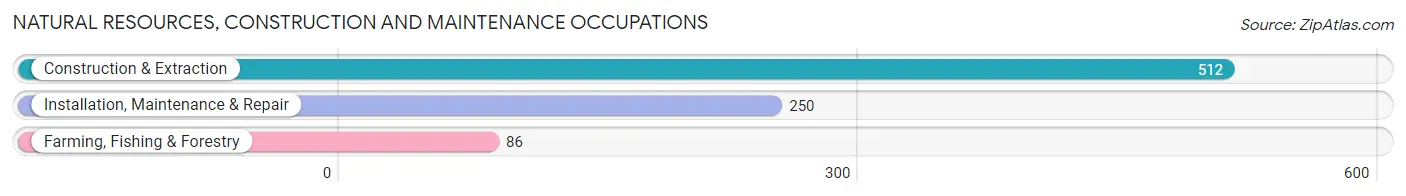
Natural Resources, Construction and Maintenance Occupations
The most common Natural Resources, Construction and Maintenance occupations in Callahan County are Construction & Extraction (512 | 8.2%), Installation, Maintenance & Repair (250 | 4.0%), and Farming, Fishing & Forestry (86 | 1.4%).
Natural Resources, Construction and Maintenance Occupations by Sex
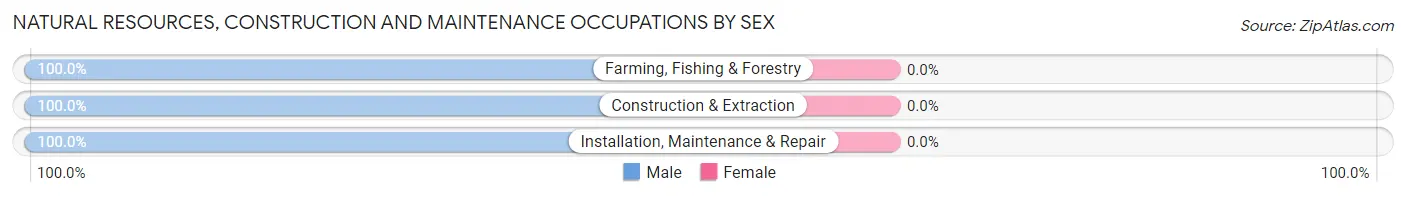
| Occupation | Male | Female |
| Farming, Fishing & Forestry | 86 (100.0%) | 0 (0.0%) |
| Construction & Extraction | 512 (100.0%) | 0 (0.0%) |
| Installation, Maintenance & Repair | 250 (100.0%) | 0 (0.0%) |
| Total (Category) | 848 (100.0%) | 0 (0.0%) |
| Total (Overall) | 3,409 (54.7%) | 2,828 (45.3%) |
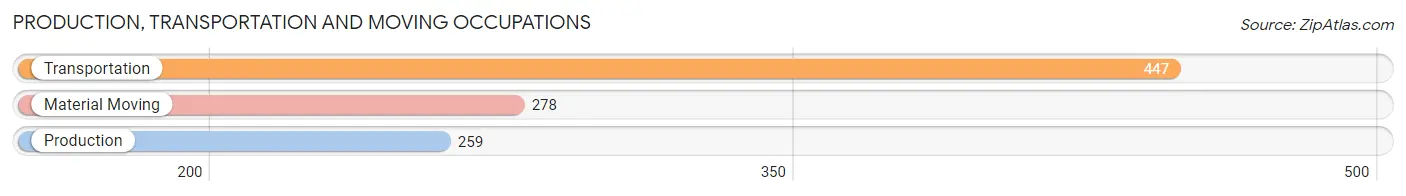
Production, Transportation and Moving Occupations
The most common Production, Transportation and Moving occupations in Callahan County are Transportation (447 | 7.2%), Material Moving (278 | 4.5%), and Production (259 | 4.2%).
Production, Transportation and Moving Occupations by Sex
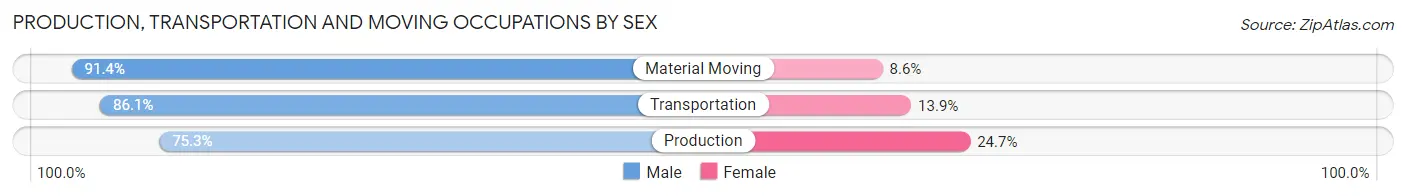
| Occupation | Male | Female |
| Production | 195 (75.3%) | 64 (24.7%) |
| Transportation | 385 (86.1%) | 62 (13.9%) |
| Material Moving | 254 (91.4%) | 24 (8.6%) |
| Total (Category) | 834 (84.8%) | 150 (15.2%) |
| Total (Overall) | 3,409 (54.7%) | 2,828 (45.3%) |
Employment Industries by Sex in Callahan County
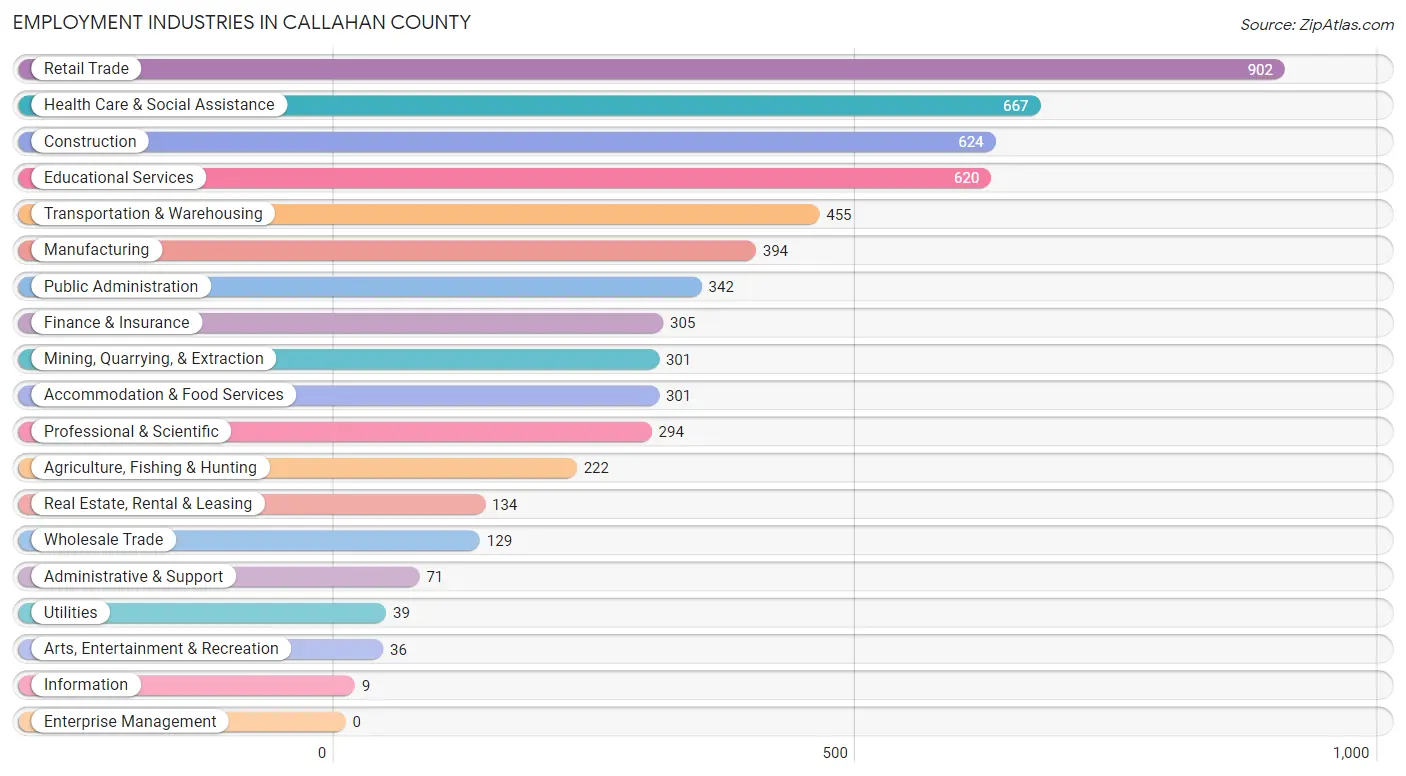
Employment Industries in Callahan County
The major employment industries in Callahan County include Retail Trade (902 | 14.5%), Health Care & Social Assistance (667 | 10.7%), Construction (624 | 10.0%), Educational Services (620 | 9.9%), and Transportation & Warehousing (455 | 7.3%).
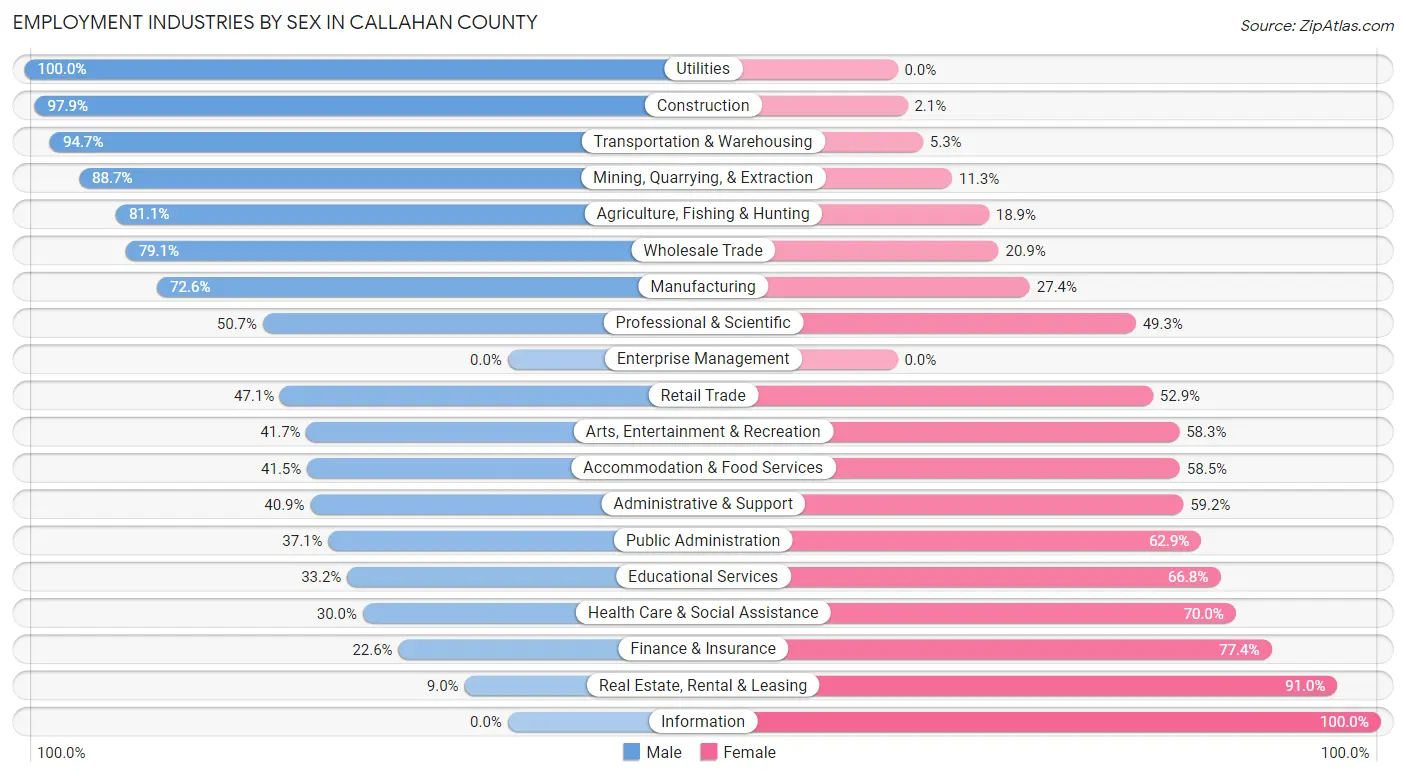
Employment Industries by Sex in Callahan County
The Callahan County industries that see more men than women are Utilities (100.0%), Construction (97.9%), and Transportation & Warehousing (94.7%), whereas the industries that tend to have a higher number of women are Information (100.0%), Real Estate, Rental & Leasing (91.0%), and Finance & Insurance (77.4%).
| Industry | Male | Female |
| Agriculture, Fishing & Hunting | 180 (81.1%) | 42 (18.9%) |
| Mining, Quarrying, & Extraction | 267 (88.7%) | 34 (11.3%) |
| Construction | 611 (97.9%) | 13 (2.1%) |
| Manufacturing | 286 (72.6%) | 108 (27.4%) |
| Wholesale Trade | 102 (79.1%) | 27 (20.9%) |
| Retail Trade | 425 (47.1%) | 477 (52.9%) |
| Transportation & Warehousing | 431 (94.7%) | 24 (5.3%) |
| Utilities | 39 (100.0%) | 0 (0.0%) |
| Information | 0 (0.0%) | 9 (100.0%) |
| Finance & Insurance | 69 (22.6%) | 236 (77.4%) |
| Real Estate, Rental & Leasing | 12 (9.0%) | 122 (91.0%) |
| Professional & Scientific | 149 (50.7%) | 145 (49.3%) |
| Enterprise Management | 0 (0.0%) | 0 (0.0%) |
| Administrative & Support | 29 (40.8%) | 42 (59.2%) |
| Educational Services | 206 (33.2%) | 414 (66.8%) |
| Health Care & Social Assistance | 200 (30.0%) | 467 (70.0%) |
| Arts, Entertainment & Recreation | 15 (41.7%) | 21 (58.3%) |
| Accommodation & Food Services | 125 (41.5%) | 176 (58.5%) |
| Public Administration | 127 (37.1%) | 215 (62.9%) |
| Total | 3,409 (54.7%) | 2,828 (45.3%) |
Education in Callahan County
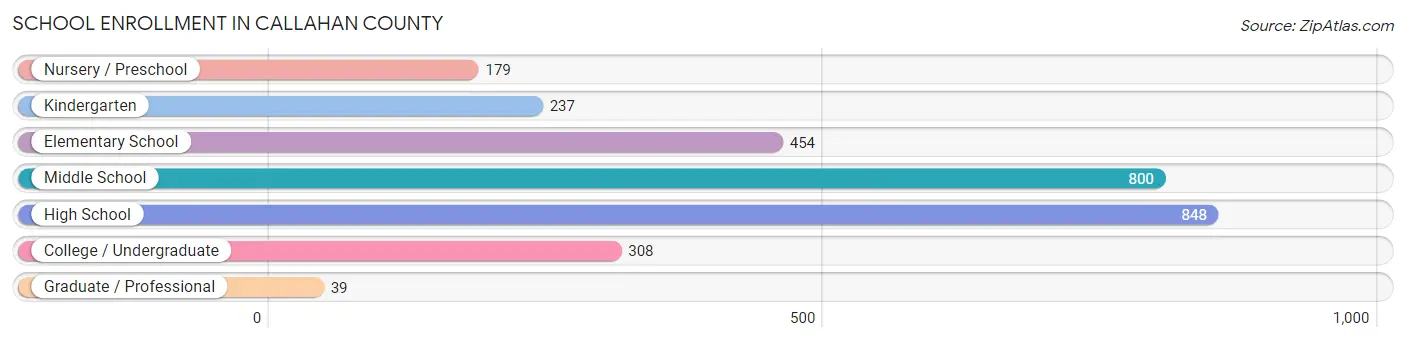
School Enrollment in Callahan County
The most common levels of schooling among the 2,865 students in Callahan County are high school (848 | 29.6%), middle school (800 | 27.9%), and elementary school (454 | 15.9%).
| School Level | # Students | % Students |
| Nursery / Preschool | 179 | 6.2% |
| Kindergarten | 237 | 8.3% |
| Elementary School | 454 | 15.9% |
| Middle School | 800 | 27.9% |
| High School | 848 | 29.6% |
| College / Undergraduate | 308 | 10.7% |
| Graduate / Professional | 39 | 1.4% |
| Total | 2,865 | 100.0% |
School Enrollment by Age by Funding Source in Callahan County
Out of a total of 2,865 students who are enrolled in schools in Callahan County, 312 (10.9%) attend a private institution, while the remaining 2,553 (89.1%) are enrolled in public schools. The age group of 25 to 34 year olds has the highest likelihood of being enrolled in private schools, with 26 (56.5% in the age bracket) enrolled. Conversely, the age group of 20 to 24 year olds has the lowest likelihood of being enrolled in a private school, with 141 (100.0% in the age bracket) attending a public institution.
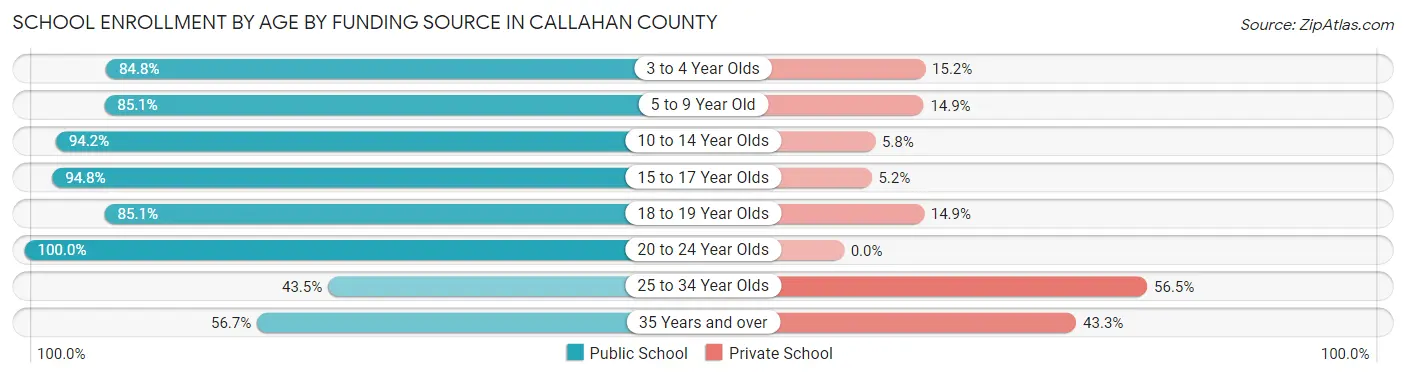
| Age Bracket | Public School | Private School |
| 3 to 4 Year Olds | 123 (84.8%) | 22 (15.2%) |
| 5 to 9 Year Old | 567 (85.1%) | 99 (14.9%) |
| 10 to 14 Year Olds | 905 (94.2%) | 56 (5.8%) |
| 15 to 17 Year Olds | 532 (94.8%) | 29 (5.2%) |
| 18 to 19 Year Olds | 211 (85.1%) | 37 (14.9%) |
| 20 to 24 Year Olds | 141 (100.0%) | 0 (0.0%) |
| 25 to 34 Year Olds | 20 (43.5%) | 26 (56.5%) |
| 35 Years and over | 55 (56.7%) | 42 (43.3%) |
| Total | 2,553 (89.1%) | 312 (10.9%) |
Educational Attainment by Field of Study in Callahan County
Education (714 | 28.9%), business (405 | 16.4%), bio, nature & agricultural (245 | 9.9%), science & technology (217 | 8.8%), and arts & humanities (189 | 7.6%) are the most common fields of study among 2,474 individuals in Callahan County who have obtained a bachelor's degree or higher.
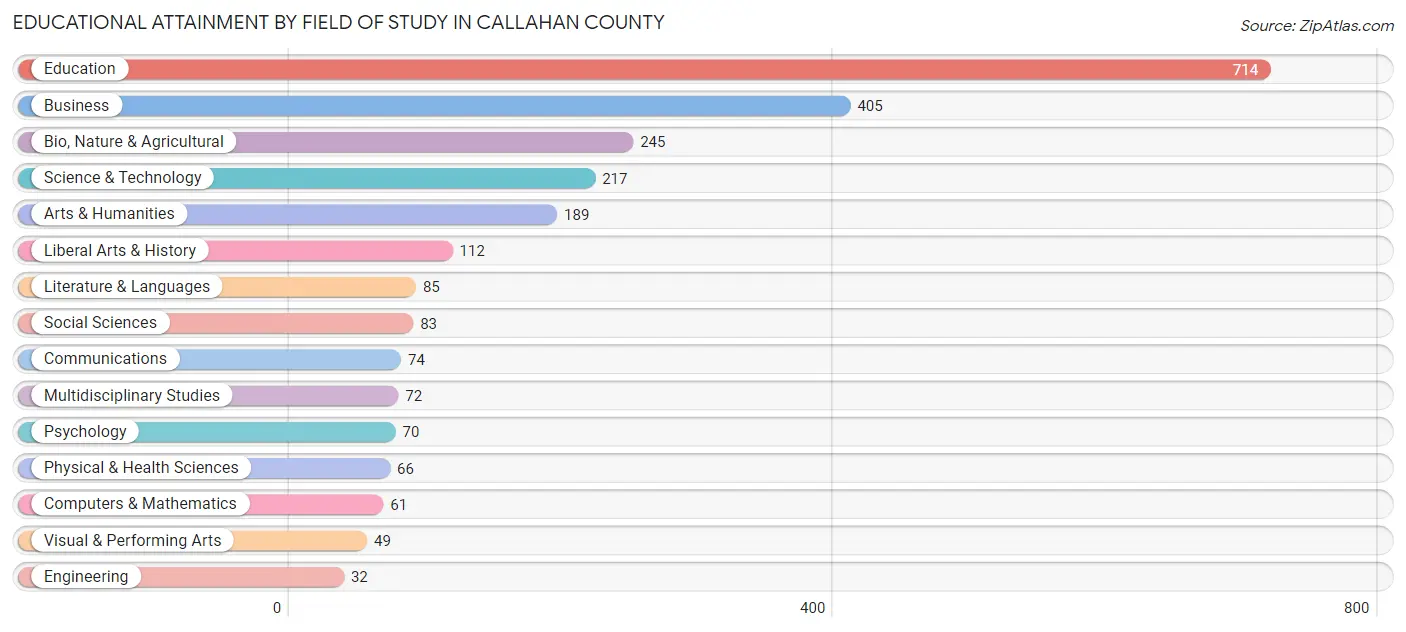
| Field of Study | # Graduates | % Graduates |
| Computers & Mathematics | 61 | 2.5% |
| Bio, Nature & Agricultural | 245 | 9.9% |
| Physical & Health Sciences | 66 | 2.7% |
| Psychology | 70 | 2.8% |
| Social Sciences | 83 | 3.4% |
| Engineering | 32 | 1.3% |
| Multidisciplinary Studies | 72 | 2.9% |
| Science & Technology | 217 | 8.8% |
| Business | 405 | 16.4% |
| Education | 714 | 28.9% |
| Literature & Languages | 85 | 3.4% |
| Liberal Arts & History | 112 | 4.5% |
| Visual & Performing Arts | 49 | 2.0% |
| Communications | 74 | 3.0% |
| Arts & Humanities | 189 | 7.6% |
| Total | 2,474 | 100.0% |
Transportation & Commute in Callahan County
Vehicle Availability by Sex in Callahan County
The most prevalent vehicle ownership categories in Callahan County are males with 3 vehicles (1,123, accounting for 33.2%) and females with 3 vehicles (718, making up 40.5%).
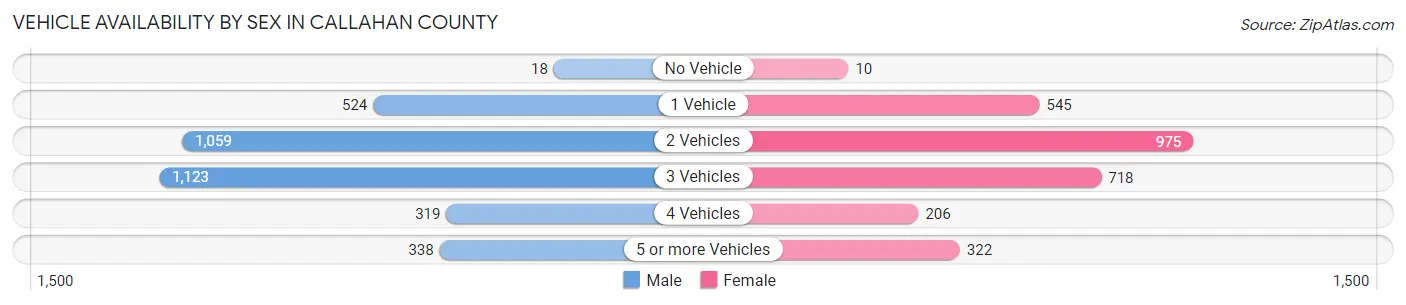
| Vehicles Available | Male | Female |
| No Vehicle | 18 (0.5%) | 10 (0.4%) |
| 1 Vehicle | 524 (15.5%) | 545 (19.6%) |
| 2 Vehicles | 1,059 (31.3%) | 975 (35.1%) |
| 3 Vehicles | 1,123 (33.2%) | 718 (25.9%) |
| 4 Vehicles | 319 (9.4%) | 206 (7.4%) |
| 5 or more Vehicles | 338 (10.0%) | 322 (11.6%) |
| Total | 3,381 (100.0%) | 2,776 (100.0%) |
Commute Time in Callahan County
The most frequently occuring commute durations in Callahan County are 30 to 34 minutes (1,011 commuters, 17.9%), 20 to 24 minutes (999 commuters, 17.7%), and 25 to 29 minutes (691 commuters, 12.2%).
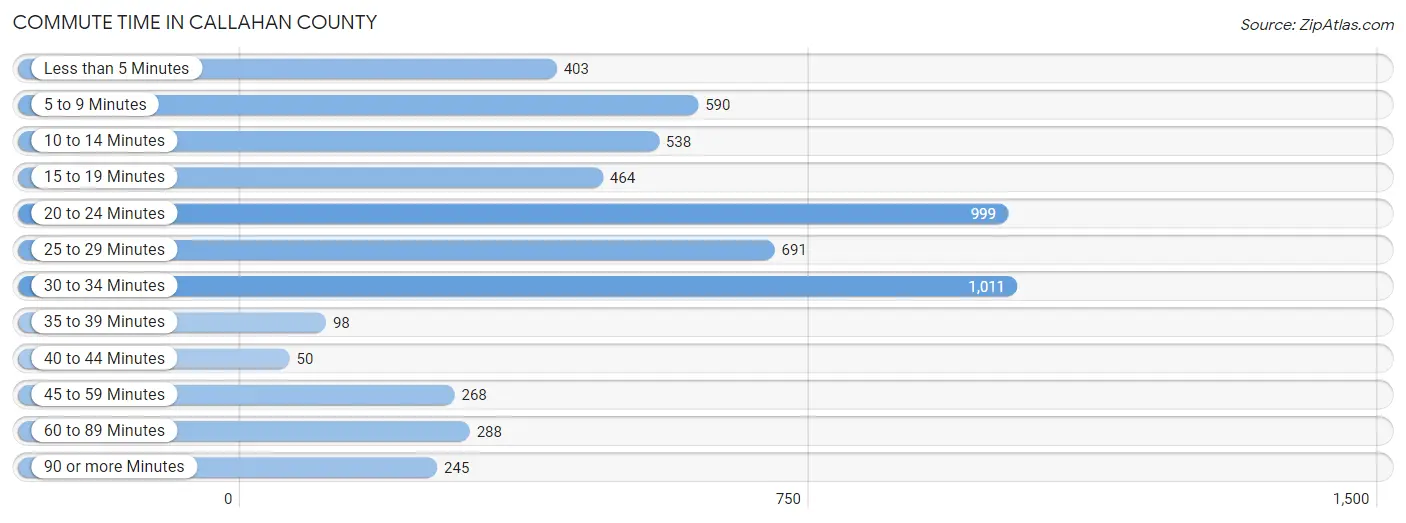
| Commute Time | # Commuters | % Commuters |
| Less than 5 Minutes | 403 | 7.1% |
| 5 to 9 Minutes | 590 | 10.4% |
| 10 to 14 Minutes | 538 | 9.5% |
| 15 to 19 Minutes | 464 | 8.2% |
| 20 to 24 Minutes | 999 | 17.7% |
| 25 to 29 Minutes | 691 | 12.2% |
| 30 to 34 Minutes | 1,011 | 17.9% |
| 35 to 39 Minutes | 98 | 1.7% |
| 40 to 44 Minutes | 50 | 0.9% |
| 45 to 59 Minutes | 268 | 4.8% |
| 60 to 89 Minutes | 288 | 5.1% |
| 90 or more Minutes | 245 | 4.3% |
Commute Time by Sex in Callahan County
The most common commute times in Callahan County are 30 to 34 minutes (632 commuters, 19.7%) for males and 20 to 24 minutes (392 commuters, 16.1%) for females.
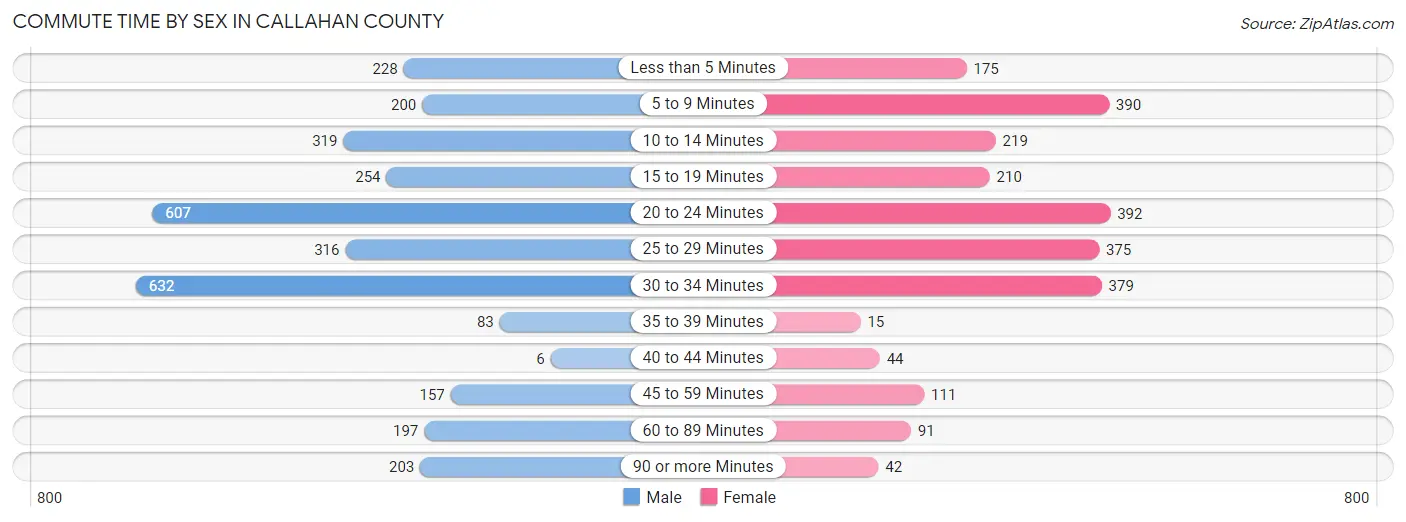
| Commute Time | Male | Female |
| Less than 5 Minutes | 228 (7.1%) | 175 (7.2%) |
| 5 to 9 Minutes | 200 (6.2%) | 390 (16.0%) |
| 10 to 14 Minutes | 319 (10.0%) | 219 (9.0%) |
| 15 to 19 Minutes | 254 (7.9%) | 210 (8.6%) |
| 20 to 24 Minutes | 607 (19.0%) | 392 (16.1%) |
| 25 to 29 Minutes | 316 (9.9%) | 375 (15.3%) |
| 30 to 34 Minutes | 632 (19.7%) | 379 (15.5%) |
| 35 to 39 Minutes | 83 (2.6%) | 15 (0.6%) |
| 40 to 44 Minutes | 6 (0.2%) | 44 (1.8%) |
| 45 to 59 Minutes | 157 (4.9%) | 111 (4.5%) |
| 60 to 89 Minutes | 197 (6.1%) | 91 (3.7%) |
| 90 or more Minutes | 203 (6.3%) | 42 (1.7%) |
Time of Departure to Work by Sex in Callahan County
The most frequent times of departure to work in Callahan County are 7:00 AM to 7:29 AM (699, 21.8%) for males and 7:00 AM to 7:29 AM (571, 23.4%) for females.
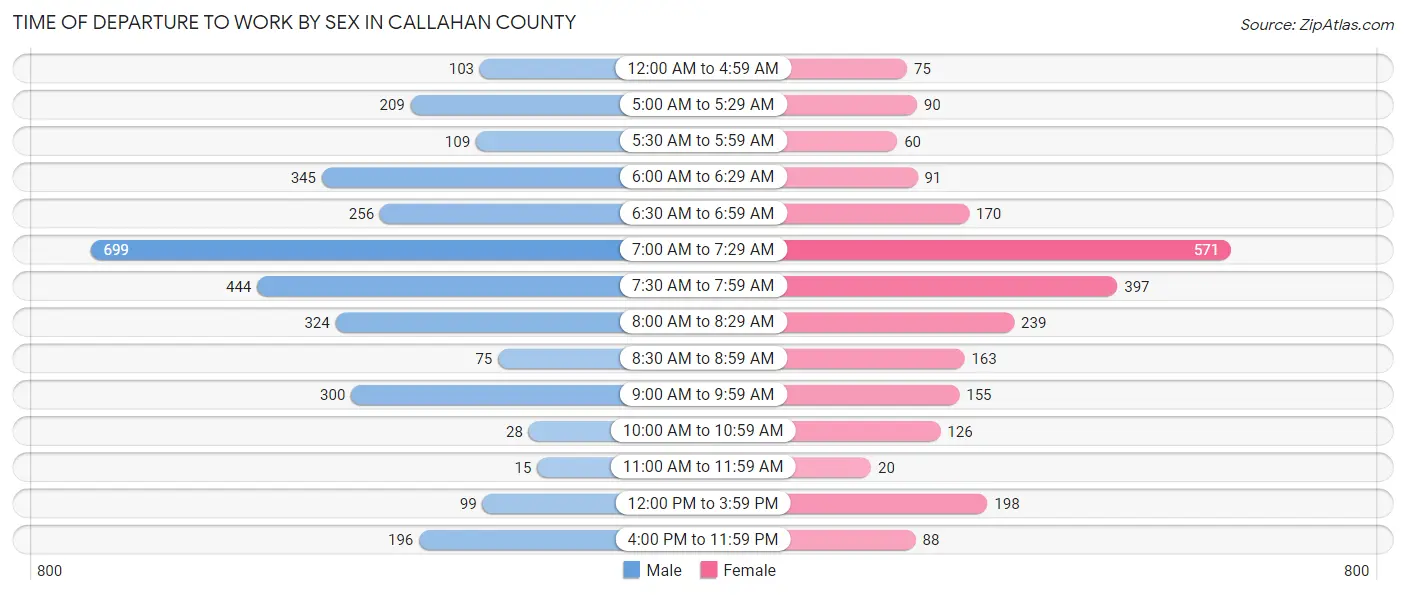
| Time of Departure | Male | Female |
| 12:00 AM to 4:59 AM | 103 (3.2%) | 75 (3.1%) |
| 5:00 AM to 5:29 AM | 209 (6.5%) | 90 (3.7%) |
| 5:30 AM to 5:59 AM | 109 (3.4%) | 60 (2.5%) |
| 6:00 AM to 6:29 AM | 345 (10.8%) | 91 (3.7%) |
| 6:30 AM to 6:59 AM | 256 (8.0%) | 170 (7.0%) |
| 7:00 AM to 7:29 AM | 699 (21.8%) | 571 (23.4%) |
| 7:30 AM to 7:59 AM | 444 (13.9%) | 397 (16.3%) |
| 8:00 AM to 8:29 AM | 324 (10.1%) | 239 (9.8%) |
| 8:30 AM to 8:59 AM | 75 (2.3%) | 163 (6.7%) |
| 9:00 AM to 9:59 AM | 300 (9.4%) | 155 (6.3%) |
| 10:00 AM to 10:59 AM | 28 (0.9%) | 126 (5.2%) |
| 11:00 AM to 11:59 AM | 15 (0.5%) | 20 (0.8%) |
| 12:00 PM to 3:59 PM | 99 (3.1%) | 198 (8.1%) |
| 4:00 PM to 11:59 PM | 196 (6.1%) | 88 (3.6%) |
| Total | 3,202 (100.0%) | 2,443 (100.0%) |
Housing Occupancy in Callahan County
Occupancy by Ownership in Callahan County
Of the total 5,270 dwellings in Callahan County, owner-occupied units account for 4,323 (82.0%), while renter-occupied units make up 947 (18.0%).
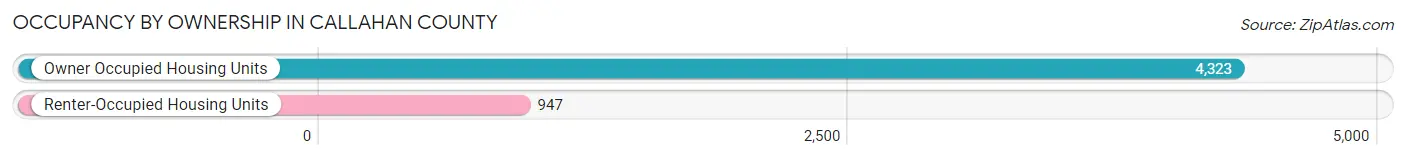
| Occupancy | # Housing Units | % Housing Units |
| Owner Occupied Housing Units | 4,323 | 82.0% |
| Renter-Occupied Housing Units | 947 | 18.0% |
| Total Occupied Housing Units | 5,270 | 100.0% |
Occupancy by Household Size in Callahan County
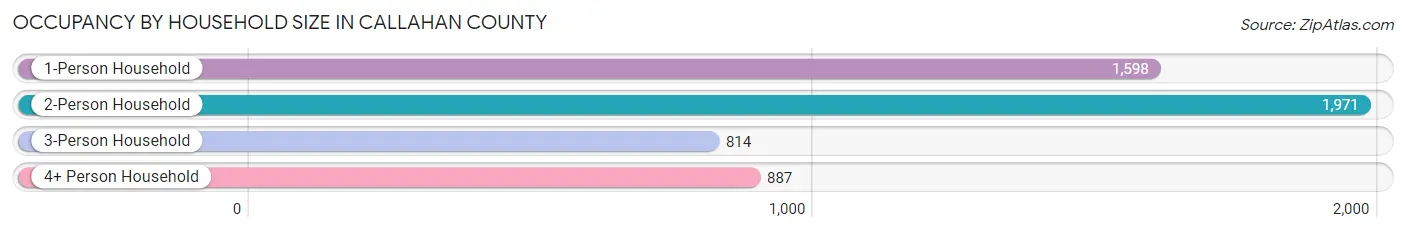
| Household Size | # Housing Units | % Housing Units |
| 1-Person Household | 1,598 | 30.3% |
| 2-Person Household | 1,971 | 37.4% |
| 3-Person Household | 814 | 15.4% |
| 4+ Person Household | 887 | 16.8% |
| Total Housing Units | 5,270 | 100.0% |
Occupancy by Ownership by Household Size in Callahan County
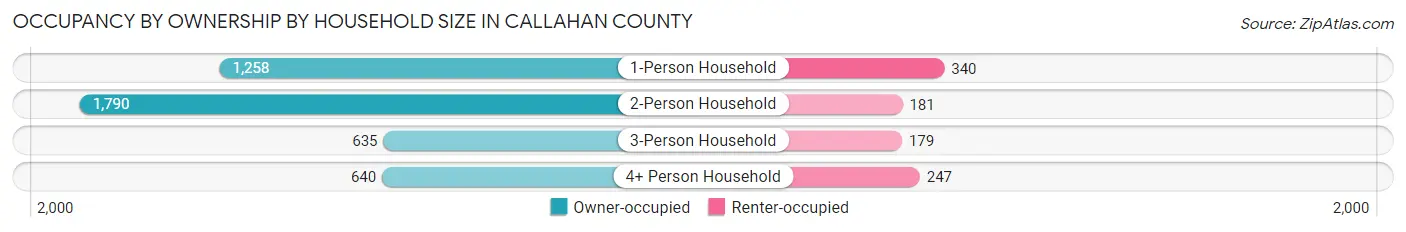
| Household Size | Owner-occupied | Renter-occupied |
| 1-Person Household | 1,258 (78.7%) | 340 (21.3%) |
| 2-Person Household | 1,790 (90.8%) | 181 (9.2%) |
| 3-Person Household | 635 (78.0%) | 179 (22.0%) |
| 4+ Person Household | 640 (72.2%) | 247 (27.9%) |
| Total Housing Units | 4,323 (82.0%) | 947 (18.0%) |
Occupancy by Educational Attainment in Callahan County
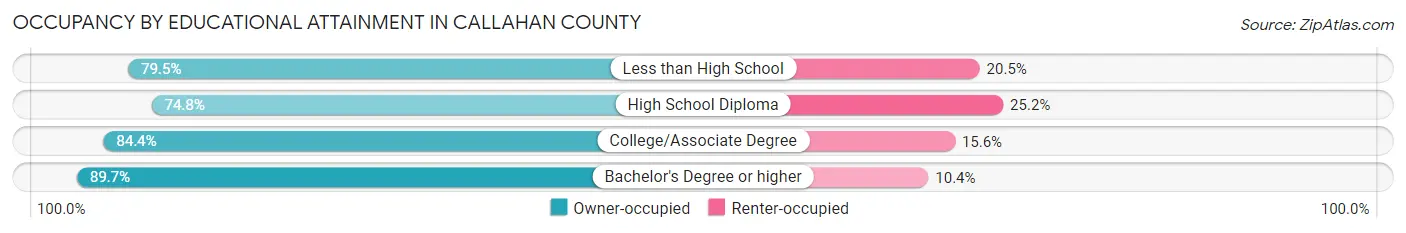
| Household Size | Owner-occupied | Renter-occupied |
| Less than High School | 275 (79.5%) | 71 (20.5%) |
| High School Diploma | 1,346 (74.8%) | 453 (25.2%) |
| College/Associate Degree | 1,593 (84.4%) | 295 (15.6%) |
| Bachelor's Degree or higher | 1,109 (89.6%) | 128 (10.3%) |
Occupancy by Age of Householder in Callahan County
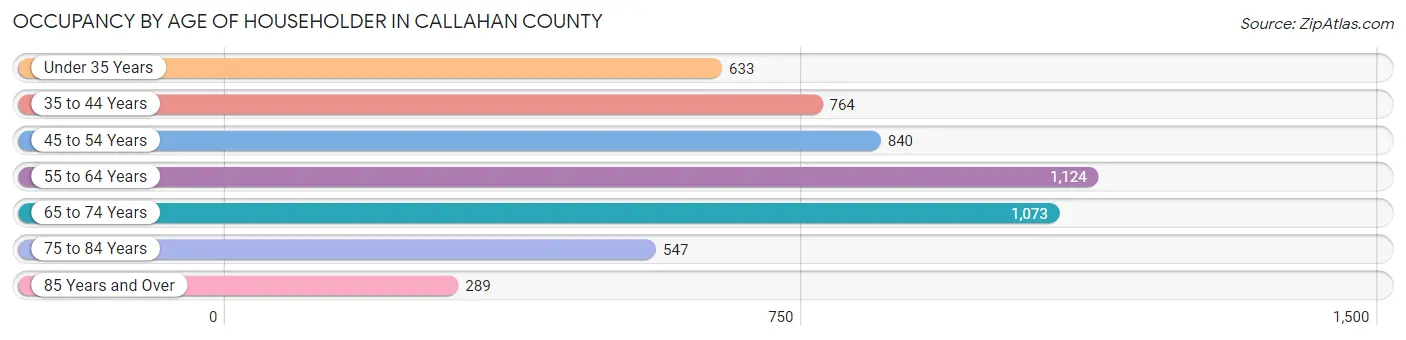
| Age Bracket | # Households | % Households |
| Under 35 Years | 633 | 12.0% |
| 35 to 44 Years | 764 | 14.5% |
| 45 to 54 Years | 840 | 15.9% |
| 55 to 64 Years | 1,124 | 21.3% |
| 65 to 74 Years | 1,073 | 20.4% |
| 75 to 84 Years | 547 | 10.4% |
| 85 Years and Over | 289 | 5.5% |
| Total | 5,270 | 100.0% |
Housing Finances in Callahan County
Median Income by Occupancy in Callahan County
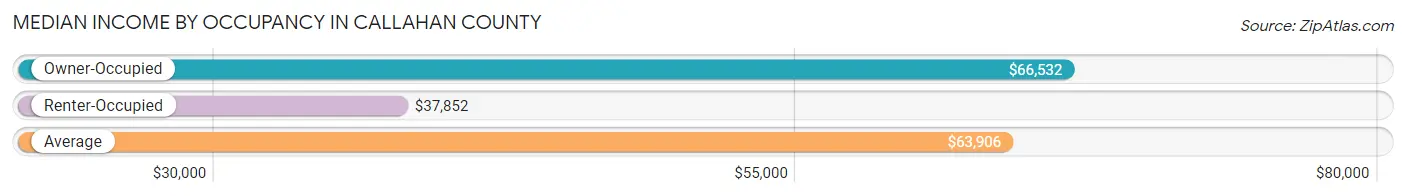
| Occupancy Type | # Households | Median Income |
| Owner-Occupied | 4,323 (82.0%) | $66,532 |
| Renter-Occupied | 947 (18.0%) | $37,852 |
| Average | 5,270 (100.0%) | $63,906 |
Occupancy by Householder Income Bracket in Callahan County
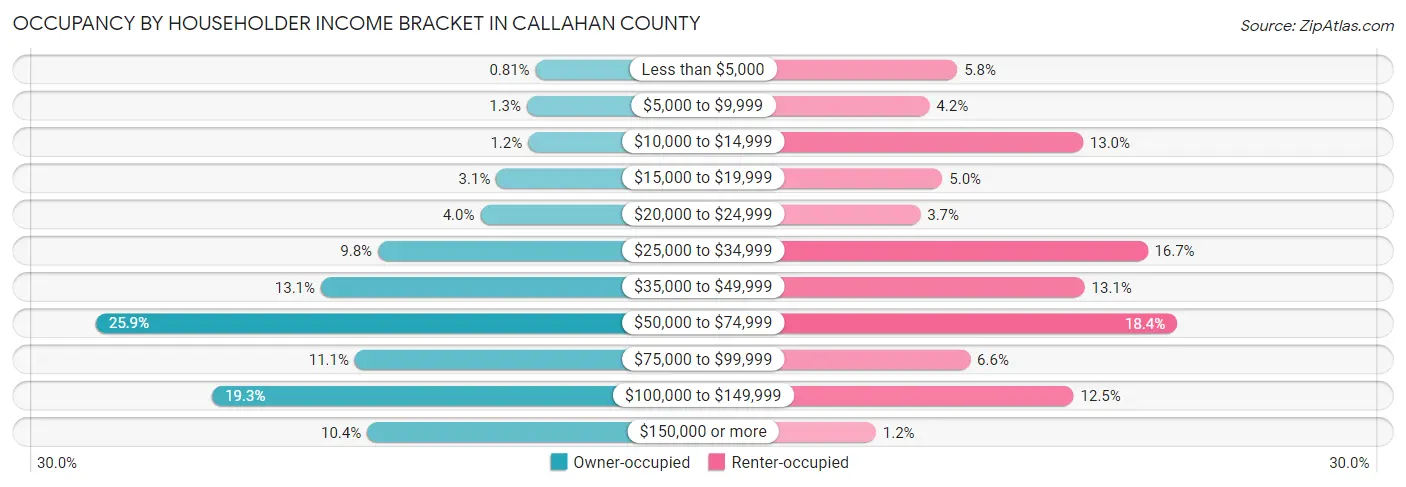
| Income Bracket | Owner-occupied | Renter-occupied |
| Less than $5,000 | 35 (0.8%) | 55 (5.8%) |
| $5,000 to $9,999 | 56 (1.3%) | 40 (4.2%) |
| $10,000 to $14,999 | 53 (1.2%) | 123 (13.0%) |
| $15,000 to $19,999 | 132 (3.0%) | 47 (5.0%) |
| $20,000 to $24,999 | 171 (4.0%) | 35 (3.7%) |
| $25,000 to $34,999 | 424 (9.8%) | 158 (16.7%) |
| $35,000 to $49,999 | 565 (13.1%) | 124 (13.1%) |
| $50,000 to $74,999 | 1,121 (25.9%) | 174 (18.4%) |
| $75,000 to $99,999 | 481 (11.1%) | 62 (6.6%) |
| $100,000 to $149,999 | 834 (19.3%) | 118 (12.5%) |
| $150,000 or more | 451 (10.4%) | 11 (1.2%) |
| Total | 4,323 (100.0%) | 947 (100.0%) |
Monthly Housing Cost Tiers in Callahan County
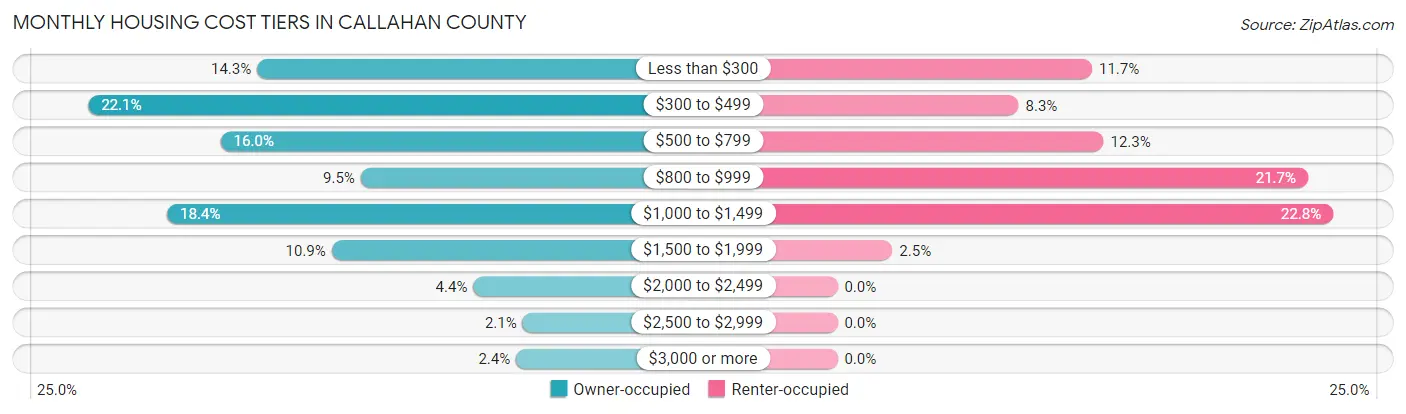
| Monthly Cost | Owner-occupied | Renter-occupied |
| Less than $300 | 618 (14.3%) | 111 (11.7%) |
| $300 to $499 | 954 (22.1%) | 79 (8.3%) |
| $500 to $799 | 691 (16.0%) | 116 (12.2%) |
| $800 to $999 | 412 (9.5%) | 205 (21.6%) |
| $1,000 to $1,499 | 797 (18.4%) | 216 (22.8%) |
| $1,500 to $1,999 | 470 (10.9%) | 24 (2.5%) |
| $2,000 to $2,499 | 188 (4.3%) | 0 (0.0%) |
| $2,500 to $2,999 | 90 (2.1%) | 0 (0.0%) |
| $3,000 or more | 103 (2.4%) | 0 (0.0%) |
| Total | 4,323 (100.0%) | 947 (100.0%) |
Physical Housing Characteristics in Callahan County
Housing Structures in Callahan County
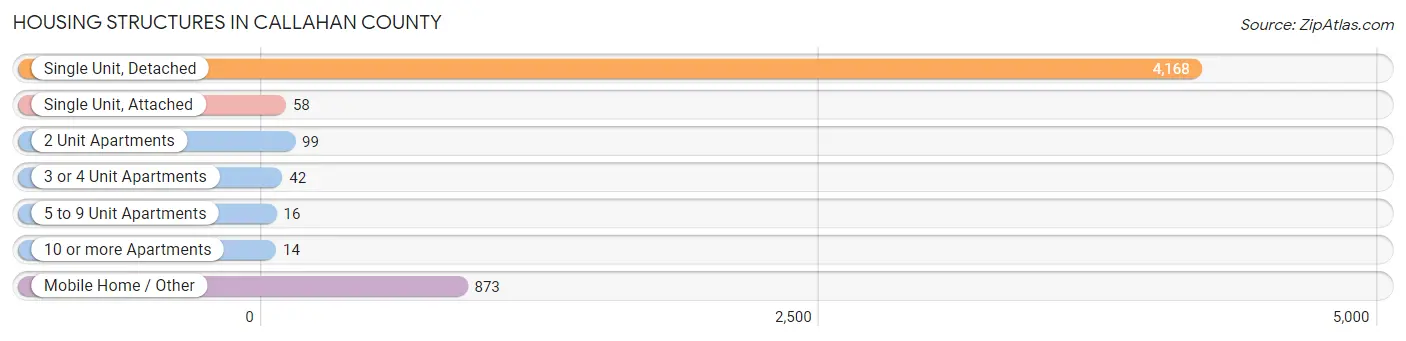
| Structure Type | # Housing Units | % Housing Units |
| Single Unit, Detached | 4,168 | 79.1% |
| Single Unit, Attached | 58 | 1.1% |
| 2 Unit Apartments | 99 | 1.9% |
| 3 or 4 Unit Apartments | 42 | 0.8% |
| 5 to 9 Unit Apartments | 16 | 0.3% |
| 10 or more Apartments | 14 | 0.3% |
| Mobile Home / Other | 873 | 16.6% |
| Total | 5,270 | 100.0% |
Housing Structures by Occupancy in Callahan County
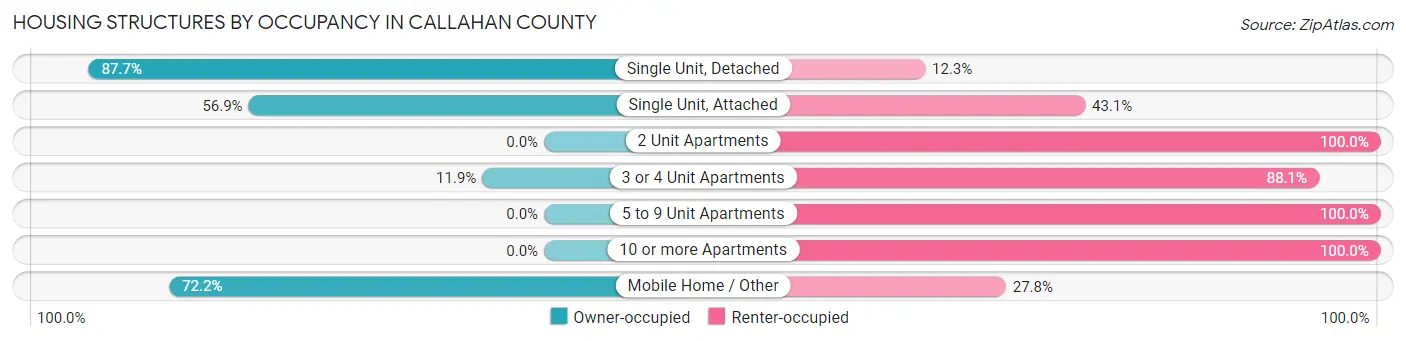
| Structure Type | Owner-occupied | Renter-occupied |
| Single Unit, Detached | 3,655 (87.7%) | 513 (12.3%) |
| Single Unit, Attached | 33 (56.9%) | 25 (43.1%) |
| 2 Unit Apartments | 0 (0.0%) | 99 (100.0%) |
| 3 or 4 Unit Apartments | 5 (11.9%) | 37 (88.1%) |
| 5 to 9 Unit Apartments | 0 (0.0%) | 16 (100.0%) |
| 10 or more Apartments | 0 (0.0%) | 14 (100.0%) |
| Mobile Home / Other | 630 (72.2%) | 243 (27.8%) |
| Total | 4,323 (82.0%) | 947 (18.0%) |
Housing Structures by Number of Rooms in Callahan County
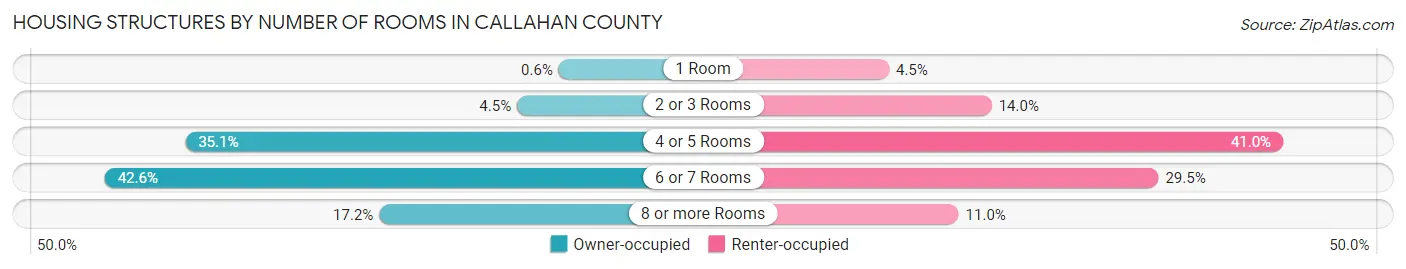
| Number of Rooms | Owner-occupied | Renter-occupied |
| 1 Room | 26 (0.6%) | 43 (4.5%) |
| 2 or 3 Rooms | 193 (4.5%) | 133 (14.0%) |
| 4 or 5 Rooms | 1,519 (35.1%) | 388 (41.0%) |
| 6 or 7 Rooms | 1,841 (42.6%) | 279 (29.5%) |
| 8 or more Rooms | 744 (17.2%) | 104 (11.0%) |
| Total | 4,323 (100.0%) | 947 (100.0%) |
Housing Structure by Heating Type in Callahan County
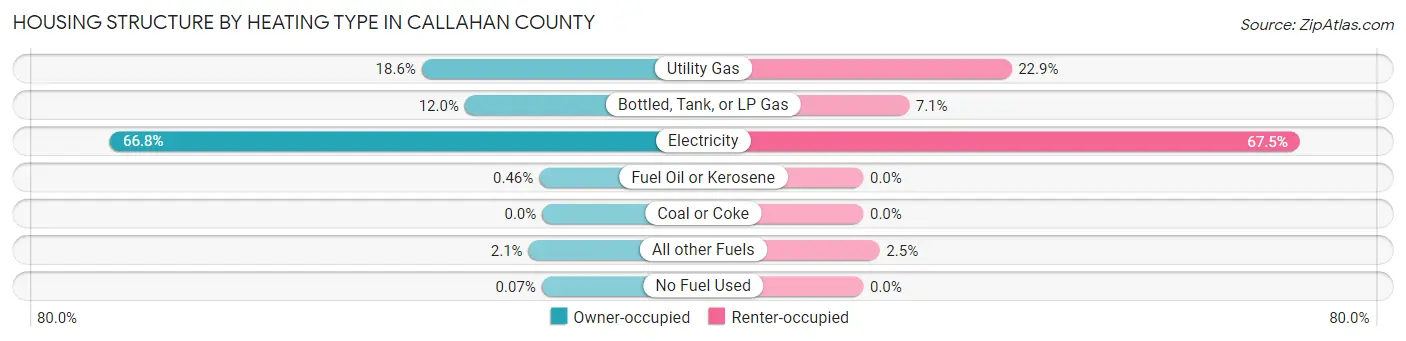
| Heating Type | Owner-occupied | Renter-occupied |
| Utility Gas | 805 (18.6%) | 217 (22.9%) |
| Bottled, Tank, or LP Gas | 517 (12.0%) | 67 (7.1%) |
| Electricity | 2,887 (66.8%) | 639 (67.5%) |
| Fuel Oil or Kerosene | 20 (0.5%) | 0 (0.0%) |
| Coal or Coke | 0 (0.0%) | 0 (0.0%) |
| All other Fuels | 91 (2.1%) | 24 (2.5%) |
| No Fuel Used | 3 (0.1%) | 0 (0.0%) |
| Total | 4,323 (100.0%) | 947 (100.0%) |
Household Vehicle Usage in Callahan County
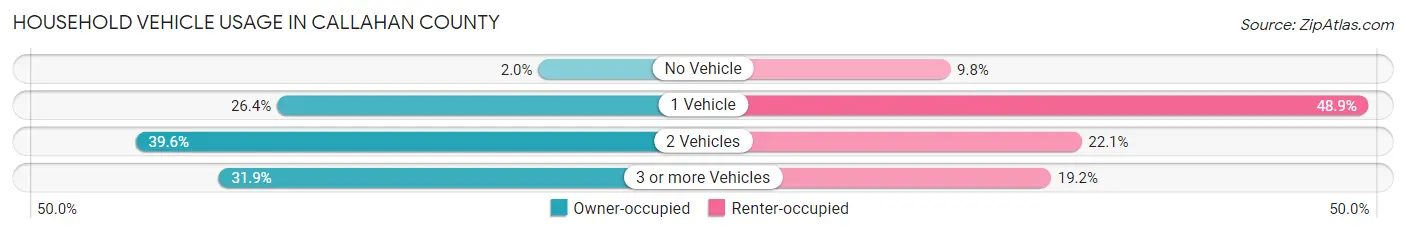
| Vehicles per Household | Owner-occupied | Renter-occupied |
| No Vehicle | 88 (2.0%) | 93 (9.8%) |
| 1 Vehicle | 1,143 (26.4%) | 463 (48.9%) |
| 2 Vehicles | 1,713 (39.6%) | 209 (22.1%) |
| 3 or more Vehicles | 1,379 (31.9%) | 182 (19.2%) |
| Total | 4,323 (100.0%) | 947 (100.0%) |
Real Estate & Mortgages in Callahan County
Real Estate and Mortgage Overview in Callahan County
| Characteristic | Without Mortgage | With Mortgage |
| Housing Units | 2,483 | 1,840 |
| Median Property Value | $123,900 | $134,900 |
| Median Household Income | $56,995 | $285 |
| Monthly Housing Costs | $446 | $103 |
| Real Estate Taxes | $910 | $149 |
Property Value by Mortgage Status in Callahan County
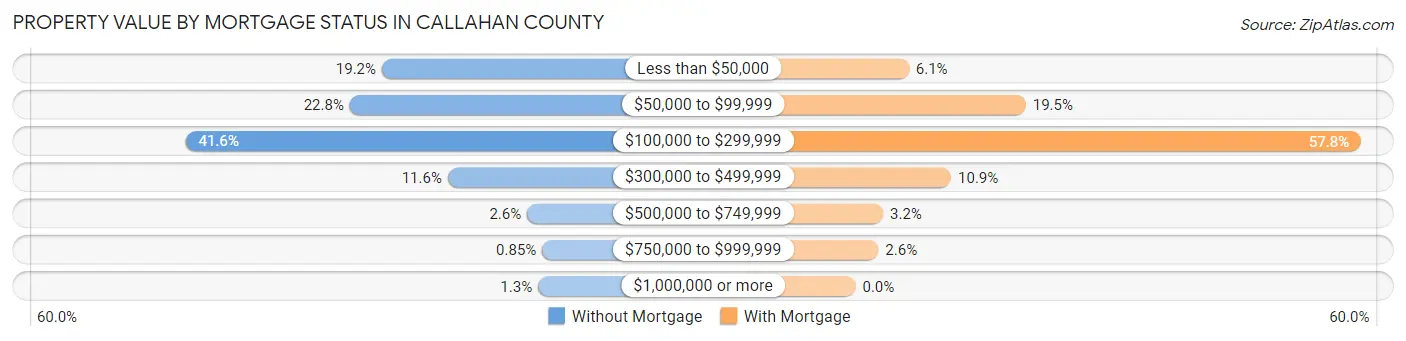
| Property Value | Without Mortgage | With Mortgage |
| Less than $50,000 | 476 (19.2%) | 112 (6.1%) |
| $50,000 to $99,999 | 567 (22.8%) | 358 (19.5%) |
| $100,000 to $299,999 | 1,033 (41.6%) | 1,063 (57.8%) |
| $300,000 to $499,999 | 289 (11.6%) | 201 (10.9%) |
| $500,000 to $749,999 | 64 (2.6%) | 58 (3.2%) |
| $750,000 to $999,999 | 21 (0.9%) | 48 (2.6%) |
| $1,000,000 or more | 33 (1.3%) | 0 (0.0%) |
| Total | 2,483 (100.0%) | 1,840 (100.0%) |
Household Income by Mortgage Status in Callahan County
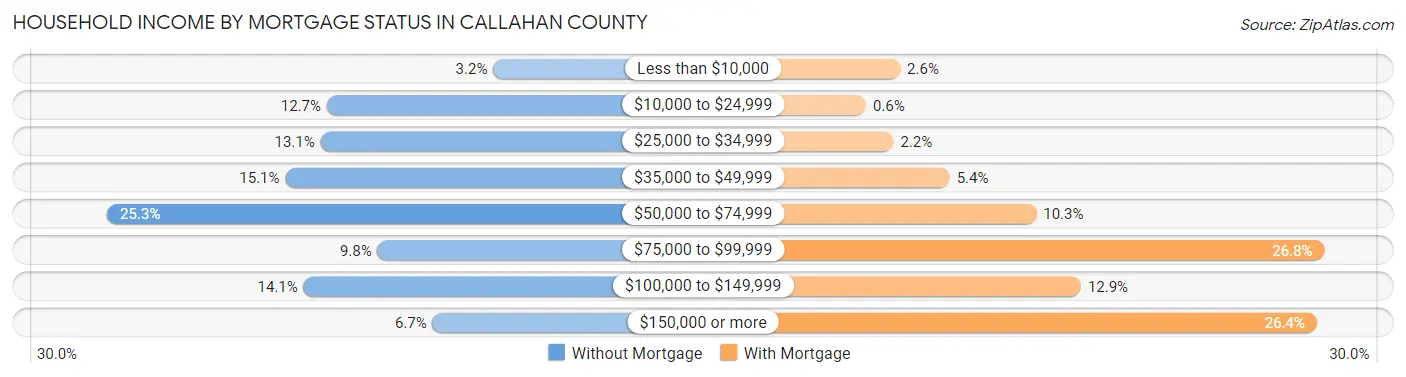
| Household Income | Without Mortgage | With Mortgage |
| Less than $10,000 | 80 (3.2%) | 47 (2.5%) |
| $10,000 to $24,999 | 316 (12.7%) | 11 (0.6%) |
| $25,000 to $34,999 | 325 (13.1%) | 40 (2.2%) |
| $35,000 to $49,999 | 375 (15.1%) | 99 (5.4%) |
| $50,000 to $74,999 | 628 (25.3%) | 190 (10.3%) |
| $75,000 to $99,999 | 244 (9.8%) | 493 (26.8%) |
| $100,000 to $149,999 | 349 (14.1%) | 237 (12.9%) |
| $150,000 or more | 166 (6.7%) | 485 (26.4%) |
| Total | 2,483 (100.0%) | 1,840 (100.0%) |
Property Value to Household Income Ratio in Callahan County
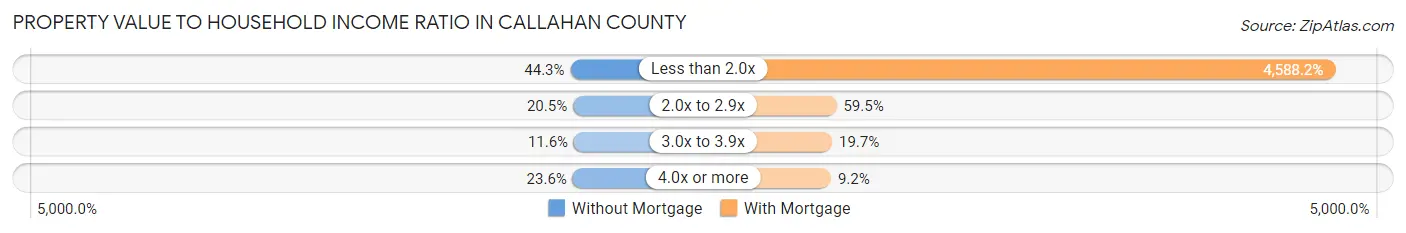
| Value-to-Income Ratio | Without Mortgage | With Mortgage |
| Less than 2.0x | 1,100 (44.3%) | 84,423 (4,588.2%) |
| 2.0x to 2.9x | 509 (20.5%) | 1,094 (59.5%) |
| 3.0x to 3.9x | 289 (11.6%) | 362 (19.7%) |
| 4.0x or more | 585 (23.6%) | 170 (9.2%) |
| Total | 2,483 (100.0%) | 1,840 (100.0%) |
Real Estate Taxes by Mortgage Status in Callahan County
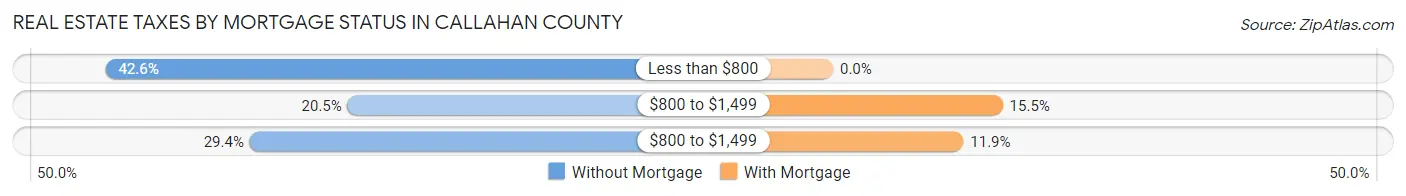
| Property Taxes | Without Mortgage | With Mortgage |
| Less than $800 | 1,058 (42.6%) | 0 (0.0%) |
| $800 to $1,499 | 509 (20.5%) | 285 (15.5%) |
| $800 to $1,499 | 731 (29.4%) | 219 (11.9%) |
| Total | 2,483 (100.0%) | 1,840 (100.0%) |
Health & Disability in Callahan County
Health Insurance Coverage by Age in Callahan County
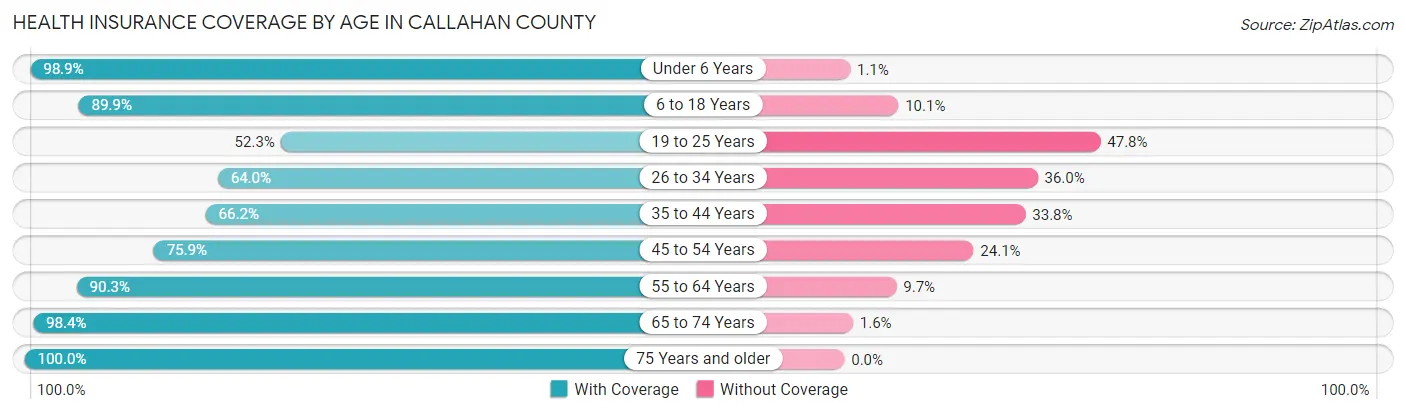
| Age Bracket | With Coverage | Without Coverage |
| Under 6 Years | 922 (98.9%) | 10 (1.1%) |
| 6 to 18 Years | 2,111 (89.9%) | 236 (10.1%) |
| 19 to 25 Years | 523 (52.2%) | 478 (47.7%) |
| 26 to 34 Years | 838 (64.0%) | 472 (36.0%) |
| 35 to 44 Years | 1,061 (66.2%) | 541 (33.8%) |
| 45 to 54 Years | 1,277 (75.9%) | 405 (24.1%) |
| 55 to 64 Years | 1,897 (90.3%) | 204 (9.7%) |
| 65 to 74 Years | 1,663 (98.4%) | 27 (1.6%) |
| 75 Years and older | 1,101 (100.0%) | 0 (0.0%) |
| Total | 11,393 (82.8%) | 2,373 (17.2%) |
Health Insurance Coverage by Citizenship Status in Callahan County
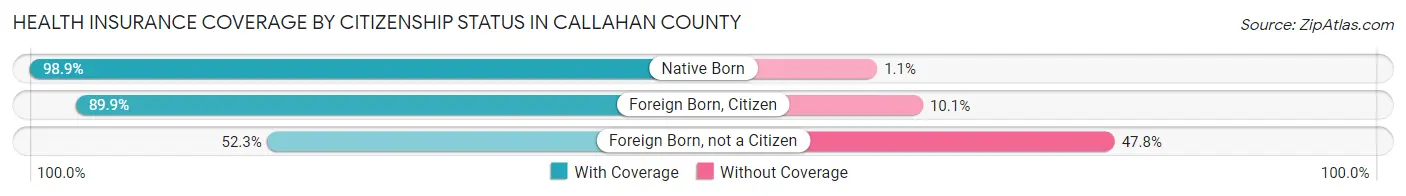
| Citizenship Status | With Coverage | Without Coverage |
| Native Born | 922 (98.9%) | 10 (1.1%) |
| Foreign Born, Citizen | 2,111 (89.9%) | 236 (10.1%) |
| Foreign Born, not a Citizen | 523 (52.2%) | 478 (47.7%) |
Health Insurance Coverage by Household Income in Callahan County
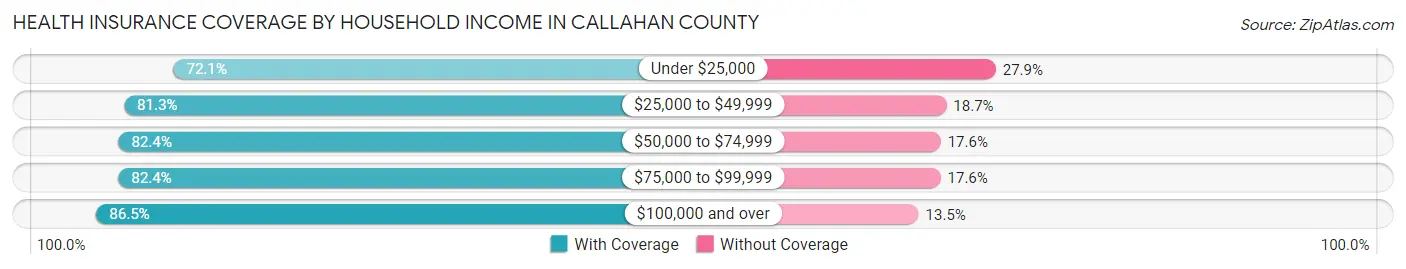
| Household Income | With Coverage | Without Coverage |
| Under $25,000 | 798 (72.1%) | 309 (27.9%) |
| $25,000 to $49,999 | 2,311 (81.3%) | 530 (18.7%) |
| $50,000 to $74,999 | 3,001 (82.4%) | 641 (17.6%) |
| $75,000 to $99,999 | 1,233 (82.4%) | 263 (17.6%) |
| $100,000 and over | 4,050 (86.5%) | 630 (13.5%) |
Public vs Private Health Insurance Coverage by Age in Callahan County
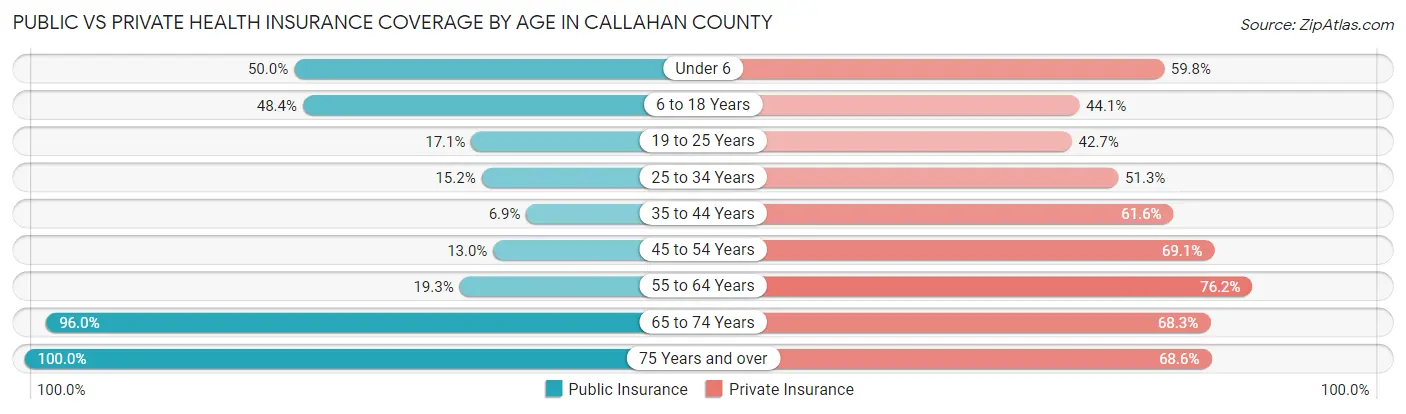
| Age Bracket | Public Insurance | Private Insurance |
| Under 6 | 466 (50.0%) | 557 (59.8%) |
| 6 to 18 Years | 1,135 (48.4%) | 1,034 (44.1%) |
| 19 to 25 Years | 171 (17.1%) | 427 (42.7%) |
| 25 to 34 Years | 199 (15.2%) | 672 (51.3%) |
| 35 to 44 Years | 110 (6.9%) | 986 (61.6%) |
| 45 to 54 Years | 219 (13.0%) | 1,162 (69.1%) |
| 55 to 64 Years | 405 (19.3%) | 1,601 (76.2%) |
| 65 to 74 Years | 1,622 (96.0%) | 1,155 (68.3%) |
| 75 Years and over | 1,101 (100.0%) | 755 (68.6%) |
| Total | 5,428 (39.4%) | 8,349 (60.7%) |
Disability Status by Sex by Age in Callahan County
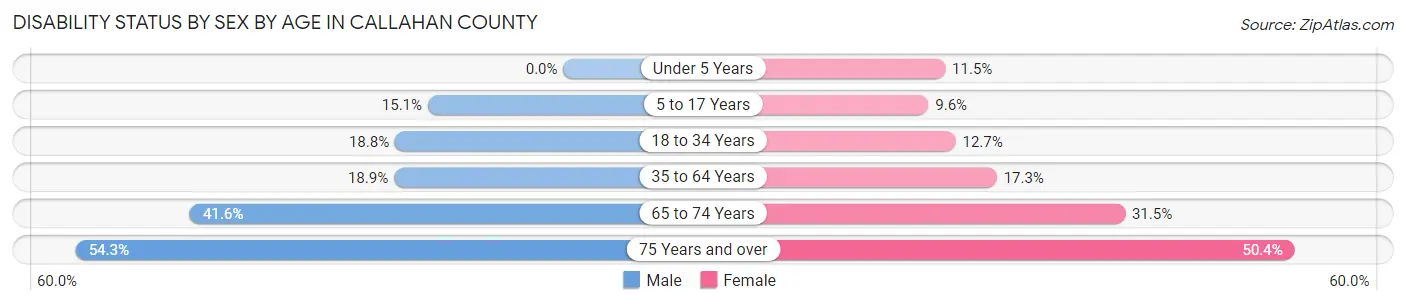
| Age Bracket | Male | Female |
| Under 5 Years | 0 (0.0%) | 42 (11.5%) |
| 5 to 17 Years | 179 (15.1%) | 102 (9.6%) |
| 18 to 34 Years | 244 (18.8%) | 167 (12.7%) |
| 35 to 64 Years | 505 (18.9%) | 467 (17.2%) |
| 65 to 74 Years | 348 (41.6%) | 269 (31.5%) |
| 75 Years and over | 278 (54.3%) | 297 (50.4%) |
Disability Class by Sex by Age in Callahan County
Disability Class: Hearing Difficulty
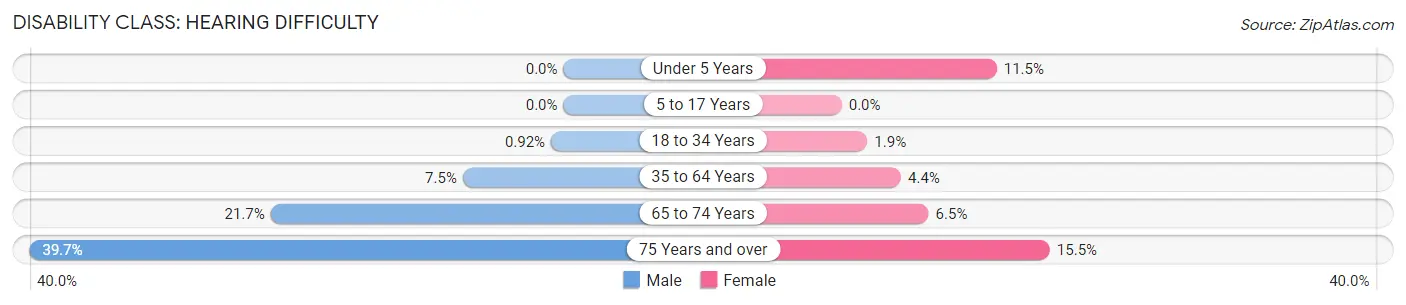
| Age Bracket | Male | Female |
| Under 5 Years | 0 (0.0%) | 42 (11.5%) |
| 5 to 17 Years | 0 (0.0%) | 0 (0.0%) |
| 18 to 34 Years | 12 (0.9%) | 25 (1.9%) |
| 35 to 64 Years | 200 (7.5%) | 119 (4.4%) |
| 65 to 74 Years | 182 (21.7%) | 55 (6.5%) |
| 75 Years and over | 203 (39.7%) | 91 (15.4%) |
Disability Class: Vision Difficulty
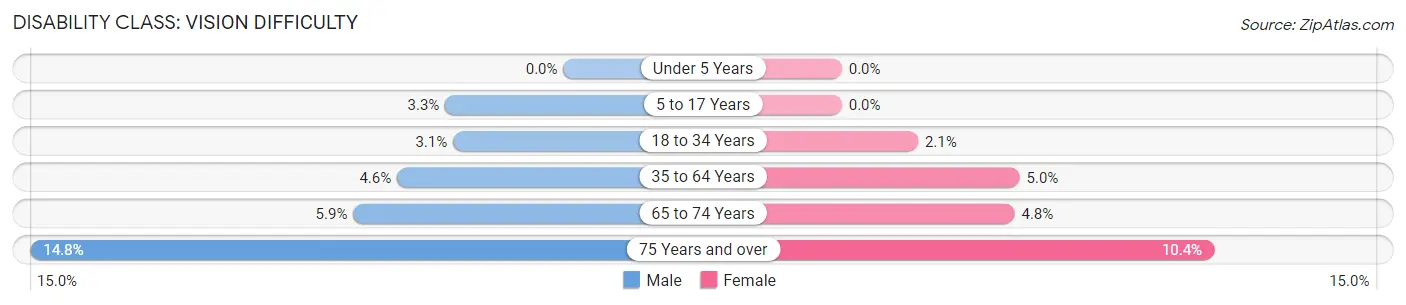
| Age Bracket | Male | Female |
| Under 5 Years | 0 (0.0%) | 0 (0.0%) |
| 5 to 17 Years | 39 (3.3%) | 0 (0.0%) |
| 18 to 34 Years | 40 (3.1%) | 28 (2.1%) |
| 35 to 64 Years | 124 (4.6%) | 134 (5.0%) |
| 65 to 74 Years | 49 (5.9%) | 41 (4.8%) |
| 75 Years and over | 76 (14.8%) | 61 (10.4%) |
Disability Class: Cognitive Difficulty
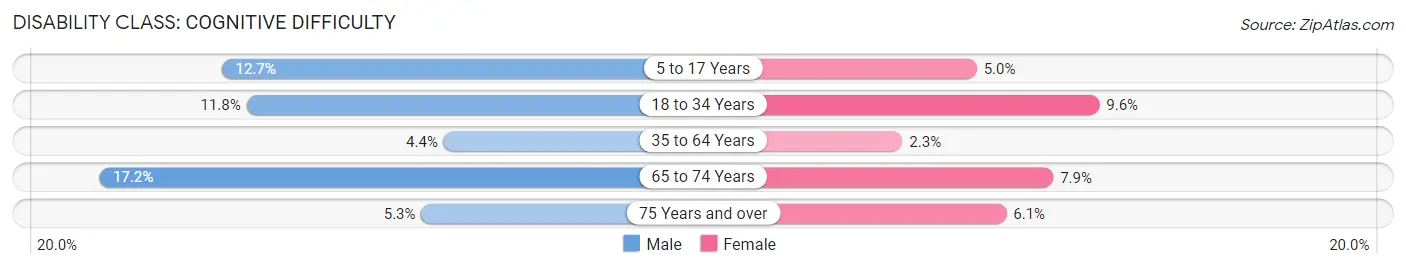
| Age Bracket | Male | Female |
| 5 to 17 Years | 150 (12.7%) | 53 (5.0%) |
| 18 to 34 Years | 153 (11.8%) | 126 (9.6%) |
| 35 to 64 Years | 119 (4.4%) | 61 (2.2%) |
| 65 to 74 Years | 144 (17.2%) | 67 (7.9%) |
| 75 Years and over | 27 (5.3%) | 36 (6.1%) |
Disability Class: Ambulatory Difficulty
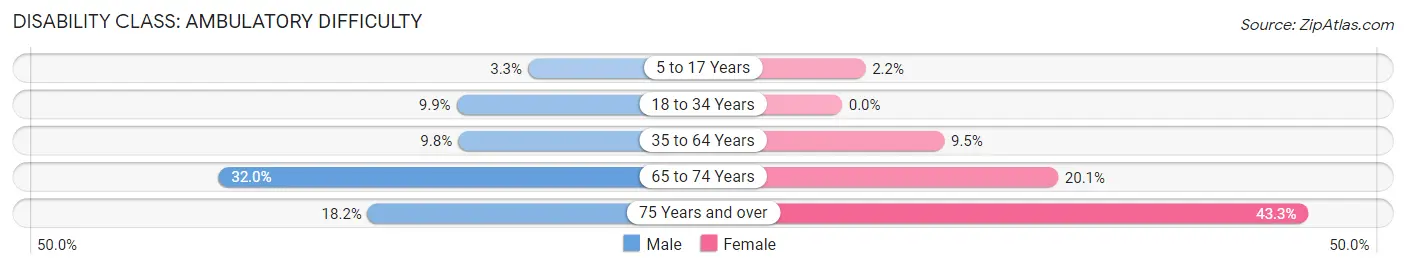
| Age Bracket | Male | Female |
| 5 to 17 Years | 39 (3.3%) | 23 (2.2%) |
| 18 to 34 Years | 129 (9.9%) | 0 (0.0%) |
| 35 to 64 Years | 262 (9.8%) | 257 (9.5%) |
| 65 to 74 Years | 268 (32.0%) | 171 (20.1%) |
| 75 Years and over | 93 (18.2%) | 255 (43.3%) |
Disability Class: Self-Care Difficulty
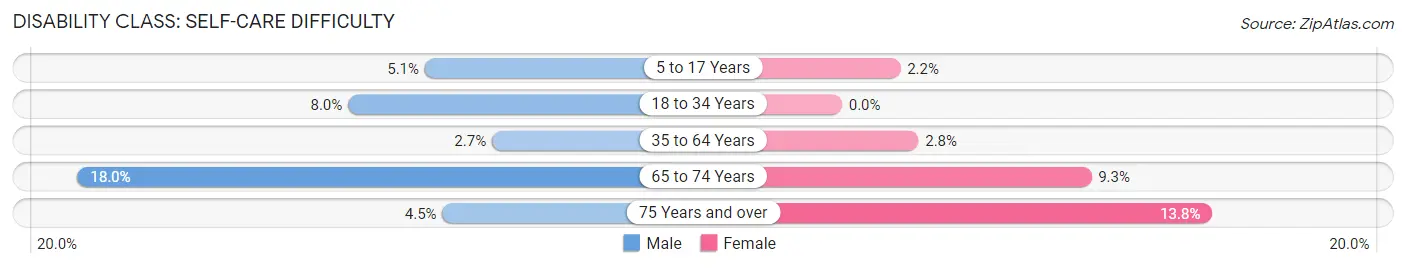
| Age Bracket | Male | Female |
| 5 to 17 Years | 61 (5.1%) | 23 (2.2%) |
| 18 to 34 Years | 104 (8.0%) | 0 (0.0%) |
| 35 to 64 Years | 71 (2.6%) | 77 (2.8%) |
| 65 to 74 Years | 151 (18.0%) | 79 (9.3%) |
| 75 Years and over | 23 (4.5%) | 81 (13.8%) |
Technology Access in Callahan County
Computing Device Access in Callahan County
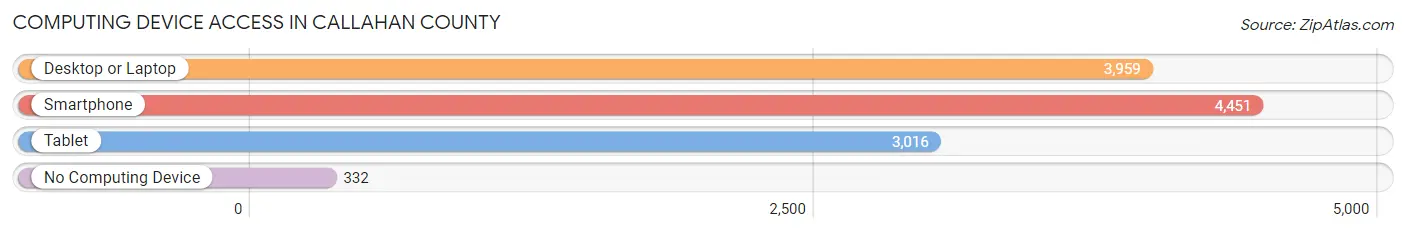
| Device Type | # Households | % Households |
| Desktop or Laptop | 3,959 | 75.1% |
| Smartphone | 4,451 | 84.5% |
| Tablet | 3,016 | 57.2% |
| No Computing Device | 332 | 6.3% |
| Total | 5,270 | 100.0% |
Internet Access in Callahan County
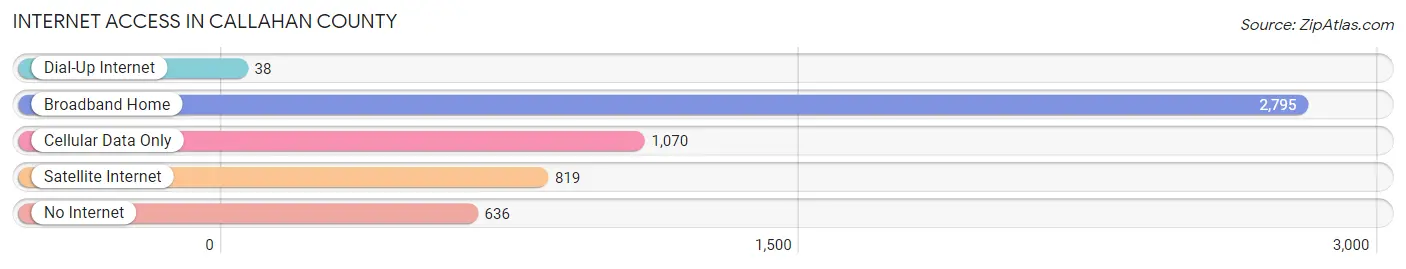
| Internet Type | # Households | % Households |
| Dial-Up Internet | 38 | 0.7% |
| Broadband Home | 2,795 | 53.0% |
| Cellular Data Only | 1,070 | 20.3% |
| Satellite Internet | 819 | 15.5% |
| No Internet | 636 | 12.1% |
| Total | 5,270 | 100.0% |
Callahan County Summary
Callahan County is located in the western part of the state of Texas, in the United States. It is part of the Abilene, Texas Metropolitan Statistical Area. The county was created in 1877 and is named for James Hughes Callahan, a Confederate soldier and Texas state legislator. As of the 2010 census, the population was 13,544.
Geography
Callahan County is located in the western part of Texas, in the United States. It is bordered by Taylor County to the north, Shackelford County to the east, Eastland County to the south, and Jones County to the west. The county covers an area of 902 square miles, of which 899 square miles is land and 3 square miles is water. The county is located in the Rolling Plains region of Texas, and is characterized by rolling hills and grassy plains. The county seat is Baird, and the largest city is Clyde.
The county is home to several natural features, including the Clear Fork of the Brazos River, which runs through the county from north to south. Other major waterways include the Callahan Divide, which runs through the county from east to west, and the Colorado River, which forms the county's western border.
Climate
Callahan County has a humid subtropical climate, with hot summers and mild winters. The average annual temperature is 64°F, and the average annual precipitation is 22 inches.
Demographics
As of the 2010 census, there were 13,544 people, 4,945 households, and 3,541 families living in the county. The population density was 15 people per square mile. The racial makeup of the county was 87.3% White, 5.2% Black or African American, 0.7% Native American, 0.4% Asian, 0.1% Pacific Islander, 4.7% from other races, and 1.6% from two or more races. 11.7% of the population were Hispanic or Latino of any race.
The median income for a household in the county was $37,945, and the median income for a family was $45,945. The per capita income for the county was $18,945. About 13.2% of families and 16.3% of the population were below the poverty line, including 22.2% of those under age 18 and 11.7% of those age 65 or over.
Economy
The economy of Callahan County is largely based on agriculture and ranching. The county is home to several large ranches, including the Callahan Divide Ranch, which covers over 100,000 acres. The county is also home to several oil and gas fields, and the county's economy is bolstered by the oil and gas industry.
The county is also home to several manufacturing companies, including a large paper mill in Clyde. The county is also home to several retail stores, restaurants, and other businesses.
The county is served by the Abilene Regional Airport, which is located in nearby Abilene. The airport provides commercial air service to the county and the surrounding area.
Education
Callahan County is served by the Callahan County Independent School District, which operates several elementary, middle, and high schools in the county. The county is also home to several private schools, including Clyde Christian Academy and Baird Christian Academy.
The county is also home to Cisco College, a two-year community college located in Cisco. The college offers associate's degrees and certificates in a variety of fields.
Conclusion
Callahan County is a rural county located in the western part of Texas. The county is home to several large ranches and oil and gas fields, and the county's economy is bolstered by the oil and gas industry. The county is served by the Callahan County Independent School District, and is home to several private schools and Cisco College. The county is also home to several natural features, including the Clear Fork of the Brazos River and the Colorado River.
Common Questions
What is Per Capita Income in Callahan County?
Per Capita income in Callahan County is $31,856.
What is the Median Family Income in Callahan County?
Median Family Income in Callahan County is $71,302.
What is the Median Household income in Callahan County?
Median Household Income in Callahan County is $63,906.
What is Income or Wage Gap in Callahan County?
Income or Wage Gap in Callahan County is 42.5%.
Women in Callahan County earn 57.5 cents for every dollar earned by a man.
What is Inequality or Gini Index in Callahan County?
Inequality or Gini Index in Callahan County is 0.40.
What is the Total Population of Callahan County?
Total Population of Callahan County is 13,869.
What is the Total Male Population of Callahan County?
Total Male Population of Callahan County is 6,917.
What is the Total Female Population of Callahan County?
Total Female Population of Callahan County is 6,952.
What is the Ratio of Males per 100 Females in Callahan County?
There are 99.50 Males per 100 Females in Callahan County.
What is the Ratio of Females per 100 Males in Callahan County?
There are 100.51 Females per 100 Males in Callahan County.
What is the Median Population Age in Callahan County?
Median Population Age in Callahan County is 43.5 Years.
What is the Average Family Size in Callahan County
Average Family Size in Callahan County is 3.2 People.
What is the Average Household Size in Callahan County
Average Household Size in Callahan County is 2.6 People.
How Large is the Labor Force in Callahan County?
There are 6,559 People in the Labor Forcein in Callahan County.
What is the Percentage of People in the Labor Force in Callahan County?
58.0% of People are in the Labor Force in Callahan County.
What is the Unemployment Rate in Callahan County?
Unemployment Rate in Callahan County is 4.8%.