Calhoun County, TX Map & Demographics
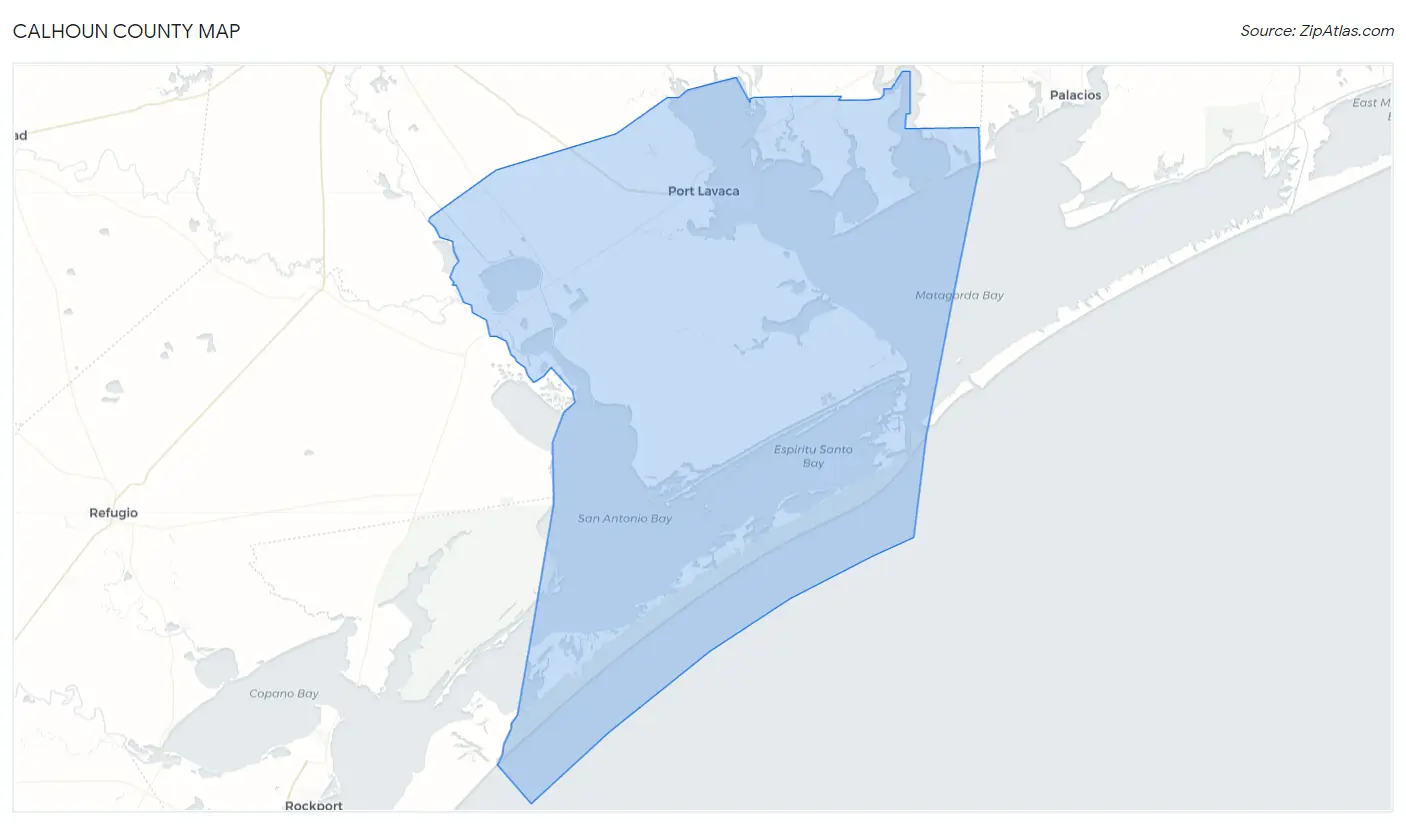
Calhoun County Map
Calhoun County Overview
$33,754
PER CAPITA INCOME
$81,276
AVG FAMILY INCOME
$62,267
AVG HOUSEHOLD INCOME
36.6%
WAGE / INCOME GAP [ % ]
63.4¢/ $1
WAGE / INCOME GAP [ $ ]
0.41
INEQUALITY / GINI INDEX
20,127
TOTAL POPULATION
10,402
MALE POPULATION
9,725
FEMALE POPULATION
106.96
MALES / 100 FEMALES
93.49
FEMALES / 100 MALES
38.4
MEDIAN AGE
3.0
AVG FAMILY SIZE
2.5
AVG HOUSEHOLD SIZE
10,026
LABOR FORCE [ PEOPLE ]
62.7%
PERCENT IN LABOR FORCE
3.4%
UNEMPLOYMENT RATE
Calhoun County Area Codes
Income in Calhoun County
Income Overview in Calhoun County
Per Capita Income in Calhoun County is $33,754, while median incomes of families and households are $81,276 and $62,267 respectively.
| Characteristic | Number | Measure |
| Per Capita Income | 20,127 | $33,754 |
| Median Family Income | 5,569 | $81,276 |
| Mean Family Income | 5,569 | $96,841 |
| Median Household Income | 8,045 | $62,267 |
| Mean Household Income | 8,045 | $81,858 |
| Income Deficit | 5,569 | $0 |
| Wage / Income Gap (%) | 20,127 | 36.58% |
| Wage / Income Gap ($) | 20,127 | 63.42¢ per $1 |
| Gini / Inequality Index | 20,127 | 0.41 |
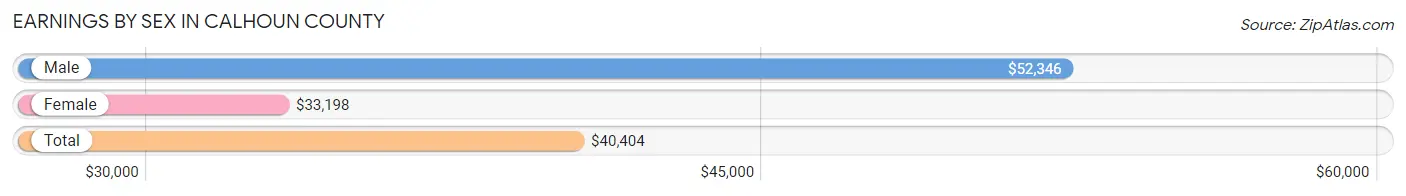
Earnings by Sex in Calhoun County
Average Earnings in Calhoun County are $40,404, $52,346 for men and $33,198 for women, a difference of 36.6%.
| Sex | Number | Average Earnings |
| Male | 5,900 (56.1%) | $52,346 |
| Female | 4,612 (43.9%) | $33,198 |
| Total | 10,512 (100.0%) | $40,404 |
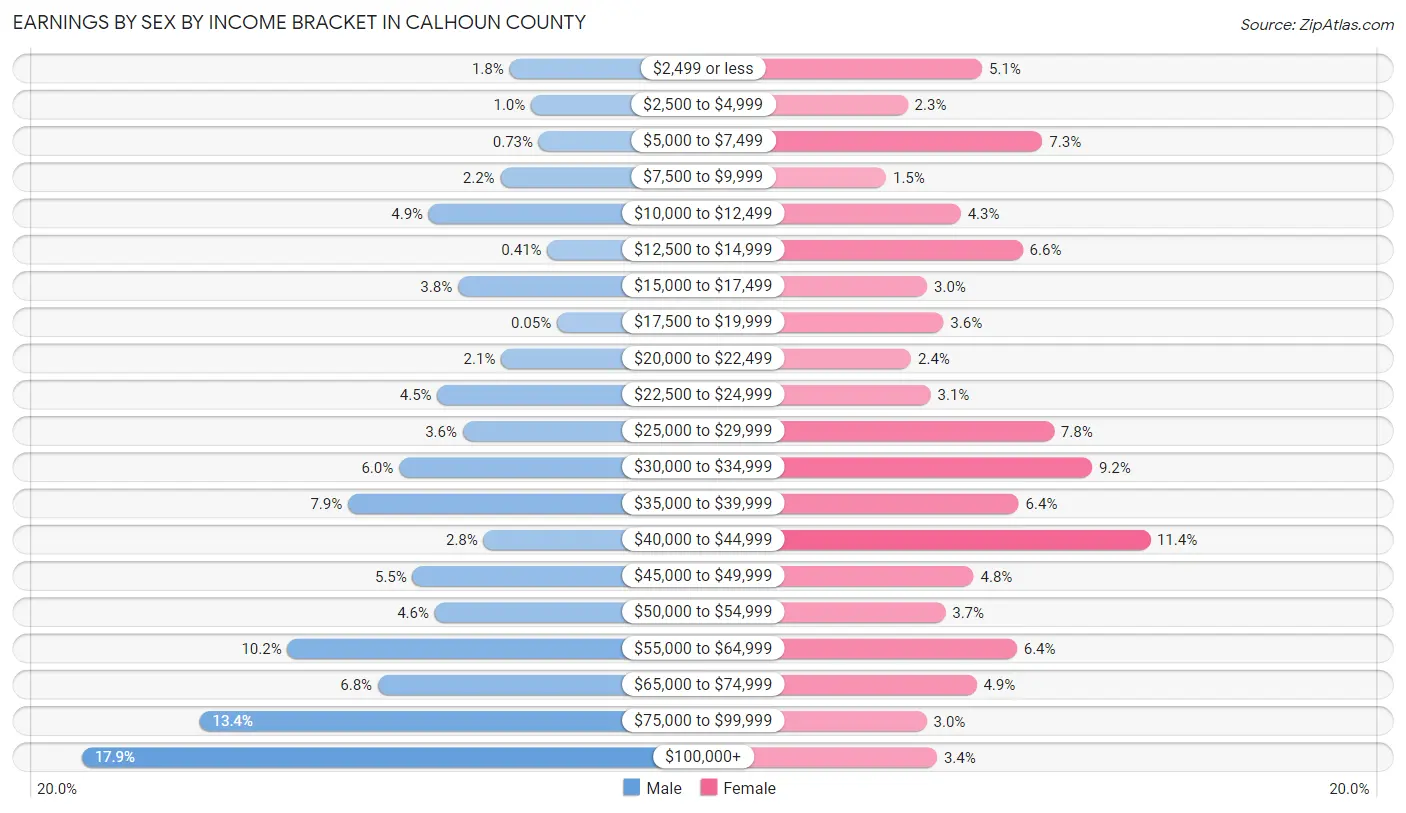
Earnings by Sex by Income Bracket in Calhoun County
The most common earnings brackets in Calhoun County are $100,000+ for men (1,054 | 17.9%) and $40,000 to $44,999 for women (524 | 11.4%).
| Income | Male | Female |
| $2,499 or less | 108 (1.8%) | 234 (5.1%) |
| $2,500 to $4,999 | 60 (1.0%) | 105 (2.3%) |
| $5,000 to $7,499 | 43 (0.7%) | 338 (7.3%) |
| $7,500 to $9,999 | 128 (2.2%) | 68 (1.5%) |
| $10,000 to $12,499 | 286 (4.9%) | 197 (4.3%) |
| $12,500 to $14,999 | 24 (0.4%) | 304 (6.6%) |
| $15,000 to $17,499 | 222 (3.8%) | 139 (3.0%) |
| $17,500 to $19,999 | 3 (0.1%) | 167 (3.6%) |
| $20,000 to $22,499 | 126 (2.1%) | 111 (2.4%) |
| $22,500 to $24,999 | 267 (4.5%) | 145 (3.1%) |
| $25,000 to $29,999 | 211 (3.6%) | 358 (7.8%) |
| $30,000 to $34,999 | 352 (6.0%) | 424 (9.2%) |
| $35,000 to $39,999 | 465 (7.9%) | 297 (6.4%) |
| $40,000 to $44,999 | 165 (2.8%) | 524 (11.4%) |
| $45,000 to $49,999 | 322 (5.5%) | 219 (4.8%) |
| $50,000 to $54,999 | 273 (4.6%) | 170 (3.7%) |
| $55,000 to $64,999 | 599 (10.2%) | 294 (6.4%) |
| $65,000 to $74,999 | 399 (6.8%) | 224 (4.9%) |
| $75,000 to $99,999 | 793 (13.4%) | 138 (3.0%) |
| $100,000+ | 1,054 (17.9%) | 156 (3.4%) |
| Total | 5,900 (100.0%) | 4,612 (100.0%) |
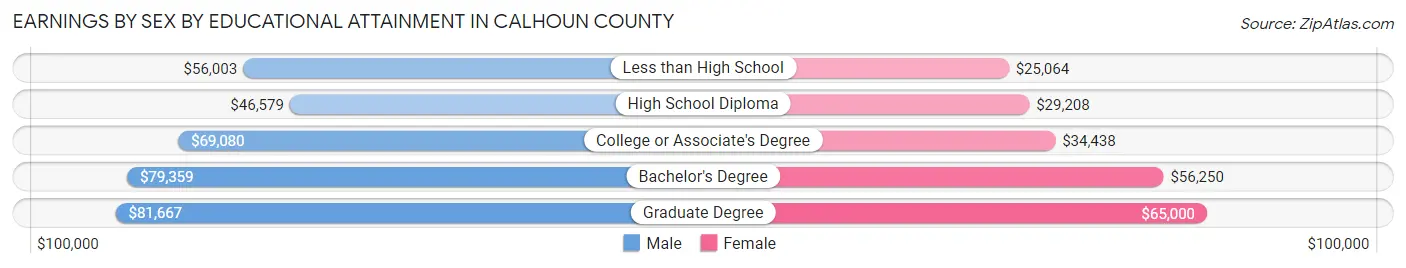
Earnings by Sex by Educational Attainment in Calhoun County
Average earnings in Calhoun County are $59,040 for men and $36,193 for women, a difference of 38.7%. Men with an educational attainment of graduate degree enjoy the highest average annual earnings of $81,667, while those with high school diploma education earn the least with $46,579. Women with an educational attainment of graduate degree earn the most with the average annual earnings of $65,000, while those with less than high school education have the smallest earnings of $25,064.
| Educational Attainment | Male Income | Female Income |
| Less than High School | $56,003 | $25,064 |
| High School Diploma | $46,579 | $29,208 |
| College or Associate's Degree | $69,080 | $34,438 |
| Bachelor's Degree | $79,359 | $56,250 |
| Graduate Degree | $81,667 | $65,000 |
| Total | $59,040 | $36,193 |
Family Income in Calhoun County
Family Income Brackets in Calhoun County
According to the Calhoun County family income data, there are 1,181 families falling into the $100,000 to $149,999 income range, which is the most common income bracket and makes up 21.2% of all families. Conversely, the $10,000 to $14,999 income bracket is the least frequent group with only 72 families (1.3%) belonging to this category.
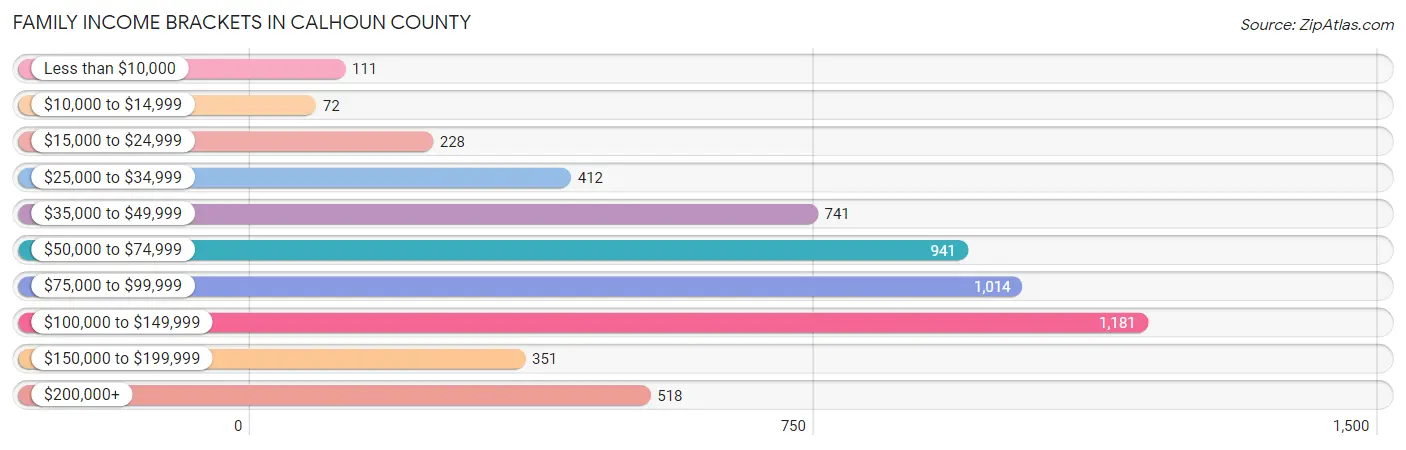
| Income Bracket | # Families | % Families |
| Less than $10,000 | 111 | 2.0% |
| $10,000 to $14,999 | 72 | 1.3% |
| $15,000 to $24,999 | 228 | 4.1% |
| $25,000 to $34,999 | 412 | 7.4% |
| $35,000 to $49,999 | 741 | 13.3% |
| $50,000 to $74,999 | 941 | 16.9% |
| $75,000 to $99,999 | 1,014 | 18.2% |
| $100,000 to $149,999 | 1,181 | 21.2% |
| $150,000 to $199,999 | 351 | 6.3% |
| $200,000+ | 518 | 9.3% |
Family Income by Famaliy Size in Calhoun County
3-person families (1,193 | 21.4%) account for the highest median family income in Calhoun County with $104,425 per family, while 3-person families (1,193 | 21.4%) have the highest median income of $34,808 per family member.
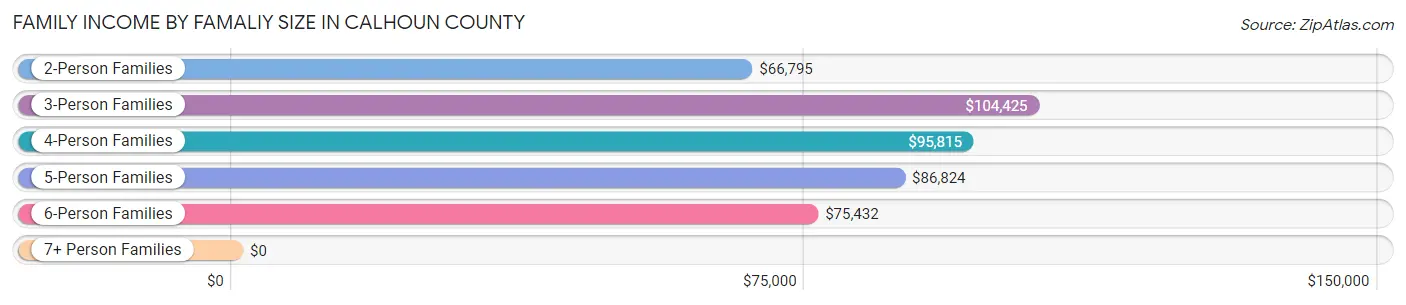
| Income Bracket | # Families | Median Income |
| 2-Person Families | 2,894 (52.0%) | $66,795 |
| 3-Person Families | 1,193 (21.4%) | $104,425 |
| 4-Person Families | 845 (15.2%) | $95,815 |
| 5-Person Families | 367 (6.6%) | $86,824 |
| 6-Person Families | 199 (3.6%) | $75,432 |
| 7+ Person Families | 71 (1.3%) | $0 |
| Total | 5,569 (100.0%) | $81,276 |
Family Income by Number of Earners in Calhoun County
The median family income in Calhoun County is $81,276, with families comprising 3+ earners (651) having the highest median family income of $127,875, while families with no earners (801) have the lowest median family income of $49,125, accounting for 11.7% and 14.4% of families, respectively.
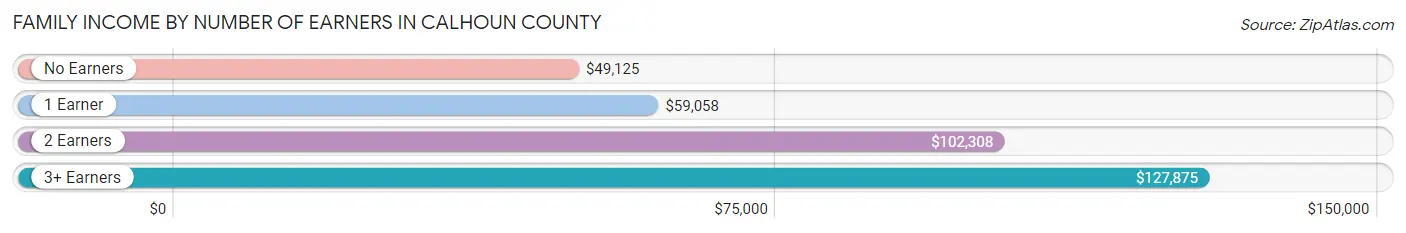
| Number of Earners | # Families | Median Income |
| No Earners | 801 (14.4%) | $49,125 |
| 1 Earner | 2,109 (37.9%) | $59,058 |
| 2 Earners | 2,008 (36.1%) | $102,308 |
| 3+ Earners | 651 (11.7%) | $127,875 |
| Total | 5,569 (100.0%) | $81,276 |
Household Income in Calhoun County
Household Income Brackets in Calhoun County
With 1,641 households falling in the category, the $50,000 to $74,999 income range is the most frequent in Calhoun County, accounting for 20.4% of all households. In contrast, only 225 households (2.8%) fall into the less than $10,000 income bracket, making it the least populous group.
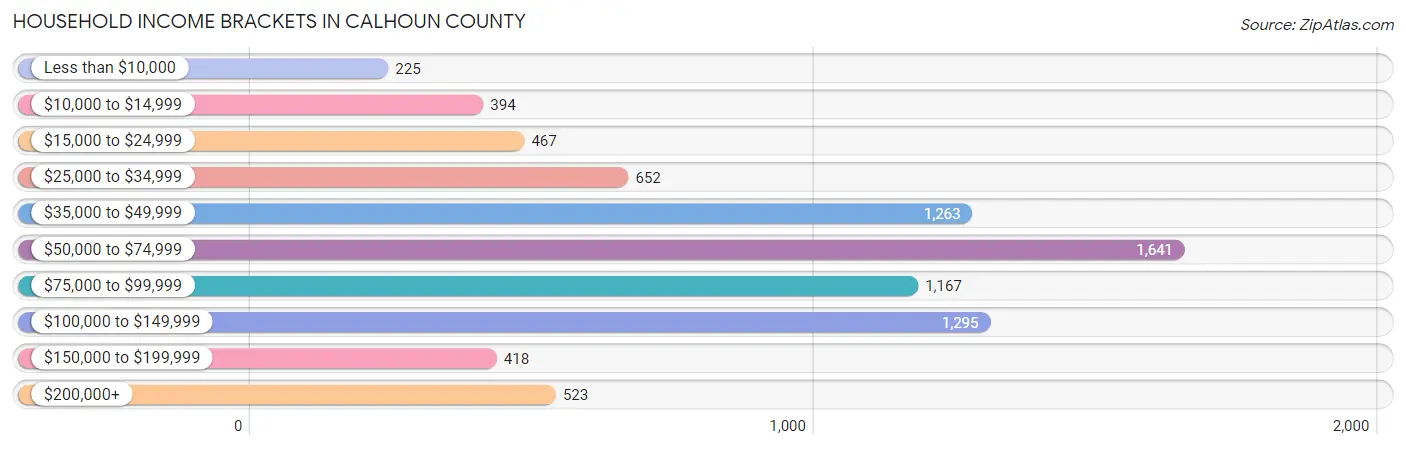
| Income Bracket | # Households | % Households |
| Less than $10,000 | 225 | 2.8% |
| $10,000 to $14,999 | 394 | 4.9% |
| $15,000 to $24,999 | 467 | 5.8% |
| $25,000 to $34,999 | 652 | 8.1% |
| $35,000 to $49,999 | 1,263 | 15.7% |
| $50,000 to $74,999 | 1,641 | 20.4% |
| $75,000 to $99,999 | 1,167 | 14.5% |
| $100,000 to $149,999 | 1,295 | 16.1% |
| $150,000 to $199,999 | 418 | 5.2% |
| $200,000+ | 523 | 6.5% |
Household Income by Householder Age in Calhoun County
The median household income in Calhoun County is $62,267, with the highest median household income of $79,397 found in the 45 to 64 years age bracket for the primary householder. A total of 2,931 households (36.4%) fall into this category. Meanwhile, the 65+ years age bracket for the primary householder has the lowest median household income of $44,205, with 2,228 households (27.7%) in this group.
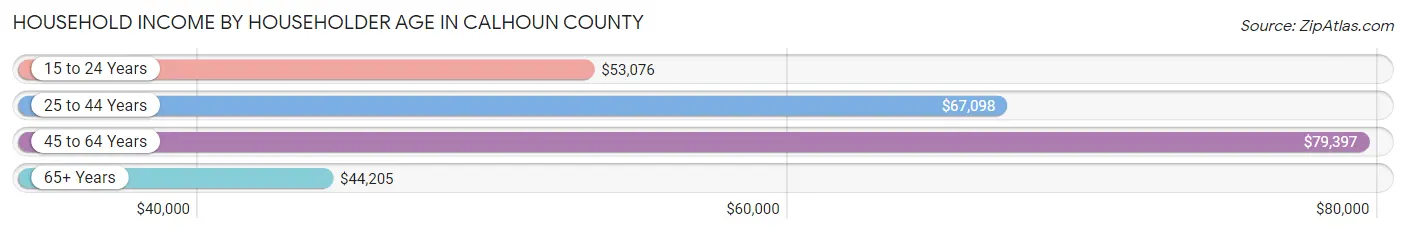
| Income Bracket | # Households | Median Income |
| 15 to 24 Years | 363 (4.5%) | $53,076 |
| 25 to 44 Years | 2,523 (31.4%) | $67,098 |
| 45 to 64 Years | 2,931 (36.4%) | $79,397 |
| 65+ Years | 2,228 (27.7%) | $44,205 |
| Total | 8,045 (100.0%) | $62,267 |
Poverty in Calhoun County
Income Below Poverty by Sex and Age in Calhoun County
With 8.6% poverty level for males and 9.9% for females among the residents of Calhoun County, under 5 year old males and 5 year old females are the most vulnerable to poverty, with 112 males (16.9%) and 36 females (34.9%) in their respective age groups living below the poverty level.
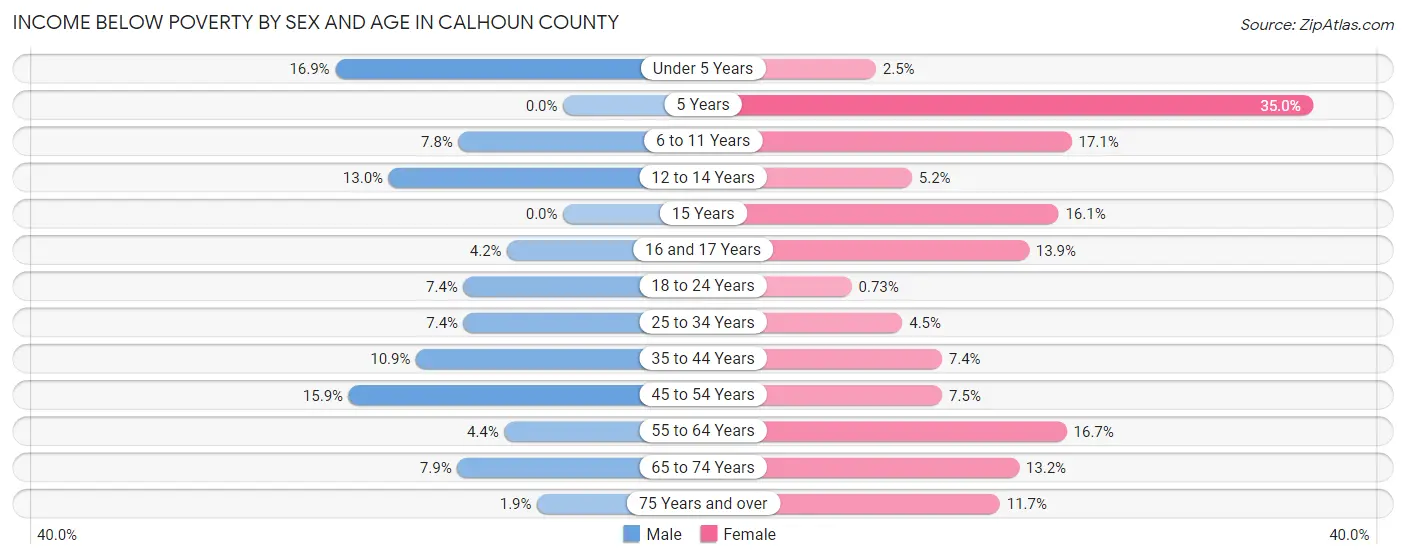
| Age Bracket | Male | Female |
| Under 5 Years | 112 (16.9%) | 15 (2.5%) |
| 5 Years | 0 (0.0%) | 36 (34.9%) |
| 6 to 11 Years | 54 (7.8%) | 136 (17.1%) |
| 12 to 14 Years | 57 (13.0%) | 18 (5.2%) |
| 15 Years | 0 (0.0%) | 28 (16.1%) |
| 16 and 17 Years | 13 (4.2%) | 40 (13.9%) |
| 18 to 24 Years | 69 (7.4%) | 6 (0.7%) |
| 25 to 34 Years | 103 (7.4%) | 47 (4.5%) |
| 35 to 44 Years | 114 (10.9%) | 89 (7.4%) |
| 45 to 54 Years | 196 (15.9%) | 80 (7.4%) |
| 55 to 64 Years | 65 (4.4%) | 227 (16.7%) |
| 65 to 74 Years | 83 (7.9%) | 134 (13.2%) |
| 75 Years and over | 13 (1.9%) | 91 (11.7%) |
| Total | 879 (8.6%) | 947 (9.9%) |
Income Above Poverty by Sex and Age in Calhoun County
According to the poverty statistics in Calhoun County, males aged 5 years and females aged 18 to 24 years are the age groups that are most secure financially, with 100.0% of males and 99.3% of females in these age groups living above the poverty line.
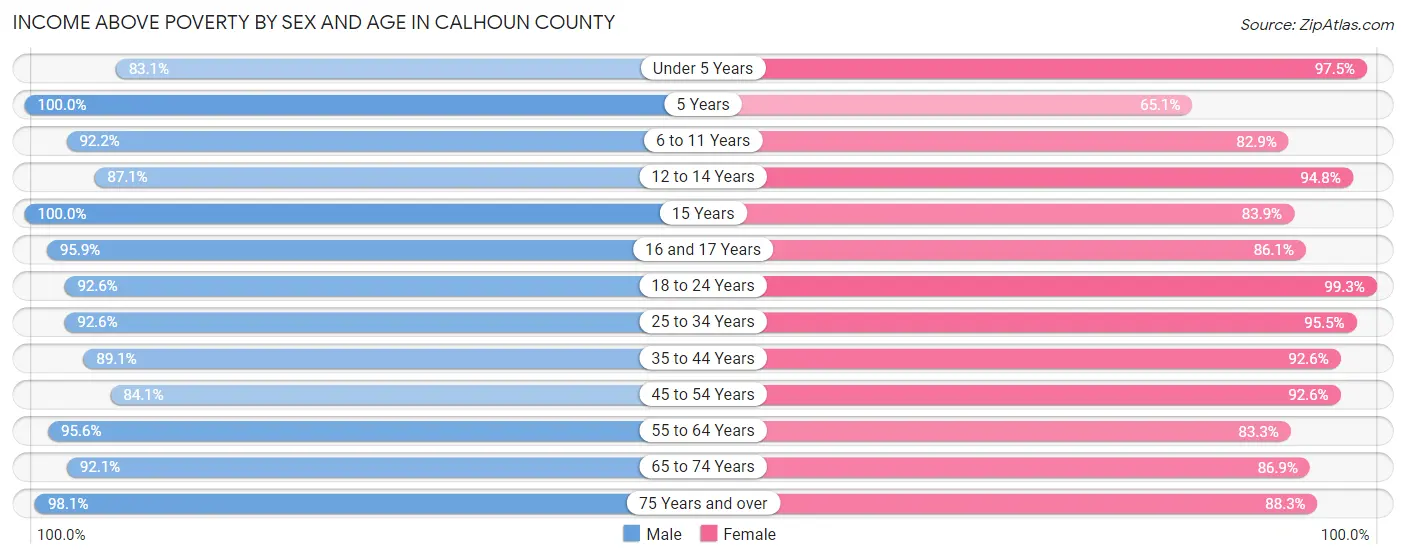
| Age Bracket | Male | Female |
| Under 5 Years | 550 (83.1%) | 577 (97.5%) |
| 5 Years | 162 (100.0%) | 67 (65.0%) |
| 6 to 11 Years | 641 (92.2%) | 661 (82.9%) |
| 12 to 14 Years | 383 (87.1%) | 328 (94.8%) |
| 15 Years | 139 (100.0%) | 146 (83.9%) |
| 16 and 17 Years | 300 (95.9%) | 248 (86.1%) |
| 18 to 24 Years | 863 (92.6%) | 821 (99.3%) |
| 25 to 34 Years | 1,293 (92.6%) | 999 (95.5%) |
| 35 to 44 Years | 930 (89.1%) | 1,109 (92.6%) |
| 45 to 54 Years | 1,035 (84.1%) | 994 (92.5%) |
| 55 to 64 Years | 1,427 (95.6%) | 1,133 (83.3%) |
| 65 to 74 Years | 973 (92.1%) | 885 (86.9%) |
| 75 Years and over | 662 (98.1%) | 685 (88.3%) |
| Total | 9,358 (91.4%) | 8,653 (90.1%) |
Income Below Poverty Among Married-Couple Families in Calhoun County
The poverty statistics for married-couple families in Calhoun County show that 3.1% or 129 of the total 4,199 families live below the poverty line. Families with no children have the highest poverty rate of 4.1%, comprising of 107 families. On the other hand, families with 3 or 4 children have the lowest poverty rate of 0.0%, which includes 0 families.
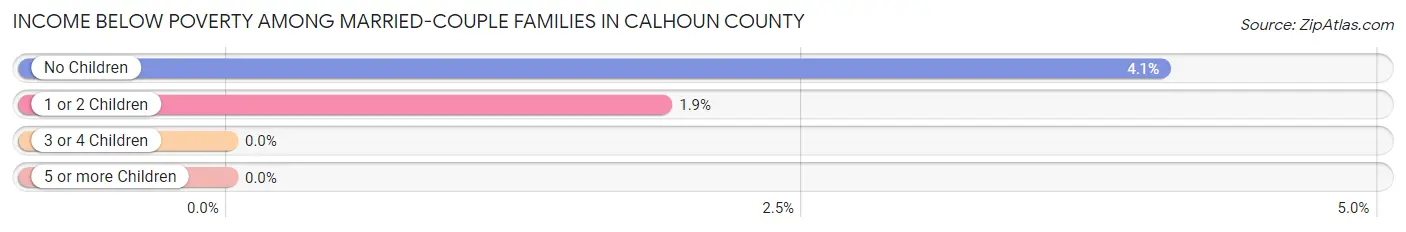
| Children | Above Poverty | Below Poverty |
| No Children | 2,529 (95.9%) | 107 (4.1%) |
| 1 or 2 Children | 1,139 (98.1%) | 22 (1.9%) |
| 3 or 4 Children | 402 (100.0%) | 0 (0.0%) |
| 5 or more Children | 0 (0.0%) | 0 (0.0%) |
| Total | 4,070 (96.9%) | 129 (3.1%) |
Income Below Poverty Among Single-Parent Households in Calhoun County
According to the poverty data in Calhoun County, 1.6% or 4 single-father households and 16.8% or 187 single-mother households are living below the poverty line. Among single-father households, those with 1 or 2 children have the highest poverty rate, with 4 households (4.2%) experiencing poverty. Likewise, among single-mother households, those with 3 or 4 children have the highest poverty rate, with 48 households (32.0%) falling below the poverty line.
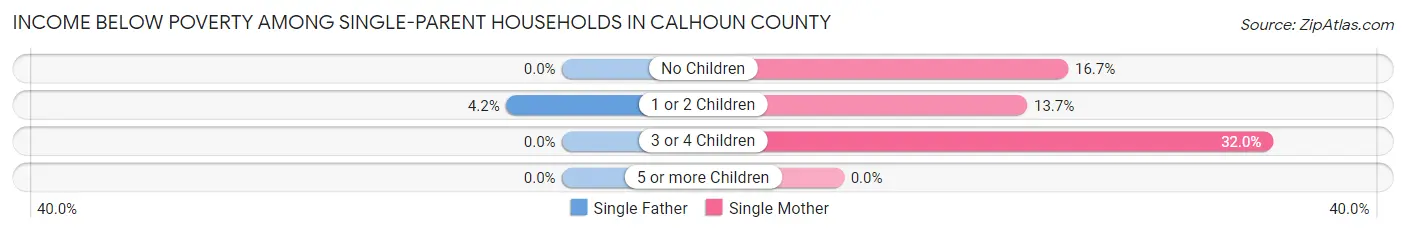
| Children | Single Father | Single Mother |
| No Children | 0 (0.0%) | 49 (16.7%) |
| 1 or 2 Children | 4 (4.2%) | 90 (13.7%) |
| 3 or 4 Children | 0 (0.0%) | 48 (32.0%) |
| 5 or more Children | 0 (0.0%) | 0 (0.0%) |
| Total | 4 (1.6%) | 187 (16.8%) |
Income Below Poverty Among Married-Couple vs Single-Parent Households in Calhoun County
The poverty data for Calhoun County shows that 129 of the married-couple family households (3.1%) and 191 of the single-parent households (13.9%) are living below the poverty level. Within the married-couple family households, those with no children have the highest poverty rate, with 107 households (4.1%) falling below the poverty line. Among the single-parent households, those with 3 or 4 children have the highest poverty rate, with 48 household (29.6%) living below poverty.
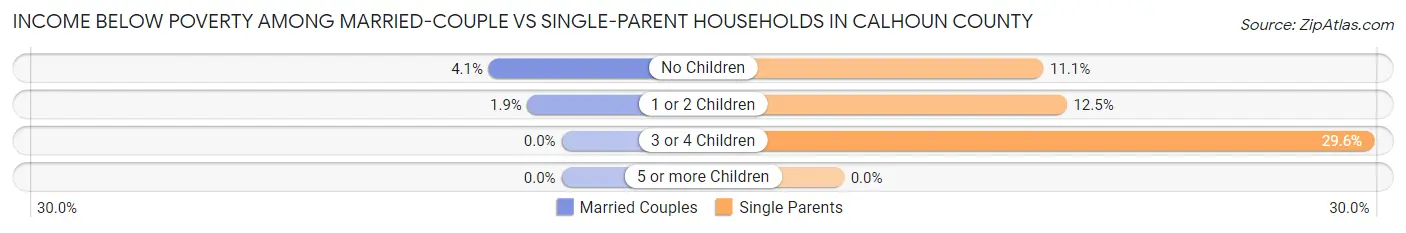
| Children | Married-Couple Families | Single-Parent Households |
| No Children | 107 (4.1%) | 49 (11.1%) |
| 1 or 2 Children | 22 (1.9%) | 94 (12.4%) |
| 3 or 4 Children | 0 (0.0%) | 48 (29.6%) |
| 5 or more Children | 0 (0.0%) | 0 (0.0%) |
| Total | 129 (3.1%) | 191 (13.9%) |
Race in Calhoun County
The most populous races in Calhoun County are White / Caucasian (14,063 | 69.9%), Hispanic or Latino (10,071 | 50.0%), and Two or more Races (3,708 | 18.4%).
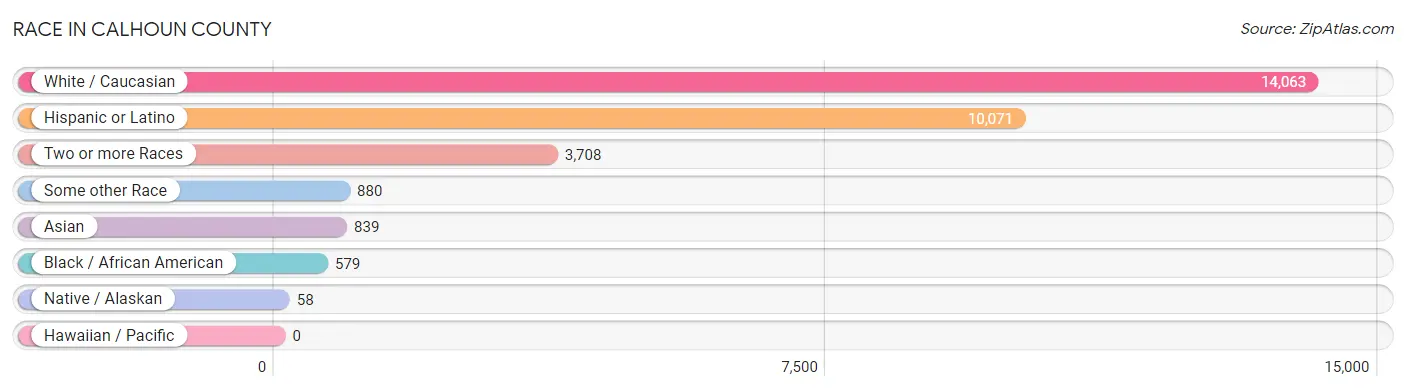
| Race | # Population | % Population |
| Asian | 839 | 4.2% |
| Black / African American | 579 | 2.9% |
| Hawaiian / Pacific | 0 | 0.0% |
| Hispanic or Latino | 10,071 | 50.0% |
| Native / Alaskan | 58 | 0.3% |
| White / Caucasian | 14,063 | 69.9% |
| Two or more Races | 3,708 | 18.4% |
| Some other Race | 880 | 4.4% |
| Total | 20,127 | 100.0% |
Ancestry in Calhoun County
The most populous ancestries reported in Calhoun County are Mexican (8,771 | 43.6%), German (2,589 | 12.9%), Czech (1,099 | 5.5%), Irish (984 | 4.9%), and American (869 | 4.3%), together accounting for 71.1% of all Calhoun County residents.
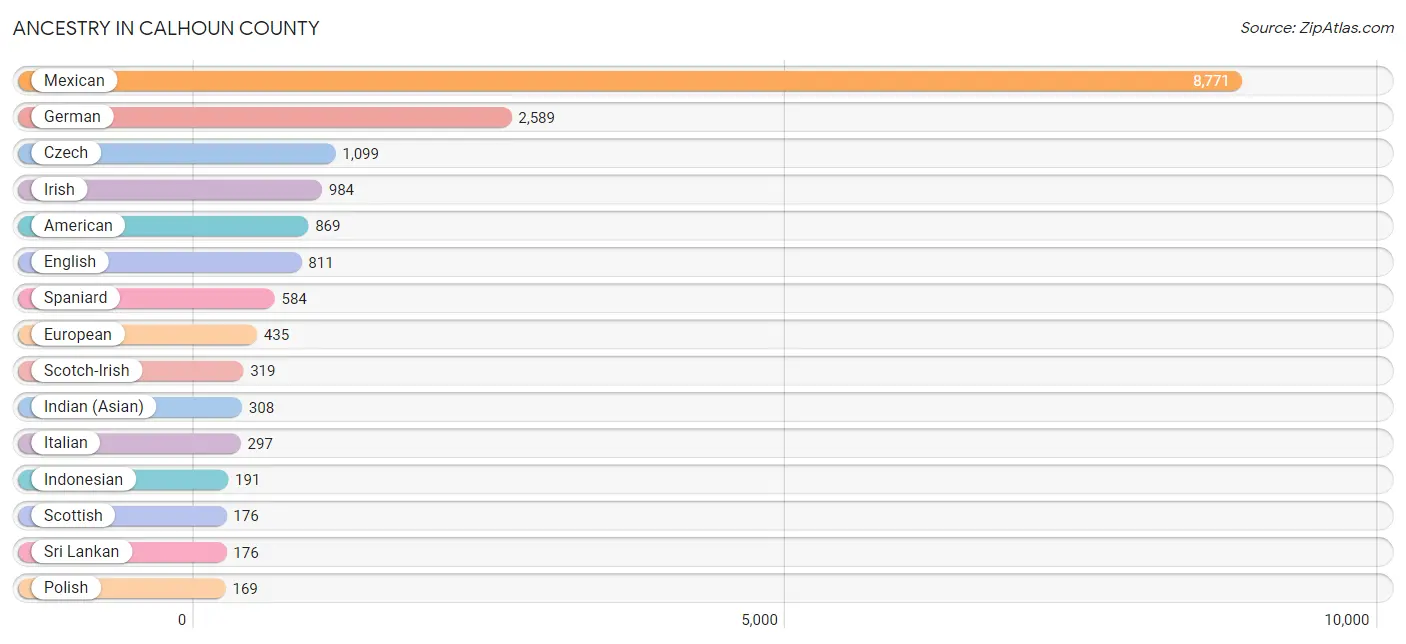
| Ancestry | # Population | % Population |
| African | 24 | 0.1% |
| American | 869 | 4.3% |
| Apache | 3 | 0.0% |
| Arab | 29 | 0.1% |
| Austrian | 9 | 0.0% |
| Belgian | 6 | 0.0% |
| Bhutanese | 20 | 0.1% |
| Blackfeet | 11 | 0.1% |
| British | 22 | 0.1% |
| Burmese | 9 | 0.0% |
| Cajun | 3 | 0.0% |
| Cherokee | 138 | 0.7% |
| Comanche | 21 | 0.1% |
| Cuban | 157 | 0.8% |
| Czech | 1,099 | 5.5% |
| Danish | 21 | 0.1% |
| Dutch | 17 | 0.1% |
| Eastern European | 7 | 0.0% |
| Egyptian | 2 | 0.0% |
| English | 811 | 4.0% |
| European | 435 | 2.2% |
| Filipino | 113 | 0.6% |
| French | 159 | 0.8% |
| French Canadian | 5 | 0.0% |
| German | 2,589 | 12.9% |
| Greek | 8 | 0.0% |
| Indian (Asian) | 308 | 1.5% |
| Indonesian | 191 | 0.9% |
| Irish | 984 | 4.9% |
| Italian | 297 | 1.5% |
| Korean | 20 | 0.1% |
| Mexican | 8,771 | 43.6% |
| Norwegian | 28 | 0.1% |
| Osage | 37 | 0.2% |
| Polish | 169 | 0.8% |
| Portuguese | 51 | 0.3% |
| Puerto Rican | 78 | 0.4% |
| Russian | 8 | 0.0% |
| Scandinavian | 21 | 0.1% |
| Scotch-Irish | 319 | 1.6% |
| Scottish | 176 | 0.9% |
| Spaniard | 584 | 2.9% |
| Spanish | 31 | 0.2% |
| Sri Lankan | 176 | 0.9% |
| Subsaharan African | 24 | 0.1% |
| Swedish | 42 | 0.2% |
| Swiss | 28 | 0.1% |
| Thai | 36 | 0.2% |
| Tlingit-Haida | 10 | 0.1% |
| Ukrainian | 27 | 0.1% |
| Welsh | 57 | 0.3% | View All 51 Rows |
Immigrants in Calhoun County
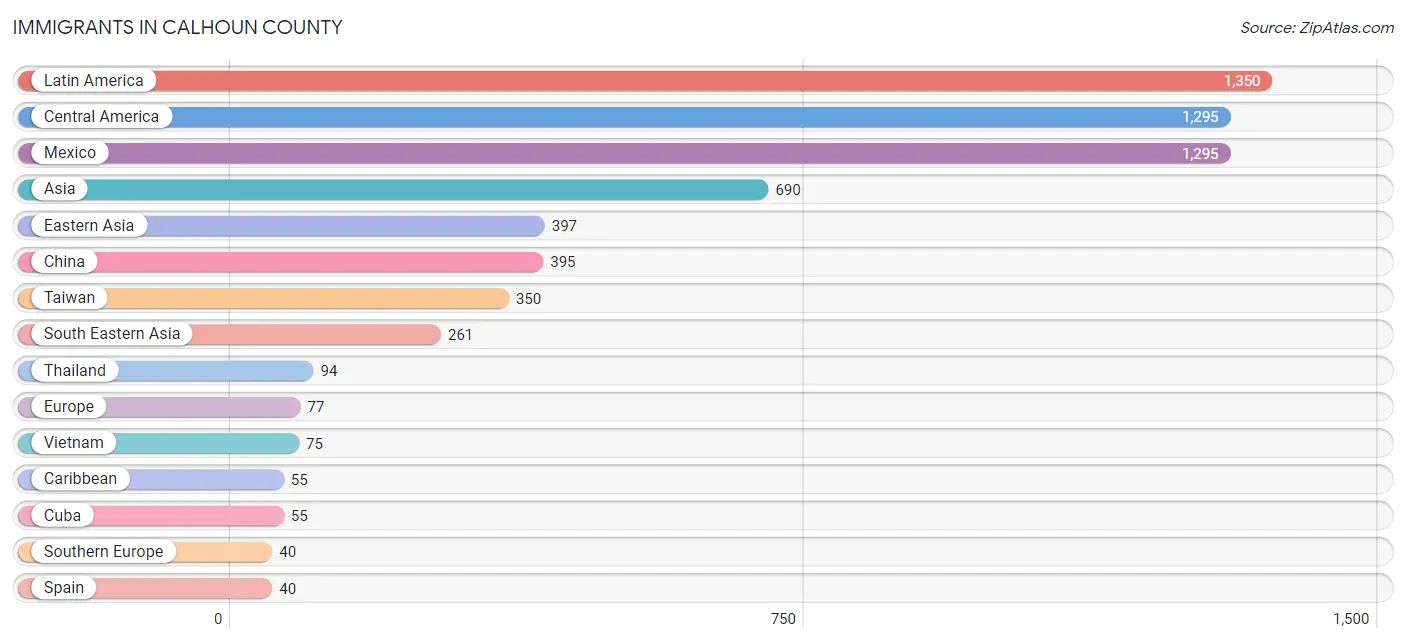
The most numerous immigrant groups reported in Calhoun County came from Latin America (1,350 | 6.7%), Central America (1,295 | 6.4%), Mexico (1,295 | 6.4%), Asia (690 | 3.4%), and Eastern Asia (397 | 2.0%), together accounting for 25.0% of all Calhoun County residents.
| Immigration Origin | # Population | % Population |
| Africa | 2 | 0.0% |
| Asia | 690 | 3.4% |
| Canada | 27 | 0.1% |
| Caribbean | 55 | 0.3% |
| Central America | 1,295 | 6.4% |
| China | 395 | 2.0% |
| Cuba | 55 | 0.3% |
| Czechoslovakia | 12 | 0.1% |
| Eastern Asia | 397 | 2.0% |
| Eastern Europe | 12 | 0.1% |
| Egypt | 2 | 0.0% |
| England | 8 | 0.0% |
| Europe | 77 | 0.4% |
| Germany | 11 | 0.1% |
| India | 28 | 0.1% |
| Korea | 2 | 0.0% |
| Latin America | 1,350 | 6.7% |
| Mexico | 1,295 | 6.4% |
| Northern Africa | 2 | 0.0% |
| Northern Europe | 8 | 0.0% |
| Pakistan | 4 | 0.0% |
| Philippines | 15 | 0.1% |
| South Central Asia | 32 | 0.2% |
| South Eastern Asia | 261 | 1.3% |
| Southern Europe | 40 | 0.2% |
| Spain | 40 | 0.2% |
| Taiwan | 350 | 1.7% |
| Thailand | 94 | 0.5% |
| Vietnam | 75 | 0.4% |
| Western Europe | 17 | 0.1% | View All 30 Rows |
Sex and Age in Calhoun County
Sex and Age in Calhoun County
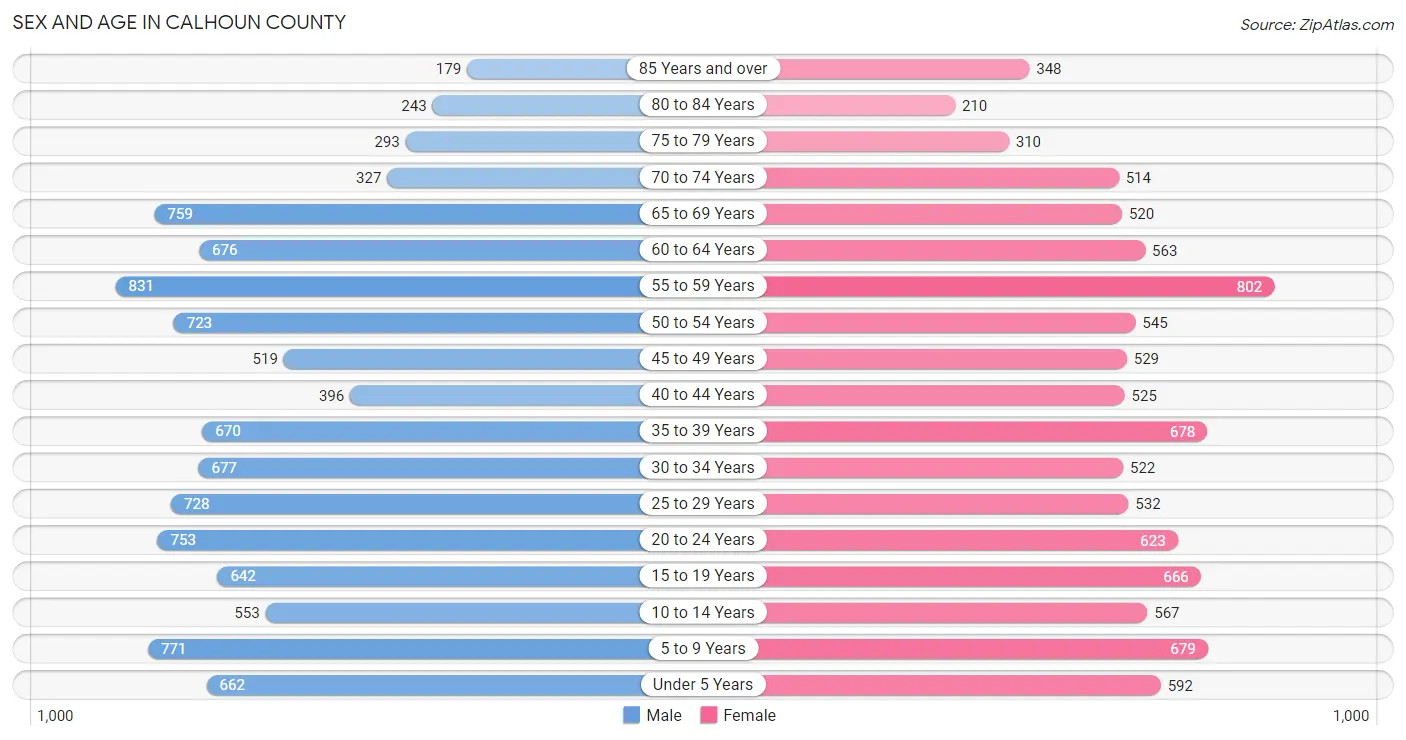
The most populous age groups in Calhoun County are 55 to 59 Years (831 | 8.0%) for men and 55 to 59 Years (802 | 8.3%) for women.
| Age Bracket | Male | Female |
| Under 5 Years | 662 (6.4%) | 592 (6.1%) |
| 5 to 9 Years | 771 (7.4%) | 679 (7.0%) |
| 10 to 14 Years | 553 (5.3%) | 567 (5.8%) |
| 15 to 19 Years | 642 (6.2%) | 666 (6.9%) |
| 20 to 24 Years | 753 (7.2%) | 623 (6.4%) |
| 25 to 29 Years | 728 (7.0%) | 532 (5.5%) |
| 30 to 34 Years | 677 (6.5%) | 522 (5.4%) |
| 35 to 39 Years | 670 (6.4%) | 678 (7.0%) |
| 40 to 44 Years | 396 (3.8%) | 525 (5.4%) |
| 45 to 49 Years | 519 (5.0%) | 529 (5.4%) |
| 50 to 54 Years | 723 (7.0%) | 545 (5.6%) |
| 55 to 59 Years | 831 (8.0%) | 802 (8.3%) |
| 60 to 64 Years | 676 (6.5%) | 563 (5.8%) |
| 65 to 69 Years | 759 (7.3%) | 520 (5.3%) |
| 70 to 74 Years | 327 (3.1%) | 514 (5.3%) |
| 75 to 79 Years | 293 (2.8%) | 310 (3.2%) |
| 80 to 84 Years | 243 (2.3%) | 210 (2.2%) |
| 85 Years and over | 179 (1.7%) | 348 (3.6%) |
| Total | 10,402 (100.0%) | 9,725 (100.0%) |
Families and Households in Calhoun County
Median Family Size in Calhoun County
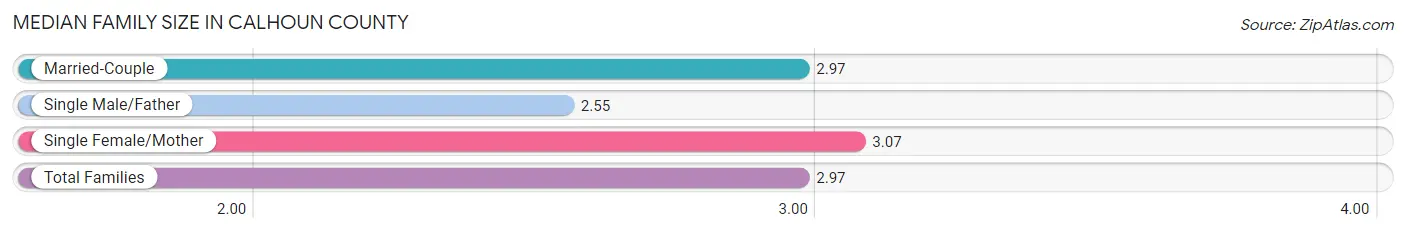
The median family size in Calhoun County is 2.97 persons per family, with single female/mother families (1,115 | 20.0%) accounting for the largest median family size of 3.07 persons per family. On the other hand, single male/father families (255 | 4.6%) represent the smallest median family size with 2.55 persons per family.
| Family Type | # Families | Family Size |
| Married-Couple | 4,199 (75.4%) | 2.97 |
| Single Male/Father | 255 (4.6%) | 2.55 |
| Single Female/Mother | 1,115 (20.0%) | 3.07 |
| Total Families | 5,569 (100.0%) | 2.97 |
Median Household Size in Calhoun County
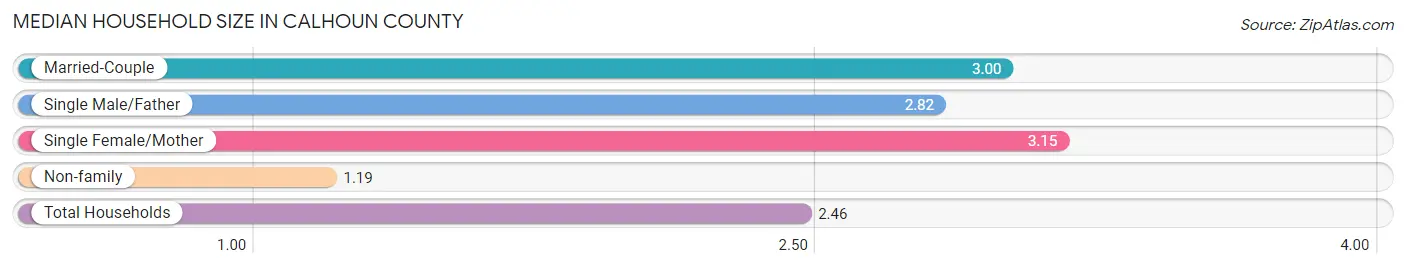
The median household size in Calhoun County is 2.46 persons per household, with single female/mother households (1,115 | 13.9%) accounting for the largest median household size of 3.15 persons per household. non-family households (2,476 | 30.8%) represent the smallest median household size with 1.19 persons per household.
| Household Type | # Households | Household Size |
| Married-Couple | 4,199 (52.2%) | 3.00 |
| Single Male/Father | 255 (3.2%) | 2.82 |
| Single Female/Mother | 1,115 (13.9%) | 3.15 |
| Non-family | 2,476 (30.8%) | 1.19 |
| Total Households | 8,045 (100.0%) | 2.46 |
Household Size by Marriage Status in Calhoun County
Out of a total of 8,045 households in Calhoun County, 5,569 (69.2%) are family households, while 2,476 (30.8%) are nonfamily households. The most numerous type of family households are 2-person households, comprising 2,602, and the most common type of nonfamily households are 1-person households, comprising 2,043.
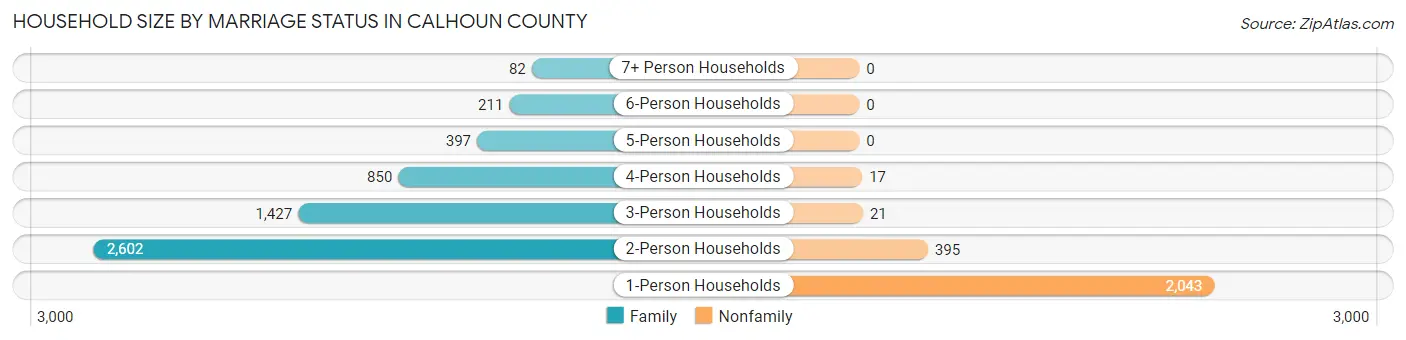
| Household Size | Family Households | Nonfamily Households |
| 1-Person Households | - | 2,043 (25.4%) |
| 2-Person Households | 2,602 (32.3%) | 395 (4.9%) |
| 3-Person Households | 1,427 (17.7%) | 21 (0.3%) |
| 4-Person Households | 850 (10.6%) | 17 (0.2%) |
| 5-Person Households | 397 (4.9%) | 0 (0.0%) |
| 6-Person Households | 211 (2.6%) | 0 (0.0%) |
| 7+ Person Households | 82 (1.0%) | 0 (0.0%) |
| Total | 5,569 (69.2%) | 2,476 (30.8%) |
Female Fertility in Calhoun County
Fertility by Age in Calhoun County
Average fertility rate in Calhoun County is 45.0 births per 1,000 women. Women in the age bracket of 20 to 34 years have the highest fertility rate with 112.0 births per 1,000 women. Women in the age bracket of 20 to 34 years acount for 100.0% of all women with births.
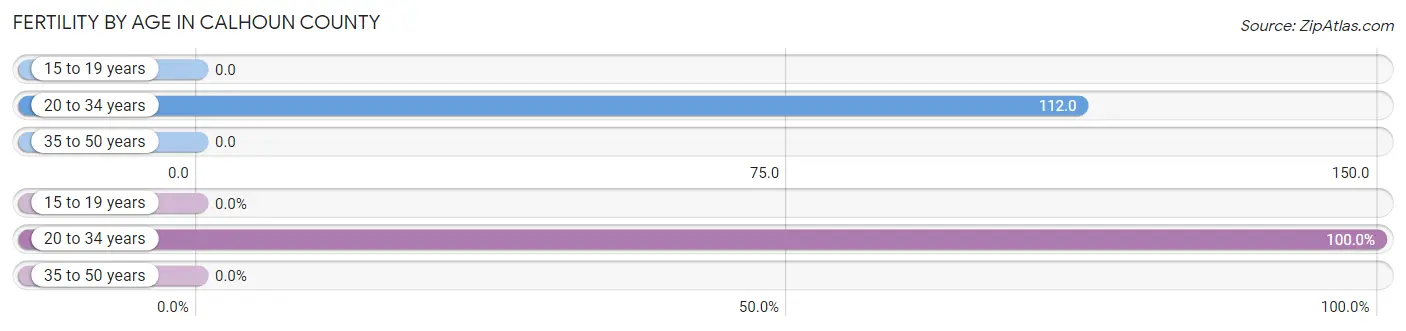
| Age Bracket | Women with Births | Births / 1,000 Women |
| 15 to 19 years | 0 (0.0%) | 0.0 |
| 20 to 34 years | 187 (100.0%) | 112.0 |
| 35 to 50 years | 0 (0.0%) | 0.0 |
| Total | 187 (100.0%) | 45.0 |
Fertility by Age by Marriage Status in Calhoun County
72.2% of women with births (187) in Calhoun County are married. The highest percentage of unmarried women with births falls into 20 to 34 years age bracket with 27.8% of them unmarried at the time of birth, while the lowest percentage of unmarried women with births belong to 20 to 34 years age bracket with 27.8% of them unmarried.
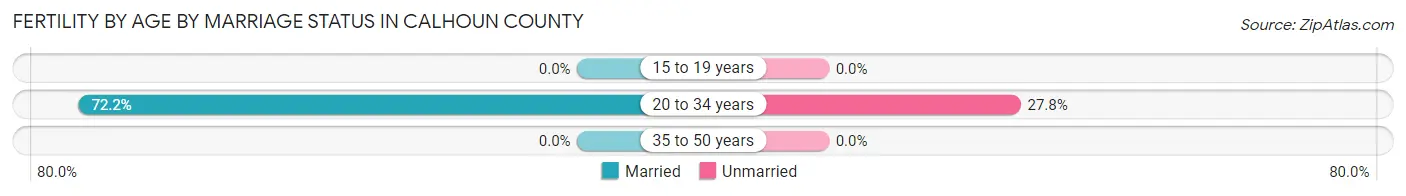
| Age Bracket | Married | Unmarried |
| 15 to 19 years | 0 (0.0%) | 0 (0.0%) |
| 20 to 34 years | 135 (72.2%) | 52 (27.8%) |
| 35 to 50 years | 0 (0.0%) | 0 (0.0%) |
| Total | 135 (72.2%) | 52 (27.8%) |
Fertility by Education in Calhoun County
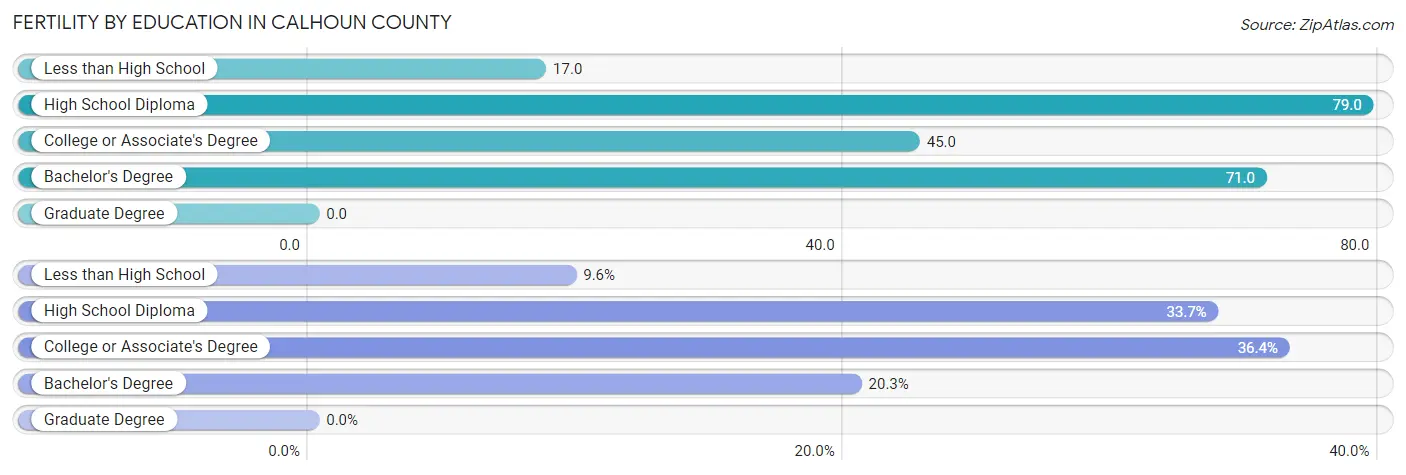
| Educational Attainment | Women with Births | Births / 1,000 Women |
| Less than High School | 18 (9.6%) | 17.0 |
| High School Diploma | 63 (33.7%) | 79.0 |
| College or Associate's Degree | 68 (36.4%) | 45.0 |
| Bachelor's Degree | 38 (20.3%) | 71.0 |
| Graduate Degree | 0 (0.0%) | 0.0 |
| Total | 187 (100.0%) | 45.0 |
Fertility by Education by Marriage Status in Calhoun County
27.8% of women with births in Calhoun County are unmarried. Women with the educational attainment of bachelor's degree are most likely to be married with 100.0% of them married at childbirth, while women with the educational attainment of less than high school are least likely to be married with 83.3% of them unmarried at childbirth.
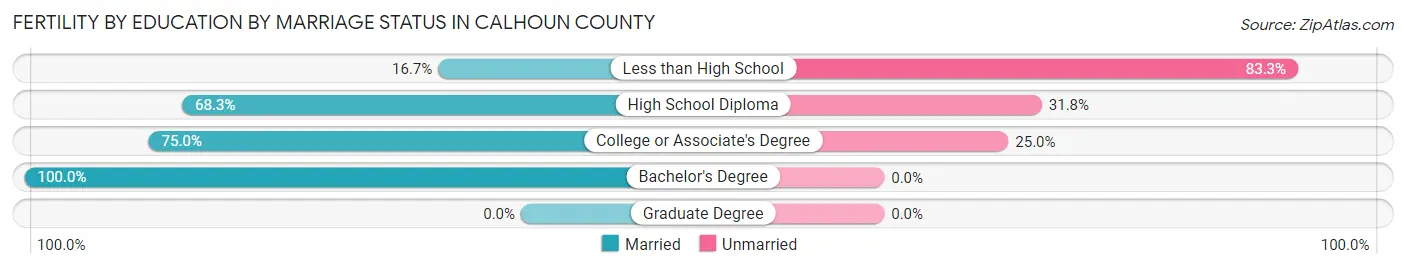
| Educational Attainment | Married | Unmarried |
| Less than High School | 3 (16.7%) | 15 (83.3%) |
| High School Diploma | 43 (68.2%) | 20 (31.8%) |
| College or Associate's Degree | 51 (75.0%) | 17 (25.0%) |
| Bachelor's Degree | 38 (100.0%) | 0 (0.0%) |
| Graduate Degree | 0 (0.0%) | 0 (0.0%) |
| Total | 135 (72.2%) | 52 (27.8%) |
Employment Characteristics in Calhoun County
Employment by Class of Employer in Calhoun County
Among the 9,608 employed individuals in Calhoun County, private company employees (6,516 | 67.8%), local government employees (1,306 | 13.6%), and not-for-profit organizations (646 | 6.7%) make up the most common classes of employment.
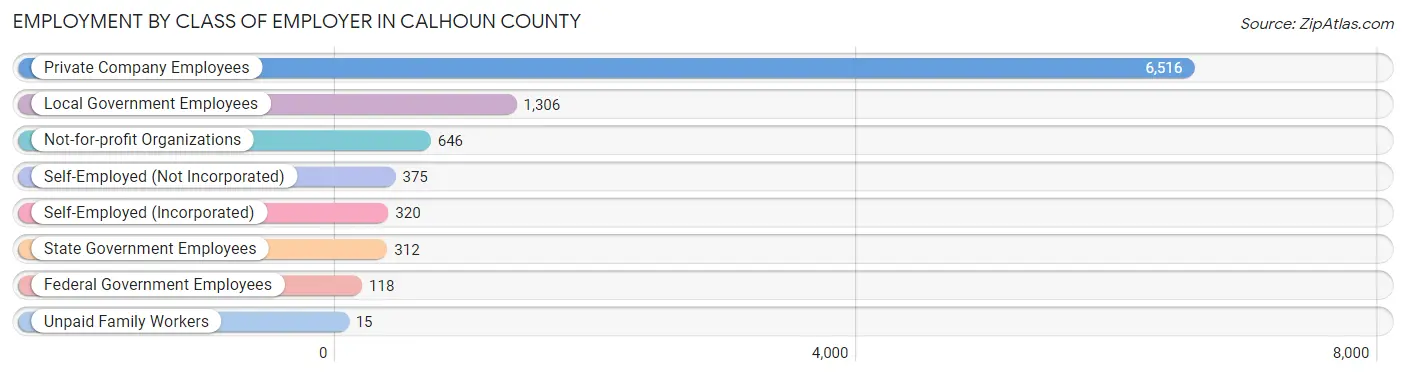
| Employer Class | # Employees | % Employees |
| Private Company Employees | 6,516 | 67.8% |
| Self-Employed (Incorporated) | 320 | 3.3% |
| Self-Employed (Not Incorporated) | 375 | 3.9% |
| Not-for-profit Organizations | 646 | 6.7% |
| Local Government Employees | 1,306 | 13.6% |
| State Government Employees | 312 | 3.3% |
| Federal Government Employees | 118 | 1.2% |
| Unpaid Family Workers | 15 | 0.2% |
| Total | 9,608 | 100.0% |
Employment Status by Age in Calhoun County
According to the labor force statistics for Calhoun County, out of the total population over 16 years of age (15,990), 62.7% or 10,026 individuals are in the labor force, with 3.4% or 341 of them unemployed. The age group with the highest labor force participation rate is 25 to 29 years, with 86.3% or 1,087 individuals in the labor force. Within the labor force, the 16 to 19 years age range has the highest percentage of unemployed individuals, with 16.8% or 67 of them being unemployed.
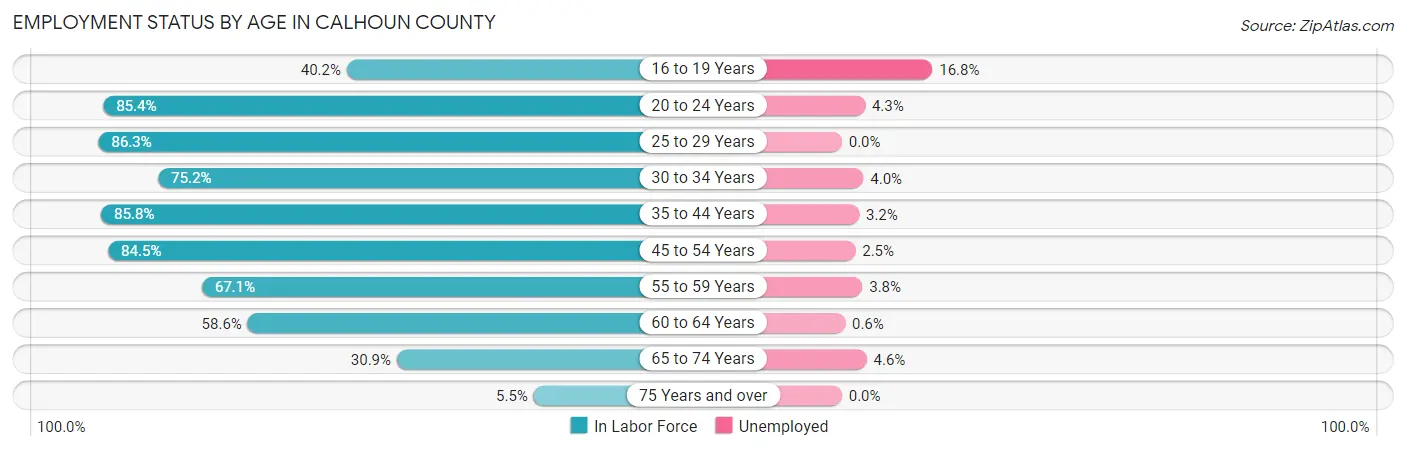
| Age Bracket | In Labor Force | Unemployed |
| 16 to 19 Years | 400 (40.2%) | 67 (16.8%) |
| 20 to 24 Years | 1,175 (85.4%) | 51 (4.3%) |
| 25 to 29 Years | 1,087 (86.3%) | 0 (0.0%) |
| 30 to 34 Years | 902 (75.2%) | 36 (4.0%) |
| 35 to 44 Years | 1,947 (85.8%) | 62 (3.2%) |
| 45 to 54 Years | 1,957 (84.5%) | 49 (2.5%) |
| 55 to 59 Years | 1,096 (67.1%) | 42 (3.8%) |
| 60 to 64 Years | 726 (58.6%) | 4 (0.6%) |
| 65 to 74 Years | 655 (30.9%) | 30 (4.6%) |
| 75 Years and over | 87 (5.5%) | 0 (0.0%) |
| Total | 10,026 (62.7%) | 341 (3.4%) |
Employment Status by Educational Attainment in Calhoun County
According to labor force statistics for Calhoun County, 77.8% of individuals (7,715) out of the total population between 25 and 64 years of age (9,916) are in the labor force, with 2.5% or 193 of them being unemployed. The group with the highest labor force participation rate are those with the educational attainment of bachelor's degree or higher, with 87.9% or 1,399 individuals in the labor force. Within the labor force, individuals with less than high school education have the highest percentage of unemployment, with 4.0% or 42 of them being unemployed.
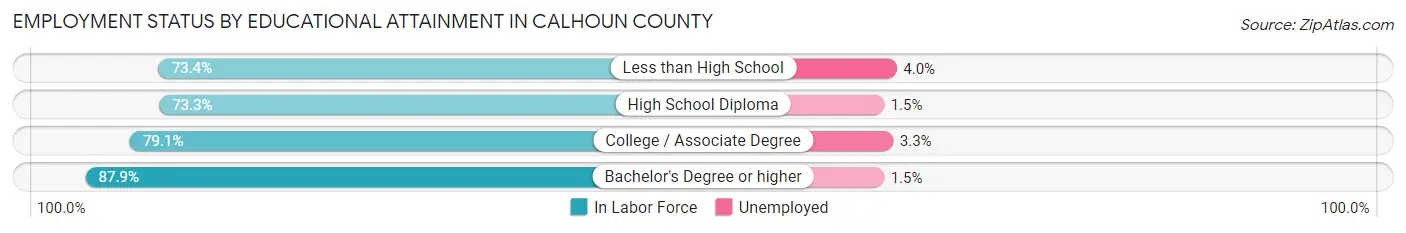
| Educational Attainment | In Labor Force | Unemployed |
| Less than High School | 1,055 (73.4%) | 57 (4.0%) |
| High School Diploma | 2,407 (73.3%) | 49 (1.5%) |
| College / Associate Degree | 2,850 (79.1%) | 119 (3.3%) |
| Bachelor's Degree or higher | 1,399 (87.9%) | 24 (1.5%) |
| Total | 7,715 (77.8%) | 248 (2.5%) |
Employment Occupations by Sex in Calhoun County
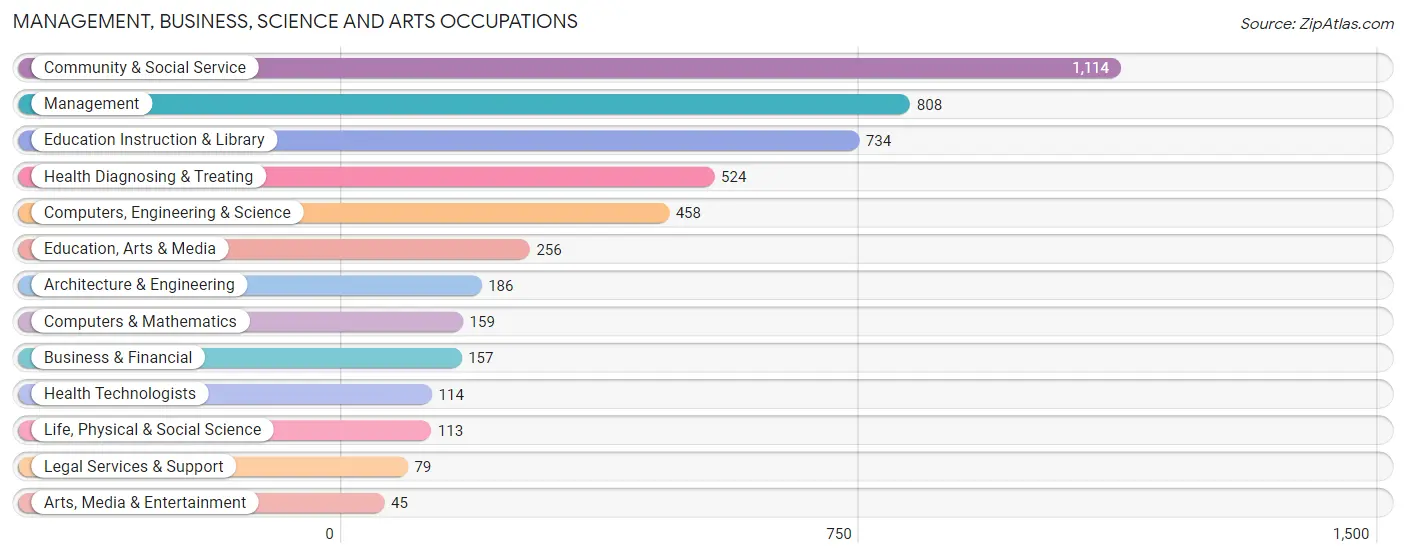
Management, Business, Science and Arts Occupations
The most common Management, Business, Science and Arts occupations in Calhoun County are Community & Social Service (1,114 | 11.5%), Management (808 | 8.3%), Education Instruction & Library (734 | 7.6%), Health Diagnosing & Treating (524 | 5.4%), and Computers, Engineering & Science (458 | 4.7%).
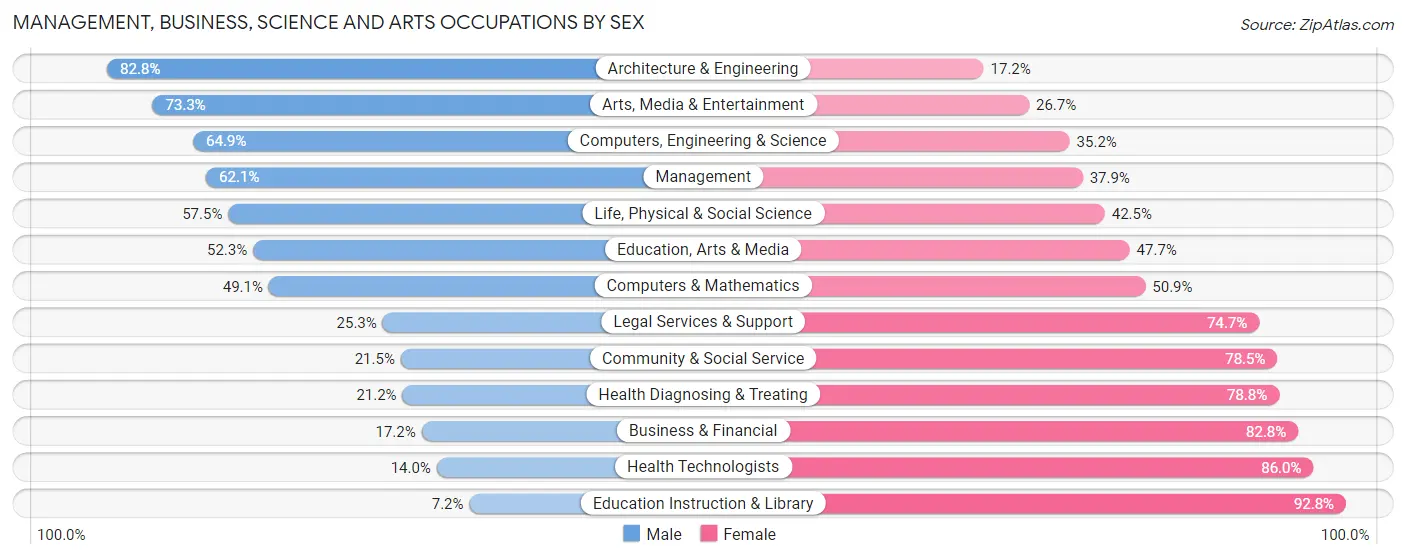
Management, Business, Science and Arts Occupations by Sex
Within the Management, Business, Science and Arts occupations in Calhoun County, the most male-oriented occupations are Architecture & Engineering (82.8%), Arts, Media & Entertainment (73.3%), and Computers, Engineering & Science (64.8%), while the most female-oriented occupations are Education Instruction & Library (92.8%), Health Technologists (86.0%), and Business & Financial (82.8%).
| Occupation | Male | Female |
| Management | 502 (62.1%) | 306 (37.9%) |
| Business & Financial | 27 (17.2%) | 130 (82.8%) |
| Computers, Engineering & Science | 297 (64.8%) | 161 (35.1%) |
| Computers & Mathematics | 78 (49.1%) | 81 (50.9%) |
| Architecture & Engineering | 154 (82.8%) | 32 (17.2%) |
| Life, Physical & Social Science | 65 (57.5%) | 48 (42.5%) |
| Community & Social Service | 240 (21.5%) | 874 (78.5%) |
| Education, Arts & Media | 134 (52.3%) | 122 (47.7%) |
| Legal Services & Support | 20 (25.3%) | 59 (74.7%) |
| Education Instruction & Library | 53 (7.2%) | 681 (92.8%) |
| Arts, Media & Entertainment | 33 (73.3%) | 12 (26.7%) |
| Health Diagnosing & Treating | 111 (21.2%) | 413 (78.8%) |
| Health Technologists | 16 (14.0%) | 98 (86.0%) |
| Total (Category) | 1,177 (38.5%) | 1,884 (61.6%) |
| Total (Overall) | 5,474 (56.5%) | 4,217 (43.5%) |
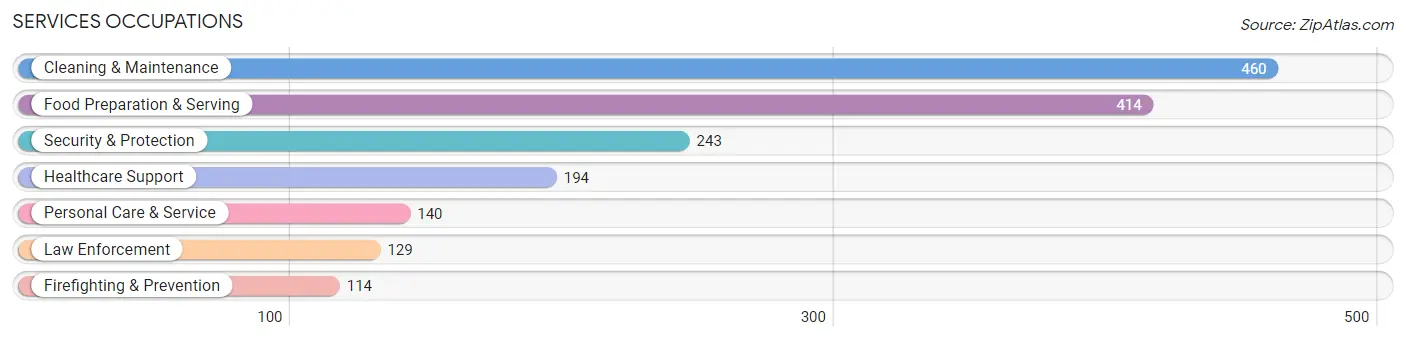
Services Occupations
The most common Services occupations in Calhoun County are Cleaning & Maintenance (460 | 4.8%), Food Preparation & Serving (414 | 4.3%), Security & Protection (243 | 2.5%), Healthcare Support (194 | 2.0%), and Personal Care & Service (140 | 1.4%).
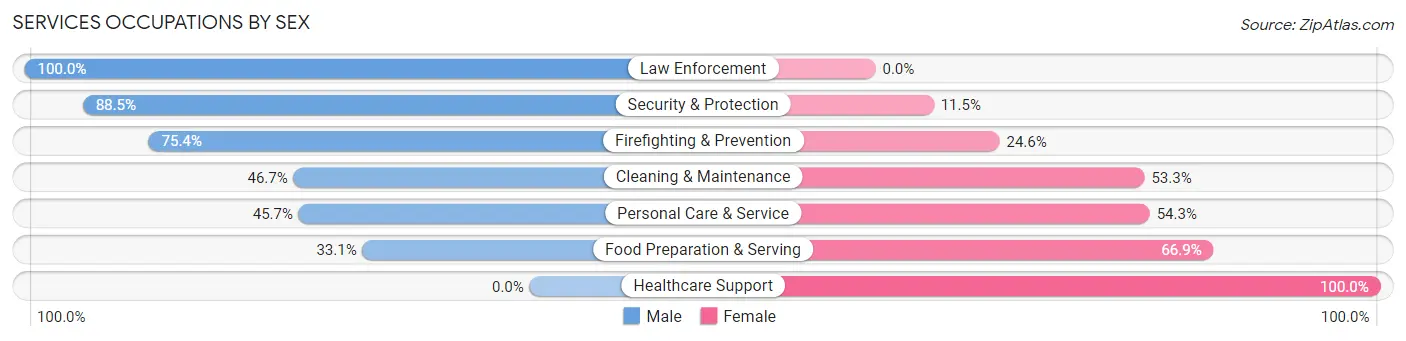
Services Occupations by Sex
Within the Services occupations in Calhoun County, the most male-oriented occupations are Law Enforcement (100.0%), Security & Protection (88.5%), and Firefighting & Prevention (75.4%), while the most female-oriented occupations are Healthcare Support (100.0%), Food Preparation & Serving (66.9%), and Personal Care & Service (54.3%).
| Occupation | Male | Female |
| Healthcare Support | 0 (0.0%) | 194 (100.0%) |
| Security & Protection | 215 (88.5%) | 28 (11.5%) |
| Firefighting & Prevention | 86 (75.4%) | 28 (24.6%) |
| Law Enforcement | 129 (100.0%) | 0 (0.0%) |
| Food Preparation & Serving | 137 (33.1%) | 277 (66.9%) |
| Cleaning & Maintenance | 215 (46.7%) | 245 (53.3%) |
| Personal Care & Service | 64 (45.7%) | 76 (54.3%) |
| Total (Category) | 631 (43.5%) | 820 (56.5%) |
| Total (Overall) | 5,474 (56.5%) | 4,217 (43.5%) |
Sales and Office Occupations
The most common Sales and Office occupations in Calhoun County are Office & Administration (1,059 | 10.9%), and Sales & Related (638 | 6.6%).

Sales and Office Occupations by Sex

| Occupation | Male | Female |
| Sales & Related | 298 (46.7%) | 340 (53.3%) |
| Office & Administration | 170 (16.1%) | 889 (84.0%) |
| Total (Category) | 468 (27.6%) | 1,229 (72.4%) |
| Total (Overall) | 5,474 (56.5%) | 4,217 (43.5%) |
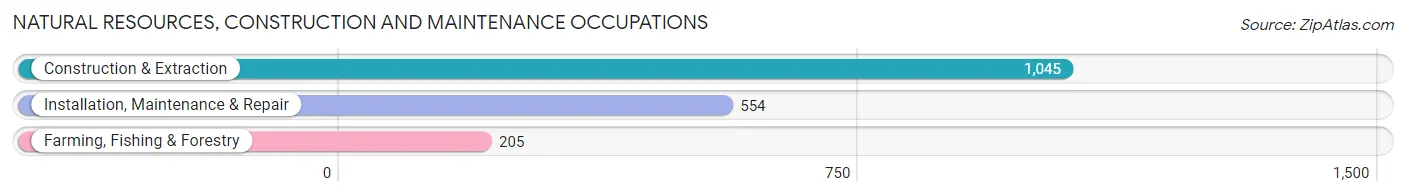
Natural Resources, Construction and Maintenance Occupations
The most common Natural Resources, Construction and Maintenance occupations in Calhoun County are Construction & Extraction (1,045 | 10.8%), Installation, Maintenance & Repair (554 | 5.7%), and Farming, Fishing & Forestry (205 | 2.1%).
Natural Resources, Construction and Maintenance Occupations by Sex
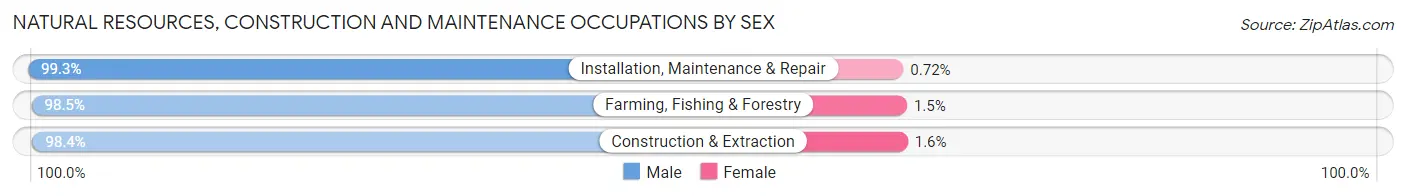
| Occupation | Male | Female |
| Farming, Fishing & Forestry | 202 (98.5%) | 3 (1.5%) |
| Construction & Extraction | 1,028 (98.4%) | 17 (1.6%) |
| Installation, Maintenance & Repair | 550 (99.3%) | 4 (0.7%) |
| Total (Category) | 1,780 (98.7%) | 24 (1.3%) |
| Total (Overall) | 5,474 (56.5%) | 4,217 (43.5%) |
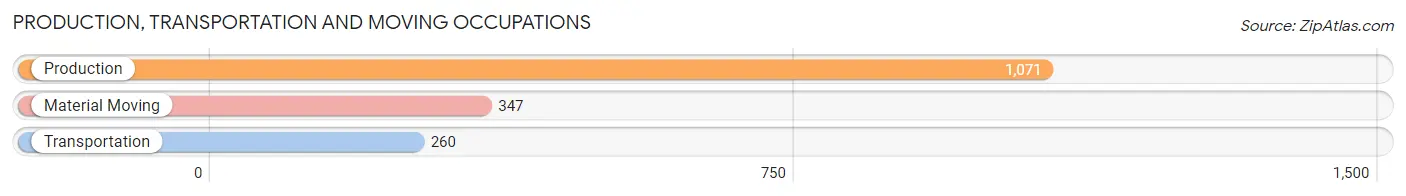
Production, Transportation and Moving Occupations
The most common Production, Transportation and Moving occupations in Calhoun County are Production (1,071 | 11.1%), Material Moving (347 | 3.6%), and Transportation (260 | 2.7%).
Production, Transportation and Moving Occupations by Sex
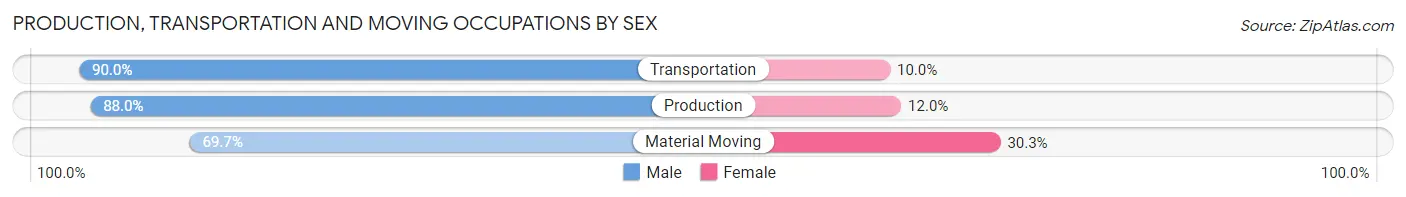
| Occupation | Male | Female |
| Production | 942 (88.0%) | 129 (12.0%) |
| Transportation | 234 (90.0%) | 26 (10.0%) |
| Material Moving | 242 (69.7%) | 105 (30.3%) |
| Total (Category) | 1,418 (84.5%) | 260 (15.5%) |
| Total (Overall) | 5,474 (56.5%) | 4,217 (43.5%) |
Employment Industries by Sex in Calhoun County
Employment Industries in Calhoun County
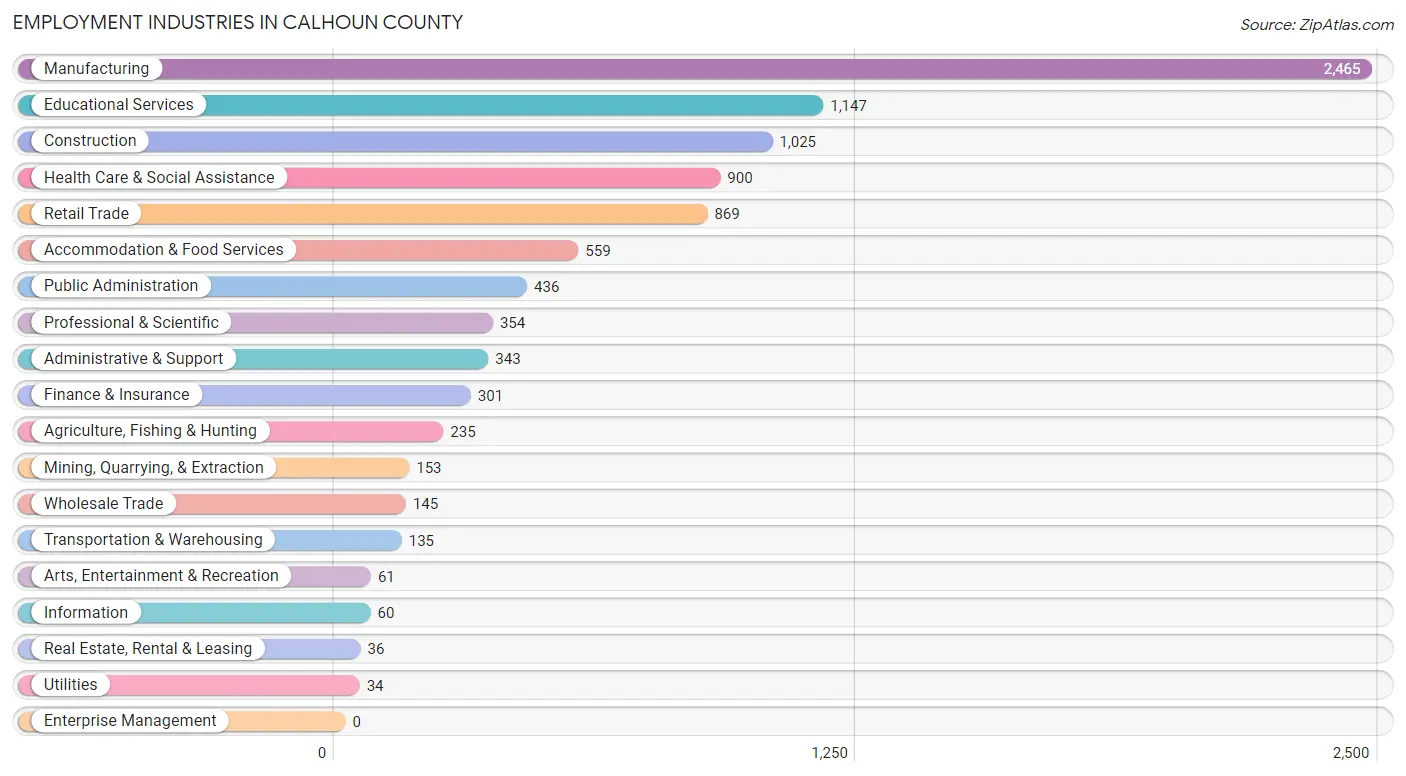
The major employment industries in Calhoun County include Manufacturing (2,465 | 25.4%), Educational Services (1,147 | 11.8%), Construction (1,025 | 10.6%), Health Care & Social Assistance (900 | 9.3%), and Retail Trade (869 | 9.0%).
Employment Industries by Sex in Calhoun County
The Calhoun County industries that see more men than women are Utilities (100.0%), Real Estate, Rental & Leasing (100.0%), and Arts, Entertainment & Recreation (100.0%), whereas the industries that tend to have a higher number of women are Finance & Insurance (96.7%), Health Care & Social Assistance (91.8%), and Educational Services (89.9%).
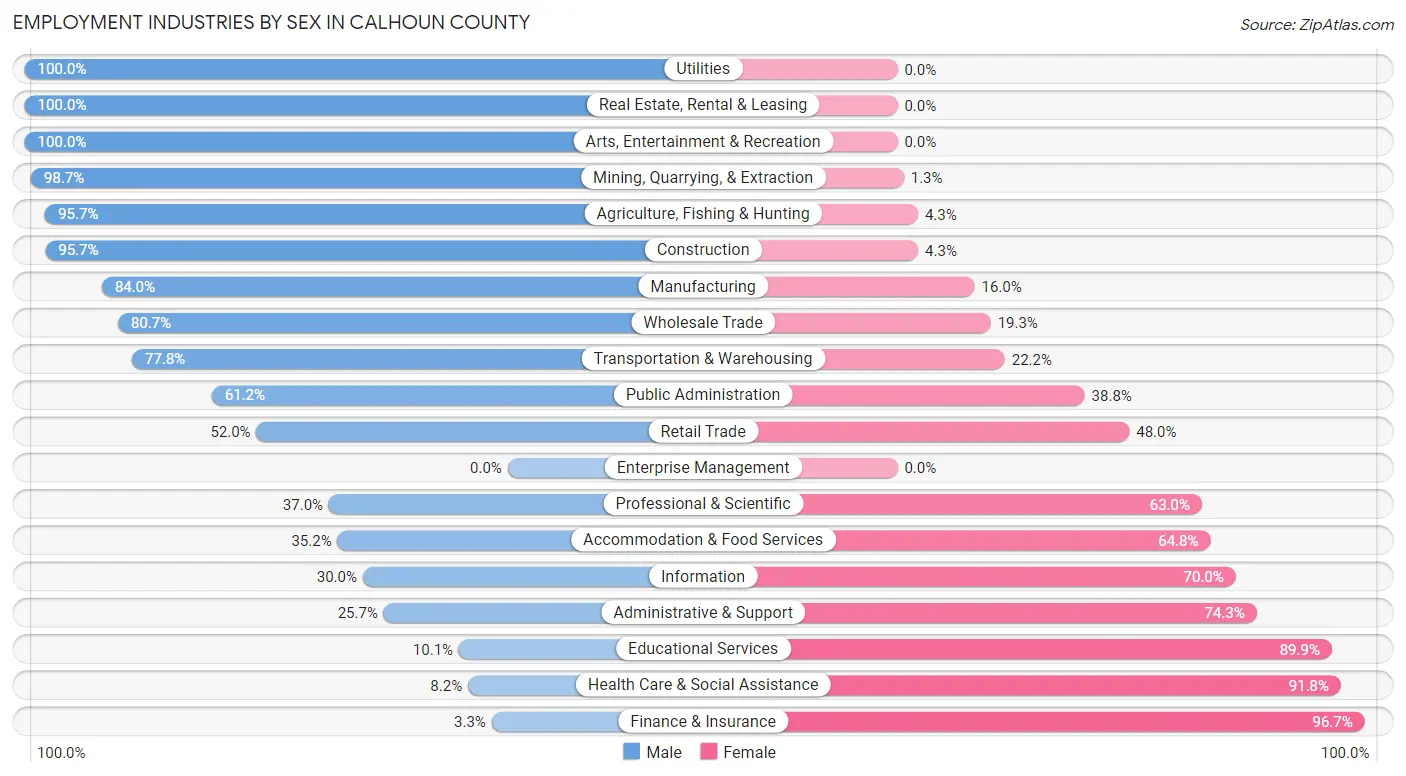
| Industry | Male | Female |
| Agriculture, Fishing & Hunting | 225 (95.7%) | 10 (4.3%) |
| Mining, Quarrying, & Extraction | 151 (98.7%) | 2 (1.3%) |
| Construction | 981 (95.7%) | 44 (4.3%) |
| Manufacturing | 2,071 (84.0%) | 394 (16.0%) |
| Wholesale Trade | 117 (80.7%) | 28 (19.3%) |
| Retail Trade | 452 (52.0%) | 417 (48.0%) |
| Transportation & Warehousing | 105 (77.8%) | 30 (22.2%) |
| Utilities | 34 (100.0%) | 0 (0.0%) |
| Information | 18 (30.0%) | 42 (70.0%) |
| Finance & Insurance | 10 (3.3%) | 291 (96.7%) |
| Real Estate, Rental & Leasing | 36 (100.0%) | 0 (0.0%) |
| Professional & Scientific | 131 (37.0%) | 223 (63.0%) |
| Enterprise Management | 0 (0.0%) | 0 (0.0%) |
| Administrative & Support | 88 (25.7%) | 255 (74.3%) |
| Educational Services | 116 (10.1%) | 1,031 (89.9%) |
| Health Care & Social Assistance | 74 (8.2%) | 826 (91.8%) |
| Arts, Entertainment & Recreation | 61 (100.0%) | 0 (0.0%) |
| Accommodation & Food Services | 197 (35.2%) | 362 (64.8%) |
| Public Administration | 267 (61.2%) | 169 (38.8%) |
| Total | 5,474 (56.5%) | 4,217 (43.5%) |
Education in Calhoun County
School Enrollment in Calhoun County
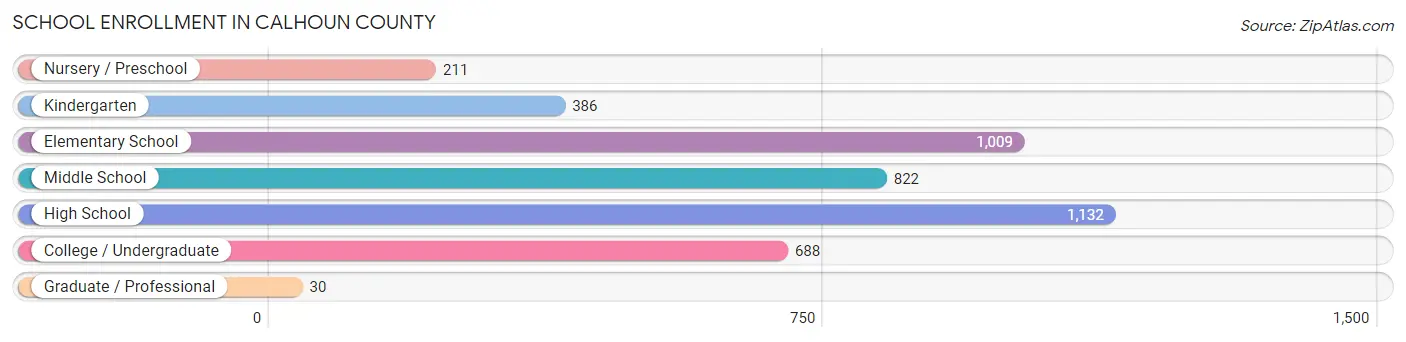
The most common levels of schooling among the 4,278 students in Calhoun County are high school (1,132 | 26.5%), elementary school (1,009 | 23.6%), and middle school (822 | 19.2%).
| School Level | # Students | % Students |
| Nursery / Preschool | 211 | 4.9% |
| Kindergarten | 386 | 9.0% |
| Elementary School | 1,009 | 23.6% |
| Middle School | 822 | 19.2% |
| High School | 1,132 | 26.5% |
| College / Undergraduate | 688 | 16.1% |
| Graduate / Professional | 30 | 0.7% |
| Total | 4,278 | 100.0% |
School Enrollment by Age by Funding Source in Calhoun County
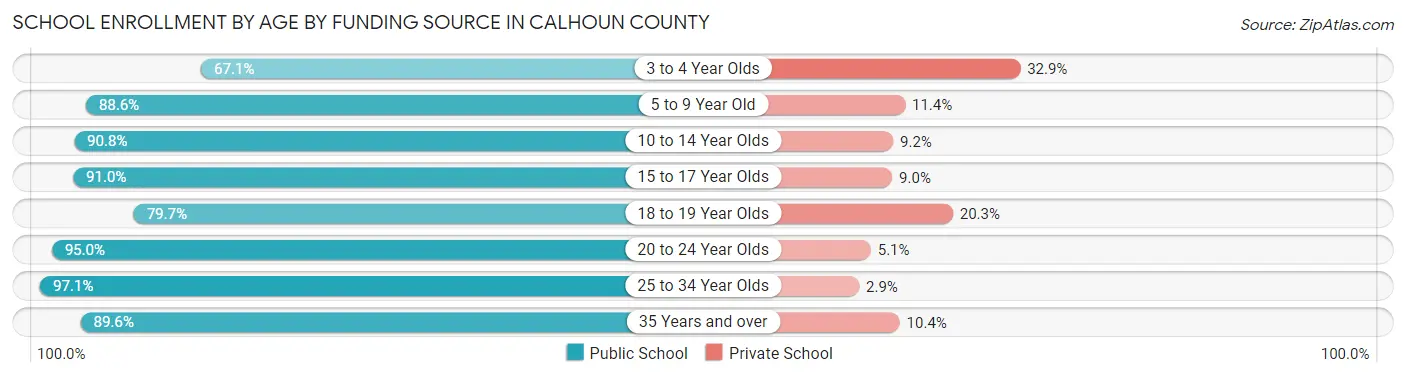
Out of a total of 4,278 students who are enrolled in schools in Calhoun County, 458 (10.7%) attend a private institution, while the remaining 3,820 (89.3%) are enrolled in public schools. The age group of 3 to 4 year olds has the highest likelihood of being enrolled in private schools, with 48 (32.9% in the age bracket) enrolled. Conversely, the age group of 25 to 34 year olds has the lowest likelihood of being enrolled in a private school, with 202 (97.1% in the age bracket) attending a public institution.
| Age Bracket | Public School | Private School |
| 3 to 4 Year Olds | 98 (67.1%) | 48 (32.9%) |
| 5 to 9 Year Old | 1,170 (88.6%) | 151 (11.4%) |
| 10 to 14 Year Olds | 1,005 (90.8%) | 102 (9.2%) |
| 15 to 17 Year Olds | 806 (91.0%) | 80 (9.0%) |
| 18 to 19 Year Olds | 145 (79.7%) | 37 (20.3%) |
| 20 to 24 Year Olds | 188 (95.0%) | 10 (5.1%) |
| 25 to 34 Year Olds | 202 (97.1%) | 6 (2.9%) |
| 35 Years and over | 206 (89.6%) | 24 (10.4%) |
| Total | 3,820 (89.3%) | 458 (10.7%) |
Educational Attainment by Field of Study in Calhoun County
Education (547 | 23.4%), arts & humanities (329 | 14.1%), engineering (279 | 11.9%), liberal arts & history (176 | 7.5%), and business (174 | 7.4%) are the most common fields of study among 2,337 individuals in Calhoun County who have obtained a bachelor's degree or higher.
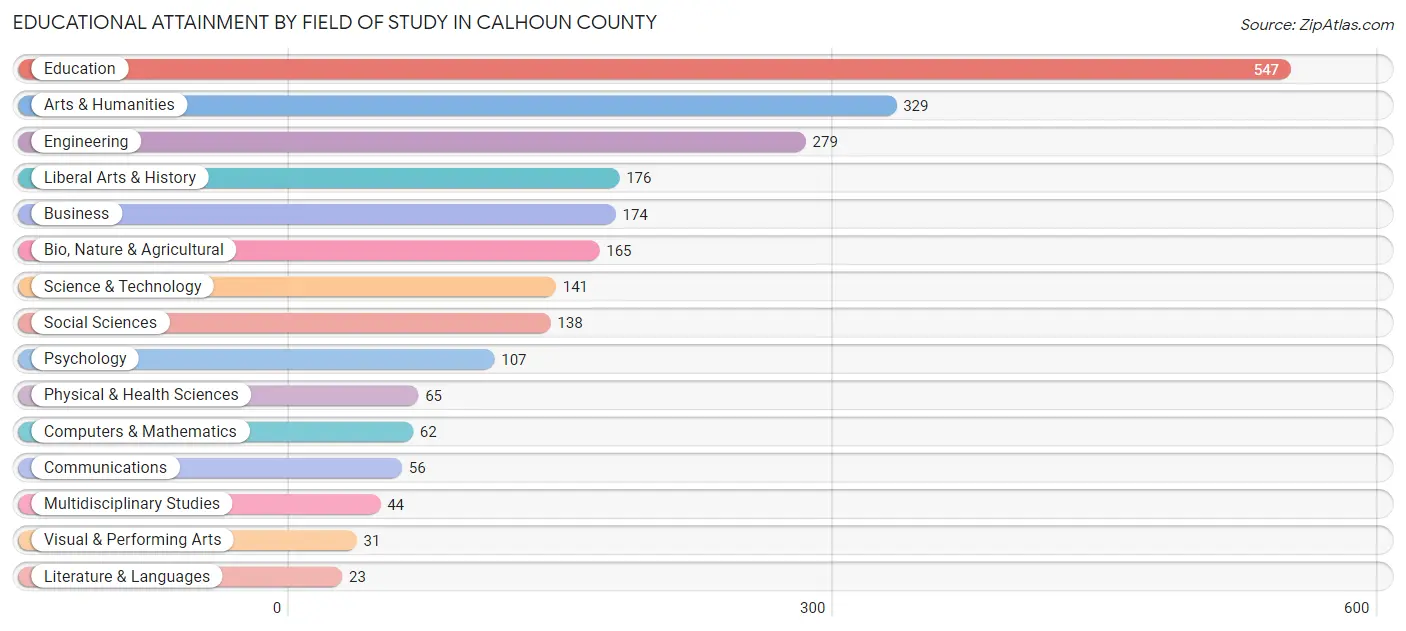
| Field of Study | # Graduates | % Graduates |
| Computers & Mathematics | 62 | 2.6% |
| Bio, Nature & Agricultural | 165 | 7.1% |
| Physical & Health Sciences | 65 | 2.8% |
| Psychology | 107 | 4.6% |
| Social Sciences | 138 | 5.9% |
| Engineering | 279 | 11.9% |
| Multidisciplinary Studies | 44 | 1.9% |
| Science & Technology | 141 | 6.0% |
| Business | 174 | 7.4% |
| Education | 547 | 23.4% |
| Literature & Languages | 23 | 1.0% |
| Liberal Arts & History | 176 | 7.5% |
| Visual & Performing Arts | 31 | 1.3% |
| Communications | 56 | 2.4% |
| Arts & Humanities | 329 | 14.1% |
| Total | 2,337 | 100.0% |
Transportation & Commute in Calhoun County
Vehicle Availability by Sex in Calhoun County
The most prevalent vehicle ownership categories in Calhoun County are males with 2 vehicles (2,457, accounting for 45.5%) and females with 2 vehicles (1,738, making up 58.6%).
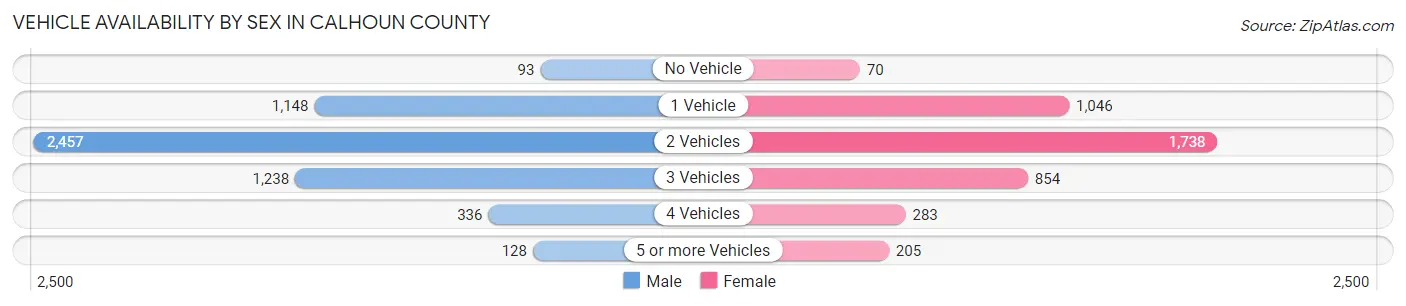
| Vehicles Available | Male | Female |
| No Vehicle | 93 (1.7%) | 70 (1.7%) |
| 1 Vehicle | 1,148 (21.3%) | 1,046 (24.9%) |
| 2 Vehicles | 2,457 (45.5%) | 1,738 (41.4%) |
| 3 Vehicles | 1,238 (22.9%) | 854 (20.3%) |
| 4 Vehicles | 336 (6.2%) | 283 (6.7%) |
| 5 or more Vehicles | 128 (2.4%) | 205 (4.9%) |
| Total | 5,400 (100.0%) | 4,196 (100.0%) |
Commute Time in Calhoun County
The most frequently occuring commute durations in Calhoun County are 15 to 19 minutes (2,074 commuters, 22.0%), 5 to 9 minutes (1,788 commuters, 19.0%), and 10 to 14 minutes (1,719 commuters, 18.2%).
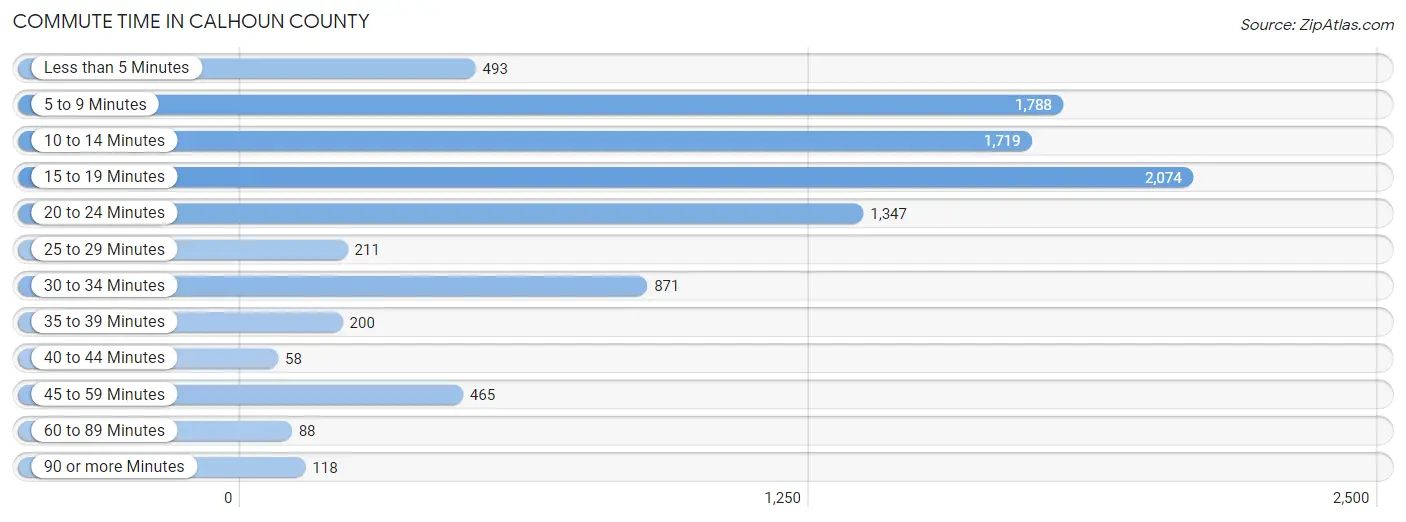
| Commute Time | # Commuters | % Commuters |
| Less than 5 Minutes | 493 | 5.2% |
| 5 to 9 Minutes | 1,788 | 19.0% |
| 10 to 14 Minutes | 1,719 | 18.2% |
| 15 to 19 Minutes | 2,074 | 22.0% |
| 20 to 24 Minutes | 1,347 | 14.3% |
| 25 to 29 Minutes | 211 | 2.2% |
| 30 to 34 Minutes | 871 | 9.2% |
| 35 to 39 Minutes | 200 | 2.1% |
| 40 to 44 Minutes | 58 | 0.6% |
| 45 to 59 Minutes | 465 | 4.9% |
| 60 to 89 Minutes | 88 | 0.9% |
| 90 or more Minutes | 118 | 1.3% |
Commute Time by Sex in Calhoun County
The most common commute times in Calhoun County are 15 to 19 minutes (1,313 commuters, 24.5%) for males and 5 to 9 minutes (993 commuters, 24.4%) for females.
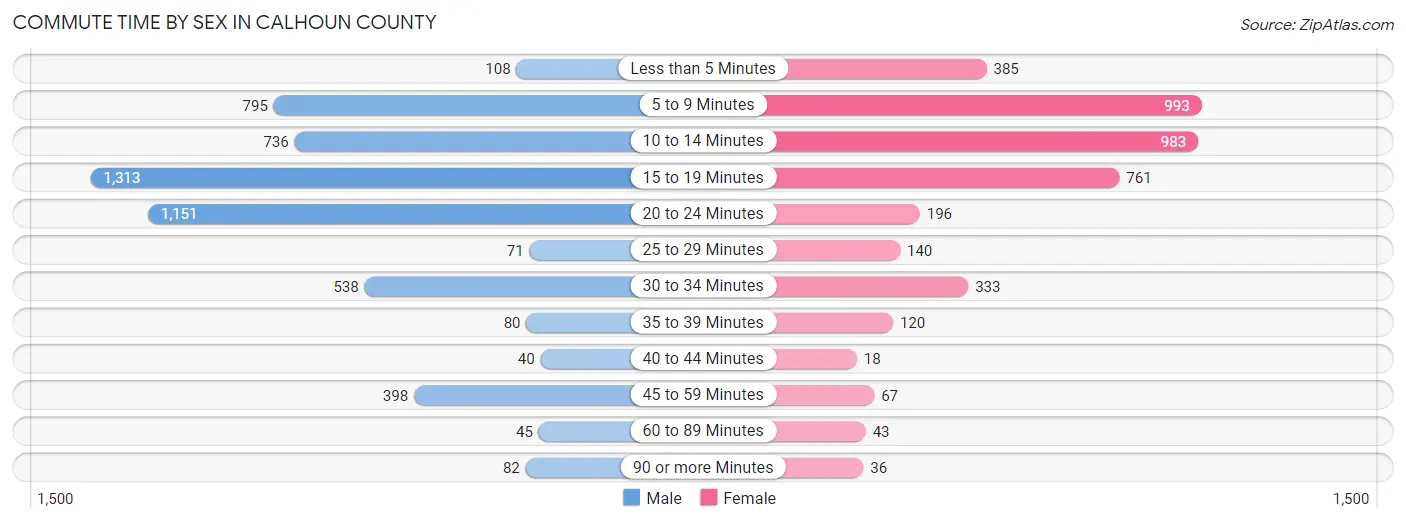
| Commute Time | Male | Female |
| Less than 5 Minutes | 108 (2.0%) | 385 (9.5%) |
| 5 to 9 Minutes | 795 (14.8%) | 993 (24.4%) |
| 10 to 14 Minutes | 736 (13.7%) | 983 (24.1%) |
| 15 to 19 Minutes | 1,313 (24.5%) | 761 (18.7%) |
| 20 to 24 Minutes | 1,151 (21.5%) | 196 (4.8%) |
| 25 to 29 Minutes | 71 (1.3%) | 140 (3.4%) |
| 30 to 34 Minutes | 538 (10.0%) | 333 (8.2%) |
| 35 to 39 Minutes | 80 (1.5%) | 120 (2.9%) |
| 40 to 44 Minutes | 40 (0.7%) | 18 (0.4%) |
| 45 to 59 Minutes | 398 (7.4%) | 67 (1.6%) |
| 60 to 89 Minutes | 45 (0.8%) | 43 (1.1%) |
| 90 or more Minutes | 82 (1.5%) | 36 (0.9%) |
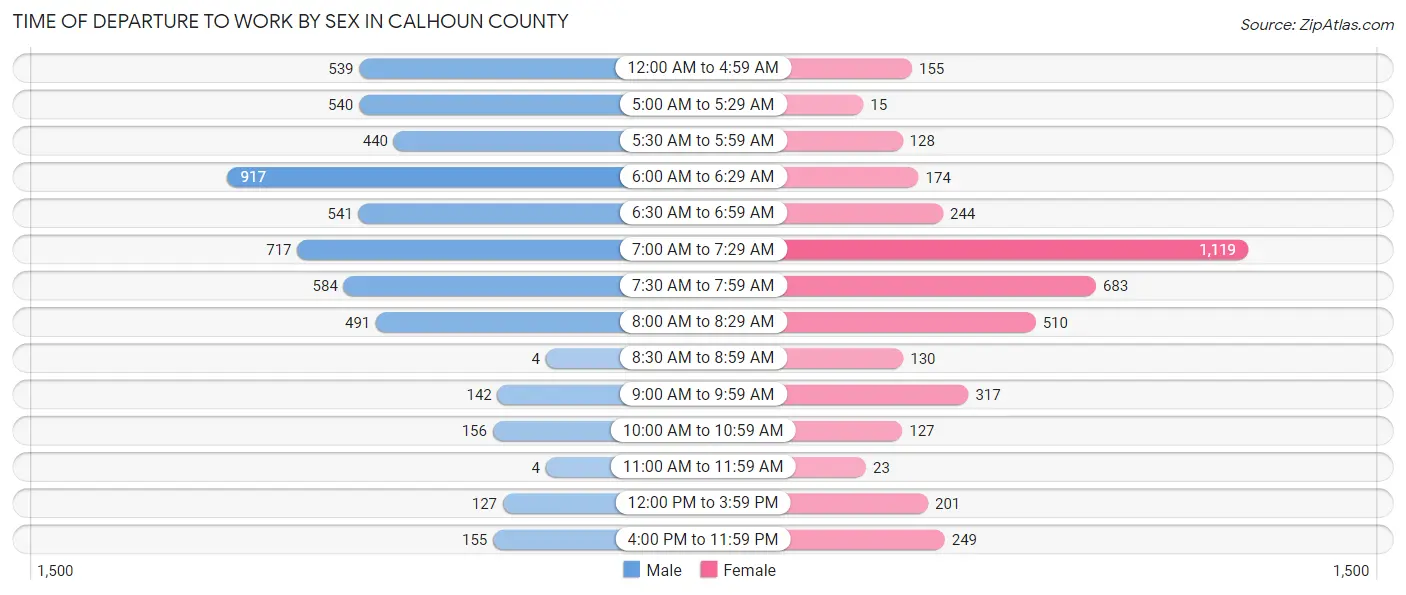
Time of Departure to Work by Sex in Calhoun County
The most frequent times of departure to work in Calhoun County are 6:00 AM to 6:29 AM (917, 17.1%) for males and 7:00 AM to 7:29 AM (1,119, 27.5%) for females.
| Time of Departure | Male | Female |
| 12:00 AM to 4:59 AM | 539 (10.1%) | 155 (3.8%) |
| 5:00 AM to 5:29 AM | 540 (10.1%) | 15 (0.4%) |
| 5:30 AM to 5:59 AM | 440 (8.2%) | 128 (3.1%) |
| 6:00 AM to 6:29 AM | 917 (17.1%) | 174 (4.3%) |
| 6:30 AM to 6:59 AM | 541 (10.1%) | 244 (6.0%) |
| 7:00 AM to 7:29 AM | 717 (13.4%) | 1,119 (27.5%) |
| 7:30 AM to 7:59 AM | 584 (10.9%) | 683 (16.8%) |
| 8:00 AM to 8:29 AM | 491 (9.2%) | 510 (12.5%) |
| 8:30 AM to 8:59 AM | 4 (0.1%) | 130 (3.2%) |
| 9:00 AM to 9:59 AM | 142 (2.6%) | 317 (7.8%) |
| 10:00 AM to 10:59 AM | 156 (2.9%) | 127 (3.1%) |
| 11:00 AM to 11:59 AM | 4 (0.1%) | 23 (0.6%) |
| 12:00 PM to 3:59 PM | 127 (2.4%) | 201 (4.9%) |
| 4:00 PM to 11:59 PM | 155 (2.9%) | 249 (6.1%) |
| Total | 5,357 (100.0%) | 4,075 (100.0%) |
Housing Occupancy in Calhoun County
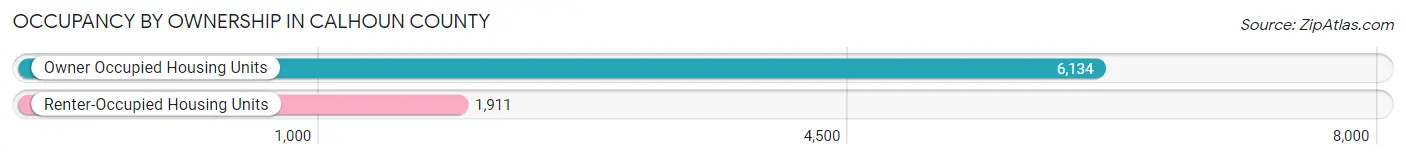
Occupancy by Ownership in Calhoun County
Of the total 8,045 dwellings in Calhoun County, owner-occupied units account for 6,134 (76.2%), while renter-occupied units make up 1,911 (23.7%).
| Occupancy | # Housing Units | % Housing Units |
| Owner Occupied Housing Units | 6,134 | 76.2% |
| Renter-Occupied Housing Units | 1,911 | 23.7% |
| Total Occupied Housing Units | 8,045 | 100.0% |
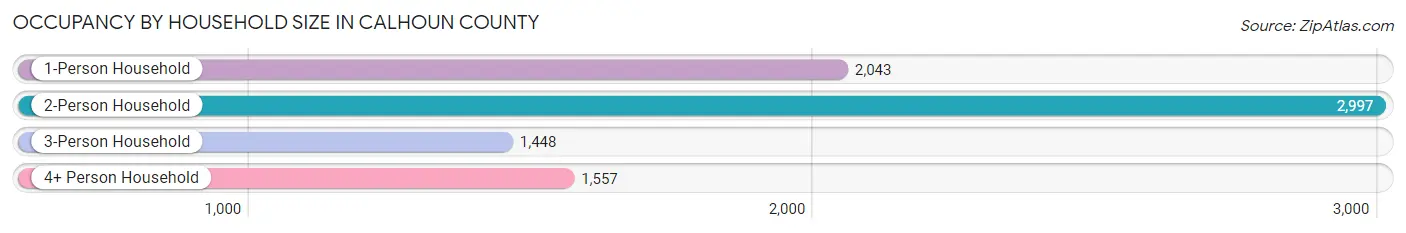
Occupancy by Household Size in Calhoun County
| Household Size | # Housing Units | % Housing Units |
| 1-Person Household | 2,043 | 25.4% |
| 2-Person Household | 2,997 | 37.2% |
| 3-Person Household | 1,448 | 18.0% |
| 4+ Person Household | 1,557 | 19.4% |
| Total Housing Units | 8,045 | 100.0% |
Occupancy by Ownership by Household Size in Calhoun County
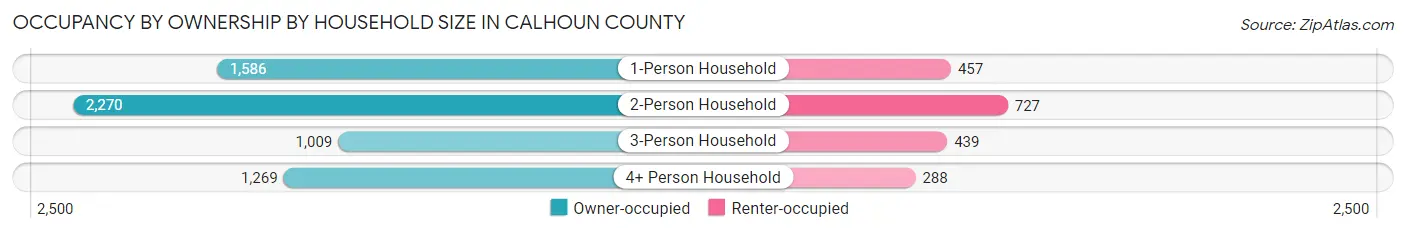
| Household Size | Owner-occupied | Renter-occupied |
| 1-Person Household | 1,586 (77.6%) | 457 (22.4%) |
| 2-Person Household | 2,270 (75.7%) | 727 (24.3%) |
| 3-Person Household | 1,009 (69.7%) | 439 (30.3%) |
| 4+ Person Household | 1,269 (81.5%) | 288 (18.5%) |
| Total Housing Units | 6,134 (76.2%) | 1,911 (23.7%) |
Occupancy by Educational Attainment in Calhoun County
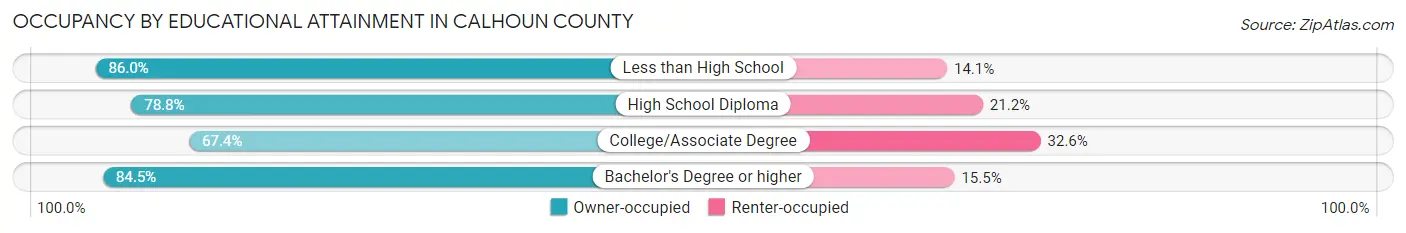
| Household Size | Owner-occupied | Renter-occupied |
| Less than High School | 875 (86.0%) | 143 (14.1%) |
| High School Diploma | 1,975 (78.8%) | 530 (21.2%) |
| College/Associate Degree | 2,115 (67.4%) | 1,023 (32.6%) |
| Bachelor's Degree or higher | 1,169 (84.5%) | 215 (15.5%) |
Occupancy by Age of Householder in Calhoun County
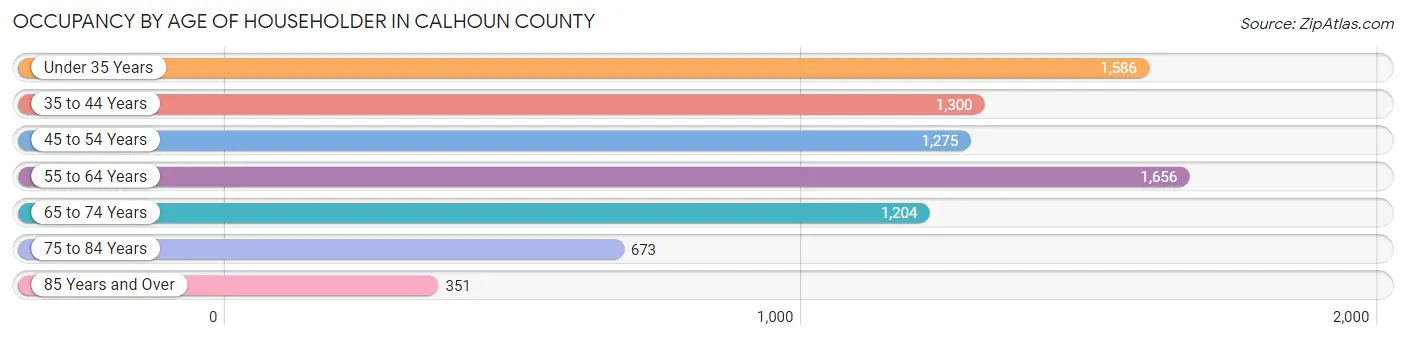
| Age Bracket | # Households | % Households |
| Under 35 Years | 1,586 | 19.7% |
| 35 to 44 Years | 1,300 | 16.2% |
| 45 to 54 Years | 1,275 | 15.9% |
| 55 to 64 Years | 1,656 | 20.6% |
| 65 to 74 Years | 1,204 | 15.0% |
| 75 to 84 Years | 673 | 8.4% |
| 85 Years and Over | 351 | 4.4% |
| Total | 8,045 | 100.0% |
Housing Finances in Calhoun County
Median Income by Occupancy in Calhoun County
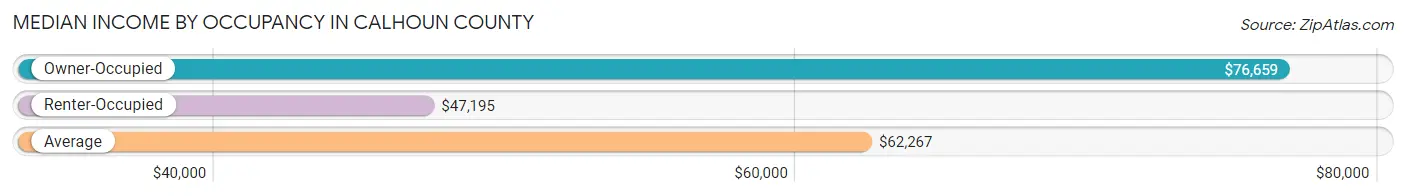
| Occupancy Type | # Households | Median Income |
| Owner-Occupied | 6,134 (76.2%) | $76,659 |
| Renter-Occupied | 1,911 (23.7%) | $47,195 |
| Average | 8,045 (100.0%) | $62,267 |
Occupancy by Householder Income Bracket in Calhoun County
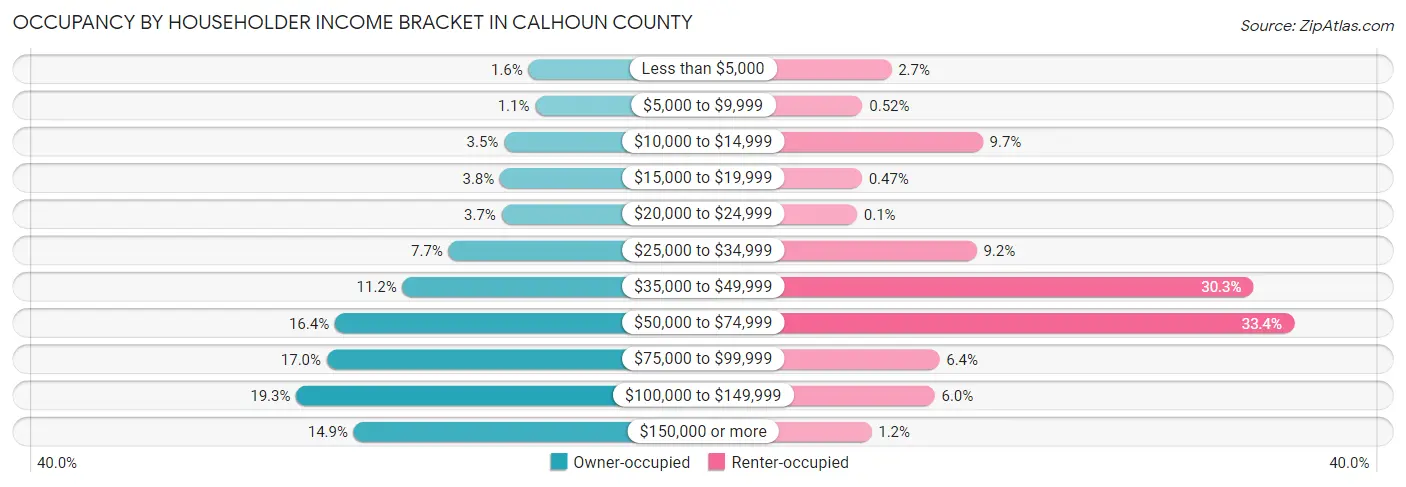
| Income Bracket | Owner-occupied | Renter-occupied |
| Less than $5,000 | 98 (1.6%) | 52 (2.7%) |
| $5,000 to $9,999 | 67 (1.1%) | 10 (0.5%) |
| $10,000 to $14,999 | 212 (3.5%) | 185 (9.7%) |
| $15,000 to $19,999 | 231 (3.8%) | 9 (0.5%) |
| $20,000 to $24,999 | 224 (3.6%) | 2 (0.1%) |
| $25,000 to $34,999 | 472 (7.7%) | 176 (9.2%) |
| $35,000 to $49,999 | 687 (11.2%) | 579 (30.3%) |
| $50,000 to $74,999 | 1,003 (16.4%) | 638 (33.4%) |
| $75,000 to $99,999 | 1,041 (17.0%) | 122 (6.4%) |
| $100,000 to $149,999 | 1,184 (19.3%) | 115 (6.0%) |
| $150,000 or more | 915 (14.9%) | 23 (1.2%) |
| Total | 6,134 (100.0%) | 1,911 (100.0%) |
Monthly Housing Cost Tiers in Calhoun County
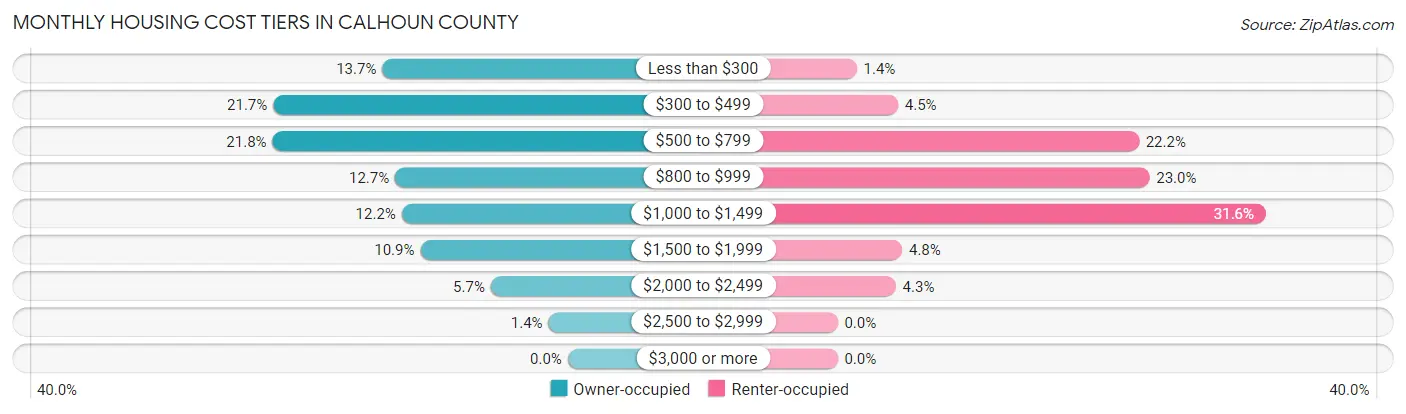
| Monthly Cost | Owner-occupied | Renter-occupied |
| Less than $300 | 838 (13.7%) | 27 (1.4%) |
| $300 to $499 | 1,331 (21.7%) | 85 (4.4%) |
| $500 to $799 | 1,334 (21.7%) | 424 (22.2%) |
| $800 to $999 | 780 (12.7%) | 439 (23.0%) |
| $1,000 to $1,499 | 750 (12.2%) | 603 (31.6%) |
| $1,500 to $1,999 | 666 (10.9%) | 91 (4.8%) |
| $2,000 to $2,499 | 348 (5.7%) | 82 (4.3%) |
| $2,500 to $2,999 | 87 (1.4%) | 0 (0.0%) |
| $3,000 or more | 0 (0.0%) | 0 (0.0%) |
| Total | 6,134 (100.0%) | 1,911 (100.0%) |
Physical Housing Characteristics in Calhoun County
Housing Structures in Calhoun County
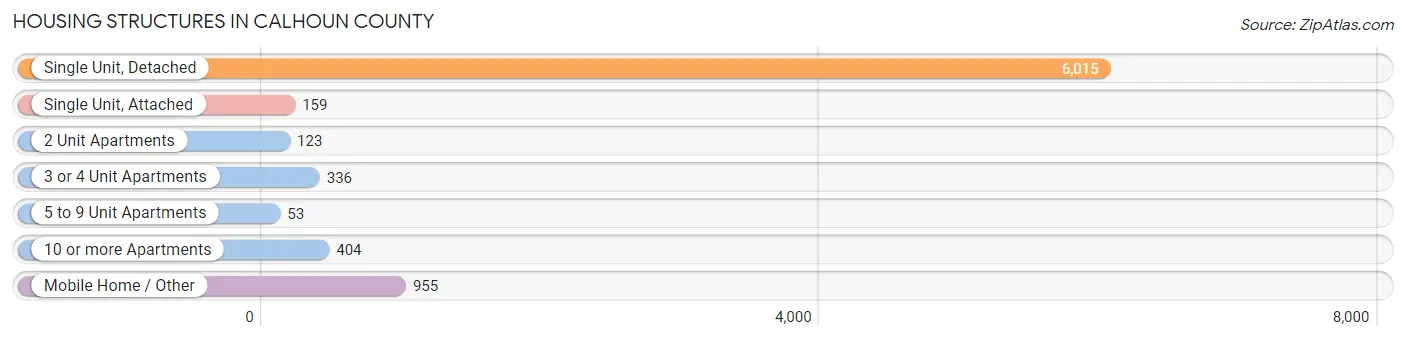
| Structure Type | # Housing Units | % Housing Units |
| Single Unit, Detached | 6,015 | 74.8% |
| Single Unit, Attached | 159 | 2.0% |
| 2 Unit Apartments | 123 | 1.5% |
| 3 or 4 Unit Apartments | 336 | 4.2% |
| 5 to 9 Unit Apartments | 53 | 0.7% |
| 10 or more Apartments | 404 | 5.0% |
| Mobile Home / Other | 955 | 11.9% |
| Total | 8,045 | 100.0% |
Housing Structures by Occupancy in Calhoun County
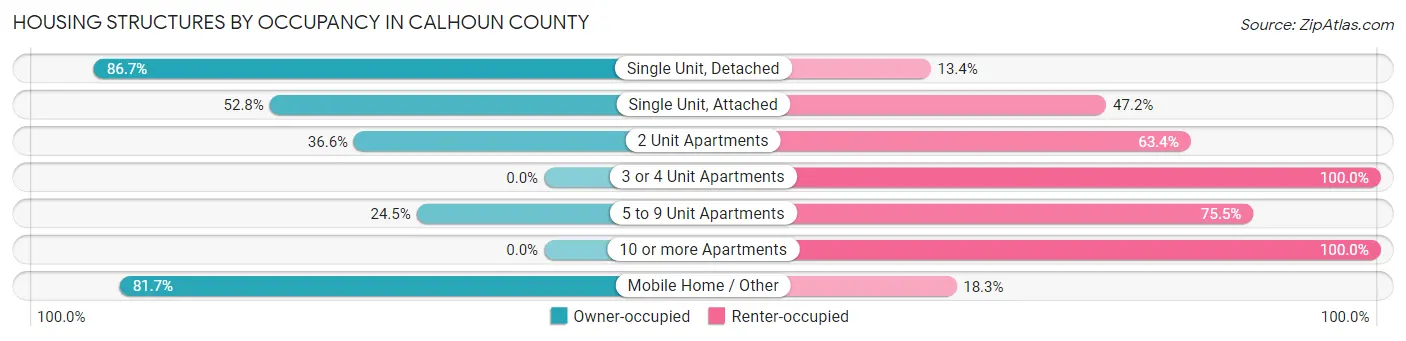
| Structure Type | Owner-occupied | Renter-occupied |
| Single Unit, Detached | 5,212 (86.7%) | 803 (13.4%) |
| Single Unit, Attached | 84 (52.8%) | 75 (47.2%) |
| 2 Unit Apartments | 45 (36.6%) | 78 (63.4%) |
| 3 or 4 Unit Apartments | 0 (0.0%) | 336 (100.0%) |
| 5 to 9 Unit Apartments | 13 (24.5%) | 40 (75.5%) |
| 10 or more Apartments | 0 (0.0%) | 404 (100.0%) |
| Mobile Home / Other | 780 (81.7%) | 175 (18.3%) |
| Total | 6,134 (76.2%) | 1,911 (23.7%) |
Housing Structures by Number of Rooms in Calhoun County
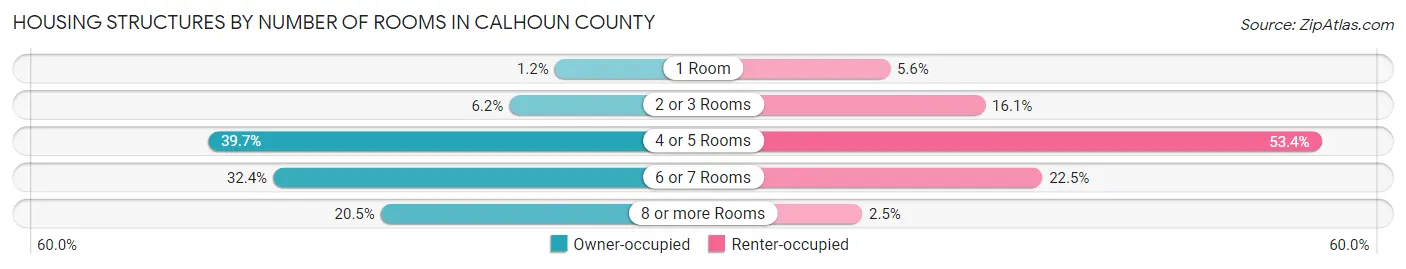
| Number of Rooms | Owner-occupied | Renter-occupied |
| 1 Room | 73 (1.2%) | 106 (5.6%) |
| 2 or 3 Rooms | 382 (6.2%) | 308 (16.1%) |
| 4 or 5 Rooms | 2,432 (39.7%) | 1,021 (53.4%) |
| 6 or 7 Rooms | 1,990 (32.4%) | 429 (22.5%) |
| 8 or more Rooms | 1,257 (20.5%) | 47 (2.5%) |
| Total | 6,134 (100.0%) | 1,911 (100.0%) |
Housing Structure by Heating Type in Calhoun County
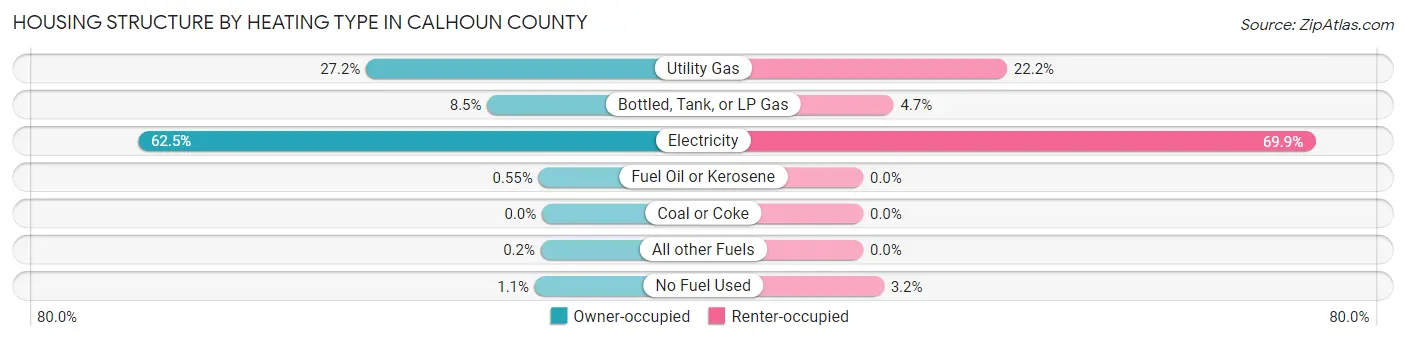
| Heating Type | Owner-occupied | Renter-occupied |
| Utility Gas | 1,668 (27.2%) | 425 (22.2%) |
| Bottled, Tank, or LP Gas | 519 (8.5%) | 90 (4.7%) |
| Electricity | 3,832 (62.5%) | 1,335 (69.9%) |
| Fuel Oil or Kerosene | 34 (0.5%) | 0 (0.0%) |
| Coal or Coke | 0 (0.0%) | 0 (0.0%) |
| All other Fuels | 12 (0.2%) | 0 (0.0%) |
| No Fuel Used | 69 (1.1%) | 61 (3.2%) |
| Total | 6,134 (100.0%) | 1,911 (100.0%) |
Household Vehicle Usage in Calhoun County
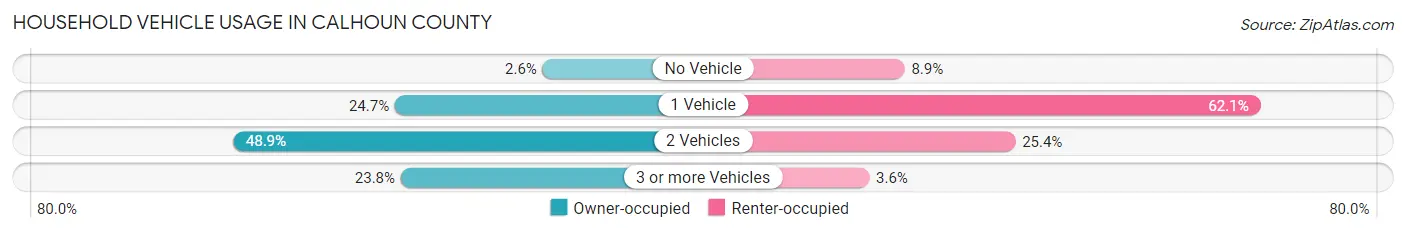
| Vehicles per Household | Owner-occupied | Renter-occupied |
| No Vehicle | 161 (2.6%) | 170 (8.9%) |
| 1 Vehicle | 1,514 (24.7%) | 1,186 (62.1%) |
| 2 Vehicles | 2,999 (48.9%) | 486 (25.4%) |
| 3 or more Vehicles | 1,460 (23.8%) | 69 (3.6%) |
| Total | 6,134 (100.0%) | 1,911 (100.0%) |
Real Estate & Mortgages in Calhoun County
Real Estate and Mortgage Overview in Calhoun County
| Characteristic | Without Mortgage | With Mortgage |
| Housing Units | 3,859 | 2,275 |
| Median Property Value | $114,400 | $164,700 |
| Median Household Income | $58,586 | $581 |
| Monthly Housing Costs | $469 | $0 |
| Real Estate Taxes | $1,254 | $62 |
Property Value by Mortgage Status in Calhoun County
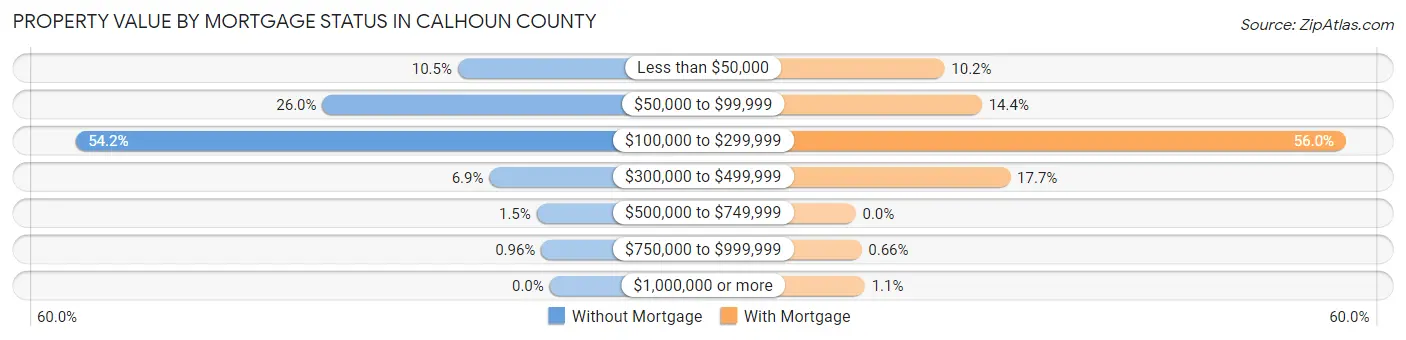
| Property Value | Without Mortgage | With Mortgage |
| Less than $50,000 | 405 (10.5%) | 231 (10.2%) |
| $50,000 to $99,999 | 1,002 (26.0%) | 328 (14.4%) |
| $100,000 to $299,999 | 2,092 (54.2%) | 1,275 (56.0%) |
| $300,000 to $499,999 | 266 (6.9%) | 402 (17.7%) |
| $500,000 to $749,999 | 57 (1.5%) | 0 (0.0%) |
| $750,000 to $999,999 | 37 (1.0%) | 15 (0.7%) |
| $1,000,000 or more | 0 (0.0%) | 24 (1.1%) |
| Total | 3,859 (100.0%) | 2,275 (100.0%) |
Household Income by Mortgage Status in Calhoun County
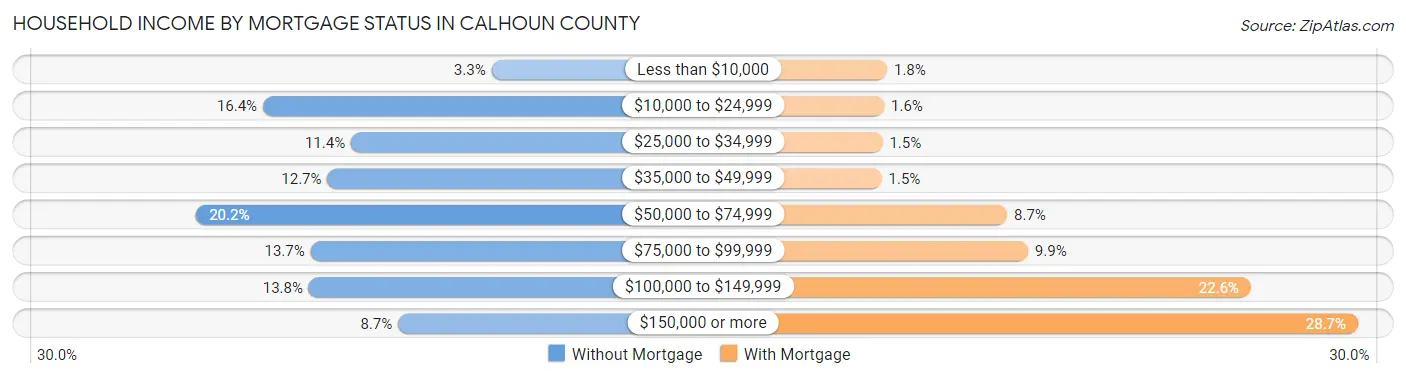
| Household Income | Without Mortgage | With Mortgage |
| Less than $10,000 | 128 (3.3%) | 41 (1.8%) |
| $10,000 to $24,999 | 632 (16.4%) | 37 (1.6%) |
| $25,000 to $34,999 | 438 (11.4%) | 35 (1.5%) |
| $35,000 to $49,999 | 490 (12.7%) | 34 (1.5%) |
| $50,000 to $74,999 | 779 (20.2%) | 197 (8.7%) |
| $75,000 to $99,999 | 527 (13.7%) | 224 (9.9%) |
| $100,000 to $149,999 | 531 (13.8%) | 514 (22.6%) |
| $150,000 or more | 334 (8.7%) | 653 (28.7%) |
| Total | 3,859 (100.0%) | 2,275 (100.0%) |
Property Value to Household Income Ratio in Calhoun County
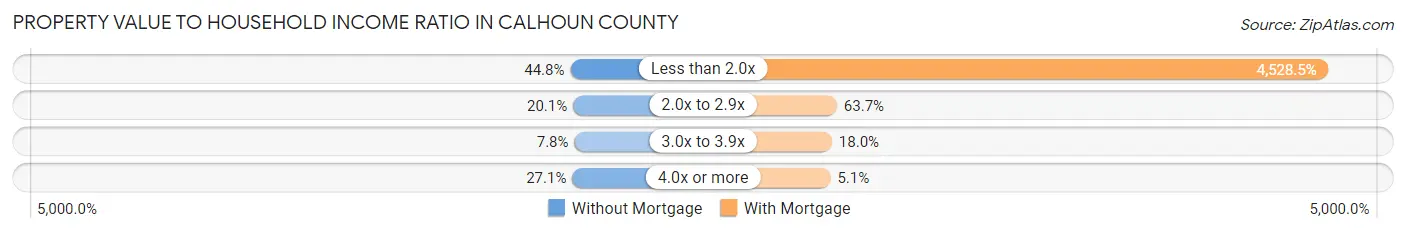
| Value-to-Income Ratio | Without Mortgage | With Mortgage |
| Less than 2.0x | 1,729 (44.8%) | 103,024 (4,528.5%) |
| 2.0x to 2.9x | 777 (20.1%) | 1,448 (63.6%) |
| 3.0x to 3.9x | 299 (7.7%) | 410 (18.0%) |
| 4.0x or more | 1,045 (27.1%) | 116 (5.1%) |
| Total | 3,859 (100.0%) | 2,275 (100.0%) |
Real Estate Taxes by Mortgage Status in Calhoun County
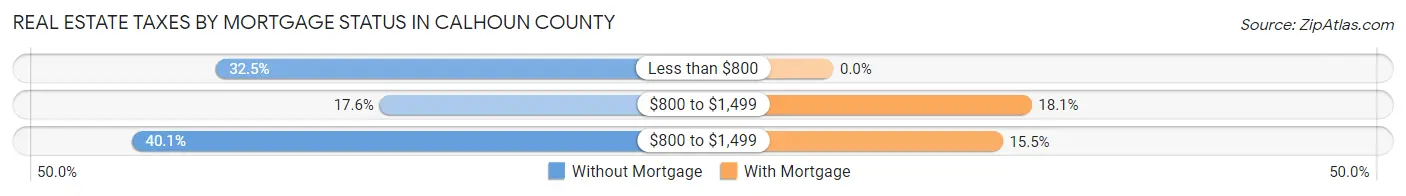
| Property Taxes | Without Mortgage | With Mortgage |
| Less than $800 | 1,254 (32.5%) | 0 (0.0%) |
| $800 to $1,499 | 678 (17.6%) | 412 (18.1%) |
| $800 to $1,499 | 1,549 (40.1%) | 352 (15.5%) |
| Total | 3,859 (100.0%) | 2,275 (100.0%) |
Health & Disability in Calhoun County
Health Insurance Coverage by Age in Calhoun County
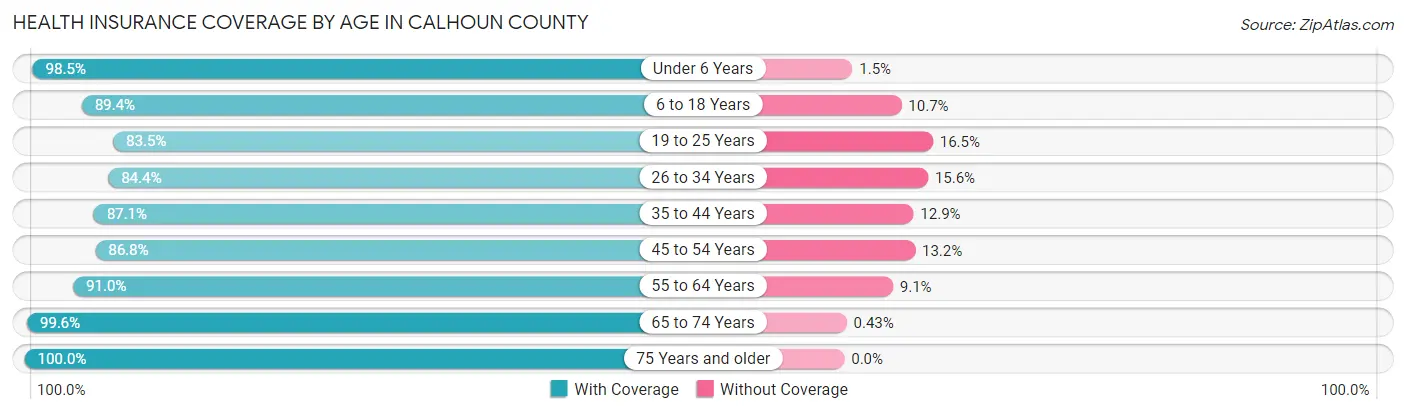
| Age Bracket | With Coverage | Without Coverage |
| Under 6 Years | 1,508 (98.5%) | 23 (1.5%) |
| 6 to 18 Years | 2,996 (89.3%) | 357 (10.6%) |
| 19 to 25 Years | 1,625 (83.5%) | 321 (16.5%) |
| 26 to 34 Years | 1,780 (84.4%) | 329 (15.6%) |
| 35 to 44 Years | 1,953 (87.1%) | 289 (12.9%) |
| 45 to 54 Years | 2,001 (86.8%) | 304 (13.2%) |
| 55 to 64 Years | 2,594 (90.9%) | 258 (9.0%) |
| 65 to 74 Years | 2,066 (99.6%) | 9 (0.4%) |
| 75 Years and older | 1,451 (100.0%) | 0 (0.0%) |
| Total | 17,974 (90.5%) | 1,890 (9.5%) |
Health Insurance Coverage by Citizenship Status in Calhoun County
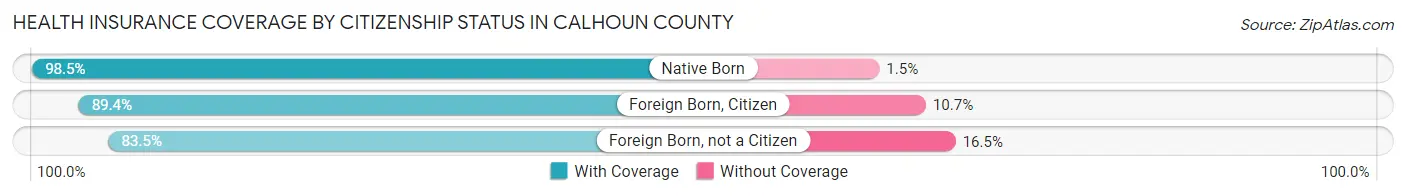
| Citizenship Status | With Coverage | Without Coverage |
| Native Born | 1,508 (98.5%) | 23 (1.5%) |
| Foreign Born, Citizen | 2,996 (89.3%) | 357 (10.6%) |
| Foreign Born, not a Citizen | 1,625 (83.5%) | 321 (16.5%) |
Health Insurance Coverage by Household Income in Calhoun County
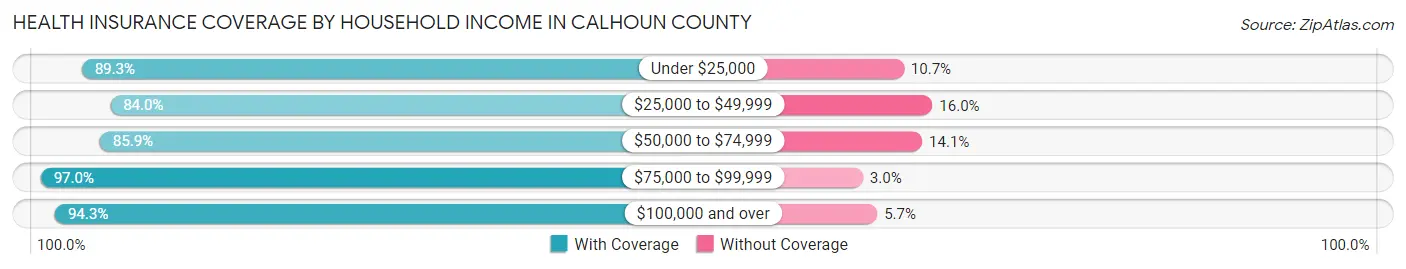
| Household Income | With Coverage | Without Coverage |
| Under $25,000 | 1,528 (89.3%) | 183 (10.7%) |
| $25,000 to $49,999 | 3,408 (84.0%) | 651 (16.0%) |
| $50,000 to $74,999 | 3,423 (85.9%) | 563 (14.1%) |
| $75,000 to $99,999 | 2,922 (97.0%) | 91 (3.0%) |
| $100,000 and over | 6,613 (94.3%) | 400 (5.7%) |
Public vs Private Health Insurance Coverage by Age in Calhoun County
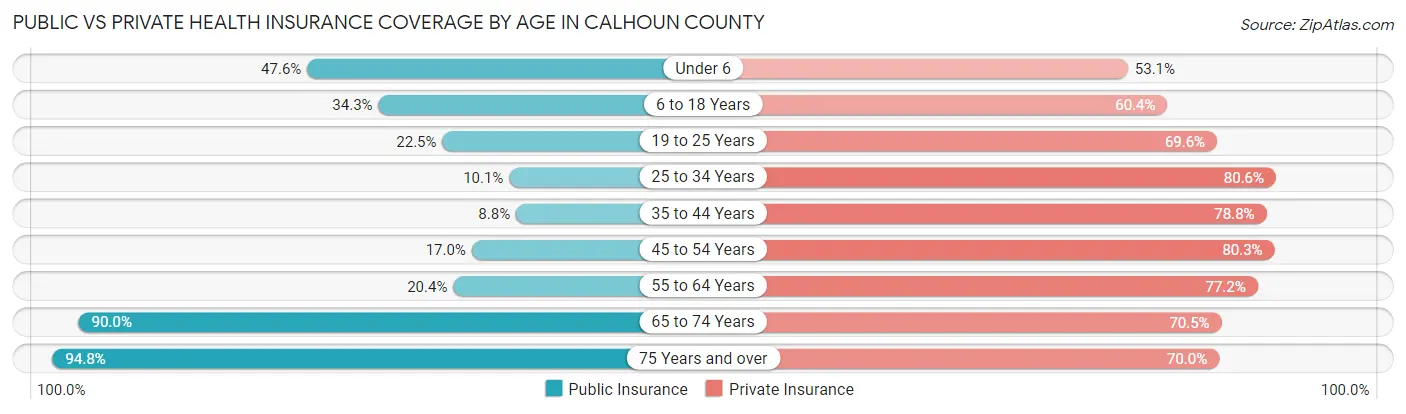
| Age Bracket | Public Insurance | Private Insurance |
| Under 6 | 728 (47.5%) | 813 (53.1%) |
| 6 to 18 Years | 1,151 (34.3%) | 2,026 (60.4%) |
| 19 to 25 Years | 437 (22.5%) | 1,355 (69.6%) |
| 25 to 34 Years | 212 (10.1%) | 1,699 (80.6%) |
| 35 to 44 Years | 197 (8.8%) | 1,767 (78.8%) |
| 45 to 54 Years | 392 (17.0%) | 1,851 (80.3%) |
| 55 to 64 Years | 583 (20.4%) | 2,201 (77.2%) |
| 65 to 74 Years | 1,867 (90.0%) | 1,462 (70.5%) |
| 75 Years and over | 1,376 (94.8%) | 1,016 (70.0%) |
| Total | 6,943 (34.9%) | 14,190 (71.4%) |
Disability Status by Sex by Age in Calhoun County
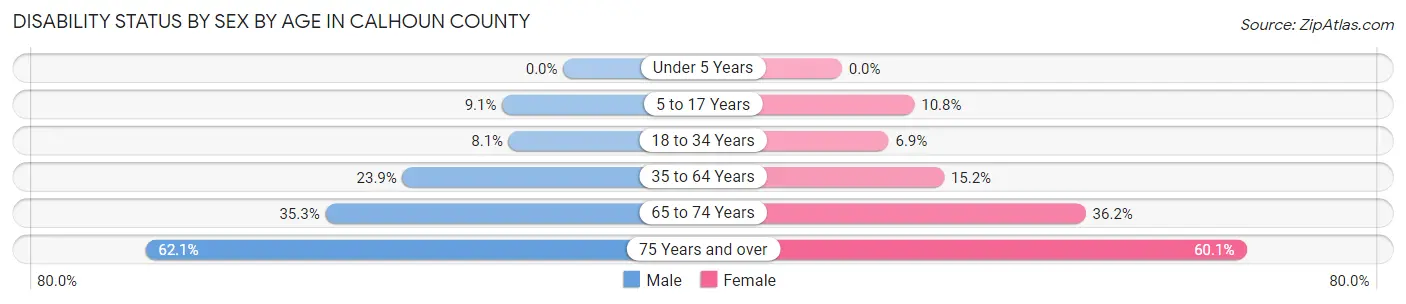
| Age Bracket | Male | Female |
| Under 5 Years | 0 (0.0%) | 0 (0.0%) |
| 5 to 17 Years | 161 (9.1%) | 184 (10.8%) |
| 18 to 34 Years | 188 (8.1%) | 130 (6.9%) |
| 35 to 64 Years | 899 (23.9%) | 551 (15.2%) |
| 65 to 74 Years | 373 (35.3%) | 369 (36.2%) |
| 75 Years and over | 419 (62.1%) | 466 (60.1%) |
Disability Class by Sex by Age in Calhoun County
Disability Class: Hearing Difficulty
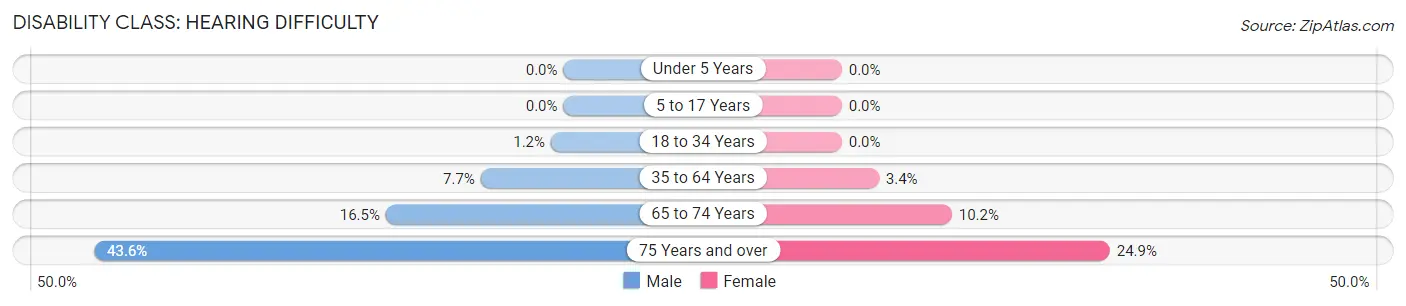
| Age Bracket | Male | Female |
| Under 5 Years | 0 (0.0%) | 0 (0.0%) |
| 5 to 17 Years | 0 (0.0%) | 0 (0.0%) |
| 18 to 34 Years | 27 (1.2%) | 0 (0.0%) |
| 35 to 64 Years | 289 (7.7%) | 125 (3.4%) |
| 65 to 74 Years | 174 (16.5%) | 104 (10.2%) |
| 75 Years and over | 294 (43.6%) | 193 (24.9%) |
Disability Class: Vision Difficulty
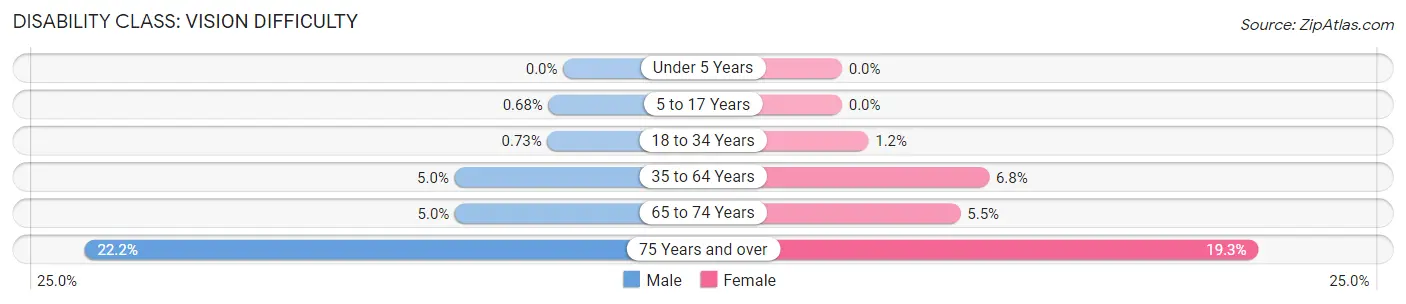
| Age Bracket | Male | Female |
| Under 5 Years | 0 (0.0%) | 0 (0.0%) |
| 5 to 17 Years | 12 (0.7%) | 0 (0.0%) |
| 18 to 34 Years | 17 (0.7%) | 23 (1.2%) |
| 35 to 64 Years | 190 (5.0%) | 248 (6.8%) |
| 65 to 74 Years | 53 (5.0%) | 56 (5.5%) |
| 75 Years and over | 150 (22.2%) | 150 (19.3%) |
Disability Class: Cognitive Difficulty
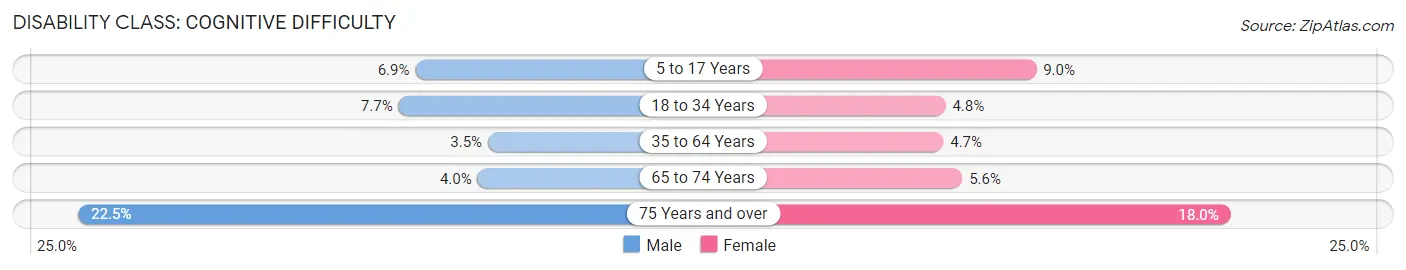
| Age Bracket | Male | Female |
| 5 to 17 Years | 122 (6.9%) | 154 (9.0%) |
| 18 to 34 Years | 178 (7.6%) | 90 (4.8%) |
| 35 to 64 Years | 132 (3.5%) | 171 (4.7%) |
| 65 to 74 Years | 42 (4.0%) | 57 (5.6%) |
| 75 Years and over | 152 (22.5%) | 140 (18.0%) |
Disability Class: Ambulatory Difficulty
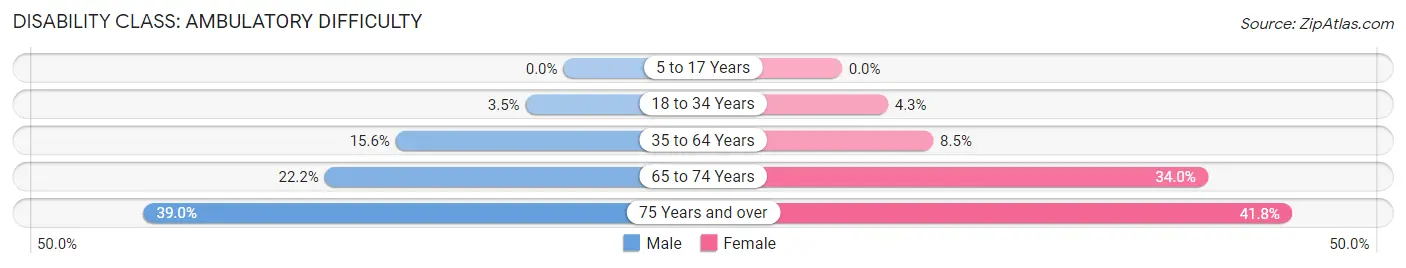
| Age Bracket | Male | Female |
| 5 to 17 Years | 0 (0.0%) | 0 (0.0%) |
| 18 to 34 Years | 82 (3.5%) | 80 (4.3%) |
| 35 to 64 Years | 586 (15.6%) | 308 (8.5%) |
| 65 to 74 Years | 234 (22.2%) | 346 (34.0%) |
| 75 Years and over | 263 (39.0%) | 324 (41.7%) |
Disability Class: Self-Care Difficulty
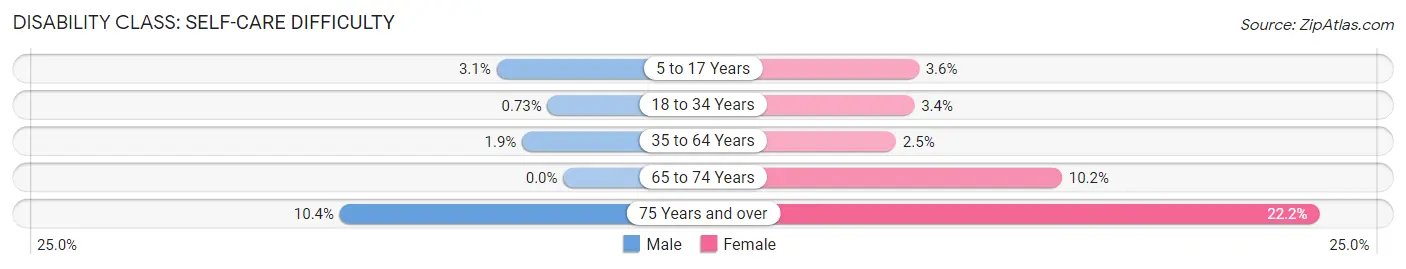
| Age Bracket | Male | Female |
| 5 to 17 Years | 55 (3.1%) | 61 (3.6%) |
| 18 to 34 Years | 17 (0.7%) | 63 (3.4%) |
| 35 to 64 Years | 72 (1.9%) | 91 (2.5%) |
| 65 to 74 Years | 0 (0.0%) | 104 (10.2%) |
| 75 Years and over | 70 (10.4%) | 172 (22.2%) |
Technology Access in Calhoun County
Computing Device Access in Calhoun County
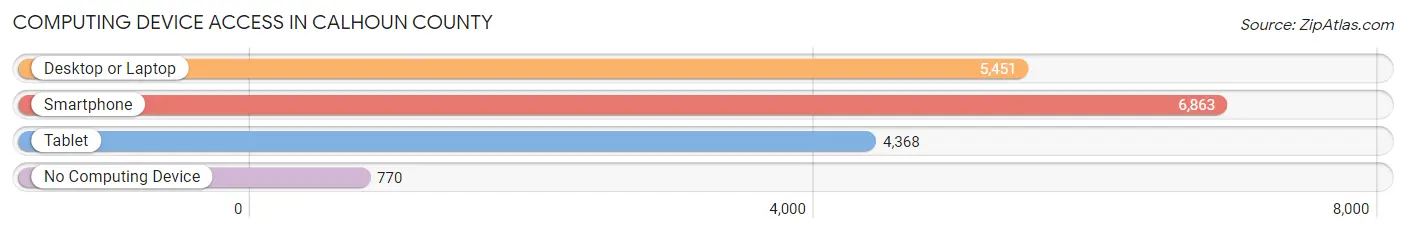
| Device Type | # Households | % Households |
| Desktop or Laptop | 5,451 | 67.8% |
| Smartphone | 6,863 | 85.3% |
| Tablet | 4,368 | 54.3% |
| No Computing Device | 770 | 9.6% |
| Total | 8,045 | 100.0% |
Internet Access in Calhoun County
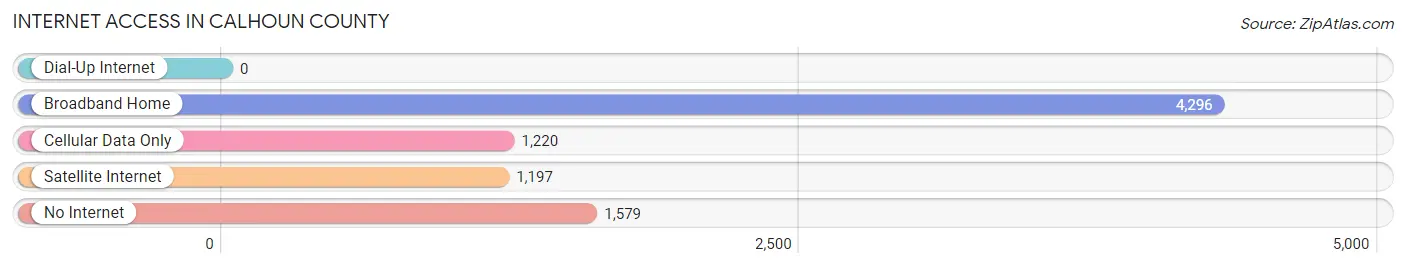
| Internet Type | # Households | % Households |
| Dial-Up Internet | 0 | 0.0% |
| Broadband Home | 4,296 | 53.4% |
| Cellular Data Only | 1,220 | 15.2% |
| Satellite Internet | 1,197 | 14.9% |
| No Internet | 1,579 | 19.6% |
| Total | 8,045 | 100.0% |
Calhoun County Summary
Calhoun County is located in the southeastern corner of Texas, along the Gulf of Mexico. It is bordered by Matagorda County to the north, Jackson County to the east, Victoria County to the west, and Aransas County to the south. The county seat is Port Lavaca, and the county has a total area of 837 square miles.
History
Calhoun County was established in 1846 and named after John C. Calhoun, the seventh Vice President of the United States. The county was originally part of Jackson County, but was later divided into its own county. The county was originally populated by Native Americans, including the Karankawa, Tonkawa, and Coahuiltecan tribes.
In the early 19th century, the area was settled by European immigrants, primarily from Germany and Czechoslovakia. The first settlers arrived in 1831, and the county was officially organized in 1846.
Geography
Calhoun County is located in the southeastern corner of Texas, along the Gulf of Mexico. It is bordered by Matagorda County to the north, Jackson County to the east, Victoria County to the west, and Aransas County to the south. The county has a total area of 837 square miles, and is mostly flat with some rolling hills. The terrain is mostly covered in grasslands and woodlands, with some coastal marshes and wetlands.
The county is home to several rivers, including the Lavaca River, San Antonio River, and Guadalupe River. The county also contains several bays, including Lavaca Bay, San Antonio Bay, and Matagorda Bay.
Economy
Calhoun County has a diverse economy, with a mix of agriculture, manufacturing, and tourism. The county is home to several large agricultural operations, including cattle, cotton, and grain farms. The county is also home to several manufacturing plants, including a paper mill, a chemical plant, and a steel mill.
The county is also a popular tourist destination, with several beaches, fishing spots, and other attractions. The county is home to several state parks, including Goose Island State Park and Matagorda Island State Park.
Demographics
As of the 2010 census, Calhoun County had a population of 21,381. The population was spread out, with 48.3% male and 51.7% female. The median age was 38.7 years.
The racial makeup of the county was 79.2% White, 11.2% Hispanic or Latino, 8.2% African American, 0.7% Native American, 0.3% Asian, and 0.2% Pacific Islander. The median household income was $41,945, and the median family income was $50,945. The per capita income was $20,945.
Common Questions
What is Per Capita Income in Calhoun County?
Per Capita income in Calhoun County is $33,754.
What is the Median Family Income in Calhoun County?
Median Family Income in Calhoun County is $81,276.
What is the Median Household income in Calhoun County?
Median Household Income in Calhoun County is $62,267.
What is Income or Wage Gap in Calhoun County?
Income or Wage Gap in Calhoun County is 36.6%.
Women in Calhoun County earn 63.4 cents for every dollar earned by a man.
What is Inequality or Gini Index in Calhoun County?
Inequality or Gini Index in Calhoun County is 0.41.
What is the Total Population of Calhoun County?
Total Population of Calhoun County is 20,127.
What is the Total Male Population of Calhoun County?
Total Male Population of Calhoun County is 10,402.
What is the Total Female Population of Calhoun County?
Total Female Population of Calhoun County is 9,725.
What is the Ratio of Males per 100 Females in Calhoun County?
There are 106.96 Males per 100 Females in Calhoun County.
What is the Ratio of Females per 100 Males in Calhoun County?
There are 93.49 Females per 100 Males in Calhoun County.
What is the Median Population Age in Calhoun County?
Median Population Age in Calhoun County is 38.4 Years.
What is the Average Family Size in Calhoun County
Average Family Size in Calhoun County is 3.0 People.
What is the Average Household Size in Calhoun County
Average Household Size in Calhoun County is 2.5 People.
How Large is the Labor Force in Calhoun County?
There are 10,026 People in the Labor Forcein in Calhoun County.
What is the Percentage of People in the Labor Force in Calhoun County?
62.7% of People are in the Labor Force in Calhoun County.
What is the Unemployment Rate in Calhoun County?
Unemployment Rate in Calhoun County is 3.4%.