Caldwell County, TX Map & Demographics
Caldwell County Map
Caldwell County Overview
$28,742
PER CAPITA INCOME
$76,740
AVG FAMILY INCOME
$66,779
AVG HOUSEHOLD INCOME
36.7%
WAGE / INCOME GAP [ % ]
63.3¢/ $1
WAGE / INCOME GAP [ $ ]
0.41
INEQUALITY / GINI INDEX
46,141
TOTAL POPULATION
23,228
MALE POPULATION
22,913
FEMALE POPULATION
101.37
MALES / 100 FEMALES
98.64
FEMALES / 100 MALES
37.8
MEDIAN AGE
3.4
AVG FAMILY SIZE
2.8
AVG HOUSEHOLD SIZE
21,084
LABOR FORCE [ PEOPLE ]
57.0%
PERCENT IN LABOR FORCE
2.4%
UNEMPLOYMENT RATE
Income in Caldwell County
Income Overview in Caldwell County
Per Capita Income in Caldwell County is $28,742, while median incomes of families and households are $76,740 and $66,779 respectively.
| Characteristic | Number | Measure |
| Per Capita Income | 46,141 | $28,742 |
| Median Family Income | 10,595 | $76,740 |
| Mean Family Income | 10,595 | $93,450 |
| Median Household Income | 15,087 | $66,779 |
| Mean Household Income | 15,087 | $83,491 |
| Income Deficit | 10,595 | $0 |
| Wage / Income Gap (%) | 46,141 | 36.68% |
| Wage / Income Gap ($) | 46,141 | 63.32¢ per $1 |
| Gini / Inequality Index | 46,141 | 0.41 |
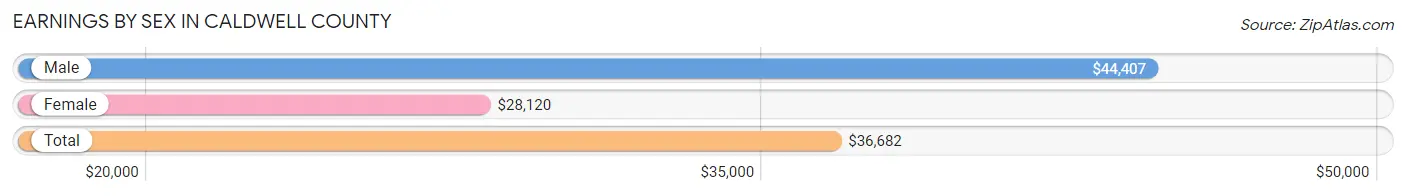
Earnings by Sex in Caldwell County
Average Earnings in Caldwell County are $36,682, $44,407 for men and $28,120 for women, a difference of 36.7%.
| Sex | Number | Average Earnings |
| Male | 12,530 (55.2%) | $44,407 |
| Female | 10,164 (44.8%) | $28,120 |
| Total | 22,694 (100.0%) | $36,682 |
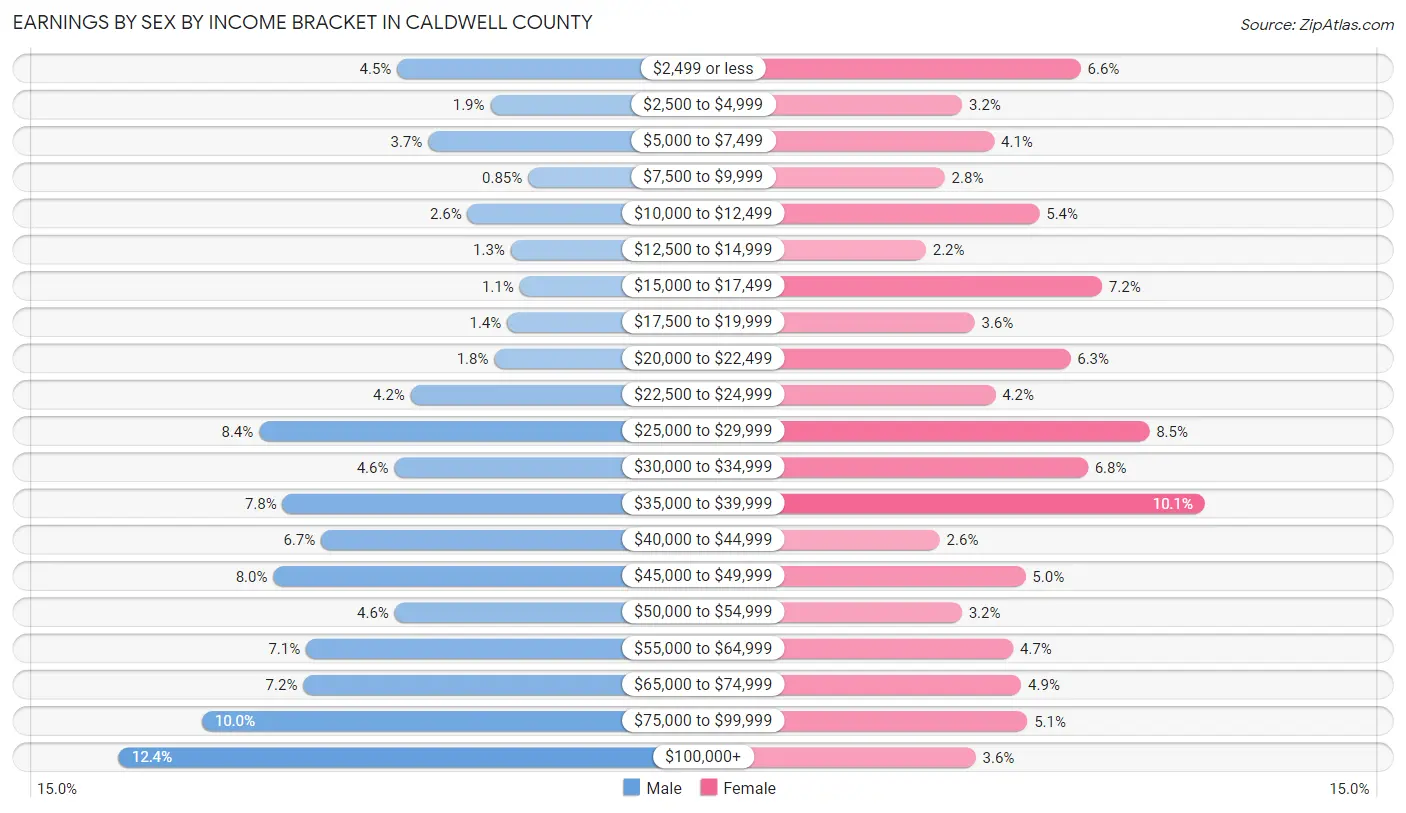
Earnings by Sex by Income Bracket in Caldwell County
The most common earnings brackets in Caldwell County are $100,000+ for men (1,548 | 12.3%) and $35,000 to $39,999 for women (1,023 | 10.1%).
| Income | Male | Female |
| $2,499 or less | 567 (4.5%) | 668 (6.6%) |
| $2,500 to $4,999 | 239 (1.9%) | 329 (3.2%) |
| $5,000 to $7,499 | 458 (3.7%) | 421 (4.1%) |
| $7,500 to $9,999 | 107 (0.9%) | 280 (2.8%) |
| $10,000 to $12,499 | 319 (2.5%) | 550 (5.4%) |
| $12,500 to $14,999 | 168 (1.3%) | 226 (2.2%) |
| $15,000 to $17,499 | 136 (1.1%) | 729 (7.2%) |
| $17,500 to $19,999 | 180 (1.4%) | 365 (3.6%) |
| $20,000 to $22,499 | 226 (1.8%) | 638 (6.3%) |
| $22,500 to $24,999 | 520 (4.2%) | 424 (4.2%) |
| $25,000 to $29,999 | 1,054 (8.4%) | 864 (8.5%) |
| $30,000 to $34,999 | 578 (4.6%) | 688 (6.8%) |
| $35,000 to $39,999 | 971 (7.7%) | 1,023 (10.1%) |
| $40,000 to $44,999 | 836 (6.7%) | 265 (2.6%) |
| $45,000 to $49,999 | 1,004 (8.0%) | 510 (5.0%) |
| $50,000 to $54,999 | 576 (4.6%) | 328 (3.2%) |
| $55,000 to $64,999 | 888 (7.1%) | 475 (4.7%) |
| $65,000 to $74,999 | 899 (7.2%) | 498 (4.9%) |
| $75,000 to $99,999 | 1,256 (10.0%) | 515 (5.1%) |
| $100,000+ | 1,548 (12.3%) | 368 (3.6%) |
| Total | 12,530 (100.0%) | 10,164 (100.0%) |
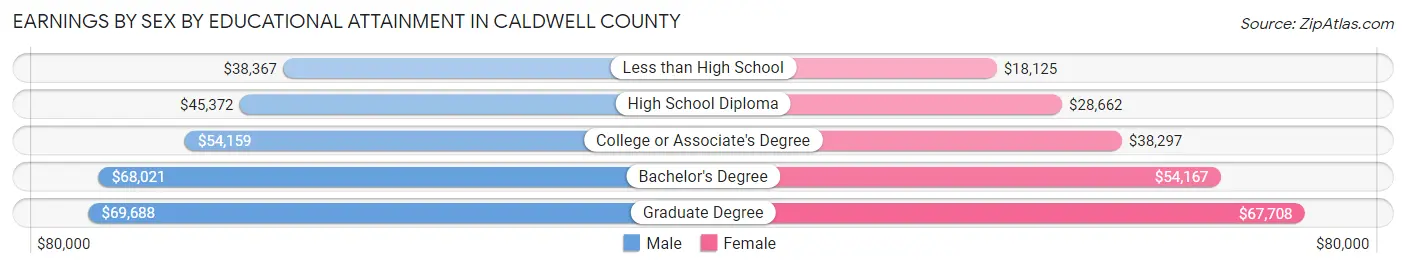
Earnings by Sex by Educational Attainment in Caldwell County
Average earnings in Caldwell County are $47,088 for men and $33,216 for women, a difference of 29.5%. Men with an educational attainment of graduate degree enjoy the highest average annual earnings of $69,688, while those with less than high school education earn the least with $38,367. Women with an educational attainment of graduate degree earn the most with the average annual earnings of $67,708, while those with less than high school education have the smallest earnings of $18,125.
| Educational Attainment | Male Income | Female Income |
| Less than High School | $38,367 | $18,125 |
| High School Diploma | $45,372 | $28,662 |
| College or Associate's Degree | $54,159 | $38,297 |
| Bachelor's Degree | $68,021 | $54,167 |
| Graduate Degree | $69,688 | $67,708 |
| Total | $47,088 | $33,216 |
Family Income in Caldwell County
Family Income Brackets in Caldwell County
According to the Caldwell County family income data, there are 2,267 families falling into the $50,000 to $74,999 income range, which is the most common income bracket and makes up 21.4% of all families. Conversely, the $10,000 to $14,999 income bracket is the least frequent group with only 170 families (1.6%) belonging to this category.
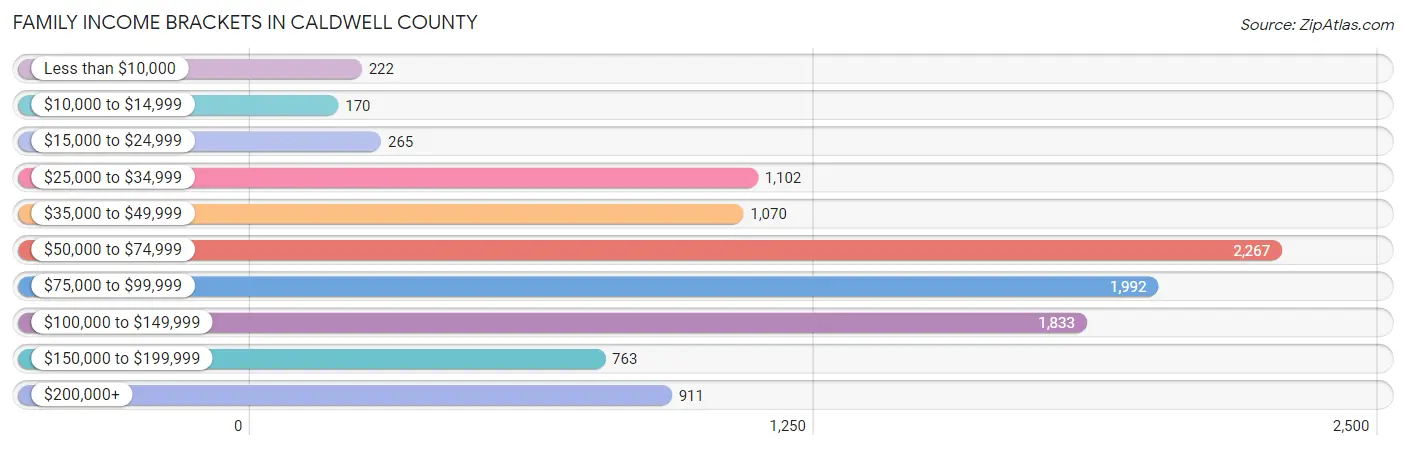
| Income Bracket | # Families | % Families |
| Less than $10,000 | 222 | 2.1% |
| $10,000 to $14,999 | 170 | 1.6% |
| $15,000 to $24,999 | 265 | 2.5% |
| $25,000 to $34,999 | 1,102 | 10.4% |
| $35,000 to $49,999 | 1,070 | 10.1% |
| $50,000 to $74,999 | 2,267 | 21.4% |
| $75,000 to $99,999 | 1,992 | 18.8% |
| $100,000 to $149,999 | 1,833 | 17.3% |
| $150,000 to $199,999 | 763 | 7.2% |
| $200,000+ | 911 | 8.6% |
Family Income by Famaliy Size in Caldwell County
7+ person families (480 | 4.5%) account for the highest median family income in Caldwell County with $143,542 per family, while 2-person families (4,761 | 44.9%) have the highest median income of $32,045 per family member.
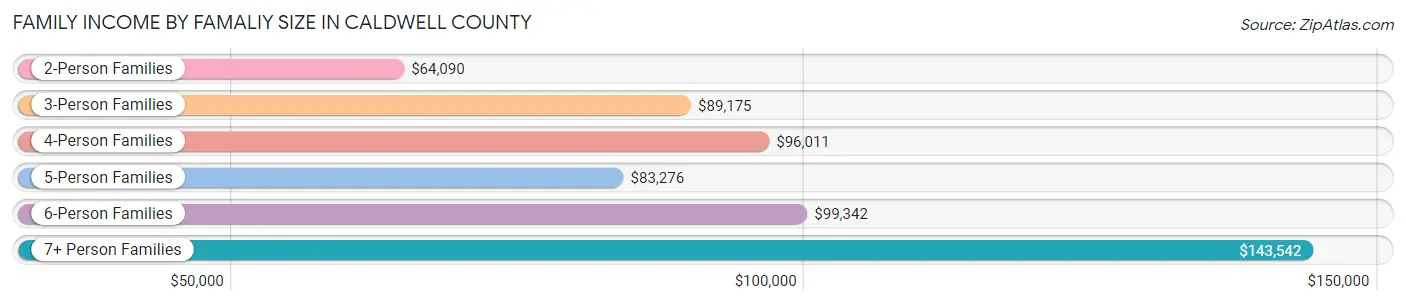
| Income Bracket | # Families | Median Income |
| 2-Person Families | 4,761 (44.9%) | $64,090 |
| 3-Person Families | 2,098 (19.8%) | $89,175 |
| 4-Person Families | 1,684 (15.9%) | $96,011 |
| 5-Person Families | 1,052 (9.9%) | $83,276 |
| 6-Person Families | 520 (4.9%) | $99,342 |
| 7+ Person Families | 480 (4.5%) | $143,542 |
| Total | 10,595 (100.0%) | $76,740 |
Family Income by Number of Earners in Caldwell County
The median family income in Caldwell County is $76,740, with families comprising 3+ earners (1,271) having the highest median family income of $114,375, while families with no earners (1,356) have the lowest median family income of $44,938, accounting for 12.0% and 12.8% of families, respectively.
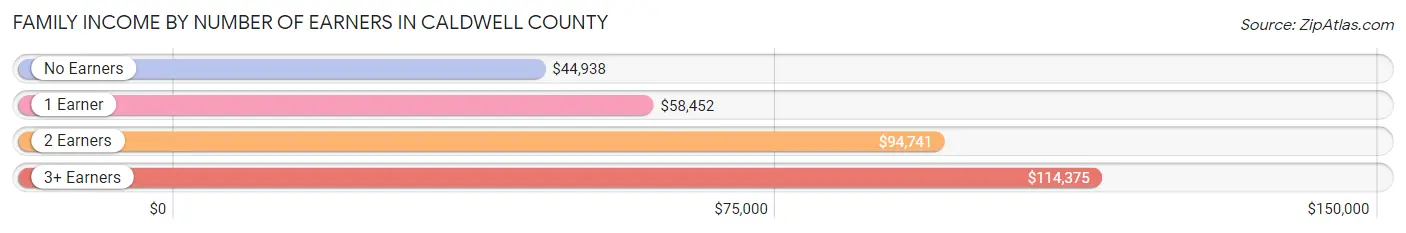
| Number of Earners | # Families | Median Income |
| No Earners | 1,356 (12.8%) | $44,938 |
| 1 Earner | 3,724 (35.1%) | $58,452 |
| 2 Earners | 4,244 (40.1%) | $94,741 |
| 3+ Earners | 1,271 (12.0%) | $114,375 |
| Total | 10,595 (100.0%) | $76,740 |
Household Income in Caldwell County
Household Income Brackets in Caldwell County
With 3,259 households falling in the category, the $50,000 to $74,999 income range is the most frequent in Caldwell County, accounting for 21.6% of all households. In contrast, only 362 households (2.4%) fall into the $10,000 to $14,999 income bracket, making it the least populous group.
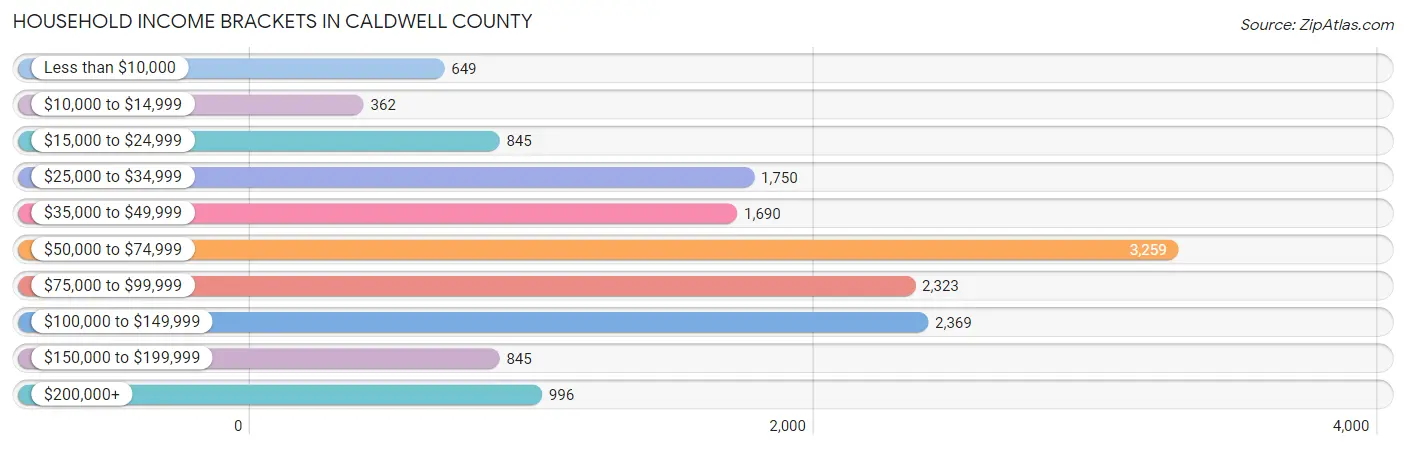
| Income Bracket | # Households | % Households |
| Less than $10,000 | 649 | 4.3% |
| $10,000 to $14,999 | 362 | 2.4% |
| $15,000 to $24,999 | 845 | 5.6% |
| $25,000 to $34,999 | 1,750 | 11.6% |
| $35,000 to $49,999 | 1,690 | 11.2% |
| $50,000 to $74,999 | 3,259 | 21.6% |
| $75,000 to $99,999 | 2,323 | 15.4% |
| $100,000 to $149,999 | 2,369 | 15.7% |
| $150,000 to $199,999 | 845 | 5.6% |
| $200,000+ | 996 | 6.6% |
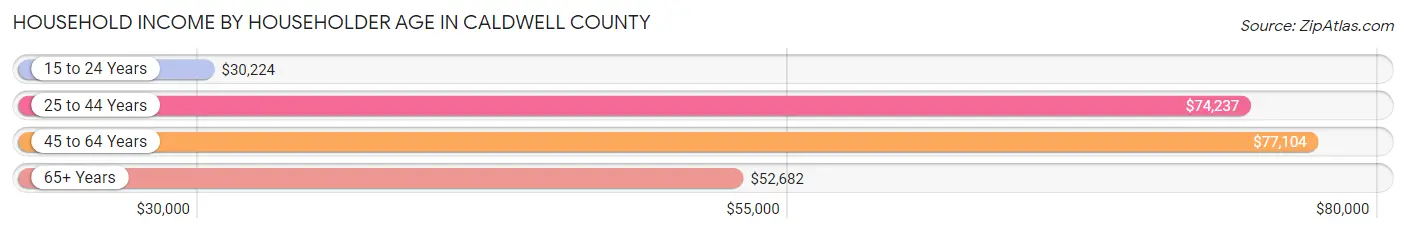
Household Income by Householder Age in Caldwell County
The median household income in Caldwell County is $66,779, with the highest median household income of $77,104 found in the 45 to 64 years age bracket for the primary householder. A total of 5,740 households (38.1%) fall into this category. Meanwhile, the 15 to 24 years age bracket for the primary householder has the lowest median household income of $30,224, with 469 households (3.1%) in this group.
| Income Bracket | # Households | Median Income |
| 15 to 24 Years | 469 (3.1%) | $30,224 |
| 25 to 44 Years | 4,767 (31.6%) | $74,237 |
| 45 to 64 Years | 5,740 (38.1%) | $77,104 |
| 65+ Years | 4,111 (27.3%) | $52,682 |
| Total | 15,087 (100.0%) | $66,779 |
Poverty in Caldwell County
Income Below Poverty by Sex and Age in Caldwell County
With 14.6% poverty level for males and 13.4% for females among the residents of Caldwell County, 16 and 17 year old males and 5 year old females are the most vulnerable to poverty, with 337 males (45.0%) and 49 females (27.1%) in their respective age groups living below the poverty level.
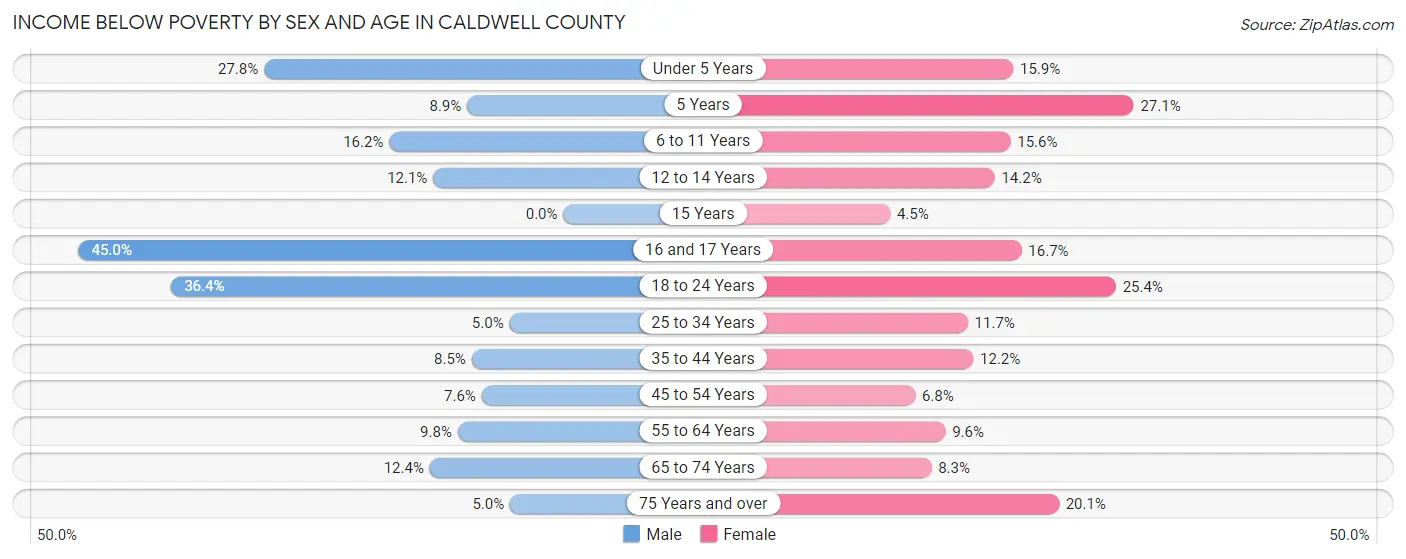
| Age Bracket | Male | Female |
| Under 5 Years | 382 (27.8%) | 217 (15.9%) |
| 5 Years | 30 (8.9%) | 49 (27.1%) |
| 6 to 11 Years | 216 (16.2%) | 291 (15.6%) |
| 12 to 14 Years | 130 (12.1%) | 125 (14.2%) |
| 15 Years | 0 (0.0%) | 8 (4.5%) |
| 16 and 17 Years | 337 (45.0%) | 116 (16.7%) |
| 18 to 24 Years | 980 (36.4%) | 532 (25.4%) |
| 25 to 34 Years | 156 (5.0%) | 292 (11.7%) |
| 35 to 44 Years | 247 (8.5%) | 318 (12.2%) |
| 45 to 54 Years | 205 (7.6%) | 181 (6.8%) |
| 55 to 64 Years | 281 (9.8%) | 267 (9.6%) |
| 65 to 74 Years | 245 (12.4%) | 174 (8.3%) |
| 75 Years and over | 49 (5.0%) | 316 (20.1%) |
| Total | 3,258 (14.6%) | 2,886 (13.4%) |
Income Above Poverty by Sex and Age in Caldwell County
According to the poverty statistics in Caldwell County, males aged 15 years and females aged 15 years are the age groups that are most secure financially, with 100.0% of males and 95.5% of females in these age groups living above the poverty line.
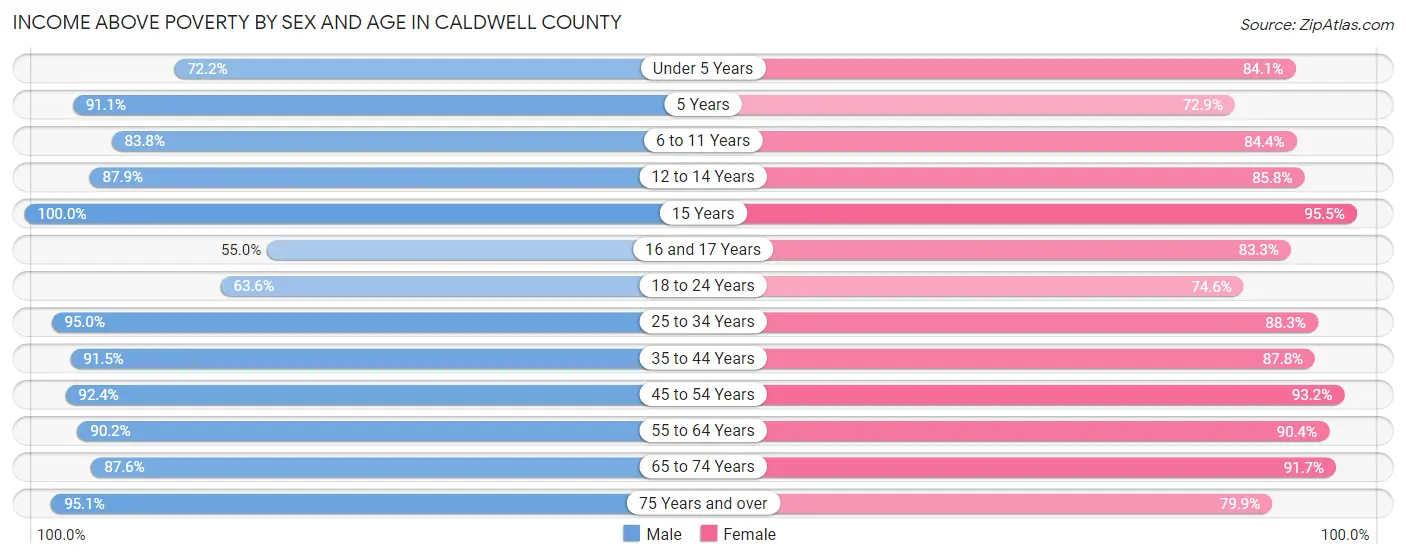
| Age Bracket | Male | Female |
| Under 5 Years | 993 (72.2%) | 1,149 (84.1%) |
| 5 Years | 306 (91.1%) | 132 (72.9%) |
| 6 to 11 Years | 1,121 (83.8%) | 1,570 (84.4%) |
| 12 to 14 Years | 946 (87.9%) | 757 (85.8%) |
| 15 Years | 233 (100.0%) | 171 (95.5%) |
| 16 and 17 Years | 412 (55.0%) | 580 (83.3%) |
| 18 to 24 Years | 1,713 (63.6%) | 1,561 (74.6%) |
| 25 to 34 Years | 2,966 (95.0%) | 2,208 (88.3%) |
| 35 to 44 Years | 2,657 (91.5%) | 2,291 (87.8%) |
| 45 to 54 Years | 2,499 (92.4%) | 2,486 (93.2%) |
| 55 to 64 Years | 2,586 (90.2%) | 2,514 (90.4%) |
| 65 to 74 Years | 1,731 (87.6%) | 1,923 (91.7%) |
| 75 Years and over | 941 (95.1%) | 1,254 (79.9%) |
| Total | 19,104 (85.4%) | 18,596 (86.6%) |
Income Below Poverty Among Married-Couple Families in Caldwell County
The poverty statistics for married-couple families in Caldwell County show that 4.5% or 360 of the total 7,907 families live below the poverty line. Families with 3 or 4 children have the highest poverty rate of 16.0%, comprising of 118 families. On the other hand, families with no children have the lowest poverty rate of 1.4%, which includes 57 families.
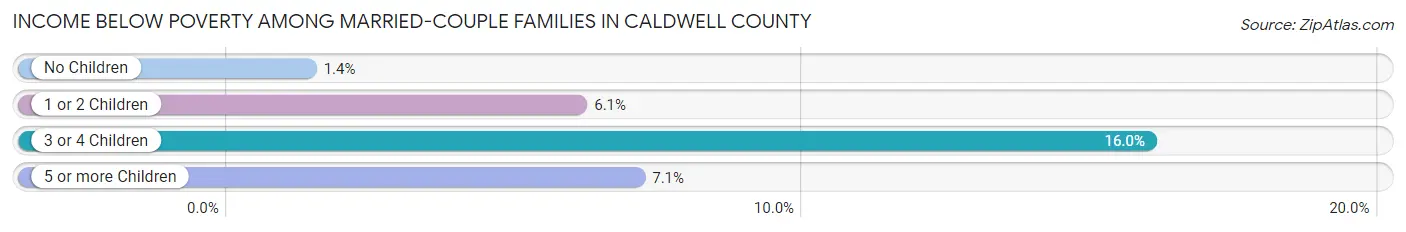
| Children | Above Poverty | Below Poverty |
| No Children | 4,091 (98.6%) | 57 (1.4%) |
| 1 or 2 Children | 2,718 (93.9%) | 176 (6.1%) |
| 3 or 4 Children | 620 (84.0%) | 118 (16.0%) |
| 5 or more Children | 118 (92.9%) | 9 (7.1%) |
| Total | 7,547 (95.5%) | 360 (4.5%) |
Income Below Poverty Among Single-Parent Households in Caldwell County
According to the poverty data in Caldwell County, 1.4% or 9 single-father households and 20.0% or 407 single-mother households are living below the poverty line. Among single-father households, those with 3 or 4 children have the highest poverty rate, with 7 households (21.9%) experiencing poverty. Likewise, among single-mother households, those with 3 or 4 children have the highest poverty rate, with 120 households (35.4%) falling below the poverty line.
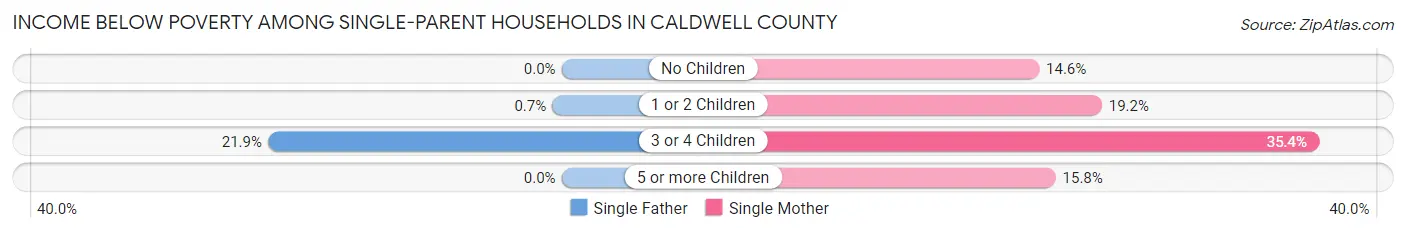
| Children | Single Father | Single Mother |
| No Children | 0 (0.0%) | 121 (14.6%) |
| 1 or 2 Children | 2 (0.7%) | 160 (19.2%) |
| 3 or 4 Children | 7 (21.9%) | 120 (35.4%) |
| 5 or more Children | 0 (0.0%) | 6 (15.8%) |
| Total | 9 (1.4%) | 407 (20.0%) |
Income Below Poverty Among Married-Couple vs Single-Parent Households in Caldwell County
The poverty data for Caldwell County shows that 360 of the married-couple family households (4.5%) and 416 of the single-parent households (15.5%) are living below the poverty level. Within the married-couple family households, those with 3 or 4 children have the highest poverty rate, with 118 households (16.0%) falling below the poverty line. Among the single-parent households, those with 3 or 4 children have the highest poverty rate, with 127 household (34.2%) living below poverty.
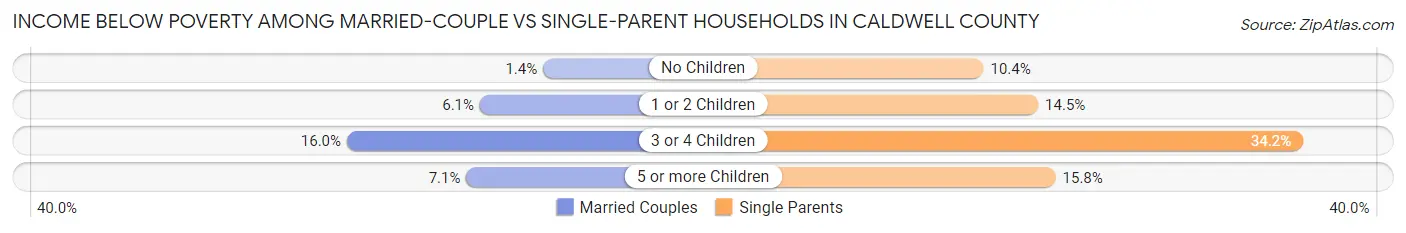
| Children | Married-Couple Families | Single-Parent Households |
| No Children | 57 (1.4%) | 121 (10.4%) |
| 1 or 2 Children | 176 (6.1%) | 162 (14.5%) |
| 3 or 4 Children | 118 (16.0%) | 127 (34.2%) |
| 5 or more Children | 9 (7.1%) | 6 (15.8%) |
| Total | 360 (4.5%) | 416 (15.5%) |
Race in Caldwell County
The most populous races in Caldwell County are White / Caucasian (30,055 | 65.1%), Hispanic or Latino (25,412 | 55.1%), and Two or more Races (9,672 | 21.0%).
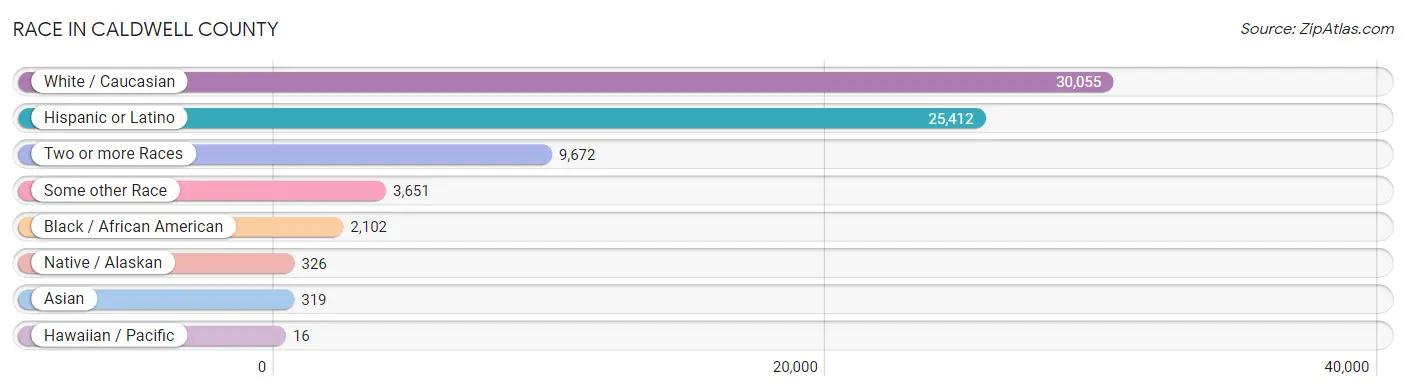
| Race | # Population | % Population |
| Asian | 319 | 0.7% |
| Black / African American | 2,102 | 4.6% |
| Hawaiian / Pacific | 16 | 0.0% |
| Hispanic or Latino | 25,412 | 55.1% |
| Native / Alaskan | 326 | 0.7% |
| White / Caucasian | 30,055 | 65.1% |
| Two or more Races | 9,672 | 21.0% |
| Some other Race | 3,651 | 7.9% |
| Total | 46,141 | 100.0% |
Ancestry in Caldwell County
The most populous ancestries reported in Caldwell County are Mexican (22,878 | 49.6%), German (4,748 | 10.3%), Irish (2,529 | 5.5%), American (2,259 | 4.9%), and English (2,191 | 4.8%), together accounting for 75.0% of all Caldwell County residents.
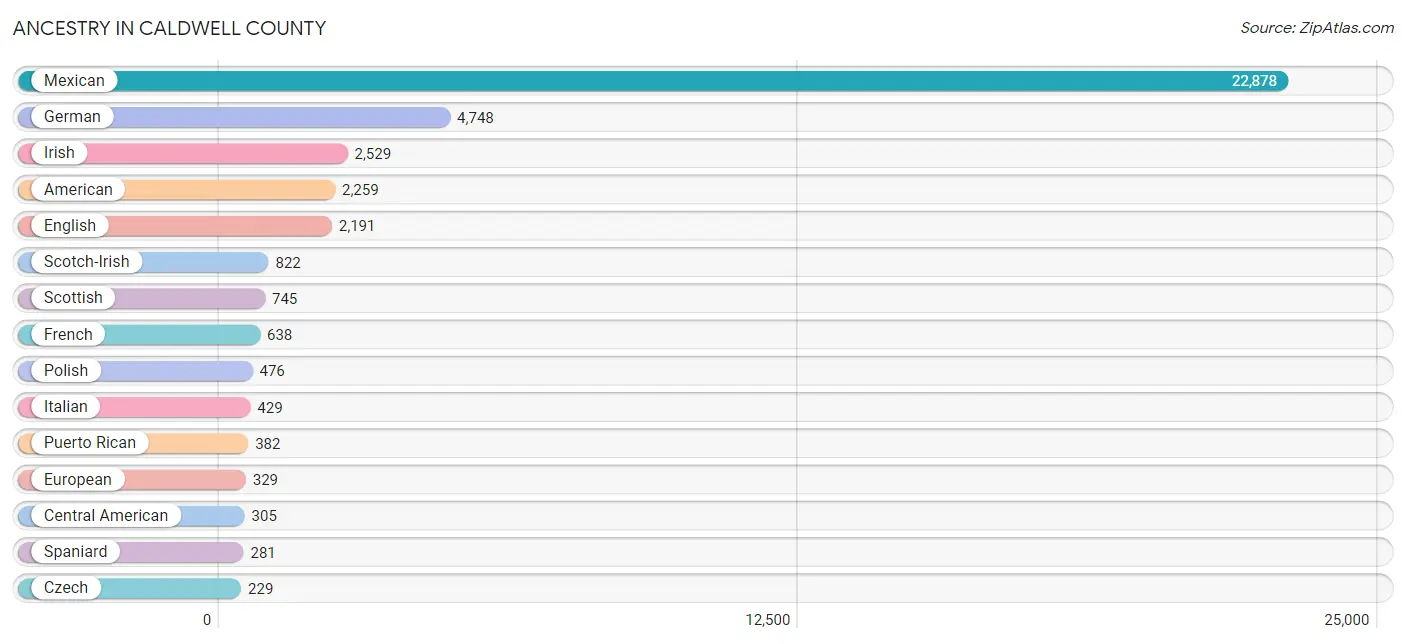
| Ancestry | # Population | % Population |
| African | 48 | 0.1% |
| Alsatian | 19 | 0.0% |
| American | 2,259 | 4.9% |
| Arab | 78 | 0.2% |
| Australian | 23 | 0.1% |
| Austrian | 33 | 0.1% |
| Bhutanese | 77 | 0.2% |
| Blackfeet | 186 | 0.4% |
| British | 150 | 0.3% |
| Burmese | 9 | 0.0% |
| Cajun | 51 | 0.1% |
| Canadian | 25 | 0.1% |
| Central American | 305 | 0.7% |
| Cherokee | 117 | 0.3% |
| Choctaw | 1 | 0.0% |
| Colombian | 117 | 0.3% |
| Comanche | 9 | 0.0% |
| Cuban | 46 | 0.1% |
| Czech | 229 | 0.5% |
| Danish | 20 | 0.0% |
| Dutch | 217 | 0.5% |
| Dutch West Indian | 22 | 0.1% |
| Eastern European | 70 | 0.2% |
| Egyptian | 33 | 0.1% |
| English | 2,191 | 4.8% |
| European | 329 | 0.7% |
| Finnish | 16 | 0.0% |
| French | 638 | 1.4% |
| French Canadian | 38 | 0.1% |
| German | 4,748 | 10.3% |
| Greek | 33 | 0.1% |
| Honduran | 109 | 0.2% |
| Hungarian | 65 | 0.1% |
| Indian (Asian) | 102 | 0.2% |
| Iranian | 9 | 0.0% |
| Irish | 2,529 | 5.5% |
| Iroquois | 34 | 0.1% |
| Italian | 429 | 0.9% |
| Jordanian | 29 | 0.1% |
| Korean | 167 | 0.4% |
| Lithuanian | 21 | 0.1% |
| Malaysian | 34 | 0.1% |
| Mexican | 22,878 | 49.6% |
| Mexican American Indian | 109 | 0.2% |
| Native Hawaiian | 45 | 0.1% |
| Nicaraguan | 31 | 0.1% |
| Northern European | 21 | 0.1% |
| Norwegian | 166 | 0.4% |
| Panamanian | 79 | 0.2% |
| Pennsylvania German | 54 | 0.1% |
| Pima | 15 | 0.0% |
| Polish | 476 | 1.0% |
| Portuguese | 80 | 0.2% |
| Puerto Rican | 382 | 0.8% |
| Russian | 39 | 0.1% |
| Salvadoran | 86 | 0.2% |
| Scandinavian | 136 | 0.3% |
| Scotch-Irish | 822 | 1.8% |
| Scottish | 745 | 1.6% |
| Serbian | 41 | 0.1% |
| South American | 117 | 0.3% |
| Spaniard | 281 | 0.6% |
| Spanish | 87 | 0.2% |
| Subsaharan African | 55 | 0.1% |
| Swedish | 199 | 0.4% |
| Swiss | 23 | 0.1% |
| Thai | 61 | 0.1% |
| Turkish | 6 | 0.0% |
| Ukrainian | 26 | 0.1% |
| Welsh | 97 | 0.2% | View All 70 Rows |
Immigrants in Caldwell County
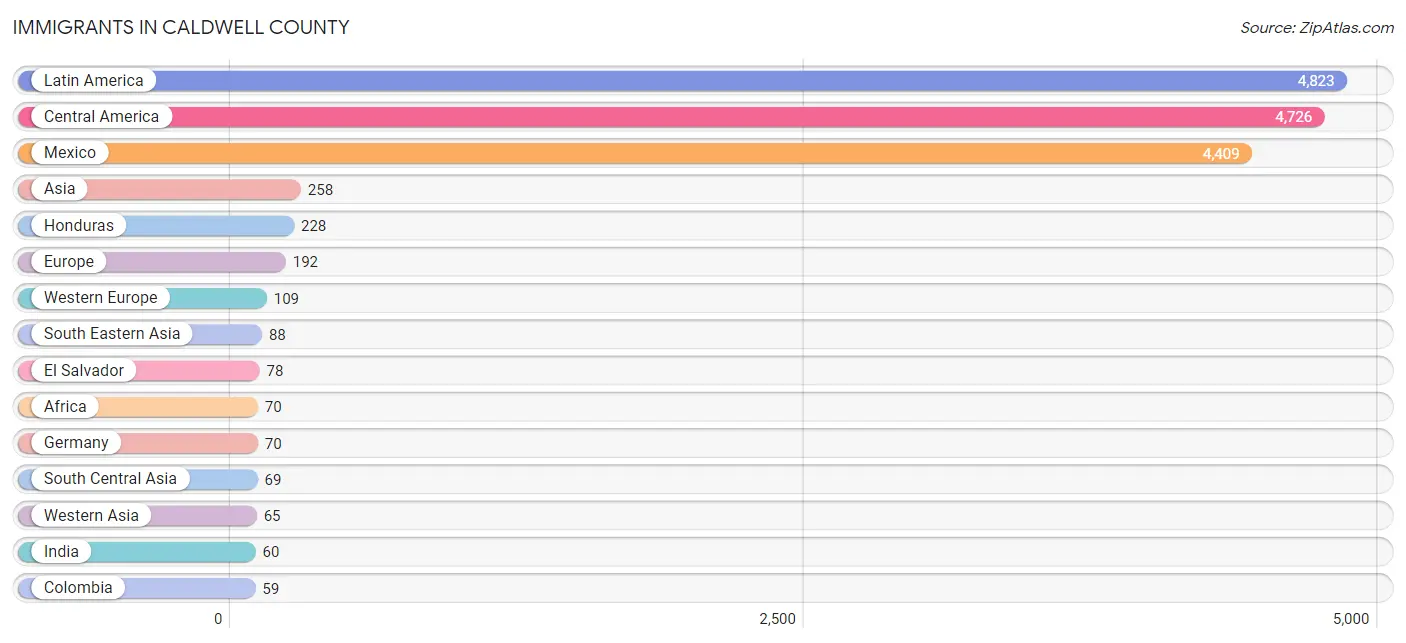
The most numerous immigrant groups reported in Caldwell County came from Latin America (4,823 | 10.4%), Central America (4,726 | 10.2%), Mexico (4,409 | 9.6%), Asia (258 | 0.6%), and Honduras (228 | 0.5%), together accounting for 31.3% of all Caldwell County residents.
| Immigration Origin | # Population | % Population |
| Africa | 70 | 0.2% |
| Asia | 258 | 0.6% |
| Cameroon | 7 | 0.0% |
| Canada | 24 | 0.1% |
| Caribbean | 38 | 0.1% |
| Central America | 4,726 | 10.2% |
| China | 36 | 0.1% |
| Colombia | 59 | 0.1% |
| Cuba | 34 | 0.1% |
| Dominican Republic | 4 | 0.0% |
| Eastern Africa | 30 | 0.1% |
| Eastern Asia | 36 | 0.1% |
| Eastern Europe | 34 | 0.1% |
| Egypt | 33 | 0.1% |
| El Salvador | 78 | 0.2% |
| England | 24 | 0.1% |
| Europe | 192 | 0.4% |
| Germany | 70 | 0.2% |
| Honduras | 228 | 0.5% |
| Hungary | 10 | 0.0% |
| India | 60 | 0.1% |
| Iran | 9 | 0.0% |
| Ireland | 25 | 0.1% |
| Jordan | 29 | 0.1% |
| Laos | 31 | 0.1% |
| Latin America | 4,823 | 10.4% |
| Mexico | 4,409 | 9.6% |
| Middle Africa | 7 | 0.0% |
| Netherlands | 39 | 0.1% |
| Nicaragua | 11 | 0.0% |
| Northern Africa | 33 | 0.1% |
| Northern Europe | 49 | 0.1% |
| Oceania | 20 | 0.0% |
| Philippines | 57 | 0.1% |
| Poland | 4 | 0.0% |
| Serbia | 5 | 0.0% |
| South America | 59 | 0.1% |
| South Central Asia | 69 | 0.2% |
| South Eastern Asia | 88 | 0.2% |
| Turkey | 36 | 0.1% |
| Uganda | 30 | 0.1% |
| Western Asia | 65 | 0.1% |
| Western Europe | 109 | 0.2% | View All 43 Rows |
Sex and Age in Caldwell County
Sex and Age in Caldwell County
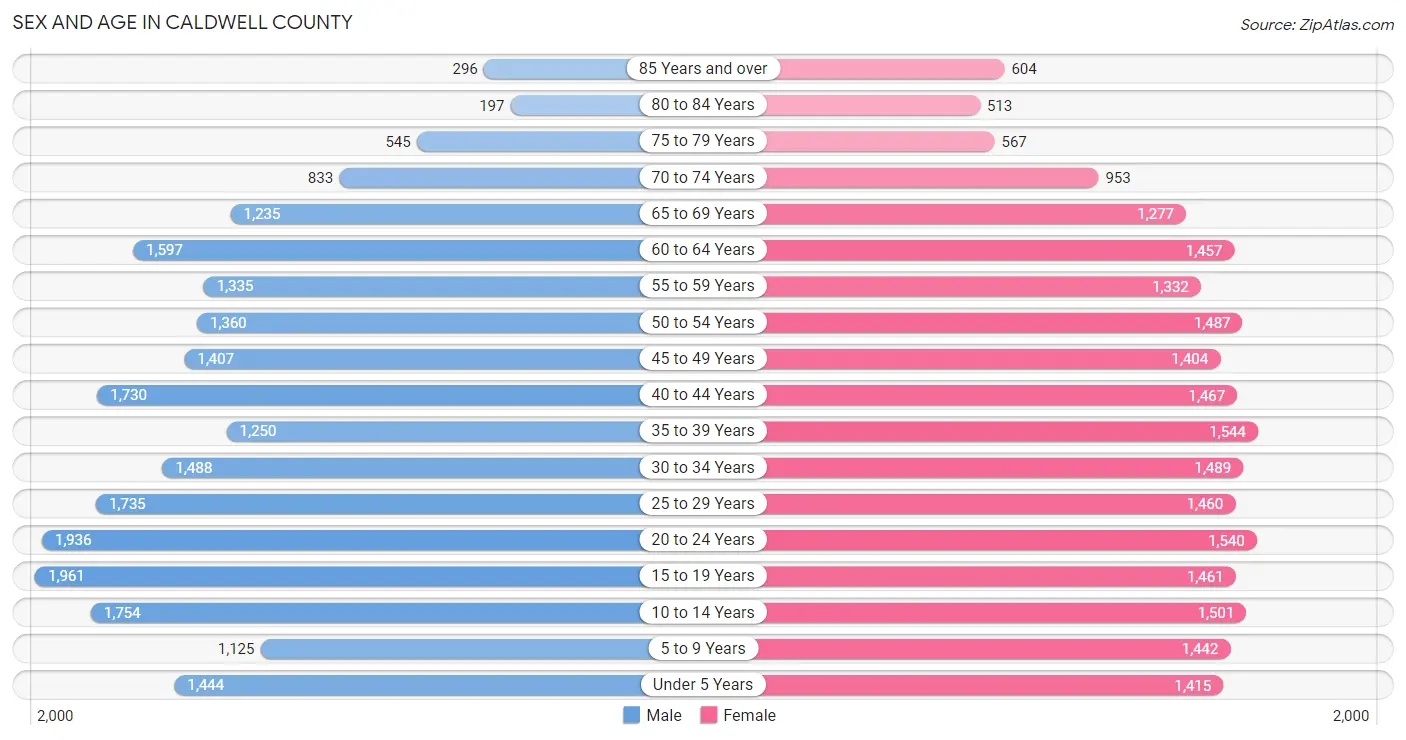
The most populous age groups in Caldwell County are 15 to 19 Years (1,961 | 8.4%) for men and 35 to 39 Years (1,544 | 6.7%) for women.
| Age Bracket | Male | Female |
| Under 5 Years | 1,444 (6.2%) | 1,415 (6.2%) |
| 5 to 9 Years | 1,125 (4.8%) | 1,442 (6.3%) |
| 10 to 14 Years | 1,754 (7.5%) | 1,501 (6.6%) |
| 15 to 19 Years | 1,961 (8.4%) | 1,461 (6.4%) |
| 20 to 24 Years | 1,936 (8.3%) | 1,540 (6.7%) |
| 25 to 29 Years | 1,735 (7.5%) | 1,460 (6.4%) |
| 30 to 34 Years | 1,488 (6.4%) | 1,489 (6.5%) |
| 35 to 39 Years | 1,250 (5.4%) | 1,544 (6.7%) |
| 40 to 44 Years | 1,730 (7.4%) | 1,467 (6.4%) |
| 45 to 49 Years | 1,407 (6.1%) | 1,404 (6.1%) |
| 50 to 54 Years | 1,360 (5.9%) | 1,487 (6.5%) |
| 55 to 59 Years | 1,335 (5.8%) | 1,332 (5.8%) |
| 60 to 64 Years | 1,597 (6.9%) | 1,457 (6.4%) |
| 65 to 69 Years | 1,235 (5.3%) | 1,277 (5.6%) |
| 70 to 74 Years | 833 (3.6%) | 953 (4.2%) |
| 75 to 79 Years | 545 (2.4%) | 567 (2.5%) |
| 80 to 84 Years | 197 (0.9%) | 513 (2.2%) |
| 85 Years and over | 296 (1.3%) | 604 (2.6%) |
| Total | 23,228 (100.0%) | 22,913 (100.0%) |
Families and Households in Caldwell County
Median Family Size in Caldwell County
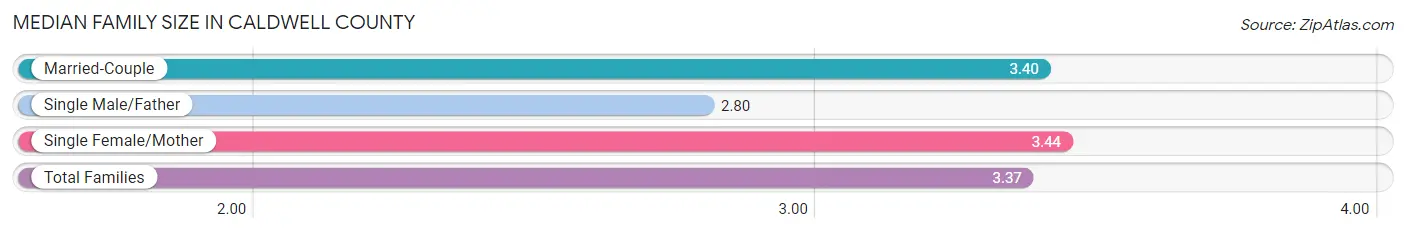
The median family size in Caldwell County is 3.37 persons per family, with single female/mother families (2,040 | 19.3%) accounting for the largest median family size of 3.44 persons per family. On the other hand, single male/father families (648 | 6.1%) represent the smallest median family size with 2.80 persons per family.
| Family Type | # Families | Family Size |
| Married-Couple | 7,907 (74.6%) | 3.40 |
| Single Male/Father | 648 (6.1%) | 2.80 |
| Single Female/Mother | 2,040 (19.3%) | 3.44 |
| Total Families | 10,595 (100.0%) | 3.37 |
Median Household Size in Caldwell County
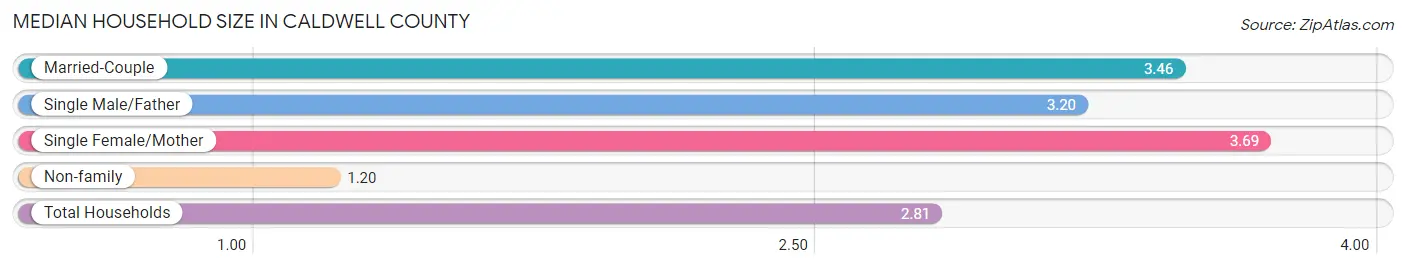
The median household size in Caldwell County is 2.81 persons per household, with single female/mother households (2,040 | 13.5%) accounting for the largest median household size of 3.69 persons per household. non-family households (4,492 | 29.8%) represent the smallest median household size with 1.20 persons per household.
| Household Type | # Households | Household Size |
| Married-Couple | 7,907 (52.4%) | 3.46 |
| Single Male/Father | 648 (4.3%) | 3.20 |
| Single Female/Mother | 2,040 (13.5%) | 3.69 |
| Non-family | 4,492 (29.8%) | 1.20 |
| Total Households | 15,087 (100.0%) | 2.81 |
Household Size by Marriage Status in Caldwell County
Out of a total of 15,087 households in Caldwell County, 10,595 (70.2%) are family households, while 4,492 (29.8%) are nonfamily households. The most numerous type of family households are 2-person households, comprising 4,448, and the most common type of nonfamily households are 1-person households, comprising 3,657.
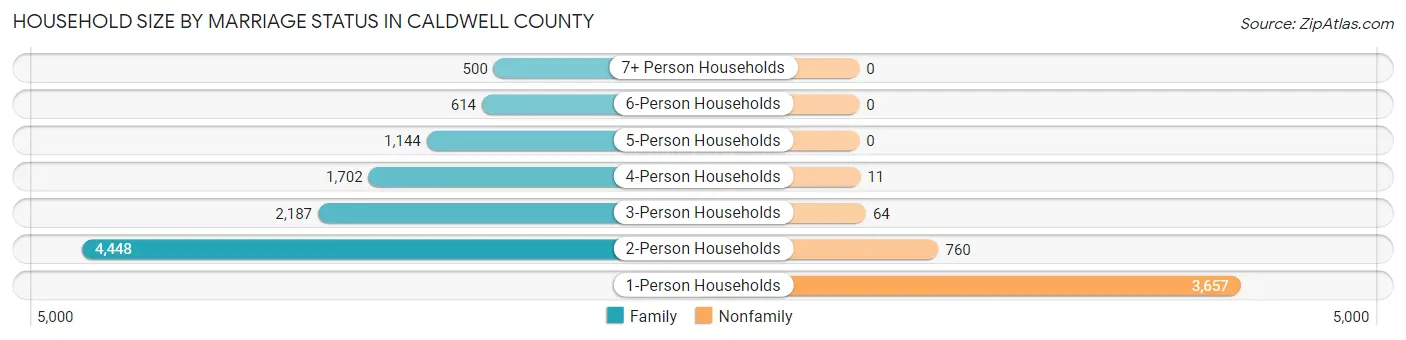
| Household Size | Family Households | Nonfamily Households |
| 1-Person Households | - | 3,657 (24.2%) |
| 2-Person Households | 4,448 (29.5%) | 760 (5.0%) |
| 3-Person Households | 2,187 (14.5%) | 64 (0.4%) |
| 4-Person Households | 1,702 (11.3%) | 11 (0.1%) |
| 5-Person Households | 1,144 (7.6%) | 0 (0.0%) |
| 6-Person Households | 614 (4.1%) | 0 (0.0%) |
| 7+ Person Households | 500 (3.3%) | 0 (0.0%) |
| Total | 10,595 (70.2%) | 4,492 (29.8%) |
Female Fertility in Caldwell County
Fertility by Age in Caldwell County
Average fertility rate in Caldwell County is 56.0 births per 1,000 women. Women in the age bracket of 20 to 34 years have the highest fertility rate with 115.0 births per 1,000 women. Women in the age bracket of 20 to 34 years acount for 85.1% of all women with births.
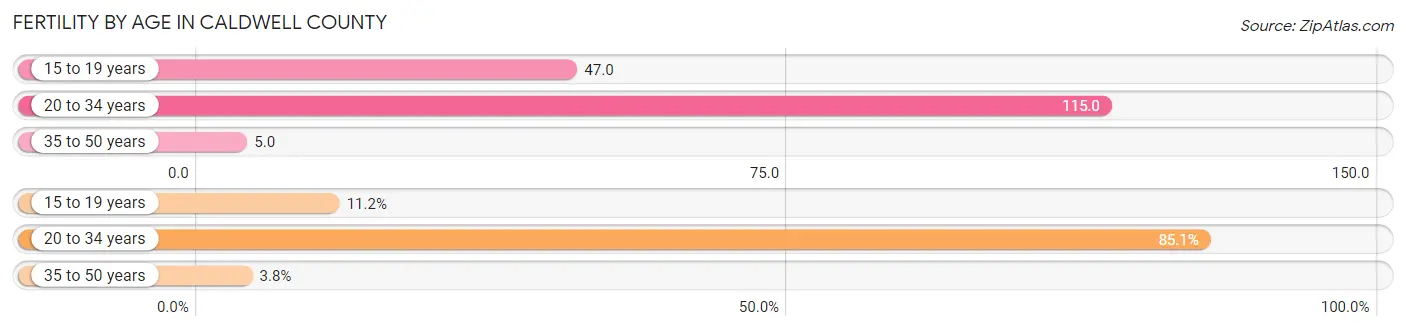
| Age Bracket | Women with Births | Births / 1,000 Women |
| 15 to 19 years | 68 (11.2%) | 47.0 |
| 20 to 34 years | 518 (85.1%) | 115.0 |
| 35 to 50 years | 23 (3.8%) | 5.0 |
| Total | 609 (100.0%) | 56.0 |
Fertility by Age by Marriage Status in Caldwell County
54.4% of women with births (609) in Caldwell County are married. The highest percentage of unmarried women with births falls into 15 to 19 years age bracket with 100.0% of them unmarried at the time of birth, while the lowest percentage of unmarried women with births belong to 35 to 50 years age bracket with 0.0% of them unmarried.
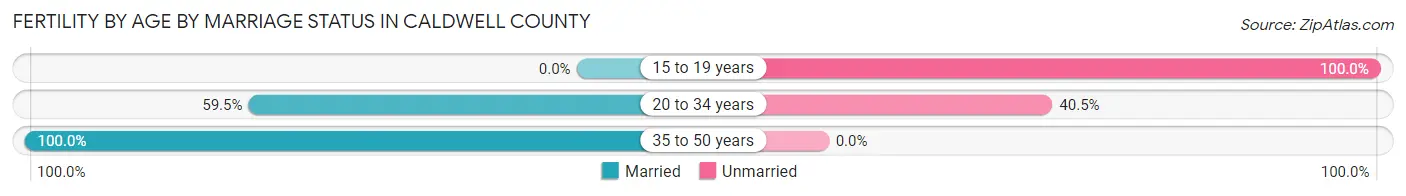
| Age Bracket | Married | Unmarried |
| 15 to 19 years | 0 (0.0%) | 68 (100.0%) |
| 20 to 34 years | 308 (59.5%) | 210 (40.5%) |
| 35 to 50 years | 23 (100.0%) | 0 (0.0%) |
| Total | 331 (54.3%) | 278 (45.7%) |
Fertility by Education in Caldwell County
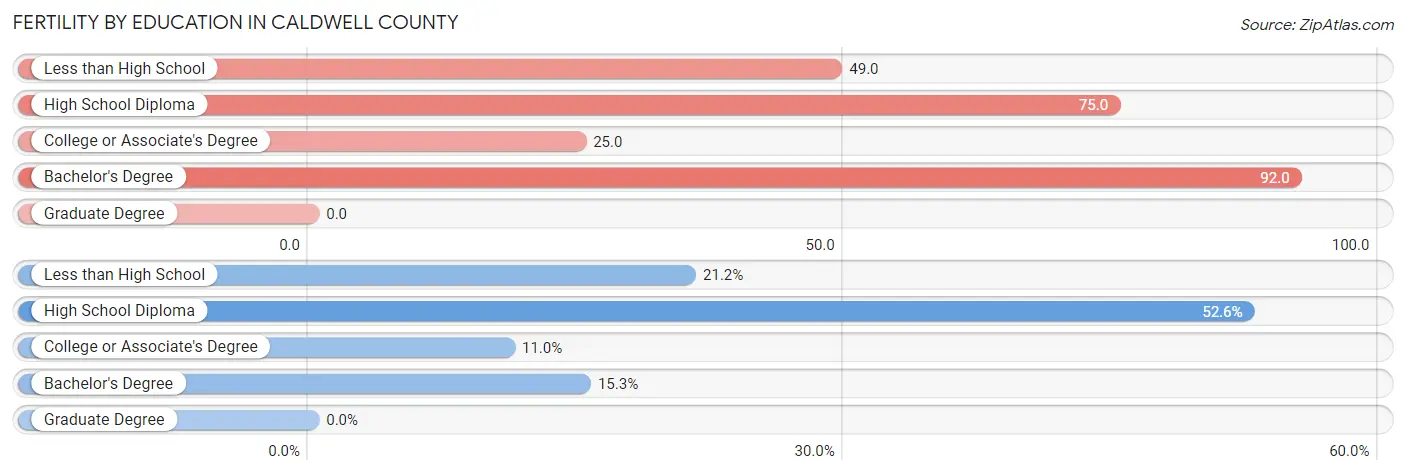
| Educational Attainment | Women with Births | Births / 1,000 Women |
| Less than High School | 129 (21.2%) | 49.0 |
| High School Diploma | 320 (52.5%) | 75.0 |
| College or Associate's Degree | 67 (11.0%) | 25.0 |
| Bachelor's Degree | 93 (15.3%) | 92.0 |
| Graduate Degree | 0 (0.0%) | 0.0 |
| Total | 609 (100.0%) | 56.0 |
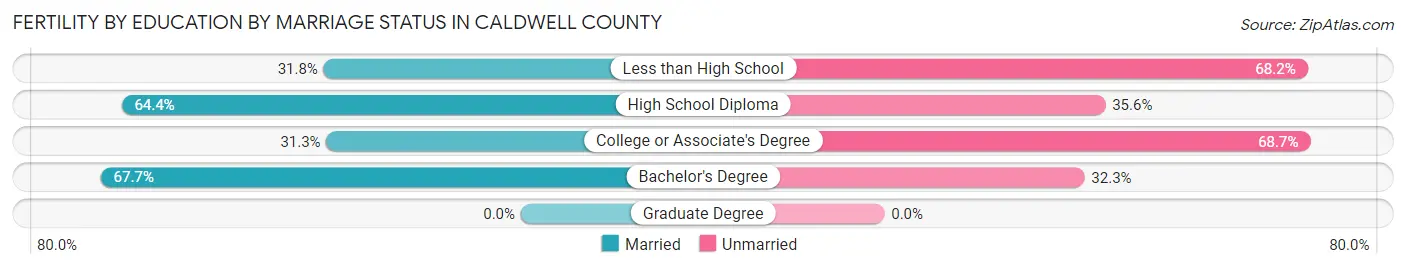
Fertility by Education by Marriage Status in Caldwell County
45.7% of women with births in Caldwell County are unmarried. Women with the educational attainment of bachelor's degree are most likely to be married with 67.7% of them married at childbirth, while women with the educational attainment of college or associate's degree are least likely to be married with 68.7% of them unmarried at childbirth.
| Educational Attainment | Married | Unmarried |
| Less than High School | 41 (31.8%) | 88 (68.2%) |
| High School Diploma | 206 (64.4%) | 114 (35.6%) |
| College or Associate's Degree | 21 (31.3%) | 46 (68.7%) |
| Bachelor's Degree | 63 (67.7%) | 30 (32.3%) |
| Graduate Degree | 0 (0.0%) | 0 (0.0%) |
| Total | 331 (54.3%) | 278 (45.7%) |
Employment Characteristics in Caldwell County
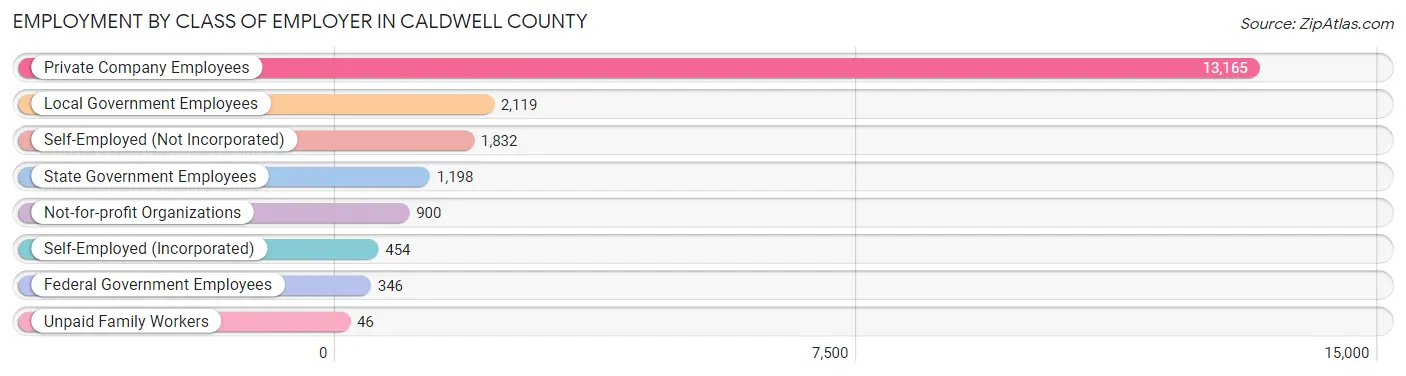
Employment by Class of Employer in Caldwell County
Among the 20,060 employed individuals in Caldwell County, private company employees (13,165 | 65.6%), local government employees (2,119 | 10.6%), and self-employed (not incorporated) (1,832 | 9.1%) make up the most common classes of employment.
| Employer Class | # Employees | % Employees |
| Private Company Employees | 13,165 | 65.6% |
| Self-Employed (Incorporated) | 454 | 2.3% |
| Self-Employed (Not Incorporated) | 1,832 | 9.1% |
| Not-for-profit Organizations | 900 | 4.5% |
| Local Government Employees | 2,119 | 10.6% |
| State Government Employees | 1,198 | 6.0% |
| Federal Government Employees | 346 | 1.7% |
| Unpaid Family Workers | 46 | 0.2% |
| Total | 20,060 | 100.0% |
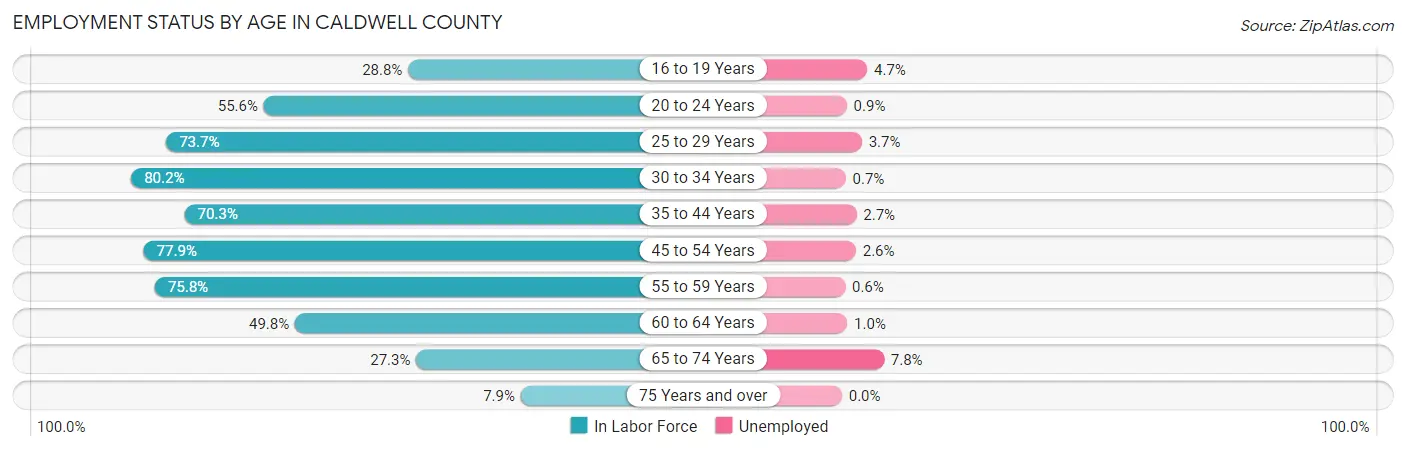
Employment Status by Age in Caldwell County
According to the labor force statistics for Caldwell County, out of the total population over 16 years of age (36,990), 57.0% or 21,084 individuals are in the labor force, with 2.4% or 506 of them unemployed. The age group with the highest labor force participation rate is 30 to 34 years, with 80.2% or 2,388 individuals in the labor force. Within the labor force, the 65 to 74 years age range has the highest percentage of unemployed individuals, with 7.8% or 91 of them being unemployed.
| Age Bracket | In Labor Force | Unemployed |
| 16 to 19 Years | 850 (28.8%) | 40 (4.7%) |
| 20 to 24 Years | 1,933 (55.6%) | 17 (0.9%) |
| 25 to 29 Years | 2,355 (73.7%) | 87 (3.7%) |
| 30 to 34 Years | 2,388 (80.2%) | 17 (0.7%) |
| 35 to 44 Years | 4,212 (70.3%) | 114 (2.7%) |
| 45 to 54 Years | 4,408 (77.9%) | 115 (2.6%) |
| 55 to 59 Years | 2,022 (75.8%) | 12 (0.6%) |
| 60 to 64 Years | 1,521 (49.8%) | 15 (1.0%) |
| 65 to 74 Years | 1,173 (27.3%) | 91 (7.8%) |
| 75 Years and over | 215 (7.9%) | 0 (0.0%) |
| Total | 21,084 (57.0%) | 506 (2.4%) |
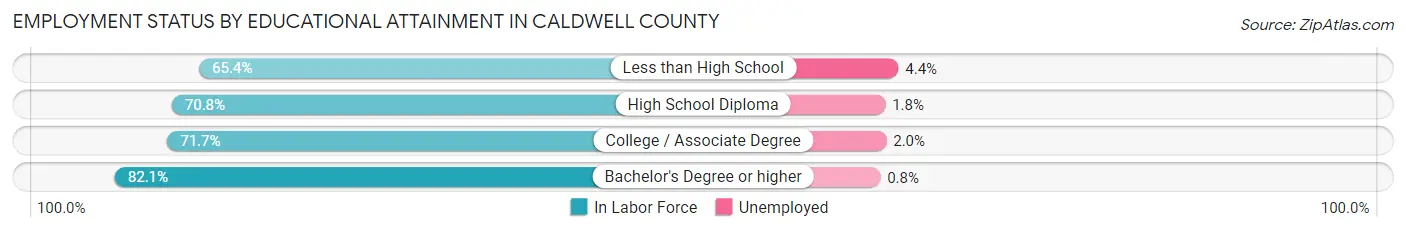
Employment Status by Educational Attainment in Caldwell County
According to labor force statistics for Caldwell County, 71.8% of individuals (16,903) out of the total population between 25 and 64 years of age (23,542) are in the labor force, with 2.1% or 355 of them being unemployed. The group with the highest labor force participation rate are those with the educational attainment of bachelor's degree or higher, with 82.1% or 3,165 individuals in the labor force. Within the labor force, individuals with less than high school education have the highest percentage of unemployment, with 4.4% or 135 of them being unemployed.
| Educational Attainment | In Labor Force | Unemployed |
| Less than High School | 3,073 (65.4%) | 207 (4.4%) |
| High School Diploma | 6,361 (70.8%) | 162 (1.8%) |
| College / Associate Degree | 4,305 (71.7%) | 120 (2.0%) |
| Bachelor's Degree or higher | 3,165 (82.1%) | 31 (0.8%) |
| Total | 16,903 (71.8%) | 494 (2.1%) |
Employment Occupations by Sex in Caldwell County
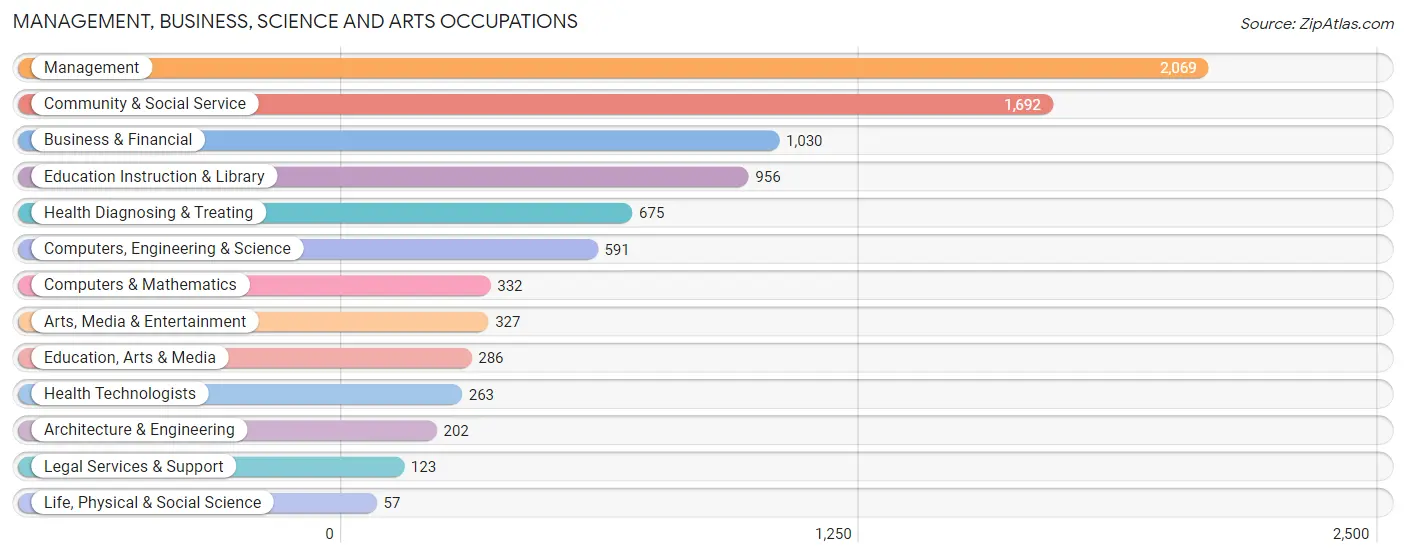
Management, Business, Science and Arts Occupations
The most common Management, Business, Science and Arts occupations in Caldwell County are Management (2,069 | 10.1%), Community & Social Service (1,692 | 8.2%), Business & Financial (1,030 | 5.0%), Education Instruction & Library (956 | 4.6%), and Health Diagnosing & Treating (675 | 3.3%).
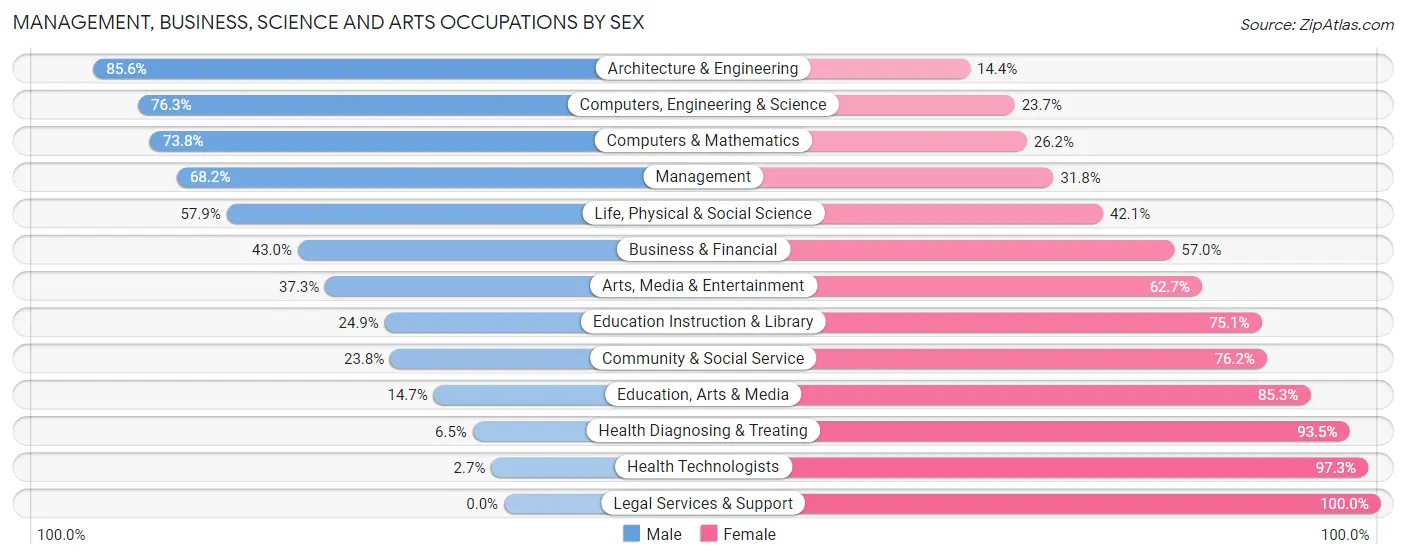
Management, Business, Science and Arts Occupations by Sex
Within the Management, Business, Science and Arts occupations in Caldwell County, the most male-oriented occupations are Architecture & Engineering (85.6%), Computers, Engineering & Science (76.3%), and Computers & Mathematics (73.8%), while the most female-oriented occupations are Legal Services & Support (100.0%), Health Technologists (97.3%), and Health Diagnosing & Treating (93.5%).
| Occupation | Male | Female |
| Management | 1,411 (68.2%) | 658 (31.8%) |
| Business & Financial | 443 (43.0%) | 587 (57.0%) |
| Computers, Engineering & Science | 451 (76.3%) | 140 (23.7%) |
| Computers & Mathematics | 245 (73.8%) | 87 (26.2%) |
| Architecture & Engineering | 173 (85.6%) | 29 (14.4%) |
| Life, Physical & Social Science | 33 (57.9%) | 24 (42.1%) |
| Community & Social Service | 402 (23.8%) | 1,290 (76.2%) |
| Education, Arts & Media | 42 (14.7%) | 244 (85.3%) |
| Legal Services & Support | 0 (0.0%) | 123 (100.0%) |
| Education Instruction & Library | 238 (24.9%) | 718 (75.1%) |
| Arts, Media & Entertainment | 122 (37.3%) | 205 (62.7%) |
| Health Diagnosing & Treating | 44 (6.5%) | 631 (93.5%) |
| Health Technologists | 7 (2.7%) | 256 (97.3%) |
| Total (Category) | 2,751 (45.4%) | 3,306 (54.6%) |
| Total (Overall) | 11,407 (55.5%) | 9,156 (44.5%) |
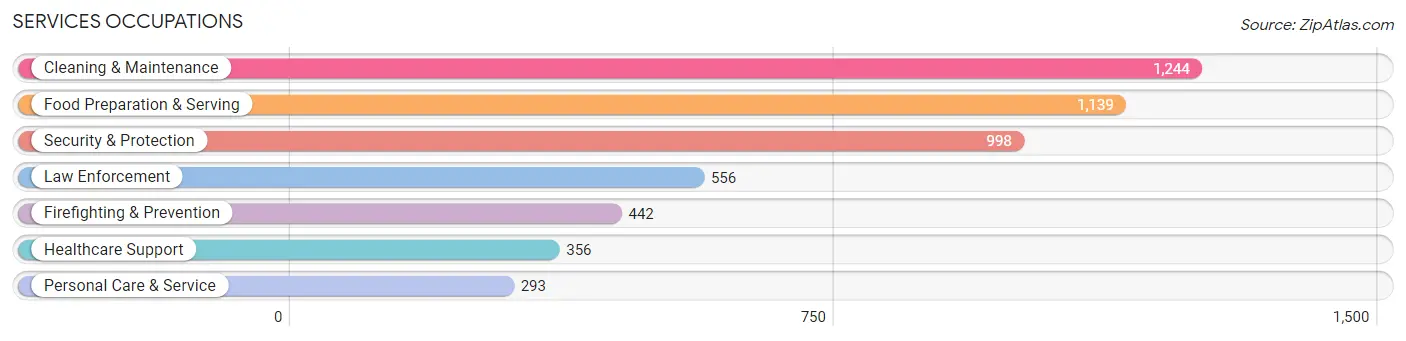
Services Occupations
The most common Services occupations in Caldwell County are Cleaning & Maintenance (1,244 | 6.0%), Food Preparation & Serving (1,139 | 5.5%), Security & Protection (998 | 4.9%), Law Enforcement (556 | 2.7%), and Firefighting & Prevention (442 | 2.1%).
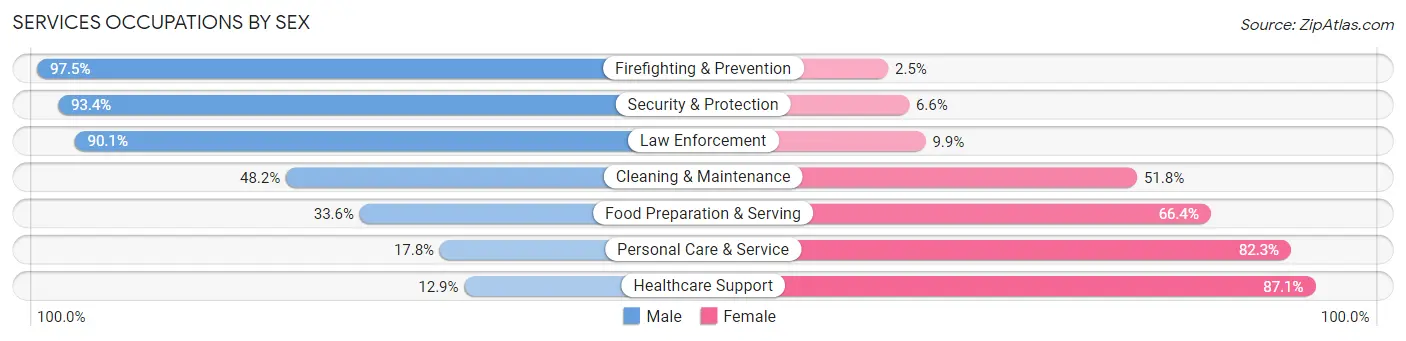
Services Occupations by Sex
Within the Services occupations in Caldwell County, the most male-oriented occupations are Firefighting & Prevention (97.5%), Security & Protection (93.4%), and Law Enforcement (90.1%), while the most female-oriented occupations are Healthcare Support (87.1%), Personal Care & Service (82.3%), and Food Preparation & Serving (66.4%).
| Occupation | Male | Female |
| Healthcare Support | 46 (12.9%) | 310 (87.1%) |
| Security & Protection | 932 (93.4%) | 66 (6.6%) |
| Firefighting & Prevention | 431 (97.5%) | 11 (2.5%) |
| Law Enforcement | 501 (90.1%) | 55 (9.9%) |
| Food Preparation & Serving | 383 (33.6%) | 756 (66.4%) |
| Cleaning & Maintenance | 600 (48.2%) | 644 (51.8%) |
| Personal Care & Service | 52 (17.7%) | 241 (82.3%) |
| Total (Category) | 2,013 (49.9%) | 2,017 (50.0%) |
| Total (Overall) | 11,407 (55.5%) | 9,156 (44.5%) |
Sales and Office Occupations
The most common Sales and Office occupations in Caldwell County are Office & Administration (2,510 | 12.2%), and Sales & Related (1,609 | 7.8%).

Sales and Office Occupations by Sex
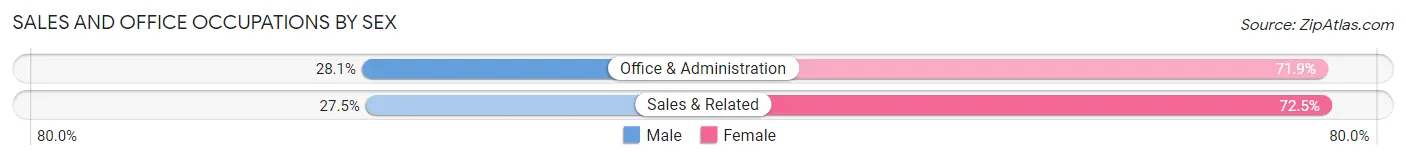
| Occupation | Male | Female |
| Sales & Related | 443 (27.5%) | 1,166 (72.5%) |
| Office & Administration | 706 (28.1%) | 1,804 (71.9%) |
| Total (Category) | 1,149 (27.9%) | 2,970 (72.1%) |
| Total (Overall) | 11,407 (55.5%) | 9,156 (44.5%) |
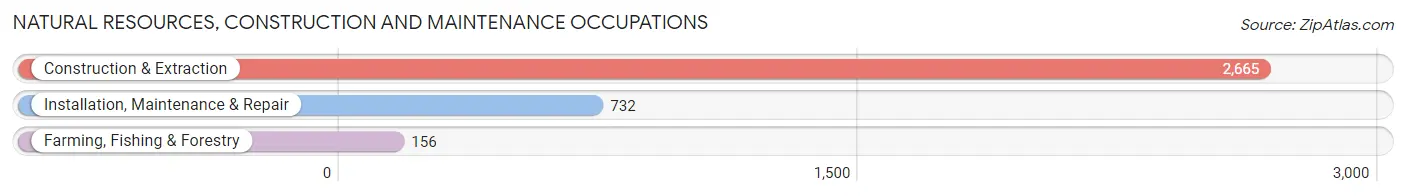
Natural Resources, Construction and Maintenance Occupations
The most common Natural Resources, Construction and Maintenance occupations in Caldwell County are Construction & Extraction (2,665 | 13.0%), Installation, Maintenance & Repair (732 | 3.6%), and Farming, Fishing & Forestry (156 | 0.8%).
Natural Resources, Construction and Maintenance Occupations by Sex
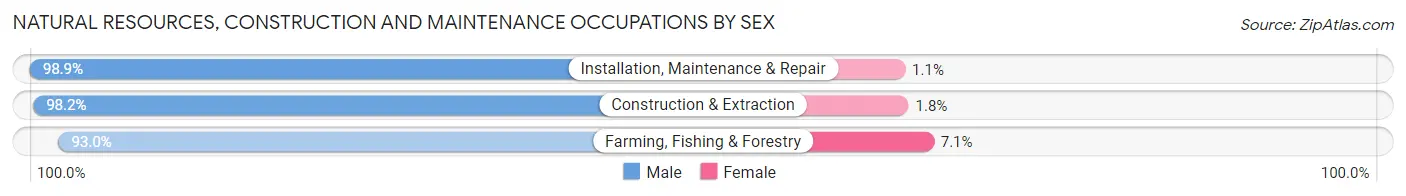
| Occupation | Male | Female |
| Farming, Fishing & Forestry | 145 (92.9%) | 11 (7.0%) |
| Construction & Extraction | 2,617 (98.2%) | 48 (1.8%) |
| Installation, Maintenance & Repair | 724 (98.9%) | 8 (1.1%) |
| Total (Category) | 3,486 (98.1%) | 67 (1.9%) |
| Total (Overall) | 11,407 (55.5%) | 9,156 (44.5%) |
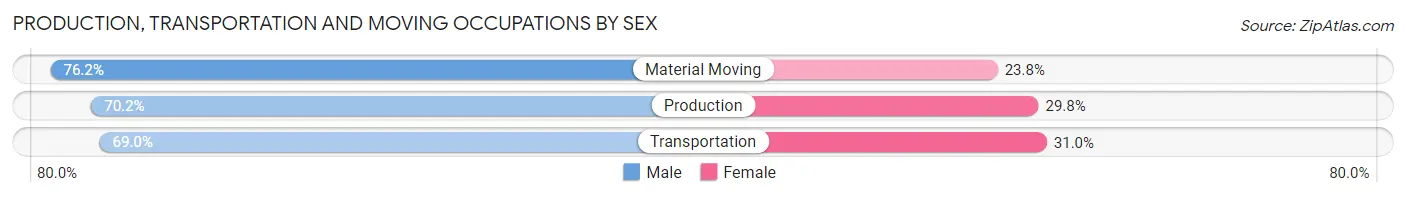
Production, Transportation and Moving Occupations
The most common Production, Transportation and Moving occupations in Caldwell County are Production (1,084 | 5.3%), Transportation (880 | 4.3%), and Material Moving (840 | 4.1%).
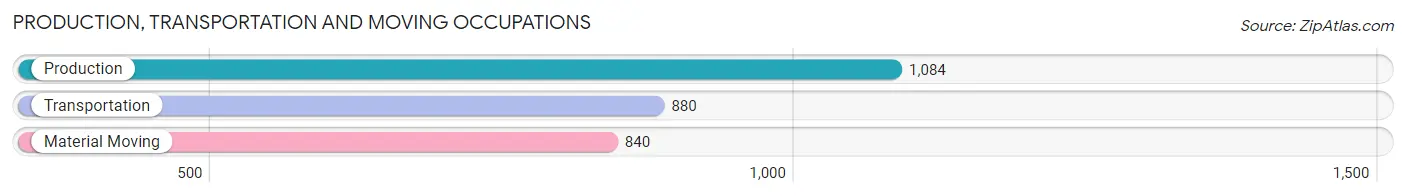
Production, Transportation and Moving Occupations by Sex
| Occupation | Male | Female |
| Production | 761 (70.2%) | 323 (29.8%) |
| Transportation | 607 (69.0%) | 273 (31.0%) |
| Material Moving | 640 (76.2%) | 200 (23.8%) |
| Total (Category) | 2,008 (71.6%) | 796 (28.4%) |
| Total (Overall) | 11,407 (55.5%) | 9,156 (44.5%) |
Employment Industries by Sex in Caldwell County
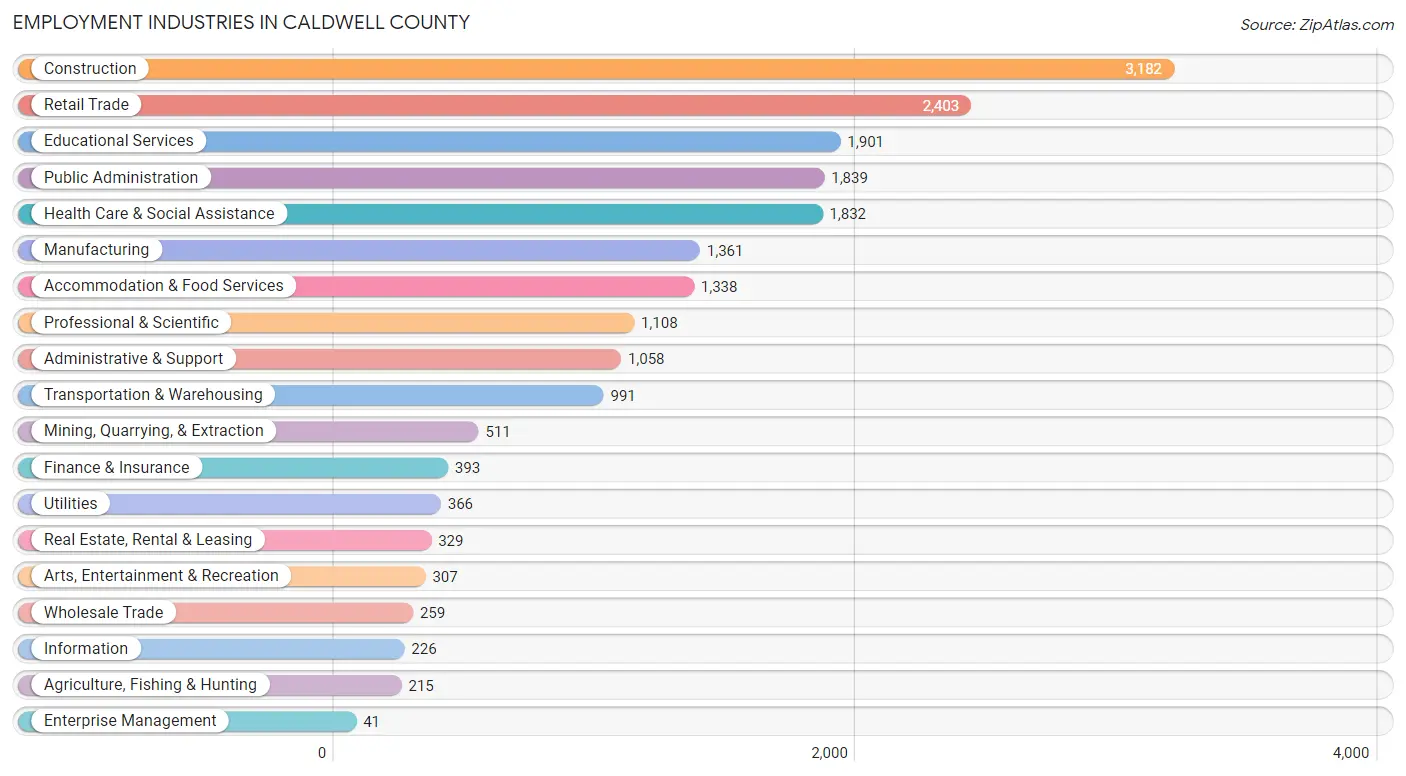
Employment Industries in Caldwell County
The major employment industries in Caldwell County include Construction (3,182 | 15.5%), Retail Trade (2,403 | 11.7%), Educational Services (1,901 | 9.2%), Public Administration (1,839 | 8.9%), and Health Care & Social Assistance (1,832 | 8.9%).
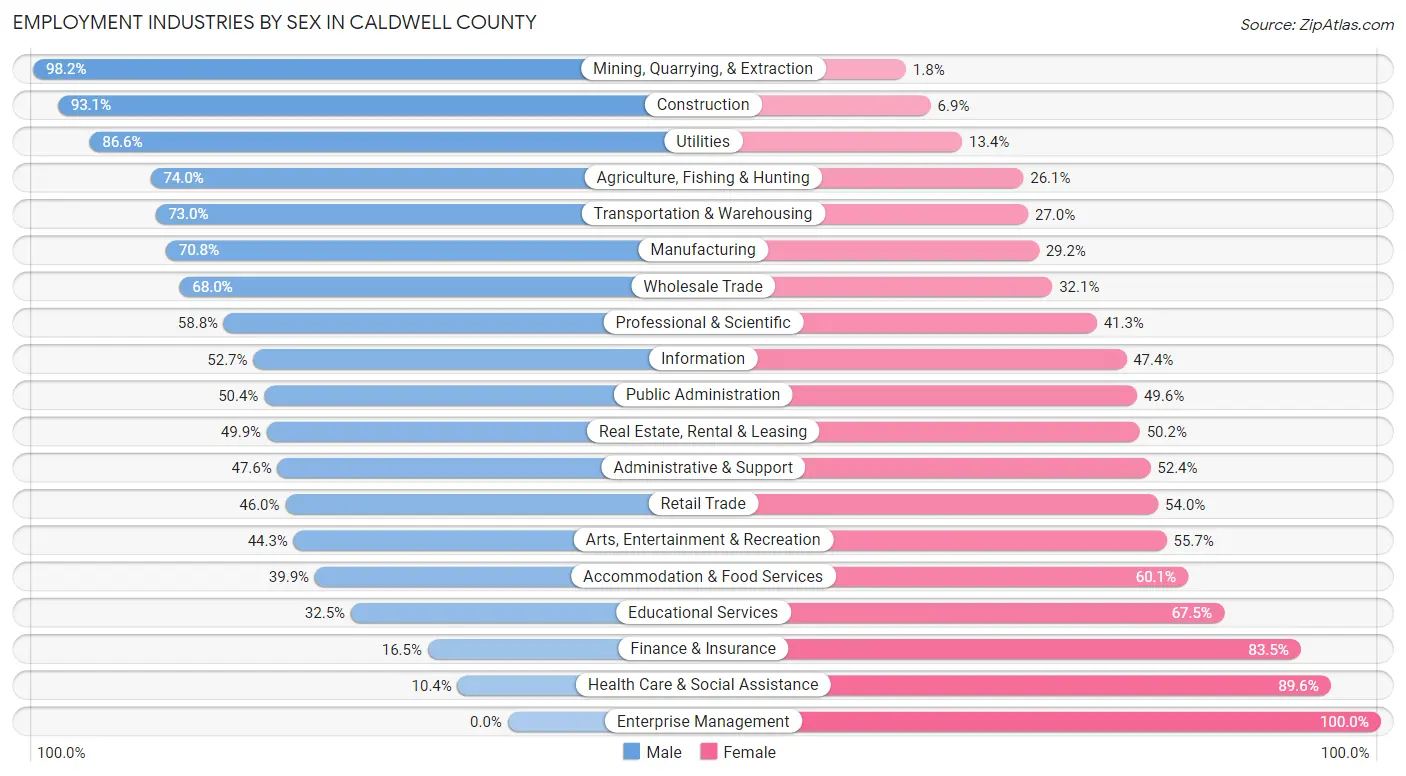
Employment Industries by Sex in Caldwell County
The Caldwell County industries that see more men than women are Mining, Quarrying, & Extraction (98.2%), Construction (93.1%), and Utilities (86.6%), whereas the industries that tend to have a higher number of women are Enterprise Management (100.0%), Health Care & Social Assistance (89.6%), and Finance & Insurance (83.5%).
| Industry | Male | Female |
| Agriculture, Fishing & Hunting | 159 (74.0%) | 56 (26.1%) |
| Mining, Quarrying, & Extraction | 502 (98.2%) | 9 (1.8%) |
| Construction | 2,963 (93.1%) | 219 (6.9%) |
| Manufacturing | 963 (70.8%) | 398 (29.2%) |
| Wholesale Trade | 176 (67.9%) | 83 (32.1%) |
| Retail Trade | 1,106 (46.0%) | 1,297 (54.0%) |
| Transportation & Warehousing | 723 (73.0%) | 268 (27.0%) |
| Utilities | 317 (86.6%) | 49 (13.4%) |
| Information | 119 (52.6%) | 107 (47.3%) |
| Finance & Insurance | 65 (16.5%) | 328 (83.5%) |
| Real Estate, Rental & Leasing | 164 (49.8%) | 165 (50.1%) |
| Professional & Scientific | 651 (58.8%) | 457 (41.2%) |
| Enterprise Management | 0 (0.0%) | 41 (100.0%) |
| Administrative & Support | 504 (47.6%) | 554 (52.4%) |
| Educational Services | 617 (32.5%) | 1,284 (67.5%) |
| Health Care & Social Assistance | 190 (10.4%) | 1,642 (89.6%) |
| Arts, Entertainment & Recreation | 136 (44.3%) | 171 (55.7%) |
| Accommodation & Food Services | 534 (39.9%) | 804 (60.1%) |
| Public Administration | 927 (50.4%) | 912 (49.6%) |
| Total | 11,407 (55.5%) | 9,156 (44.5%) |
Education in Caldwell County
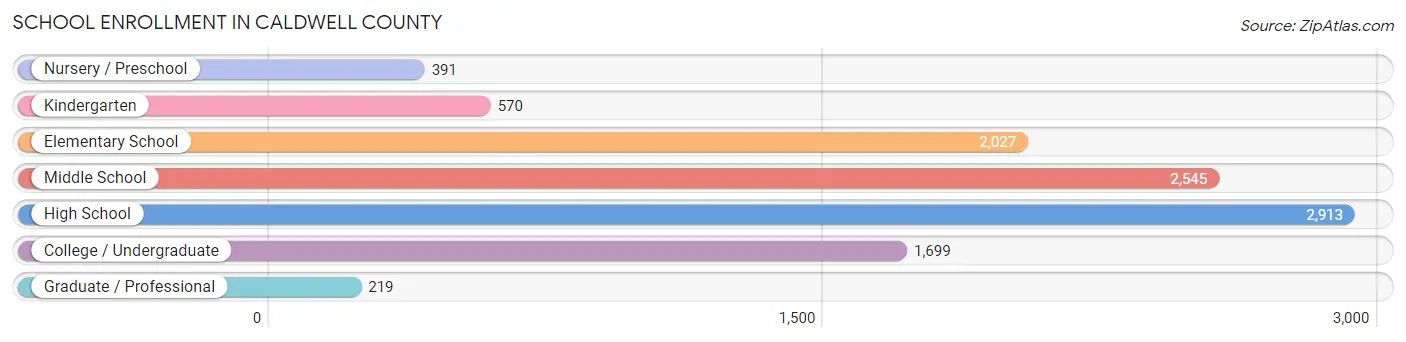
School Enrollment in Caldwell County
The most common levels of schooling among the 10,364 students in Caldwell County are high school (2,913 | 28.1%), middle school (2,545 | 24.6%), and elementary school (2,027 | 19.6%).
| School Level | # Students | % Students |
| Nursery / Preschool | 391 | 3.8% |
| Kindergarten | 570 | 5.5% |
| Elementary School | 2,027 | 19.6% |
| Middle School | 2,545 | 24.6% |
| High School | 2,913 | 28.1% |
| College / Undergraduate | 1,699 | 16.4% |
| Graduate / Professional | 219 | 2.1% |
| Total | 10,364 | 100.0% |
School Enrollment by Age by Funding Source in Caldwell County
Out of a total of 10,364 students who are enrolled in schools in Caldwell County, 684 (6.6%) attend a private institution, while the remaining 9,680 (93.4%) are enrolled in public schools. The age group of 3 to 4 year olds has the highest likelihood of being enrolled in private schools, with 96 (28.6% in the age bracket) enrolled. Conversely, the age group of 20 to 24 year olds has the lowest likelihood of being enrolled in a private school, with 947 (97.6% in the age bracket) attending a public institution.
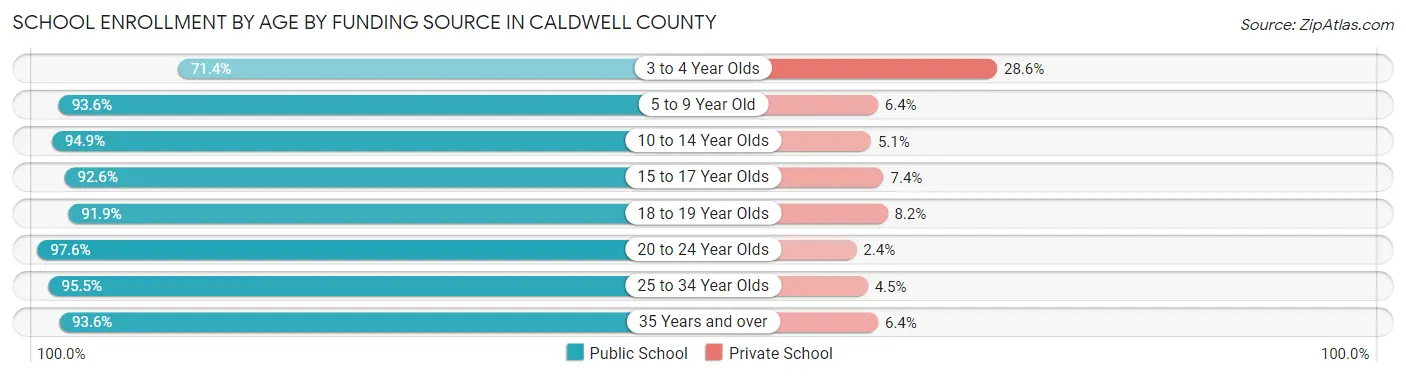
| Age Bracket | Public School | Private School |
| 3 to 4 Year Olds | 240 (71.4%) | 96 (28.6%) |
| 5 to 9 Year Old | 2,225 (93.6%) | 151 (6.4%) |
| 10 to 14 Year Olds | 2,895 (94.9%) | 155 (5.1%) |
| 15 to 17 Year Olds | 1,655 (92.6%) | 133 (7.4%) |
| 18 to 19 Year Olds | 699 (91.8%) | 62 (8.2%) |
| 20 to 24 Year Olds | 947 (97.6%) | 23 (2.4%) |
| 25 to 34 Year Olds | 512 (95.5%) | 24 (4.5%) |
| 35 Years and over | 512 (93.6%) | 35 (6.4%) |
| Total | 9,680 (93.4%) | 684 (6.6%) |
Educational Attainment by Field of Study in Caldwell County
Business (1,263 | 23.3%), education (925 | 17.0%), bio, nature & agricultural (566 | 10.4%), arts & humanities (409 | 7.5%), and liberal arts & history (352 | 6.5%) are the most common fields of study among 5,431 individuals in Caldwell County who have obtained a bachelor's degree or higher.
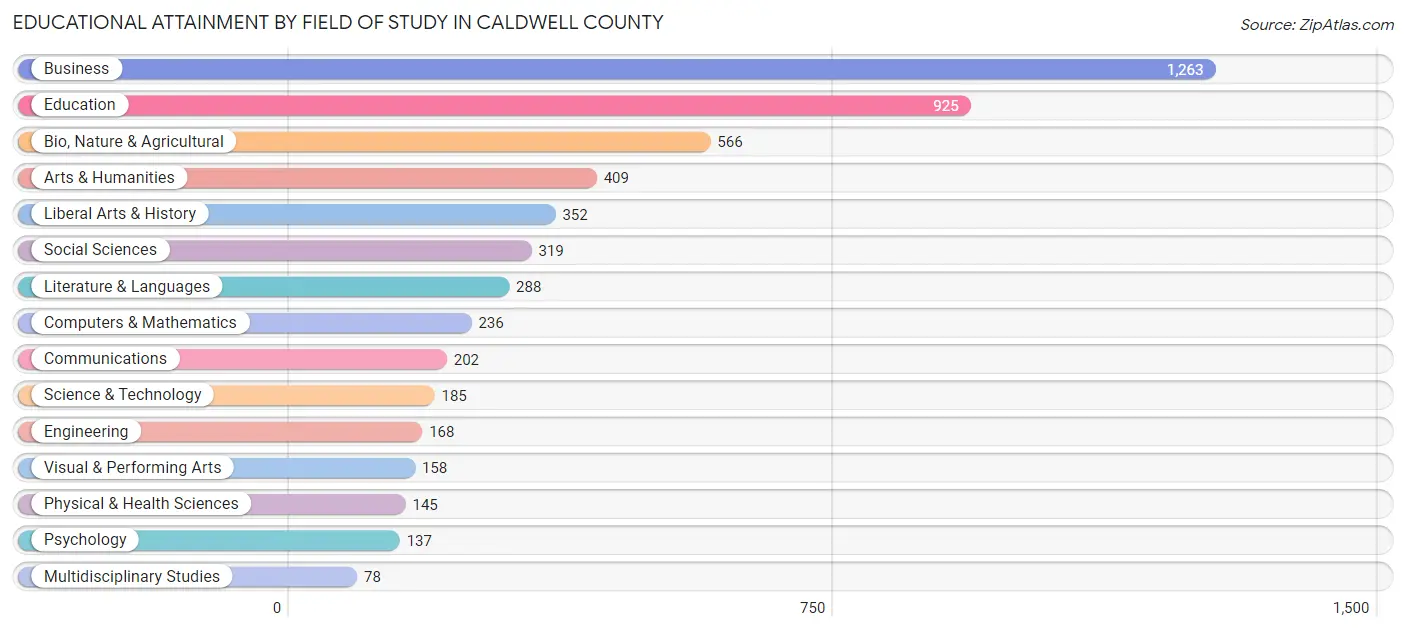
| Field of Study | # Graduates | % Graduates |
| Computers & Mathematics | 236 | 4.3% |
| Bio, Nature & Agricultural | 566 | 10.4% |
| Physical & Health Sciences | 145 | 2.7% |
| Psychology | 137 | 2.5% |
| Social Sciences | 319 | 5.9% |
| Engineering | 168 | 3.1% |
| Multidisciplinary Studies | 78 | 1.4% |
| Science & Technology | 185 | 3.4% |
| Business | 1,263 | 23.3% |
| Education | 925 | 17.0% |
| Literature & Languages | 288 | 5.3% |
| Liberal Arts & History | 352 | 6.5% |
| Visual & Performing Arts | 158 | 2.9% |
| Communications | 202 | 3.7% |
| Arts & Humanities | 409 | 7.5% |
| Total | 5,431 | 100.0% |
Transportation & Commute in Caldwell County
Vehicle Availability by Sex in Caldwell County
The most prevalent vehicle ownership categories in Caldwell County are males with 2 vehicles (4,631, accounting for 41.8%) and females with 2 vehicles (3,404, making up 53.0%).
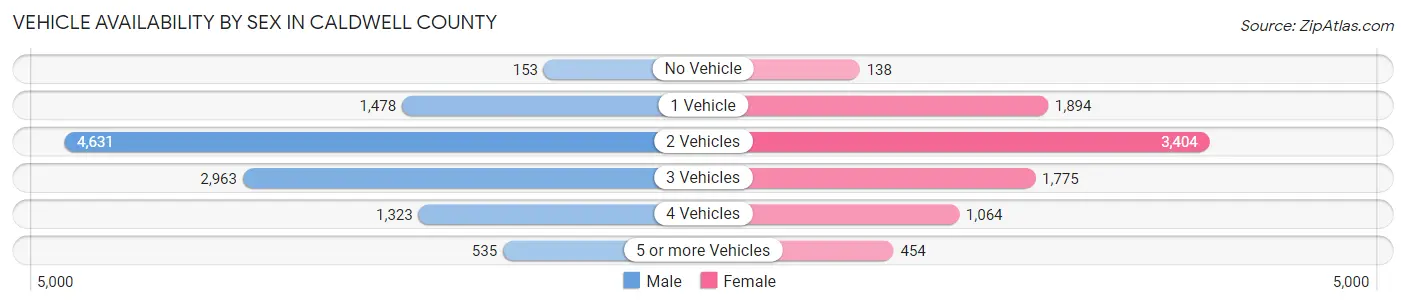
| Vehicles Available | Male | Female |
| No Vehicle | 153 (1.4%) | 138 (1.6%) |
| 1 Vehicle | 1,478 (13.3%) | 1,894 (21.7%) |
| 2 Vehicles | 4,631 (41.8%) | 3,404 (39.0%) |
| 3 Vehicles | 2,963 (26.7%) | 1,775 (20.3%) |
| 4 Vehicles | 1,323 (11.9%) | 1,064 (12.2%) |
| 5 or more Vehicles | 535 (4.8%) | 454 (5.2%) |
| Total | 11,083 (100.0%) | 8,729 (100.0%) |
Commute Time in Caldwell County
The most frequently occuring commute durations in Caldwell County are 60 to 89 minutes (2,746 commuters, 14.8%), 30 to 34 minutes (2,492 commuters, 13.4%), and 45 to 59 minutes (2,094 commuters, 11.3%).
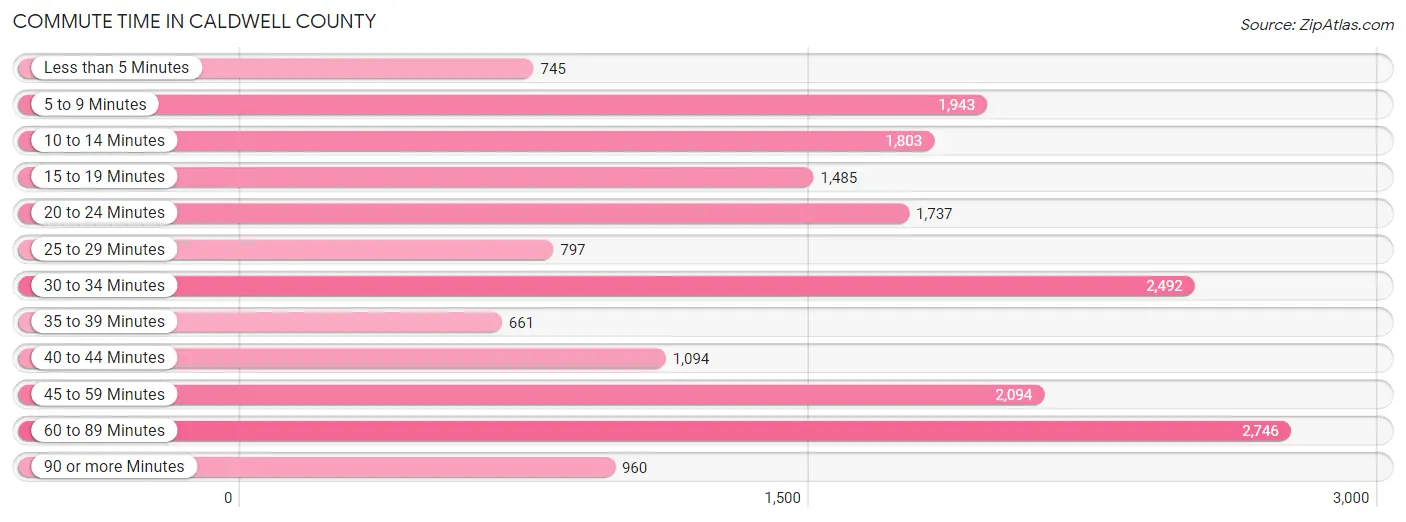
| Commute Time | # Commuters | % Commuters |
| Less than 5 Minutes | 745 | 4.0% |
| 5 to 9 Minutes | 1,943 | 10.5% |
| 10 to 14 Minutes | 1,803 | 9.7% |
| 15 to 19 Minutes | 1,485 | 8.0% |
| 20 to 24 Minutes | 1,737 | 9.4% |
| 25 to 29 Minutes | 797 | 4.3% |
| 30 to 34 Minutes | 2,492 | 13.4% |
| 35 to 39 Minutes | 661 | 3.6% |
| 40 to 44 Minutes | 1,094 | 5.9% |
| 45 to 59 Minutes | 2,094 | 11.3% |
| 60 to 89 Minutes | 2,746 | 14.8% |
| 90 or more Minutes | 960 | 5.2% |
Commute Time by Sex in Caldwell County
The most common commute times in Caldwell County are 60 to 89 minutes (2,017 commuters, 19.5%) for males and 5 to 9 minutes (1,204 commuters, 14.7%) for females.
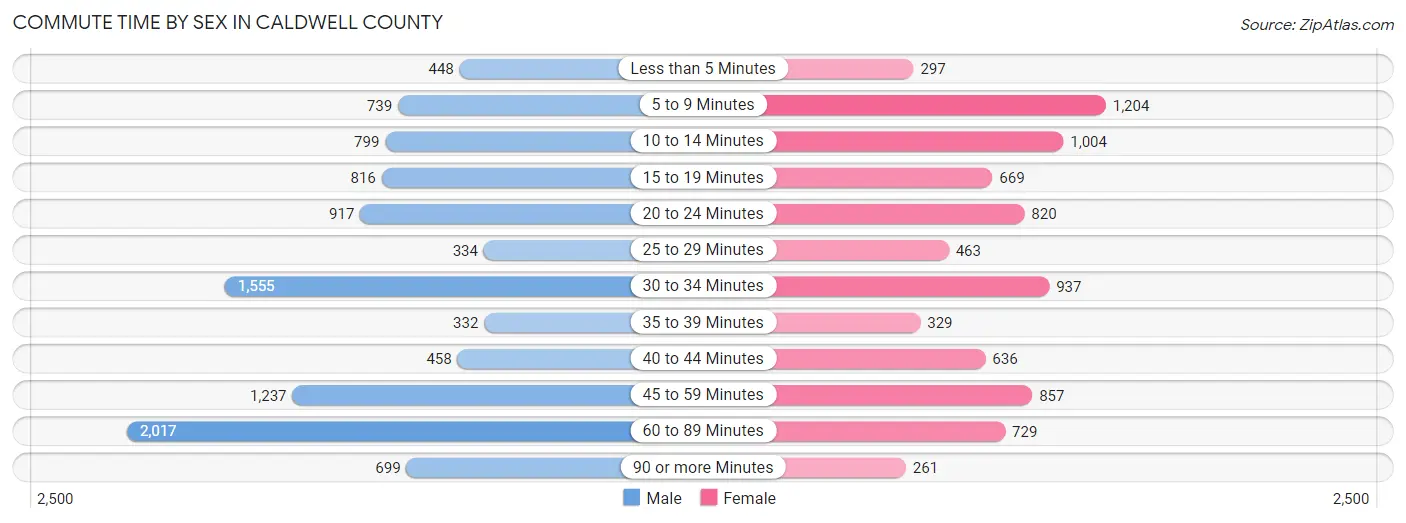
| Commute Time | Male | Female |
| Less than 5 Minutes | 448 (4.3%) | 297 (3.6%) |
| 5 to 9 Minutes | 739 (7.1%) | 1,204 (14.7%) |
| 10 to 14 Minutes | 799 (7.7%) | 1,004 (12.2%) |
| 15 to 19 Minutes | 816 (7.9%) | 669 (8.2%) |
| 20 to 24 Minutes | 917 (8.9%) | 820 (10.0%) |
| 25 to 29 Minutes | 334 (3.2%) | 463 (5.6%) |
| 30 to 34 Minutes | 1,555 (15.0%) | 937 (11.4%) |
| 35 to 39 Minutes | 332 (3.2%) | 329 (4.0%) |
| 40 to 44 Minutes | 458 (4.4%) | 636 (7.7%) |
| 45 to 59 Minutes | 1,237 (11.9%) | 857 (10.4%) |
| 60 to 89 Minutes | 2,017 (19.5%) | 729 (8.9%) |
| 90 or more Minutes | 699 (6.8%) | 261 (3.2%) |
Time of Departure to Work by Sex in Caldwell County
The most frequent times of departure to work in Caldwell County are 6:00 AM to 6:29 AM (1,885, 18.2%) for males and 7:00 AM to 7:29 AM (1,235, 15.0%) for females.
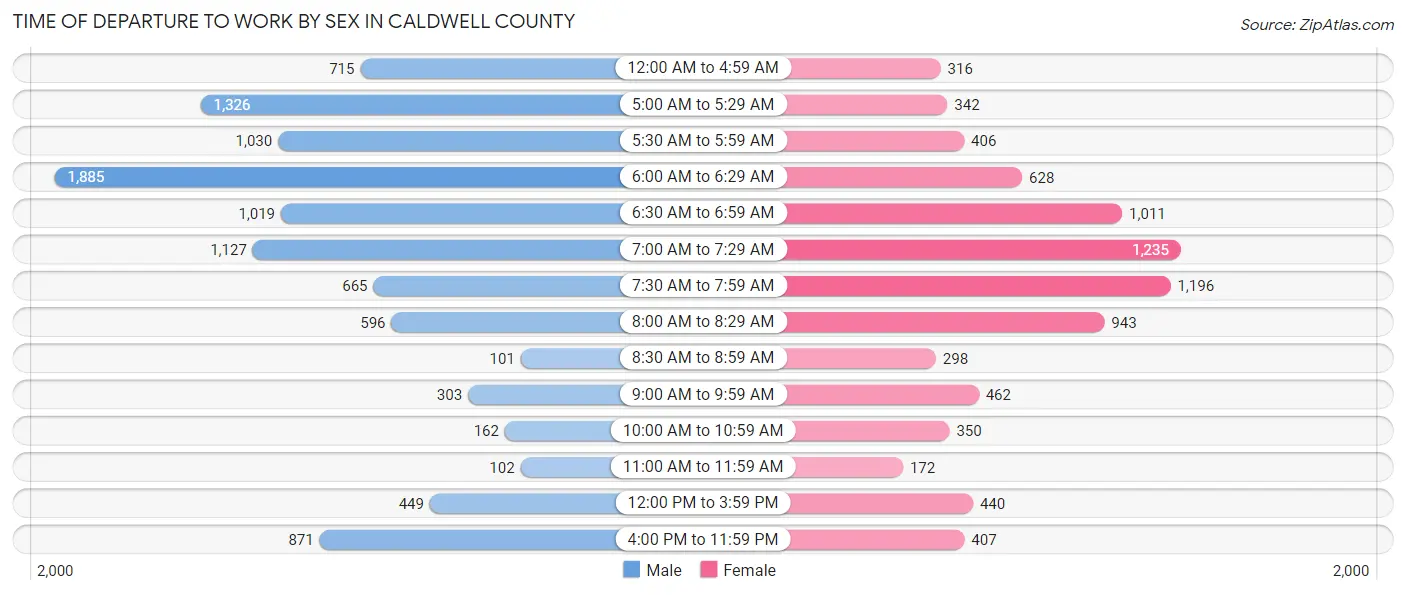
| Time of Departure | Male | Female |
| 12:00 AM to 4:59 AM | 715 (6.9%) | 316 (3.8%) |
| 5:00 AM to 5:29 AM | 1,326 (12.8%) | 342 (4.2%) |
| 5:30 AM to 5:59 AM | 1,030 (10.0%) | 406 (5.0%) |
| 6:00 AM to 6:29 AM | 1,885 (18.2%) | 628 (7.6%) |
| 6:30 AM to 6:59 AM | 1,019 (9.8%) | 1,011 (12.3%) |
| 7:00 AM to 7:29 AM | 1,127 (10.9%) | 1,235 (15.0%) |
| 7:30 AM to 7:59 AM | 665 (6.4%) | 1,196 (14.6%) |
| 8:00 AM to 8:29 AM | 596 (5.8%) | 943 (11.5%) |
| 8:30 AM to 8:59 AM | 101 (1.0%) | 298 (3.6%) |
| 9:00 AM to 9:59 AM | 303 (2.9%) | 462 (5.6%) |
| 10:00 AM to 10:59 AM | 162 (1.6%) | 350 (4.3%) |
| 11:00 AM to 11:59 AM | 102 (1.0%) | 172 (2.1%) |
| 12:00 PM to 3:59 PM | 449 (4.3%) | 440 (5.4%) |
| 4:00 PM to 11:59 PM | 871 (8.4%) | 407 (5.0%) |
| Total | 10,351 (100.0%) | 8,206 (100.0%) |
Housing Occupancy in Caldwell County
Occupancy by Ownership in Caldwell County
Of the total 15,087 dwellings in Caldwell County, owner-occupied units account for 10,788 (71.5%), while renter-occupied units make up 4,299 (28.5%).
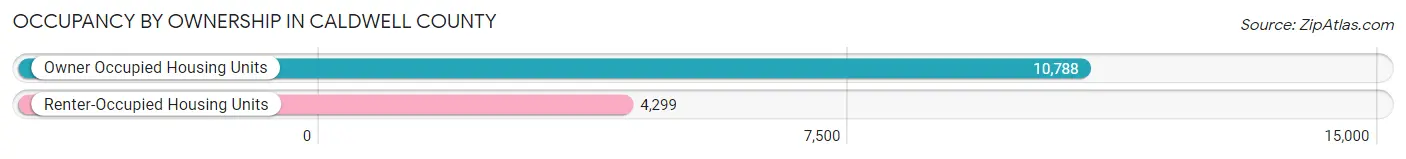
| Occupancy | # Housing Units | % Housing Units |
| Owner Occupied Housing Units | 10,788 | 71.5% |
| Renter-Occupied Housing Units | 4,299 | 28.5% |
| Total Occupied Housing Units | 15,087 | 100.0% |
Occupancy by Household Size in Caldwell County
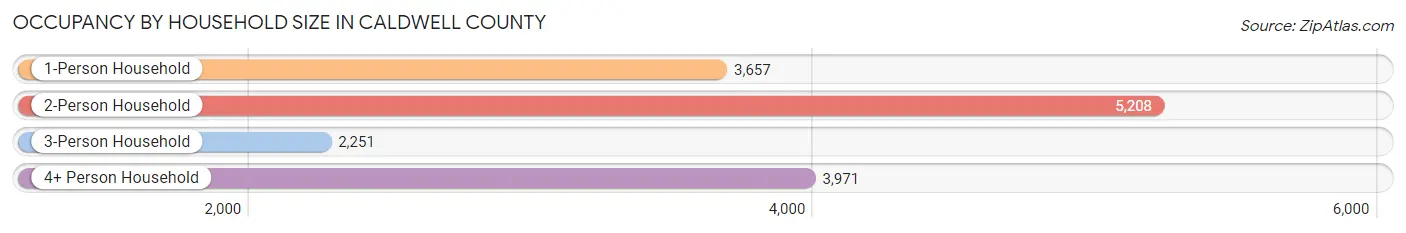
| Household Size | # Housing Units | % Housing Units |
| 1-Person Household | 3,657 | 24.2% |
| 2-Person Household | 5,208 | 34.5% |
| 3-Person Household | 2,251 | 14.9% |
| 4+ Person Household | 3,971 | 26.3% |
| Total Housing Units | 15,087 | 100.0% |
Occupancy by Ownership by Household Size in Caldwell County
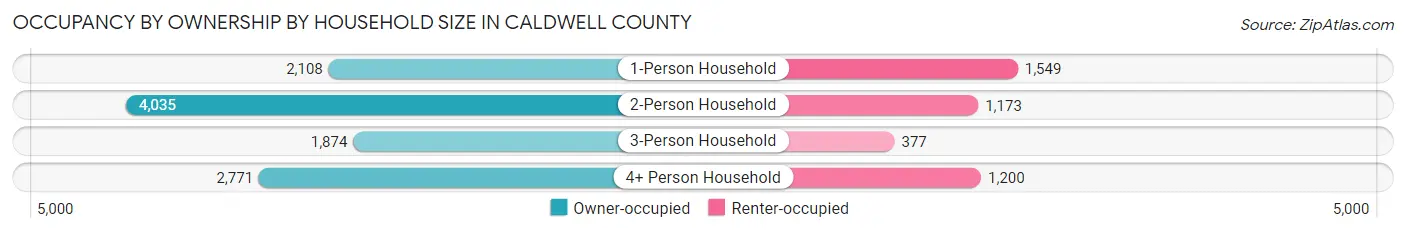
| Household Size | Owner-occupied | Renter-occupied |
| 1-Person Household | 2,108 (57.6%) | 1,549 (42.4%) |
| 2-Person Household | 4,035 (77.5%) | 1,173 (22.5%) |
| 3-Person Household | 1,874 (83.3%) | 377 (16.8%) |
| 4+ Person Household | 2,771 (69.8%) | 1,200 (30.2%) |
| Total Housing Units | 10,788 (71.5%) | 4,299 (28.5%) |
Occupancy by Educational Attainment in Caldwell County
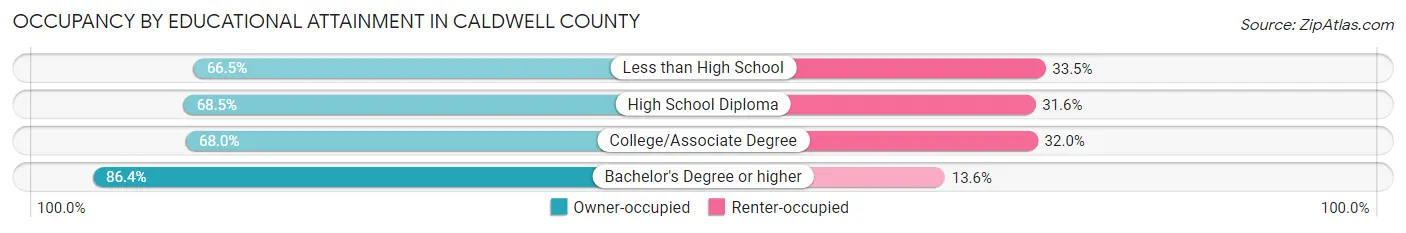
| Household Size | Owner-occupied | Renter-occupied |
| Less than High School | 1,615 (66.5%) | 815 (33.5%) |
| High School Diploma | 3,537 (68.4%) | 1,630 (31.6%) |
| College/Associate Degree | 3,082 (68.0%) | 1,452 (32.0%) |
| Bachelor's Degree or higher | 2,554 (86.4%) | 402 (13.6%) |
Occupancy by Age of Householder in Caldwell County
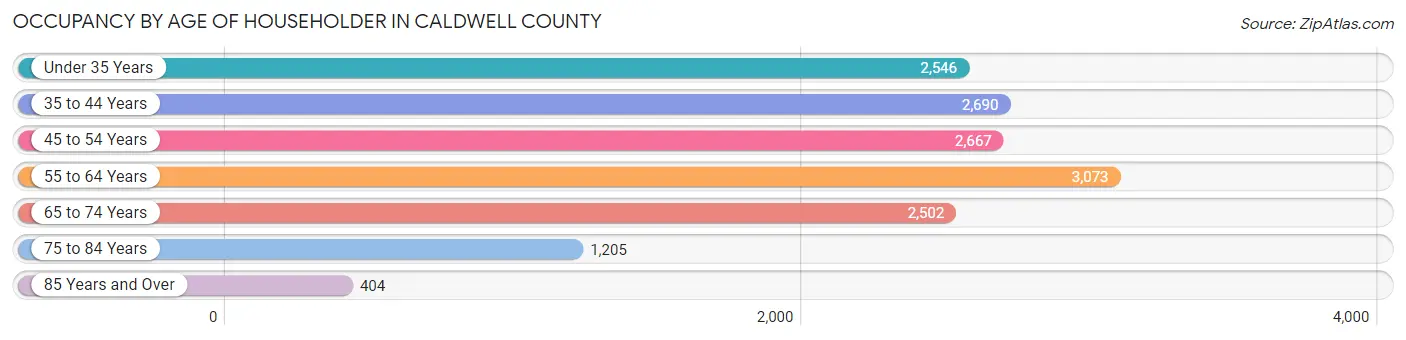
| Age Bracket | # Households | % Households |
| Under 35 Years | 2,546 | 16.9% |
| 35 to 44 Years | 2,690 | 17.8% |
| 45 to 54 Years | 2,667 | 17.7% |
| 55 to 64 Years | 3,073 | 20.4% |
| 65 to 74 Years | 2,502 | 16.6% |
| 75 to 84 Years | 1,205 | 8.0% |
| 85 Years and Over | 404 | 2.7% |
| Total | 15,087 | 100.0% |
Housing Finances in Caldwell County
Median Income by Occupancy in Caldwell County
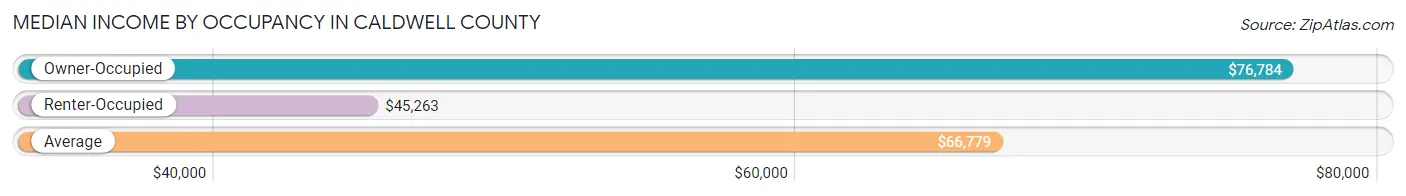
| Occupancy Type | # Households | Median Income |
| Owner-Occupied | 10,788 (71.5%) | $76,784 |
| Renter-Occupied | 4,299 (28.5%) | $45,263 |
| Average | 15,087 (100.0%) | $66,779 |
Occupancy by Householder Income Bracket in Caldwell County
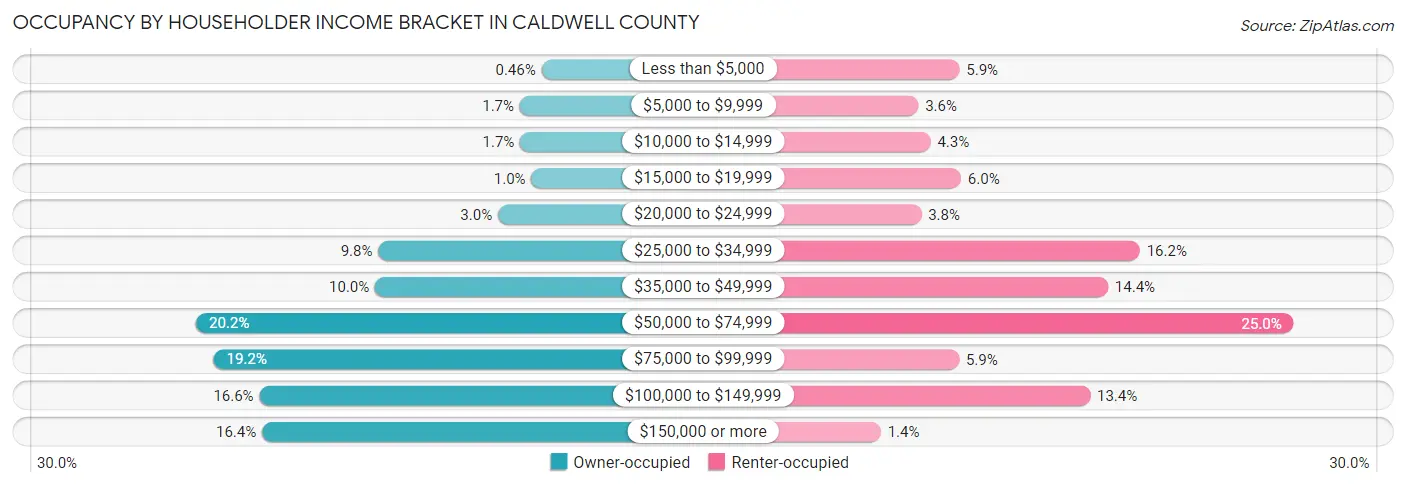
| Income Bracket | Owner-occupied | Renter-occupied |
| Less than $5,000 | 50 (0.5%) | 255 (5.9%) |
| $5,000 to $9,999 | 183 (1.7%) | 154 (3.6%) |
| $10,000 to $14,999 | 181 (1.7%) | 184 (4.3%) |
| $15,000 to $19,999 | 112 (1.0%) | 259 (6.0%) |
| $20,000 to $24,999 | 318 (2.9%) | 161 (3.7%) |
| $25,000 to $34,999 | 1,056 (9.8%) | 698 (16.2%) |
| $35,000 to $49,999 | 1,076 (10.0%) | 620 (14.4%) |
| $50,000 to $74,999 | 2,179 (20.2%) | 1,076 (25.0%) |
| $75,000 to $99,999 | 2,071 (19.2%) | 254 (5.9%) |
| $100,000 to $149,999 | 1,789 (16.6%) | 576 (13.4%) |
| $150,000 or more | 1,773 (16.4%) | 62 (1.4%) |
| Total | 10,788 (100.0%) | 4,299 (100.0%) |
Monthly Housing Cost Tiers in Caldwell County
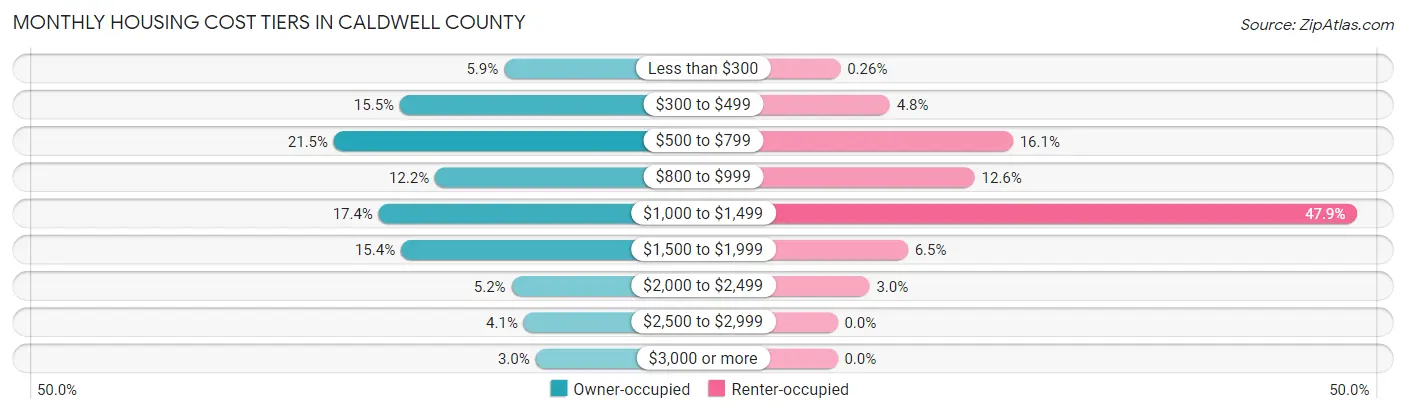
| Monthly Cost | Owner-occupied | Renter-occupied |
| Less than $300 | 632 (5.9%) | 11 (0.3%) |
| $300 to $499 | 1,667 (15.4%) | 207 (4.8%) |
| $500 to $799 | 2,323 (21.5%) | 694 (16.1%) |
| $800 to $999 | 1,318 (12.2%) | 543 (12.6%) |
| $1,000 to $1,499 | 1,877 (17.4%) | 2,057 (47.8%) |
| $1,500 to $1,999 | 1,656 (15.3%) | 278 (6.5%) |
| $2,000 to $2,499 | 559 (5.2%) | 127 (2.9%) |
| $2,500 to $2,999 | 437 (4.1%) | 0 (0.0%) |
| $3,000 or more | 319 (3.0%) | 0 (0.0%) |
| Total | 10,788 (100.0%) | 4,299 (100.0%) |
Physical Housing Characteristics in Caldwell County
Housing Structures in Caldwell County
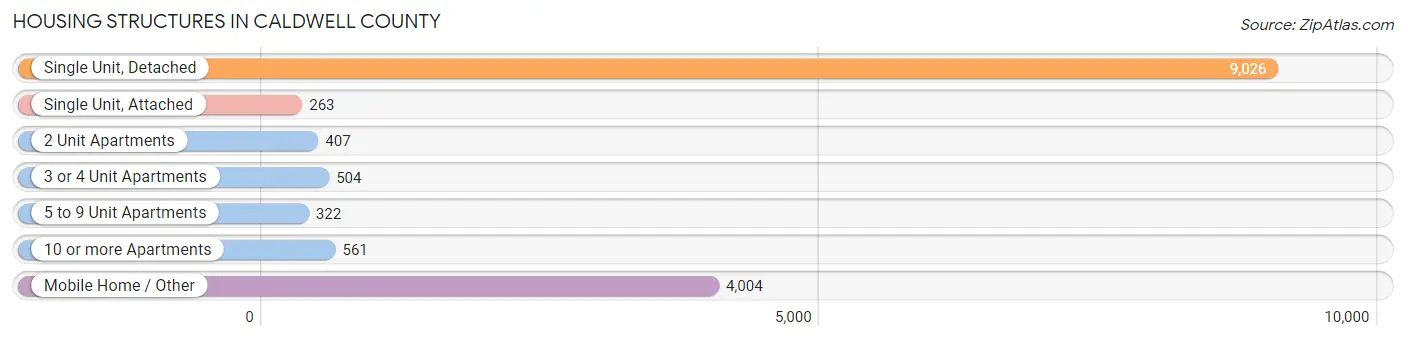
| Structure Type | # Housing Units | % Housing Units |
| Single Unit, Detached | 9,026 | 59.8% |
| Single Unit, Attached | 263 | 1.7% |
| 2 Unit Apartments | 407 | 2.7% |
| 3 or 4 Unit Apartments | 504 | 3.3% |
| 5 to 9 Unit Apartments | 322 | 2.1% |
| 10 or more Apartments | 561 | 3.7% |
| Mobile Home / Other | 4,004 | 26.5% |
| Total | 15,087 | 100.0% |
Housing Structures by Occupancy in Caldwell County
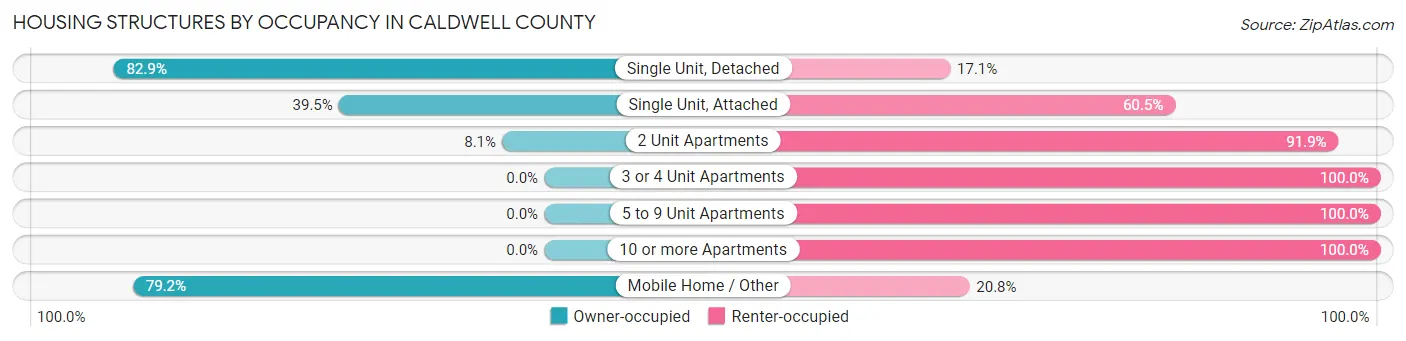
| Structure Type | Owner-occupied | Renter-occupied |
| Single Unit, Detached | 7,481 (82.9%) | 1,545 (17.1%) |
| Single Unit, Attached | 104 (39.5%) | 159 (60.5%) |
| 2 Unit Apartments | 33 (8.1%) | 374 (91.9%) |
| 3 or 4 Unit Apartments | 0 (0.0%) | 504 (100.0%) |
| 5 to 9 Unit Apartments | 0 (0.0%) | 322 (100.0%) |
| 10 or more Apartments | 0 (0.0%) | 561 (100.0%) |
| Mobile Home / Other | 3,170 (79.2%) | 834 (20.8%) |
| Total | 10,788 (71.5%) | 4,299 (28.5%) |
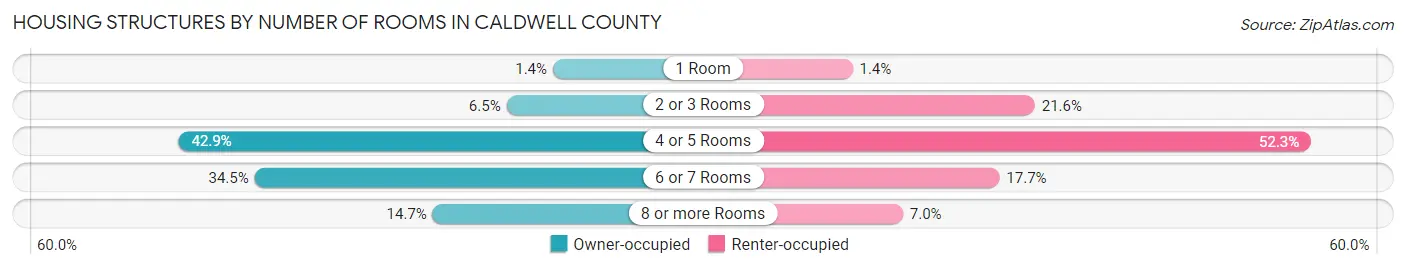
Housing Structures by Number of Rooms in Caldwell County
| Number of Rooms | Owner-occupied | Renter-occupied |
| 1 Room | 148 (1.4%) | 60 (1.4%) |
| 2 or 3 Rooms | 703 (6.5%) | 930 (21.6%) |
| 4 or 5 Rooms | 4,630 (42.9%) | 2,248 (52.3%) |
| 6 or 7 Rooms | 3,720 (34.5%) | 761 (17.7%) |
| 8 or more Rooms | 1,587 (14.7%) | 300 (7.0%) |
| Total | 10,788 (100.0%) | 4,299 (100.0%) |
Housing Structure by Heating Type in Caldwell County
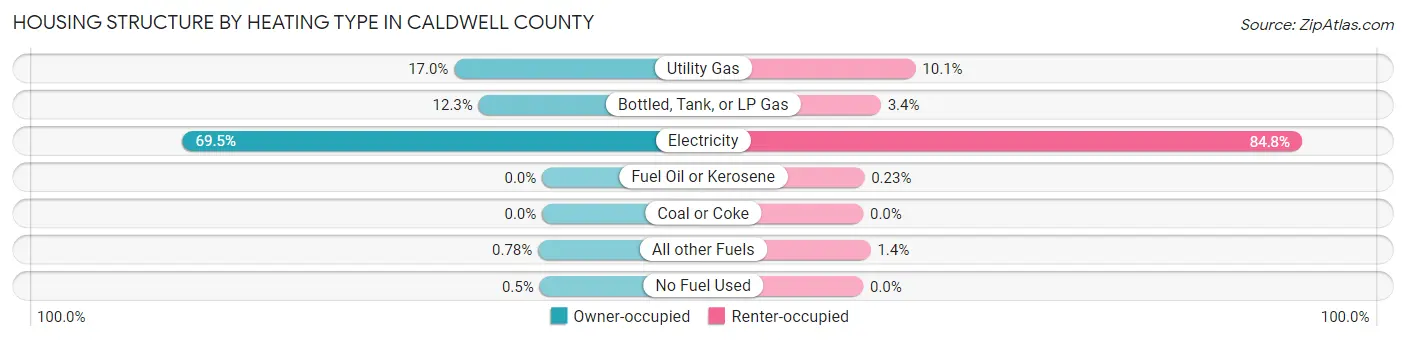
| Heating Type | Owner-occupied | Renter-occupied |
| Utility Gas | 1,833 (17.0%) | 435 (10.1%) |
| Bottled, Tank, or LP Gas | 1,324 (12.3%) | 147 (3.4%) |
| Electricity | 7,493 (69.5%) | 3,645 (84.8%) |
| Fuel Oil or Kerosene | 0 (0.0%) | 10 (0.2%) |
| Coal or Coke | 0 (0.0%) | 0 (0.0%) |
| All other Fuels | 84 (0.8%) | 62 (1.4%) |
| No Fuel Used | 54 (0.5%) | 0 (0.0%) |
| Total | 10,788 (100.0%) | 4,299 (100.0%) |
Household Vehicle Usage in Caldwell County
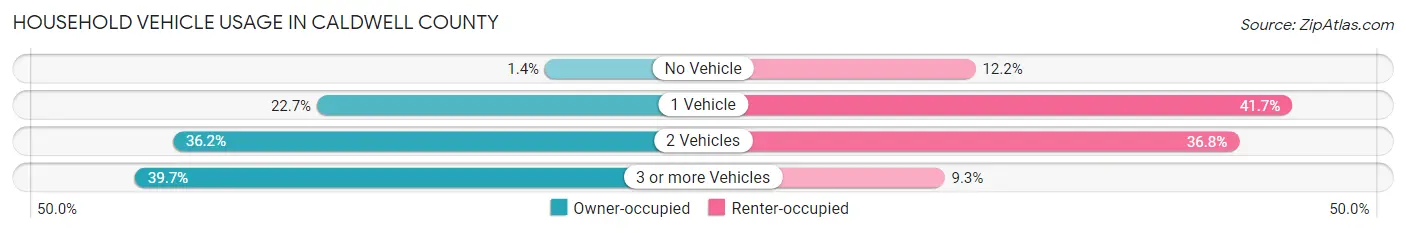
| Vehicles per Household | Owner-occupied | Renter-occupied |
| No Vehicle | 154 (1.4%) | 524 (12.2%) |
| 1 Vehicle | 2,450 (22.7%) | 1,794 (41.7%) |
| 2 Vehicles | 3,901 (36.2%) | 1,581 (36.8%) |
| 3 or more Vehicles | 4,283 (39.7%) | 400 (9.3%) |
| Total | 10,788 (100.0%) | 4,299 (100.0%) |
Real Estate & Mortgages in Caldwell County
Real Estate and Mortgage Overview in Caldwell County
| Characteristic | Without Mortgage | With Mortgage |
| Housing Units | 5,357 | 5,431 |
| Median Property Value | $141,300 | $206,900 |
| Median Household Income | $61,482 | $1,216 |
| Monthly Housing Costs | $544 | $319 |
| Real Estate Taxes | $2,214 | $274 |
Property Value by Mortgage Status in Caldwell County
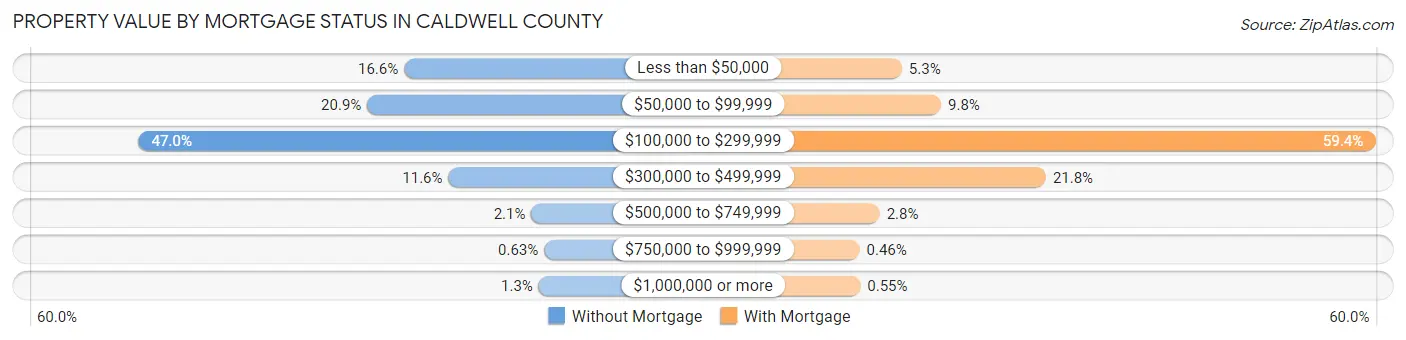
| Property Value | Without Mortgage | With Mortgage |
| Less than $50,000 | 891 (16.6%) | 288 (5.3%) |
| $50,000 to $99,999 | 1,117 (20.8%) | 531 (9.8%) |
| $100,000 to $299,999 | 2,516 (47.0%) | 3,225 (59.4%) |
| $300,000 to $499,999 | 620 (11.6%) | 1,182 (21.8%) |
| $500,000 to $749,999 | 112 (2.1%) | 150 (2.8%) |
| $750,000 to $999,999 | 34 (0.6%) | 25 (0.5%) |
| $1,000,000 or more | 67 (1.3%) | 30 (0.5%) |
| Total | 5,357 (100.0%) | 5,431 (100.0%) |
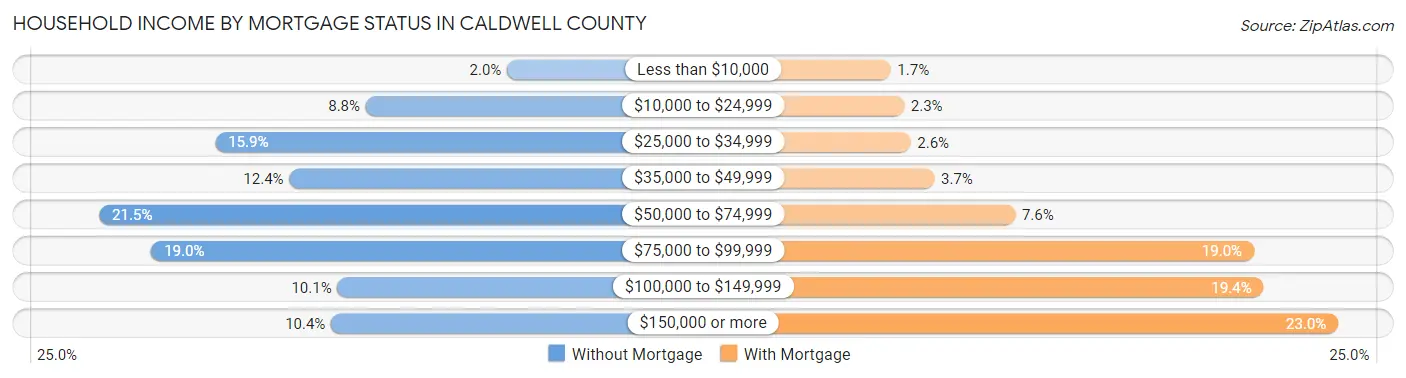
Household Income by Mortgage Status in Caldwell County
| Household Income | Without Mortgage | With Mortgage |
| Less than $10,000 | 108 (2.0%) | 90 (1.7%) |
| $10,000 to $24,999 | 469 (8.7%) | 125 (2.3%) |
| $25,000 to $34,999 | 853 (15.9%) | 142 (2.6%) |
| $35,000 to $49,999 | 664 (12.4%) | 203 (3.7%) |
| $50,000 to $74,999 | 1,149 (21.4%) | 412 (7.6%) |
| $75,000 to $99,999 | 1,016 (19.0%) | 1,030 (19.0%) |
| $100,000 to $149,999 | 541 (10.1%) | 1,055 (19.4%) |
| $150,000 or more | 557 (10.4%) | 1,248 (23.0%) |
| Total | 5,357 (100.0%) | 5,431 (100.0%) |
Property Value to Household Income Ratio in Caldwell County
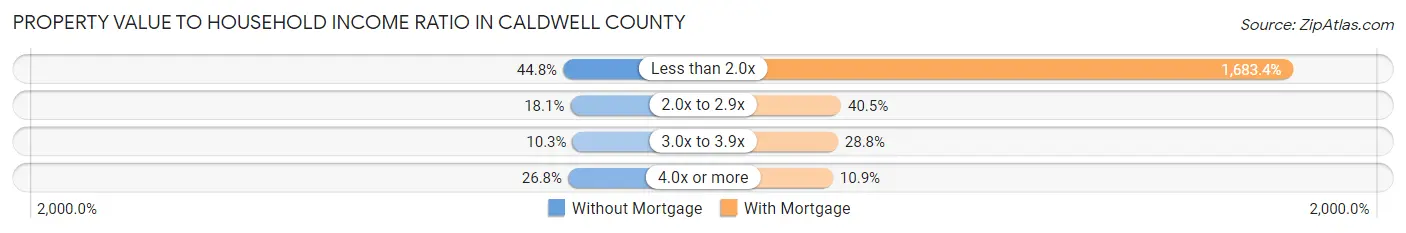
| Value-to-Income Ratio | Without Mortgage | With Mortgage |
| Less than 2.0x | 2,400 (44.8%) | 91,424 (1,683.4%) |
| 2.0x to 2.9x | 971 (18.1%) | 2,200 (40.5%) |
| 3.0x to 3.9x | 552 (10.3%) | 1,565 (28.8%) |
| 4.0x or more | 1,434 (26.8%) | 591 (10.9%) |
| Total | 5,357 (100.0%) | 5,431 (100.0%) |
Real Estate Taxes by Mortgage Status in Caldwell County

| Property Taxes | Without Mortgage | With Mortgage |
| Less than $800 | 934 (17.4%) | 0 (0.0%) |
| $800 to $1,499 | 820 (15.3%) | 341 (6.3%) |
| $800 to $1,499 | 3,184 (59.4%) | 615 (11.3%) |
| Total | 5,357 (100.0%) | 5,431 (100.0%) |
Health & Disability in Caldwell County
Health Insurance Coverage by Age in Caldwell County
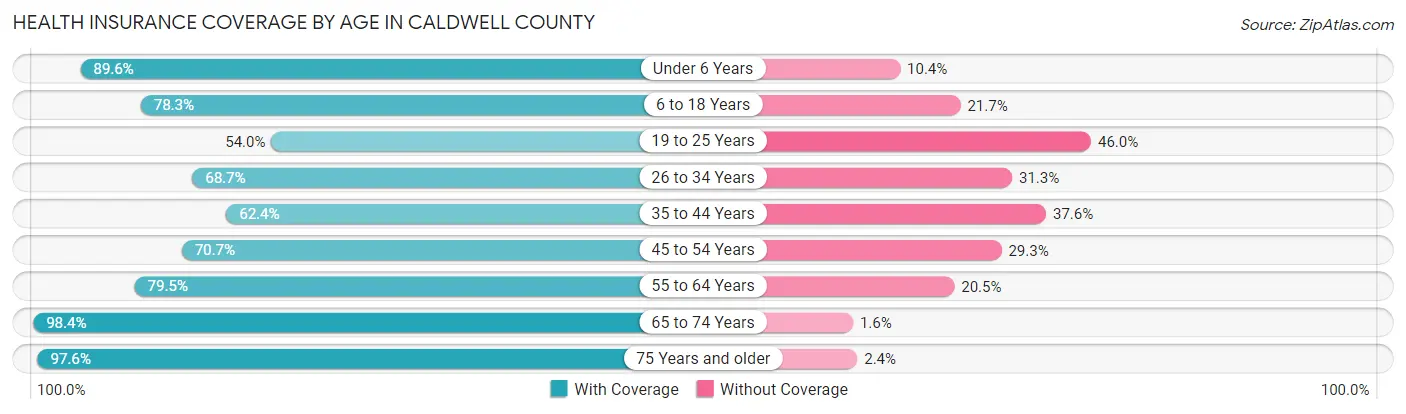
| Age Bracket | With Coverage | Without Coverage |
| Under 6 Years | 3,011 (89.6%) | 350 (10.4%) |
| 6 to 18 Years | 5,873 (78.3%) | 1,625 (21.7%) |
| 19 to 25 Years | 2,704 (54.0%) | 2,304 (46.0%) |
| 26 to 34 Years | 3,431 (68.7%) | 1,562 (31.3%) |
| 35 to 44 Years | 3,439 (62.4%) | 2,074 (37.6%) |
| 45 to 54 Years | 3,797 (70.7%) | 1,574 (29.3%) |
| 55 to 64 Years | 4,489 (79.5%) | 1,159 (20.5%) |
| 65 to 74 Years | 4,007 (98.4%) | 66 (1.6%) |
| 75 Years and older | 2,498 (97.6%) | 62 (2.4%) |
| Total | 33,249 (75.5%) | 10,776 (24.5%) |
Health Insurance Coverage by Citizenship Status in Caldwell County
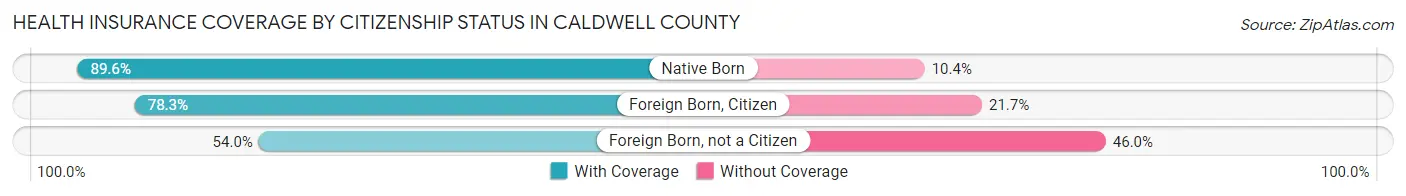
| Citizenship Status | With Coverage | Without Coverage |
| Native Born | 3,011 (89.6%) | 350 (10.4%) |
| Foreign Born, Citizen | 5,873 (78.3%) | 1,625 (21.7%) |
| Foreign Born, not a Citizen | 2,704 (54.0%) | 2,304 (46.0%) |
Health Insurance Coverage by Household Income in Caldwell County
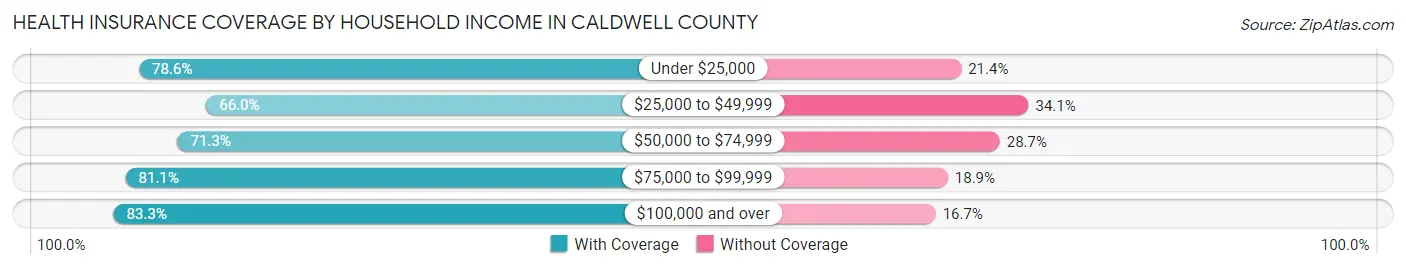
| Household Income | With Coverage | Without Coverage |
| Under $25,000 | 2,436 (78.6%) | 665 (21.4%) |
| $25,000 to $49,999 | 5,351 (65.9%) | 2,763 (34.1%) |
| $50,000 to $74,999 | 6,569 (71.3%) | 2,640 (28.7%) |
| $75,000 to $99,999 | 5,572 (81.1%) | 1,301 (18.9%) |
| $100,000 and over | 12,541 (83.3%) | 2,507 (16.7%) |
Public vs Private Health Insurance Coverage by Age in Caldwell County
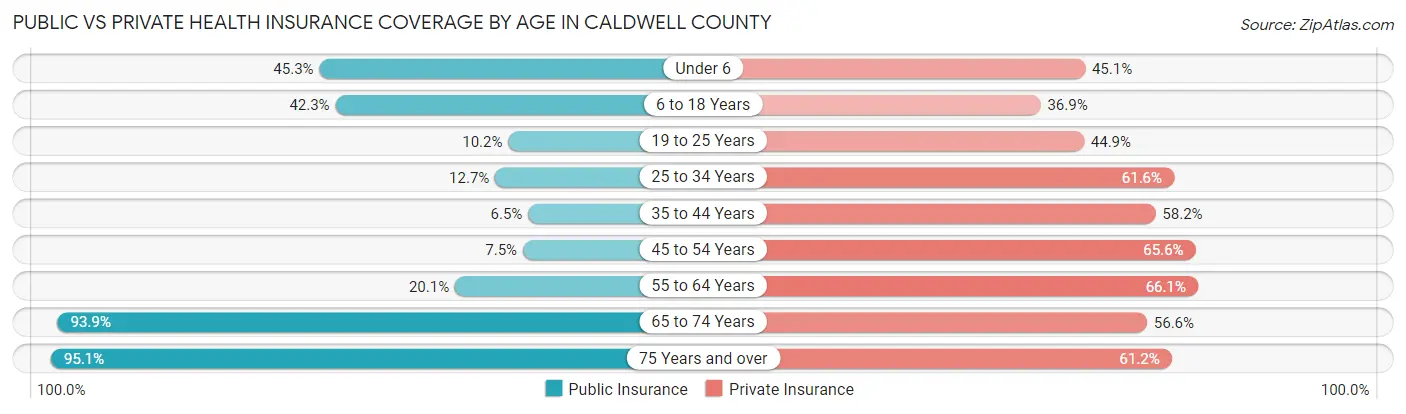
| Age Bracket | Public Insurance | Private Insurance |
| Under 6 | 1,522 (45.3%) | 1,517 (45.1%) |
| 6 to 18 Years | 3,172 (42.3%) | 2,765 (36.9%) |
| 19 to 25 Years | 512 (10.2%) | 2,250 (44.9%) |
| 25 to 34 Years | 632 (12.7%) | 3,077 (61.6%) |
| 35 to 44 Years | 360 (6.5%) | 3,209 (58.2%) |
| 45 to 54 Years | 403 (7.5%) | 3,525 (65.6%) |
| 55 to 64 Years | 1,136 (20.1%) | 3,731 (66.1%) |
| 65 to 74 Years | 3,824 (93.9%) | 2,306 (56.6%) |
| 75 Years and over | 2,435 (95.1%) | 1,567 (61.2%) |
| Total | 13,996 (31.8%) | 23,947 (54.4%) |
Disability Status by Sex by Age in Caldwell County
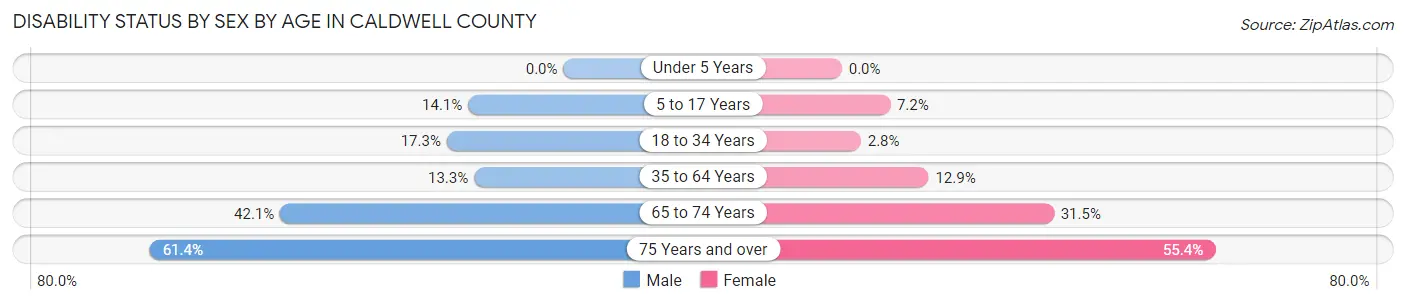
| Age Bracket | Male | Female |
| Under 5 Years | 0 (0.0%) | 0 (0.0%) |
| 5 to 17 Years | 529 (14.1%) | 273 (7.1%) |
| 18 to 34 Years | 1,012 (17.3%) | 130 (2.8%) |
| 35 to 64 Years | 1,124 (13.3%) | 1,037 (12.9%) |
| 65 to 74 Years | 831 (42.0%) | 660 (31.5%) |
| 75 Years and over | 608 (61.4%) | 870 (55.4%) |
Disability Class by Sex by Age in Caldwell County
Disability Class: Hearing Difficulty
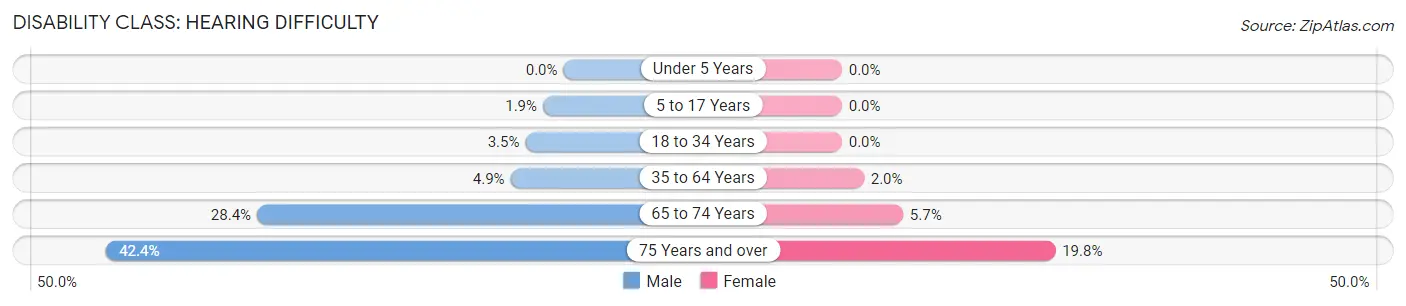
| Age Bracket | Male | Female |
| Under 5 Years | 0 (0.0%) | 0 (0.0%) |
| 5 to 17 Years | 71 (1.9%) | 0 (0.0%) |
| 18 to 34 Years | 206 (3.5%) | 0 (0.0%) |
| 35 to 64 Years | 416 (4.9%) | 164 (2.0%) |
| 65 to 74 Years | 562 (28.4%) | 119 (5.7%) |
| 75 Years and over | 420 (42.4%) | 311 (19.8%) |
Disability Class: Vision Difficulty
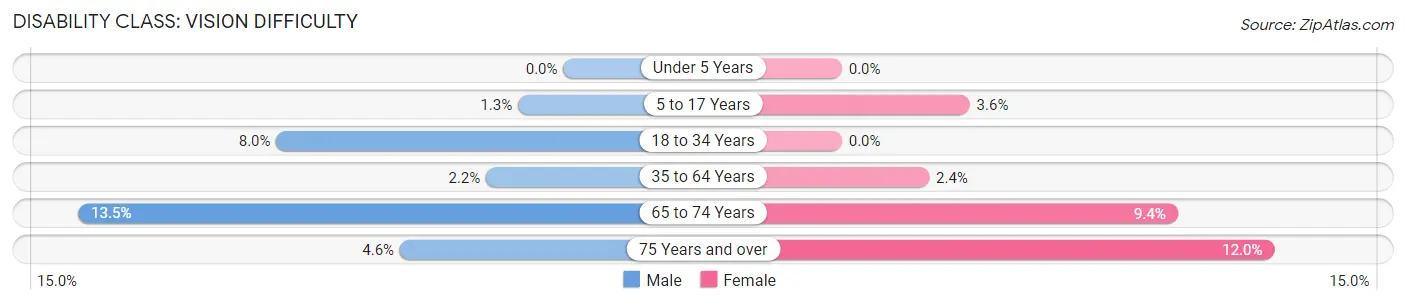
| Age Bracket | Male | Female |
| Under 5 Years | 0 (0.0%) | 0 (0.0%) |
| 5 to 17 Years | 47 (1.3%) | 136 (3.6%) |
| 18 to 34 Years | 467 (8.0%) | 0 (0.0%) |
| 35 to 64 Years | 182 (2.1%) | 196 (2.4%) |
| 65 to 74 Years | 267 (13.5%) | 196 (9.3%) |
| 75 Years and over | 45 (4.5%) | 189 (12.0%) |
Disability Class: Cognitive Difficulty
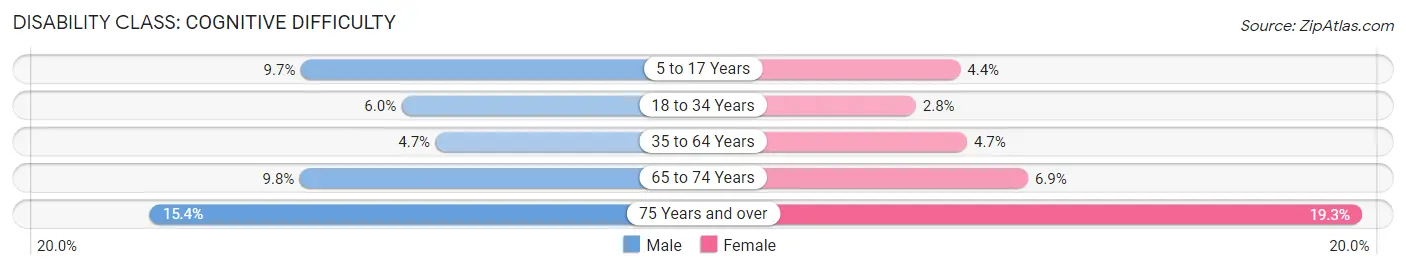
| Age Bracket | Male | Female |
| 5 to 17 Years | 364 (9.7%) | 168 (4.4%) |
| 18 to 34 Years | 350 (6.0%) | 127 (2.8%) |
| 35 to 64 Years | 401 (4.7%) | 375 (4.6%) |
| 65 to 74 Years | 193 (9.8%) | 145 (6.9%) |
| 75 Years and over | 152 (15.3%) | 303 (19.3%) |
Disability Class: Ambulatory Difficulty
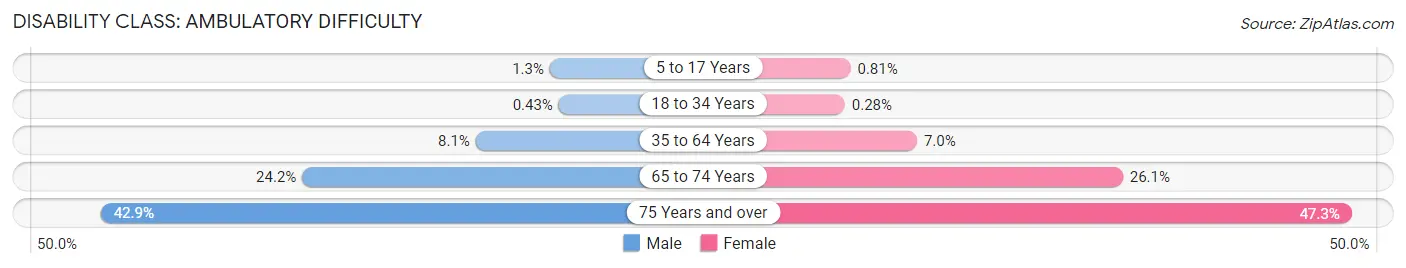
| Age Bracket | Male | Female |
| 5 to 17 Years | 47 (1.3%) | 31 (0.8%) |
| 18 to 34 Years | 25 (0.4%) | 13 (0.3%) |
| 35 to 64 Years | 690 (8.1%) | 562 (7.0%) |
| 65 to 74 Years | 479 (24.2%) | 547 (26.1%) |
| 75 Years and over | 425 (42.9%) | 743 (47.3%) |
Disability Class: Self-Care Difficulty
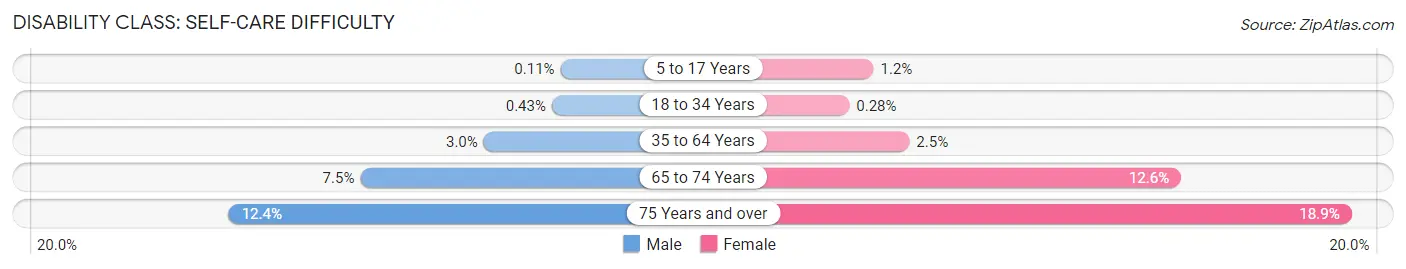
| Age Bracket | Male | Female |
| 5 to 17 Years | 4 (0.1%) | 45 (1.2%) |
| 18 to 34 Years | 25 (0.4%) | 13 (0.3%) |
| 35 to 64 Years | 251 (3.0%) | 202 (2.5%) |
| 65 to 74 Years | 149 (7.5%) | 264 (12.6%) |
| 75 Years and over | 123 (12.4%) | 297 (18.9%) |
Technology Access in Caldwell County
Computing Device Access in Caldwell County
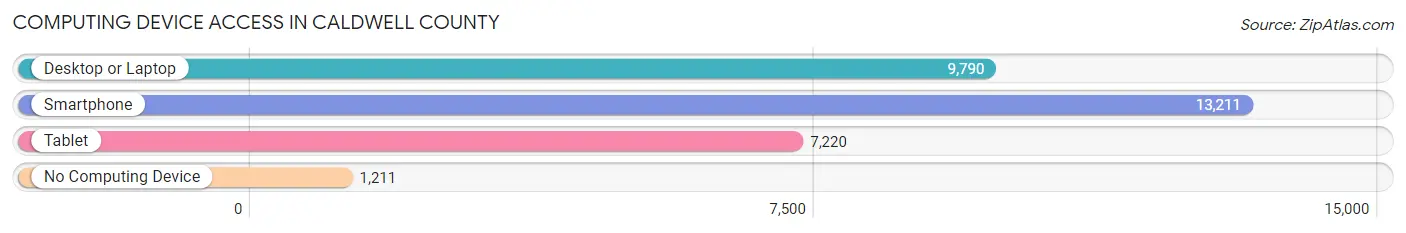
| Device Type | # Households | % Households |
| Desktop or Laptop | 9,790 | 64.9% |
| Smartphone | 13,211 | 87.6% |
| Tablet | 7,220 | 47.9% |
| No Computing Device | 1,211 | 8.0% |
| Total | 15,087 | 100.0% |
Internet Access in Caldwell County
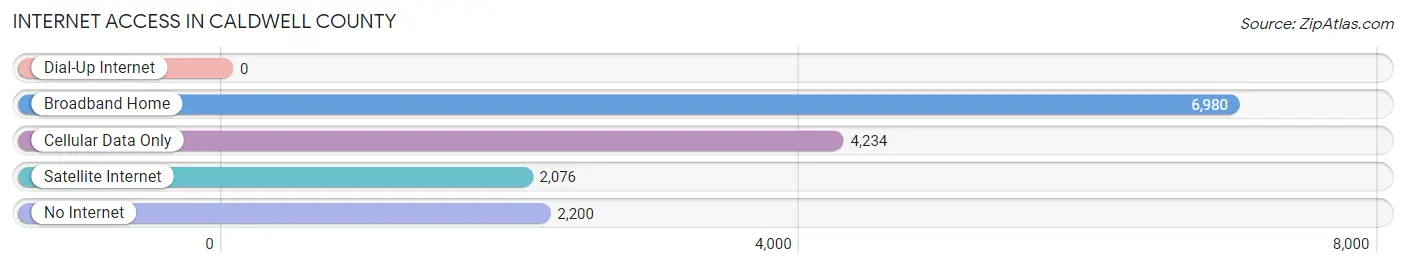
| Internet Type | # Households | % Households |
| Dial-Up Internet | 0 | 0.0% |
| Broadband Home | 6,980 | 46.3% |
| Cellular Data Only | 4,234 | 28.1% |
| Satellite Internet | 2,076 | 13.8% |
| No Internet | 2,200 | 14.6% |
| Total | 15,087 | 100.0% |
Caldwell County Summary
Caldwell County is located in Central Texas, approximately 30 miles southeast of Austin. It is bordered by Bastrop, Hays, Travis, and Guadalupe counties. The county seat is Lockhart, and the population was 38,066 as of the 2010 census.
History
Caldwell County was established in 1848 and named after Mathew Caldwell, a Texas Ranger and signer of the Texas Declaration of Independence. The county was originally part of Bastrop County, but was later divided into its own county. The first settlers in the area were German immigrants who arrived in the 1840s.
Geography
Caldwell County is located in the Hill Country region of Central Texas. It is mostly rural, with rolling hills and wooded areas. The county is drained by the San Marcos and Blanco Rivers. The highest point in the county is the summit of Pilot Knob, which is 1,093 feet above sea level.
Economy
Agriculture is the main economic activity in Caldwell County. The county is home to several large farms and ranches, and the main crops grown are cotton, corn, and hay. The county also has a thriving livestock industry, with cattle, sheep, and goats being the main livestock raised.
In addition to agriculture, Caldwell County also has a growing manufacturing sector. The county is home to several large factories, including a Dell computer plant and a Caterpillar plant. The county also has a growing tourism industry, with several wineries, golf courses, and other attractions.
Demographics
As of the 2010 census, the population of Caldwell County was 38,066. The racial makeup of the county was 79.3% White, 11.7% Hispanic or Latino, 6.2% African American, 0.7% Native American, 0.4% Asian, and 2.1% from other races.
The median household income in Caldwell County was $45,945, and the median family income was $54,945. The per capita income was $21,945. About 14.3% of the population was below the poverty line.
Conclusion
Caldwell County is a rural county located in Central Texas. It has a rich history and a thriving agricultural and manufacturing economy. The population is diverse, with a mix of White, Hispanic, African American, Native American, and Asian residents. The county has a median household income of $45,945 and a per capita income of $21,945.
Common Questions
What is Per Capita Income in Caldwell County?
Per Capita income in Caldwell County is $28,742.
What is the Median Family Income in Caldwell County?
Median Family Income in Caldwell County is $76,740.
What is the Median Household income in Caldwell County?
Median Household Income in Caldwell County is $66,779.
What is Income or Wage Gap in Caldwell County?
Income or Wage Gap in Caldwell County is 36.7%.
Women in Caldwell County earn 63.3 cents for every dollar earned by a man.
What is Inequality or Gini Index in Caldwell County?
Inequality or Gini Index in Caldwell County is 0.41.
What is the Total Population of Caldwell County?
Total Population of Caldwell County is 46,141.
What is the Total Male Population of Caldwell County?
Total Male Population of Caldwell County is 23,228.
What is the Total Female Population of Caldwell County?
Total Female Population of Caldwell County is 22,913.
What is the Ratio of Males per 100 Females in Caldwell County?
There are 101.37 Males per 100 Females in Caldwell County.
What is the Ratio of Females per 100 Males in Caldwell County?
There are 98.64 Females per 100 Males in Caldwell County.
What is the Median Population Age in Caldwell County?
Median Population Age in Caldwell County is 37.8 Years.
What is the Average Family Size in Caldwell County
Average Family Size in Caldwell County is 3.4 People.
What is the Average Household Size in Caldwell County
Average Household Size in Caldwell County is 2.8 People.
How Large is the Labor Force in Caldwell County?
There are 21,084 People in the Labor Forcein in Caldwell County.
What is the Percentage of People in the Labor Force in Caldwell County?
57.0% of People are in the Labor Force in Caldwell County.
What is the Unemployment Rate in Caldwell County?
Unemployment Rate in Caldwell County is 2.4%.