Burnet County, TX Map & Demographics
Burnet County Map
Burnet County Overview
$40,628
PER CAPITA INCOME
$87,136
AVG FAMILY INCOME
$71,482
AVG HOUSEHOLD INCOME
42.0%
WAGE / INCOME GAP [ % ]
58.0¢/ $1
WAGE / INCOME GAP [ $ ]
$10,751
FAMILY INCOME DEFICIT
0.47
INEQUALITY / GINI INDEX
49,684
TOTAL POPULATION
24,537
MALE POPULATION
25,147
FEMALE POPULATION
97.57
MALES / 100 FEMALES
102.49
FEMALES / 100 MALES
44.7
MEDIAN AGE
3.1
AVG FAMILY SIZE
2.6
AVG HOUSEHOLD SIZE
23,976
LABOR FORCE [ PEOPLE ]
58.9%
PERCENT IN LABOR FORCE
3.4%
UNEMPLOYMENT RATE
Income in Burnet County
Income Overview in Burnet County
Per Capita Income in Burnet County is $40,628, while median incomes of families and households are $87,136 and $71,482 respectively.
| Characteristic | Number | Measure |
| Per Capita Income | 49,684 | $40,628 |
| Median Family Income | 13,066 | $87,136 |
| Mean Family Income | 13,066 | $120,372 |
| Median Household Income | 18,629 | $71,482 |
| Mean Household Income | 18,629 | $104,304 |
| Income Deficit | 13,066 | $10,751 |
| Wage / Income Gap (%) | 49,684 | 42.01% |
| Wage / Income Gap ($) | 49,684 | 57.99¢ per $1 |
| Gini / Inequality Index | 49,684 | 0.47 |
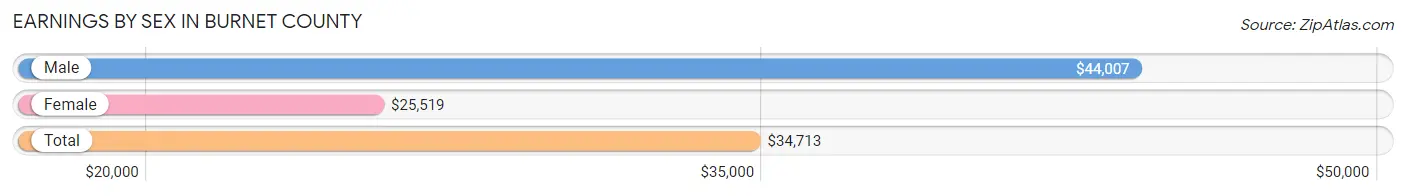
Earnings by Sex in Burnet County
Average Earnings in Burnet County are $34,713, $44,007 for men and $25,519 for women, a difference of 42.0%.
| Sex | Number | Average Earnings |
| Male | 13,265 (52.0%) | $44,007 |
| Female | 12,248 (48.0%) | $25,519 |
| Total | 25,513 (100.0%) | $34,713 |
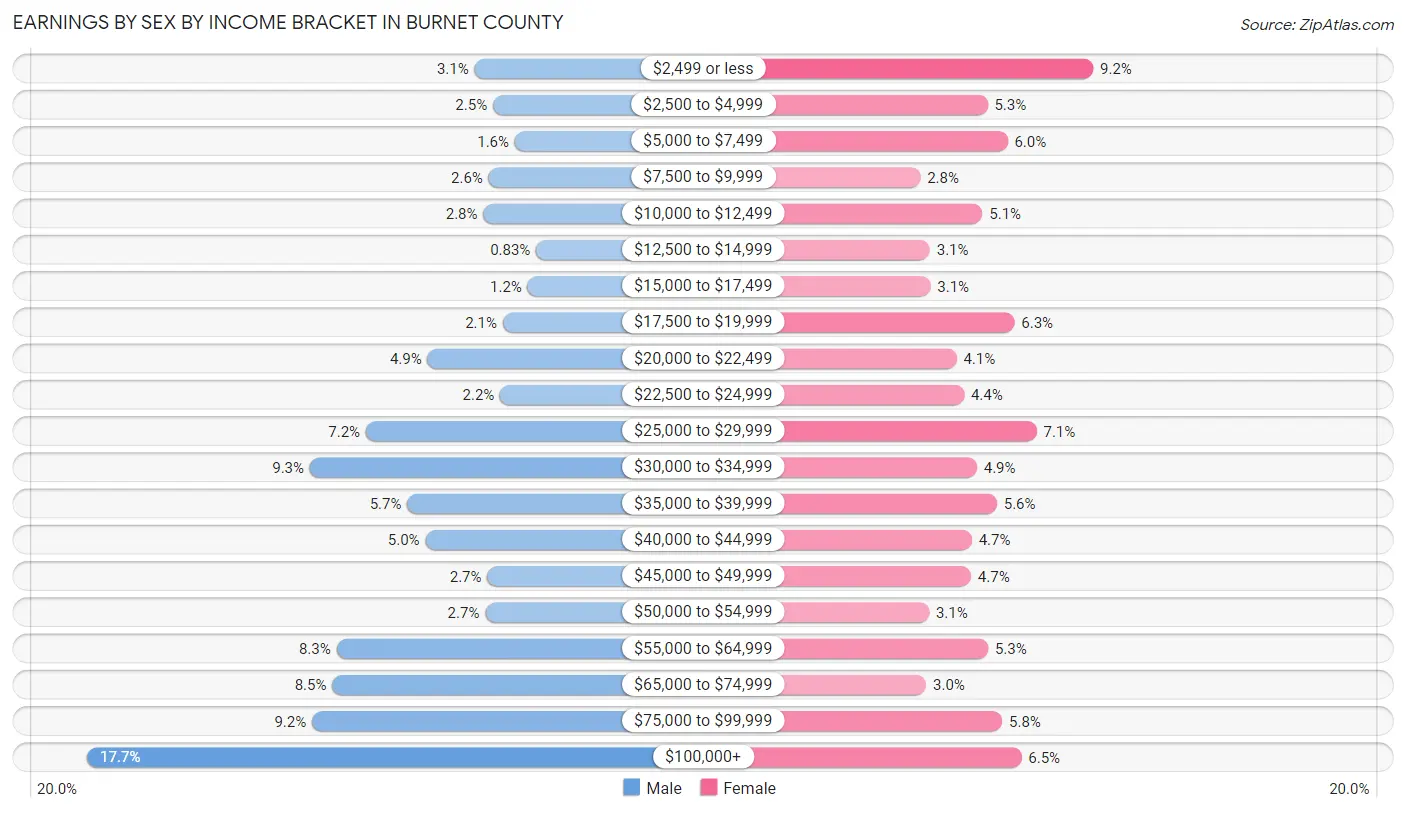
Earnings by Sex by Income Bracket in Burnet County
The most common earnings brackets in Burnet County are $100,000+ for men (2,343 | 17.7%) and $2,499 or less for women (1,131 | 9.2%).
| Income | Male | Female |
| $2,499 or less | 416 (3.1%) | 1,131 (9.2%) |
| $2,500 to $4,999 | 325 (2.5%) | 646 (5.3%) |
| $5,000 to $7,499 | 216 (1.6%) | 737 (6.0%) |
| $7,500 to $9,999 | 346 (2.6%) | 337 (2.8%) |
| $10,000 to $12,499 | 373 (2.8%) | 622 (5.1%) |
| $12,500 to $14,999 | 110 (0.8%) | 381 (3.1%) |
| $15,000 to $17,499 | 152 (1.1%) | 383 (3.1%) |
| $17,500 to $19,999 | 276 (2.1%) | 769 (6.3%) |
| $20,000 to $22,499 | 650 (4.9%) | 503 (4.1%) |
| $22,500 to $24,999 | 289 (2.2%) | 538 (4.4%) |
| $25,000 to $29,999 | 957 (7.2%) | 871 (7.1%) |
| $30,000 to $34,999 | 1,235 (9.3%) | 597 (4.9%) |
| $35,000 to $39,999 | 751 (5.7%) | 688 (5.6%) |
| $40,000 to $44,999 | 660 (5.0%) | 573 (4.7%) |
| $45,000 to $49,999 | 353 (2.7%) | 569 (4.6%) |
| $50,000 to $54,999 | 364 (2.7%) | 377 (3.1%) |
| $55,000 to $64,999 | 1,102 (8.3%) | 648 (5.3%) |
| $65,000 to $74,999 | 1,123 (8.5%) | 364 (3.0%) |
| $75,000 to $99,999 | 1,224 (9.2%) | 713 (5.8%) |
| $100,000+ | 2,343 (17.7%) | 801 (6.5%) |
| Total | 13,265 (100.0%) | 12,248 (100.0%) |
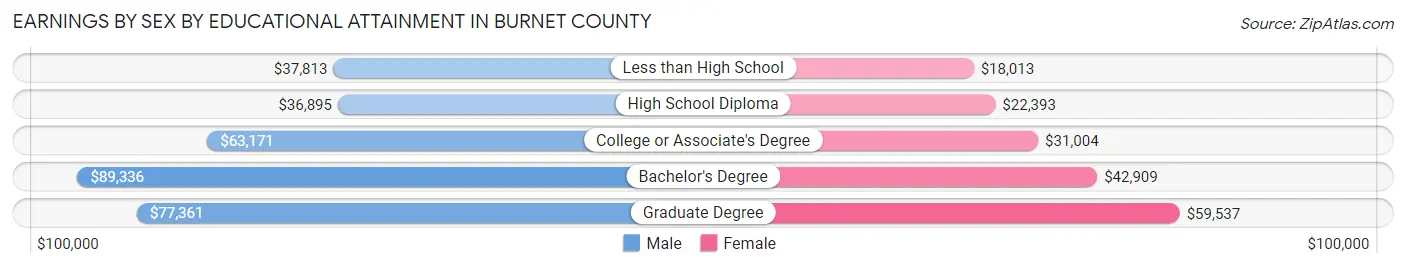
Earnings by Sex by Educational Attainment in Burnet County
Average earnings in Burnet County are $55,177 for men and $30,018 for women, a difference of 45.6%. Men with an educational attainment of bachelor's degree enjoy the highest average annual earnings of $89,336, while those with high school diploma education earn the least with $36,895. Women with an educational attainment of graduate degree earn the most with the average annual earnings of $59,537, while those with less than high school education have the smallest earnings of $18,013.
| Educational Attainment | Male Income | Female Income |
| Less than High School | $37,813 | $18,013 |
| High School Diploma | $36,895 | $22,393 |
| College or Associate's Degree | $63,171 | $31,004 |
| Bachelor's Degree | $89,336 | $42,909 |
| Graduate Degree | $77,361 | $59,537 |
| Total | $55,177 | $30,018 |
Family Income in Burnet County
Family Income Brackets in Burnet County
According to the Burnet County family income data, there are 2,522 families falling into the $100,000 to $149,999 income range, which is the most common income bracket and makes up 19.3% of all families. Conversely, the $10,000 to $14,999 income bracket is the least frequent group with only 91 families (0.7%) belonging to this category.
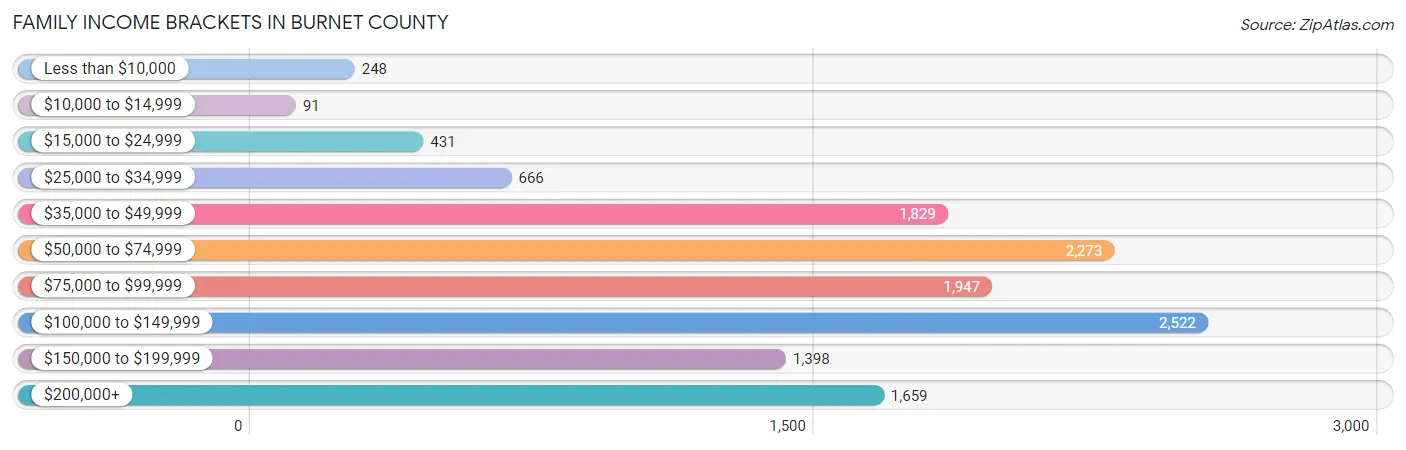
| Income Bracket | # Families | % Families |
| Less than $10,000 | 248 | 1.9% |
| $10,000 to $14,999 | 91 | 0.7% |
| $15,000 to $24,999 | 431 | 3.3% |
| $25,000 to $34,999 | 666 | 5.1% |
| $35,000 to $49,999 | 1,829 | 14.0% |
| $50,000 to $74,999 | 2,273 | 17.4% |
| $75,000 to $99,999 | 1,947 | 14.9% |
| $100,000 to $149,999 | 2,522 | 19.3% |
| $150,000 to $199,999 | 1,398 | 10.7% |
| $200,000+ | 1,659 | 12.7% |
Family Income by Famaliy Size in Burnet County
7+ person families (457 | 3.5%) account for the highest median family income in Burnet County with $129,271 per family, while 2-person families (7,192 | 55.0%) have the highest median income of $42,078 per family member.
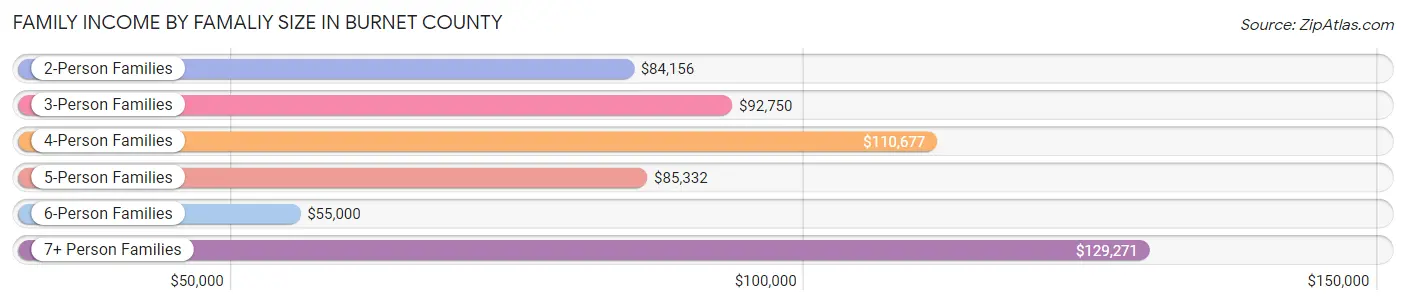
| Income Bracket | # Families | Median Income |
| 2-Person Families | 7,192 (55.0%) | $84,156 |
| 3-Person Families | 2,515 (19.3%) | $92,750 |
| 4-Person Families | 1,215 (9.3%) | $110,677 |
| 5-Person Families | 875 (6.7%) | $85,332 |
| 6-Person Families | 812 (6.2%) | $55,000 |
| 7+ Person Families | 457 (3.5%) | $129,271 |
| Total | 13,066 (100.0%) | $87,136 |
Family Income by Number of Earners in Burnet County
The median family income in Burnet County is $87,136, with families comprising 3+ earners (1,774) having the highest median family income of $138,420, while families with 1 earner (3,400) have the lowest median family income of $66,130, accounting for 13.6% and 26.0% of families, respectively.
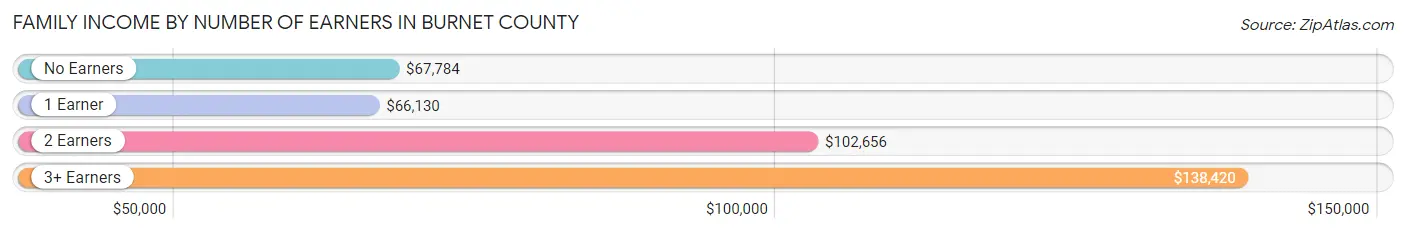
| Number of Earners | # Families | Median Income |
| No Earners | 2,908 (22.3%) | $67,784 |
| 1 Earner | 3,400 (26.0%) | $66,130 |
| 2 Earners | 4,984 (38.1%) | $102,656 |
| 3+ Earners | 1,774 (13.6%) | $138,420 |
| Total | 13,066 (100.0%) | $87,136 |
Household Income in Burnet County
Household Income Brackets in Burnet County
With 3,521 households falling in the category, the $50,000 to $74,999 income range is the most frequent in Burnet County, accounting for 18.9% of all households. In contrast, only 522 households (2.8%) fall into the $10,000 to $14,999 income bracket, making it the least populous group.
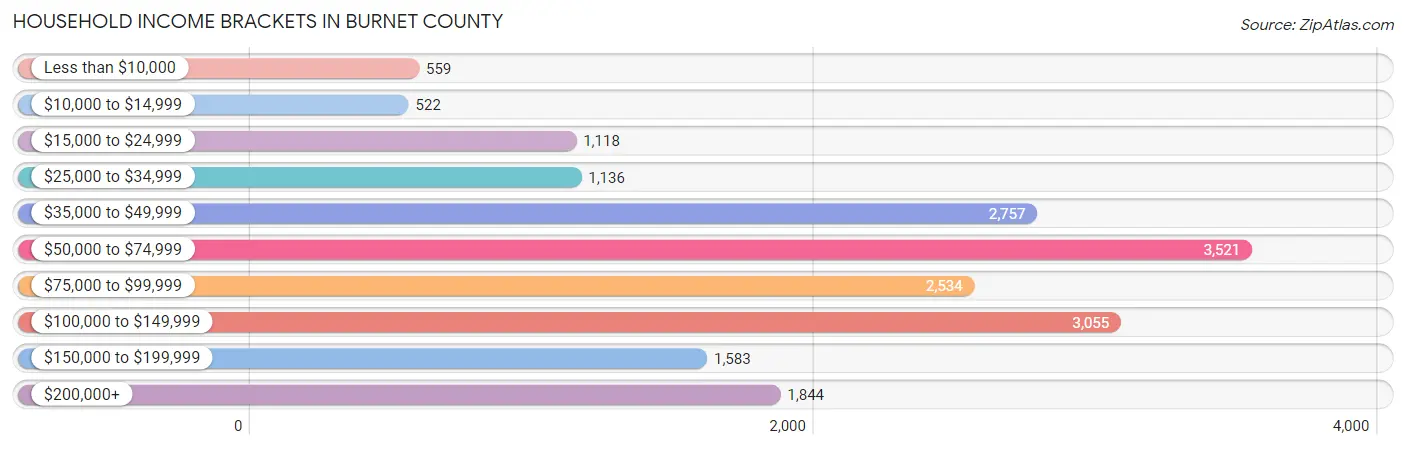
| Income Bracket | # Households | % Households |
| Less than $10,000 | 559 | 3.0% |
| $10,000 to $14,999 | 522 | 2.8% |
| $15,000 to $24,999 | 1,118 | 6.0% |
| $25,000 to $34,999 | 1,136 | 6.1% |
| $35,000 to $49,999 | 2,757 | 14.8% |
| $50,000 to $74,999 | 3,521 | 18.9% |
| $75,000 to $99,999 | 2,534 | 13.6% |
| $100,000 to $149,999 | 3,055 | 16.4% |
| $150,000 to $199,999 | 1,583 | 8.5% |
| $200,000+ | 1,844 | 9.9% |
Household Income by Householder Age in Burnet County
The median household income in Burnet County is $71,482, with the highest median household income of $98,151 found in the 45 to 64 years age bracket for the primary householder. A total of 7,141 households (38.3%) fall into this category. Meanwhile, the 15 to 24 years age bracket for the primary householder has the lowest median household income of $49,853, with 596 households (3.2%) in this group.
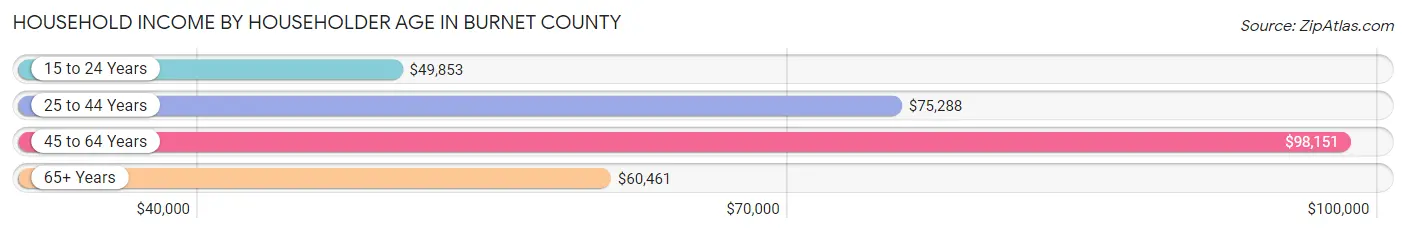
| Income Bracket | # Households | Median Income |
| 15 to 24 Years | 596 (3.2%) | $49,853 |
| 25 to 44 Years | 4,183 (22.5%) | $75,288 |
| 45 to 64 Years | 7,141 (38.3%) | $98,151 |
| 65+ Years | 6,709 (36.0%) | $60,461 |
| Total | 18,629 (100.0%) | $71,482 |
Poverty in Burnet County
Income Below Poverty by Sex and Age in Burnet County
With 7.2% poverty level for males and 8.5% for females among the residents of Burnet County, 15 year old males and 5 year old females are the most vulnerable to poverty, with 92 males (25.1%) and 27 females (35.1%) in their respective age groups living below the poverty level.
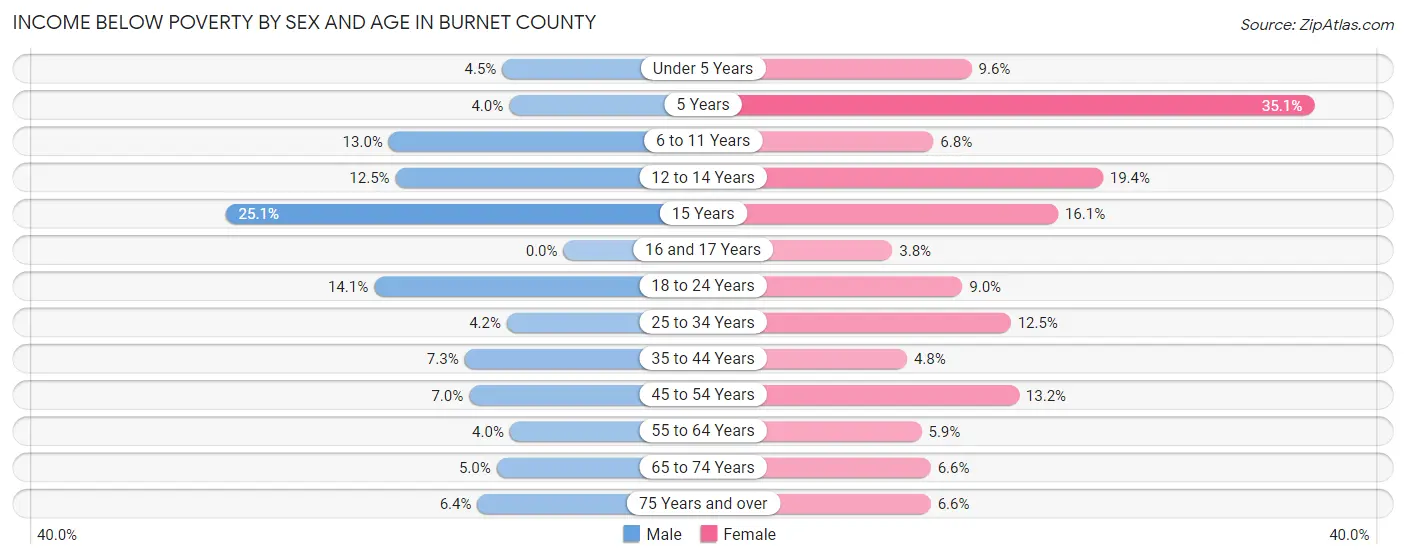
| Age Bracket | Male | Female |
| Under 5 Years | 55 (4.5%) | 109 (9.6%) |
| 5 Years | 10 (4.0%) | 27 (35.1%) |
| 6 to 11 Years | 185 (13.0%) | 119 (6.8%) |
| 12 to 14 Years | 149 (12.5%) | 175 (19.4%) |
| 15 Years | 92 (25.1%) | 52 (16.1%) |
| 16 and 17 Years | 0 (0.0%) | 24 (3.7%) |
| 18 to 24 Years | 294 (14.1%) | 166 (8.9%) |
| 25 to 34 Years | 101 (4.2%) | 310 (12.5%) |
| 35 to 44 Years | 198 (7.3%) | 140 (4.8%) |
| 45 to 54 Years | 193 (7.0%) | 335 (13.2%) |
| 55 to 64 Years | 147 (4.0%) | 238 (5.9%) |
| 65 to 74 Years | 165 (5.0%) | 232 (6.6%) |
| 75 Years and over | 129 (6.4%) | 161 (6.6%) |
| Total | 1,718 (7.2%) | 2,088 (8.5%) |
Income Above Poverty by Sex and Age in Burnet County
According to the poverty statistics in Burnet County, males aged 16 and 17 years and females aged 16 and 17 years are the age groups that are most secure financially, with 100.0% of males and 96.3% of females in these age groups living above the poverty line.
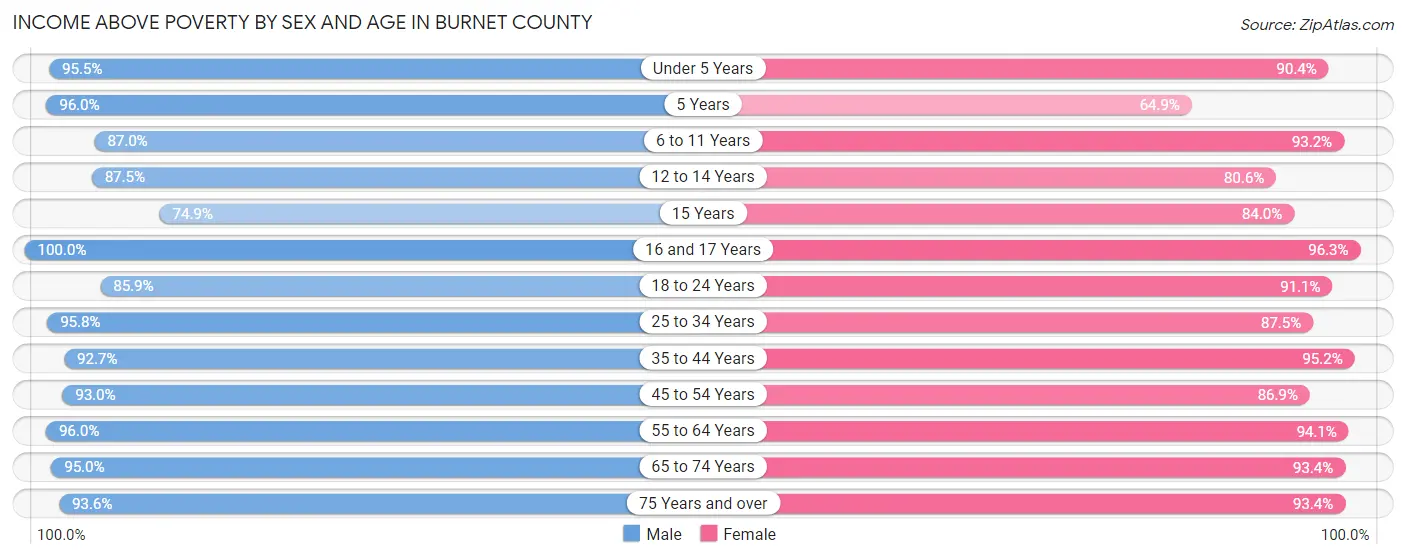
| Age Bracket | Male | Female |
| Under 5 Years | 1,156 (95.5%) | 1,022 (90.4%) |
| 5 Years | 238 (96.0%) | 50 (64.9%) |
| 6 to 11 Years | 1,241 (87.0%) | 1,632 (93.2%) |
| 12 to 14 Years | 1,046 (87.5%) | 728 (80.6%) |
| 15 Years | 275 (74.9%) | 272 (84.0%) |
| 16 and 17 Years | 568 (100.0%) | 616 (96.3%) |
| 18 to 24 Years | 1,797 (85.9%) | 1,689 (91.0%) |
| 25 to 34 Years | 2,301 (95.8%) | 2,163 (87.5%) |
| 35 to 44 Years | 2,500 (92.7%) | 2,755 (95.2%) |
| 45 to 54 Years | 2,564 (93.0%) | 2,212 (86.9%) |
| 55 to 64 Years | 3,549 (96.0%) | 3,781 (94.1%) |
| 65 to 74 Years | 3,164 (95.0%) | 3,285 (93.4%) |
| 75 Years and over | 1,891 (93.6%) | 2,278 (93.4%) |
| Total | 22,290 (92.8%) | 22,483 (91.5%) |
Income Below Poverty Among Married-Couple Families in Burnet County
The poverty statistics for married-couple families in Burnet County show that 3.3% or 344 of the total 10,538 families live below the poverty line. Families with 3 or 4 children have the highest poverty rate of 7.2%, comprising of 79 families. On the other hand, families with 5 or more children have the lowest poverty rate of 0.0%, which includes 0 families.
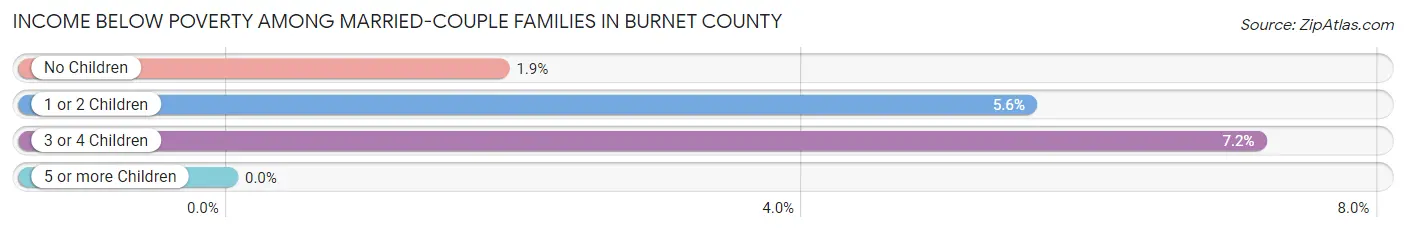
| Children | Above Poverty | Below Poverty |
| No Children | 6,761 (98.1%) | 130 (1.9%) |
| 1 or 2 Children | 2,295 (94.4%) | 135 (5.6%) |
| 3 or 4 Children | 1,025 (92.8%) | 79 (7.2%) |
| 5 or more Children | 113 (100.0%) | 0 (0.0%) |
| Total | 10,194 (96.7%) | 344 (3.3%) |
Income Below Poverty Among Single-Parent Households in Burnet County
According to the poverty data in Burnet County, 5.7% or 46 single-father households and 20.5% or 351 single-mother households are living below the poverty line. Among single-father households, those with no children have the highest poverty rate, with 25 households (7.2%) experiencing poverty. Likewise, among single-mother households, those with 3 or 4 children have the highest poverty rate, with 72 households (59.0%) falling below the poverty line.
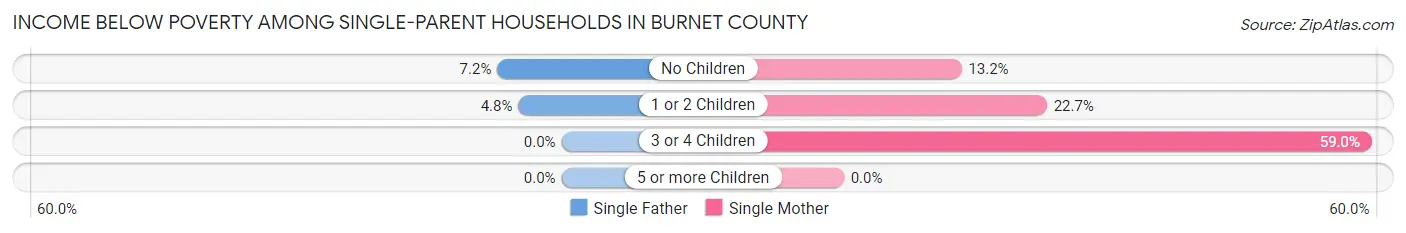
| Children | Single Father | Single Mother |
| No Children | 25 (7.2%) | 105 (13.2%) |
| 1 or 2 Children | 21 (4.8%) | 174 (22.7%) |
| 3 or 4 Children | 0 (0.0%) | 72 (59.0%) |
| 5 or more Children | 0 (0.0%) | 0 (0.0%) |
| Total | 46 (5.7%) | 351 (20.5%) |
Income Below Poverty Among Married-Couple vs Single-Parent Households in Burnet County
The poverty data for Burnet County shows that 344 of the married-couple family households (3.3%) and 397 of the single-parent households (15.7%) are living below the poverty level. Within the married-couple family households, those with 3 or 4 children have the highest poverty rate, with 79 households (7.2%) falling below the poverty line. Among the single-parent households, those with 3 or 4 children have the highest poverty rate, with 72 household (54.1%) living below poverty.
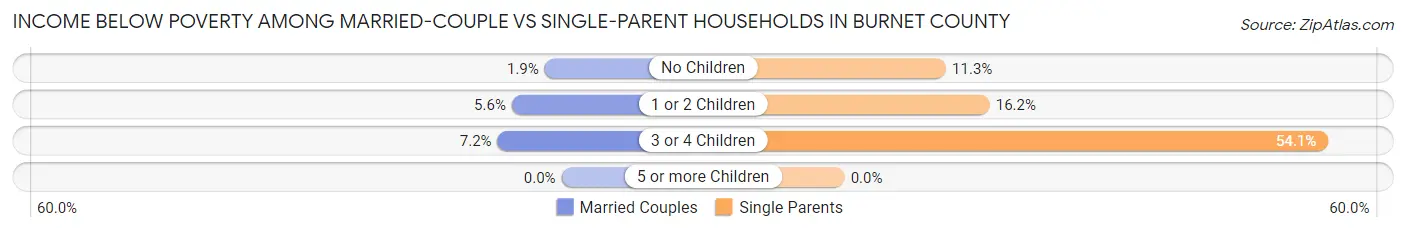
| Children | Married-Couple Families | Single-Parent Households |
| No Children | 130 (1.9%) | 130 (11.3%) |
| 1 or 2 Children | 135 (5.6%) | 195 (16.2%) |
| 3 or 4 Children | 79 (7.2%) | 72 (54.1%) |
| 5 or more Children | 0 (0.0%) | 0 (0.0%) |
| Total | 344 (3.3%) | 397 (15.7%) |
Race in Burnet County
The most populous races in Burnet County are White / Caucasian (40,856 | 82.2%), Hispanic or Latino (11,300 | 22.7%), and Two or more Races (4,873 | 9.8%).
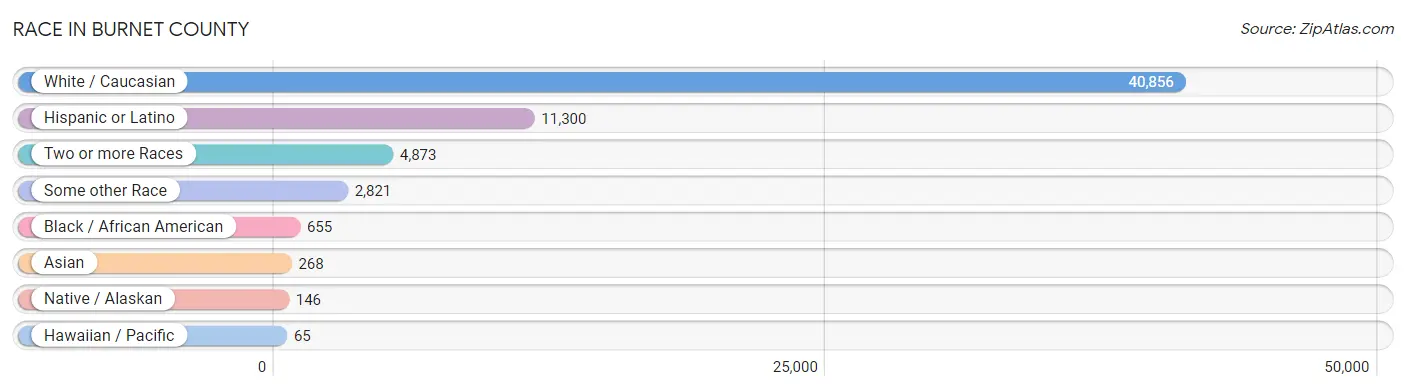
| Race | # Population | % Population |
| Asian | 268 | 0.5% |
| Black / African American | 655 | 1.3% |
| Hawaiian / Pacific | 65 | 0.1% |
| Hispanic or Latino | 11,300 | 22.7% |
| Native / Alaskan | 146 | 0.3% |
| White / Caucasian | 40,856 | 82.2% |
| Two or more Races | 4,873 | 9.8% |
| Some other Race | 2,821 | 5.7% |
| Total | 49,684 | 100.0% |
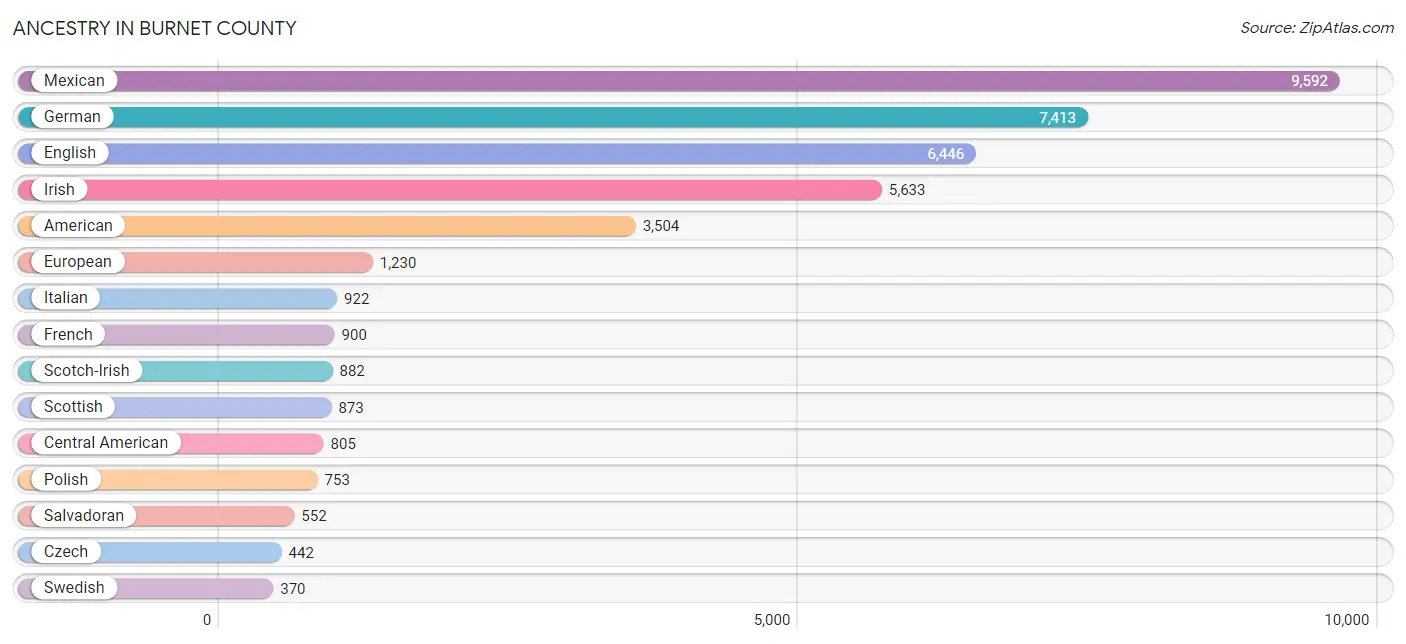
Ancestry in Burnet County
The most populous ancestries reported in Burnet County are Mexican (9,592 | 19.3%), German (7,413 | 14.9%), English (6,446 | 13.0%), Irish (5,633 | 11.3%), and American (3,504 | 7.0%), together accounting for 65.6% of all Burnet County residents.
| Ancestry | # Population | % Population |
| African | 5 | 0.0% |
| Albanian | 36 | 0.1% |
| American | 3,504 | 7.0% |
| Apache | 13 | 0.0% |
| Arab | 43 | 0.1% |
| Austrian | 33 | 0.1% |
| Basque | 5 | 0.0% |
| Belgian | 5 | 0.0% |
| Bhutanese | 28 | 0.1% |
| Blackfeet | 5 | 0.0% |
| Brazilian | 20 | 0.0% |
| British | 158 | 0.3% |
| Bulgarian | 6 | 0.0% |
| Burmese | 36 | 0.1% |
| Cajun | 130 | 0.3% |
| Canadian | 18 | 0.0% |
| Celtic | 13 | 0.0% |
| Central American | 805 | 1.6% |
| Central American Indian | 56 | 0.1% |
| Cherokee | 222 | 0.4% |
| Chickasaw | 57 | 0.1% |
| Chippewa | 66 | 0.1% |
| Choctaw | 37 | 0.1% |
| Comanche | 13 | 0.0% |
| Creek | 2 | 0.0% |
| Croatian | 18 | 0.0% |
| Crow | 11 | 0.0% |
| Cuban | 55 | 0.1% |
| Czech | 442 | 0.9% |
| Czechoslovakian | 37 | 0.1% |
| Danish | 70 | 0.1% |
| Dutch | 267 | 0.5% |
| Eastern European | 3 | 0.0% |
| English | 6,446 | 13.0% |
| European | 1,230 | 2.5% |
| Finnish | 67 | 0.1% |
| French | 900 | 1.8% |
| French Canadian | 29 | 0.1% |
| German | 7,413 | 14.9% |
| Greek | 69 | 0.1% |
| Guamanian / Chamorro | 51 | 0.1% |
| Guatemalan | 176 | 0.4% |
| Honduran | 50 | 0.1% |
| Hungarian | 73 | 0.2% |
| Indian (Asian) | 32 | 0.1% |
| Irish | 5,633 | 11.3% |
| Israeli | 12 | 0.0% |
| Italian | 922 | 1.9% |
| Japanese | 111 | 0.2% |
| Jordanian | 14 | 0.0% |
| Korean | 345 | 0.7% |
| Lebanese | 3 | 0.0% |
| Lithuanian | 43 | 0.1% |
| Mexican | 9,592 | 19.3% |
| Mexican American Indian | 82 | 0.2% |
| Native Hawaiian | 75 | 0.2% |
| New Zealander | 13 | 0.0% |
| Nicaraguan | 26 | 0.1% |
| Northern European | 103 | 0.2% |
| Norwegian | 350 | 0.7% |
| Panamanian | 1 | 0.0% |
| Pennsylvania German | 8 | 0.0% |
| Peruvian | 87 | 0.2% |
| Polish | 753 | 1.5% |
| Portuguese | 58 | 0.1% |
| Puerto Rican | 129 | 0.3% |
| Russian | 9 | 0.0% |
| Salvadoran | 552 | 1.1% |
| Samoan | 38 | 0.1% |
| Scandinavian | 54 | 0.1% |
| Scotch-Irish | 882 | 1.8% |
| Scottish | 873 | 1.8% |
| Serbian | 26 | 0.1% |
| Sioux | 14 | 0.0% |
| Slavic | 25 | 0.1% |
| Slovak | 8 | 0.0% |
| South African | 5 | 0.0% |
| South American | 87 | 0.2% |
| Spaniard | 123 | 0.3% |
| Spanish | 58 | 0.1% |
| Spanish American | 2 | 0.0% |
| Subsaharan African | 10 | 0.0% |
| Swedish | 370 | 0.7% |
| Swiss | 78 | 0.2% |
| Thai | 84 | 0.2% |
| Ukrainian | 6 | 0.0% |
| Ute | 5 | 0.0% |
| Welsh | 203 | 0.4% | View All 88 Rows |
Immigrants in Burnet County
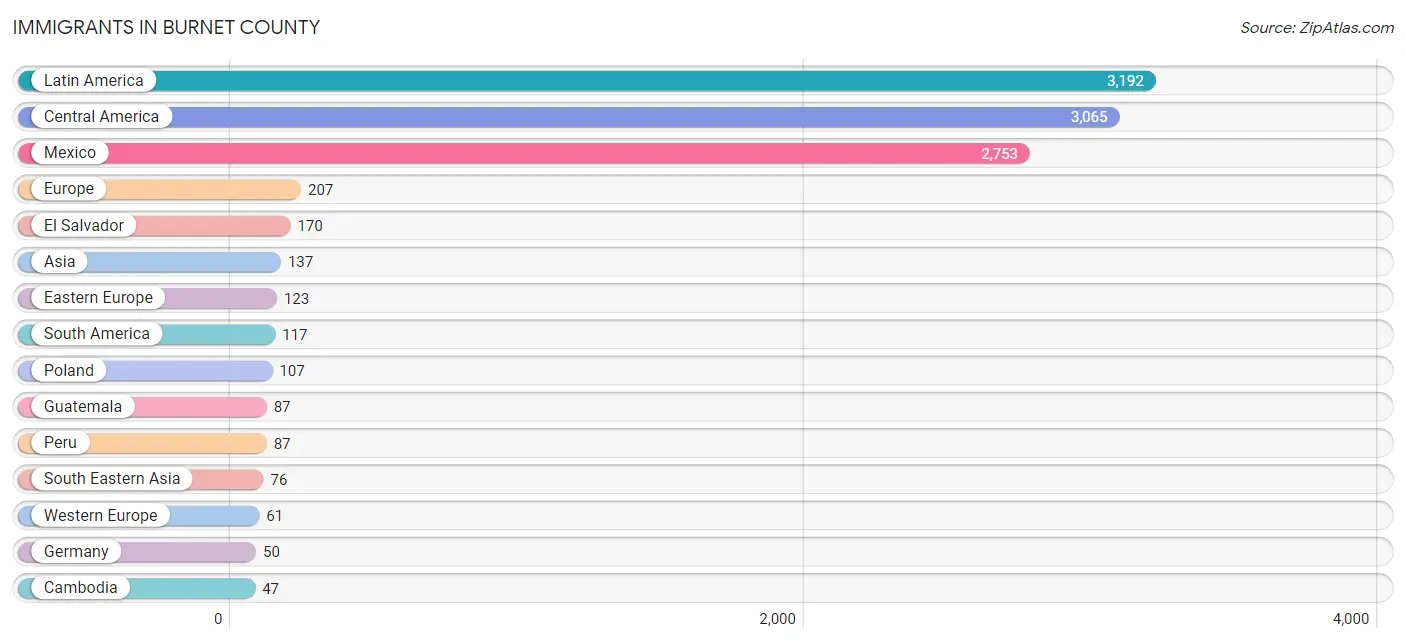
The most numerous immigrant groups reported in Burnet County came from Latin America (3,192 | 6.4%), Central America (3,065 | 6.2%), Mexico (2,753 | 5.5%), Europe (207 | 0.4%), and El Salvador (170 | 0.3%), together accounting for 18.9% of all Burnet County residents.
| Immigration Origin | # Population | % Population |
| Africa | 25 | 0.1% |
| Asia | 137 | 0.3% |
| Brazil | 30 | 0.1% |
| Cambodia | 47 | 0.1% |
| Canada | 20 | 0.0% |
| Caribbean | 10 | 0.0% |
| Central America | 3,065 | 6.2% |
| China | 6 | 0.0% |
| Cuba | 10 | 0.0% |
| Eastern Asia | 29 | 0.1% |
| Eastern Europe | 123 | 0.3% |
| El Salvador | 170 | 0.3% |
| England | 10 | 0.0% |
| Europe | 207 | 0.4% |
| France | 4 | 0.0% |
| Germany | 50 | 0.1% |
| Guatemala | 87 | 0.2% |
| Honduras | 29 | 0.1% |
| India | 20 | 0.0% |
| Ireland | 1 | 0.0% |
| Israel | 12 | 0.0% |
| Italy | 12 | 0.0% |
| Japan | 16 | 0.0% |
| Korea | 7 | 0.0% |
| Latin America | 3,192 | 6.4% |
| Mexico | 2,753 | 5.5% |
| Netherlands | 7 | 0.0% |
| Nicaragua | 26 | 0.1% |
| Northern Europe | 11 | 0.0% |
| Oceania | 7 | 0.0% |
| Peru | 87 | 0.2% |
| Philippines | 29 | 0.1% |
| Poland | 107 | 0.2% |
| Serbia | 4 | 0.0% |
| South Africa | 11 | 0.0% |
| South America | 117 | 0.2% |
| South Central Asia | 20 | 0.0% |
| South Eastern Asia | 76 | 0.2% |
| Southern Europe | 12 | 0.0% |
| Western Asia | 12 | 0.0% |
| Western Europe | 61 | 0.1% | View All 41 Rows |
Sex and Age in Burnet County
Sex and Age in Burnet County
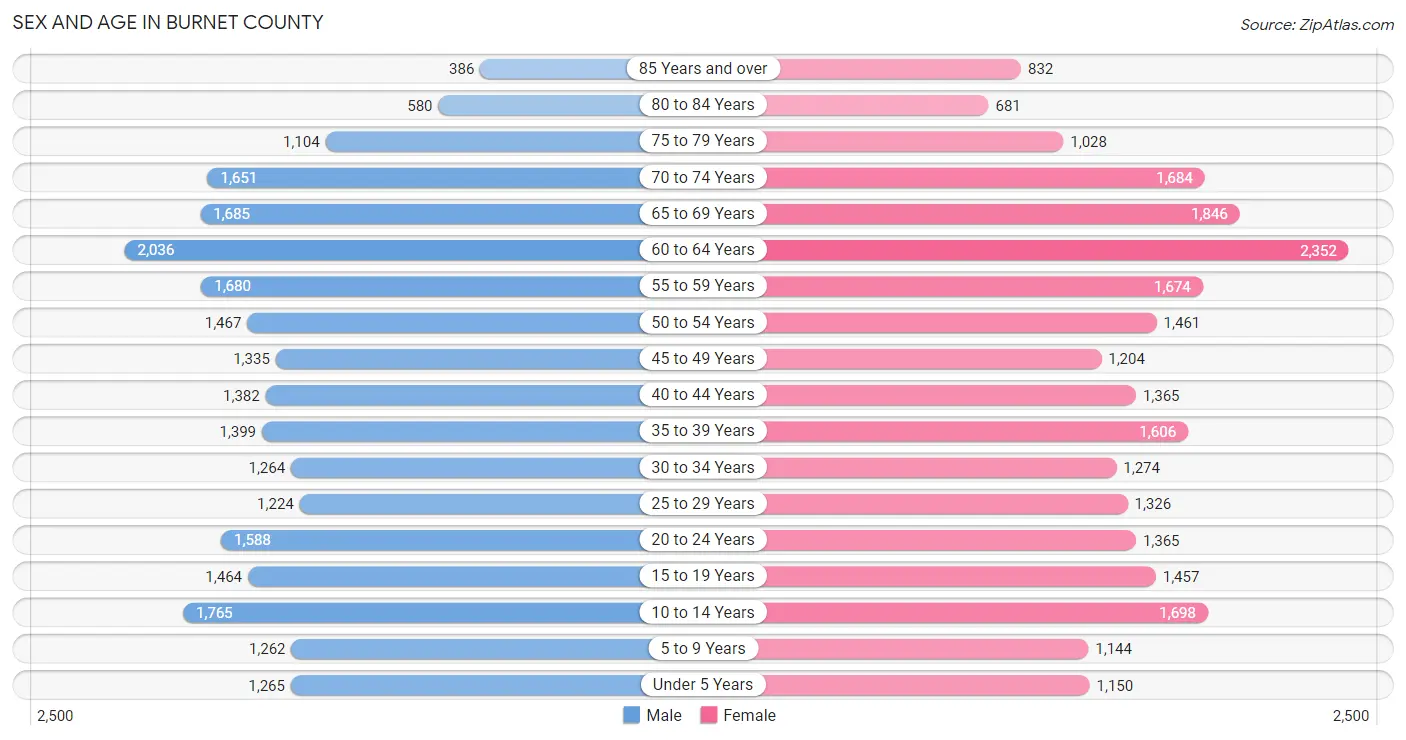
The most populous age groups in Burnet County are 60 to 64 Years (2,036 | 8.3%) for men and 60 to 64 Years (2,352 | 9.3%) for women.
| Age Bracket | Male | Female |
| Under 5 Years | 1,265 (5.2%) | 1,150 (4.6%) |
| 5 to 9 Years | 1,262 (5.1%) | 1,144 (4.5%) |
| 10 to 14 Years | 1,765 (7.2%) | 1,698 (6.8%) |
| 15 to 19 Years | 1,464 (6.0%) | 1,457 (5.8%) |
| 20 to 24 Years | 1,588 (6.5%) | 1,365 (5.4%) |
| 25 to 29 Years | 1,224 (5.0%) | 1,326 (5.3%) |
| 30 to 34 Years | 1,264 (5.1%) | 1,274 (5.1%) |
| 35 to 39 Years | 1,399 (5.7%) | 1,606 (6.4%) |
| 40 to 44 Years | 1,382 (5.6%) | 1,365 (5.4%) |
| 45 to 49 Years | 1,335 (5.4%) | 1,204 (4.8%) |
| 50 to 54 Years | 1,467 (6.0%) | 1,461 (5.8%) |
| 55 to 59 Years | 1,680 (6.9%) | 1,674 (6.7%) |
| 60 to 64 Years | 2,036 (8.3%) | 2,352 (9.3%) |
| 65 to 69 Years | 1,685 (6.9%) | 1,846 (7.3%) |
| 70 to 74 Years | 1,651 (6.7%) | 1,684 (6.7%) |
| 75 to 79 Years | 1,104 (4.5%) | 1,028 (4.1%) |
| 80 to 84 Years | 580 (2.4%) | 681 (2.7%) |
| 85 Years and over | 386 (1.6%) | 832 (3.3%) |
| Total | 24,537 (100.0%) | 25,147 (100.0%) |
Families and Households in Burnet County
Median Family Size in Burnet County
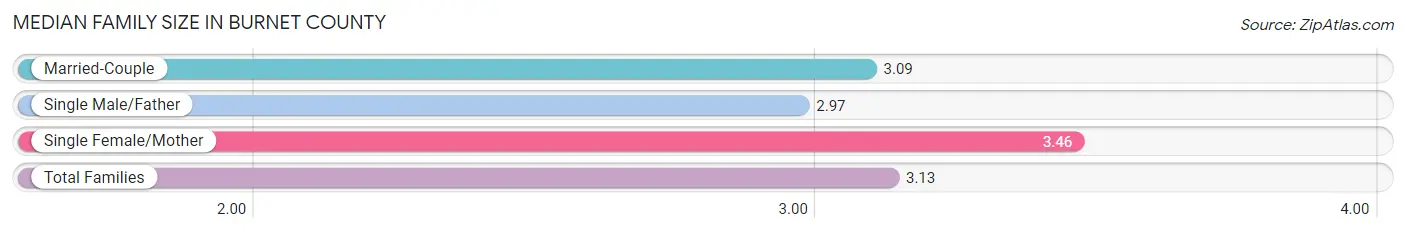
The median family size in Burnet County is 3.13 persons per family, with single female/mother families (1,714 | 13.1%) accounting for the largest median family size of 3.46 persons per family. On the other hand, single male/father families (814 | 6.2%) represent the smallest median family size with 2.97 persons per family.
| Family Type | # Families | Family Size |
| Married-Couple | 10,538 (80.6%) | 3.09 |
| Single Male/Father | 814 (6.2%) | 2.97 |
| Single Female/Mother | 1,714 (13.1%) | 3.46 |
| Total Families | 13,066 (100.0%) | 3.13 |
Median Household Size in Burnet County
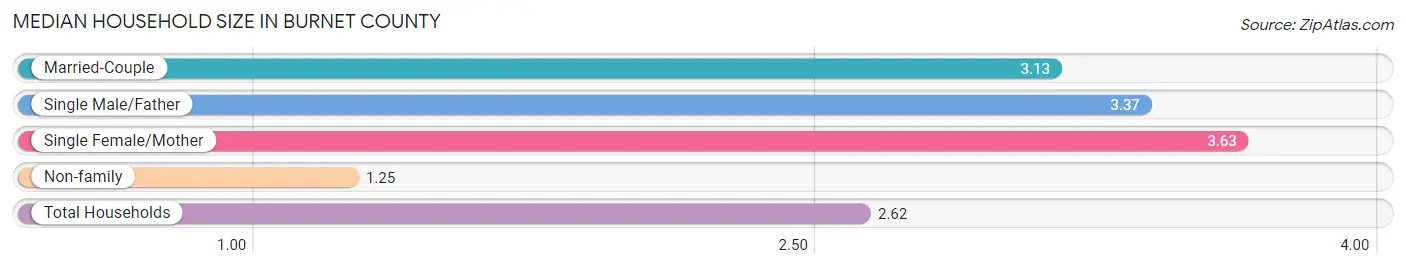
The median household size in Burnet County is 2.62 persons per household, with single female/mother households (1,714 | 9.2%) accounting for the largest median household size of 3.63 persons per household. non-family households (5,563 | 29.9%) represent the smallest median household size with 1.25 persons per household.
| Household Type | # Households | Household Size |
| Married-Couple | 10,538 (56.6%) | 3.13 |
| Single Male/Father | 814 (4.4%) | 3.37 |
| Single Female/Mother | 1,714 (9.2%) | 3.63 |
| Non-family | 5,563 (29.9%) | 1.25 |
| Total Households | 18,629 (100.0%) | 2.62 |
Household Size by Marriage Status in Burnet County
Out of a total of 18,629 households in Burnet County, 13,066 (70.1%) are family households, while 5,563 (29.9%) are nonfamily households. The most numerous type of family households are 2-person households, comprising 6,681, and the most common type of nonfamily households are 1-person households, comprising 4,668.
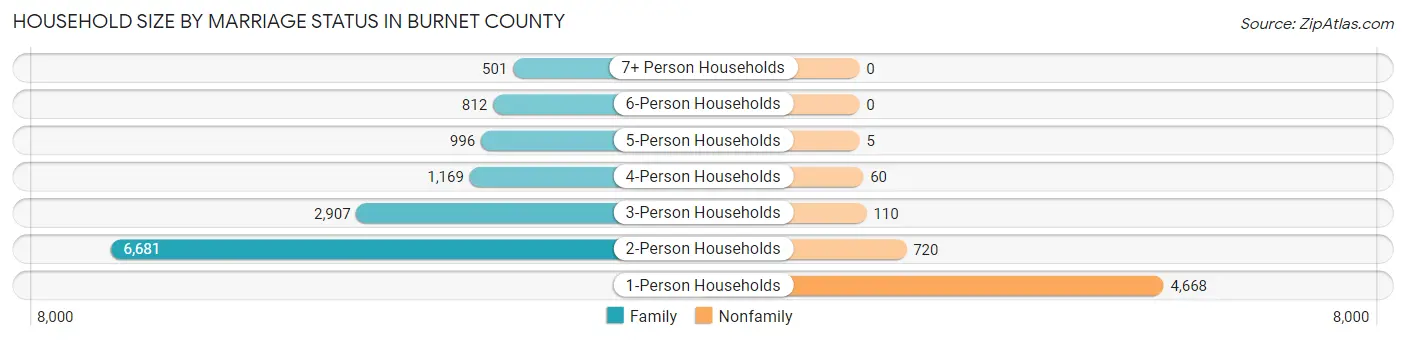
| Household Size | Family Households | Nonfamily Households |
| 1-Person Households | - | 4,668 (25.1%) |
| 2-Person Households | 6,681 (35.9%) | 720 (3.9%) |
| 3-Person Households | 2,907 (15.6%) | 110 (0.6%) |
| 4-Person Households | 1,169 (6.3%) | 60 (0.3%) |
| 5-Person Households | 996 (5.3%) | 5 (0.0%) |
| 6-Person Households | 812 (4.4%) | 0 (0.0%) |
| 7+ Person Households | 501 (2.7%) | 0 (0.0%) |
| Total | 13,066 (70.1%) | 5,563 (29.9%) |
Female Fertility in Burnet County
Fertility by Age in Burnet County
Average fertility rate in Burnet County is 35.0 births per 1,000 women. Women in the age bracket of 20 to 34 years have the highest fertility rate with 57.0 births per 1,000 women. Women in the age bracket of 20 to 34 years acount for 66.6% of all women with births.
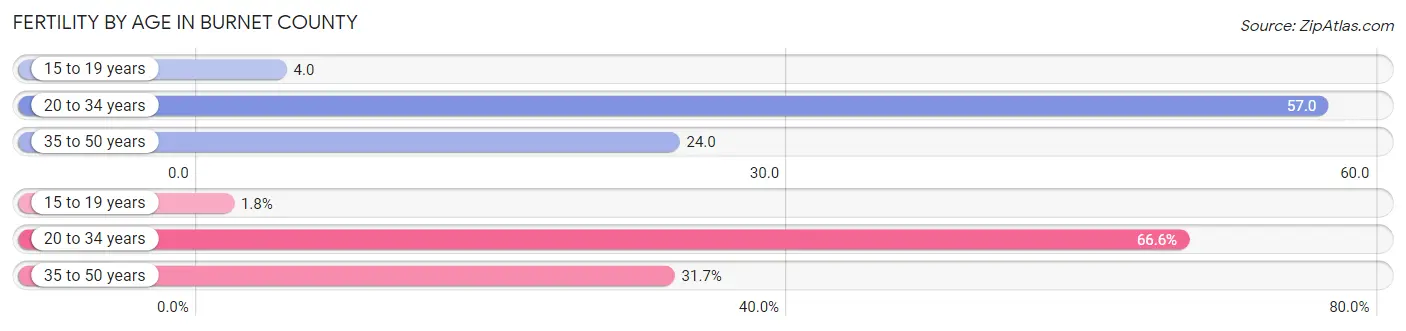
| Age Bracket | Women with Births | Births / 1,000 Women |
| 15 to 19 years | 6 (1.8%) | 4.0 |
| 20 to 34 years | 227 (66.6%) | 57.0 |
| 35 to 50 years | 108 (31.7%) | 24.0 |
| Total | 341 (100.0%) | 35.0 |
Fertility by Age by Marriage Status in Burnet County
71.6% of women with births (341) in Burnet County are married. The highest percentage of unmarried women with births falls into 15 to 19 years age bracket with 100.0% of them unmarried at the time of birth, while the lowest percentage of unmarried women with births belong to 35 to 50 years age bracket with 0.0% of them unmarried.
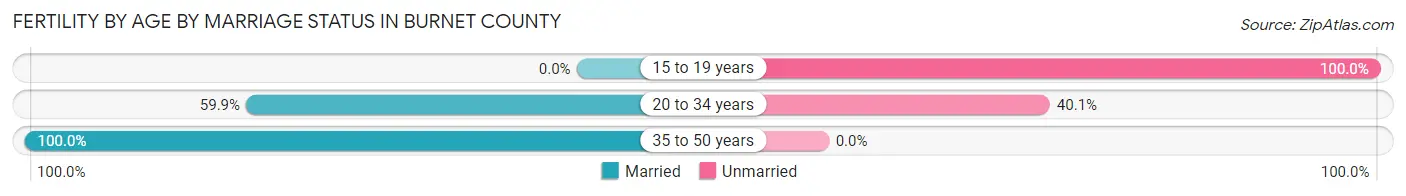
| Age Bracket | Married | Unmarried |
| 15 to 19 years | 0 (0.0%) | 6 (100.0%) |
| 20 to 34 years | 136 (59.9%) | 91 (40.1%) |
| 35 to 50 years | 108 (100.0%) | 0 (0.0%) |
| Total | 244 (71.6%) | 97 (28.4%) |
Fertility by Education in Burnet County
Average fertility rate in Burnet County is 35.0 births per 1,000 women. Women with the education attainment of graduate degree have the highest fertility rate of 69.0 births per 1,000 women, while women with the education attainment of bachelor's degree have the lowest fertility at 9.0 births per 1,000 women. Women with the education attainment of high school diploma represent 34.3% of all women with births.
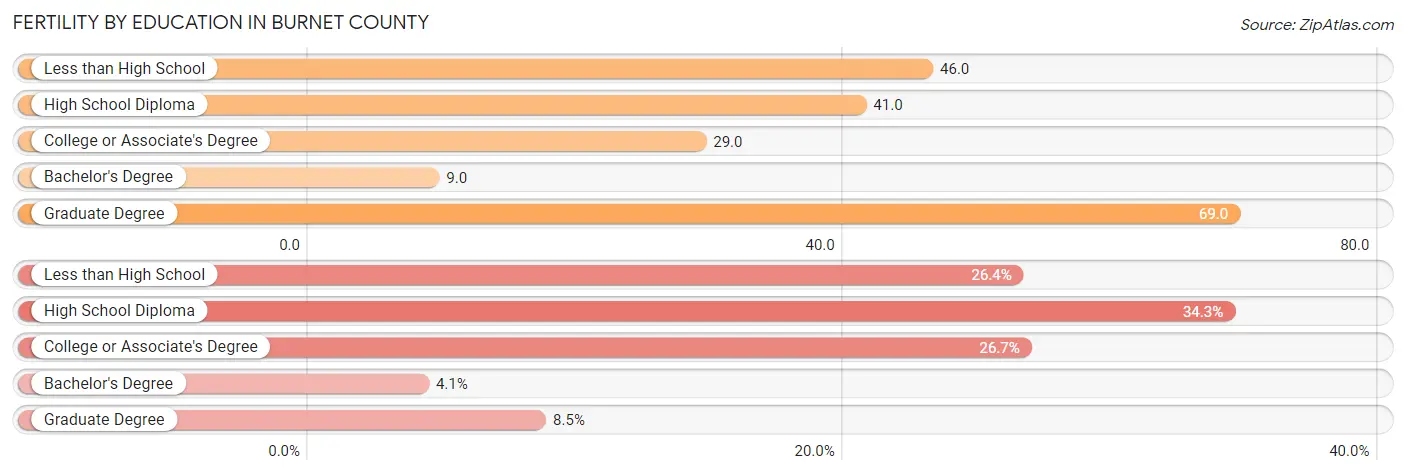
| Educational Attainment | Women with Births | Births / 1,000 Women |
| Less than High School | 90 (26.4%) | 46.0 |
| High School Diploma | 117 (34.3%) | 41.0 |
| College or Associate's Degree | 91 (26.7%) | 29.0 |
| Bachelor's Degree | 14 (4.1%) | 9.0 |
| Graduate Degree | 29 (8.5%) | 69.0 |
| Total | 341 (100.0%) | 35.0 |
Fertility by Education by Marriage Status in Burnet County
28.4% of women with births in Burnet County are unmarried. Women with the educational attainment of college or associate's degree are most likely to be married with 100.0% of them married at childbirth, while women with the educational attainment of less than high school are least likely to be married with 100.0% of them unmarried at childbirth.
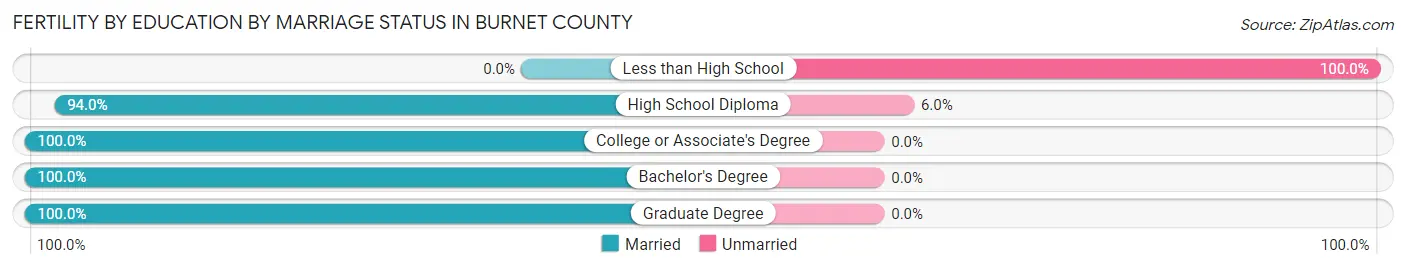
| Educational Attainment | Married | Unmarried |
| Less than High School | 0 (0.0%) | 90 (100.0%) |
| High School Diploma | 110 (94.0%) | 7 (6.0%) |
| College or Associate's Degree | 91 (100.0%) | 0 (0.0%) |
| Bachelor's Degree | 14 (100.0%) | 0 (0.0%) |
| Graduate Degree | 29 (100.0%) | 0 (0.0%) |
| Total | 244 (71.6%) | 97 (28.4%) |
Employment Characteristics in Burnet County
Employment by Class of Employer in Burnet County
Among the 22,760 employed individuals in Burnet County, private company employees (13,580 | 59.7%), self-employed (not incorporated) (2,521 | 11.1%), and not-for-profit organizations (2,162 | 9.5%) make up the most common classes of employment.
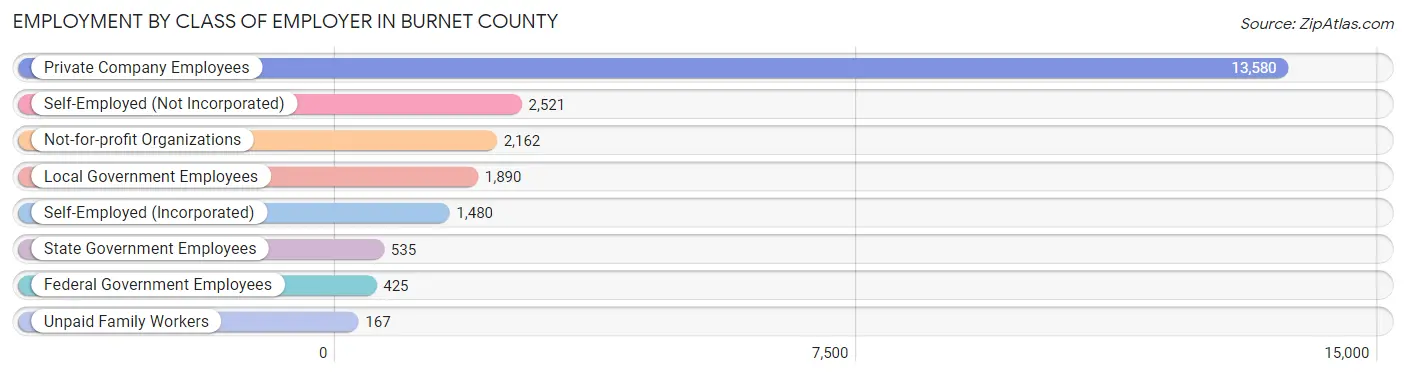
| Employer Class | # Employees | % Employees |
| Private Company Employees | 13,580 | 59.7% |
| Self-Employed (Incorporated) | 1,480 | 6.5% |
| Self-Employed (Not Incorporated) | 2,521 | 11.1% |
| Not-for-profit Organizations | 2,162 | 9.5% |
| Local Government Employees | 1,890 | 8.3% |
| State Government Employees | 535 | 2.4% |
| Federal Government Employees | 425 | 1.9% |
| Unpaid Family Workers | 167 | 0.7% |
| Total | 22,760 | 100.0% |
Employment Status by Age in Burnet County
According to the labor force statistics for Burnet County, out of the total population over 16 years of age (40,706), 58.9% or 23,976 individuals are in the labor force, with 3.4% or 815 of them unemployed. The age group with the highest labor force participation rate is 35 to 44 years, with 83.0% or 4,774 individuals in the labor force. Within the labor force, the 25 to 29 years age range has the highest percentage of unemployed individuals, with 12.1% or 241 of them being unemployed.
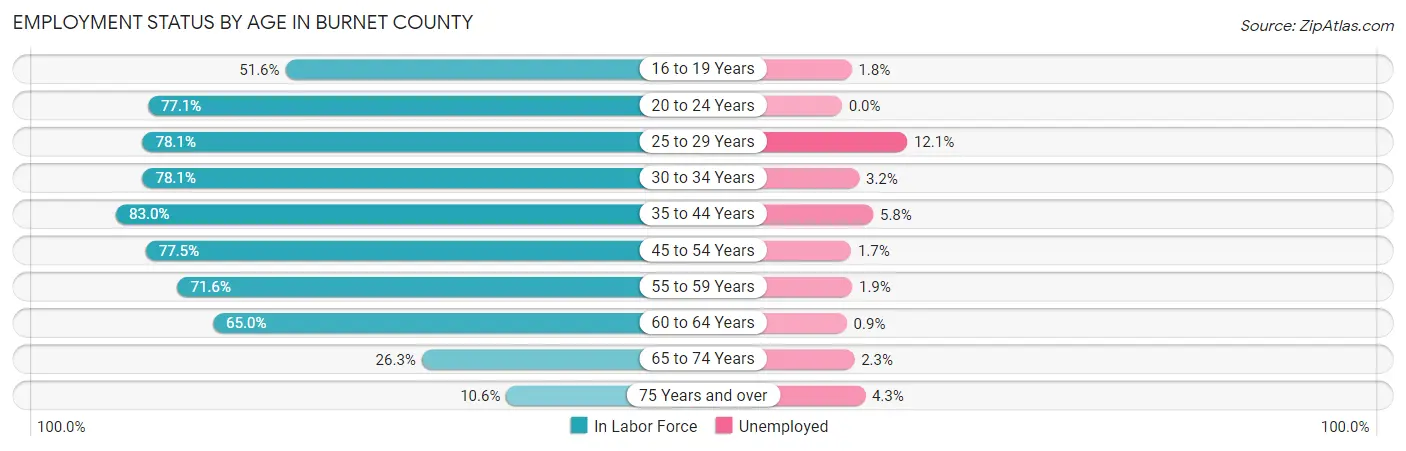
| Age Bracket | In Labor Force | Unemployed |
| 16 to 19 Years | 1,149 (51.6%) | 21 (1.8%) |
| 20 to 24 Years | 2,277 (77.1%) | 0 (0.0%) |
| 25 to 29 Years | 1,992 (78.1%) | 241 (12.1%) |
| 30 to 34 Years | 1,982 (78.1%) | 63 (3.2%) |
| 35 to 44 Years | 4,774 (83.0%) | 277 (5.8%) |
| 45 to 54 Years | 4,237 (77.5%) | 72 (1.7%) |
| 55 to 59 Years | 2,401 (71.6%) | 46 (1.9%) |
| 60 to 64 Years | 2,852 (65.0%) | 26 (0.9%) |
| 65 to 74 Years | 1,806 (26.3%) | 42 (2.3%) |
| 75 Years and over | 489 (10.6%) | 21 (4.3%) |
| Total | 23,976 (58.9%) | 815 (3.4%) |
Employment Status by Educational Attainment in Burnet County
According to labor force statistics for Burnet County, 75.8% of individuals (18,229) out of the total population between 25 and 64 years of age (24,049) are in the labor force, with 4.0% or 729 of them being unemployed. The group with the highest labor force participation rate are those with the educational attainment of bachelor's degree or higher, with 81.1% or 5,061 individuals in the labor force. Within the labor force, individuals with less than high school education have the highest percentage of unemployment, with 7.0% or 152 of them being unemployed.
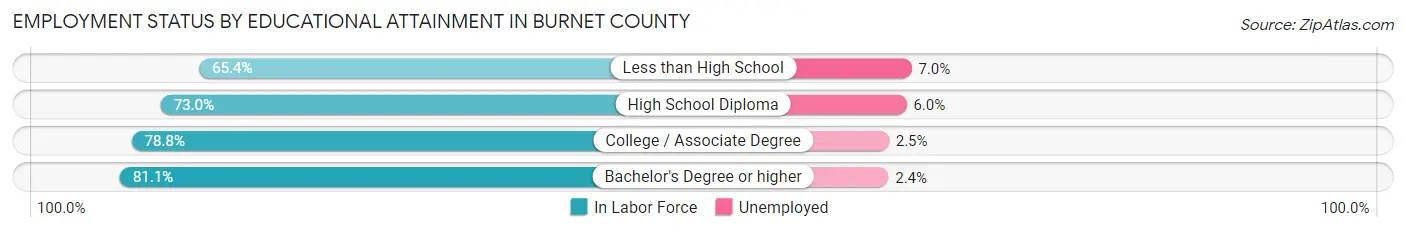
| Educational Attainment | In Labor Force | Unemployed |
| Less than High School | 2,173 (65.4%) | 233 (7.0%) |
| High School Diploma | 5,171 (73.0%) | 425 (6.0%) |
| College / Associate Degree | 5,834 (78.8%) | 185 (2.5%) |
| Bachelor's Degree or higher | 5,061 (81.1%) | 150 (2.4%) |
| Total | 18,229 (75.8%) | 962 (4.0%) |
Employment Occupations by Sex in Burnet County
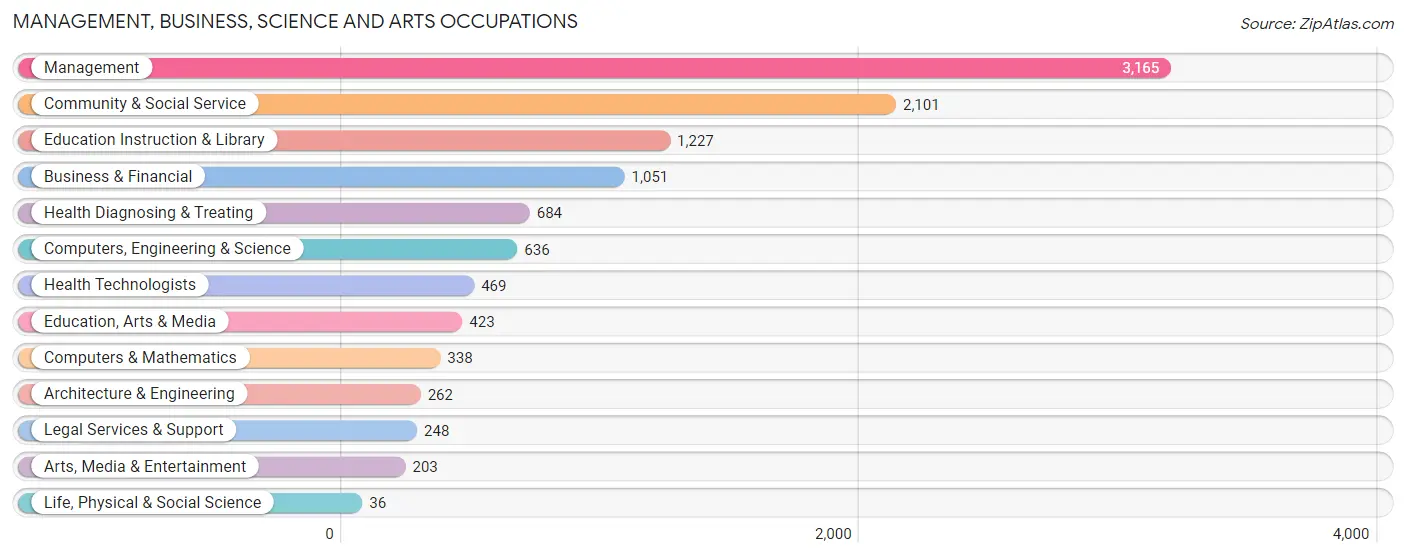
Management, Business, Science and Arts Occupations
The most common Management, Business, Science and Arts occupations in Burnet County are Management (3,165 | 13.7%), Community & Social Service (2,101 | 9.1%), Education Instruction & Library (1,227 | 5.3%), Business & Financial (1,051 | 4.5%), and Health Diagnosing & Treating (684 | 3.0%).
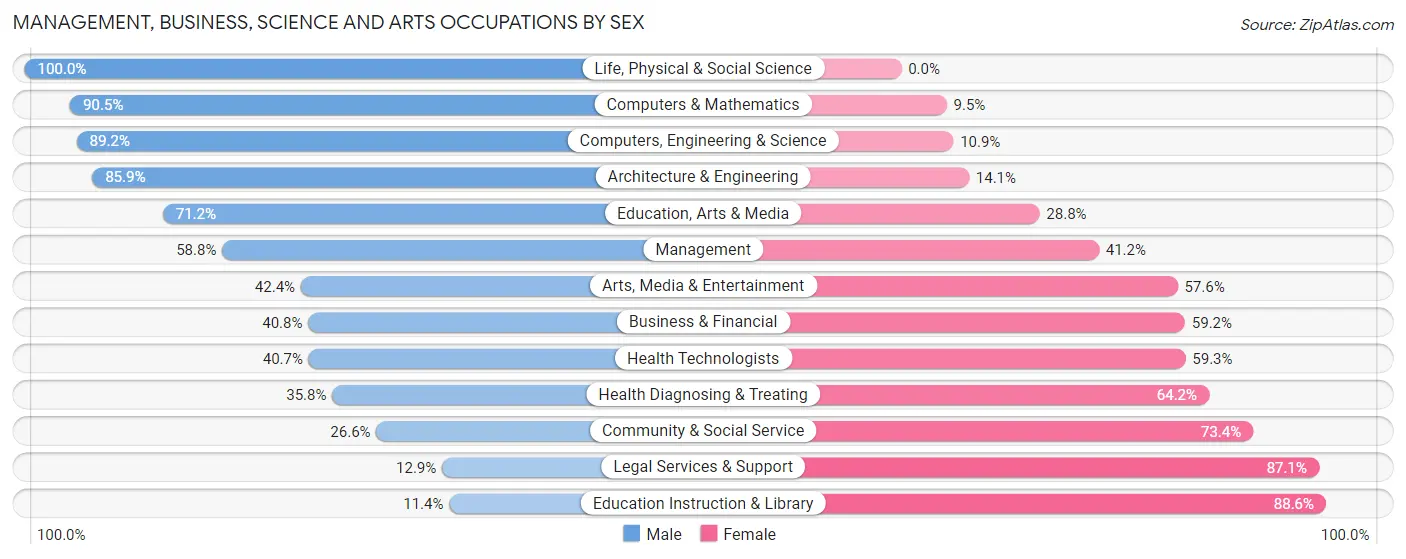
Management, Business, Science and Arts Occupations by Sex
Within the Management, Business, Science and Arts occupations in Burnet County, the most male-oriented occupations are Life, Physical & Social Science (100.0%), Computers & Mathematics (90.5%), and Computers, Engineering & Science (89.1%), while the most female-oriented occupations are Education Instruction & Library (88.6%), Legal Services & Support (87.1%), and Community & Social Service (73.4%).
| Occupation | Male | Female |
| Management | 1,860 (58.8%) | 1,305 (41.2%) |
| Business & Financial | 429 (40.8%) | 622 (59.2%) |
| Computers, Engineering & Science | 567 (89.1%) | 69 (10.8%) |
| Computers & Mathematics | 306 (90.5%) | 32 (9.5%) |
| Architecture & Engineering | 225 (85.9%) | 37 (14.1%) |
| Life, Physical & Social Science | 36 (100.0%) | 0 (0.0%) |
| Community & Social Service | 559 (26.6%) | 1,542 (73.4%) |
| Education, Arts & Media | 301 (71.2%) | 122 (28.8%) |
| Legal Services & Support | 32 (12.9%) | 216 (87.1%) |
| Education Instruction & Library | 140 (11.4%) | 1,087 (88.6%) |
| Arts, Media & Entertainment | 86 (42.4%) | 117 (57.6%) |
| Health Diagnosing & Treating | 245 (35.8%) | 439 (64.2%) |
| Health Technologists | 191 (40.7%) | 278 (59.3%) |
| Total (Category) | 3,660 (47.9%) | 3,977 (52.1%) |
| Total (Overall) | 12,296 (53.2%) | 10,832 (46.8%) |
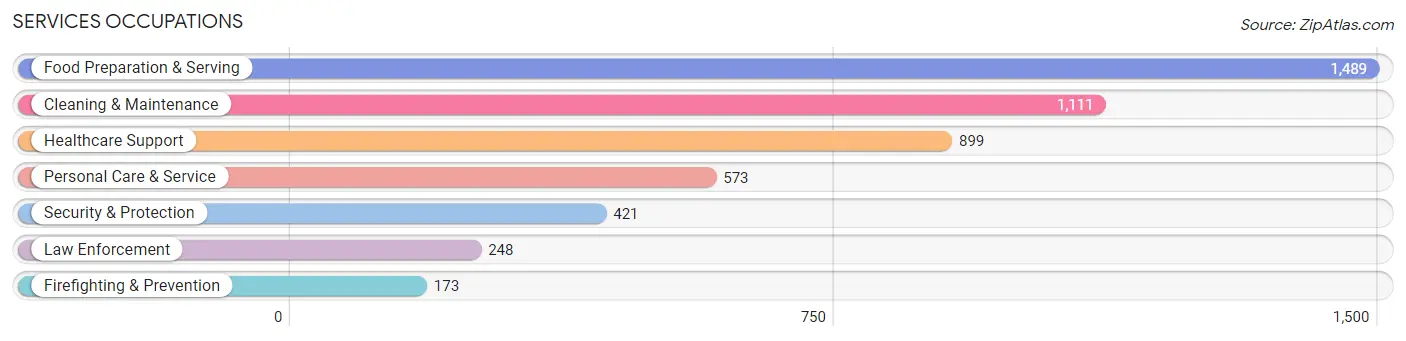
Services Occupations
The most common Services occupations in Burnet County are Food Preparation & Serving (1,489 | 6.4%), Cleaning & Maintenance (1,111 | 4.8%), Healthcare Support (899 | 3.9%), Personal Care & Service (573 | 2.5%), and Security & Protection (421 | 1.8%).
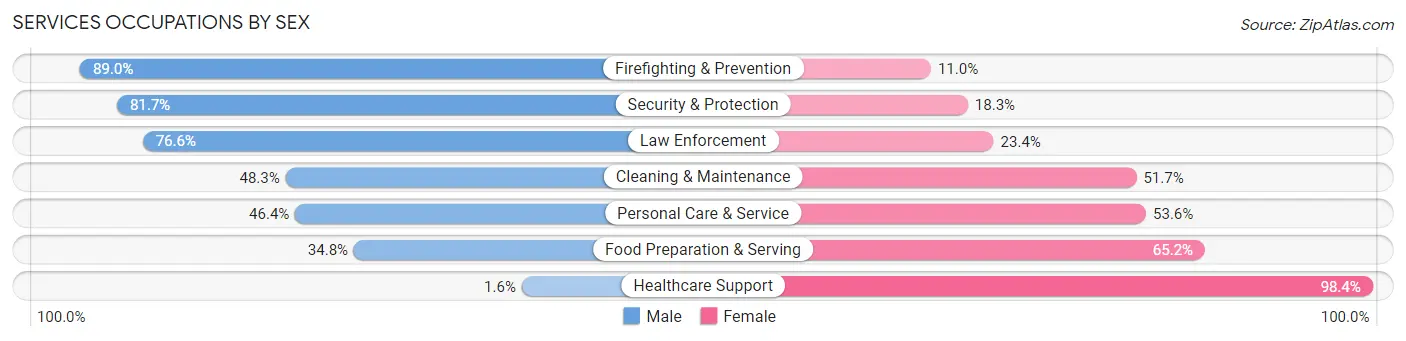
Services Occupations by Sex
Within the Services occupations in Burnet County, the most male-oriented occupations are Firefighting & Prevention (89.0%), Security & Protection (81.7%), and Law Enforcement (76.6%), while the most female-oriented occupations are Healthcare Support (98.4%), Food Preparation & Serving (65.2%), and Personal Care & Service (53.6%).
| Occupation | Male | Female |
| Healthcare Support | 14 (1.6%) | 885 (98.4%) |
| Security & Protection | 344 (81.7%) | 77 (18.3%) |
| Firefighting & Prevention | 154 (89.0%) | 19 (11.0%) |
| Law Enforcement | 190 (76.6%) | 58 (23.4%) |
| Food Preparation & Serving | 518 (34.8%) | 971 (65.2%) |
| Cleaning & Maintenance | 537 (48.3%) | 574 (51.7%) |
| Personal Care & Service | 266 (46.4%) | 307 (53.6%) |
| Total (Category) | 1,679 (37.4%) | 2,814 (62.6%) |
| Total (Overall) | 12,296 (53.2%) | 10,832 (46.8%) |
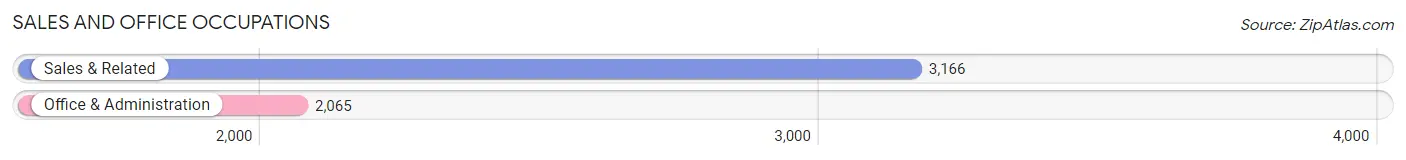
Sales and Office Occupations
The most common Sales and Office occupations in Burnet County are Sales & Related (3,166 | 13.7%), and Office & Administration (2,065 | 8.9%).
Sales and Office Occupations by Sex
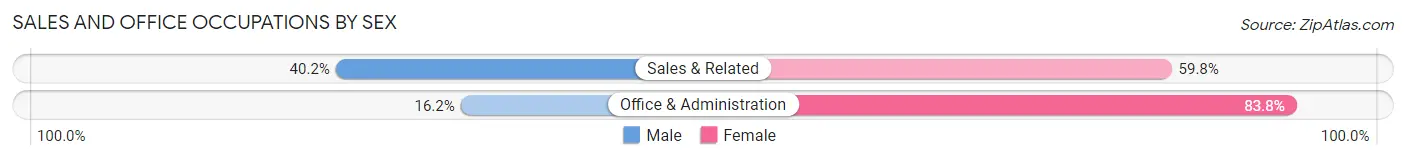
| Occupation | Male | Female |
| Sales & Related | 1,272 (40.2%) | 1,894 (59.8%) |
| Office & Administration | 334 (16.2%) | 1,731 (83.8%) |
| Total (Category) | 1,606 (30.7%) | 3,625 (69.3%) |
| Total (Overall) | 12,296 (53.2%) | 10,832 (46.8%) |
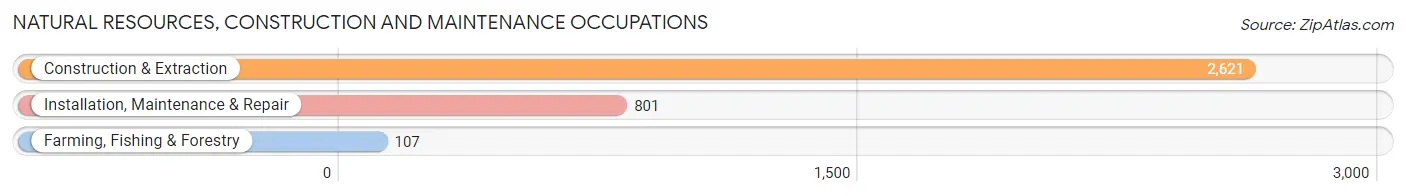
Natural Resources, Construction and Maintenance Occupations
The most common Natural Resources, Construction and Maintenance occupations in Burnet County are Construction & Extraction (2,621 | 11.3%), Installation, Maintenance & Repair (801 | 3.5%), and Farming, Fishing & Forestry (107 | 0.5%).
Natural Resources, Construction and Maintenance Occupations by Sex
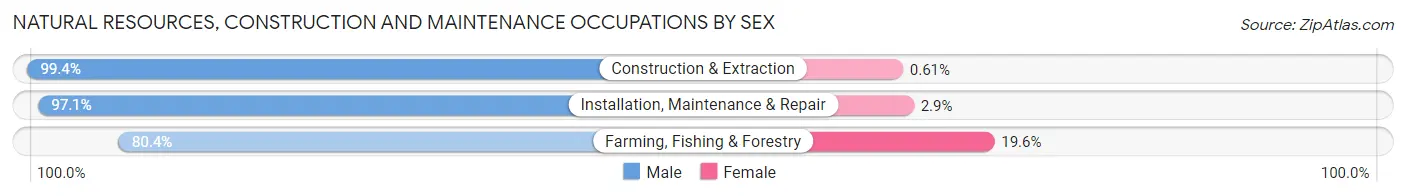
| Occupation | Male | Female |
| Farming, Fishing & Forestry | 86 (80.4%) | 21 (19.6%) |
| Construction & Extraction | 2,605 (99.4%) | 16 (0.6%) |
| Installation, Maintenance & Repair | 778 (97.1%) | 23 (2.9%) |
| Total (Category) | 3,469 (98.3%) | 60 (1.7%) |
| Total (Overall) | 12,296 (53.2%) | 10,832 (46.8%) |
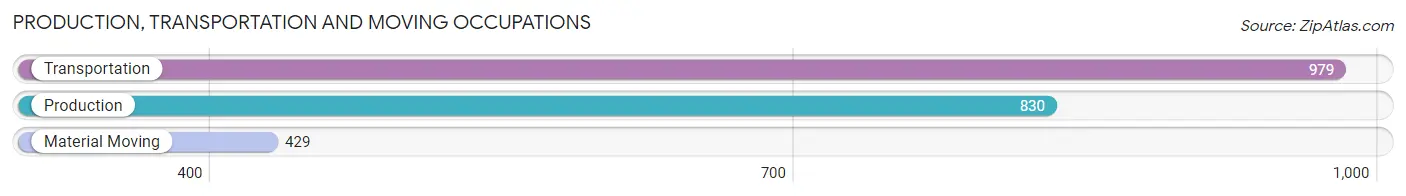
Production, Transportation and Moving Occupations
The most common Production, Transportation and Moving occupations in Burnet County are Transportation (979 | 4.2%), Production (830 | 3.6%), and Material Moving (429 | 1.8%).
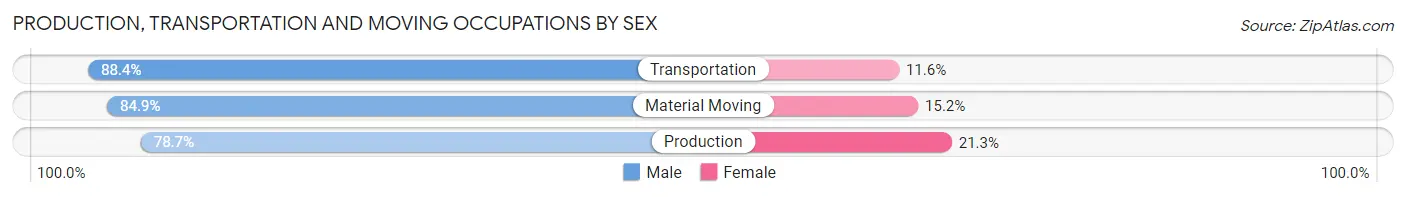
Production, Transportation and Moving Occupations by Sex
| Occupation | Male | Female |
| Production | 653 (78.7%) | 177 (21.3%) |
| Transportation | 865 (88.4%) | 114 (11.6%) |
| Material Moving | 364 (84.9%) | 65 (15.1%) |
| Total (Category) | 1,882 (84.1%) | 356 (15.9%) |
| Total (Overall) | 12,296 (53.2%) | 10,832 (46.8%) |
Employment Industries by Sex in Burnet County
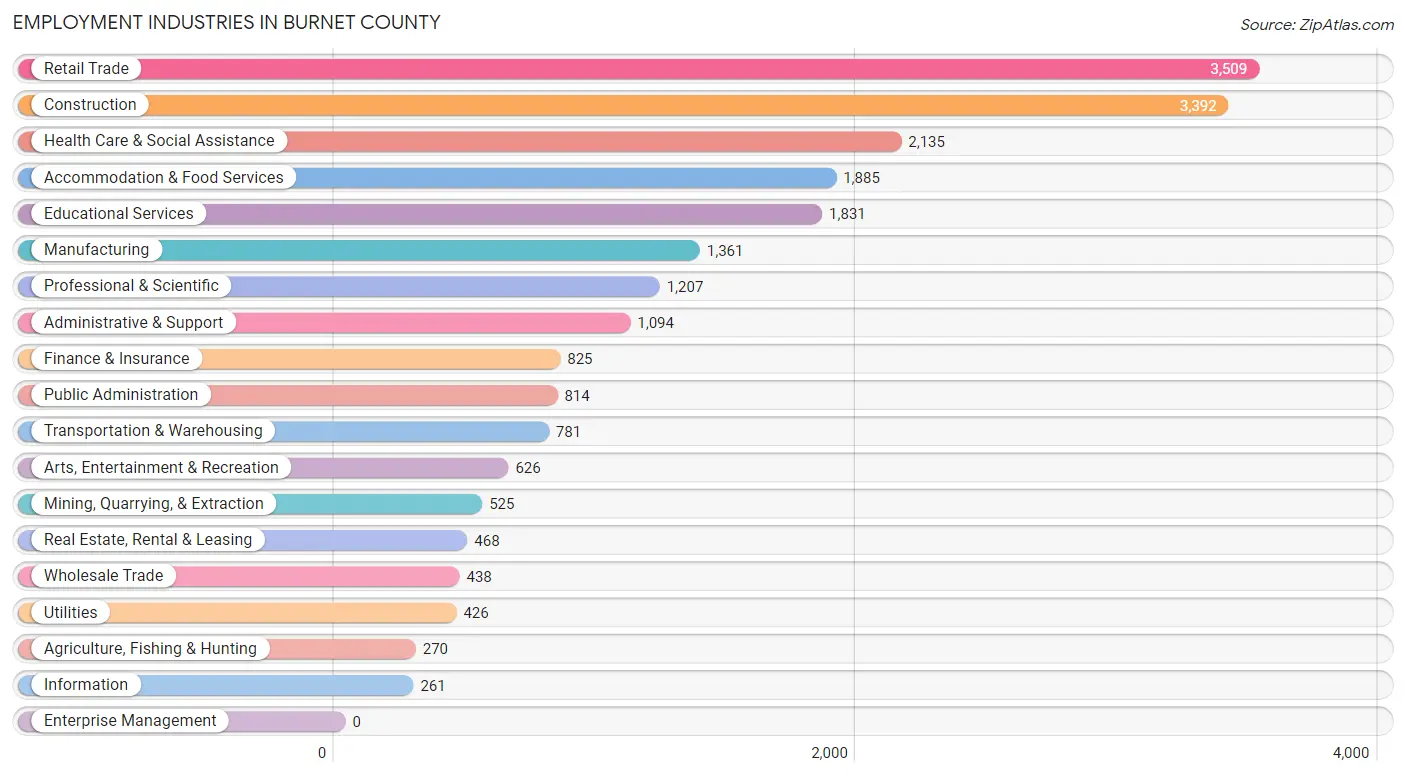
Employment Industries in Burnet County
The major employment industries in Burnet County include Retail Trade (3,509 | 15.2%), Construction (3,392 | 14.7%), Health Care & Social Assistance (2,135 | 9.2%), Accommodation & Food Services (1,885 | 8.2%), and Educational Services (1,831 | 7.9%).
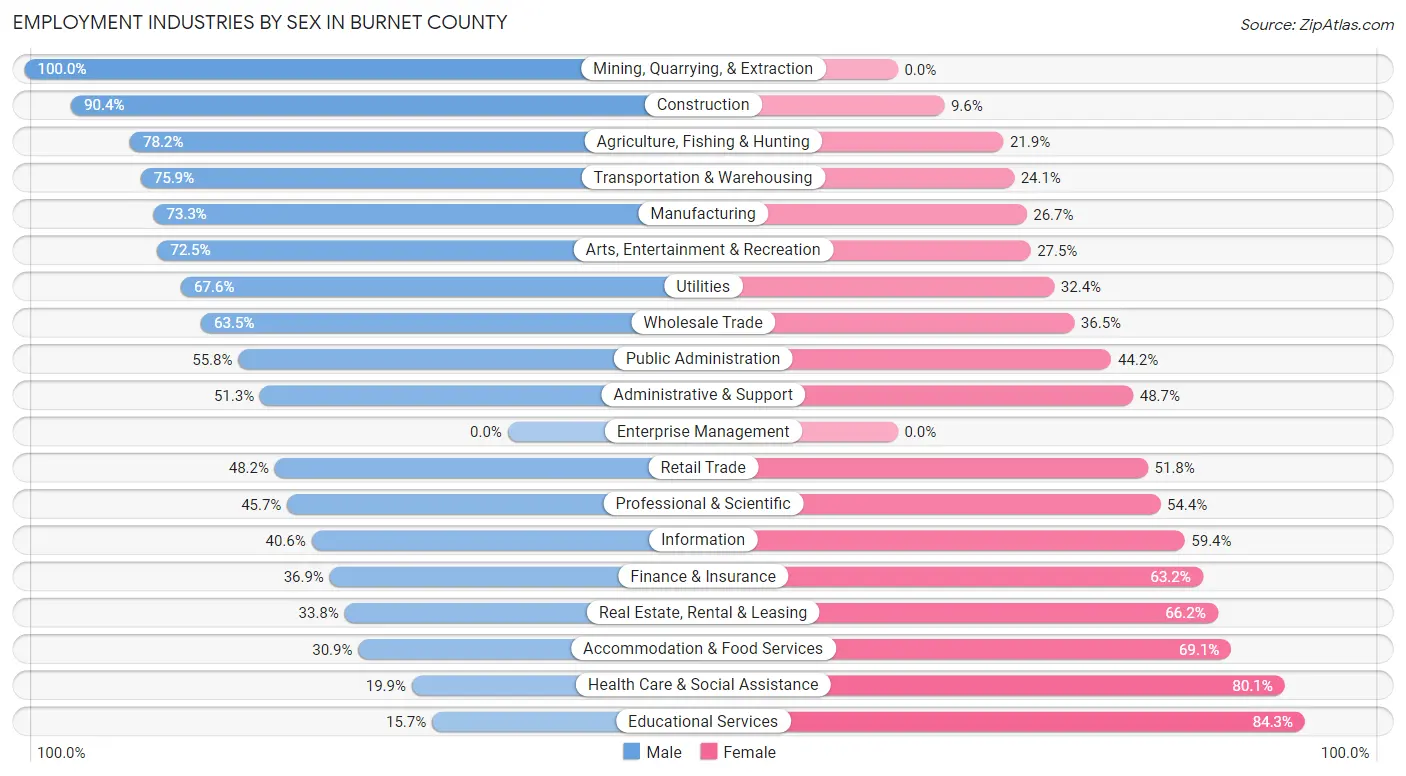
Employment Industries by Sex in Burnet County
The Burnet County industries that see more men than women are Mining, Quarrying, & Extraction (100.0%), Construction (90.4%), and Agriculture, Fishing & Hunting (78.1%), whereas the industries that tend to have a higher number of women are Educational Services (84.3%), Health Care & Social Assistance (80.1%), and Accommodation & Food Services (69.1%).
| Industry | Male | Female |
| Agriculture, Fishing & Hunting | 211 (78.1%) | 59 (21.8%) |
| Mining, Quarrying, & Extraction | 525 (100.0%) | 0 (0.0%) |
| Construction | 3,065 (90.4%) | 327 (9.6%) |
| Manufacturing | 998 (73.3%) | 363 (26.7%) |
| Wholesale Trade | 278 (63.5%) | 160 (36.5%) |
| Retail Trade | 1,692 (48.2%) | 1,817 (51.8%) |
| Transportation & Warehousing | 593 (75.9%) | 188 (24.1%) |
| Utilities | 288 (67.6%) | 138 (32.4%) |
| Information | 106 (40.6%) | 155 (59.4%) |
| Finance & Insurance | 304 (36.8%) | 521 (63.1%) |
| Real Estate, Rental & Leasing | 158 (33.8%) | 310 (66.2%) |
| Professional & Scientific | 551 (45.7%) | 656 (54.3%) |
| Enterprise Management | 0 (0.0%) | 0 (0.0%) |
| Administrative & Support | 561 (51.3%) | 533 (48.7%) |
| Educational Services | 287 (15.7%) | 1,544 (84.3%) |
| Health Care & Social Assistance | 424 (19.9%) | 1,711 (80.1%) |
| Arts, Entertainment & Recreation | 454 (72.5%) | 172 (27.5%) |
| Accommodation & Food Services | 583 (30.9%) | 1,302 (69.1%) |
| Public Administration | 454 (55.8%) | 360 (44.2%) |
| Total | 12,296 (53.2%) | 10,832 (46.8%) |
Education in Burnet County
School Enrollment in Burnet County
The most common levels of schooling among the 10,458 students in Burnet County are middle school (2,843 | 27.2%), high school (2,667 | 25.5%), and elementary school (2,185 | 20.9%).
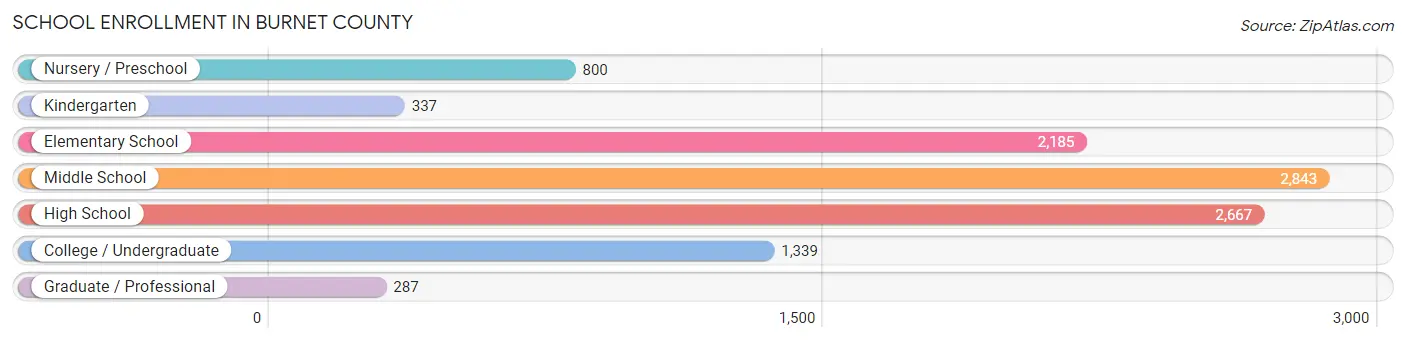
| School Level | # Students | % Students |
| Nursery / Preschool | 800 | 7.6% |
| Kindergarten | 337 | 3.2% |
| Elementary School | 2,185 | 20.9% |
| Middle School | 2,843 | 27.2% |
| High School | 2,667 | 25.5% |
| College / Undergraduate | 1,339 | 12.8% |
| Graduate / Professional | 287 | 2.7% |
| Total | 10,458 | 100.0% |
School Enrollment by Age by Funding Source in Burnet County
Out of a total of 10,458 students who are enrolled in schools in Burnet County, 2,060 (19.7%) attend a private institution, while the remaining 8,398 (80.3%) are enrolled in public schools. The age group of 3 to 4 year olds has the highest likelihood of being enrolled in private schools, with 355 (48.2% in the age bracket) enrolled. Conversely, the age group of 15 to 17 year olds has the lowest likelihood of being enrolled in a private school, with 1,685 (90.1% in the age bracket) attending a public institution.
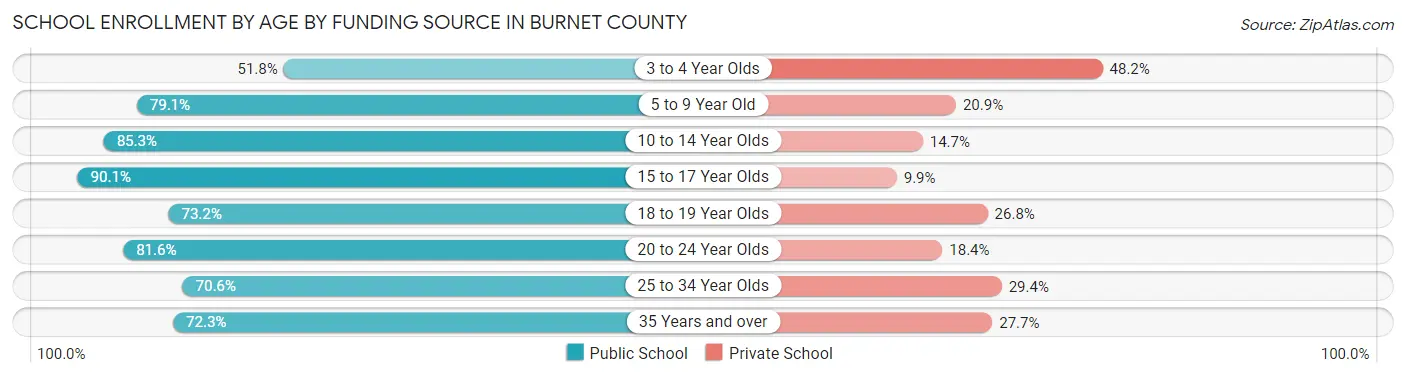
| Age Bracket | Public School | Private School |
| 3 to 4 Year Olds | 381 (51.8%) | 355 (48.2%) |
| 5 to 9 Year Old | 1,860 (79.1%) | 492 (20.9%) |
| 10 to 14 Year Olds | 2,916 (85.3%) | 504 (14.7%) |
| 15 to 17 Year Olds | 1,685 (90.1%) | 185 (9.9%) |
| 18 to 19 Year Olds | 382 (73.2%) | 140 (26.8%) |
| 20 to 24 Year Olds | 453 (81.6%) | 102 (18.4%) |
| 25 to 34 Year Olds | 175 (70.6%) | 73 (29.4%) |
| 35 Years and over | 546 (72.3%) | 209 (27.7%) |
| Total | 8,398 (80.3%) | 2,060 (19.7%) |
Educational Attainment by Field of Study in Burnet County
Business (2,773 | 25.9%), education (1,962 | 18.3%), bio, nature & agricultural (832 | 7.8%), social sciences (771 | 7.2%), and science & technology (728 | 6.8%) are the most common fields of study among 10,713 individuals in Burnet County who have obtained a bachelor's degree or higher.
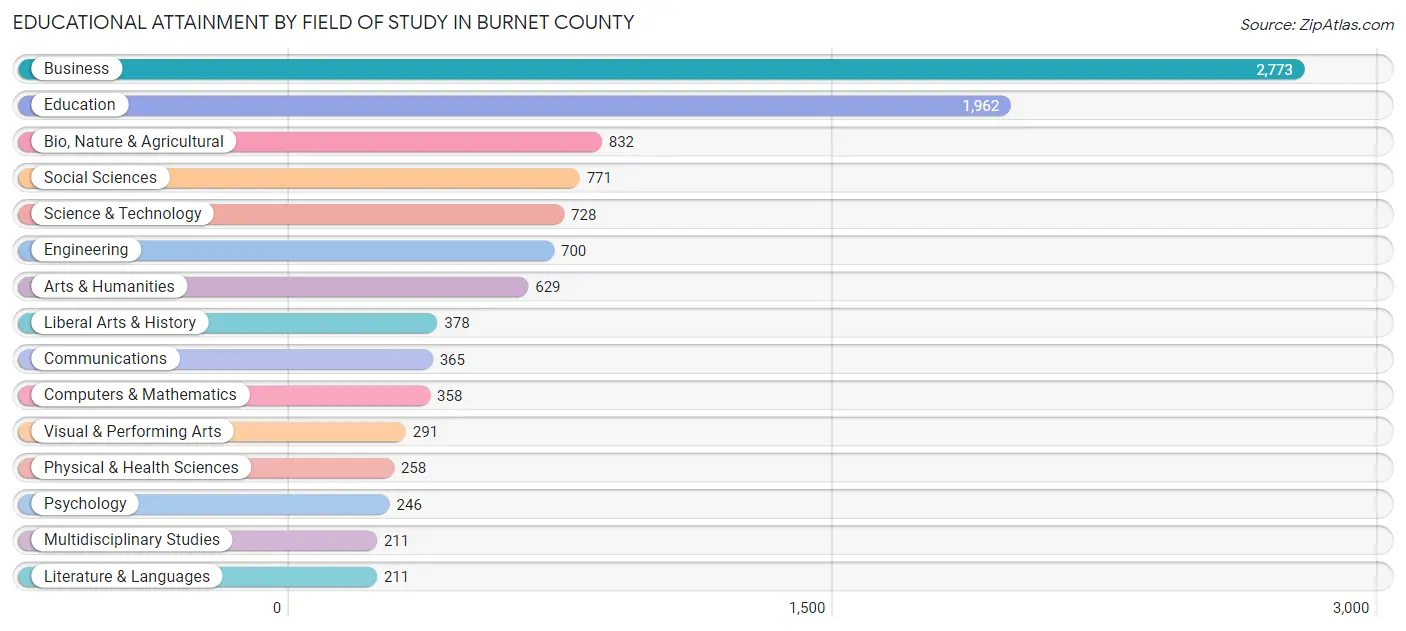
| Field of Study | # Graduates | % Graduates |
| Computers & Mathematics | 358 | 3.3% |
| Bio, Nature & Agricultural | 832 | 7.8% |
| Physical & Health Sciences | 258 | 2.4% |
| Psychology | 246 | 2.3% |
| Social Sciences | 771 | 7.2% |
| Engineering | 700 | 6.5% |
| Multidisciplinary Studies | 211 | 2.0% |
| Science & Technology | 728 | 6.8% |
| Business | 2,773 | 25.9% |
| Education | 1,962 | 18.3% |
| Literature & Languages | 211 | 2.0% |
| Liberal Arts & History | 378 | 3.5% |
| Visual & Performing Arts | 291 | 2.7% |
| Communications | 365 | 3.4% |
| Arts & Humanities | 629 | 5.9% |
| Total | 10,713 | 100.0% |
Transportation & Commute in Burnet County
Vehicle Availability by Sex in Burnet County
The most prevalent vehicle ownership categories in Burnet County are males with 2 vehicles (5,019, accounting for 41.5%) and females with 2 vehicles (4,008, making up 47.1%).
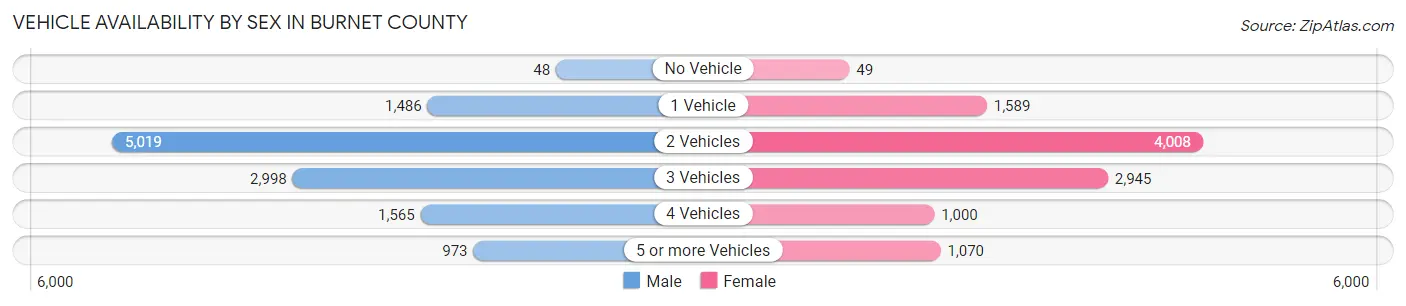
| Vehicles Available | Male | Female |
| No Vehicle | 48 (0.4%) | 49 (0.5%) |
| 1 Vehicle | 1,486 (12.3%) | 1,589 (14.9%) |
| 2 Vehicles | 5,019 (41.5%) | 4,008 (37.6%) |
| 3 Vehicles | 2,998 (24.8%) | 2,945 (27.6%) |
| 4 Vehicles | 1,565 (13.0%) | 1,000 (9.4%) |
| 5 or more Vehicles | 973 (8.1%) | 1,070 (10.0%) |
| Total | 12,089 (100.0%) | 10,661 (100.0%) |
Commute Time in Burnet County
The most frequently occuring commute durations in Burnet County are 5 to 9 minutes (3,446 commuters, 17.0%), 10 to 14 minutes (2,606 commuters, 12.9%), and 15 to 19 minutes (2,342 commuters, 11.6%).
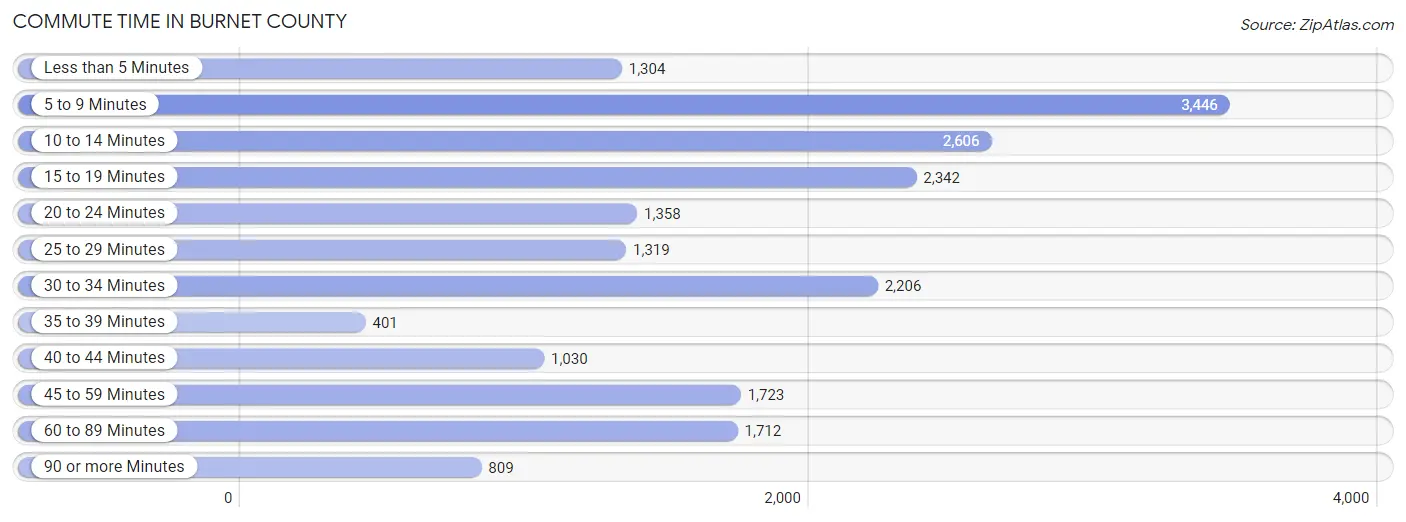
| Commute Time | # Commuters | % Commuters |
| Less than 5 Minutes | 1,304 | 6.4% |
| 5 to 9 Minutes | 3,446 | 17.0% |
| 10 to 14 Minutes | 2,606 | 12.9% |
| 15 to 19 Minutes | 2,342 | 11.6% |
| 20 to 24 Minutes | 1,358 | 6.7% |
| 25 to 29 Minutes | 1,319 | 6.5% |
| 30 to 34 Minutes | 2,206 | 10.9% |
| 35 to 39 Minutes | 401 | 2.0% |
| 40 to 44 Minutes | 1,030 | 5.1% |
| 45 to 59 Minutes | 1,723 | 8.5% |
| 60 to 89 Minutes | 1,712 | 8.5% |
| 90 or more Minutes | 809 | 4.0% |
Commute Time by Sex in Burnet County
The most common commute times in Burnet County are 5 to 9 minutes (1,780 commuters, 16.2%) for males and 5 to 9 minutes (1,666 commuters, 17.9%) for females.
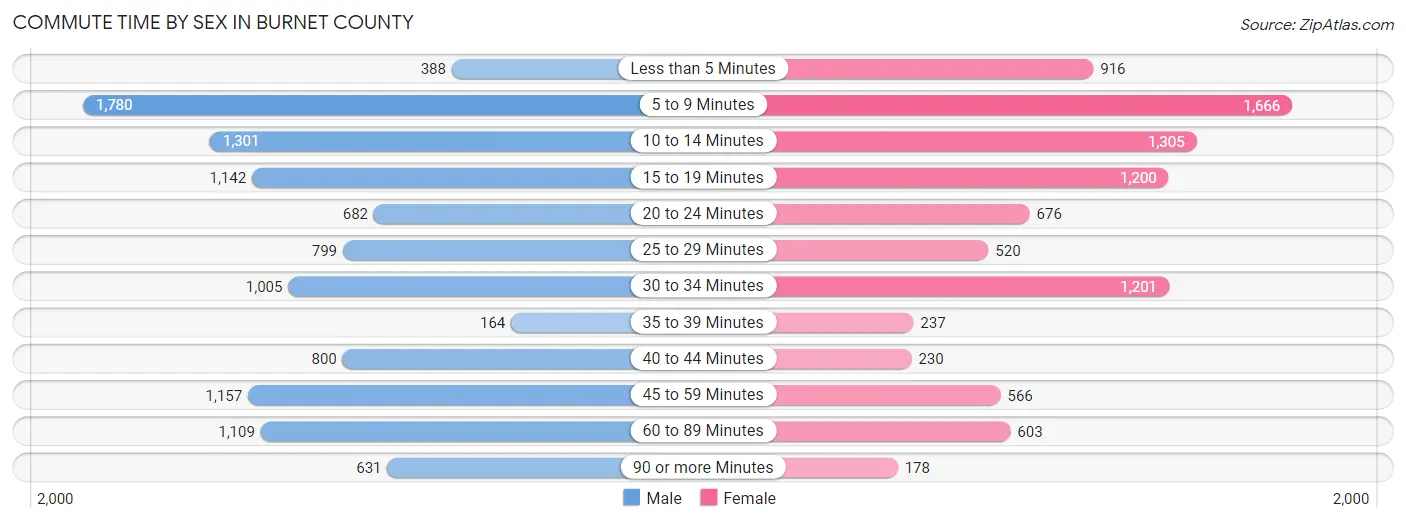
| Commute Time | Male | Female |
| Less than 5 Minutes | 388 (3.5%) | 916 (9.9%) |
| 5 to 9 Minutes | 1,780 (16.2%) | 1,666 (17.9%) |
| 10 to 14 Minutes | 1,301 (11.9%) | 1,305 (14.0%) |
| 15 to 19 Minutes | 1,142 (10.4%) | 1,200 (12.9%) |
| 20 to 24 Minutes | 682 (6.2%) | 676 (7.3%) |
| 25 to 29 Minutes | 799 (7.3%) | 520 (5.6%) |
| 30 to 34 Minutes | 1,005 (9.2%) | 1,201 (12.9%) |
| 35 to 39 Minutes | 164 (1.5%) | 237 (2.5%) |
| 40 to 44 Minutes | 800 (7.3%) | 230 (2.5%) |
| 45 to 59 Minutes | 1,157 (10.6%) | 566 (6.1%) |
| 60 to 89 Minutes | 1,109 (10.1%) | 603 (6.5%) |
| 90 or more Minutes | 631 (5.8%) | 178 (1.9%) |
Time of Departure to Work by Sex in Burnet County
The most frequent times of departure to work in Burnet County are 7:00 AM to 7:29 AM (2,168, 19.8%) for males and 7:00 AM to 7:29 AM (1,578, 17.0%) for females.
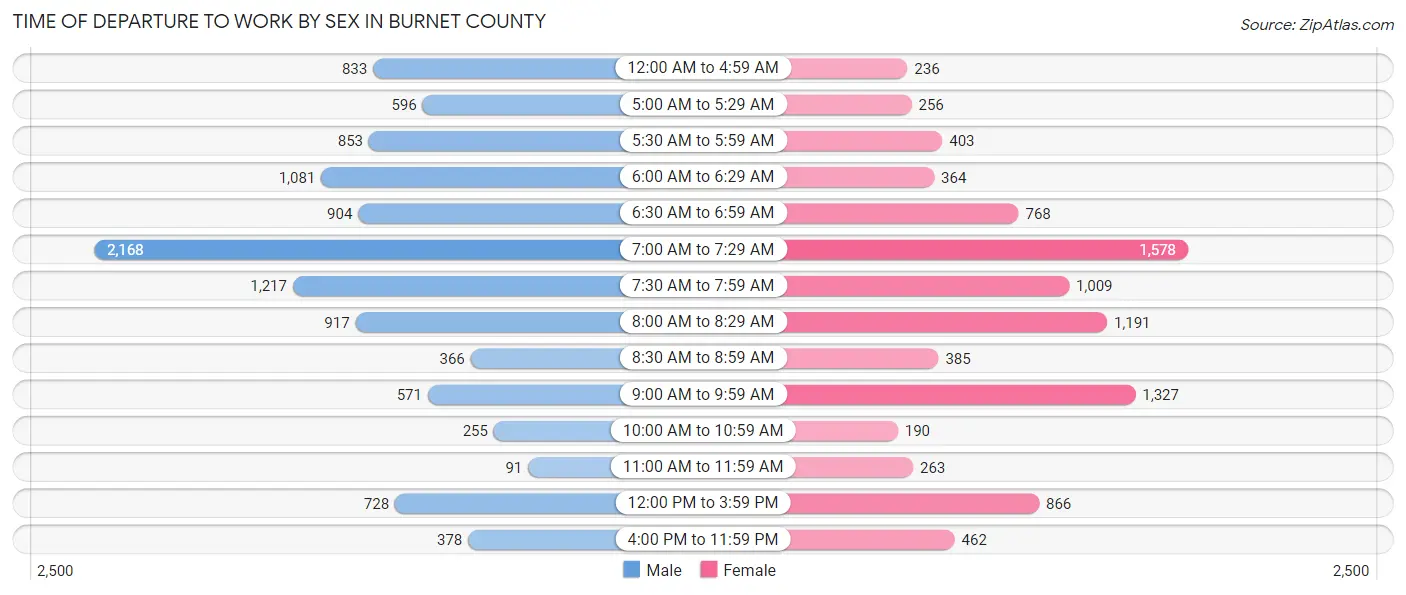
| Time of Departure | Male | Female |
| 12:00 AM to 4:59 AM | 833 (7.6%) | 236 (2.5%) |
| 5:00 AM to 5:29 AM | 596 (5.4%) | 256 (2.8%) |
| 5:30 AM to 5:59 AM | 853 (7.8%) | 403 (4.3%) |
| 6:00 AM to 6:29 AM | 1,081 (9.9%) | 364 (3.9%) |
| 6:30 AM to 6:59 AM | 904 (8.3%) | 768 (8.3%) |
| 7:00 AM to 7:29 AM | 2,168 (19.8%) | 1,578 (17.0%) |
| 7:30 AM to 7:59 AM | 1,217 (11.1%) | 1,009 (10.8%) |
| 8:00 AM to 8:29 AM | 917 (8.4%) | 1,191 (12.8%) |
| 8:30 AM to 8:59 AM | 366 (3.3%) | 385 (4.1%) |
| 9:00 AM to 9:59 AM | 571 (5.2%) | 1,327 (14.3%) |
| 10:00 AM to 10:59 AM | 255 (2.3%) | 190 (2.0%) |
| 11:00 AM to 11:59 AM | 91 (0.8%) | 263 (2.8%) |
| 12:00 PM to 3:59 PM | 728 (6.6%) | 866 (9.3%) |
| 4:00 PM to 11:59 PM | 378 (3.5%) | 462 (5.0%) |
| Total | 10,958 (100.0%) | 9,298 (100.0%) |
Housing Occupancy in Burnet County
Occupancy by Ownership in Burnet County
Of the total 18,629 dwellings in Burnet County, owner-occupied units account for 14,788 (79.4%), while renter-occupied units make up 3,841 (20.6%).
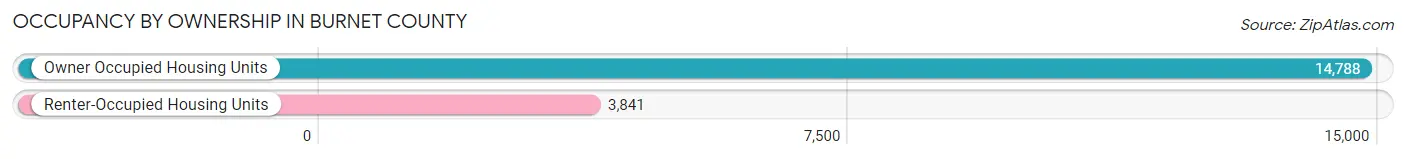
| Occupancy | # Housing Units | % Housing Units |
| Owner Occupied Housing Units | 14,788 | 79.4% |
| Renter-Occupied Housing Units | 3,841 | 20.6% |
| Total Occupied Housing Units | 18,629 | 100.0% |
Occupancy by Household Size in Burnet County
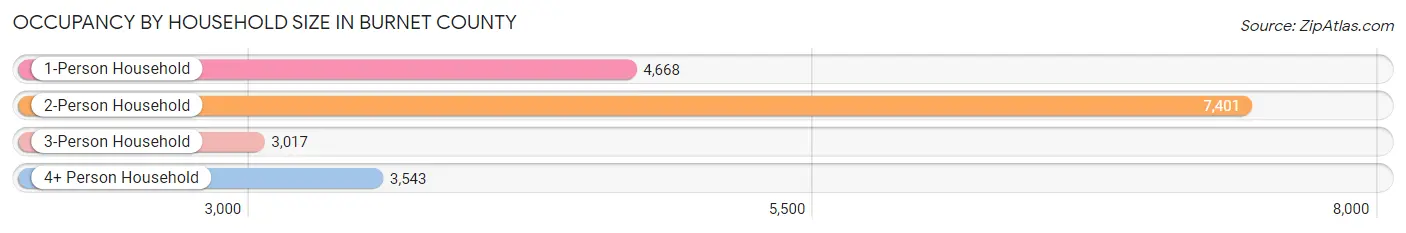
| Household Size | # Housing Units | % Housing Units |
| 1-Person Household | 4,668 | 25.1% |
| 2-Person Household | 7,401 | 39.7% |
| 3-Person Household | 3,017 | 16.2% |
| 4+ Person Household | 3,543 | 19.0% |
| Total Housing Units | 18,629 | 100.0% |
Occupancy by Ownership by Household Size in Burnet County
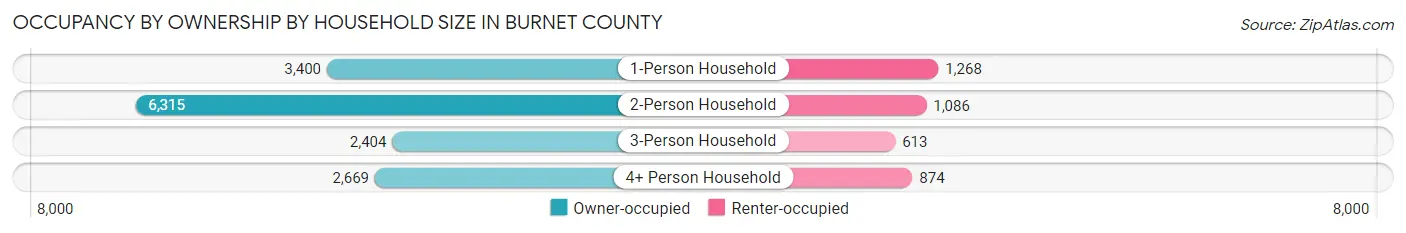
| Household Size | Owner-occupied | Renter-occupied |
| 1-Person Household | 3,400 (72.8%) | 1,268 (27.2%) |
| 2-Person Household | 6,315 (85.3%) | 1,086 (14.7%) |
| 3-Person Household | 2,404 (79.7%) | 613 (20.3%) |
| 4+ Person Household | 2,669 (75.3%) | 874 (24.7%) |
| Total Housing Units | 14,788 (79.4%) | 3,841 (20.6%) |
Occupancy by Educational Attainment in Burnet County
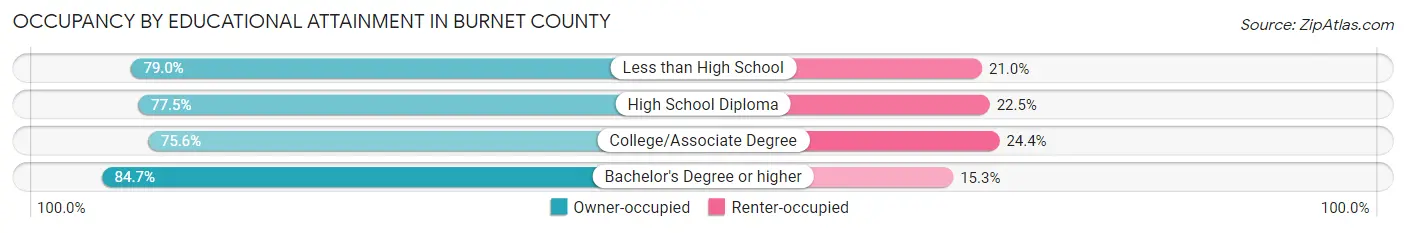
| Household Size | Owner-occupied | Renter-occupied |
| Less than High School | 1,340 (79.0%) | 356 (21.0%) |
| High School Diploma | 3,481 (77.5%) | 1,011 (22.5%) |
| College/Associate Degree | 4,723 (75.6%) | 1,528 (24.4%) |
| Bachelor's Degree or higher | 5,244 (84.7%) | 946 (15.3%) |
Occupancy by Age of Householder in Burnet County
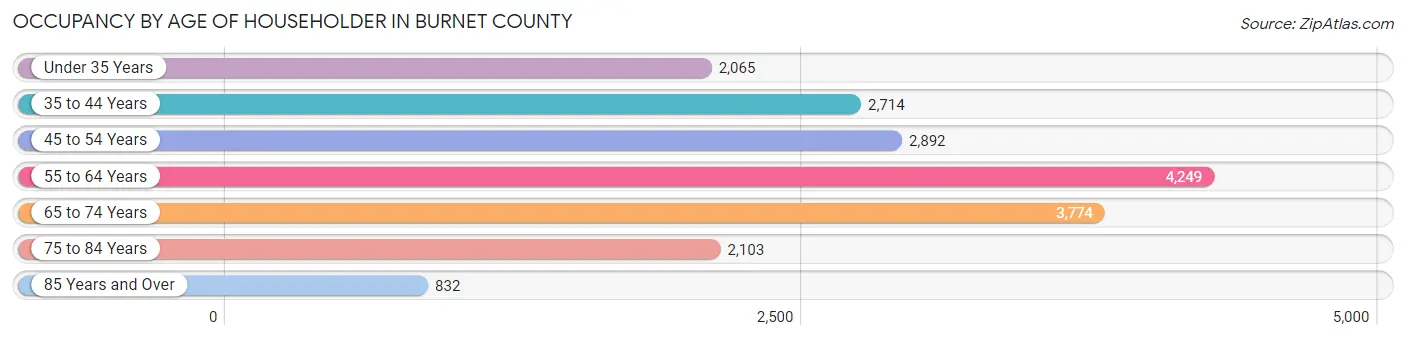
| Age Bracket | # Households | % Households |
| Under 35 Years | 2,065 | 11.1% |
| 35 to 44 Years | 2,714 | 14.6% |
| 45 to 54 Years | 2,892 | 15.5% |
| 55 to 64 Years | 4,249 | 22.8% |
| 65 to 74 Years | 3,774 | 20.3% |
| 75 to 84 Years | 2,103 | 11.3% |
| 85 Years and Over | 832 | 4.5% |
| Total | 18,629 | 100.0% |
Housing Finances in Burnet County
Median Income by Occupancy in Burnet County
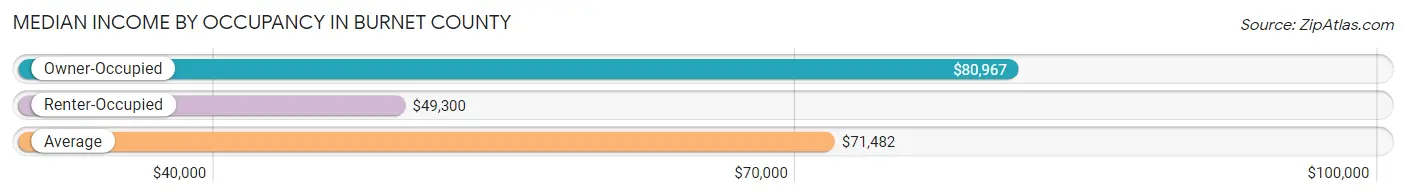
| Occupancy Type | # Households | Median Income |
| Owner-Occupied | 14,788 (79.4%) | $80,967 |
| Renter-Occupied | 3,841 (20.6%) | $49,300 |
| Average | 18,629 (100.0%) | $71,482 |
Occupancy by Householder Income Bracket in Burnet County
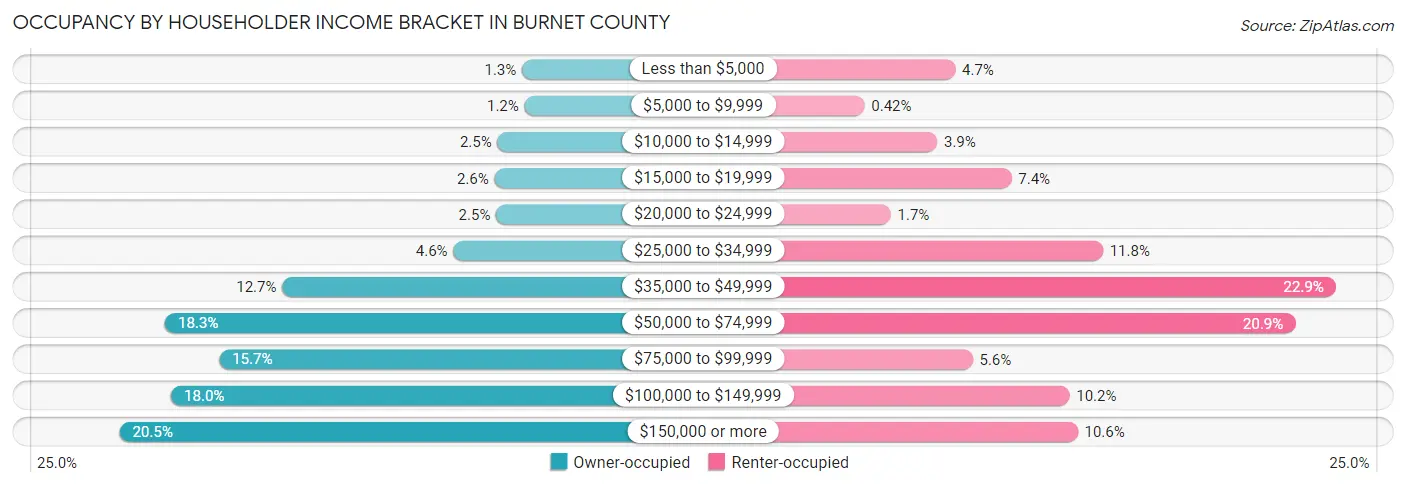
| Income Bracket | Owner-occupied | Renter-occupied |
| Less than $5,000 | 194 (1.3%) | 182 (4.7%) |
| $5,000 to $9,999 | 176 (1.2%) | 16 (0.4%) |
| $10,000 to $14,999 | 367 (2.5%) | 149 (3.9%) |
| $15,000 to $19,999 | 388 (2.6%) | 285 (7.4%) |
| $20,000 to $24,999 | 376 (2.5%) | 64 (1.7%) |
| $25,000 to $34,999 | 677 (4.6%) | 452 (11.8%) |
| $35,000 to $49,999 | 1,882 (12.7%) | 878 (22.9%) |
| $50,000 to $74,999 | 2,708 (18.3%) | 804 (20.9%) |
| $75,000 to $99,999 | 2,326 (15.7%) | 214 (5.6%) |
| $100,000 to $149,999 | 2,665 (18.0%) | 391 (10.2%) |
| $150,000 or more | 3,029 (20.5%) | 406 (10.6%) |
| Total | 14,788 (100.0%) | 3,841 (100.0%) |
Monthly Housing Cost Tiers in Burnet County
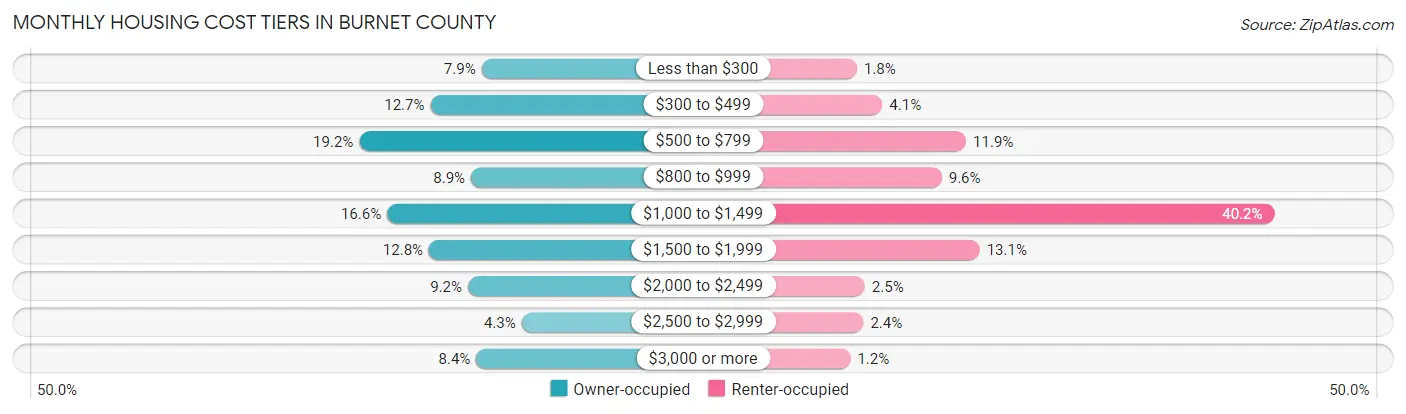
| Monthly Cost | Owner-occupied | Renter-occupied |
| Less than $300 | 1,174 (7.9%) | 69 (1.8%) |
| $300 to $499 | 1,870 (12.7%) | 159 (4.1%) |
| $500 to $799 | 2,839 (19.2%) | 455 (11.8%) |
| $800 to $999 | 1,318 (8.9%) | 369 (9.6%) |
| $1,000 to $1,499 | 2,461 (16.6%) | 1,545 (40.2%) |
| $1,500 to $1,999 | 1,890 (12.8%) | 503 (13.1%) |
| $2,000 to $2,499 | 1,361 (9.2%) | 97 (2.5%) |
| $2,500 to $2,999 | 629 (4.3%) | 92 (2.4%) |
| $3,000 or more | 1,246 (8.4%) | 46 (1.2%) |
| Total | 14,788 (100.0%) | 3,841 (100.0%) |
Physical Housing Characteristics in Burnet County
Housing Structures in Burnet County
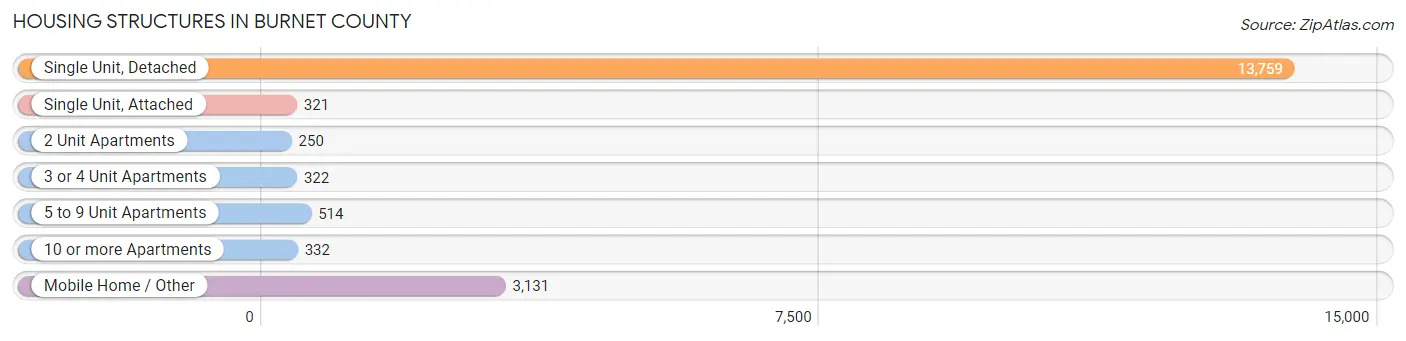
| Structure Type | # Housing Units | % Housing Units |
| Single Unit, Detached | 13,759 | 73.9% |
| Single Unit, Attached | 321 | 1.7% |
| 2 Unit Apartments | 250 | 1.3% |
| 3 or 4 Unit Apartments | 322 | 1.7% |
| 5 to 9 Unit Apartments | 514 | 2.8% |
| 10 or more Apartments | 332 | 1.8% |
| Mobile Home / Other | 3,131 | 16.8% |
| Total | 18,629 | 100.0% |
Housing Structures by Occupancy in Burnet County
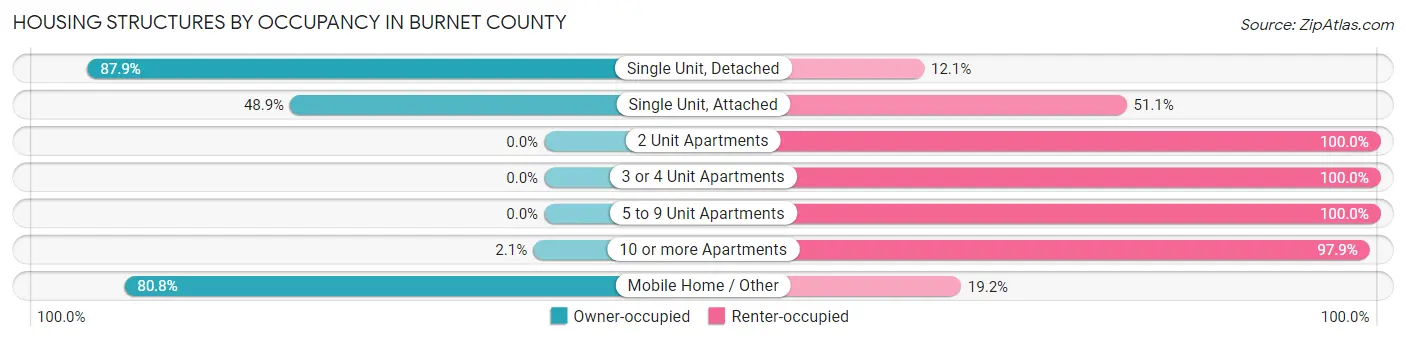
| Structure Type | Owner-occupied | Renter-occupied |
| Single Unit, Detached | 12,094 (87.9%) | 1,665 (12.1%) |
| Single Unit, Attached | 157 (48.9%) | 164 (51.1%) |
| 2 Unit Apartments | 0 (0.0%) | 250 (100.0%) |
| 3 or 4 Unit Apartments | 0 (0.0%) | 322 (100.0%) |
| 5 to 9 Unit Apartments | 0 (0.0%) | 514 (100.0%) |
| 10 or more Apartments | 7 (2.1%) | 325 (97.9%) |
| Mobile Home / Other | 2,530 (80.8%) | 601 (19.2%) |
| Total | 14,788 (79.4%) | 3,841 (20.6%) |
Housing Structures by Number of Rooms in Burnet County
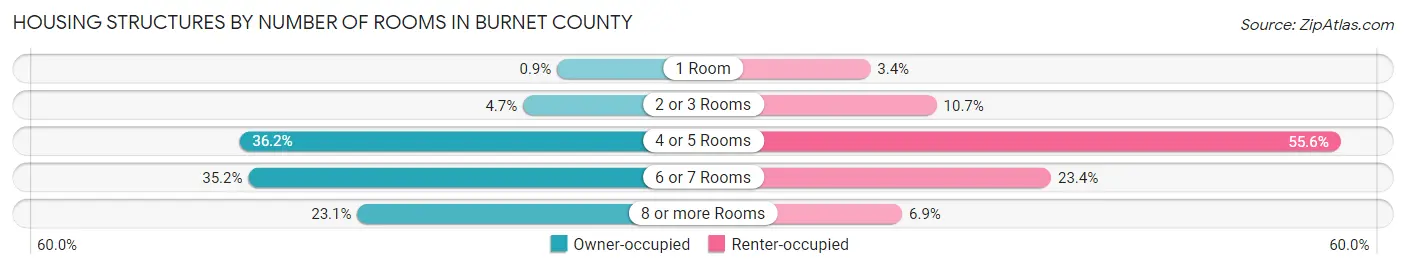
| Number of Rooms | Owner-occupied | Renter-occupied |
| 1 Room | 133 (0.9%) | 130 (3.4%) |
| 2 or 3 Rooms | 692 (4.7%) | 412 (10.7%) |
| 4 or 5 Rooms | 5,349 (36.2%) | 2,134 (55.6%) |
| 6 or 7 Rooms | 5,201 (35.2%) | 900 (23.4%) |
| 8 or more Rooms | 3,413 (23.1%) | 265 (6.9%) |
| Total | 14,788 (100.0%) | 3,841 (100.0%) |
Housing Structure by Heating Type in Burnet County
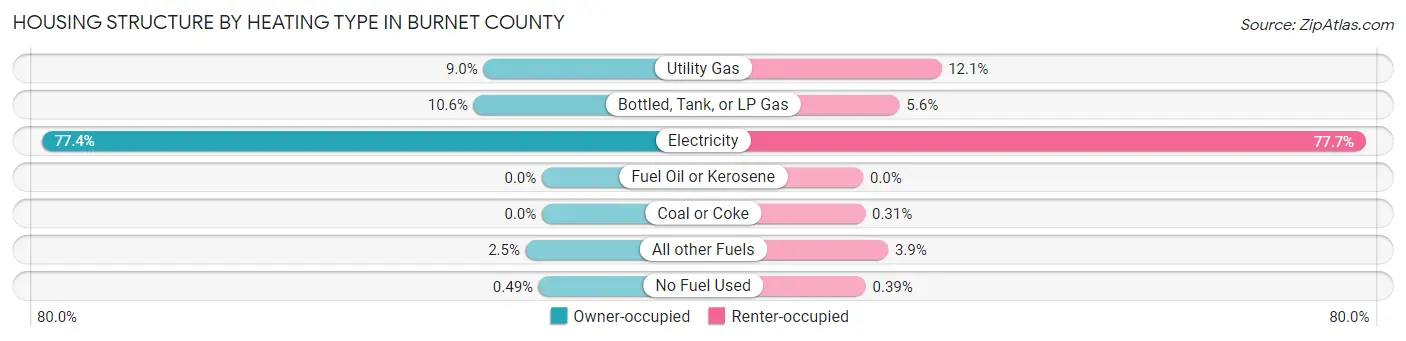
| Heating Type | Owner-occupied | Renter-occupied |
| Utility Gas | 1,337 (9.0%) | 464 (12.1%) |
| Bottled, Tank, or LP Gas | 1,561 (10.6%) | 216 (5.6%) |
| Electricity | 11,445 (77.4%) | 2,986 (77.7%) |
| Fuel Oil or Kerosene | 0 (0.0%) | 0 (0.0%) |
| Coal or Coke | 0 (0.0%) | 12 (0.3%) |
| All other Fuels | 372 (2.5%) | 148 (3.8%) |
| No Fuel Used | 73 (0.5%) | 15 (0.4%) |
| Total | 14,788 (100.0%) | 3,841 (100.0%) |
Household Vehicle Usage in Burnet County
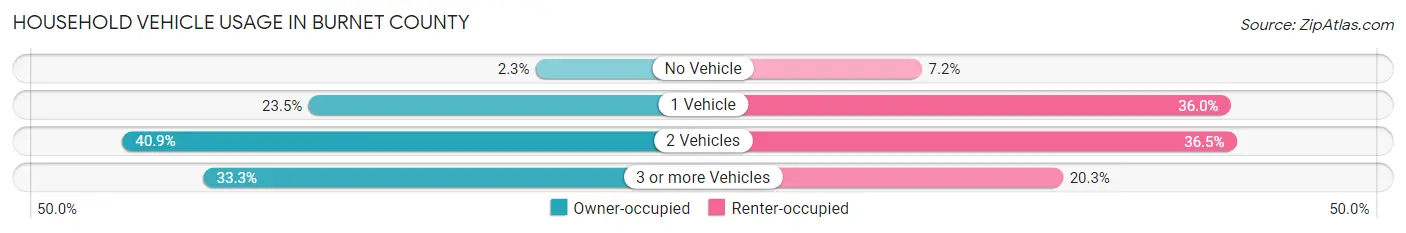
| Vehicles per Household | Owner-occupied | Renter-occupied |
| No Vehicle | 343 (2.3%) | 275 (7.2%) |
| 1 Vehicle | 3,479 (23.5%) | 1,382 (36.0%) |
| 2 Vehicles | 6,044 (40.9%) | 1,403 (36.5%) |
| 3 or more Vehicles | 4,922 (33.3%) | 781 (20.3%) |
| Total | 14,788 (100.0%) | 3,841 (100.0%) |
Real Estate & Mortgages in Burnet County
Real Estate and Mortgage Overview in Burnet County
| Characteristic | Without Mortgage | With Mortgage |
| Housing Units | 7,863 | 6,925 |
| Median Property Value | $237,000 | $306,300 |
| Median Household Income | $66,575 | $1,822 |
| Monthly Housing Costs | $603 | $1,213 |
| Real Estate Taxes | $2,769 | $262 |
Property Value by Mortgage Status in Burnet County
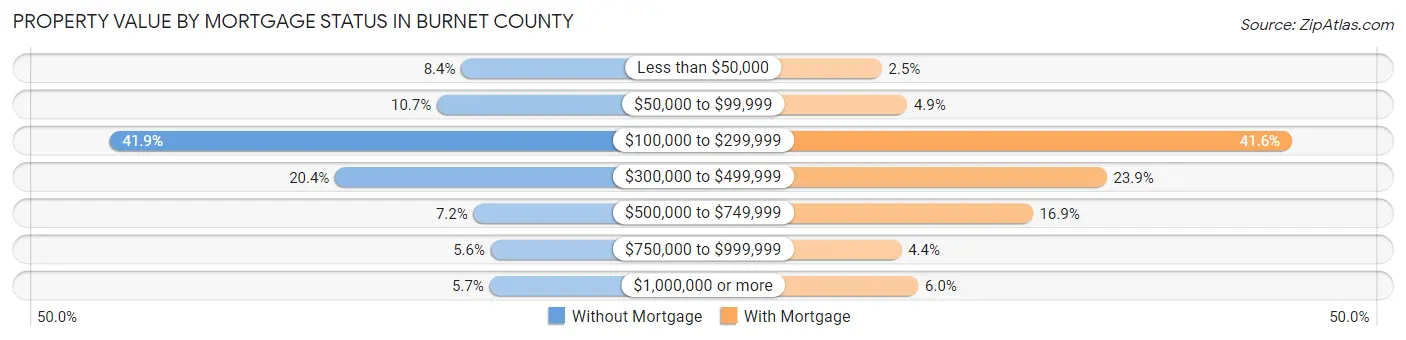
| Property Value | Without Mortgage | With Mortgage |
| Less than $50,000 | 661 (8.4%) | 172 (2.5%) |
| $50,000 to $99,999 | 843 (10.7%) | 339 (4.9%) |
| $100,000 to $299,999 | 3,295 (41.9%) | 2,878 (41.6%) |
| $300,000 to $499,999 | 1,606 (20.4%) | 1,655 (23.9%) |
| $500,000 to $749,999 | 569 (7.2%) | 1,167 (16.9%) |
| $750,000 to $999,999 | 440 (5.6%) | 301 (4.3%) |
| $1,000,000 or more | 449 (5.7%) | 413 (6.0%) |
| Total | 7,863 (100.0%) | 6,925 (100.0%) |
Household Income by Mortgage Status in Burnet County
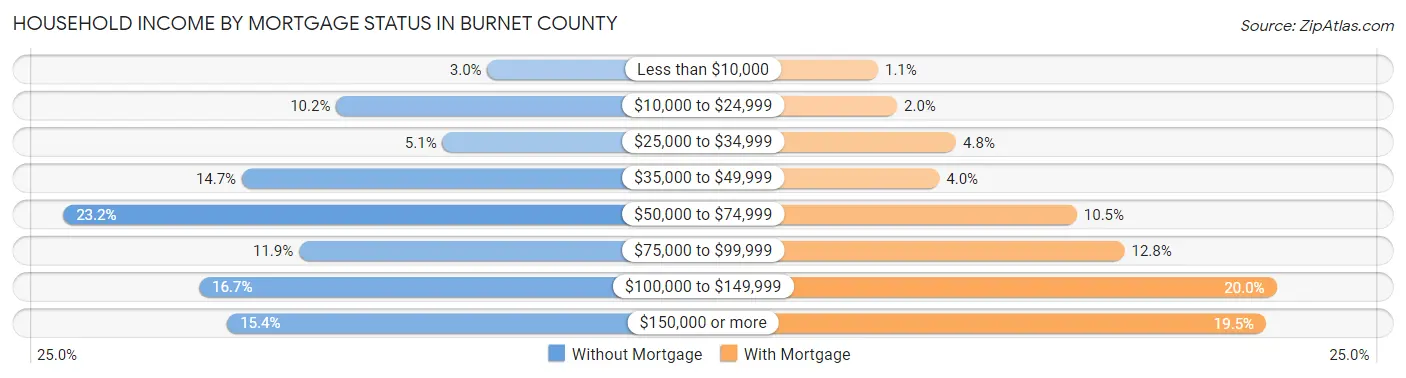
| Household Income | Without Mortgage | With Mortgage |
| Less than $10,000 | 233 (3.0%) | 74 (1.1%) |
| $10,000 to $24,999 | 799 (10.2%) | 137 (2.0%) |
| $25,000 to $34,999 | 401 (5.1%) | 332 (4.8%) |
| $35,000 to $49,999 | 1,152 (14.6%) | 276 (4.0%) |
| $50,000 to $74,999 | 1,821 (23.2%) | 730 (10.5%) |
| $75,000 to $99,999 | 938 (11.9%) | 887 (12.8%) |
| $100,000 to $149,999 | 1,312 (16.7%) | 1,388 (20.0%) |
| $150,000 or more | 1,207 (15.3%) | 1,353 (19.5%) |
| Total | 7,863 (100.0%) | 6,925 (100.0%) |
Property Value to Household Income Ratio in Burnet County
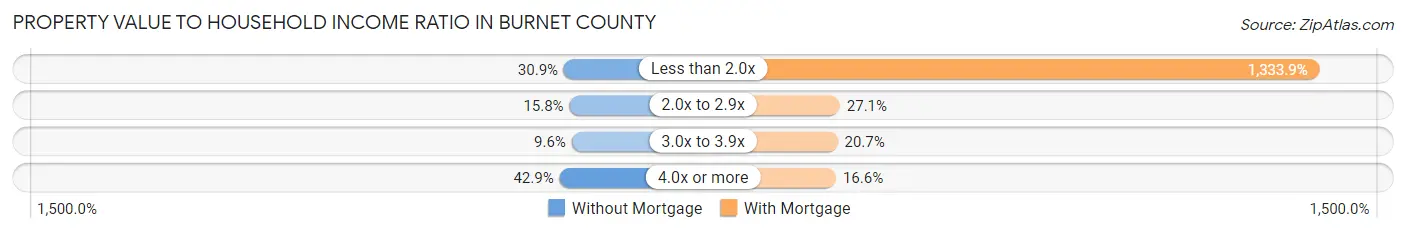
| Value-to-Income Ratio | Without Mortgage | With Mortgage |
| Less than 2.0x | 2,427 (30.9%) | 92,375 (1,333.9%) |
| 2.0x to 2.9x | 1,239 (15.8%) | 1,877 (27.1%) |
| 3.0x to 3.9x | 757 (9.6%) | 1,434 (20.7%) |
| 4.0x or more | 3,374 (42.9%) | 1,149 (16.6%) |
| Total | 7,863 (100.0%) | 6,925 (100.0%) |
Real Estate Taxes by Mortgage Status in Burnet County
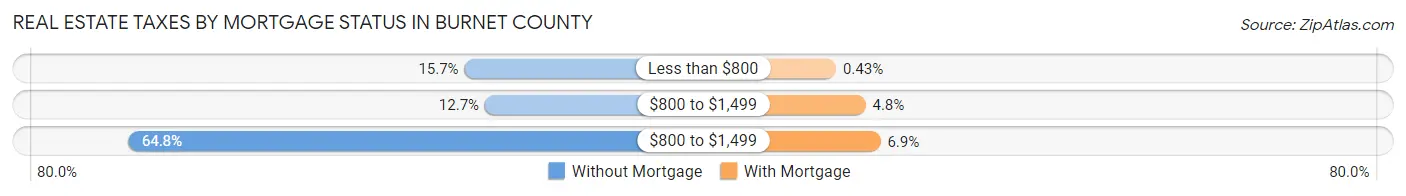
| Property Taxes | Without Mortgage | With Mortgage |
| Less than $800 | 1,237 (15.7%) | 30 (0.4%) |
| $800 to $1,499 | 1,002 (12.7%) | 329 (4.8%) |
| $800 to $1,499 | 5,092 (64.8%) | 480 (6.9%) |
| Total | 7,863 (100.0%) | 6,925 (100.0%) |
Health & Disability in Burnet County
Health Insurance Coverage by Age in Burnet County
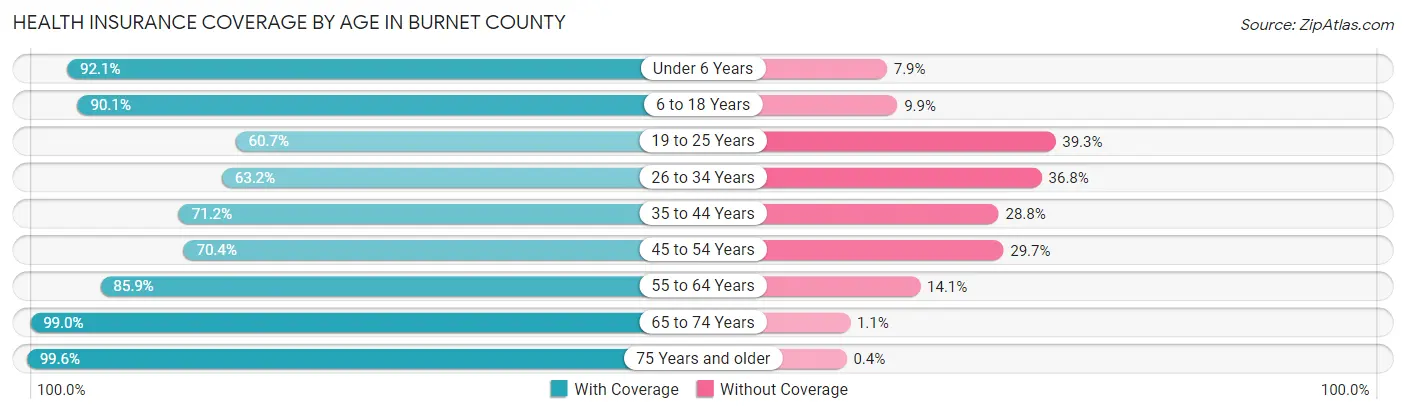
| Age Bracket | With Coverage | Without Coverage |
| Under 6 Years | 2,523 (92.1%) | 217 (7.9%) |
| 6 to 18 Years | 7,166 (90.1%) | 785 (9.9%) |
| 19 to 25 Years | 2,299 (60.7%) | 1,491 (39.3%) |
| 26 to 34 Years | 2,857 (63.2%) | 1,663 (36.8%) |
| 35 to 44 Years | 3,984 (71.2%) | 1,609 (28.8%) |
| 45 to 54 Years | 3,714 (70.4%) | 1,565 (29.6%) |
| 55 to 64 Years | 6,624 (85.9%) | 1,091 (14.1%) |
| 65 to 74 Years | 6,774 (99.0%) | 72 (1.1%) |
| 75 Years and older | 4,441 (99.6%) | 18 (0.4%) |
| Total | 40,382 (82.6%) | 8,511 (17.4%) |
Health Insurance Coverage by Citizenship Status in Burnet County
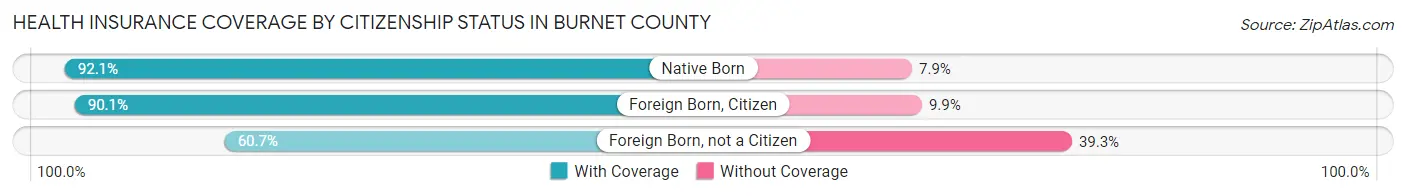
| Citizenship Status | With Coverage | Without Coverage |
| Native Born | 2,523 (92.1%) | 217 (7.9%) |
| Foreign Born, Citizen | 7,166 (90.1%) | 785 (9.9%) |
| Foreign Born, not a Citizen | 2,299 (60.7%) | 1,491 (39.3%) |
Health Insurance Coverage by Household Income in Burnet County
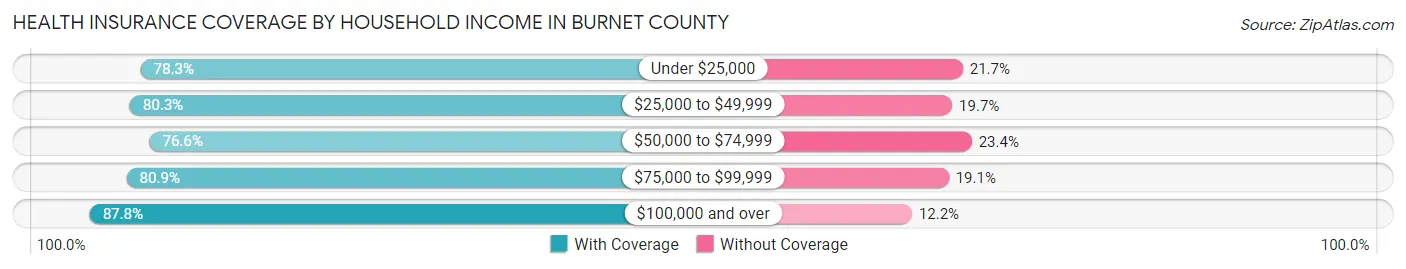
| Household Income | With Coverage | Without Coverage |
| Under $25,000 | 3,019 (78.3%) | 838 (21.7%) |
| $25,000 to $49,999 | 7,133 (80.3%) | 1,754 (19.7%) |
| $50,000 to $74,999 | 6,644 (76.6%) | 2,031 (23.4%) |
| $75,000 to $99,999 | 6,137 (80.9%) | 1,449 (19.1%) |
| $100,000 and over | 17,398 (87.8%) | 2,420 (12.2%) |
Public vs Private Health Insurance Coverage by Age in Burnet County
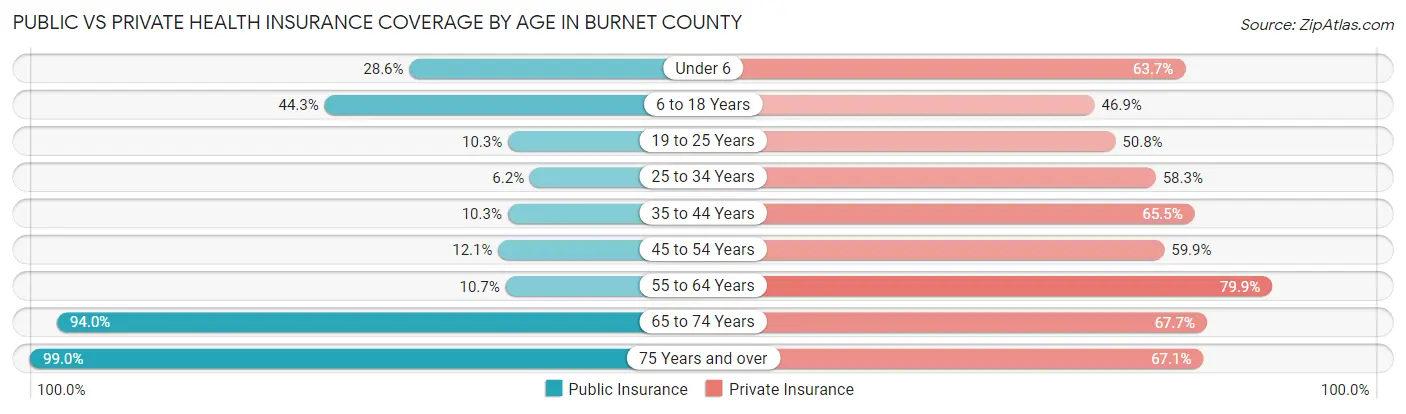
| Age Bracket | Public Insurance | Private Insurance |
| Under 6 | 783 (28.6%) | 1,746 (63.7%) |
| 6 to 18 Years | 3,524 (44.3%) | 3,732 (46.9%) |
| 19 to 25 Years | 389 (10.3%) | 1,925 (50.8%) |
| 25 to 34 Years | 280 (6.2%) | 2,634 (58.3%) |
| 35 to 44 Years | 577 (10.3%) | 3,662 (65.5%) |
| 45 to 54 Years | 637 (12.1%) | 3,160 (59.9%) |
| 55 to 64 Years | 828 (10.7%) | 6,162 (79.9%) |
| 65 to 74 Years | 6,435 (94.0%) | 4,637 (67.7%) |
| 75 Years and over | 4,413 (99.0%) | 2,991 (67.1%) |
| Total | 17,866 (36.5%) | 30,649 (62.7%) |
Disability Status by Sex by Age in Burnet County
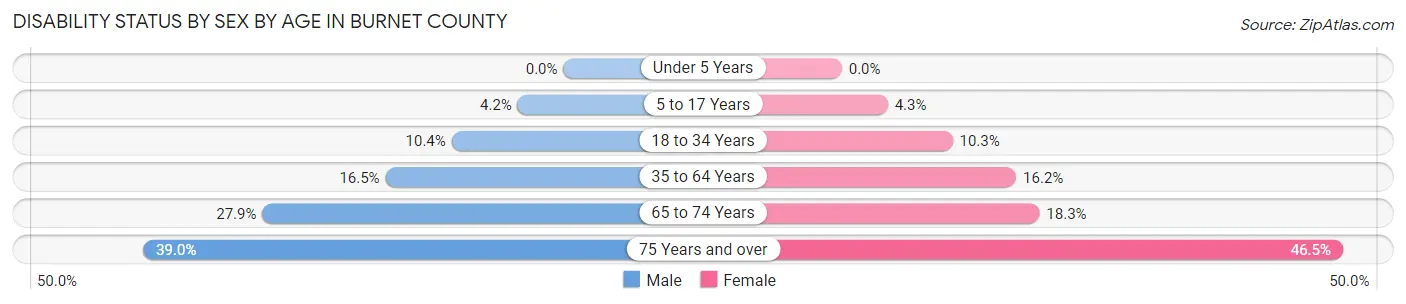
| Age Bracket | Male | Female |
| Under 5 Years | 0 (0.0%) | 0 (0.0%) |
| 5 to 17 Years | 168 (4.2%) | 162 (4.3%) |
| 18 to 34 Years | 466 (10.4%) | 445 (10.3%) |
| 35 to 64 Years | 1,507 (16.5%) | 1,531 (16.2%) |
| 65 to 74 Years | 930 (27.9%) | 645 (18.3%) |
| 75 Years and over | 788 (39.0%) | 1,134 (46.5%) |
Disability Class by Sex by Age in Burnet County
Disability Class: Hearing Difficulty
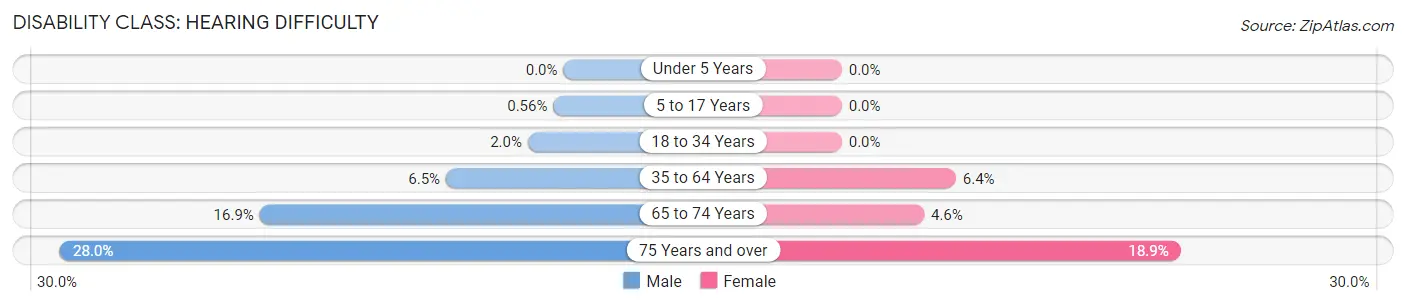
| Age Bracket | Male | Female |
| Under 5 Years | 0 (0.0%) | 0 (0.0%) |
| 5 to 17 Years | 22 (0.6%) | 0 (0.0%) |
| 18 to 34 Years | 89 (2.0%) | 0 (0.0%) |
| 35 to 64 Years | 597 (6.5%) | 601 (6.4%) |
| 65 to 74 Years | 563 (16.9%) | 161 (4.6%) |
| 75 Years and over | 566 (28.0%) | 460 (18.9%) |
Disability Class: Vision Difficulty
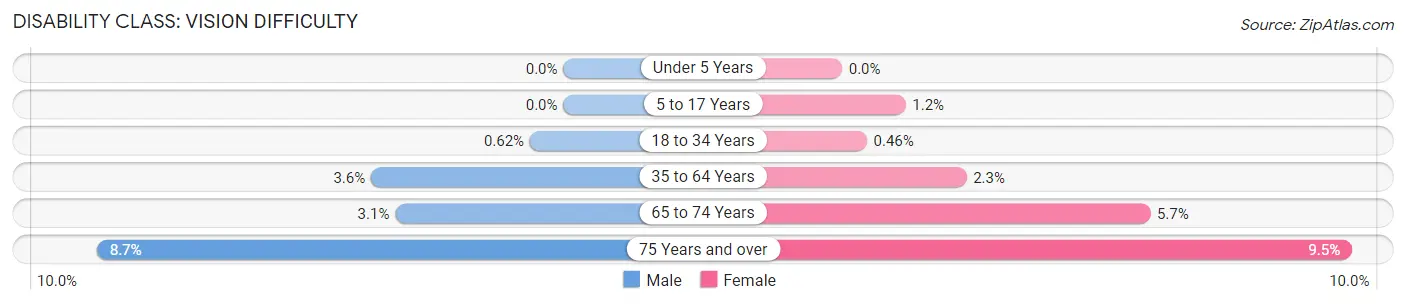
| Age Bracket | Male | Female |
| Under 5 Years | 0 (0.0%) | 0 (0.0%) |
| 5 to 17 Years | 0 (0.0%) | 45 (1.2%) |
| 18 to 34 Years | 28 (0.6%) | 20 (0.5%) |
| 35 to 64 Years | 326 (3.6%) | 219 (2.3%) |
| 65 to 74 Years | 104 (3.1%) | 201 (5.7%) |
| 75 Years and over | 175 (8.7%) | 231 (9.5%) |
Disability Class: Cognitive Difficulty
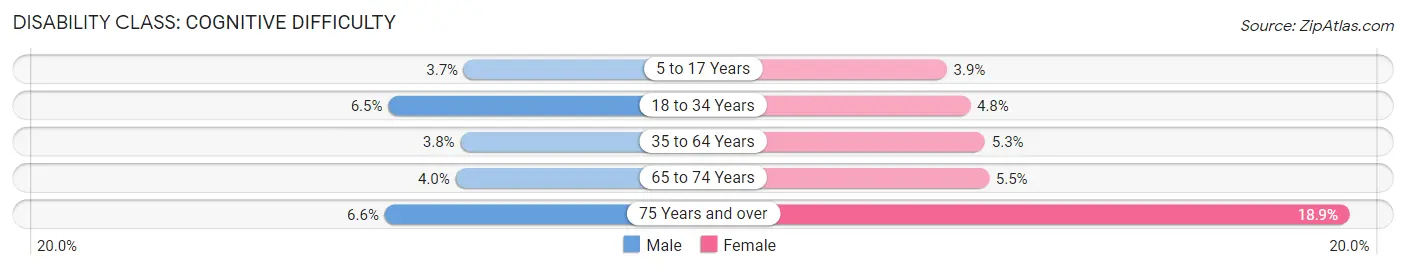
| Age Bracket | Male | Female |
| 5 to 17 Years | 146 (3.7%) | 148 (3.9%) |
| 18 to 34 Years | 292 (6.5%) | 206 (4.8%) |
| 35 to 64 Years | 349 (3.8%) | 502 (5.3%) |
| 65 to 74 Years | 133 (4.0%) | 192 (5.5%) |
| 75 Years and over | 134 (6.6%) | 460 (18.9%) |
Disability Class: Ambulatory Difficulty
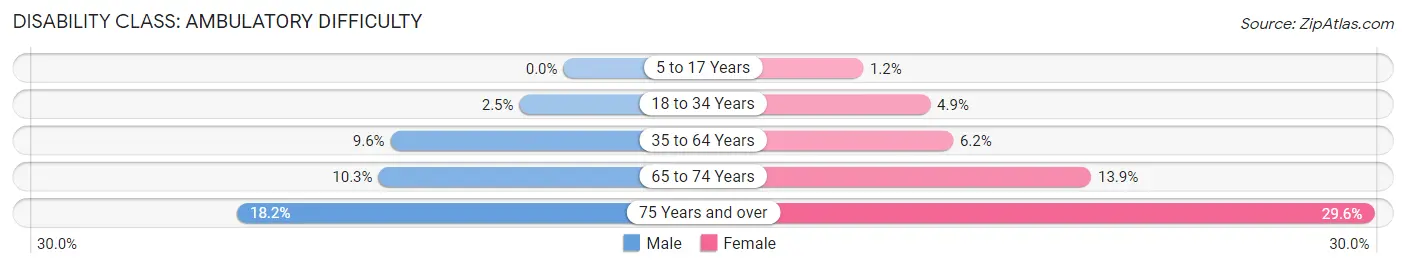
| Age Bracket | Male | Female |
| 5 to 17 Years | 0 (0.0%) | 45 (1.2%) |
| 18 to 34 Years | 110 (2.5%) | 213 (4.9%) |
| 35 to 64 Years | 879 (9.6%) | 586 (6.2%) |
| 65 to 74 Years | 343 (10.3%) | 488 (13.9%) |
| 75 Years and over | 367 (18.2%) | 723 (29.6%) |
Disability Class: Self-Care Difficulty
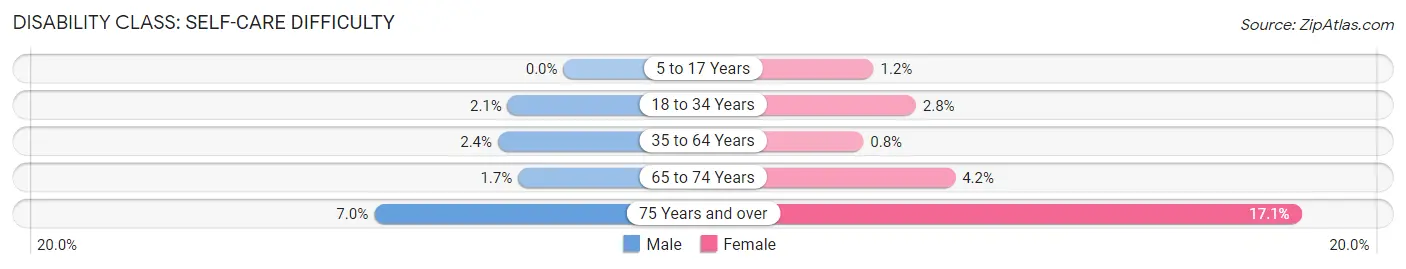
| Age Bracket | Male | Female |
| 5 to 17 Years | 0 (0.0%) | 45 (1.2%) |
| 18 to 34 Years | 93 (2.1%) | 119 (2.8%) |
| 35 to 64 Years | 222 (2.4%) | 76 (0.8%) |
| 65 to 74 Years | 56 (1.7%) | 148 (4.2%) |
| 75 Years and over | 142 (7.0%) | 416 (17.1%) |
Technology Access in Burnet County
Computing Device Access in Burnet County
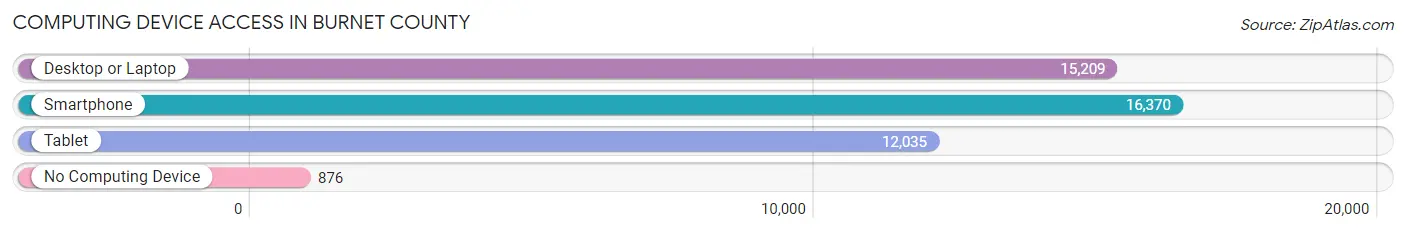
| Device Type | # Households | % Households |
| Desktop or Laptop | 15,209 | 81.6% |
| Smartphone | 16,370 | 87.9% |
| Tablet | 12,035 | 64.6% |
| No Computing Device | 876 | 4.7% |
| Total | 18,629 | 100.0% |
Internet Access in Burnet County
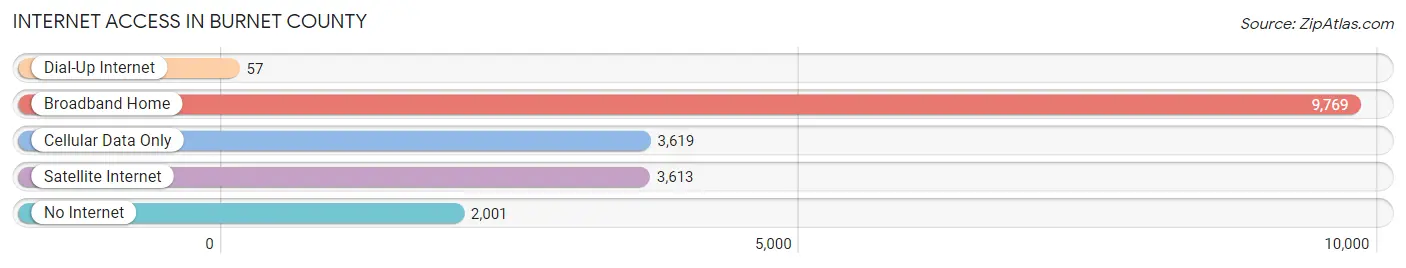
| Internet Type | # Households | % Households |
| Dial-Up Internet | 57 | 0.3% |
| Broadband Home | 9,769 | 52.4% |
| Cellular Data Only | 3,619 | 19.4% |
| Satellite Internet | 3,613 | 19.4% |
| No Internet | 2,001 | 10.7% |
| Total | 18,629 | 100.0% |
Burnet County Summary
Burnet County is located in the Hill Country region of Central Texas. It is bordered by Llano County to the north, Blanco County to the east, Travis County to the south, and Williamson County to the west. The county seat is Burnet, and the largest city is Marble Falls. The county was founded in 1852 and is named for David G. Burnet, the first president of the Republic of Texas.
Geography
Burnet County covers an area of 1,023 square miles, making it the fourth-largest county in Texas. The terrain is mostly hilly, with elevations ranging from 600 to 1,500 feet above sea level. The county is drained by the Colorado River, which forms its western boundary. The county is home to several state parks, including Inks Lake State Park, Longhorn Cavern State Park, and Enchanted Rock State Natural Area.
Climate
Burnet County has a humid subtropical climate, with hot summers and mild winters. Average temperatures range from a low of 33°F in January to a high of 96°F in July. Average annual precipitation is 33 inches.
Demographics
As of the 2010 census, Burnet County had a population of 42,750. The racial makeup of the county was 84.3% White, 8.2% Hispanic or Latino, 5.2% African American, 0.7% Native American, 0.4% Asian, and 0.2% Pacific Islander. The median household income was $45,845, and the median family income was $51,845.
Economy
The economy of Burnet County is largely based on agriculture and tourism. The county is home to several wineries, and the area is known for its peaches, apples, and other fruits. The county is also home to several manufacturing companies, including a large steel mill in Marble Falls. The county is also home to several state parks, which attract tourists from all over the state.
Education
Burnet County is served by the Burnet Consolidated Independent School District, which includes seven elementary schools, two middle schools, and one high school. The county is also home to several private schools, including Marble Falls Christian Academy and Faith Academy of Marble Falls. The county is also home to several higher education institutions, including Central Texas College, Texas State Technical College, and the University of Texas at Austin.
Conclusion
Burnet County is a vibrant and diverse county located in the Hill Country region of Central Texas. The county is home to several state parks, wineries, and manufacturing companies, and its economy is largely based on agriculture and tourism. The county is served by the Burnet Consolidated Independent School District, and is home to several higher education institutions. With its beautiful scenery and rich history, Burnet County is an ideal place to live and work.
Common Questions
What is Per Capita Income in Burnet County?
Per Capita income in Burnet County is $40,628.
What is the Median Family Income in Burnet County?
Median Family Income in Burnet County is $87,136.
What is the Median Household income in Burnet County?
Median Household Income in Burnet County is $71,482.
What is Income or Wage Gap in Burnet County?
Income or Wage Gap in Burnet County is 42.0%.
Women in Burnet County earn 58.0 cents for every dollar earned by a man.
What is Family Income Deficit in Burnet County?
Family Income Deficit in Burnet County is $10,751.
Families that are below poverty line in Burnet County earn $10,751 less on average than the poverty threshold level.
What is Inequality or Gini Index in Burnet County?
Inequality or Gini Index in Burnet County is 0.47.
What is the Total Population of Burnet County?
Total Population of Burnet County is 49,684.
What is the Total Male Population of Burnet County?
Total Male Population of Burnet County is 24,537.
What is the Total Female Population of Burnet County?
Total Female Population of Burnet County is 25,147.
What is the Ratio of Males per 100 Females in Burnet County?
There are 97.57 Males per 100 Females in Burnet County.
What is the Ratio of Females per 100 Males in Burnet County?
There are 102.49 Females per 100 Males in Burnet County.
What is the Median Population Age in Burnet County?
Median Population Age in Burnet County is 44.7 Years.
What is the Average Family Size in Burnet County
Average Family Size in Burnet County is 3.1 People.
What is the Average Household Size in Burnet County
Average Household Size in Burnet County is 2.6 People.
How Large is the Labor Force in Burnet County?
There are 23,976 People in the Labor Forcein in Burnet County.
What is the Percentage of People in the Labor Force in Burnet County?
58.9% of People are in the Labor Force in Burnet County.
What is the Unemployment Rate in Burnet County?
Unemployment Rate in Burnet County is 3.4%.