Burleson County, TX Map & Demographics
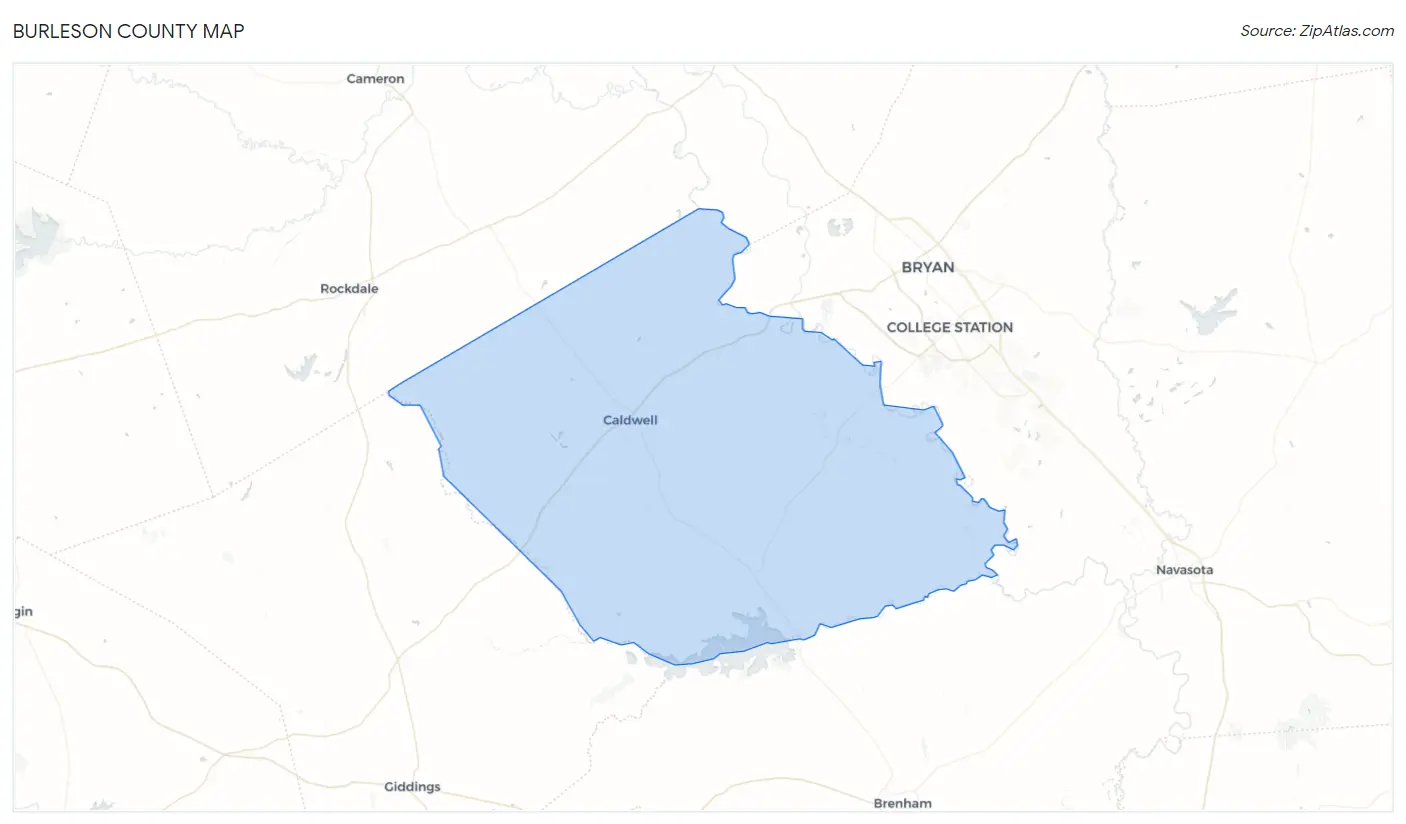
Burleson County Map
Burleson County Overview
$38,918
PER CAPITA INCOME
$83,876
AVG FAMILY INCOME
$71,745
AVG HOUSEHOLD INCOME
32.2%
WAGE / INCOME GAP [ % ]
67.8¢/ $1
WAGE / INCOME GAP [ $ ]
0.45
INEQUALITY / GINI INDEX
17,958
TOTAL POPULATION
8,767
MALE POPULATION
9,191
FEMALE POPULATION
95.39
MALES / 100 FEMALES
104.84
FEMALES / 100 MALES
44.1
MEDIAN AGE
2.9
AVG FAMILY SIZE
2.3
AVG HOUSEHOLD SIZE
8,151
LABOR FORCE [ PEOPLE ]
56.2%
PERCENT IN LABOR FORCE
3.8%
UNEMPLOYMENT RATE
Burleson County Area Codes
Income in Burleson County
Income Overview in Burleson County
Per Capita Income in Burleson County is $38,918, while median incomes of families and households are $83,876 and $71,745 respectively.
| Characteristic | Number | Measure |
| Per Capita Income | 17,958 | $38,918 |
| Median Family Income | 5,085 | $83,876 |
| Mean Family Income | 5,085 | $110,350 |
| Median Household Income | 7,586 | $71,745 |
| Mean Household Income | 7,586 | $92,851 |
| Income Deficit | 5,085 | $0 |
| Wage / Income Gap (%) | 17,958 | 32.21% |
| Wage / Income Gap ($) | 17,958 | 67.79¢ per $1 |
| Gini / Inequality Index | 17,958 | 0.45 |
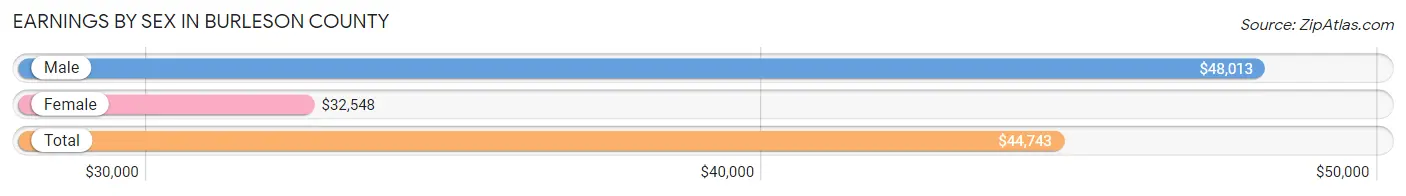
Earnings by Sex in Burleson County
Average Earnings in Burleson County are $44,743, $48,013 for men and $32,548 for women, a difference of 32.2%.
| Sex | Number | Average Earnings |
| Male | 4,904 (57.4%) | $48,013 |
| Female | 3,637 (42.6%) | $32,548 |
| Total | 8,541 (100.0%) | $44,743 |
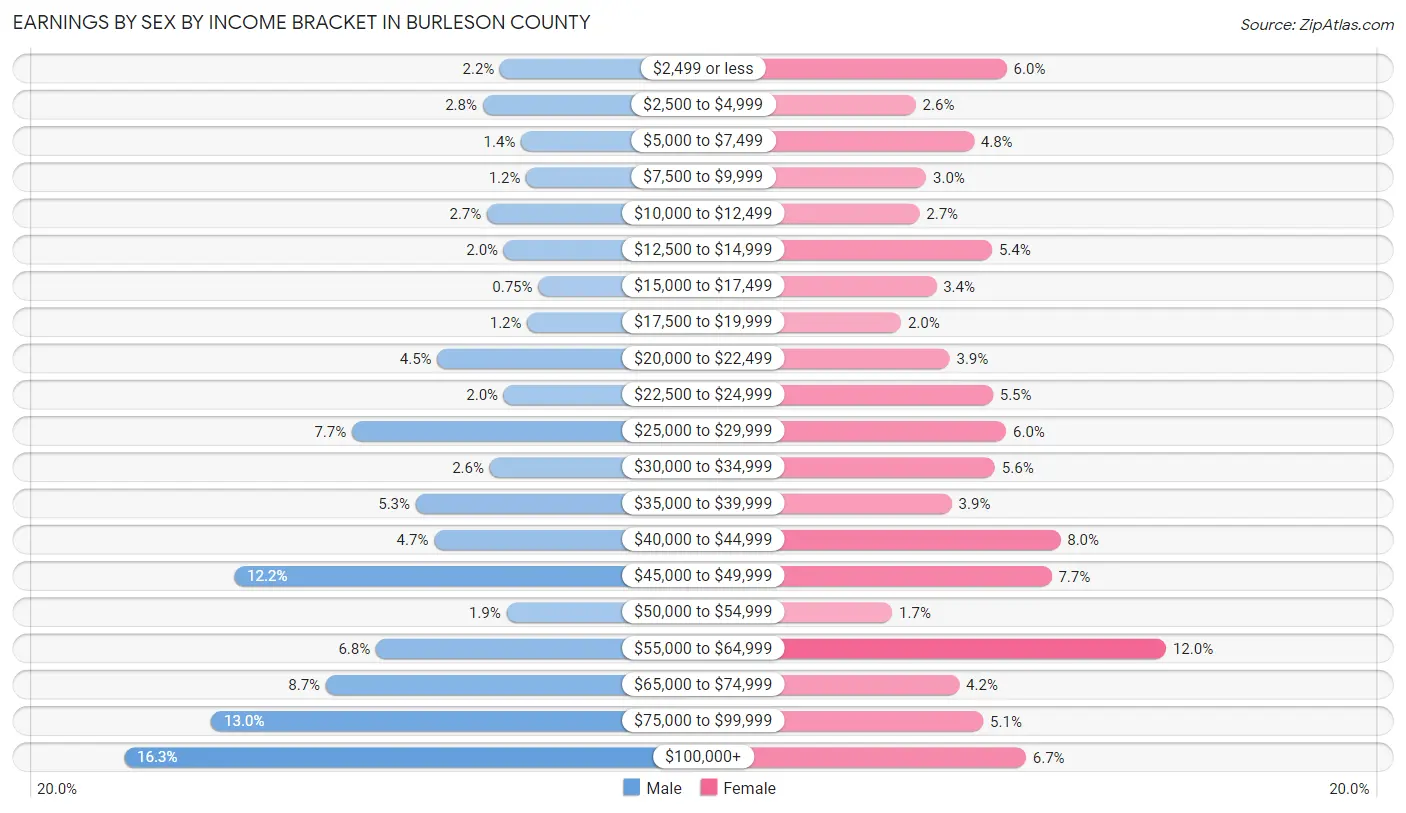
Earnings by Sex by Income Bracket in Burleson County
The most common earnings brackets in Burleson County are $100,000+ for men (798 | 16.3%) and $55,000 to $64,999 for women (435 | 12.0%).
| Income | Male | Female |
| $2,499 or less | 107 (2.2%) | 218 (6.0%) |
| $2,500 to $4,999 | 139 (2.8%) | 94 (2.6%) |
| $5,000 to $7,499 | 68 (1.4%) | 173 (4.8%) |
| $7,500 to $9,999 | 59 (1.2%) | 108 (3.0%) |
| $10,000 to $12,499 | 131 (2.7%) | 99 (2.7%) |
| $12,500 to $14,999 | 100 (2.0%) | 198 (5.4%) |
| $15,000 to $17,499 | 37 (0.7%) | 122 (3.4%) |
| $17,500 to $19,999 | 57 (1.2%) | 74 (2.0%) |
| $20,000 to $22,499 | 222 (4.5%) | 140 (3.8%) |
| $22,500 to $24,999 | 100 (2.0%) | 199 (5.5%) |
| $25,000 to $29,999 | 379 (7.7%) | 217 (6.0%) |
| $30,000 to $34,999 | 126 (2.6%) | 202 (5.6%) |
| $35,000 to $39,999 | 262 (5.3%) | 143 (3.9%) |
| $40,000 to $44,999 | 228 (4.6%) | 291 (8.0%) |
| $45,000 to $49,999 | 596 (12.1%) | 279 (7.7%) |
| $50,000 to $54,999 | 95 (1.9%) | 62 (1.7%) |
| $55,000 to $64,999 | 335 (6.8%) | 435 (12.0%) |
| $65,000 to $74,999 | 427 (8.7%) | 153 (4.2%) |
| $75,000 to $99,999 | 638 (13.0%) | 186 (5.1%) |
| $100,000+ | 798 (16.3%) | 244 (6.7%) |
| Total | 4,904 (100.0%) | 3,637 (100.0%) |
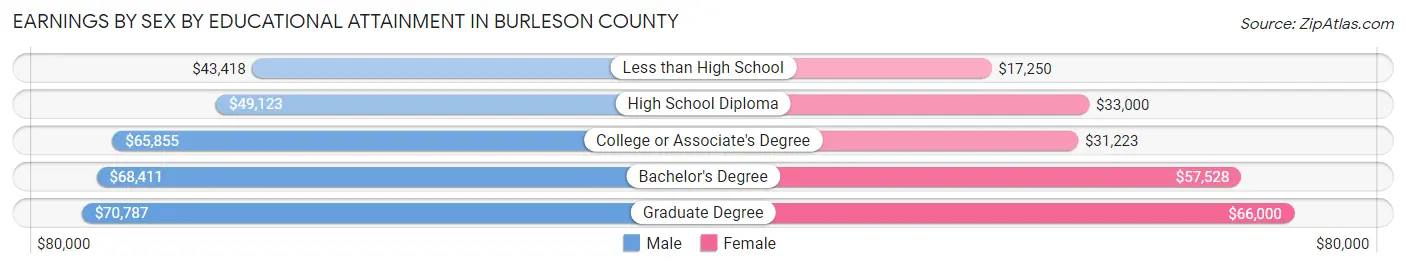
Earnings by Sex by Educational Attainment in Burleson County
Average earnings in Burleson County are $51,581 for men and $40,103 for women, a difference of 22.3%. Men with an educational attainment of graduate degree enjoy the highest average annual earnings of $70,787, while those with less than high school education earn the least with $43,418. Women with an educational attainment of graduate degree earn the most with the average annual earnings of $66,000, while those with less than high school education have the smallest earnings of $17,250.
| Educational Attainment | Male Income | Female Income |
| Less than High School | $43,418 | $17,250 |
| High School Diploma | $49,123 | $33,000 |
| College or Associate's Degree | $65,855 | $31,223 |
| Bachelor's Degree | $68,411 | $57,528 |
| Graduate Degree | $70,787 | $66,000 |
| Total | $51,581 | $40,103 |
Family Income in Burleson County
Family Income Brackets in Burleson County
According to the Burleson County family income data, there are 1,083 families falling into the $100,000 to $149,999 income range, which is the most common income bracket and makes up 21.3% of all families. Conversely, the $10,000 to $14,999 income bracket is the least frequent group with only 92 families (1.8%) belonging to this category.
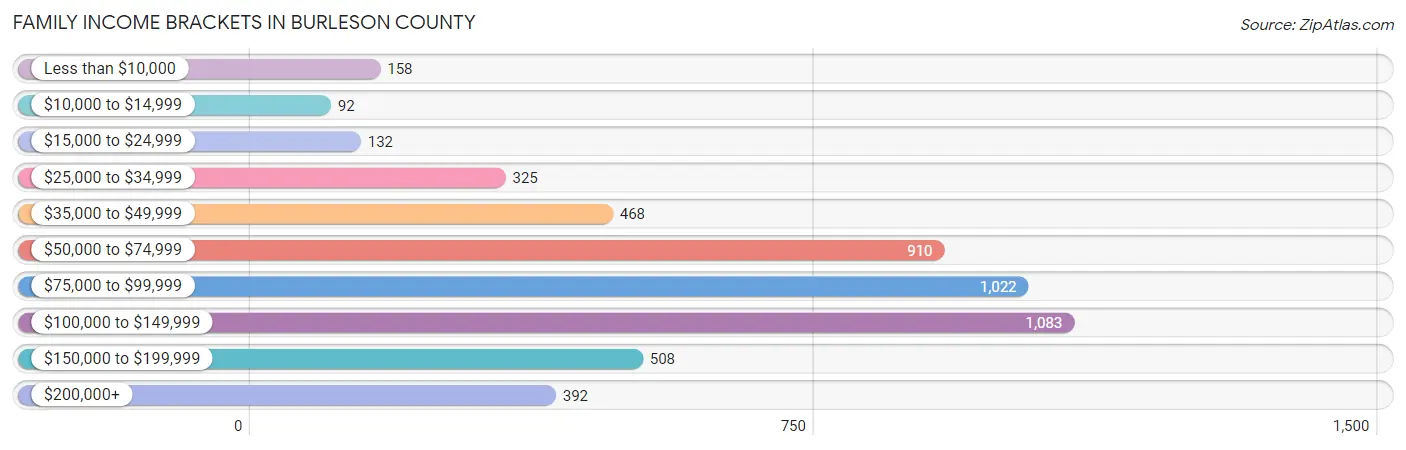
| Income Bracket | # Families | % Families |
| Less than $10,000 | 158 | 3.1% |
| $10,000 to $14,999 | 92 | 1.8% |
| $15,000 to $24,999 | 132 | 2.6% |
| $25,000 to $34,999 | 325 | 6.4% |
| $35,000 to $49,999 | 468 | 9.2% |
| $50,000 to $74,999 | 910 | 17.9% |
| $75,000 to $99,999 | 1,022 | 20.1% |
| $100,000 to $149,999 | 1,083 | 21.3% |
| $150,000 to $199,999 | 508 | 10.0% |
| $200,000+ | 392 | 7.7% |
Family Income by Famaliy Size in Burleson County
7+ person families (143 | 2.8%) account for the highest median family income in Burleson County with $130,027 per family, while 2-person families (2,752 | 54.1%) have the highest median income of $38,797 per family member.
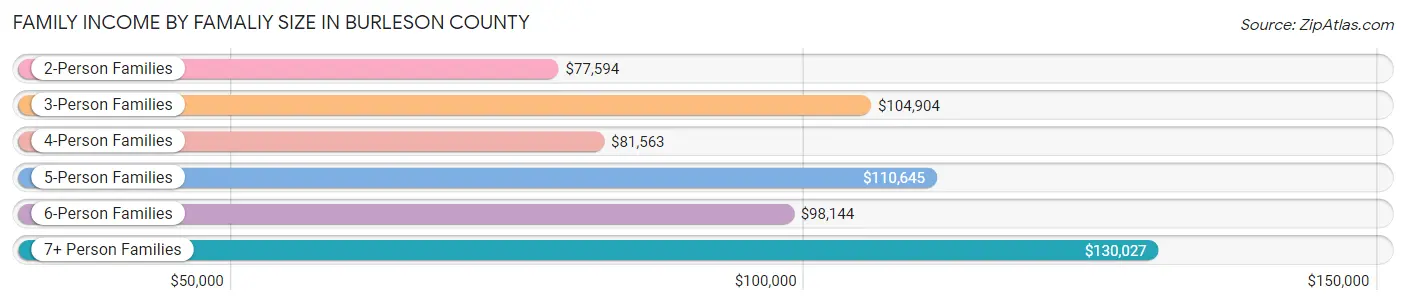
| Income Bracket | # Families | Median Income |
| 2-Person Families | 2,752 (54.1%) | $77,594 |
| 3-Person Families | 797 (15.7%) | $104,904 |
| 4-Person Families | 870 (17.1%) | $81,563 |
| 5-Person Families | 328 (6.5%) | $110,645 |
| 6-Person Families | 195 (3.8%) | $98,144 |
| 7+ Person Families | 143 (2.8%) | $130,027 |
| Total | 5,085 (100.0%) | $83,876 |
Family Income by Number of Earners in Burleson County
The median family income in Burleson County is $83,876, with families comprising 2 earners (1,920) having the highest median family income of $113,974, while families with no earners (966) have the lowest median family income of $61,429, accounting for 37.8% and 19.0% of families, respectively.
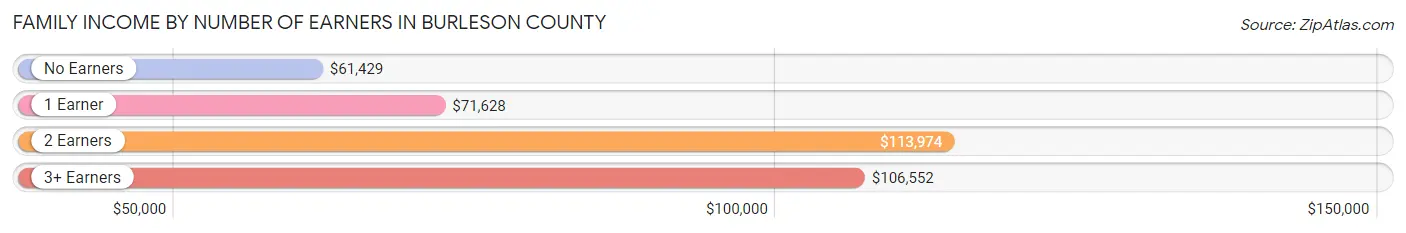
| Number of Earners | # Families | Median Income |
| No Earners | 966 (19.0%) | $61,429 |
| 1 Earner | 1,781 (35.0%) | $71,628 |
| 2 Earners | 1,920 (37.8%) | $113,974 |
| 3+ Earners | 418 (8.2%) | $106,552 |
| Total | 5,085 (100.0%) | $83,876 |
Household Income in Burleson County
Household Income Brackets in Burleson County
With 1,457 households falling in the category, the $50,000 to $74,999 income range is the most frequent in Burleson County, accounting for 19.2% of all households. In contrast, only 319 households (4.2%) fall into the $10,000 to $14,999 income bracket, making it the least populous group.
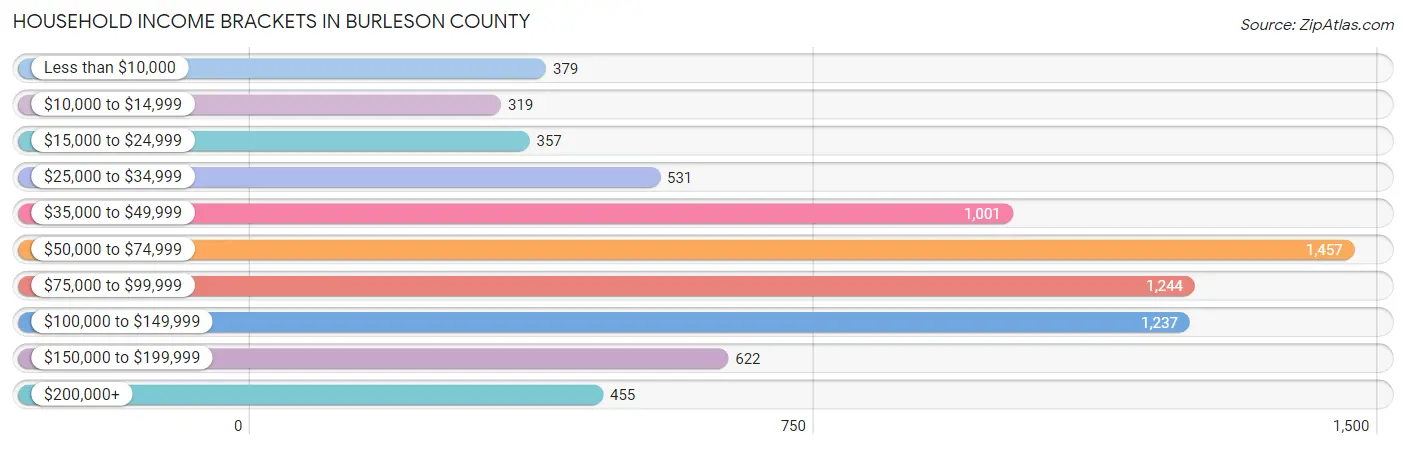
| Income Bracket | # Households | % Households |
| Less than $10,000 | 379 | 5.0% |
| $10,000 to $14,999 | 319 | 4.2% |
| $15,000 to $24,999 | 357 | 4.7% |
| $25,000 to $34,999 | 531 | 7.0% |
| $35,000 to $49,999 | 1,001 | 13.2% |
| $50,000 to $74,999 | 1,457 | 19.2% |
| $75,000 to $99,999 | 1,244 | 16.4% |
| $100,000 to $149,999 | 1,237 | 16.3% |
| $150,000 to $199,999 | 622 | 8.2% |
| $200,000+ | 455 | 6.0% |
Household Income by Householder Age in Burleson County
The median household income in Burleson County is $71,745, with the highest median household income of $75,179 found in the 45 to 64 years age bracket for the primary householder. A total of 2,855 households (37.6%) fall into this category. Meanwhile, the 15 to 24 years age bracket for the primary householder has the lowest median household income of $0, with 278 households (3.7%) in this group.
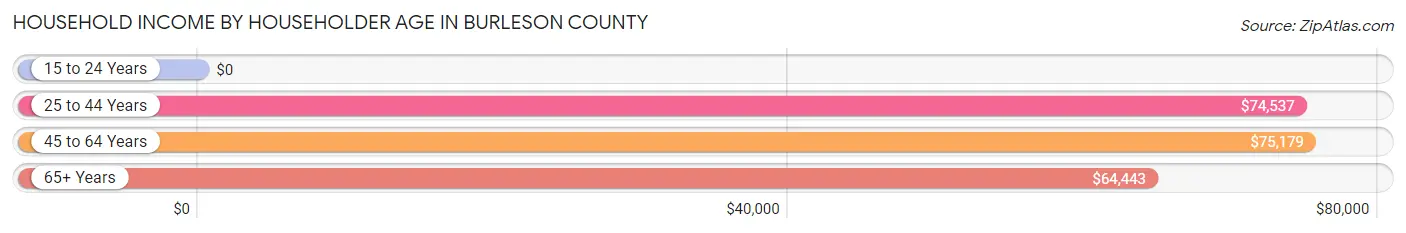
| Income Bracket | # Households | Median Income |
| 15 to 24 Years | 278 (3.7%) | $0 |
| 25 to 44 Years | 1,914 (25.2%) | $74,537 |
| 45 to 64 Years | 2,855 (37.6%) | $75,179 |
| 65+ Years | 2,539 (33.5%) | $64,443 |
| Total | 7,586 (100.0%) | $71,745 |
Poverty in Burleson County
Income Below Poverty by Sex and Age in Burleson County
With 9.4% poverty level for males and 15.4% for females among the residents of Burleson County, 5 year old males and 15 year old females are the most vulnerable to poverty, with 45 males (72.6%) and 67 females (66.3%) in their respective age groups living below the poverty level.
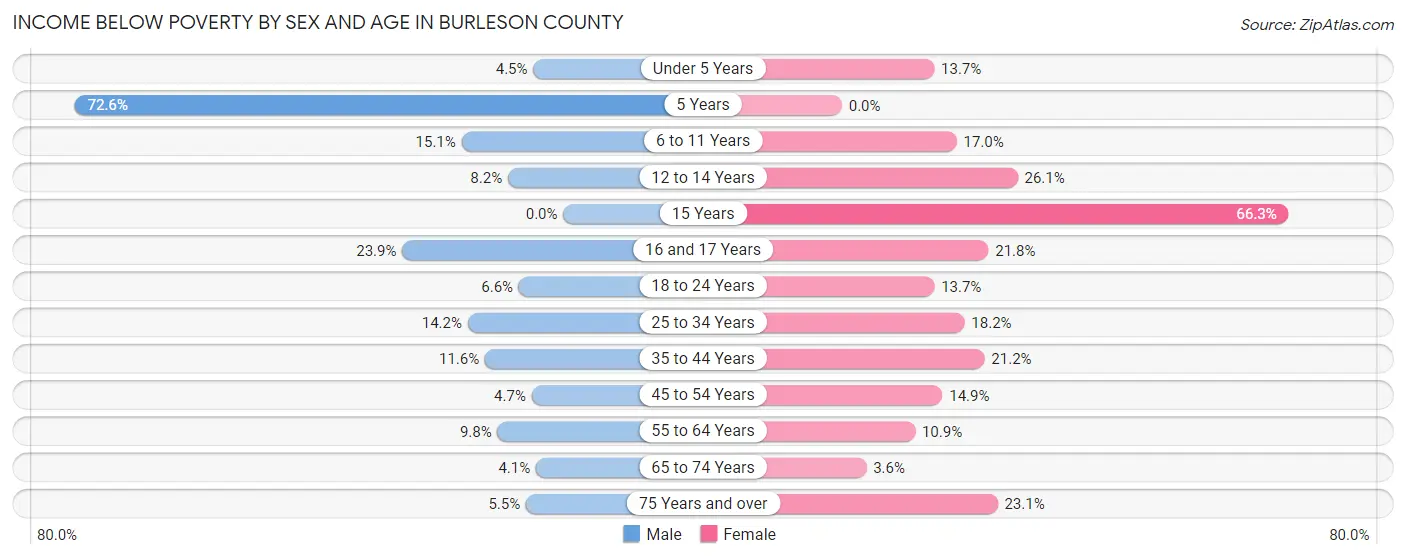
| Age Bracket | Male | Female |
| Under 5 Years | 15 (4.4%) | 81 (13.7%) |
| 5 Years | 45 (72.6%) | 0 (0.0%) |
| 6 to 11 Years | 100 (15.1%) | 92 (17.0%) |
| 12 to 14 Years | 37 (8.2%) | 101 (26.1%) |
| 15 Years | 0 (0.0%) | 67 (66.3%) |
| 16 and 17 Years | 44 (23.9%) | 62 (21.7%) |
| 18 to 24 Years | 39 (6.6%) | 76 (13.7%) |
| 25 to 34 Years | 141 (14.2%) | 181 (18.2%) |
| 35 to 44 Years | 127 (11.6%) | 211 (21.2%) |
| 45 to 54 Years | 47 (4.7%) | 172 (14.9%) |
| 55 to 64 Years | 130 (9.8%) | 148 (10.9%) |
| 65 to 74 Years | 48 (4.1%) | 46 (3.6%) |
| 75 Years and over | 35 (5.5%) | 160 (23.1%) |
| Total | 808 (9.4%) | 1,397 (15.4%) |
Income Above Poverty by Sex and Age in Burleson County
According to the poverty statistics in Burleson County, males aged 15 years and females aged 5 years are the age groups that are most secure financially, with 100.0% of males and 100.0% of females in these age groups living above the poverty line.
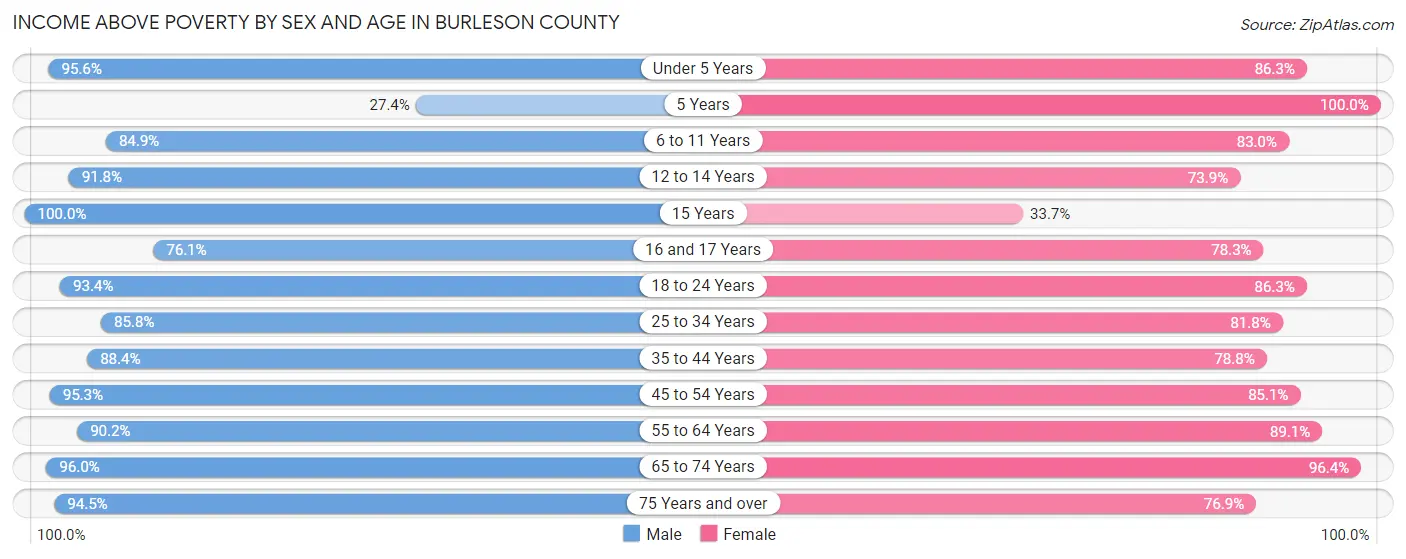
| Age Bracket | Male | Female |
| Under 5 Years | 322 (95.6%) | 510 (86.3%) |
| 5 Years | 17 (27.4%) | 178 (100.0%) |
| 6 to 11 Years | 562 (84.9%) | 448 (83.0%) |
| 12 to 14 Years | 413 (91.8%) | 286 (73.9%) |
| 15 Years | 77 (100.0%) | 34 (33.7%) |
| 16 and 17 Years | 140 (76.1%) | 223 (78.2%) |
| 18 to 24 Years | 552 (93.4%) | 478 (86.3%) |
| 25 to 34 Years | 853 (85.8%) | 813 (81.8%) |
| 35 to 44 Years | 965 (88.4%) | 785 (78.8%) |
| 45 to 54 Years | 956 (95.3%) | 981 (85.1%) |
| 55 to 64 Years | 1,201 (90.2%) | 1,213 (89.1%) |
| 65 to 74 Years | 1,137 (96.0%) | 1,220 (96.4%) |
| 75 Years and over | 597 (94.5%) | 532 (76.9%) |
| Total | 7,792 (90.6%) | 7,701 (84.6%) |
Income Below Poverty Among Married-Couple Families in Burleson County
The poverty statistics for married-couple families in Burleson County show that 7.5% or 316 of the total 4,216 families live below the poverty line. Families with 1 or 2 children have the highest poverty rate of 18.7%, comprising of 210 families. On the other hand, families with 5 or more children have the lowest poverty rate of 0.0%, which includes 0 families.
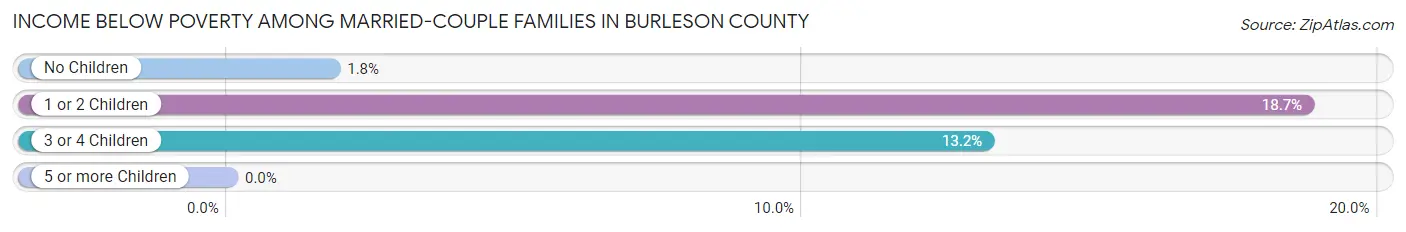
| Children | Above Poverty | Below Poverty |
| No Children | 2,543 (98.2%) | 46 (1.8%) |
| 1 or 2 Children | 911 (81.3%) | 210 (18.7%) |
| 3 or 4 Children | 396 (86.8%) | 60 (13.2%) |
| 5 or more Children | 50 (100.0%) | 0 (0.0%) |
| Total | 3,900 (92.5%) | 316 (7.5%) |
Income Below Poverty Among Single-Parent Households in Burleson County
According to the poverty data in Burleson County, 7.7% or 9 single-father households and 17.7% or 133 single-mother households are living below the poverty line. Among single-father households, those with no children have the highest poverty rate, with 7 households (12.7%) experiencing poverty. Likewise, among single-mother households, those with 3 or 4 children have the highest poverty rate, with 44 households (49.4%) falling below the poverty line.
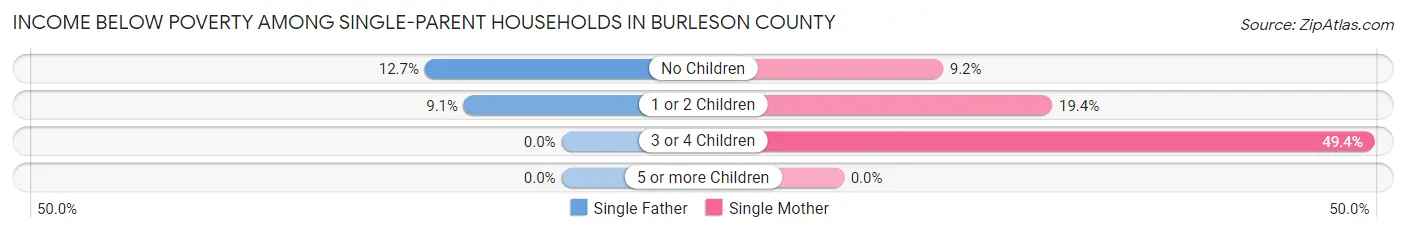
| Children | Single Father | Single Mother |
| No Children | 7 (12.7%) | 36 (9.2%) |
| 1 or 2 Children | 2 (9.1%) | 53 (19.4%) |
| 3 or 4 Children | 0 (0.0%) | 44 (49.4%) |
| 5 or more Children | 0 (0.0%) | 0 (0.0%) |
| Total | 9 (7.7%) | 133 (17.7%) |
Income Below Poverty Among Married-Couple vs Single-Parent Households in Burleson County
The poverty data for Burleson County shows that 316 of the married-couple family households (7.5%) and 142 of the single-parent households (16.3%) are living below the poverty level. Within the married-couple family households, those with 1 or 2 children have the highest poverty rate, with 210 households (18.7%) falling below the poverty line. Among the single-parent households, those with 3 or 4 children have the highest poverty rate, with 44 household (34.1%) living below poverty.
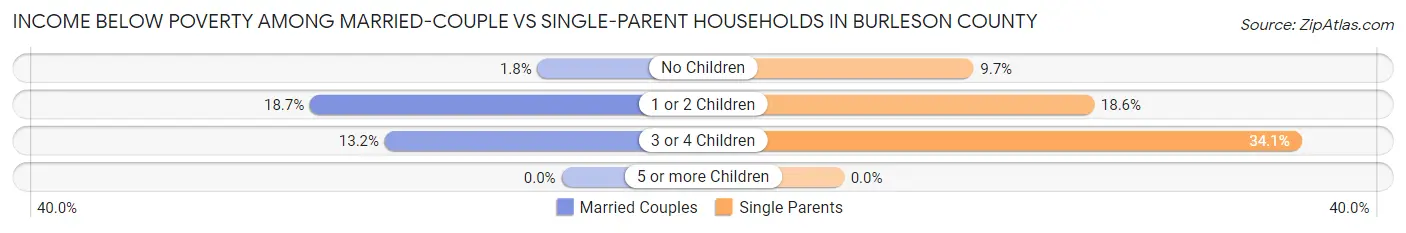
| Children | Married-Couple Families | Single-Parent Households |
| No Children | 46 (1.8%) | 43 (9.7%) |
| 1 or 2 Children | 210 (18.7%) | 55 (18.6%) |
| 3 or 4 Children | 60 (13.2%) | 44 (34.1%) |
| 5 or more Children | 0 (0.0%) | 0 (0.0%) |
| Total | 316 (7.5%) | 142 (16.3%) |
Race in Burleson County
The most populous races in Burleson County are White / Caucasian (13,264 | 73.9%), Hispanic or Latino (3,880 | 21.6%), and Black / African American (2,171 | 12.1%).
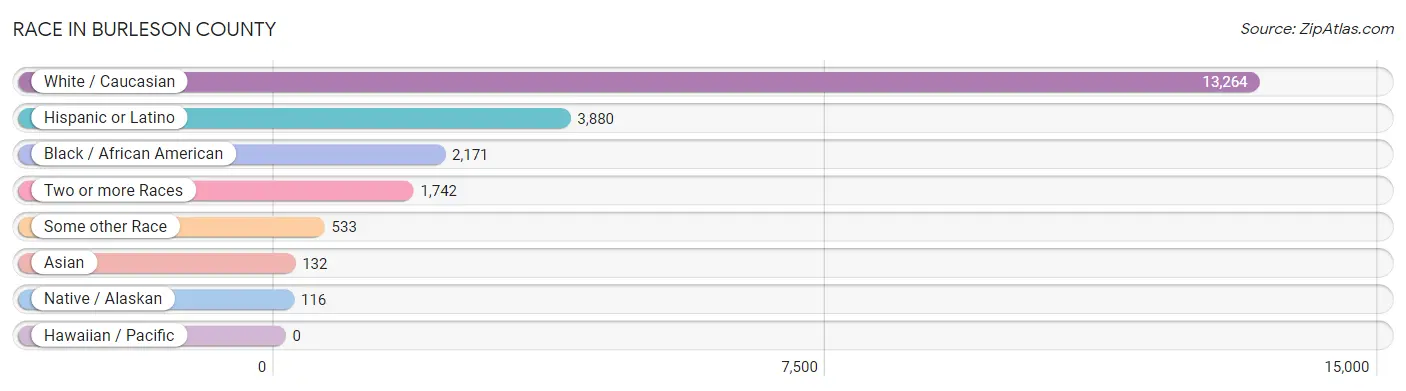
| Race | # Population | % Population |
| Asian | 132 | 0.7% |
| Black / African American | 2,171 | 12.1% |
| Hawaiian / Pacific | 0 | 0.0% |
| Hispanic or Latino | 3,880 | 21.6% |
| Native / Alaskan | 116 | 0.6% |
| White / Caucasian | 13,264 | 73.9% |
| Two or more Races | 1,742 | 9.7% |
| Some other Race | 533 | 3.0% |
| Total | 17,958 | 100.0% |
Ancestry in Burleson County
The most populous ancestries reported in Burleson County are Mexican (3,400 | 18.9%), German (2,805 | 15.6%), American (1,321 | 7.4%), Czech (1,275 | 7.1%), and Irish (1,273 | 7.1%), together accounting for 56.1% of all Burleson County residents.
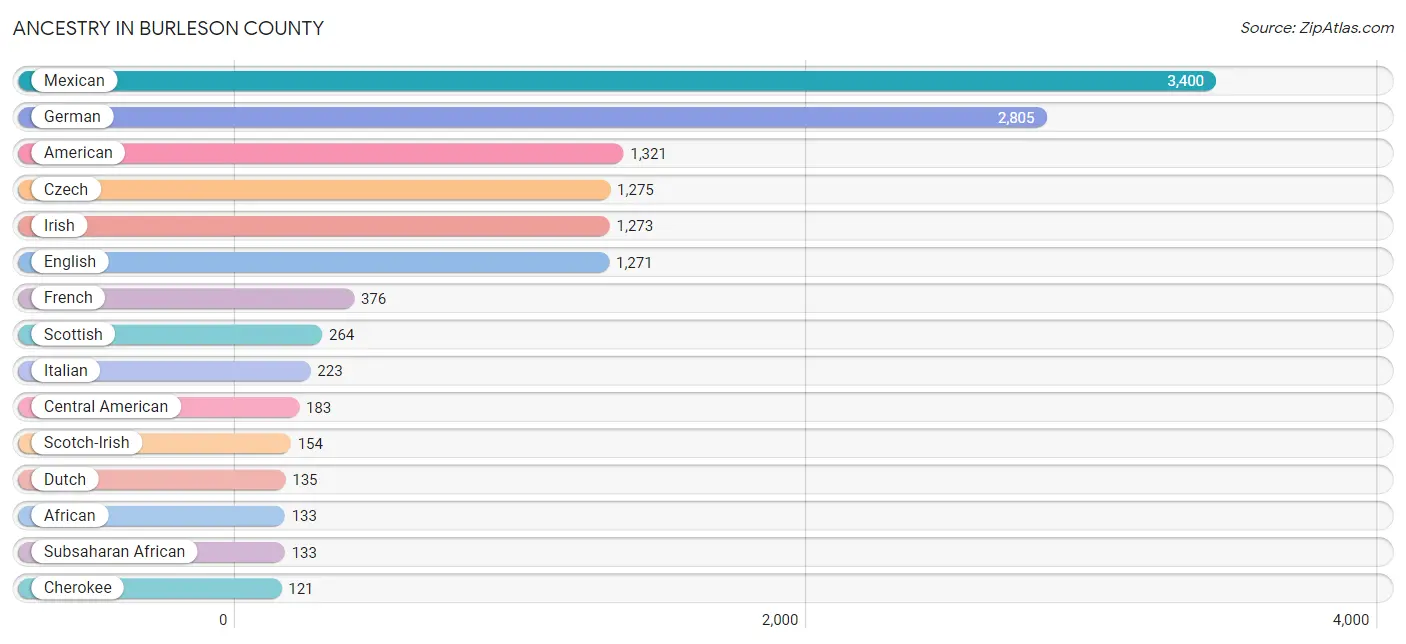
| Ancestry | # Population | % Population |
| African | 133 | 0.7% |
| American | 1,321 | 7.4% |
| Arab | 20 | 0.1% |
| Belgian | 10 | 0.1% |
| British | 60 | 0.3% |
| Burmese | 21 | 0.1% |
| Cajun | 5 | 0.0% |
| Canadian | 16 | 0.1% |
| Central American | 183 | 1.0% |
| Cherokee | 121 | 0.7% |
| Choctaw | 13 | 0.1% |
| Costa Rican | 81 | 0.4% |
| Cuban | 6 | 0.0% |
| Czech | 1,275 | 7.1% |
| Czechoslovakian | 52 | 0.3% |
| Dutch | 135 | 0.7% |
| Dutch West Indian | 3 | 0.0% |
| English | 1,271 | 7.1% |
| European | 72 | 0.4% |
| French | 376 | 2.1% |
| French Canadian | 8 | 0.0% |
| German | 2,805 | 15.6% |
| Greek | 44 | 0.3% |
| Guyanese | 6 | 0.0% |
| Hungarian | 18 | 0.1% |
| Icelander | 15 | 0.1% |
| Indian (Asian) | 5 | 0.0% |
| Irish | 1,273 | 7.1% |
| Italian | 223 | 1.2% |
| Jamaican | 74 | 0.4% |
| Kiowa | 13 | 0.1% |
| Korean | 110 | 0.6% |
| Lebanese | 20 | 0.1% |
| Mexican | 3,400 | 18.9% |
| Mexican American Indian | 61 | 0.3% |
| Nicaraguan | 28 | 0.2% |
| Norwegian | 6 | 0.0% |
| Panamanian | 74 | 0.4% |
| Pennsylvania German | 23 | 0.1% |
| Polish | 84 | 0.5% |
| Puerto Rican | 7 | 0.0% |
| Russian | 11 | 0.1% |
| Scandinavian | 13 | 0.1% |
| Scotch-Irish | 154 | 0.9% |
| Scottish | 264 | 1.5% |
| Slovak | 24 | 0.1% |
| South American | 83 | 0.5% |
| Spaniard | 106 | 0.6% |
| Sri Lankan | 37 | 0.2% |
| Subsaharan African | 133 | 0.7% |
| Swedish | 2 | 0.0% |
| Swiss | 16 | 0.1% |
| Thai | 21 | 0.1% |
| Venezuelan | 83 | 0.5% |
| Welsh | 43 | 0.2% |
| Yaqui | 13 | 0.1% | View All 56 Rows |
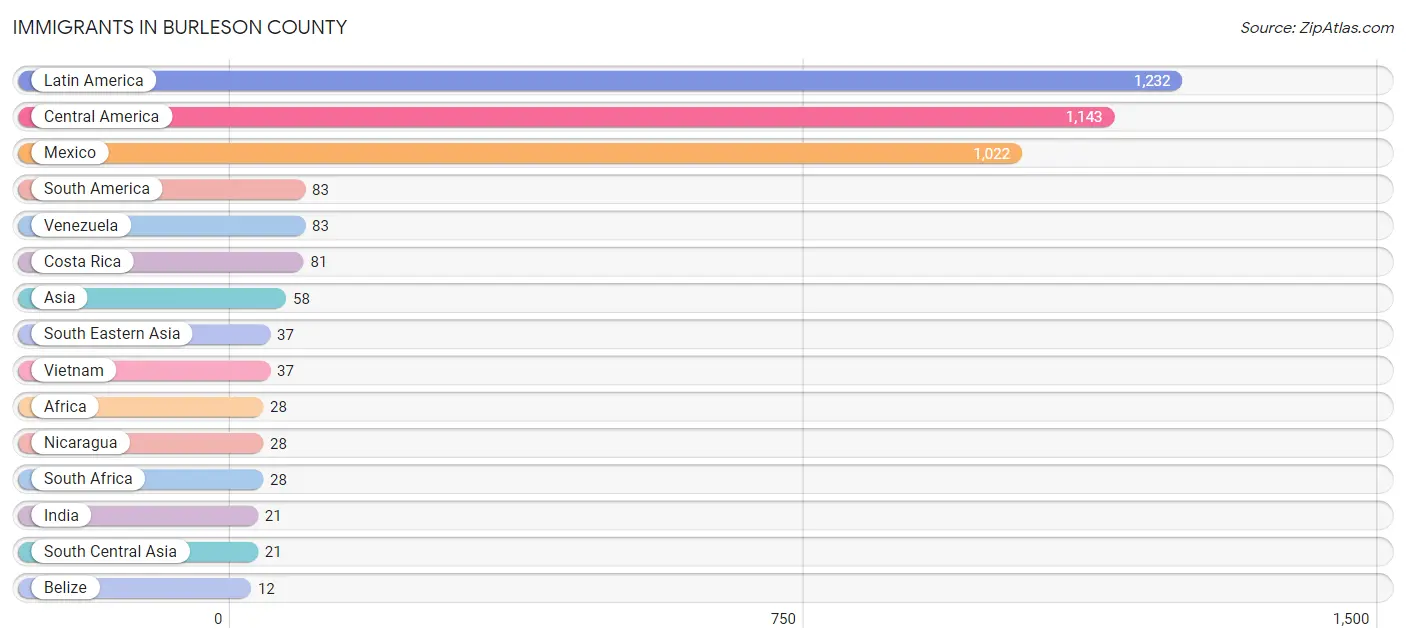
Immigrants in Burleson County
The most numerous immigrant groups reported in Burleson County came from Latin America (1,232 | 6.9%), Central America (1,143 | 6.4%), Mexico (1,022 | 5.7%), South America (83 | 0.5%), and Venezuela (83 | 0.5%), together accounting for 19.8% of all Burleson County residents.
| Immigration Origin | # Population | % Population |
| Africa | 28 | 0.2% |
| Asia | 58 | 0.3% |
| Belize | 12 | 0.1% |
| Caribbean | 6 | 0.0% |
| Central America | 1,143 | 6.4% |
| Costa Rica | 81 | 0.4% |
| Cuba | 6 | 0.0% |
| Europe | 4 | 0.0% |
| Germany | 4 | 0.0% |
| India | 21 | 0.1% |
| Latin America | 1,232 | 6.9% |
| Mexico | 1,022 | 5.7% |
| Nicaragua | 28 | 0.2% |
| South Africa | 28 | 0.2% |
| South America | 83 | 0.5% |
| South Central Asia | 21 | 0.1% |
| South Eastern Asia | 37 | 0.2% |
| Venezuela | 83 | 0.5% |
| Vietnam | 37 | 0.2% |
| Western Europe | 4 | 0.0% | View All 20 Rows |
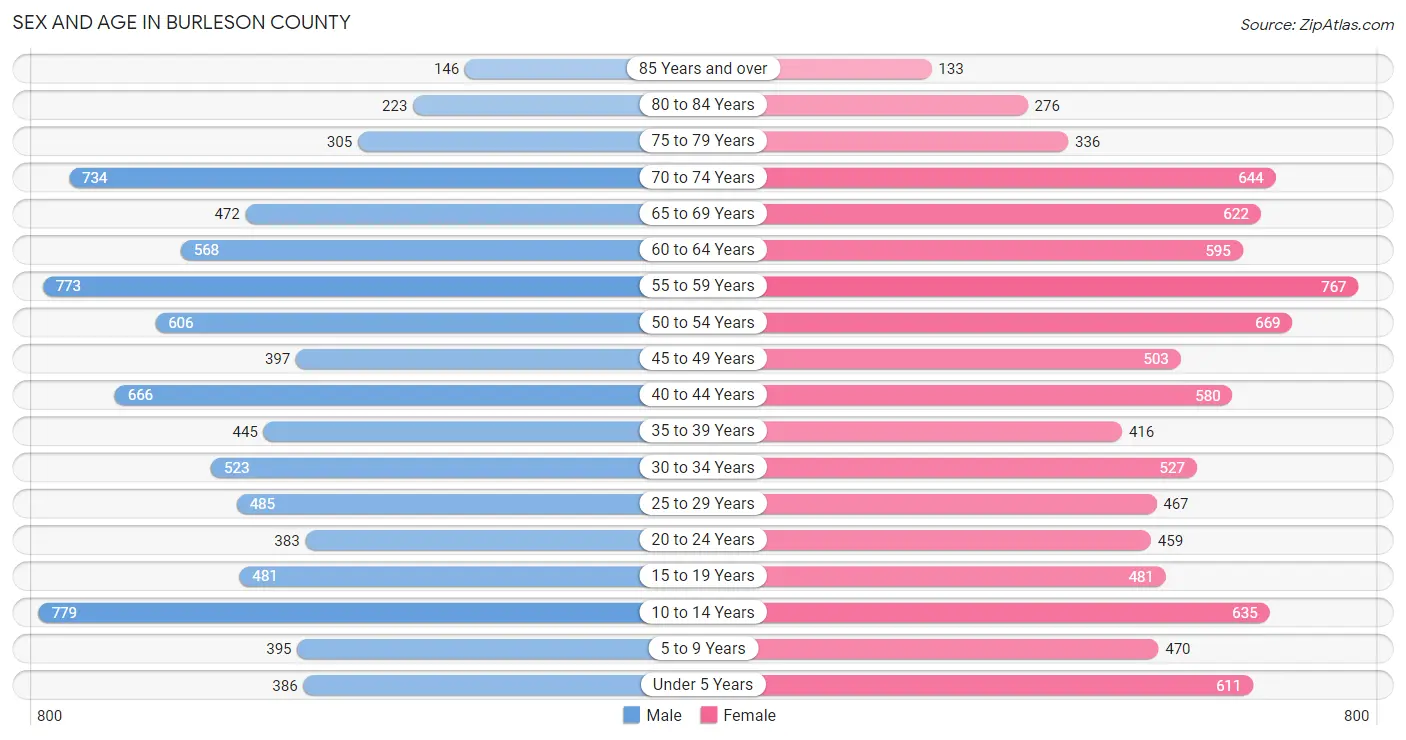
Sex and Age in Burleson County
Sex and Age in Burleson County
The most populous age groups in Burleson County are 10 to 14 Years (779 | 8.9%) for men and 55 to 59 Years (767 | 8.4%) for women.
| Age Bracket | Male | Female |
| Under 5 Years | 386 (4.4%) | 611 (6.7%) |
| 5 to 9 Years | 395 (4.5%) | 470 (5.1%) |
| 10 to 14 Years | 779 (8.9%) | 635 (6.9%) |
| 15 to 19 Years | 481 (5.5%) | 481 (5.2%) |
| 20 to 24 Years | 383 (4.4%) | 459 (5.0%) |
| 25 to 29 Years | 485 (5.5%) | 467 (5.1%) |
| 30 to 34 Years | 523 (6.0%) | 527 (5.7%) |
| 35 to 39 Years | 445 (5.1%) | 416 (4.5%) |
| 40 to 44 Years | 666 (7.6%) | 580 (6.3%) |
| 45 to 49 Years | 397 (4.5%) | 503 (5.5%) |
| 50 to 54 Years | 606 (6.9%) | 669 (7.3%) |
| 55 to 59 Years | 773 (8.8%) | 767 (8.4%) |
| 60 to 64 Years | 568 (6.5%) | 595 (6.5%) |
| 65 to 69 Years | 472 (5.4%) | 622 (6.8%) |
| 70 to 74 Years | 734 (8.4%) | 644 (7.0%) |
| 75 to 79 Years | 305 (3.5%) | 336 (3.7%) |
| 80 to 84 Years | 223 (2.5%) | 276 (3.0%) |
| 85 Years and over | 146 (1.7%) | 133 (1.5%) |
| Total | 8,767 (100.0%) | 9,191 (100.0%) |
Families and Households in Burleson County
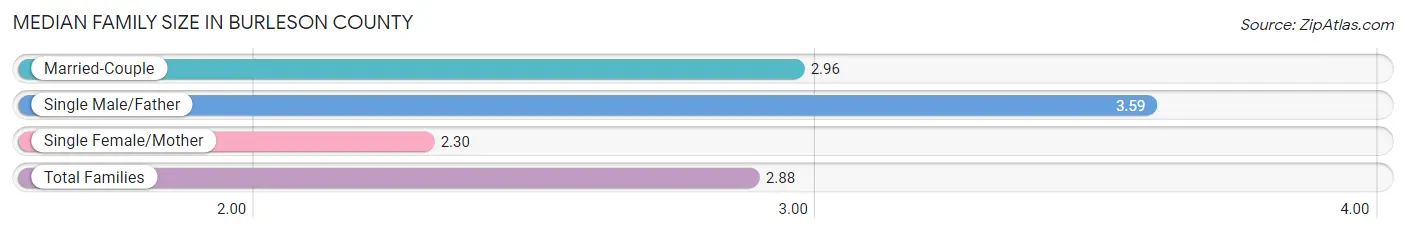
Median Family Size in Burleson County
The median family size in Burleson County is 2.88 persons per family, with single male/father families (117 | 2.3%) accounting for the largest median family size of 3.59 persons per family. On the other hand, single female/mother families (752 | 14.8%) represent the smallest median family size with 2.30 persons per family.
| Family Type | # Families | Family Size |
| Married-Couple | 4,216 (82.9%) | 2.96 |
| Single Male/Father | 117 (2.3%) | 3.59 |
| Single Female/Mother | 752 (14.8%) | 2.30 |
| Total Families | 5,085 (100.0%) | 2.88 |
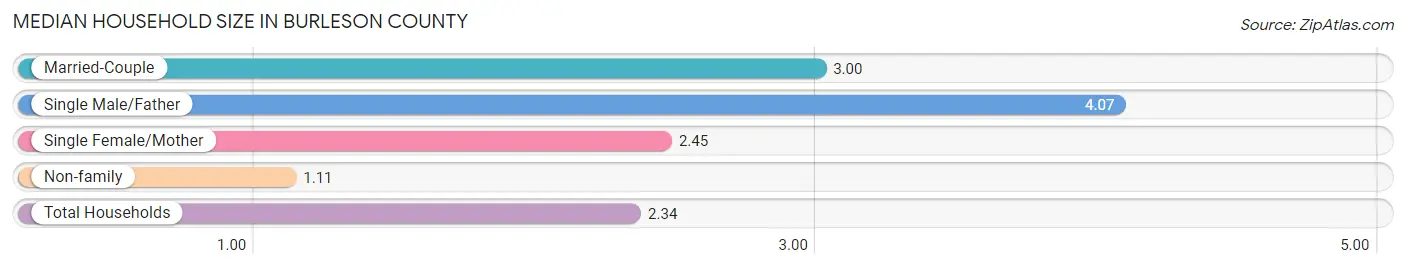
Median Household Size in Burleson County
The median household size in Burleson County is 2.34 persons per household, with single male/father households (117 | 1.5%) accounting for the largest median household size of 4.07 persons per household. non-family households (2,501 | 33.0%) represent the smallest median household size with 1.11 persons per household.
| Household Type | # Households | Household Size |
| Married-Couple | 4,216 (55.6%) | 3.00 |
| Single Male/Father | 117 (1.5%) | 4.07 |
| Single Female/Mother | 752 (9.9%) | 2.45 |
| Non-family | 2,501 (33.0%) | 1.11 |
| Total Households | 7,586 (100.0%) | 2.34 |
Household Size by Marriage Status in Burleson County
Out of a total of 7,586 households in Burleson County, 5,085 (67.0%) are family households, while 2,501 (33.0%) are nonfamily households. The most numerous type of family households are 2-person households, comprising 2,664, and the most common type of nonfamily households are 1-person households, comprising 2,060.
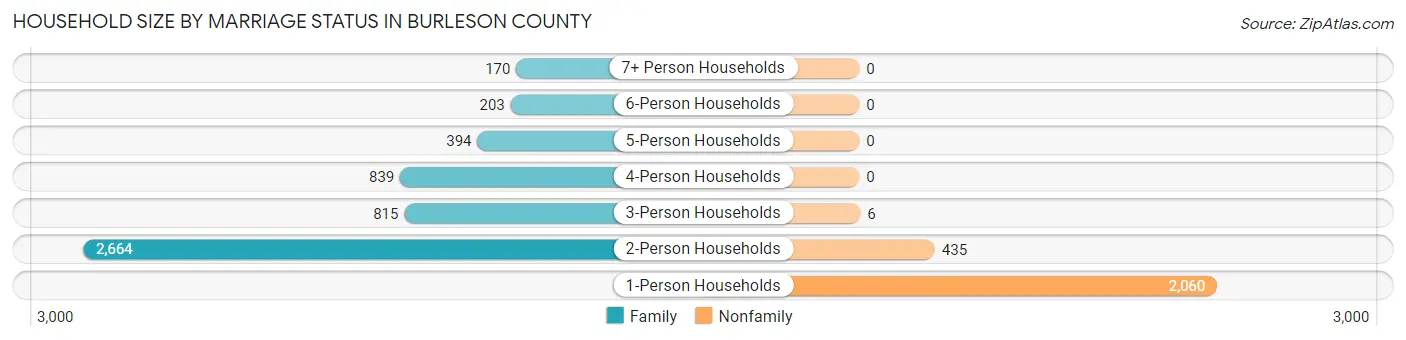
| Household Size | Family Households | Nonfamily Households |
| 1-Person Households | - | 2,060 (27.2%) |
| 2-Person Households | 2,664 (35.1%) | 435 (5.7%) |
| 3-Person Households | 815 (10.7%) | 6 (0.1%) |
| 4-Person Households | 839 (11.1%) | 0 (0.0%) |
| 5-Person Households | 394 (5.2%) | 0 (0.0%) |
| 6-Person Households | 203 (2.7%) | 0 (0.0%) |
| 7+ Person Households | 170 (2.2%) | 0 (0.0%) |
| Total | 5,085 (67.0%) | 2,501 (33.0%) |
Female Fertility in Burleson County
Fertility by Age in Burleson County
Average fertility rate in Burleson County is 34.0 births per 1,000 women. Women in the age bracket of 20 to 34 years have the highest fertility rate with 85.0 births per 1,000 women. Women in the age bracket of 20 to 34 years acount for 100.0% of all women with births.
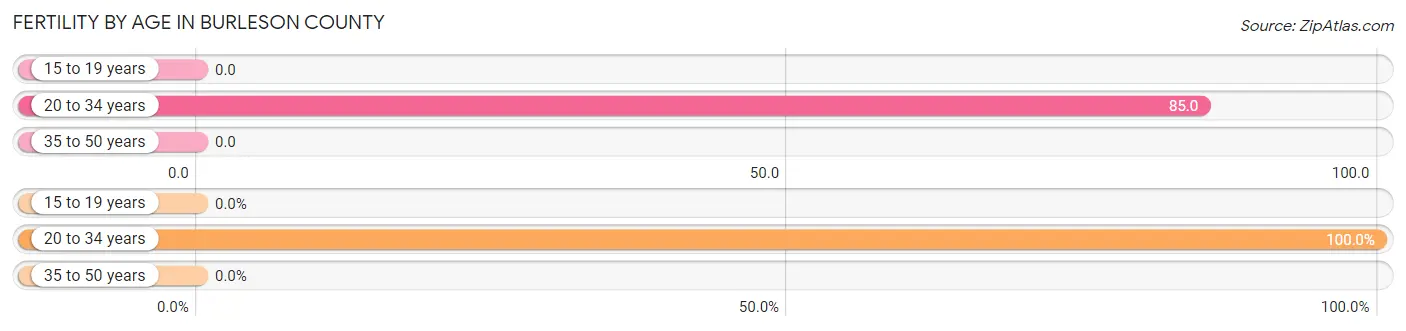
| Age Bracket | Women with Births | Births / 1,000 Women |
| 15 to 19 years | 0 (0.0%) | 0.0 |
| 20 to 34 years | 123 (100.0%) | 85.0 |
| 35 to 50 years | 0 (0.0%) | 0.0 |
| Total | 123 (100.0%) | 34.0 |
Fertility by Age by Marriage Status in Burleson County
33.3% of women with births (123) in Burleson County are married. The highest percentage of unmarried women with births falls into 20 to 34 years age bracket with 66.7% of them unmarried at the time of birth, while the lowest percentage of unmarried women with births belong to 20 to 34 years age bracket with 66.7% of them unmarried.
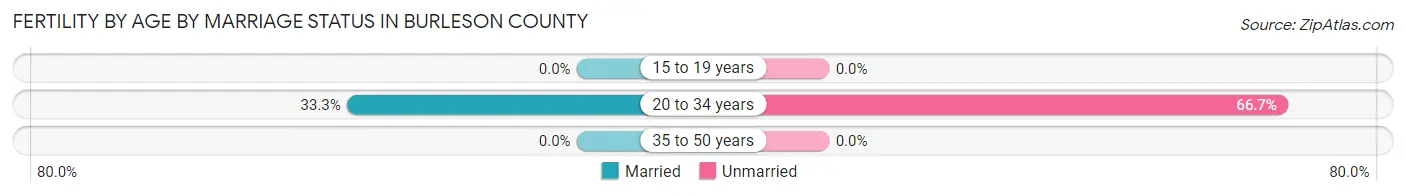
| Age Bracket | Married | Unmarried |
| 15 to 19 years | 0 (0.0%) | 0 (0.0%) |
| 20 to 34 years | 41 (33.3%) | 82 (66.7%) |
| 35 to 50 years | 0 (0.0%) | 0 (0.0%) |
| Total | 41 (33.3%) | 82 (66.7%) |
Fertility by Education in Burleson County
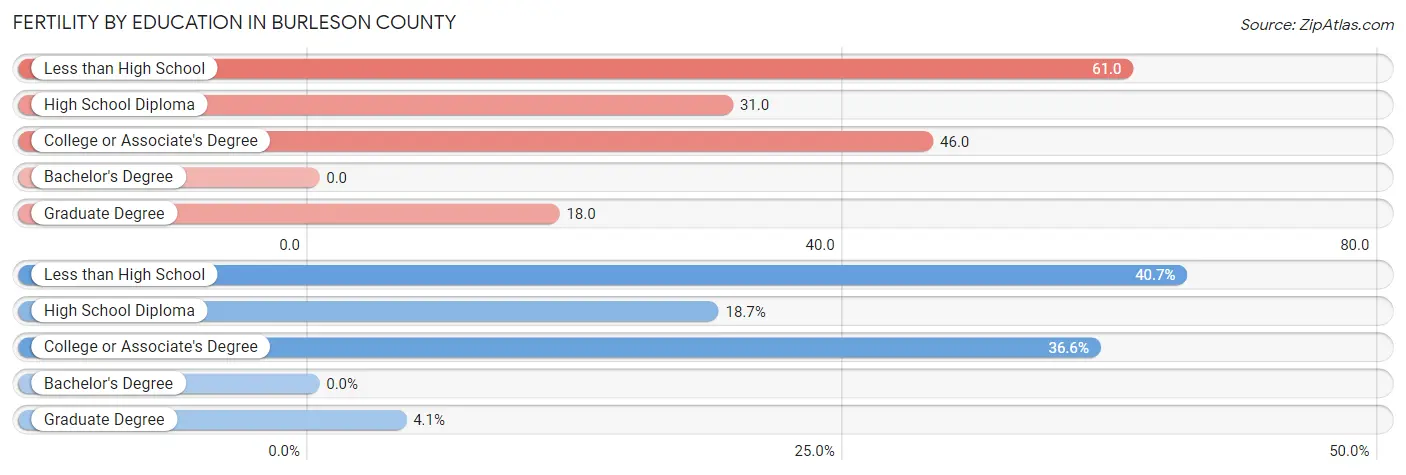
| Educational Attainment | Women with Births | Births / 1,000 Women |
| Less than High School | 50 (40.6%) | 61.0 |
| High School Diploma | 23 (18.7%) | 31.0 |
| College or Associate's Degree | 45 (36.6%) | 46.0 |
| Bachelor's Degree | 0 (0.0%) | 0.0 |
| Graduate Degree | 5 (4.1%) | 18.0 |
| Total | 123 (100.0%) | 34.0 |
Fertility by Education by Marriage Status in Burleson County
66.7% of women with births in Burleson County are unmarried. Women with the educational attainment of high school diploma are most likely to be married with 100.0% of them married at childbirth, while women with the educational attainment of less than high school are least likely to be married with 100.0% of them unmarried at childbirth.
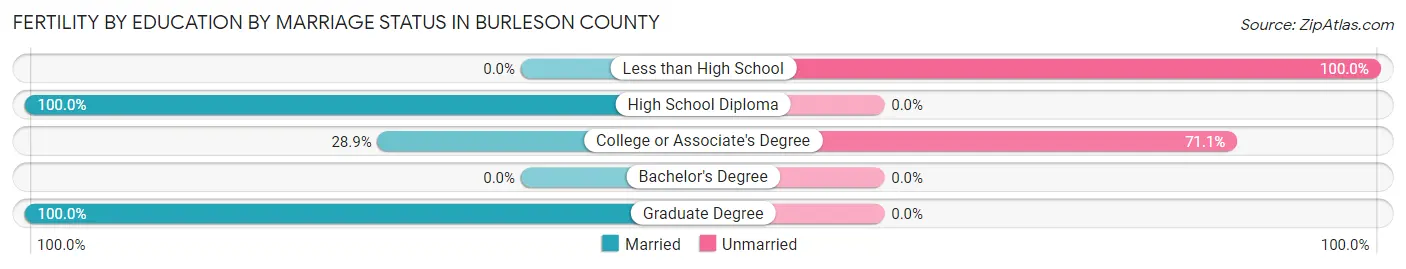
| Educational Attainment | Married | Unmarried |
| Less than High School | 0 (0.0%) | 50 (100.0%) |
| High School Diploma | 23 (100.0%) | 0 (0.0%) |
| College or Associate's Degree | 13 (28.9%) | 32 (71.1%) |
| Bachelor's Degree | 0 (0.0%) | 0 (0.0%) |
| Graduate Degree | 5 (100.0%) | 0 (0.0%) |
| Total | 41 (33.3%) | 82 (66.7%) |
Employment Characteristics in Burleson County
Employment by Class of Employer in Burleson County
Among the 7,492 employed individuals in Burleson County, private company employees (4,639 | 61.9%), state government employees (732 | 9.8%), and self-employed (not incorporated) (708 | 9.5%) make up the most common classes of employment.
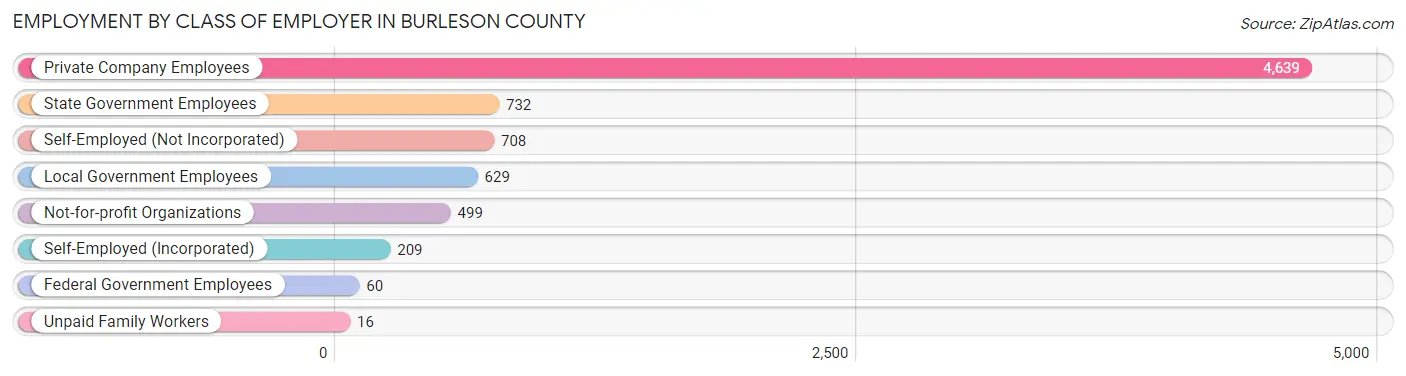
| Employer Class | # Employees | % Employees |
| Private Company Employees | 4,639 | 61.9% |
| Self-Employed (Incorporated) | 209 | 2.8% |
| Self-Employed (Not Incorporated) | 708 | 9.5% |
| Not-for-profit Organizations | 499 | 6.7% |
| Local Government Employees | 629 | 8.4% |
| State Government Employees | 732 | 9.8% |
| Federal Government Employees | 60 | 0.8% |
| Unpaid Family Workers | 16 | 0.2% |
| Total | 7,492 | 100.0% |
Employment Status by Age in Burleson County
According to the labor force statistics for Burleson County, out of the total population over 16 years of age (14,504), 56.2% or 8,151 individuals are in the labor force, with 3.8% or 310 of them unemployed. The age group with the highest labor force participation rate is 30 to 34 years, with 83.1% or 873 individuals in the labor force. Within the labor force, the 35 to 44 years age range has the highest percentage of unemployed individuals, with 7.7% or 133 of them being unemployed.
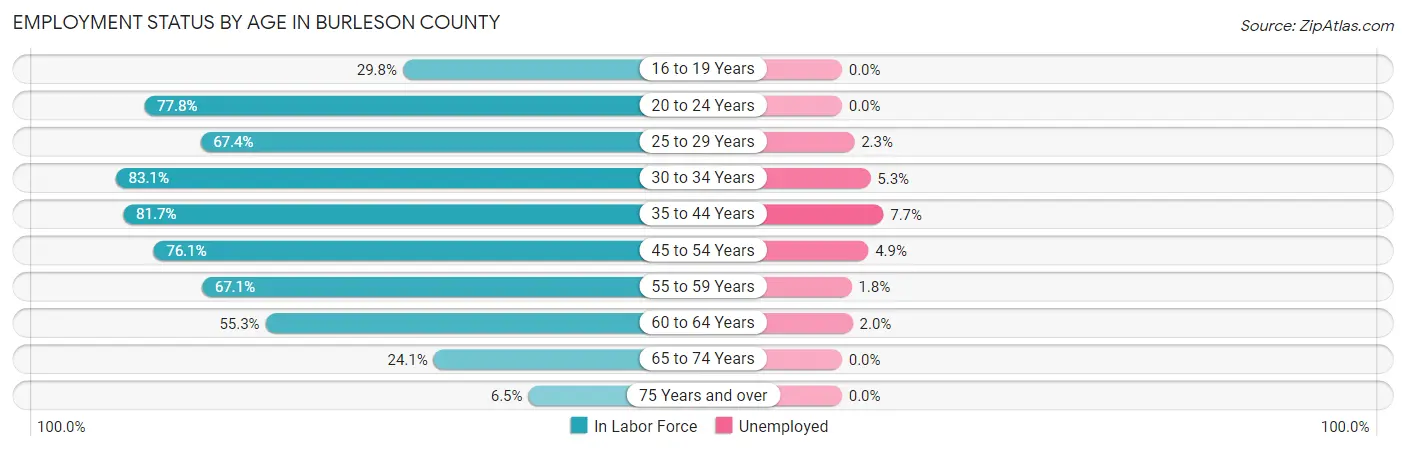
| Age Bracket | In Labor Force | Unemployed |
| 16 to 19 Years | 234 (29.8%) | 0 (0.0%) |
| 20 to 24 Years | 655 (77.8%) | 0 (0.0%) |
| 25 to 29 Years | 642 (67.4%) | 15 (2.3%) |
| 30 to 34 Years | 873 (83.1%) | 46 (5.3%) |
| 35 to 44 Years | 1,721 (81.7%) | 133 (7.7%) |
| 45 to 54 Years | 1,655 (76.1%) | 81 (4.9%) |
| 55 to 59 Years | 1,033 (67.1%) | 19 (1.8%) |
| 60 to 64 Years | 643 (55.3%) | 13 (2.0%) |
| 65 to 74 Years | 596 (24.1%) | 0 (0.0%) |
| 75 Years and over | 92 (6.5%) | 0 (0.0%) |
| Total | 8,151 (56.2%) | 310 (3.8%) |
Employment Status by Educational Attainment in Burleson County
According to labor force statistics for Burleson County, 73.1% of individuals (6,569) out of the total population between 25 and 64 years of age (8,987) are in the labor force, with 4.7% or 309 of them being unemployed. The group with the highest labor force participation rate are those with the educational attainment of bachelor's degree or higher, with 87.8% or 1,698 individuals in the labor force. Within the labor force, individuals with college / associate degree education have the highest percentage of unemployment, with 8.6% or 182 of them being unemployed.
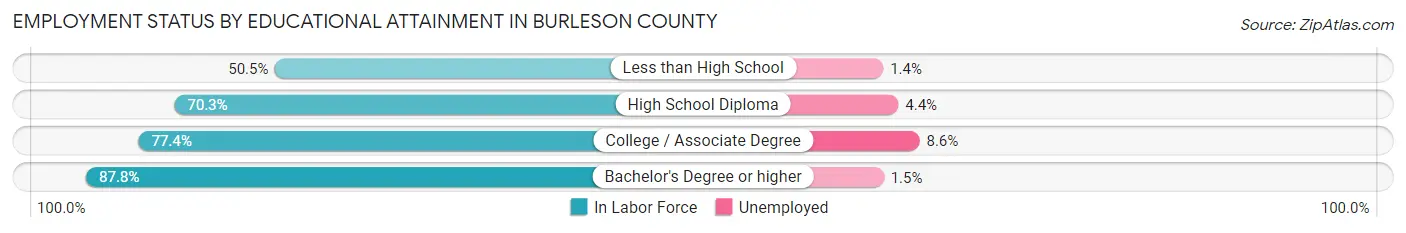
| Educational Attainment | In Labor Force | Unemployed |
| Less than High School | 720 (50.5%) | 20 (1.4%) |
| High School Diploma | 2,034 (70.3%) | 127 (4.4%) |
| College / Associate Degree | 2,116 (77.4%) | 235 (8.6%) |
| Bachelor's Degree or higher | 1,698 (87.8%) | 29 (1.5%) |
| Total | 6,569 (73.1%) | 422 (4.7%) |
Employment Occupations by Sex in Burleson County
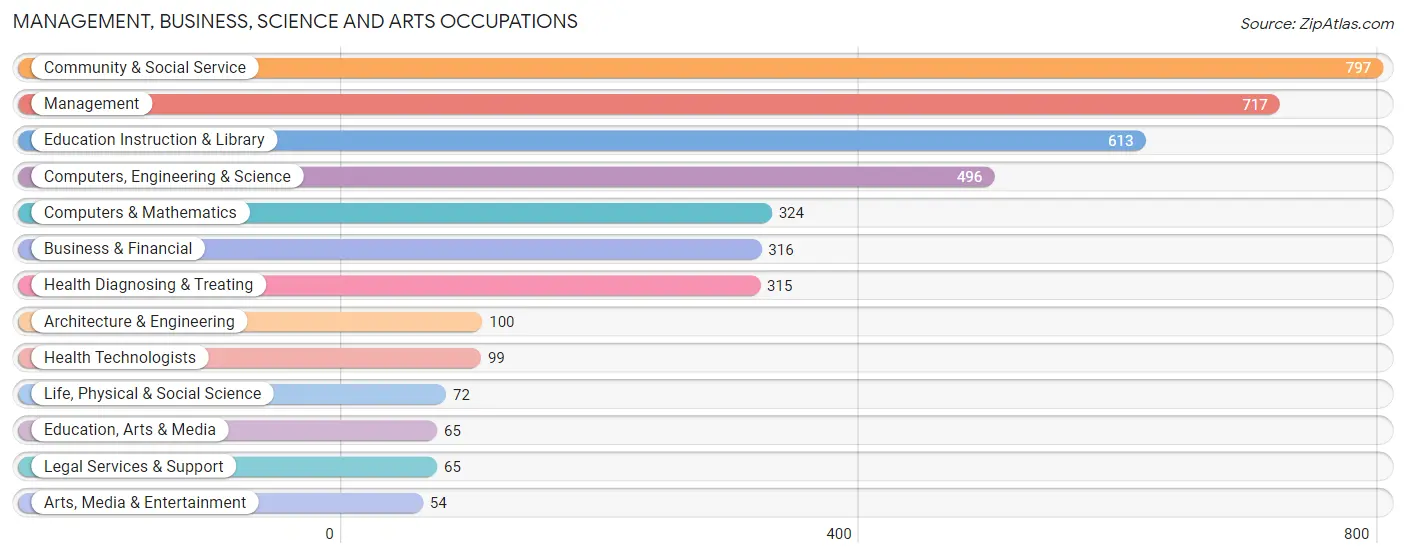
Management, Business, Science and Arts Occupations
The most common Management, Business, Science and Arts occupations in Burleson County are Community & Social Service (797 | 10.2%), Management (717 | 9.1%), Education Instruction & Library (613 | 7.8%), Computers, Engineering & Science (496 | 6.3%), and Computers & Mathematics (324 | 4.1%).
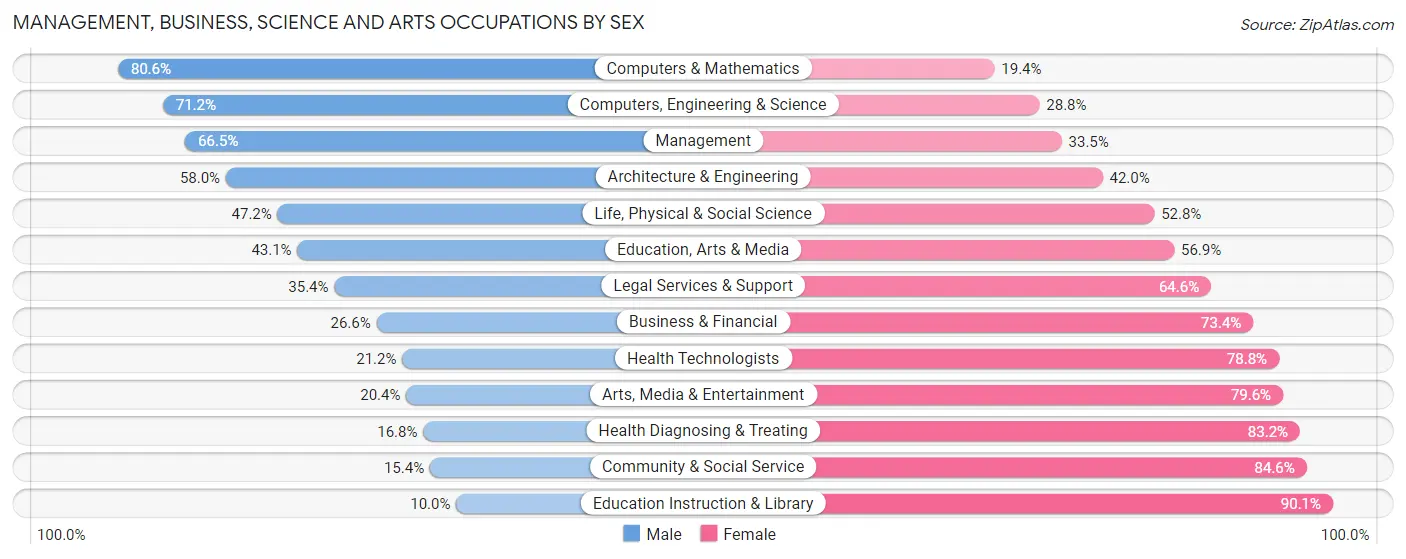
Management, Business, Science and Arts Occupations by Sex
Within the Management, Business, Science and Arts occupations in Burleson County, the most male-oriented occupations are Computers & Mathematics (80.6%), Computers, Engineering & Science (71.2%), and Management (66.5%), while the most female-oriented occupations are Education Instruction & Library (90.0%), Community & Social Service (84.6%), and Health Diagnosing & Treating (83.2%).
| Occupation | Male | Female |
| Management | 477 (66.5%) | 240 (33.5%) |
| Business & Financial | 84 (26.6%) | 232 (73.4%) |
| Computers, Engineering & Science | 353 (71.2%) | 143 (28.8%) |
| Computers & Mathematics | 261 (80.6%) | 63 (19.4%) |
| Architecture & Engineering | 58 (58.0%) | 42 (42.0%) |
| Life, Physical & Social Science | 34 (47.2%) | 38 (52.8%) |
| Community & Social Service | 123 (15.4%) | 674 (84.6%) |
| Education, Arts & Media | 28 (43.1%) | 37 (56.9%) |
| Legal Services & Support | 23 (35.4%) | 42 (64.6%) |
| Education Instruction & Library | 61 (10.0%) | 552 (90.0%) |
| Arts, Media & Entertainment | 11 (20.4%) | 43 (79.6%) |
| Health Diagnosing & Treating | 53 (16.8%) | 262 (83.2%) |
| Health Technologists | 21 (21.2%) | 78 (78.8%) |
| Total (Category) | 1,090 (41.3%) | 1,551 (58.7%) |
| Total (Overall) | 4,464 (56.9%) | 3,376 (43.1%) |
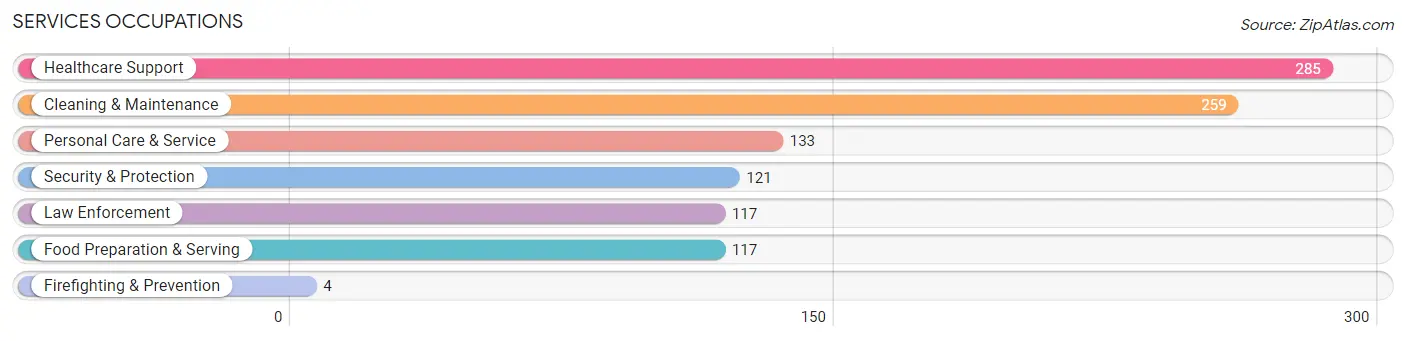
Services Occupations
The most common Services occupations in Burleson County are Healthcare Support (285 | 3.6%), Cleaning & Maintenance (259 | 3.3%), Personal Care & Service (133 | 1.7%), Security & Protection (121 | 1.5%), and Law Enforcement (117 | 1.5%).
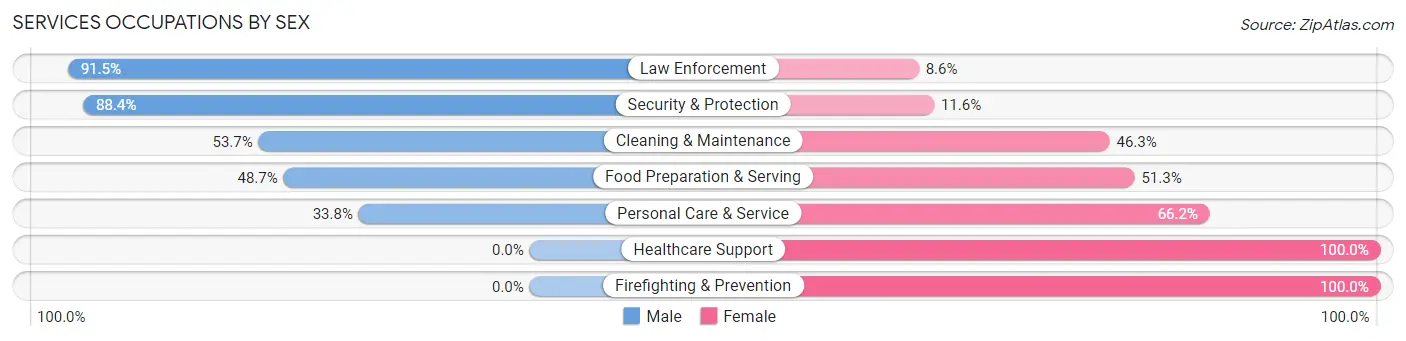
Services Occupations by Sex
Within the Services occupations in Burleson County, the most male-oriented occupations are Law Enforcement (91.4%), Security & Protection (88.4%), and Cleaning & Maintenance (53.7%), while the most female-oriented occupations are Healthcare Support (100.0%), Firefighting & Prevention (100.0%), and Personal Care & Service (66.2%).
| Occupation | Male | Female |
| Healthcare Support | 0 (0.0%) | 285 (100.0%) |
| Security & Protection | 107 (88.4%) | 14 (11.6%) |
| Firefighting & Prevention | 0 (0.0%) | 4 (100.0%) |
| Law Enforcement | 107 (91.4%) | 10 (8.6%) |
| Food Preparation & Serving | 57 (48.7%) | 60 (51.3%) |
| Cleaning & Maintenance | 139 (53.7%) | 120 (46.3%) |
| Personal Care & Service | 45 (33.8%) | 88 (66.2%) |
| Total (Category) | 348 (38.0%) | 567 (62.0%) |
| Total (Overall) | 4,464 (56.9%) | 3,376 (43.1%) |
Sales and Office Occupations
The most common Sales and Office occupations in Burleson County are Office & Administration (986 | 12.6%), and Sales & Related (576 | 7.3%).
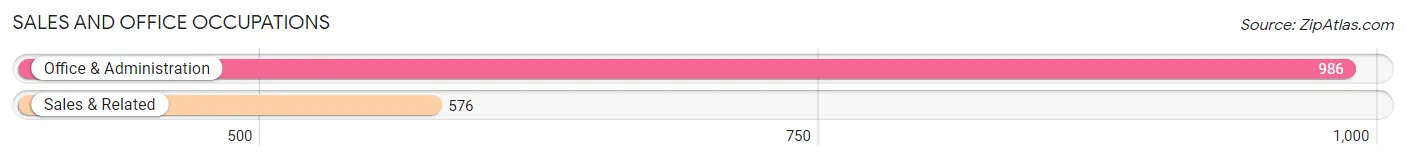
Sales and Office Occupations by Sex
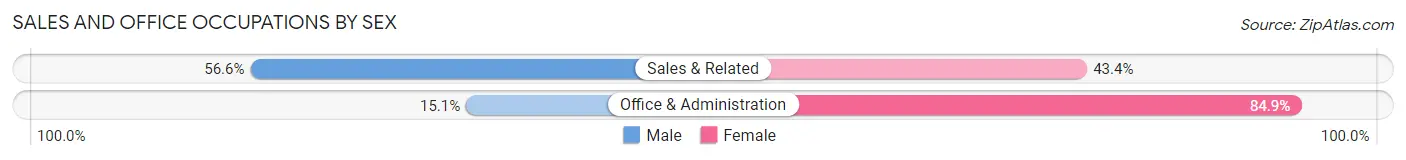
| Occupation | Male | Female |
| Sales & Related | 326 (56.6%) | 250 (43.4%) |
| Office & Administration | 149 (15.1%) | 837 (84.9%) |
| Total (Category) | 475 (30.4%) | 1,087 (69.6%) |
| Total (Overall) | 4,464 (56.9%) | 3,376 (43.1%) |
Natural Resources, Construction and Maintenance Occupations
The most common Natural Resources, Construction and Maintenance occupations in Burleson County are Construction & Extraction (1,010 | 12.9%), Installation, Maintenance & Repair (342 | 4.4%), and Farming, Fishing & Forestry (130 | 1.7%).
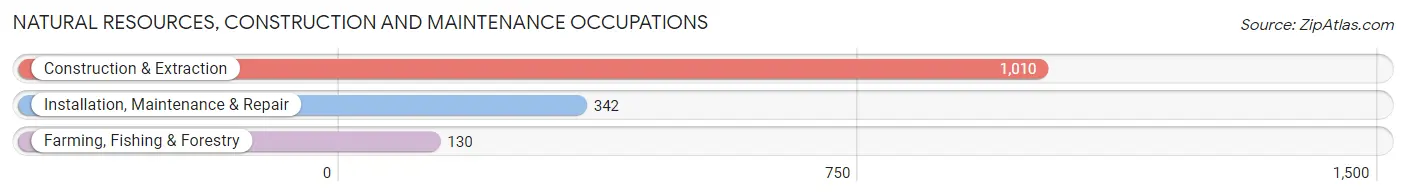
Natural Resources, Construction and Maintenance Occupations by Sex
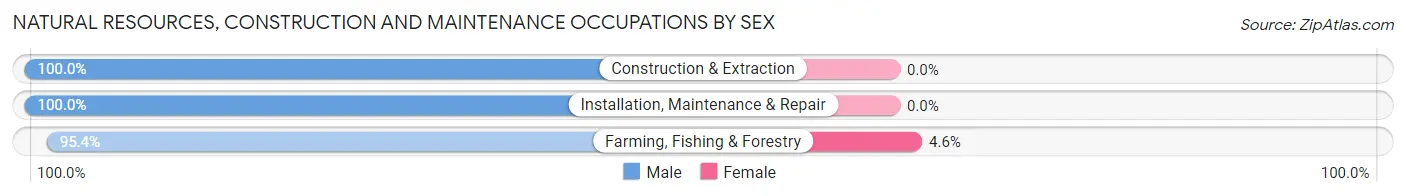
| Occupation | Male | Female |
| Farming, Fishing & Forestry | 124 (95.4%) | 6 (4.6%) |
| Construction & Extraction | 1,010 (100.0%) | 0 (0.0%) |
| Installation, Maintenance & Repair | 342 (100.0%) | 0 (0.0%) |
| Total (Category) | 1,476 (99.6%) | 6 (0.4%) |
| Total (Overall) | 4,464 (56.9%) | 3,376 (43.1%) |
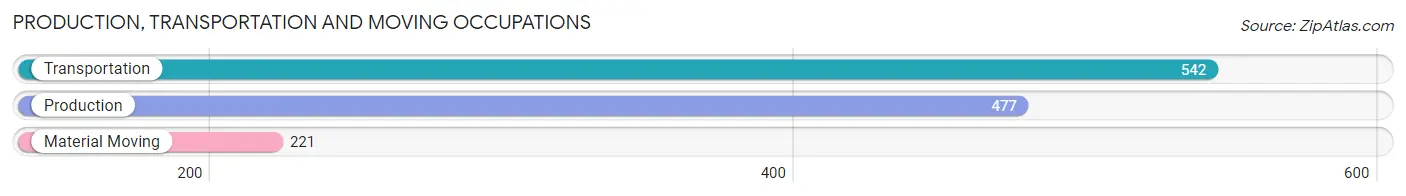
Production, Transportation and Moving Occupations
The most common Production, Transportation and Moving occupations in Burleson County are Transportation (542 | 6.9%), Production (477 | 6.1%), and Material Moving (221 | 2.8%).
Production, Transportation and Moving Occupations by Sex
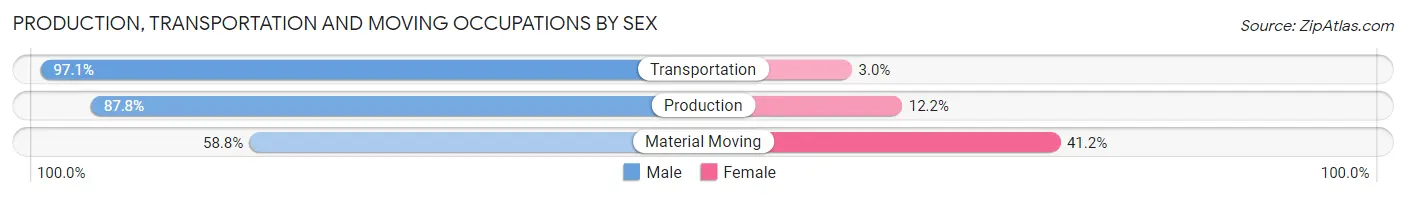
| Occupation | Male | Female |
| Production | 419 (87.8%) | 58 (12.2%) |
| Transportation | 526 (97.1%) | 16 (2.9%) |
| Material Moving | 130 (58.8%) | 91 (41.2%) |
| Total (Category) | 1,075 (86.7%) | 165 (13.3%) |
| Total (Overall) | 4,464 (56.9%) | 3,376 (43.1%) |
Employment Industries by Sex in Burleson County
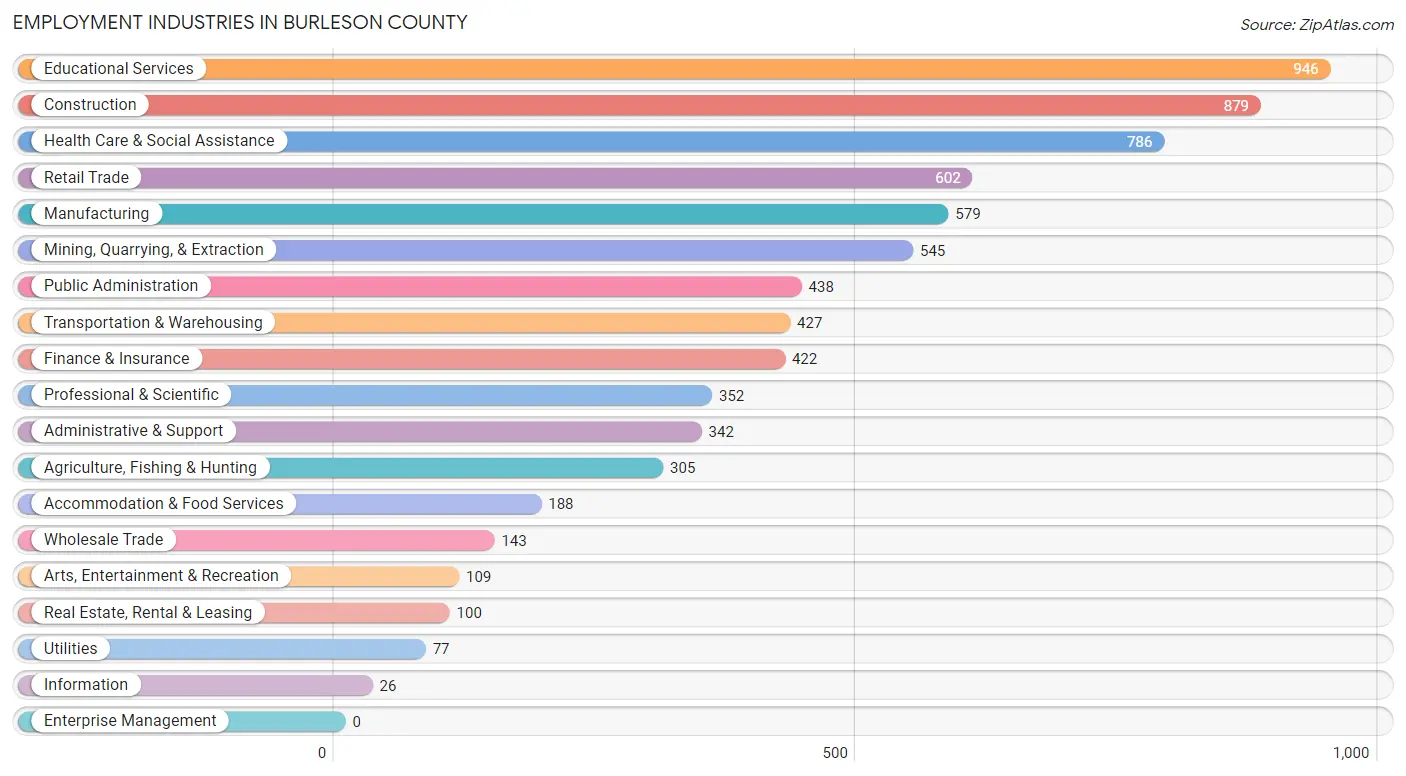
Employment Industries in Burleson County
The major employment industries in Burleson County include Educational Services (946 | 12.1%), Construction (879 | 11.2%), Health Care & Social Assistance (786 | 10.0%), Retail Trade (602 | 7.7%), and Manufacturing (579 | 7.4%).
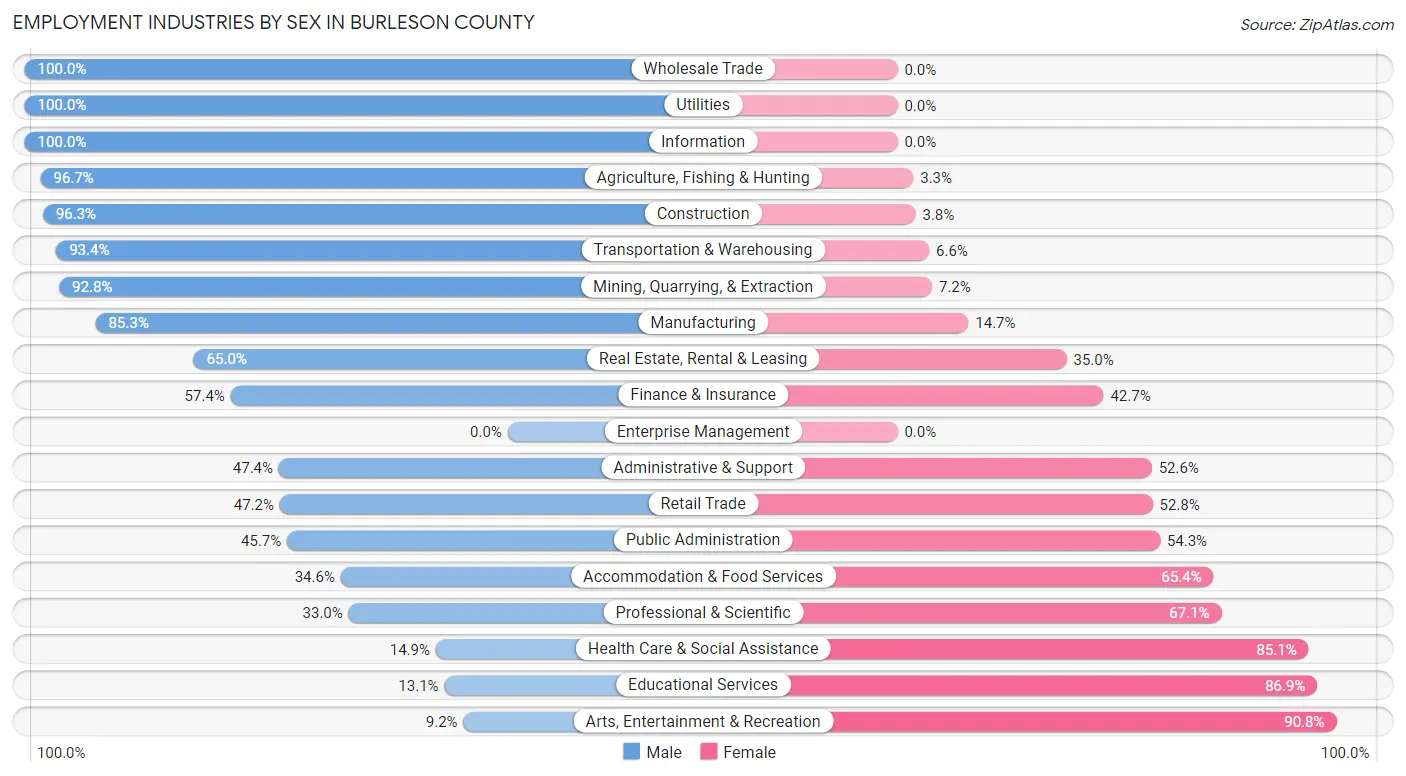
Employment Industries by Sex in Burleson County
The Burleson County industries that see more men than women are Wholesale Trade (100.0%), Utilities (100.0%), and Information (100.0%), whereas the industries that tend to have a higher number of women are Arts, Entertainment & Recreation (90.8%), Educational Services (86.9%), and Health Care & Social Assistance (85.1%).
| Industry | Male | Female |
| Agriculture, Fishing & Hunting | 295 (96.7%) | 10 (3.3%) |
| Mining, Quarrying, & Extraction | 506 (92.8%) | 39 (7.2%) |
| Construction | 846 (96.3%) | 33 (3.7%) |
| Manufacturing | 494 (85.3%) | 85 (14.7%) |
| Wholesale Trade | 143 (100.0%) | 0 (0.0%) |
| Retail Trade | 284 (47.2%) | 318 (52.8%) |
| Transportation & Warehousing | 399 (93.4%) | 28 (6.6%) |
| Utilities | 77 (100.0%) | 0 (0.0%) |
| Information | 26 (100.0%) | 0 (0.0%) |
| Finance & Insurance | 242 (57.4%) | 180 (42.6%) |
| Real Estate, Rental & Leasing | 65 (65.0%) | 35 (35.0%) |
| Professional & Scientific | 116 (33.0%) | 236 (67.0%) |
| Enterprise Management | 0 (0.0%) | 0 (0.0%) |
| Administrative & Support | 162 (47.4%) | 180 (52.6%) |
| Educational Services | 124 (13.1%) | 822 (86.9%) |
| Health Care & Social Assistance | 117 (14.9%) | 669 (85.1%) |
| Arts, Entertainment & Recreation | 10 (9.2%) | 99 (90.8%) |
| Accommodation & Food Services | 65 (34.6%) | 123 (65.4%) |
| Public Administration | 200 (45.7%) | 238 (54.3%) |
| Total | 4,464 (56.9%) | 3,376 (43.1%) |
Education in Burleson County
School Enrollment in Burleson County
The most common levels of schooling among the 3,717 students in Burleson County are middle school (1,082 | 29.1%), high school (865 | 23.3%), and elementary school (747 | 20.1%).
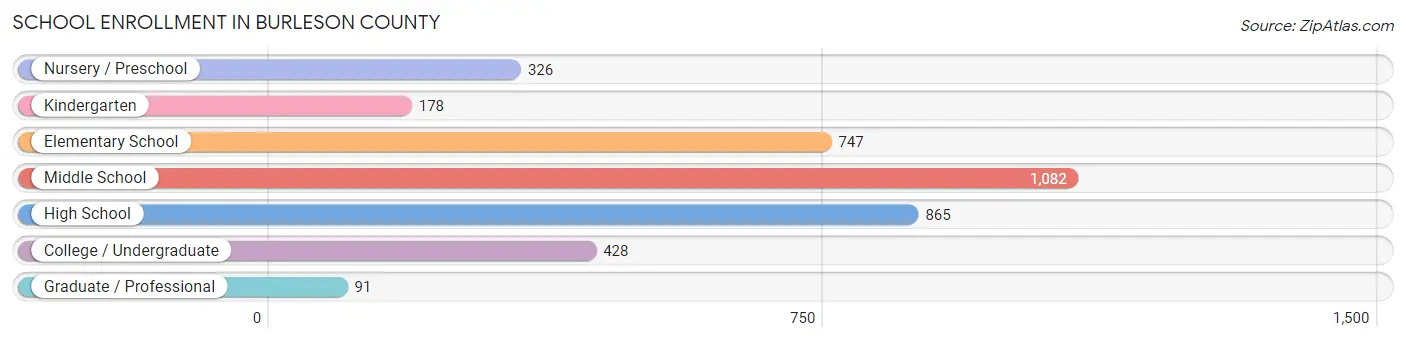
| School Level | # Students | % Students |
| Nursery / Preschool | 326 | 8.8% |
| Kindergarten | 178 | 4.8% |
| Elementary School | 747 | 20.1% |
| Middle School | 1,082 | 29.1% |
| High School | 865 | 23.3% |
| College / Undergraduate | 428 | 11.5% |
| Graduate / Professional | 91 | 2.5% |
| Total | 3,717 | 100.0% |
School Enrollment by Age by Funding Source in Burleson County
Out of a total of 3,717 students who are enrolled in schools in Burleson County, 271 (7.3%) attend a private institution, while the remaining 3,446 (92.7%) are enrolled in public schools. The age group of 35 years and over has the highest likelihood of being enrolled in private schools, with 41 (35.3% in the age bracket) enrolled. Conversely, the age group of 20 to 24 year olds has the lowest likelihood of being enrolled in a private school, with 201 (100.0% in the age bracket) attending a public institution.
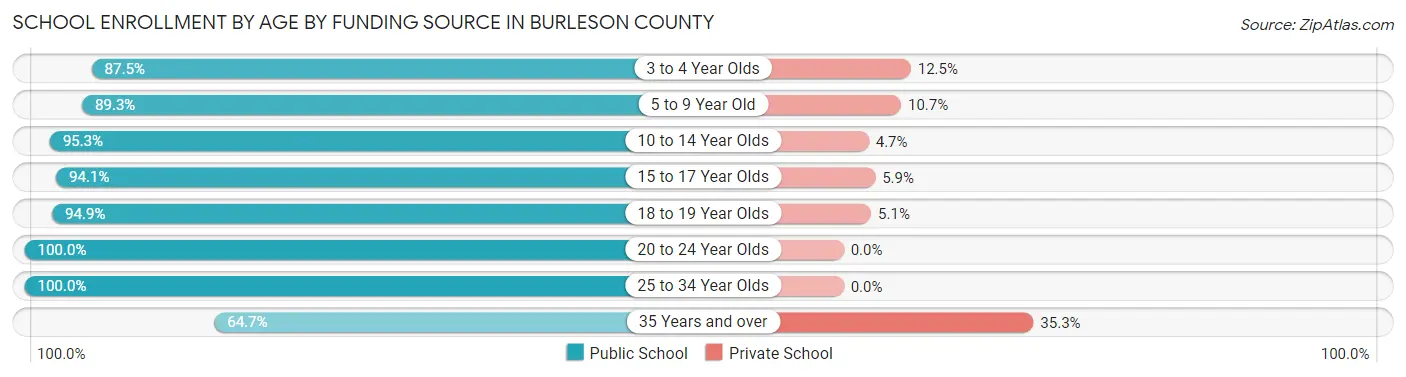
| Age Bracket | Public School | Private School |
| 3 to 4 Year Olds | 196 (87.5%) | 28 (12.5%) |
| 5 to 9 Year Old | 752 (89.3%) | 90 (10.7%) |
| 10 to 14 Year Olds | 1,325 (95.3%) | 65 (4.7%) |
| 15 to 17 Year Olds | 609 (94.1%) | 38 (5.9%) |
| 18 to 19 Year Olds | 204 (94.9%) | 11 (5.1%) |
| 20 to 24 Year Olds | 201 (100.0%) | 0 (0.0%) |
| 25 to 34 Year Olds | 82 (100.0%) | 0 (0.0%) |
| 35 Years and over | 75 (64.7%) | 41 (35.3%) |
| Total | 3,446 (92.7%) | 271 (7.3%) |
Educational Attainment by Field of Study in Burleson County
Business (617 | 20.4%), education (535 | 17.6%), bio, nature & agricultural (398 | 13.1%), arts & humanities (246 | 8.1%), and liberal arts & history (221 | 7.3%) are the most common fields of study among 3,031 individuals in Burleson County who have obtained a bachelor's degree or higher.
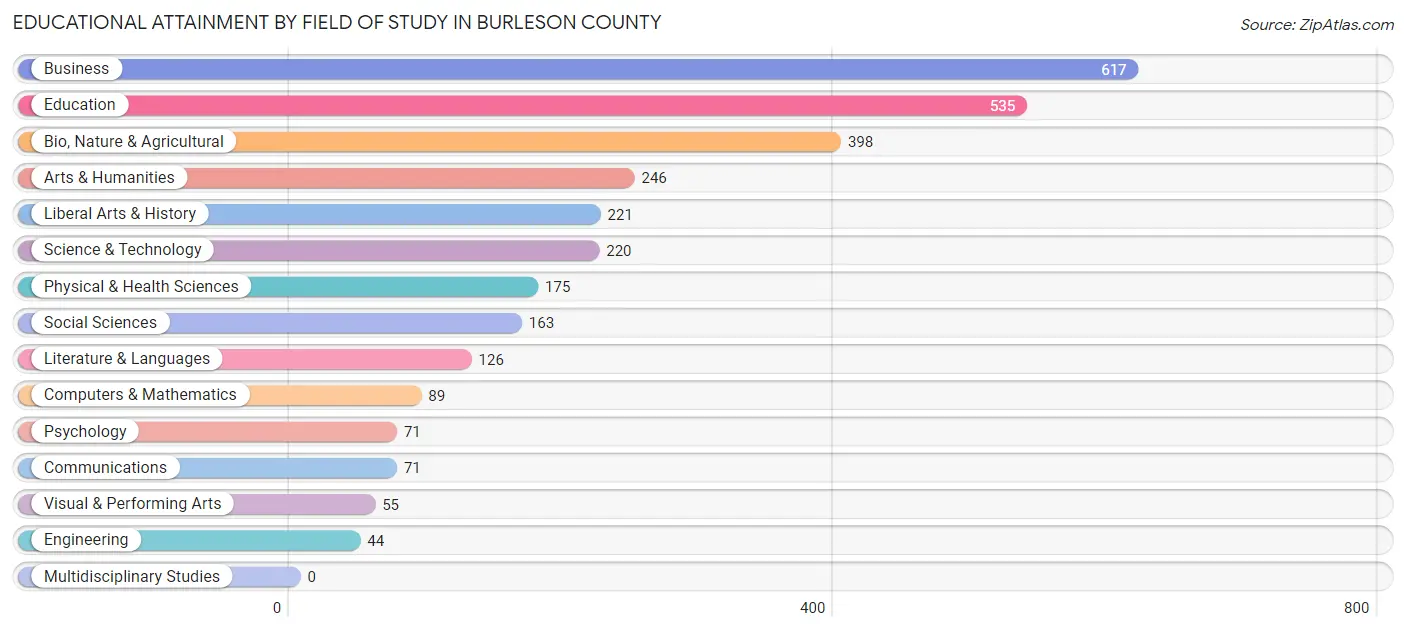
| Field of Study | # Graduates | % Graduates |
| Computers & Mathematics | 89 | 2.9% |
| Bio, Nature & Agricultural | 398 | 13.1% |
| Physical & Health Sciences | 175 | 5.8% |
| Psychology | 71 | 2.3% |
| Social Sciences | 163 | 5.4% |
| Engineering | 44 | 1.5% |
| Multidisciplinary Studies | 0 | 0.0% |
| Science & Technology | 220 | 7.3% |
| Business | 617 | 20.4% |
| Education | 535 | 17.6% |
| Literature & Languages | 126 | 4.2% |
| Liberal Arts & History | 221 | 7.3% |
| Visual & Performing Arts | 55 | 1.8% |
| Communications | 71 | 2.3% |
| Arts & Humanities | 246 | 8.1% |
| Total | 3,031 | 100.0% |
Transportation & Commute in Burleson County
Vehicle Availability by Sex in Burleson County
The most prevalent vehicle ownership categories in Burleson County are males with 2 vehicles (1,515, accounting for 36.2%) and females with 2 vehicles (1,486, making up 45.9%).
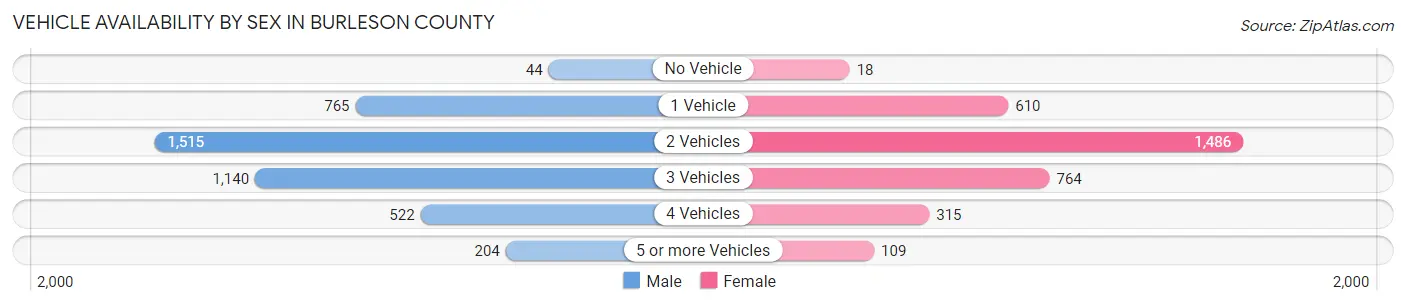
| Vehicles Available | Male | Female |
| No Vehicle | 44 (1.1%) | 18 (0.5%) |
| 1 Vehicle | 765 (18.3%) | 610 (18.5%) |
| 2 Vehicles | 1,515 (36.2%) | 1,486 (45.0%) |
| 3 Vehicles | 1,140 (27.2%) | 764 (23.1%) |
| 4 Vehicles | 522 (12.5%) | 315 (9.5%) |
| 5 or more Vehicles | 204 (4.9%) | 109 (3.3%) |
| Total | 4,190 (100.0%) | 3,302 (100.0%) |
Commute Time in Burleson County
The most frequently occuring commute durations in Burleson County are 30 to 34 minutes (1,231 commuters, 18.6%), 5 to 9 minutes (920 commuters, 13.9%), and 45 to 59 minutes (857 commuters, 13.0%).
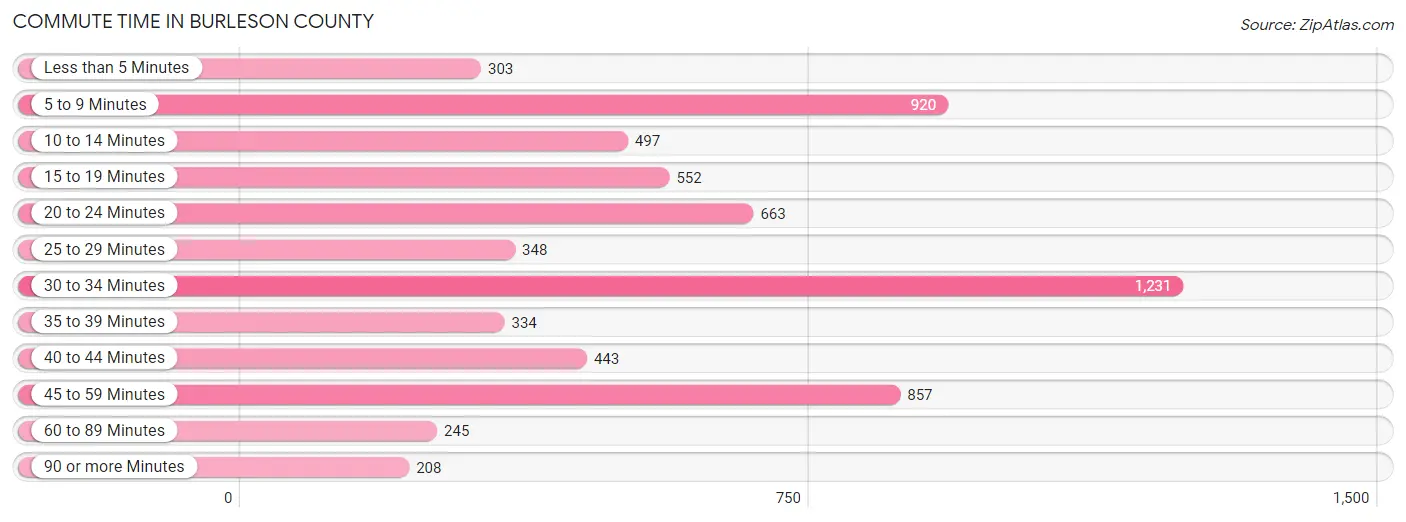
| Commute Time | # Commuters | % Commuters |
| Less than 5 Minutes | 303 | 4.6% |
| 5 to 9 Minutes | 920 | 13.9% |
| 10 to 14 Minutes | 497 | 7.5% |
| 15 to 19 Minutes | 552 | 8.4% |
| 20 to 24 Minutes | 663 | 10.0% |
| 25 to 29 Minutes | 348 | 5.3% |
| 30 to 34 Minutes | 1,231 | 18.6% |
| 35 to 39 Minutes | 334 | 5.1% |
| 40 to 44 Minutes | 443 | 6.7% |
| 45 to 59 Minutes | 857 | 13.0% |
| 60 to 89 Minutes | 245 | 3.7% |
| 90 or more Minutes | 208 | 3.2% |
Commute Time by Sex in Burleson County
The most common commute times in Burleson County are 30 to 34 minutes (851 commuters, 23.2%) for males and 45 to 59 minutes (487 commuters, 16.6%) for females.
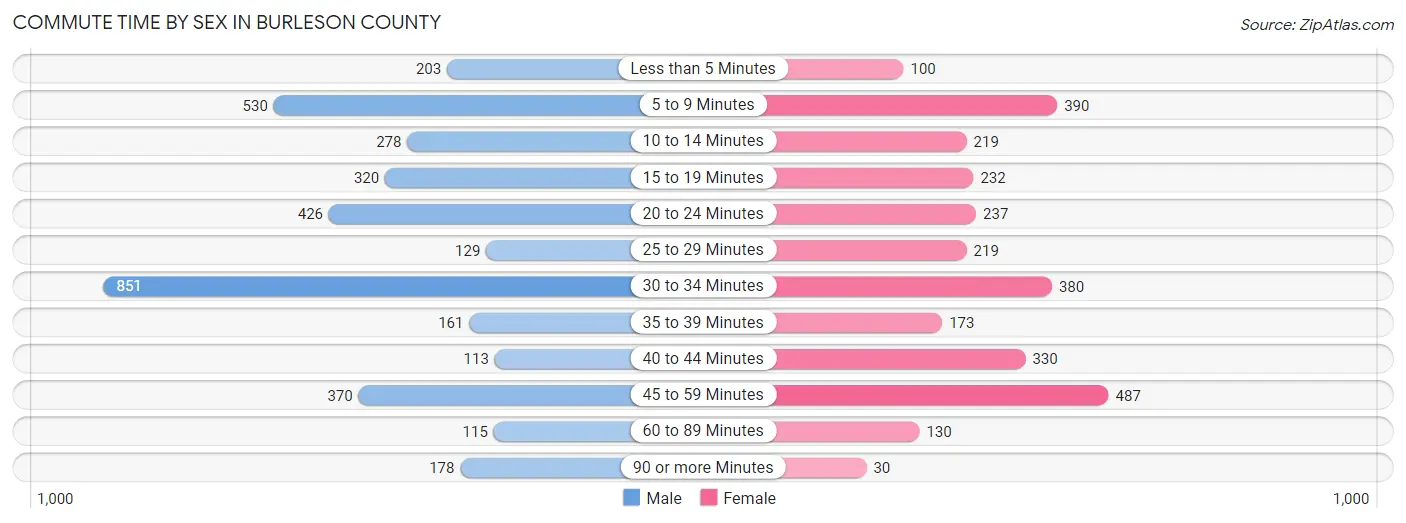
| Commute Time | Male | Female |
| Less than 5 Minutes | 203 (5.5%) | 100 (3.4%) |
| 5 to 9 Minutes | 530 (14.4%) | 390 (13.3%) |
| 10 to 14 Minutes | 278 (7.6%) | 219 (7.5%) |
| 15 to 19 Minutes | 320 (8.7%) | 232 (7.9%) |
| 20 to 24 Minutes | 426 (11.6%) | 237 (8.1%) |
| 25 to 29 Minutes | 129 (3.5%) | 219 (7.5%) |
| 30 to 34 Minutes | 851 (23.2%) | 380 (13.0%) |
| 35 to 39 Minutes | 161 (4.4%) | 173 (5.9%) |
| 40 to 44 Minutes | 113 (3.1%) | 330 (11.3%) |
| 45 to 59 Minutes | 370 (10.1%) | 487 (16.6%) |
| 60 to 89 Minutes | 115 (3.1%) | 130 (4.4%) |
| 90 or more Minutes | 178 (4.8%) | 30 (1.0%) |
Time of Departure to Work by Sex in Burleson County
The most frequent times of departure to work in Burleson County are 6:00 AM to 6:29 AM (828, 22.5%) for males and 7:00 AM to 7:29 AM (720, 24.6%) for females.
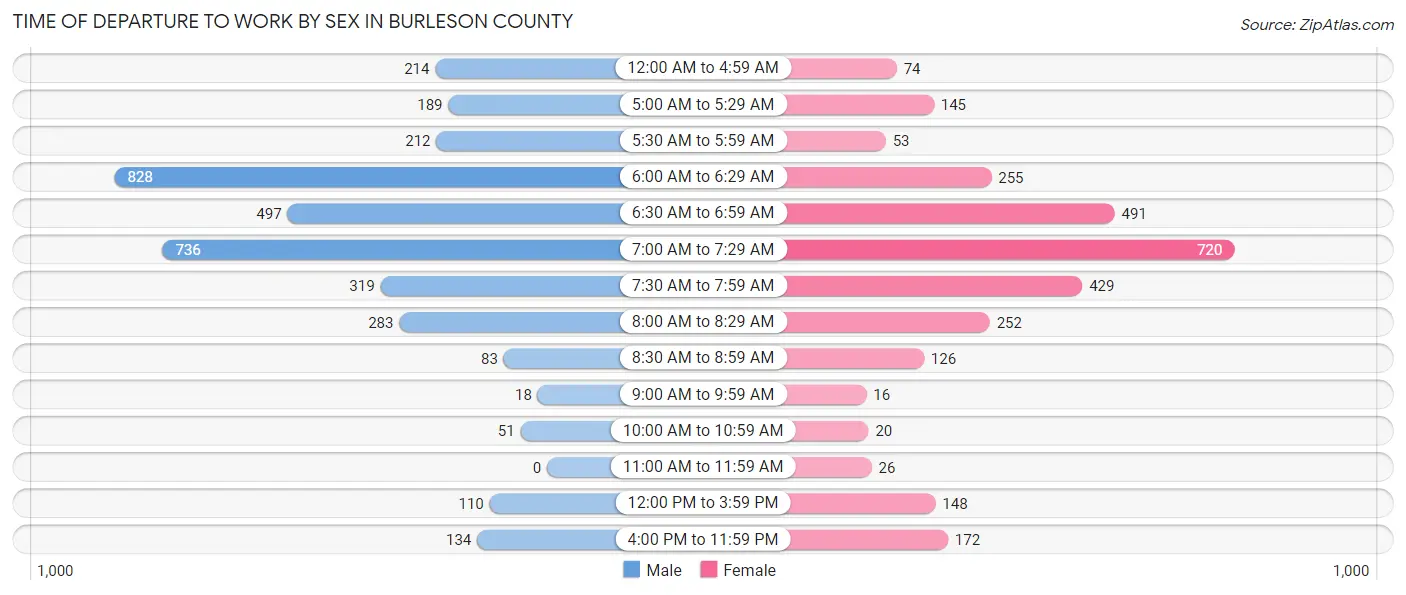
| Time of Departure | Male | Female |
| 12:00 AM to 4:59 AM | 214 (5.8%) | 74 (2.5%) |
| 5:00 AM to 5:29 AM | 189 (5.1%) | 145 (5.0%) |
| 5:30 AM to 5:59 AM | 212 (5.8%) | 53 (1.8%) |
| 6:00 AM to 6:29 AM | 828 (22.5%) | 255 (8.7%) |
| 6:30 AM to 6:59 AM | 497 (13.5%) | 491 (16.8%) |
| 7:00 AM to 7:29 AM | 736 (20.0%) | 720 (24.6%) |
| 7:30 AM to 7:59 AM | 319 (8.7%) | 429 (14.7%) |
| 8:00 AM to 8:29 AM | 283 (7.7%) | 252 (8.6%) |
| 8:30 AM to 8:59 AM | 83 (2.3%) | 126 (4.3%) |
| 9:00 AM to 9:59 AM | 18 (0.5%) | 16 (0.5%) |
| 10:00 AM to 10:59 AM | 51 (1.4%) | 20 (0.7%) |
| 11:00 AM to 11:59 AM | 0 (0.0%) | 26 (0.9%) |
| 12:00 PM to 3:59 PM | 110 (3.0%) | 148 (5.1%) |
| 4:00 PM to 11:59 PM | 134 (3.6%) | 172 (5.9%) |
| Total | 3,674 (100.0%) | 2,927 (100.0%) |
Housing Occupancy in Burleson County
Occupancy by Ownership in Burleson County
Of the total 7,586 dwellings in Burleson County, owner-occupied units account for 5,973 (78.7%), while renter-occupied units make up 1,613 (21.3%).
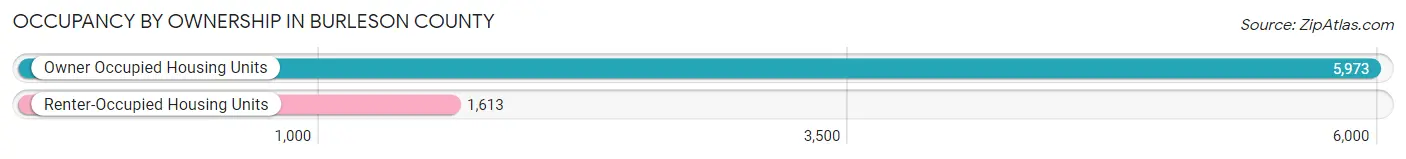
| Occupancy | # Housing Units | % Housing Units |
| Owner Occupied Housing Units | 5,973 | 78.7% |
| Renter-Occupied Housing Units | 1,613 | 21.3% |
| Total Occupied Housing Units | 7,586 | 100.0% |
Occupancy by Household Size in Burleson County
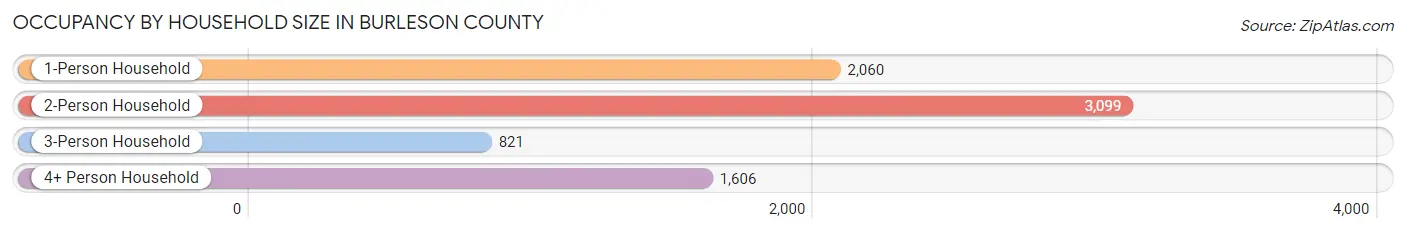
| Household Size | # Housing Units | % Housing Units |
| 1-Person Household | 2,060 | 27.2% |
| 2-Person Household | 3,099 | 40.8% |
| 3-Person Household | 821 | 10.8% |
| 4+ Person Household | 1,606 | 21.2% |
| Total Housing Units | 7,586 | 100.0% |
Occupancy by Ownership by Household Size in Burleson County
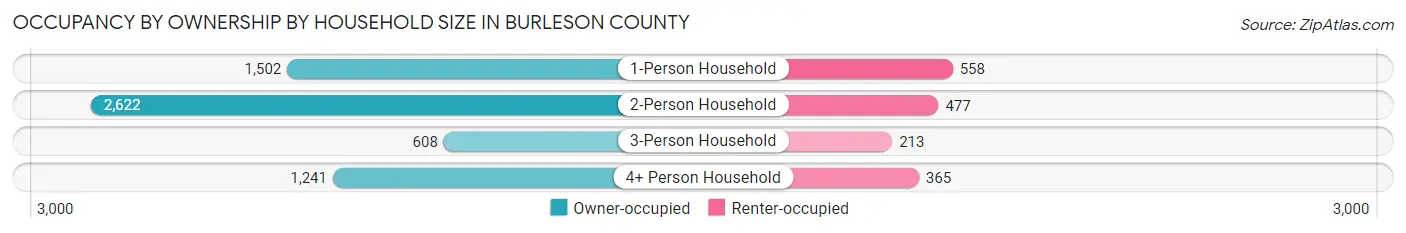
| Household Size | Owner-occupied | Renter-occupied |
| 1-Person Household | 1,502 (72.9%) | 558 (27.1%) |
| 2-Person Household | 2,622 (84.6%) | 477 (15.4%) |
| 3-Person Household | 608 (74.1%) | 213 (25.9%) |
| 4+ Person Household | 1,241 (77.3%) | 365 (22.7%) |
| Total Housing Units | 5,973 (78.7%) | 1,613 (21.3%) |
Occupancy by Educational Attainment in Burleson County
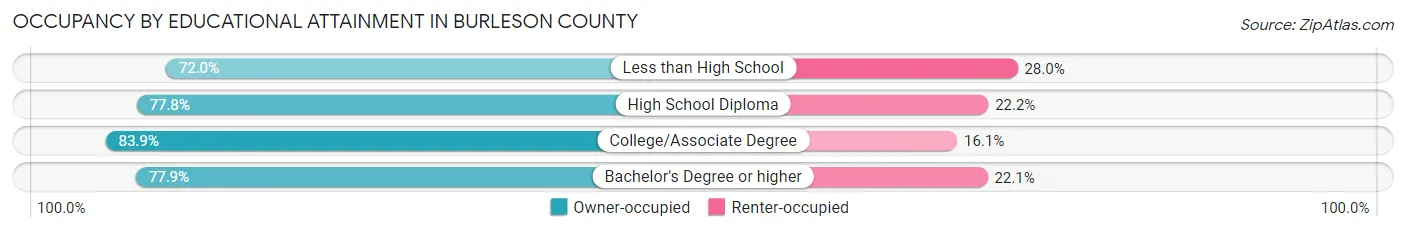
| Household Size | Owner-occupied | Renter-occupied |
| Less than High School | 673 (72.0%) | 262 (28.0%) |
| High School Diploma | 2,147 (77.8%) | 613 (22.2%) |
| College/Associate Degree | 1,688 (83.9%) | 323 (16.1%) |
| Bachelor's Degree or higher | 1,465 (77.9%) | 415 (22.1%) |
Occupancy by Age of Householder in Burleson County
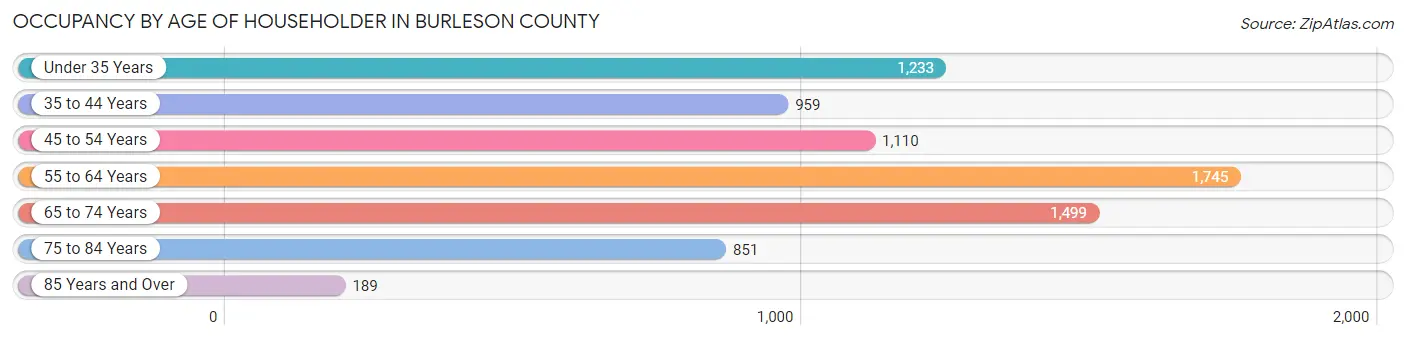
| Age Bracket | # Households | % Households |
| Under 35 Years | 1,233 | 16.3% |
| 35 to 44 Years | 959 | 12.6% |
| 45 to 54 Years | 1,110 | 14.6% |
| 55 to 64 Years | 1,745 | 23.0% |
| 65 to 74 Years | 1,499 | 19.8% |
| 75 to 84 Years | 851 | 11.2% |
| 85 Years and Over | 189 | 2.5% |
| Total | 7,586 | 100.0% |
Housing Finances in Burleson County
Median Income by Occupancy in Burleson County
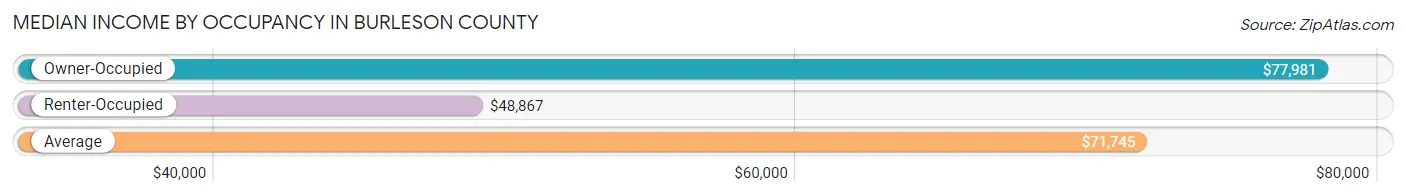
| Occupancy Type | # Households | Median Income |
| Owner-Occupied | 5,973 (78.7%) | $77,981 |
| Renter-Occupied | 1,613 (21.3%) | $48,867 |
| Average | 7,586 (100.0%) | $71,745 |
Occupancy by Householder Income Bracket in Burleson County
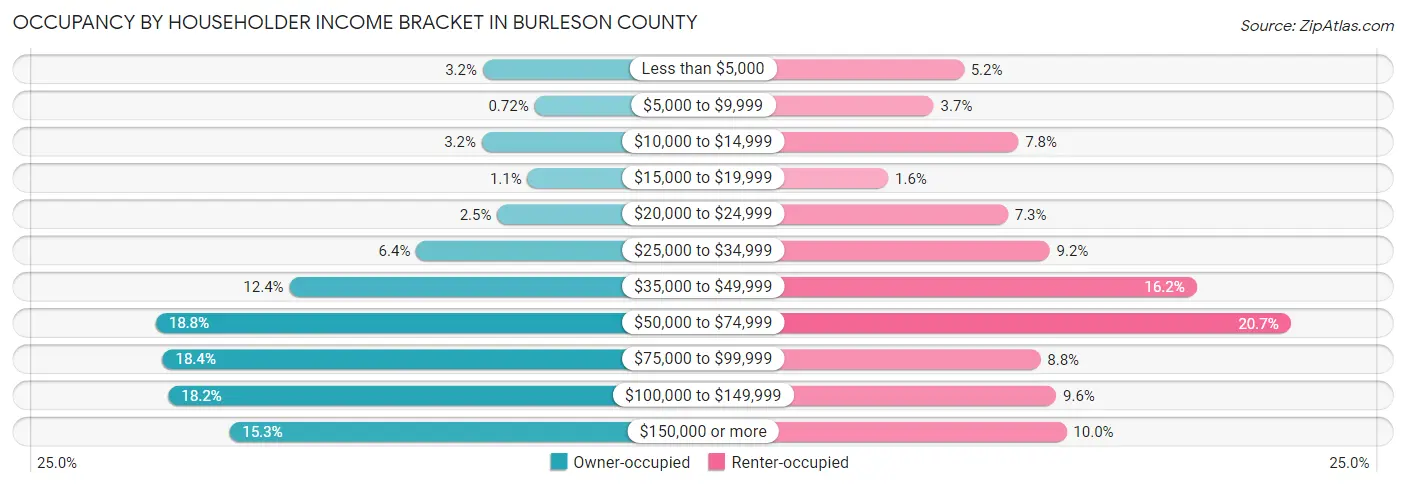
| Income Bracket | Owner-occupied | Renter-occupied |
| Less than $5,000 | 190 (3.2%) | 83 (5.1%) |
| $5,000 to $9,999 | 43 (0.7%) | 60 (3.7%) |
| $10,000 to $14,999 | 193 (3.2%) | 125 (7.7%) |
| $15,000 to $19,999 | 63 (1.1%) | 25 (1.5%) |
| $20,000 to $24,999 | 149 (2.5%) | 117 (7.2%) |
| $25,000 to $34,999 | 379 (6.4%) | 149 (9.2%) |
| $35,000 to $49,999 | 740 (12.4%) | 262 (16.2%) |
| $50,000 to $74,999 | 1,120 (18.8%) | 334 (20.7%) |
| $75,000 to $99,999 | 1,101 (18.4%) | 142 (8.8%) |
| $100,000 to $149,999 | 1,084 (18.1%) | 154 (9.6%) |
| $150,000 or more | 911 (15.2%) | 162 (10.0%) |
| Total | 5,973 (100.0%) | 1,613 (100.0%) |
Monthly Housing Cost Tiers in Burleson County
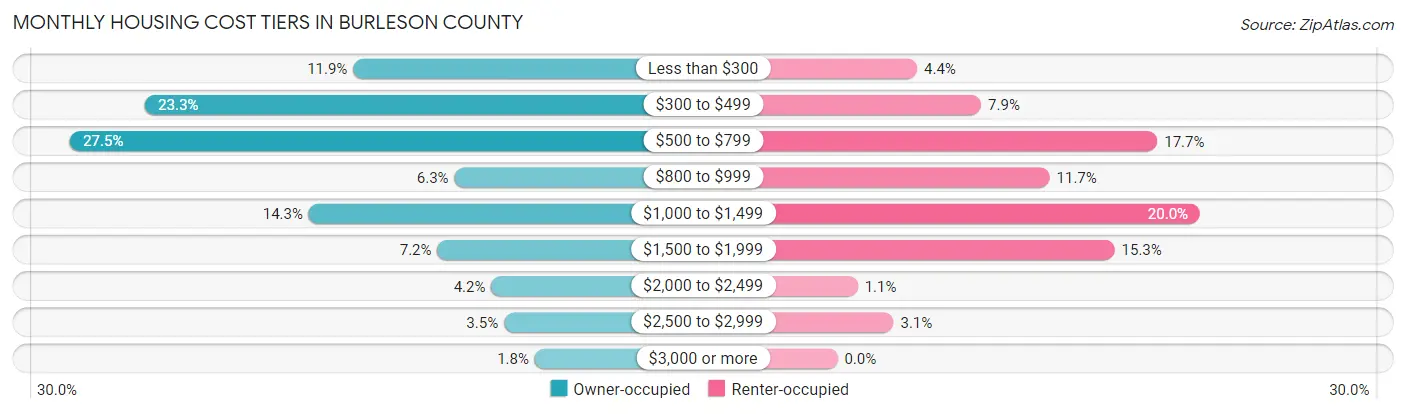
| Monthly Cost | Owner-occupied | Renter-occupied |
| Less than $300 | 708 (11.8%) | 71 (4.4%) |
| $300 to $499 | 1,394 (23.3%) | 128 (7.9%) |
| $500 to $799 | 1,642 (27.5%) | 285 (17.7%) |
| $800 to $999 | 374 (6.3%) | 189 (11.7%) |
| $1,000 to $1,499 | 854 (14.3%) | 323 (20.0%) |
| $1,500 to $1,999 | 430 (7.2%) | 247 (15.3%) |
| $2,000 to $2,499 | 252 (4.2%) | 18 (1.1%) |
| $2,500 to $2,999 | 210 (3.5%) | 50 (3.1%) |
| $3,000 or more | 109 (1.8%) | 0 (0.0%) |
| Total | 5,973 (100.0%) | 1,613 (100.0%) |
Physical Housing Characteristics in Burleson County
Housing Structures in Burleson County
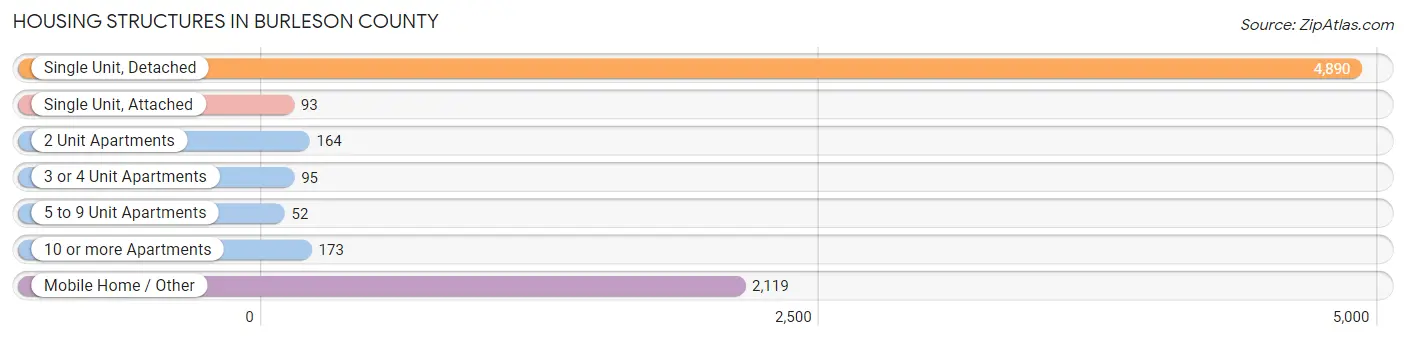
| Structure Type | # Housing Units | % Housing Units |
| Single Unit, Detached | 4,890 | 64.5% |
| Single Unit, Attached | 93 | 1.2% |
| 2 Unit Apartments | 164 | 2.2% |
| 3 or 4 Unit Apartments | 95 | 1.3% |
| 5 to 9 Unit Apartments | 52 | 0.7% |
| 10 or more Apartments | 173 | 2.3% |
| Mobile Home / Other | 2,119 | 27.9% |
| Total | 7,586 | 100.0% |
Housing Structures by Occupancy in Burleson County
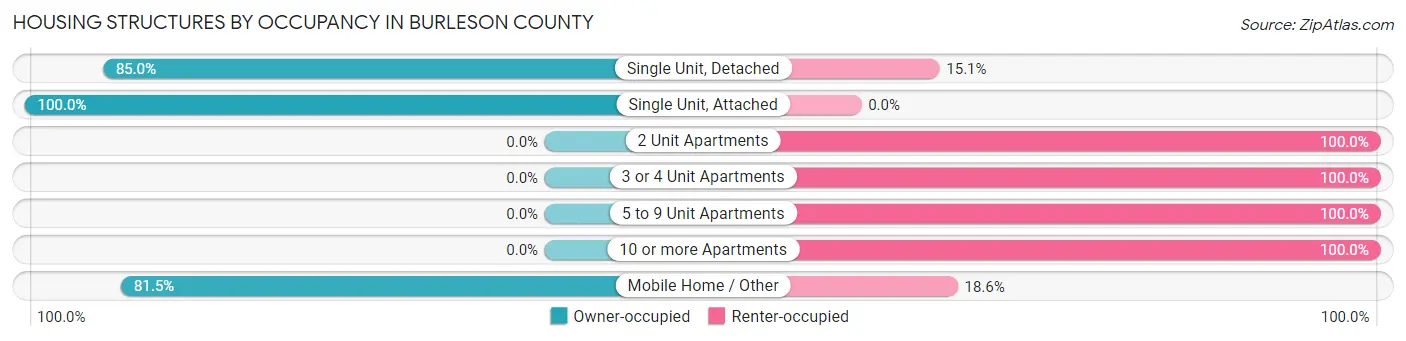
| Structure Type | Owner-occupied | Renter-occupied |
| Single Unit, Detached | 4,154 (85.0%) | 736 (15.0%) |
| Single Unit, Attached | 93 (100.0%) | 0 (0.0%) |
| 2 Unit Apartments | 0 (0.0%) | 164 (100.0%) |
| 3 or 4 Unit Apartments | 0 (0.0%) | 95 (100.0%) |
| 5 to 9 Unit Apartments | 0 (0.0%) | 52 (100.0%) |
| 10 or more Apartments | 0 (0.0%) | 173 (100.0%) |
| Mobile Home / Other | 1,726 (81.5%) | 393 (18.5%) |
| Total | 5,973 (78.7%) | 1,613 (21.3%) |
Housing Structures by Number of Rooms in Burleson County
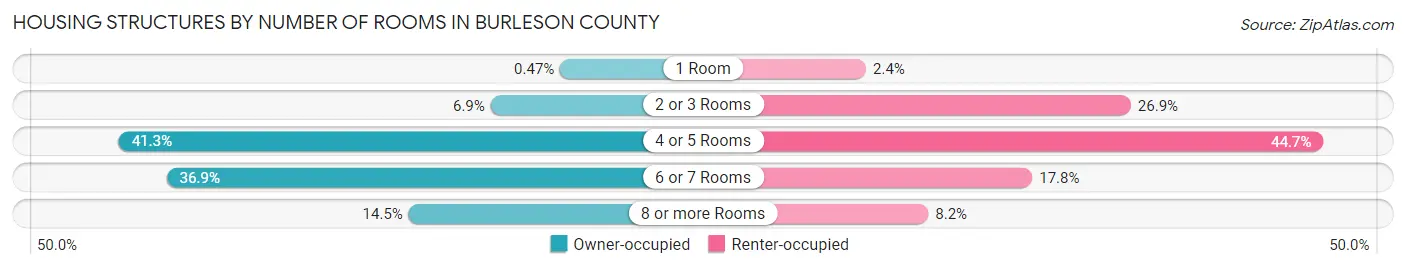
| Number of Rooms | Owner-occupied | Renter-occupied |
| 1 Room | 28 (0.5%) | 39 (2.4%) |
| 2 or 3 Rooms | 412 (6.9%) | 434 (26.9%) |
| 4 or 5 Rooms | 2,466 (41.3%) | 721 (44.7%) |
| 6 or 7 Rooms | 2,202 (36.9%) | 287 (17.8%) |
| 8 or more Rooms | 865 (14.5%) | 132 (8.2%) |
| Total | 5,973 (100.0%) | 1,613 (100.0%) |
Housing Structure by Heating Type in Burleson County
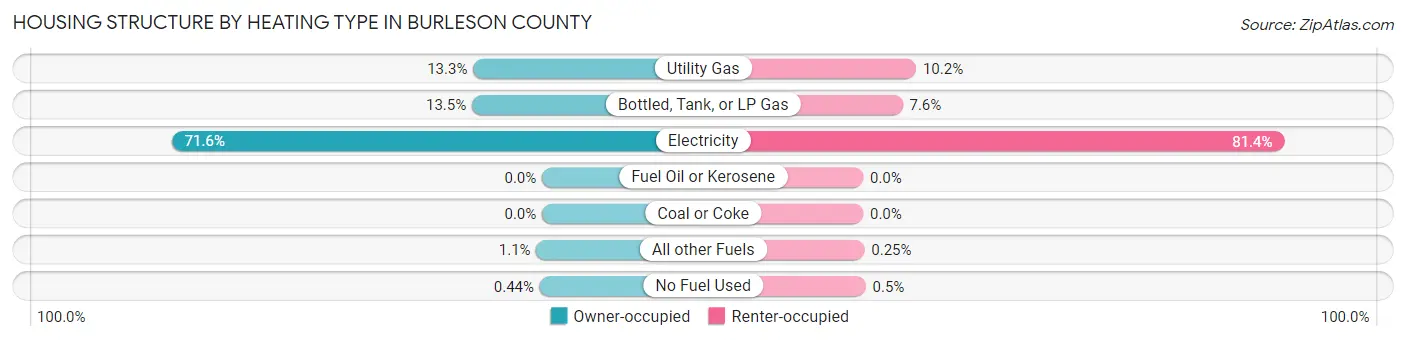
| Heating Type | Owner-occupied | Renter-occupied |
| Utility Gas | 795 (13.3%) | 165 (10.2%) |
| Bottled, Tank, or LP Gas | 809 (13.5%) | 123 (7.6%) |
| Electricity | 4,277 (71.6%) | 1,313 (81.4%) |
| Fuel Oil or Kerosene | 0 (0.0%) | 0 (0.0%) |
| Coal or Coke | 0 (0.0%) | 0 (0.0%) |
| All other Fuels | 66 (1.1%) | 4 (0.3%) |
| No Fuel Used | 26 (0.4%) | 8 (0.5%) |
| Total | 5,973 (100.0%) | 1,613 (100.0%) |
Household Vehicle Usage in Burleson County
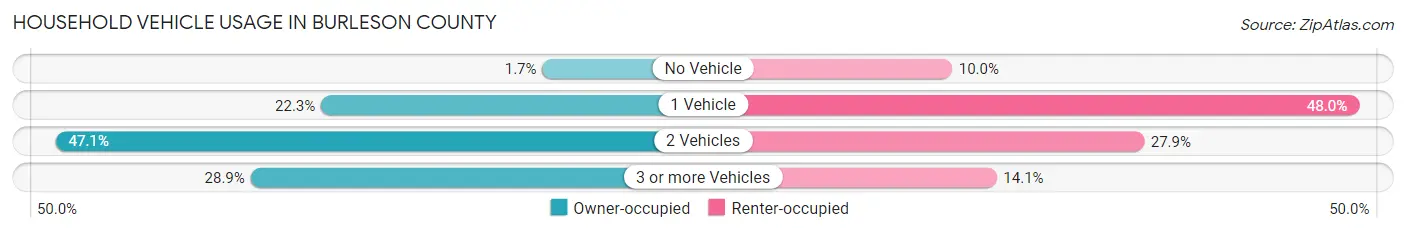
| Vehicles per Household | Owner-occupied | Renter-occupied |
| No Vehicle | 100 (1.7%) | 161 (10.0%) |
| 1 Vehicle | 1,333 (22.3%) | 774 (48.0%) |
| 2 Vehicles | 2,814 (47.1%) | 450 (27.9%) |
| 3 or more Vehicles | 1,726 (28.9%) | 228 (14.1%) |
| Total | 5,973 (100.0%) | 1,613 (100.0%) |
Real Estate & Mortgages in Burleson County
Real Estate and Mortgage Overview in Burleson County
| Characteristic | Without Mortgage | With Mortgage |
| Housing Units | 3,993 | 1,980 |
| Median Property Value | $134,100 | $191,600 |
| Median Household Income | $68,060 | $383 |
| Monthly Housing Costs | $483 | $96 |
| Real Estate Taxes | $1,485 | $4 |
Property Value by Mortgage Status in Burleson County
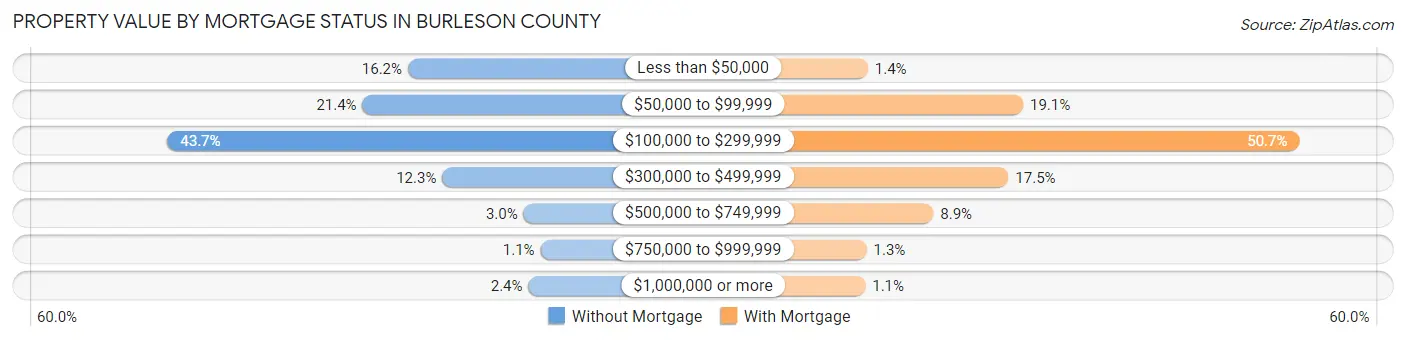
| Property Value | Without Mortgage | With Mortgage |
| Less than $50,000 | 647 (16.2%) | 28 (1.4%) |
| $50,000 to $99,999 | 854 (21.4%) | 379 (19.1%) |
| $100,000 to $299,999 | 1,744 (43.7%) | 1,004 (50.7%) |
| $300,000 to $499,999 | 490 (12.3%) | 346 (17.5%) |
| $500,000 to $749,999 | 119 (3.0%) | 176 (8.9%) |
| $750,000 to $999,999 | 42 (1.1%) | 25 (1.3%) |
| $1,000,000 or more | 97 (2.4%) | 22 (1.1%) |
| Total | 3,993 (100.0%) | 1,980 (100.0%) |
Household Income by Mortgage Status in Burleson County
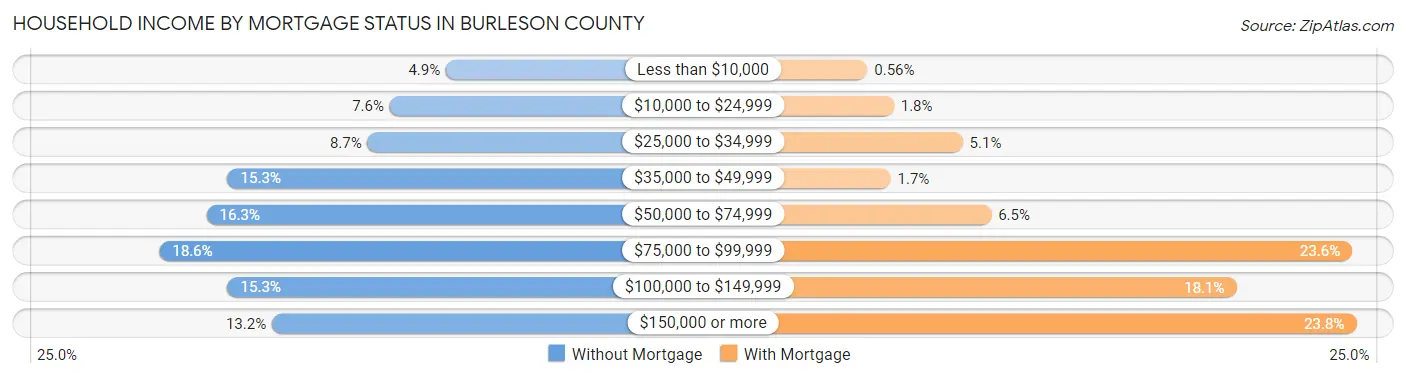
| Household Income | Without Mortgage | With Mortgage |
| Less than $10,000 | 197 (4.9%) | 11 (0.6%) |
| $10,000 to $24,999 | 304 (7.6%) | 36 (1.8%) |
| $25,000 to $34,999 | 346 (8.7%) | 101 (5.1%) |
| $35,000 to $49,999 | 612 (15.3%) | 33 (1.7%) |
| $50,000 to $74,999 | 652 (16.3%) | 128 (6.5%) |
| $75,000 to $99,999 | 742 (18.6%) | 468 (23.6%) |
| $100,000 to $149,999 | 612 (15.3%) | 359 (18.1%) |
| $150,000 or more | 528 (13.2%) | 472 (23.8%) |
| Total | 3,993 (100.0%) | 1,980 (100.0%) |
Property Value to Household Income Ratio in Burleson County
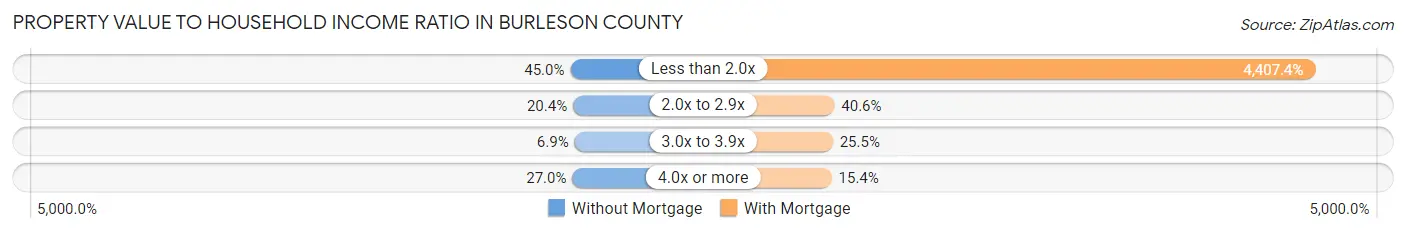
| Value-to-Income Ratio | Without Mortgage | With Mortgage |
| Less than 2.0x | 1,798 (45.0%) | 87,267 (4,407.4%) |
| 2.0x to 2.9x | 813 (20.4%) | 803 (40.6%) |
| 3.0x to 3.9x | 276 (6.9%) | 504 (25.5%) |
| 4.0x or more | 1,076 (27.0%) | 304 (15.3%) |
| Total | 3,993 (100.0%) | 1,980 (100.0%) |
Real Estate Taxes by Mortgage Status in Burleson County
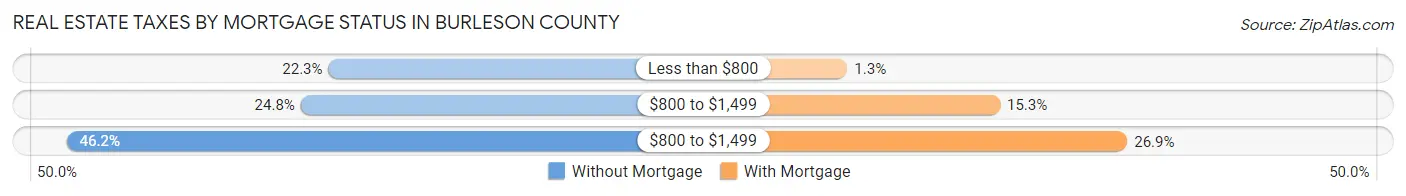
| Property Taxes | Without Mortgage | With Mortgage |
| Less than $800 | 889 (22.3%) | 26 (1.3%) |
| $800 to $1,499 | 990 (24.8%) | 302 (15.2%) |
| $800 to $1,499 | 1,843 (46.2%) | 532 (26.9%) |
| Total | 3,993 (100.0%) | 1,980 (100.0%) |
Health & Disability in Burleson County
Health Insurance Coverage by Age in Burleson County
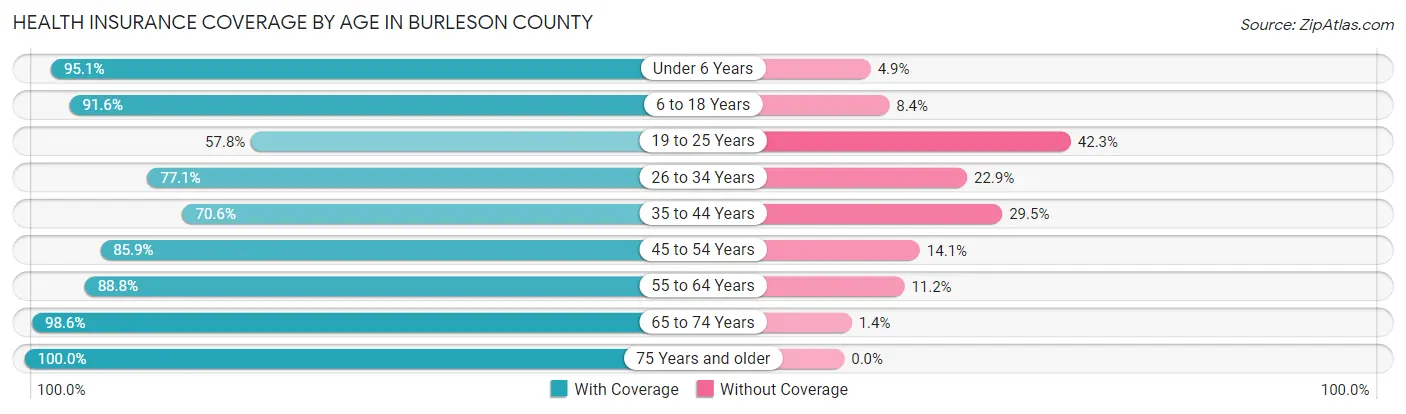
| Age Bracket | With Coverage | Without Coverage |
| Under 6 Years | 1,176 (95.1%) | 61 (4.9%) |
| 6 to 18 Years | 2,609 (91.6%) | 239 (8.4%) |
| 19 to 25 Years | 656 (57.8%) | 480 (42.2%) |
| 26 to 34 Years | 1,415 (77.1%) | 420 (22.9%) |
| 35 to 44 Years | 1,473 (70.6%) | 615 (29.4%) |
| 45 to 54 Years | 1,852 (85.9%) | 304 (14.1%) |
| 55 to 64 Years | 2,390 (88.8%) | 302 (11.2%) |
| 65 to 74 Years | 2,417 (98.6%) | 34 (1.4%) |
| 75 Years and older | 1,324 (100.0%) | 0 (0.0%) |
| Total | 15,312 (86.2%) | 2,455 (13.8%) |
Health Insurance Coverage by Citizenship Status in Burleson County
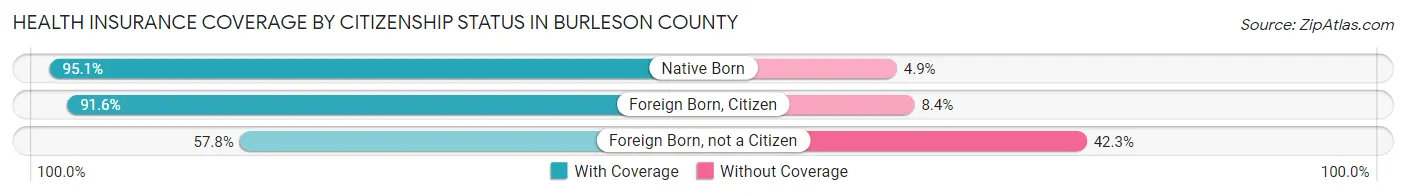
| Citizenship Status | With Coverage | Without Coverage |
| Native Born | 1,176 (95.1%) | 61 (4.9%) |
| Foreign Born, Citizen | 2,609 (91.6%) | 239 (8.4%) |
| Foreign Born, not a Citizen | 656 (57.8%) | 480 (42.2%) |
Health Insurance Coverage by Household Income in Burleson County
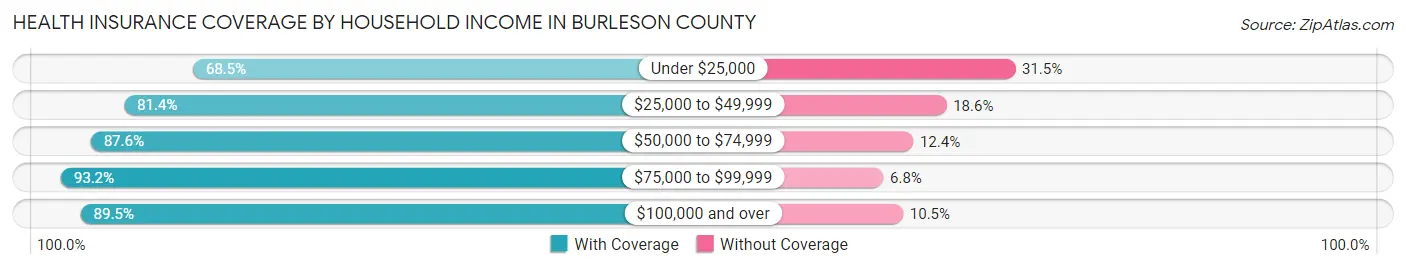
| Household Income | With Coverage | Without Coverage |
| Under $25,000 | 1,273 (68.5%) | 586 (31.5%) |
| $25,000 to $49,999 | 2,315 (81.4%) | 530 (18.6%) |
| $50,000 to $74,999 | 2,472 (87.6%) | 350 (12.4%) |
| $75,000 to $99,999 | 2,797 (93.2%) | 204 (6.8%) |
| $100,000 and over | 6,455 (89.5%) | 757 (10.5%) |
Public vs Private Health Insurance Coverage by Age in Burleson County
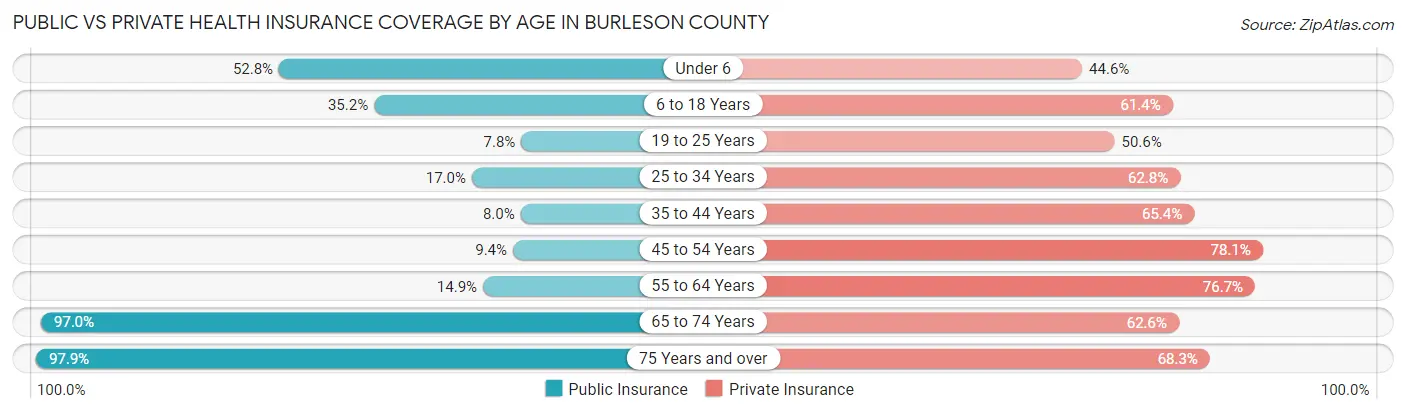
| Age Bracket | Public Insurance | Private Insurance |
| Under 6 | 653 (52.8%) | 552 (44.6%) |
| 6 to 18 Years | 1,001 (35.1%) | 1,748 (61.4%) |
| 19 to 25 Years | 89 (7.8%) | 575 (50.6%) |
| 25 to 34 Years | 312 (17.0%) | 1,152 (62.8%) |
| 35 to 44 Years | 166 (8.0%) | 1,365 (65.4%) |
| 45 to 54 Years | 202 (9.4%) | 1,684 (78.1%) |
| 55 to 64 Years | 402 (14.9%) | 2,064 (76.7%) |
| 65 to 74 Years | 2,377 (97.0%) | 1,533 (62.5%) |
| 75 Years and over | 1,296 (97.9%) | 904 (68.3%) |
| Total | 6,498 (36.6%) | 11,577 (65.2%) |
Disability Status by Sex by Age in Burleson County
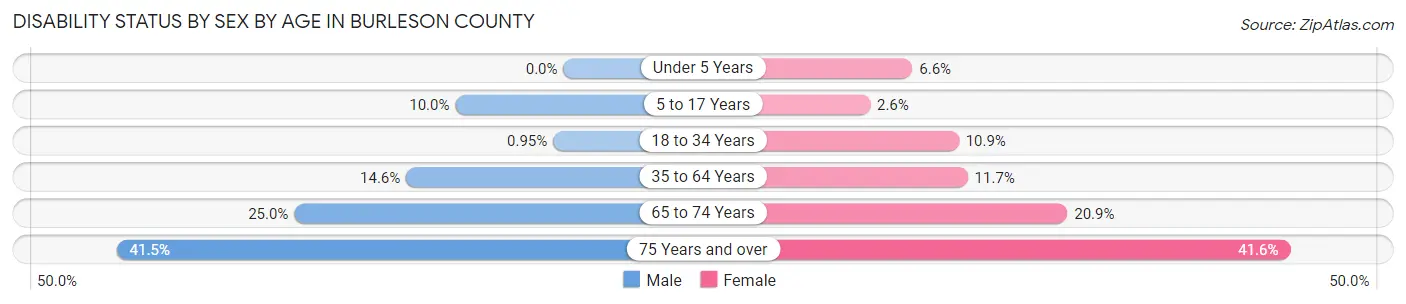
| Age Bracket | Male | Female |
| Under 5 Years | 0 (0.0%) | 40 (6.6%) |
| 5 to 17 Years | 144 (10.0%) | 39 (2.6%) |
| 18 to 34 Years | 15 (0.9%) | 168 (10.8%) |
| 35 to 64 Years | 500 (14.6%) | 410 (11.7%) |
| 65 to 74 Years | 296 (25.0%) | 265 (20.9%) |
| 75 Years and over | 262 (41.5%) | 288 (41.6%) |
Disability Class by Sex by Age in Burleson County
Disability Class: Hearing Difficulty
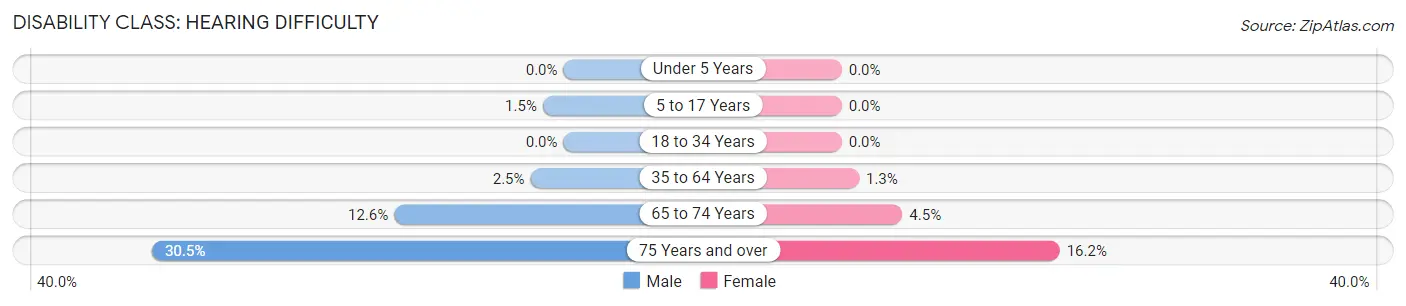
| Age Bracket | Male | Female |
| Under 5 Years | 0 (0.0%) | 0 (0.0%) |
| 5 to 17 Years | 22 (1.5%) | 0 (0.0%) |
| 18 to 34 Years | 0 (0.0%) | 0 (0.0%) |
| 35 to 64 Years | 84 (2.5%) | 45 (1.3%) |
| 65 to 74 Years | 149 (12.6%) | 57 (4.5%) |
| 75 Years and over | 193 (30.5%) | 112 (16.2%) |
Disability Class: Vision Difficulty
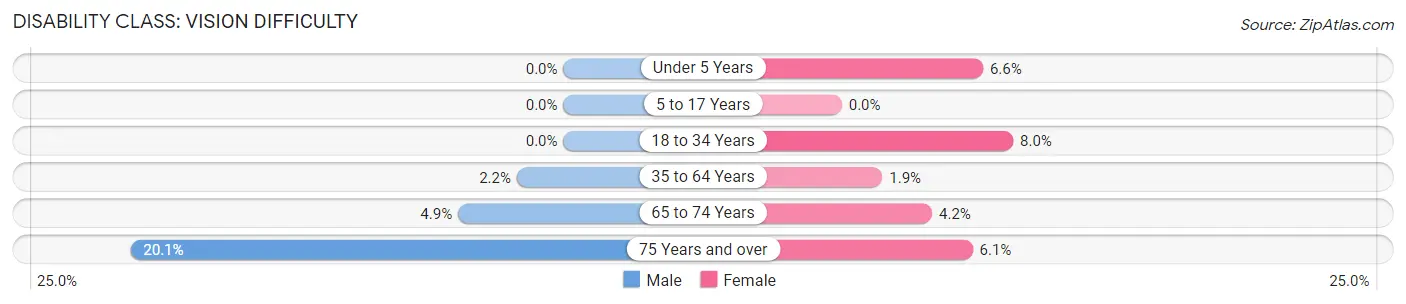
| Age Bracket | Male | Female |
| Under 5 Years | 0 (0.0%) | 40 (6.6%) |
| 5 to 17 Years | 0 (0.0%) | 0 (0.0%) |
| 18 to 34 Years | 0 (0.0%) | 123 (8.0%) |
| 35 to 64 Years | 74 (2.2%) | 66 (1.9%) |
| 65 to 74 Years | 58 (4.9%) | 53 (4.2%) |
| 75 Years and over | 127 (20.1%) | 42 (6.1%) |
Disability Class: Cognitive Difficulty
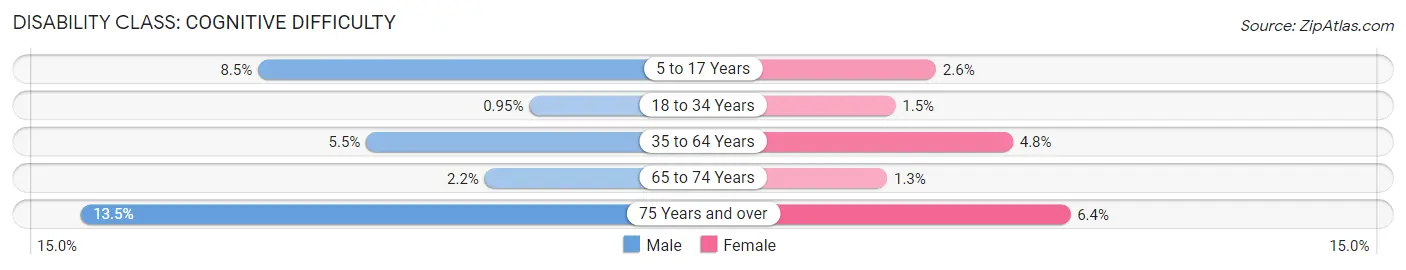
| Age Bracket | Male | Female |
| 5 to 17 Years | 122 (8.5%) | 39 (2.6%) |
| 18 to 34 Years | 15 (0.9%) | 23 (1.5%) |
| 35 to 64 Years | 188 (5.5%) | 167 (4.8%) |
| 65 to 74 Years | 26 (2.2%) | 16 (1.3%) |
| 75 Years and over | 85 (13.5%) | 44 (6.4%) |
Disability Class: Ambulatory Difficulty
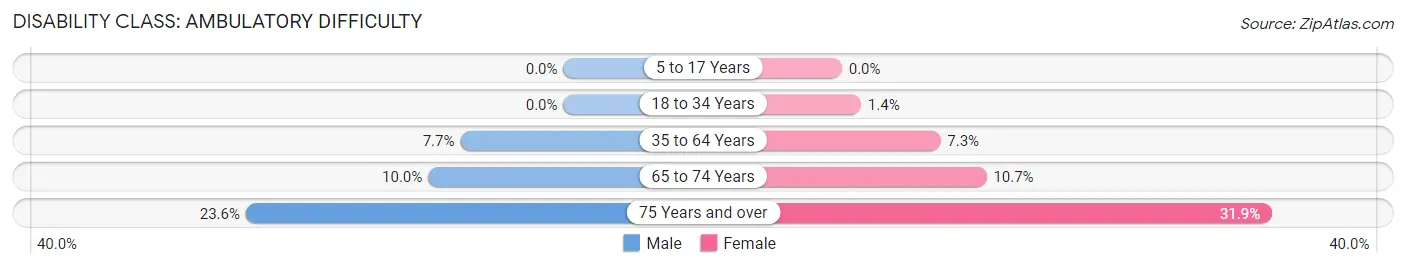
| Age Bracket | Male | Female |
| 5 to 17 Years | 0 (0.0%) | 0 (0.0%) |
| 18 to 34 Years | 0 (0.0%) | 22 (1.4%) |
| 35 to 64 Years | 262 (7.6%) | 257 (7.3%) |
| 65 to 74 Years | 119 (10.0%) | 136 (10.7%) |
| 75 Years and over | 149 (23.6%) | 221 (31.9%) |
Disability Class: Self-Care Difficulty
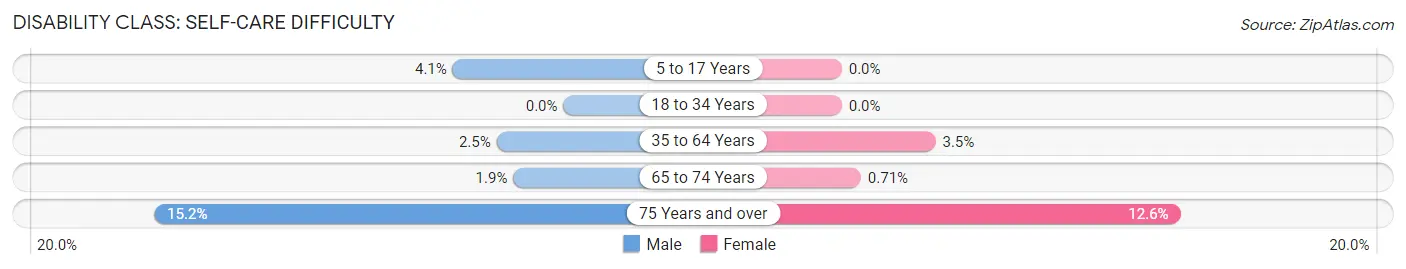
| Age Bracket | Male | Female |
| 5 to 17 Years | 59 (4.1%) | 0 (0.0%) |
| 18 to 34 Years | 0 (0.0%) | 0 (0.0%) |
| 35 to 64 Years | 85 (2.5%) | 122 (3.5%) |
| 65 to 74 Years | 22 (1.9%) | 9 (0.7%) |
| 75 Years and over | 96 (15.2%) | 87 (12.6%) |
Technology Access in Burleson County
Computing Device Access in Burleson County
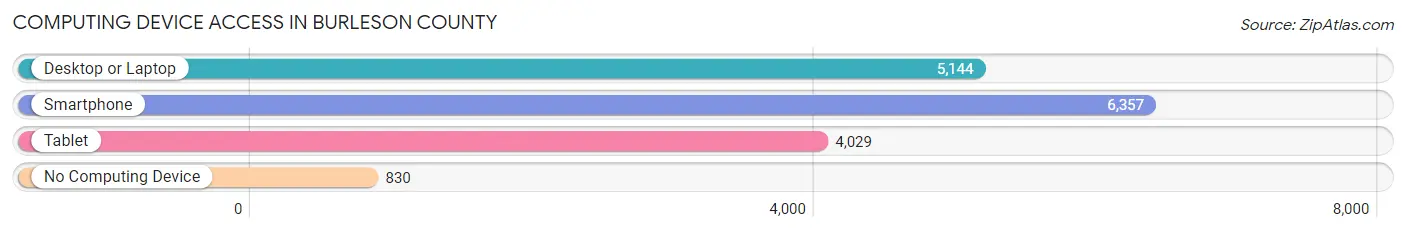
| Device Type | # Households | % Households |
| Desktop or Laptop | 5,144 | 67.8% |
| Smartphone | 6,357 | 83.8% |
| Tablet | 4,029 | 53.1% |
| No Computing Device | 830 | 10.9% |
| Total | 7,586 | 100.0% |
Internet Access in Burleson County
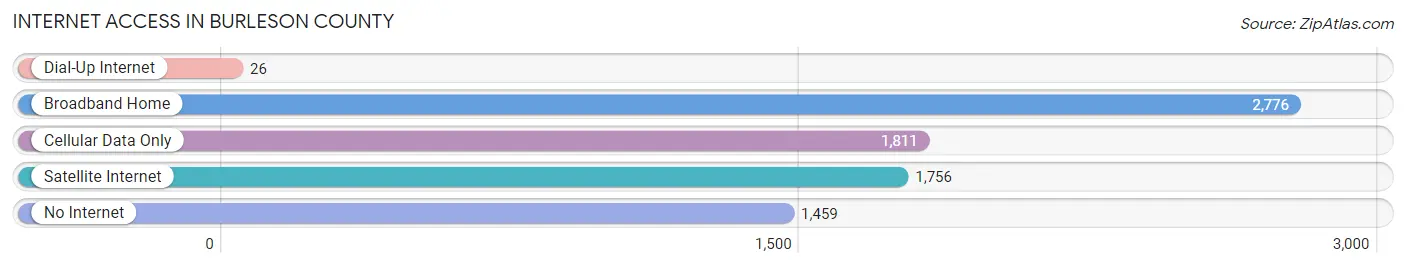
| Internet Type | # Households | % Households |
| Dial-Up Internet | 26 | 0.3% |
| Broadband Home | 2,776 | 36.6% |
| Cellular Data Only | 1,811 | 23.9% |
| Satellite Internet | 1,756 | 23.2% |
| No Internet | 1,459 | 19.2% |
| Total | 7,586 | 100.0% |
Burleson County Summary
Burleson County is located in the Central Texas region of the United States. It is bordered by Brazos, Robertson, Milam, Lee, Washington, and Austin counties. The county seat is Caldwell, and the largest city is Somerville. As of the 2010 census, the population was 17,187.
Geography
Burleson County is located in the Central Texas region of the United States. It is bordered by Brazos, Robertson, Milam, Lee, Washington, and Austin counties. The county has a total area of 576 square miles, of which 574 square miles is land and 2 square miles (0.3%) is water. The terrain is mostly flat with some rolling hills. The county is drained by the Brazos River and its tributaries.
History
Burleson County was created in 1846 from parts of Milam and Washington counties. It was named for Edward Burleson, a general in the Texas Revolution. The county seat was originally located in the town of Bremond, but was moved to Caldwell in 1848.
The county was largely rural until the 1950s, when the population began to grow rapidly due to the development of the oil and gas industry. The population continued to grow throughout the 1960s and 1970s, and by the 1980s the county had become a major center for oil and gas production.
Economy
The economy of Burleson County is largely based on agriculture and oil and gas production. The county is home to several large farms and ranches, and is a major producer of cotton, corn, and hay. The oil and gas industry is also a major employer in the county, with several large oil and gas companies operating in the area.
In addition to agriculture and oil and gas production, the county is also home to several manufacturing companies, including a large paper mill and a plastics plant. The county is also home to several retail stores, restaurants, and other businesses.
Demographics
As of the 2010 census, there were 17,187 people, 6,541 households, and 4,717 families residing in the county. The population density was 30 people per square mile. There were 7,541 housing units at an average density of 13 per square mile. The racial makeup of the county was 81.2% White, 11.7% Black or African American, 0.5% Native American, 0.3% Asian, 0.1% Pacific Islander, 5.2% from other races, and 1.1% from two or more races. Hispanic or Latino of any race were 13.2% of the population.
The median income for a household in the county was $37,945, and the median income for a family was $45,945. The per capita income for the county was $18,945. About 14.2% of families and 17.3% of the population were below the poverty line, including 22.3% of those under age 18 and 11.7% of those age 65 or over.
Conclusion
Burleson County is a rural county located in the Central Texas region of the United States. It is bordered by Brazos, Robertson, Milam, Lee, Washington, and Austin counties. The county has a total area of 576 square miles, of which 574 square miles is land and 2 square miles (0.3%) is water. The economy of Burleson County is largely based on agriculture and oil and gas production. As of the 2010 census, there were 17,187 people, 6,541 households, and 4,717 families residing in the county. The median income for a household in the county was $37,945, and the median income for a family was $45,945. The per capita income for the county was $18,945.
Common Questions
What is Per Capita Income in Burleson County?
Per Capita income in Burleson County is $38,918.
What is the Median Family Income in Burleson County?
Median Family Income in Burleson County is $83,876.
What is the Median Household income in Burleson County?
Median Household Income in Burleson County is $71,745.
What is Income or Wage Gap in Burleson County?
Income or Wage Gap in Burleson County is 32.2%.
Women in Burleson County earn 67.8 cents for every dollar earned by a man.
What is Inequality or Gini Index in Burleson County?
Inequality or Gini Index in Burleson County is 0.45.
What is the Total Population of Burleson County?
Total Population of Burleson County is 17,958.
What is the Total Male Population of Burleson County?
Total Male Population of Burleson County is 8,767.
What is the Total Female Population of Burleson County?
Total Female Population of Burleson County is 9,191.
What is the Ratio of Males per 100 Females in Burleson County?
There are 95.39 Males per 100 Females in Burleson County.
What is the Ratio of Females per 100 Males in Burleson County?
There are 104.84 Females per 100 Males in Burleson County.
What is the Median Population Age in Burleson County?
Median Population Age in Burleson County is 44.1 Years.
What is the Average Family Size in Burleson County
Average Family Size in Burleson County is 2.9 People.
What is the Average Household Size in Burleson County
Average Household Size in Burleson County is 2.3 People.
How Large is the Labor Force in Burleson County?
There are 8,151 People in the Labor Forcein in Burleson County.
What is the Percentage of People in the Labor Force in Burleson County?
56.2% of People are in the Labor Force in Burleson County.
What is the Unemployment Rate in Burleson County?
Unemployment Rate in Burleson County is 3.8%.