Brooks County, TX Map & Demographics
Brooks County Map
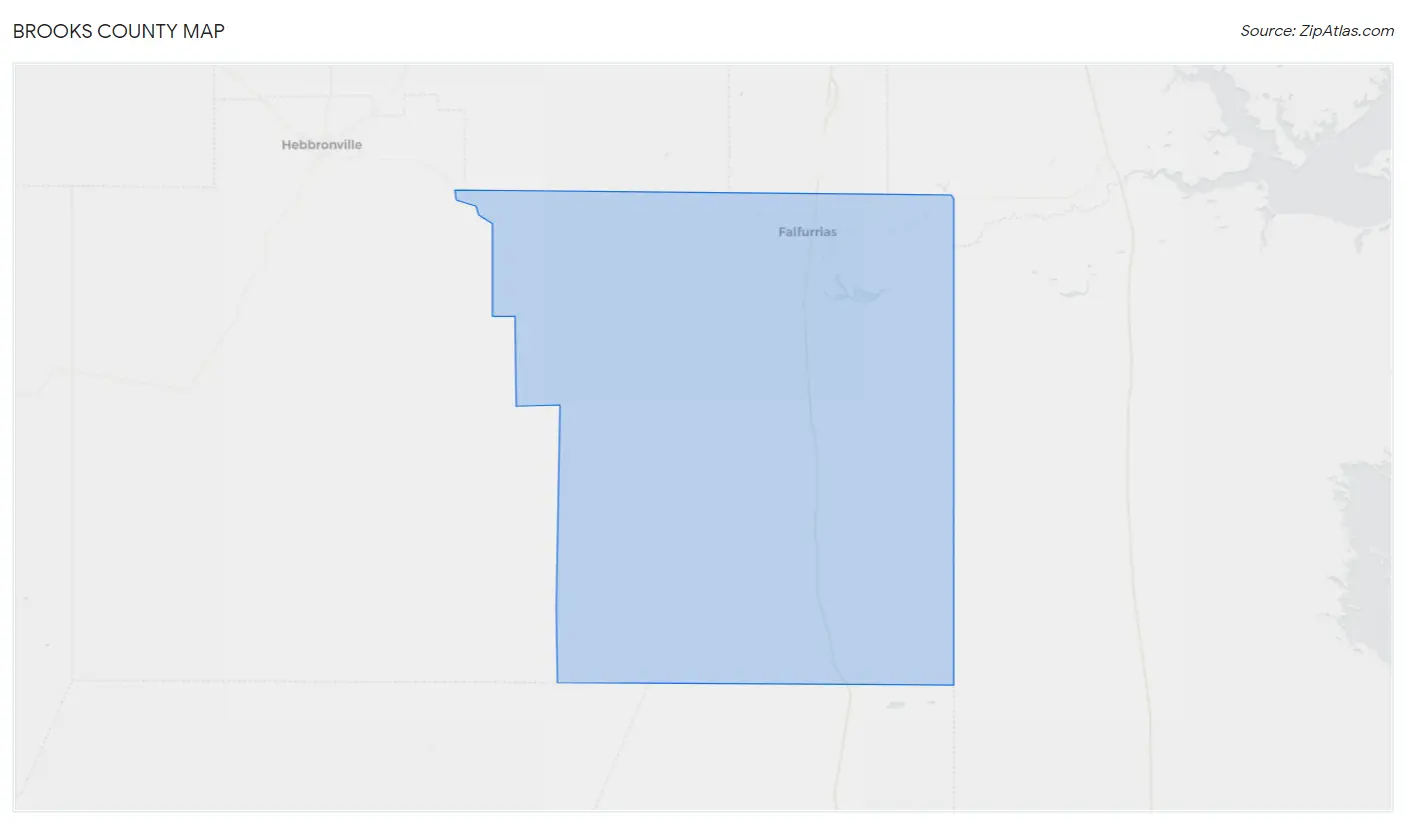
Brooks County Overview
$20,308
PER CAPITA INCOME
$38,438
AVG FAMILY INCOME
$30,566
AVG HOUSEHOLD INCOME
6.4%
WAGE / INCOME GAP [ % ]
93.6¢/ $1
WAGE / INCOME GAP [ $ ]
0.50
INEQUALITY / GINI INDEX
7,059
TOTAL POPULATION
3,385
MALE POPULATION
3,674
FEMALE POPULATION
92.13
MALES / 100 FEMALES
108.54
FEMALES / 100 MALES
38.3
MEDIAN AGE
3.4
AVG FAMILY SIZE
2.5
AVG HOUSEHOLD SIZE
3,073
LABOR FORCE [ PEOPLE ]
53.4%
PERCENT IN LABOR FORCE
2.1%
UNEMPLOYMENT RATE
Brooks County Area Codes
Income in Brooks County
Income Overview in Brooks County
Per Capita Income in Brooks County is $20,308, while median incomes of families and households are $38,438 and $30,566 respectively.
| Characteristic | Number | Measure |
| Per Capita Income | 7,059 | $20,308 |
| Median Family Income | 1,524 | $38,438 |
| Mean Family Income | 1,524 | $57,296 |
| Median Household Income | 2,652 | $30,566 |
| Mean Household Income | 2,652 | $46,187 |
| Income Deficit | 1,524 | $0 |
| Wage / Income Gap (%) | 7,059 | 6.44% |
| Wage / Income Gap ($) | 7,059 | 93.56¢ per $1 |
| Gini / Inequality Index | 7,059 | 0.50 |
Earnings by Sex in Brooks County
Average Earnings in Brooks County are $23,019, $21,842 for men and $23,345 for women, a difference of 6.4%.
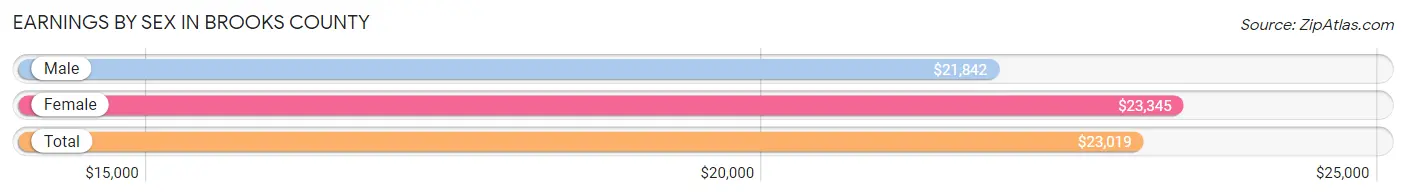
| Sex | Number | Average Earnings |
| Male | 1,824 (54.3%) | $21,842 |
| Female | 1,536 (45.7%) | $23,345 |
| Total | 3,360 (100.0%) | $23,019 |
Earnings by Sex by Income Bracket in Brooks County
The most common earnings brackets in Brooks County are $2,500 to $4,999 for men (395 | 21.7%) and $2,499 or less for women (322 | 21.0%).
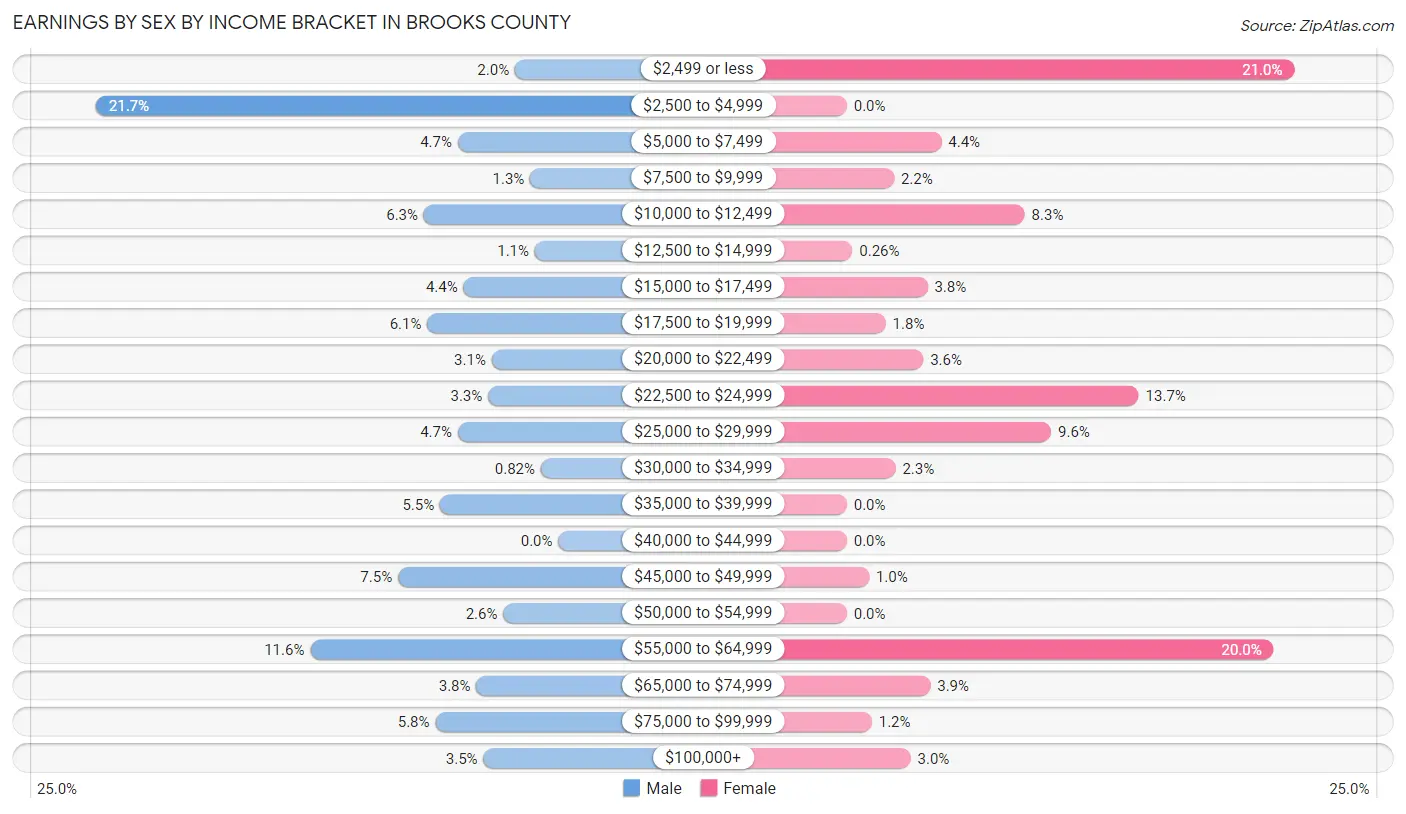
| Income | Male | Female |
| $2,499 or less | 37 (2.0%) | 322 (21.0%) |
| $2,500 to $4,999 | 395 (21.7%) | 0 (0.0%) |
| $5,000 to $7,499 | 86 (4.7%) | 68 (4.4%) |
| $7,500 to $9,999 | 24 (1.3%) | 34 (2.2%) |
| $10,000 to $12,499 | 115 (6.3%) | 128 (8.3%) |
| $12,500 to $14,999 | 20 (1.1%) | 4 (0.3%) |
| $15,000 to $17,499 | 81 (4.4%) | 58 (3.8%) |
| $17,500 to $19,999 | 112 (6.1%) | 28 (1.8%) |
| $20,000 to $22,499 | 57 (3.1%) | 55 (3.6%) |
| $22,500 to $24,999 | 60 (3.3%) | 210 (13.7%) |
| $25,000 to $29,999 | 86 (4.7%) | 147 (9.6%) |
| $30,000 to $34,999 | 15 (0.8%) | 35 (2.3%) |
| $35,000 to $39,999 | 101 (5.5%) | 0 (0.0%) |
| $40,000 to $44,999 | 0 (0.0%) | 0 (0.0%) |
| $45,000 to $49,999 | 137 (7.5%) | 16 (1.0%) |
| $50,000 to $54,999 | 47 (2.6%) | 0 (0.0%) |
| $55,000 to $64,999 | 212 (11.6%) | 307 (20.0%) |
| $65,000 to $74,999 | 70 (3.8%) | 60 (3.9%) |
| $75,000 to $99,999 | 105 (5.8%) | 18 (1.2%) |
| $100,000+ | 64 (3.5%) | 46 (3.0%) |
| Total | 1,824 (100.0%) | 1,536 (100.0%) |
Earnings by Sex by Educational Attainment in Brooks County
Average earnings in Brooks County are $38,110 for men and $23,821 for women, a difference of 37.5%. Men with an educational attainment of graduate degree enjoy the highest average annual earnings of $59,740, while those with college or associate's degree education earn the least with $38,242. Women with an educational attainment of bachelor's degree earn the most with the average annual earnings of $56,495, while those with less than high school education have the smallest earnings of $2,499.
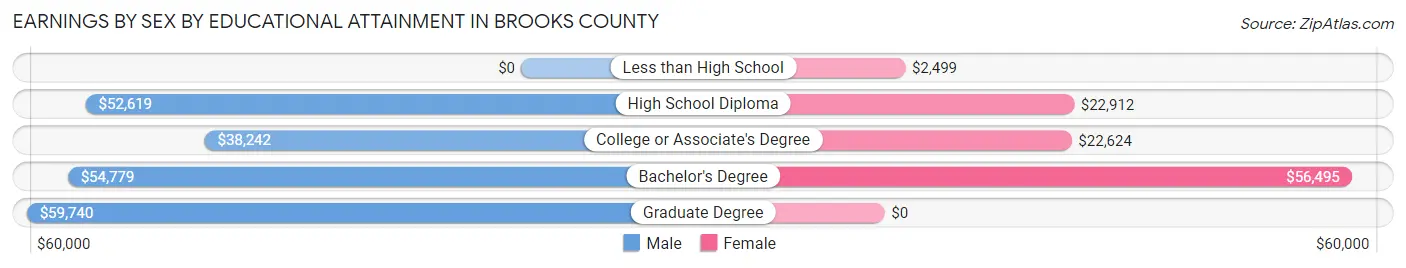
| Educational Attainment | Male Income | Female Income |
| Less than High School | - | - |
| High School Diploma | $52,619 | $22,912 |
| College or Associate's Degree | $38,242 | $22,624 |
| Bachelor's Degree | $54,779 | $56,495 |
| Graduate Degree | $59,740 | $0 |
| Total | $38,110 | $23,821 |
Family Income in Brooks County
Family Income Brackets in Brooks County
According to the Brooks County family income data, there are 279 families falling into the $100,000 to $149,999 income range, which is the most common income bracket and makes up 18.3% of all families. Conversely, the $200,000+ income bracket is the least frequent group with only 8 families (0.5%) belonging to this category.
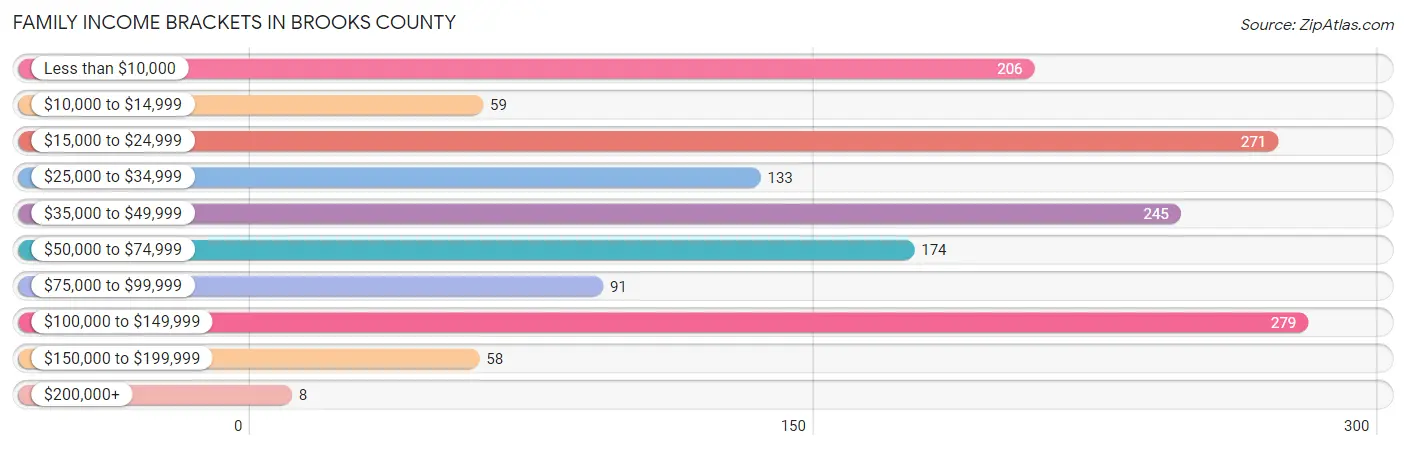
| Income Bracket | # Families | % Families |
| Less than $10,000 | 206 | 13.5% |
| $10,000 to $14,999 | 59 | 3.9% |
| $15,000 to $24,999 | 271 | 17.8% |
| $25,000 to $34,999 | 133 | 8.7% |
| $35,000 to $49,999 | 245 | 16.1% |
| $50,000 to $74,999 | 174 | 11.4% |
| $75,000 to $99,999 | 91 | 6.0% |
| $100,000 to $149,999 | 279 | 18.3% |
| $150,000 to $199,999 | 58 | 3.8% |
| $200,000+ | 8 | 0.5% |
Family Income by Famaliy Size in Brooks County
5-person families (94 | 6.2%) account for the highest median family income in Brooks County with $130,610 per family, while 5-person families (94 | 6.2%) have the highest median income of $26,122 per family member.
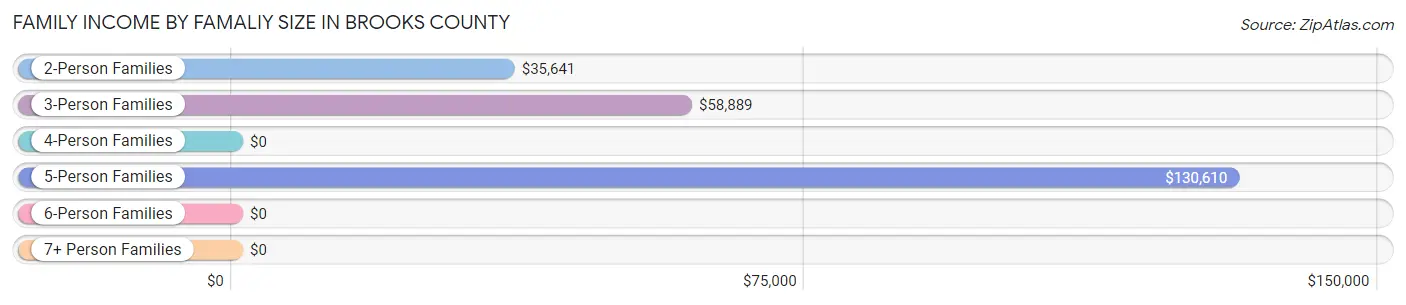
| Income Bracket | # Families | Median Income |
| 2-Person Families | 776 (50.9%) | $35,641 |
| 3-Person Families | 242 (15.9%) | $58,889 |
| 4-Person Families | 392 (25.7%) | $0 |
| 5-Person Families | 94 (6.2%) | $130,610 |
| 6-Person Families | 20 (1.3%) | $0 |
| 7+ Person Families | 0 (0.0%) | $0 |
| Total | 1,524 (100.0%) | $38,438 |
Family Income by Number of Earners in Brooks County
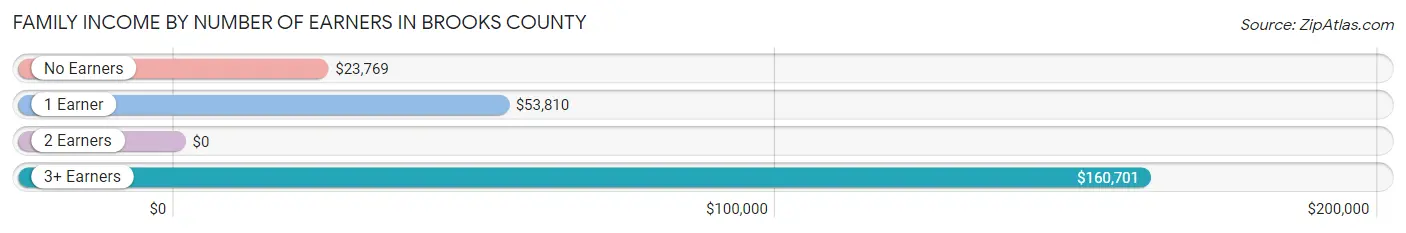
| Number of Earners | # Families | Median Income |
| No Earners | 442 (29.0%) | $23,769 |
| 1 Earner | 468 (30.7%) | $53,810 |
| 2 Earners | 541 (35.5%) | $0 |
| 3+ Earners | 73 (4.8%) | $160,701 |
| Total | 1,524 (100.0%) | $38,438 |
Household Income in Brooks County
Household Income Brackets in Brooks County
With 552 households falling in the category, the less than $10,000 income range is the most frequent in Brooks County, accounting for 20.8% of all households. In contrast, only 8 households (0.3%) fall into the $200,000+ income bracket, making it the least populous group.
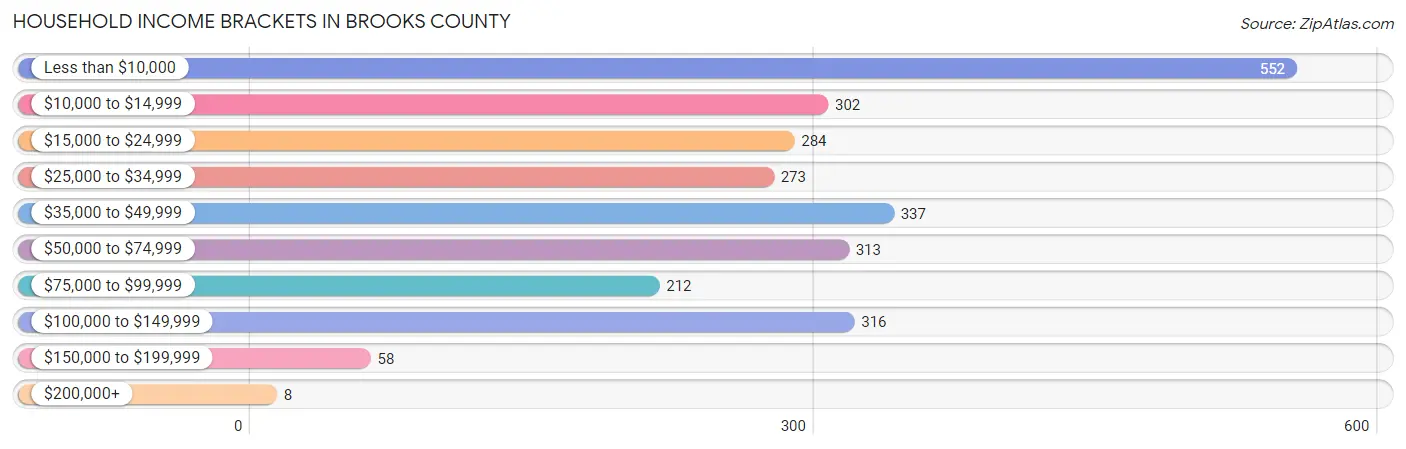
| Income Bracket | # Households | % Households |
| Less than $10,000 | 552 | 20.8% |
| $10,000 to $14,999 | 302 | 11.4% |
| $15,000 to $24,999 | 284 | 10.7% |
| $25,000 to $34,999 | 273 | 10.3% |
| $35,000 to $49,999 | 337 | 12.7% |
| $50,000 to $74,999 | 313 | 11.8% |
| $75,000 to $99,999 | 212 | 8.0% |
| $100,000 to $149,999 | 316 | 11.9% |
| $150,000 to $199,999 | 58 | 2.2% |
| $200,000+ | 8 | 0.3% |
Household Income by Householder Age in Brooks County
The median household income in Brooks County is $30,566, with the highest median household income of $39,375 found in the 45 to 64 years age bracket for the primary householder. A total of 1,022 households (38.5%) fall into this category. Meanwhile, the 15 to 24 years age bracket for the primary householder has the lowest median household income of $0, with 240 households (9.0%) in this group.
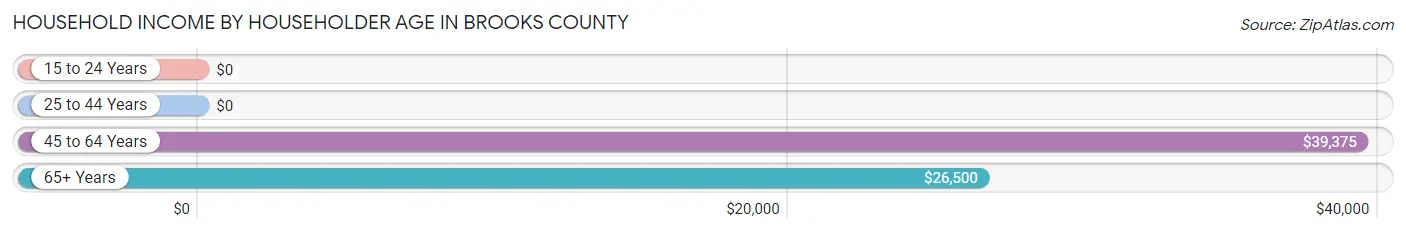
| Income Bracket | # Households | Median Income |
| 15 to 24 Years | 240 (9.0%) | $0 |
| 25 to 44 Years | 530 (20.0%) | $0 |
| 45 to 64 Years | 1,022 (38.5%) | $39,375 |
| 65+ Years | 860 (32.4%) | $26,500 |
| Total | 2,652 (100.0%) | $30,566 |
Poverty in Brooks County
Income Below Poverty by Sex and Age in Brooks County
With 36.7% poverty level for males and 30.4% for females among the residents of Brooks County, 5 year old males and 12 to 14 year old females are the most vulnerable to poverty, with 77 males (100.0%) and 148 females (79.6%) in their respective age groups living below the poverty level.
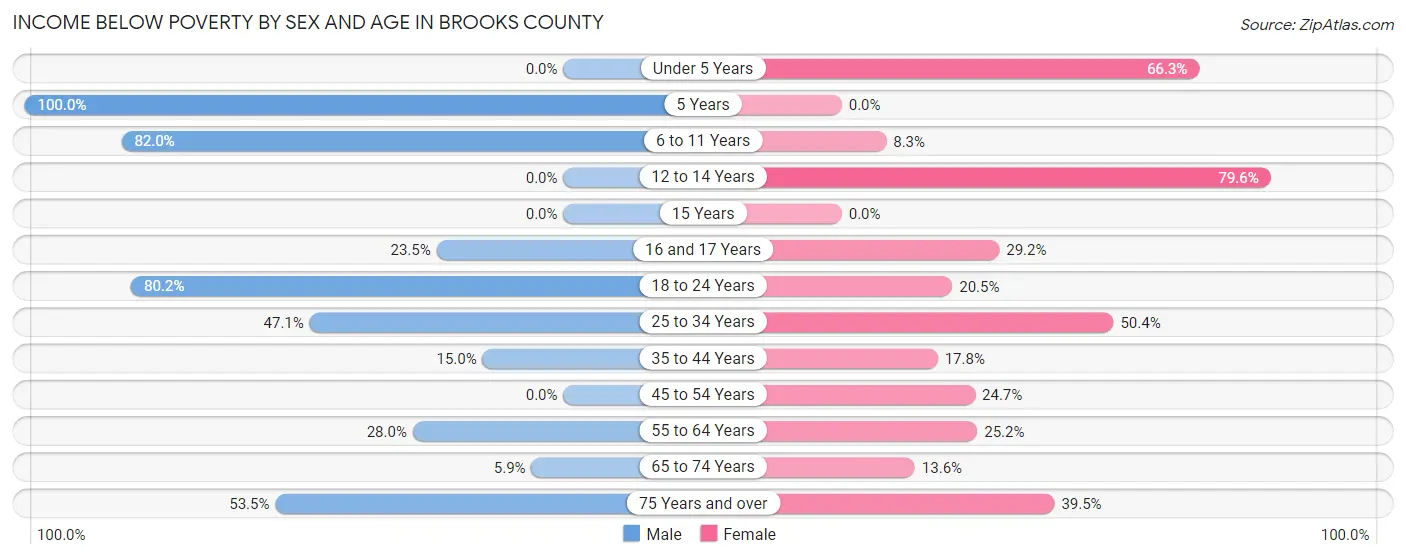
| Age Bracket | Male | Female |
| Under 5 Years | 0 (0.0%) | 132 (66.3%) |
| 5 Years | 77 (100.0%) | 0 (0.0%) |
| 6 to 11 Years | 187 (82.0%) | 28 (8.3%) |
| 12 to 14 Years | 0 (0.0%) | 148 (79.6%) |
| 15 Years | 0 (0.0%) | 0 (0.0%) |
| 16 and 17 Years | 24 (23.5%) | 50 (29.2%) |
| 18 to 24 Years | 337 (80.2%) | 8 (20.5%) |
| 25 to 34 Years | 138 (47.1%) | 232 (50.4%) |
| 35 to 44 Years | 57 (15.0%) | 75 (17.8%) |
| 45 to 54 Years | 0 (0.0%) | 94 (24.7%) |
| 55 to 64 Years | 104 (28.0%) | 128 (25.2%) |
| 65 to 74 Years | 15 (5.9%) | 70 (13.6%) |
| 75 Years and over | 139 (53.5%) | 133 (39.5%) |
| Total | 1,078 (36.7%) | 1,098 (30.4%) |
Income Above Poverty by Sex and Age in Brooks County
According to the poverty statistics in Brooks County, males aged 12 to 14 years and females aged 5 years are the age groups that are most secure financially, with 100.0% of males and 100.0% of females in these age groups living above the poverty line.
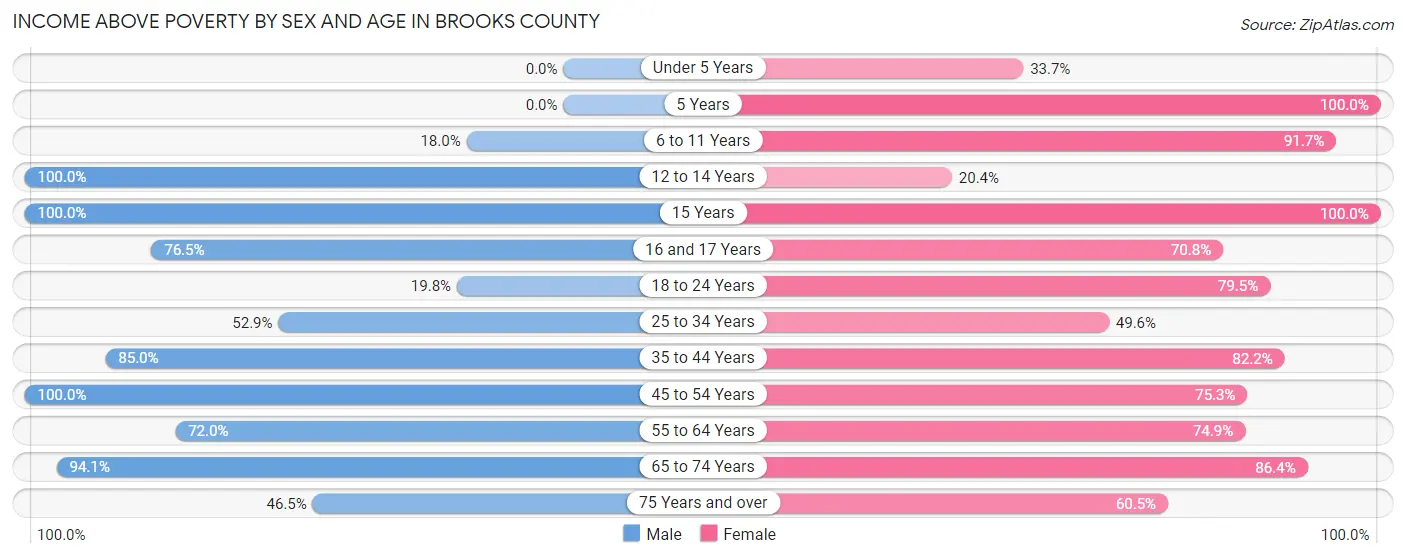
| Age Bracket | Male | Female |
| Under 5 Years | 0 (0.0%) | 67 (33.7%) |
| 5 Years | 0 (0.0%) | 30 (100.0%) |
| 6 to 11 Years | 41 (18.0%) | 311 (91.7%) |
| 12 to 14 Years | 184 (100.0%) | 38 (20.4%) |
| 15 Years | 36 (100.0%) | 25 (100.0%) |
| 16 and 17 Years | 78 (76.5%) | 121 (70.8%) |
| 18 to 24 Years | 83 (19.8%) | 31 (79.5%) |
| 25 to 34 Years | 155 (52.9%) | 228 (49.6%) |
| 35 to 44 Years | 323 (85.0%) | 346 (82.2%) |
| 45 to 54 Years | 334 (100.0%) | 286 (75.3%) |
| 55 to 64 Years | 268 (72.0%) | 381 (74.9%) |
| 65 to 74 Years | 238 (94.1%) | 446 (86.4%) |
| 75 Years and over | 121 (46.5%) | 204 (60.5%) |
| Total | 1,861 (63.3%) | 2,514 (69.6%) |
Income Below Poverty Among Married-Couple Families in Brooks County
The poverty statistics for married-couple families in Brooks County show that 20.8% or 236 of the total 1,134 families live below the poverty line. Families with 1 or 2 children have the highest poverty rate of 31.9%, comprising of 128 families. On the other hand, families with no children have the lowest poverty rate of 13.8%, which includes 93 families.
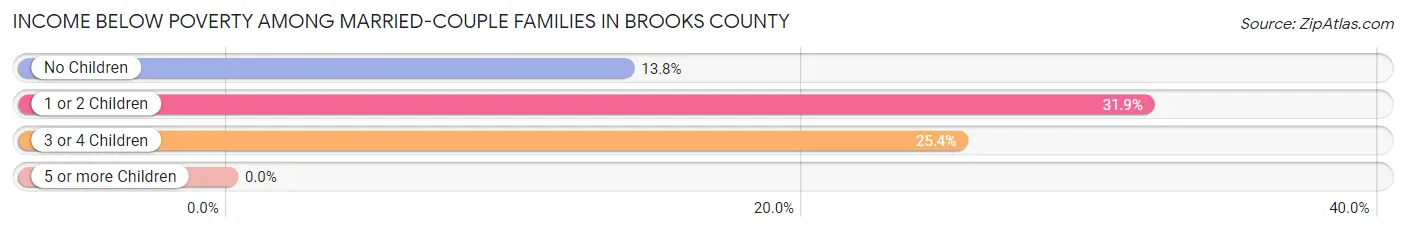
| Children | Above Poverty | Below Poverty |
| No Children | 581 (86.2%) | 93 (13.8%) |
| 1 or 2 Children | 273 (68.1%) | 128 (31.9%) |
| 3 or 4 Children | 44 (74.6%) | 15 (25.4%) |
| 5 or more Children | 0 (0.0%) | 0 (0.0%) |
| Total | 898 (79.2%) | 236 (20.8%) |
Income Below Poverty Among Single-Parent Households in Brooks County
According to the poverty data in Brooks County, 11.5% or 10 single-father households and 59.4% or 180 single-mother households are living below the poverty line. Among single-father households, those with 1 or 2 children have the highest poverty rate, with 10 households (14.5%) experiencing poverty. Likewise, among single-mother households, those with 3 or 4 children have the highest poverty rate, with 71 households (100.0%) falling below the poverty line.
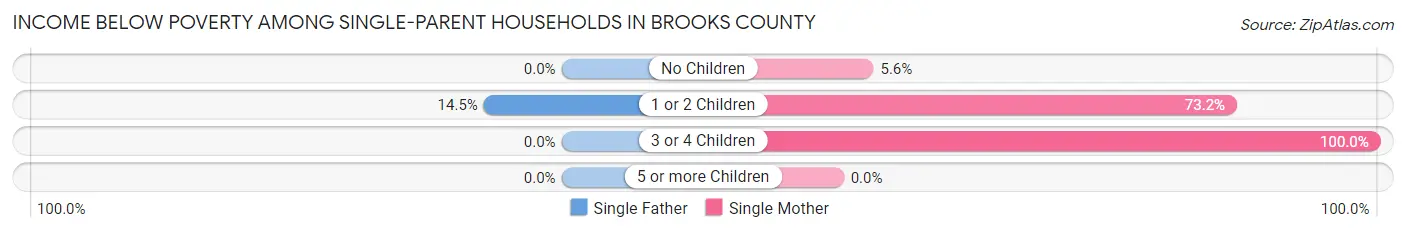
| Children | Single Father | Single Mother |
| No Children | 0 (0.0%) | 5 (5.6%) |
| 1 or 2 Children | 10 (14.5%) | 104 (73.2%) |
| 3 or 4 Children | 0 (0.0%) | 71 (100.0%) |
| 5 or more Children | 0 (0.0%) | 0 (0.0%) |
| Total | 10 (11.5%) | 180 (59.4%) |
Income Below Poverty Among Married-Couple vs Single-Parent Households in Brooks County
The poverty data for Brooks County shows that 236 of the married-couple family households (20.8%) and 190 of the single-parent households (48.7%) are living below the poverty level. Within the married-couple family households, those with 1 or 2 children have the highest poverty rate, with 128 households (31.9%) falling below the poverty line. Among the single-parent households, those with 3 or 4 children have the highest poverty rate, with 71 household (100.0%) living below poverty.
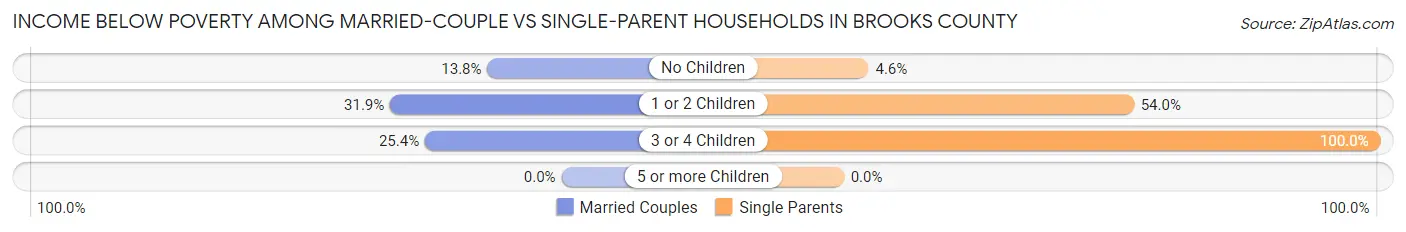
| Children | Married-Couple Families | Single-Parent Households |
| No Children | 93 (13.8%) | 5 (4.6%) |
| 1 or 2 Children | 128 (31.9%) | 114 (54.0%) |
| 3 or 4 Children | 15 (25.4%) | 71 (100.0%) |
| 5 or more Children | 0 (0.0%) | 0 (0.0%) |
| Total | 236 (20.8%) | 190 (48.7%) |
Race in Brooks County
The most populous races in Brooks County are Hispanic or Latino (6,314 | 89.4%), White / Caucasian (4,281 | 60.7%), and Two or more Races (2,018 | 28.6%).
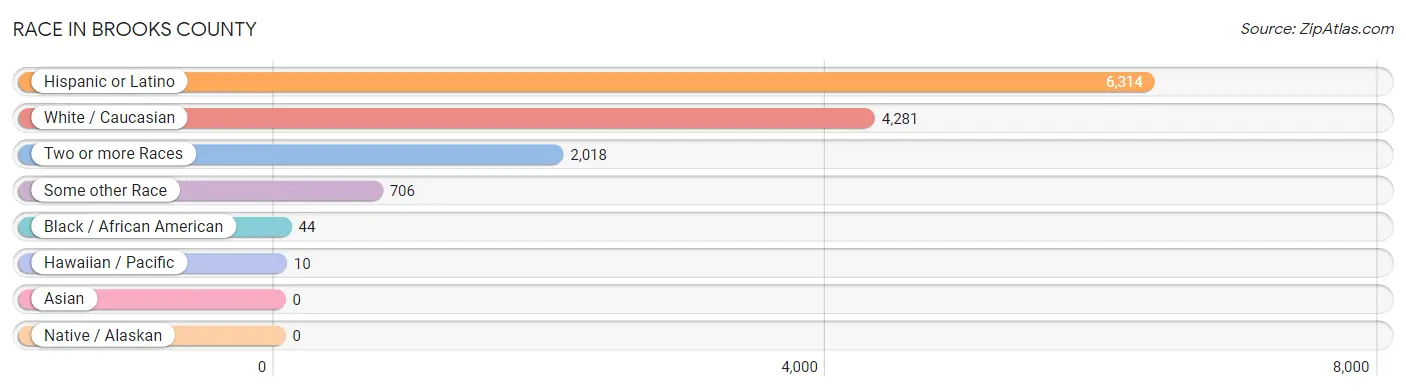
| Race | # Population | % Population |
| Asian | 0 | 0.0% |
| Black / African American | 44 | 0.6% |
| Hawaiian / Pacific | 10 | 0.1% |
| Hispanic or Latino | 6,314 | 89.4% |
| Native / Alaskan | 0 | 0.0% |
| White / Caucasian | 4,281 | 60.7% |
| Two or more Races | 2,018 | 28.6% |
| Some other Race | 706 | 10.0% |
| Total | 7,059 | 100.0% |
Ancestry in Brooks County
The most populous ancestries reported in Brooks County are Mexican (5,788 | 82.0%), German (415 | 5.9%), French (330 | 4.7%), Laotian (89 | 1.3%), and American (78 | 1.1%), together accounting for 94.9% of all Brooks County residents.
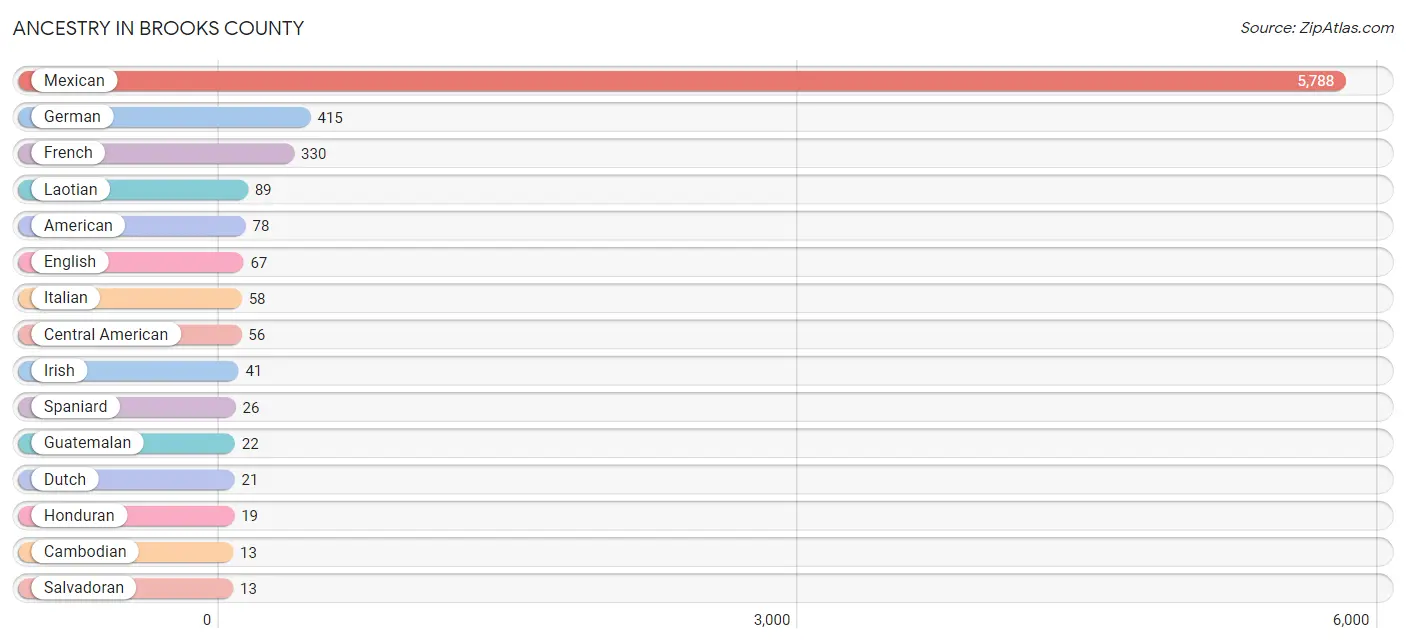
| Ancestry | # Population | % Population |
| American | 78 | 1.1% |
| Cambodian | 13 | 0.2% |
| Central American | 56 | 0.8% |
| Colombian | 12 | 0.2% |
| Dutch | 21 | 0.3% |
| English | 67 | 0.9% |
| French | 330 | 4.7% |
| German | 415 | 5.9% |
| Guatemalan | 22 | 0.3% |
| Honduran | 19 | 0.3% |
| Irish | 41 | 0.6% |
| Italian | 58 | 0.8% |
| Laotian | 89 | 1.3% |
| Mexican | 5,788 | 82.0% |
| Native Hawaiian | 10 | 0.1% |
| Nicaraguan | 2 | 0.0% |
| Salvadoran | 13 | 0.2% |
| South American | 12 | 0.2% |
| Spaniard | 26 | 0.4% |
| Spanish | 8 | 0.1% | View All 20 Rows |
Immigrants in Brooks County
The most numerous immigrant groups reported in Brooks County came from Latin America (571 | 8.1%), Central America (546 | 7.7%), Mexico (480 | 6.8%), Asia (70 | 1.0%), and Indonesia (70 | 1.0%), together accounting for 24.6% of all Brooks County residents.
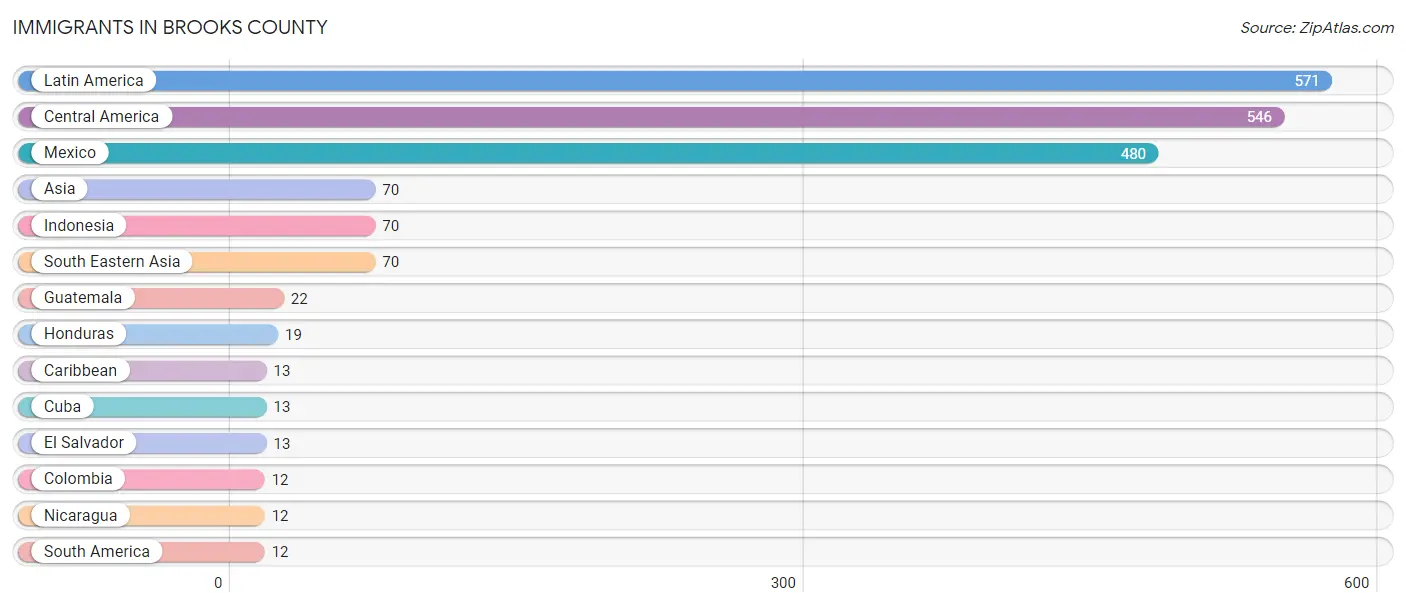
| Immigration Origin | # Population | % Population |
| Asia | 70 | 1.0% |
| Caribbean | 13 | 0.2% |
| Central America | 546 | 7.7% |
| Colombia | 12 | 0.2% |
| Cuba | 13 | 0.2% |
| El Salvador | 13 | 0.2% |
| Guatemala | 22 | 0.3% |
| Honduras | 19 | 0.3% |
| Indonesia | 70 | 1.0% |
| Latin America | 571 | 8.1% |
| Mexico | 480 | 6.8% |
| Nicaragua | 12 | 0.2% |
| South America | 12 | 0.2% |
| South Eastern Asia | 70 | 1.0% | View All 14 Rows |
Sex and Age in Brooks County
Sex and Age in Brooks County
The most populous age groups in Brooks County are 20 to 24 Years (446 | 13.2%) for men and 65 to 69 Years (348 | 9.5%) for women.
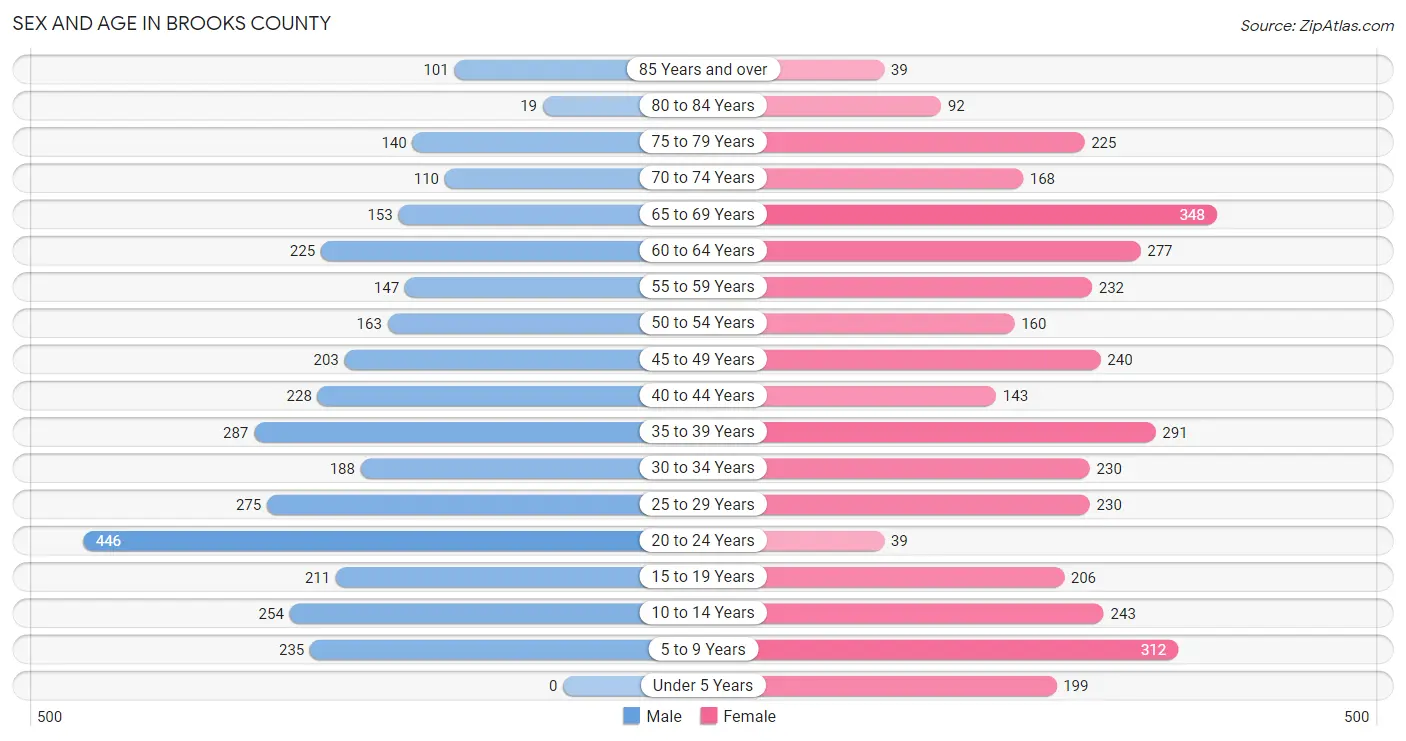
| Age Bracket | Male | Female |
| Under 5 Years | 0 (0.0%) | 199 (5.4%) |
| 5 to 9 Years | 235 (6.9%) | 312 (8.5%) |
| 10 to 14 Years | 254 (7.5%) | 243 (6.6%) |
| 15 to 19 Years | 211 (6.2%) | 206 (5.6%) |
| 20 to 24 Years | 446 (13.2%) | 39 (1.1%) |
| 25 to 29 Years | 275 (8.1%) | 230 (6.3%) |
| 30 to 34 Years | 188 (5.6%) | 230 (6.3%) |
| 35 to 39 Years | 287 (8.5%) | 291 (7.9%) |
| 40 to 44 Years | 228 (6.7%) | 143 (3.9%) |
| 45 to 49 Years | 203 (6.0%) | 240 (6.5%) |
| 50 to 54 Years | 163 (4.8%) | 160 (4.3%) |
| 55 to 59 Years | 147 (4.3%) | 232 (6.3%) |
| 60 to 64 Years | 225 (6.7%) | 277 (7.5%) |
| 65 to 69 Years | 153 (4.5%) | 348 (9.5%) |
| 70 to 74 Years | 110 (3.3%) | 168 (4.6%) |
| 75 to 79 Years | 140 (4.1%) | 225 (6.1%) |
| 80 to 84 Years | 19 (0.6%) | 92 (2.5%) |
| 85 Years and over | 101 (3.0%) | 39 (1.1%) |
| Total | 3,385 (100.0%) | 3,674 (100.0%) |
Families and Households in Brooks County
Median Family Size in Brooks County
The median family size in Brooks County is 3.36 persons per family, with single female/mother families (303 | 19.9%) accounting for the largest median family size of 4.28 persons per family. On the other hand, single male/father families (87 | 5.7%) represent the smallest median family size with 2.70 persons per family.
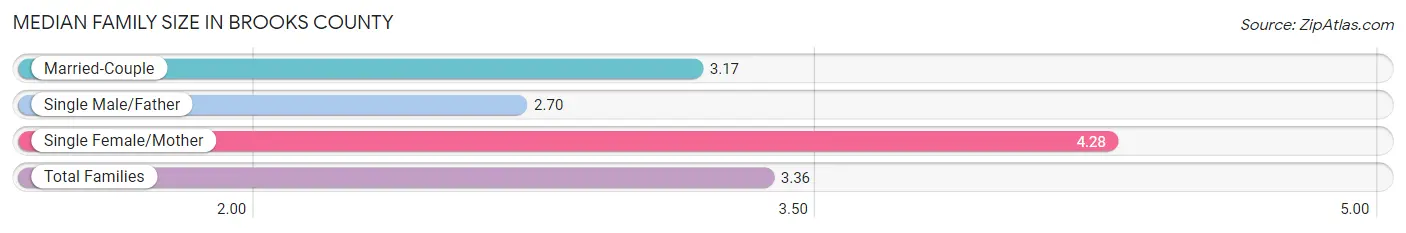
| Family Type | # Families | Family Size |
| Married-Couple | 1,134 (74.4%) | 3.17 |
| Single Male/Father | 87 (5.7%) | 2.70 |
| Single Female/Mother | 303 (19.9%) | 4.28 |
| Total Families | 1,524 (100.0%) | 3.36 |
Median Household Size in Brooks County
The median household size in Brooks County is 2.47 persons per household, with single female/mother households (303 | 11.4%) accounting for the largest median household size of 4.64 persons per household. non-family households (1,128 | 42.5%) represent the smallest median household size with 1.08 persons per household.
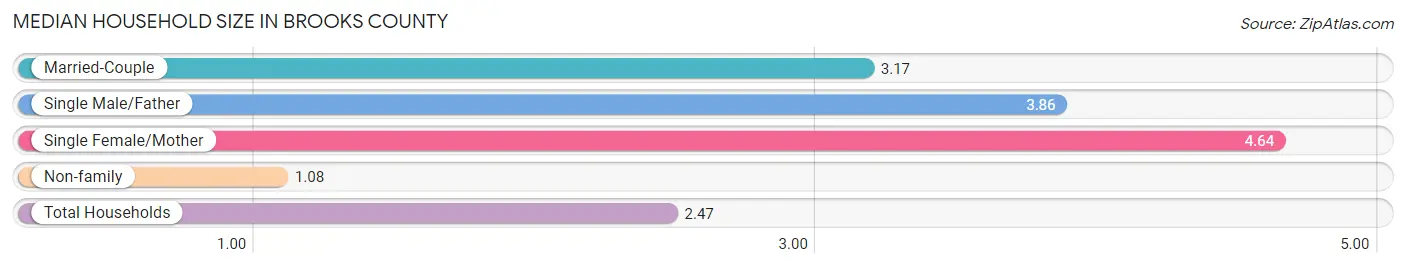
| Household Type | # Households | Household Size |
| Married-Couple | 1,134 (42.8%) | 3.17 |
| Single Male/Father | 87 (3.3%) | 3.86 |
| Single Female/Mother | 303 (11.4%) | 4.64 |
| Non-family | 1,128 (42.5%) | 1.08 |
| Total Households | 2,652 (100.0%) | 2.47 |
Household Size by Marriage Status in Brooks County
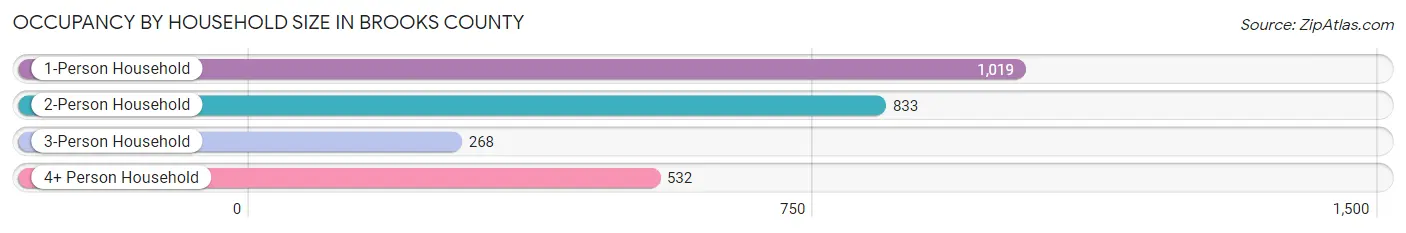
Out of a total of 2,652 households in Brooks County, 1,524 (57.5%) are family households, while 1,128 (42.5%) are nonfamily households. The most numerous type of family households are 2-person households, comprising 724, and the most common type of nonfamily households are 1-person households, comprising 1,019.
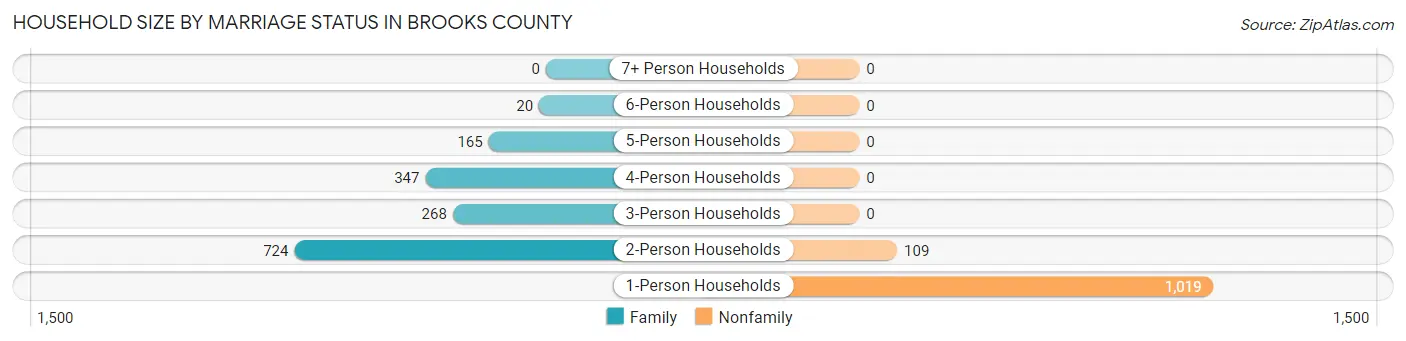
| Household Size | Family Households | Nonfamily Households |
| 1-Person Households | - | 1,019 (38.4%) |
| 2-Person Households | 724 (27.3%) | 109 (4.1%) |
| 3-Person Households | 268 (10.1%) | 0 (0.0%) |
| 4-Person Households | 347 (13.1%) | 0 (0.0%) |
| 5-Person Households | 165 (6.2%) | 0 (0.0%) |
| 6-Person Households | 20 (0.7%) | 0 (0.0%) |
| 7+ Person Households | 0 (0.0%) | 0 (0.0%) |
| Total | 1,524 (57.5%) | 1,128 (42.5%) |
Female Fertility in Brooks County
Fertility by Age in Brooks County
Average fertility rate in Brooks County is 78.0 births per 1,000 women. Women in the age bracket of 35 to 50 years have the highest fertility rate with 153.0 births per 1,000 women. Women in the age bracket of 35 to 50 years acount for 100.0% of all women with births.
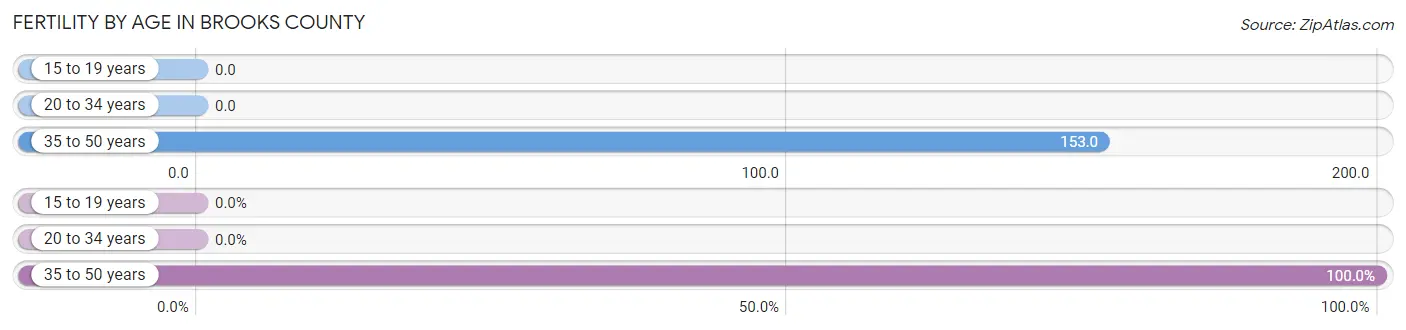
| Age Bracket | Women with Births | Births / 1,000 Women |
| 15 to 19 years | 0 (0.0%) | 0.0 |
| 20 to 34 years | 0 (0.0%) | 0.0 |
| 35 to 50 years | 111 (100.0%) | 153.0 |
| Total | 111 (100.0%) | 78.0 |
Fertility by Age by Marriage Status in Brooks County
36.0% of women with births (111) in Brooks County are married. The highest percentage of unmarried women with births falls into 35 to 50 years age bracket with 64.0% of them unmarried at the time of birth, while the lowest percentage of unmarried women with births belong to 35 to 50 years age bracket with 64.0% of them unmarried.
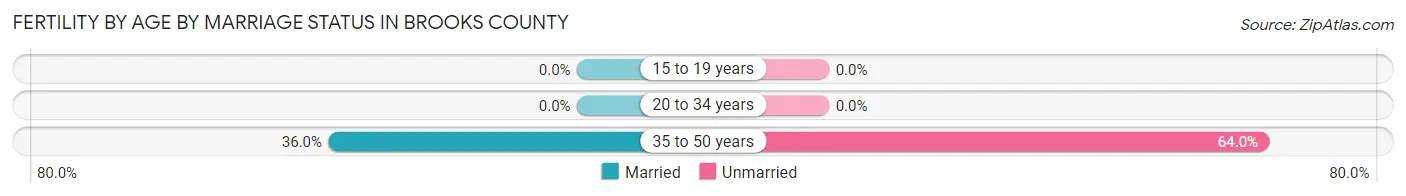
| Age Bracket | Married | Unmarried |
| 15 to 19 years | 0 (0.0%) | 0 (0.0%) |
| 20 to 34 years | 0 (0.0%) | 0 (0.0%) |
| 35 to 50 years | 40 (36.0%) | 71 (64.0%) |
| Total | 40 (36.0%) | 71 (64.0%) |
Fertility by Education in Brooks County
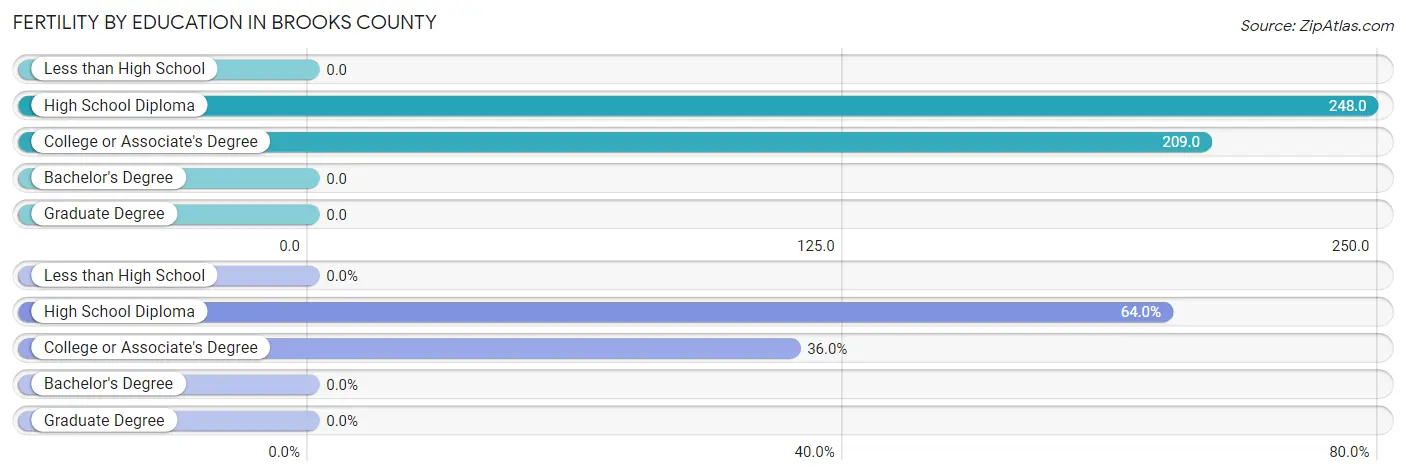
| Educational Attainment | Women with Births | Births / 1,000 Women |
| Less than High School | 0 (0.0%) | 0.0 |
| High School Diploma | 71 (64.0%) | 248.0 |
| College or Associate's Degree | 40 (36.0%) | 209.0 |
| Bachelor's Degree | 0 (0.0%) | 0.0 |
| Graduate Degree | 0 (0.0%) | 0.0 |
| Total | 111 (100.0%) | 78.0 |
Fertility by Education by Marriage Status in Brooks County
64.0% of women with births in Brooks County are unmarried. Women with the educational attainment of college or associate's degree are most likely to be married with 100.0% of them married at childbirth, while women with the educational attainment of high school diploma are least likely to be married with 100.0% of them unmarried at childbirth.
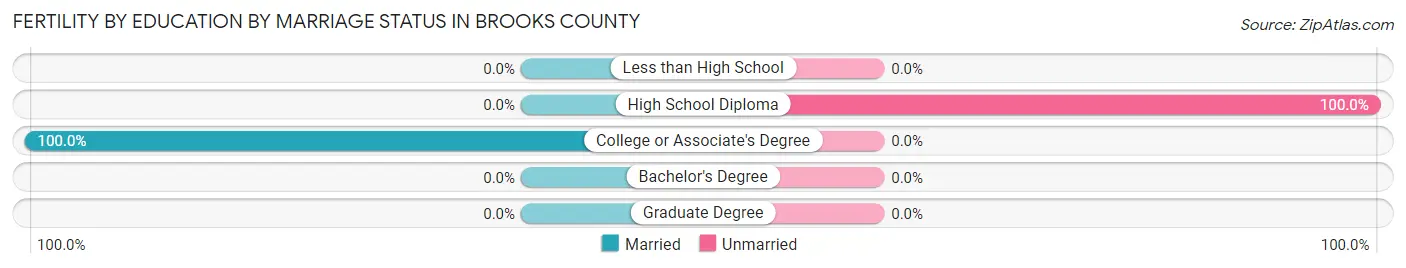
| Educational Attainment | Married | Unmarried |
| Less than High School | 0 (0.0%) | 0 (0.0%) |
| High School Diploma | 0 (0.0%) | 71 (100.0%) |
| College or Associate's Degree | 40 (100.0%) | 0 (0.0%) |
| Bachelor's Degree | 0 (0.0%) | 0 (0.0%) |
| Graduate Degree | 0 (0.0%) | 0 (0.0%) |
| Total | 40 (36.0%) | 71 (64.0%) |
Employment Characteristics in Brooks County
Employment by Class of Employer in Brooks County
Among the 2,951 employed individuals in Brooks County, private company employees (1,815 | 61.5%), self-employed (not incorporated) (400 | 13.6%), and local government employees (298 | 10.1%) make up the most common classes of employment.
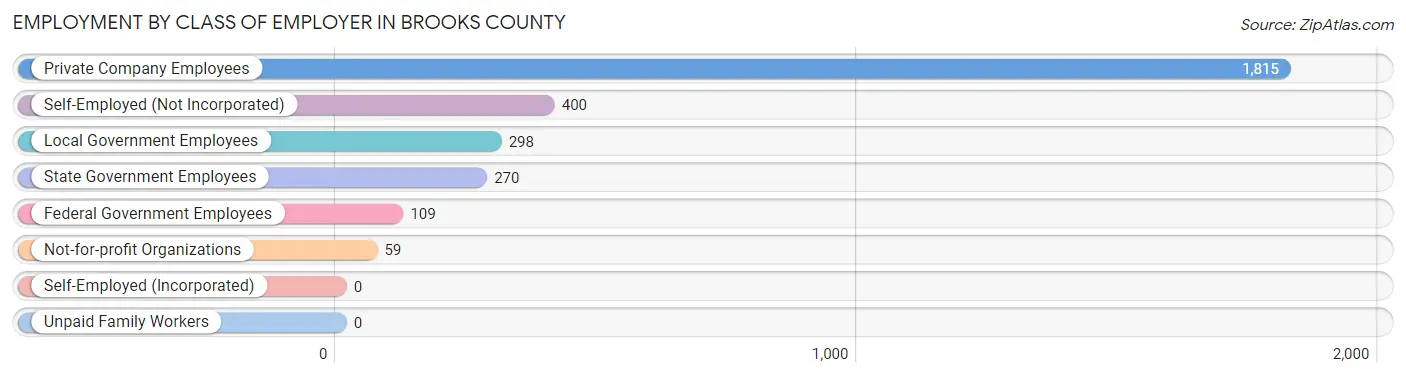
| Employer Class | # Employees | % Employees |
| Private Company Employees | 1,815 | 61.5% |
| Self-Employed (Incorporated) | 0 | 0.0% |
| Self-Employed (Not Incorporated) | 400 | 13.6% |
| Not-for-profit Organizations | 59 | 2.0% |
| Local Government Employees | 298 | 10.1% |
| State Government Employees | 270 | 9.1% |
| Federal Government Employees | 109 | 3.7% |
| Unpaid Family Workers | 0 | 0.0% |
| Total | 2,951 | 100.0% |
Employment Status by Age in Brooks County
According to the labor force statistics for Brooks County, out of the total population over 16 years of age (5,755), 53.4% or 3,073 individuals are in the labor force, with 2.1% or 65 of them unemployed. The age group with the highest labor force participation rate is 25 to 29 years, with 85.9% or 434 individuals in the labor force. Within the labor force, the 30 to 34 years age range has the highest percentage of unemployed individuals, with 8.6% or 27 of them being unemployed.
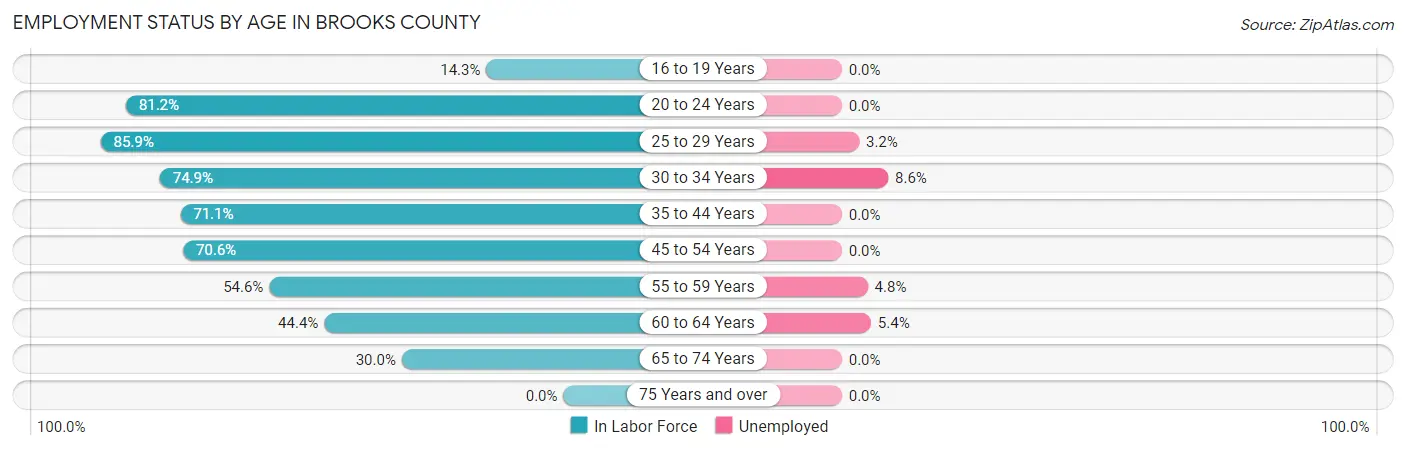
| Age Bracket | In Labor Force | Unemployed |
| 16 to 19 Years | 51 (14.3%) | 0 (0.0%) |
| 20 to 24 Years | 394 (81.2%) | 0 (0.0%) |
| 25 to 29 Years | 434 (85.9%) | 14 (3.2%) |
| 30 to 34 Years | 313 (74.9%) | 27 (8.6%) |
| 35 to 44 Years | 675 (71.1%) | 0 (0.0%) |
| 45 to 54 Years | 541 (70.6%) | 0 (0.0%) |
| 55 to 59 Years | 207 (54.6%) | 10 (4.8%) |
| 60 to 64 Years | 223 (44.4%) | 12 (5.4%) |
| 65 to 74 Years | 234 (30.0%) | 0 (0.0%) |
| 75 Years and over | 0 (0.0%) | 0 (0.0%) |
| Total | 3,073 (53.4%) | 65 (2.1%) |
Employment Status by Educational Attainment in Brooks County
According to labor force statistics for Brooks County, 68.0% of individuals (2,393) out of the total population between 25 and 64 years of age (3,519) are in the labor force, with 2.6% or 62 of them being unemployed. The group with the highest labor force participation rate are those with the educational attainment of bachelor's degree or higher, with 91.0% or 688 individuals in the labor force. Within the labor force, individuals with high school diploma education have the highest percentage of unemployment, with 7.7% or 51 of them being unemployed.
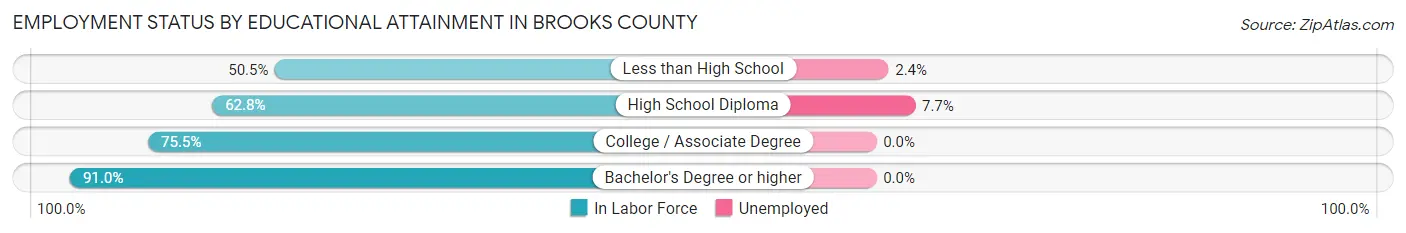
| Educational Attainment | In Labor Force | Unemployed |
| Less than High School | 501 (50.5%) | 24 (2.4%) |
| High School Diploma | 661 (62.8%) | 81 (7.7%) |
| College / Associate Degree | 543 (75.5%) | 0 (0.0%) |
| Bachelor's Degree or higher | 688 (91.0%) | 0 (0.0%) |
| Total | 2,393 (68.0%) | 91 (2.6%) |
Employment Occupations by Sex in Brooks County
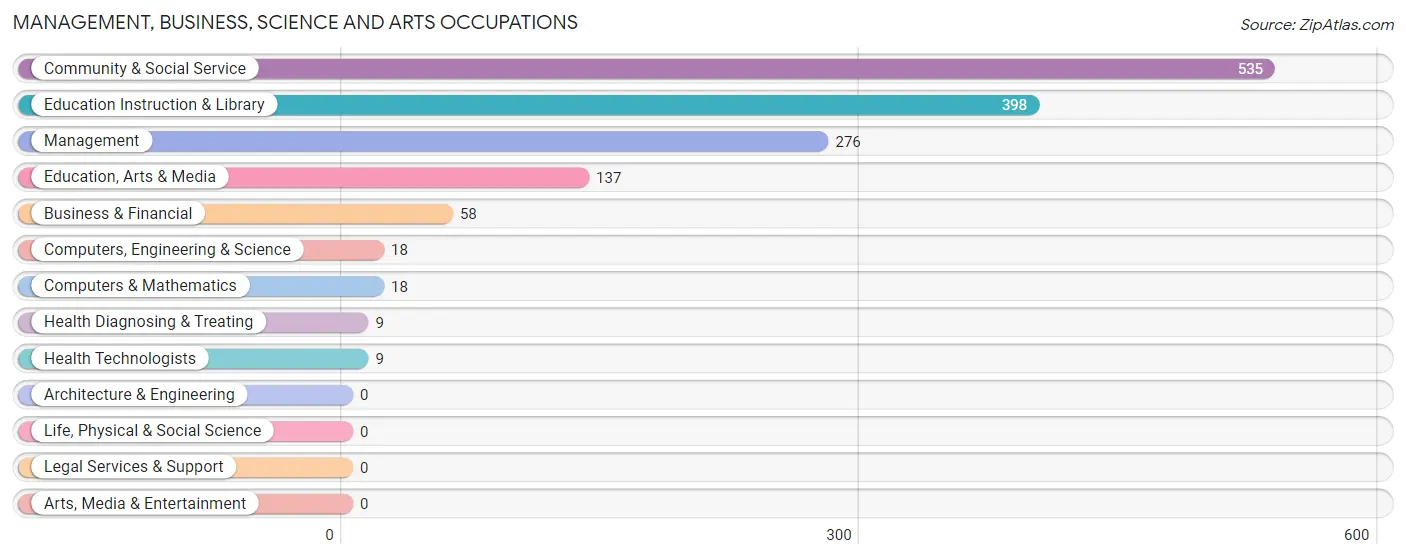
Management, Business, Science and Arts Occupations
The most common Management, Business, Science and Arts occupations in Brooks County are Community & Social Service (535 | 17.8%), Education Instruction & Library (398 | 13.2%), Management (276 | 9.2%), Education, Arts & Media (137 | 4.5%), and Business & Financial (58 | 1.9%).
Management, Business, Science and Arts Occupations by Sex
Within the Management, Business, Science and Arts occupations in Brooks County, the most male-oriented occupations are Computers, Engineering & Science (100.0%), Computers & Mathematics (100.0%), and Business & Financial (51.7%), while the most female-oriented occupations are Management (85.5%), Education Instruction & Library (81.4%), and Community & Social Service (79.1%).
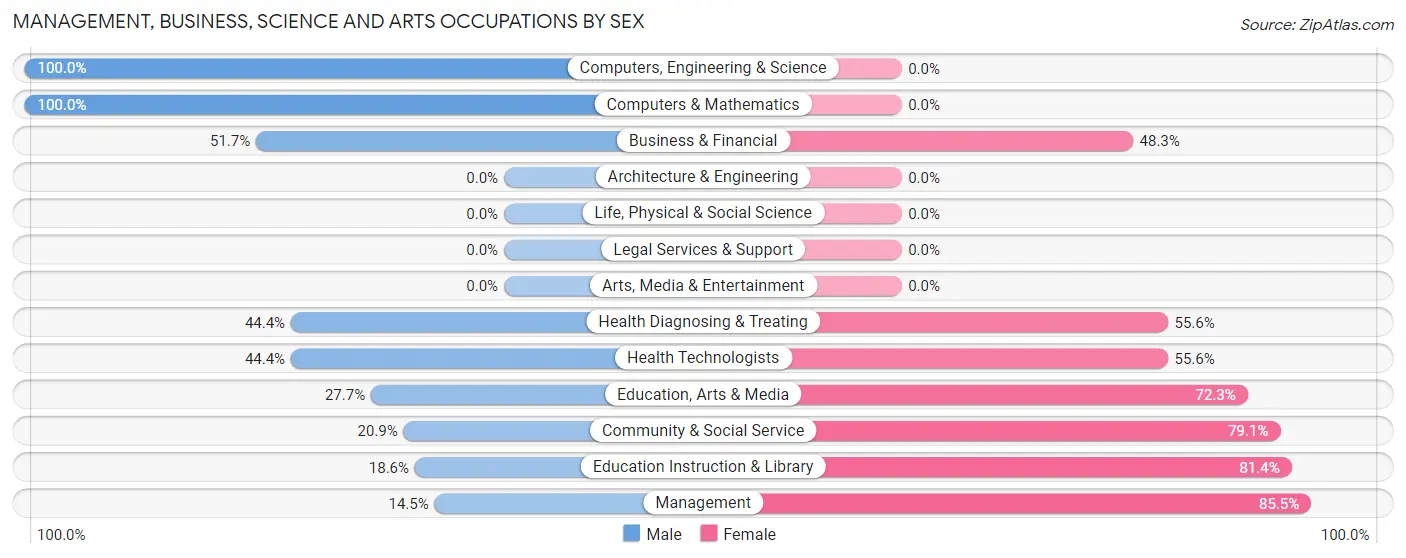
| Occupation | Male | Female |
| Management | 40 (14.5%) | 236 (85.5%) |
| Business & Financial | 30 (51.7%) | 28 (48.3%) |
| Computers, Engineering & Science | 18 (100.0%) | 0 (0.0%) |
| Computers & Mathematics | 18 (100.0%) | 0 (0.0%) |
| Architecture & Engineering | 0 (0.0%) | 0 (0.0%) |
| Life, Physical & Social Science | 0 (0.0%) | 0 (0.0%) |
| Community & Social Service | 112 (20.9%) | 423 (79.1%) |
| Education, Arts & Media | 38 (27.7%) | 99 (72.3%) |
| Legal Services & Support | 0 (0.0%) | 0 (0.0%) |
| Education Instruction & Library | 74 (18.6%) | 324 (81.4%) |
| Arts, Media & Entertainment | 0 (0.0%) | 0 (0.0%) |
| Health Diagnosing & Treating | 4 (44.4%) | 5 (55.6%) |
| Health Technologists | 4 (44.4%) | 5 (55.6%) |
| Total (Category) | 204 (22.8%) | 692 (77.2%) |
| Total (Overall) | 1,527 (50.7%) | 1,482 (49.2%) |
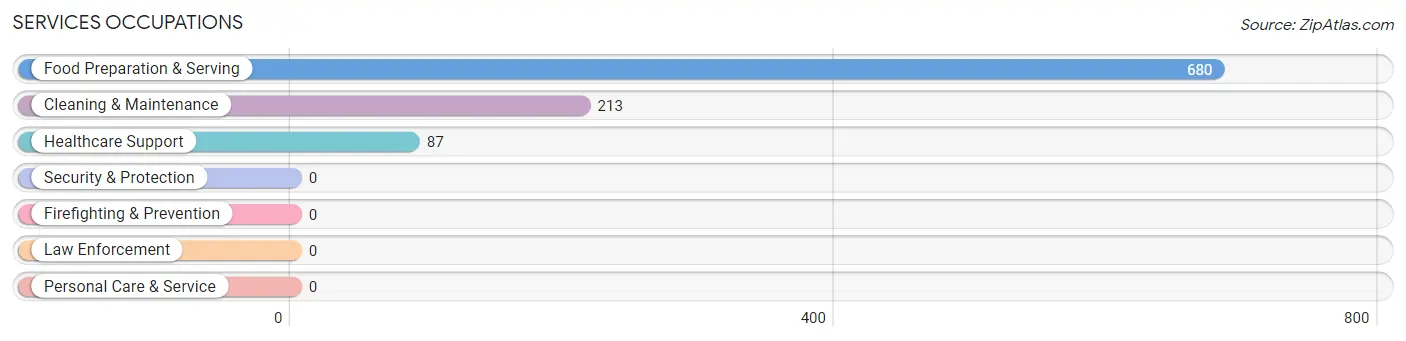
Services Occupations
The most common Services occupations in Brooks County are Food Preparation & Serving (680 | 22.6%), Cleaning & Maintenance (213 | 7.1%), and Healthcare Support (87 | 2.9%).
Services Occupations by Sex
Within the Services occupations in Brooks County, the most male-oriented occupations are Cleaning & Maintenance (97.2%), Food Preparation & Serving (38.4%), and Healthcare Support (9.2%), while the most female-oriented occupations are Healthcare Support (90.8%), Food Preparation & Serving (61.6%), and Cleaning & Maintenance (2.8%).
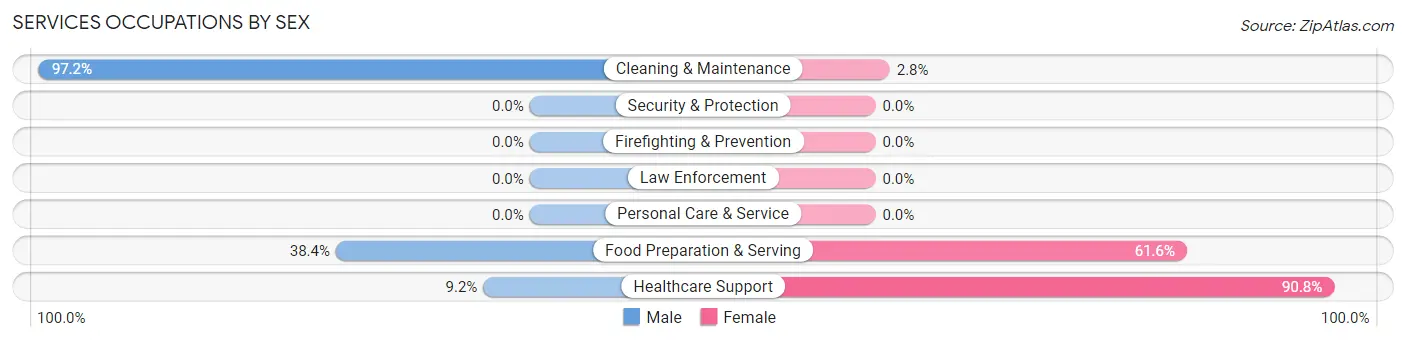
| Occupation | Male | Female |
| Healthcare Support | 8 (9.2%) | 79 (90.8%) |
| Security & Protection | 0 (0.0%) | 0 (0.0%) |
| Firefighting & Prevention | 0 (0.0%) | 0 (0.0%) |
| Law Enforcement | 0 (0.0%) | 0 (0.0%) |
| Food Preparation & Serving | 261 (38.4%) | 419 (61.6%) |
| Cleaning & Maintenance | 207 (97.2%) | 6 (2.8%) |
| Personal Care & Service | 0 (0.0%) | 0 (0.0%) |
| Total (Category) | 476 (48.6%) | 504 (51.4%) |
| Total (Overall) | 1,527 (50.7%) | 1,482 (49.2%) |
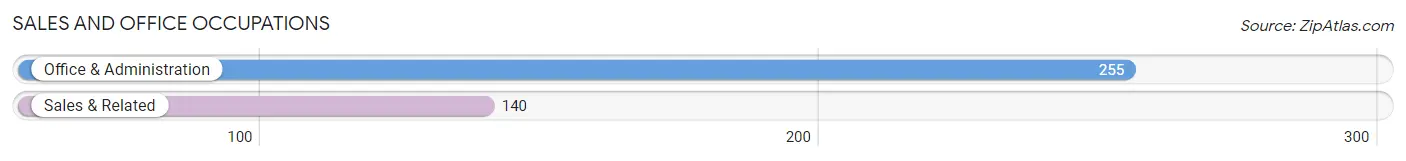
Sales and Office Occupations
The most common Sales and Office occupations in Brooks County are Office & Administration (255 | 8.5%), and Sales & Related (140 | 4.6%).
Sales and Office Occupations by Sex
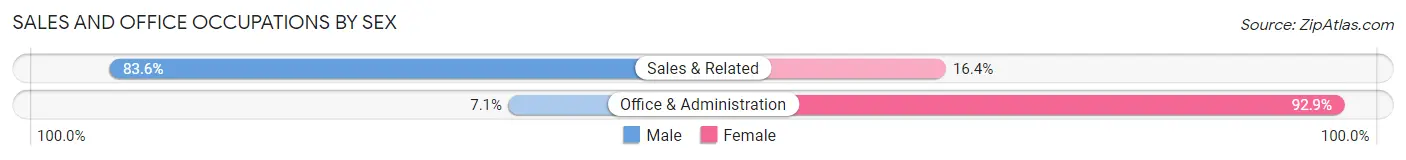
| Occupation | Male | Female |
| Sales & Related | 117 (83.6%) | 23 (16.4%) |
| Office & Administration | 18 (7.1%) | 237 (92.9%) |
| Total (Category) | 135 (34.2%) | 260 (65.8%) |
| Total (Overall) | 1,527 (50.7%) | 1,482 (49.2%) |
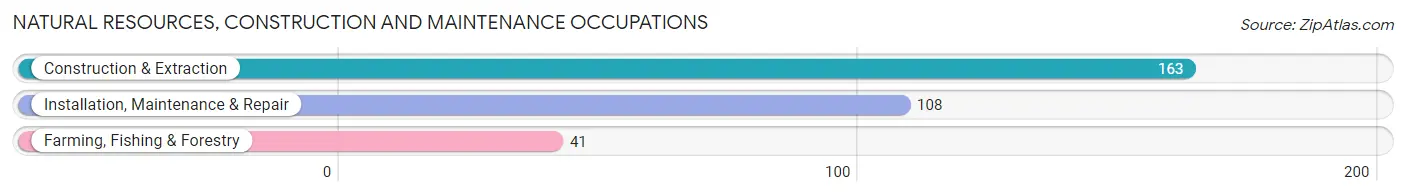
Natural Resources, Construction and Maintenance Occupations
The most common Natural Resources, Construction and Maintenance occupations in Brooks County are Construction & Extraction (163 | 5.4%), Installation, Maintenance & Repair (108 | 3.6%), and Farming, Fishing & Forestry (41 | 1.4%).
Natural Resources, Construction and Maintenance Occupations by Sex
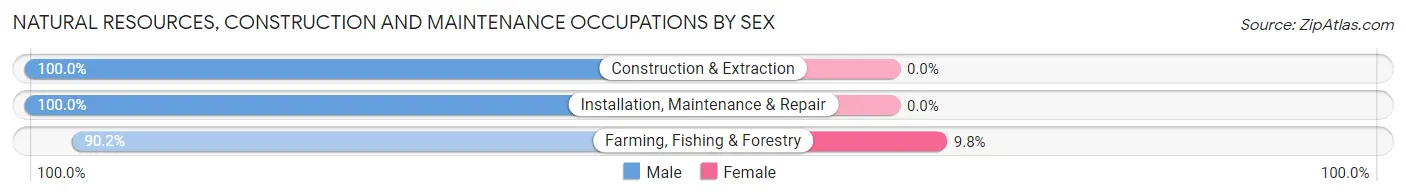
| Occupation | Male | Female |
| Farming, Fishing & Forestry | 37 (90.2%) | 4 (9.8%) |
| Construction & Extraction | 163 (100.0%) | 0 (0.0%) |
| Installation, Maintenance & Repair | 108 (100.0%) | 0 (0.0%) |
| Total (Category) | 308 (98.7%) | 4 (1.3%) |
| Total (Overall) | 1,527 (50.7%) | 1,482 (49.2%) |
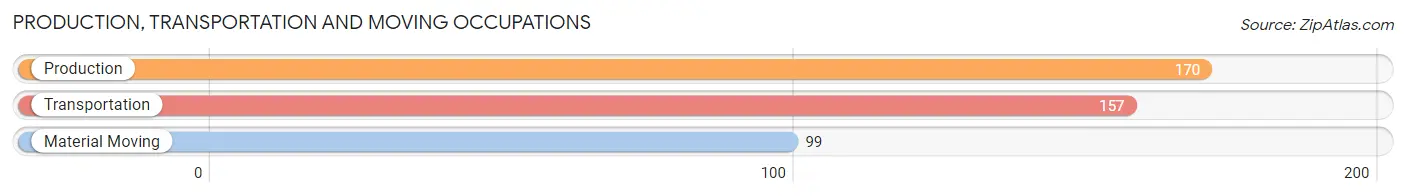
Production, Transportation and Moving Occupations
The most common Production, Transportation and Moving occupations in Brooks County are Production (170 | 5.7%), Transportation (157 | 5.2%), and Material Moving (99 | 3.3%).
Production, Transportation and Moving Occupations by Sex
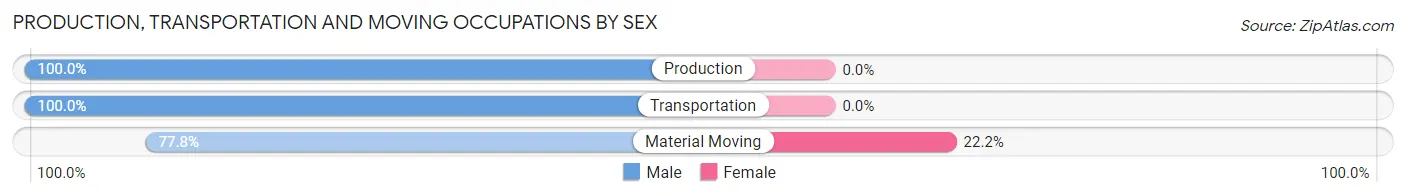
| Occupation | Male | Female |
| Production | 170 (100.0%) | 0 (0.0%) |
| Transportation | 157 (100.0%) | 0 (0.0%) |
| Material Moving | 77 (77.8%) | 22 (22.2%) |
| Total (Category) | 404 (94.8%) | 22 (5.2%) |
| Total (Overall) | 1,527 (50.7%) | 1,482 (49.2%) |
Employment Industries by Sex in Brooks County
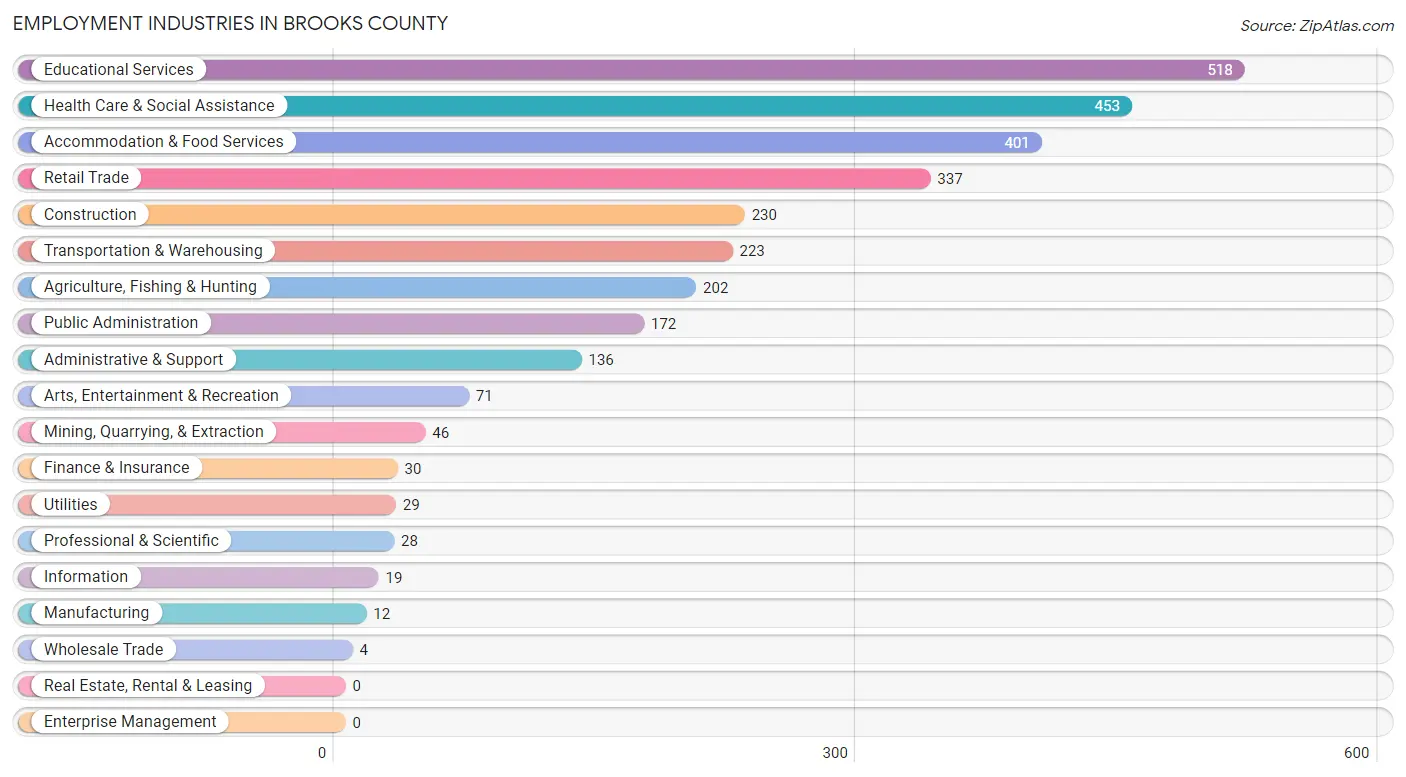
Employment Industries in Brooks County
The major employment industries in Brooks County include Educational Services (518 | 17.2%), Health Care & Social Assistance (453 | 15.0%), Accommodation & Food Services (401 | 13.3%), Retail Trade (337 | 11.2%), and Construction (230 | 7.6%).
Employment Industries by Sex in Brooks County
The Brooks County industries that see more men than women are Mining, Quarrying, & Extraction (100.0%), Construction (100.0%), and Manufacturing (100.0%), whereas the industries that tend to have a higher number of women are Wholesale Trade (100.0%), Professional & Scientific (100.0%), and Health Care & Social Assistance (88.3%).
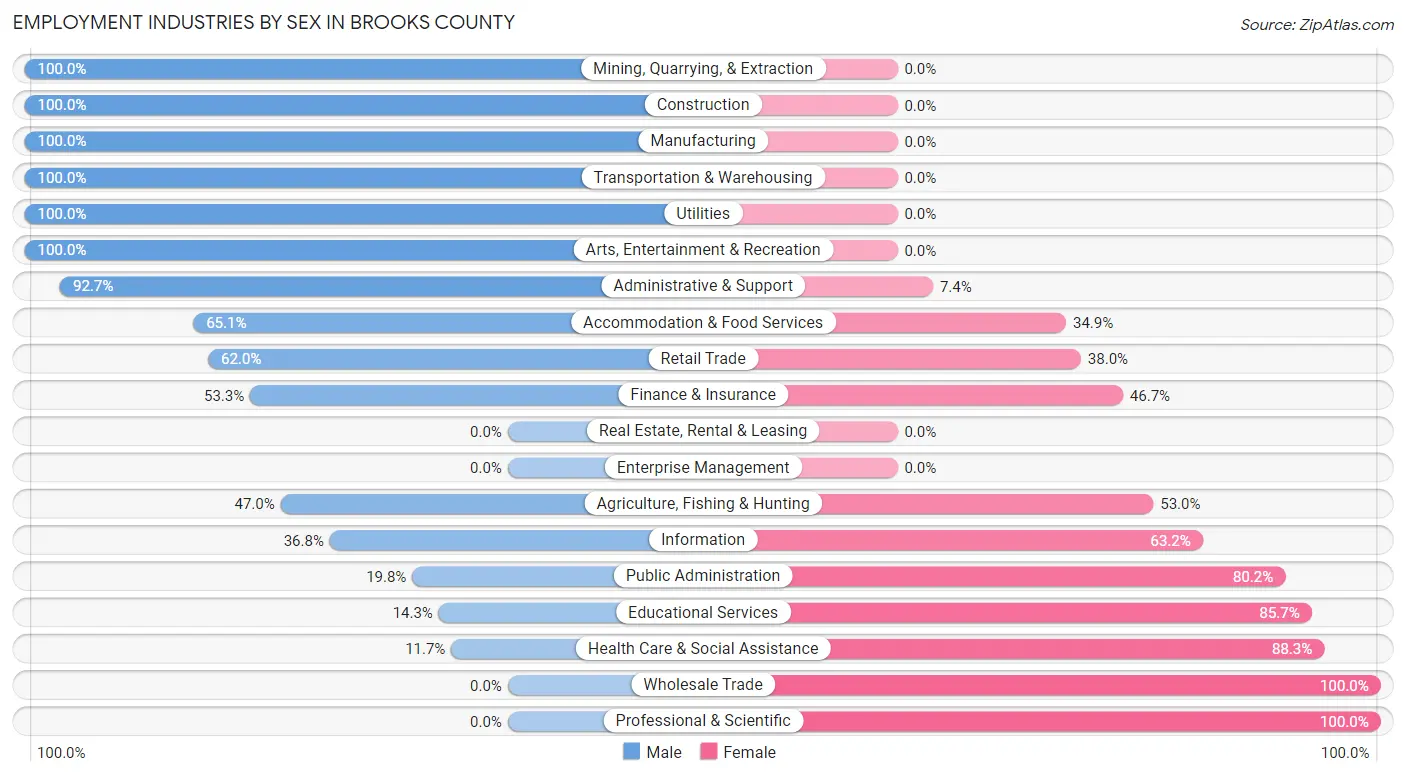
| Industry | Male | Female |
| Agriculture, Fishing & Hunting | 95 (47.0%) | 107 (53.0%) |
| Mining, Quarrying, & Extraction | 46 (100.0%) | 0 (0.0%) |
| Construction | 230 (100.0%) | 0 (0.0%) |
| Manufacturing | 12 (100.0%) | 0 (0.0%) |
| Wholesale Trade | 0 (0.0%) | 4 (100.0%) |
| Retail Trade | 209 (62.0%) | 128 (38.0%) |
| Transportation & Warehousing | 223 (100.0%) | 0 (0.0%) |
| Utilities | 29 (100.0%) | 0 (0.0%) |
| Information | 7 (36.8%) | 12 (63.2%) |
| Finance & Insurance | 16 (53.3%) | 14 (46.7%) |
| Real Estate, Rental & Leasing | 0 (0.0%) | 0 (0.0%) |
| Professional & Scientific | 0 (0.0%) | 28 (100.0%) |
| Enterprise Management | 0 (0.0%) | 0 (0.0%) |
| Administrative & Support | 126 (92.6%) | 10 (7.3%) |
| Educational Services | 74 (14.3%) | 444 (85.7%) |
| Health Care & Social Assistance | 53 (11.7%) | 400 (88.3%) |
| Arts, Entertainment & Recreation | 71 (100.0%) | 0 (0.0%) |
| Accommodation & Food Services | 261 (65.1%) | 140 (34.9%) |
| Public Administration | 34 (19.8%) | 138 (80.2%) |
| Total | 1,527 (50.7%) | 1,482 (49.2%) |
Education in Brooks County
School Enrollment in Brooks County
The most common levels of schooling among the 1,656 students in Brooks County are elementary school (497 | 30.0%), high school (430 | 26.0%), and middle school (409 | 24.7%).
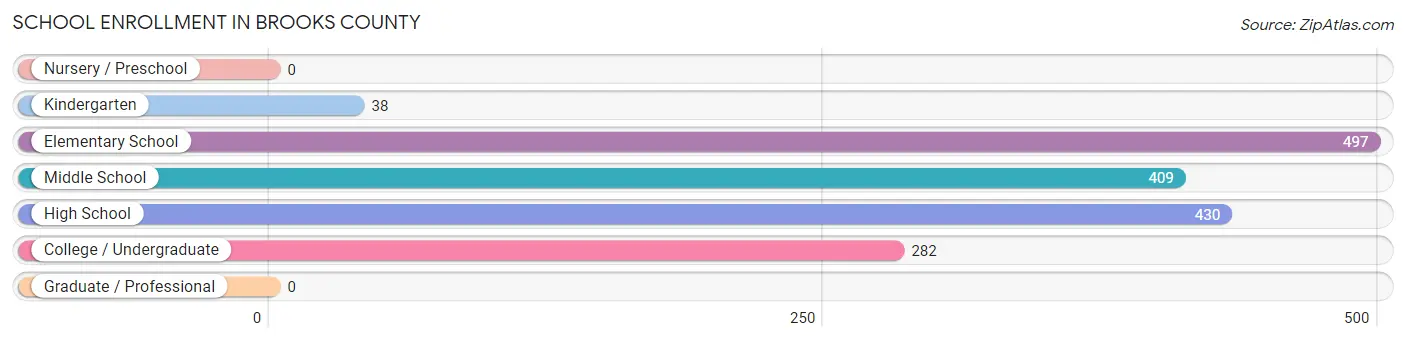
| School Level | # Students | % Students |
| Nursery / Preschool | 0 | 0.0% |
| Kindergarten | 38 | 2.3% |
| Elementary School | 497 | 30.0% |
| Middle School | 409 | 24.7% |
| High School | 430 | 26.0% |
| College / Undergraduate | 282 | 17.0% |
| Graduate / Professional | 0 | 0.0% |
| Total | 1,656 | 100.0% |
School Enrollment by Age by Funding Source in Brooks County
Out of a total of 1,656 students who are enrolled in schools in Brooks County, 131 (7.9%) attend a private institution, while the remaining 1,525 (92.1%) are enrolled in public schools. The age group of 18 to 19 year olds has the highest likelihood of being enrolled in private schools, with 57 (100.0% in the age bracket) enrolled. Conversely, the age group of 5 to 9 year old has the lowest likelihood of being enrolled in a private school, with 478 (100.0% in the age bracket) attending a public institution.
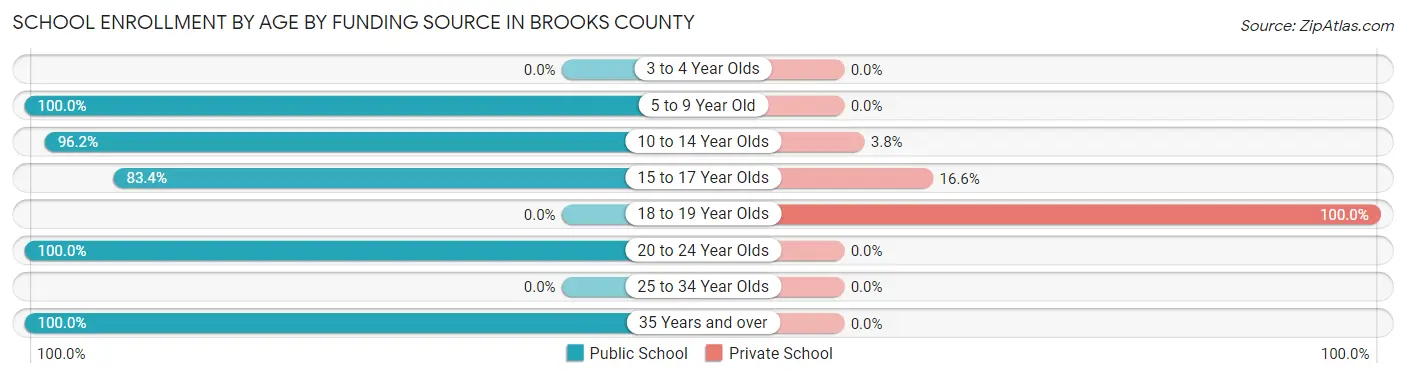
| Age Bracket | Public School | Private School |
| 3 to 4 Year Olds | 0 (0.0%) | 0 (0.0%) |
| 5 to 9 Year Old | 478 (100.0%) | 0 (0.0%) |
| 10 to 14 Year Olds | 461 (96.2%) | 18 (3.8%) |
| 15 to 17 Year Olds | 277 (83.4%) | 55 (16.6%) |
| 18 to 19 Year Olds | 0 (0.0%) | 57 (100.0%) |
| 20 to 24 Year Olds | 272 (100.0%) | 0 (0.0%) |
| 25 to 34 Year Olds | 0 (0.0%) | 0 (0.0%) |
| 35 Years and over | 38 (100.0%) | 0 (0.0%) |
| Total | 1,525 (92.1%) | 131 (7.9%) |
Educational Attainment by Field of Study in Brooks County
Education (318 | 32.8%), business (249 | 25.7%), communications (101 | 10.4%), psychology (72 | 7.4%), and bio, nature & agricultural (71 | 7.3%) are the most common fields of study among 970 individuals in Brooks County who have obtained a bachelor's degree or higher.
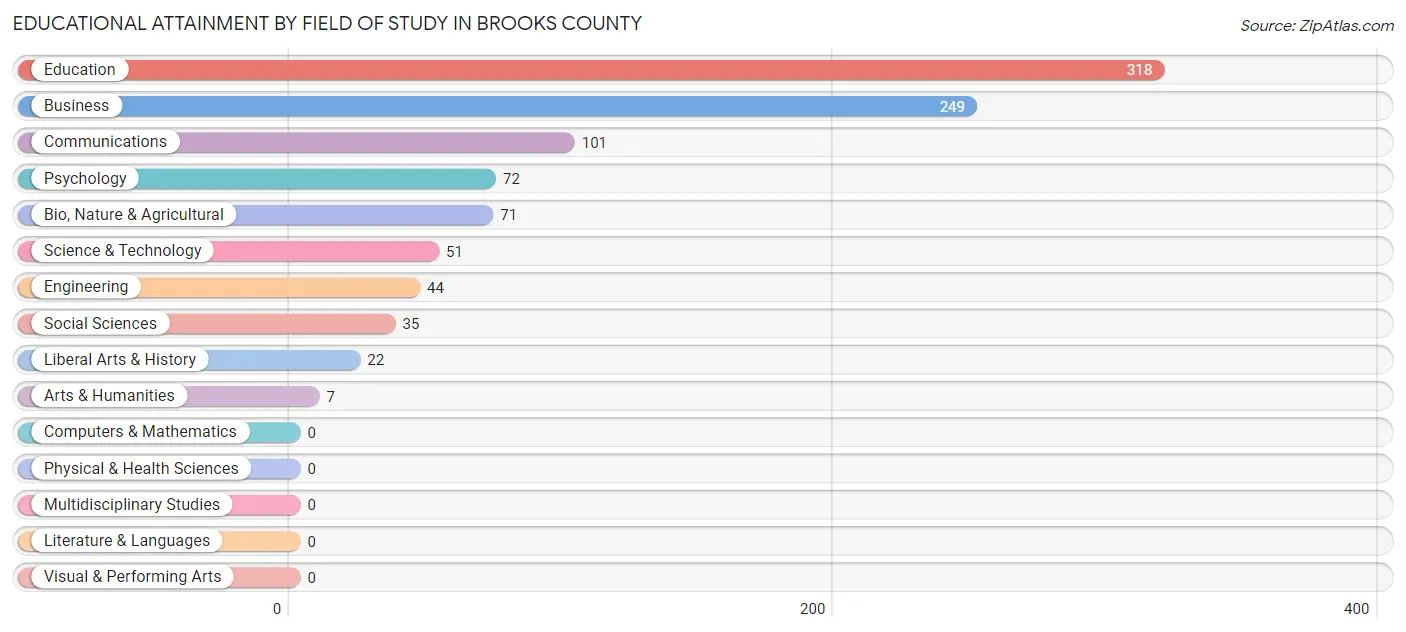
| Field of Study | # Graduates | % Graduates |
| Computers & Mathematics | 0 | 0.0% |
| Bio, Nature & Agricultural | 71 | 7.3% |
| Physical & Health Sciences | 0 | 0.0% |
| Psychology | 72 | 7.4% |
| Social Sciences | 35 | 3.6% |
| Engineering | 44 | 4.5% |
| Multidisciplinary Studies | 0 | 0.0% |
| Science & Technology | 51 | 5.3% |
| Business | 249 | 25.7% |
| Education | 318 | 32.8% |
| Literature & Languages | 0 | 0.0% |
| Liberal Arts & History | 22 | 2.3% |
| Visual & Performing Arts | 0 | 0.0% |
| Communications | 101 | 10.4% |
| Arts & Humanities | 7 | 0.7% |
| Total | 970 | 100.0% |
Transportation & Commute in Brooks County
Vehicle Availability by Sex in Brooks County
The most prevalent vehicle ownership categories in Brooks County are males with 1 vehicle (683, accounting for 44.7%) and females with 1 vehicle (536, making up 48.0%).
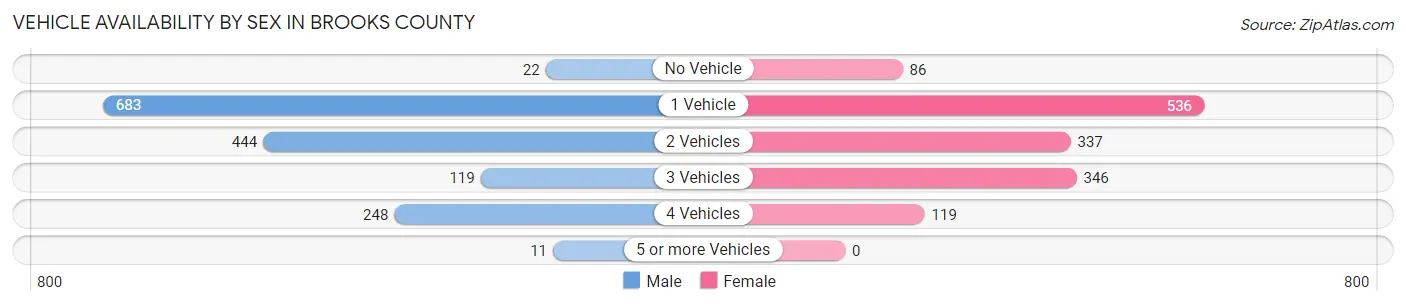
| Vehicles Available | Male | Female |
| No Vehicle | 22 (1.4%) | 86 (6.0%) |
| 1 Vehicle | 683 (44.7%) | 536 (37.6%) |
| 2 Vehicles | 444 (29.1%) | 337 (23.7%) |
| 3 Vehicles | 119 (7.8%) | 346 (24.3%) |
| 4 Vehicles | 248 (16.2%) | 119 (8.4%) |
| 5 or more Vehicles | 11 (0.7%) | 0 (0.0%) |
| Total | 1,527 (100.0%) | 1,424 (100.0%) |
Commute Time in Brooks County
The most frequently occuring commute durations in Brooks County are 5 to 9 minutes (1,237 commuters, 42.8%), 10 to 14 minutes (511 commuters, 17.7%), and less than 5 minutes (371 commuters, 12.8%).
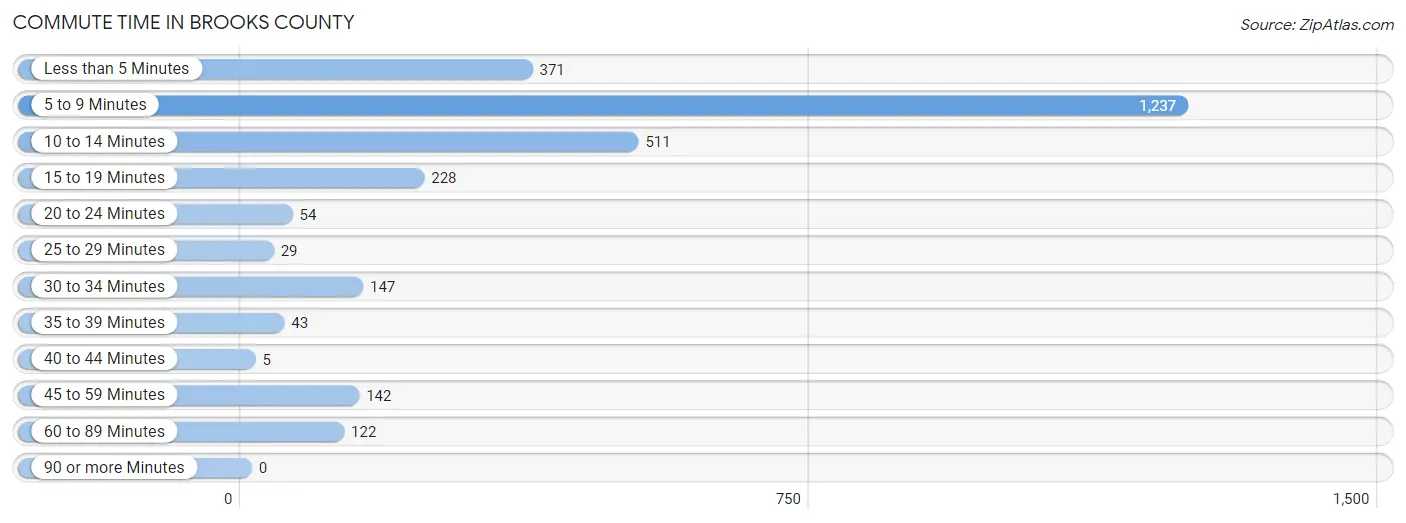
| Commute Time | # Commuters | % Commuters |
| Less than 5 Minutes | 371 | 12.8% |
| 5 to 9 Minutes | 1,237 | 42.8% |
| 10 to 14 Minutes | 511 | 17.7% |
| 15 to 19 Minutes | 228 | 7.9% |
| 20 to 24 Minutes | 54 | 1.9% |
| 25 to 29 Minutes | 29 | 1.0% |
| 30 to 34 Minutes | 147 | 5.1% |
| 35 to 39 Minutes | 43 | 1.5% |
| 40 to 44 Minutes | 5 | 0.2% |
| 45 to 59 Minutes | 142 | 4.9% |
| 60 to 89 Minutes | 122 | 4.2% |
| 90 or more Minutes | 0 | 0.0% |
Commute Time by Sex in Brooks County
The most common commute times in Brooks County are 5 to 9 minutes (622 commuters, 41.3%) for males and 5 to 9 minutes (615 commuters, 44.5%) for females.
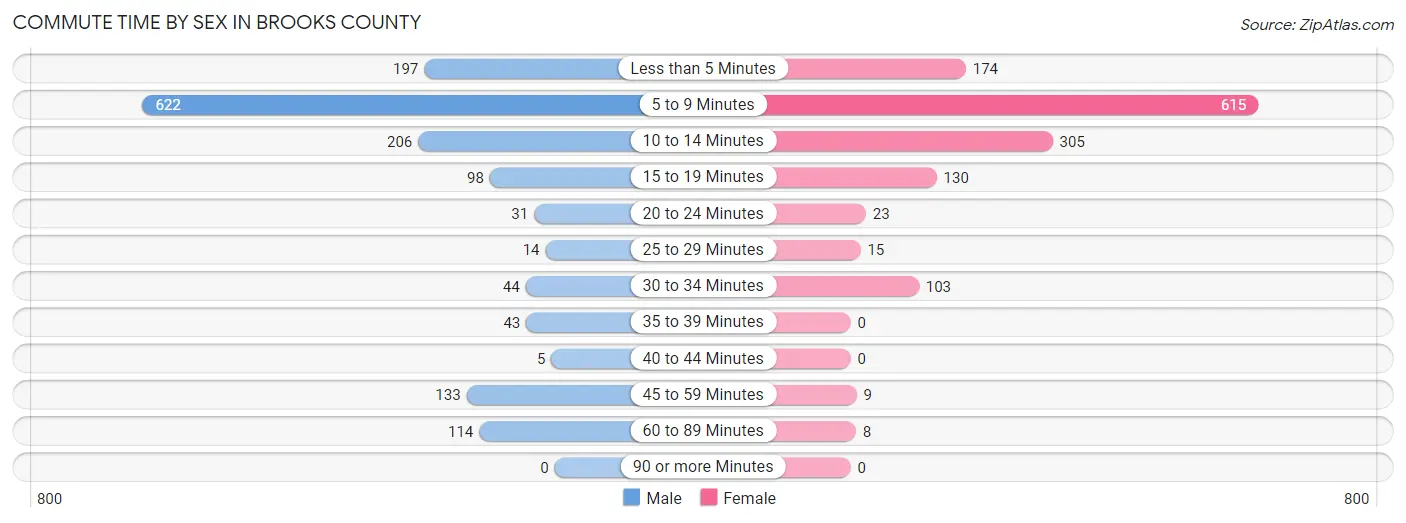
| Commute Time | Male | Female |
| Less than 5 Minutes | 197 (13.1%) | 174 (12.6%) |
| 5 to 9 Minutes | 622 (41.3%) | 615 (44.5%) |
| 10 to 14 Minutes | 206 (13.7%) | 305 (22.1%) |
| 15 to 19 Minutes | 98 (6.5%) | 130 (9.4%) |
| 20 to 24 Minutes | 31 (2.1%) | 23 (1.7%) |
| 25 to 29 Minutes | 14 (0.9%) | 15 (1.1%) |
| 30 to 34 Minutes | 44 (2.9%) | 103 (7.4%) |
| 35 to 39 Minutes | 43 (2.9%) | 0 (0.0%) |
| 40 to 44 Minutes | 5 (0.3%) | 0 (0.0%) |
| 45 to 59 Minutes | 133 (8.8%) | 9 (0.6%) |
| 60 to 89 Minutes | 114 (7.6%) | 8 (0.6%) |
| 90 or more Minutes | 0 (0.0%) | 0 (0.0%) |
Time of Departure to Work by Sex in Brooks County
The most frequent times of departure to work in Brooks County are 9:00 AM to 9:59 AM (219, 14.5%) for males and 8:00 AM to 8:29 AM (479, 34.7%) for females.
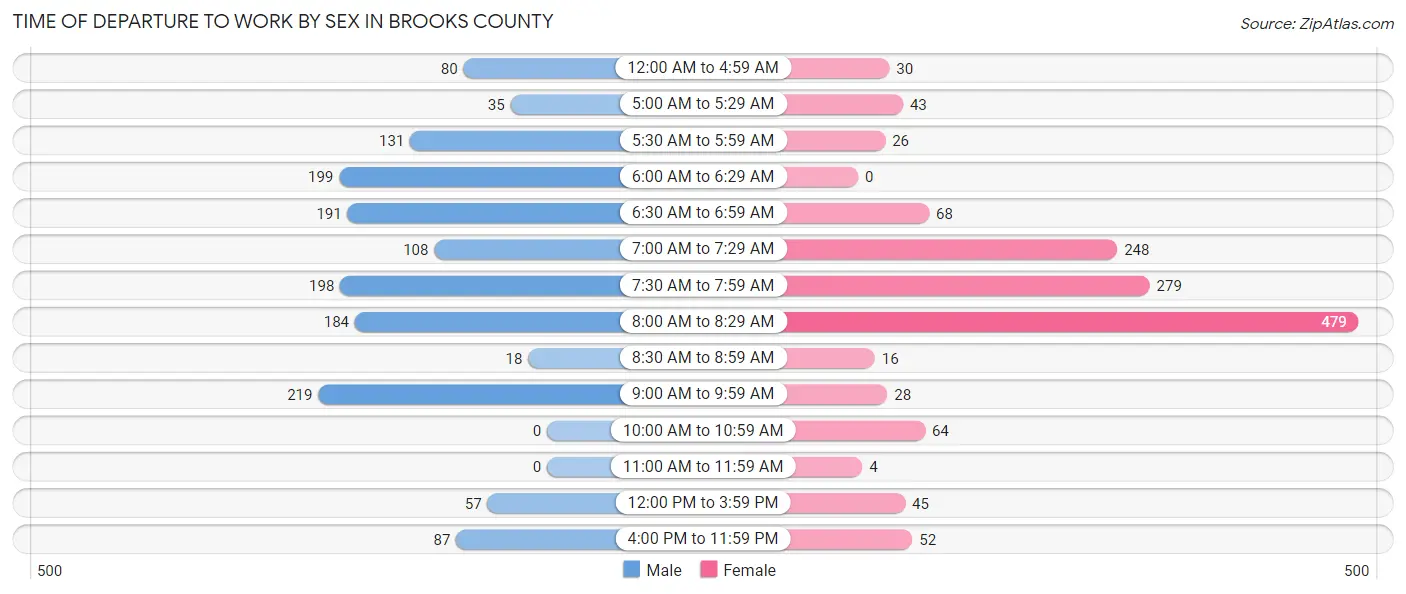
| Time of Departure | Male | Female |
| 12:00 AM to 4:59 AM | 80 (5.3%) | 30 (2.2%) |
| 5:00 AM to 5:29 AM | 35 (2.3%) | 43 (3.1%) |
| 5:30 AM to 5:59 AM | 131 (8.7%) | 26 (1.9%) |
| 6:00 AM to 6:29 AM | 199 (13.2%) | 0 (0.0%) |
| 6:30 AM to 6:59 AM | 191 (12.7%) | 68 (4.9%) |
| 7:00 AM to 7:29 AM | 108 (7.2%) | 248 (17.9%) |
| 7:30 AM to 7:59 AM | 198 (13.1%) | 279 (20.2%) |
| 8:00 AM to 8:29 AM | 184 (12.2%) | 479 (34.7%) |
| 8:30 AM to 8:59 AM | 18 (1.2%) | 16 (1.2%) |
| 9:00 AM to 9:59 AM | 219 (14.5%) | 28 (2.0%) |
| 10:00 AM to 10:59 AM | 0 (0.0%) | 64 (4.6%) |
| 11:00 AM to 11:59 AM | 0 (0.0%) | 4 (0.3%) |
| 12:00 PM to 3:59 PM | 57 (3.8%) | 45 (3.3%) |
| 4:00 PM to 11:59 PM | 87 (5.8%) | 52 (3.8%) |
| Total | 1,507 (100.0%) | 1,382 (100.0%) |
Housing Occupancy in Brooks County
Occupancy by Ownership in Brooks County
Of the total 2,652 dwellings in Brooks County, owner-occupied units account for 1,623 (61.2%), while renter-occupied units make up 1,029 (38.8%).
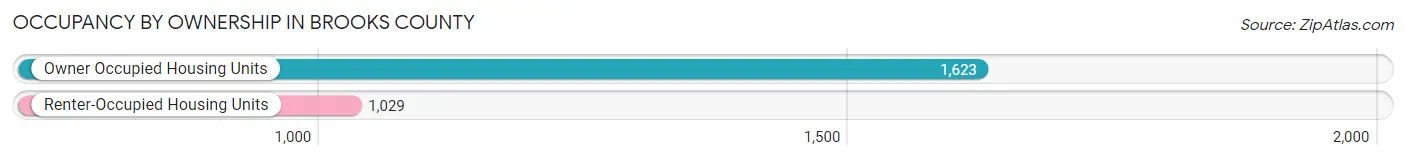
| Occupancy | # Housing Units | % Housing Units |
| Owner Occupied Housing Units | 1,623 | 61.2% |
| Renter-Occupied Housing Units | 1,029 | 38.8% |
| Total Occupied Housing Units | 2,652 | 100.0% |
Occupancy by Household Size in Brooks County
| Household Size | # Housing Units | % Housing Units |
| 1-Person Household | 1,019 | 38.4% |
| 2-Person Household | 833 | 31.4% |
| 3-Person Household | 268 | 10.1% |
| 4+ Person Household | 532 | 20.1% |
| Total Housing Units | 2,652 | 100.0% |
Occupancy by Ownership by Household Size in Brooks County
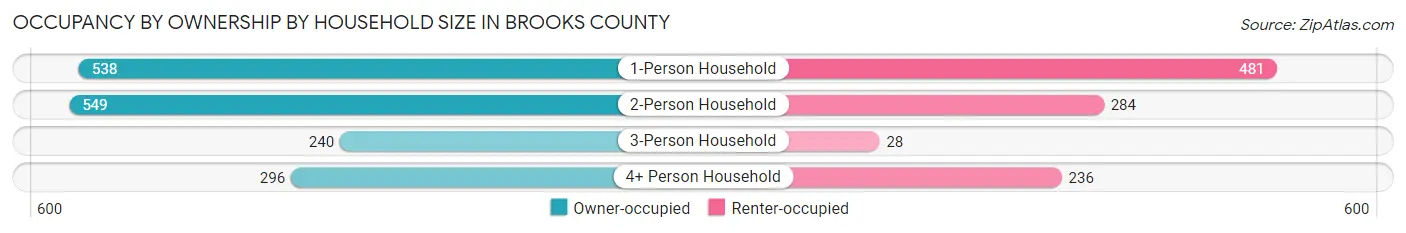
| Household Size | Owner-occupied | Renter-occupied |
| 1-Person Household | 538 (52.8%) | 481 (47.2%) |
| 2-Person Household | 549 (65.9%) | 284 (34.1%) |
| 3-Person Household | 240 (89.5%) | 28 (10.4%) |
| 4+ Person Household | 296 (55.6%) | 236 (44.4%) |
| Total Housing Units | 1,623 (61.2%) | 1,029 (38.8%) |
Occupancy by Educational Attainment in Brooks County
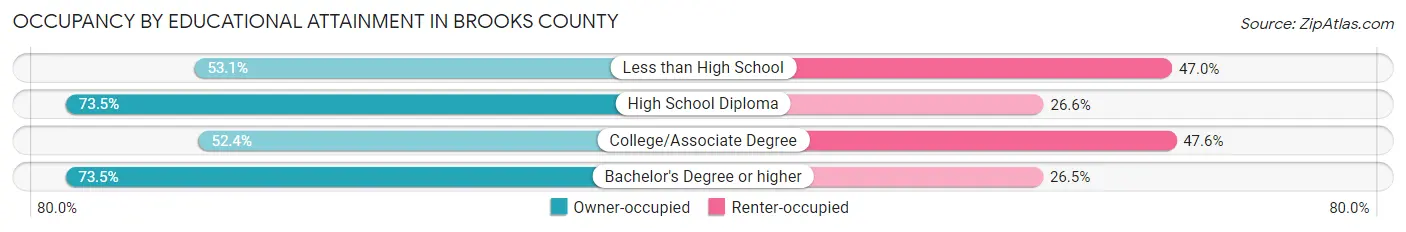
| Household Size | Owner-occupied | Renter-occupied |
| Less than High School | 357 (53.0%) | 316 (46.9%) |
| High School Diploma | 509 (73.5%) | 184 (26.6%) |
| College/Associate Degree | 468 (52.4%) | 425 (47.6%) |
| Bachelor's Degree or higher | 289 (73.5%) | 104 (26.5%) |
Occupancy by Age of Householder in Brooks County
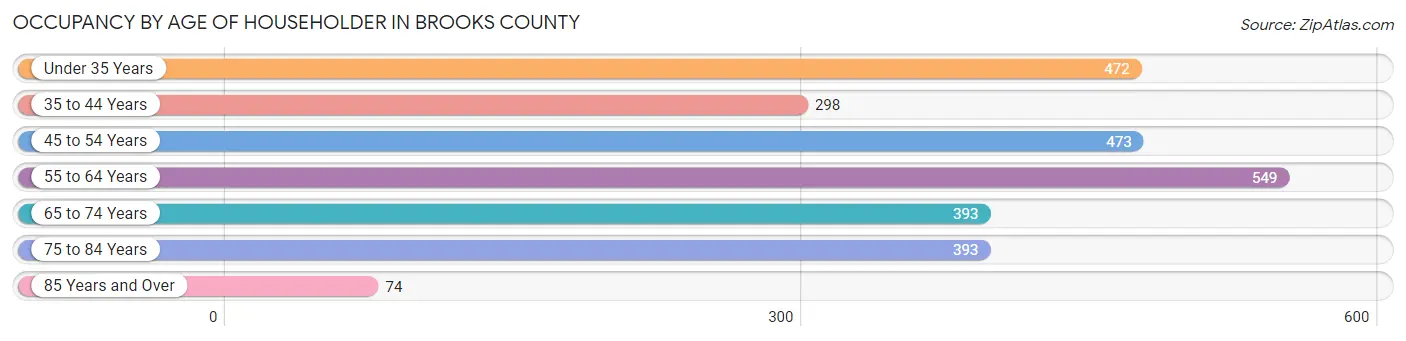
| Age Bracket | # Households | % Households |
| Under 35 Years | 472 | 17.8% |
| 35 to 44 Years | 298 | 11.2% |
| 45 to 54 Years | 473 | 17.8% |
| 55 to 64 Years | 549 | 20.7% |
| 65 to 74 Years | 393 | 14.8% |
| 75 to 84 Years | 393 | 14.8% |
| 85 Years and Over | 74 | 2.8% |
| Total | 2,652 | 100.0% |
Housing Finances in Brooks County
Median Income by Occupancy in Brooks County
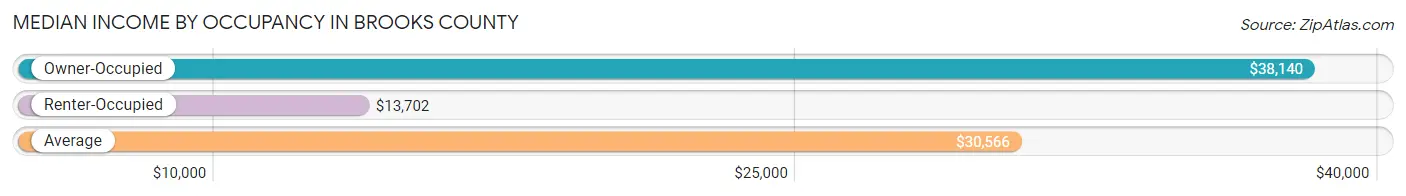
| Occupancy Type | # Households | Median Income |
| Owner-Occupied | 1,623 (61.2%) | $38,140 |
| Renter-Occupied | 1,029 (38.8%) | $13,702 |
| Average | 2,652 (100.0%) | $30,566 |
Occupancy by Householder Income Bracket in Brooks County
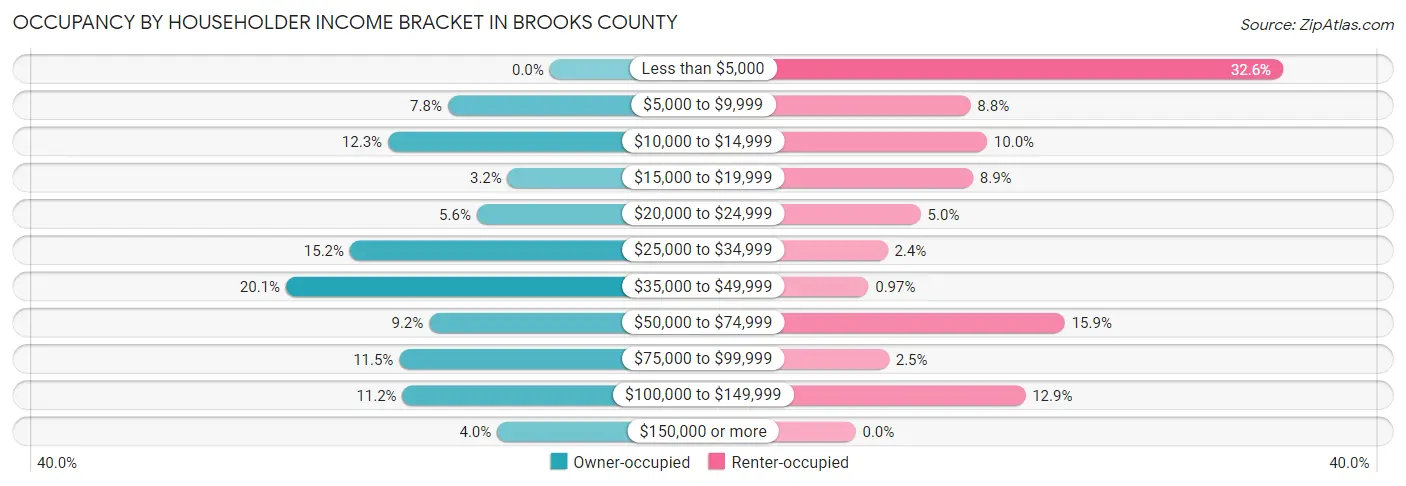
| Income Bracket | Owner-occupied | Renter-occupied |
| Less than $5,000 | 0 (0.0%) | 335 (32.6%) |
| $5,000 to $9,999 | 126 (7.8%) | 90 (8.7%) |
| $10,000 to $14,999 | 200 (12.3%) | 103 (10.0%) |
| $15,000 to $19,999 | 52 (3.2%) | 92 (8.9%) |
| $20,000 to $24,999 | 90 (5.6%) | 51 (5.0%) |
| $25,000 to $34,999 | 247 (15.2%) | 25 (2.4%) |
| $35,000 to $49,999 | 326 (20.1%) | 10 (1.0%) |
| $50,000 to $74,999 | 149 (9.2%) | 164 (15.9%) |
| $75,000 to $99,999 | 186 (11.5%) | 26 (2.5%) |
| $100,000 to $149,999 | 182 (11.2%) | 133 (12.9%) |
| $150,000 or more | 65 (4.0%) | 0 (0.0%) |
| Total | 1,623 (100.0%) | 1,029 (100.0%) |
Monthly Housing Cost Tiers in Brooks County
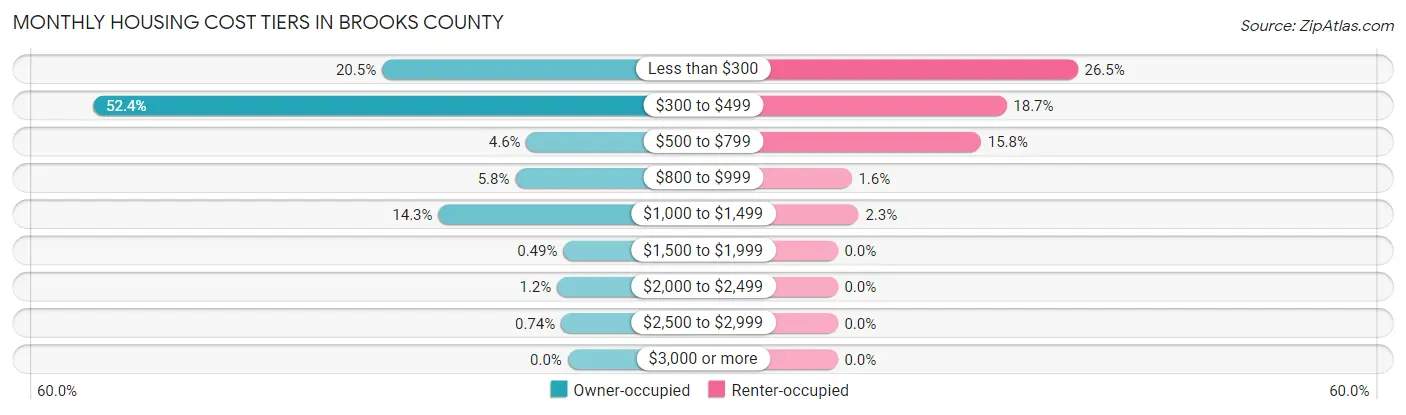
| Monthly Cost | Owner-occupied | Renter-occupied |
| Less than $300 | 333 (20.5%) | 273 (26.5%) |
| $300 to $499 | 851 (52.4%) | 192 (18.7%) |
| $500 to $799 | 74 (4.6%) | 163 (15.8%) |
| $800 to $999 | 94 (5.8%) | 16 (1.5%) |
| $1,000 to $1,499 | 232 (14.3%) | 24 (2.3%) |
| $1,500 to $1,999 | 8 (0.5%) | 0 (0.0%) |
| $2,000 to $2,499 | 19 (1.2%) | 0 (0.0%) |
| $2,500 to $2,999 | 12 (0.7%) | 0 (0.0%) |
| $3,000 or more | 0 (0.0%) | 0 (0.0%) |
| Total | 1,623 (100.0%) | 1,029 (100.0%) |
Physical Housing Characteristics in Brooks County
Housing Structures in Brooks County
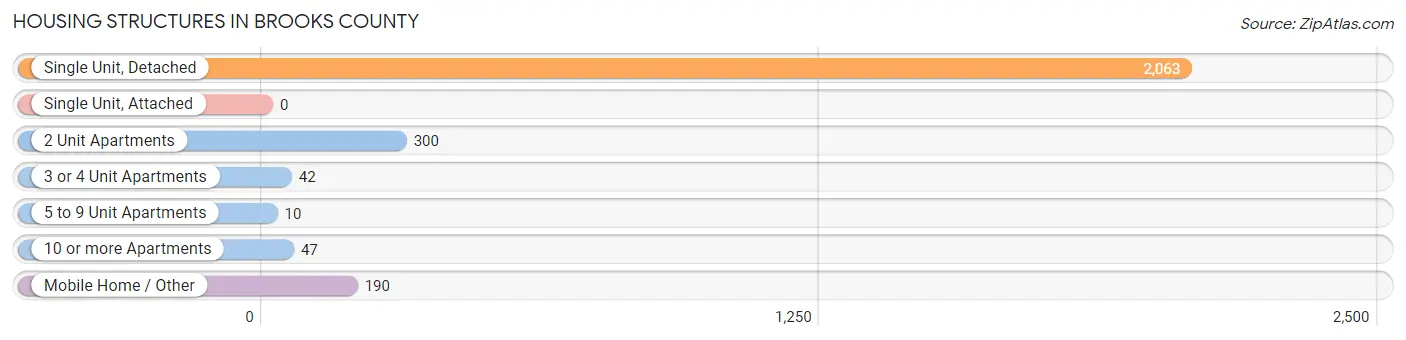
| Structure Type | # Housing Units | % Housing Units |
| Single Unit, Detached | 2,063 | 77.8% |
| Single Unit, Attached | 0 | 0.0% |
| 2 Unit Apartments | 300 | 11.3% |
| 3 or 4 Unit Apartments | 42 | 1.6% |
| 5 to 9 Unit Apartments | 10 | 0.4% |
| 10 or more Apartments | 47 | 1.8% |
| Mobile Home / Other | 190 | 7.2% |
| Total | 2,652 | 100.0% |
Housing Structures by Occupancy in Brooks County
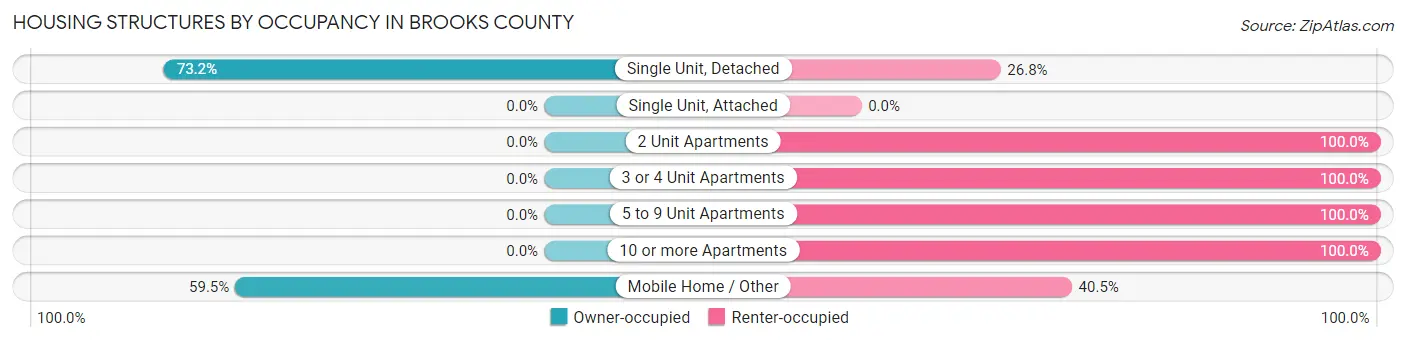
| Structure Type | Owner-occupied | Renter-occupied |
| Single Unit, Detached | 1,510 (73.2%) | 553 (26.8%) |
| Single Unit, Attached | 0 (0.0%) | 0 (0.0%) |
| 2 Unit Apartments | 0 (0.0%) | 300 (100.0%) |
| 3 or 4 Unit Apartments | 0 (0.0%) | 42 (100.0%) |
| 5 to 9 Unit Apartments | 0 (0.0%) | 10 (100.0%) |
| 10 or more Apartments | 0 (0.0%) | 47 (100.0%) |
| Mobile Home / Other | 113 (59.5%) | 77 (40.5%) |
| Total | 1,623 (61.2%) | 1,029 (38.8%) |
Housing Structures by Number of Rooms in Brooks County
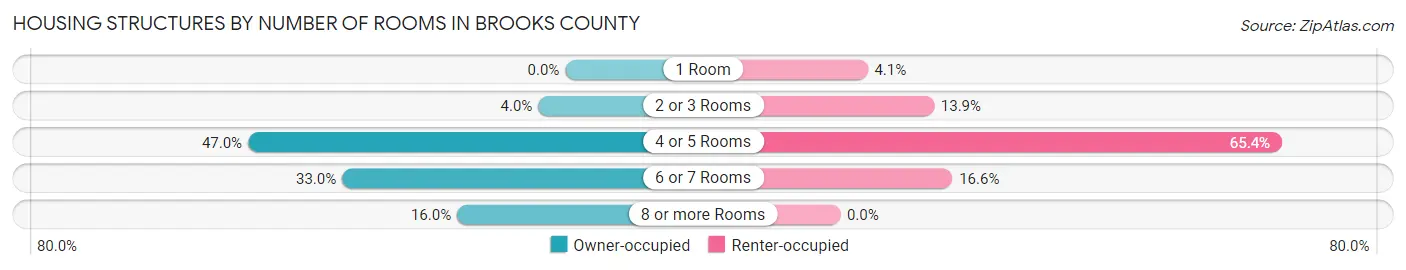
| Number of Rooms | Owner-occupied | Renter-occupied |
| 1 Room | 0 (0.0%) | 42 (4.1%) |
| 2 or 3 Rooms | 65 (4.0%) | 143 (13.9%) |
| 4 or 5 Rooms | 762 (46.9%) | 673 (65.4%) |
| 6 or 7 Rooms | 536 (33.0%) | 171 (16.6%) |
| 8 or more Rooms | 260 (16.0%) | 0 (0.0%) |
| Total | 1,623 (100.0%) | 1,029 (100.0%) |
Housing Structure by Heating Type in Brooks County
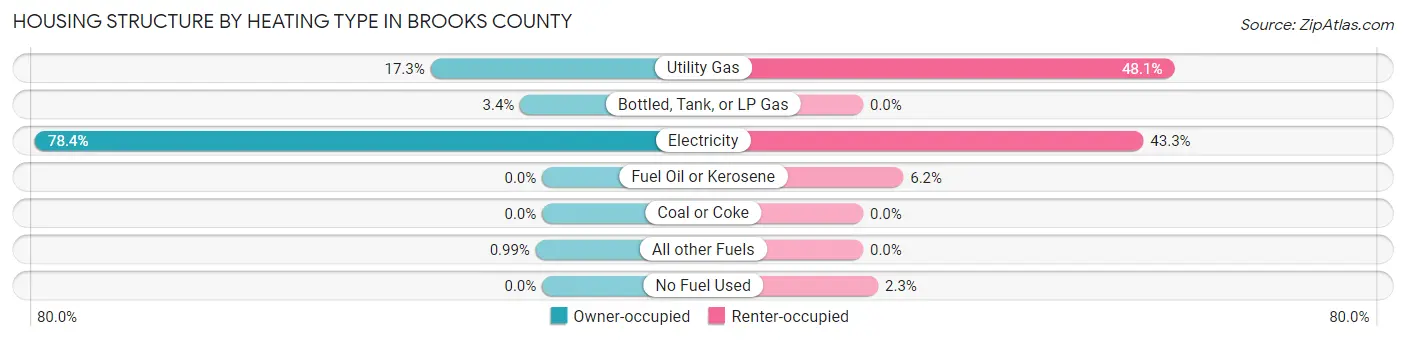
| Heating Type | Owner-occupied | Renter-occupied |
| Utility Gas | 280 (17.2%) | 495 (48.1%) |
| Bottled, Tank, or LP Gas | 55 (3.4%) | 0 (0.0%) |
| Electricity | 1,272 (78.4%) | 446 (43.3%) |
| Fuel Oil or Kerosene | 0 (0.0%) | 64 (6.2%) |
| Coal or Coke | 0 (0.0%) | 0 (0.0%) |
| All other Fuels | 16 (1.0%) | 0 (0.0%) |
| No Fuel Used | 0 (0.0%) | 24 (2.3%) |
| Total | 1,623 (100.0%) | 1,029 (100.0%) |
Household Vehicle Usage in Brooks County
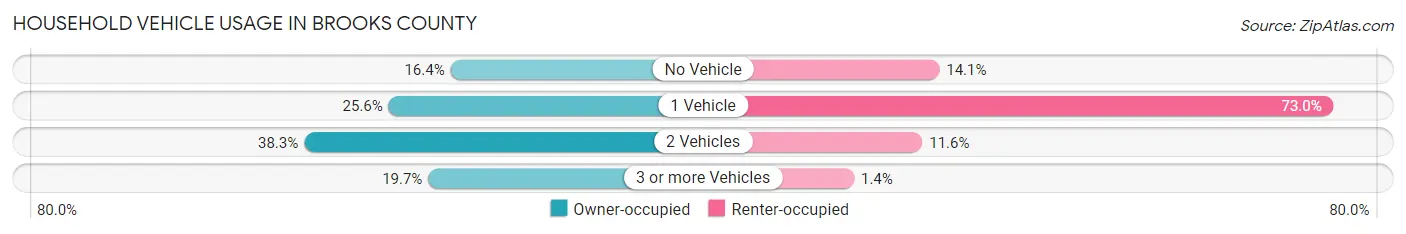
| Vehicles per Household | Owner-occupied | Renter-occupied |
| No Vehicle | 266 (16.4%) | 145 (14.1%) |
| 1 Vehicle | 416 (25.6%) | 751 (73.0%) |
| 2 Vehicles | 621 (38.3%) | 119 (11.6%) |
| 3 or more Vehicles | 320 (19.7%) | 14 (1.4%) |
| Total | 1,623 (100.0%) | 1,029 (100.0%) |
Real Estate & Mortgages in Brooks County
Real Estate and Mortgage Overview in Brooks County
| Characteristic | Without Mortgage | With Mortgage |
| Housing Units | 1,306 | 317 |
| Median Property Value | $61,500 | $105,100 |
| Median Household Income | $35,705 | $14 |
| Monthly Housing Costs | $382 | $0 |
| Real Estate Taxes | $684 | $0 |
Property Value by Mortgage Status in Brooks County
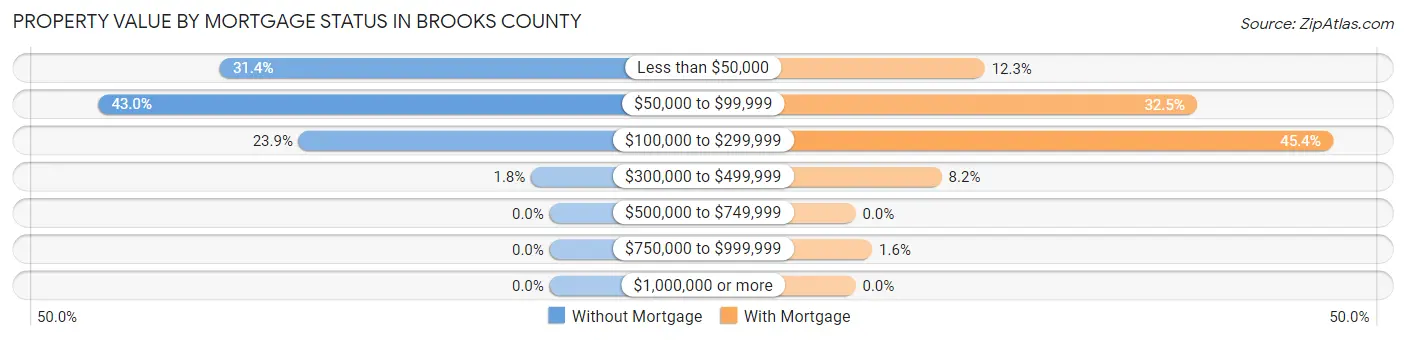
| Property Value | Without Mortgage | With Mortgage |
| Less than $50,000 | 410 (31.4%) | 39 (12.3%) |
| $50,000 to $99,999 | 561 (43.0%) | 103 (32.5%) |
| $100,000 to $299,999 | 312 (23.9%) | 144 (45.4%) |
| $300,000 to $499,999 | 23 (1.8%) | 26 (8.2%) |
| $500,000 to $749,999 | 0 (0.0%) | 0 (0.0%) |
| $750,000 to $999,999 | 0 (0.0%) | 5 (1.6%) |
| $1,000,000 or more | 0 (0.0%) | 0 (0.0%) |
| Total | 1,306 (100.0%) | 317 (100.0%) |
Household Income by Mortgage Status in Brooks County
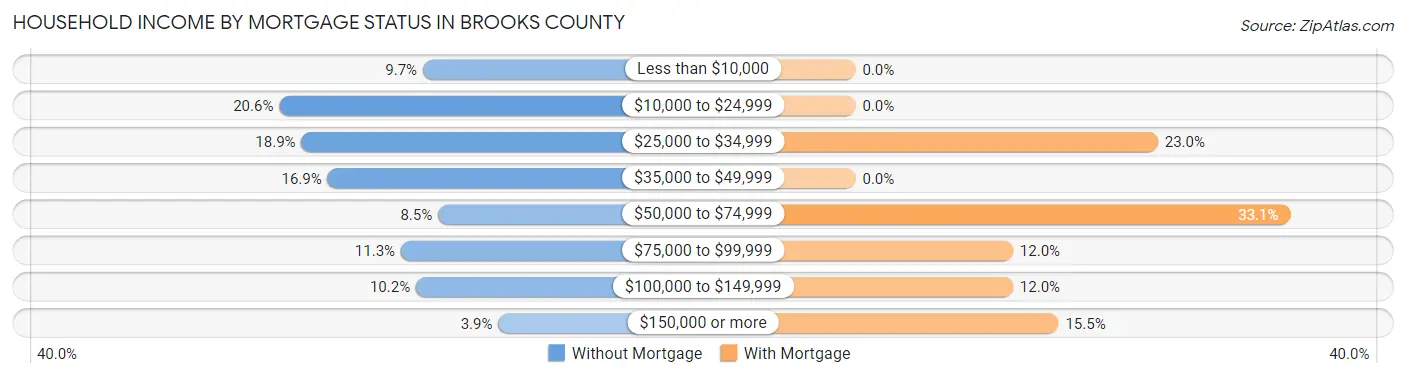
| Household Income | Without Mortgage | With Mortgage |
| Less than $10,000 | 126 (9.7%) | 0 (0.0%) |
| $10,000 to $24,999 | 269 (20.6%) | 0 (0.0%) |
| $25,000 to $34,999 | 247 (18.9%) | 73 (23.0%) |
| $35,000 to $49,999 | 221 (16.9%) | 0 (0.0%) |
| $50,000 to $74,999 | 111 (8.5%) | 105 (33.1%) |
| $75,000 to $99,999 | 148 (11.3%) | 38 (12.0%) |
| $100,000 to $149,999 | 133 (10.2%) | 38 (12.0%) |
| $150,000 or more | 51 (3.9%) | 49 (15.5%) |
| Total | 1,306 (100.0%) | 317 (100.0%) |
Property Value to Household Income Ratio in Brooks County
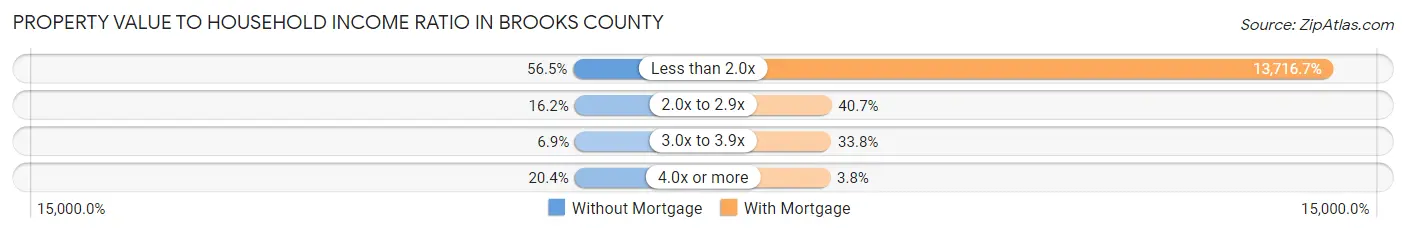
| Value-to-Income Ratio | Without Mortgage | With Mortgage |
| Less than 2.0x | 738 (56.5%) | 43,482 (13,716.7%) |
| 2.0x to 2.9x | 211 (16.2%) | 129 (40.7%) |
| 3.0x to 3.9x | 90 (6.9%) | 107 (33.8%) |
| 4.0x or more | 267 (20.4%) | 12 (3.8%) |
| Total | 1,306 (100.0%) | 317 (100.0%) |
Real Estate Taxes by Mortgage Status in Brooks County
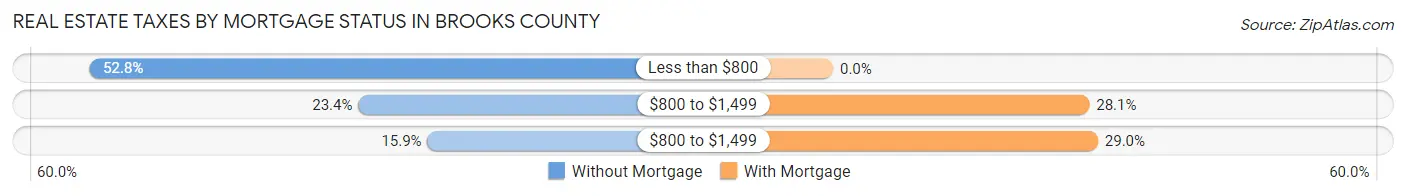
| Property Taxes | Without Mortgage | With Mortgage |
| Less than $800 | 690 (52.8%) | 0 (0.0%) |
| $800 to $1,499 | 306 (23.4%) | 89 (28.1%) |
| $800 to $1,499 | 207 (15.9%) | 92 (29.0%) |
| Total | 1,306 (100.0%) | 317 (100.0%) |
Health & Disability in Brooks County
Health Insurance Coverage by Age in Brooks County
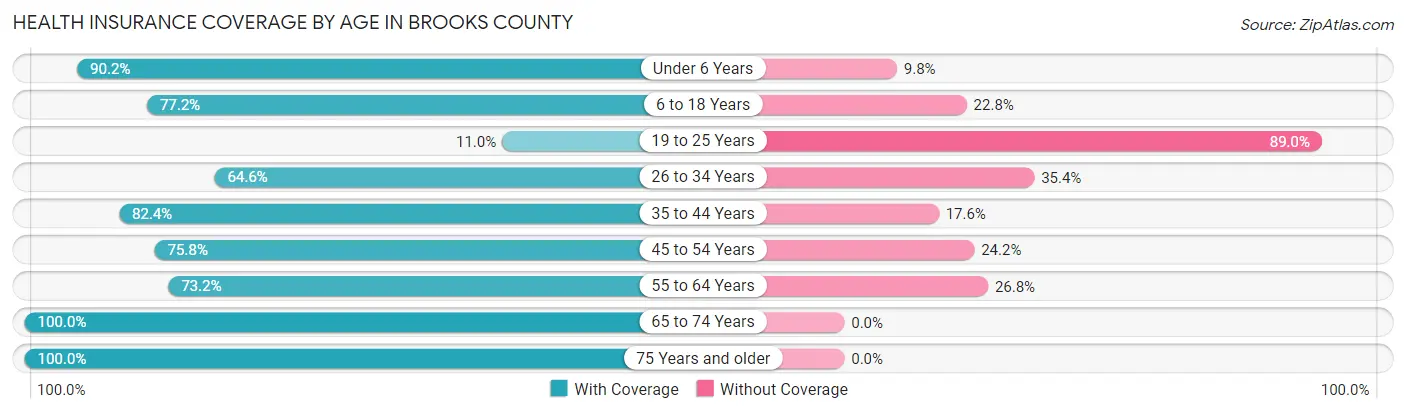
| Age Bracket | With Coverage | Without Coverage |
| Under 6 Years | 276 (90.2%) | 30 (9.8%) |
| 6 to 18 Years | 1,025 (77.2%) | 303 (22.8%) |
| 19 to 25 Years | 65 (11.0%) | 528 (89.0%) |
| 26 to 34 Years | 363 (64.6%) | 199 (35.4%) |
| 35 to 44 Years | 660 (82.4%) | 141 (17.6%) |
| 45 to 54 Years | 541 (75.8%) | 173 (24.2%) |
| 55 to 64 Years | 645 (73.2%) | 236 (26.8%) |
| 65 to 74 Years | 769 (100.0%) | 0 (0.0%) |
| 75 Years and older | 597 (100.0%) | 0 (0.0%) |
| Total | 4,941 (75.4%) | 1,610 (24.6%) |
Health Insurance Coverage by Citizenship Status in Brooks County
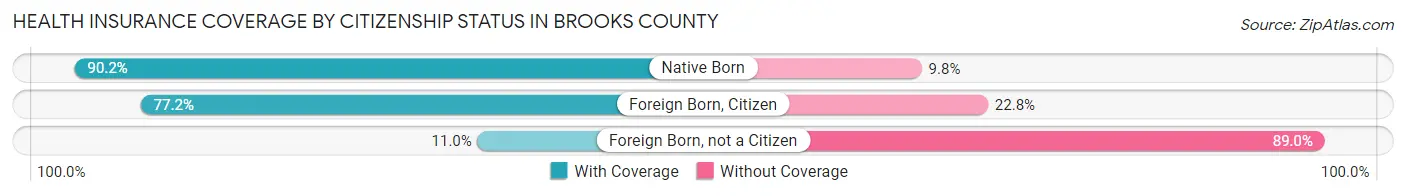
| Citizenship Status | With Coverage | Without Coverage |
| Native Born | 276 (90.2%) | 30 (9.8%) |
| Foreign Born, Citizen | 1,025 (77.2%) | 303 (22.8%) |
| Foreign Born, not a Citizen | 65 (11.0%) | 528 (89.0%) |
Health Insurance Coverage by Household Income in Brooks County
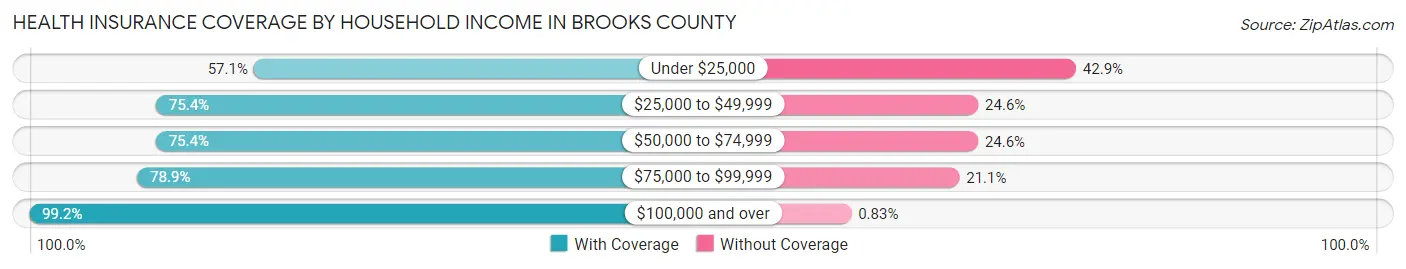
| Household Income | With Coverage | Without Coverage |
| Under $25,000 | 1,162 (57.1%) | 874 (42.9%) |
| $25,000 to $49,999 | 1,026 (75.4%) | 335 (24.6%) |
| $50,000 to $74,999 | 574 (75.4%) | 187 (24.6%) |
| $75,000 to $99,999 | 749 (78.9%) | 200 (21.1%) |
| $100,000 and over | 1,430 (99.2%) | 12 (0.8%) |
Public vs Private Health Insurance Coverage by Age in Brooks County
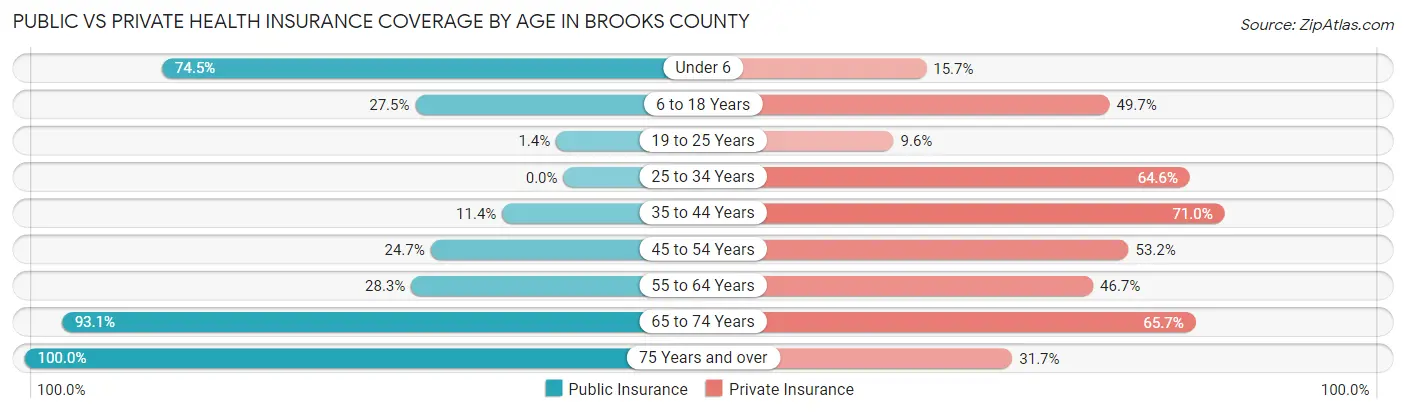
| Age Bracket | Public Insurance | Private Insurance |
| Under 6 | 228 (74.5%) | 48 (15.7%) |
| 6 to 18 Years | 365 (27.5%) | 660 (49.7%) |
| 19 to 25 Years | 8 (1.3%) | 57 (9.6%) |
| 25 to 34 Years | 0 (0.0%) | 363 (64.6%) |
| 35 to 44 Years | 91 (11.4%) | 569 (71.0%) |
| 45 to 54 Years | 176 (24.6%) | 380 (53.2%) |
| 55 to 64 Years | 249 (28.3%) | 411 (46.7%) |
| 65 to 74 Years | 716 (93.1%) | 505 (65.7%) |
| 75 Years and over | 597 (100.0%) | 189 (31.7%) |
| Total | 2,430 (37.1%) | 3,182 (48.6%) |
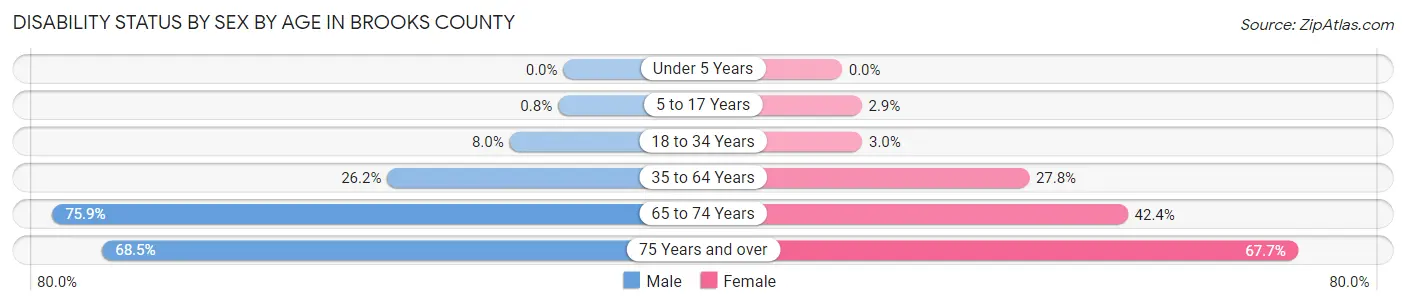
Disability Status by Sex by Age in Brooks County
| Age Bracket | Male | Female |
| Under 5 Years | 0 (0.0%) | 0 (0.0%) |
| 5 to 17 Years | 5 (0.8%) | 22 (2.9%) |
| 18 to 34 Years | 57 (8.0%) | 15 (3.0%) |
| 35 to 64 Years | 284 (26.2%) | 364 (27.8%) |
| 65 to 74 Years | 192 (75.9%) | 219 (42.4%) |
| 75 Years and over | 178 (68.5%) | 228 (67.7%) |
Disability Class by Sex by Age in Brooks County
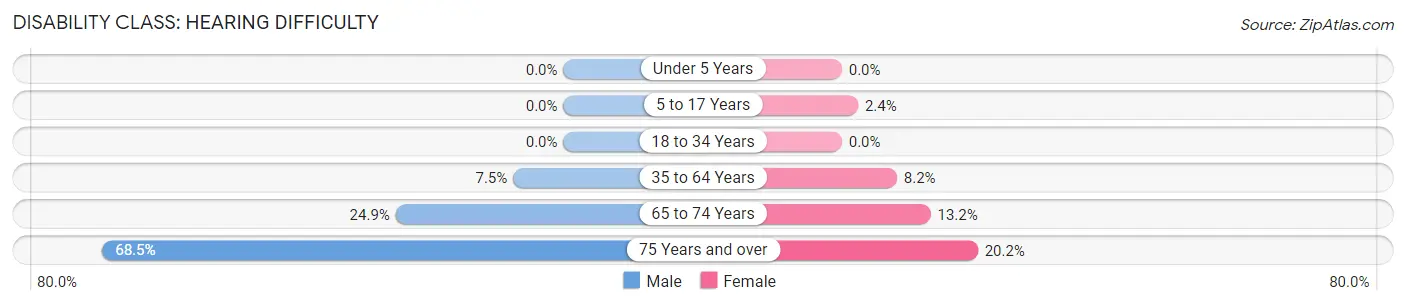
Disability Class: Hearing Difficulty
| Age Bracket | Male | Female |
| Under 5 Years | 0 (0.0%) | 0 (0.0%) |
| 5 to 17 Years | 0 (0.0%) | 18 (2.4%) |
| 18 to 34 Years | 0 (0.0%) | 0 (0.0%) |
| 35 to 64 Years | 81 (7.5%) | 107 (8.2%) |
| 65 to 74 Years | 63 (24.9%) | 68 (13.2%) |
| 75 Years and over | 178 (68.5%) | 68 (20.2%) |
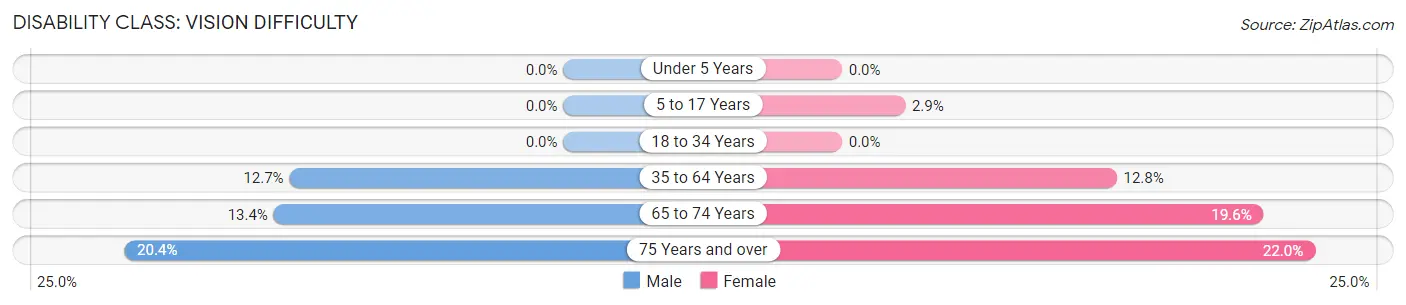
Disability Class: Vision Difficulty
| Age Bracket | Male | Female |
| Under 5 Years | 0 (0.0%) | 0 (0.0%) |
| 5 to 17 Years | 0 (0.0%) | 22 (2.9%) |
| 18 to 34 Years | 0 (0.0%) | 0 (0.0%) |
| 35 to 64 Years | 138 (12.7%) | 167 (12.8%) |
| 65 to 74 Years | 34 (13.4%) | 101 (19.6%) |
| 75 Years and over | 53 (20.4%) | 74 (22.0%) |
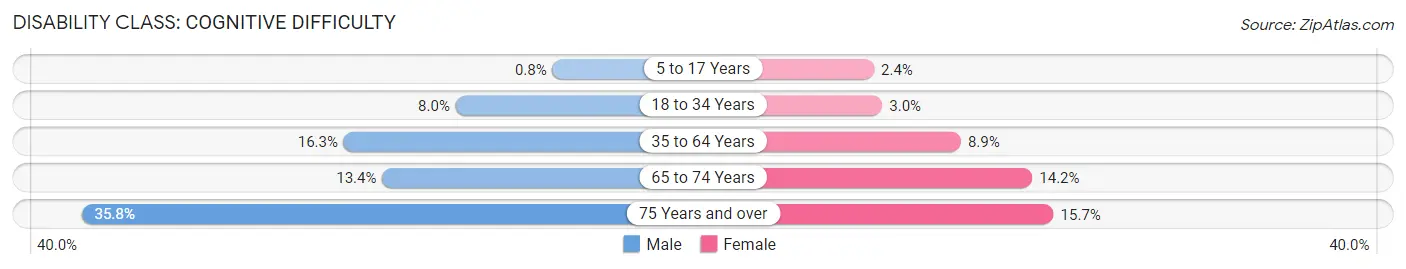
Disability Class: Cognitive Difficulty
| Age Bracket | Male | Female |
| 5 to 17 Years | 5 (0.8%) | 18 (2.4%) |
| 18 to 34 Years | 57 (8.0%) | 15 (3.0%) |
| 35 to 64 Years | 177 (16.3%) | 116 (8.8%) |
| 65 to 74 Years | 34 (13.4%) | 73 (14.1%) |
| 75 Years and over | 93 (35.8%) | 53 (15.7%) |
Disability Class: Ambulatory Difficulty
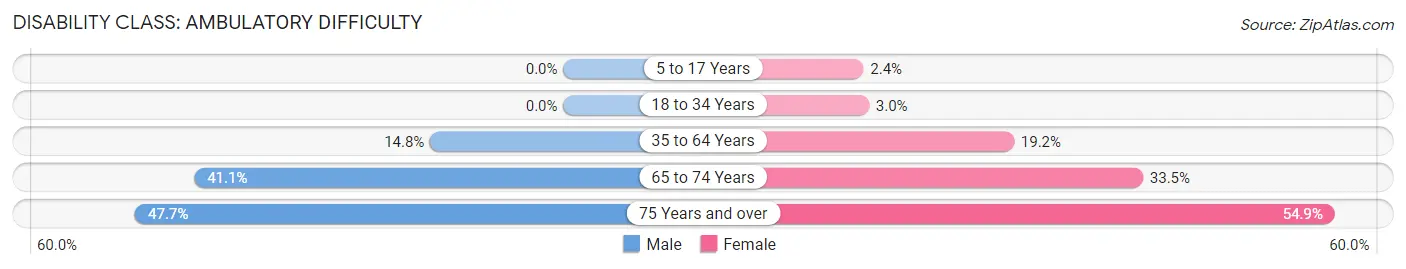
| Age Bracket | Male | Female |
| 5 to 17 Years | 0 (0.0%) | 18 (2.4%) |
| 18 to 34 Years | 0 (0.0%) | 15 (3.0%) |
| 35 to 64 Years | 161 (14.8%) | 251 (19.2%) |
| 65 to 74 Years | 104 (41.1%) | 173 (33.5%) |
| 75 Years and over | 124 (47.7%) | 185 (54.9%) |
Disability Class: Self-Care Difficulty
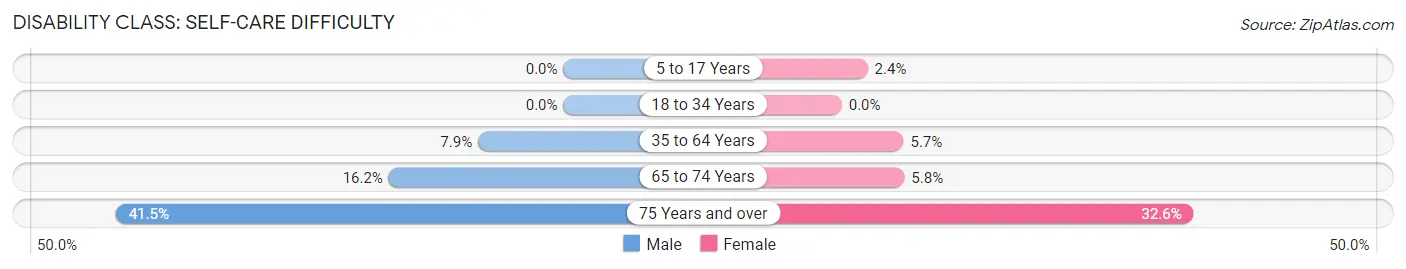
| Age Bracket | Male | Female |
| 5 to 17 Years | 0 (0.0%) | 18 (2.4%) |
| 18 to 34 Years | 0 (0.0%) | 0 (0.0%) |
| 35 to 64 Years | 86 (7.9%) | 75 (5.7%) |
| 65 to 74 Years | 41 (16.2%) | 30 (5.8%) |
| 75 Years and over | 108 (41.5%) | 110 (32.6%) |
Technology Access in Brooks County
Computing Device Access in Brooks County
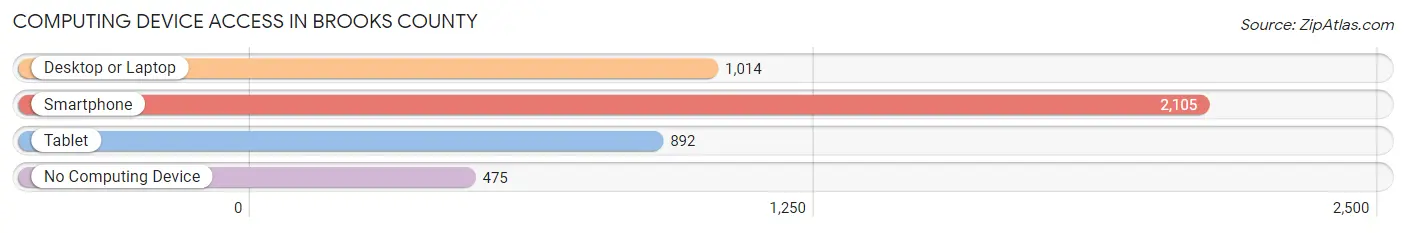
| Device Type | # Households | % Households |
| Desktop or Laptop | 1,014 | 38.2% |
| Smartphone | 2,105 | 79.4% |
| Tablet | 892 | 33.6% |
| No Computing Device | 475 | 17.9% |
| Total | 2,652 | 100.0% |
Internet Access in Brooks County
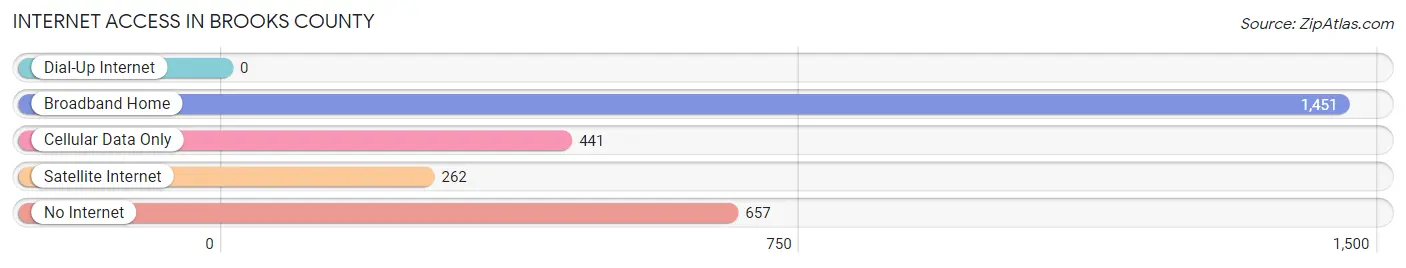
| Internet Type | # Households | % Households |
| Dial-Up Internet | 0 | 0.0% |
| Broadband Home | 1,451 | 54.7% |
| Cellular Data Only | 441 | 16.6% |
| Satellite Internet | 262 | 9.9% |
| No Internet | 657 | 24.8% |
| Total | 2,652 | 100.0% |
Brooks County Summary
Brooks County is located in the southern part of Texas, in the Coastal Plains region of the state. It is bordered by Jim Wells County to the north, Kenedy County to the east, Jim Hogg County to the south, and Duval County to the west. The county seat is Falfurrias, and the county has a total area of 1,180 square miles. As of the 2010 census, the population was 7,223, making it one of the least populous counties in Texas.
The geography of Brooks County is mostly flat, with some rolling hills in the northern part of the county. The terrain is mostly covered in grasslands, with some areas of brush and mesquite. The climate is semi-arid, with hot summers and mild winters. The average annual precipitation is about 20 inches.
The economy of Brooks County is largely based on agriculture. The main crops grown in the county are cotton, corn, sorghum, and wheat. Livestock production is also important, with cattle, sheep, and goats being the main animals raised. The county also has some oil and gas production, as well as some manufacturing.
Demographically, Brooks County is predominantly Hispanic, with about 85% of the population identifying as such. The median household income is about $30,000, and the poverty rate is about 25%. The unemployment rate is about 8%, which is slightly higher than the state average.
Education is provided by the Brooks County Independent School District, which serves the county. There are three elementary schools, one middle school, and one high school. The county also has a branch of the South Texas College, which offers a variety of courses and programs.
Brooks County has a rich history, dating back to the early 1800s when it was part of the Spanish Empire. The county was officially established in 1858, and was named after James Abijah Brooks, a Texas Ranger who fought in the Battle of San Jacinto. The county has a long history of ranching and farming, and was an important stop on the Chisholm Trail.
Today, Brooks County is a rural county with a small population. It is largely agricultural, with some oil and gas production, and some manufacturing. The county is predominantly Hispanic, and the median household income is about $30,000. Education is provided by the Brooks County Independent School District, and the county has a branch of the South Texas College. Brooks County has a rich history, and is an important part of the state of Texas.
Common Questions
What is Per Capita Income in Brooks County?
Per Capita income in Brooks County is $20,308.
What is the Median Family Income in Brooks County?
Median Family Income in Brooks County is $38,438.
What is the Median Household income in Brooks County?
Median Household Income in Brooks County is $30,566.
What is Income or Wage Gap in Brooks County?
Income or Wage Gap in Brooks County is 6.4%.
Women in Brooks County earn 93.6 cents for every dollar earned by a man.
What is Inequality or Gini Index in Brooks County?
Inequality or Gini Index in Brooks County is 0.50.
What is the Total Population of Brooks County?
Total Population of Brooks County is 7,059.
What is the Total Male Population of Brooks County?
Total Male Population of Brooks County is 3,385.
What is the Total Female Population of Brooks County?
Total Female Population of Brooks County is 3,674.
What is the Ratio of Males per 100 Females in Brooks County?
There are 92.13 Males per 100 Females in Brooks County.
What is the Ratio of Females per 100 Males in Brooks County?
There are 108.54 Females per 100 Males in Brooks County.
What is the Median Population Age in Brooks County?
Median Population Age in Brooks County is 38.3 Years.
What is the Average Family Size in Brooks County
Average Family Size in Brooks County is 3.4 People.
What is the Average Household Size in Brooks County
Average Household Size in Brooks County is 2.5 People.
How Large is the Labor Force in Brooks County?
There are 3,073 People in the Labor Forcein in Brooks County.
What is the Percentage of People in the Labor Force in Brooks County?
53.4% of People are in the Labor Force in Brooks County.
What is the Unemployment Rate in Brooks County?
Unemployment Rate in Brooks County is 2.1%.