Briscoe County, TX Map & Demographics
Briscoe County Map
Briscoe County Overview
$29,721
PER CAPITA INCOME
$50,000
AVG FAMILY INCOME
$35,446
AVG HOUSEHOLD INCOME
0.54
INEQUALITY / GINI INDEX
1,290
TOTAL POPULATION
710
MALE POPULATION
580
FEMALE POPULATION
122.41
MALES / 100 FEMALES
81.69
FEMALES / 100 MALES
49.7
MEDIAN AGE
2.8
AVG FAMILY SIZE
2.2
AVG HOUSEHOLD SIZE
513
LABOR FORCE [ PEOPLE ]
47.7%
PERCENT IN LABOR FORCE
3.3%
UNEMPLOYMENT RATE
Briscoe County Area Codes
Income in Briscoe County
Income Overview in Briscoe County
Per Capita Income in Briscoe County is $29,721, while median incomes of families and households are $50,000 and $35,446 respectively.
| Characteristic | Number | Measure |
| Per Capita Income | 1,290 | $29,721 |
| Median Family Income | 324 | $50,000 |
| Mean Family Income | 324 | $80,783 |
| Median Household Income | 581 | $35,446 |
| Mean Household Income | 581 | $58,194 |
| Income Deficit | 324 | $0 |
| Wage / Income Gap (%) | 1,290 | 0.00% |
| Wage / Income Gap ($) | 1,290 | 100.00¢ per $1 |
| Gini / Inequality Index | 1,290 | 0.54 |
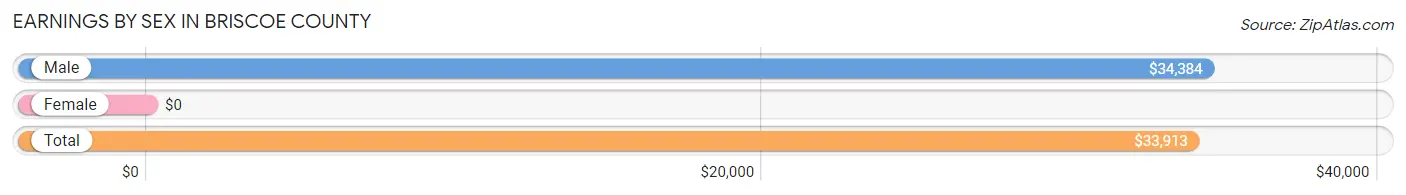
Earnings by Sex in Briscoe County
| Sex | Number | Average Earnings |
| Male | 347 (65.2%) | $34,384 |
| Female | 185 (34.8%) | $0 |
| Total | 532 (100.0%) | $33,913 |
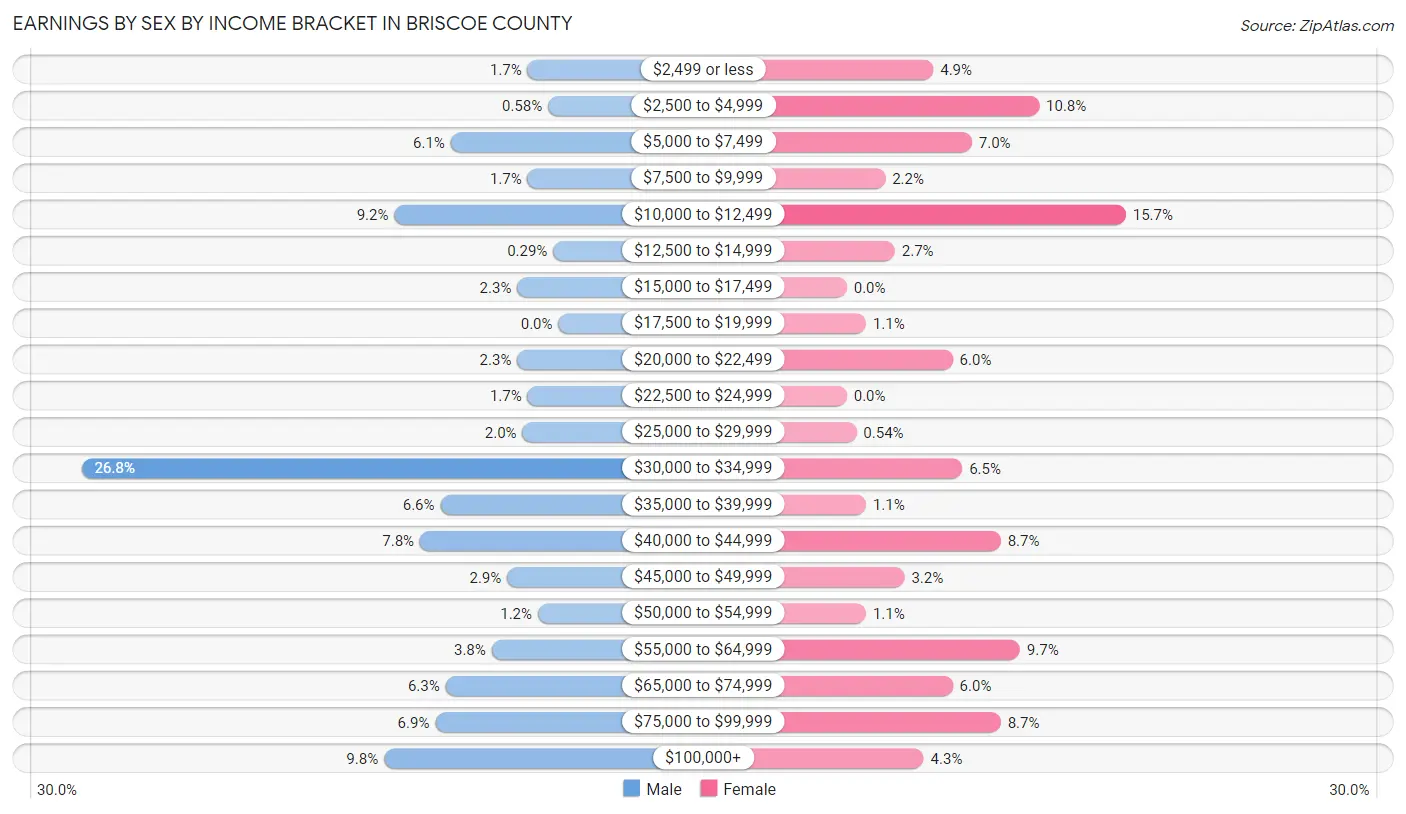
Earnings by Sex by Income Bracket in Briscoe County
The most common earnings brackets in Briscoe County are $30,000 to $34,999 for men (93 | 26.8%) and $10,000 to $12,499 for women (29 | 15.7%).
| Income | Male | Female |
| $2,499 or less | 6 (1.7%) | 9 (4.9%) |
| $2,500 to $4,999 | 2 (0.6%) | 20 (10.8%) |
| $5,000 to $7,499 | 21 (6.0%) | 13 (7.0%) |
| $7,500 to $9,999 | 6 (1.7%) | 4 (2.2%) |
| $10,000 to $12,499 | 32 (9.2%) | 29 (15.7%) |
| $12,500 to $14,999 | 1 (0.3%) | 5 (2.7%) |
| $15,000 to $17,499 | 8 (2.3%) | 0 (0.0%) |
| $17,500 to $19,999 | 0 (0.0%) | 2 (1.1%) |
| $20,000 to $22,499 | 8 (2.3%) | 11 (5.9%) |
| $22,500 to $24,999 | 6 (1.7%) | 0 (0.0%) |
| $25,000 to $29,999 | 7 (2.0%) | 1 (0.5%) |
| $30,000 to $34,999 | 93 (26.8%) | 12 (6.5%) |
| $35,000 to $39,999 | 23 (6.6%) | 2 (1.1%) |
| $40,000 to $44,999 | 27 (7.8%) | 16 (8.6%) |
| $45,000 to $49,999 | 10 (2.9%) | 6 (3.2%) |
| $50,000 to $54,999 | 4 (1.1%) | 2 (1.1%) |
| $55,000 to $64,999 | 13 (3.7%) | 18 (9.7%) |
| $65,000 to $74,999 | 22 (6.3%) | 11 (5.9%) |
| $75,000 to $99,999 | 24 (6.9%) | 16 (8.6%) |
| $100,000+ | 34 (9.8%) | 8 (4.3%) |
| Total | 347 (100.0%) | 185 (100.0%) |
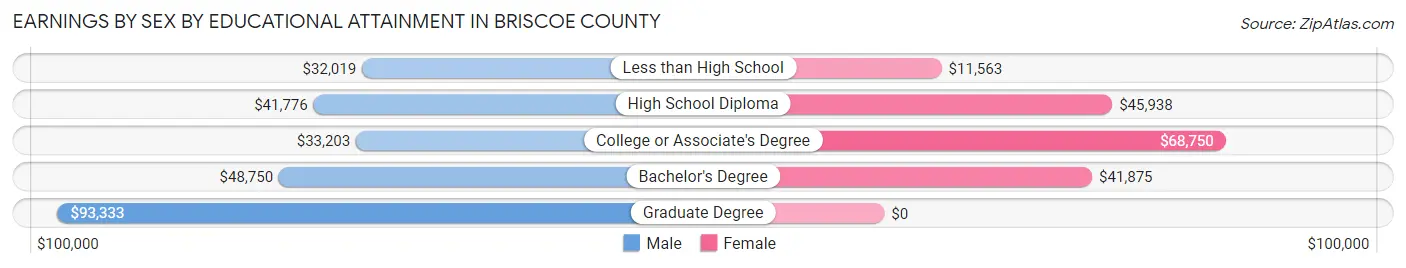
Earnings by Sex by Educational Attainment in Briscoe County
Average earnings in Briscoe County are $34,496 for men and $31,125 for women, a difference of 9.8%. Men with an educational attainment of graduate degree enjoy the highest average annual earnings of $93,333, while those with less than high school education earn the least with $32,019. Women with an educational attainment of college or associate's degree earn the most with the average annual earnings of $68,750, while those with less than high school education have the smallest earnings of $11,563.
| Educational Attainment | Male Income | Female Income |
| Less than High School | $32,019 | $11,563 |
| High School Diploma | $41,776 | $45,938 |
| College or Associate's Degree | $33,203 | $68,750 |
| Bachelor's Degree | $48,750 | $41,875 |
| Graduate Degree | $93,333 | $0 |
| Total | $34,496 | $31,125 |
Family Income in Briscoe County
Family Income Brackets in Briscoe County
According to the Briscoe County family income data, there are 54 families falling into the $35,000 to $49,999 income range, which is the most common income bracket and makes up 16.7% of all families. Conversely, the $200,000+ income bracket is the least frequent group with only 20 families (6.2%) belonging to this category.
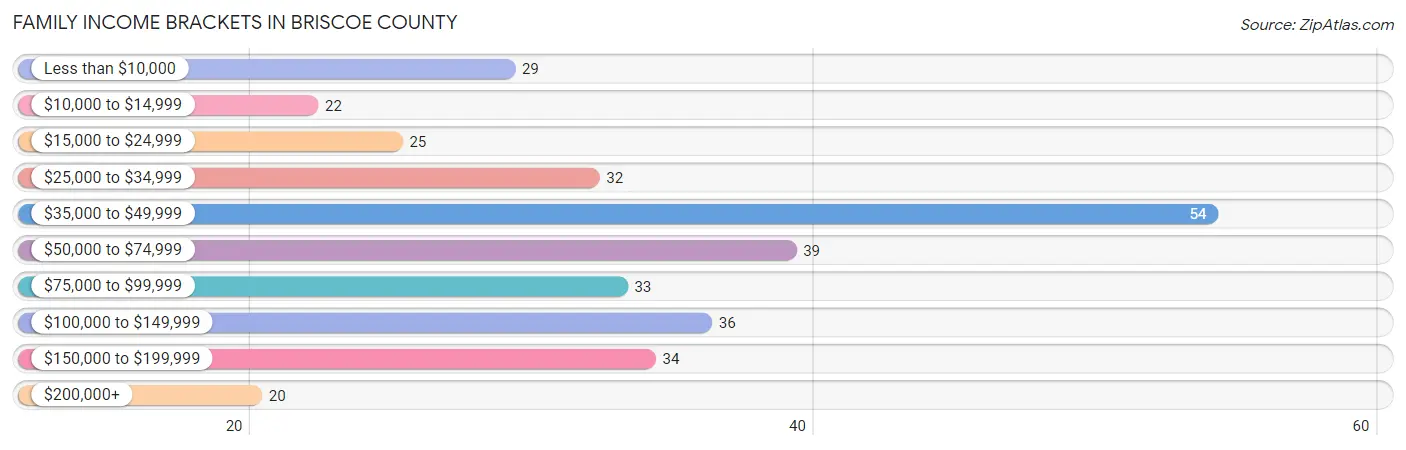
| Income Bracket | # Families | % Families |
| Less than $10,000 | 29 | 9.0% |
| $10,000 to $14,999 | 22 | 6.8% |
| $15,000 to $24,999 | 25 | 7.7% |
| $25,000 to $34,999 | 32 | 9.9% |
| $35,000 to $49,999 | 54 | 16.7% |
| $50,000 to $74,999 | 39 | 12.0% |
| $75,000 to $99,999 | 33 | 10.2% |
| $100,000 to $149,999 | 36 | 11.1% |
| $150,000 to $199,999 | 34 | 10.5% |
| $200,000+ | 20 | 6.2% |
Family Income by Famaliy Size in Briscoe County
3-person families (59 | 18.2%) account for the highest median family income in Briscoe County with $73,036 per family, while 3-person families (59 | 18.2%) have the highest median income of $24,345 per family member.
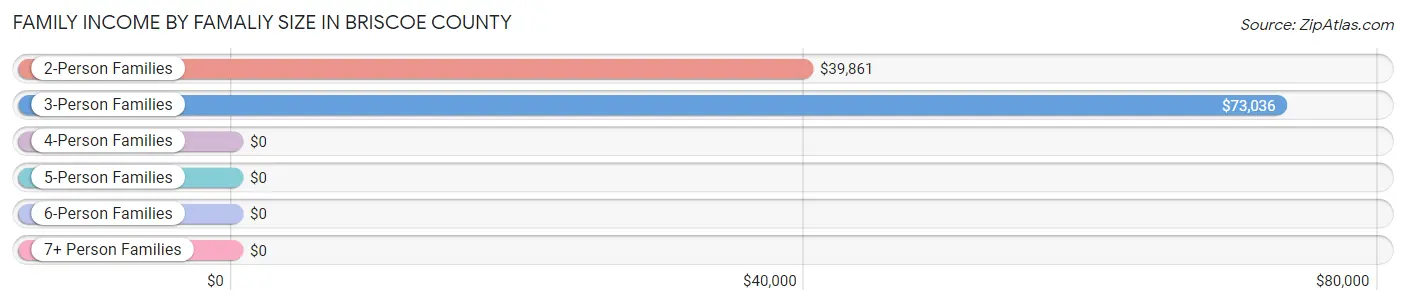
| Income Bracket | # Families | Median Income |
| 2-Person Families | 203 (62.6%) | $39,861 |
| 3-Person Families | 59 (18.2%) | $73,036 |
| 4-Person Families | 23 (7.1%) | $0 |
| 5-Person Families | 9 (2.8%) | $0 |
| 6-Person Families | 28 (8.6%) | $0 |
| 7+ Person Families | 2 (0.6%) | $0 |
| Total | 324 (100.0%) | $50,000 |
Family Income by Number of Earners in Briscoe County
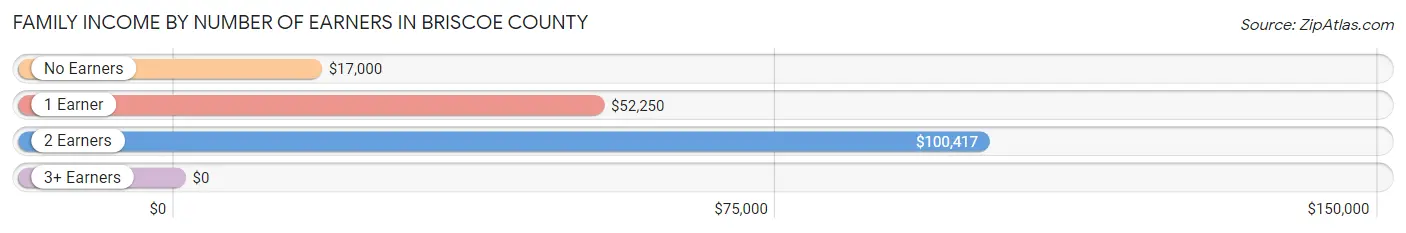
| Number of Earners | # Families | Median Income |
| No Earners | 98 (30.2%) | $17,000 |
| 1 Earner | 109 (33.6%) | $52,250 |
| 2 Earners | 111 (34.3%) | $100,417 |
| 3+ Earners | 6 (1.8%) | $0 |
| Total | 324 (100.0%) | $50,000 |
Household Income in Briscoe County
Household Income Brackets in Briscoe County
With 87 households falling in the category, the $35,000 to $49,999 income range is the most frequent in Briscoe County, accounting for 15.0% of all households. In contrast, only 21 households (3.6%) fall into the $200,000+ income bracket, making it the least populous group.
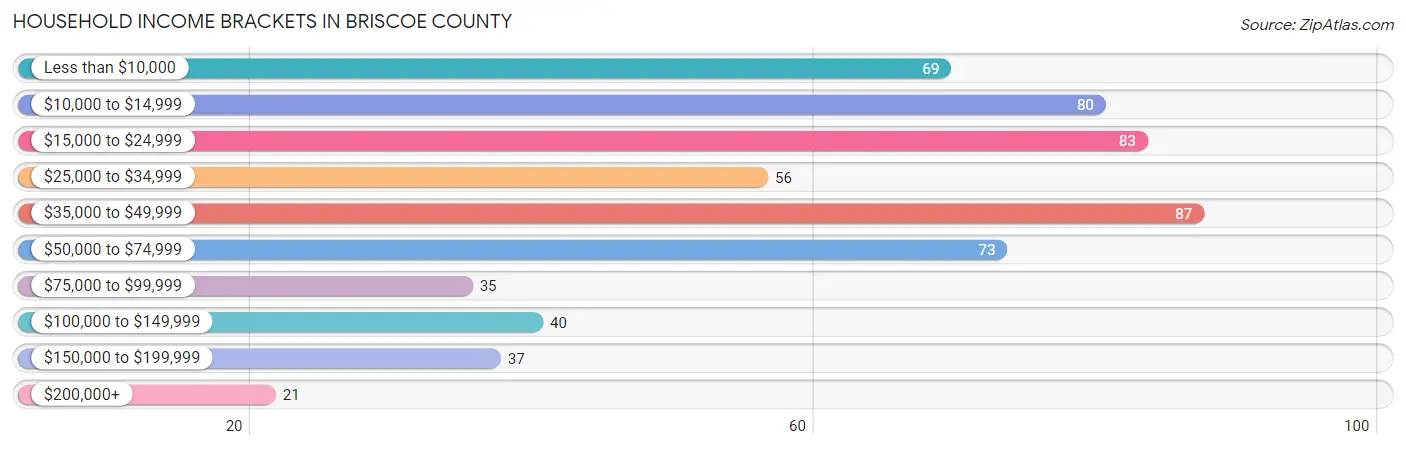
| Income Bracket | # Households | % Households |
| Less than $10,000 | 69 | 11.9% |
| $10,000 to $14,999 | 80 | 13.8% |
| $15,000 to $24,999 | 83 | 14.3% |
| $25,000 to $34,999 | 56 | 9.6% |
| $35,000 to $49,999 | 87 | 15.0% |
| $50,000 to $74,999 | 73 | 12.6% |
| $75,000 to $99,999 | 35 | 6.0% |
| $100,000 to $149,999 | 40 | 6.9% |
| $150,000 to $199,999 | 37 | 6.4% |
| $200,000+ | 21 | 3.6% |
Household Income by Householder Age in Briscoe County
The median household income in Briscoe County is $35,446, with the highest median household income of $41,847 found in the 25 to 44 years age bracket for the primary householder. A total of 109 households (18.8%) fall into this category. Meanwhile, the 45 to 64 years age bracket for the primary householder has the lowest median household income of $0, with 222 households (38.2%) in this group.
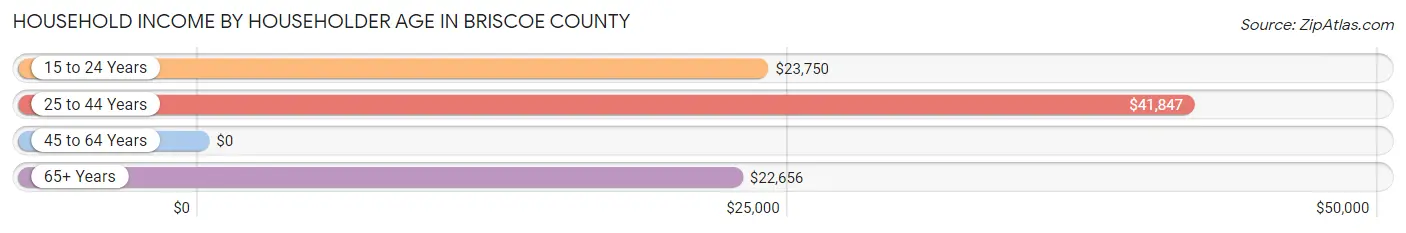
| Income Bracket | # Households | Median Income |
| 15 to 24 Years | 10 (1.7%) | $23,750 |
| 25 to 44 Years | 109 (18.8%) | $41,847 |
| 45 to 64 Years | 222 (38.2%) | $0 |
| 65+ Years | 240 (41.3%) | $22,656 |
| Total | 581 (100.0%) | $35,446 |
Poverty in Briscoe County
Income Below Poverty by Sex and Age in Briscoe County
With 26.2% poverty level for males and 22.0% for females among the residents of Briscoe County, 65 to 74 year old males and 18 to 24 year old females are the most vulnerable to poverty, with 81 males (58.7%) and 27 females (75.0%) in their respective age groups living below the poverty level.
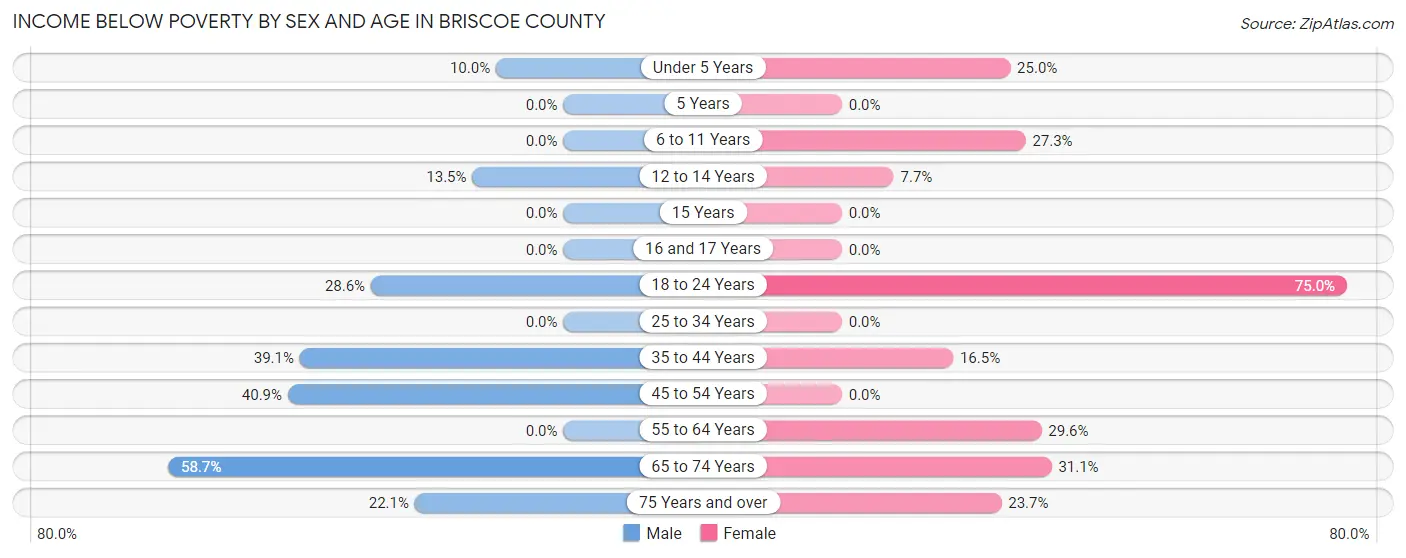
| Age Bracket | Male | Female |
| Under 5 Years | 4 (10.0%) | 1 (25.0%) |
| 5 Years | 0 (0.0%) | 0 (0.0%) |
| 6 to 11 Years | 0 (0.0%) | 3 (27.3%) |
| 12 to 14 Years | 5 (13.5%) | 2 (7.7%) |
| 15 Years | 0 (0.0%) | 0 (0.0%) |
| 16 and 17 Years | 0 (0.0%) | 0 (0.0%) |
| 18 to 24 Years | 8 (28.6%) | 27 (75.0%) |
| 25 to 34 Years | 0 (0.0%) | 0 (0.0%) |
| 35 to 44 Years | 27 (39.1%) | 18 (16.5%) |
| 45 to 54 Years | 45 (40.9%) | 0 (0.0%) |
| 55 to 64 Years | 0 (0.0%) | 24 (29.6%) |
| 65 to 74 Years | 81 (58.7%) | 33 (31.1%) |
| 75 Years and over | 15 (22.1%) | 18 (23.7%) |
| Total | 185 (26.2%) | 126 (22.0%) |
Income Above Poverty by Sex and Age in Briscoe County
According to the poverty statistics in Briscoe County, males aged 6 to 11 years and females aged 5 years are the age groups that are most secure financially, with 100.0% of males and 100.0% of females in these age groups living above the poverty line.
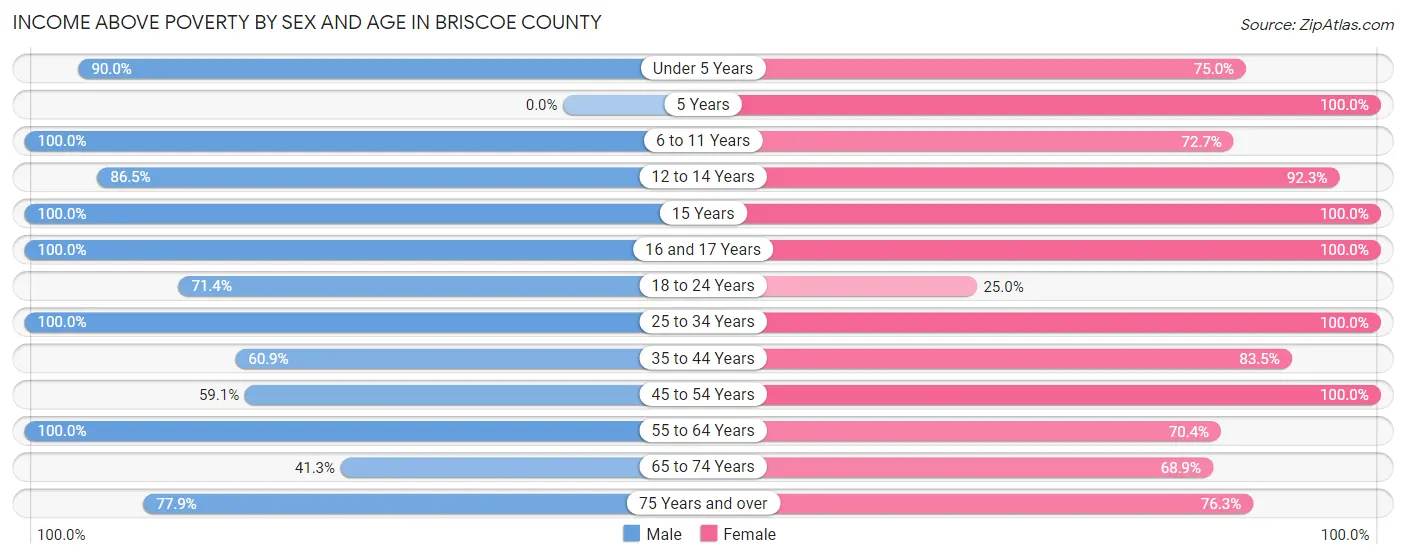
| Age Bracket | Male | Female |
| Under 5 Years | 36 (90.0%) | 3 (75.0%) |
| 5 Years | 0 (0.0%) | 37 (100.0%) |
| 6 to 11 Years | 24 (100.0%) | 8 (72.7%) |
| 12 to 14 Years | 32 (86.5%) | 24 (92.3%) |
| 15 Years | 19 (100.0%) | 3 (100.0%) |
| 16 and 17 Years | 12 (100.0%) | 22 (100.0%) |
| 18 to 24 Years | 20 (71.4%) | 9 (25.0%) |
| 25 to 34 Years | 81 (100.0%) | 18 (100.0%) |
| 35 to 44 Years | 42 (60.9%) | 91 (83.5%) |
| 45 to 54 Years | 65 (59.1%) | 43 (100.0%) |
| 55 to 64 Years | 79 (100.0%) | 57 (70.4%) |
| 65 to 74 Years | 57 (41.3%) | 73 (68.9%) |
| 75 Years and over | 53 (77.9%) | 58 (76.3%) |
| Total | 520 (73.8%) | 446 (78.0%) |
Income Below Poverty Among Married-Couple Families in Briscoe County
The poverty statistics for married-couple families in Briscoe County show that 14.0% or 39 of the total 278 families live below the poverty line. Families with no children have the highest poverty rate of 18.8%, comprising of 33 families. On the other hand, families with 3 or 4 children have the lowest poverty rate of 5.1%, which includes 2 families.
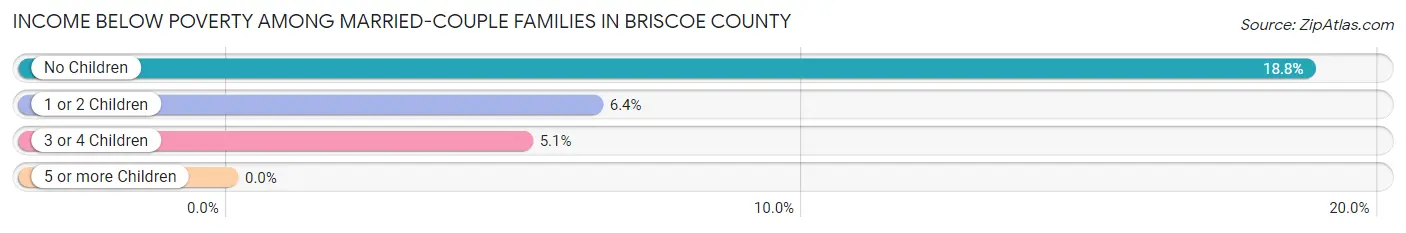
| Children | Above Poverty | Below Poverty |
| No Children | 143 (81.2%) | 33 (18.8%) |
| 1 or 2 Children | 59 (93.6%) | 4 (6.4%) |
| 3 or 4 Children | 37 (94.9%) | 2 (5.1%) |
| 5 or more Children | 0 (0.0%) | 0 (0.0%) |
| Total | 239 (86.0%) | 39 (14.0%) |
Income Below Poverty Among Single-Parent Households in Briscoe County
According to the poverty data in Briscoe County, 46.9% or 15 single-father households and 28.6% or 4 single-mother households are living below the poverty line. Among single-father households, those with no children have the highest poverty rate, with 13 households (61.9%) experiencing poverty. Likewise, among single-mother households, those with 1 or 2 children have the highest poverty rate, with 2 households (40.0%) falling below the poverty line.
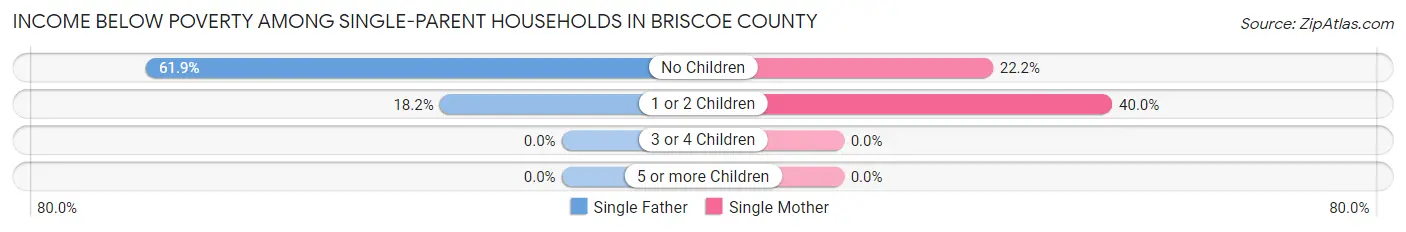
| Children | Single Father | Single Mother |
| No Children | 13 (61.9%) | 2 (22.2%) |
| 1 or 2 Children | 2 (18.2%) | 2 (40.0%) |
| 3 or 4 Children | 0 (0.0%) | 0 (0.0%) |
| 5 or more Children | 0 (0.0%) | 0 (0.0%) |
| Total | 15 (46.9%) | 4 (28.6%) |
Income Below Poverty Among Married-Couple vs Single-Parent Households in Briscoe County
The poverty data for Briscoe County shows that 39 of the married-couple family households (14.0%) and 19 of the single-parent households (41.3%) are living below the poverty level. Within the married-couple family households, those with no children have the highest poverty rate, with 33 households (18.8%) falling below the poverty line. Among the single-parent households, those with no children have the highest poverty rate, with 15 household (50.0%) living below poverty.
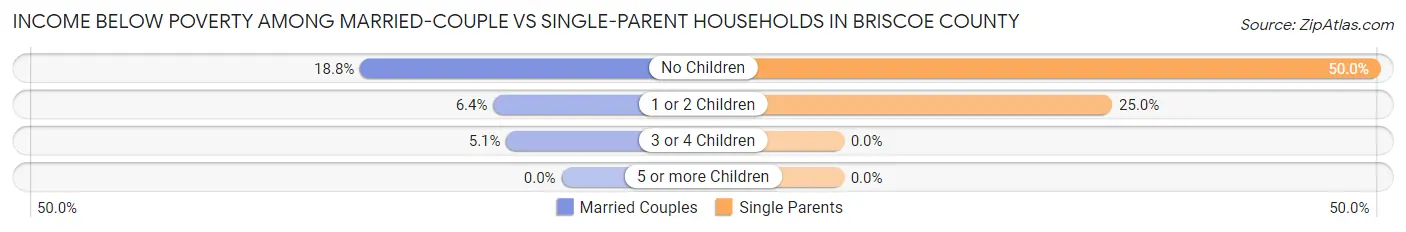
| Children | Married-Couple Families | Single-Parent Households |
| No Children | 33 (18.8%) | 15 (50.0%) |
| 1 or 2 Children | 4 (6.4%) | 4 (25.0%) |
| 3 or 4 Children | 2 (5.1%) | 0 (0.0%) |
| 5 or more Children | 0 (0.0%) | 0 (0.0%) |
| Total | 39 (14.0%) | 19 (41.3%) |
Race in Briscoe County
The most populous races in Briscoe County are White / Caucasian (1,043 | 80.8%), Hispanic or Latino (454 | 35.2%), and Two or more Races (137 | 10.6%).
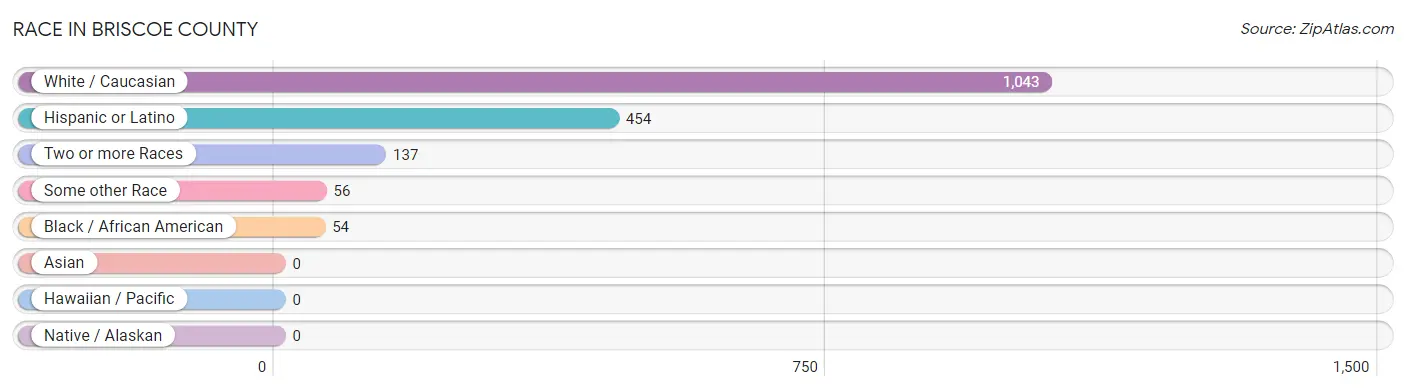
| Race | # Population | % Population |
| Asian | 0 | 0.0% |
| Black / African American | 54 | 4.2% |
| Hawaiian / Pacific | 0 | 0.0% |
| Hispanic or Latino | 454 | 35.2% |
| Native / Alaskan | 0 | 0.0% |
| White / Caucasian | 1,043 | 80.8% |
| Two or more Races | 137 | 10.6% |
| Some other Race | 56 | 4.3% |
| Total | 1,290 | 100.0% |
Ancestry in Briscoe County
The most populous ancestries reported in Briscoe County are Mexican (392 | 30.4%), English (136 | 10.5%), Irish (101 | 7.8%), German (97 | 7.5%), and Scottish (41 | 3.2%), together accounting for 59.5% of all Briscoe County residents.
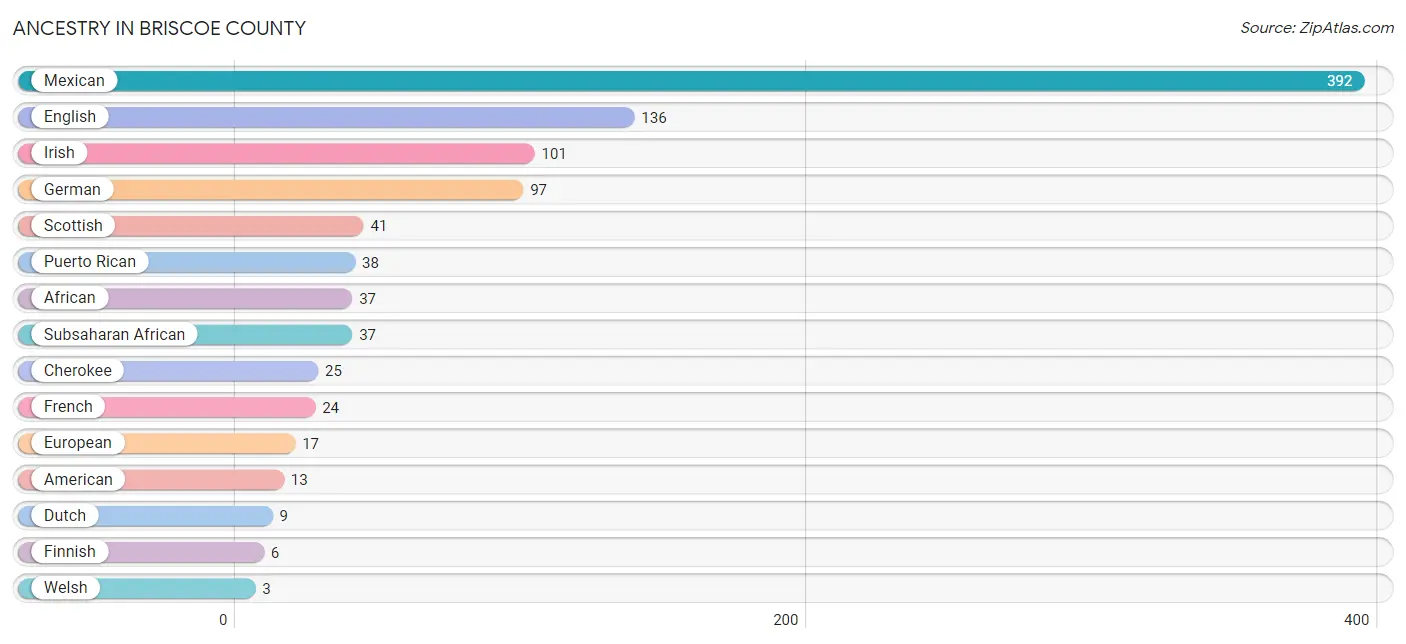
| Ancestry | # Population | % Population |
| African | 37 | 2.9% |
| American | 13 | 1.0% |
| Cherokee | 25 | 1.9% |
| Czech | 2 | 0.2% |
| Dutch | 9 | 0.7% |
| English | 136 | 10.5% |
| European | 17 | 1.3% |
| Finnish | 6 | 0.5% |
| French | 24 | 1.9% |
| German | 97 | 7.5% |
| Iranian | 2 | 0.2% |
| Irish | 101 | 7.8% |
| Italian | 1 | 0.1% |
| Mexican | 392 | 30.4% |
| Norwegian | 1 | 0.1% |
| Pennsylvania German | 2 | 0.2% |
| Puerto Rican | 38 | 2.9% |
| Scotch-Irish | 2 | 0.2% |
| Scottish | 41 | 3.2% |
| Subsaharan African | 37 | 2.9% |
| Welsh | 3 | 0.2% | View All 21 Rows |
Immigrants in Briscoe County
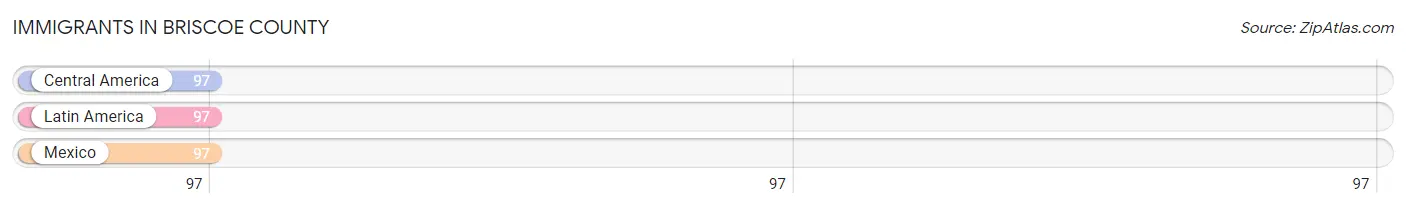
The most numerous immigrant groups reported in Briscoe County came from Central America (97 | 7.5%), Latin America (97 | 7.5%), and Mexico (97 | 7.5%), together accounting for 22.6% of all Briscoe County residents.
| Immigration Origin | # Population | % Population |
| Central America | 97 | 7.5% |
| Latin America | 97 | 7.5% |
| Mexico | 97 | 7.5% | View All 3 Rows |
Sex and Age in Briscoe County
Sex and Age in Briscoe County
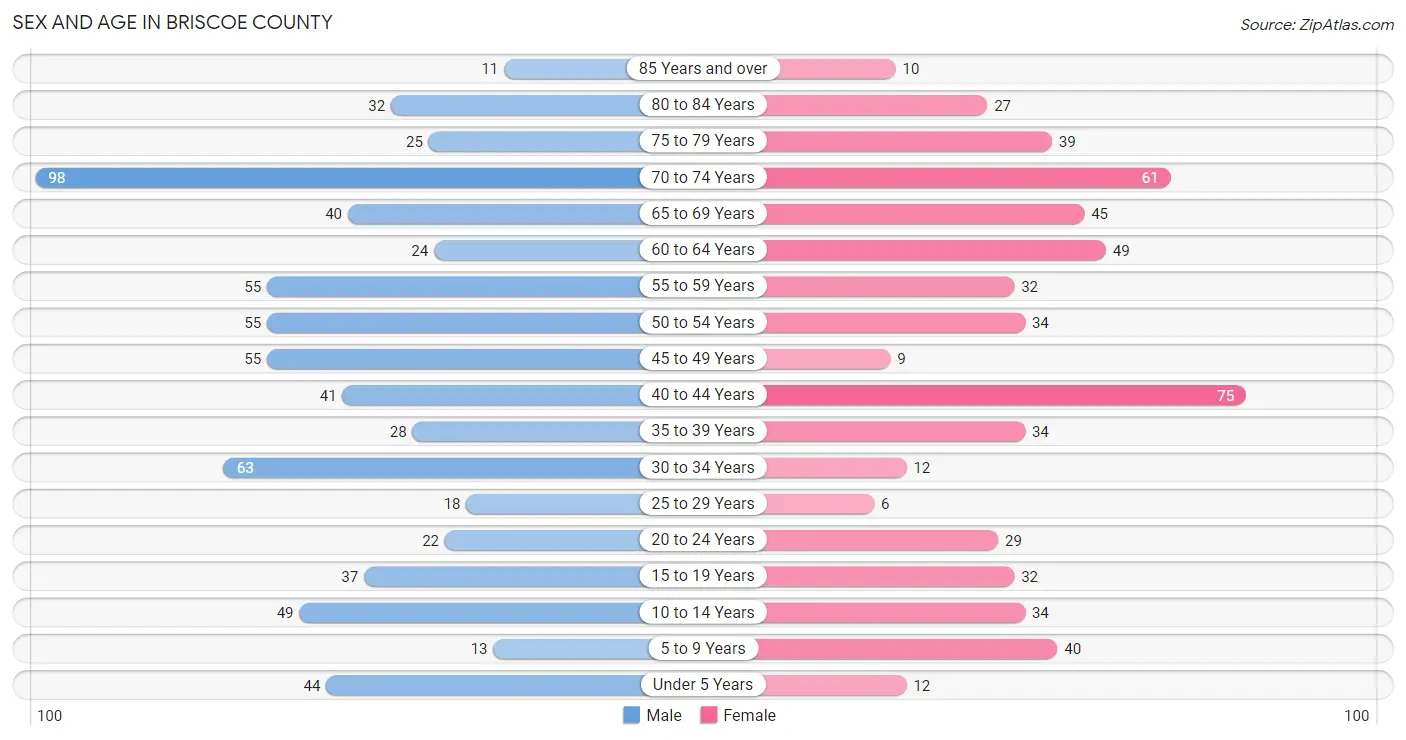
The most populous age groups in Briscoe County are 70 to 74 Years (98 | 13.8%) for men and 40 to 44 Years (75 | 12.9%) for women.
| Age Bracket | Male | Female |
| Under 5 Years | 44 (6.2%) | 12 (2.1%) |
| 5 to 9 Years | 13 (1.8%) | 40 (6.9%) |
| 10 to 14 Years | 49 (6.9%) | 34 (5.9%) |
| 15 to 19 Years | 37 (5.2%) | 32 (5.5%) |
| 20 to 24 Years | 22 (3.1%) | 29 (5.0%) |
| 25 to 29 Years | 18 (2.5%) | 6 (1.0%) |
| 30 to 34 Years | 63 (8.9%) | 12 (2.1%) |
| 35 to 39 Years | 28 (3.9%) | 34 (5.9%) |
| 40 to 44 Years | 41 (5.8%) | 75 (12.9%) |
| 45 to 49 Years | 55 (7.7%) | 9 (1.5%) |
| 50 to 54 Years | 55 (7.7%) | 34 (5.9%) |
| 55 to 59 Years | 55 (7.7%) | 32 (5.5%) |
| 60 to 64 Years | 24 (3.4%) | 49 (8.5%) |
| 65 to 69 Years | 40 (5.6%) | 45 (7.8%) |
| 70 to 74 Years | 98 (13.8%) | 61 (10.5%) |
| 75 to 79 Years | 25 (3.5%) | 39 (6.7%) |
| 80 to 84 Years | 32 (4.5%) | 27 (4.7%) |
| 85 Years and over | 11 (1.5%) | 10 (1.7%) |
| Total | 710 (100.0%) | 580 (100.0%) |
Families and Households in Briscoe County
Median Family Size in Briscoe County
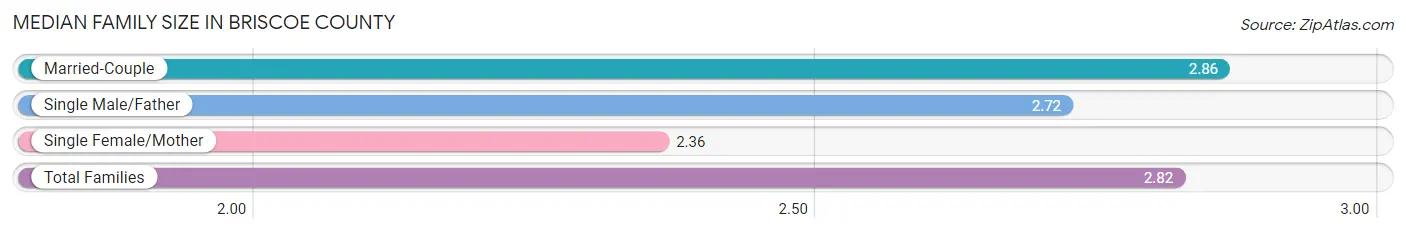
The median family size in Briscoe County is 2.82 persons per family, with married-couple families (278 | 85.8%) accounting for the largest median family size of 2.86 persons per family. On the other hand, single female/mother families (14 | 4.3%) represent the smallest median family size with 2.36 persons per family.
| Family Type | # Families | Family Size |
| Married-Couple | 278 (85.8%) | 2.86 |
| Single Male/Father | 32 (9.9%) | 2.72 |
| Single Female/Mother | 14 (4.3%) | 2.36 |
| Total Families | 324 (100.0%) | 2.82 |
Median Household Size in Briscoe County
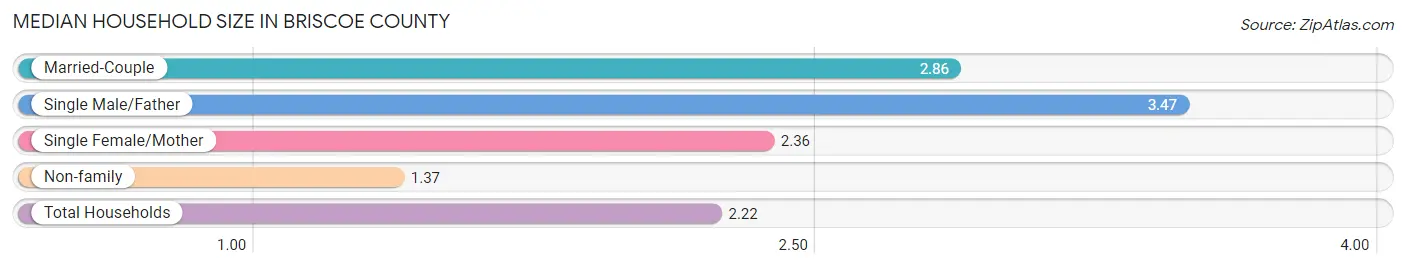
The median household size in Briscoe County is 2.22 persons per household, with single male/father households (32 | 5.5%) accounting for the largest median household size of 3.47 persons per household. non-family households (257 | 44.2%) represent the smallest median household size with 1.37 persons per household.
| Household Type | # Households | Household Size |
| Married-Couple | 278 (47.8%) | 2.86 |
| Single Male/Father | 32 (5.5%) | 3.47 |
| Single Female/Mother | 14 (2.4%) | 2.36 |
| Non-family | 257 (44.2%) | 1.37 |
| Total Households | 581 (100.0%) | 2.22 |
Household Size by Marriage Status in Briscoe County
Out of a total of 581 households in Briscoe County, 324 (55.8%) are family households, while 257 (44.2%) are nonfamily households. The most numerous type of family households are 2-person households, comprising 194, and the most common type of nonfamily households are 1-person households, comprising 231.
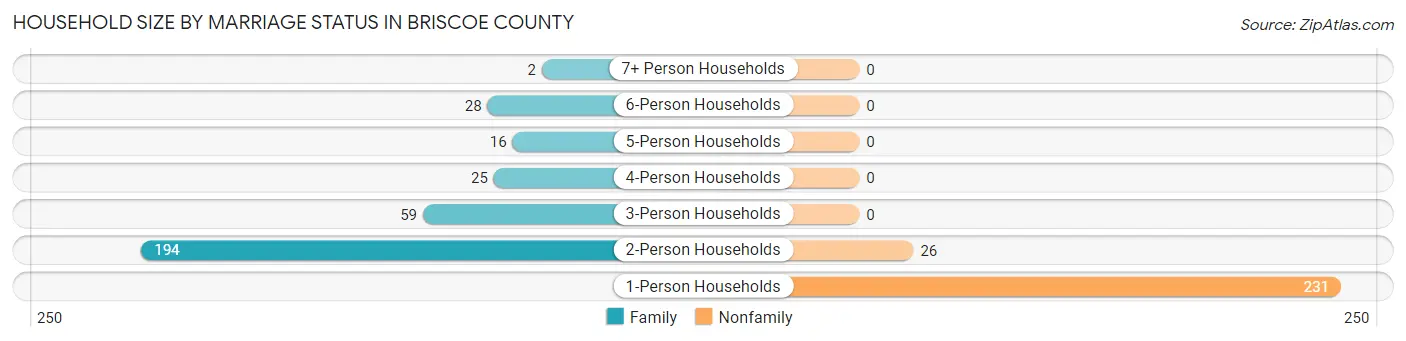
| Household Size | Family Households | Nonfamily Households |
| 1-Person Households | - | 231 (39.8%) |
| 2-Person Households | 194 (33.4%) | 26 (4.5%) |
| 3-Person Households | 59 (10.2%) | 0 (0.0%) |
| 4-Person Households | 25 (4.3%) | 0 (0.0%) |
| 5-Person Households | 16 (2.8%) | 0 (0.0%) |
| 6-Person Households | 28 (4.8%) | 0 (0.0%) |
| 7+ Person Households | 2 (0.3%) | 0 (0.0%) |
| Total | 324 (55.8%) | 257 (44.2%) |
Female Fertility in Briscoe County
Fertility by Age in Briscoe County
Average fertility rate in Briscoe County is 223.0 births per 1,000 women. Women in the age bracket of 20 to 34 years have the highest fertility rate with 277.0 births per 1,000 women. Women in the age bracket of 35 to 50 years acount for 72.9% of all women with births.
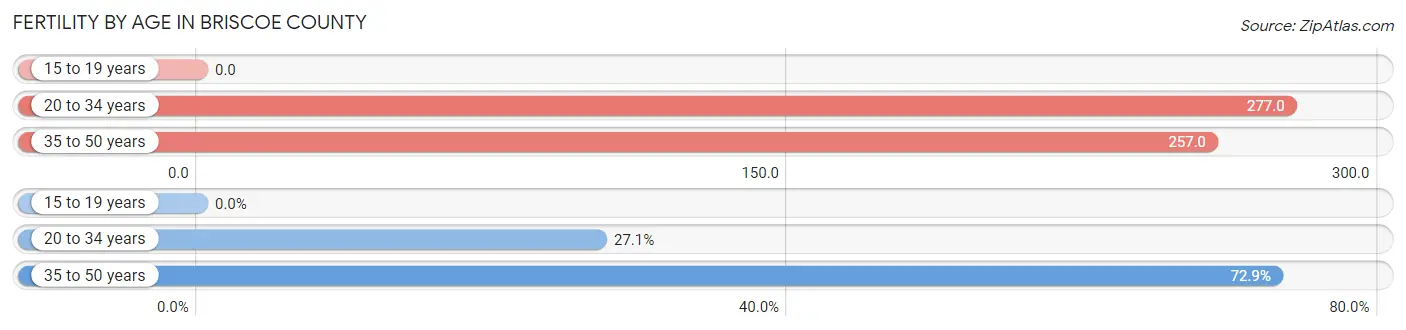
| Age Bracket | Women with Births | Births / 1,000 Women |
| 15 to 19 years | 0 (0.0%) | 0.0 |
| 20 to 34 years | 13 (27.1%) | 277.0 |
| 35 to 50 years | 35 (72.9%) | 257.0 |
| Total | 48 (100.0%) | 223.0 |
Fertility by Age by Marriage Status in Briscoe County
79.2% of women with births (48) in Briscoe County are married. The highest percentage of unmarried women with births falls into 20 to 34 years age bracket with 76.9% of them unmarried at the time of birth, while the lowest percentage of unmarried women with births belong to 35 to 50 years age bracket with 0.0% of them unmarried.
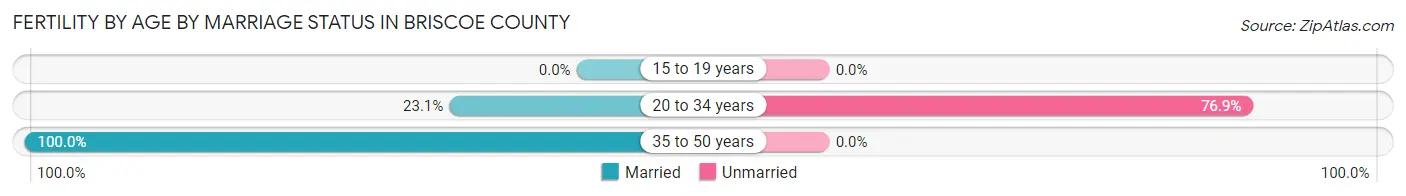
| Age Bracket | Married | Unmarried |
| 15 to 19 years | 0 (0.0%) | 0 (0.0%) |
| 20 to 34 years | 3 (23.1%) | 10 (76.9%) |
| 35 to 50 years | 35 (100.0%) | 0 (0.0%) |
| Total | 38 (79.2%) | 10 (20.8%) |
Fertility by Education in Briscoe County
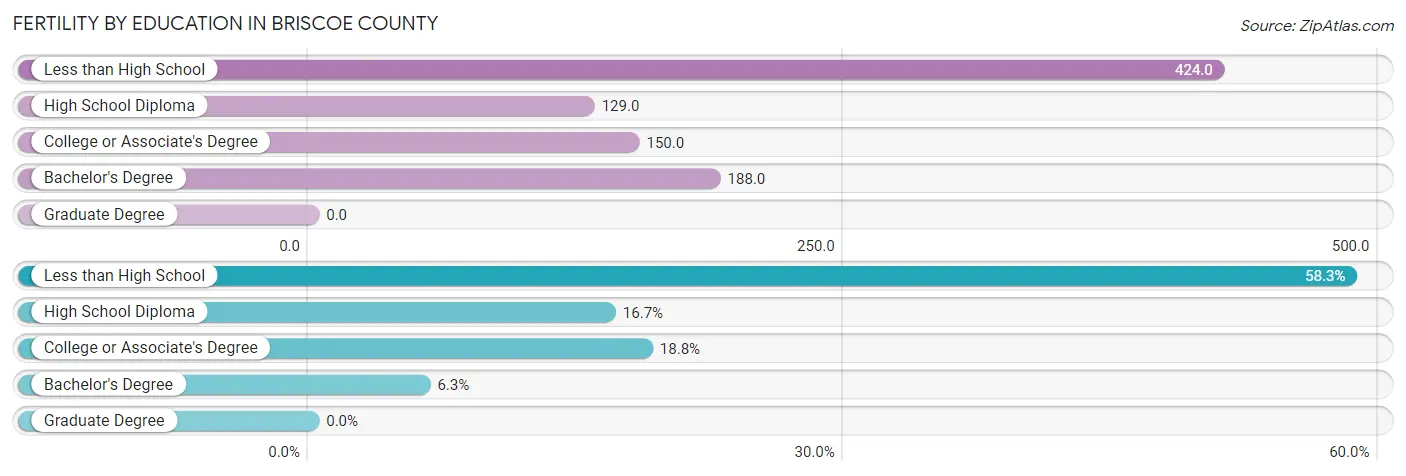
| Educational Attainment | Women with Births | Births / 1,000 Women |
| Less than High School | 28 (58.3%) | 424.0 |
| High School Diploma | 8 (16.7%) | 129.0 |
| College or Associate's Degree | 9 (18.8%) | 150.0 |
| Bachelor's Degree | 3 (6.2%) | 188.0 |
| Graduate Degree | 0 (0.0%) | 0.0 |
| Total | 48 (100.0%) | 223.0 |
Fertility by Education by Marriage Status in Briscoe County
20.8% of women with births in Briscoe County are unmarried. Women with the educational attainment of less than high school are most likely to be married with 100.0% of them married at childbirth, while women with the educational attainment of college or associate's degree are least likely to be married with 100.0% of them unmarried at childbirth.
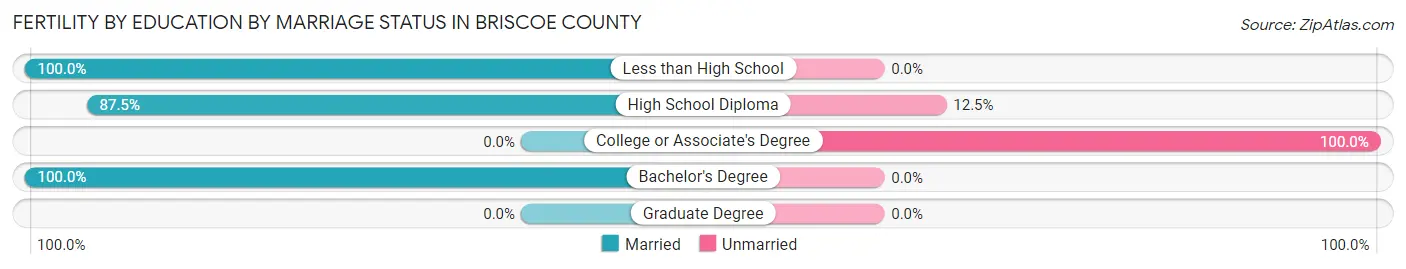
| Educational Attainment | Married | Unmarried |
| Less than High School | 28 (100.0%) | 0 (0.0%) |
| High School Diploma | 7 (87.5%) | 1 (12.5%) |
| College or Associate's Degree | 0 (0.0%) | 9 (100.0%) |
| Bachelor's Degree | 3 (100.0%) | 0 (0.0%) |
| Graduate Degree | 0 (0.0%) | 0 (0.0%) |
| Total | 38 (79.2%) | 10 (20.8%) |
Employment Characteristics in Briscoe County
Employment by Class of Employer in Briscoe County
Among the 496 employed individuals in Briscoe County, private company employees (294 | 59.3%), self-employed (not incorporated) (86 | 17.3%), and local government employees (51 | 10.3%) make up the most common classes of employment.
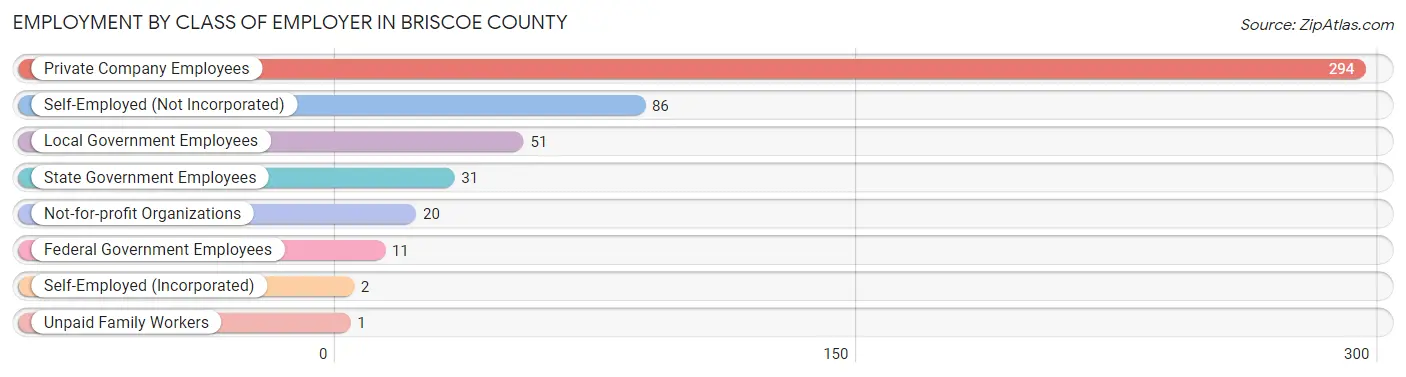
| Employer Class | # Employees | % Employees |
| Private Company Employees | 294 | 59.3% |
| Self-Employed (Incorporated) | 2 | 0.4% |
| Self-Employed (Not Incorporated) | 86 | 17.3% |
| Not-for-profit Organizations | 20 | 4.0% |
| Local Government Employees | 51 | 10.3% |
| State Government Employees | 31 | 6.2% |
| Federal Government Employees | 11 | 2.2% |
| Unpaid Family Workers | 1 | 0.2% |
| Total | 496 | 100.0% |
Employment Status by Age in Briscoe County
According to the labor force statistics for Briscoe County, out of the total population over 16 years of age (1,076), 47.7% or 513 individuals are in the labor force, with 3.3% or 17 of them unemployed. The age group with the highest labor force participation rate is 30 to 34 years, with 92.0% or 69 individuals in the labor force. Within the labor force, the 20 to 24 years age range has the highest percentage of unemployed individuals, with 47.4% or 9 of them being unemployed.
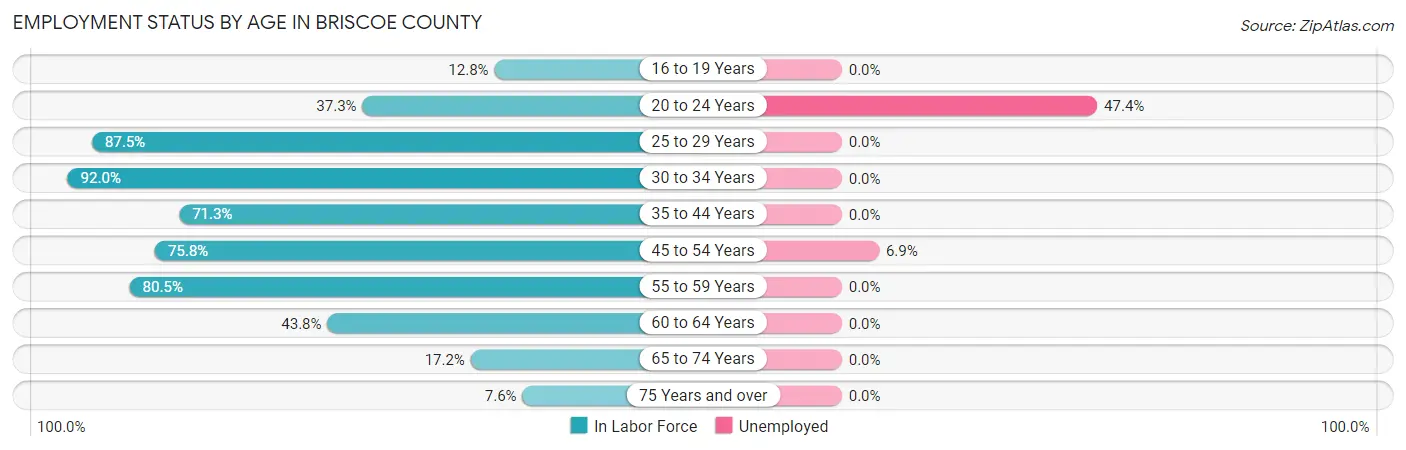
| Age Bracket | In Labor Force | Unemployed |
| 16 to 19 Years | 6 (12.8%) | 0 (0.0%) |
| 20 to 24 Years | 19 (37.3%) | 9 (47.4%) |
| 25 to 29 Years | 21 (87.5%) | 0 (0.0%) |
| 30 to 34 Years | 69 (92.0%) | 0 (0.0%) |
| 35 to 44 Years | 127 (71.3%) | 0 (0.0%) |
| 45 to 54 Years | 116 (75.8%) | 8 (6.9%) |
| 55 to 59 Years | 70 (80.5%) | 0 (0.0%) |
| 60 to 64 Years | 32 (43.8%) | 0 (0.0%) |
| 65 to 74 Years | 42 (17.2%) | 0 (0.0%) |
| 75 Years and over | 11 (7.6%) | 0 (0.0%) |
| Total | 513 (47.7%) | 17 (3.3%) |
Employment Status by Educational Attainment in Briscoe County
According to labor force statistics for Briscoe County, 73.7% of individuals (435) out of the total population between 25 and 64 years of age (590) are in the labor force, with 1.8% or 8 of them being unemployed. The group with the highest labor force participation rate are those with the educational attainment of less than high school, with 93.2% or 82 individuals in the labor force. Within the labor force, individuals with less than high school education have the highest percentage of unemployment, with 9.8% or 8 of them being unemployed.
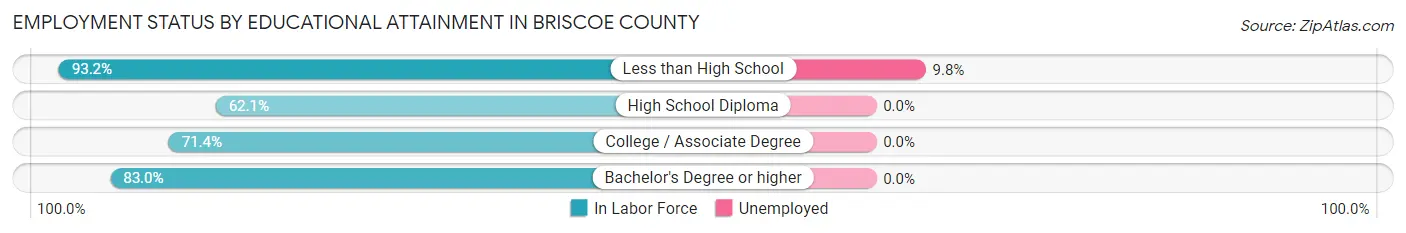
| Educational Attainment | In Labor Force | Unemployed |
| Less than High School | 82 (93.2%) | 9 (9.8%) |
| High School Diploma | 110 (62.1%) | 0 (0.0%) |
| College / Associate Degree | 165 (71.4%) | 0 (0.0%) |
| Bachelor's Degree or higher | 78 (83.0%) | 0 (0.0%) |
| Total | 435 (73.7%) | 11 (1.8%) |
Employment Occupations by Sex in Briscoe County
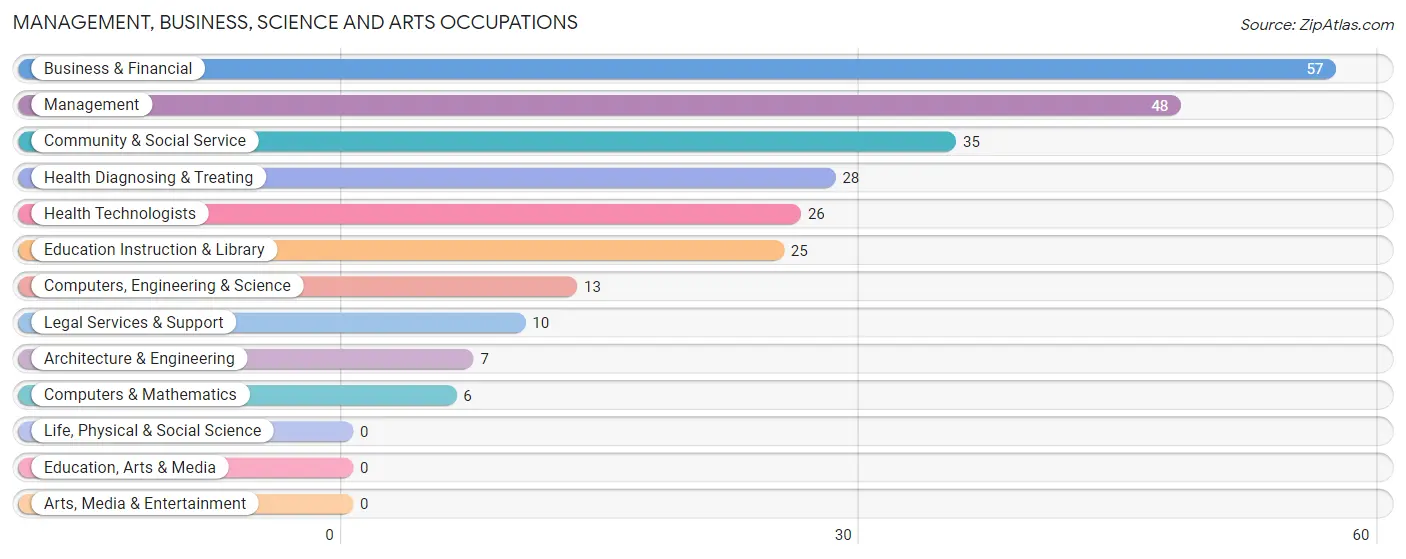
Management, Business, Science and Arts Occupations
The most common Management, Business, Science and Arts occupations in Briscoe County are Business & Financial (57 | 11.5%), Management (48 | 9.7%), Community & Social Service (35 | 7.1%), Health Diagnosing & Treating (28 | 5.7%), and Health Technologists (26 | 5.2%).
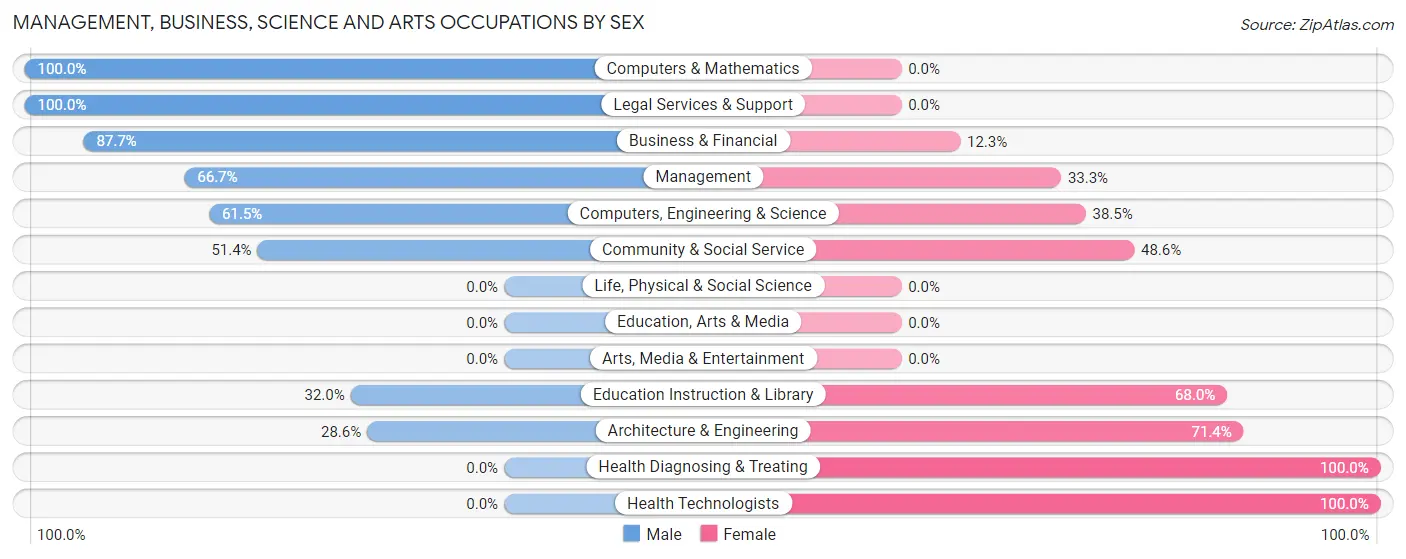
Management, Business, Science and Arts Occupations by Sex
Within the Management, Business, Science and Arts occupations in Briscoe County, the most male-oriented occupations are Computers & Mathematics (100.0%), Legal Services & Support (100.0%), and Business & Financial (87.7%), while the most female-oriented occupations are Health Diagnosing & Treating (100.0%), Health Technologists (100.0%), and Architecture & Engineering (71.4%).
| Occupation | Male | Female |
| Management | 32 (66.7%) | 16 (33.3%) |
| Business & Financial | 50 (87.7%) | 7 (12.3%) |
| Computers, Engineering & Science | 8 (61.5%) | 5 (38.5%) |
| Computers & Mathematics | 6 (100.0%) | 0 (0.0%) |
| Architecture & Engineering | 2 (28.6%) | 5 (71.4%) |
| Life, Physical & Social Science | 0 (0.0%) | 0 (0.0%) |
| Community & Social Service | 18 (51.4%) | 17 (48.6%) |
| Education, Arts & Media | 0 (0.0%) | 0 (0.0%) |
| Legal Services & Support | 10 (100.0%) | 0 (0.0%) |
| Education Instruction & Library | 8 (32.0%) | 17 (68.0%) |
| Arts, Media & Entertainment | 0 (0.0%) | 0 (0.0%) |
| Health Diagnosing & Treating | 0 (0.0%) | 28 (100.0%) |
| Health Technologists | 0 (0.0%) | 26 (100.0%) |
| Total (Category) | 108 (59.7%) | 73 (40.3%) |
| Total (Overall) | 319 (64.3%) | 177 (35.7%) |
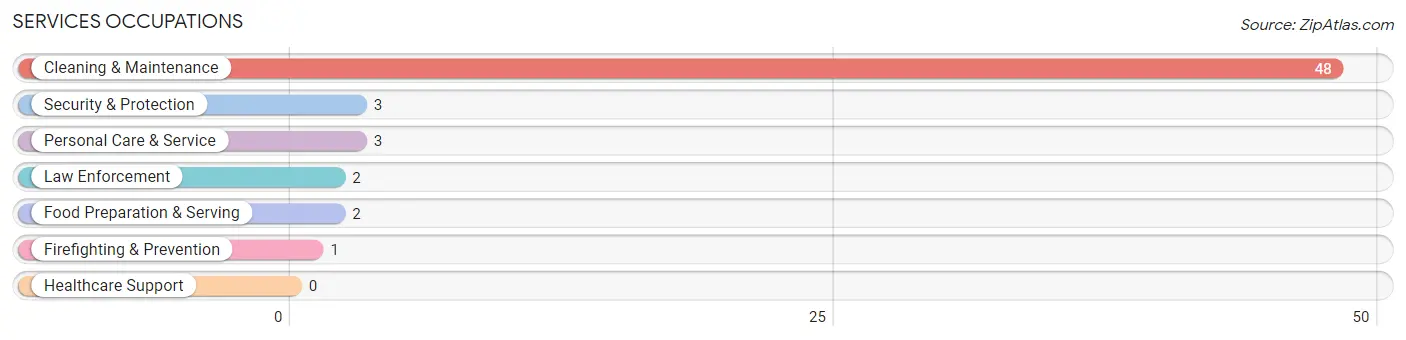
Services Occupations
The most common Services occupations in Briscoe County are Cleaning & Maintenance (48 | 9.7%), Security & Protection (3 | 0.6%), Personal Care & Service (3 | 0.6%), Law Enforcement (2 | 0.4%), and Food Preparation & Serving (2 | 0.4%).
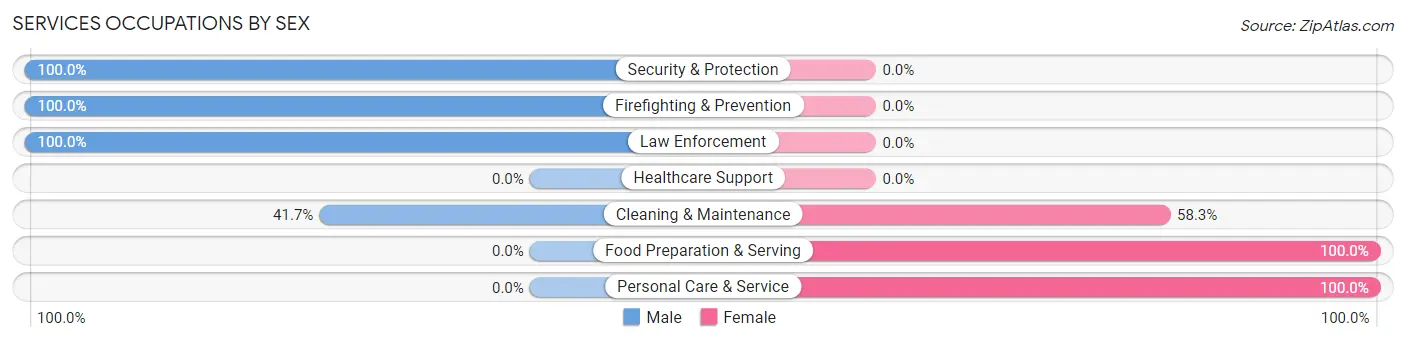
Services Occupations by Sex
Within the Services occupations in Briscoe County, the most male-oriented occupations are Security & Protection (100.0%), Firefighting & Prevention (100.0%), and Law Enforcement (100.0%), while the most female-oriented occupations are Food Preparation & Serving (100.0%), Personal Care & Service (100.0%), and Cleaning & Maintenance (58.3%).
| Occupation | Male | Female |
| Healthcare Support | 0 (0.0%) | 0 (0.0%) |
| Security & Protection | 3 (100.0%) | 0 (0.0%) |
| Firefighting & Prevention | 1 (100.0%) | 0 (0.0%) |
| Law Enforcement | 2 (100.0%) | 0 (0.0%) |
| Food Preparation & Serving | 0 (0.0%) | 2 (100.0%) |
| Cleaning & Maintenance | 20 (41.7%) | 28 (58.3%) |
| Personal Care & Service | 0 (0.0%) | 3 (100.0%) |
| Total (Category) | 23 (41.1%) | 33 (58.9%) |
| Total (Overall) | 319 (64.3%) | 177 (35.7%) |
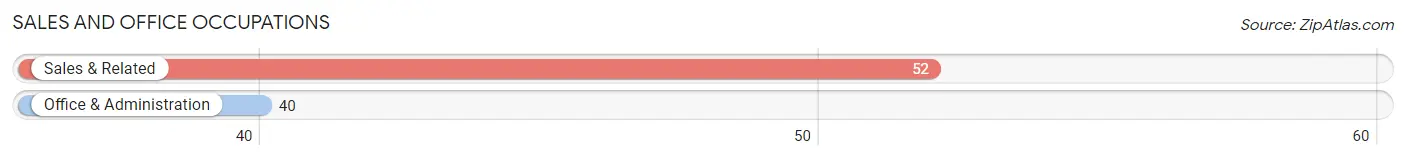
Sales and Office Occupations
The most common Sales and Office occupations in Briscoe County are Sales & Related (52 | 10.5%), and Office & Administration (40 | 8.1%).
Sales and Office Occupations by Sex
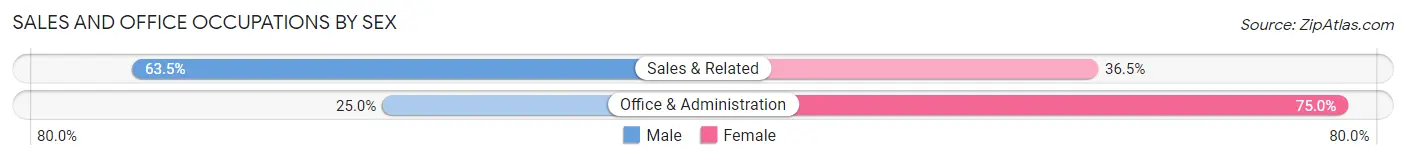
| Occupation | Male | Female |
| Sales & Related | 33 (63.5%) | 19 (36.5%) |
| Office & Administration | 10 (25.0%) | 30 (75.0%) |
| Total (Category) | 43 (46.7%) | 49 (53.3%) |
| Total (Overall) | 319 (64.3%) | 177 (35.7%) |
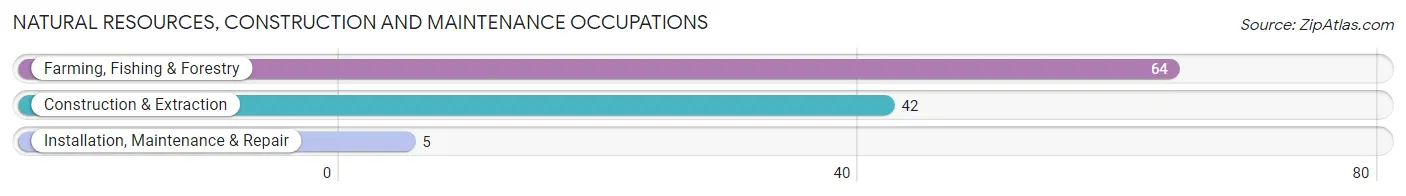
Natural Resources, Construction and Maintenance Occupations
The most common Natural Resources, Construction and Maintenance occupations in Briscoe County are Farming, Fishing & Forestry (64 | 12.9%), Construction & Extraction (42 | 8.5%), and Installation, Maintenance & Repair (5 | 1.0%).
Natural Resources, Construction and Maintenance Occupations by Sex
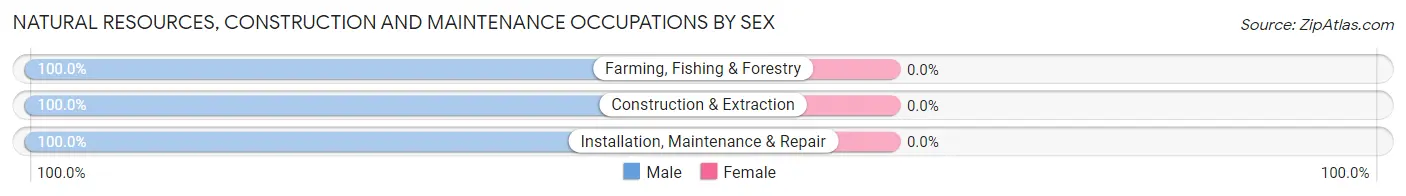
| Occupation | Male | Female |
| Farming, Fishing & Forestry | 64 (100.0%) | 0 (0.0%) |
| Construction & Extraction | 42 (100.0%) | 0 (0.0%) |
| Installation, Maintenance & Repair | 5 (100.0%) | 0 (0.0%) |
| Total (Category) | 111 (100.0%) | 0 (0.0%) |
| Total (Overall) | 319 (64.3%) | 177 (35.7%) |
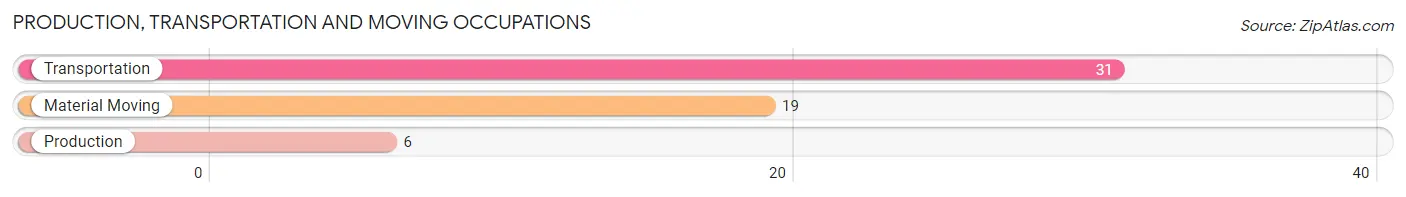
Production, Transportation and Moving Occupations
The most common Production, Transportation and Moving occupations in Briscoe County are Transportation (31 | 6.2%), Material Moving (19 | 3.8%), and Production (6 | 1.2%).
Production, Transportation and Moving Occupations by Sex
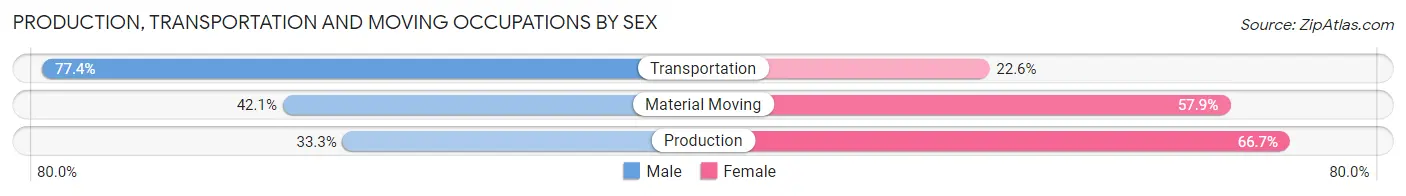
| Occupation | Male | Female |
| Production | 2 (33.3%) | 4 (66.7%) |
| Transportation | 24 (77.4%) | 7 (22.6%) |
| Material Moving | 8 (42.1%) | 11 (57.9%) |
| Total (Category) | 34 (60.7%) | 22 (39.3%) |
| Total (Overall) | 319 (64.3%) | 177 (35.7%) |
Employment Industries by Sex in Briscoe County
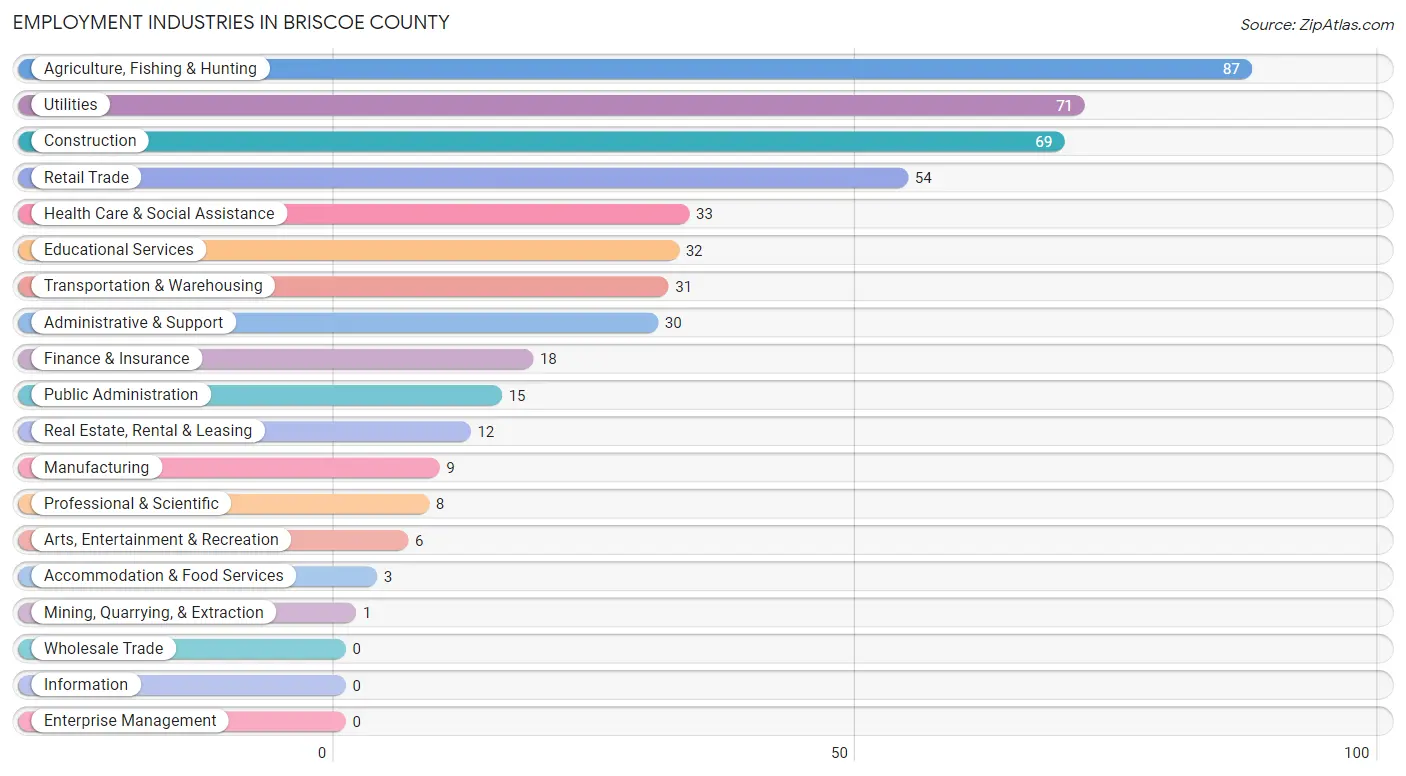
Employment Industries in Briscoe County
The major employment industries in Briscoe County include Agriculture, Fishing & Hunting (87 | 17.5%), Utilities (71 | 14.3%), Construction (69 | 13.9%), Retail Trade (54 | 10.9%), and Health Care & Social Assistance (33 | 6.7%).
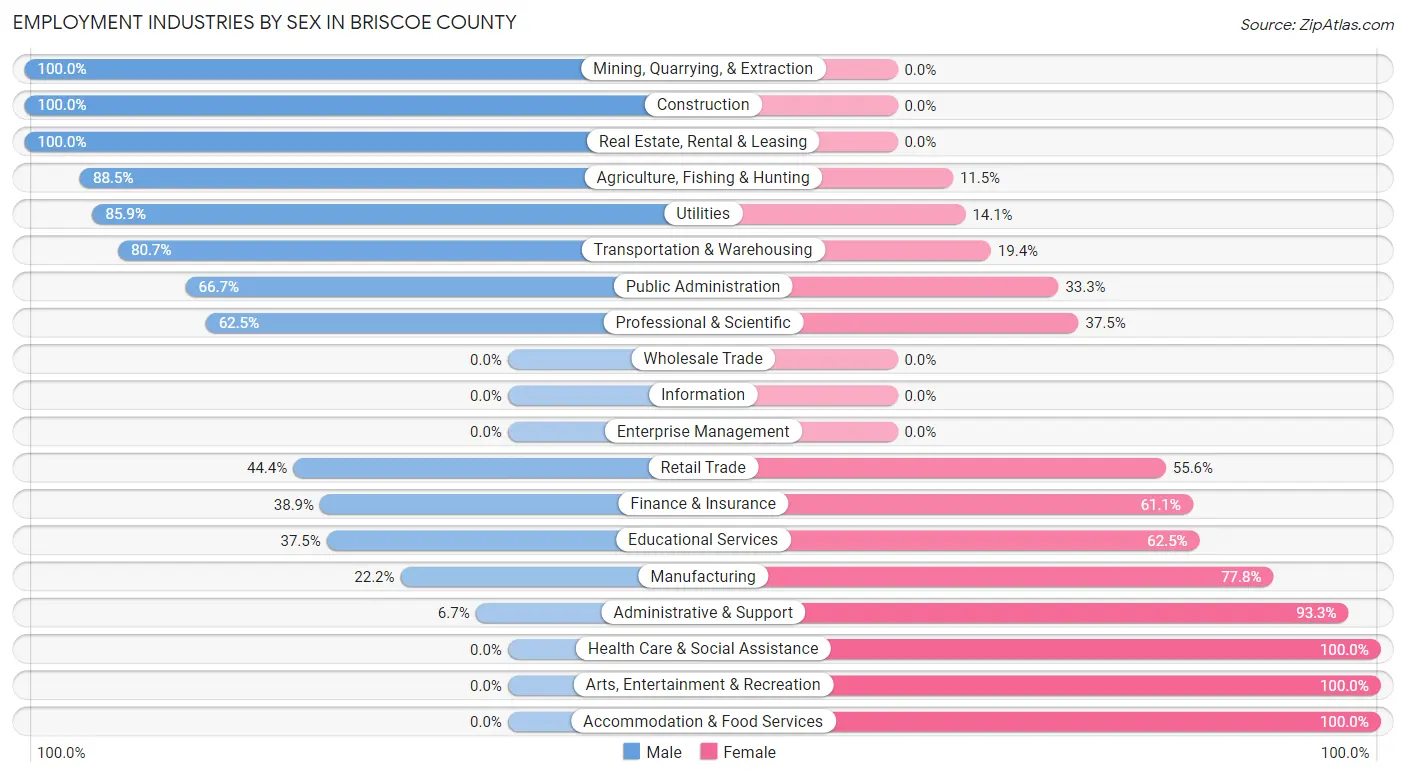
Employment Industries by Sex in Briscoe County
The Briscoe County industries that see more men than women are Mining, Quarrying, & Extraction (100.0%), Construction (100.0%), and Real Estate, Rental & Leasing (100.0%), whereas the industries that tend to have a higher number of women are Health Care & Social Assistance (100.0%), Arts, Entertainment & Recreation (100.0%), and Accommodation & Food Services (100.0%).
| Industry | Male | Female |
| Agriculture, Fishing & Hunting | 77 (88.5%) | 10 (11.5%) |
| Mining, Quarrying, & Extraction | 1 (100.0%) | 0 (0.0%) |
| Construction | 69 (100.0%) | 0 (0.0%) |
| Manufacturing | 2 (22.2%) | 7 (77.8%) |
| Wholesale Trade | 0 (0.0%) | 0 (0.0%) |
| Retail Trade | 24 (44.4%) | 30 (55.6%) |
| Transportation & Warehousing | 25 (80.6%) | 6 (19.4%) |
| Utilities | 61 (85.9%) | 10 (14.1%) |
| Information | 0 (0.0%) | 0 (0.0%) |
| Finance & Insurance | 7 (38.9%) | 11 (61.1%) |
| Real Estate, Rental & Leasing | 12 (100.0%) | 0 (0.0%) |
| Professional & Scientific | 5 (62.5%) | 3 (37.5%) |
| Enterprise Management | 0 (0.0%) | 0 (0.0%) |
| Administrative & Support | 2 (6.7%) | 28 (93.3%) |
| Educational Services | 12 (37.5%) | 20 (62.5%) |
| Health Care & Social Assistance | 0 (0.0%) | 33 (100.0%) |
| Arts, Entertainment & Recreation | 0 (0.0%) | 6 (100.0%) |
| Accommodation & Food Services | 0 (0.0%) | 3 (100.0%) |
| Public Administration | 10 (66.7%) | 5 (33.3%) |
| Total | 319 (64.3%) | 177 (35.7%) |
Education in Briscoe County
School Enrollment in Briscoe County
The most common levels of schooling among the 227 students in Briscoe County are high school (74 | 32.6%), middle school (68 | 30.0%), and kindergarten (37 | 16.3%).
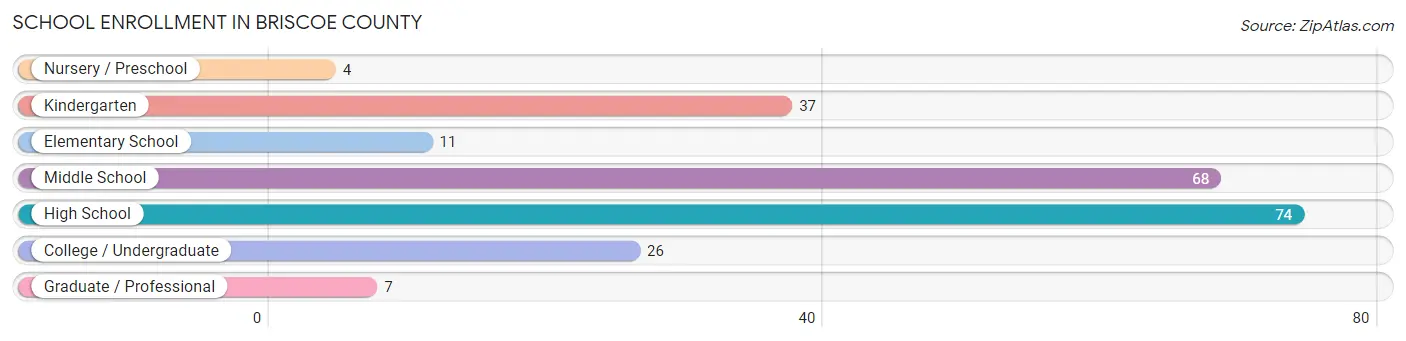
| School Level | # Students | % Students |
| Nursery / Preschool | 4 | 1.8% |
| Kindergarten | 37 | 16.3% |
| Elementary School | 11 | 4.9% |
| Middle School | 68 | 30.0% |
| High School | 74 | 32.6% |
| College / Undergraduate | 26 | 11.5% |
| Graduate / Professional | 7 | 3.1% |
| Total | 227 | 100.0% |
School Enrollment by Age by Funding Source in Briscoe County
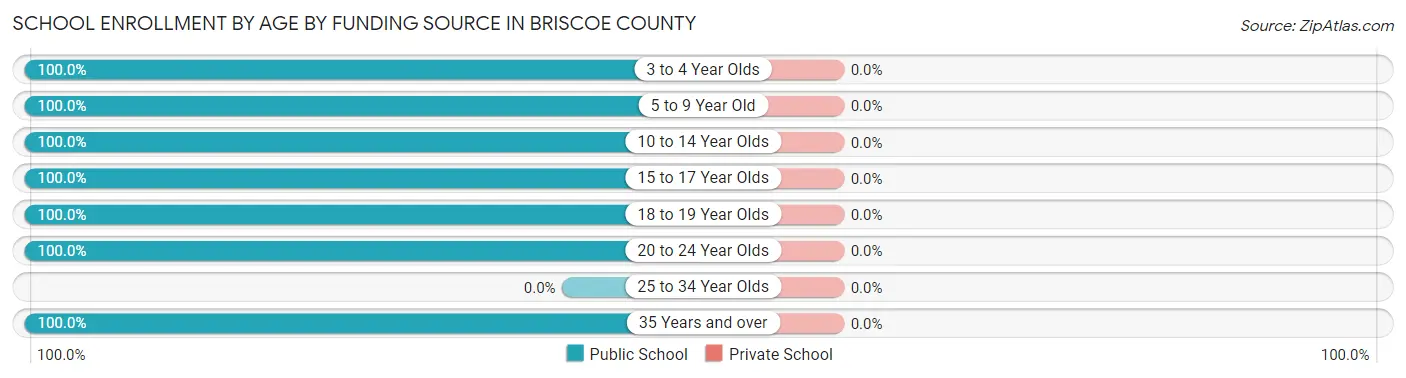
| Age Bracket | Public School | Private School |
| 3 to 4 Year Olds | 4 (100.0%) | 0 (0.0%) |
| 5 to 9 Year Old | 45 (100.0%) | 0 (0.0%) |
| 10 to 14 Year Olds | 83 (100.0%) | 0 (0.0%) |
| 15 to 17 Year Olds | 56 (100.0%) | 0 (0.0%) |
| 18 to 19 Year Olds | 13 (100.0%) | 0 (0.0%) |
| 20 to 24 Year Olds | 10 (100.0%) | 0 (0.0%) |
| 25 to 34 Year Olds | 0 (0.0%) | 0 (0.0%) |
| 35 Years and over | 16 (100.0%) | 0 (0.0%) |
| Total | 227 (100.0%) | 0 (0.0%) |
Educational Attainment by Field of Study in Briscoe County
Education (51 | 30.5%), bio, nature & agricultural (41 | 24.5%), business (19 | 11.4%), liberal arts & history (14 | 8.4%), and science & technology (12 | 7.2%) are the most common fields of study among 167 individuals in Briscoe County who have obtained a bachelor's degree or higher.
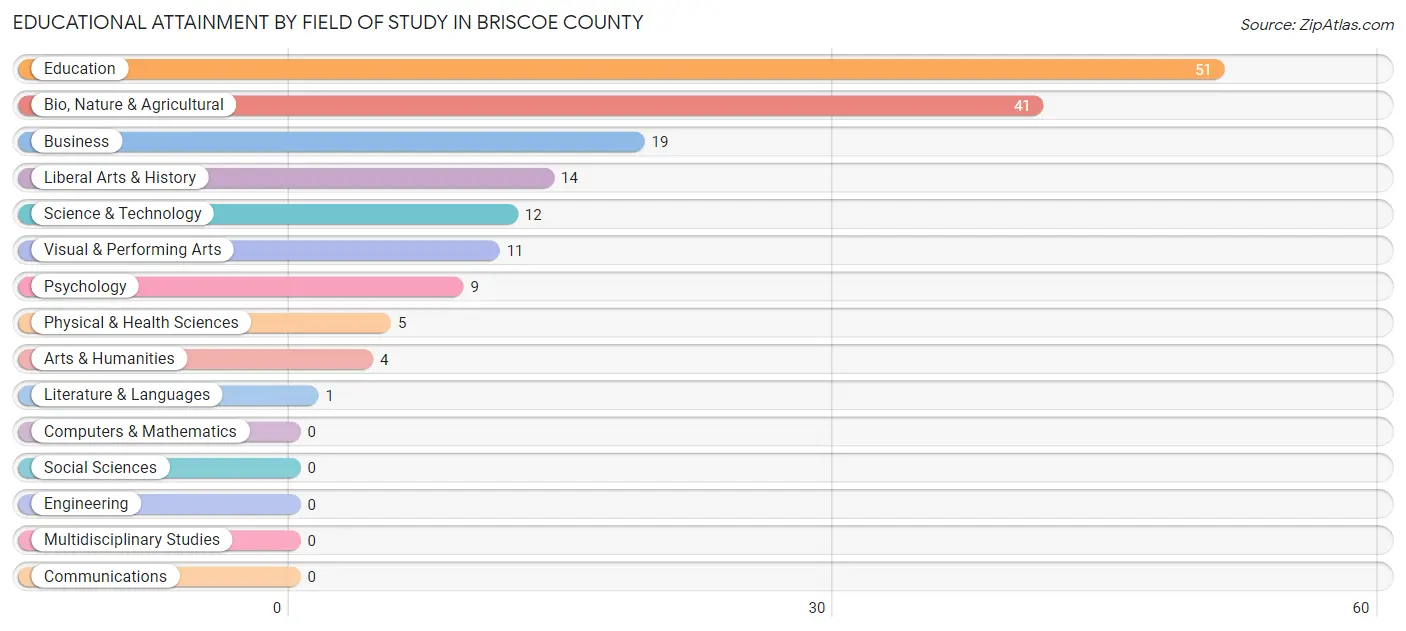
| Field of Study | # Graduates | % Graduates |
| Computers & Mathematics | 0 | 0.0% |
| Bio, Nature & Agricultural | 41 | 24.5% |
| Physical & Health Sciences | 5 | 3.0% |
| Psychology | 9 | 5.4% |
| Social Sciences | 0 | 0.0% |
| Engineering | 0 | 0.0% |
| Multidisciplinary Studies | 0 | 0.0% |
| Science & Technology | 12 | 7.2% |
| Business | 19 | 11.4% |
| Education | 51 | 30.5% |
| Literature & Languages | 1 | 0.6% |
| Liberal Arts & History | 14 | 8.4% |
| Visual & Performing Arts | 11 | 6.6% |
| Communications | 0 | 0.0% |
| Arts & Humanities | 4 | 2.4% |
| Total | 167 | 100.0% |
Transportation & Commute in Briscoe County
Vehicle Availability by Sex in Briscoe County
The most prevalent vehicle ownership categories in Briscoe County are males with 3 vehicles (105, accounting for 32.9%) and females with 3 vehicles (65, making up 59.3%).
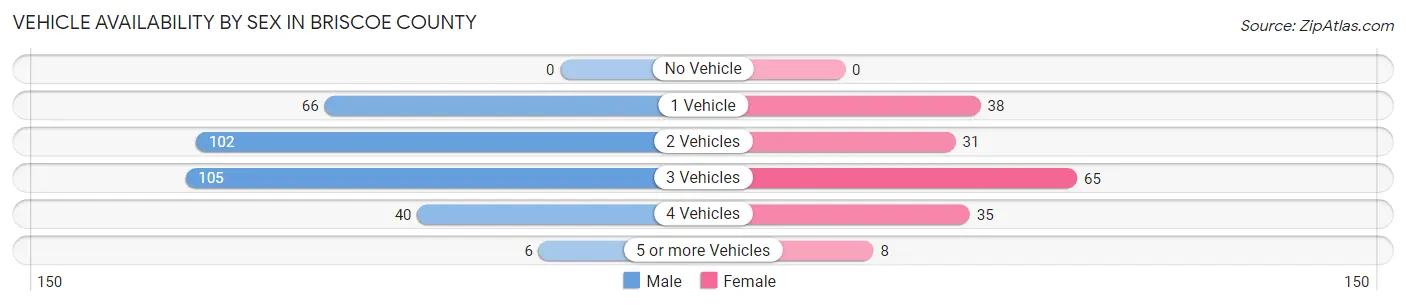
| Vehicles Available | Male | Female |
| No Vehicle | 0 (0.0%) | 0 (0.0%) |
| 1 Vehicle | 66 (20.7%) | 38 (21.5%) |
| 2 Vehicles | 102 (32.0%) | 31 (17.5%) |
| 3 Vehicles | 105 (32.9%) | 65 (36.7%) |
| 4 Vehicles | 40 (12.5%) | 35 (19.8%) |
| 5 or more Vehicles | 6 (1.9%) | 8 (4.5%) |
| Total | 319 (100.0%) | 177 (100.0%) |
Commute Time in Briscoe County
The most frequently occuring commute durations in Briscoe County are 15 to 19 minutes (78 commuters, 17.9%), less than 5 minutes (77 commuters, 17.7%), and 5 to 9 minutes (68 commuters, 15.6%).
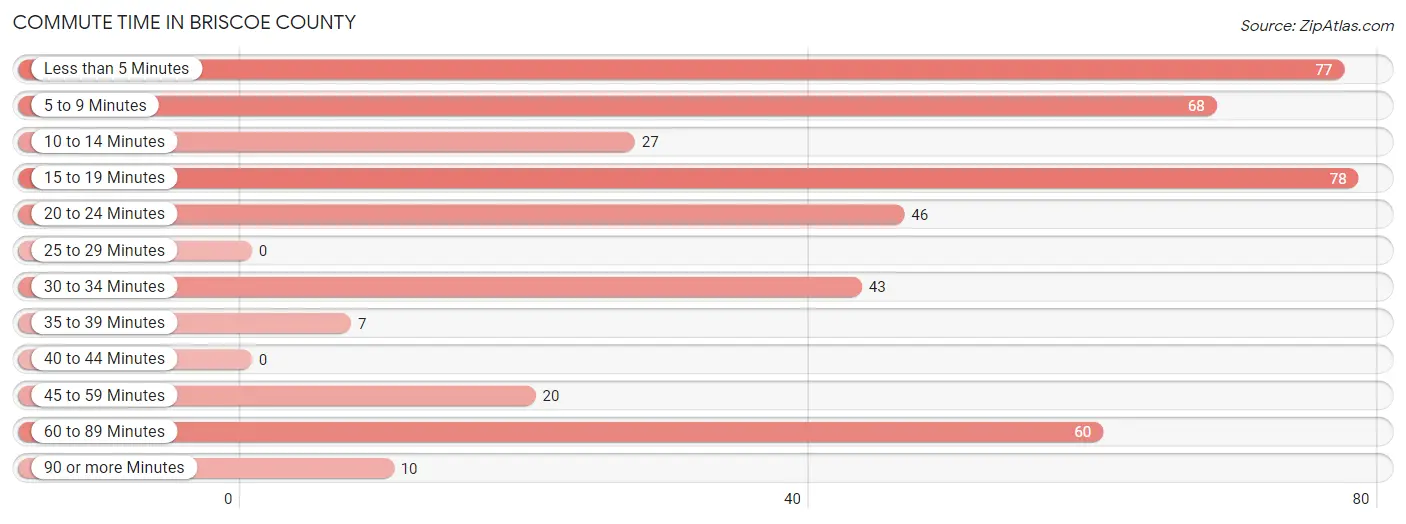
| Commute Time | # Commuters | % Commuters |
| Less than 5 Minutes | 77 | 17.7% |
| 5 to 9 Minutes | 68 | 15.6% |
| 10 to 14 Minutes | 27 | 6.2% |
| 15 to 19 Minutes | 78 | 17.9% |
| 20 to 24 Minutes | 46 | 10.5% |
| 25 to 29 Minutes | 0 | 0.0% |
| 30 to 34 Minutes | 43 | 9.9% |
| 35 to 39 Minutes | 7 | 1.6% |
| 40 to 44 Minutes | 0 | 0.0% |
| 45 to 59 Minutes | 20 | 4.6% |
| 60 to 89 Minutes | 60 | 13.8% |
| 90 or more Minutes | 10 | 2.3% |
Commute Time by Sex in Briscoe County
The most common commute times in Briscoe County are 60 to 89 minutes (51 commuters, 17.3%) for males and 15 to 19 minutes (43 commuters, 30.5%) for females.
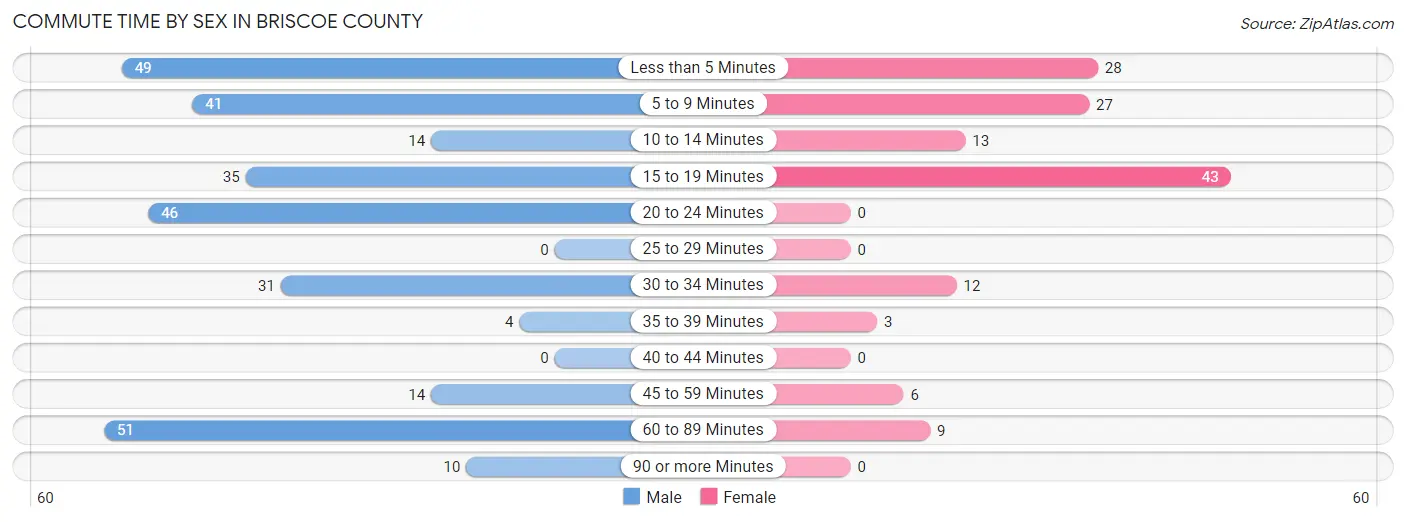
| Commute Time | Male | Female |
| Less than 5 Minutes | 49 (16.6%) | 28 (19.9%) |
| 5 to 9 Minutes | 41 (13.9%) | 27 (19.2%) |
| 10 to 14 Minutes | 14 (4.8%) | 13 (9.2%) |
| 15 to 19 Minutes | 35 (11.9%) | 43 (30.5%) |
| 20 to 24 Minutes | 46 (15.6%) | 0 (0.0%) |
| 25 to 29 Minutes | 0 (0.0%) | 0 (0.0%) |
| 30 to 34 Minutes | 31 (10.5%) | 12 (8.5%) |
| 35 to 39 Minutes | 4 (1.4%) | 3 (2.1%) |
| 40 to 44 Minutes | 0 (0.0%) | 0 (0.0%) |
| 45 to 59 Minutes | 14 (4.8%) | 6 (4.3%) |
| 60 to 89 Minutes | 51 (17.3%) | 9 (6.4%) |
| 90 or more Minutes | 10 (3.4%) | 0 (0.0%) |
Time of Departure to Work by Sex in Briscoe County
The most frequent times of departure to work in Briscoe County are 8:00 AM to 8:29 AM (98, 33.2%) for males and 7:30 AM to 7:59 AM (62, 44.0%) for females.
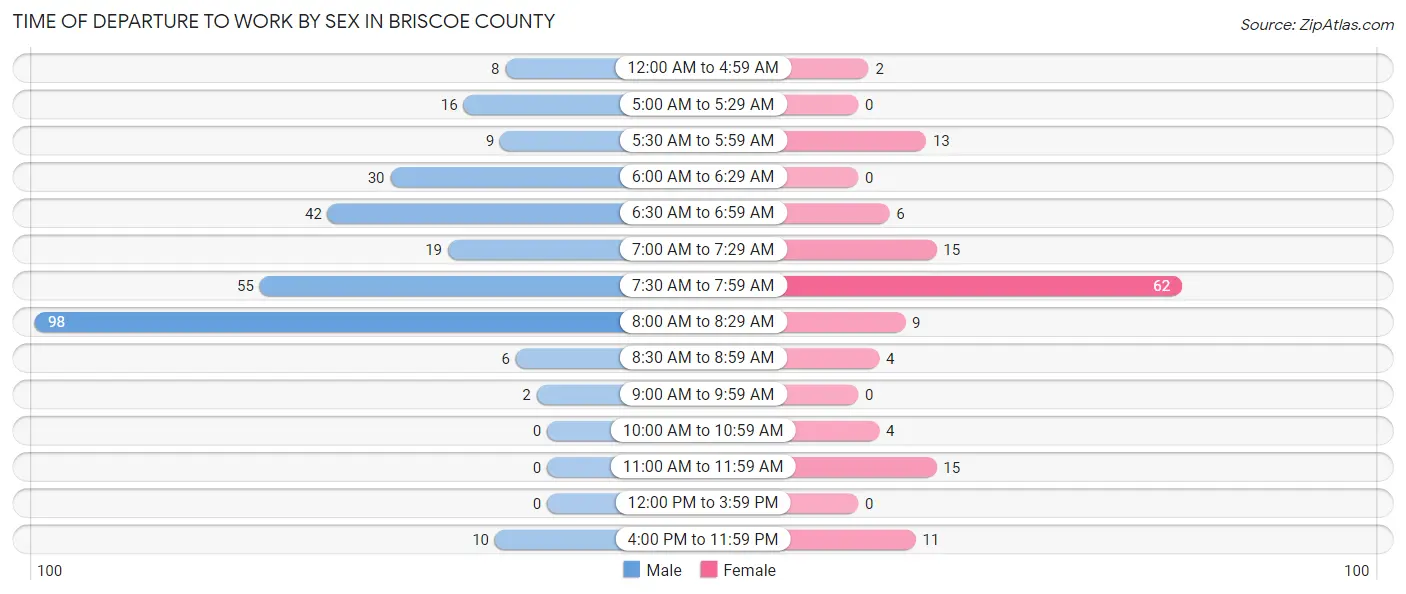
| Time of Departure | Male | Female |
| 12:00 AM to 4:59 AM | 8 (2.7%) | 2 (1.4%) |
| 5:00 AM to 5:29 AM | 16 (5.4%) | 0 (0.0%) |
| 5:30 AM to 5:59 AM | 9 (3.0%) | 13 (9.2%) |
| 6:00 AM to 6:29 AM | 30 (10.2%) | 0 (0.0%) |
| 6:30 AM to 6:59 AM | 42 (14.2%) | 6 (4.3%) |
| 7:00 AM to 7:29 AM | 19 (6.4%) | 15 (10.6%) |
| 7:30 AM to 7:59 AM | 55 (18.6%) | 62 (44.0%) |
| 8:00 AM to 8:29 AM | 98 (33.2%) | 9 (6.4%) |
| 8:30 AM to 8:59 AM | 6 (2.0%) | 4 (2.8%) |
| 9:00 AM to 9:59 AM | 2 (0.7%) | 0 (0.0%) |
| 10:00 AM to 10:59 AM | 0 (0.0%) | 4 (2.8%) |
| 11:00 AM to 11:59 AM | 0 (0.0%) | 15 (10.6%) |
| 12:00 PM to 3:59 PM | 0 (0.0%) | 0 (0.0%) |
| 4:00 PM to 11:59 PM | 10 (3.4%) | 11 (7.8%) |
| Total | 295 (100.0%) | 141 (100.0%) |
Housing Occupancy in Briscoe County
Occupancy by Ownership in Briscoe County
Of the total 581 dwellings in Briscoe County, owner-occupied units account for 430 (74.0%), while renter-occupied units make up 151 (26.0%).
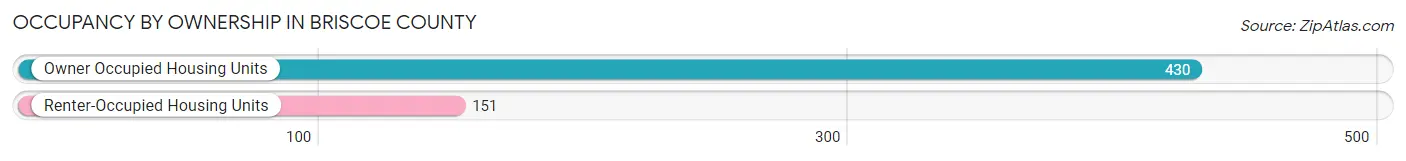
| Occupancy | # Housing Units | % Housing Units |
| Owner Occupied Housing Units | 430 | 74.0% |
| Renter-Occupied Housing Units | 151 | 26.0% |
| Total Occupied Housing Units | 581 | 100.0% |
Occupancy by Household Size in Briscoe County
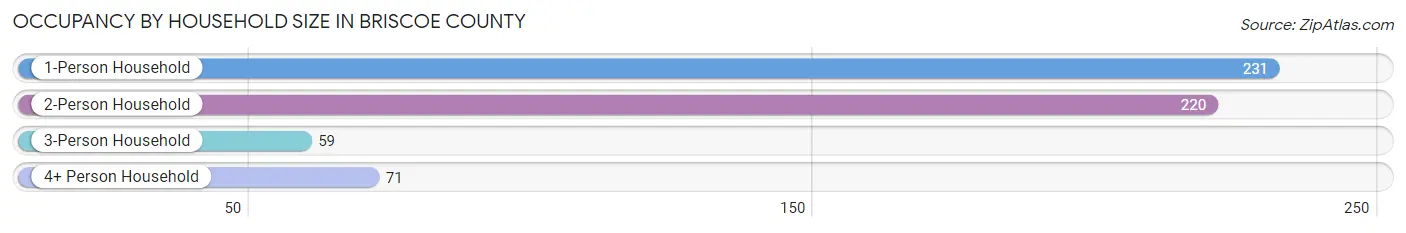
| Household Size | # Housing Units | % Housing Units |
| 1-Person Household | 231 | 39.8% |
| 2-Person Household | 220 | 37.9% |
| 3-Person Household | 59 | 10.2% |
| 4+ Person Household | 71 | 12.2% |
| Total Housing Units | 581 | 100.0% |
Occupancy by Ownership by Household Size in Briscoe County
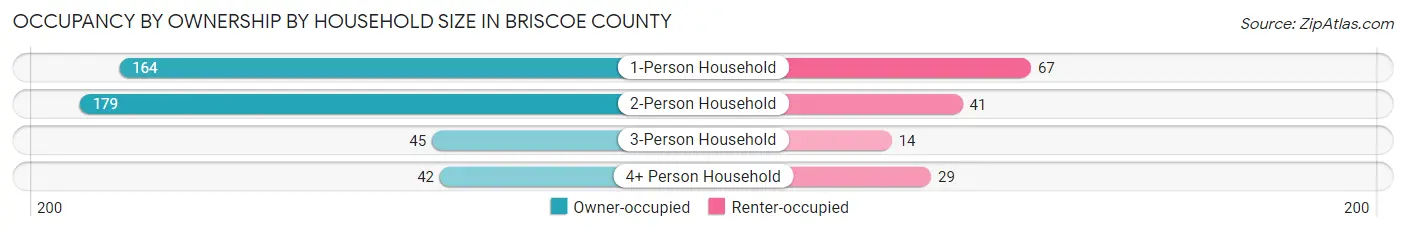
| Household Size | Owner-occupied | Renter-occupied |
| 1-Person Household | 164 (71.0%) | 67 (29.0%) |
| 2-Person Household | 179 (81.4%) | 41 (18.6%) |
| 3-Person Household | 45 (76.3%) | 14 (23.7%) |
| 4+ Person Household | 42 (59.2%) | 29 (40.8%) |
| Total Housing Units | 430 (74.0%) | 151 (26.0%) |
Occupancy by Educational Attainment in Briscoe County
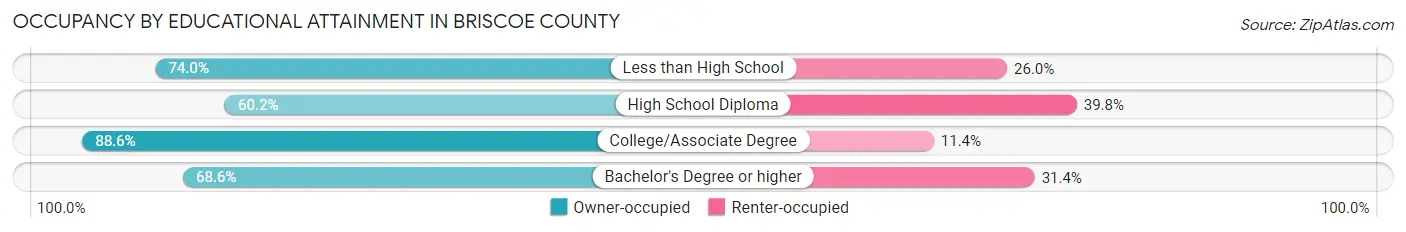
| Household Size | Owner-occupied | Renter-occupied |
| Less than High School | 77 (74.0%) | 27 (26.0%) |
| High School Diploma | 103 (60.2%) | 68 (39.8%) |
| College/Associate Degree | 178 (88.6%) | 23 (11.4%) |
| Bachelor's Degree or higher | 72 (68.6%) | 33 (31.4%) |
Occupancy by Age of Householder in Briscoe County
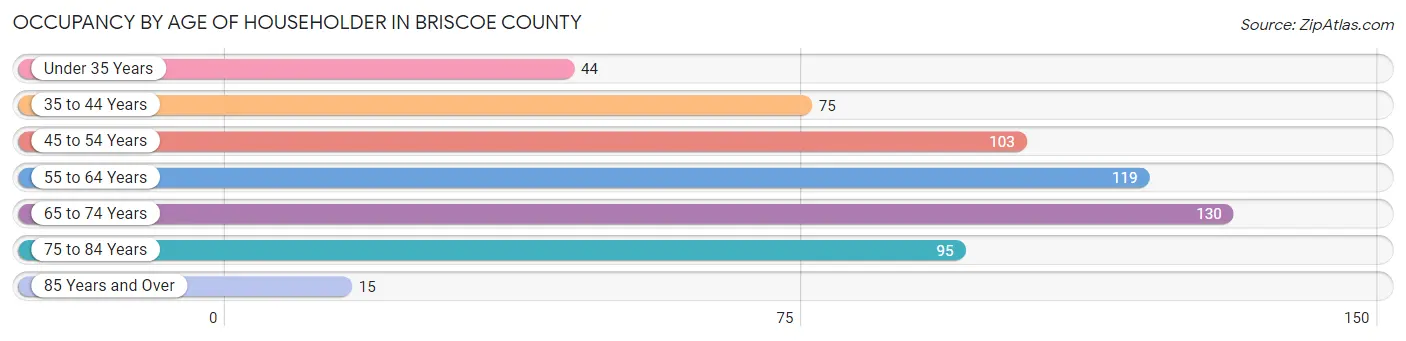
| Age Bracket | # Households | % Households |
| Under 35 Years | 44 | 7.6% |
| 35 to 44 Years | 75 | 12.9% |
| 45 to 54 Years | 103 | 17.7% |
| 55 to 64 Years | 119 | 20.5% |
| 65 to 74 Years | 130 | 22.4% |
| 75 to 84 Years | 95 | 16.4% |
| 85 Years and Over | 15 | 2.6% |
| Total | 581 | 100.0% |
Housing Finances in Briscoe County
Median Income by Occupancy in Briscoe County
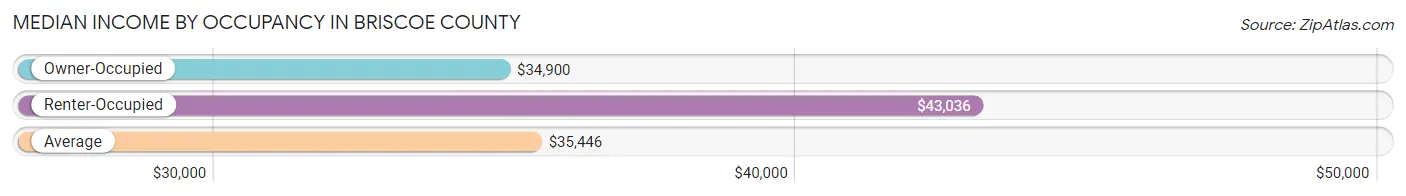
| Occupancy Type | # Households | Median Income |
| Owner-Occupied | 430 (74.0%) | $34,900 |
| Renter-Occupied | 151 (26.0%) | $43,036 |
| Average | 581 (100.0%) | $35,446 |
Occupancy by Householder Income Bracket in Briscoe County
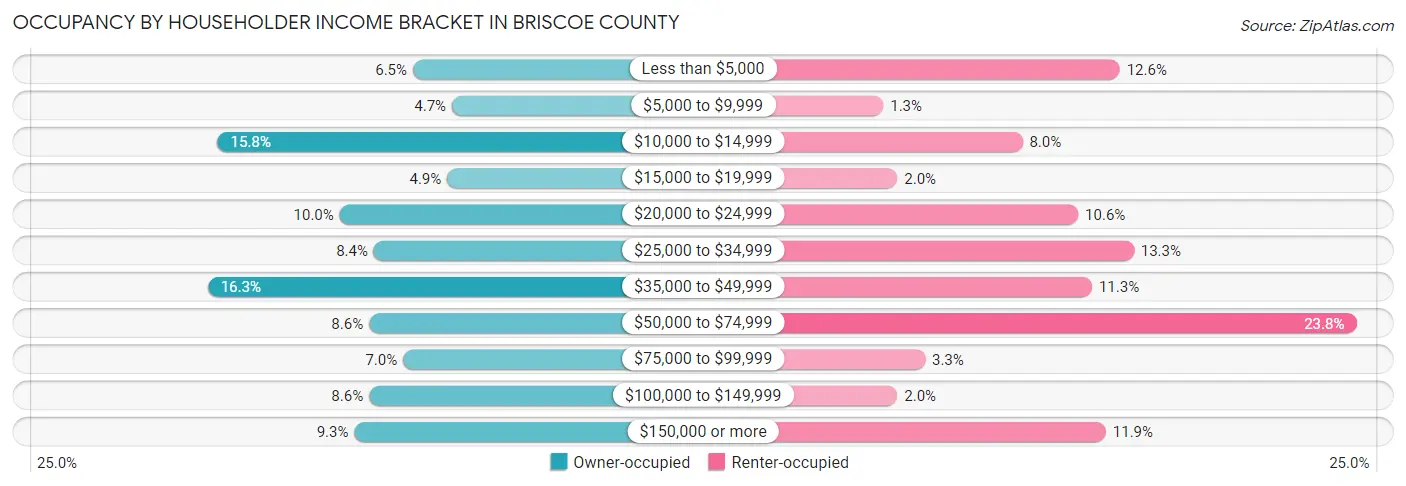
| Income Bracket | Owner-occupied | Renter-occupied |
| Less than $5,000 | 28 (6.5%) | 19 (12.6%) |
| $5,000 to $9,999 | 20 (4.6%) | 2 (1.3%) |
| $10,000 to $14,999 | 68 (15.8%) | 12 (8.0%) |
| $15,000 to $19,999 | 21 (4.9%) | 3 (2.0%) |
| $20,000 to $24,999 | 43 (10.0%) | 16 (10.6%) |
| $25,000 to $34,999 | 36 (8.4%) | 20 (13.3%) |
| $35,000 to $49,999 | 70 (16.3%) | 17 (11.3%) |
| $50,000 to $74,999 | 37 (8.6%) | 36 (23.8%) |
| $75,000 to $99,999 | 30 (7.0%) | 5 (3.3%) |
| $100,000 to $149,999 | 37 (8.6%) | 3 (2.0%) |
| $150,000 or more | 40 (9.3%) | 18 (11.9%) |
| Total | 430 (100.0%) | 151 (100.0%) |
Monthly Housing Cost Tiers in Briscoe County
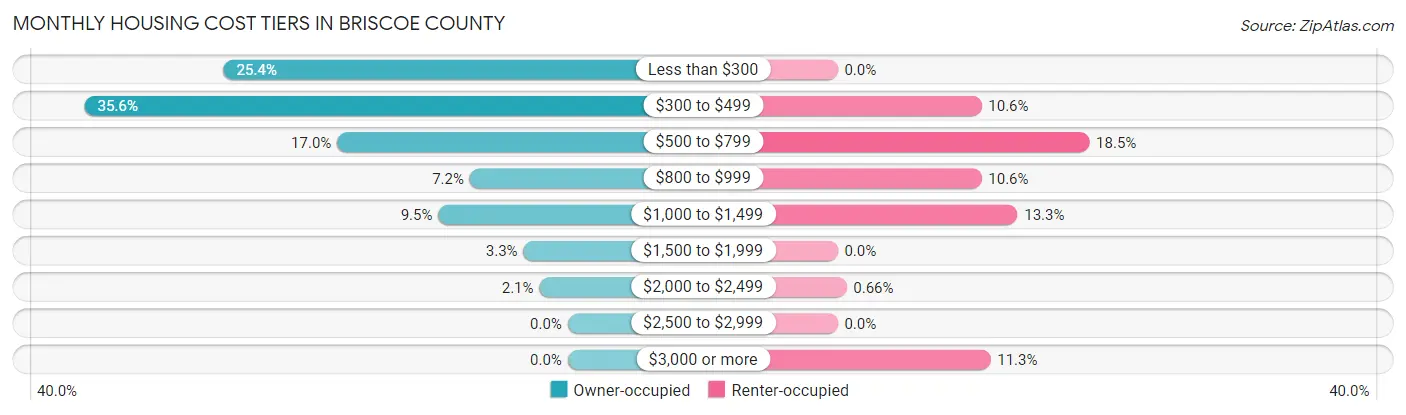
| Monthly Cost | Owner-occupied | Renter-occupied |
| Less than $300 | 109 (25.4%) | 0 (0.0%) |
| $300 to $499 | 153 (35.6%) | 16 (10.6%) |
| $500 to $799 | 73 (17.0%) | 28 (18.5%) |
| $800 to $999 | 31 (7.2%) | 16 (10.6%) |
| $1,000 to $1,499 | 41 (9.5%) | 20 (13.3%) |
| $1,500 to $1,999 | 14 (3.3%) | 0 (0.0%) |
| $2,000 to $2,499 | 9 (2.1%) | 1 (0.7%) |
| $2,500 to $2,999 | 0 (0.0%) | 0 (0.0%) |
| $3,000 or more | 0 (0.0%) | 17 (11.3%) |
| Total | 430 (100.0%) | 151 (100.0%) |
Physical Housing Characteristics in Briscoe County
Housing Structures in Briscoe County
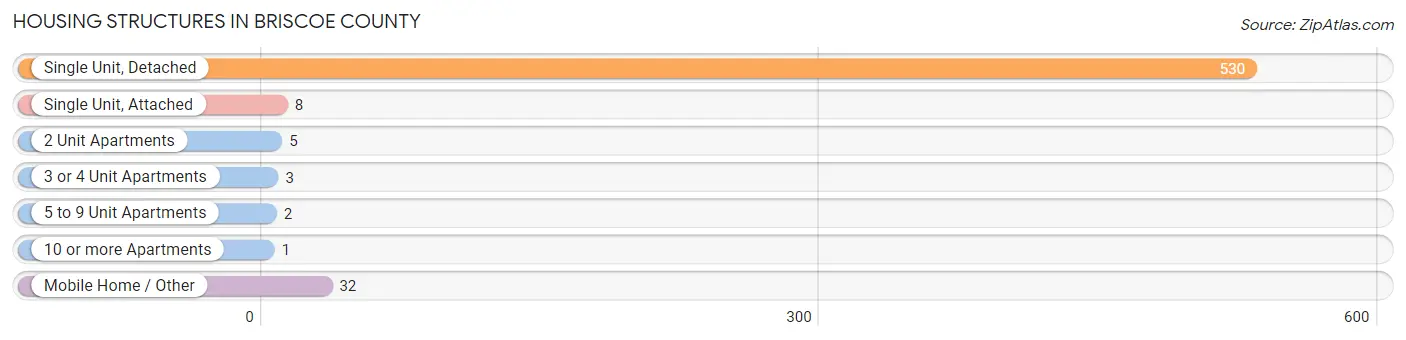
| Structure Type | # Housing Units | % Housing Units |
| Single Unit, Detached | 530 | 91.2% |
| Single Unit, Attached | 8 | 1.4% |
| 2 Unit Apartments | 5 | 0.9% |
| 3 or 4 Unit Apartments | 3 | 0.5% |
| 5 to 9 Unit Apartments | 2 | 0.3% |
| 10 or more Apartments | 1 | 0.2% |
| Mobile Home / Other | 32 | 5.5% |
| Total | 581 | 100.0% |
Housing Structures by Occupancy in Briscoe County
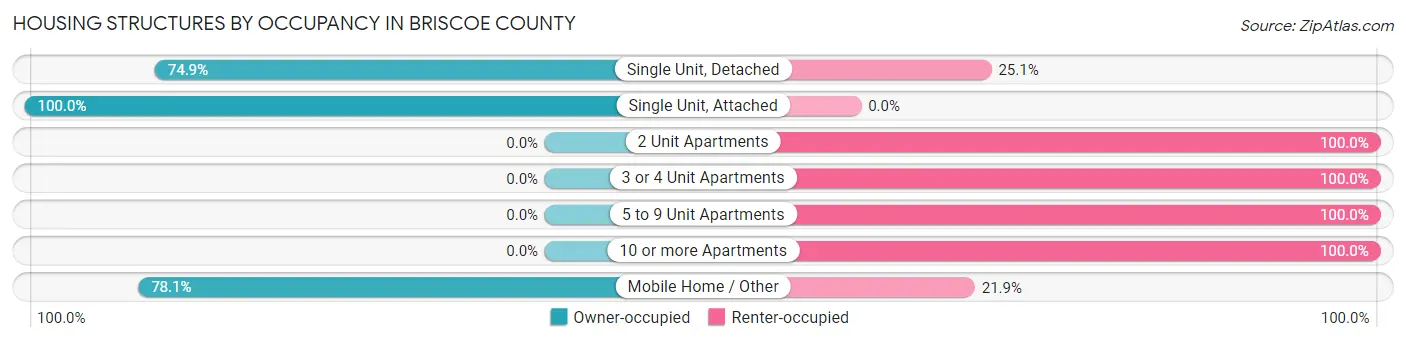
| Structure Type | Owner-occupied | Renter-occupied |
| Single Unit, Detached | 397 (74.9%) | 133 (25.1%) |
| Single Unit, Attached | 8 (100.0%) | 0 (0.0%) |
| 2 Unit Apartments | 0 (0.0%) | 5 (100.0%) |
| 3 or 4 Unit Apartments | 0 (0.0%) | 3 (100.0%) |
| 5 to 9 Unit Apartments | 0 (0.0%) | 2 (100.0%) |
| 10 or more Apartments | 0 (0.0%) | 1 (100.0%) |
| Mobile Home / Other | 25 (78.1%) | 7 (21.9%) |
| Total | 430 (74.0%) | 151 (26.0%) |
Housing Structures by Number of Rooms in Briscoe County
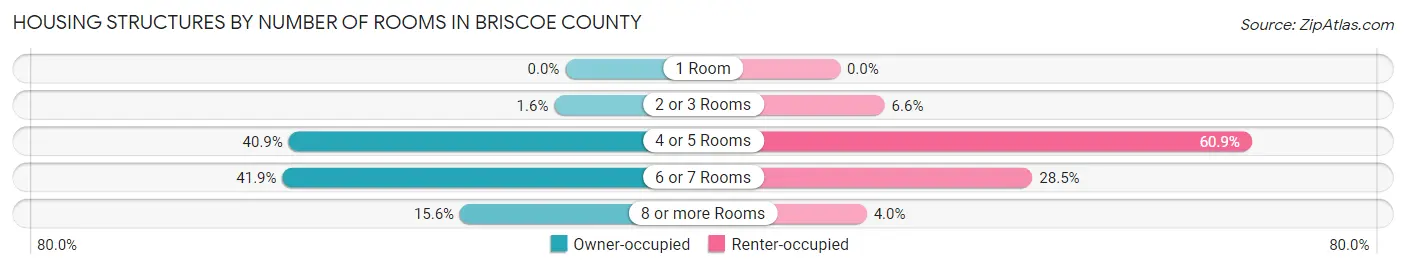
| Number of Rooms | Owner-occupied | Renter-occupied |
| 1 Room | 0 (0.0%) | 0 (0.0%) |
| 2 or 3 Rooms | 7 (1.6%) | 10 (6.6%) |
| 4 or 5 Rooms | 176 (40.9%) | 92 (60.9%) |
| 6 or 7 Rooms | 180 (41.9%) | 43 (28.5%) |
| 8 or more Rooms | 67 (15.6%) | 6 (4.0%) |
| Total | 430 (100.0%) | 151 (100.0%) |
Housing Structure by Heating Type in Briscoe County
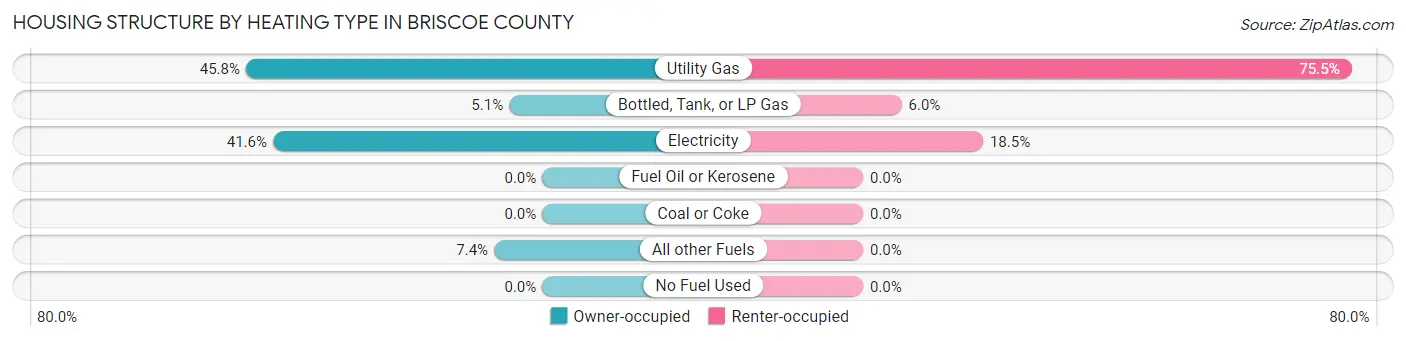
| Heating Type | Owner-occupied | Renter-occupied |
| Utility Gas | 197 (45.8%) | 114 (75.5%) |
| Bottled, Tank, or LP Gas | 22 (5.1%) | 9 (6.0%) |
| Electricity | 179 (41.6%) | 28 (18.5%) |
| Fuel Oil or Kerosene | 0 (0.0%) | 0 (0.0%) |
| Coal or Coke | 0 (0.0%) | 0 (0.0%) |
| All other Fuels | 32 (7.4%) | 0 (0.0%) |
| No Fuel Used | 0 (0.0%) | 0 (0.0%) |
| Total | 430 (100.0%) | 151 (100.0%) |
Household Vehicle Usage in Briscoe County
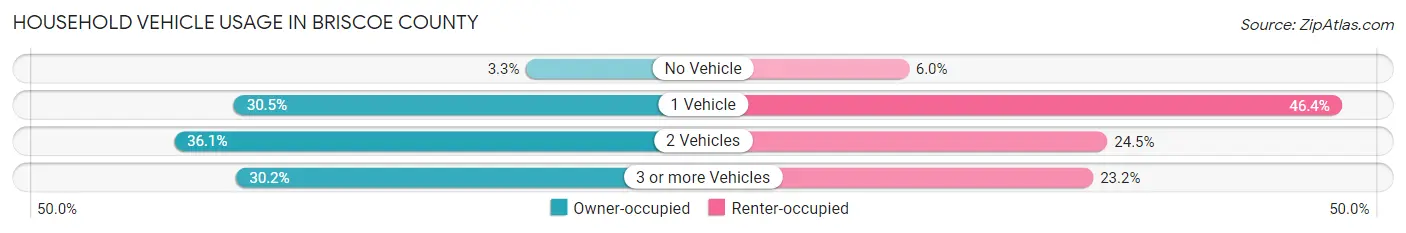
| Vehicles per Household | Owner-occupied | Renter-occupied |
| No Vehicle | 14 (3.3%) | 9 (6.0%) |
| 1 Vehicle | 131 (30.5%) | 70 (46.4%) |
| 2 Vehicles | 155 (36.0%) | 37 (24.5%) |
| 3 or more Vehicles | 130 (30.2%) | 35 (23.2%) |
| Total | 430 (100.0%) | 151 (100.0%) |
Real Estate & Mortgages in Briscoe County
Real Estate and Mortgage Overview in Briscoe County
| Characteristic | Without Mortgage | With Mortgage |
| Housing Units | 347 | 83 |
| Median Property Value | $71,900 | $105,400 |
| Median Household Income | $32,850 | $12 |
| Monthly Housing Costs | $362 | $0 |
| Real Estate Taxes | $724 | $15 |
Property Value by Mortgage Status in Briscoe County
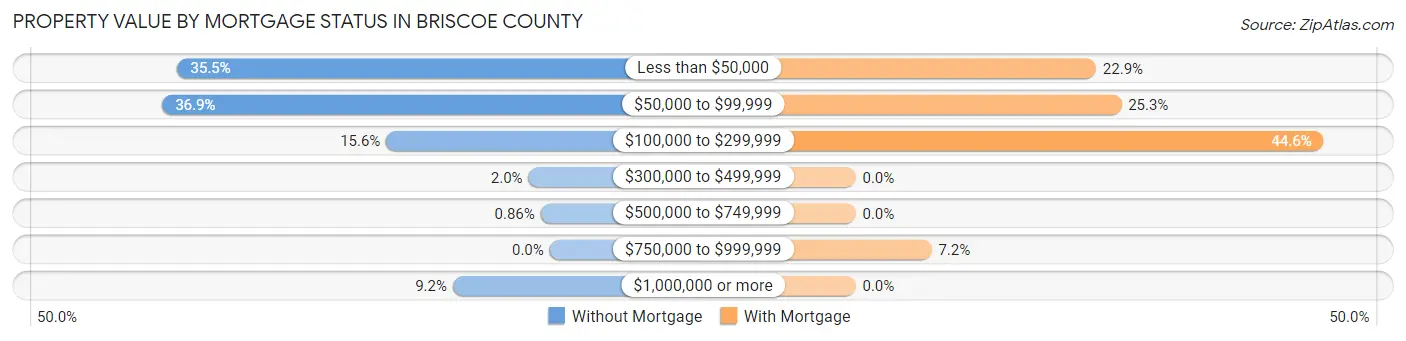
| Property Value | Without Mortgage | With Mortgage |
| Less than $50,000 | 123 (35.4%) | 19 (22.9%) |
| $50,000 to $99,999 | 128 (36.9%) | 21 (25.3%) |
| $100,000 to $299,999 | 54 (15.6%) | 37 (44.6%) |
| $300,000 to $499,999 | 7 (2.0%) | 0 (0.0%) |
| $500,000 to $749,999 | 3 (0.9%) | 0 (0.0%) |
| $750,000 to $999,999 | 0 (0.0%) | 6 (7.2%) |
| $1,000,000 or more | 32 (9.2%) | 0 (0.0%) |
| Total | 347 (100.0%) | 83 (100.0%) |
Household Income by Mortgage Status in Briscoe County
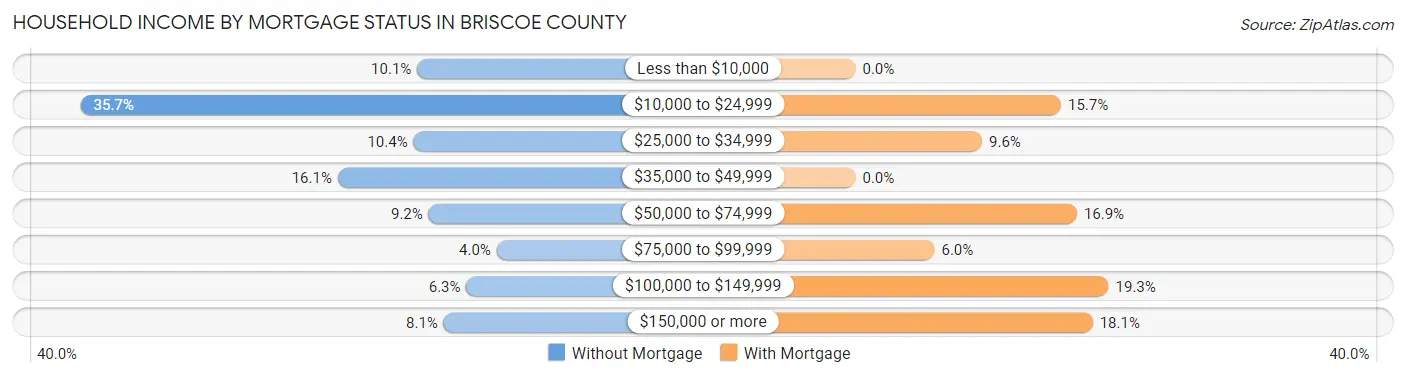
| Household Income | Without Mortgage | With Mortgage |
| Less than $10,000 | 35 (10.1%) | 0 (0.0%) |
| $10,000 to $24,999 | 124 (35.7%) | 13 (15.7%) |
| $25,000 to $34,999 | 36 (10.4%) | 8 (9.6%) |
| $35,000 to $49,999 | 56 (16.1%) | 0 (0.0%) |
| $50,000 to $74,999 | 32 (9.2%) | 14 (16.9%) |
| $75,000 to $99,999 | 14 (4.0%) | 5 (6.0%) |
| $100,000 to $149,999 | 22 (6.3%) | 16 (19.3%) |
| $150,000 or more | 28 (8.1%) | 15 (18.1%) |
| Total | 347 (100.0%) | 83 (100.0%) |
Property Value to Household Income Ratio in Briscoe County
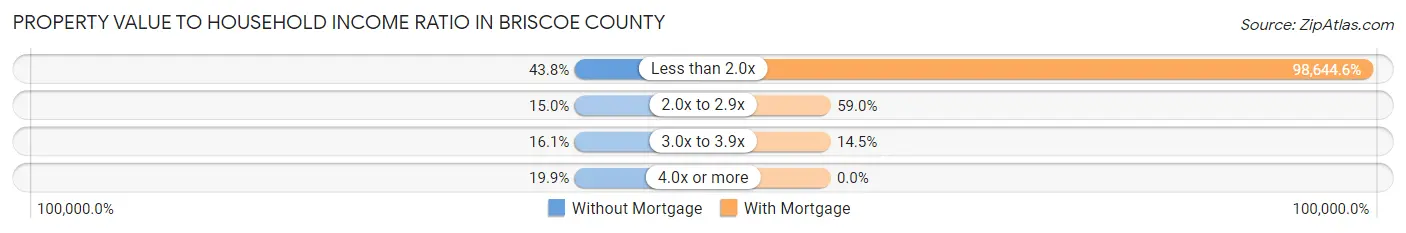
| Value-to-Income Ratio | Without Mortgage | With Mortgage |
| Less than 2.0x | 152 (43.8%) | 81,875 (98,644.6%) |
| 2.0x to 2.9x | 52 (15.0%) | 49 (59.0%) |
| 3.0x to 3.9x | 56 (16.1%) | 12 (14.5%) |
| 4.0x or more | 69 (19.9%) | 0 (0.0%) |
| Total | 347 (100.0%) | 83 (100.0%) |
Real Estate Taxes by Mortgage Status in Briscoe County
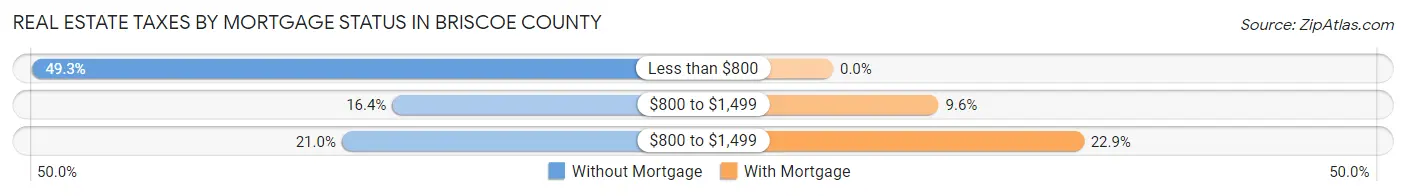
| Property Taxes | Without Mortgage | With Mortgage |
| Less than $800 | 171 (49.3%) | 0 (0.0%) |
| $800 to $1,499 | 57 (16.4%) | 8 (9.6%) |
| $800 to $1,499 | 73 (21.0%) | 19 (22.9%) |
| Total | 347 (100.0%) | 83 (100.0%) |
Health & Disability in Briscoe County
Health Insurance Coverage by Age in Briscoe County
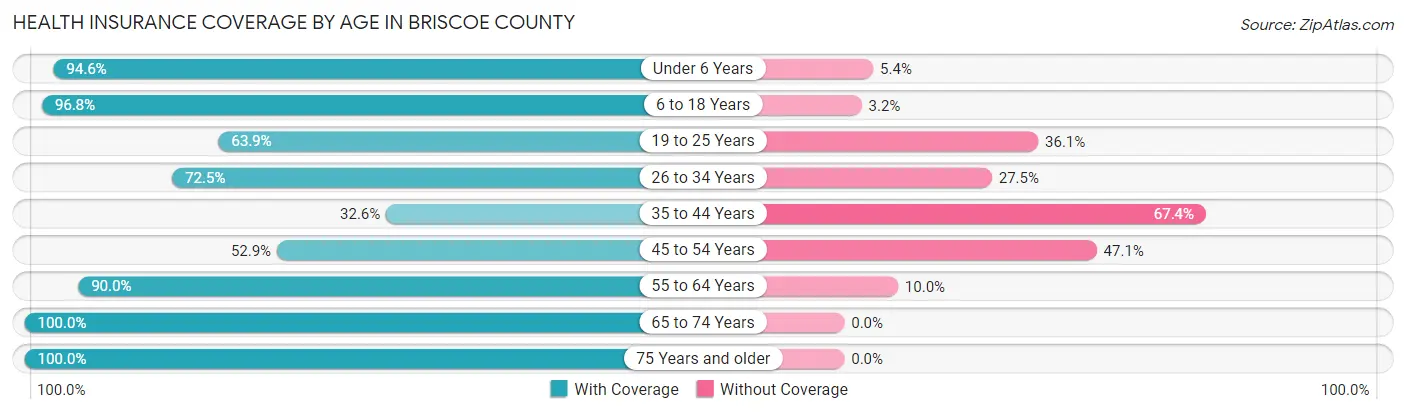
| Age Bracket | With Coverage | Without Coverage |
| Under 6 Years | 88 (94.6%) | 5 (5.4%) |
| 6 to 18 Years | 150 (96.8%) | 5 (3.2%) |
| 19 to 25 Years | 53 (63.9%) | 30 (36.1%) |
| 26 to 34 Years | 58 (72.5%) | 22 (27.5%) |
| 35 to 44 Years | 58 (32.6%) | 120 (67.4%) |
| 45 to 54 Years | 81 (52.9%) | 72 (47.1%) |
| 55 to 64 Years | 144 (90.0%) | 16 (10.0%) |
| 65 to 74 Years | 244 (100.0%) | 0 (0.0%) |
| 75 Years and older | 144 (100.0%) | 0 (0.0%) |
| Total | 1,020 (79.1%) | 270 (20.9%) |
Health Insurance Coverage by Citizenship Status in Briscoe County
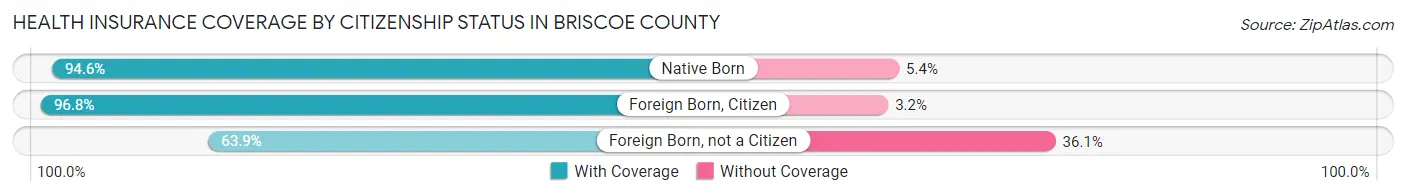
| Citizenship Status | With Coverage | Without Coverage |
| Native Born | 88 (94.6%) | 5 (5.4%) |
| Foreign Born, Citizen | 150 (96.8%) | 5 (3.2%) |
| Foreign Born, not a Citizen | 53 (63.9%) | 30 (36.1%) |
Health Insurance Coverage by Household Income in Briscoe County
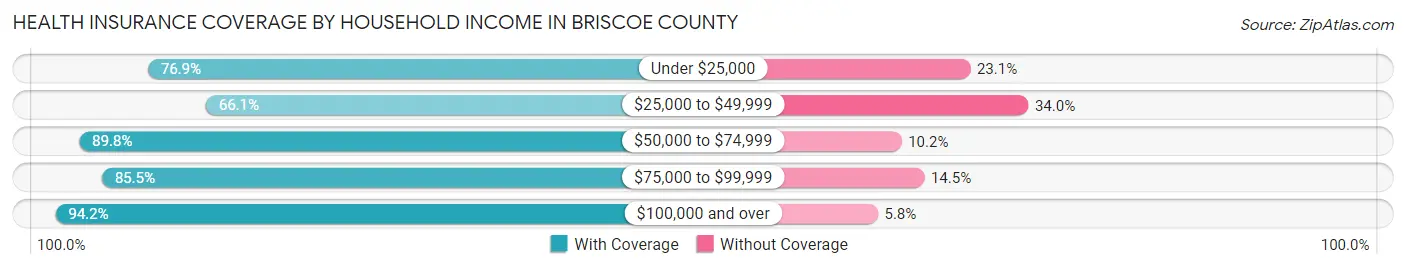
| Household Income | With Coverage | Without Coverage |
| Under $25,000 | 260 (76.9%) | 78 (23.1%) |
| $25,000 to $49,999 | 284 (66.0%) | 146 (34.0%) |
| $50,000 to $74,999 | 176 (89.8%) | 20 (10.2%) |
| $75,000 to $99,999 | 71 (85.5%) | 12 (14.5%) |
| $100,000 and over | 229 (94.2%) | 14 (5.8%) |
Public vs Private Health Insurance Coverage by Age in Briscoe County
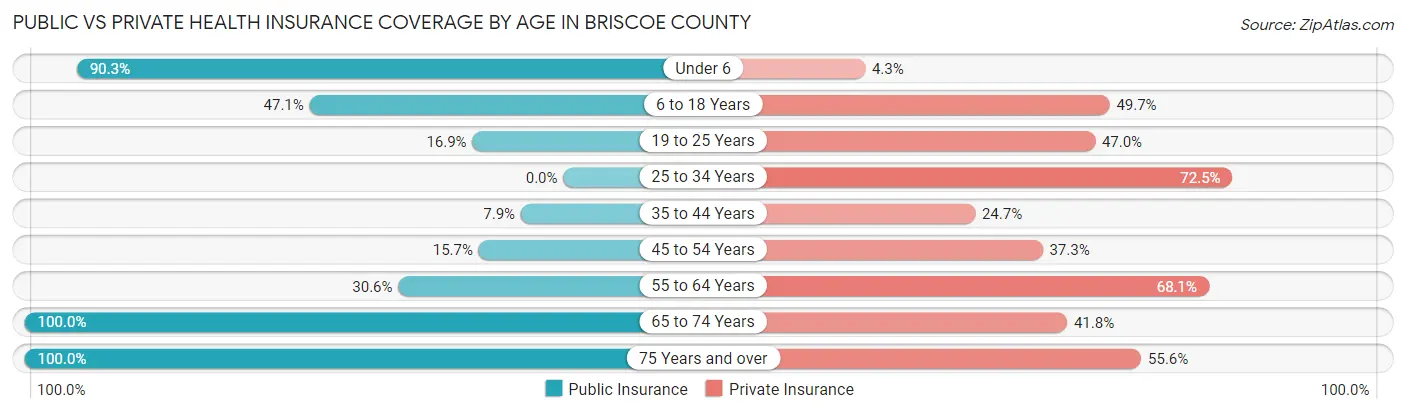
| Age Bracket | Public Insurance | Private Insurance |
| Under 6 | 84 (90.3%) | 4 (4.3%) |
| 6 to 18 Years | 73 (47.1%) | 77 (49.7%) |
| 19 to 25 Years | 14 (16.9%) | 39 (47.0%) |
| 25 to 34 Years | 0 (0.0%) | 58 (72.5%) |
| 35 to 44 Years | 14 (7.9%) | 44 (24.7%) |
| 45 to 54 Years | 24 (15.7%) | 57 (37.2%) |
| 55 to 64 Years | 49 (30.6%) | 109 (68.1%) |
| 65 to 74 Years | 244 (100.0%) | 102 (41.8%) |
| 75 Years and over | 144 (100.0%) | 80 (55.6%) |
| Total | 646 (50.1%) | 570 (44.2%) |
Disability Status by Sex by Age in Briscoe County
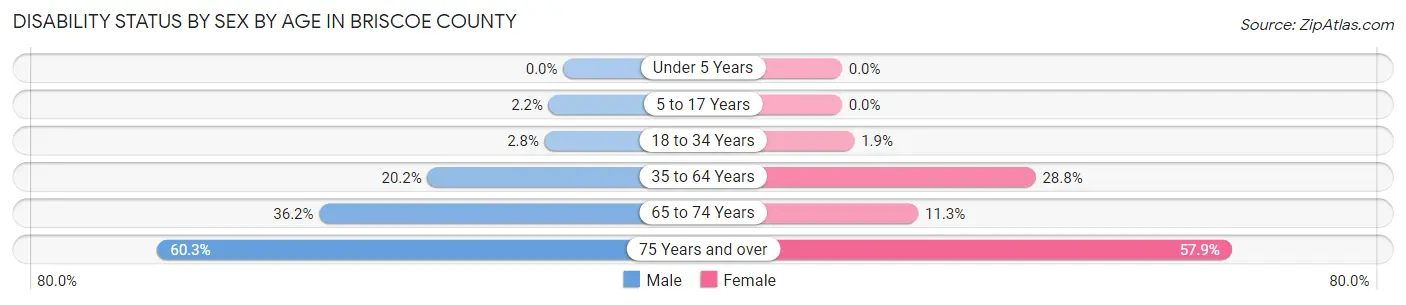
| Age Bracket | Male | Female |
| Under 5 Years | 0 (0.0%) | 0 (0.0%) |
| 5 to 17 Years | 2 (2.1%) | 0 (0.0%) |
| 18 to 34 Years | 3 (2.8%) | 1 (1.8%) |
| 35 to 64 Years | 52 (20.2%) | 67 (28.8%) |
| 65 to 74 Years | 50 (36.2%) | 12 (11.3%) |
| 75 Years and over | 41 (60.3%) | 44 (57.9%) |
Disability Class by Sex by Age in Briscoe County
Disability Class: Hearing Difficulty
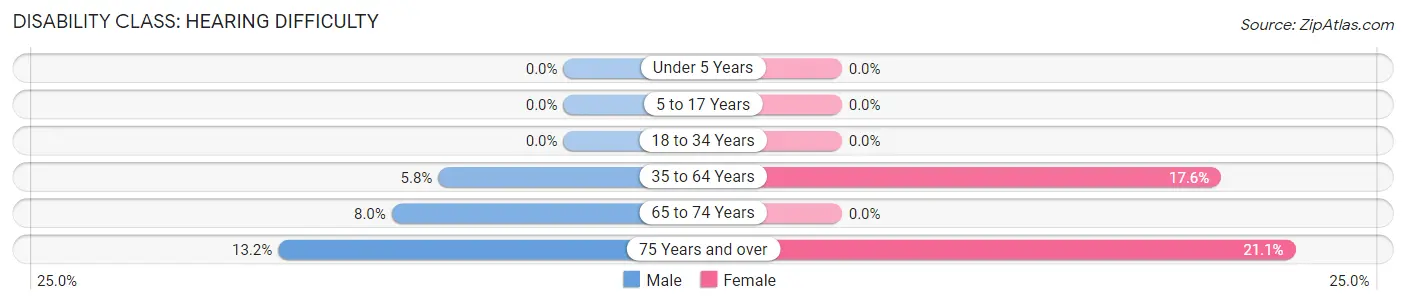
| Age Bracket | Male | Female |
| Under 5 Years | 0 (0.0%) | 0 (0.0%) |
| 5 to 17 Years | 0 (0.0%) | 0 (0.0%) |
| 18 to 34 Years | 0 (0.0%) | 0 (0.0%) |
| 35 to 64 Years | 15 (5.8%) | 41 (17.6%) |
| 65 to 74 Years | 11 (8.0%) | 0 (0.0%) |
| 75 Years and over | 9 (13.2%) | 16 (21.0%) |
Disability Class: Vision Difficulty
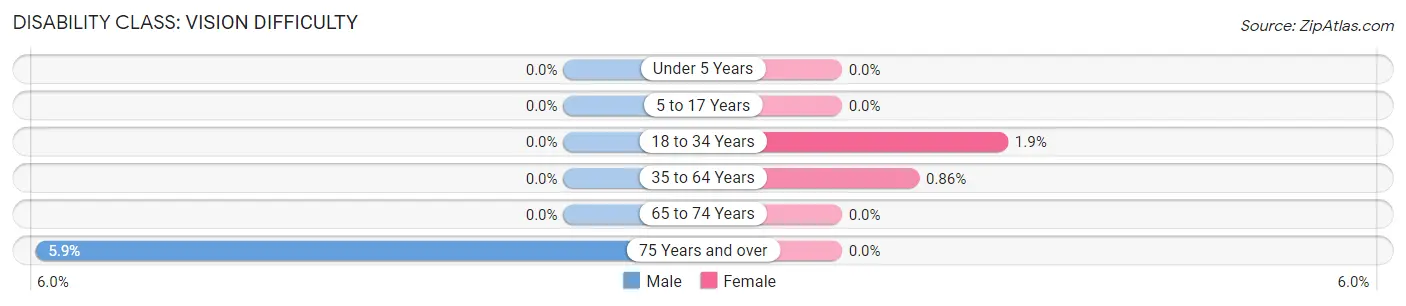
| Age Bracket | Male | Female |
| Under 5 Years | 0 (0.0%) | 0 (0.0%) |
| 5 to 17 Years | 0 (0.0%) | 0 (0.0%) |
| 18 to 34 Years | 0 (0.0%) | 1 (1.8%) |
| 35 to 64 Years | 0 (0.0%) | 2 (0.9%) |
| 65 to 74 Years | 0 (0.0%) | 0 (0.0%) |
| 75 Years and over | 4 (5.9%) | 0 (0.0%) |
Disability Class: Cognitive Difficulty
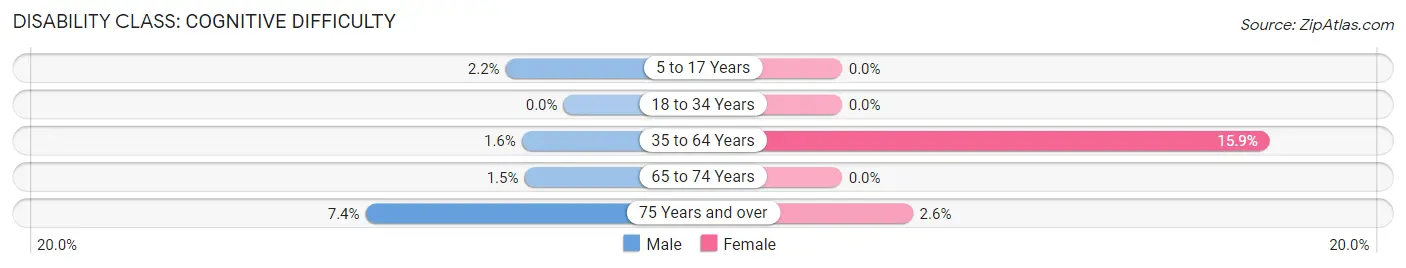
| Age Bracket | Male | Female |
| 5 to 17 Years | 2 (2.1%) | 0 (0.0%) |
| 18 to 34 Years | 0 (0.0%) | 0 (0.0%) |
| 35 to 64 Years | 4 (1.5%) | 37 (15.9%) |
| 65 to 74 Years | 2 (1.5%) | 0 (0.0%) |
| 75 Years and over | 5 (7.3%) | 2 (2.6%) |
Disability Class: Ambulatory Difficulty
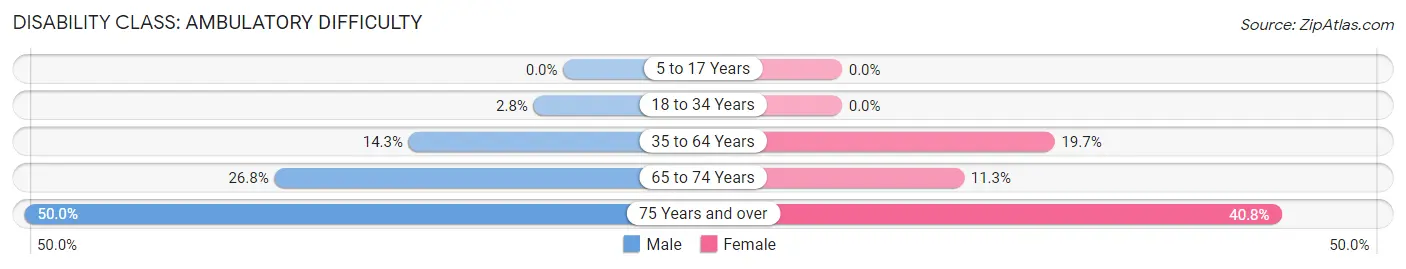
| Age Bracket | Male | Female |
| 5 to 17 Years | 0 (0.0%) | 0 (0.0%) |
| 18 to 34 Years | 3 (2.8%) | 0 (0.0%) |
| 35 to 64 Years | 37 (14.3%) | 46 (19.7%) |
| 65 to 74 Years | 37 (26.8%) | 12 (11.3%) |
| 75 Years and over | 34 (50.0%) | 31 (40.8%) |
Disability Class: Self-Care Difficulty
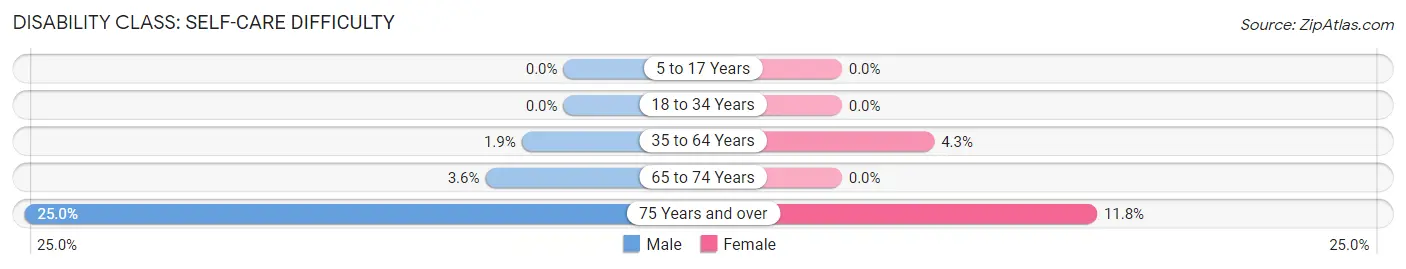
| Age Bracket | Male | Female |
| 5 to 17 Years | 0 (0.0%) | 0 (0.0%) |
| 18 to 34 Years | 0 (0.0%) | 0 (0.0%) |
| 35 to 64 Years | 5 (1.9%) | 10 (4.3%) |
| 65 to 74 Years | 5 (3.6%) | 0 (0.0%) |
| 75 Years and over | 17 (25.0%) | 9 (11.8%) |
Technology Access in Briscoe County
Computing Device Access in Briscoe County
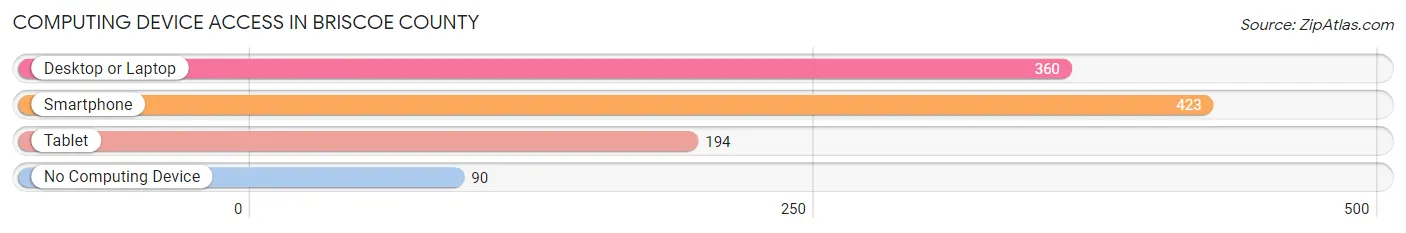
| Device Type | # Households | % Households |
| Desktop or Laptop | 360 | 62.0% |
| Smartphone | 423 | 72.8% |
| Tablet | 194 | 33.4% |
| No Computing Device | 90 | 15.5% |
| Total | 581 | 100.0% |
Internet Access in Briscoe County
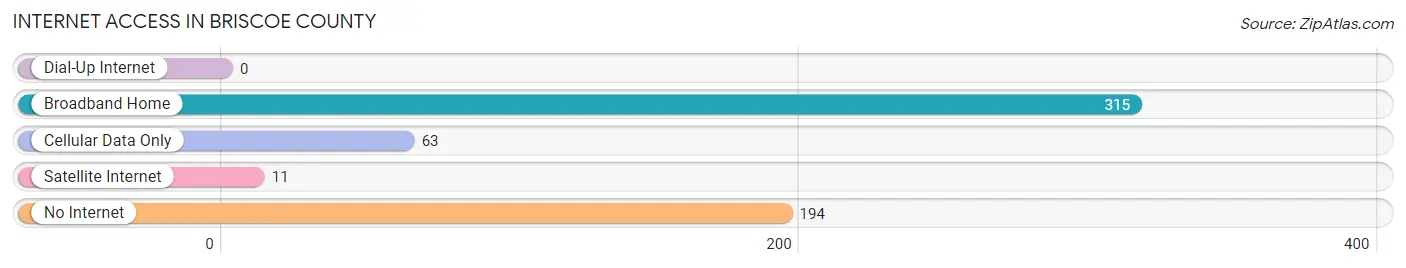
| Internet Type | # Households | % Households |
| Dial-Up Internet | 0 | 0.0% |
| Broadband Home | 315 | 54.2% |
| Cellular Data Only | 63 | 10.8% |
| Satellite Internet | 11 | 1.9% |
| No Internet | 194 | 33.4% |
| Total | 581 | 100.0% |
Briscoe County Summary
Briscoe County is located in the northern part of the Texas Panhandle, in the South Plains region of the state. It is bordered by Deaf Smith County to the north, Randall County to the east, Floyd County to the south, and Parmer County to the west. The county seat is Silverton, and the largest city is Silverton. The county has a total area of 902 square miles, of which 899 square miles is land and 3 square miles is water.
History
Briscoe County was established in 1876 and named for Andrew Briscoe, a signer of the Texas Declaration of Independence. The county was originally part of Young County, but was later divided into two parts, with the western part becoming Briscoe County. The county was organized in 1892, and the first county seat was located in Silverton.
Geography
Briscoe County is located in the northern part of the Texas Panhandle, in the South Plains region of the state. It is bordered by Deaf Smith County to the north, Randall County to the east, Floyd County to the south, and Parmer County to the west. The county has a total area of 902 square miles, of which 899 square miles is land and 3 square miles is water.
The terrain of the county is mostly flat, with some rolling hills in the western part of the county. The county is drained by the Canadian River and its tributaries, including the White River, the Red River, and the Salt Fork of the Brazos River. The county is home to several small lakes, including Lake Mackenzie, Lake Silverton, and Lake Briscoe.
Economy
The economy of Briscoe County is largely based on agriculture and ranching. The county is home to several large ranches, including the 6666 Ranch, the Pitchfork Ranch, and the Matador Ranch. The county is also home to several large farms, which produce cotton, wheat, sorghum, and other crops.
The county is also home to several oil and gas fields, which produce natural gas and crude oil. The county is home to several wind farms, which generate electricity for the region.
Demographics
As of the 2010 census, there were 1,622 people, 645 households, and 463 families living in the county. The population density was 2 people per square mile. There were 745 housing units at an average density of 1 per square mile. The racial makeup of the county was 94.3% White, 0.2% African American, 0.7% Native American, 0.1% Asian, 0.1% Pacific Islander, 3.3% from other races, and 1.3% from two or more races. Hispanic or Latino of any race were 8.2% of the population.
The median income for a household in the county was $31,250, and the median income for a family was $37,500. Males had a median income of $27,500 versus $20,000 for females. The per capita income for the county was $14,945. About 14.2% of families and 17.2% of the population were below the poverty line, including 22.2% of those under age 18 and 14.3% of those age 65 or over.
Common Questions
What is Per Capita Income in Briscoe County?
Per Capita income in Briscoe County is $29,721.
What is the Median Family Income in Briscoe County?
Median Family Income in Briscoe County is $50,000.
What is the Median Household income in Briscoe County?
Median Household Income in Briscoe County is $35,446.
What is Inequality or Gini Index in Briscoe County?
Inequality or Gini Index in Briscoe County is 0.54.
What is the Total Population of Briscoe County?
Total Population of Briscoe County is 1,290.
What is the Total Male Population of Briscoe County?
Total Male Population of Briscoe County is 710.
What is the Total Female Population of Briscoe County?
Total Female Population of Briscoe County is 580.
What is the Ratio of Males per 100 Females in Briscoe County?
There are 122.41 Males per 100 Females in Briscoe County.
What is the Ratio of Females per 100 Males in Briscoe County?
There are 81.69 Females per 100 Males in Briscoe County.
What is the Median Population Age in Briscoe County?
Median Population Age in Briscoe County is 49.7 Years.
What is the Average Family Size in Briscoe County
Average Family Size in Briscoe County is 2.8 People.
What is the Average Household Size in Briscoe County
Average Household Size in Briscoe County is 2.2 People.
How Large is the Labor Force in Briscoe County?
There are 513 People in the Labor Forcein in Briscoe County.
What is the Percentage of People in the Labor Force in Briscoe County?
47.7% of People are in the Labor Force in Briscoe County.
What is the Unemployment Rate in Briscoe County?
Unemployment Rate in Briscoe County is 3.3%.