Bowie County, TX Map & Demographics
Bowie County Map
Bowie County Overview
$30,103
PER CAPITA INCOME
$71,618
AVG FAMILY INCOME
$56,628
AVG HOUSEHOLD INCOME
23.1%
WAGE / INCOME GAP [ % ]
76.9¢/ $1
WAGE / INCOME GAP [ $ ]
$11,000
FAMILY INCOME DEFICIT
0.49
INEQUALITY / GINI INDEX
92,747
TOTAL POPULATION
46,884
MALE POPULATION
45,863
FEMALE POPULATION
102.23
MALES / 100 FEMALES
97.82
FEMALES / 100 MALES
38.2
MEDIAN AGE
3.2
AVG FAMILY SIZE
2.5
AVG HOUSEHOLD SIZE
39,726
LABOR FORCE [ PEOPLE ]
54.3%
PERCENT IN LABOR FORCE
4.0%
UNEMPLOYMENT RATE
Income in Bowie County
Income Overview in Bowie County
Per Capita Income in Bowie County is $30,103, while median incomes of families and households are $71,618 and $56,628 respectively.
| Characteristic | Number | Measure |
| Per Capita Income | 92,747 | $30,103 |
| Median Family Income | 22,493 | $71,618 |
| Mean Family Income | 22,493 | $94,505 |
| Median Household Income | 34,486 | $56,628 |
| Mean Household Income | 34,486 | $78,971 |
| Income Deficit | 22,493 | $11,000 |
| Wage / Income Gap (%) | 92,747 | 23.14% |
| Wage / Income Gap ($) | 92,747 | 76.86¢ per $1 |
| Gini / Inequality Index | 92,747 | 0.49 |
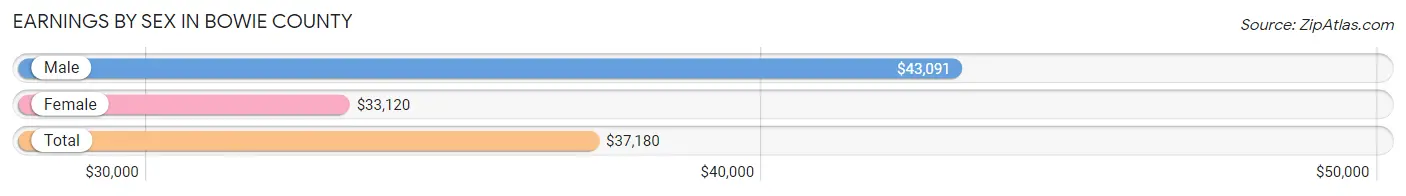
Earnings by Sex in Bowie County
Average Earnings in Bowie County are $37,180, $43,091 for men and $33,120 for women, a difference of 23.1%.
| Sex | Number | Average Earnings |
| Male | 21,447 (51.1%) | $43,091 |
| Female | 20,536 (48.9%) | $33,120 |
| Total | 41,983 (100.0%) | $37,180 |
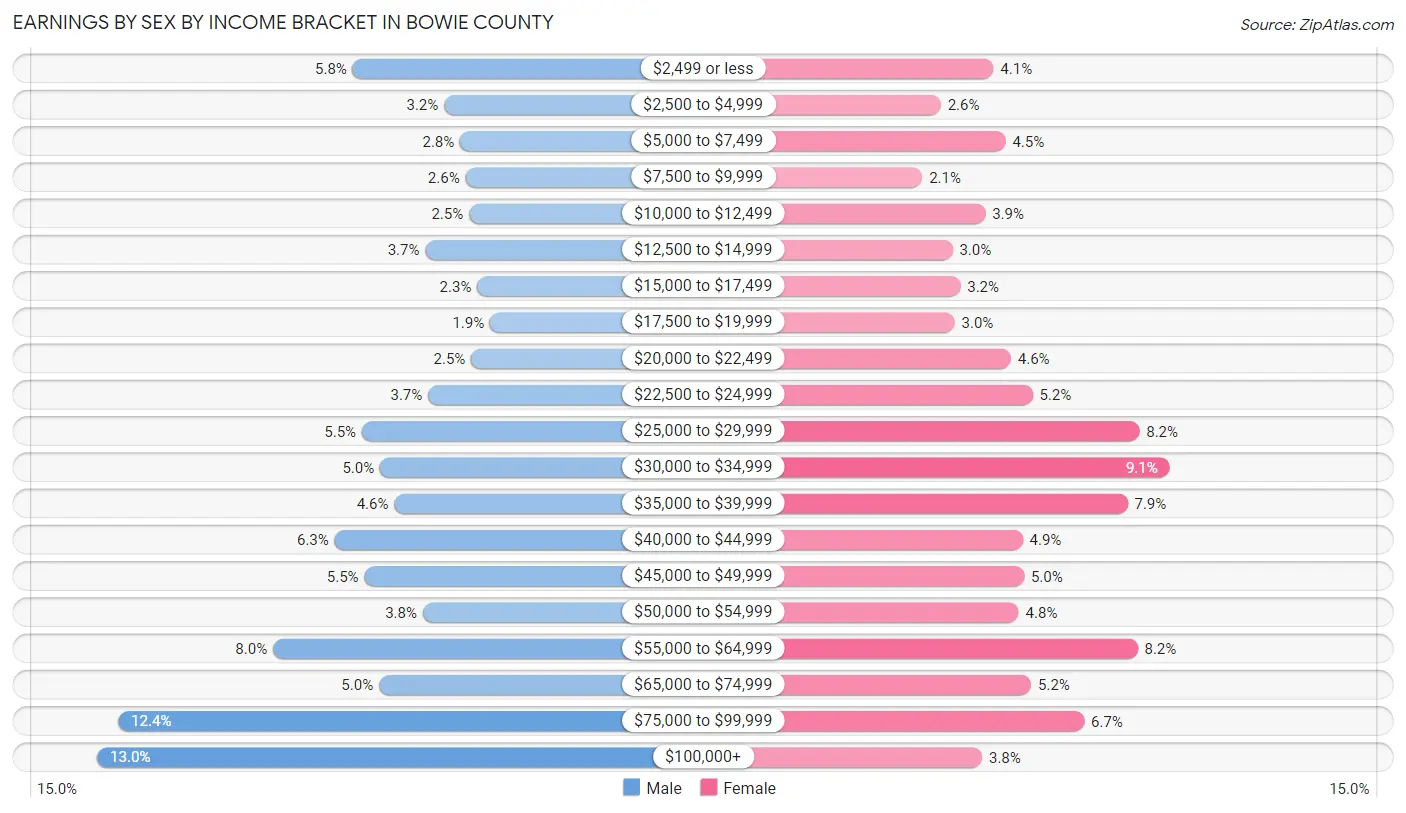
Earnings by Sex by Income Bracket in Bowie County
The most common earnings brackets in Bowie County are $100,000+ for men (2,779 | 13.0%) and $30,000 to $34,999 for women (1,863 | 9.1%).
| Income | Male | Female |
| $2,499 or less | 1,240 (5.8%) | 846 (4.1%) |
| $2,500 to $4,999 | 689 (3.2%) | 543 (2.6%) |
| $5,000 to $7,499 | 593 (2.8%) | 916 (4.5%) |
| $7,500 to $9,999 | 559 (2.6%) | 436 (2.1%) |
| $10,000 to $12,499 | 538 (2.5%) | 799 (3.9%) |
| $12,500 to $14,999 | 802 (3.7%) | 610 (3.0%) |
| $15,000 to $17,499 | 490 (2.3%) | 655 (3.2%) |
| $17,500 to $19,999 | 411 (1.9%) | 622 (3.0%) |
| $20,000 to $22,499 | 525 (2.5%) | 946 (4.6%) |
| $22,500 to $24,999 | 785 (3.7%) | 1,071 (5.2%) |
| $25,000 to $29,999 | 1,183 (5.5%) | 1,688 (8.2%) |
| $30,000 to $34,999 | 1,074 (5.0%) | 1,863 (9.1%) |
| $35,000 to $39,999 | 989 (4.6%) | 1,621 (7.9%) |
| $40,000 to $44,999 | 1,348 (6.3%) | 1,015 (4.9%) |
| $45,000 to $49,999 | 1,169 (5.4%) | 1,023 (5.0%) |
| $50,000 to $54,999 | 817 (3.8%) | 991 (4.8%) |
| $55,000 to $64,999 | 1,720 (8.0%) | 1,678 (8.2%) |
| $65,000 to $74,999 | 1,082 (5.0%) | 1,064 (5.2%) |
| $75,000 to $99,999 | 2,654 (12.4%) | 1,369 (6.7%) |
| $100,000+ | 2,779 (13.0%) | 780 (3.8%) |
| Total | 21,447 (100.0%) | 20,536 (100.0%) |
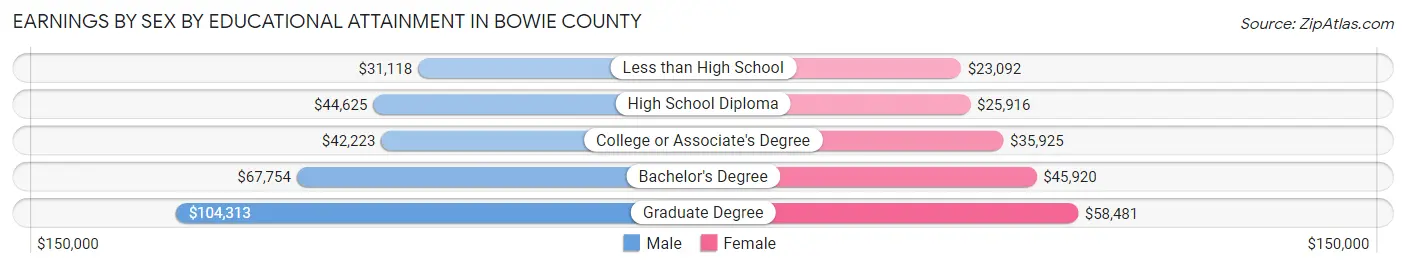
Earnings by Sex by Educational Attainment in Bowie County
Average earnings in Bowie County are $47,124 for men and $35,652 for women, a difference of 24.3%. Men with an educational attainment of graduate degree enjoy the highest average annual earnings of $104,313, while those with less than high school education earn the least with $31,118. Women with an educational attainment of graduate degree earn the most with the average annual earnings of $58,481, while those with less than high school education have the smallest earnings of $23,092.
| Educational Attainment | Male Income | Female Income |
| Less than High School | $31,118 | $23,092 |
| High School Diploma | $44,625 | $25,916 |
| College or Associate's Degree | $42,223 | $35,925 |
| Bachelor's Degree | $67,754 | $45,920 |
| Graduate Degree | $104,313 | $58,481 |
| Total | $47,124 | $35,652 |
Family Income in Bowie County
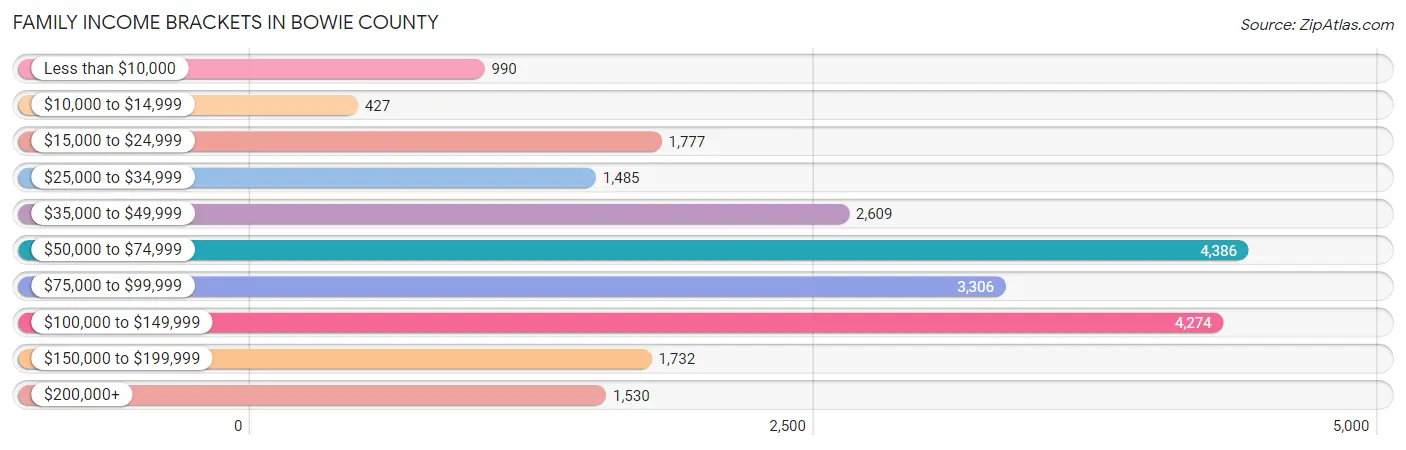
Family Income Brackets in Bowie County
According to the Bowie County family income data, there are 4,386 families falling into the $50,000 to $74,999 income range, which is the most common income bracket and makes up 19.5% of all families. Conversely, the $10,000 to $14,999 income bracket is the least frequent group with only 427 families (1.9%) belonging to this category.
| Income Bracket | # Families | % Families |
| Less than $10,000 | 990 | 4.4% |
| $10,000 to $14,999 | 427 | 1.9% |
| $15,000 to $24,999 | 1,777 | 7.9% |
| $25,000 to $34,999 | 1,485 | 6.6% |
| $35,000 to $49,999 | 2,609 | 11.6% |
| $50,000 to $74,999 | 4,386 | 19.5% |
| $75,000 to $99,999 | 3,306 | 14.7% |
| $100,000 to $149,999 | 4,274 | 19.0% |
| $150,000 to $199,999 | 1,732 | 7.7% |
| $200,000+ | 1,530 | 6.8% |
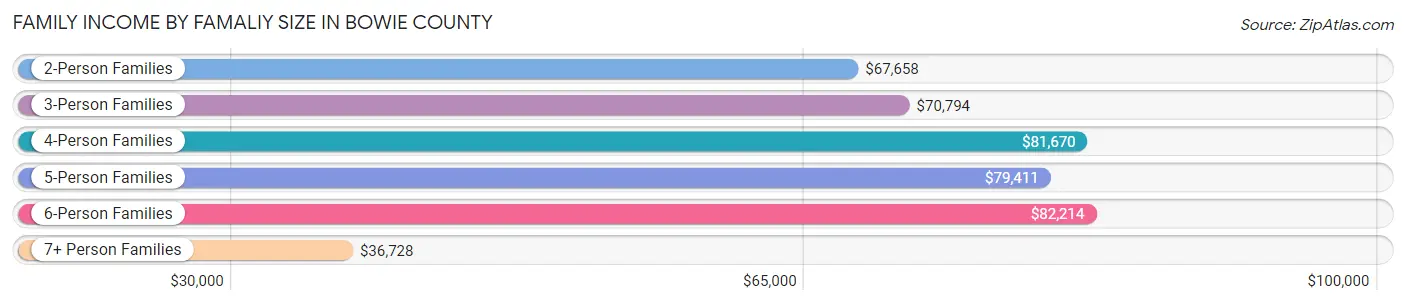
Family Income by Famaliy Size in Bowie County
6-person families (687 | 3.0%) account for the highest median family income in Bowie County with $82,214 per family, while 2-person families (10,479 | 46.6%) have the highest median income of $33,829 per family member.
| Income Bracket | # Families | Median Income |
| 2-Person Families | 10,479 (46.6%) | $67,658 |
| 3-Person Families | 5,027 (22.4%) | $70,794 |
| 4-Person Families | 4,145 (18.4%) | $81,670 |
| 5-Person Families | 1,785 (7.9%) | $79,411 |
| 6-Person Families | 687 (3.0%) | $82,214 |
| 7+ Person Families | 370 (1.6%) | $36,728 |
| Total | 22,493 (100.0%) | $71,618 |
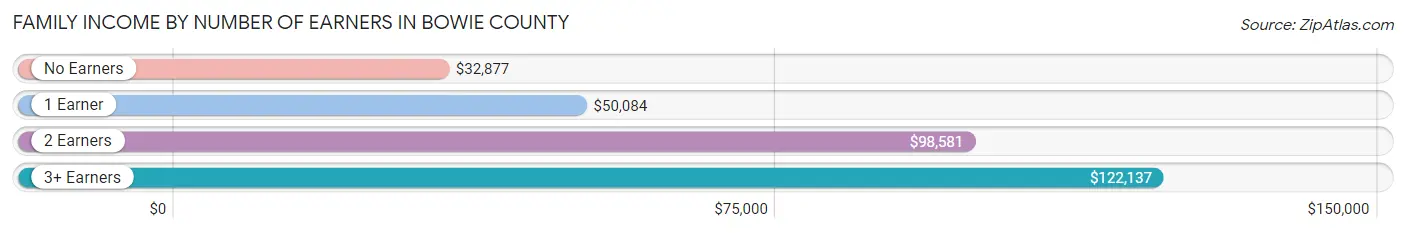
Family Income by Number of Earners in Bowie County
The median family income in Bowie County is $71,618, with families comprising 3+ earners (1,801) having the highest median family income of $122,137, while families with no earners (3,740) have the lowest median family income of $32,877, accounting for 8.0% and 16.6% of families, respectively.
| Number of Earners | # Families | Median Income |
| No Earners | 3,740 (16.6%) | $32,877 |
| 1 Earner | 8,306 (36.9%) | $50,084 |
| 2 Earners | 8,646 (38.4%) | $98,581 |
| 3+ Earners | 1,801 (8.0%) | $122,137 |
| Total | 22,493 (100.0%) | $71,618 |
Household Income in Bowie County
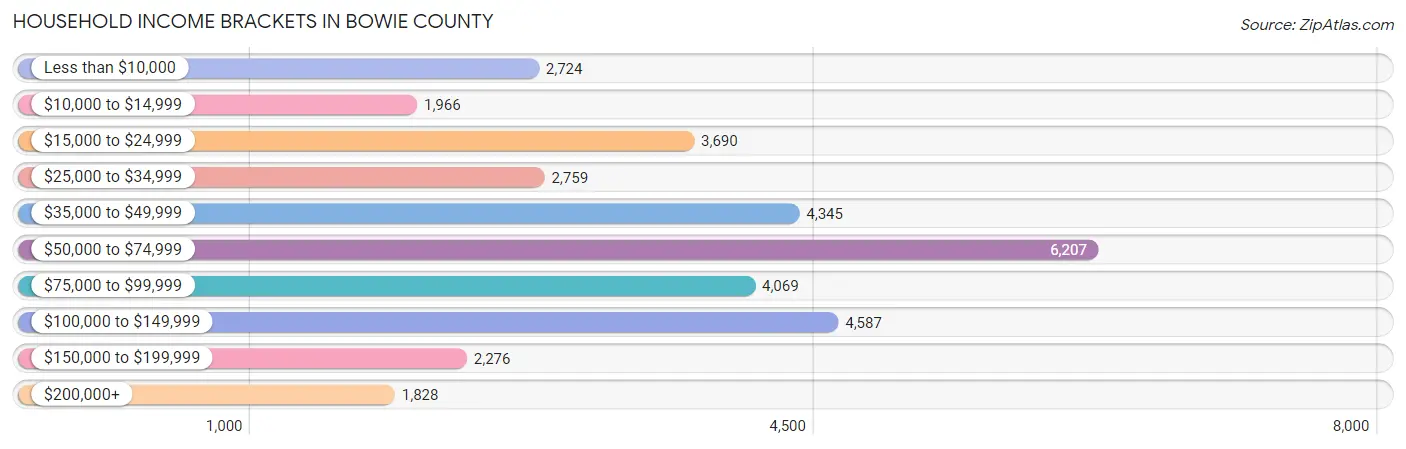
Household Income Brackets in Bowie County
With 6,207 households falling in the category, the $50,000 to $74,999 income range is the most frequent in Bowie County, accounting for 18.0% of all households. In contrast, only 1,828 households (5.3%) fall into the $200,000+ income bracket, making it the least populous group.
| Income Bracket | # Households | % Households |
| Less than $10,000 | 2,724 | 7.9% |
| $10,000 to $14,999 | 1,966 | 5.7% |
| $15,000 to $24,999 | 3,690 | 10.7% |
| $25,000 to $34,999 | 2,759 | 8.0% |
| $35,000 to $49,999 | 4,345 | 12.6% |
| $50,000 to $74,999 | 6,207 | 18.0% |
| $75,000 to $99,999 | 4,069 | 11.8% |
| $100,000 to $149,999 | 4,587 | 13.3% |
| $150,000 to $199,999 | 2,276 | 6.6% |
| $200,000+ | 1,828 | 5.3% |
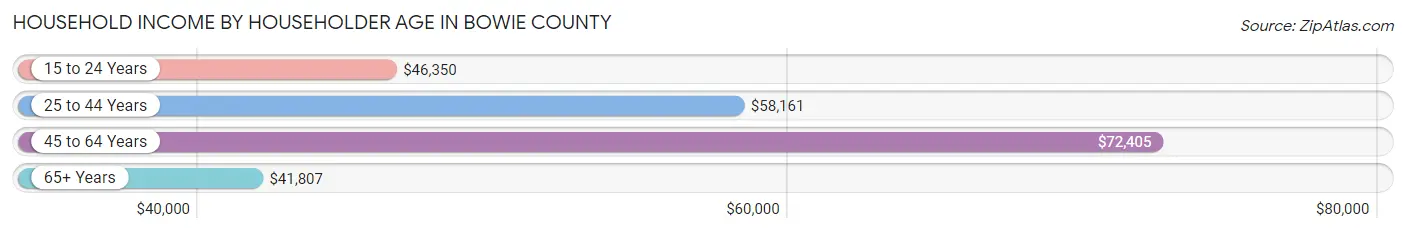
Household Income by Householder Age in Bowie County
The median household income in Bowie County is $56,628, with the highest median household income of $72,405 found in the 45 to 64 years age bracket for the primary householder. A total of 11,632 households (33.7%) fall into this category. Meanwhile, the 65+ years age bracket for the primary householder has the lowest median household income of $41,807, with 10,471 households (30.4%) in this group.
| Income Bracket | # Households | Median Income |
| 15 to 24 Years | 1,439 (4.2%) | $46,350 |
| 25 to 44 Years | 10,944 (31.7%) | $58,161 |
| 45 to 64 Years | 11,632 (33.7%) | $72,405 |
| 65+ Years | 10,471 (30.4%) | $41,807 |
| Total | 34,486 (100.0%) | $56,628 |
Poverty in Bowie County
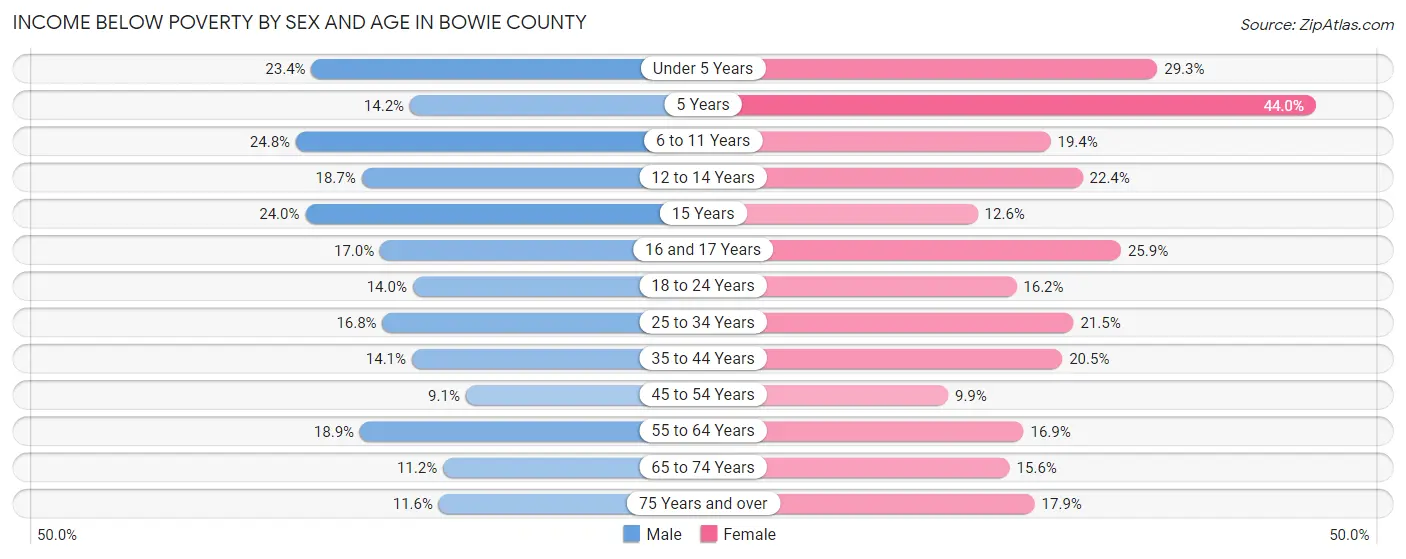
Income Below Poverty by Sex and Age in Bowie County
With 16.1% poverty level for males and 18.5% for females among the residents of Bowie County, 6 to 11 year old males and 5 year old females are the most vulnerable to poverty, with 983 males (24.8%) and 205 females (44.0%) in their respective age groups living below the poverty level.
| Age Bracket | Male | Female |
| Under 5 Years | 709 (23.4%) | 764 (29.3%) |
| 5 Years | 96 (14.2%) | 205 (44.0%) |
| 6 to 11 Years | 983 (24.8%) | 793 (19.4%) |
| 12 to 14 Years | 310 (18.7%) | 352 (22.4%) |
| 15 Years | 177 (23.9%) | 83 (12.6%) |
| 16 and 17 Years | 200 (17.0%) | 305 (25.9%) |
| 18 to 24 Years | 545 (14.0%) | 606 (16.2%) |
| 25 to 34 Years | 924 (16.8%) | 1,198 (21.5%) |
| 35 to 44 Years | 662 (14.1%) | 1,166 (20.5%) |
| 45 to 54 Years | 440 (9.1%) | 530 (9.9%) |
| 55 to 64 Years | 947 (18.9%) | 966 (16.9%) |
| 65 to 74 Years | 459 (11.2%) | 763 (15.6%) |
| 75 Years and over | 282 (11.6%) | 652 (17.9%) |
| Total | 6,734 (16.1%) | 8,383 (18.5%) |
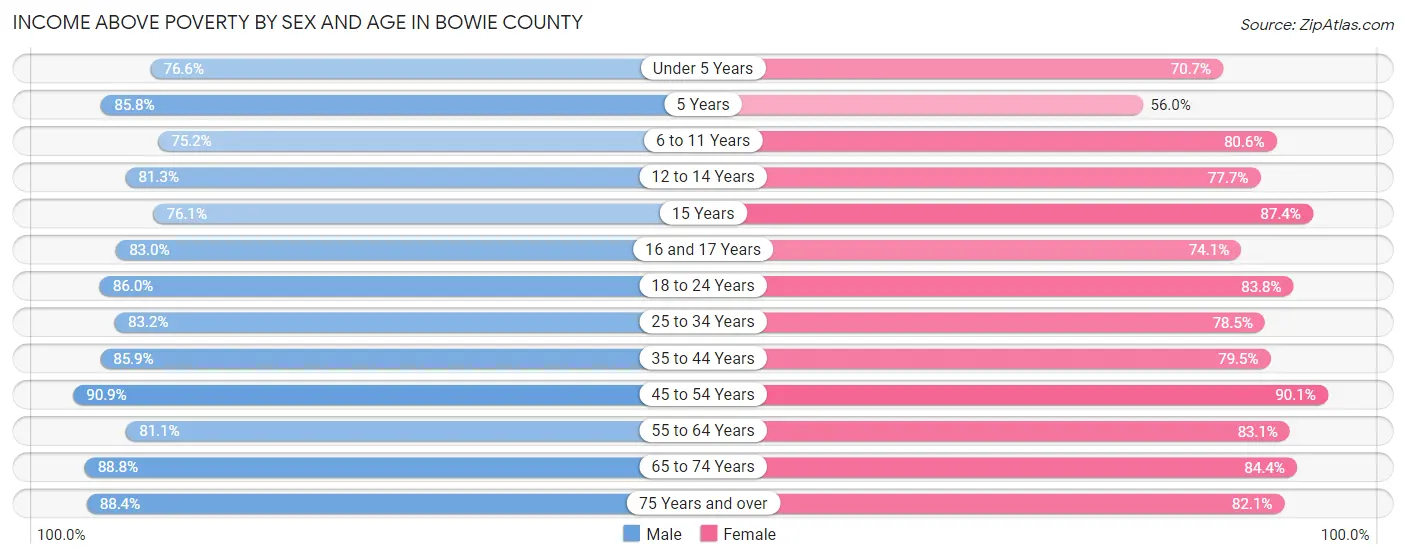
Income Above Poverty by Sex and Age in Bowie County
According to the poverty statistics in Bowie County, males aged 45 to 54 years and females aged 45 to 54 years are the age groups that are most secure financially, with 90.9% of males and 90.1% of females in these age groups living above the poverty line.
| Age Bracket | Male | Female |
| Under 5 Years | 2,323 (76.6%) | 1,845 (70.7%) |
| 5 Years | 578 (85.8%) | 261 (56.0%) |
| 6 to 11 Years | 2,978 (75.2%) | 3,302 (80.6%) |
| 12 to 14 Years | 1,345 (81.3%) | 1,223 (77.6%) |
| 15 Years | 562 (76.0%) | 575 (87.4%) |
| 16 and 17 Years | 976 (83.0%) | 872 (74.1%) |
| 18 to 24 Years | 3,353 (86.0%) | 3,135 (83.8%) |
| 25 to 34 Years | 4,579 (83.2%) | 4,375 (78.5%) |
| 35 to 44 Years | 4,045 (85.9%) | 4,533 (79.5%) |
| 45 to 54 Years | 4,414 (90.9%) | 4,843 (90.1%) |
| 55 to 64 Years | 4,068 (81.1%) | 4,759 (83.1%) |
| 65 to 74 Years | 3,649 (88.8%) | 4,133 (84.4%) |
| 75 Years and over | 2,158 (88.4%) | 2,990 (82.1%) |
| Total | 35,028 (83.9%) | 36,846 (81.5%) |
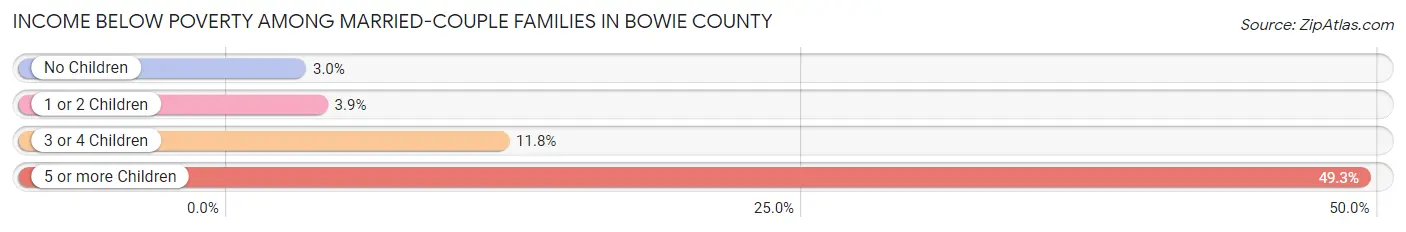
Income Below Poverty Among Married-Couple Families in Bowie County
The poverty statistics for married-couple families in Bowie County show that 4.3% or 658 of the total 15,191 families live below the poverty line. Families with 5 or more children have the highest poverty rate of 49.3%, comprising of 35 families. On the other hand, families with no children have the lowest poverty rate of 3.0%, which includes 258 families.
| Children | Above Poverty | Below Poverty |
| No Children | 8,451 (97.0%) | 258 (3.0%) |
| 1 or 2 Children | 4,760 (96.1%) | 193 (3.9%) |
| 3 or 4 Children | 1,286 (88.2%) | 172 (11.8%) |
| 5 or more Children | 36 (50.7%) | 35 (49.3%) |
| Total | 14,533 (95.7%) | 658 (4.3%) |
Income Below Poverty Among Single-Parent Households in Bowie County
According to the poverty data in Bowie County, 13.5% or 212 single-father households and 35.0% or 2,007 single-mother households are living below the poverty line. Among single-father households, those with 1 or 2 children have the highest poverty rate, with 96 households (17.0%) experiencing poverty. Likewise, among single-mother households, those with 5 or more children have the highest poverty rate, with 170 households (100.0%) falling below the poverty line.
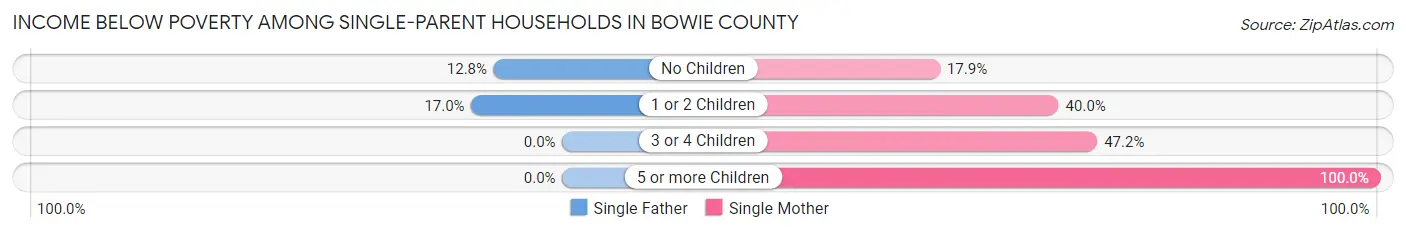
| Children | Single Father | Single Mother |
| No Children | 116 (12.8%) | 356 (17.9%) |
| 1 or 2 Children | 96 (17.0%) | 1,166 (40.0%) |
| 3 or 4 Children | 0 (0.0%) | 315 (47.2%) |
| 5 or more Children | 0 (0.0%) | 170 (100.0%) |
| Total | 212 (13.5%) | 2,007 (35.0%) |
Income Below Poverty Among Married-Couple vs Single-Parent Households in Bowie County
The poverty data for Bowie County shows that 658 of the married-couple family households (4.3%) and 2,219 of the single-parent households (30.4%) are living below the poverty level. Within the married-couple family households, those with 5 or more children have the highest poverty rate, with 35 households (49.3%) falling below the poverty line. Among the single-parent households, those with 5 or more children have the highest poverty rate, with 170 household (100.0%) living below poverty.
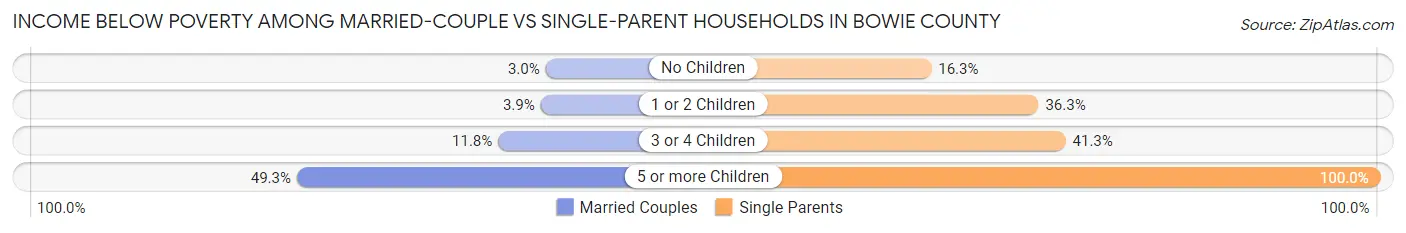
| Children | Married-Couple Families | Single-Parent Households |
| No Children | 258 (3.0%) | 472 (16.3%) |
| 1 or 2 Children | 193 (3.9%) | 1,262 (36.3%) |
| 3 or 4 Children | 172 (11.8%) | 315 (41.3%) |
| 5 or more Children | 35 (49.3%) | 170 (100.0%) |
| Total | 658 (4.3%) | 2,219 (30.4%) |
Race in Bowie County
The most populous races in Bowie County are White / Caucasian (61,938 | 66.8%), Black / African American (23,462 | 25.3%), and Hispanic or Latino (7,521 | 8.1%).
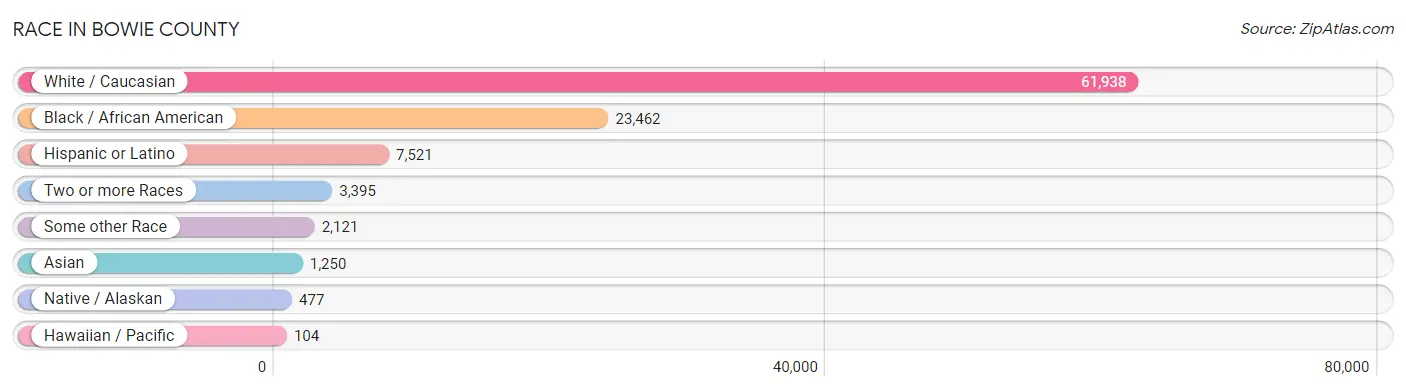
| Race | # Population | % Population |
| Asian | 1,250 | 1.3% |
| Black / African American | 23,462 | 25.3% |
| Hawaiian / Pacific | 104 | 0.1% |
| Hispanic or Latino | 7,521 | 8.1% |
| Native / Alaskan | 477 | 0.5% |
| White / Caucasian | 61,938 | 66.8% |
| Two or more Races | 3,395 | 3.7% |
| Some other Race | 2,121 | 2.3% |
| Total | 92,747 | 100.0% |
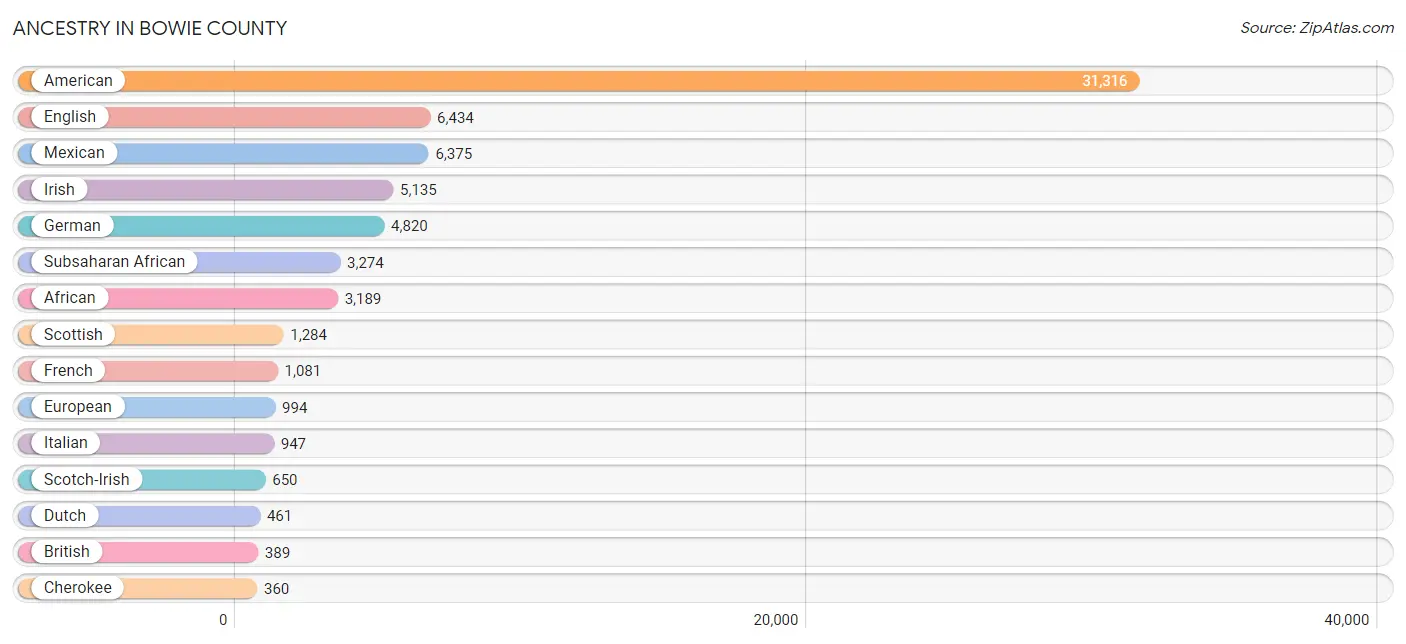
Ancestry in Bowie County
The most populous ancestries reported in Bowie County are American (31,316 | 33.8%), English (6,434 | 6.9%), Mexican (6,375 | 6.9%), Irish (5,135 | 5.5%), and German (4,820 | 5.2%), together accounting for 58.3% of all Bowie County residents.
| Ancestry | # Population | % Population |
| African | 3,189 | 3.4% |
| Alaskan Athabascan | 6 | 0.0% |
| American | 31,316 | 33.8% |
| Apache | 68 | 0.1% |
| Arab | 80 | 0.1% |
| Australian | 9 | 0.0% |
| Belgian | 99 | 0.1% |
| Bhutanese | 54 | 0.1% |
| Blackfeet | 39 | 0.0% |
| British | 389 | 0.4% |
| Burmese | 211 | 0.2% |
| Cajun | 23 | 0.0% |
| Canadian | 10 | 0.0% |
| Central American | 206 | 0.2% |
| Central American Indian | 23 | 0.0% |
| Cherokee | 360 | 0.4% |
| Chickasaw | 63 | 0.1% |
| Chippewa | 2 | 0.0% |
| Choctaw | 329 | 0.4% |
| Creek | 5 | 0.0% |
| Cuban | 2 | 0.0% |
| Czech | 184 | 0.2% |
| Czechoslovakian | 2 | 0.0% |
| Danish | 40 | 0.0% |
| Dominican | 27 | 0.0% |
| Dutch | 461 | 0.5% |
| Dutch West Indian | 4 | 0.0% |
| Eastern European | 4 | 0.0% |
| Ecuadorian | 22 | 0.0% |
| Egyptian | 34 | 0.0% |
| English | 6,434 | 6.9% |
| European | 994 | 1.1% |
| Fijian | 32 | 0.0% |
| Finnish | 16 | 0.0% |
| French | 1,081 | 1.2% |
| French Canadian | 149 | 0.2% |
| German | 4,820 | 5.2% |
| Greek | 22 | 0.0% |
| Guamanian / Chamorro | 43 | 0.1% |
| Guatemalan | 102 | 0.1% |
| Indian (Asian) | 286 | 0.3% |
| Iranian | 319 | 0.3% |
| Irish | 5,135 | 5.5% |
| Iroquois | 1 | 0.0% |
| Israeli | 2 | 0.0% |
| Italian | 947 | 1.0% |
| Jamaican | 31 | 0.0% |
| Japanese | 38 | 0.0% |
| Korean | 326 | 0.4% |
| Lithuanian | 68 | 0.1% |
| Mexican | 6,375 | 6.9% |
| Moroccan | 7 | 0.0% |
| Native Hawaiian | 121 | 0.1% |
| Navajo | 4 | 0.0% |
| Nigerian | 33 | 0.0% |
| Northern European | 46 | 0.1% |
| Norwegian | 310 | 0.3% |
| Osage | 2 | 0.0% |
| Pakistani | 5 | 0.0% |
| Panamanian | 12 | 0.0% |
| Paraguayan | 30 | 0.0% |
| Polish | 300 | 0.3% |
| Portuguese | 94 | 0.1% |
| Puerto Rican | 194 | 0.2% |
| Russian | 58 | 0.1% |
| Salvadoran | 92 | 0.1% |
| Scandinavian | 111 | 0.1% |
| Scotch-Irish | 650 | 0.7% |
| Scottish | 1,284 | 1.4% |
| Seminole | 7 | 0.0% |
| Sioux | 41 | 0.0% |
| Slovak | 6 | 0.0% |
| South American | 56 | 0.1% |
| Spaniard | 90 | 0.1% |
| Spanish | 57 | 0.1% |
| Sri Lankan | 319 | 0.3% |
| Subsaharan African | 3,274 | 3.5% |
| Sudanese | 13 | 0.0% |
| Swedish | 157 | 0.2% |
| Swiss | 45 | 0.1% |
| Thai | 290 | 0.3% |
| Trinidadian and Tobagonian | 11 | 0.0% |
| Ukrainian | 34 | 0.0% |
| Venezuelan | 4 | 0.0% |
| Welsh | 144 | 0.2% |
| West Indian | 37 | 0.0% |
| Yaqui | 23 | 0.0% |
| Yugoslavian | 26 | 0.0% | View All 88 Rows |
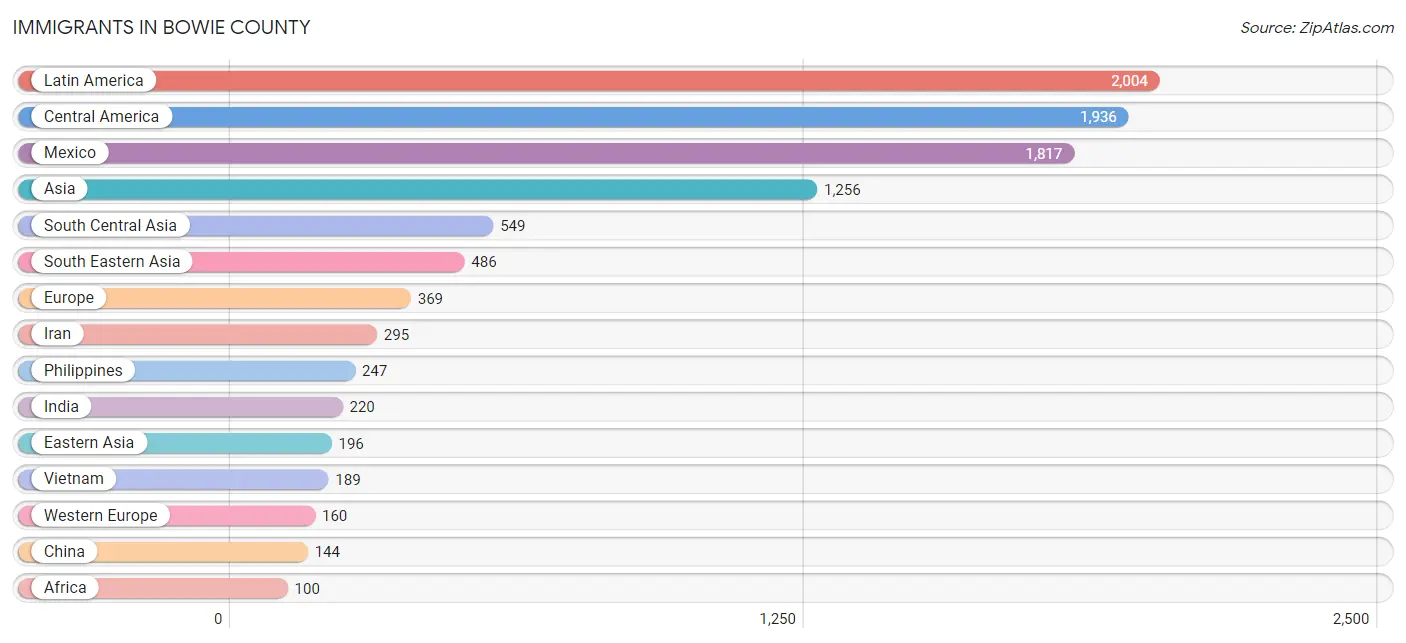
Immigrants in Bowie County
The most numerous immigrant groups reported in Bowie County came from Latin America (2,004 | 2.2%), Central America (1,936 | 2.1%), Mexico (1,817 | 2.0%), Asia (1,256 | 1.3%), and South Central Asia (549 | 0.6%), together accounting for 8.2% of all Bowie County residents.
| Immigration Origin | # Population | % Population |
| Africa | 100 | 0.1% |
| Asia | 1,256 | 1.3% |
| Australia | 15 | 0.0% |
| Cambodia | 38 | 0.0% |
| Canada | 68 | 0.1% |
| Caribbean | 61 | 0.1% |
| Central America | 1,936 | 2.1% |
| China | 144 | 0.2% |
| Colombia | 7 | 0.0% |
| Eastern Africa | 28 | 0.0% |
| Eastern Asia | 196 | 0.2% |
| Eastern Europe | 92 | 0.1% |
| Egypt | 18 | 0.0% |
| El Salvador | 40 | 0.0% |
| England | 38 | 0.0% |
| Ethiopia | 28 | 0.0% |
| Europe | 369 | 0.4% |
| France | 15 | 0.0% |
| Germany | 97 | 0.1% |
| Guatemala | 55 | 0.1% |
| Honduras | 12 | 0.0% |
| Hong Kong | 64 | 0.1% |
| Hungary | 1 | 0.0% |
| India | 220 | 0.2% |
| Iran | 295 | 0.3% |
| Iraq | 12 | 0.0% |
| Italy | 55 | 0.1% |
| Jamaica | 24 | 0.0% |
| Korea | 52 | 0.1% |
| Latin America | 2,004 | 2.2% |
| Lithuania | 29 | 0.0% |
| Malaysia | 7 | 0.0% |
| Mexico | 1,817 | 2.0% |
| Nepal | 34 | 0.0% |
| Netherlands | 48 | 0.1% |
| Nicaragua | 12 | 0.0% |
| Nigeria | 45 | 0.1% |
| Northern Africa | 18 | 0.0% |
| Northern Europe | 60 | 0.1% |
| Oceania | 44 | 0.1% |
| Philippines | 247 | 0.3% |
| Poland | 17 | 0.0% |
| Saudi Arabia | 13 | 0.0% |
| Serbia | 26 | 0.0% |
| South America | 7 | 0.0% |
| South Central Asia | 549 | 0.6% |
| South Eastern Asia | 486 | 0.5% |
| Southern Europe | 57 | 0.1% |
| Spain | 2 | 0.0% |
| Taiwan | 15 | 0.0% |
| Thailand | 5 | 0.0% |
| Ukraine | 19 | 0.0% |
| Vietnam | 189 | 0.2% |
| Western Africa | 54 | 0.1% |
| Western Asia | 25 | 0.0% |
| Western Europe | 160 | 0.2% | View All 56 Rows |
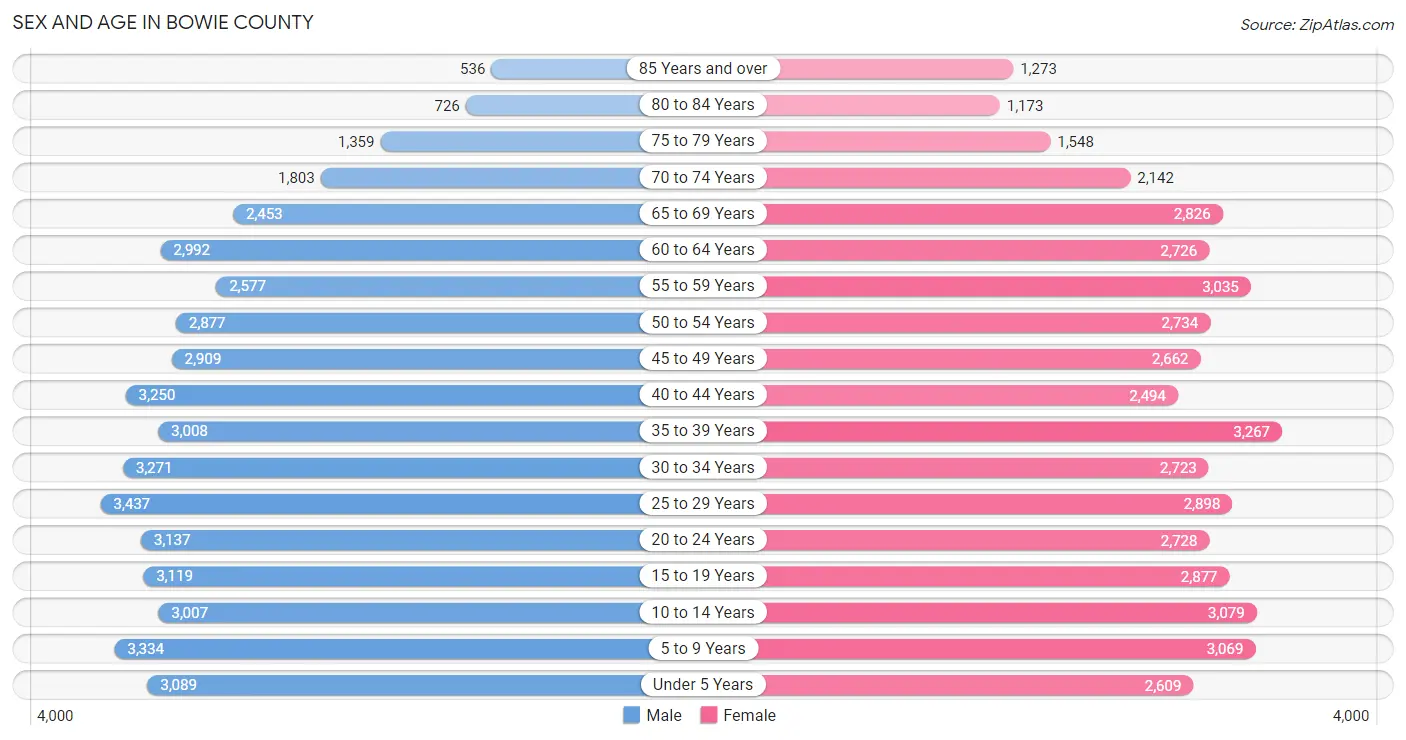
Sex and Age in Bowie County
Sex and Age in Bowie County
The most populous age groups in Bowie County are 25 to 29 Years (3,437 | 7.3%) for men and 35 to 39 Years (3,267 | 7.1%) for women.
| Age Bracket | Male | Female |
| Under 5 Years | 3,089 (6.6%) | 2,609 (5.7%) |
| 5 to 9 Years | 3,334 (7.1%) | 3,069 (6.7%) |
| 10 to 14 Years | 3,007 (6.4%) | 3,079 (6.7%) |
| 15 to 19 Years | 3,119 (6.7%) | 2,877 (6.3%) |
| 20 to 24 Years | 3,137 (6.7%) | 2,728 (5.9%) |
| 25 to 29 Years | 3,437 (7.3%) | 2,898 (6.3%) |
| 30 to 34 Years | 3,271 (7.0%) | 2,723 (5.9%) |
| 35 to 39 Years | 3,008 (6.4%) | 3,267 (7.1%) |
| 40 to 44 Years | 3,250 (6.9%) | 2,494 (5.4%) |
| 45 to 49 Years | 2,909 (6.2%) | 2,662 (5.8%) |
| 50 to 54 Years | 2,877 (6.1%) | 2,734 (6.0%) |
| 55 to 59 Years | 2,577 (5.5%) | 3,035 (6.6%) |
| 60 to 64 Years | 2,992 (6.4%) | 2,726 (5.9%) |
| 65 to 69 Years | 2,453 (5.2%) | 2,826 (6.2%) |
| 70 to 74 Years | 1,803 (3.8%) | 2,142 (4.7%) |
| 75 to 79 Years | 1,359 (2.9%) | 1,548 (3.4%) |
| 80 to 84 Years | 726 (1.5%) | 1,173 (2.6%) |
| 85 Years and over | 536 (1.1%) | 1,273 (2.8%) |
| Total | 46,884 (100.0%) | 45,863 (100.0%) |
Families and Households in Bowie County
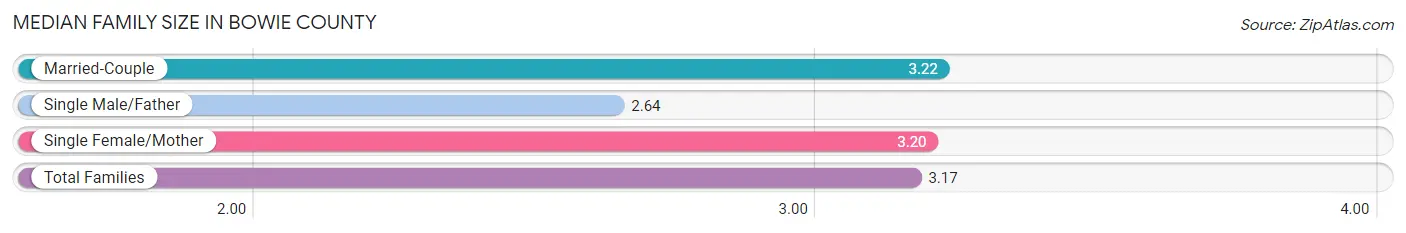
Median Family Size in Bowie County
The median family size in Bowie County is 3.17 persons per family, with married-couple families (15,191 | 67.5%) accounting for the largest median family size of 3.22 persons per family. On the other hand, single male/father families (1,569 | 7.0%) represent the smallest median family size with 2.64 persons per family.
| Family Type | # Families | Family Size |
| Married-Couple | 15,191 (67.5%) | 3.22 |
| Single Male/Father | 1,569 (7.0%) | 2.64 |
| Single Female/Mother | 5,733 (25.5%) | 3.20 |
| Total Families | 22,493 (100.0%) | 3.17 |
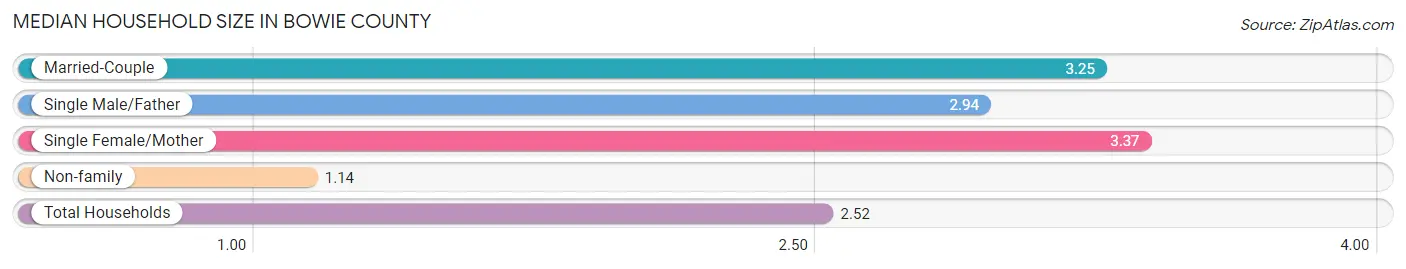
Median Household Size in Bowie County
The median household size in Bowie County is 2.52 persons per household, with single female/mother households (5,733 | 16.6%) accounting for the largest median household size of 3.37 persons per household. non-family households (11,993 | 34.8%) represent the smallest median household size with 1.14 persons per household.
| Household Type | # Households | Household Size |
| Married-Couple | 15,191 (44.1%) | 3.25 |
| Single Male/Father | 1,569 (4.5%) | 2.94 |
| Single Female/Mother | 5,733 (16.6%) | 3.37 |
| Non-family | 11,993 (34.8%) | 1.14 |
| Total Households | 34,486 (100.0%) | 2.52 |
Household Size by Marriage Status in Bowie County
Out of a total of 34,486 households in Bowie County, 22,493 (65.2%) are family households, while 11,993 (34.8%) are nonfamily households. The most numerous type of family households are 2-person households, comprising 9,800, and the most common type of nonfamily households are 1-person households, comprising 10,691.
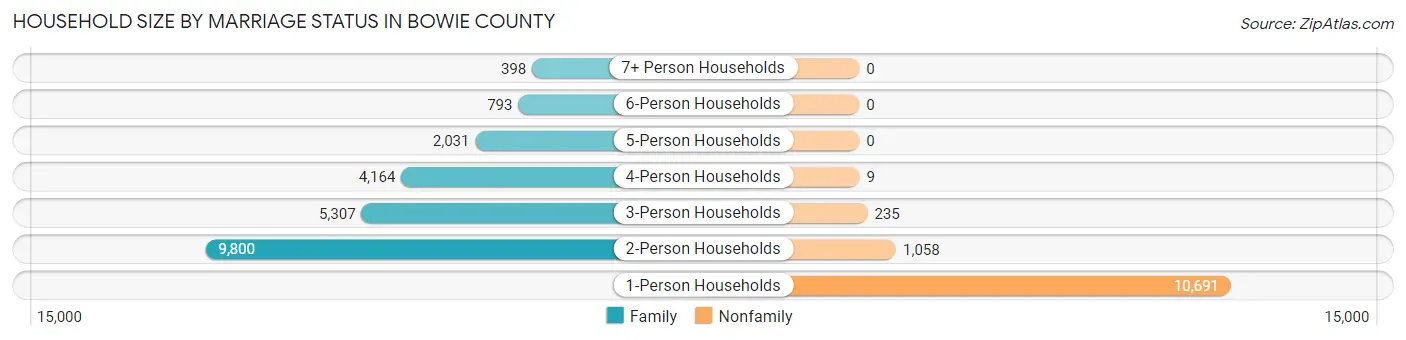
| Household Size | Family Households | Nonfamily Households |
| 1-Person Households | - | 10,691 (31.0%) |
| 2-Person Households | 9,800 (28.4%) | 1,058 (3.1%) |
| 3-Person Households | 5,307 (15.4%) | 235 (0.7%) |
| 4-Person Households | 4,164 (12.1%) | 9 (0.0%) |
| 5-Person Households | 2,031 (5.9%) | 0 (0.0%) |
| 6-Person Households | 793 (2.3%) | 0 (0.0%) |
| 7+ Person Households | 398 (1.1%) | 0 (0.0%) |
| Total | 22,493 (65.2%) | 11,993 (34.8%) |
Female Fertility in Bowie County
Fertility by Age in Bowie County
Average fertility rate in Bowie County is 52.0 births per 1,000 women. Women in the age bracket of 20 to 34 years have the highest fertility rate with 98.0 births per 1,000 women. Women in the age bracket of 20 to 34 years acount for 78.8% of all women with births.
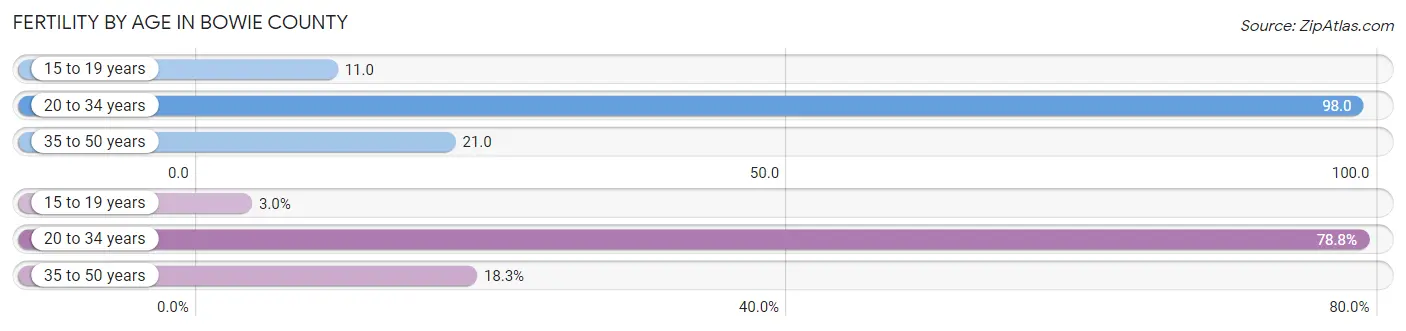
| Age Bracket | Women with Births | Births / 1,000 Women |
| 15 to 19 years | 31 (3.0%) | 11.0 |
| 20 to 34 years | 820 (78.8%) | 98.0 |
| 35 to 50 years | 190 (18.2%) | 21.0 |
| Total | 1,041 (100.0%) | 52.0 |
Fertility by Age by Marriage Status in Bowie County
43.8% of women with births (1,041) in Bowie County are married. The highest percentage of unmarried women with births falls into 20 to 34 years age bracket with 65.7% of them unmarried at the time of birth, while the lowest percentage of unmarried women with births belong to 35 to 50 years age bracket with 19.0% of them unmarried.
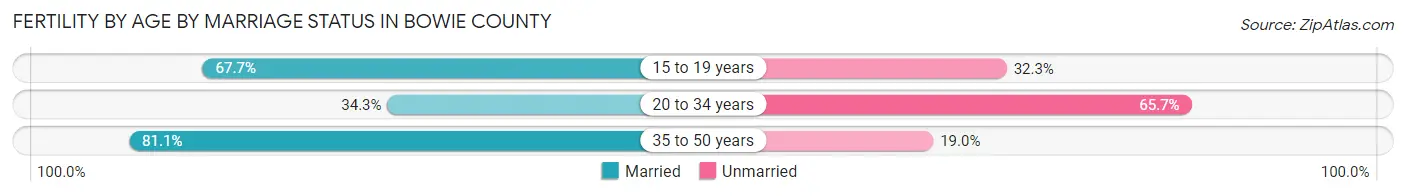
| Age Bracket | Married | Unmarried |
| 15 to 19 years | 21 (67.7%) | 10 (32.3%) |
| 20 to 34 years | 281 (34.3%) | 539 (65.7%) |
| 35 to 50 years | 154 (81.0%) | 36 (19.0%) |
| Total | 456 (43.8%) | 585 (56.2%) |
Fertility by Education in Bowie County
Average fertility rate in Bowie County is 52.0 births per 1,000 women. Women with the education attainment of less than high school have the highest fertility rate of 63.0 births per 1,000 women, while women with the education attainment of graduate degree have the lowest fertility at 5.0 births per 1,000 women. Women with the education attainment of college or associate's degree represent 36.7% of all women with births.
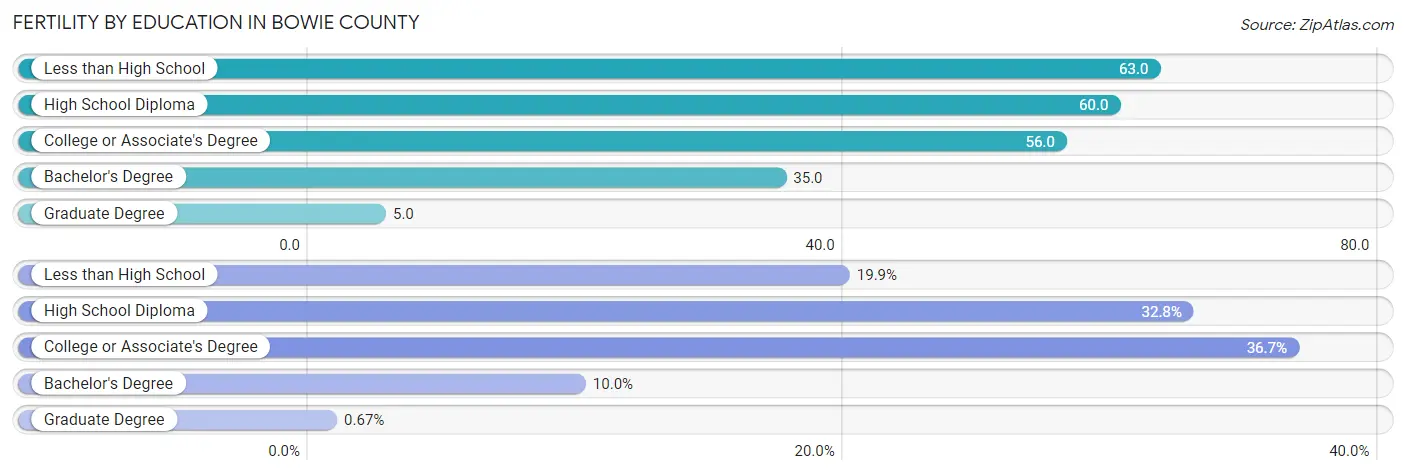
| Educational Attainment | Women with Births | Births / 1,000 Women |
| Less than High School | 207 (19.9%) | 63.0 |
| High School Diploma | 341 (32.8%) | 60.0 |
| College or Associate's Degree | 382 (36.7%) | 56.0 |
| Bachelor's Degree | 104 (10.0%) | 35.0 |
| Graduate Degree | 7 (0.7%) | 5.0 |
| Total | 1,041 (100.0%) | 52.0 |
Fertility by Education by Marriage Status in Bowie County
56.2% of women with births in Bowie County are unmarried. Women with the educational attainment of graduate degree are most likely to be married with 100.0% of them married at childbirth, while women with the educational attainment of less than high school are least likely to be married with 84.5% of them unmarried at childbirth.
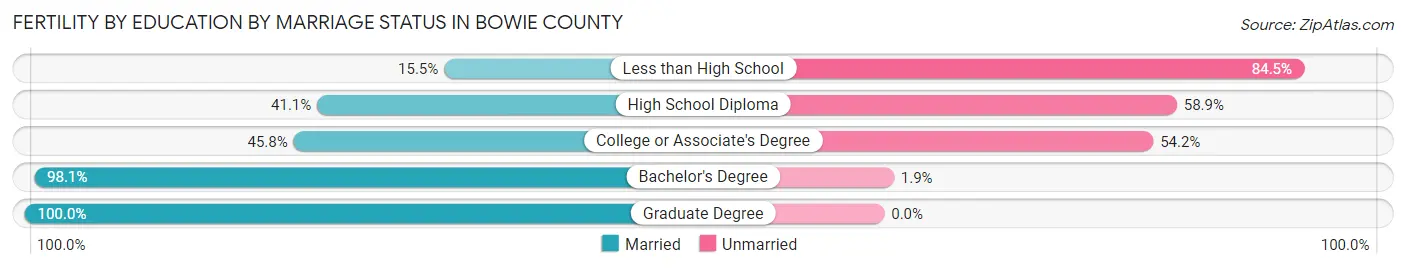
| Educational Attainment | Married | Unmarried |
| Less than High School | 32 (15.5%) | 175 (84.5%) |
| High School Diploma | 140 (41.1%) | 201 (58.9%) |
| College or Associate's Degree | 175 (45.8%) | 207 (54.2%) |
| Bachelor's Degree | 102 (98.1%) | 2 (1.9%) |
| Graduate Degree | 7 (100.0%) | 0 (0.0%) |
| Total | 456 (43.8%) | 585 (56.2%) |
Employment Characteristics in Bowie County
Employment by Class of Employer in Bowie County
Among the 37,867 employed individuals in Bowie County, private company employees (25,789 | 68.1%), local government employees (2,776 | 7.3%), and not-for-profit organizations (2,681 | 7.1%) make up the most common classes of employment.
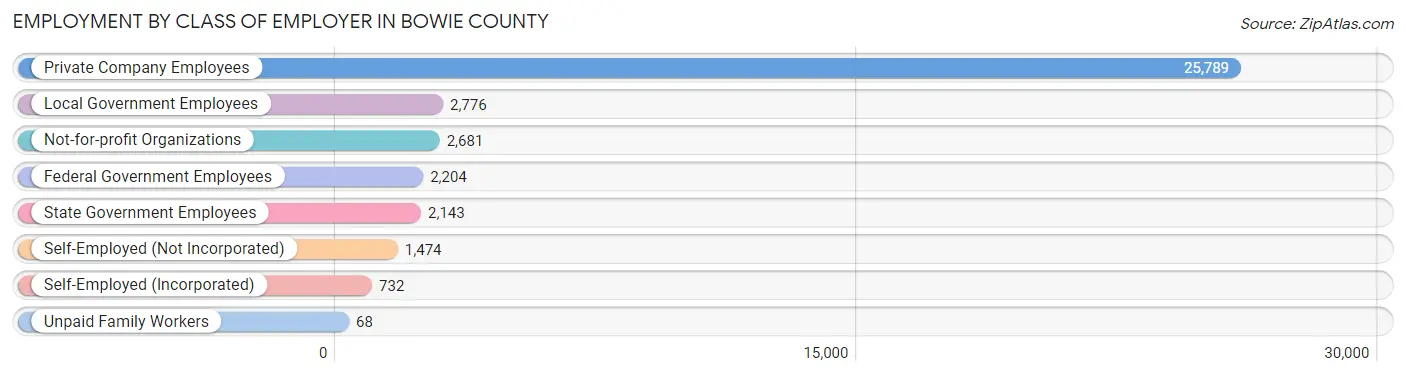
| Employer Class | # Employees | % Employees |
| Private Company Employees | 25,789 | 68.1% |
| Self-Employed (Incorporated) | 732 | 1.9% |
| Self-Employed (Not Incorporated) | 1,474 | 3.9% |
| Not-for-profit Organizations | 2,681 | 7.1% |
| Local Government Employees | 2,776 | 7.3% |
| State Government Employees | 2,143 | 5.7% |
| Federal Government Employees | 2,204 | 5.8% |
| Unpaid Family Workers | 68 | 0.2% |
| Total | 37,867 | 100.0% |
Employment Status by Age in Bowie County
According to the labor force statistics for Bowie County, out of the total population over 16 years of age (73,160), 54.3% or 39,726 individuals are in the labor force, with 4.0% or 1,589 of them unemployed. The age group with the highest labor force participation rate is 30 to 34 years, with 73.5% or 4,406 individuals in the labor force. Within the labor force, the 16 to 19 years age range has the highest percentage of unemployed individuals, with 8.3% or 138 of them being unemployed.
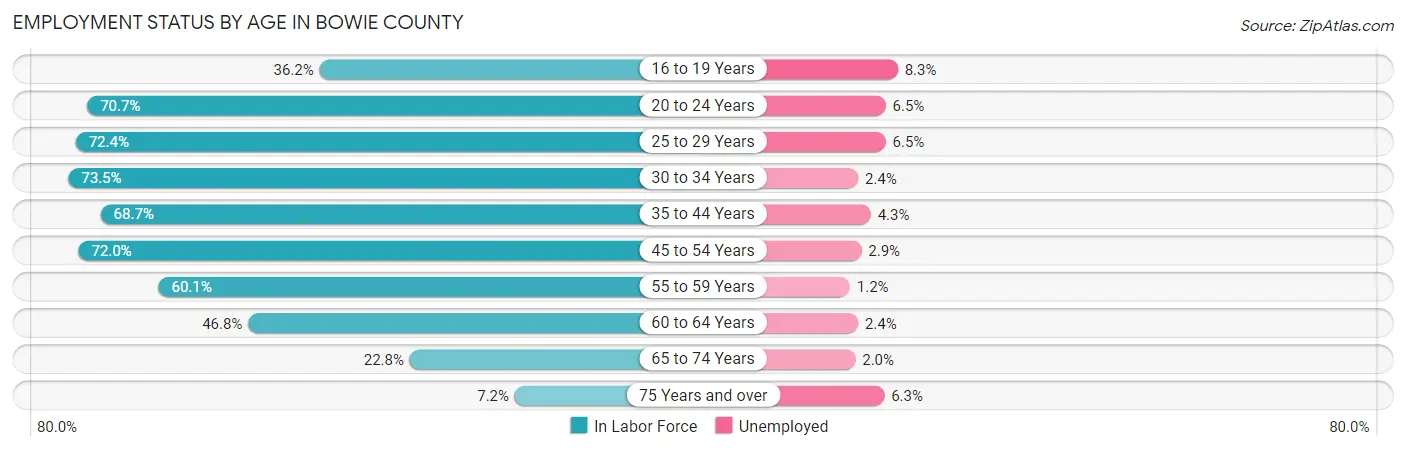
| Age Bracket | In Labor Force | Unemployed |
| 16 to 19 Years | 1,664 (36.2%) | 138 (8.3%) |
| 20 to 24 Years | 4,147 (70.7%) | 270 (6.5%) |
| 25 to 29 Years | 4,587 (72.4%) | 298 (6.5%) |
| 30 to 34 Years | 4,406 (73.5%) | 106 (2.4%) |
| 35 to 44 Years | 8,257 (68.7%) | 355 (4.3%) |
| 45 to 54 Years | 8,051 (72.0%) | 233 (2.9%) |
| 55 to 59 Years | 3,373 (60.1%) | 40 (1.2%) |
| 60 to 64 Years | 2,676 (46.8%) | 64 (2.4%) |
| 65 to 74 Years | 2,103 (22.8%) | 42 (2.0%) |
| 75 Years and over | 476 (7.2%) | 30 (6.3%) |
| Total | 39,726 (54.3%) | 1,589 (4.0%) |
Employment Status by Educational Attainment in Bowie County
According to labor force statistics for Bowie County, 66.9% of individuals (31,349) out of the total population between 25 and 64 years of age (46,860) are in the labor force, with 3.5% or 1,097 of them being unemployed. The group with the highest labor force participation rate are those with the educational attainment of bachelor's degree or higher, with 79.4% or 7,962 individuals in the labor force. Within the labor force, individuals with less than high school education have the highest percentage of unemployment, with 6.4% or 113 of them being unemployed.
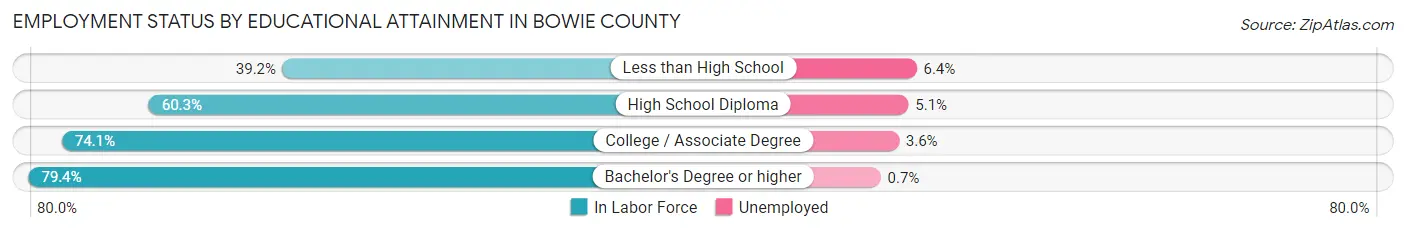
| Educational Attainment | In Labor Force | Unemployed |
| Less than High School | 1,768 (39.2%) | 289 (6.4%) |
| High School Diploma | 10,199 (60.3%) | 863 (5.1%) |
| College / Associate Degree | 11,417 (74.1%) | 555 (3.6%) |
| Bachelor's Degree or higher | 7,962 (79.4%) | 70 (0.7%) |
| Total | 31,349 (66.9%) | 1,640 (3.5%) |
Employment Occupations by Sex in Bowie County
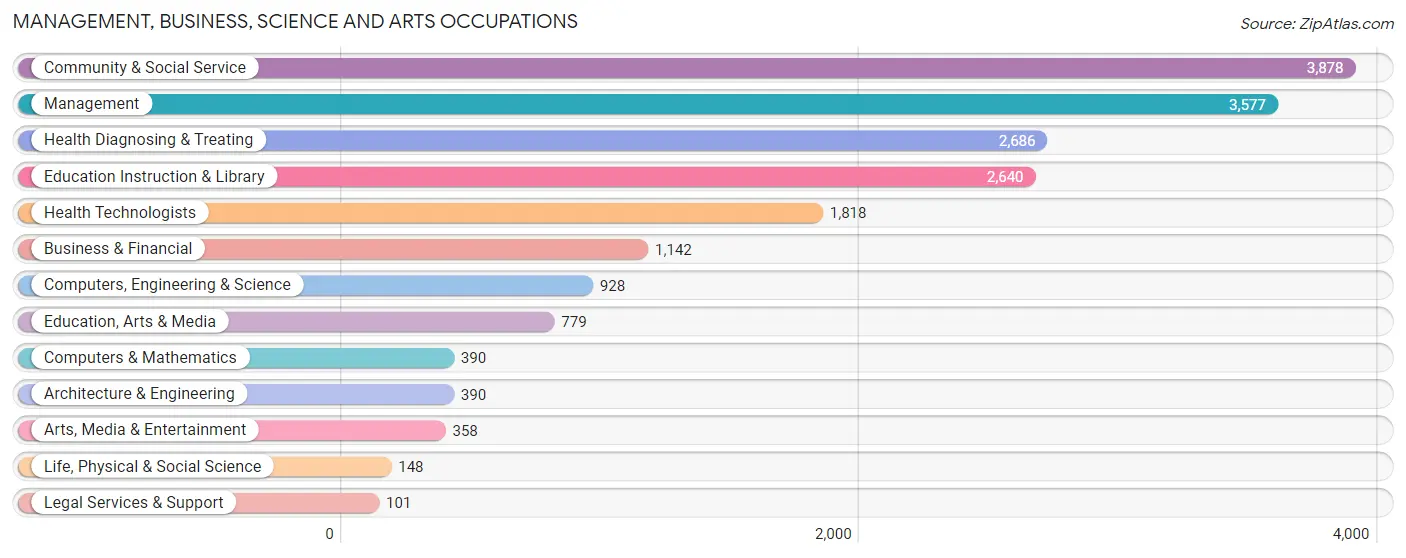
Management, Business, Science and Arts Occupations
The most common Management, Business, Science and Arts occupations in Bowie County are Community & Social Service (3,878 | 10.2%), Management (3,577 | 9.4%), Health Diagnosing & Treating (2,686 | 7.0%), Education Instruction & Library (2,640 | 6.9%), and Health Technologists (1,818 | 4.8%).
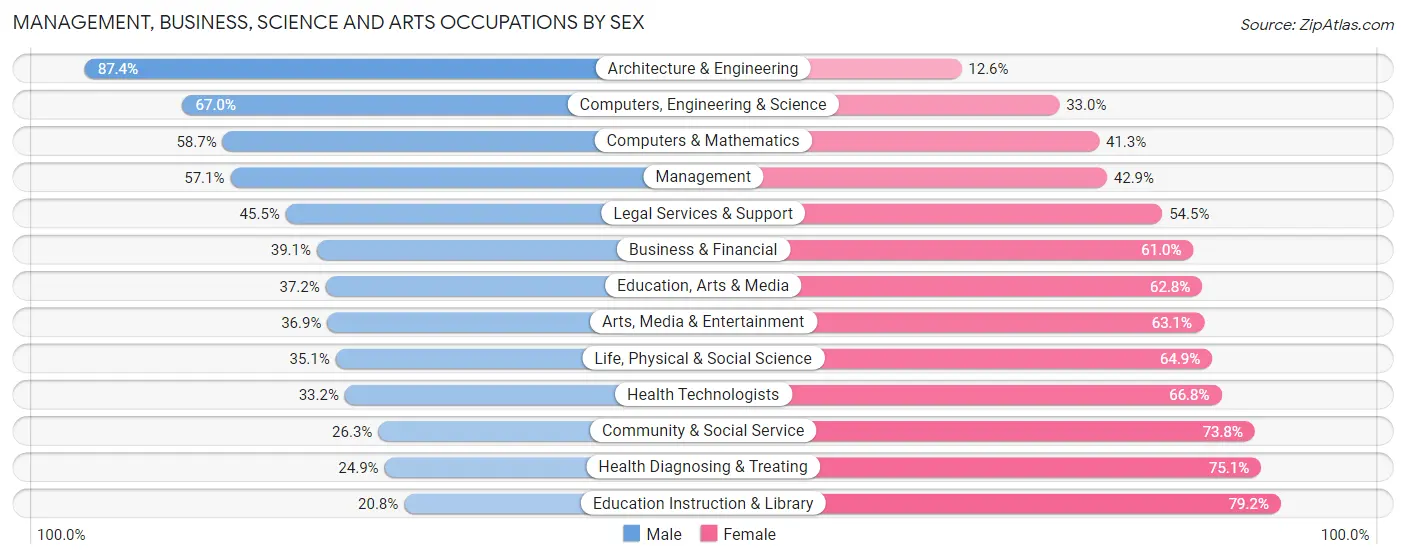
Management, Business, Science and Arts Occupations by Sex
Within the Management, Business, Science and Arts occupations in Bowie County, the most male-oriented occupations are Architecture & Engineering (87.4%), Computers, Engineering & Science (67.0%), and Computers & Mathematics (58.7%), while the most female-oriented occupations are Education Instruction & Library (79.2%), Health Diagnosing & Treating (75.1%), and Community & Social Service (73.8%).
| Occupation | Male | Female |
| Management | 2,042 (57.1%) | 1,535 (42.9%) |
| Business & Financial | 446 (39.1%) | 696 (61.0%) |
| Computers, Engineering & Science | 622 (67.0%) | 306 (33.0%) |
| Computers & Mathematics | 229 (58.7%) | 161 (41.3%) |
| Architecture & Engineering | 341 (87.4%) | 49 (12.6%) |
| Life, Physical & Social Science | 52 (35.1%) | 96 (64.9%) |
| Community & Social Service | 1,018 (26.3%) | 2,860 (73.8%) |
| Education, Arts & Media | 290 (37.2%) | 489 (62.8%) |
| Legal Services & Support | 46 (45.5%) | 55 (54.5%) |
| Education Instruction & Library | 550 (20.8%) | 2,090 (79.2%) |
| Arts, Media & Entertainment | 132 (36.9%) | 226 (63.1%) |
| Health Diagnosing & Treating | 670 (24.9%) | 2,016 (75.1%) |
| Health Technologists | 604 (33.2%) | 1,214 (66.8%) |
| Total (Category) | 4,798 (39.3%) | 7,413 (60.7%) |
| Total (Overall) | 19,070 (50.0%) | 19,067 (50.0%) |
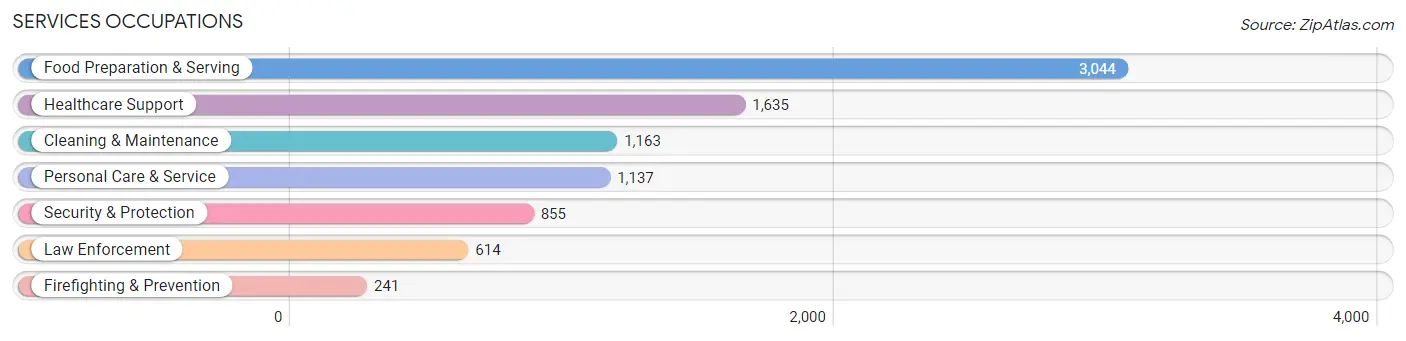
Services Occupations
The most common Services occupations in Bowie County are Food Preparation & Serving (3,044 | 8.0%), Healthcare Support (1,635 | 4.3%), Cleaning & Maintenance (1,163 | 3.0%), Personal Care & Service (1,137 | 3.0%), and Security & Protection (855 | 2.2%).
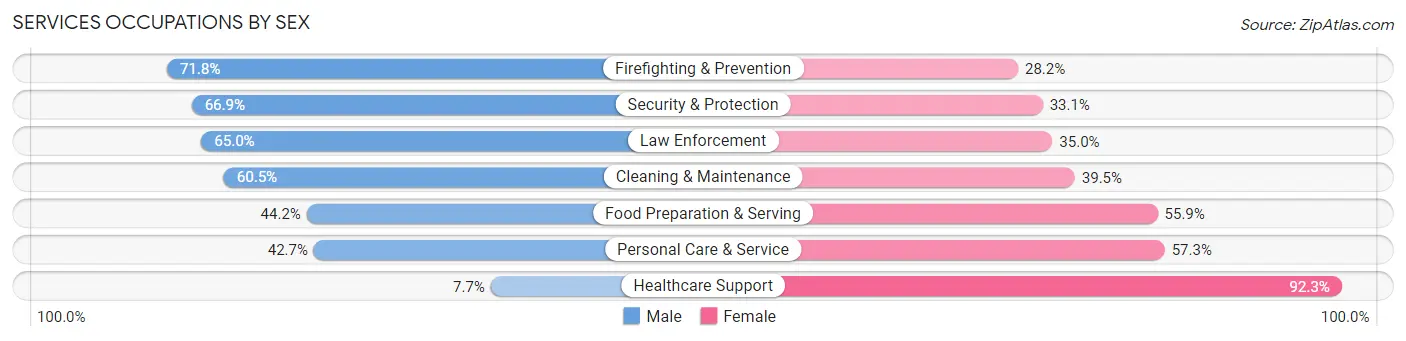
Services Occupations by Sex
Within the Services occupations in Bowie County, the most male-oriented occupations are Firefighting & Prevention (71.8%), Security & Protection (66.9%), and Law Enforcement (65.0%), while the most female-oriented occupations are Healthcare Support (92.3%), Personal Care & Service (57.3%), and Food Preparation & Serving (55.8%).
| Occupation | Male | Female |
| Healthcare Support | 126 (7.7%) | 1,509 (92.3%) |
| Security & Protection | 572 (66.9%) | 283 (33.1%) |
| Firefighting & Prevention | 173 (71.8%) | 68 (28.2%) |
| Law Enforcement | 399 (65.0%) | 215 (35.0%) |
| Food Preparation & Serving | 1,344 (44.2%) | 1,700 (55.8%) |
| Cleaning & Maintenance | 704 (60.5%) | 459 (39.5%) |
| Personal Care & Service | 486 (42.7%) | 651 (57.3%) |
| Total (Category) | 3,232 (41.3%) | 4,602 (58.7%) |
| Total (Overall) | 19,070 (50.0%) | 19,067 (50.0%) |
Sales and Office Occupations
The most common Sales and Office occupations in Bowie County are Office & Administration (4,626 | 12.1%), and Sales & Related (4,448 | 11.7%).

Sales and Office Occupations by Sex
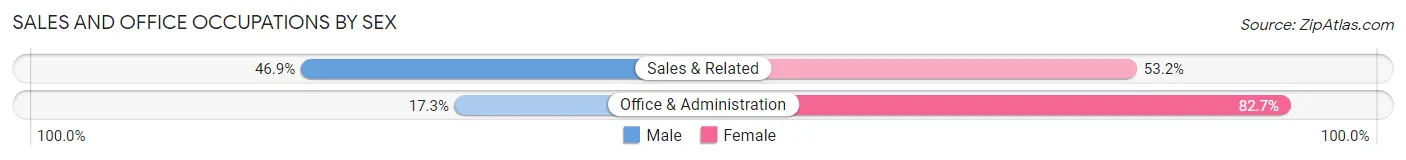
| Occupation | Male | Female |
| Sales & Related | 2,084 (46.9%) | 2,364 (53.1%) |
| Office & Administration | 799 (17.3%) | 3,827 (82.7%) |
| Total (Category) | 2,883 (31.8%) | 6,191 (68.2%) |
| Total (Overall) | 19,070 (50.0%) | 19,067 (50.0%) |
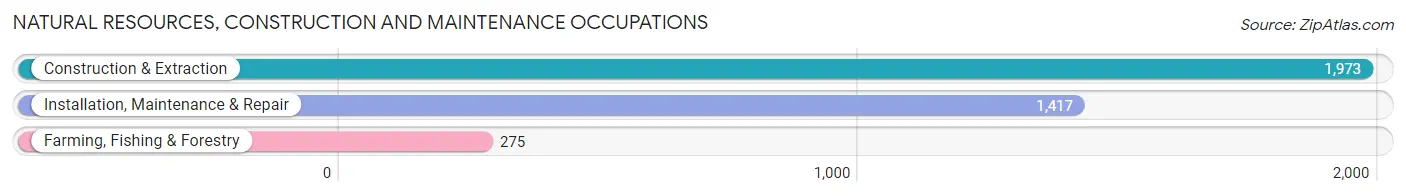
Natural Resources, Construction and Maintenance Occupations
The most common Natural Resources, Construction and Maintenance occupations in Bowie County are Construction & Extraction (1,973 | 5.2%), Installation, Maintenance & Repair (1,417 | 3.7%), and Farming, Fishing & Forestry (275 | 0.7%).
Natural Resources, Construction and Maintenance Occupations by Sex
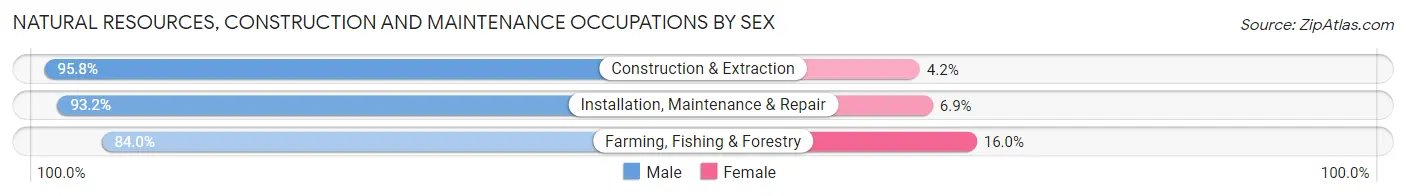
| Occupation | Male | Female |
| Farming, Fishing & Forestry | 231 (84.0%) | 44 (16.0%) |
| Construction & Extraction | 1,891 (95.8%) | 82 (4.2%) |
| Installation, Maintenance & Repair | 1,320 (93.1%) | 97 (6.9%) |
| Total (Category) | 3,442 (93.9%) | 223 (6.1%) |
| Total (Overall) | 19,070 (50.0%) | 19,067 (50.0%) |
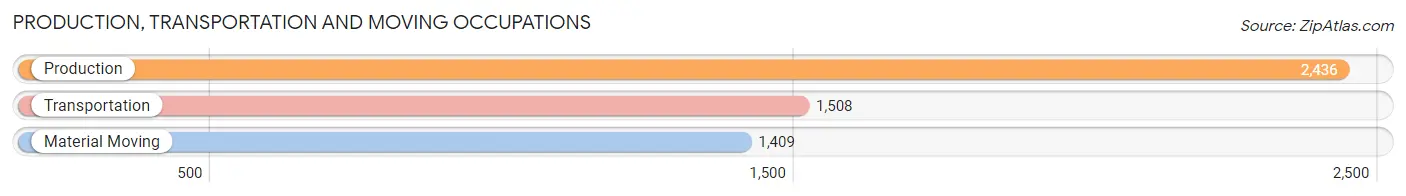
Production, Transportation and Moving Occupations
The most common Production, Transportation and Moving occupations in Bowie County are Production (2,436 | 6.4%), Transportation (1,508 | 4.0%), and Material Moving (1,409 | 3.7%).
Production, Transportation and Moving Occupations by Sex
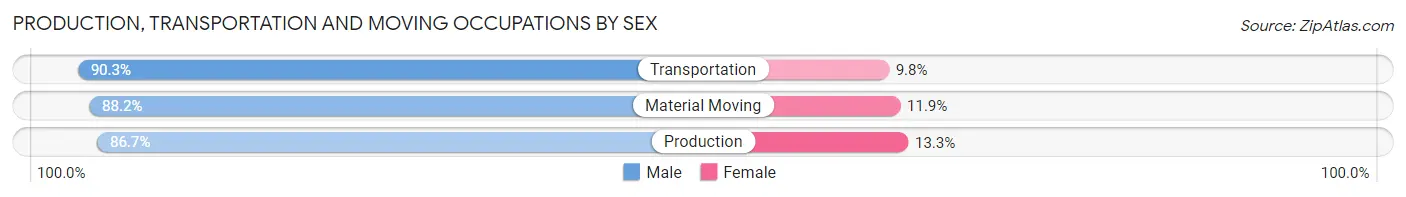
| Occupation | Male | Female |
| Production | 2,112 (86.7%) | 324 (13.3%) |
| Transportation | 1,361 (90.2%) | 147 (9.8%) |
| Material Moving | 1,242 (88.1%) | 167 (11.8%) |
| Total (Category) | 4,715 (88.1%) | 638 (11.9%) |
| Total (Overall) | 19,070 (50.0%) | 19,067 (50.0%) |
Employment Industries by Sex in Bowie County
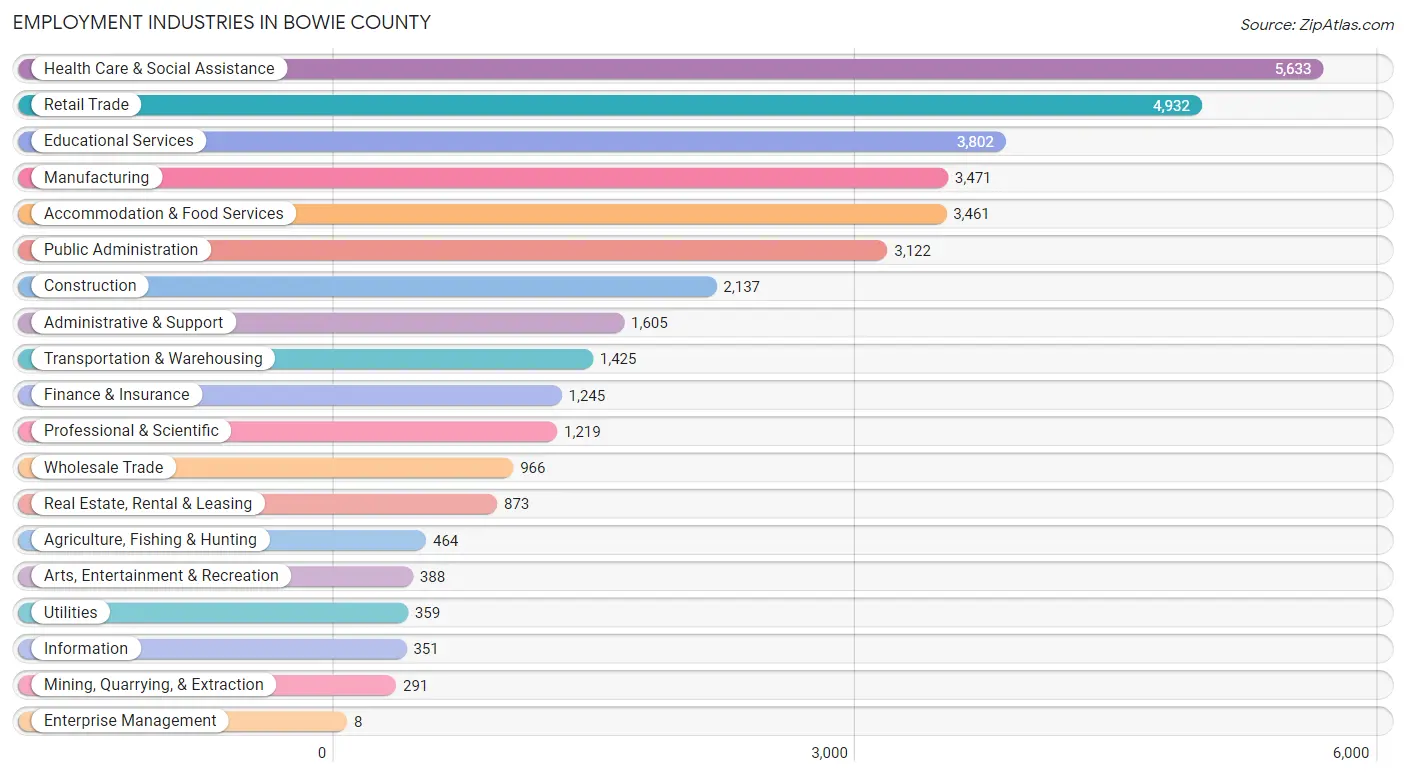
Employment Industries in Bowie County
The major employment industries in Bowie County include Health Care & Social Assistance (5,633 | 14.8%), Retail Trade (4,932 | 12.9%), Educational Services (3,802 | 10.0%), Manufacturing (3,471 | 9.1%), and Accommodation & Food Services (3,461 | 9.1%).
Employment Industries by Sex in Bowie County
The Bowie County industries that see more men than women are Mining, Quarrying, & Extraction (100.0%), Construction (92.8%), and Agriculture, Fishing & Hunting (86.0%), whereas the industries that tend to have a higher number of women are Enterprise Management (100.0%), Health Care & Social Assistance (83.1%), and Educational Services (78.1%).
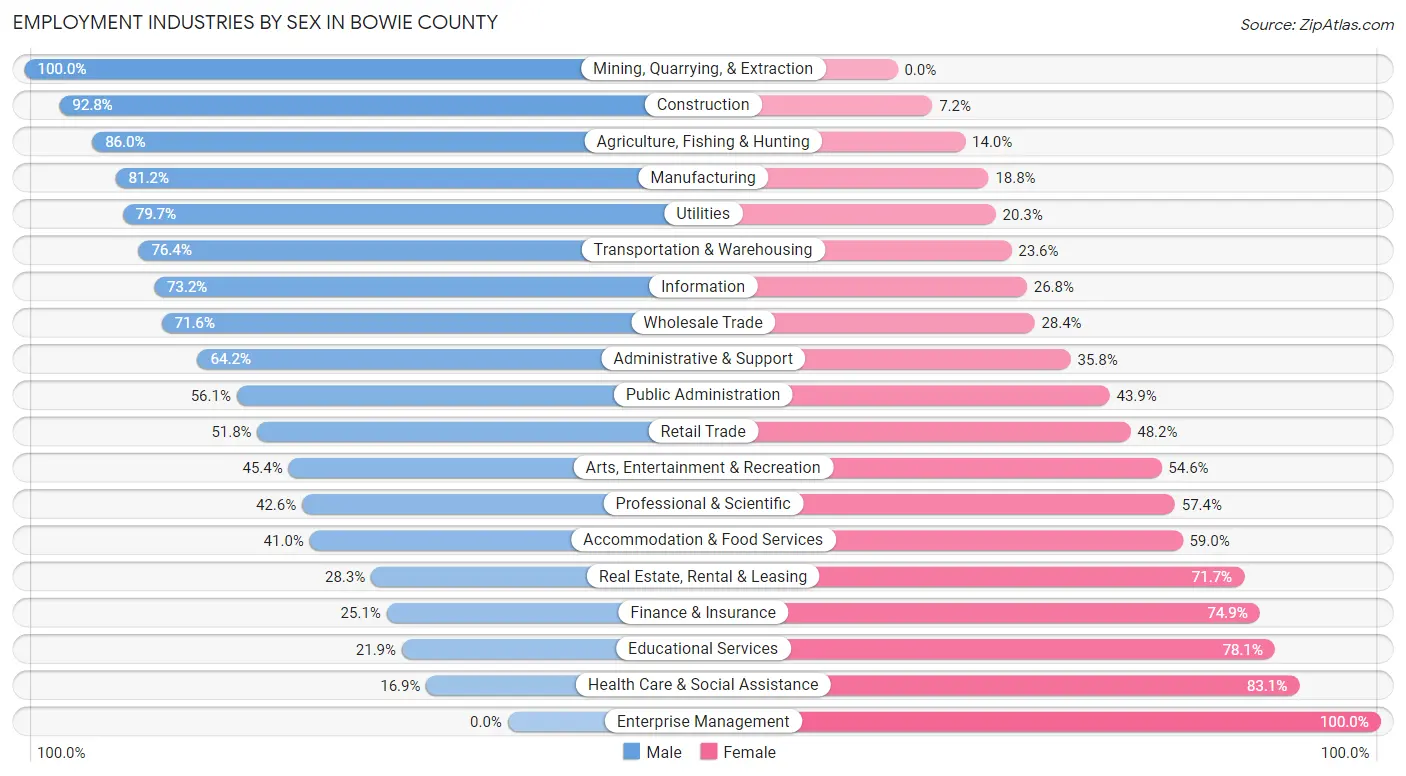
| Industry | Male | Female |
| Agriculture, Fishing & Hunting | 399 (86.0%) | 65 (14.0%) |
| Mining, Quarrying, & Extraction | 291 (100.0%) | 0 (0.0%) |
| Construction | 1,983 (92.8%) | 154 (7.2%) |
| Manufacturing | 2,817 (81.2%) | 654 (18.8%) |
| Wholesale Trade | 692 (71.6%) | 274 (28.4%) |
| Retail Trade | 2,555 (51.8%) | 2,377 (48.2%) |
| Transportation & Warehousing | 1,089 (76.4%) | 336 (23.6%) |
| Utilities | 286 (79.7%) | 73 (20.3%) |
| Information | 257 (73.2%) | 94 (26.8%) |
| Finance & Insurance | 312 (25.1%) | 933 (74.9%) |
| Real Estate, Rental & Leasing | 247 (28.3%) | 626 (71.7%) |
| Professional & Scientific | 519 (42.6%) | 700 (57.4%) |
| Enterprise Management | 0 (0.0%) | 8 (100.0%) |
| Administrative & Support | 1,030 (64.2%) | 575 (35.8%) |
| Educational Services | 833 (21.9%) | 2,969 (78.1%) |
| Health Care & Social Assistance | 950 (16.9%) | 4,683 (83.1%) |
| Arts, Entertainment & Recreation | 176 (45.4%) | 212 (54.6%) |
| Accommodation & Food Services | 1,419 (41.0%) | 2,042 (59.0%) |
| Public Administration | 1,751 (56.1%) | 1,371 (43.9%) |
| Total | 19,070 (50.0%) | 19,067 (50.0%) |
Education in Bowie County
School Enrollment in Bowie County
The most common levels of schooling among the 21,615 students in Bowie County are elementary school (5,152 | 23.8%), high school (5,084 | 23.5%), and middle school (4,578 | 21.2%).
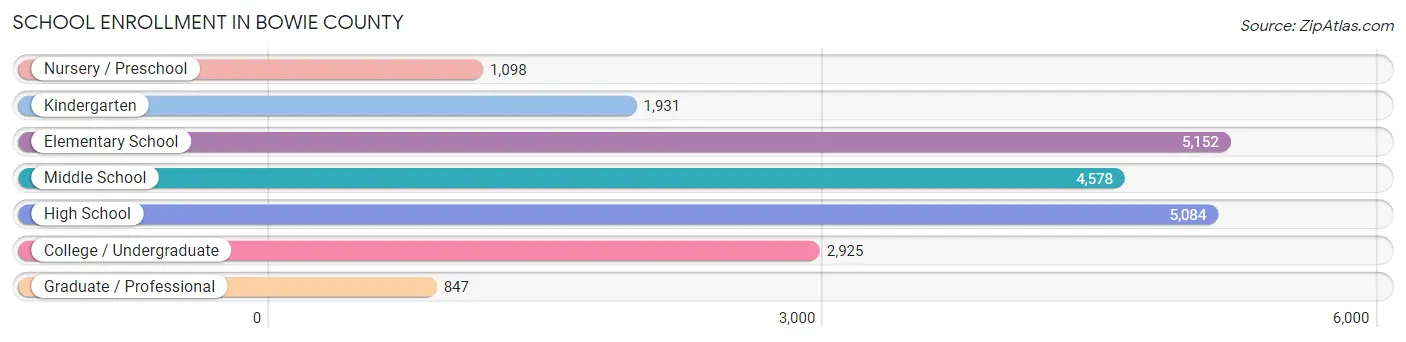
| School Level | # Students | % Students |
| Nursery / Preschool | 1,098 | 5.1% |
| Kindergarten | 1,931 | 8.9% |
| Elementary School | 5,152 | 23.8% |
| Middle School | 4,578 | 21.2% |
| High School | 5,084 | 23.5% |
| College / Undergraduate | 2,925 | 13.5% |
| Graduate / Professional | 847 | 3.9% |
| Total | 21,615 | 100.0% |
School Enrollment by Age by Funding Source in Bowie County
Out of a total of 21,615 students who are enrolled in schools in Bowie County, 1,794 (8.3%) attend a private institution, while the remaining 19,821 (91.7%) are enrolled in public schools. The age group of 20 to 24 year olds has the highest likelihood of being enrolled in private schools, with 333 (20.7% in the age bracket) enrolled. Conversely, the age group of 5 to 9 year old has the lowest likelihood of being enrolled in a private school, with 5,916 (95.3% in the age bracket) attending a public institution.
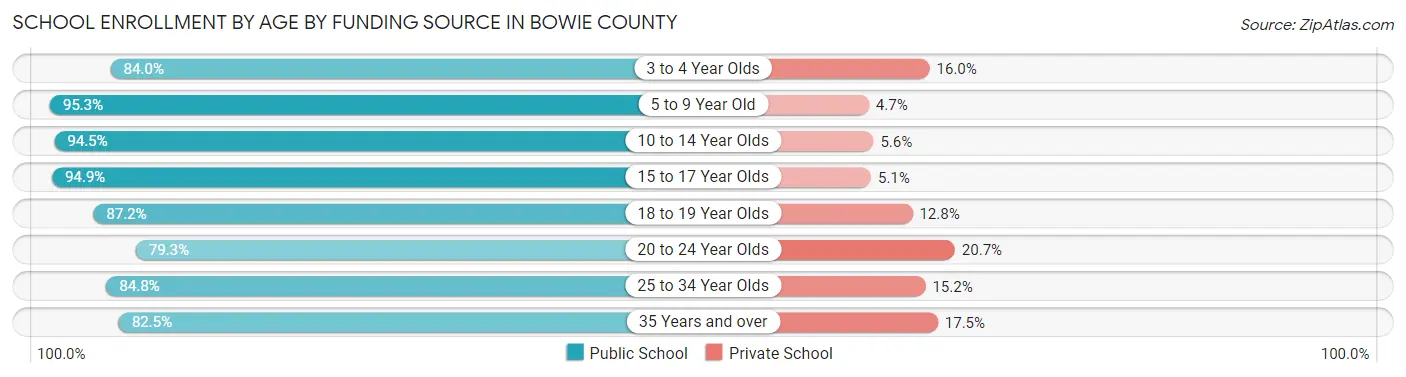
| Age Bracket | Public School | Private School |
| 3 to 4 Year Olds | 871 (84.0%) | 166 (16.0%) |
| 5 to 9 Year Old | 5,916 (95.3%) | 292 (4.7%) |
| 10 to 14 Year Olds | 5,647 (94.5%) | 332 (5.6%) |
| 15 to 17 Year Olds | 3,459 (94.9%) | 186 (5.1%) |
| 18 to 19 Year Olds | 816 (87.2%) | 120 (12.8%) |
| 20 to 24 Year Olds | 1,274 (79.3%) | 333 (20.7%) |
| 25 to 34 Year Olds | 1,007 (84.8%) | 181 (15.2%) |
| 35 Years and over | 837 (82.5%) | 178 (17.5%) |
| Total | 19,821 (91.7%) | 1,794 (8.3%) |
Educational Attainment by Field of Study in Bowie County
Education (3,290 | 22.2%), business (2,907 | 19.6%), science & technology (1,559 | 10.5%), bio, nature & agricultural (1,125 | 7.6%), and arts & humanities (867 | 5.9%) are the most common fields of study among 14,816 individuals in Bowie County who have obtained a bachelor's degree or higher.
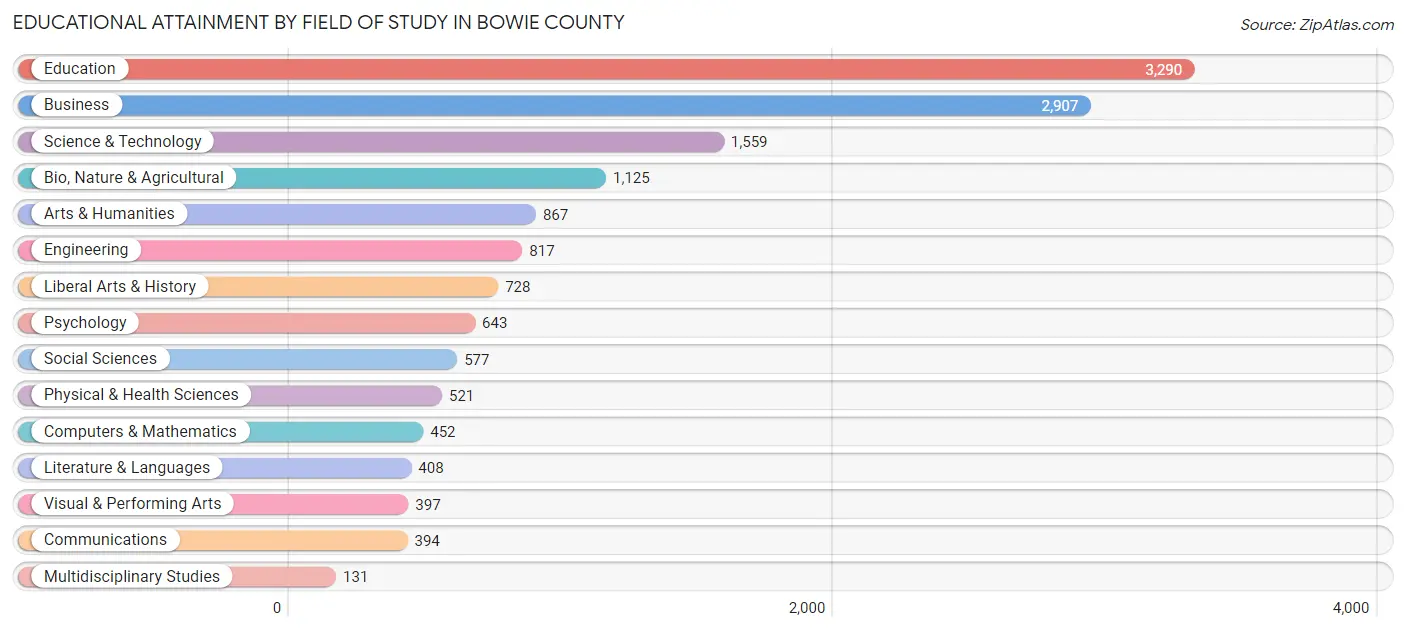
| Field of Study | # Graduates | % Graduates |
| Computers & Mathematics | 452 | 3.0% |
| Bio, Nature & Agricultural | 1,125 | 7.6% |
| Physical & Health Sciences | 521 | 3.5% |
| Psychology | 643 | 4.3% |
| Social Sciences | 577 | 3.9% |
| Engineering | 817 | 5.5% |
| Multidisciplinary Studies | 131 | 0.9% |
| Science & Technology | 1,559 | 10.5% |
| Business | 2,907 | 19.6% |
| Education | 3,290 | 22.2% |
| Literature & Languages | 408 | 2.8% |
| Liberal Arts & History | 728 | 4.9% |
| Visual & Performing Arts | 397 | 2.7% |
| Communications | 394 | 2.7% |
| Arts & Humanities | 867 | 5.9% |
| Total | 14,816 | 100.0% |
Transportation & Commute in Bowie County
Vehicle Availability by Sex in Bowie County
The most prevalent vehicle ownership categories in Bowie County are males with 2 vehicles (7,863, accounting for 41.5%) and females with 2 vehicles (7,705, making up 41.5%).
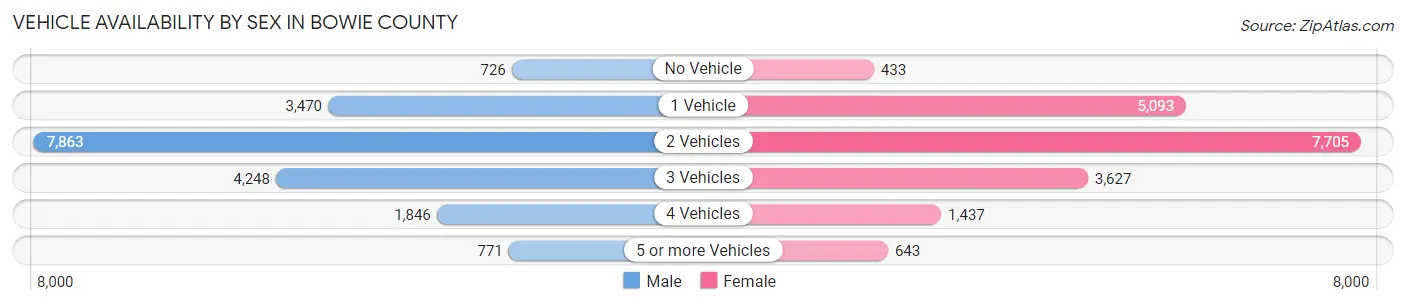
| Vehicles Available | Male | Female |
| No Vehicle | 726 (3.8%) | 433 (2.3%) |
| 1 Vehicle | 3,470 (18.3%) | 5,093 (26.9%) |
| 2 Vehicles | 7,863 (41.5%) | 7,705 (40.7%) |
| 3 Vehicles | 4,248 (22.5%) | 3,627 (19.2%) |
| 4 Vehicles | 1,846 (9.8%) | 1,437 (7.6%) |
| 5 or more Vehicles | 771 (4.1%) | 643 (3.4%) |
| Total | 18,924 (100.0%) | 18,938 (100.0%) |
Commute Time in Bowie County
The most frequently occuring commute durations in Bowie County are 10 to 14 minutes (11,662 commuters, 32.2%), 20 to 24 minutes (6,069 commuters, 16.8%), and 5 to 9 minutes (5,613 commuters, 15.5%).
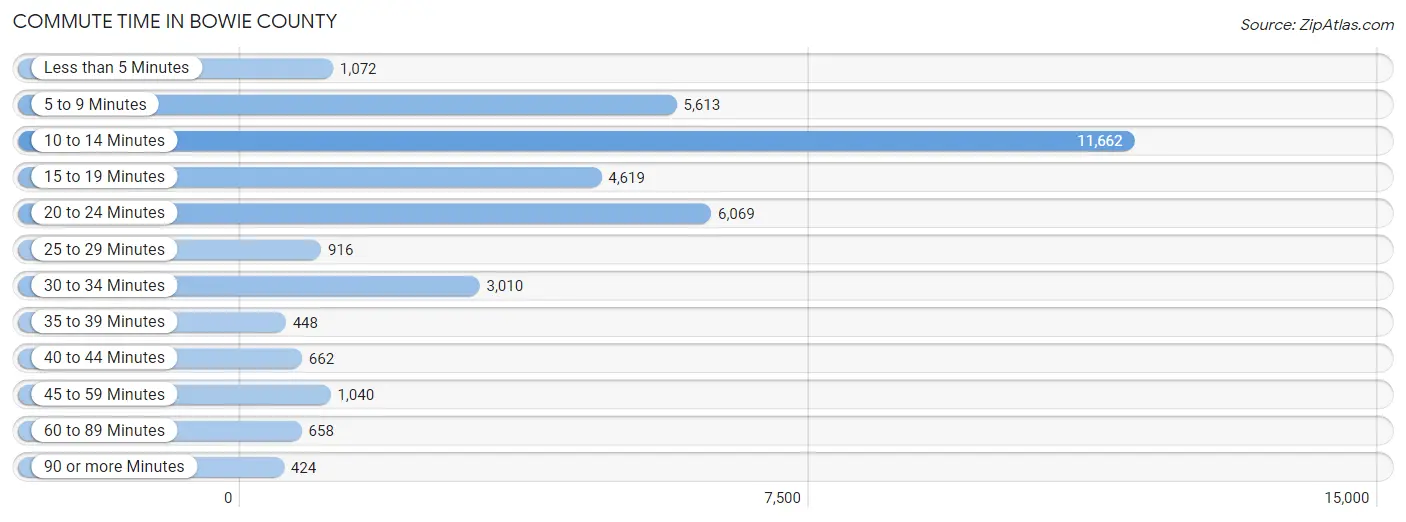
| Commute Time | # Commuters | % Commuters |
| Less than 5 Minutes | 1,072 | 3.0% |
| 5 to 9 Minutes | 5,613 | 15.5% |
| 10 to 14 Minutes | 11,662 | 32.2% |
| 15 to 19 Minutes | 4,619 | 12.8% |
| 20 to 24 Minutes | 6,069 | 16.8% |
| 25 to 29 Minutes | 916 | 2.5% |
| 30 to 34 Minutes | 3,010 | 8.3% |
| 35 to 39 Minutes | 448 | 1.2% |
| 40 to 44 Minutes | 662 | 1.8% |
| 45 to 59 Minutes | 1,040 | 2.9% |
| 60 to 89 Minutes | 658 | 1.8% |
| 90 or more Minutes | 424 | 1.2% |
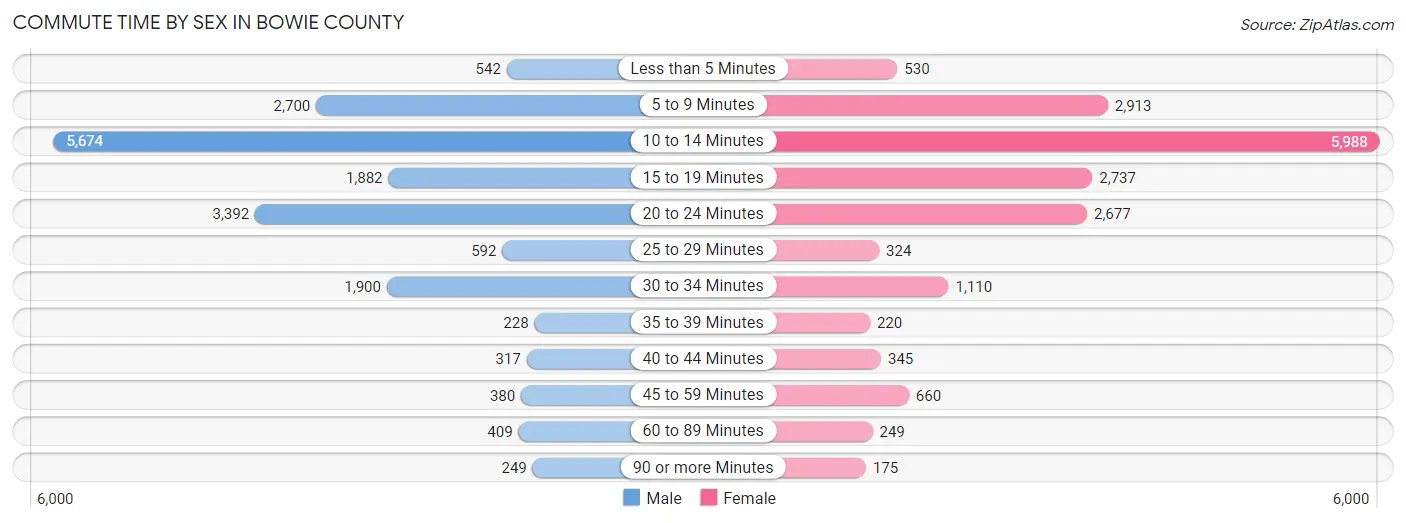
Commute Time by Sex in Bowie County
The most common commute times in Bowie County are 10 to 14 minutes (5,674 commuters, 31.1%) for males and 10 to 14 minutes (5,988 commuters, 33.4%) for females.
| Commute Time | Male | Female |
| Less than 5 Minutes | 542 (3.0%) | 530 (3.0%) |
| 5 to 9 Minutes | 2,700 (14.8%) | 2,913 (16.3%) |
| 10 to 14 Minutes | 5,674 (31.1%) | 5,988 (33.4%) |
| 15 to 19 Minutes | 1,882 (10.3%) | 2,737 (15.3%) |
| 20 to 24 Minutes | 3,392 (18.6%) | 2,677 (14.9%) |
| 25 to 29 Minutes | 592 (3.2%) | 324 (1.8%) |
| 30 to 34 Minutes | 1,900 (10.4%) | 1,110 (6.2%) |
| 35 to 39 Minutes | 228 (1.3%) | 220 (1.2%) |
| 40 to 44 Minutes | 317 (1.7%) | 345 (1.9%) |
| 45 to 59 Minutes | 380 (2.1%) | 660 (3.7%) |
| 60 to 89 Minutes | 409 (2.2%) | 249 (1.4%) |
| 90 or more Minutes | 249 (1.4%) | 175 (1.0%) |
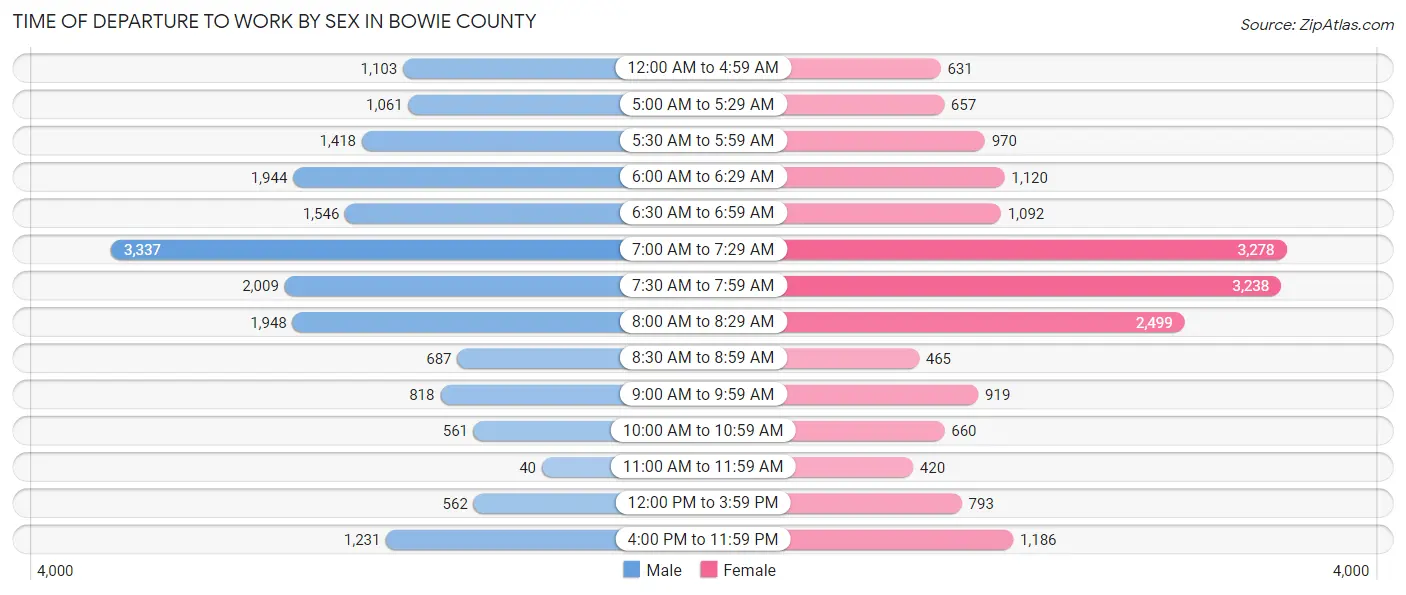
Time of Departure to Work by Sex in Bowie County
The most frequent times of departure to work in Bowie County are 7:00 AM to 7:29 AM (3,337, 18.3%) for males and 7:00 AM to 7:29 AM (3,278, 18.3%) for females.
| Time of Departure | Male | Female |
| 12:00 AM to 4:59 AM | 1,103 (6.0%) | 631 (3.5%) |
| 5:00 AM to 5:29 AM | 1,061 (5.8%) | 657 (3.7%) |
| 5:30 AM to 5:59 AM | 1,418 (7.8%) | 970 (5.4%) |
| 6:00 AM to 6:29 AM | 1,944 (10.6%) | 1,120 (6.2%) |
| 6:30 AM to 6:59 AM | 1,546 (8.5%) | 1,092 (6.1%) |
| 7:00 AM to 7:29 AM | 3,337 (18.3%) | 3,278 (18.3%) |
| 7:30 AM to 7:59 AM | 2,009 (11.0%) | 3,238 (18.1%) |
| 8:00 AM to 8:29 AM | 1,948 (10.7%) | 2,499 (13.9%) |
| 8:30 AM to 8:59 AM | 687 (3.8%) | 465 (2.6%) |
| 9:00 AM to 9:59 AM | 818 (4.5%) | 919 (5.1%) |
| 10:00 AM to 10:59 AM | 561 (3.1%) | 660 (3.7%) |
| 11:00 AM to 11:59 AM | 40 (0.2%) | 420 (2.3%) |
| 12:00 PM to 3:59 PM | 562 (3.1%) | 793 (4.4%) |
| 4:00 PM to 11:59 PM | 1,231 (6.7%) | 1,186 (6.6%) |
| Total | 18,265 (100.0%) | 17,928 (100.0%) |
Housing Occupancy in Bowie County
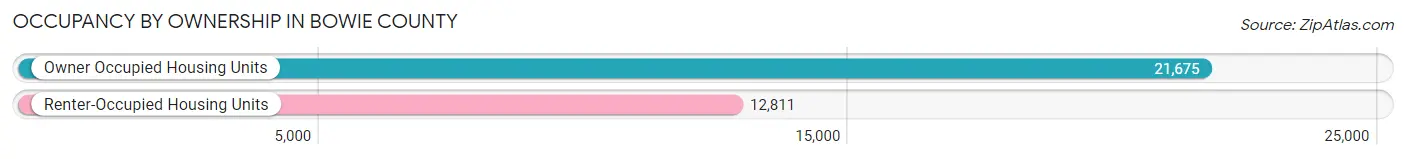
Occupancy by Ownership in Bowie County
Of the total 34,486 dwellings in Bowie County, owner-occupied units account for 21,675 (62.8%), while renter-occupied units make up 12,811 (37.1%).
| Occupancy | # Housing Units | % Housing Units |
| Owner Occupied Housing Units | 21,675 | 62.8% |
| Renter-Occupied Housing Units | 12,811 | 37.1% |
| Total Occupied Housing Units | 34,486 | 100.0% |
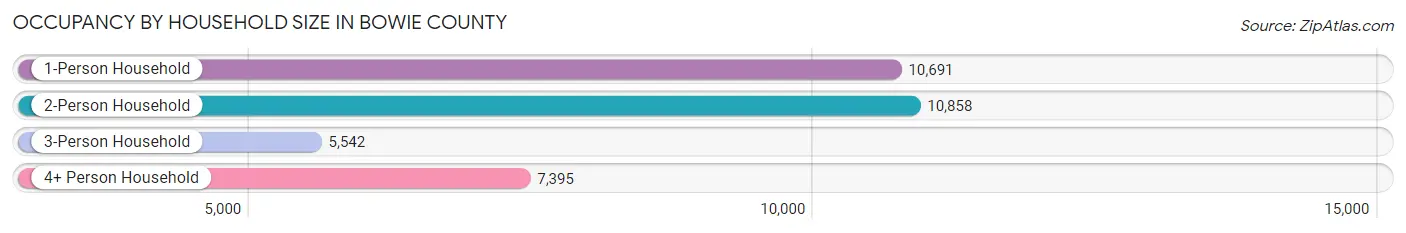
Occupancy by Household Size in Bowie County
| Household Size | # Housing Units | % Housing Units |
| 1-Person Household | 10,691 | 31.0% |
| 2-Person Household | 10,858 | 31.5% |
| 3-Person Household | 5,542 | 16.1% |
| 4+ Person Household | 7,395 | 21.4% |
| Total Housing Units | 34,486 | 100.0% |
Occupancy by Ownership by Household Size in Bowie County
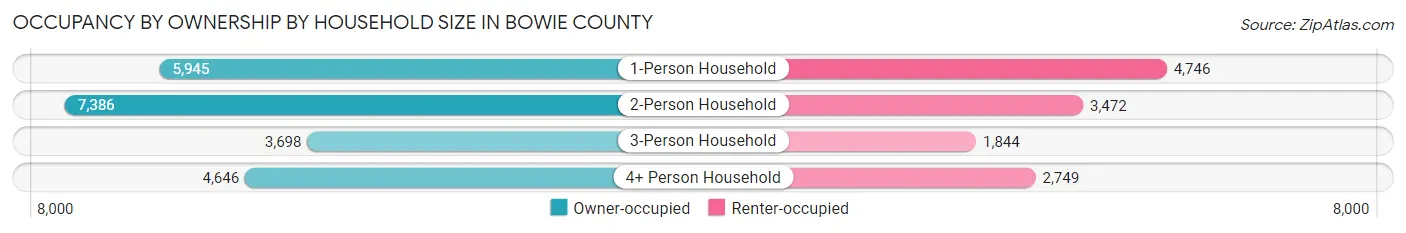
| Household Size | Owner-occupied | Renter-occupied |
| 1-Person Household | 5,945 (55.6%) | 4,746 (44.4%) |
| 2-Person Household | 7,386 (68.0%) | 3,472 (32.0%) |
| 3-Person Household | 3,698 (66.7%) | 1,844 (33.3%) |
| 4+ Person Household | 4,646 (62.8%) | 2,749 (37.2%) |
| Total Housing Units | 21,675 (62.8%) | 12,811 (37.1%) |
Occupancy by Educational Attainment in Bowie County
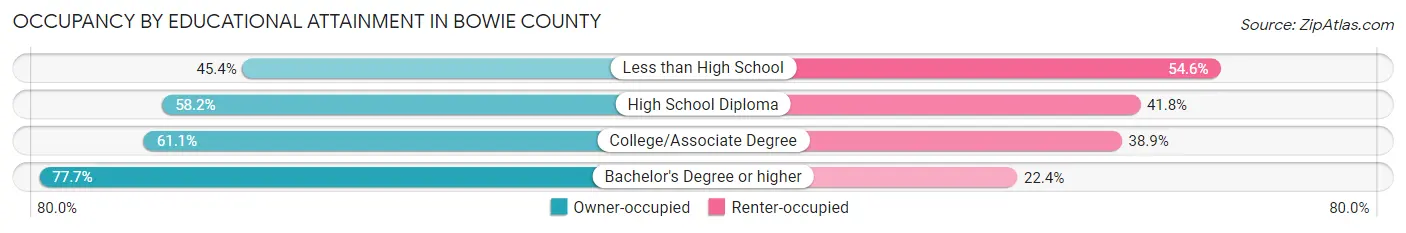
| Household Size | Owner-occupied | Renter-occupied |
| Less than High School | 1,337 (45.4%) | 1,606 (54.6%) |
| High School Diploma | 6,216 (58.2%) | 4,471 (41.8%) |
| College/Associate Degree | 7,642 (61.1%) | 4,869 (38.9%) |
| Bachelor's Degree or higher | 6,480 (77.6%) | 1,865 (22.4%) |
Occupancy by Age of Householder in Bowie County
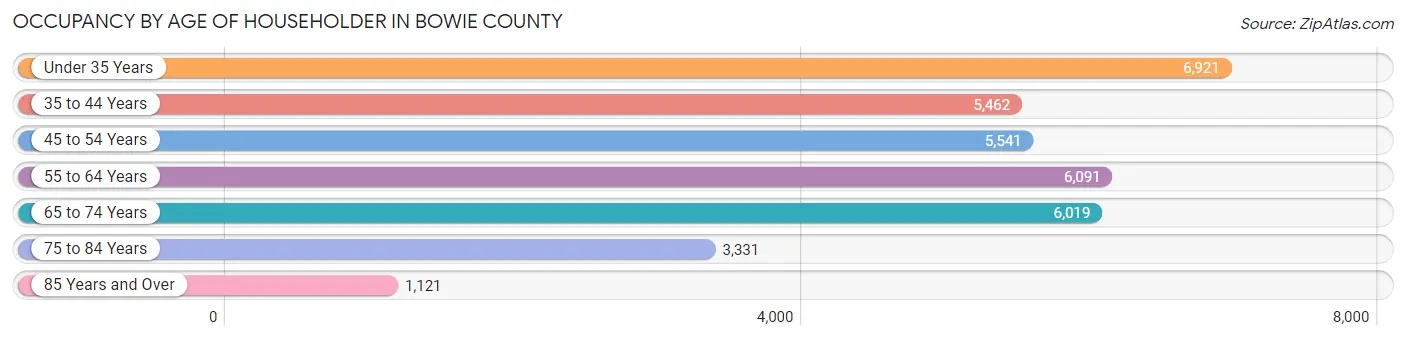
| Age Bracket | # Households | % Households |
| Under 35 Years | 6,921 | 20.1% |
| 35 to 44 Years | 5,462 | 15.8% |
| 45 to 54 Years | 5,541 | 16.1% |
| 55 to 64 Years | 6,091 | 17.7% |
| 65 to 74 Years | 6,019 | 17.4% |
| 75 to 84 Years | 3,331 | 9.7% |
| 85 Years and Over | 1,121 | 3.3% |
| Total | 34,486 | 100.0% |
Housing Finances in Bowie County
Median Income by Occupancy in Bowie County
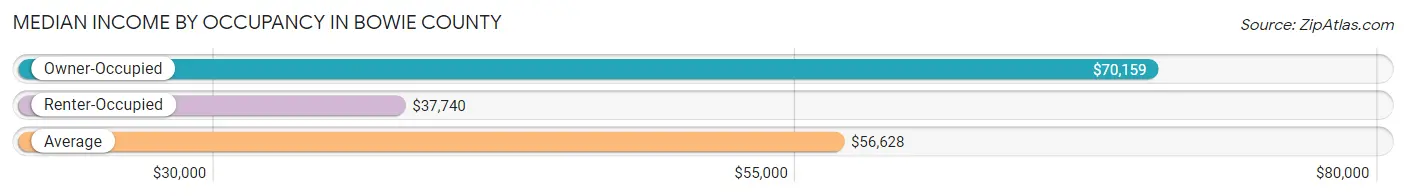
| Occupancy Type | # Households | Median Income |
| Owner-Occupied | 21,675 (62.8%) | $70,159 |
| Renter-Occupied | 12,811 (37.1%) | $37,740 |
| Average | 34,486 (100.0%) | $56,628 |
Occupancy by Householder Income Bracket in Bowie County
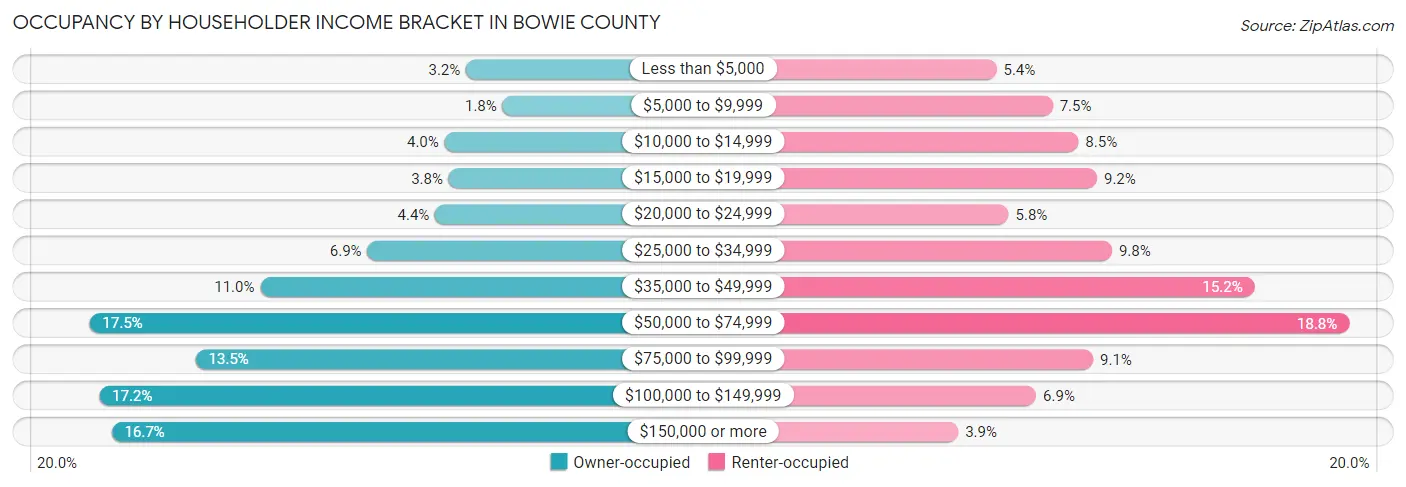
| Income Bracket | Owner-occupied | Renter-occupied |
| Less than $5,000 | 690 (3.2%) | 688 (5.4%) |
| $5,000 to $9,999 | 387 (1.8%) | 962 (7.5%) |
| $10,000 to $14,999 | 868 (4.0%) | 1,088 (8.5%) |
| $15,000 to $19,999 | 832 (3.8%) | 1,178 (9.2%) |
| $20,000 to $24,999 | 946 (4.4%) | 747 (5.8%) |
| $25,000 to $34,999 | 1,505 (6.9%) | 1,252 (9.8%) |
| $35,000 to $49,999 | 2,388 (11.0%) | 1,947 (15.2%) |
| $50,000 to $74,999 | 3,799 (17.5%) | 2,408 (18.8%) |
| $75,000 to $99,999 | 2,923 (13.5%) | 1,159 (9.0%) |
| $100,000 to $149,999 | 3,720 (17.2%) | 881 (6.9%) |
| $150,000 or more | 3,617 (16.7%) | 501 (3.9%) |
| Total | 21,675 (100.0%) | 12,811 (100.0%) |
Monthly Housing Cost Tiers in Bowie County
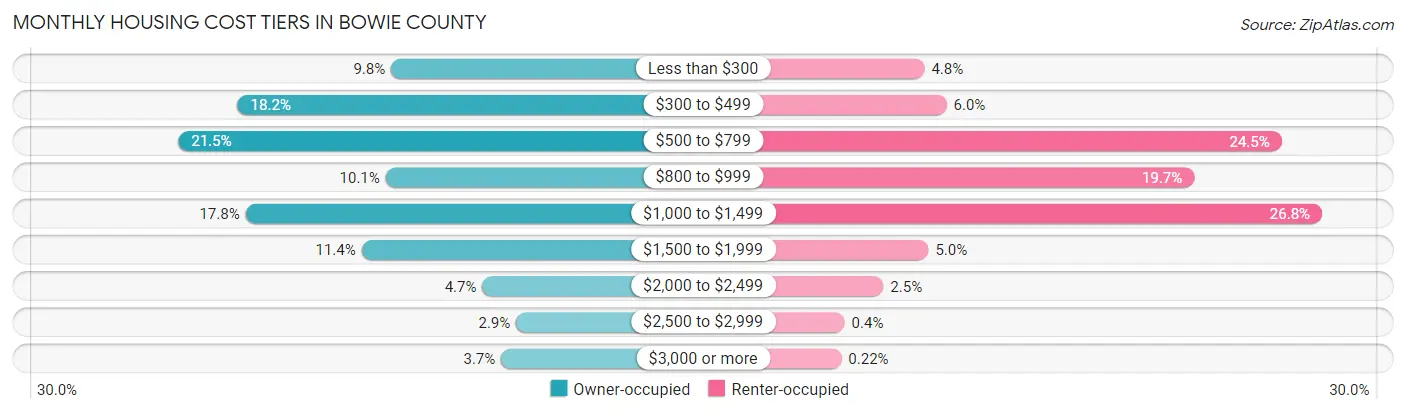
| Monthly Cost | Owner-occupied | Renter-occupied |
| Less than $300 | 2,115 (9.8%) | 616 (4.8%) |
| $300 to $499 | 3,952 (18.2%) | 773 (6.0%) |
| $500 to $799 | 4,662 (21.5%) | 3,143 (24.5%) |
| $800 to $999 | 2,181 (10.1%) | 2,524 (19.7%) |
| $1,000 to $1,499 | 3,859 (17.8%) | 3,428 (26.8%) |
| $1,500 to $1,999 | 2,469 (11.4%) | 644 (5.0%) |
| $2,000 to $2,499 | 1,022 (4.7%) | 325 (2.5%) |
| $2,500 to $2,999 | 618 (2.9%) | 51 (0.4%) |
| $3,000 or more | 797 (3.7%) | 28 (0.2%) |
| Total | 21,675 (100.0%) | 12,811 (100.0%) |
Physical Housing Characteristics in Bowie County
Housing Structures in Bowie County
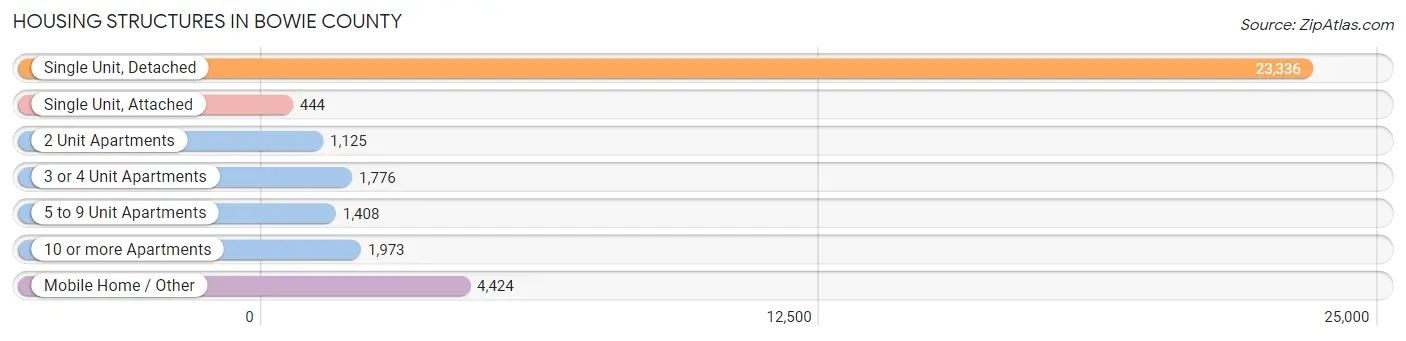
| Structure Type | # Housing Units | % Housing Units |
| Single Unit, Detached | 23,336 | 67.7% |
| Single Unit, Attached | 444 | 1.3% |
| 2 Unit Apartments | 1,125 | 3.3% |
| 3 or 4 Unit Apartments | 1,776 | 5.1% |
| 5 to 9 Unit Apartments | 1,408 | 4.1% |
| 10 or more Apartments | 1,973 | 5.7% |
| Mobile Home / Other | 4,424 | 12.8% |
| Total | 34,486 | 100.0% |
Housing Structures by Occupancy in Bowie County
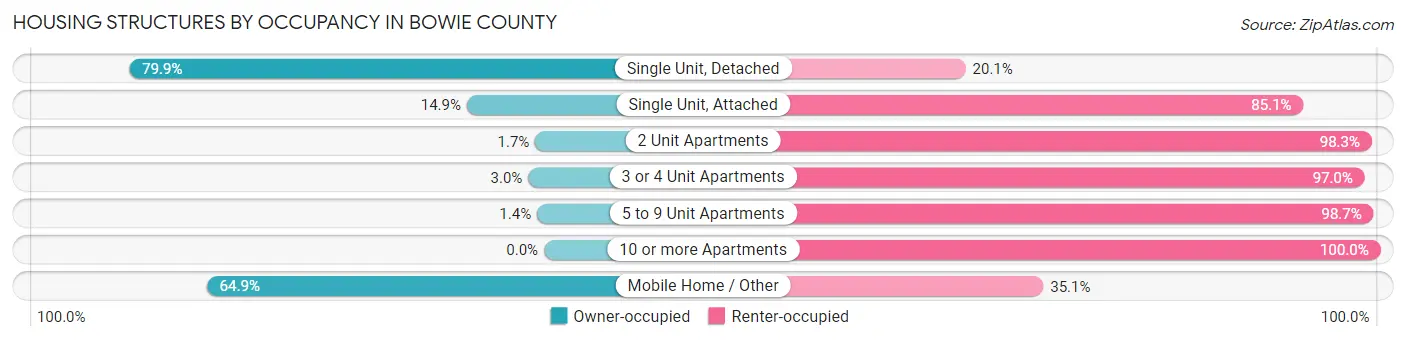
| Structure Type | Owner-occupied | Renter-occupied |
| Single Unit, Detached | 18,644 (79.9%) | 4,692 (20.1%) |
| Single Unit, Attached | 66 (14.9%) | 378 (85.1%) |
| 2 Unit Apartments | 19 (1.7%) | 1,106 (98.3%) |
| 3 or 4 Unit Apartments | 54 (3.0%) | 1,722 (97.0%) |
| 5 to 9 Unit Apartments | 19 (1.3%) | 1,389 (98.7%) |
| 10 or more Apartments | 0 (0.0%) | 1,973 (100.0%) |
| Mobile Home / Other | 2,873 (64.9%) | 1,551 (35.1%) |
| Total | 21,675 (62.8%) | 12,811 (37.1%) |
Housing Structures by Number of Rooms in Bowie County
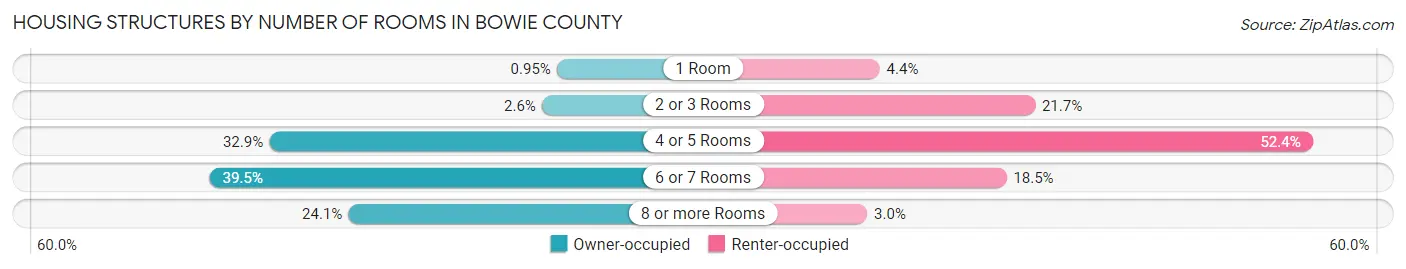
| Number of Rooms | Owner-occupied | Renter-occupied |
| 1 Room | 206 (0.9%) | 565 (4.4%) |
| 2 or 3 Rooms | 566 (2.6%) | 2,774 (21.6%) |
| 4 or 5 Rooms | 7,126 (32.9%) | 6,718 (52.4%) |
| 6 or 7 Rooms | 8,555 (39.5%) | 2,367 (18.5%) |
| 8 or more Rooms | 5,222 (24.1%) | 387 (3.0%) |
| Total | 21,675 (100.0%) | 12,811 (100.0%) |
Housing Structure by Heating Type in Bowie County
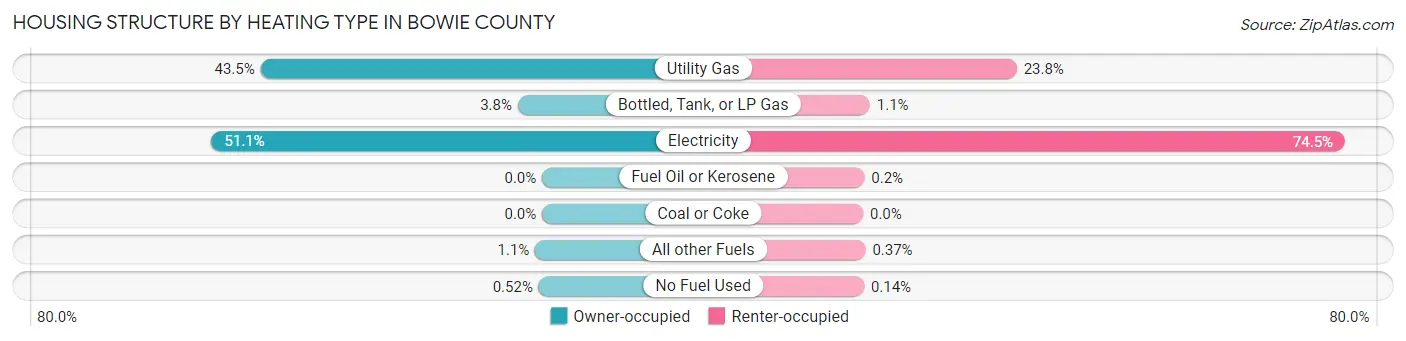
| Heating Type | Owner-occupied | Renter-occupied |
| Utility Gas | 9,436 (43.5%) | 3,042 (23.7%) |
| Bottled, Tank, or LP Gas | 813 (3.7%) | 134 (1.1%) |
| Electricity | 11,081 (51.1%) | 9,543 (74.5%) |
| Fuel Oil or Kerosene | 0 (0.0%) | 26 (0.2%) |
| Coal or Coke | 0 (0.0%) | 0 (0.0%) |
| All other Fuels | 233 (1.1%) | 48 (0.4%) |
| No Fuel Used | 112 (0.5%) | 18 (0.1%) |
| Total | 21,675 (100.0%) | 12,811 (100.0%) |
Household Vehicle Usage in Bowie County
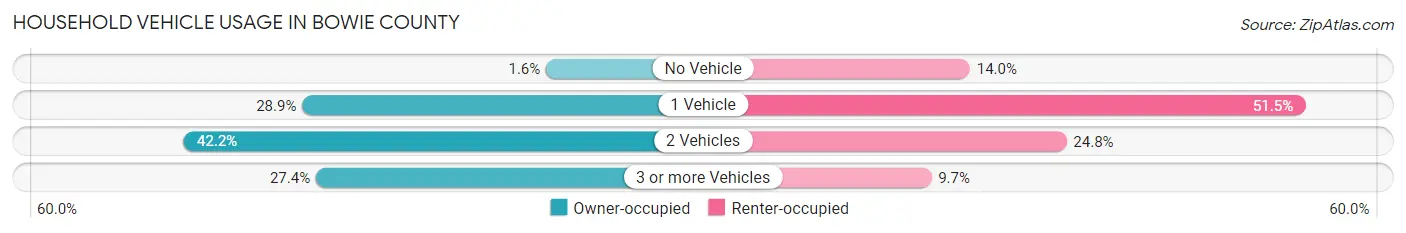
| Vehicles per Household | Owner-occupied | Renter-occupied |
| No Vehicle | 343 (1.6%) | 1,792 (14.0%) |
| 1 Vehicle | 6,265 (28.9%) | 6,602 (51.5%) |
| 2 Vehicles | 9,136 (42.1%) | 3,178 (24.8%) |
| 3 or more Vehicles | 5,931 (27.4%) | 1,239 (9.7%) |
| Total | 21,675 (100.0%) | 12,811 (100.0%) |
Real Estate & Mortgages in Bowie County
Real Estate and Mortgage Overview in Bowie County
| Characteristic | Without Mortgage | With Mortgage |
| Housing Units | 11,330 | 10,345 |
| Median Property Value | $126,100 | $168,800 |
| Median Household Income | $53,750 | $2,296 |
| Monthly Housing Costs | $488 | $786 |
| Real Estate Taxes | $1,451 | $537 |
Property Value by Mortgage Status in Bowie County
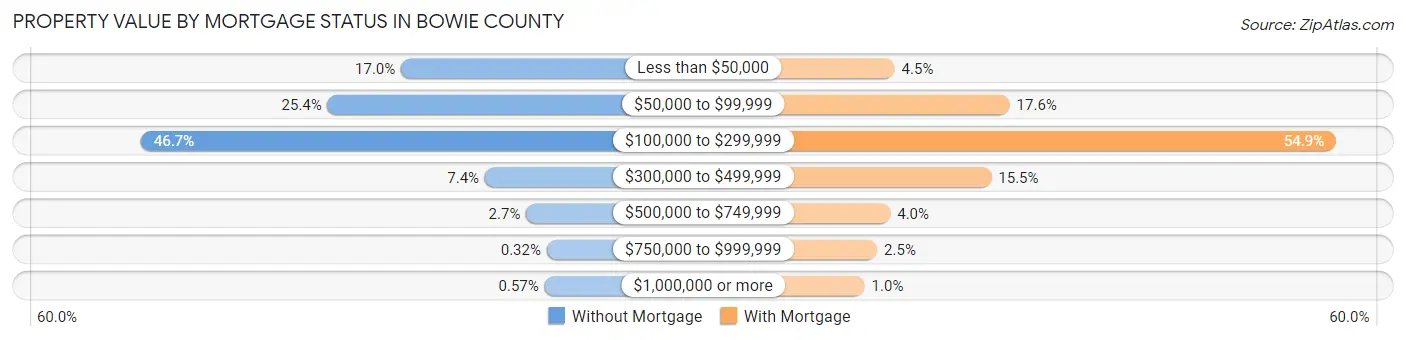
| Property Value | Without Mortgage | With Mortgage |
| Less than $50,000 | 1,923 (17.0%) | 462 (4.5%) |
| $50,000 to $99,999 | 2,874 (25.4%) | 1,822 (17.6%) |
| $100,000 to $299,999 | 5,292 (46.7%) | 5,680 (54.9%) |
| $300,000 to $499,999 | 837 (7.4%) | 1,606 (15.5%) |
| $500,000 to $749,999 | 303 (2.7%) | 411 (4.0%) |
| $750,000 to $999,999 | 36 (0.3%) | 256 (2.5%) |
| $1,000,000 or more | 65 (0.6%) | 108 (1.0%) |
| Total | 11,330 (100.0%) | 10,345 (100.0%) |
Household Income by Mortgage Status in Bowie County
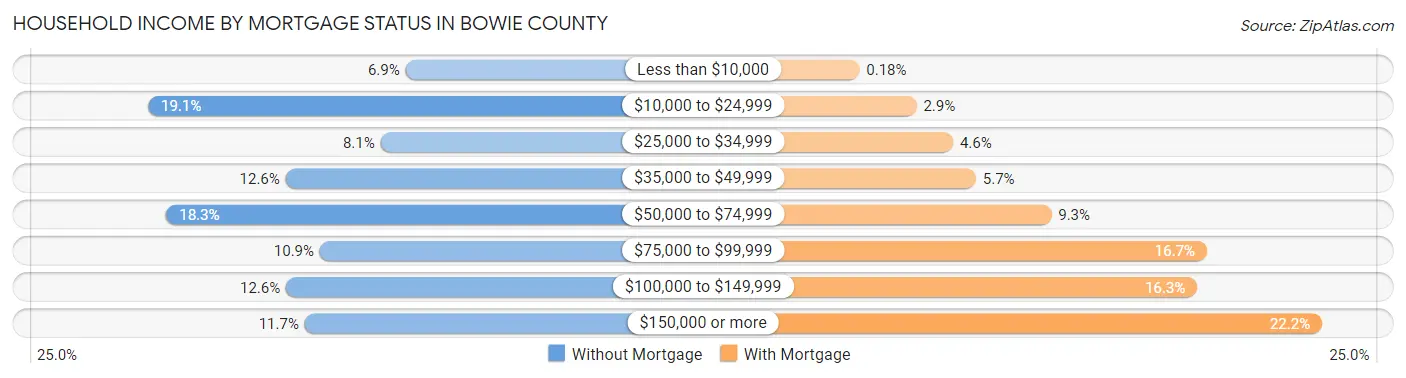
| Household Income | Without Mortgage | With Mortgage |
| Less than $10,000 | 777 (6.9%) | 19 (0.2%) |
| $10,000 to $24,999 | 2,166 (19.1%) | 300 (2.9%) |
| $25,000 to $34,999 | 912 (8.1%) | 480 (4.6%) |
| $35,000 to $49,999 | 1,424 (12.6%) | 593 (5.7%) |
| $50,000 to $74,999 | 2,068 (18.2%) | 964 (9.3%) |
| $75,000 to $99,999 | 1,240 (10.9%) | 1,731 (16.7%) |
| $100,000 to $149,999 | 1,422 (12.6%) | 1,683 (16.3%) |
| $150,000 or more | 1,321 (11.7%) | 2,298 (22.2%) |
| Total | 11,330 (100.0%) | 10,345 (100.0%) |
Property Value to Household Income Ratio in Bowie County
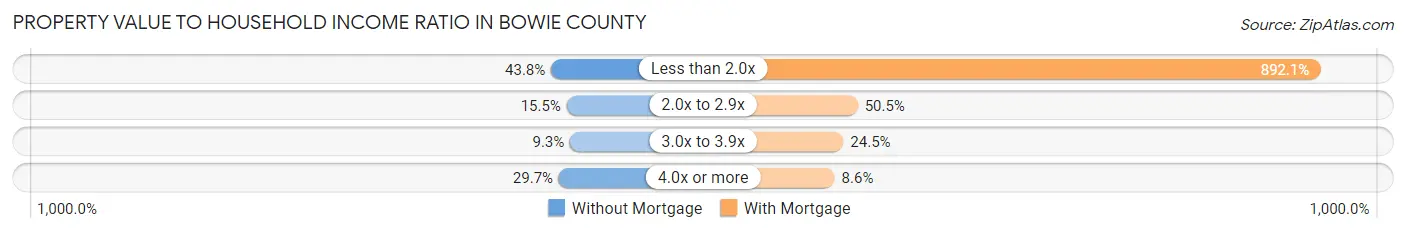
| Value-to-Income Ratio | Without Mortgage | With Mortgage |
| Less than 2.0x | 4,960 (43.8%) | 92,292 (892.1%) |
| 2.0x to 2.9x | 1,757 (15.5%) | 5,221 (50.5%) |
| 3.0x to 3.9x | 1,056 (9.3%) | 2,538 (24.5%) |
| 4.0x or more | 3,360 (29.7%) | 884 (8.6%) |
| Total | 11,330 (100.0%) | 10,345 (100.0%) |
Real Estate Taxes by Mortgage Status in Bowie County
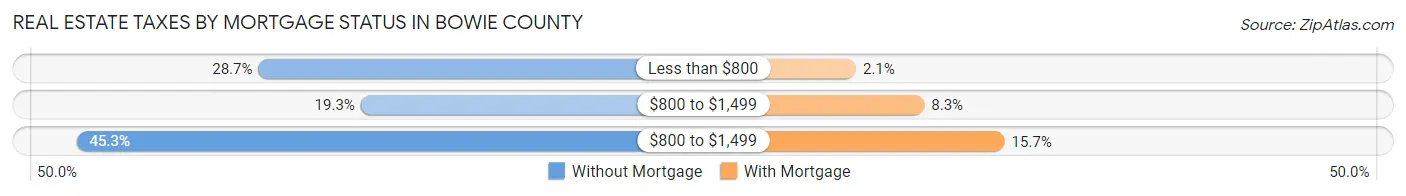
| Property Taxes | Without Mortgage | With Mortgage |
| Less than $800 | 3,247 (28.7%) | 217 (2.1%) |
| $800 to $1,499 | 2,188 (19.3%) | 863 (8.3%) |
| $800 to $1,499 | 5,128 (45.3%) | 1,621 (15.7%) |
| Total | 11,330 (100.0%) | 10,345 (100.0%) |
Health & Disability in Bowie County
Health Insurance Coverage by Age in Bowie County
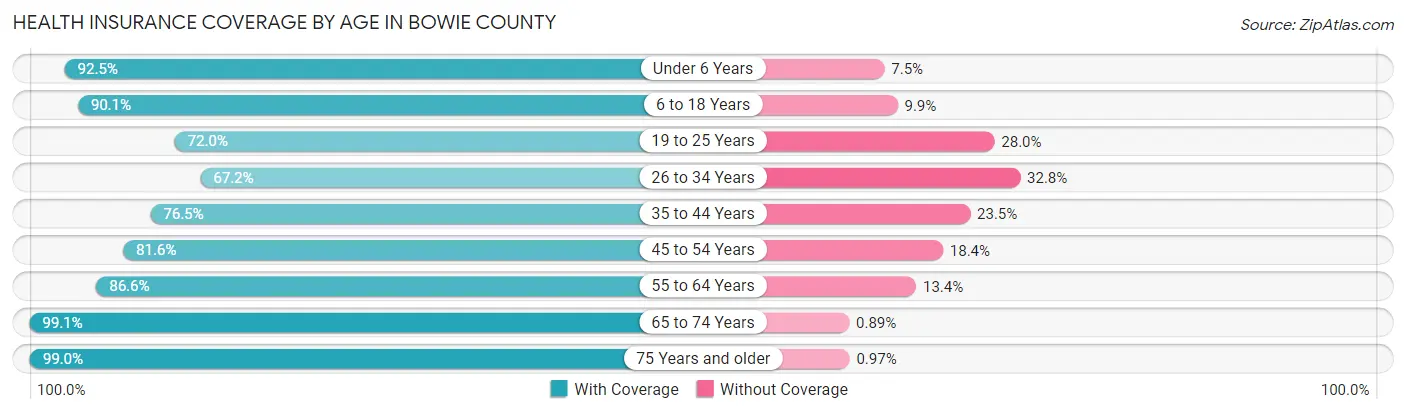
| Age Bracket | With Coverage | Without Coverage |
| Under 6 Years | 6,327 (92.5%) | 511 (7.5%) |
| 6 to 18 Years | 14,346 (90.1%) | 1,581 (9.9%) |
| 19 to 25 Years | 5,713 (72.0%) | 2,220 (28.0%) |
| 26 to 34 Years | 6,698 (67.2%) | 3,267 (32.8%) |
| 35 to 44 Years | 7,965 (76.5%) | 2,441 (23.5%) |
| 45 to 54 Years | 8,347 (81.6%) | 1,880 (18.4%) |
| 55 to 64 Years | 9,303 (86.6%) | 1,437 (13.4%) |
| 65 to 74 Years | 8,924 (99.1%) | 80 (0.9%) |
| 75 Years and older | 6,023 (99.0%) | 59 (1.0%) |
| Total | 73,646 (84.5%) | 13,476 (15.5%) |
Health Insurance Coverage by Citizenship Status in Bowie County
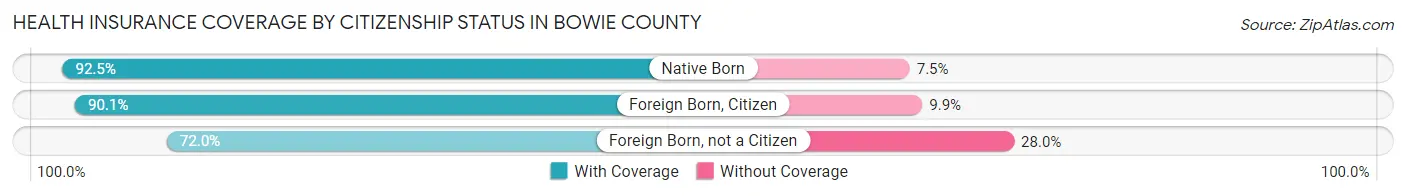
| Citizenship Status | With Coverage | Without Coverage |
| Native Born | 6,327 (92.5%) | 511 (7.5%) |
| Foreign Born, Citizen | 14,346 (90.1%) | 1,581 (9.9%) |
| Foreign Born, not a Citizen | 5,713 (72.0%) | 2,220 (28.0%) |
Health Insurance Coverage by Household Income in Bowie County
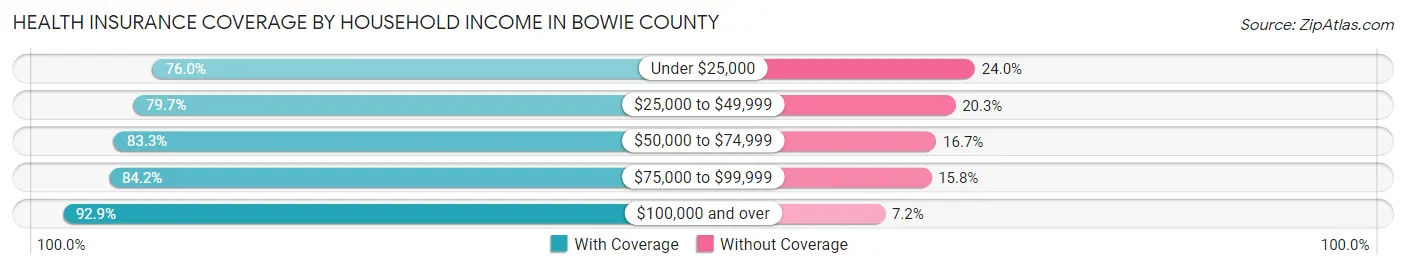
| Household Income | With Coverage | Without Coverage |
| Under $25,000 | 11,678 (76.0%) | 3,688 (24.0%) |
| $25,000 to $49,999 | 11,962 (79.7%) | 3,049 (20.3%) |
| $50,000 to $74,999 | 13,815 (83.3%) | 2,777 (16.7%) |
| $75,000 to $99,999 | 10,226 (84.2%) | 1,920 (15.8%) |
| $100,000 and over | 25,834 (92.8%) | 1,989 (7.1%) |
Public vs Private Health Insurance Coverage by Age in Bowie County
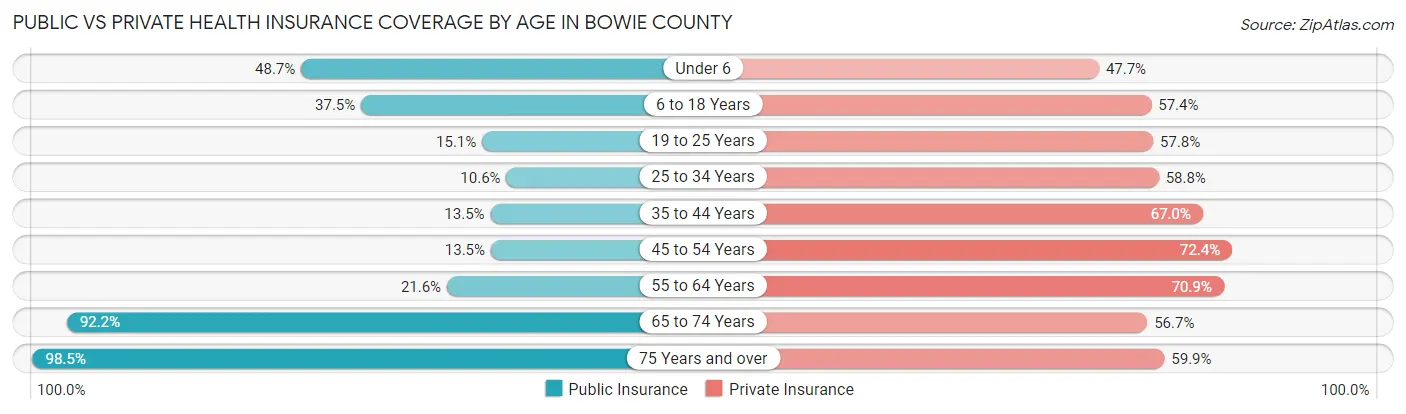
| Age Bracket | Public Insurance | Private Insurance |
| Under 6 | 3,328 (48.7%) | 3,264 (47.7%) |
| 6 to 18 Years | 5,979 (37.5%) | 9,149 (57.4%) |
| 19 to 25 Years | 1,196 (15.1%) | 4,584 (57.8%) |
| 25 to 34 Years | 1,053 (10.6%) | 5,861 (58.8%) |
| 35 to 44 Years | 1,409 (13.5%) | 6,972 (67.0%) |
| 45 to 54 Years | 1,376 (13.5%) | 7,407 (72.4%) |
| 55 to 64 Years | 2,321 (21.6%) | 7,614 (70.9%) |
| 65 to 74 Years | 8,299 (92.2%) | 5,104 (56.7%) |
| 75 Years and over | 5,992 (98.5%) | 3,641 (59.9%) |
| Total | 30,953 (35.5%) | 53,596 (61.5%) |
Disability Status by Sex by Age in Bowie County
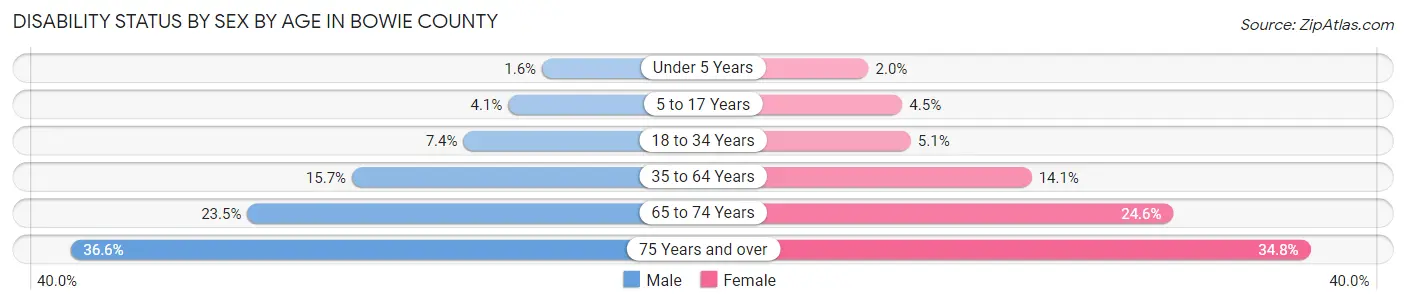
| Age Bracket | Male | Female |
| Under 5 Years | 49 (1.6%) | 52 (2.0%) |
| 5 to 17 Years | 338 (4.1%) | 359 (4.5%) |
| 18 to 34 Years | 698 (7.4%) | 479 (5.1%) |
| 35 to 64 Years | 2,288 (15.7%) | 2,369 (14.1%) |
| 65 to 74 Years | 964 (23.5%) | 1,205 (24.6%) |
| 75 Years and over | 893 (36.6%) | 1,267 (34.8%) |
Disability Class by Sex by Age in Bowie County
Disability Class: Hearing Difficulty
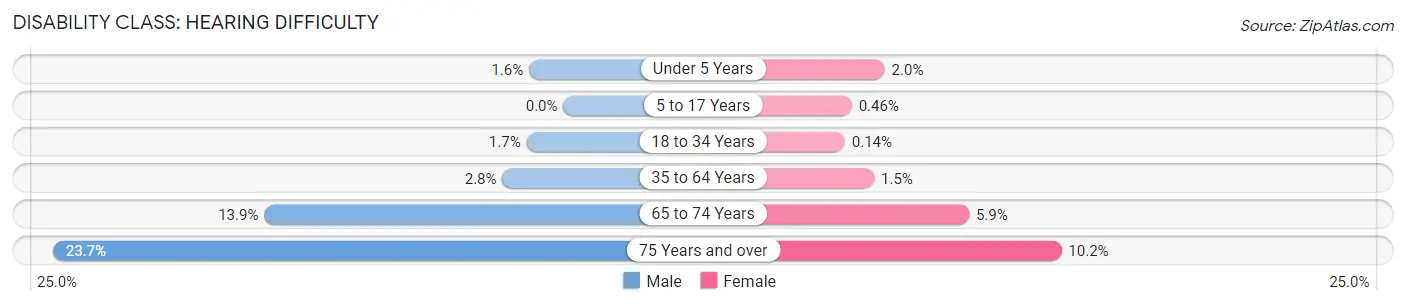
| Age Bracket | Male | Female |
| Under 5 Years | 49 (1.6%) | 52 (2.0%) |
| 5 to 17 Years | 0 (0.0%) | 37 (0.5%) |
| 18 to 34 Years | 161 (1.7%) | 13 (0.1%) |
| 35 to 64 Years | 412 (2.8%) | 252 (1.5%) |
| 65 to 74 Years | 570 (13.9%) | 289 (5.9%) |
| 75 Years and over | 578 (23.7%) | 371 (10.2%) |
Disability Class: Vision Difficulty
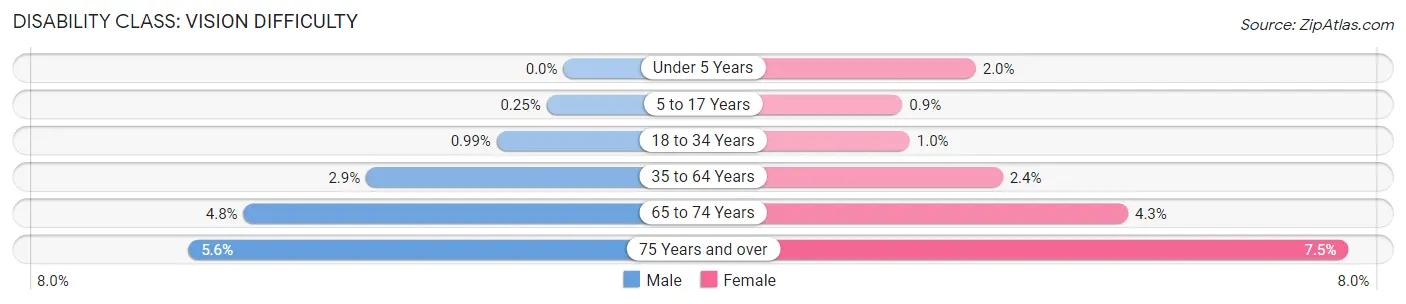
| Age Bracket | Male | Female |
| Under 5 Years | 0 (0.0%) | 52 (2.0%) |
| 5 to 17 Years | 21 (0.3%) | 72 (0.9%) |
| 18 to 34 Years | 93 (1.0%) | 94 (1.0%) |
| 35 to 64 Years | 427 (2.9%) | 401 (2.4%) |
| 65 to 74 Years | 195 (4.8%) | 208 (4.3%) |
| 75 Years and over | 136 (5.6%) | 274 (7.5%) |
Disability Class: Cognitive Difficulty
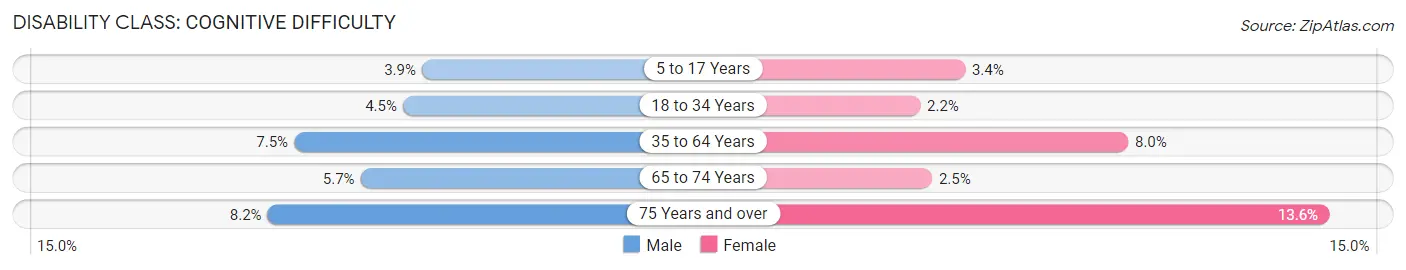
| Age Bracket | Male | Female |
| 5 to 17 Years | 325 (3.9%) | 274 (3.4%) |
| 18 to 34 Years | 420 (4.5%) | 204 (2.2%) |
| 35 to 64 Years | 1,093 (7.5%) | 1,338 (8.0%) |
| 65 to 74 Years | 232 (5.7%) | 123 (2.5%) |
| 75 Years and over | 201 (8.2%) | 495 (13.6%) |
Disability Class: Ambulatory Difficulty
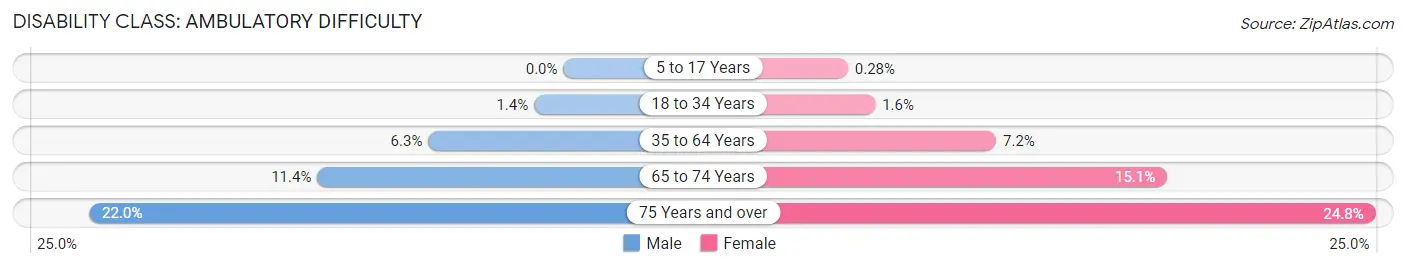
| Age Bracket | Male | Female |
| 5 to 17 Years | 0 (0.0%) | 22 (0.3%) |
| 18 to 34 Years | 128 (1.4%) | 145 (1.5%) |
| 35 to 64 Years | 914 (6.3%) | 1,203 (7.2%) |
| 65 to 74 Years | 469 (11.4%) | 739 (15.1%) |
| 75 Years and over | 537 (22.0%) | 902 (24.8%) |
Disability Class: Self-Care Difficulty
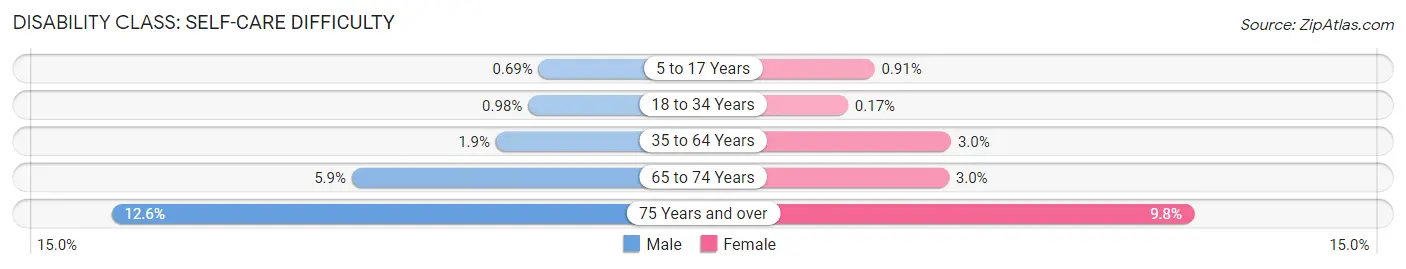
| Age Bracket | Male | Female |
| 5 to 17 Years | 57 (0.7%) | 73 (0.9%) |
| 18 to 34 Years | 92 (1.0%) | 16 (0.2%) |
| 35 to 64 Years | 274 (1.9%) | 511 (3.0%) |
| 65 to 74 Years | 242 (5.9%) | 146 (3.0%) |
| 75 Years and over | 307 (12.6%) | 357 (9.8%) |
Technology Access in Bowie County
Computing Device Access in Bowie County
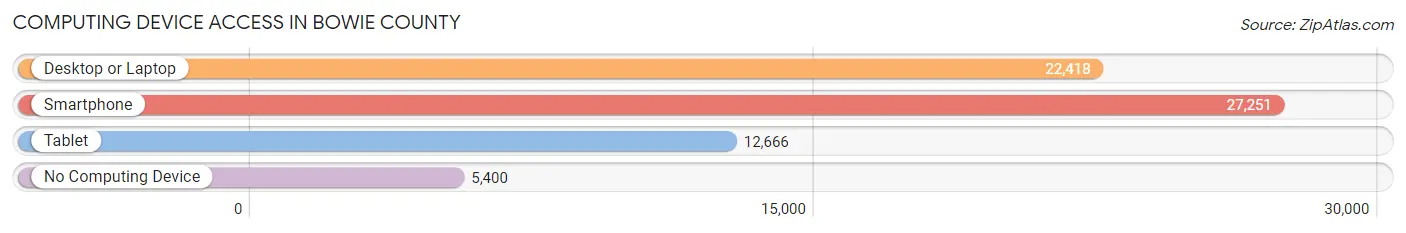
| Device Type | # Households | % Households |
| Desktop or Laptop | 22,418 | 65.0% |
| Smartphone | 27,251 | 79.0% |
| Tablet | 12,666 | 36.7% |
| No Computing Device | 5,400 | 15.7% |
| Total | 34,486 | 100.0% |
Internet Access in Bowie County
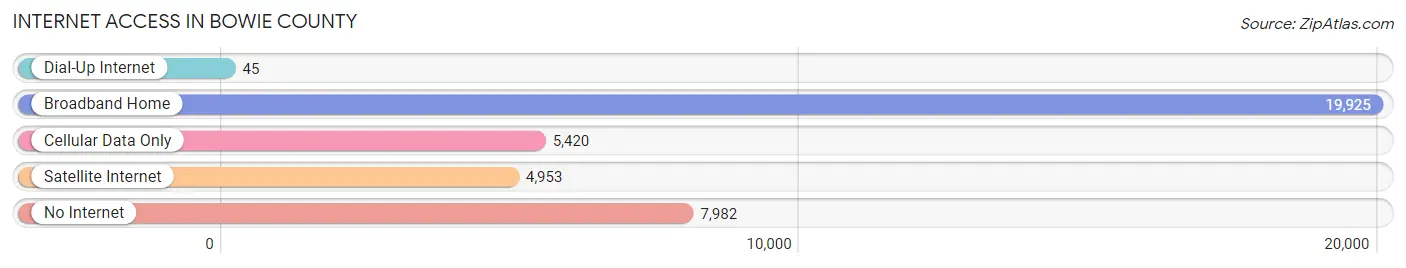
| Internet Type | # Households | % Households |
| Dial-Up Internet | 45 | 0.1% |
| Broadband Home | 19,925 | 57.8% |
| Cellular Data Only | 5,420 | 15.7% |
| Satellite Internet | 4,953 | 14.4% |
| No Internet | 7,982 | 23.2% |
| Total | 34,486 | 100.0% |
Bowie County Summary
Bowie County is located in the northeastern corner of Texas, and is bordered by the states of Arkansas and Oklahoma. It is part of the Texarkana Metropolitan Statistical Area, and is the largest county in the state by area. The county seat is New Boston, and the largest city is Texarkana. As of the 2010 census, the population was 92,565.
History
Bowie County was established in 1841, and was named for James Bowie, a famous Texas Ranger and Alamo defender. The county was originally part of Miller County, Arkansas, and was annexed to Texas in 1845. The county was organized in 1846, and the first county seat was located in Boston. The county seat was moved to New Boston in 1873.
Geography
Bowie County covers an area of 906 square miles, making it the largest county in Texas by area. The county is located in the northeast corner of the state, and is bordered by the states of Arkansas and Oklahoma. The terrain is mostly flat, with some rolling hills in the western part of the county. The county is drained by the Red River and its tributaries.
The climate of Bowie County is humid subtropical, with hot, humid summers and mild winters. The average annual temperature is 68°F, and the average annual precipitation is 44 inches.
Economy
The economy of Bowie County is largely based on agriculture and manufacturing. The county is home to several large industrial plants, including a Tyson Foods poultry processing plant, a Pilgrim’s Pride poultry processing plant, and a Georgia-Pacific paper mill. The county is also home to several large farms, including cotton, soybean, and wheat farms.
The county is also home to several large retail stores, including Walmart, Target, and Lowe’s. The county is also home to several large medical facilities, including the Texarkana Regional Medical Center and the Wadley Regional Medical Center.
Demographics
As of the 2010 census, the population of Bowie County was 92,565. The racial makeup of the county was 75.3% White, 17.7% Black or African American, 0.7% Native American, 0.7% Asian, 0.1% Pacific Islander, 3.7% from other races, and 2.6% from two or more races. Hispanic or Latino of any race were 8.2% of the population.
The median income for a household in the county was $37,945, and the median income for a family was $45,945. The per capita income for the county was $19,945. About 16.2% of the population was below the poverty line.
Common Questions
What is Per Capita Income in Bowie County?
Per Capita income in Bowie County is $30,103.
What is the Median Family Income in Bowie County?
Median Family Income in Bowie County is $71,618.
What is the Median Household income in Bowie County?
Median Household Income in Bowie County is $56,628.
What is Income or Wage Gap in Bowie County?
Income or Wage Gap in Bowie County is 23.1%.
Women in Bowie County earn 76.9 cents for every dollar earned by a man.
What is Family Income Deficit in Bowie County?
Family Income Deficit in Bowie County is $11,000.
Families that are below poverty line in Bowie County earn $11,000 less on average than the poverty threshold level.
What is Inequality or Gini Index in Bowie County?
Inequality or Gini Index in Bowie County is 0.49.
What is the Total Population of Bowie County?
Total Population of Bowie County is 92,747.
What is the Total Male Population of Bowie County?
Total Male Population of Bowie County is 46,884.
What is the Total Female Population of Bowie County?
Total Female Population of Bowie County is 45,863.
What is the Ratio of Males per 100 Females in Bowie County?
There are 102.23 Males per 100 Females in Bowie County.
What is the Ratio of Females per 100 Males in Bowie County?
There are 97.82 Females per 100 Males in Bowie County.
What is the Median Population Age in Bowie County?
Median Population Age in Bowie County is 38.2 Years.
What is the Average Family Size in Bowie County
Average Family Size in Bowie County is 3.2 People.
What is the Average Household Size in Bowie County
Average Household Size in Bowie County is 2.5 People.
How Large is the Labor Force in Bowie County?
There are 39,726 People in the Labor Forcein in Bowie County.
What is the Percentage of People in the Labor Force in Bowie County?
54.3% of People are in the Labor Force in Bowie County.
What is the Unemployment Rate in Bowie County?
Unemployment Rate in Bowie County is 4.0%.