Bosque County, TX Map & Demographics
Bosque County Map
Bosque County Overview
$32,990
PER CAPITA INCOME
$77,047
AVG FAMILY INCOME
$63,868
AVG HOUSEHOLD INCOME
33.6%
WAGE / INCOME GAP [ % ]
66.4¢/ $1
WAGE / INCOME GAP [ $ ]
$6,543
FAMILY INCOME DEFICIT
0.43
INEQUALITY / GINI INDEX
18,404
TOTAL POPULATION
9,135
MALE POPULATION
9,269
FEMALE POPULATION
98.55
MALES / 100 FEMALES
101.47
FEMALES / 100 MALES
46.1
MEDIAN AGE
3.0
AVG FAMILY SIZE
2.5
AVG HOUSEHOLD SIZE
8,028
LABOR FORCE [ PEOPLE ]
53.6%
PERCENT IN LABOR FORCE
3.9%
UNEMPLOYMENT RATE
Bosque County Area Codes
Income in Bosque County
Income Overview in Bosque County
Per Capita Income in Bosque County is $32,990, while median incomes of families and households are $77,047 and $63,868 respectively.
| Characteristic | Number | Measure |
| Per Capita Income | 18,404 | $32,990 |
| Median Family Income | 5,149 | $77,047 |
| Mean Family Income | 5,149 | $95,915 |
| Median Household Income | 7,277 | $63,868 |
| Mean Household Income | 7,277 | $81,933 |
| Income Deficit | 5,149 | $6,543 |
| Wage / Income Gap (%) | 18,404 | 33.62% |
| Wage / Income Gap ($) | 18,404 | 66.38¢ per $1 |
| Gini / Inequality Index | 18,404 | 0.43 |
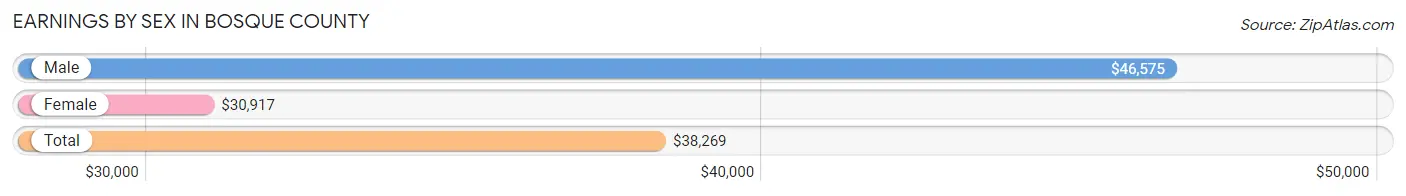
Earnings by Sex in Bosque County
Average Earnings in Bosque County are $38,269, $46,575 for men and $30,917 for women, a difference of 33.6%.
| Sex | Number | Average Earnings |
| Male | 4,554 (54.0%) | $46,575 |
| Female | 3,879 (46.0%) | $30,917 |
| Total | 8,433 (100.0%) | $38,269 |
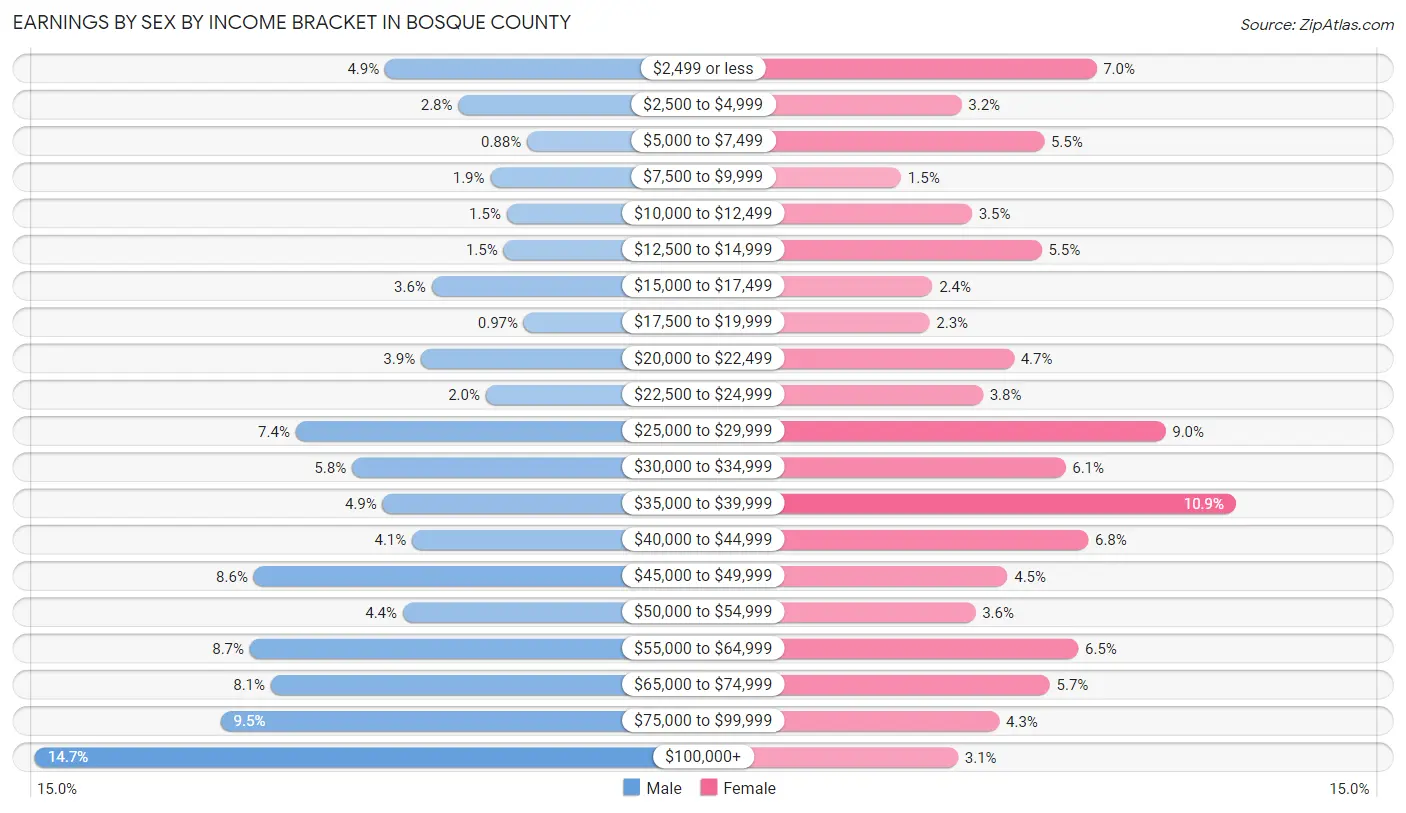
Earnings by Sex by Income Bracket in Bosque County
The most common earnings brackets in Bosque County are $100,000+ for men (670 | 14.7%) and $35,000 to $39,999 for women (424 | 10.9%).
| Income | Male | Female |
| $2,499 or less | 222 (4.9%) | 272 (7.0%) |
| $2,500 to $4,999 | 128 (2.8%) | 125 (3.2%) |
| $5,000 to $7,499 | 40 (0.9%) | 215 (5.5%) |
| $7,500 to $9,999 | 87 (1.9%) | 59 (1.5%) |
| $10,000 to $12,499 | 66 (1.5%) | 136 (3.5%) |
| $12,500 to $14,999 | 70 (1.5%) | 212 (5.5%) |
| $15,000 to $17,499 | 162 (3.6%) | 93 (2.4%) |
| $17,500 to $19,999 | 44 (1.0%) | 90 (2.3%) |
| $20,000 to $22,499 | 176 (3.9%) | 182 (4.7%) |
| $22,500 to $24,999 | 93 (2.0%) | 148 (3.8%) |
| $25,000 to $29,999 | 336 (7.4%) | 347 (8.9%) |
| $30,000 to $34,999 | 264 (5.8%) | 238 (6.1%) |
| $35,000 to $39,999 | 225 (4.9%) | 424 (10.9%) |
| $40,000 to $44,999 | 187 (4.1%) | 263 (6.8%) |
| $45,000 to $49,999 | 390 (8.6%) | 175 (4.5%) |
| $50,000 to $54,999 | 199 (4.4%) | 140 (3.6%) |
| $55,000 to $64,999 | 395 (8.7%) | 252 (6.5%) |
| $65,000 to $74,999 | 368 (8.1%) | 221 (5.7%) |
| $75,000 to $99,999 | 432 (9.5%) | 166 (4.3%) |
| $100,000+ | 670 (14.7%) | 121 (3.1%) |
| Total | 4,554 (100.0%) | 3,879 (100.0%) |
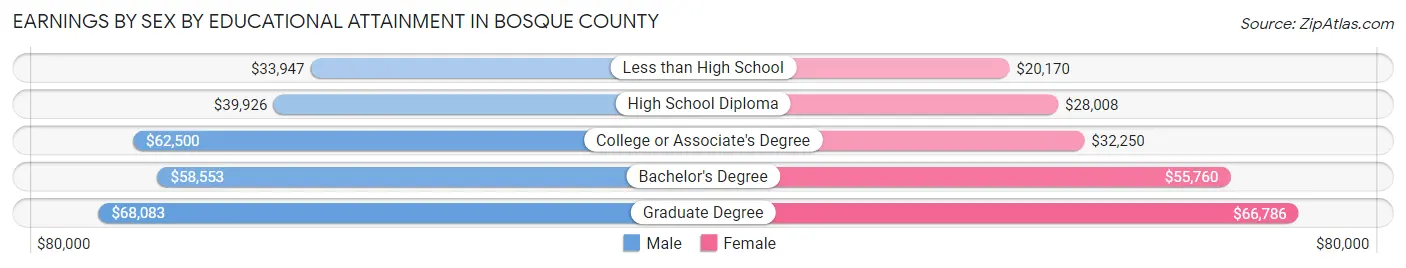
Earnings by Sex by Educational Attainment in Bosque County
Average earnings in Bosque County are $48,608 for men and $34,332 for women, a difference of 29.4%. Men with an educational attainment of graduate degree enjoy the highest average annual earnings of $68,083, while those with less than high school education earn the least with $33,947. Women with an educational attainment of graduate degree earn the most with the average annual earnings of $66,786, while those with less than high school education have the smallest earnings of $20,170.
| Educational Attainment | Male Income | Female Income |
| Less than High School | $33,947 | $20,170 |
| High School Diploma | $39,926 | $28,008 |
| College or Associate's Degree | $62,500 | $32,250 |
| Bachelor's Degree | $58,553 | $55,760 |
| Graduate Degree | $68,083 | $66,786 |
| Total | $48,608 | $34,332 |
Family Income in Bosque County
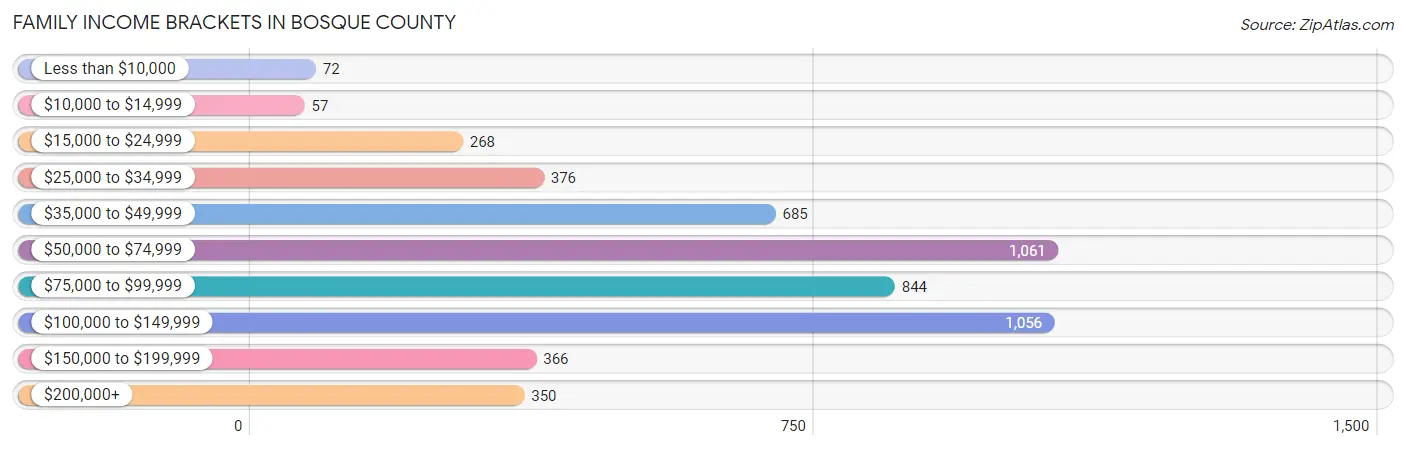
Family Income Brackets in Bosque County
According to the Bosque County family income data, there are 1,061 families falling into the $50,000 to $74,999 income range, which is the most common income bracket and makes up 20.6% of all families. Conversely, the $10,000 to $14,999 income bracket is the least frequent group with only 57 families (1.1%) belonging to this category.
| Income Bracket | # Families | % Families |
| Less than $10,000 | 72 | 1.4% |
| $10,000 to $14,999 | 57 | 1.1% |
| $15,000 to $24,999 | 268 | 5.2% |
| $25,000 to $34,999 | 376 | 7.3% |
| $35,000 to $49,999 | 685 | 13.3% |
| $50,000 to $74,999 | 1,061 | 20.6% |
| $75,000 to $99,999 | 844 | 16.4% |
| $100,000 to $149,999 | 1,056 | 20.5% |
| $150,000 to $199,999 | 366 | 7.1% |
| $200,000+ | 350 | 6.8% |
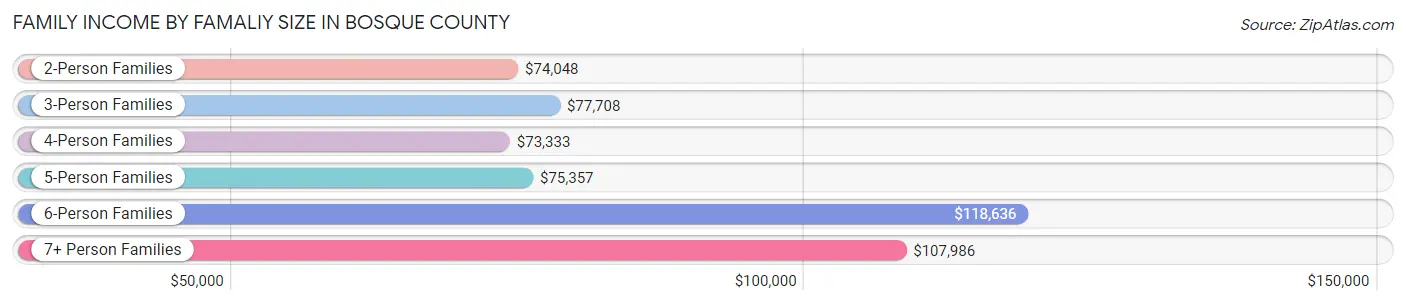
Family Income by Famaliy Size in Bosque County
6-person families (188 | 3.6%) account for the highest median family income in Bosque County with $118,636 per family, while 2-person families (2,720 | 52.8%) have the highest median income of $37,024 per family member.
| Income Bracket | # Families | Median Income |
| 2-Person Families | 2,720 (52.8%) | $74,048 |
| 3-Person Families | 946 (18.4%) | $77,708 |
| 4-Person Families | 850 (16.5%) | $73,333 |
| 5-Person Families | 392 (7.6%) | $75,357 |
| 6-Person Families | 188 (3.6%) | $118,636 |
| 7+ Person Families | 53 (1.0%) | $107,986 |
| Total | 5,149 (100.0%) | $77,047 |
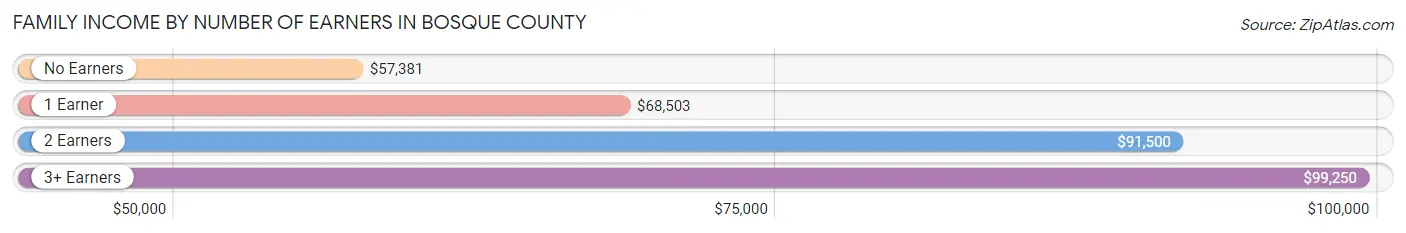
Family Income by Number of Earners in Bosque County
The median family income in Bosque County is $77,047, with families comprising 3+ earners (442) having the highest median family income of $99,250, while families with no earners (1,146) have the lowest median family income of $57,381, accounting for 8.6% and 22.3% of families, respectively.
| Number of Earners | # Families | Median Income |
| No Earners | 1,146 (22.3%) | $57,381 |
| 1 Earner | 1,677 (32.6%) | $68,503 |
| 2 Earners | 1,884 (36.6%) | $91,500 |
| 3+ Earners | 442 (8.6%) | $99,250 |
| Total | 5,149 (100.0%) | $77,047 |
Household Income in Bosque County
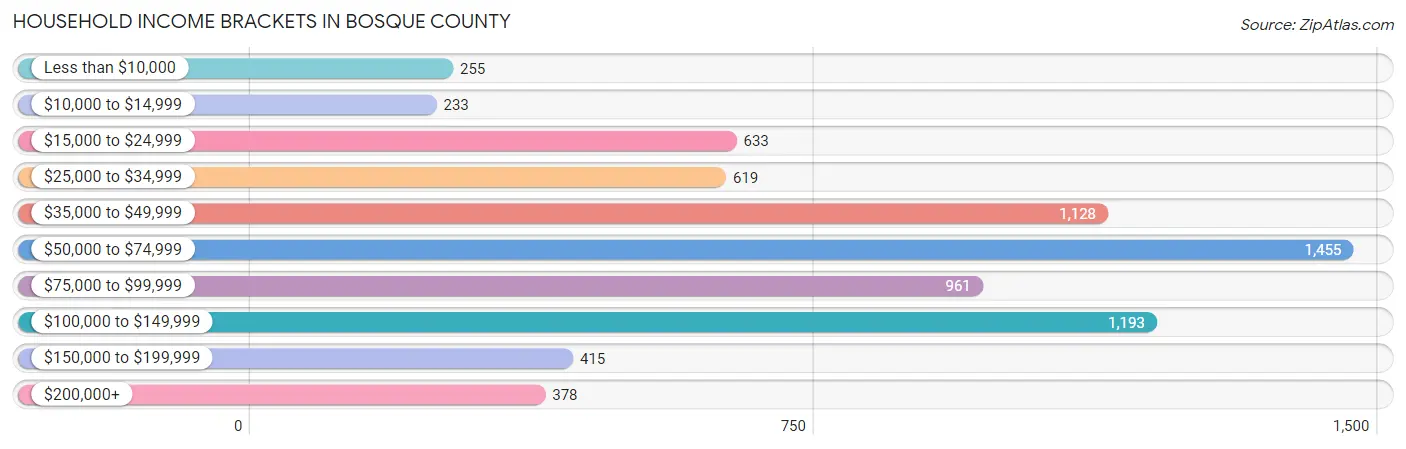
Household Income Brackets in Bosque County
With 1,455 households falling in the category, the $50,000 to $74,999 income range is the most frequent in Bosque County, accounting for 20.0% of all households. In contrast, only 233 households (3.2%) fall into the $10,000 to $14,999 income bracket, making it the least populous group.
| Income Bracket | # Households | % Households |
| Less than $10,000 | 255 | 3.5% |
| $10,000 to $14,999 | 233 | 3.2% |
| $15,000 to $24,999 | 633 | 8.7% |
| $25,000 to $34,999 | 619 | 8.5% |
| $35,000 to $49,999 | 1,128 | 15.5% |
| $50,000 to $74,999 | 1,455 | 20.0% |
| $75,000 to $99,999 | 961 | 13.2% |
| $100,000 to $149,999 | 1,193 | 16.4% |
| $150,000 to $199,999 | 415 | 5.7% |
| $200,000+ | 378 | 5.2% |
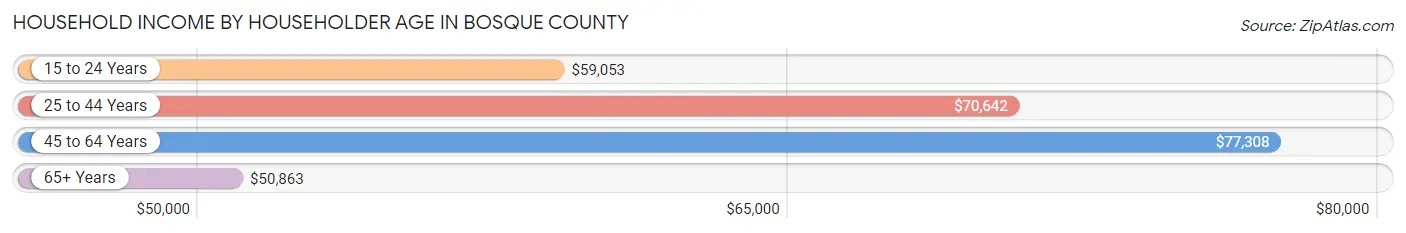
Household Income by Householder Age in Bosque County
The median household income in Bosque County is $63,868, with the highest median household income of $77,308 found in the 45 to 64 years age bracket for the primary householder. A total of 2,510 households (34.5%) fall into this category. Meanwhile, the 65+ years age bracket for the primary householder has the lowest median household income of $50,863, with 2,769 households (38.1%) in this group.
| Income Bracket | # Households | Median Income |
| 15 to 24 Years | 309 (4.3%) | $59,053 |
| 25 to 44 Years | 1,689 (23.2%) | $70,642 |
| 45 to 64 Years | 2,510 (34.5%) | $77,308 |
| 65+ Years | 2,769 (38.1%) | $50,863 |
| Total | 7,277 (100.0%) | $63,868 |
Poverty in Bosque County
Income Below Poverty by Sex and Age in Bosque County
With 9.7% poverty level for males and 13.4% for females among the residents of Bosque County, 12 to 14 year old males and 15 year old females are the most vulnerable to poverty, with 100 males (22.2%) and 62 females (37.1%) in their respective age groups living below the poverty level.
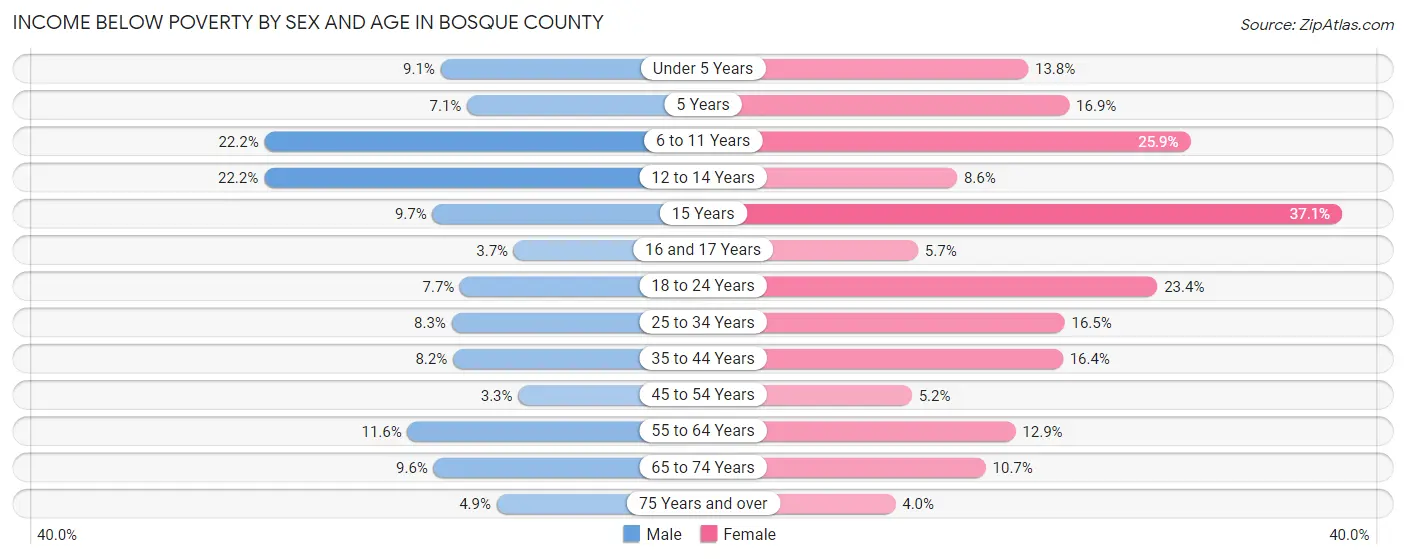
| Age Bracket | Male | Female |
| Under 5 Years | 45 (9.1%) | 61 (13.8%) |
| 5 Years | 5 (7.1%) | 13 (16.9%) |
| 6 to 11 Years | 144 (22.2%) | 171 (25.9%) |
| 12 to 14 Years | 100 (22.2%) | 26 (8.6%) |
| 15 Years | 10 (9.7%) | 62 (37.1%) |
| 16 and 17 Years | 9 (3.7%) | 10 (5.7%) |
| 18 to 24 Years | 51 (7.7%) | 141 (23.4%) |
| 25 to 34 Years | 72 (8.3%) | 154 (16.5%) |
| 35 to 44 Years | 85 (8.2%) | 163 (16.4%) |
| 45 to 54 Years | 33 (3.3%) | 56 (5.2%) |
| 55 to 64 Years | 158 (11.6%) | 176 (12.9%) |
| 65 to 74 Years | 124 (9.6%) | 139 (10.7%) |
| 75 Years and over | 38 (4.9%) | 38 (4.0%) |
| Total | 874 (9.7%) | 1,210 (13.4%) |
Income Above Poverty by Sex and Age in Bosque County
According to the poverty statistics in Bosque County, males aged 45 to 54 years and females aged 75 years and over are the age groups that are most secure financially, with 96.7% of males and 96.0% of females in these age groups living above the poverty line.
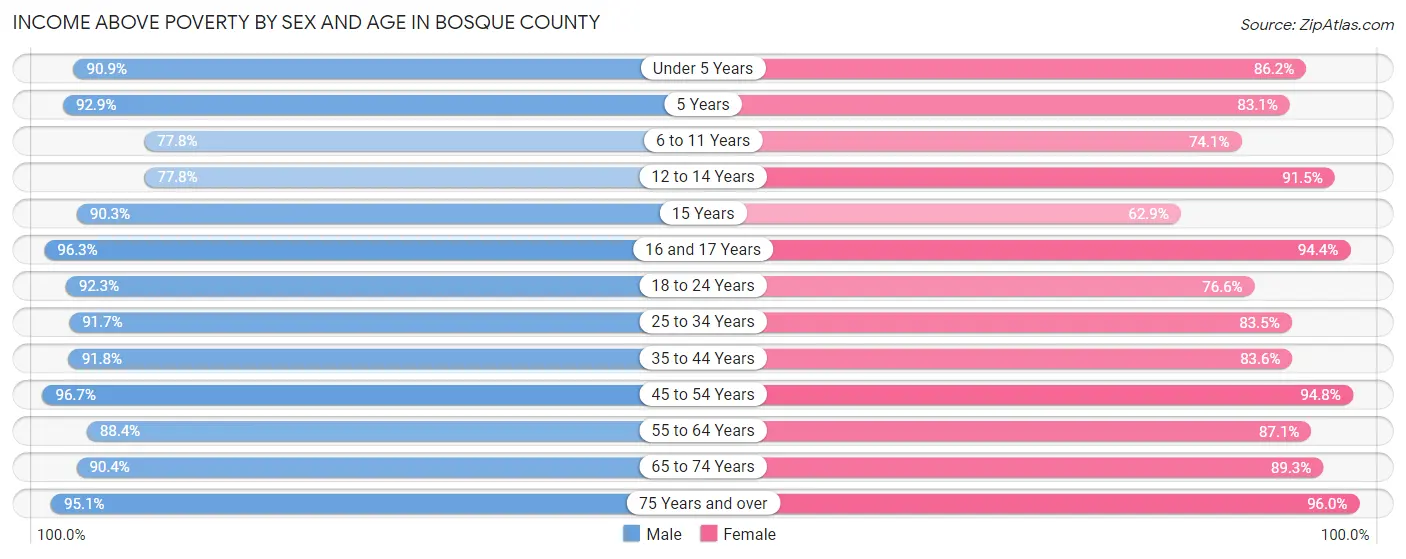
| Age Bracket | Male | Female |
| Under 5 Years | 449 (90.9%) | 380 (86.2%) |
| 5 Years | 65 (92.9%) | 64 (83.1%) |
| 6 to 11 Years | 505 (77.8%) | 490 (74.1%) |
| 12 to 14 Years | 350 (77.8%) | 278 (91.4%) |
| 15 Years | 93 (90.3%) | 105 (62.9%) |
| 16 and 17 Years | 236 (96.3%) | 167 (94.4%) |
| 18 to 24 Years | 615 (92.3%) | 461 (76.6%) |
| 25 to 34 Years | 796 (91.7%) | 777 (83.5%) |
| 35 to 44 Years | 953 (91.8%) | 831 (83.6%) |
| 45 to 54 Years | 955 (96.7%) | 1,024 (94.8%) |
| 55 to 64 Years | 1,208 (88.4%) | 1,189 (87.1%) |
| 65 to 74 Years | 1,163 (90.4%) | 1,163 (89.3%) |
| 75 Years and over | 732 (95.1%) | 919 (96.0%) |
| Total | 8,120 (90.3%) | 7,848 (86.6%) |
Income Below Poverty Among Married-Couple Families in Bosque County
The poverty statistics for married-couple families in Bosque County show that 5.9% or 250 of the total 4,227 families live below the poverty line. Families with 3 or 4 children have the highest poverty rate of 33.1%, comprising of 122 families. On the other hand, families with 1 or 2 children have the lowest poverty rate of 2.1%, which includes 22 families.
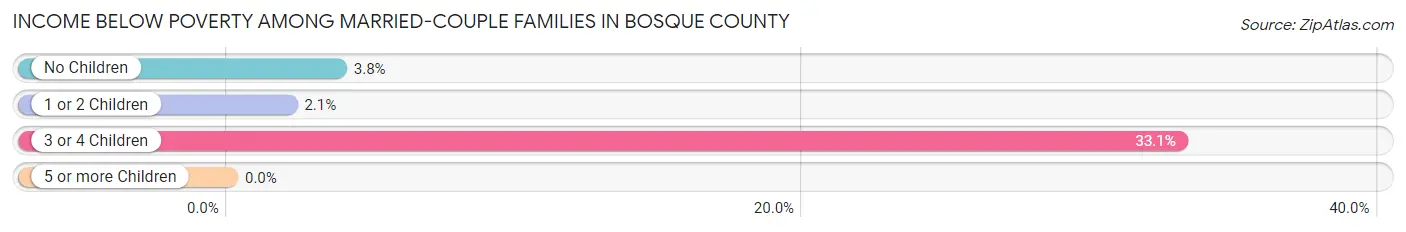
| Children | Above Poverty | Below Poverty |
| No Children | 2,691 (96.2%) | 106 (3.8%) |
| 1 or 2 Children | 1,039 (97.9%) | 22 (2.1%) |
| 3 or 4 Children | 247 (66.9%) | 122 (33.1%) |
| 5 or more Children | 0 (0.0%) | 0 (0.0%) |
| Total | 3,977 (94.1%) | 250 (5.9%) |
Income Below Poverty Among Single-Parent Households in Bosque County
According to the poverty data in Bosque County, 8.6% or 15 single-father households and 19.4% or 145 single-mother households are living below the poverty line. Among single-father households, those with 3 or 4 children have the highest poverty rate, with 4 households (50.0%) experiencing poverty. Likewise, among single-mother households, those with 3 or 4 children have the highest poverty rate, with 28 households (32.6%) falling below the poverty line.
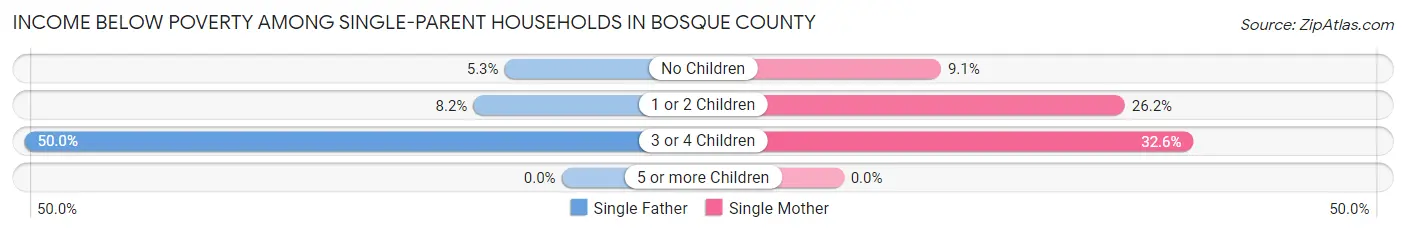
| Children | Single Father | Single Mother |
| No Children | 5 (5.3%) | 29 (9.1%) |
| 1 or 2 Children | 6 (8.2%) | 88 (26.2%) |
| 3 or 4 Children | 4 (50.0%) | 28 (32.6%) |
| 5 or more Children | 0 (0.0%) | 0 (0.0%) |
| Total | 15 (8.6%) | 145 (19.4%) |
Income Below Poverty Among Married-Couple vs Single-Parent Households in Bosque County
The poverty data for Bosque County shows that 250 of the married-couple family households (5.9%) and 160 of the single-parent households (17.3%) are living below the poverty level. Within the married-couple family households, those with 3 or 4 children have the highest poverty rate, with 122 households (33.1%) falling below the poverty line. Among the single-parent households, those with 3 or 4 children have the highest poverty rate, with 32 household (34.0%) living below poverty.
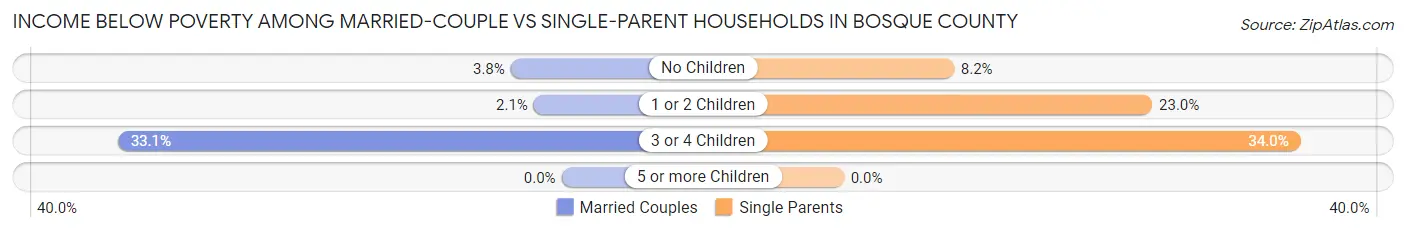
| Children | Married-Couple Families | Single-Parent Households |
| No Children | 106 (3.8%) | 34 (8.2%) |
| 1 or 2 Children | 22 (2.1%) | 94 (23.0%) |
| 3 or 4 Children | 122 (33.1%) | 32 (34.0%) |
| 5 or more Children | 0 (0.0%) | 0 (0.0%) |
| Total | 250 (5.9%) | 160 (17.3%) |
Race in Bosque County
The most populous races in Bosque County are White / Caucasian (15,198 | 82.6%), Hispanic or Latino (3,613 | 19.6%), and Two or more Races (1,931 | 10.5%).
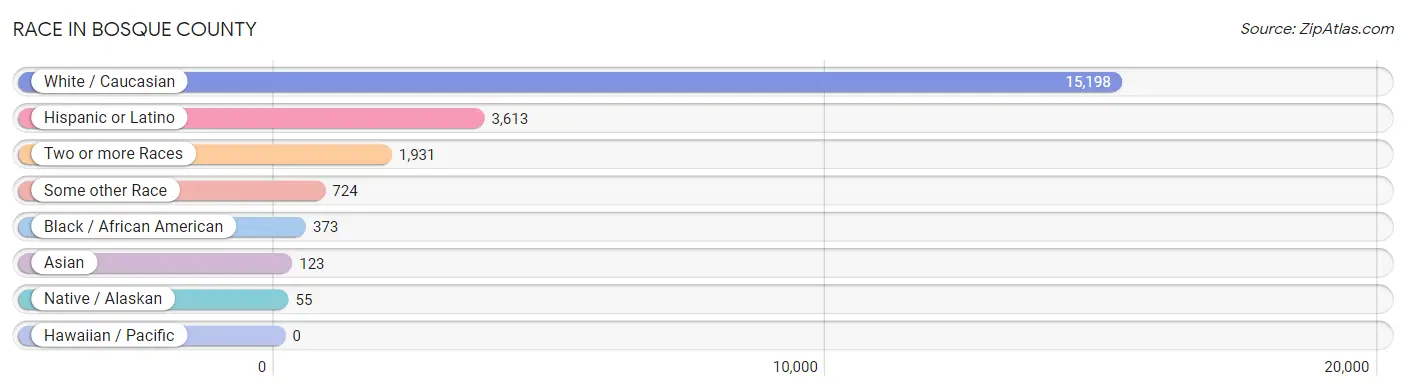
| Race | # Population | % Population |
| Asian | 123 | 0.7% |
| Black / African American | 373 | 2.0% |
| Hawaiian / Pacific | 0 | 0.0% |
| Hispanic or Latino | 3,613 | 19.6% |
| Native / Alaskan | 55 | 0.3% |
| White / Caucasian | 15,198 | 82.6% |
| Two or more Races | 1,931 | 10.5% |
| Some other Race | 724 | 3.9% |
| Total | 18,404 | 100.0% |
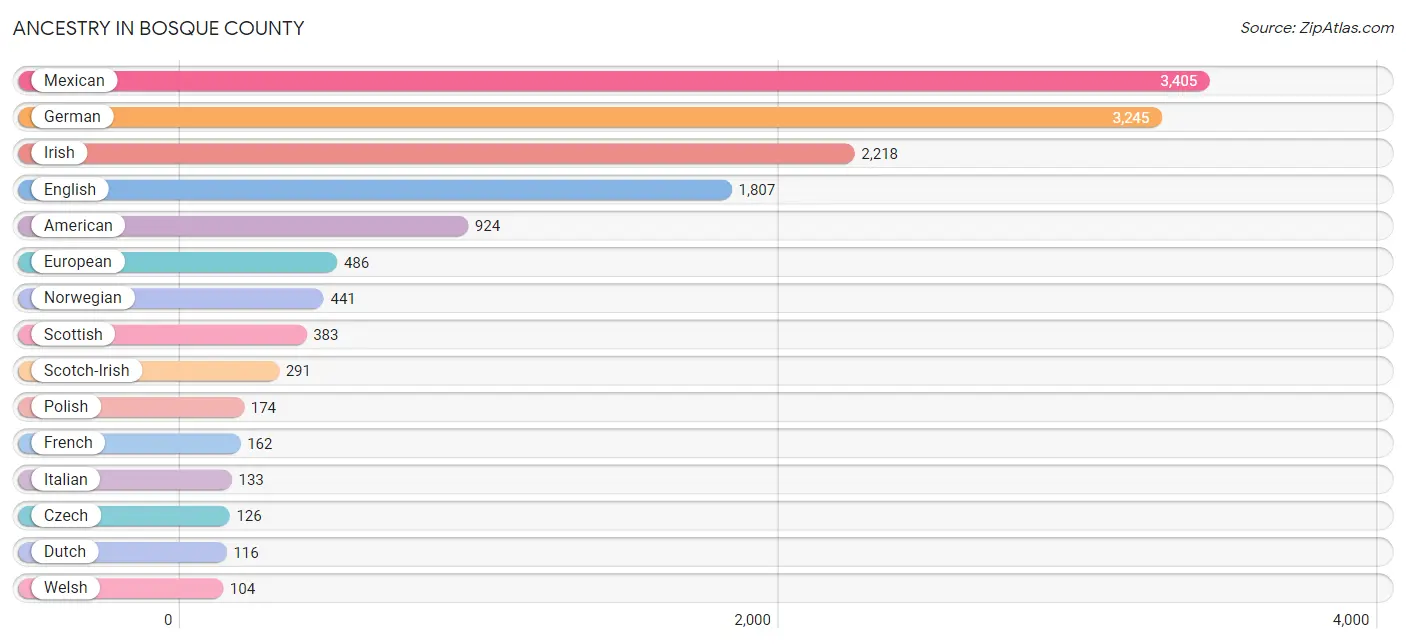
Ancestry in Bosque County
The most populous ancestries reported in Bosque County are Mexican (3,405 | 18.5%), German (3,245 | 17.6%), Irish (2,218 | 12.0%), English (1,807 | 9.8%), and American (924 | 5.0%), together accounting for 63.0% of all Bosque County residents.
| Ancestry | # Population | % Population |
| African | 48 | 0.3% |
| American | 924 | 5.0% |
| Apache | 35 | 0.2% |
| Arab | 2 | 0.0% |
| Austrian | 44 | 0.2% |
| Blackfeet | 21 | 0.1% |
| British | 77 | 0.4% |
| Burmese | 13 | 0.1% |
| Cajun | 10 | 0.1% |
| Canadian | 4 | 0.0% |
| Celtic | 36 | 0.2% |
| Central American | 6 | 0.0% |
| Central American Indian | 11 | 0.1% |
| Cherokee | 79 | 0.4% |
| Cheyenne | 1 | 0.0% |
| Chickasaw | 2 | 0.0% |
| Choctaw | 18 | 0.1% |
| Comanche | 4 | 0.0% |
| Croatian | 13 | 0.1% |
| Czech | 126 | 0.7% |
| Czechoslovakian | 6 | 0.0% |
| Danish | 13 | 0.1% |
| Dutch | 116 | 0.6% |
| Dutch West Indian | 27 | 0.2% |
| Eastern European | 3 | 0.0% |
| English | 1,807 | 9.8% |
| European | 486 | 2.6% |
| Finnish | 28 | 0.2% |
| French | 162 | 0.9% |
| French Canadian | 45 | 0.2% |
| German | 3,245 | 17.6% |
| German Russian | 10 | 0.1% |
| Greek | 3 | 0.0% |
| Guatemalan | 6 | 0.0% |
| Hungarian | 5 | 0.0% |
| Indian (Asian) | 31 | 0.2% |
| Irish | 2,218 | 12.0% |
| Italian | 133 | 0.7% |
| Jamaican | 3 | 0.0% |
| Kenyan | 2 | 0.0% |
| Korean | 37 | 0.2% |
| Lebanese | 2 | 0.0% |
| Lithuanian | 8 | 0.0% |
| Macedonian | 1 | 0.0% |
| Malaysian | 40 | 0.2% |
| Mexican | 3,405 | 18.5% |
| Native Hawaiian | 6 | 0.0% |
| Navajo | 2 | 0.0% |
| Northern European | 2 | 0.0% |
| Norwegian | 441 | 2.4% |
| Polish | 174 | 0.9% |
| Portuguese | 14 | 0.1% |
| Pueblo | 3 | 0.0% |
| Puerto Rican | 20 | 0.1% |
| Russian | 1 | 0.0% |
| Scandinavian | 40 | 0.2% |
| Scotch-Irish | 291 | 1.6% |
| Scottish | 383 | 2.1% |
| Sioux | 1 | 0.0% |
| Slovak | 8 | 0.0% |
| Spaniard | 35 | 0.2% |
| Spanish | 18 | 0.1% |
| Spanish American Indian | 1 | 0.0% |
| Sri Lankan | 3 | 0.0% |
| Subsaharan African | 50 | 0.3% |
| Swedish | 70 | 0.4% |
| Swiss | 6 | 0.0% |
| Thai | 12 | 0.1% |
| Ukrainian | 3 | 0.0% |
| Welsh | 104 | 0.6% | View All 70 Rows |
Immigrants in Bosque County
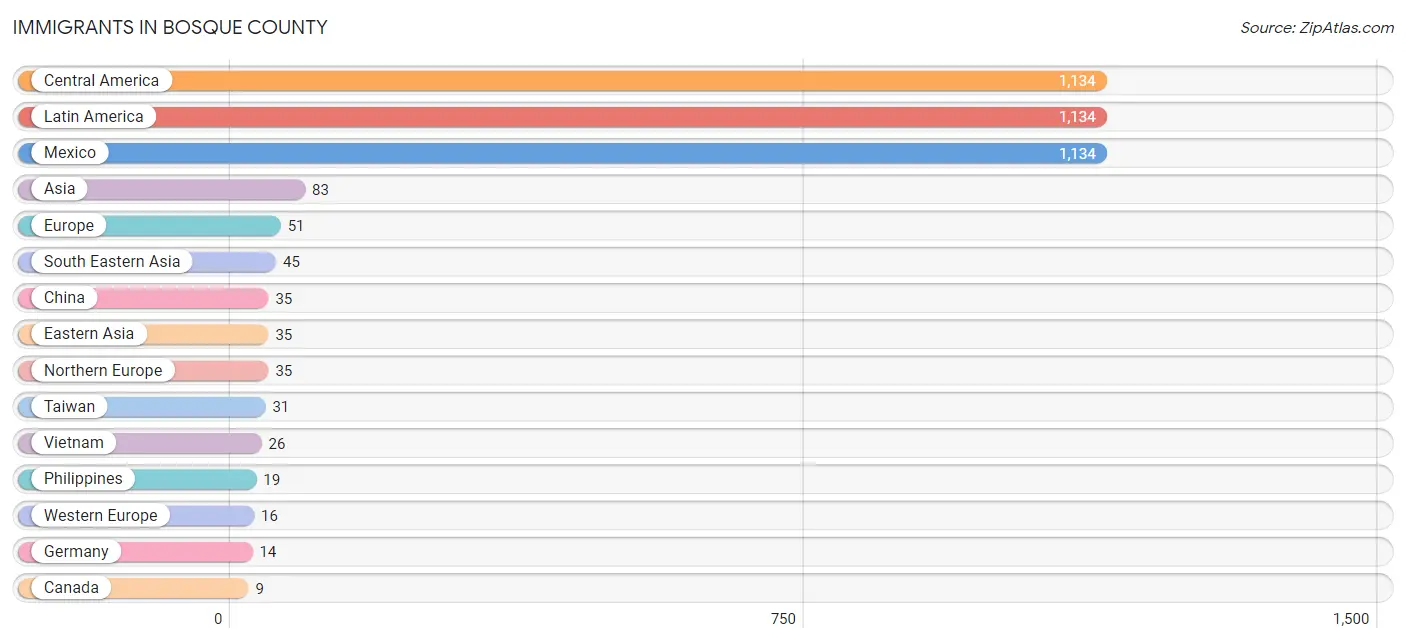
The most numerous immigrant groups reported in Bosque County came from Central America (1,134 | 6.2%), Latin America (1,134 | 6.2%), Mexico (1,134 | 6.2%), Asia (83 | 0.4%), and Europe (51 | 0.3%), together accounting for 19.2% of all Bosque County residents.
| Immigration Origin | # Population | % Population |
| Africa | 5 | 0.0% |
| Asia | 83 | 0.4% |
| Canada | 9 | 0.1% |
| Central America | 1,134 | 6.2% |
| China | 35 | 0.2% |
| Eastern Africa | 5 | 0.0% |
| Eastern Asia | 35 | 0.2% |
| Europe | 51 | 0.3% |
| Germany | 14 | 0.1% |
| India | 3 | 0.0% |
| Kenya | 2 | 0.0% |
| Latin America | 1,134 | 6.2% |
| Mexico | 1,134 | 6.2% |
| Northern Europe | 35 | 0.2% |
| Philippines | 19 | 0.1% |
| South Central Asia | 3 | 0.0% |
| South Eastern Asia | 45 | 0.2% |
| Switzerland | 2 | 0.0% |
| Taiwan | 31 | 0.2% |
| Vietnam | 26 | 0.1% |
| Western Europe | 16 | 0.1% | View All 21 Rows |
Sex and Age in Bosque County
Sex and Age in Bosque County
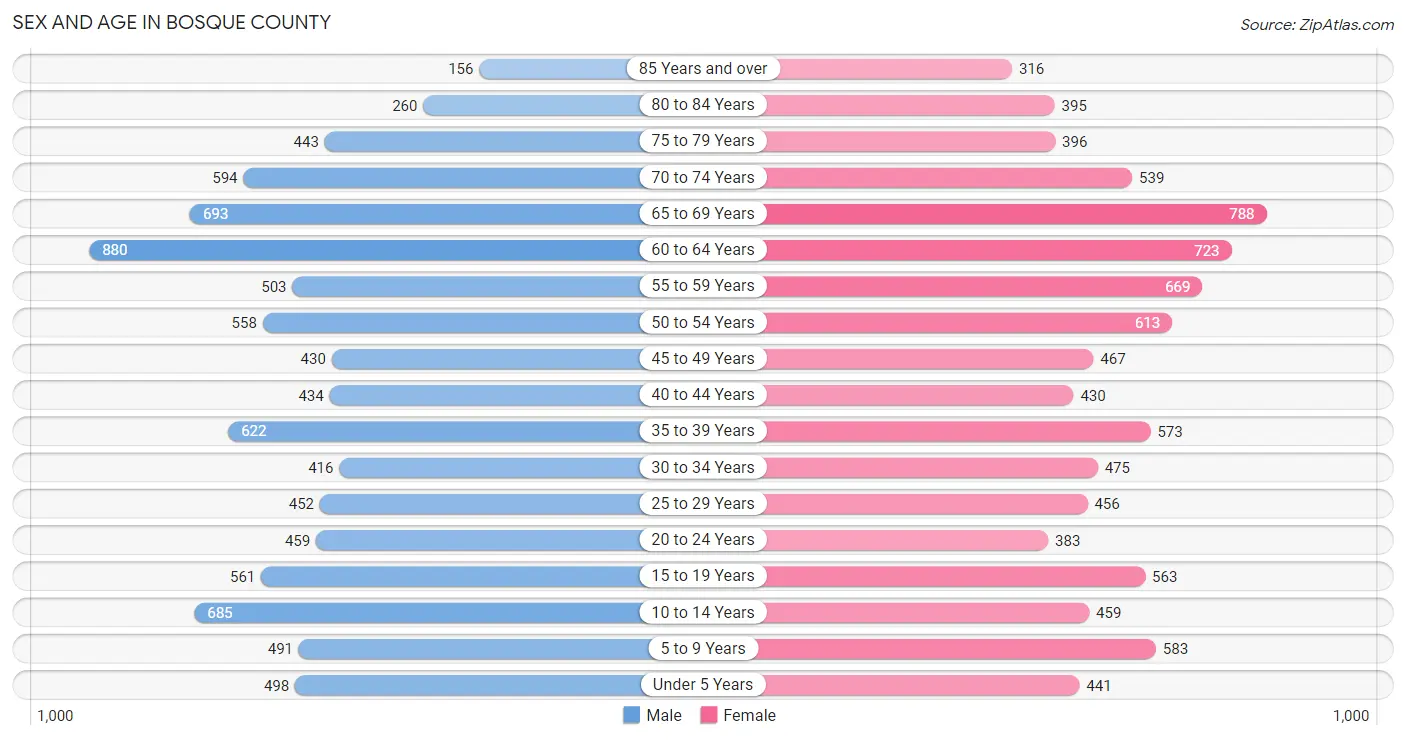
The most populous age groups in Bosque County are 60 to 64 Years (880 | 9.6%) for men and 65 to 69 Years (788 | 8.5%) for women.
| Age Bracket | Male | Female |
| Under 5 Years | 498 (5.4%) | 441 (4.8%) |
| 5 to 9 Years | 491 (5.4%) | 583 (6.3%) |
| 10 to 14 Years | 685 (7.5%) | 459 (5.0%) |
| 15 to 19 Years | 561 (6.1%) | 563 (6.1%) |
| 20 to 24 Years | 459 (5.0%) | 383 (4.1%) |
| 25 to 29 Years | 452 (5.0%) | 456 (4.9%) |
| 30 to 34 Years | 416 (4.5%) | 475 (5.1%) |
| 35 to 39 Years | 622 (6.8%) | 573 (6.2%) |
| 40 to 44 Years | 434 (4.8%) | 430 (4.6%) |
| 45 to 49 Years | 430 (4.7%) | 467 (5.0%) |
| 50 to 54 Years | 558 (6.1%) | 613 (6.6%) |
| 55 to 59 Years | 503 (5.5%) | 669 (7.2%) |
| 60 to 64 Years | 880 (9.6%) | 723 (7.8%) |
| 65 to 69 Years | 693 (7.6%) | 788 (8.5%) |
| 70 to 74 Years | 594 (6.5%) | 539 (5.8%) |
| 75 to 79 Years | 443 (4.9%) | 396 (4.3%) |
| 80 to 84 Years | 260 (2.9%) | 395 (4.3%) |
| 85 Years and over | 156 (1.7%) | 316 (3.4%) |
| Total | 9,135 (100.0%) | 9,269 (100.0%) |
Families and Households in Bosque County
Median Family Size in Bosque County
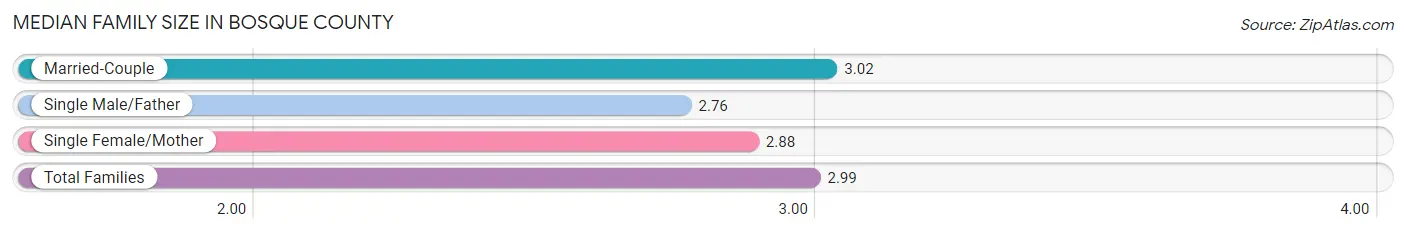
The median family size in Bosque County is 2.99 persons per family, with married-couple families (4,227 | 82.1%) accounting for the largest median family size of 3.02 persons per family. On the other hand, single male/father families (175 | 3.4%) represent the smallest median family size with 2.76 persons per family.
| Family Type | # Families | Family Size |
| Married-Couple | 4,227 (82.1%) | 3.02 |
| Single Male/Father | 175 (3.4%) | 2.76 |
| Single Female/Mother | 747 (14.5%) | 2.88 |
| Total Families | 5,149 (100.0%) | 2.99 |
Median Household Size in Bosque County
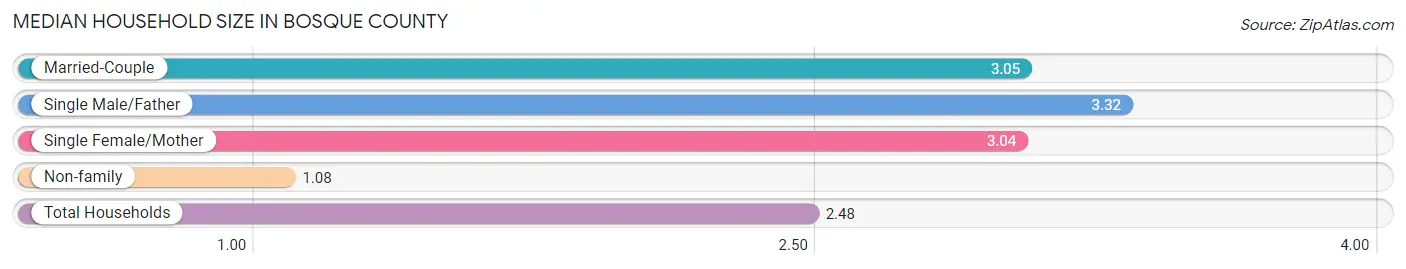
The median household size in Bosque County is 2.48 persons per household, with single male/father households (175 | 2.4%) accounting for the largest median household size of 3.32 persons per household. non-family households (2,128 | 29.2%) represent the smallest median household size with 1.08 persons per household.
| Household Type | # Households | Household Size |
| Married-Couple | 4,227 (58.1%) | 3.05 |
| Single Male/Father | 175 (2.4%) | 3.32 |
| Single Female/Mother | 747 (10.3%) | 3.04 |
| Non-family | 2,128 (29.2%) | 1.08 |
| Total Households | 7,277 (100.0%) | 2.48 |
Household Size by Marriage Status in Bosque County
Out of a total of 7,277 households in Bosque County, 5,149 (70.8%) are family households, while 2,128 (29.2%) are nonfamily households. The most numerous type of family households are 2-person households, comprising 2,643, and the most common type of nonfamily households are 1-person households, comprising 1,959.
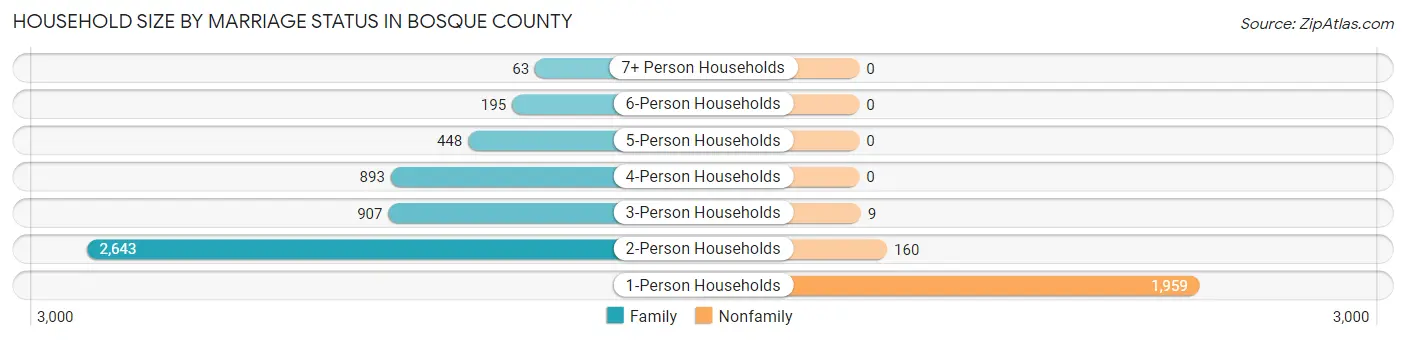
| Household Size | Family Households | Nonfamily Households |
| 1-Person Households | - | 1,959 (26.9%) |
| 2-Person Households | 2,643 (36.3%) | 160 (2.2%) |
| 3-Person Households | 907 (12.5%) | 9 (0.1%) |
| 4-Person Households | 893 (12.3%) | 0 (0.0%) |
| 5-Person Households | 448 (6.2%) | 0 (0.0%) |
| 6-Person Households | 195 (2.7%) | 0 (0.0%) |
| 7+ Person Households | 63 (0.9%) | 0 (0.0%) |
| Total | 5,149 (70.8%) | 2,128 (29.2%) |
Female Fertility in Bosque County
Fertility by Age in Bosque County
Average fertility rate in Bosque County is 51.0 births per 1,000 women. Women in the age bracket of 20 to 34 years have the highest fertility rate with 102.0 births per 1,000 women. Women in the age bracket of 20 to 34 years acount for 75.7% of all women with births.
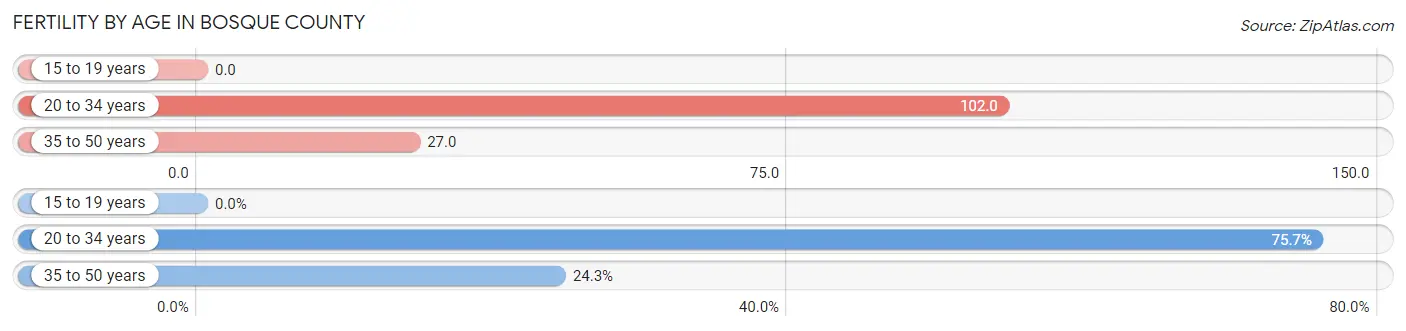
| Age Bracket | Women with Births | Births / 1,000 Women |
| 15 to 19 years | 0 (0.0%) | 0.0 |
| 20 to 34 years | 134 (75.7%) | 102.0 |
| 35 to 50 years | 43 (24.3%) | 27.0 |
| Total | 177 (100.0%) | 51.0 |
Fertility by Age by Marriage Status in Bosque County
58.2% of women with births (177) in Bosque County are married. The highest percentage of unmarried women with births falls into 20 to 34 years age bracket with 55.2% of them unmarried at the time of birth, while the lowest percentage of unmarried women with births belong to 35 to 50 years age bracket with 0.0% of them unmarried.
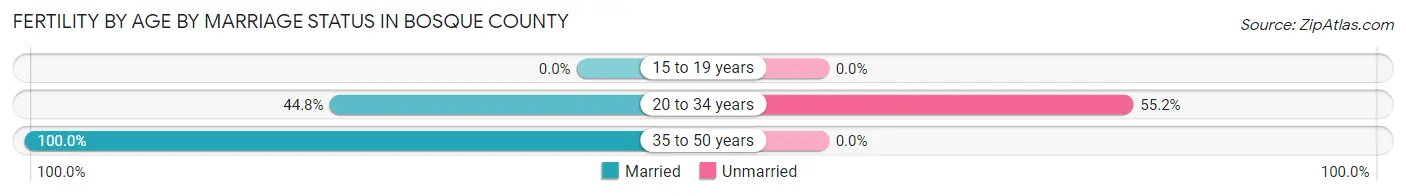
| Age Bracket | Married | Unmarried |
| 15 to 19 years | 0 (0.0%) | 0 (0.0%) |
| 20 to 34 years | 60 (44.8%) | 74 (55.2%) |
| 35 to 50 years | 43 (100.0%) | 0 (0.0%) |
| Total | 103 (58.2%) | 74 (41.8%) |
Fertility by Education in Bosque County
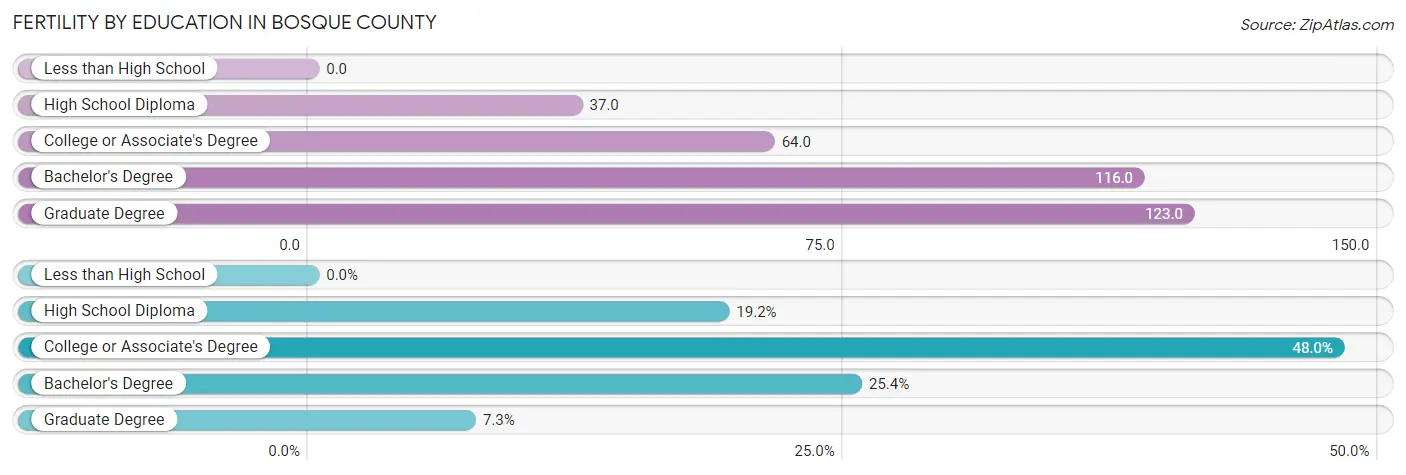
| Educational Attainment | Women with Births | Births / 1,000 Women |
| Less than High School | 0 (0.0%) | 0.0 |
| High School Diploma | 34 (19.2%) | 37.0 |
| College or Associate's Degree | 85 (48.0%) | 64.0 |
| Bachelor's Degree | 45 (25.4%) | 116.0 |
| Graduate Degree | 13 (7.3%) | 123.0 |
| Total | 177 (100.0%) | 51.0 |
Fertility by Education by Marriage Status in Bosque County
41.8% of women with births in Bosque County are unmarried. Women with the educational attainment of bachelor's degree are most likely to be married with 100.0% of them married at childbirth, while women with the educational attainment of high school diploma are least likely to be married with 97.1% of them unmarried at childbirth.
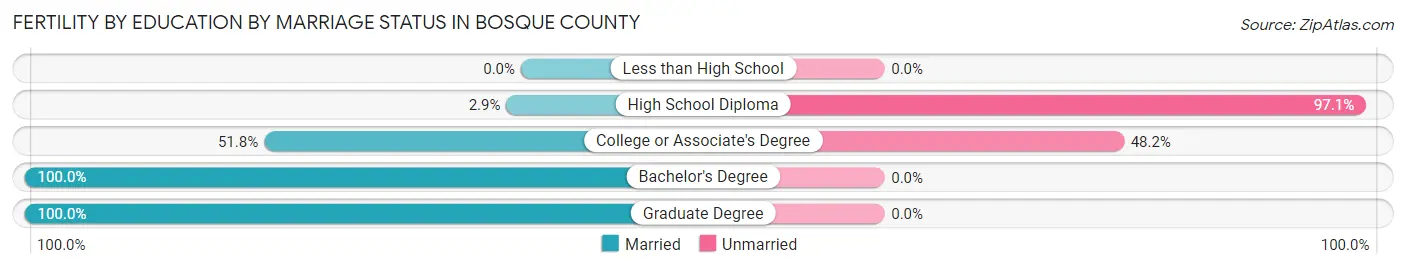
| Educational Attainment | Married | Unmarried |
| Less than High School | 0 (0.0%) | 0 (0.0%) |
| High School Diploma | 1 (2.9%) | 33 (97.1%) |
| College or Associate's Degree | 44 (51.8%) | 41 (48.2%) |
| Bachelor's Degree | 45 (100.0%) | 0 (0.0%) |
| Graduate Degree | 13 (100.0%) | 0 (0.0%) |
| Total | 103 (58.2%) | 74 (41.8%) |
Employment Characteristics in Bosque County
Employment by Class of Employer in Bosque County
Among the 7,486 employed individuals in Bosque County, private company employees (4,835 | 64.6%), local government employees (849 | 11.3%), and self-employed (not incorporated) (619 | 8.3%) make up the most common classes of employment.
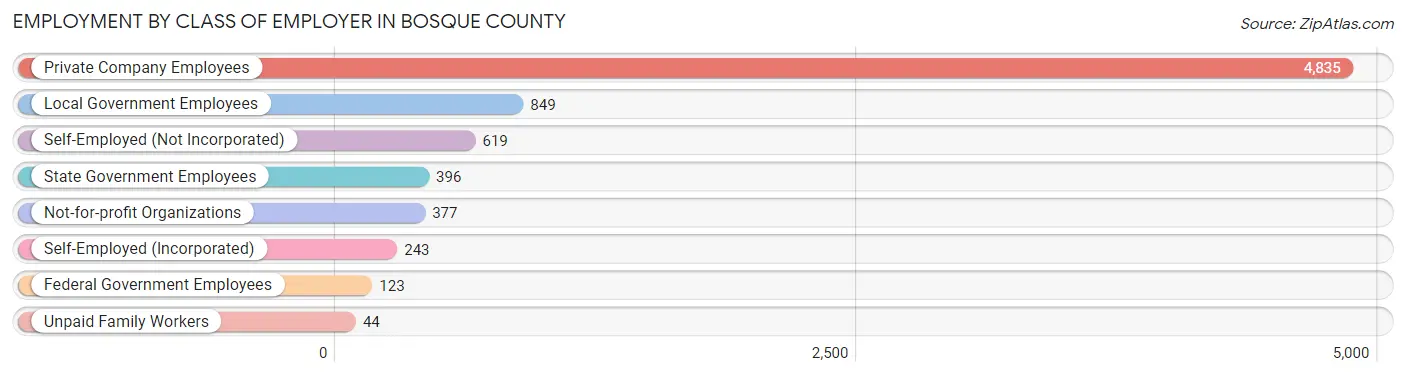
| Employer Class | # Employees | % Employees |
| Private Company Employees | 4,835 | 64.6% |
| Self-Employed (Incorporated) | 243 | 3.3% |
| Self-Employed (Not Incorporated) | 619 | 8.3% |
| Not-for-profit Organizations | 377 | 5.0% |
| Local Government Employees | 849 | 11.3% |
| State Government Employees | 396 | 5.3% |
| Federal Government Employees | 123 | 1.6% |
| Unpaid Family Workers | 44 | 0.6% |
| Total | 7,486 | 100.0% |
Employment Status by Age in Bosque County
According to the labor force statistics for Bosque County, out of the total population over 16 years of age (14,977), 53.6% or 8,028 individuals are in the labor force, with 3.9% or 313 of them unemployed. The age group with the highest labor force participation rate is 20 to 24 years, with 83.3% or 701 individuals in the labor force. Within the labor force, the 16 to 19 years age range has the highest percentage of unemployed individuals, with 11.1% or 36 of them being unemployed.
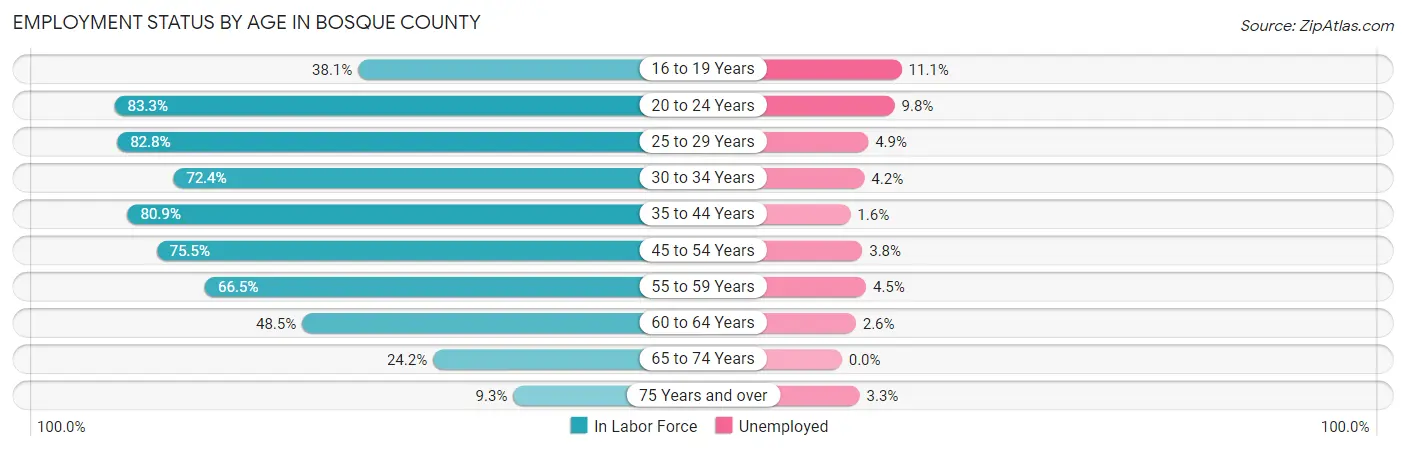
| Age Bracket | In Labor Force | Unemployed |
| 16 to 19 Years | 325 (38.1%) | 36 (11.1%) |
| 20 to 24 Years | 701 (83.3%) | 69 (9.8%) |
| 25 to 29 Years | 752 (82.8%) | 37 (4.9%) |
| 30 to 34 Years | 645 (72.4%) | 27 (4.2%) |
| 35 to 44 Years | 1,666 (80.9%) | 27 (1.6%) |
| 45 to 54 Years | 1,561 (75.5%) | 59 (3.8%) |
| 55 to 59 Years | 779 (66.5%) | 35 (4.5%) |
| 60 to 64 Years | 777 (48.5%) | 20 (2.6%) |
| 65 to 74 Years | 633 (24.2%) | 0 (0.0%) |
| 75 Years and over | 183 (9.3%) | 6 (3.3%) |
| Total | 8,028 (53.6%) | 313 (3.9%) |
Employment Status by Educational Attainment in Bosque County
According to labor force statistics for Bosque County, 71.0% of individuals (6,178) out of the total population between 25 and 64 years of age (8,701) are in the labor force, with 3.3% or 204 of them being unemployed. The group with the highest labor force participation rate are those with the educational attainment of bachelor's degree or higher, with 78.2% or 1,062 individuals in the labor force. Within the labor force, individuals with high school diploma education have the highest percentage of unemployment, with 4.4% or 85 of them being unemployed.
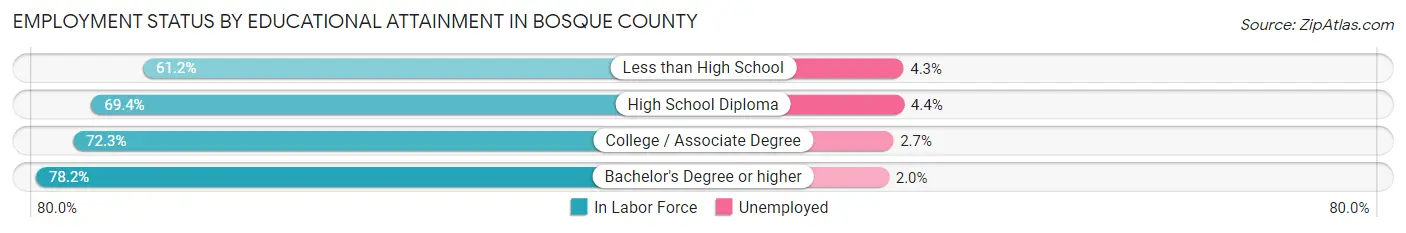
| Educational Attainment | In Labor Force | Unemployed |
| Less than High School | 622 (61.2%) | 44 (4.3%) |
| High School Diploma | 1,938 (69.4%) | 123 (4.4%) |
| College / Associate Degree | 2,556 (72.3%) | 95 (2.7%) |
| Bachelor's Degree or higher | 1,062 (78.2%) | 27 (2.0%) |
| Total | 6,178 (71.0%) | 287 (3.3%) |
Employment Occupations by Sex in Bosque County
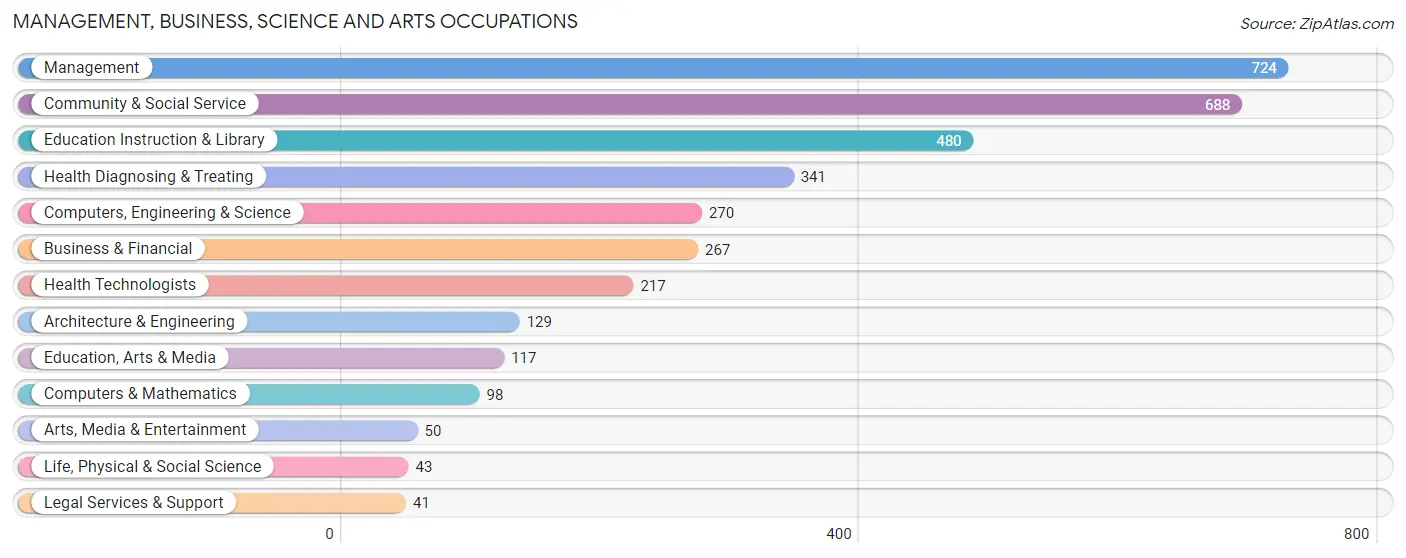
Management, Business, Science and Arts Occupations
The most common Management, Business, Science and Arts occupations in Bosque County are Management (724 | 9.4%), Community & Social Service (688 | 8.9%), Education Instruction & Library (480 | 6.2%), Health Diagnosing & Treating (341 | 4.4%), and Computers, Engineering & Science (270 | 3.5%).
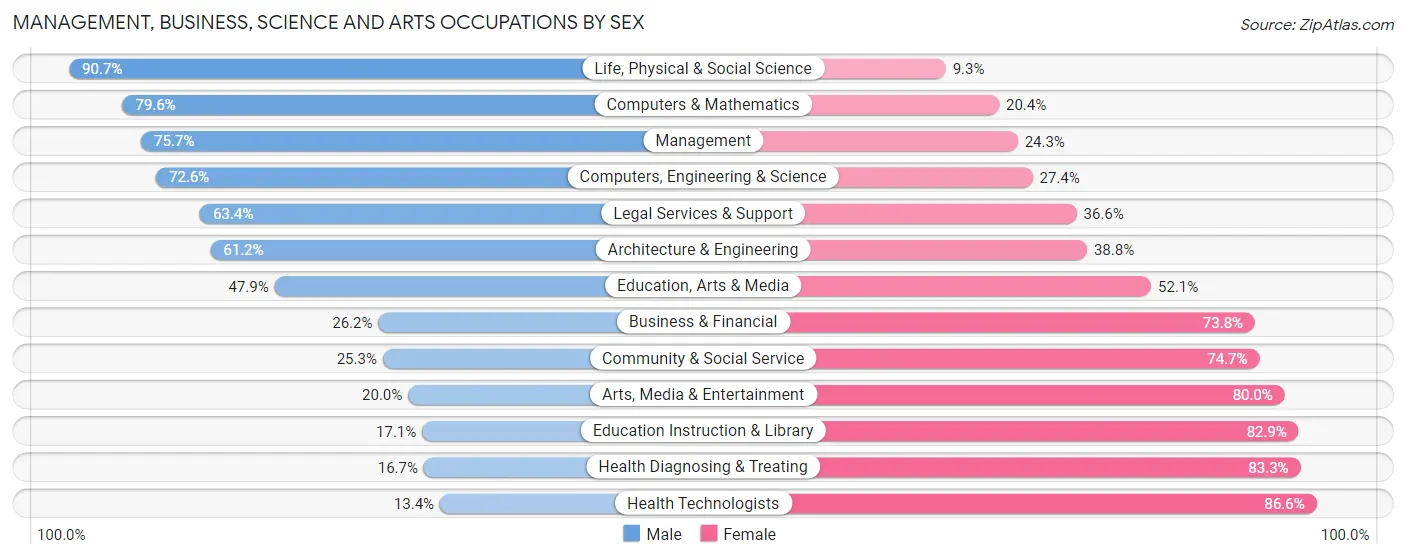
Management, Business, Science and Arts Occupations by Sex
Within the Management, Business, Science and Arts occupations in Bosque County, the most male-oriented occupations are Life, Physical & Social Science (90.7%), Computers & Mathematics (79.6%), and Management (75.7%), while the most female-oriented occupations are Health Technologists (86.6%), Health Diagnosing & Treating (83.3%), and Education Instruction & Library (82.9%).
| Occupation | Male | Female |
| Management | 548 (75.7%) | 176 (24.3%) |
| Business & Financial | 70 (26.2%) | 197 (73.8%) |
| Computers, Engineering & Science | 196 (72.6%) | 74 (27.4%) |
| Computers & Mathematics | 78 (79.6%) | 20 (20.4%) |
| Architecture & Engineering | 79 (61.2%) | 50 (38.8%) |
| Life, Physical & Social Science | 39 (90.7%) | 4 (9.3%) |
| Community & Social Service | 174 (25.3%) | 514 (74.7%) |
| Education, Arts & Media | 56 (47.9%) | 61 (52.1%) |
| Legal Services & Support | 26 (63.4%) | 15 (36.6%) |
| Education Instruction & Library | 82 (17.1%) | 398 (82.9%) |
| Arts, Media & Entertainment | 10 (20.0%) | 40 (80.0%) |
| Health Diagnosing & Treating | 57 (16.7%) | 284 (83.3%) |
| Health Technologists | 29 (13.4%) | 188 (86.6%) |
| Total (Category) | 1,045 (45.6%) | 1,245 (54.4%) |
| Total (Overall) | 4,174 (54.3%) | 3,509 (45.7%) |
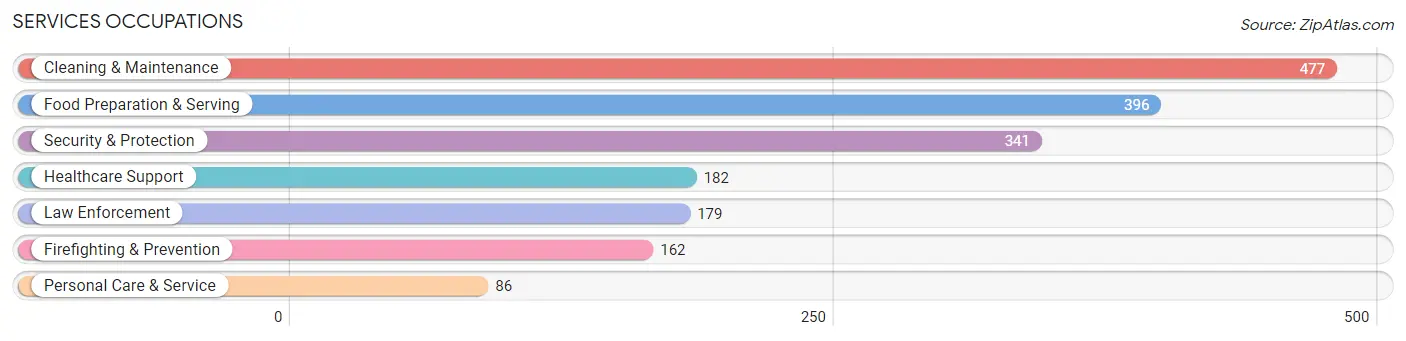
Services Occupations
The most common Services occupations in Bosque County are Cleaning & Maintenance (477 | 6.2%), Food Preparation & Serving (396 | 5.1%), Security & Protection (341 | 4.4%), Healthcare Support (182 | 2.4%), and Law Enforcement (179 | 2.3%).
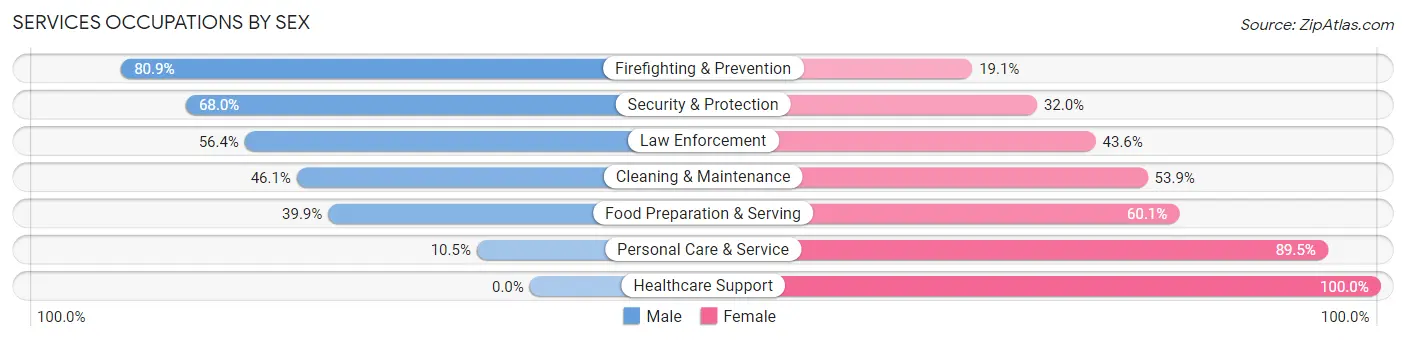
Services Occupations by Sex
Within the Services occupations in Bosque County, the most male-oriented occupations are Firefighting & Prevention (80.9%), Security & Protection (68.0%), and Law Enforcement (56.4%), while the most female-oriented occupations are Healthcare Support (100.0%), Personal Care & Service (89.5%), and Food Preparation & Serving (60.1%).
| Occupation | Male | Female |
| Healthcare Support | 0 (0.0%) | 182 (100.0%) |
| Security & Protection | 232 (68.0%) | 109 (32.0%) |
| Firefighting & Prevention | 131 (80.9%) | 31 (19.1%) |
| Law Enforcement | 101 (56.4%) | 78 (43.6%) |
| Food Preparation & Serving | 158 (39.9%) | 238 (60.1%) |
| Cleaning & Maintenance | 220 (46.1%) | 257 (53.9%) |
| Personal Care & Service | 9 (10.5%) | 77 (89.5%) |
| Total (Category) | 619 (41.8%) | 863 (58.2%) |
| Total (Overall) | 4,174 (54.3%) | 3,509 (45.7%) |
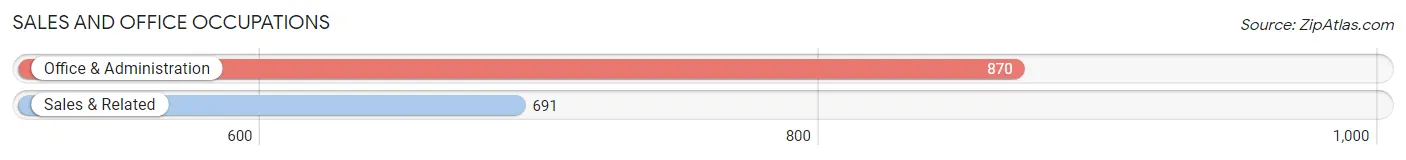
Sales and Office Occupations
The most common Sales and Office occupations in Bosque County are Office & Administration (870 | 11.3%), and Sales & Related (691 | 9.0%).
Sales and Office Occupations by Sex
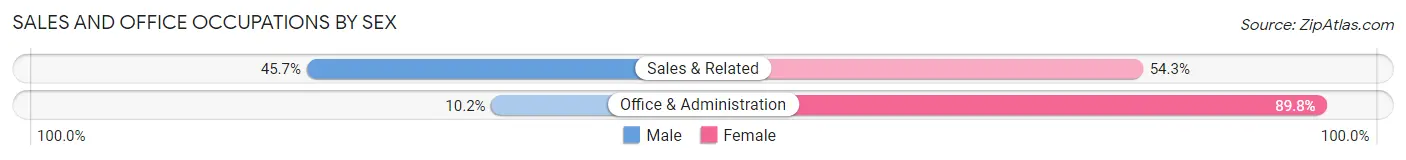
| Occupation | Male | Female |
| Sales & Related | 316 (45.7%) | 375 (54.3%) |
| Office & Administration | 89 (10.2%) | 781 (89.8%) |
| Total (Category) | 405 (25.9%) | 1,156 (74.1%) |
| Total (Overall) | 4,174 (54.3%) | 3,509 (45.7%) |
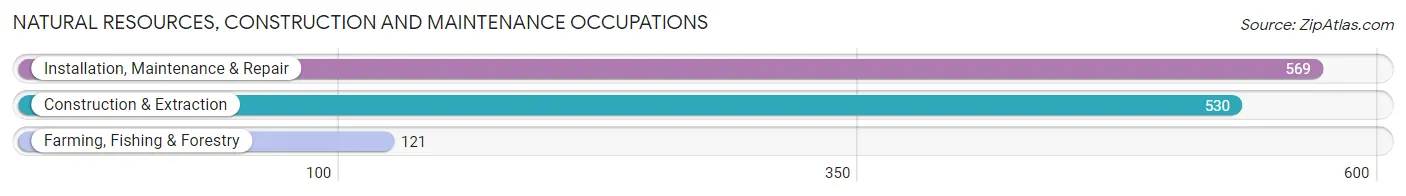
Natural Resources, Construction and Maintenance Occupations
The most common Natural Resources, Construction and Maintenance occupations in Bosque County are Installation, Maintenance & Repair (569 | 7.4%), Construction & Extraction (530 | 6.9%), and Farming, Fishing & Forestry (121 | 1.6%).
Natural Resources, Construction and Maintenance Occupations by Sex
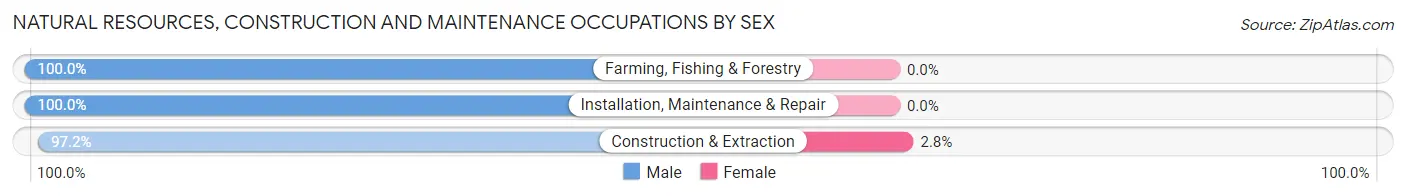
| Occupation | Male | Female |
| Farming, Fishing & Forestry | 121 (100.0%) | 0 (0.0%) |
| Construction & Extraction | 515 (97.2%) | 15 (2.8%) |
| Installation, Maintenance & Repair | 569 (100.0%) | 0 (0.0%) |
| Total (Category) | 1,205 (98.8%) | 15 (1.2%) |
| Total (Overall) | 4,174 (54.3%) | 3,509 (45.7%) |
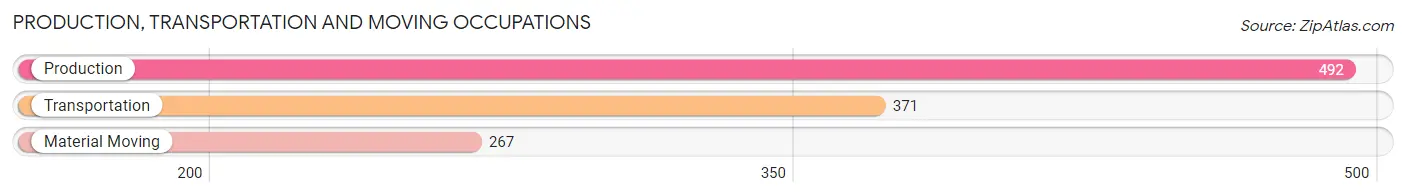
Production, Transportation and Moving Occupations
The most common Production, Transportation and Moving occupations in Bosque County are Production (492 | 6.4%), Transportation (371 | 4.8%), and Material Moving (267 | 3.5%).
Production, Transportation and Moving Occupations by Sex
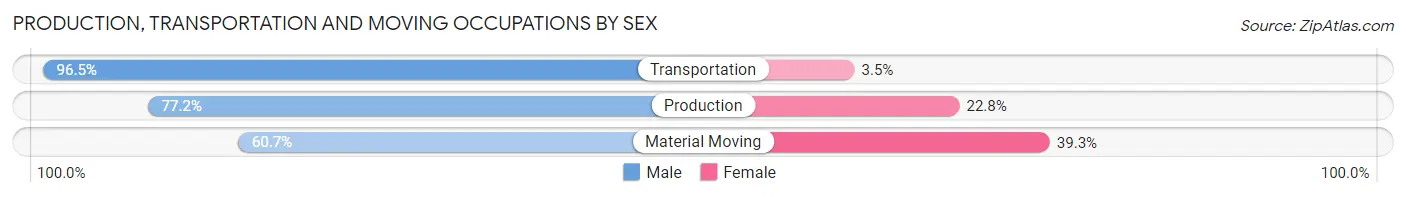
| Occupation | Male | Female |
| Production | 380 (77.2%) | 112 (22.8%) |
| Transportation | 358 (96.5%) | 13 (3.5%) |
| Material Moving | 162 (60.7%) | 105 (39.3%) |
| Total (Category) | 900 (79.6%) | 230 (20.3%) |
| Total (Overall) | 4,174 (54.3%) | 3,509 (45.7%) |
Employment Industries by Sex in Bosque County
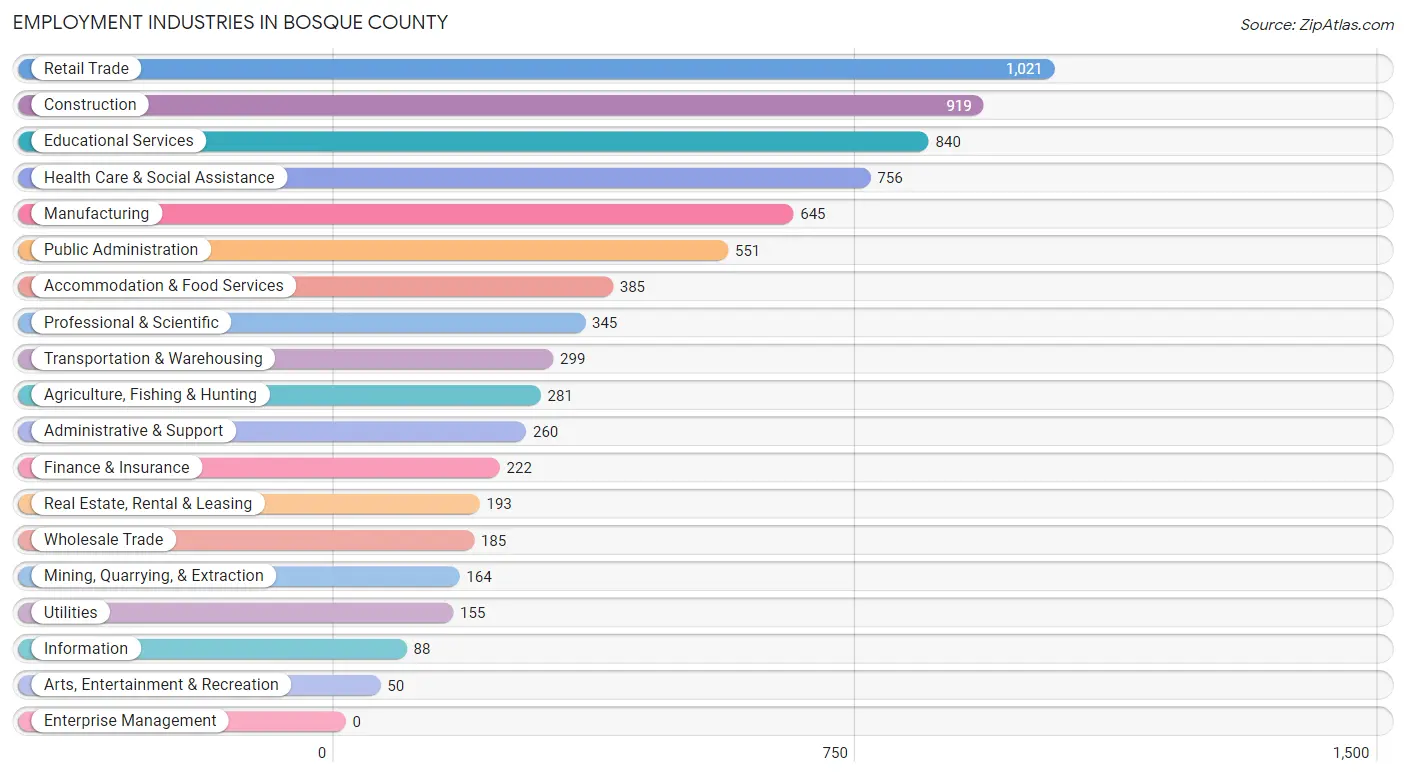
Employment Industries in Bosque County
The major employment industries in Bosque County include Retail Trade (1,021 | 13.3%), Construction (919 | 12.0%), Educational Services (840 | 10.9%), Health Care & Social Assistance (756 | 9.8%), and Manufacturing (645 | 8.4%).
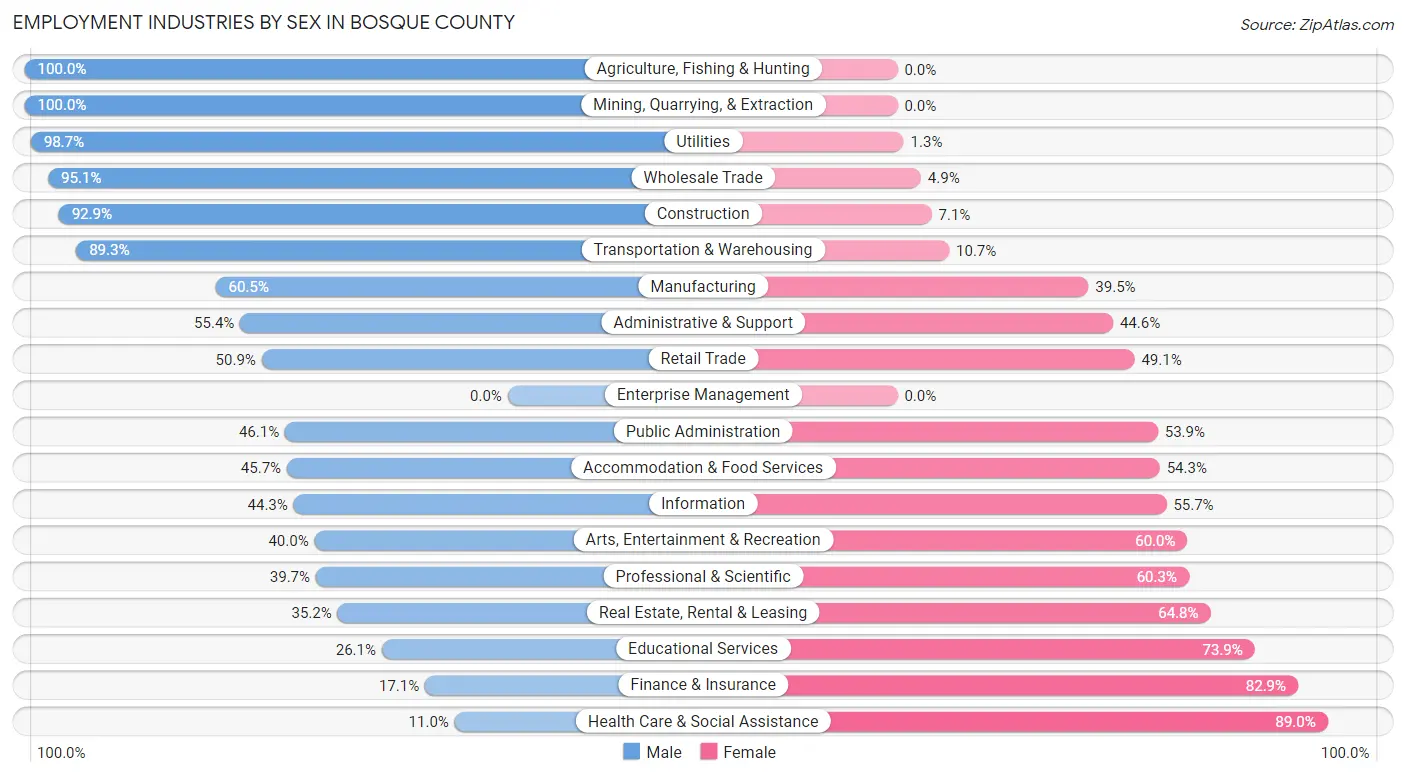
Employment Industries by Sex in Bosque County
The Bosque County industries that see more men than women are Agriculture, Fishing & Hunting (100.0%), Mining, Quarrying, & Extraction (100.0%), and Utilities (98.7%), whereas the industries that tend to have a higher number of women are Health Care & Social Assistance (89.0%), Finance & Insurance (82.9%), and Educational Services (73.9%).
| Industry | Male | Female |
| Agriculture, Fishing & Hunting | 281 (100.0%) | 0 (0.0%) |
| Mining, Quarrying, & Extraction | 164 (100.0%) | 0 (0.0%) |
| Construction | 854 (92.9%) | 65 (7.1%) |
| Manufacturing | 390 (60.5%) | 255 (39.5%) |
| Wholesale Trade | 176 (95.1%) | 9 (4.9%) |
| Retail Trade | 520 (50.9%) | 501 (49.1%) |
| Transportation & Warehousing | 267 (89.3%) | 32 (10.7%) |
| Utilities | 153 (98.7%) | 2 (1.3%) |
| Information | 39 (44.3%) | 49 (55.7%) |
| Finance & Insurance | 38 (17.1%) | 184 (82.9%) |
| Real Estate, Rental & Leasing | 68 (35.2%) | 125 (64.8%) |
| Professional & Scientific | 137 (39.7%) | 208 (60.3%) |
| Enterprise Management | 0 (0.0%) | 0 (0.0%) |
| Administrative & Support | 144 (55.4%) | 116 (44.6%) |
| Educational Services | 219 (26.1%) | 621 (73.9%) |
| Health Care & Social Assistance | 83 (11.0%) | 673 (89.0%) |
| Arts, Entertainment & Recreation | 20 (40.0%) | 30 (60.0%) |
| Accommodation & Food Services | 176 (45.7%) | 209 (54.3%) |
| Public Administration | 254 (46.1%) | 297 (53.9%) |
| Total | 4,174 (54.3%) | 3,509 (45.7%) |
Education in Bosque County
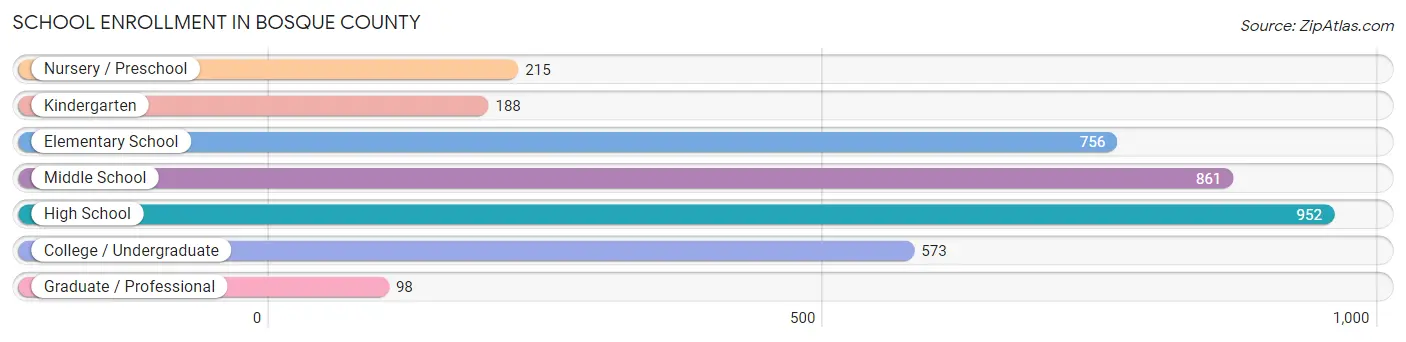
School Enrollment in Bosque County
The most common levels of schooling among the 3,643 students in Bosque County are high school (952 | 26.1%), middle school (861 | 23.6%), and elementary school (756 | 20.7%).
| School Level | # Students | % Students |
| Nursery / Preschool | 215 | 5.9% |
| Kindergarten | 188 | 5.2% |
| Elementary School | 756 | 20.7% |
| Middle School | 861 | 23.6% |
| High School | 952 | 26.1% |
| College / Undergraduate | 573 | 15.7% |
| Graduate / Professional | 98 | 2.7% |
| Total | 3,643 | 100.0% |
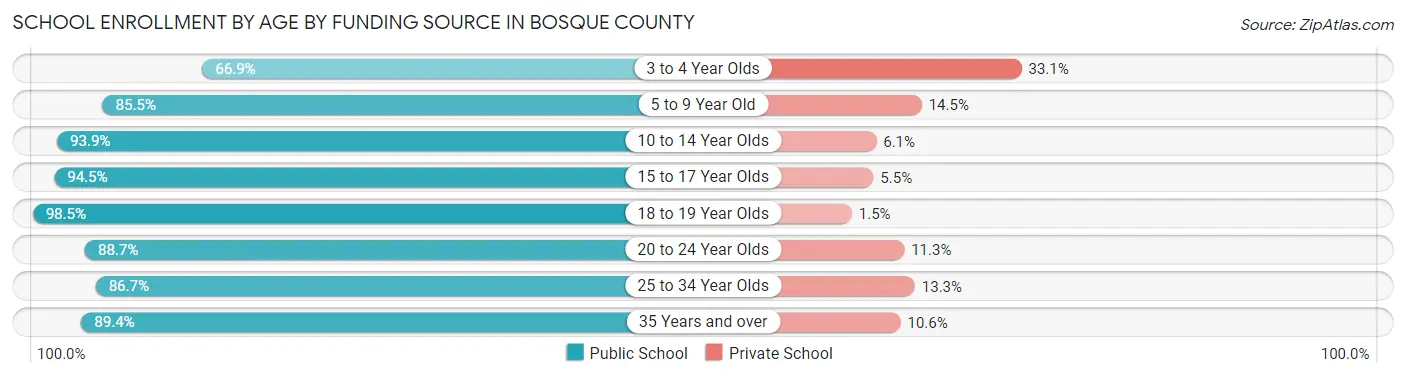
School Enrollment by Age by Funding Source in Bosque County
Out of a total of 3,643 students who are enrolled in schools in Bosque County, 361 (9.9%) attend a private institution, while the remaining 3,282 (90.1%) are enrolled in public schools. The age group of 3 to 4 year olds has the highest likelihood of being enrolled in private schools, with 55 (33.1% in the age bracket) enrolled. Conversely, the age group of 18 to 19 year olds has the lowest likelihood of being enrolled in a private school, with 260 (98.5% in the age bracket) attending a public institution.
| Age Bracket | Public School | Private School |
| 3 to 4 Year Olds | 111 (66.9%) | 55 (33.1%) |
| 5 to 9 Year Old | 805 (85.5%) | 137 (14.5%) |
| 10 to 14 Year Olds | 1,005 (93.9%) | 65 (6.1%) |
| 15 to 17 Year Olds | 597 (94.5%) | 35 (5.5%) |
| 18 to 19 Year Olds | 260 (98.5%) | 4 (1.5%) |
| 20 to 24 Year Olds | 118 (88.7%) | 15 (11.3%) |
| 25 to 34 Year Olds | 157 (86.7%) | 24 (13.3%) |
| 35 Years and over | 228 (89.4%) | 27 (10.6%) |
| Total | 3,282 (90.1%) | 361 (9.9%) |
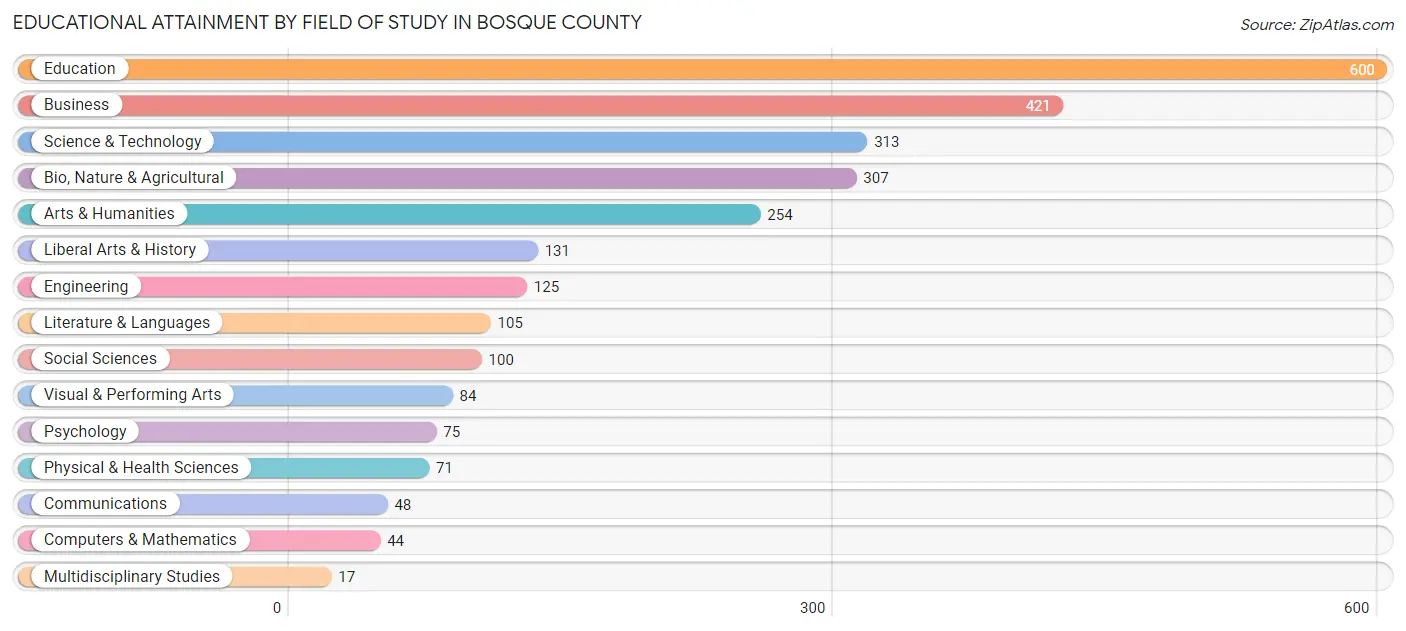
Educational Attainment by Field of Study in Bosque County
Education (600 | 22.3%), business (421 | 15.6%), science & technology (313 | 11.6%), bio, nature & agricultural (307 | 11.4%), and arts & humanities (254 | 9.4%) are the most common fields of study among 2,695 individuals in Bosque County who have obtained a bachelor's degree or higher.
| Field of Study | # Graduates | % Graduates |
| Computers & Mathematics | 44 | 1.6% |
| Bio, Nature & Agricultural | 307 | 11.4% |
| Physical & Health Sciences | 71 | 2.6% |
| Psychology | 75 | 2.8% |
| Social Sciences | 100 | 3.7% |
| Engineering | 125 | 4.6% |
| Multidisciplinary Studies | 17 | 0.6% |
| Science & Technology | 313 | 11.6% |
| Business | 421 | 15.6% |
| Education | 600 | 22.3% |
| Literature & Languages | 105 | 3.9% |
| Liberal Arts & History | 131 | 4.9% |
| Visual & Performing Arts | 84 | 3.1% |
| Communications | 48 | 1.8% |
| Arts & Humanities | 254 | 9.4% |
| Total | 2,695 | 100.0% |
Transportation & Commute in Bosque County
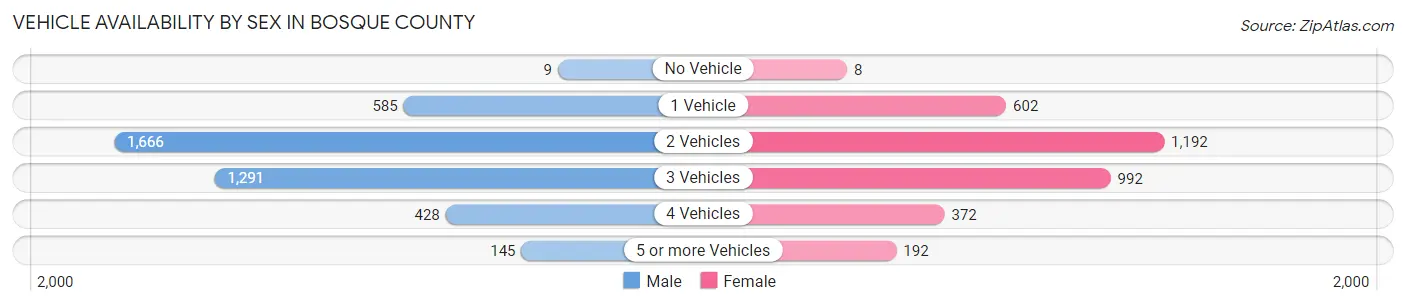
Vehicle Availability by Sex in Bosque County
The most prevalent vehicle ownership categories in Bosque County are males with 2 vehicles (1,666, accounting for 40.4%) and females with 2 vehicles (1,192, making up 49.6%).
| Vehicles Available | Male | Female |
| No Vehicle | 9 (0.2%) | 8 (0.2%) |
| 1 Vehicle | 585 (14.2%) | 602 (17.9%) |
| 2 Vehicles | 1,666 (40.4%) | 1,192 (35.5%) |
| 3 Vehicles | 1,291 (31.3%) | 992 (29.5%) |
| 4 Vehicles | 428 (10.4%) | 372 (11.1%) |
| 5 or more Vehicles | 145 (3.5%) | 192 (5.7%) |
| Total | 4,124 (100.0%) | 3,358 (100.0%) |
Commute Time in Bosque County
The most frequently occuring commute durations in Bosque County are 45 to 59 minutes (885 commuters, 12.6%), 5 to 9 minutes (811 commuters, 11.6%), and less than 5 minutes (806 commuters, 11.5%).
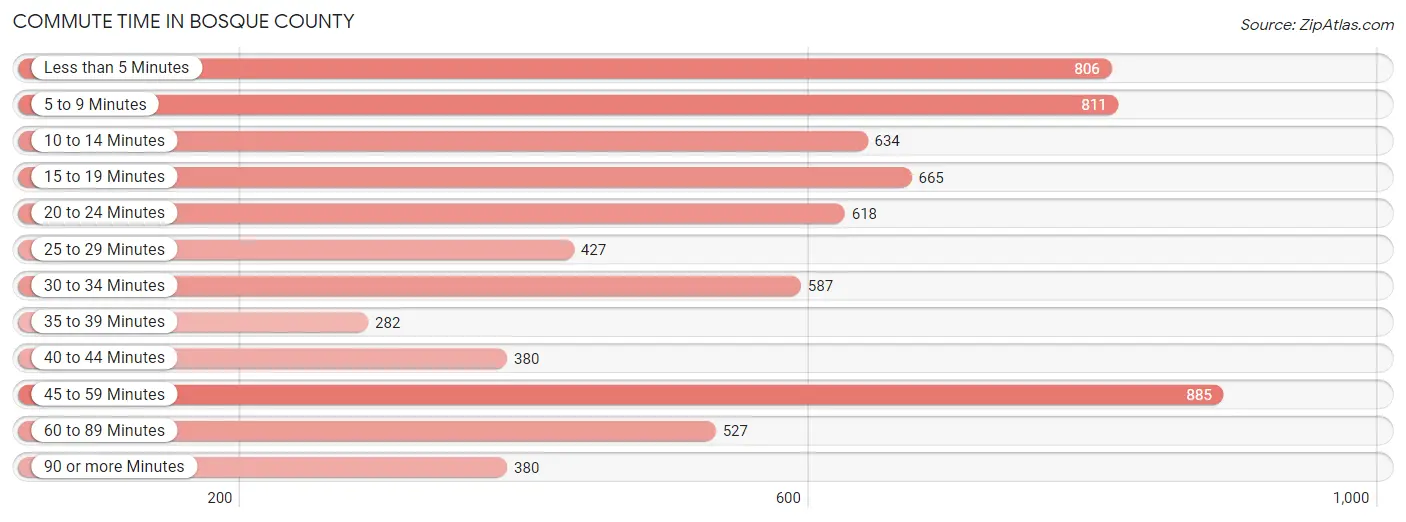
| Commute Time | # Commuters | % Commuters |
| Less than 5 Minutes | 806 | 11.5% |
| 5 to 9 Minutes | 811 | 11.6% |
| 10 to 14 Minutes | 634 | 9.0% |
| 15 to 19 Minutes | 665 | 9.5% |
| 20 to 24 Minutes | 618 | 8.8% |
| 25 to 29 Minutes | 427 | 6.1% |
| 30 to 34 Minutes | 587 | 8.4% |
| 35 to 39 Minutes | 282 | 4.0% |
| 40 to 44 Minutes | 380 | 5.4% |
| 45 to 59 Minutes | 885 | 12.6% |
| 60 to 89 Minutes | 527 | 7.5% |
| 90 or more Minutes | 380 | 5.4% |
Commute Time by Sex in Bosque County
The most common commute times in Bosque County are 45 to 59 minutes (627 commuters, 16.3%) for males and less than 5 minutes (510 commuters, 16.2%) for females.
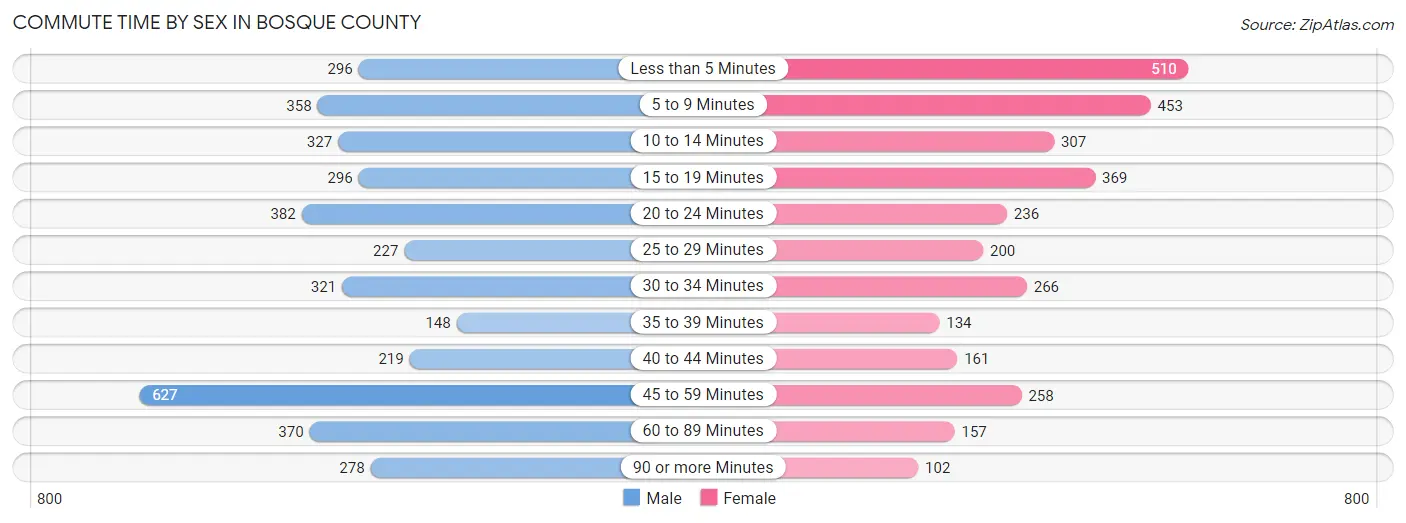
| Commute Time | Male | Female |
| Less than 5 Minutes | 296 (7.7%) | 510 (16.2%) |
| 5 to 9 Minutes | 358 (9.3%) | 453 (14.4%) |
| 10 to 14 Minutes | 327 (8.5%) | 307 (9.7%) |
| 15 to 19 Minutes | 296 (7.7%) | 369 (11.7%) |
| 20 to 24 Minutes | 382 (9.9%) | 236 (7.5%) |
| 25 to 29 Minutes | 227 (5.9%) | 200 (6.3%) |
| 30 to 34 Minutes | 321 (8.3%) | 266 (8.4%) |
| 35 to 39 Minutes | 148 (3.8%) | 134 (4.3%) |
| 40 to 44 Minutes | 219 (5.7%) | 161 (5.1%) |
| 45 to 59 Minutes | 627 (16.3%) | 258 (8.2%) |
| 60 to 89 Minutes | 370 (9.6%) | 157 (5.0%) |
| 90 or more Minutes | 278 (7.2%) | 102 (3.2%) |
Time of Departure to Work by Sex in Bosque County
The most frequent times of departure to work in Bosque County are 7:00 AM to 7:29 AM (643, 16.7%) for males and 7:00 AM to 7:29 AM (814, 25.8%) for females.
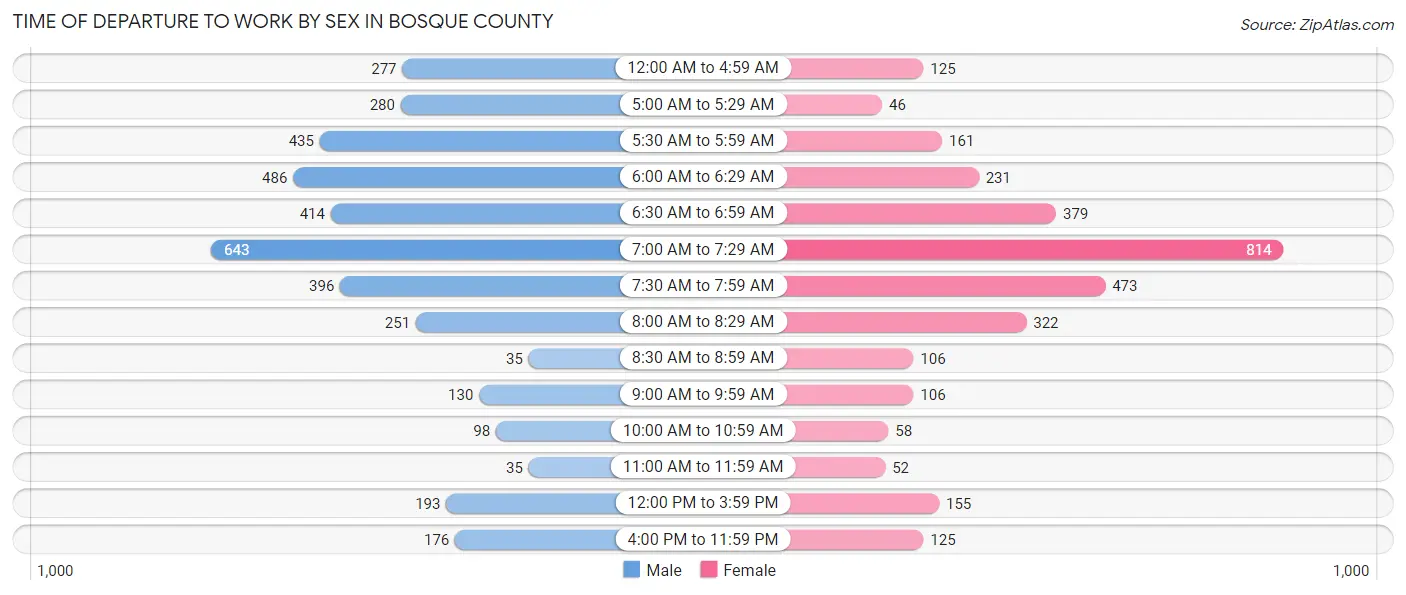
| Time of Departure | Male | Female |
| 12:00 AM to 4:59 AM | 277 (7.2%) | 125 (4.0%) |
| 5:00 AM to 5:29 AM | 280 (7.3%) | 46 (1.5%) |
| 5:30 AM to 5:59 AM | 435 (11.3%) | 161 (5.1%) |
| 6:00 AM to 6:29 AM | 486 (12.6%) | 231 (7.3%) |
| 6:30 AM to 6:59 AM | 414 (10.8%) | 379 (12.0%) |
| 7:00 AM to 7:29 AM | 643 (16.7%) | 814 (25.8%) |
| 7:30 AM to 7:59 AM | 396 (10.3%) | 473 (15.0%) |
| 8:00 AM to 8:29 AM | 251 (6.5%) | 322 (10.2%) |
| 8:30 AM to 8:59 AM | 35 (0.9%) | 106 (3.4%) |
| 9:00 AM to 9:59 AM | 130 (3.4%) | 106 (3.4%) |
| 10:00 AM to 10:59 AM | 98 (2.5%) | 58 (1.8%) |
| 11:00 AM to 11:59 AM | 35 (0.9%) | 52 (1.7%) |
| 12:00 PM to 3:59 PM | 193 (5.0%) | 155 (4.9%) |
| 4:00 PM to 11:59 PM | 176 (4.6%) | 125 (4.0%) |
| Total | 3,849 (100.0%) | 3,153 (100.0%) |
Housing Occupancy in Bosque County
Occupancy by Ownership in Bosque County
Of the total 7,277 dwellings in Bosque County, owner-occupied units account for 5,512 (75.7%), while renter-occupied units make up 1,765 (24.2%).
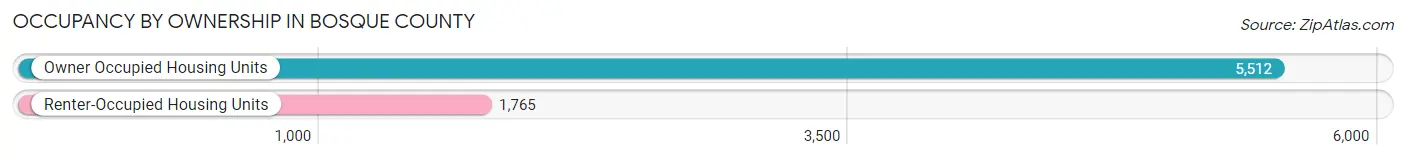
| Occupancy | # Housing Units | % Housing Units |
| Owner Occupied Housing Units | 5,512 | 75.7% |
| Renter-Occupied Housing Units | 1,765 | 24.2% |
| Total Occupied Housing Units | 7,277 | 100.0% |
Occupancy by Household Size in Bosque County
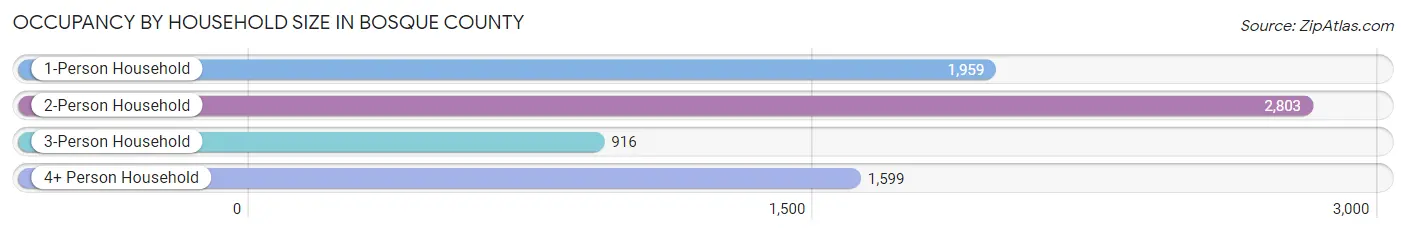
| Household Size | # Housing Units | % Housing Units |
| 1-Person Household | 1,959 | 26.9% |
| 2-Person Household | 2,803 | 38.5% |
| 3-Person Household | 916 | 12.6% |
| 4+ Person Household | 1,599 | 22.0% |
| Total Housing Units | 7,277 | 100.0% |
Occupancy by Ownership by Household Size in Bosque County
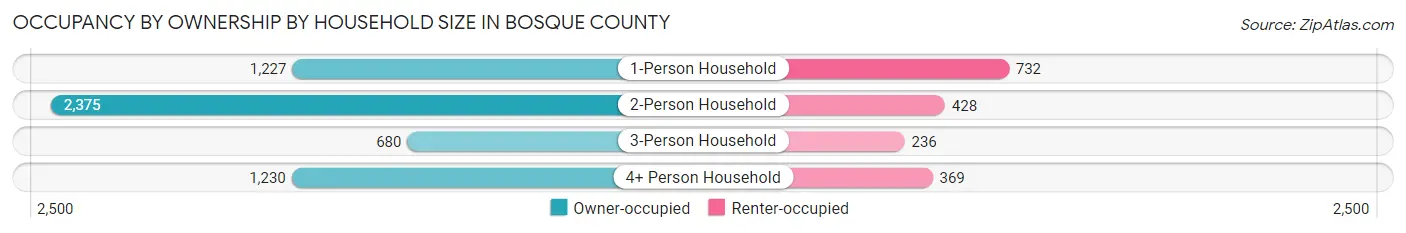
| Household Size | Owner-occupied | Renter-occupied |
| 1-Person Household | 1,227 (62.6%) | 732 (37.4%) |
| 2-Person Household | 2,375 (84.7%) | 428 (15.3%) |
| 3-Person Household | 680 (74.2%) | 236 (25.8%) |
| 4+ Person Household | 1,230 (76.9%) | 369 (23.1%) |
| Total Housing Units | 5,512 (75.7%) | 1,765 (24.2%) |
Occupancy by Educational Attainment in Bosque County
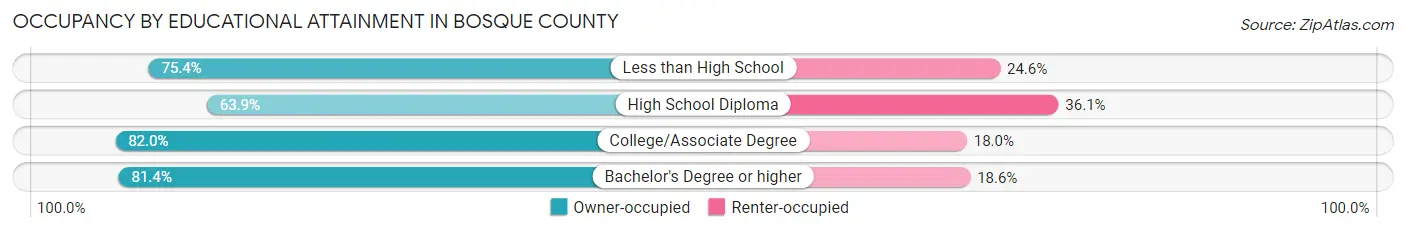
| Household Size | Owner-occupied | Renter-occupied |
| Less than High School | 605 (75.4%) | 197 (24.6%) |
| High School Diploma | 1,388 (63.9%) | 785 (36.1%) |
| College/Associate Degree | 2,332 (82.0%) | 511 (18.0%) |
| Bachelor's Degree or higher | 1,187 (81.4%) | 272 (18.6%) |
Occupancy by Age of Householder in Bosque County
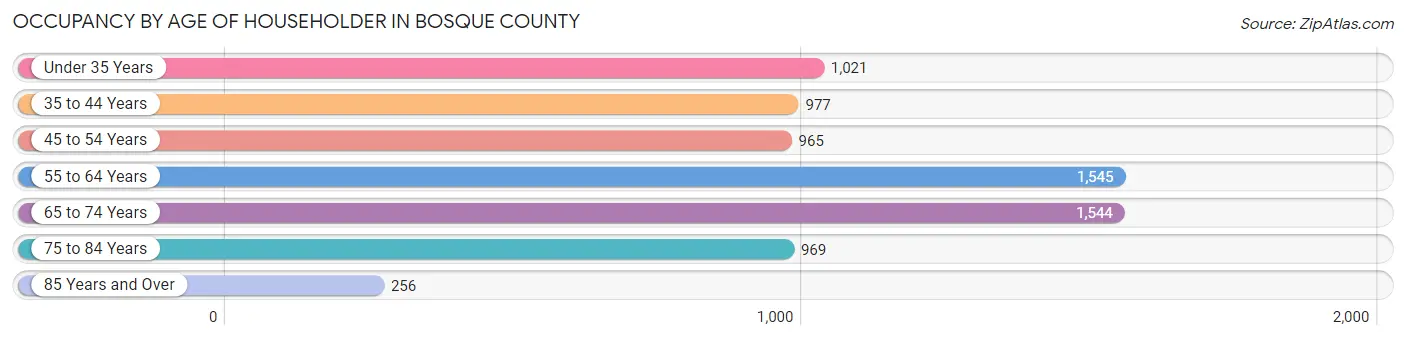
| Age Bracket | # Households | % Households |
| Under 35 Years | 1,021 | 14.0% |
| 35 to 44 Years | 977 | 13.4% |
| 45 to 54 Years | 965 | 13.3% |
| 55 to 64 Years | 1,545 | 21.2% |
| 65 to 74 Years | 1,544 | 21.2% |
| 75 to 84 Years | 969 | 13.3% |
| 85 Years and Over | 256 | 3.5% |
| Total | 7,277 | 100.0% |
Housing Finances in Bosque County
Median Income by Occupancy in Bosque County
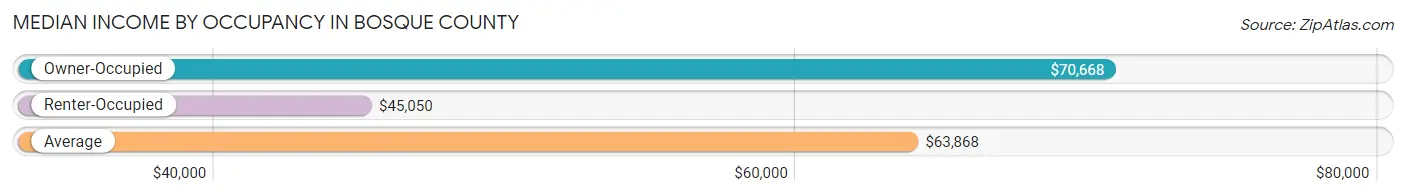
| Occupancy Type | # Households | Median Income |
| Owner-Occupied | 5,512 (75.7%) | $70,668 |
| Renter-Occupied | 1,765 (24.2%) | $45,050 |
| Average | 7,277 (100.0%) | $63,868 |
Occupancy by Householder Income Bracket in Bosque County
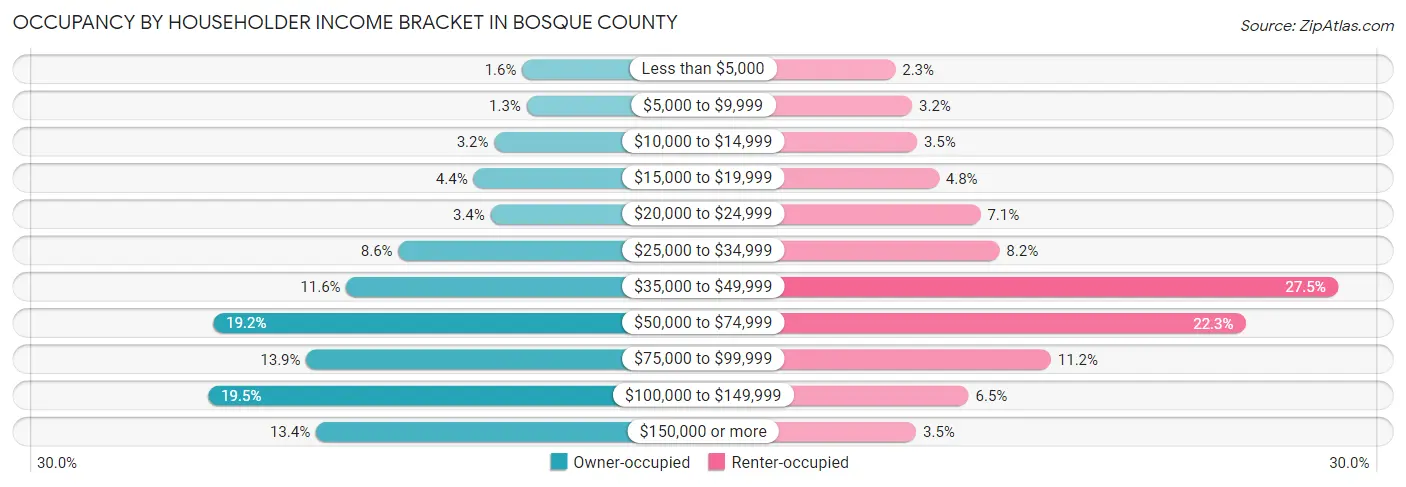
| Income Bracket | Owner-occupied | Renter-occupied |
| Less than $5,000 | 86 (1.6%) | 40 (2.3%) |
| $5,000 to $9,999 | 72 (1.3%) | 57 (3.2%) |
| $10,000 to $14,999 | 174 (3.2%) | 62 (3.5%) |
| $15,000 to $19,999 | 240 (4.3%) | 84 (4.8%) |
| $20,000 to $24,999 | 186 (3.4%) | 126 (7.1%) |
| $25,000 to $34,999 | 476 (8.6%) | 145 (8.2%) |
| $35,000 to $49,999 | 640 (11.6%) | 486 (27.5%) |
| $50,000 to $74,999 | 1,060 (19.2%) | 393 (22.3%) |
| $75,000 to $99,999 | 766 (13.9%) | 197 (11.2%) |
| $100,000 to $149,999 | 1,076 (19.5%) | 114 (6.5%) |
| $150,000 or more | 736 (13.4%) | 61 (3.5%) |
| Total | 5,512 (100.0%) | 1,765 (100.0%) |
Monthly Housing Cost Tiers in Bosque County
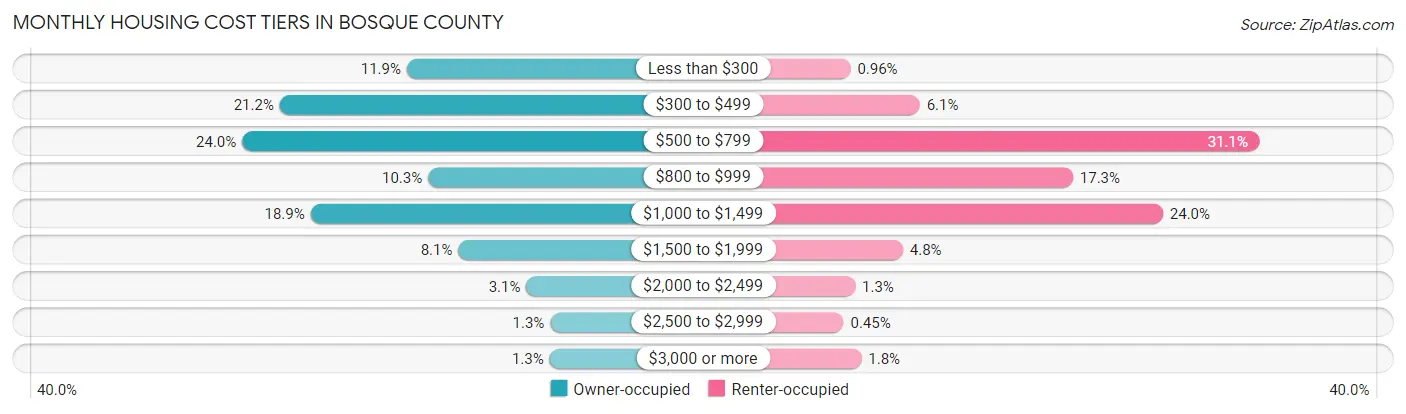
| Monthly Cost | Owner-occupied | Renter-occupied |
| Less than $300 | 653 (11.8%) | 17 (1.0%) |
| $300 to $499 | 1,169 (21.2%) | 107 (6.1%) |
| $500 to $799 | 1,322 (24.0%) | 549 (31.1%) |
| $800 to $999 | 567 (10.3%) | 306 (17.3%) |
| $1,000 to $1,499 | 1,044 (18.9%) | 423 (24.0%) |
| $1,500 to $1,999 | 444 (8.1%) | 85 (4.8%) |
| $2,000 to $2,499 | 168 (3.0%) | 23 (1.3%) |
| $2,500 to $2,999 | 71 (1.3%) | 8 (0.4%) |
| $3,000 or more | 74 (1.3%) | 31 (1.8%) |
| Total | 5,512 (100.0%) | 1,765 (100.0%) |
Physical Housing Characteristics in Bosque County
Housing Structures in Bosque County
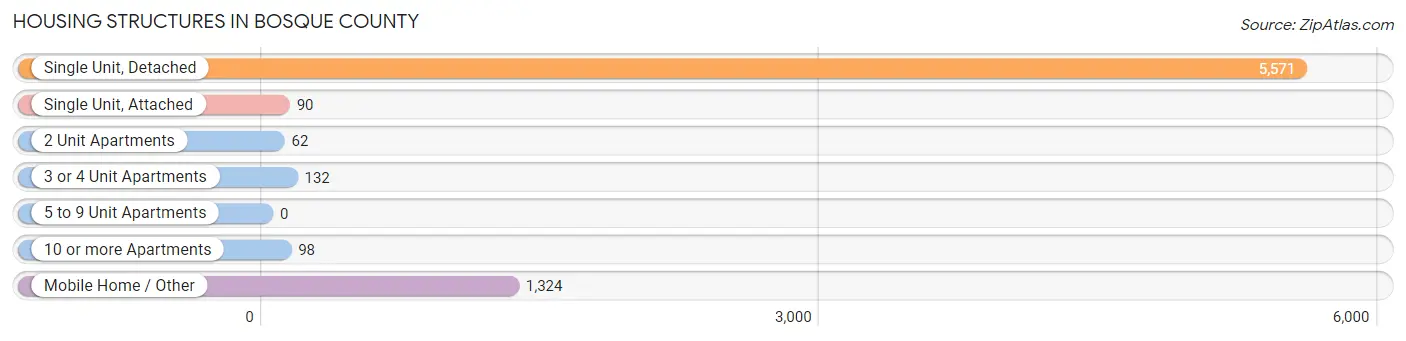
| Structure Type | # Housing Units | % Housing Units |
| Single Unit, Detached | 5,571 | 76.6% |
| Single Unit, Attached | 90 | 1.2% |
| 2 Unit Apartments | 62 | 0.9% |
| 3 or 4 Unit Apartments | 132 | 1.8% |
| 5 to 9 Unit Apartments | 0 | 0.0% |
| 10 or more Apartments | 98 | 1.3% |
| Mobile Home / Other | 1,324 | 18.2% |
| Total | 7,277 | 100.0% |
Housing Structures by Occupancy in Bosque County
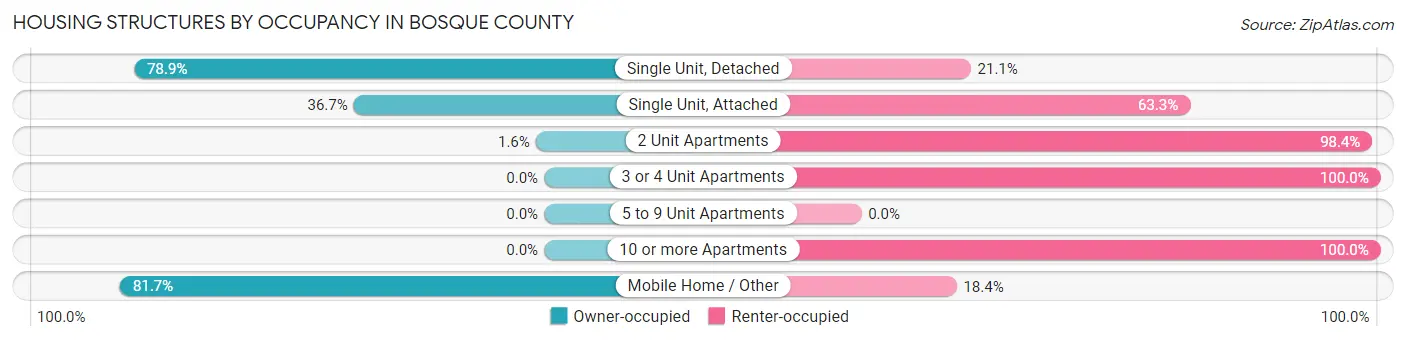
| Structure Type | Owner-occupied | Renter-occupied |
| Single Unit, Detached | 4,397 (78.9%) | 1,174 (21.1%) |
| Single Unit, Attached | 33 (36.7%) | 57 (63.3%) |
| 2 Unit Apartments | 1 (1.6%) | 61 (98.4%) |
| 3 or 4 Unit Apartments | 0 (0.0%) | 132 (100.0%) |
| 5 to 9 Unit Apartments | 0 (0.0%) | 0 (0.0%) |
| 10 or more Apartments | 0 (0.0%) | 98 (100.0%) |
| Mobile Home / Other | 1,081 (81.7%) | 243 (18.3%) |
| Total | 5,512 (75.7%) | 1,765 (24.2%) |
Housing Structures by Number of Rooms in Bosque County
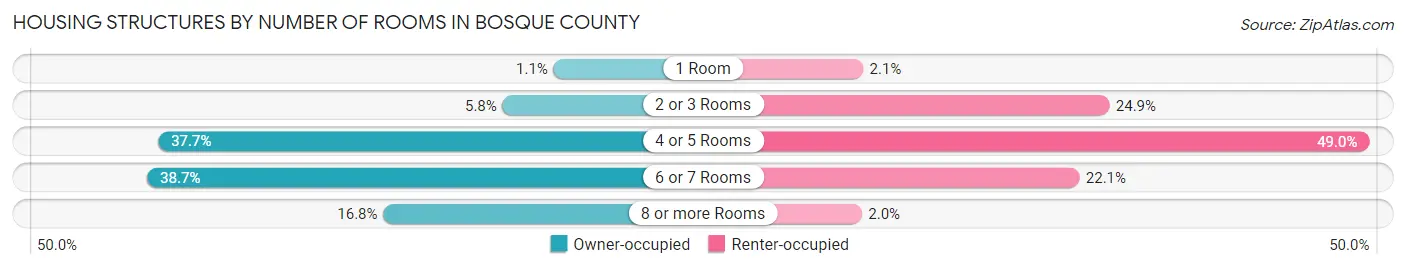
| Number of Rooms | Owner-occupied | Renter-occupied |
| 1 Room | 59 (1.1%) | 37 (2.1%) |
| 2 or 3 Rooms | 319 (5.8%) | 439 (24.9%) |
| 4 or 5 Rooms | 2,076 (37.7%) | 864 (48.9%) |
| 6 or 7 Rooms | 2,131 (38.7%) | 390 (22.1%) |
| 8 or more Rooms | 927 (16.8%) | 35 (2.0%) |
| Total | 5,512 (100.0%) | 1,765 (100.0%) |
Housing Structure by Heating Type in Bosque County
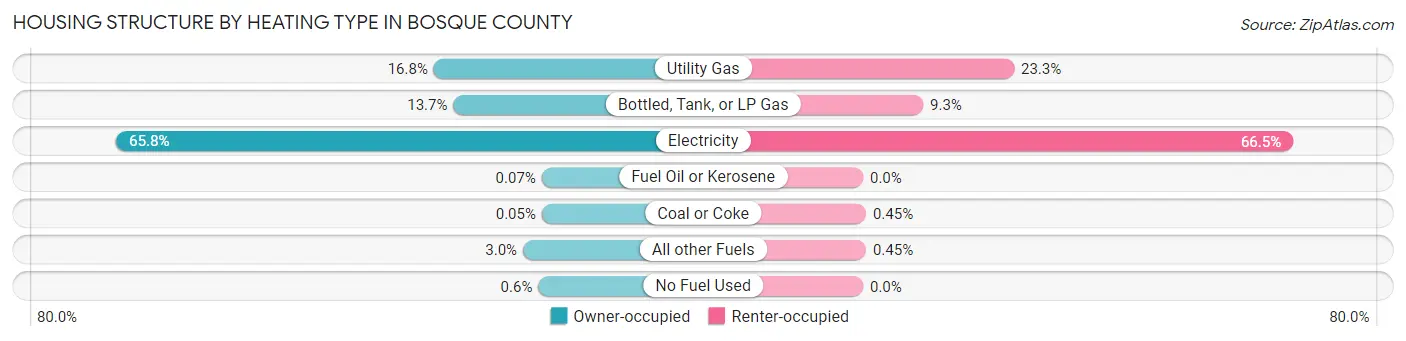
| Heating Type | Owner-occupied | Renter-occupied |
| Utility Gas | 923 (16.8%) | 412 (23.3%) |
| Bottled, Tank, or LP Gas | 757 (13.7%) | 164 (9.3%) |
| Electricity | 3,629 (65.8%) | 1,173 (66.5%) |
| Fuel Oil or Kerosene | 4 (0.1%) | 0 (0.0%) |
| Coal or Coke | 3 (0.1%) | 8 (0.4%) |
| All other Fuels | 163 (3.0%) | 8 (0.4%) |
| No Fuel Used | 33 (0.6%) | 0 (0.0%) |
| Total | 5,512 (100.0%) | 1,765 (100.0%) |
Household Vehicle Usage in Bosque County
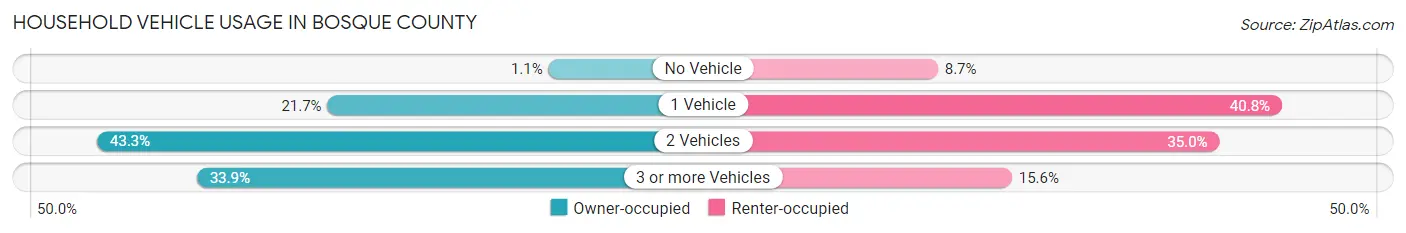
| Vehicles per Household | Owner-occupied | Renter-occupied |
| No Vehicle | 60 (1.1%) | 153 (8.7%) |
| 1 Vehicle | 1,198 (21.7%) | 720 (40.8%) |
| 2 Vehicles | 2,384 (43.2%) | 617 (35.0%) |
| 3 or more Vehicles | 1,870 (33.9%) | 275 (15.6%) |
| Total | 5,512 (100.0%) | 1,765 (100.0%) |
Real Estate & Mortgages in Bosque County
Real Estate and Mortgage Overview in Bosque County
| Characteristic | Without Mortgage | With Mortgage |
| Housing Units | 3,418 | 2,094 |
| Median Property Value | $141,000 | $163,800 |
| Median Household Income | $64,115 | $276 |
| Monthly Housing Costs | $488 | $71 |
| Real Estate Taxes | $1,452 | $182 |
Property Value by Mortgage Status in Bosque County
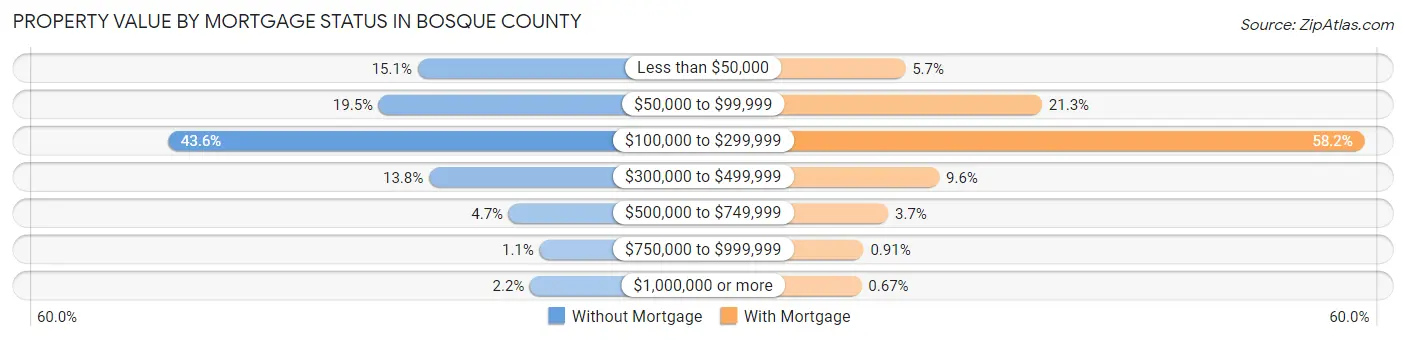
| Property Value | Without Mortgage | With Mortgage |
| Less than $50,000 | 515 (15.1%) | 119 (5.7%) |
| $50,000 to $99,999 | 667 (19.5%) | 446 (21.3%) |
| $100,000 to $299,999 | 1,491 (43.6%) | 1,218 (58.2%) |
| $300,000 to $499,999 | 471 (13.8%) | 200 (9.6%) |
| $500,000 to $749,999 | 159 (4.6%) | 78 (3.7%) |
| $750,000 to $999,999 | 39 (1.1%) | 19 (0.9%) |
| $1,000,000 or more | 76 (2.2%) | 14 (0.7%) |
| Total | 3,418 (100.0%) | 2,094 (100.0%) |
Household Income by Mortgage Status in Bosque County
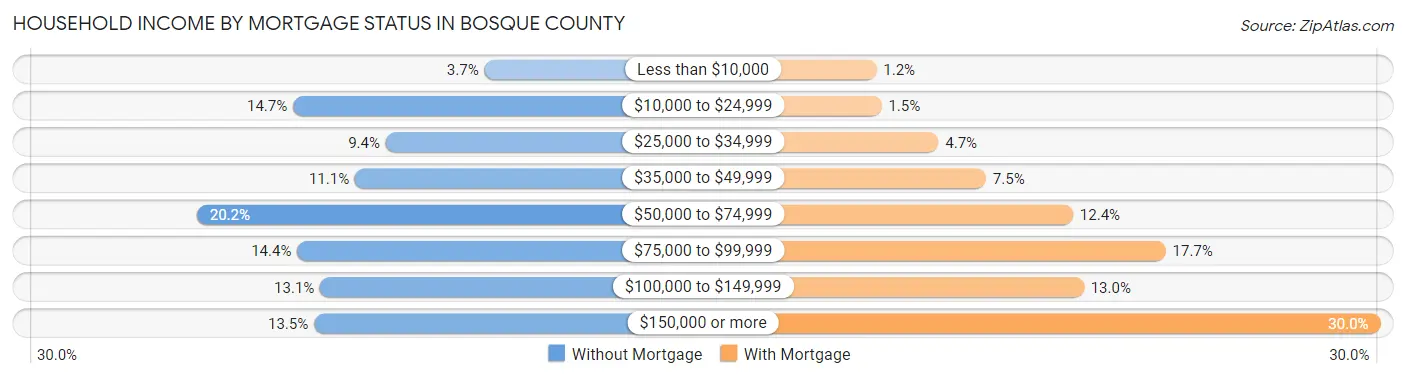
| Household Income | Without Mortgage | With Mortgage |
| Less than $10,000 | 127 (3.7%) | 25 (1.2%) |
| $10,000 to $24,999 | 501 (14.7%) | 31 (1.5%) |
| $25,000 to $34,999 | 320 (9.4%) | 99 (4.7%) |
| $35,000 to $49,999 | 380 (11.1%) | 156 (7.4%) |
| $50,000 to $74,999 | 689 (20.2%) | 260 (12.4%) |
| $75,000 to $99,999 | 493 (14.4%) | 371 (17.7%) |
| $100,000 to $149,999 | 448 (13.1%) | 273 (13.0%) |
| $150,000 or more | 460 (13.5%) | 628 (30.0%) |
| Total | 3,418 (100.0%) | 2,094 (100.0%) |
Property Value to Household Income Ratio in Bosque County
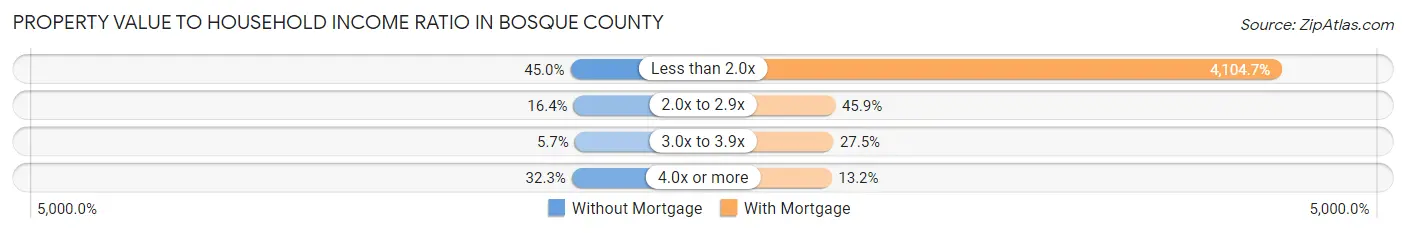
| Value-to-Income Ratio | Without Mortgage | With Mortgage |
| Less than 2.0x | 1,537 (45.0%) | 85,952 (4,104.7%) |
| 2.0x to 2.9x | 560 (16.4%) | 962 (45.9%) |
| 3.0x to 3.9x | 194 (5.7%) | 575 (27.5%) |
| 4.0x or more | 1,104 (32.3%) | 276 (13.2%) |
| Total | 3,418 (100.0%) | 2,094 (100.0%) |
Real Estate Taxes by Mortgage Status in Bosque County
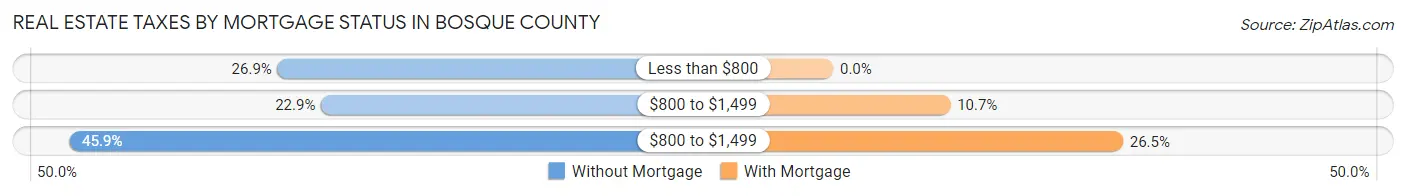
| Property Taxes | Without Mortgage | With Mortgage |
| Less than $800 | 919 (26.9%) | 0 (0.0%) |
| $800 to $1,499 | 783 (22.9%) | 224 (10.7%) |
| $800 to $1,499 | 1,570 (45.9%) | 554 (26.5%) |
| Total | 3,418 (100.0%) | 2,094 (100.0%) |
Health & Disability in Bosque County
Health Insurance Coverage by Age in Bosque County
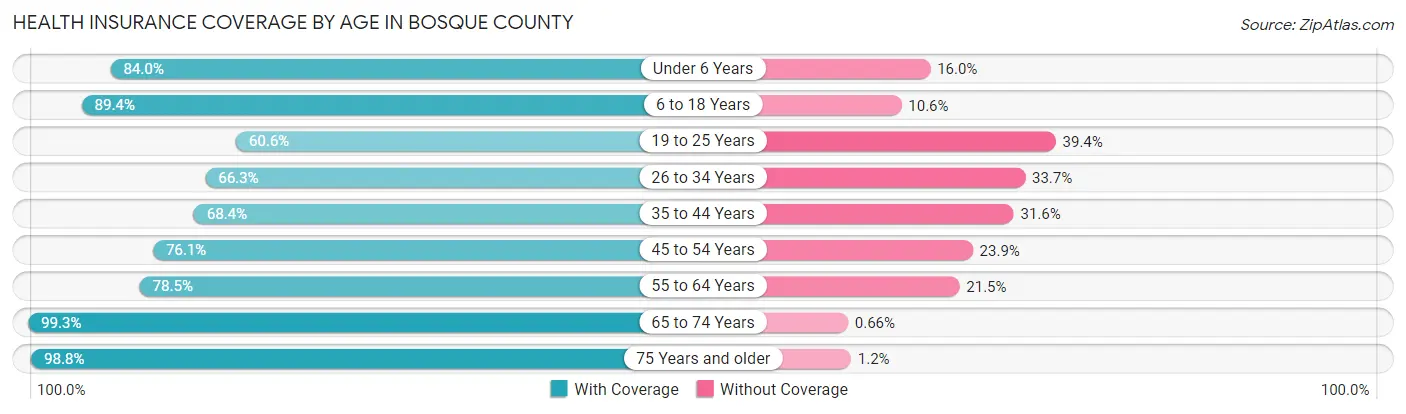
| Age Bracket | With Coverage | Without Coverage |
| Under 6 Years | 912 (84.0%) | 174 (16.0%) |
| 6 to 18 Years | 2,628 (89.4%) | 313 (10.6%) |
| 19 to 25 Years | 704 (60.6%) | 458 (39.4%) |
| 26 to 34 Years | 1,145 (66.3%) | 582 (33.7%) |
| 35 to 44 Years | 1,375 (68.4%) | 634 (31.6%) |
| 45 to 54 Years | 1,573 (76.1%) | 495 (23.9%) |
| 55 to 64 Years | 2,145 (78.5%) | 586 (21.5%) |
| 65 to 74 Years | 2,572 (99.3%) | 17 (0.7%) |
| 75 Years and older | 1,706 (98.8%) | 21 (1.2%) |
| Total | 14,760 (81.8%) | 3,280 (18.2%) |
Health Insurance Coverage by Citizenship Status in Bosque County
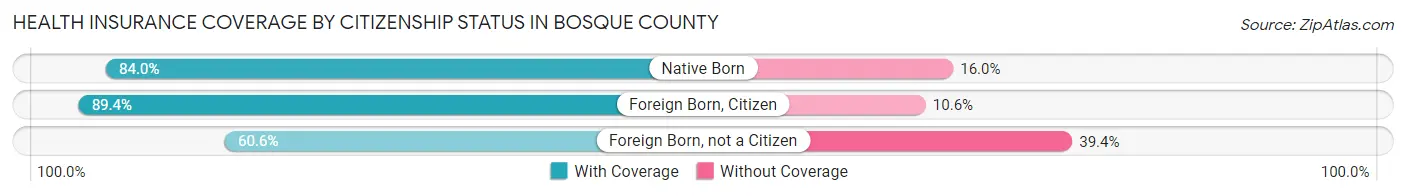
| Citizenship Status | With Coverage | Without Coverage |
| Native Born | 912 (84.0%) | 174 (16.0%) |
| Foreign Born, Citizen | 2,628 (89.4%) | 313 (10.6%) |
| Foreign Born, not a Citizen | 704 (60.6%) | 458 (39.4%) |
Health Insurance Coverage by Household Income in Bosque County
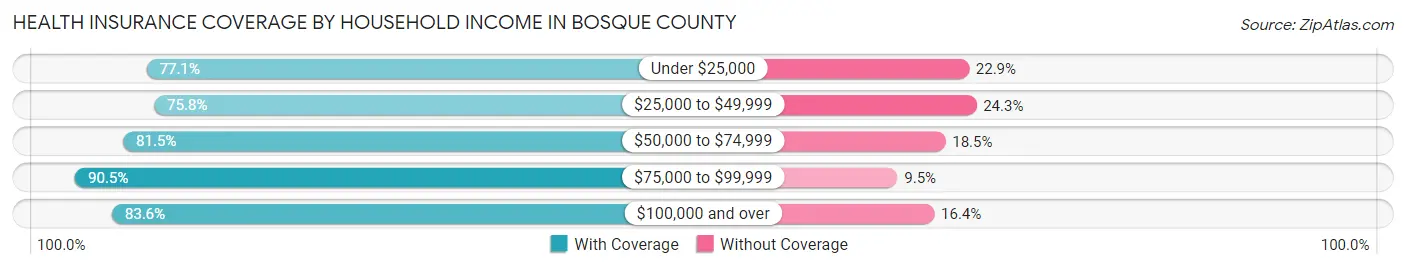
| Household Income | With Coverage | Without Coverage |
| Under $25,000 | 1,224 (77.1%) | 363 (22.9%) |
| $25,000 to $49,999 | 3,143 (75.7%) | 1,006 (24.2%) |
| $50,000 to $74,999 | 2,995 (81.5%) | 678 (18.5%) |
| $75,000 to $99,999 | 2,380 (90.5%) | 249 (9.5%) |
| $100,000 and over | 5,012 (83.6%) | 980 (16.4%) |
Public vs Private Health Insurance Coverage by Age in Bosque County
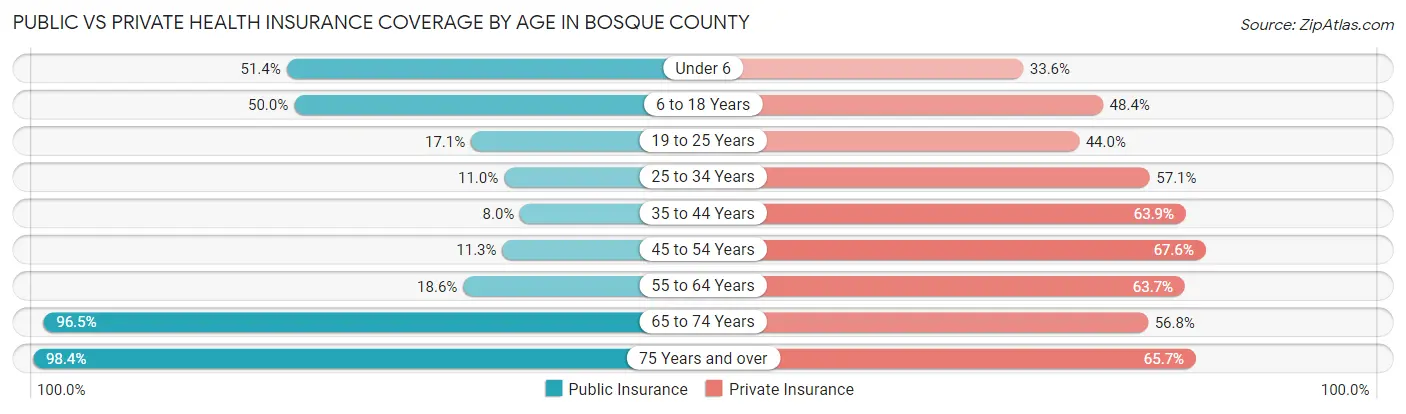
| Age Bracket | Public Insurance | Private Insurance |
| Under 6 | 558 (51.4%) | 365 (33.6%) |
| 6 to 18 Years | 1,470 (50.0%) | 1,424 (48.4%) |
| 19 to 25 Years | 199 (17.1%) | 511 (44.0%) |
| 25 to 34 Years | 190 (11.0%) | 986 (57.1%) |
| 35 to 44 Years | 161 (8.0%) | 1,283 (63.9%) |
| 45 to 54 Years | 234 (11.3%) | 1,397 (67.5%) |
| 55 to 64 Years | 508 (18.6%) | 1,739 (63.7%) |
| 65 to 74 Years | 2,499 (96.5%) | 1,470 (56.8%) |
| 75 Years and over | 1,700 (98.4%) | 1,135 (65.7%) |
| Total | 7,519 (41.7%) | 10,310 (57.2%) |
Disability Status by Sex by Age in Bosque County
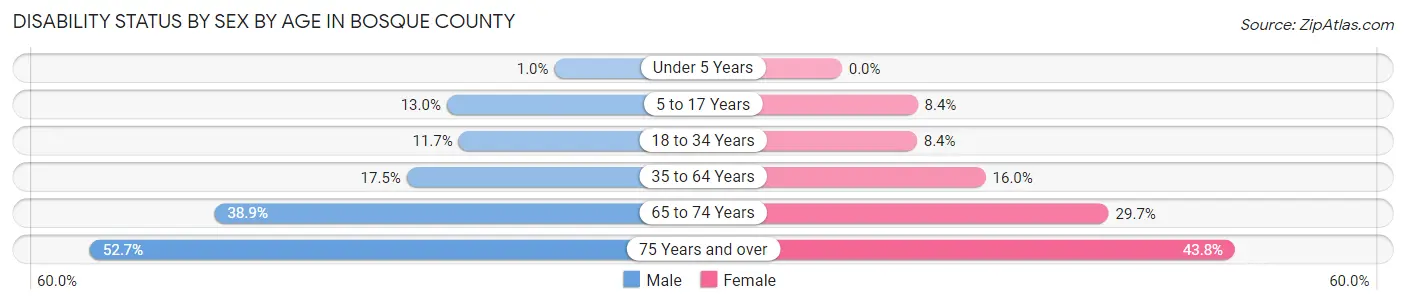
| Age Bracket | Male | Female |
| Under 5 Years | 5 (1.0%) | 0 (0.0%) |
| 5 to 17 Years | 198 (13.0%) | 117 (8.4%) |
| 18 to 34 Years | 179 (11.7%) | 128 (8.4%) |
| 35 to 64 Years | 588 (17.4%) | 551 (16.0%) |
| 65 to 74 Years | 500 (38.9%) | 387 (29.7%) |
| 75 Years and over | 406 (52.7%) | 419 (43.8%) |
Disability Class by Sex by Age in Bosque County
Disability Class: Hearing Difficulty
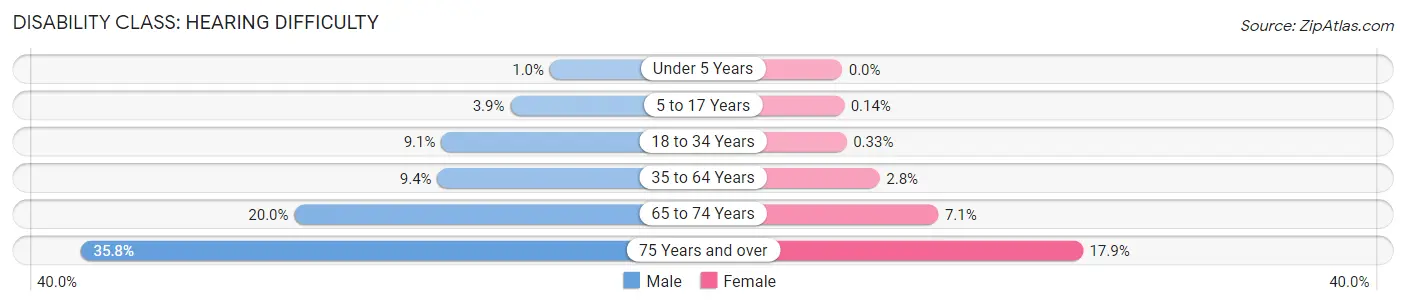
| Age Bracket | Male | Female |
| Under 5 Years | 5 (1.0%) | 0 (0.0%) |
| 5 to 17 Years | 60 (3.9%) | 2 (0.1%) |
| 18 to 34 Years | 139 (9.1%) | 5 (0.3%) |
| 35 to 64 Years | 315 (9.3%) | 96 (2.8%) |
| 65 to 74 Years | 257 (20.0%) | 93 (7.1%) |
| 75 Years and over | 276 (35.8%) | 171 (17.9%) |
Disability Class: Vision Difficulty
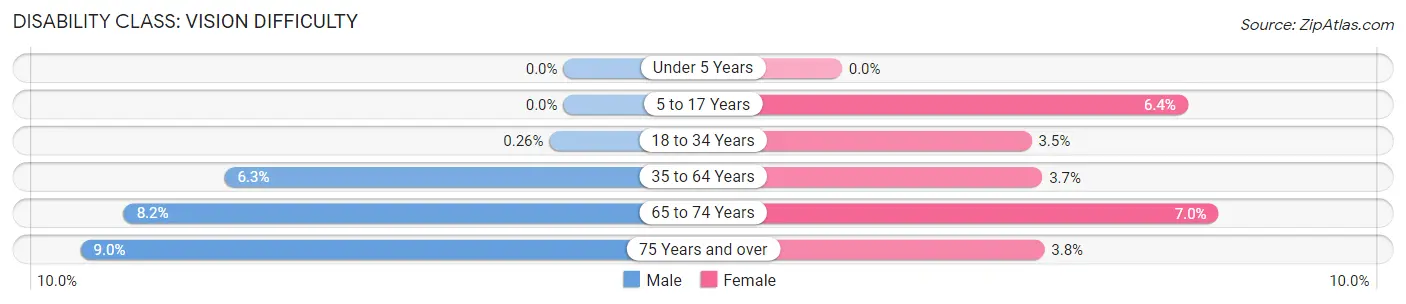
| Age Bracket | Male | Female |
| Under 5 Years | 0 (0.0%) | 0 (0.0%) |
| 5 to 17 Years | 0 (0.0%) | 89 (6.4%) |
| 18 to 34 Years | 4 (0.3%) | 54 (3.5%) |
| 35 to 64 Years | 212 (6.3%) | 128 (3.7%) |
| 65 to 74 Years | 105 (8.2%) | 91 (7.0%) |
| 75 Years and over | 69 (9.0%) | 36 (3.8%) |
Disability Class: Cognitive Difficulty
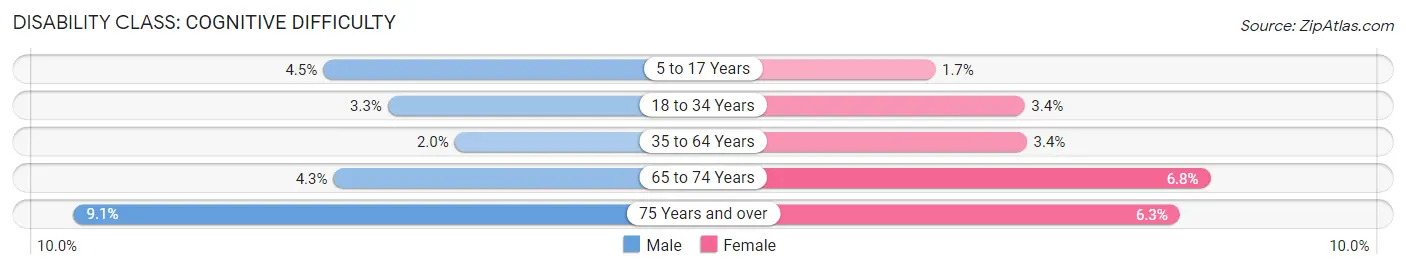
| Age Bracket | Male | Female |
| 5 to 17 Years | 68 (4.5%) | 24 (1.7%) |
| 18 to 34 Years | 50 (3.3%) | 52 (3.4%) |
| 35 to 64 Years | 68 (2.0%) | 118 (3.4%) |
| 65 to 74 Years | 55 (4.3%) | 89 (6.8%) |
| 75 Years and over | 70 (9.1%) | 60 (6.3%) |
Disability Class: Ambulatory Difficulty
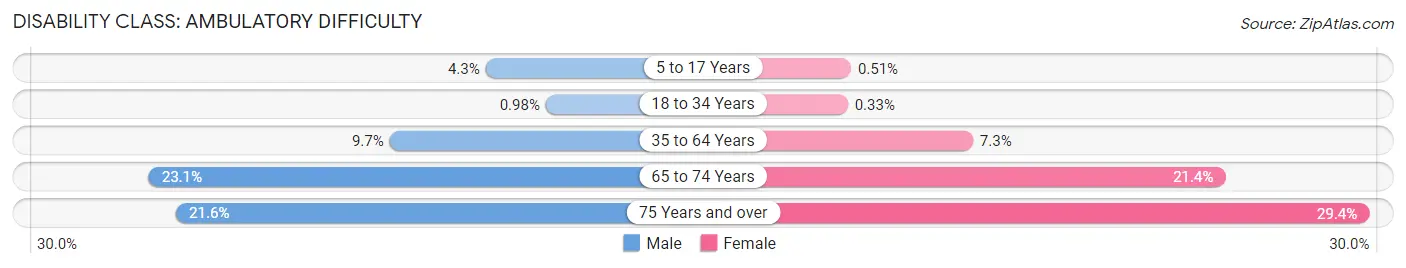
| Age Bracket | Male | Female |
| 5 to 17 Years | 66 (4.3%) | 7 (0.5%) |
| 18 to 34 Years | 15 (1.0%) | 5 (0.3%) |
| 35 to 64 Years | 326 (9.7%) | 251 (7.3%) |
| 65 to 74 Years | 297 (23.1%) | 278 (21.3%) |
| 75 Years and over | 166 (21.6%) | 281 (29.4%) |
Disability Class: Self-Care Difficulty
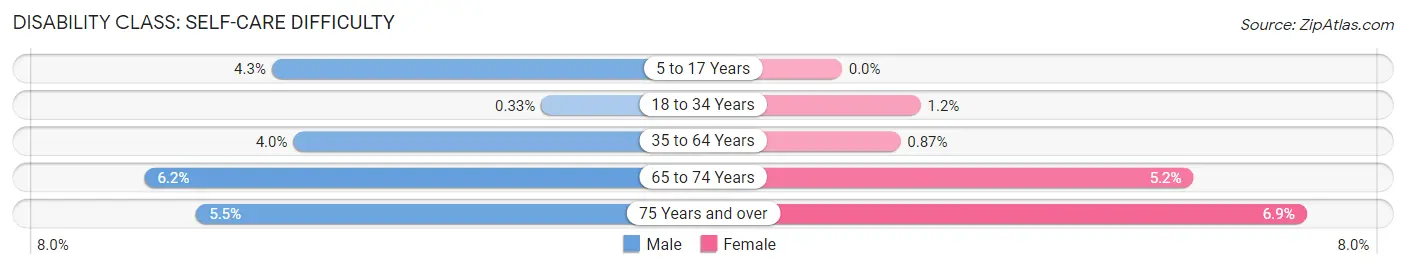
| Age Bracket | Male | Female |
| 5 to 17 Years | 66 (4.3%) | 0 (0.0%) |
| 18 to 34 Years | 5 (0.3%) | 18 (1.2%) |
| 35 to 64 Years | 135 (4.0%) | 30 (0.9%) |
| 65 to 74 Years | 80 (6.2%) | 68 (5.2%) |
| 75 Years and over | 42 (5.4%) | 66 (6.9%) |
Technology Access in Bosque County
Computing Device Access in Bosque County
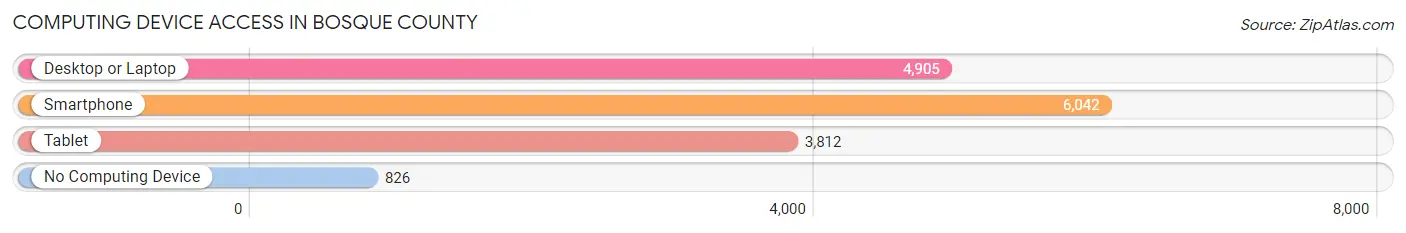
| Device Type | # Households | % Households |
| Desktop or Laptop | 4,905 | 67.4% |
| Smartphone | 6,042 | 83.0% |
| Tablet | 3,812 | 52.4% |
| No Computing Device | 826 | 11.4% |
| Total | 7,277 | 100.0% |
Internet Access in Bosque County
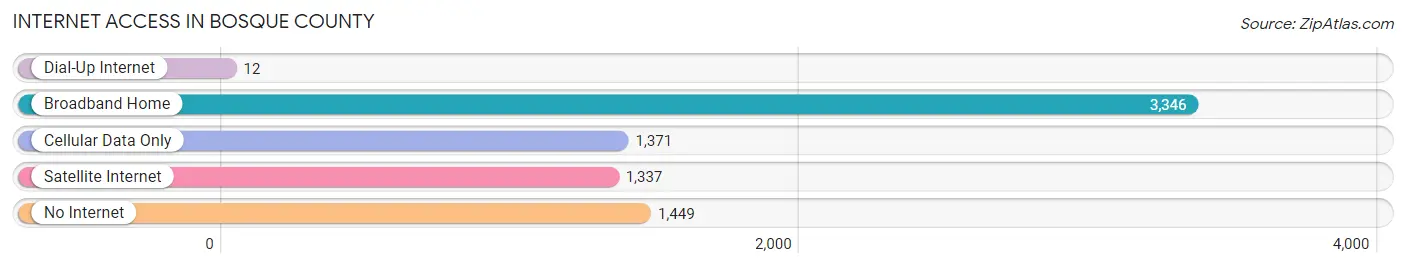
| Internet Type | # Households | % Households |
| Dial-Up Internet | 12 | 0.2% |
| Broadband Home | 3,346 | 46.0% |
| Cellular Data Only | 1,371 | 18.8% |
| Satellite Internet | 1,337 | 18.4% |
| No Internet | 1,449 | 19.9% |
| Total | 7,277 | 100.0% |
Bosque County Summary
Bosque County is located in Central Texas, and is part of the Waco Metropolitan Statistical Area. The county is bordered by Hill County to the north, McLennan County to the east, Coryell County to the south, and Hamilton and Erath counties to the west. The county seat is Meridian, and the largest city is Clifton. As of the 2010 census, the population was 18,212.
History
Bosque County was established in 1854 from land that was formerly part of McLennan County. It was named for the Bosque River, which runs through the county. The county was originally populated by Native Americans, including the Tonkawa, Comanche, and Waco tribes. The first Anglo-American settlers arrived in the area in the 1830s, and the county was organized in 1854.
The county was an important center of the cattle industry in the late 19th century, and the town of Meridian was established in 1856. The county was also home to several large ranches, including the 6666 Ranch, which was founded in 1870.
Geography
Bosque County covers an area of 902 square miles, of which 899 square miles is land and 3 square miles is water. The county is located in Central Texas, and is part of the Waco Metropolitan Statistical Area. The county is bordered by Hill County to the north, McLennan County to the east, Coryell County to the south, and Hamilton and Erath counties to the west.
The county is mostly flat, with some rolling hills in the western part of the county. The Bosque River runs through the county, and there are several small lakes and reservoirs in the area. The county is also home to several state parks, including Lake Whitney State Park and Meridian State Park.
Economy
The economy of Bosque County is largely based on agriculture and ranching. The county is home to several large ranches, including the 6666 Ranch, which is one of the largest ranches in the United States. The county is also home to several small farms, which produce a variety of crops, including cotton, corn, wheat, and hay.
The county is also home to several manufacturing companies, including a steel mill and a paper mill. The county is also home to several oil and gas companies, which are involved in the exploration and production of oil and gas in the area.
Demographics
As of the 2010 census, there were 18,212 people, 6,945 households, and 4,919 families living in the county. The population density was 20.2 people per square mile. There were 7,845 housing units, of which 6,945 were occupied. The racial makeup of the county was 84.3% White, 8.3% Black or African American, 0.7% Native American, 0.4% Asian, 0.1% Pacific Islander, 4.3% from other races, and 1.9% from two or more races. Hispanic or Latino of any race were 11.3% of the population.
The median income for a household in the county was $37,945, and the median income for a family was $45,945. The per capita income for the county was $18,945. About 13.3% of families and 17.2% of the population were below the poverty line, including 22.3% of those under age 18 and 11.7% of those age 65 or over.
Common Questions
What is Per Capita Income in Bosque County?
Per Capita income in Bosque County is $32,990.
What is the Median Family Income in Bosque County?
Median Family Income in Bosque County is $77,047.
What is the Median Household income in Bosque County?
Median Household Income in Bosque County is $63,868.
What is Income or Wage Gap in Bosque County?
Income or Wage Gap in Bosque County is 33.6%.
Women in Bosque County earn 66.4 cents for every dollar earned by a man.
What is Family Income Deficit in Bosque County?
Family Income Deficit in Bosque County is $6,543.
Families that are below poverty line in Bosque County earn $6,543 less on average than the poverty threshold level.
What is Inequality or Gini Index in Bosque County?
Inequality or Gini Index in Bosque County is 0.43.
What is the Total Population of Bosque County?
Total Population of Bosque County is 18,404.
What is the Total Male Population of Bosque County?
Total Male Population of Bosque County is 9,135.
What is the Total Female Population of Bosque County?
Total Female Population of Bosque County is 9,269.
What is the Ratio of Males per 100 Females in Bosque County?
There are 98.55 Males per 100 Females in Bosque County.
What is the Ratio of Females per 100 Males in Bosque County?
There are 101.47 Females per 100 Males in Bosque County.
What is the Median Population Age in Bosque County?
Median Population Age in Bosque County is 46.1 Years.
What is the Average Family Size in Bosque County
Average Family Size in Bosque County is 3.0 People.
What is the Average Household Size in Bosque County
Average Household Size in Bosque County is 2.5 People.
How Large is the Labor Force in Bosque County?
There are 8,028 People in the Labor Forcein in Bosque County.
What is the Percentage of People in the Labor Force in Bosque County?
53.6% of People are in the Labor Force in Bosque County.
What is the Unemployment Rate in Bosque County?
Unemployment Rate in Bosque County is 3.9%.