Borden County, TX Map & Demographics
Borden County Map
Borden County Overview
$39,276
PER CAPITA INCOME
$82,222
AVG FAMILY INCOME
$80,625
AVG HOUSEHOLD INCOME
47.7%
WAGE / INCOME GAP [ % ]
52.3¢/ $1
WAGE / INCOME GAP [ $ ]
0.46
INEQUALITY / GINI INDEX
686
TOTAL POPULATION
301
MALE POPULATION
385
FEMALE POPULATION
78.18
MALES / 100 FEMALES
127.91
FEMALES / 100 MALES
36.5
MEDIAN AGE
3.5
AVG FAMILY SIZE
3.2
AVG HOUSEHOLD SIZE
284
LABOR FORCE [ PEOPLE ]
57.5%
PERCENT IN LABOR FORCE
1.8%
UNEMPLOYMENT RATE
Borden County Area Codes
Income in Borden County
Income Overview in Borden County
Per Capita Income in Borden County is $39,276, while median incomes of families and households are $82,222 and $80,625 respectively.
| Characteristic | Number | Measure |
| Per Capita Income | 686 | $39,276 |
| Median Family Income | 188 | $82,222 |
| Mean Family Income | 188 | $118,065 |
| Median Household Income | 215 | $80,625 |
| Mean Household Income | 215 | $122,340 |
| Income Deficit | 188 | $0 |
| Wage / Income Gap (%) | 686 | 47.74% |
| Wage / Income Gap ($) | 686 | 52.26¢ per $1 |
| Gini / Inequality Index | 686 | 0.46 |
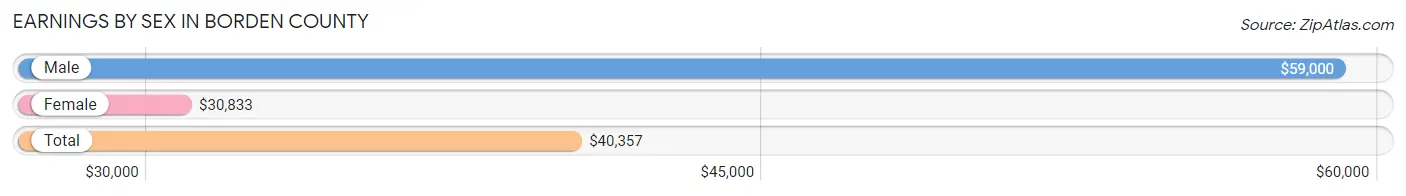
Earnings by Sex in Borden County
Average Earnings in Borden County are $40,357, $59,000 for men and $30,833 for women, a difference of 47.7%.
| Sex | Number | Average Earnings |
| Male | 182 (58.3%) | $59,000 |
| Female | 130 (41.7%) | $30,833 |
| Total | 312 (100.0%) | $40,357 |
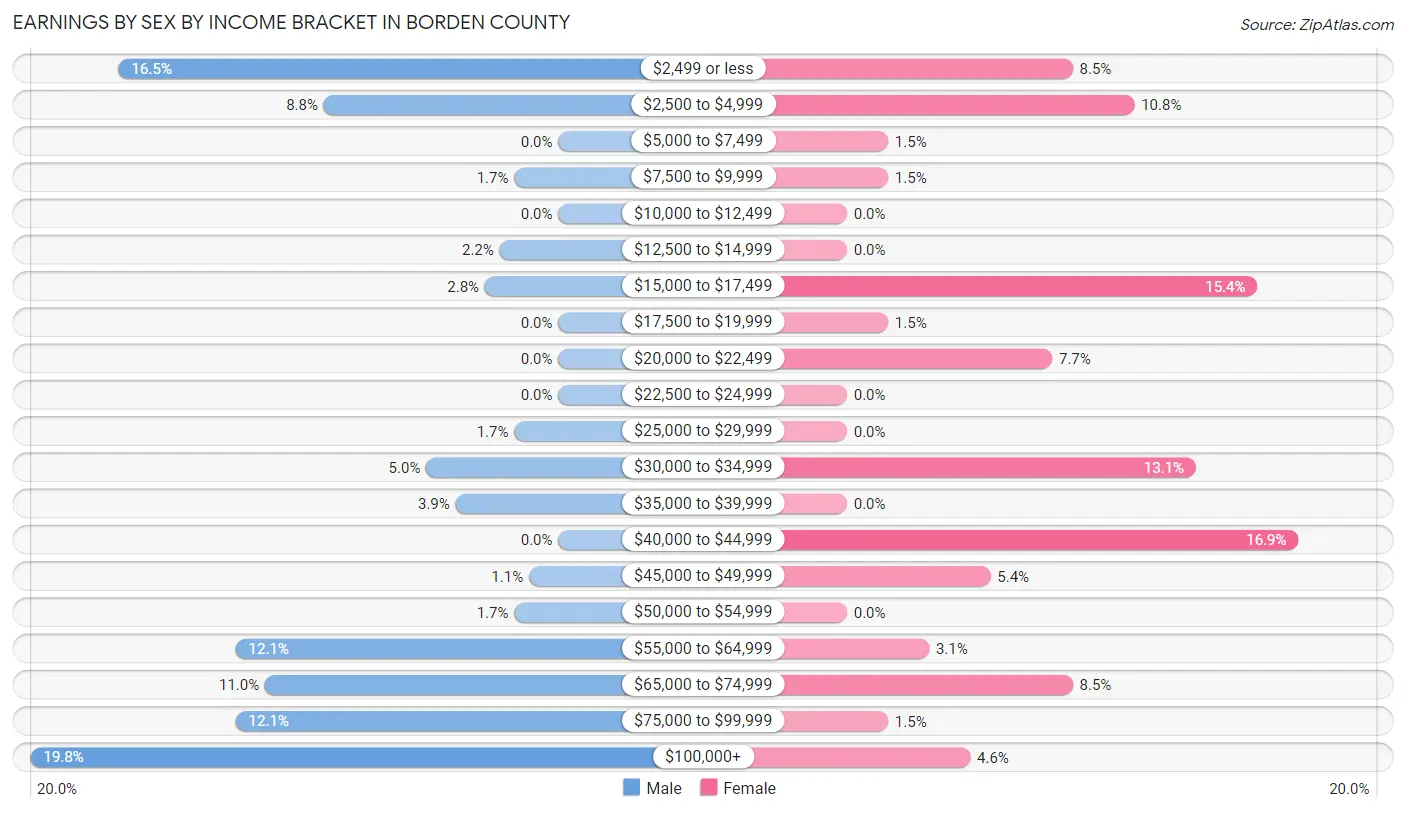
Earnings by Sex by Income Bracket in Borden County
The most common earnings brackets in Borden County are $100,000+ for men (36 | 19.8%) and $40,000 to $44,999 for women (22 | 16.9%).
| Income | Male | Female |
| $2,499 or less | 30 (16.5%) | 11 (8.5%) |
| $2,500 to $4,999 | 16 (8.8%) | 14 (10.8%) |
| $5,000 to $7,499 | 0 (0.0%) | 2 (1.5%) |
| $7,500 to $9,999 | 3 (1.7%) | 2 (1.5%) |
| $10,000 to $12,499 | 0 (0.0%) | 0 (0.0%) |
| $12,500 to $14,999 | 4 (2.2%) | 0 (0.0%) |
| $15,000 to $17,499 | 5 (2.8%) | 20 (15.4%) |
| $17,500 to $19,999 | 0 (0.0%) | 2 (1.5%) |
| $20,000 to $22,499 | 0 (0.0%) | 10 (7.7%) |
| $22,500 to $24,999 | 0 (0.0%) | 0 (0.0%) |
| $25,000 to $29,999 | 3 (1.7%) | 0 (0.0%) |
| $30,000 to $34,999 | 9 (5.0%) | 17 (13.1%) |
| $35,000 to $39,999 | 7 (3.8%) | 0 (0.0%) |
| $40,000 to $44,999 | 0 (0.0%) | 22 (16.9%) |
| $45,000 to $49,999 | 2 (1.1%) | 7 (5.4%) |
| $50,000 to $54,999 | 3 (1.7%) | 0 (0.0%) |
| $55,000 to $64,999 | 22 (12.1%) | 4 (3.1%) |
| $65,000 to $74,999 | 20 (11.0%) | 11 (8.5%) |
| $75,000 to $99,999 | 22 (12.1%) | 2 (1.5%) |
| $100,000+ | 36 (19.8%) | 6 (4.6%) |
| Total | 182 (100.0%) | 130 (100.0%) |
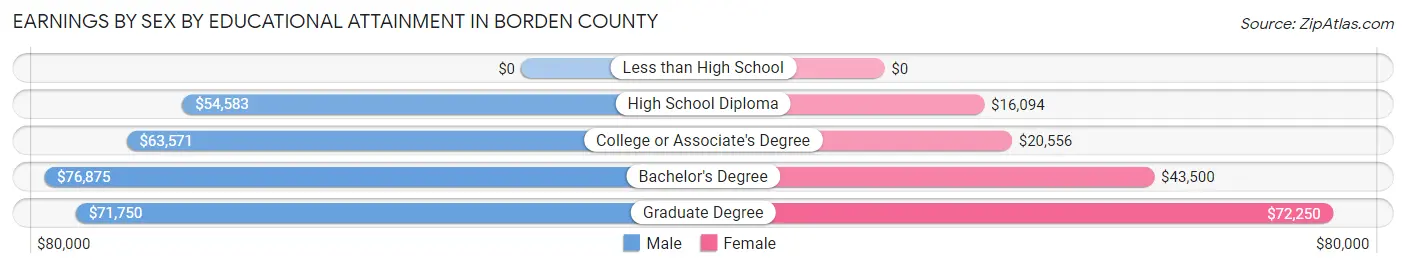
Earnings by Sex by Educational Attainment in Borden County
Average earnings in Borden County are $64,286 for men and $31,979 for women, a difference of 50.3%. Men with an educational attainment of bachelor's degree enjoy the highest average annual earnings of $76,875, while those with high school diploma education earn the least with $54,583. Women with an educational attainment of graduate degree earn the most with the average annual earnings of $72,250, while those with high school diploma education have the smallest earnings of $16,094.
| Educational Attainment | Male Income | Female Income |
| Less than High School | - | - |
| High School Diploma | $54,583 | $16,094 |
| College or Associate's Degree | $63,571 | $20,556 |
| Bachelor's Degree | $76,875 | $43,500 |
| Graduate Degree | $71,750 | $72,250 |
| Total | $64,286 | $31,979 |
Family Income in Borden County
Family Income Brackets in Borden County
According to the Borden County family income data, there are 59 families falling into the $100,000 to $149,999 income range, which is the most common income bracket and makes up 31.4% of all families.
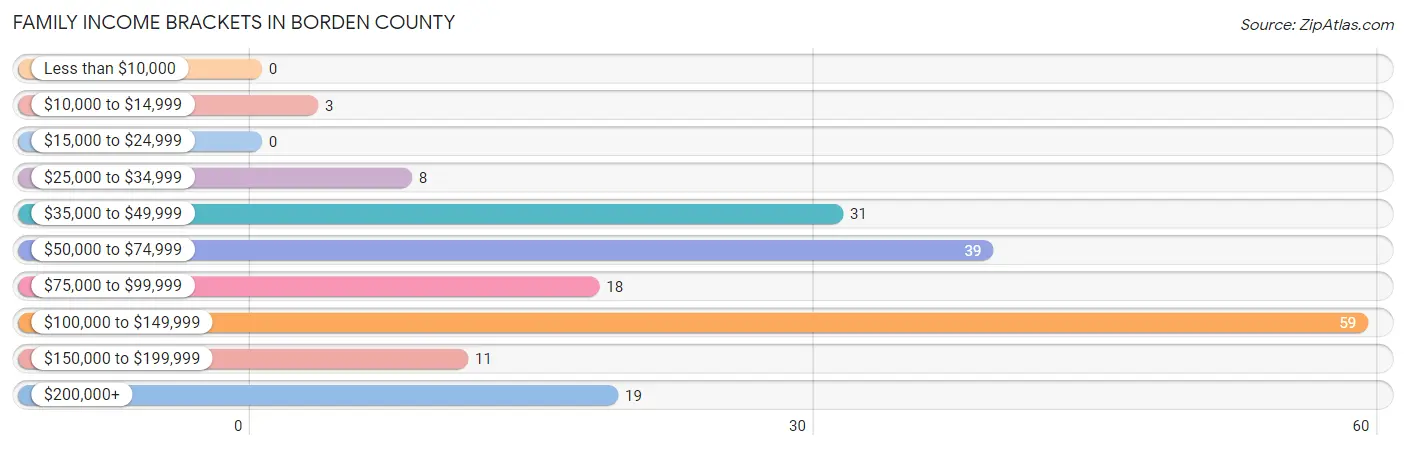
| Income Bracket | # Families | % Families |
| Less than $10,000 | 0 | 0.0% |
| $10,000 to $14,999 | 3 | 1.6% |
| $15,000 to $24,999 | 0 | 0.0% |
| $25,000 to $34,999 | 8 | 4.3% |
| $35,000 to $49,999 | 31 | 16.5% |
| $50,000 to $74,999 | 39 | 20.7% |
| $75,000 to $99,999 | 18 | 9.6% |
| $100,000 to $149,999 | 59 | 31.4% |
| $150,000 to $199,999 | 11 | 5.9% |
| $200,000+ | 19 | 10.1% |
Family Income by Famaliy Size in Borden County
5-person families (16 | 8.5%) account for the highest median family income in Borden County with $141,500 per family, while 2-person families (99 | 52.7%) have the highest median income of $39,875 per family member.
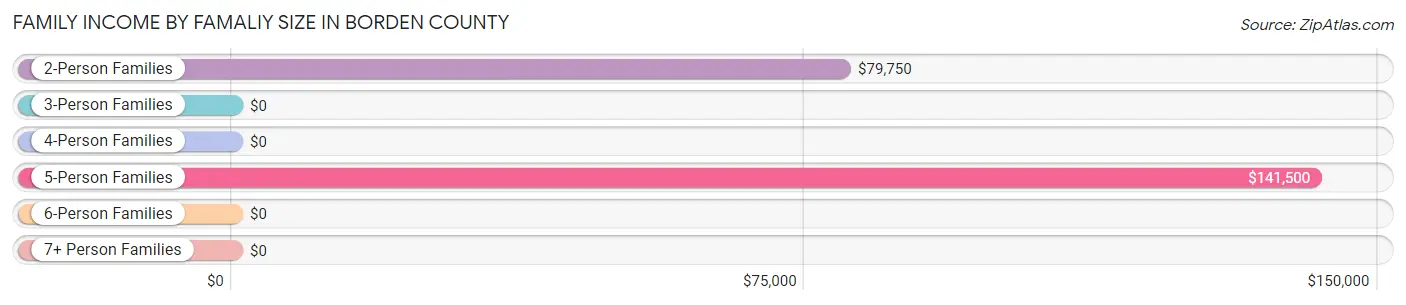
| Income Bracket | # Families | Median Income |
| 2-Person Families | 99 (52.7%) | $79,750 |
| 3-Person Families | 17 (9.0%) | $0 |
| 4-Person Families | 43 (22.9%) | $0 |
| 5-Person Families | 16 (8.5%) | $141,500 |
| 6-Person Families | 13 (6.9%) | $0 |
| 7+ Person Families | 0 (0.0%) | $0 |
| Total | 188 (100.0%) | $82,222 |
Family Income by Number of Earners in Borden County
The median family income in Borden County is $82,222, with families comprising 3+ earners (20) having the highest median family income of $150,500, while families with no earners (31) have the lowest median family income of $66,750, accounting for 10.6% and 16.5% of families, respectively.
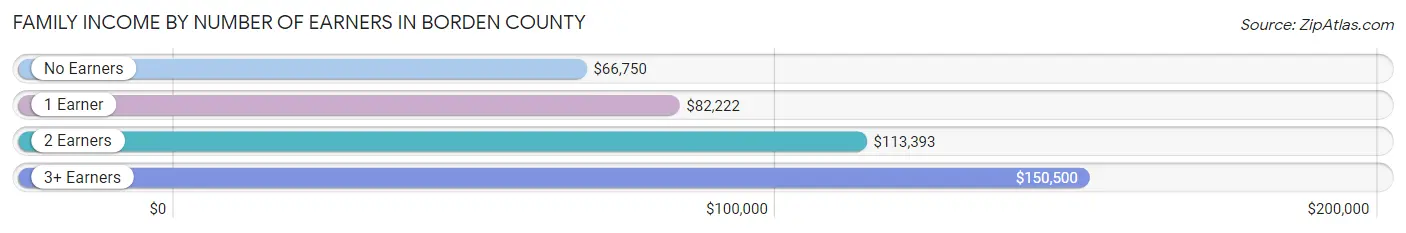
| Number of Earners | # Families | Median Income |
| No Earners | 31 (16.5%) | $66,750 |
| 1 Earner | 72 (38.3%) | $82,222 |
| 2 Earners | 65 (34.6%) | $113,393 |
| 3+ Earners | 20 (10.6%) | $150,500 |
| Total | 188 (100.0%) | $82,222 |
Household Income in Borden County
Household Income Brackets in Borden County
With 59 households falling in the category, the $100,000 to $149,999 income range is the most frequent in Borden County, accounting for 27.4% of all households. In contrast, only 1 households (0.5%) fall into the less than $10,000 income bracket, making it the least populous group.
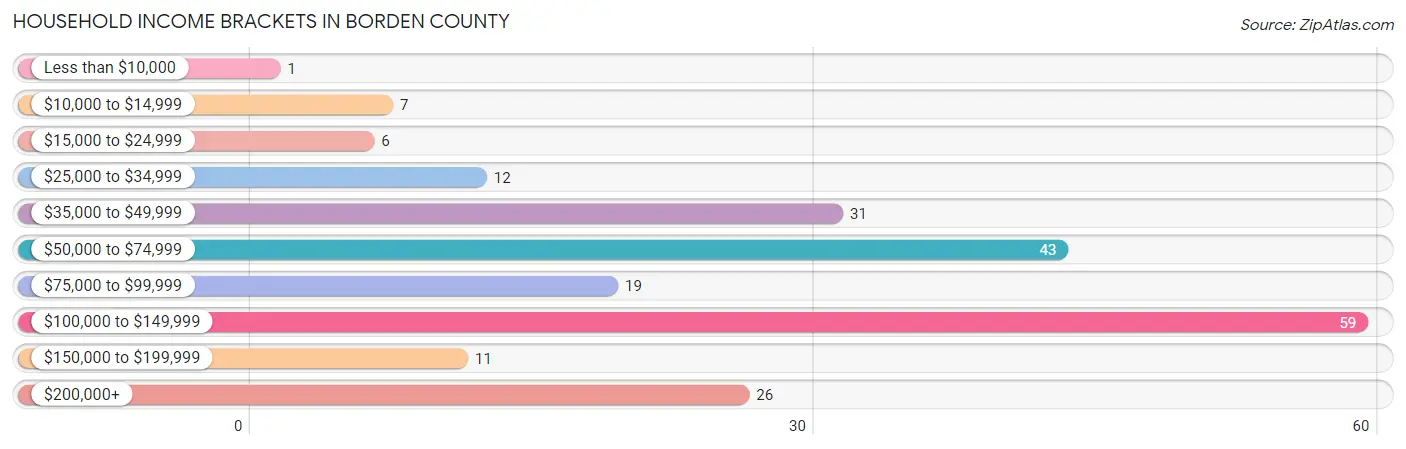
| Income Bracket | # Households | % Households |
| Less than $10,000 | 1 | 0.5% |
| $10,000 to $14,999 | 7 | 3.3% |
| $15,000 to $24,999 | 6 | 2.8% |
| $25,000 to $34,999 | 12 | 5.6% |
| $35,000 to $49,999 | 31 | 14.4% |
| $50,000 to $74,999 | 43 | 20.0% |
| $75,000 to $99,999 | 19 | 8.8% |
| $100,000 to $149,999 | 59 | 27.4% |
| $150,000 to $199,999 | 11 | 5.1% |
| $200,000+ | 26 | 12.1% |
Household Income by Householder Age in Borden County
The median household income in Borden County is $80,625, with the highest median household income of $111,625 found in the 45 to 64 years age bracket for the primary householder. A total of 77 households (35.8%) fall into this category.
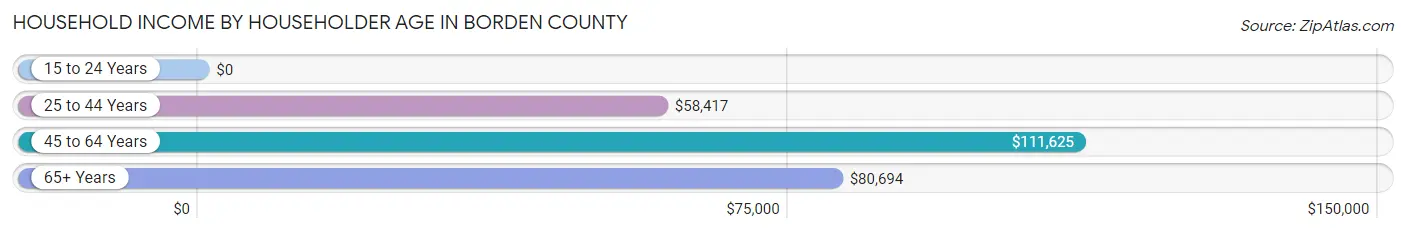
| Income Bracket | # Households | Median Income |
| 15 to 24 Years | 0 (0.0%) | $0 |
| 25 to 44 Years | 69 (32.1%) | $58,417 |
| 45 to 64 Years | 77 (35.8%) | $111,625 |
| 65+ Years | 69 (32.1%) | $80,694 |
| Total | 215 (100.0%) | $80,625 |
Poverty in Borden County
Income Below Poverty by Sex and Age in Borden County
With 3.3% poverty level for males and 0.3% for females among the residents of Borden County, 65 to 74 year old males and 75 year old and over females are the most vulnerable to poverty, with 3 males (8.8%) and 1 females (10.0%) in their respective age groups living below the poverty level.
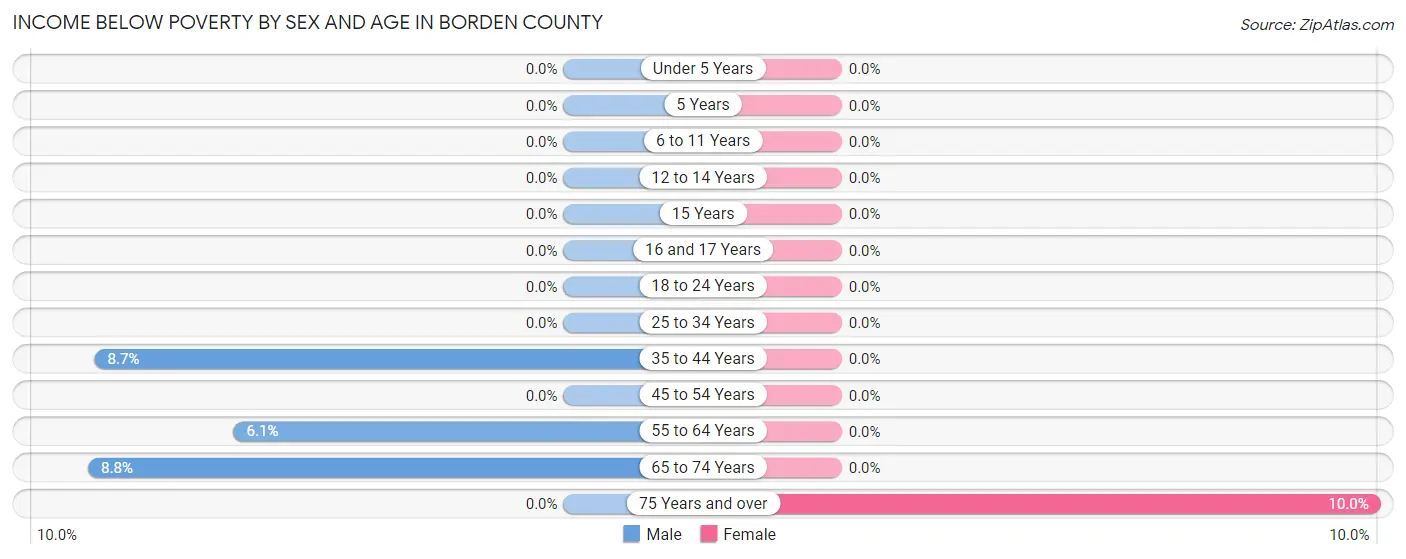
| Age Bracket | Male | Female |
| Under 5 Years | 0 (0.0%) | 0 (0.0%) |
| 5 Years | 0 (0.0%) | 0 (0.0%) |
| 6 to 11 Years | 0 (0.0%) | 0 (0.0%) |
| 12 to 14 Years | 0 (0.0%) | 0 (0.0%) |
| 15 Years | 0 (0.0%) | 0 (0.0%) |
| 16 and 17 Years | 0 (0.0%) | 0 (0.0%) |
| 18 to 24 Years | 0 (0.0%) | 0 (0.0%) |
| 25 to 34 Years | 0 (0.0%) | 0 (0.0%) |
| 35 to 44 Years | 4 (8.7%) | 0 (0.0%) |
| 45 to 54 Years | 0 (0.0%) | 0 (0.0%) |
| 55 to 64 Years | 3 (6.1%) | 0 (0.0%) |
| 65 to 74 Years | 3 (8.8%) | 0 (0.0%) |
| 75 Years and over | 0 (0.0%) | 1 (10.0%) |
| Total | 10 (3.3%) | 1 (0.3%) |
Income Above Poverty by Sex and Age in Borden County
According to the poverty statistics in Borden County, males aged under 5 years and females aged under 5 years are the age groups that are most secure financially, with 100.0% of males and 100.0% of females in these age groups living above the poverty line.
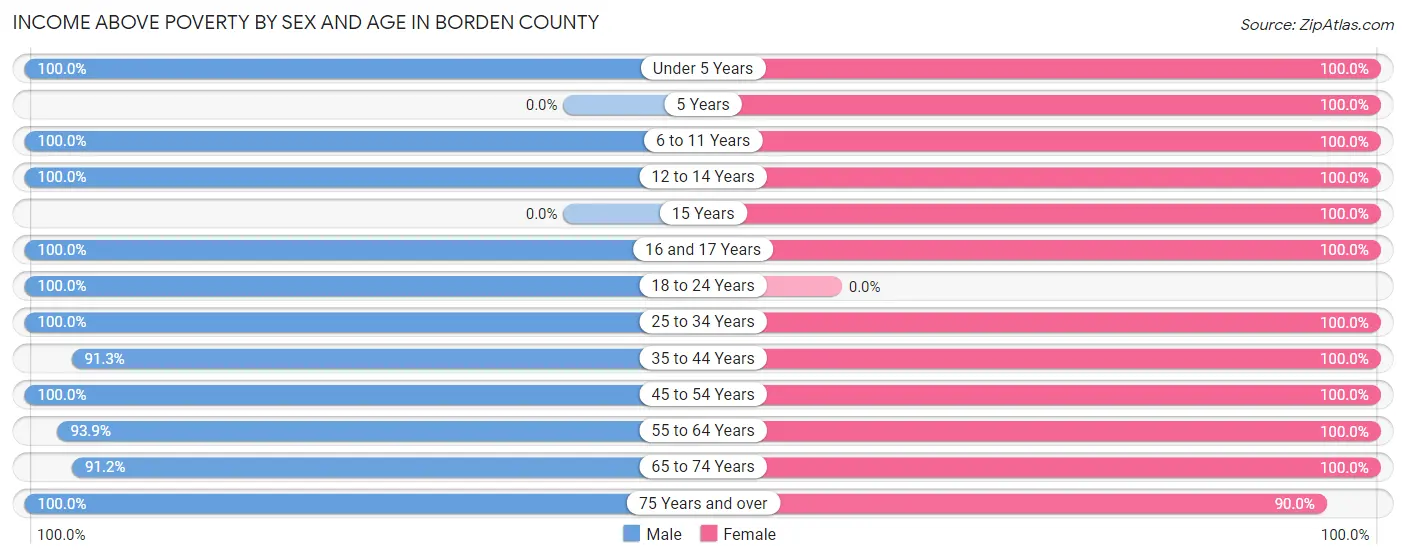
| Age Bracket | Male | Female |
| Under 5 Years | 8 (100.0%) | 52 (100.0%) |
| 5 Years | 0 (0.0%) | 16 (100.0%) |
| 6 to 11 Years | 46 (100.0%) | 28 (100.0%) |
| 12 to 14 Years | 14 (100.0%) | 19 (100.0%) |
| 15 Years | 0 (0.0%) | 9 (100.0%) |
| 16 and 17 Years | 10 (100.0%) | 33 (100.0%) |
| 18 to 24 Years | 12 (100.0%) | 0 (0.0%) |
| 25 to 34 Years | 25 (100.0%) | 43 (100.0%) |
| 35 to 44 Years | 42 (91.3%) | 40 (100.0%) |
| 45 to 54 Years | 28 (100.0%) | 60 (100.0%) |
| 55 to 64 Years | 46 (93.9%) | 22 (100.0%) |
| 65 to 74 Years | 31 (91.2%) | 53 (100.0%) |
| 75 Years and over | 29 (100.0%) | 9 (90.0%) |
| Total | 291 (96.7%) | 384 (99.7%) |
Income Below Poverty Among Married-Couple Families in Borden County
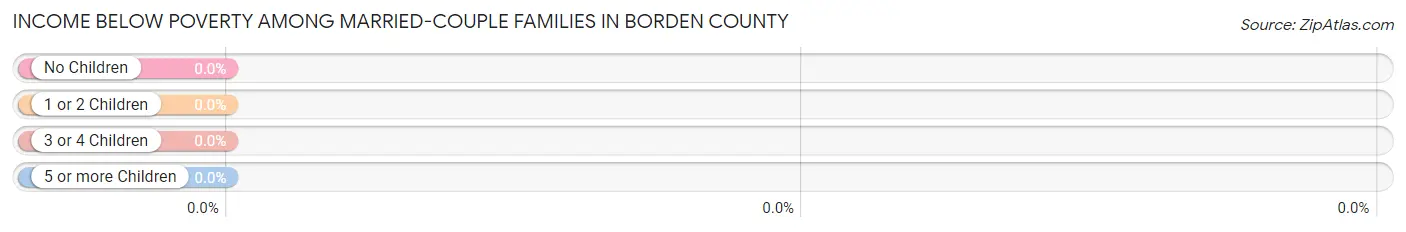
| Children | Above Poverty | Below Poverty |
| No Children | 96 (100.0%) | 0 (0.0%) |
| 1 or 2 Children | 68 (100.0%) | 0 (0.0%) |
| 3 or 4 Children | 18 (100.0%) | 0 (0.0%) |
| 5 or more Children | 0 (0.0%) | 0 (0.0%) |
| Total | 182 (100.0%) | 0 (0.0%) |
Income Below Poverty Among Single-Parent Households in Borden County
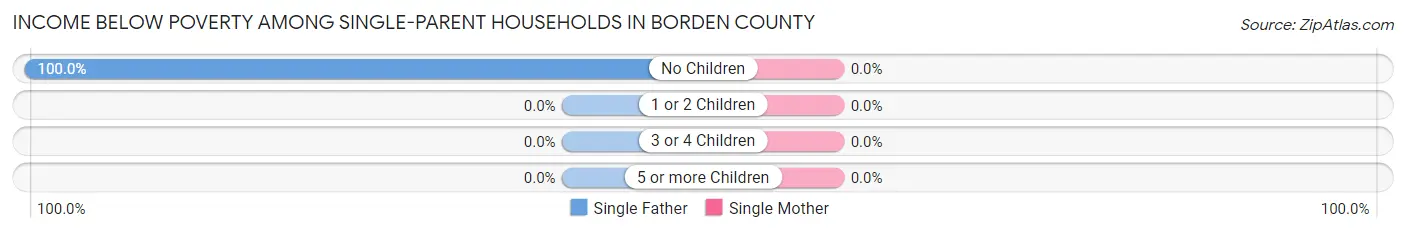
| Children | Single Father | Single Mother |
| No Children | 3 (100.0%) | 0 (0.0%) |
| 1 or 2 Children | 0 (0.0%) | 0 (0.0%) |
| 3 or 4 Children | 0 (0.0%) | 0 (0.0%) |
| 5 or more Children | 0 (0.0%) | 0 (0.0%) |
| Total | 3 (100.0%) | 0 (0.0%) |
Income Below Poverty Among Married-Couple vs Single-Parent Households in Borden County
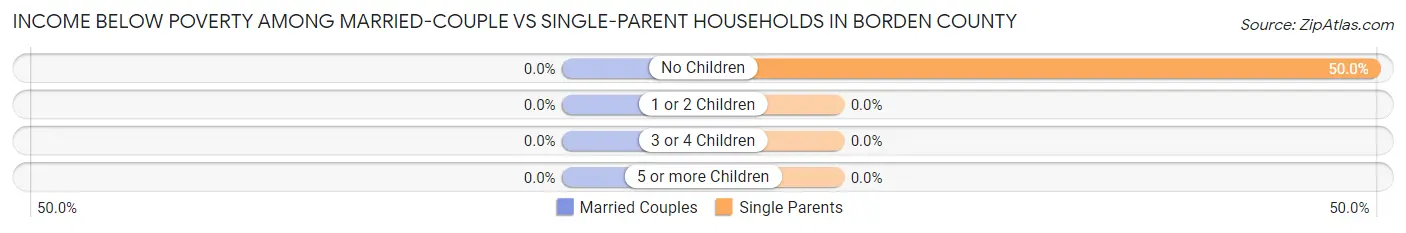
| Children | Married-Couple Families | Single-Parent Households |
| No Children | 0 (0.0%) | 3 (50.0%) |
| 1 or 2 Children | 0 (0.0%) | 0 (0.0%) |
| 3 or 4 Children | 0 (0.0%) | 0 (0.0%) |
| 5 or more Children | 0 (0.0%) | 0 (0.0%) |
| Total | 0 (0.0%) | 3 (50.0%) |
Race in Borden County
The most populous races in Borden County are White / Caucasian (601 | 87.6%), Two or more Races (67 | 9.8%), and Hispanic or Latino (52 | 7.6%).
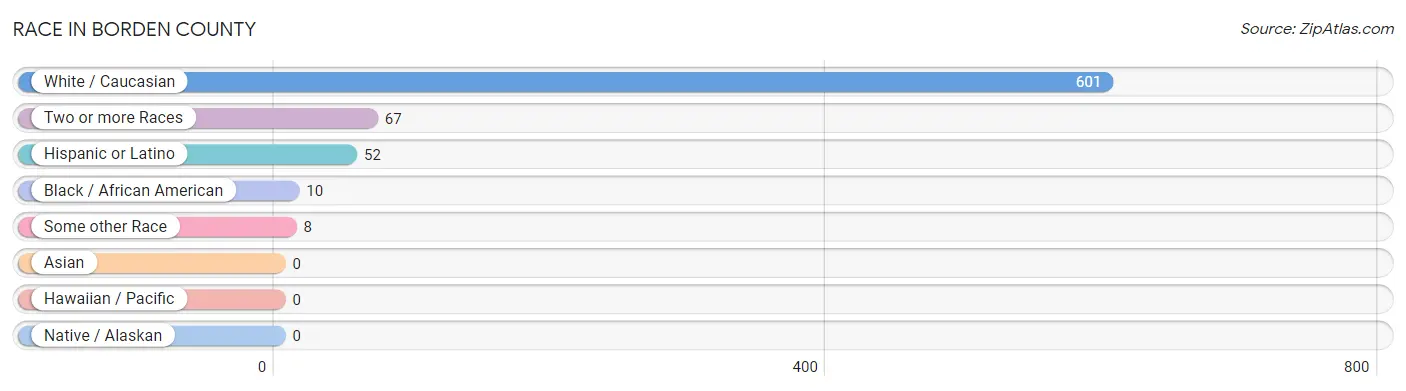
| Race | # Population | % Population |
| Asian | 0 | 0.0% |
| Black / African American | 10 | 1.5% |
| Hawaiian / Pacific | 0 | 0.0% |
| Hispanic or Latino | 52 | 7.6% |
| Native / Alaskan | 0 | 0.0% |
| White / Caucasian | 601 | 87.6% |
| Two or more Races | 67 | 9.8% |
| Some other Race | 8 | 1.2% |
| Total | 686 | 100.0% |
Ancestry in Borden County
The most populous ancestries reported in Borden County are English (121 | 17.6%), American (89 | 13.0%), Irish (74 | 10.8%), German (73 | 10.6%), and Mexican (52 | 7.6%), together accounting for 59.6% of all Borden County residents.
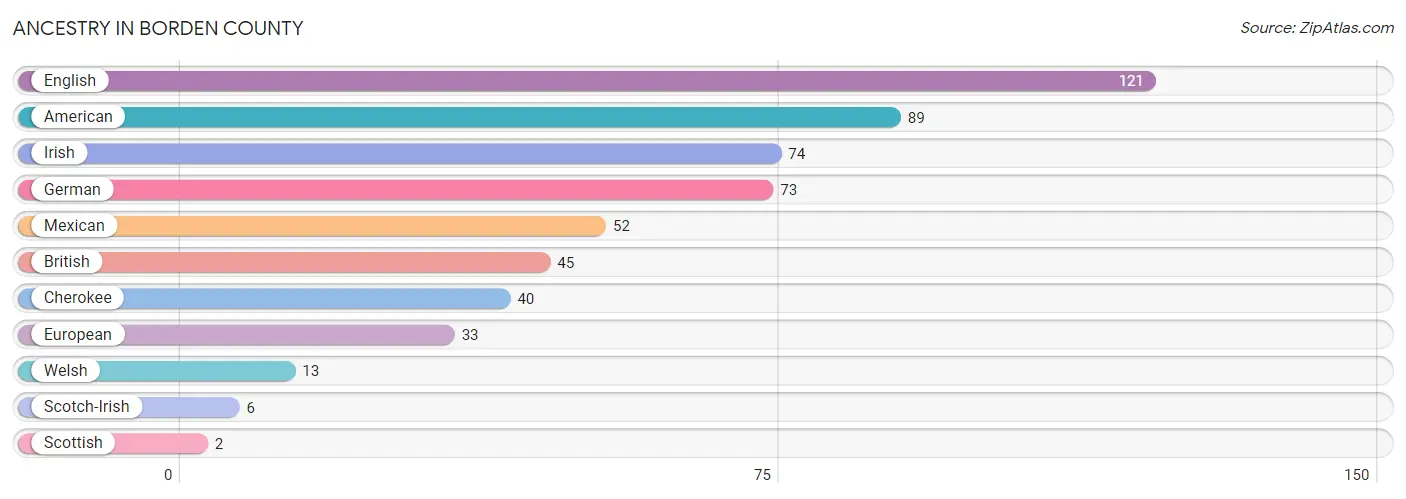
| Ancestry | # Population | % Population |
| American | 89 | 13.0% |
| British | 45 | 6.6% |
| Cherokee | 40 | 5.8% |
| English | 121 | 17.6% |
| European | 33 | 4.8% |
| German | 73 | 10.6% |
| Irish | 74 | 10.8% |
| Mexican | 52 | 7.6% |
| Scotch-Irish | 6 | 0.9% |
| Scottish | 2 | 0.3% |
| Welsh | 13 | 1.9% | View All 11 Rows |
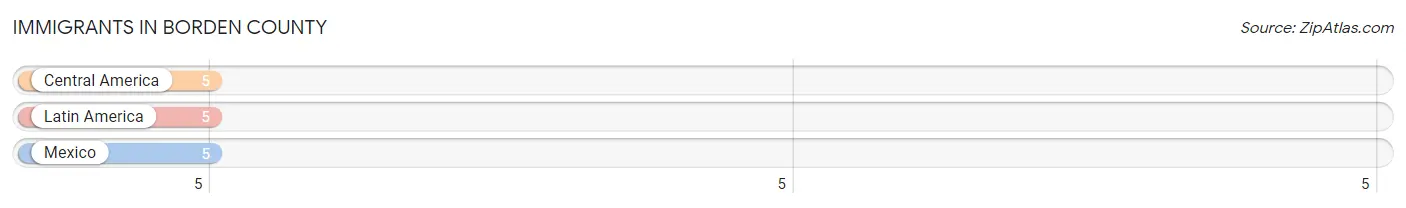
Immigrants in Borden County
The most numerous immigrant groups reported in Borden County came from Central America (5 | 0.7%), Latin America (5 | 0.7%), and Mexico (5 | 0.7%), together accounting for 2.2% of all Borden County residents.
| Immigration Origin | # Population | % Population |
| Central America | 5 | 0.7% |
| Latin America | 5 | 0.7% |
| Mexico | 5 | 0.7% | View All 3 Rows |
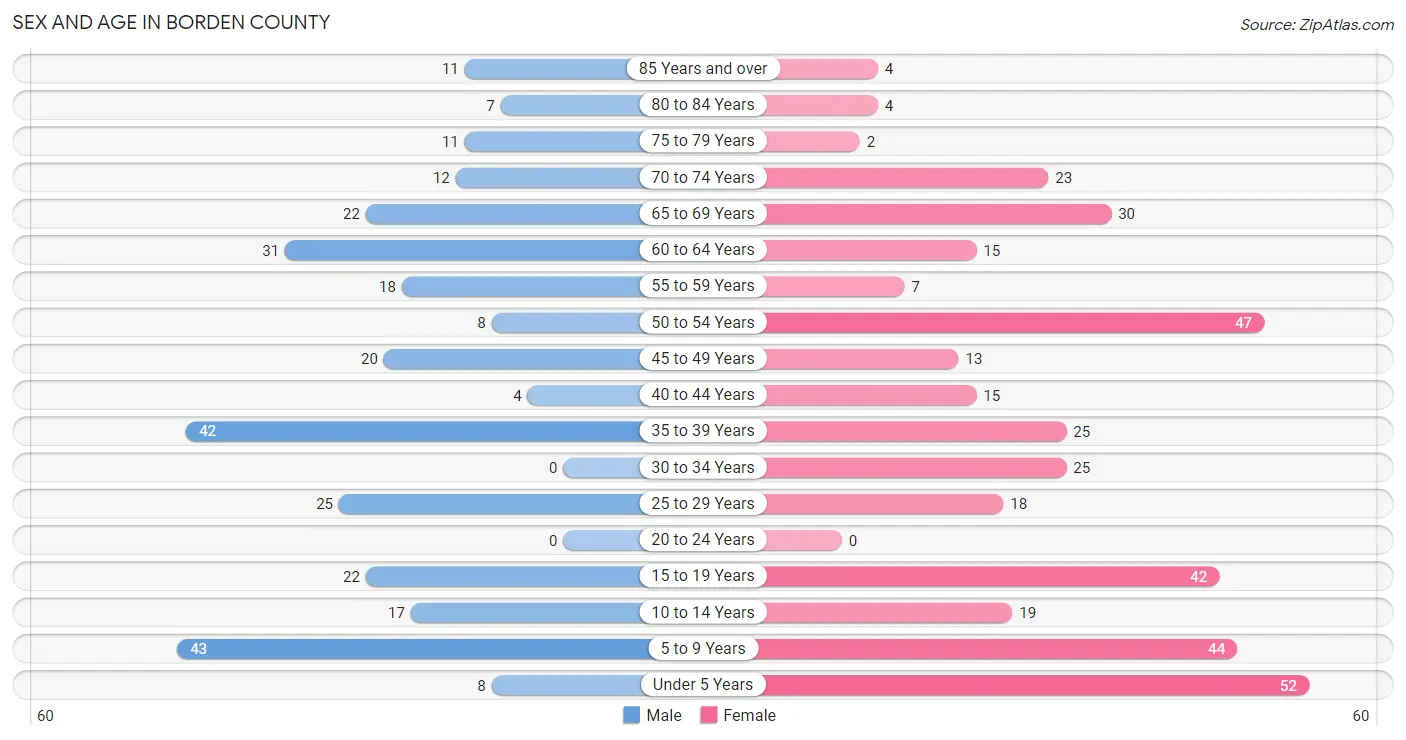
Sex and Age in Borden County
Sex and Age in Borden County
The most populous age groups in Borden County are 5 to 9 Years (43 | 14.3%) for men and Under 5 Years (52 | 13.5%) for women.
| Age Bracket | Male | Female |
| Under 5 Years | 8 (2.7%) | 52 (13.5%) |
| 5 to 9 Years | 43 (14.3%) | 44 (11.4%) |
| 10 to 14 Years | 17 (5.7%) | 19 (4.9%) |
| 15 to 19 Years | 22 (7.3%) | 42 (10.9%) |
| 20 to 24 Years | 0 (0.0%) | 0 (0.0%) |
| 25 to 29 Years | 25 (8.3%) | 18 (4.7%) |
| 30 to 34 Years | 0 (0.0%) | 25 (6.5%) |
| 35 to 39 Years | 42 (14.0%) | 25 (6.5%) |
| 40 to 44 Years | 4 (1.3%) | 15 (3.9%) |
| 45 to 49 Years | 20 (6.6%) | 13 (3.4%) |
| 50 to 54 Years | 8 (2.7%) | 47 (12.2%) |
| 55 to 59 Years | 18 (6.0%) | 7 (1.8%) |
| 60 to 64 Years | 31 (10.3%) | 15 (3.9%) |
| 65 to 69 Years | 22 (7.3%) | 30 (7.8%) |
| 70 to 74 Years | 12 (4.0%) | 23 (6.0%) |
| 75 to 79 Years | 11 (3.6%) | 2 (0.5%) |
| 80 to 84 Years | 7 (2.3%) | 4 (1.0%) |
| 85 Years and over | 11 (3.6%) | 4 (1.0%) |
| Total | 301 (100.0%) | 385 (100.0%) |
Families and Households in Borden County
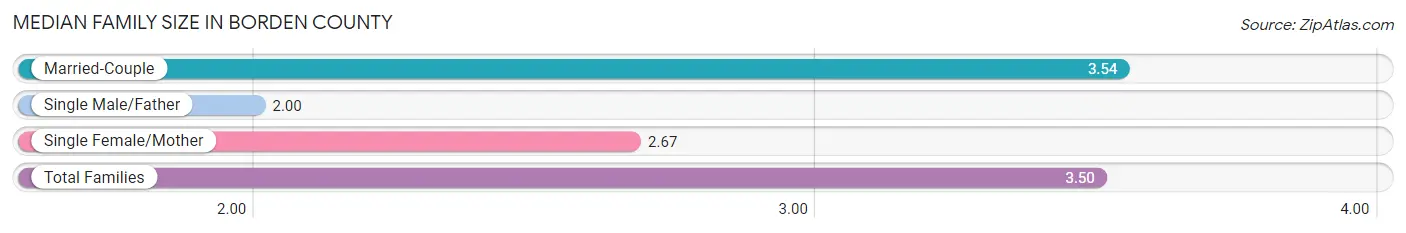
Median Family Size in Borden County
The median family size in Borden County is 3.50 persons per family, with married-couple families (182 | 96.8%) accounting for the largest median family size of 3.54 persons per family. On the other hand, single male/father families (3 | 1.6%) represent the smallest median family size with 2.00 persons per family.
| Family Type | # Families | Family Size |
| Married-Couple | 182 (96.8%) | 3.54 |
| Single Male/Father | 3 (1.6%) | 2.00 |
| Single Female/Mother | 3 (1.6%) | 2.67 |
| Total Families | 188 (100.0%) | 3.50 |
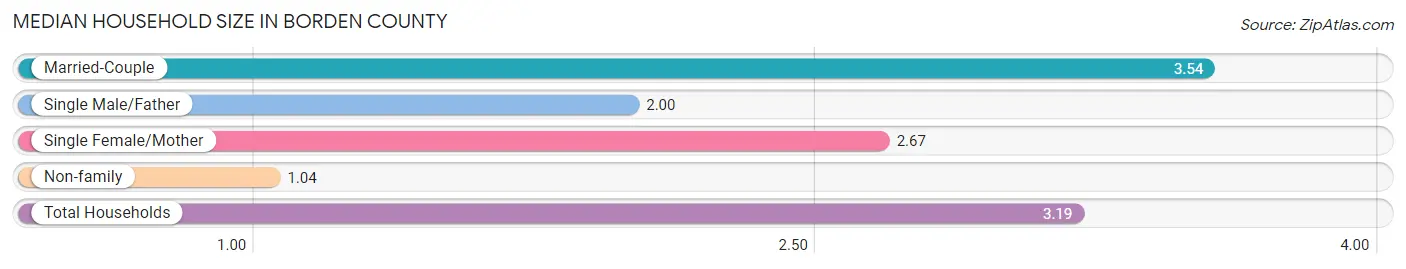
Median Household Size in Borden County
The median household size in Borden County is 3.19 persons per household, with married-couple households (182 | 84.7%) accounting for the largest median household size of 3.54 persons per household. non-family households (27 | 12.6%) represent the smallest median household size with 1.04 persons per household.
| Household Type | # Households | Household Size |
| Married-Couple | 182 (84.7%) | 3.54 |
| Single Male/Father | 3 (1.4%) | 2.00 |
| Single Female/Mother | 3 (1.4%) | 2.67 |
| Non-family | 27 (12.6%) | 1.04 |
| Total Households | 215 (100.0%) | 3.19 |
Household Size by Marriage Status in Borden County
Out of a total of 215 households in Borden County, 188 (87.4%) are family households, while 27 (12.6%) are nonfamily households. The most numerous type of family households are 2-person households, comprising 99, and the most common type of nonfamily households are 1-person households, comprising 24.
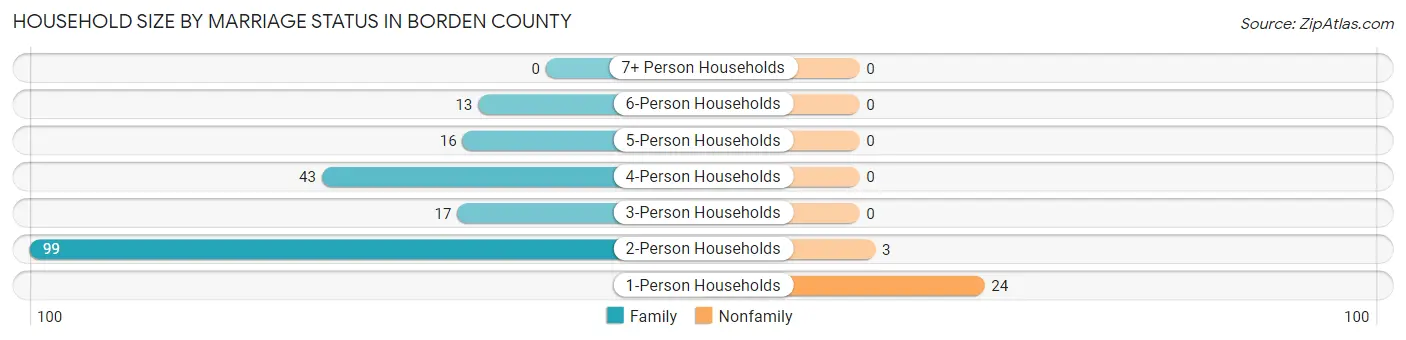
| Household Size | Family Households | Nonfamily Households |
| 1-Person Households | - | 24 (11.2%) |
| 2-Person Households | 99 (46.1%) | 3 (1.4%) |
| 3-Person Households | 17 (7.9%) | 0 (0.0%) |
| 4-Person Households | 43 (20.0%) | 0 (0.0%) |
| 5-Person Households | 16 (7.4%) | 0 (0.0%) |
| 6-Person Households | 13 (6.0%) | 0 (0.0%) |
| 7+ Person Households | 0 (0.0%) | 0 (0.0%) |
| Total | 188 (87.4%) | 27 (12.6%) |
Female Fertility in Borden County
Fertility by Age in Borden County
Average fertility rate in Borden County is 29.0 births per 1,000 women. Women in the age bracket of 20 to 34 years have the highest fertility rate with 93.0 births per 1,000 women. Women in the age bracket of 20 to 34 years acount for 100.0% of all women with births.
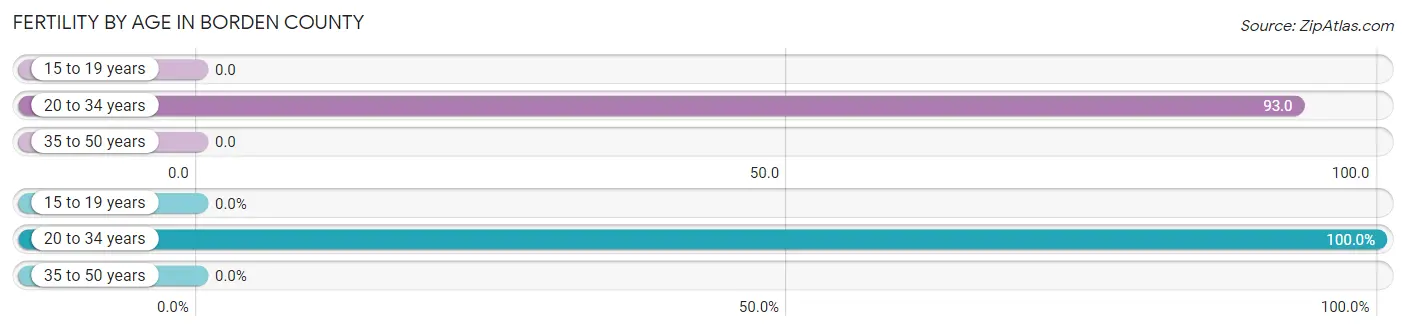
| Age Bracket | Women with Births | Births / 1,000 Women |
| 15 to 19 years | 0 (0.0%) | 0.0 |
| 20 to 34 years | 4 (100.0%) | 93.0 |
| 35 to 50 years | 0 (0.0%) | 0.0 |
| Total | 4 (100.0%) | 29.0 |
Fertility by Age by Marriage Status in Borden County
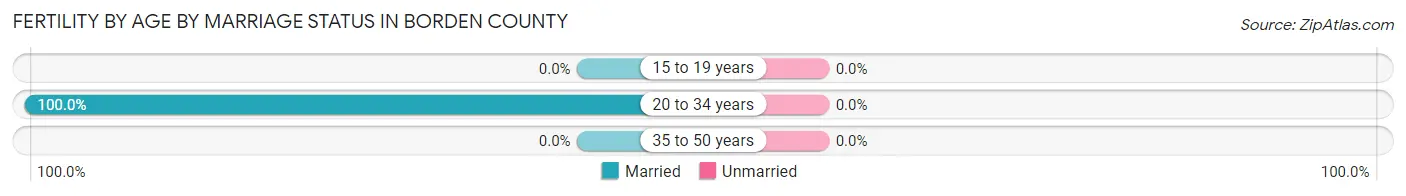
| Age Bracket | Married | Unmarried |
| 15 to 19 years | 0 (0.0%) | 0 (0.0%) |
| 20 to 34 years | 4 (100.0%) | 0 (0.0%) |
| 35 to 50 years | 0 (0.0%) | 0 (0.0%) |
| Total | 4 (100.0%) | 0 (0.0%) |
Fertility by Education in Borden County
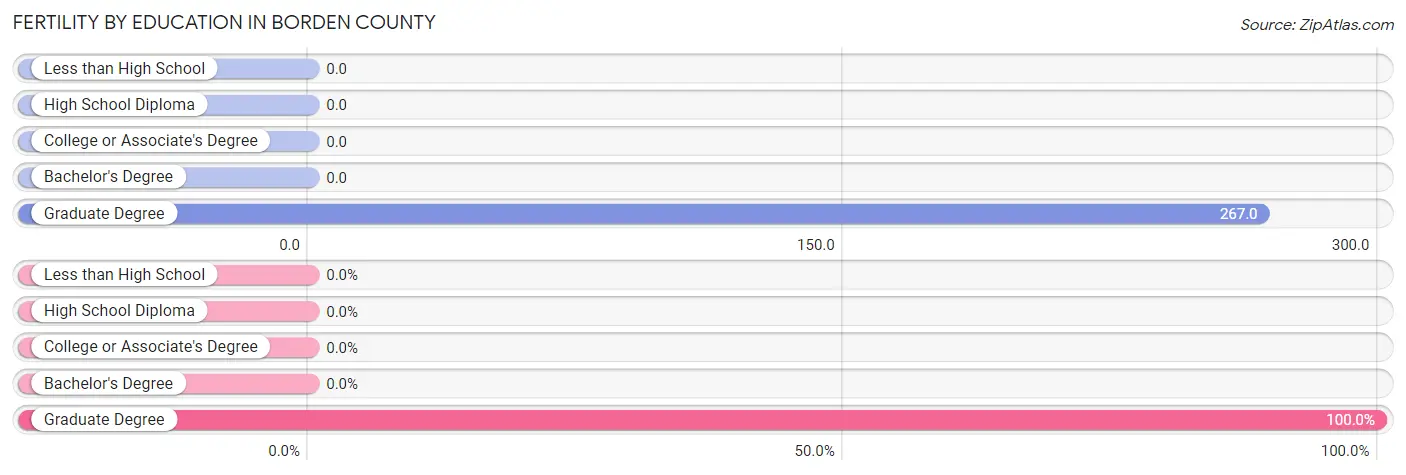
| Educational Attainment | Women with Births | Births / 1,000 Women |
| Less than High School | 0 (0.0%) | 0.0 |
| High School Diploma | 0 (0.0%) | 0.0 |
| College or Associate's Degree | 0 (0.0%) | 0.0 |
| Bachelor's Degree | 0 (0.0%) | 0.0 |
| Graduate Degree | 4 (100.0%) | 267.0 |
| Total | 4 (100.0%) | 29.0 |
Fertility by Education by Marriage Status in Borden County
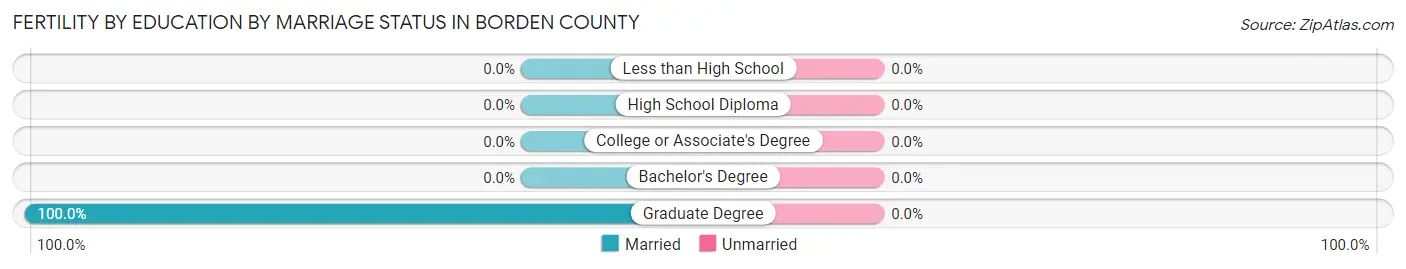
| Educational Attainment | Married | Unmarried |
| Less than High School | 0 (0.0%) | 0 (0.0%) |
| High School Diploma | 0 (0.0%) | 0 (0.0%) |
| College or Associate's Degree | 0 (0.0%) | 0 (0.0%) |
| Bachelor's Degree | 0 (0.0%) | 0 (0.0%) |
| Graduate Degree | 4 (100.0%) | 0 (0.0%) |
| Total | 4 (100.0%) | 0 (0.0%) |
Employment Characteristics in Borden County
Employment by Class of Employer in Borden County
Among the 267 employed individuals in Borden County, private company employees (158 | 59.2%), self-employed (not incorporated) (33 | 12.4%), and self-employed (incorporated) (29 | 10.9%) make up the most common classes of employment.
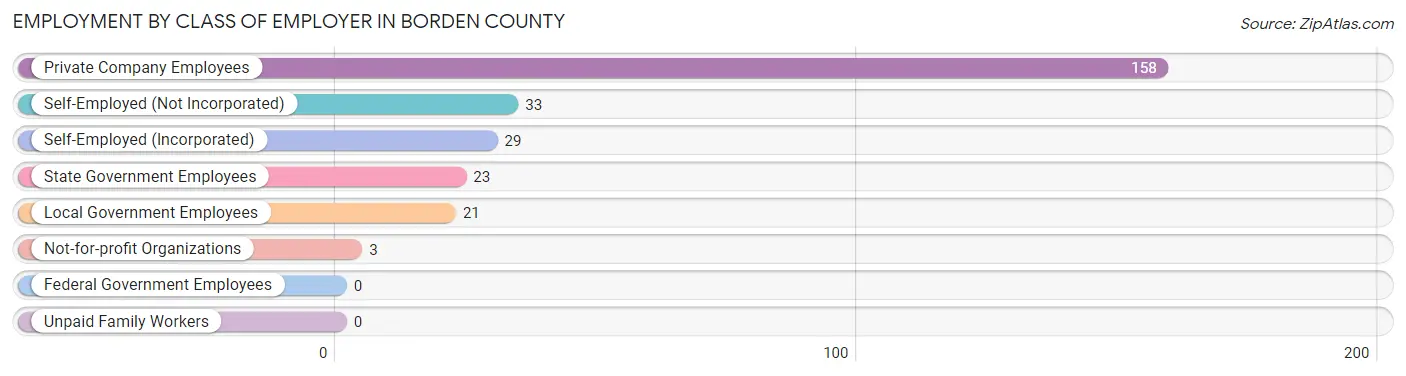
| Employer Class | # Employees | % Employees |
| Private Company Employees | 158 | 59.2% |
| Self-Employed (Incorporated) | 29 | 10.9% |
| Self-Employed (Not Incorporated) | 33 | 12.4% |
| Not-for-profit Organizations | 3 | 1.1% |
| Local Government Employees | 21 | 7.9% |
| State Government Employees | 23 | 8.6% |
| Federal Government Employees | 0 | 0.0% |
| Unpaid Family Workers | 0 | 0.0% |
| Total | 267 | 100.0% |
Employment Status by Age in Borden County
According to the labor force statistics for Borden County, out of the total population over 16 years of age (494), 57.5% or 284 individuals are in the labor force, with 1.8% or 5 of them unemployed. The age group with the highest labor force participation rate is 55 to 59 years, with 96.0% or 24 individuals in the labor force. Within the labor force, the 35 to 44 years age range has the highest percentage of unemployed individuals, with 6.8% or 5 of them being unemployed.
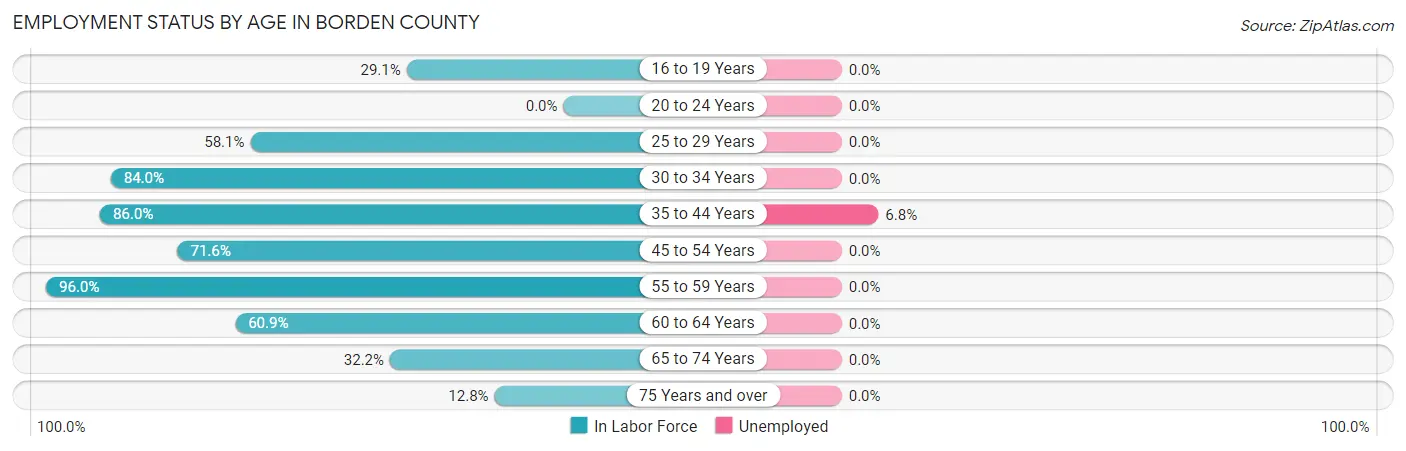
| Age Bracket | In Labor Force | Unemployed |
| 16 to 19 Years | 16 (29.1%) | 0 (0.0%) |
| 20 to 24 Years | 0 (0.0%) | 0 (0.0%) |
| 25 to 29 Years | 25 (58.1%) | 0 (0.0%) |
| 30 to 34 Years | 21 (84.0%) | 0 (0.0%) |
| 35 to 44 Years | 74 (86.0%) | 5 (6.8%) |
| 45 to 54 Years | 63 (71.6%) | 0 (0.0%) |
| 55 to 59 Years | 24 (96.0%) | 0 (0.0%) |
| 60 to 64 Years | 28 (60.9%) | 0 (0.0%) |
| 65 to 74 Years | 28 (32.2%) | 0 (0.0%) |
| 75 Years and over | 5 (12.8%) | 0 (0.0%) |
| Total | 284 (57.5%) | 5 (1.8%) |
Employment Status by Educational Attainment in Borden County
According to labor force statistics for Borden County, 75.1% of individuals (235) out of the total population between 25 and 64 years of age (313) are in the labor force, with 2.1% or 5 of them being unemployed. The group with the highest labor force participation rate are those with the educational attainment of bachelor's degree or higher, with 86.1% or 118 individuals in the labor force. Within the labor force, individuals with college / associate degree education have the highest percentage of unemployment, with 5.8% or 4 of them being unemployed.
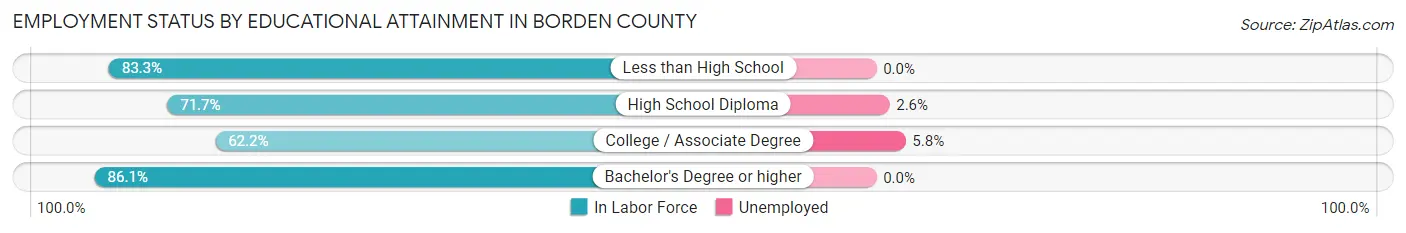
| Educational Attainment | In Labor Force | Unemployed |
| Less than High School | 10 (83.3%) | 0 (0.0%) |
| High School Diploma | 38 (71.7%) | 1 (2.6%) |
| College / Associate Degree | 69 (62.2%) | 6 (5.8%) |
| Bachelor's Degree or higher | 118 (86.1%) | 0 (0.0%) |
| Total | 235 (75.1%) | 7 (2.1%) |
Employment Occupations by Sex in Borden County
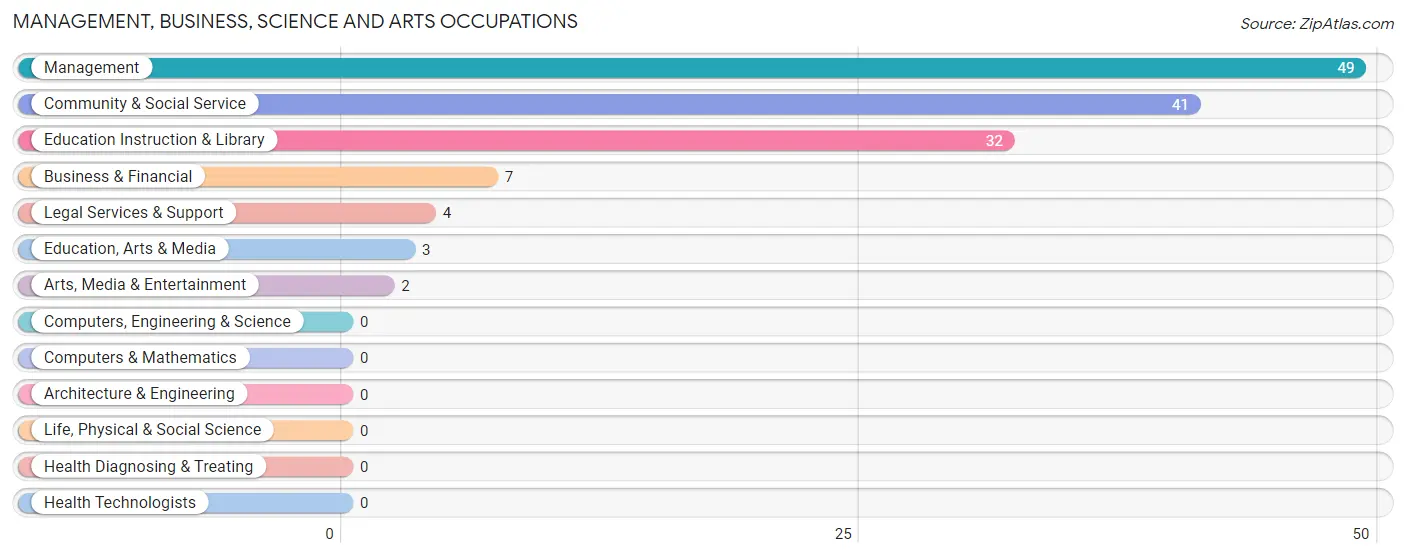
Management, Business, Science and Arts Occupations
The most common Management, Business, Science and Arts occupations in Borden County are Management (49 | 17.6%), Community & Social Service (41 | 14.7%), Education Instruction & Library (32 | 11.5%), Business & Financial (7 | 2.5%), and Legal Services & Support (4 | 1.4%).
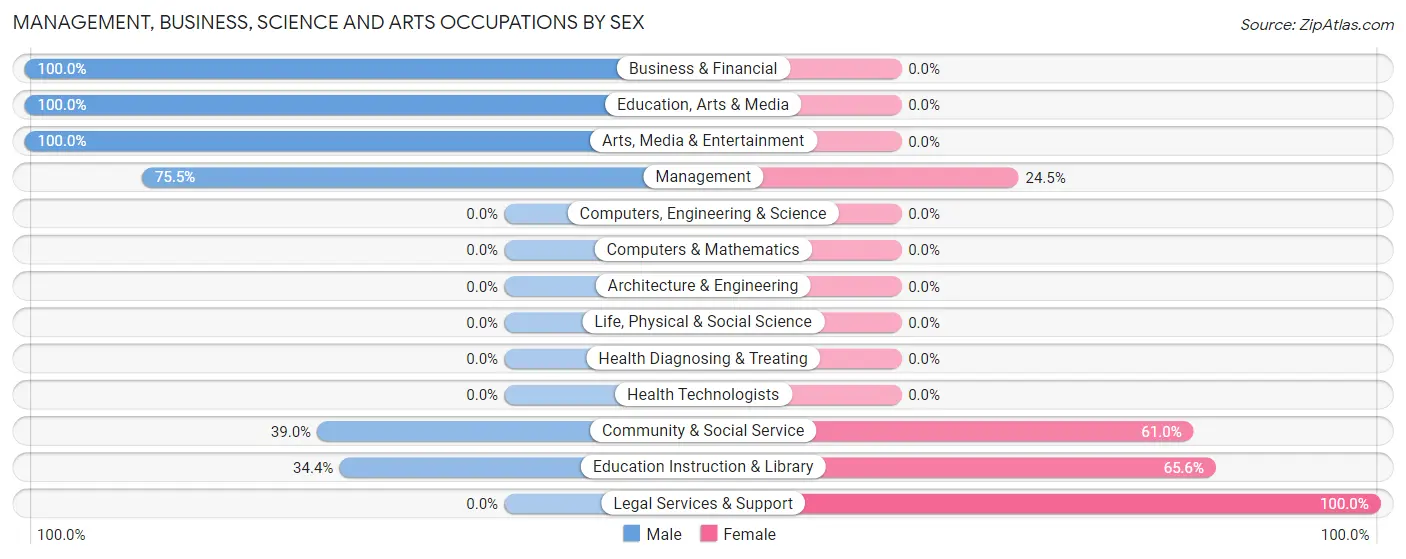
Management, Business, Science and Arts Occupations by Sex
Within the Management, Business, Science and Arts occupations in Borden County, the most male-oriented occupations are Business & Financial (100.0%), Education, Arts & Media (100.0%), and Arts, Media & Entertainment (100.0%), while the most female-oriented occupations are Legal Services & Support (100.0%), Education Instruction & Library (65.6%), and Community & Social Service (61.0%).
| Occupation | Male | Female |
| Management | 37 (75.5%) | 12 (24.5%) |
| Business & Financial | 7 (100.0%) | 0 (0.0%) |
| Computers, Engineering & Science | 0 (0.0%) | 0 (0.0%) |
| Computers & Mathematics | 0 (0.0%) | 0 (0.0%) |
| Architecture & Engineering | 0 (0.0%) | 0 (0.0%) |
| Life, Physical & Social Science | 0 (0.0%) | 0 (0.0%) |
| Community & Social Service | 16 (39.0%) | 25 (61.0%) |
| Education, Arts & Media | 3 (100.0%) | 0 (0.0%) |
| Legal Services & Support | 0 (0.0%) | 4 (100.0%) |
| Education Instruction & Library | 11 (34.4%) | 21 (65.6%) |
| Arts, Media & Entertainment | 2 (100.0%) | 0 (0.0%) |
| Health Diagnosing & Treating | 0 (0.0%) | 0 (0.0%) |
| Health Technologists | 0 (0.0%) | 0 (0.0%) |
| Total (Category) | 60 (61.9%) | 37 (38.1%) |
| Total (Overall) | 164 (58.8%) | 115 (41.2%) |
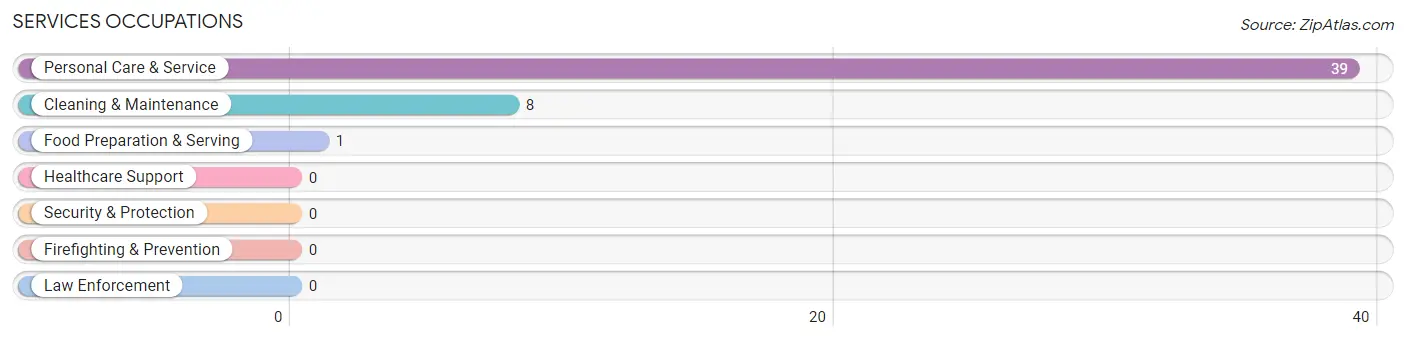
Services Occupations
The most common Services occupations in Borden County are Personal Care & Service (39 | 14.0%), Cleaning & Maintenance (8 | 2.9%), and Food Preparation & Serving (1 | 0.4%).
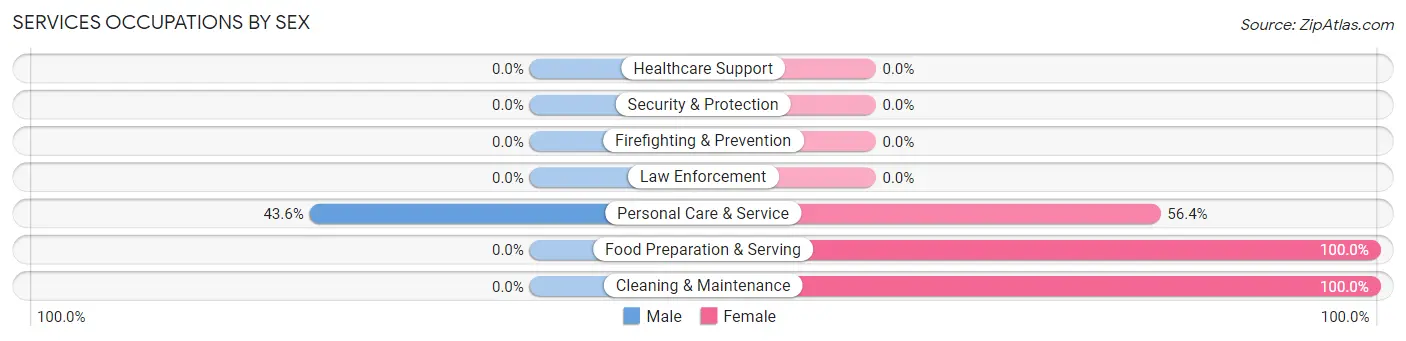
Services Occupations by Sex
| Occupation | Male | Female |
| Healthcare Support | 0 (0.0%) | 0 (0.0%) |
| Security & Protection | 0 (0.0%) | 0 (0.0%) |
| Firefighting & Prevention | 0 (0.0%) | 0 (0.0%) |
| Law Enforcement | 0 (0.0%) | 0 (0.0%) |
| Food Preparation & Serving | 0 (0.0%) | 1 (100.0%) |
| Cleaning & Maintenance | 0 (0.0%) | 8 (100.0%) |
| Personal Care & Service | 17 (43.6%) | 22 (56.4%) |
| Total (Category) | 17 (35.4%) | 31 (64.6%) |
| Total (Overall) | 164 (58.8%) | 115 (41.2%) |
Sales and Office Occupations
The most common Sales and Office occupations in Borden County are Office & Administration (52 | 18.6%), and Sales & Related (6 | 2.1%).
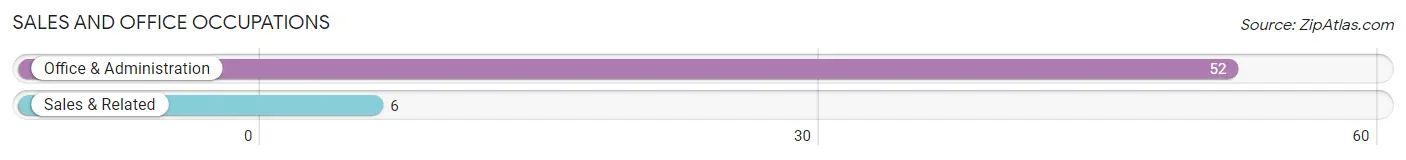
Sales and Office Occupations by Sex
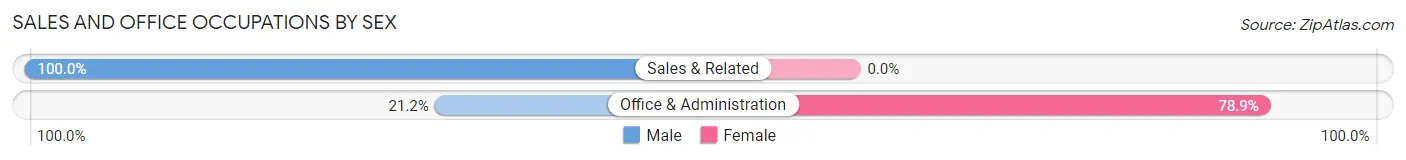
| Occupation | Male | Female |
| Sales & Related | 6 (100.0%) | 0 (0.0%) |
| Office & Administration | 11 (21.1%) | 41 (78.8%) |
| Total (Category) | 17 (29.3%) | 41 (70.7%) |
| Total (Overall) | 164 (58.8%) | 115 (41.2%) |
Natural Resources, Construction and Maintenance Occupations
The most common Natural Resources, Construction and Maintenance occupations in Borden County are Farming, Fishing & Forestry (28 | 10.0%), and Construction & Extraction (20 | 7.2%).
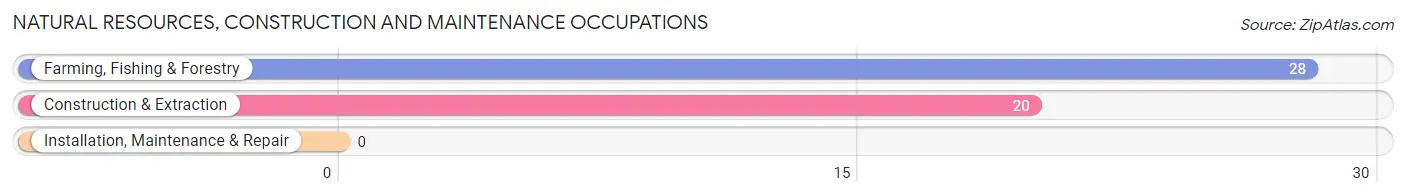
Natural Resources, Construction and Maintenance Occupations by Sex
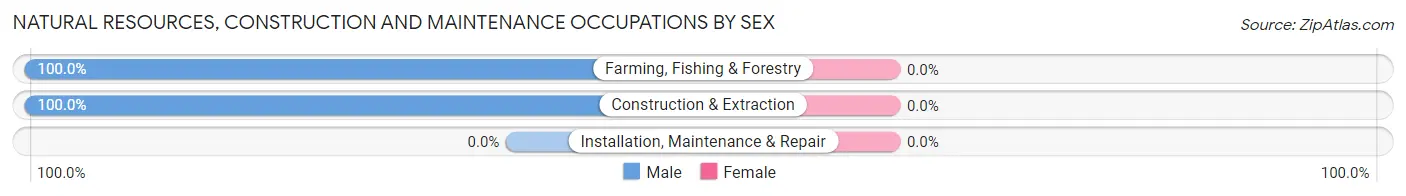
| Occupation | Male | Female |
| Farming, Fishing & Forestry | 28 (100.0%) | 0 (0.0%) |
| Construction & Extraction | 20 (100.0%) | 0 (0.0%) |
| Installation, Maintenance & Repair | 0 (0.0%) | 0 (0.0%) |
| Total (Category) | 48 (100.0%) | 0 (0.0%) |
| Total (Overall) | 164 (58.8%) | 115 (41.2%) |
Production, Transportation and Moving Occupations
The most common Production, Transportation and Moving occupations in Borden County are Production (21 | 7.5%), Material Moving (5 | 1.8%), and Transportation (2 | 0.7%).
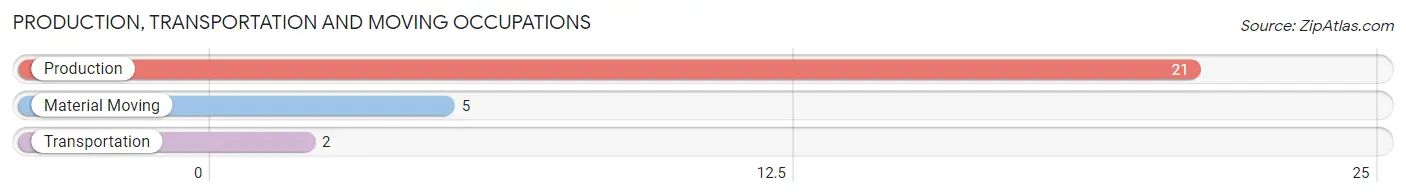
Production, Transportation and Moving Occupations by Sex
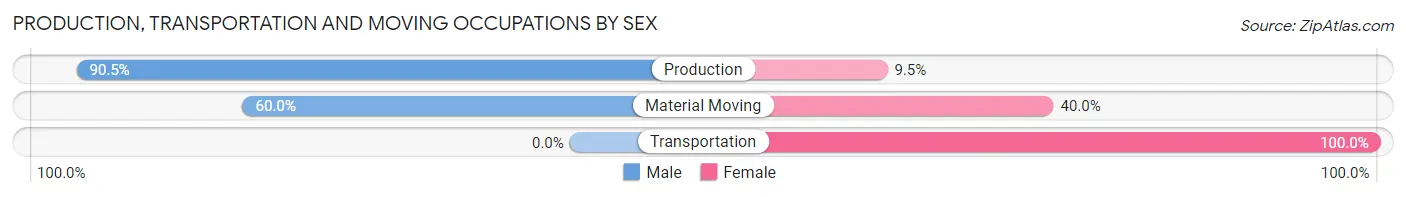
| Occupation | Male | Female |
| Production | 19 (90.5%) | 2 (9.5%) |
| Transportation | 0 (0.0%) | 2 (100.0%) |
| Material Moving | 3 (60.0%) | 2 (40.0%) |
| Total (Category) | 22 (78.6%) | 6 (21.4%) |
| Total (Overall) | 164 (58.8%) | 115 (41.2%) |
Employment Industries by Sex in Borden County
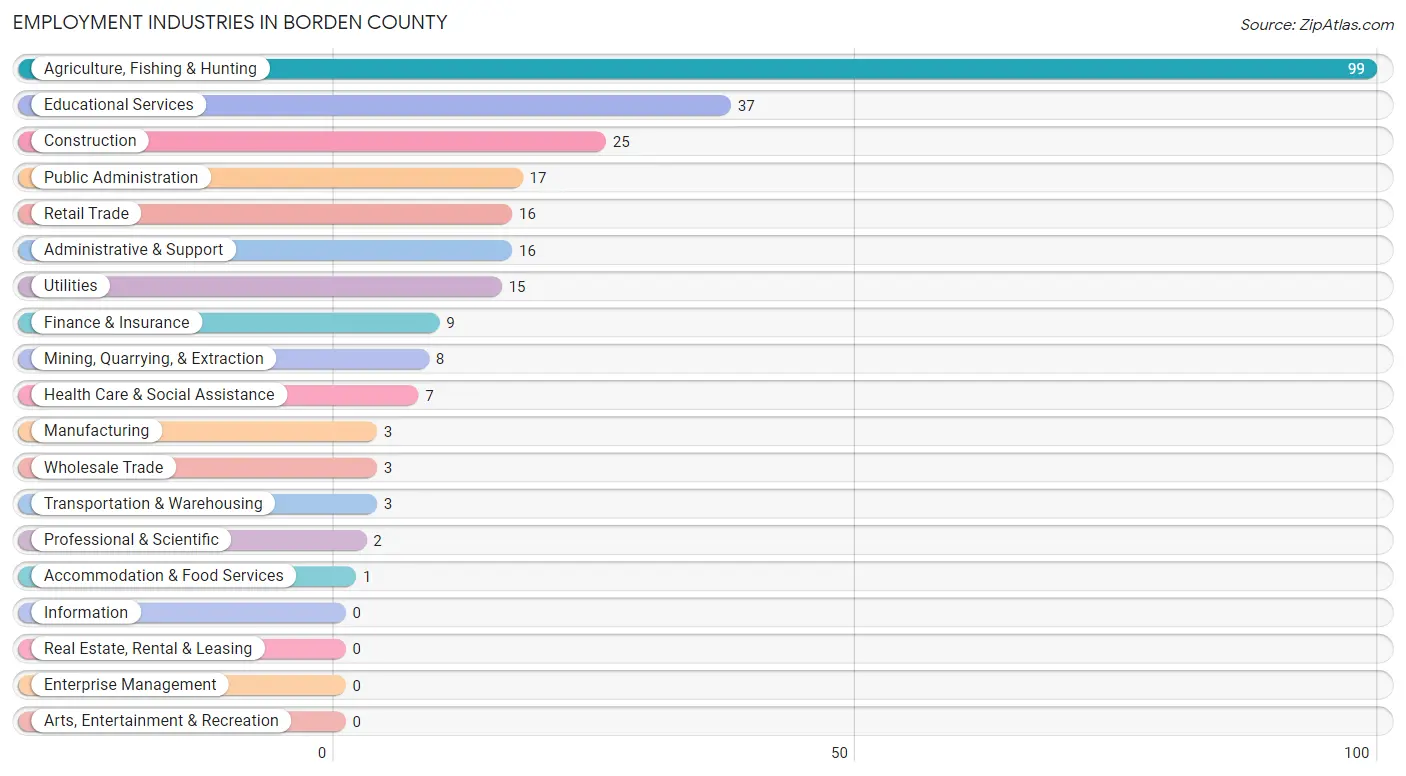
Employment Industries in Borden County
The major employment industries in Borden County include Agriculture, Fishing & Hunting (99 | 35.5%), Educational Services (37 | 13.3%), Construction (25 | 9.0%), Public Administration (17 | 6.1%), and Retail Trade (16 | 5.7%).
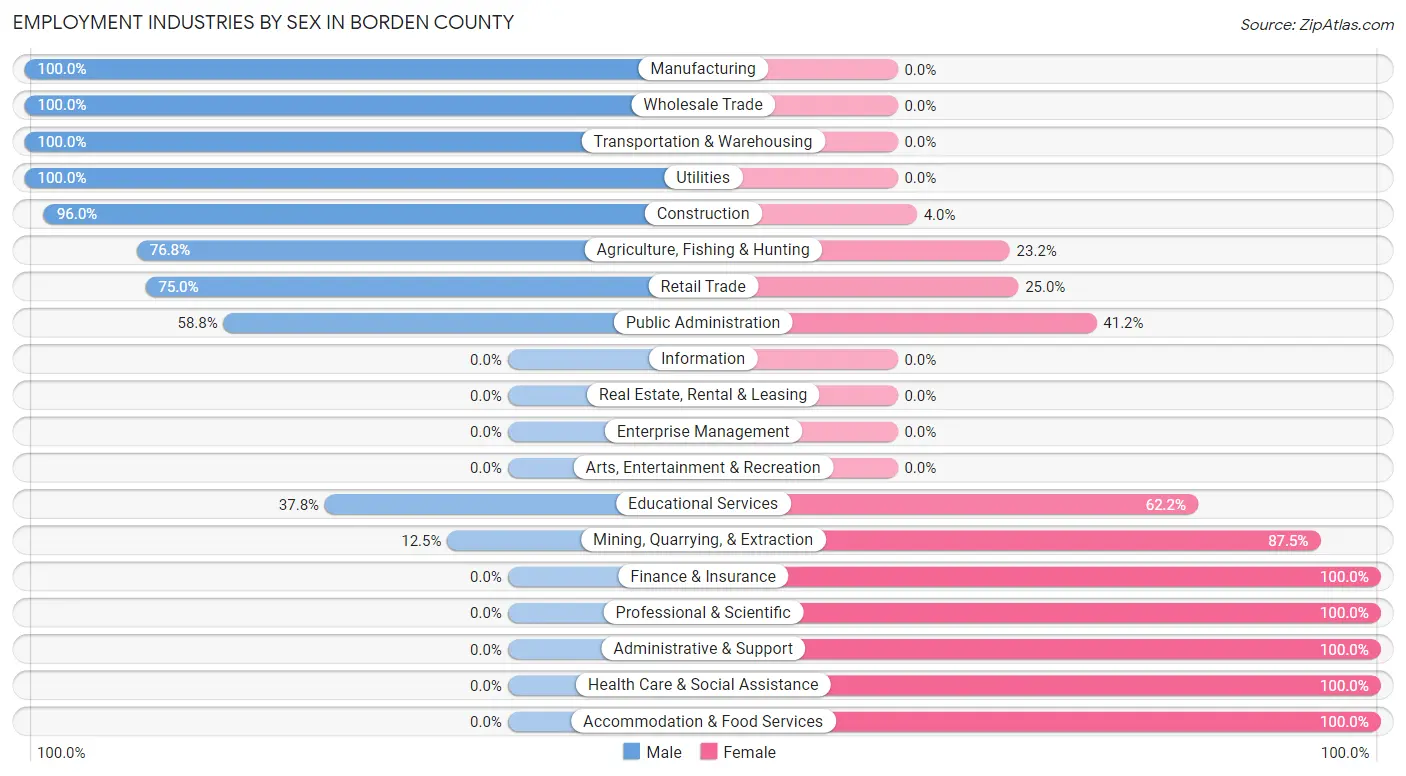
Employment Industries by Sex in Borden County
The Borden County industries that see more men than women are Manufacturing (100.0%), Wholesale Trade (100.0%), and Transportation & Warehousing (100.0%), whereas the industries that tend to have a higher number of women are Finance & Insurance (100.0%), Professional & Scientific (100.0%), and Administrative & Support (100.0%).
| Industry | Male | Female |
| Agriculture, Fishing & Hunting | 76 (76.8%) | 23 (23.2%) |
| Mining, Quarrying, & Extraction | 1 (12.5%) | 7 (87.5%) |
| Construction | 24 (96.0%) | 1 (4.0%) |
| Manufacturing | 3 (100.0%) | 0 (0.0%) |
| Wholesale Trade | 3 (100.0%) | 0 (0.0%) |
| Retail Trade | 12 (75.0%) | 4 (25.0%) |
| Transportation & Warehousing | 3 (100.0%) | 0 (0.0%) |
| Utilities | 15 (100.0%) | 0 (0.0%) |
| Information | 0 (0.0%) | 0 (0.0%) |
| Finance & Insurance | 0 (0.0%) | 9 (100.0%) |
| Real Estate, Rental & Leasing | 0 (0.0%) | 0 (0.0%) |
| Professional & Scientific | 0 (0.0%) | 2 (100.0%) |
| Enterprise Management | 0 (0.0%) | 0 (0.0%) |
| Administrative & Support | 0 (0.0%) | 16 (100.0%) |
| Educational Services | 14 (37.8%) | 23 (62.2%) |
| Health Care & Social Assistance | 0 (0.0%) | 7 (100.0%) |
| Arts, Entertainment & Recreation | 0 (0.0%) | 0 (0.0%) |
| Accommodation & Food Services | 0 (0.0%) | 1 (100.0%) |
| Public Administration | 10 (58.8%) | 7 (41.2%) |
| Total | 164 (58.8%) | 115 (41.2%) |
Education in Borden County
School Enrollment in Borden County
The most common levels of schooling among the 206 students in Borden County are high school (64 | 31.1%), elementary school (53 | 25.7%), and kindergarten (37 | 18.0%).
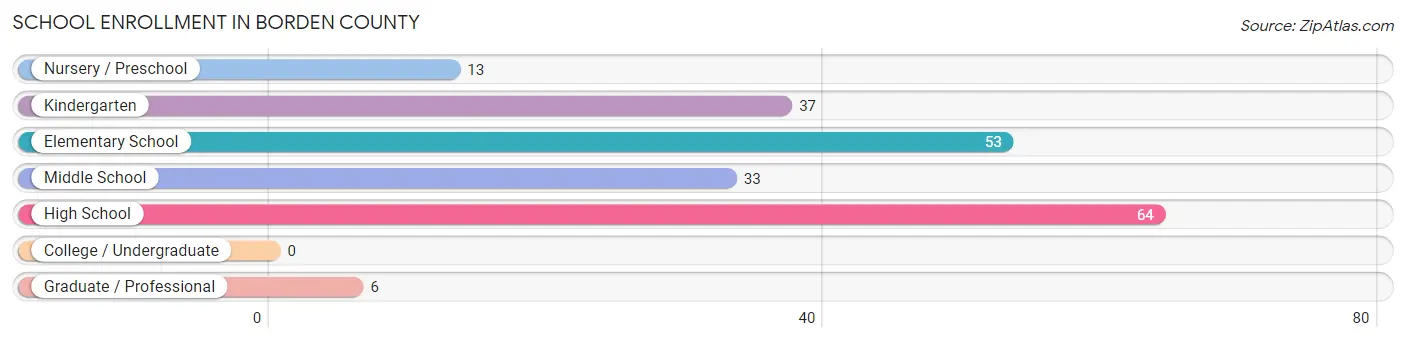
| School Level | # Students | % Students |
| Nursery / Preschool | 13 | 6.3% |
| Kindergarten | 37 | 18.0% |
| Elementary School | 53 | 25.7% |
| Middle School | 33 | 16.0% |
| High School | 64 | 31.1% |
| College / Undergraduate | 0 | 0.0% |
| Graduate / Professional | 6 | 2.9% |
| Total | 206 | 100.0% |
School Enrollment by Age by Funding Source in Borden County
Out of a total of 206 students who are enrolled in schools in Borden County, 11 (5.3%) attend a private institution, while the remaining 195 (94.7%) are enrolled in public schools. The age group of 5 to 9 year old has the highest likelihood of being enrolled in private schools, with 11 (12.6% in the age bracket) enrolled. Conversely, the age group of 3 to 4 year olds has the lowest likelihood of being enrolled in a private school, with 13 (100.0% in the age bracket) attending a public institution.
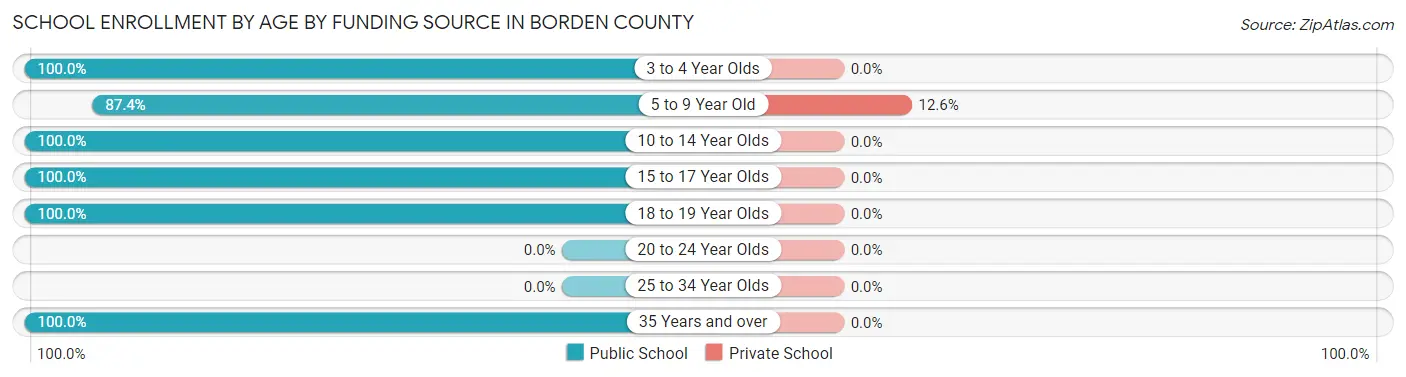
| Age Bracket | Public School | Private School |
| 3 to 4 Year Olds | 13 (100.0%) | 0 (0.0%) |
| 5 to 9 Year Old | 76 (87.4%) | 11 (12.6%) |
| 10 to 14 Year Olds | 36 (100.0%) | 0 (0.0%) |
| 15 to 17 Year Olds | 52 (100.0%) | 0 (0.0%) |
| 18 to 19 Year Olds | 12 (100.0%) | 0 (0.0%) |
| 20 to 24 Year Olds | 0 (0.0%) | 0 (0.0%) |
| 25 to 34 Year Olds | 0 (0.0%) | 0 (0.0%) |
| 35 Years and over | 6 (100.0%) | 0 (0.0%) |
| Total | 195 (94.7%) | 11 (5.3%) |
Educational Attainment by Field of Study in Borden County
Bio, nature & agricultural (58 | 30.5%), education (34 | 17.9%), arts & humanities (31 | 16.3%), business (23 | 12.1%), and literature & languages (10 | 5.3%) are the most common fields of study among 190 individuals in Borden County who have obtained a bachelor's degree or higher.
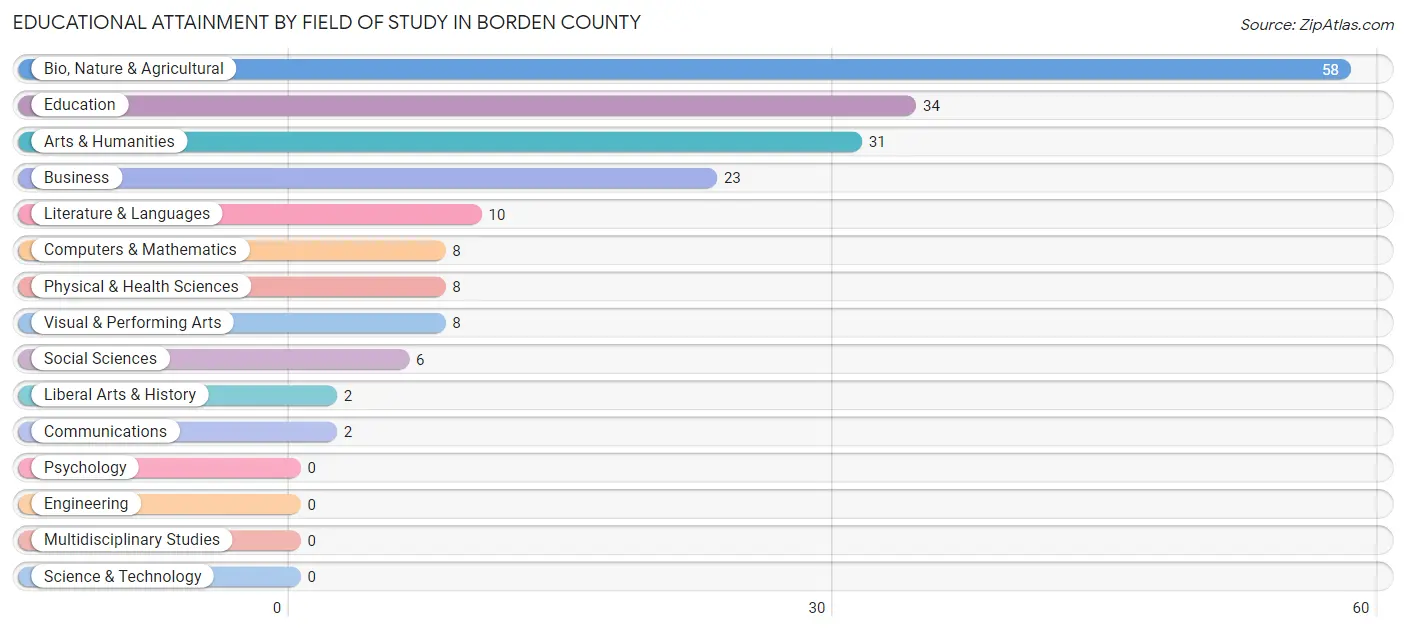
| Field of Study | # Graduates | % Graduates |
| Computers & Mathematics | 8 | 4.2% |
| Bio, Nature & Agricultural | 58 | 30.5% |
| Physical & Health Sciences | 8 | 4.2% |
| Psychology | 0 | 0.0% |
| Social Sciences | 6 | 3.2% |
| Engineering | 0 | 0.0% |
| Multidisciplinary Studies | 0 | 0.0% |
| Science & Technology | 0 | 0.0% |
| Business | 23 | 12.1% |
| Education | 34 | 17.9% |
| Literature & Languages | 10 | 5.3% |
| Liberal Arts & History | 2 | 1.1% |
| Visual & Performing Arts | 8 | 4.2% |
| Communications | 2 | 1.1% |
| Arts & Humanities | 31 | 16.3% |
| Total | 190 | 100.0% |
Transportation & Commute in Borden County
Vehicle Availability by Sex in Borden County
The most prevalent vehicle ownership categories in Borden County are males with 2 vehicles (56, accounting for 35.7%) and females with 2 vehicles (47, making up 50.9%).
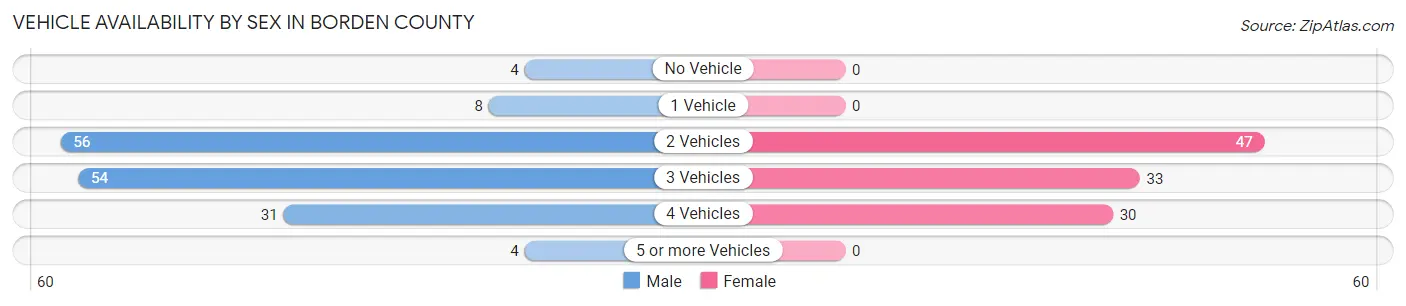
| Vehicles Available | Male | Female |
| No Vehicle | 4 (2.5%) | 0 (0.0%) |
| 1 Vehicle | 8 (5.1%) | 0 (0.0%) |
| 2 Vehicles | 56 (35.7%) | 47 (42.7%) |
| 3 Vehicles | 54 (34.4%) | 33 (30.0%) |
| 4 Vehicles | 31 (19.8%) | 30 (27.3%) |
| 5 or more Vehicles | 4 (2.5%) | 0 (0.0%) |
| Total | 157 (100.0%) | 110 (100.0%) |
Commute Time in Borden County
The most frequently occuring commute durations in Borden County are 5 to 9 minutes (57 commuters, 22.9%), 10 to 14 minutes (51 commuters, 20.5%), and less than 5 minutes (38 commuters, 15.3%).
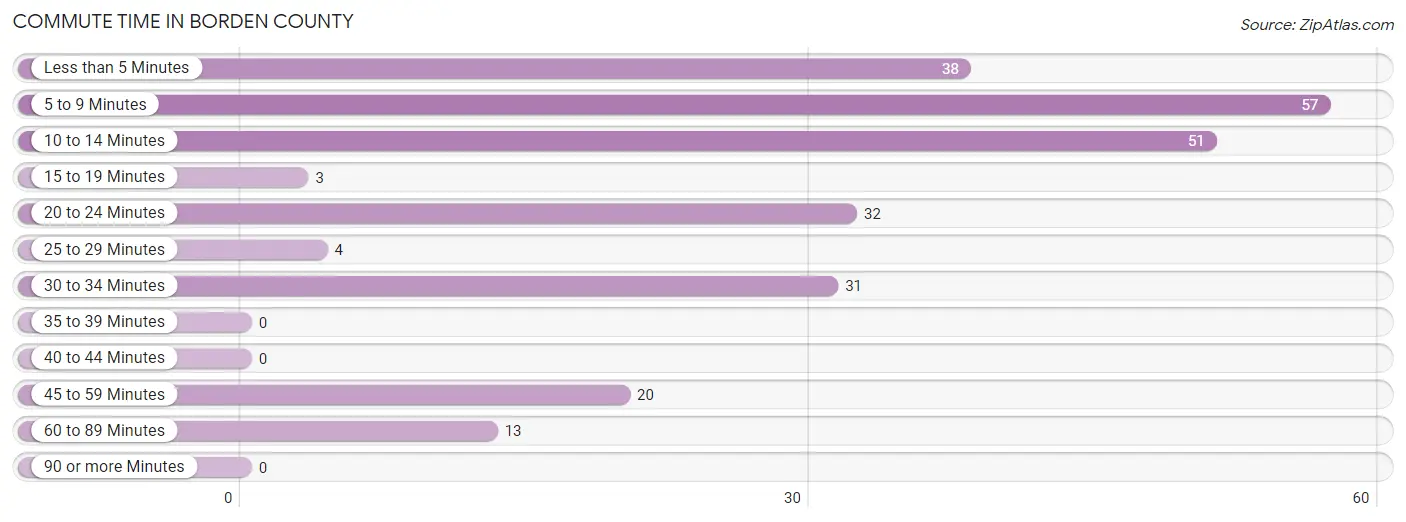
| Commute Time | # Commuters | % Commuters |
| Less than 5 Minutes | 38 | 15.3% |
| 5 to 9 Minutes | 57 | 22.9% |
| 10 to 14 Minutes | 51 | 20.5% |
| 15 to 19 Minutes | 3 | 1.2% |
| 20 to 24 Minutes | 32 | 12.9% |
| 25 to 29 Minutes | 4 | 1.6% |
| 30 to 34 Minutes | 31 | 12.4% |
| 35 to 39 Minutes | 0 | 0.0% |
| 40 to 44 Minutes | 0 | 0.0% |
| 45 to 59 Minutes | 20 | 8.0% |
| 60 to 89 Minutes | 13 | 5.2% |
| 90 or more Minutes | 0 | 0.0% |
Commute Time by Sex in Borden County
The most common commute times in Borden County are 5 to 9 minutes (46 commuters, 30.1%) for males and 30 to 34 minutes (22 commuters, 22.9%) for females.
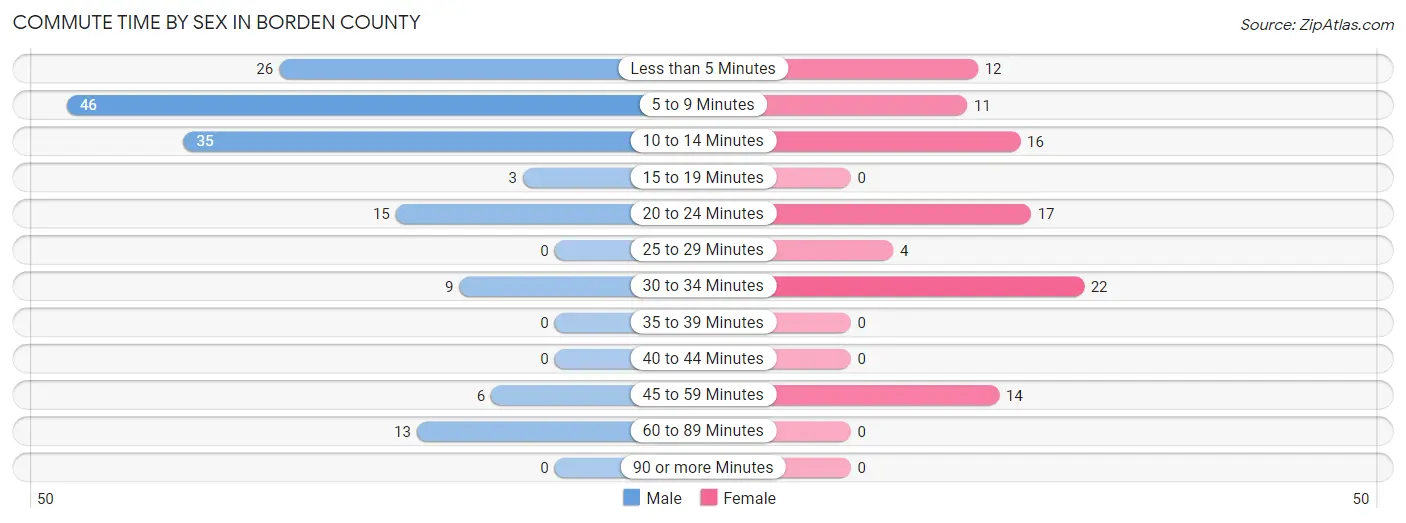
| Commute Time | Male | Female |
| Less than 5 Minutes | 26 (17.0%) | 12 (12.5%) |
| 5 to 9 Minutes | 46 (30.1%) | 11 (11.5%) |
| 10 to 14 Minutes | 35 (22.9%) | 16 (16.7%) |
| 15 to 19 Minutes | 3 (2.0%) | 0 (0.0%) |
| 20 to 24 Minutes | 15 (9.8%) | 17 (17.7%) |
| 25 to 29 Minutes | 0 (0.0%) | 4 (4.2%) |
| 30 to 34 Minutes | 9 (5.9%) | 22 (22.9%) |
| 35 to 39 Minutes | 0 (0.0%) | 0 (0.0%) |
| 40 to 44 Minutes | 0 (0.0%) | 0 (0.0%) |
| 45 to 59 Minutes | 6 (3.9%) | 14 (14.6%) |
| 60 to 89 Minutes | 13 (8.5%) | 0 (0.0%) |
| 90 or more Minutes | 0 (0.0%) | 0 (0.0%) |
Time of Departure to Work by Sex in Borden County
The most frequent times of departure to work in Borden County are 7:00 AM to 7:29 AM (55, 35.9%) for males and 7:00 AM to 7:29 AM (31, 32.3%) for females.
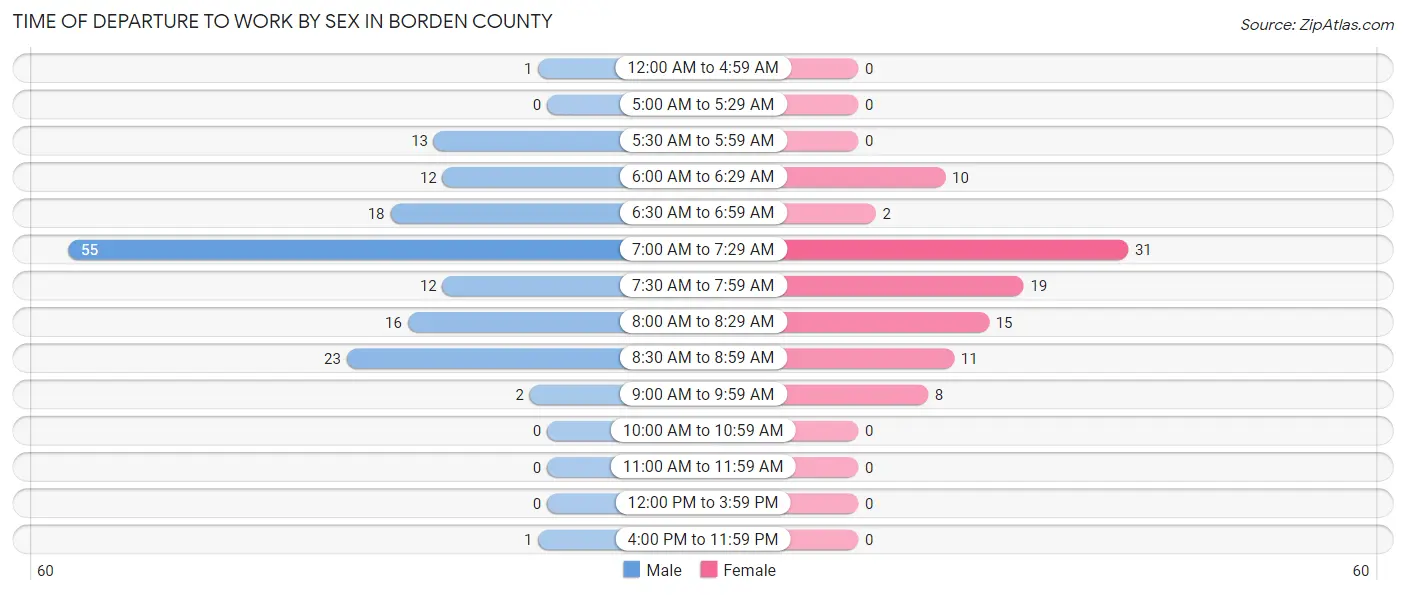
| Time of Departure | Male | Female |
| 12:00 AM to 4:59 AM | 1 (0.6%) | 0 (0.0%) |
| 5:00 AM to 5:29 AM | 0 (0.0%) | 0 (0.0%) |
| 5:30 AM to 5:59 AM | 13 (8.5%) | 0 (0.0%) |
| 6:00 AM to 6:29 AM | 12 (7.8%) | 10 (10.4%) |
| 6:30 AM to 6:59 AM | 18 (11.8%) | 2 (2.1%) |
| 7:00 AM to 7:29 AM | 55 (35.9%) | 31 (32.3%) |
| 7:30 AM to 7:59 AM | 12 (7.8%) | 19 (19.8%) |
| 8:00 AM to 8:29 AM | 16 (10.5%) | 15 (15.6%) |
| 8:30 AM to 8:59 AM | 23 (15.0%) | 11 (11.5%) |
| 9:00 AM to 9:59 AM | 2 (1.3%) | 8 (8.3%) |
| 10:00 AM to 10:59 AM | 0 (0.0%) | 0 (0.0%) |
| 11:00 AM to 11:59 AM | 0 (0.0%) | 0 (0.0%) |
| 12:00 PM to 3:59 PM | 0 (0.0%) | 0 (0.0%) |
| 4:00 PM to 11:59 PM | 1 (0.6%) | 0 (0.0%) |
| Total | 153 (100.0%) | 96 (100.0%) |
Housing Occupancy in Borden County
Occupancy by Ownership in Borden County
Of the total 215 dwellings in Borden County, owner-occupied units account for 158 (73.5%), while renter-occupied units make up 57 (26.5%).
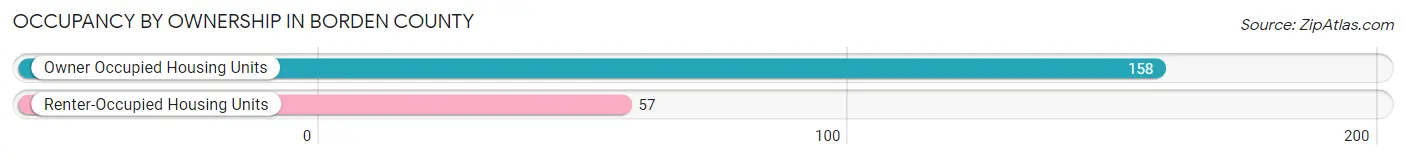
| Occupancy | # Housing Units | % Housing Units |
| Owner Occupied Housing Units | 158 | 73.5% |
| Renter-Occupied Housing Units | 57 | 26.5% |
| Total Occupied Housing Units | 215 | 100.0% |
Occupancy by Household Size in Borden County
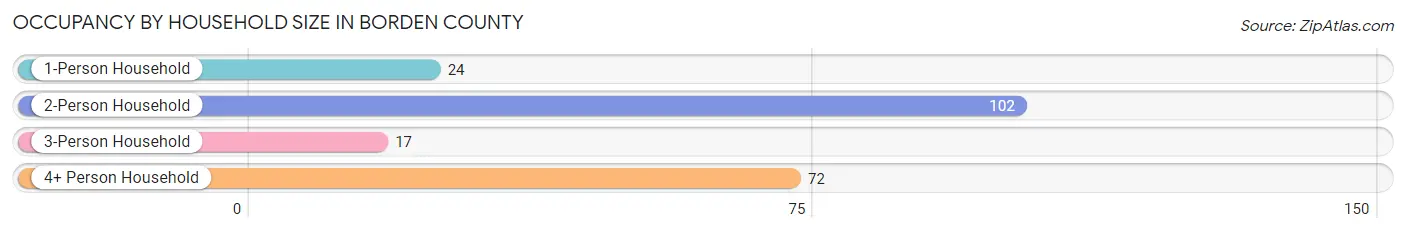
| Household Size | # Housing Units | % Housing Units |
| 1-Person Household | 24 | 11.2% |
| 2-Person Household | 102 | 47.4% |
| 3-Person Household | 17 | 7.9% |
| 4+ Person Household | 72 | 33.5% |
| Total Housing Units | 215 | 100.0% |
Occupancy by Ownership by Household Size in Borden County
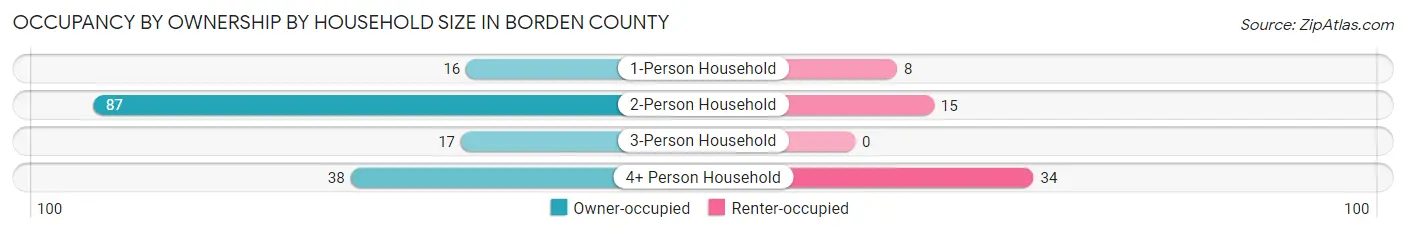
| Household Size | Owner-occupied | Renter-occupied |
| 1-Person Household | 16 (66.7%) | 8 (33.3%) |
| 2-Person Household | 87 (85.3%) | 15 (14.7%) |
| 3-Person Household | 17 (100.0%) | 0 (0.0%) |
| 4+ Person Household | 38 (52.8%) | 34 (47.2%) |
| Total Housing Units | 158 (73.5%) | 57 (26.5%) |
Occupancy by Educational Attainment in Borden County
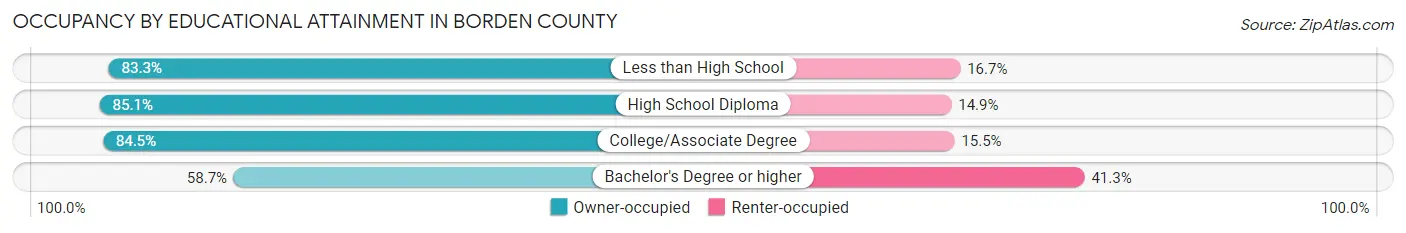
| Household Size | Owner-occupied | Renter-occupied |
| Less than High School | 15 (83.3%) | 3 (16.7%) |
| High School Diploma | 40 (85.1%) | 7 (14.9%) |
| College/Associate Degree | 49 (84.5%) | 9 (15.5%) |
| Bachelor's Degree or higher | 54 (58.7%) | 38 (41.3%) |
Occupancy by Age of Householder in Borden County
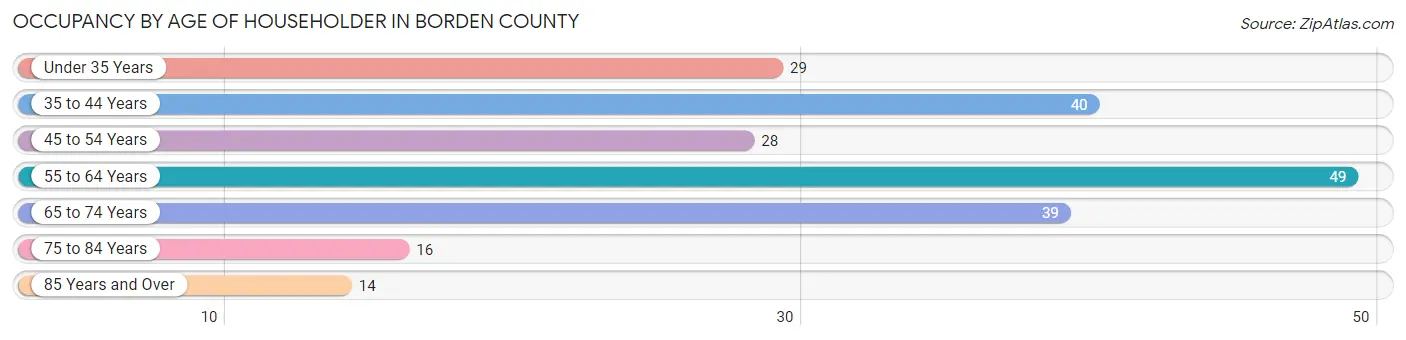
| Age Bracket | # Households | % Households |
| Under 35 Years | 29 | 13.5% |
| 35 to 44 Years | 40 | 18.6% |
| 45 to 54 Years | 28 | 13.0% |
| 55 to 64 Years | 49 | 22.8% |
| 65 to 74 Years | 39 | 18.1% |
| 75 to 84 Years | 16 | 7.4% |
| 85 Years and Over | 14 | 6.5% |
| Total | 215 | 100.0% |
Housing Finances in Borden County
Median Income by Occupancy in Borden County
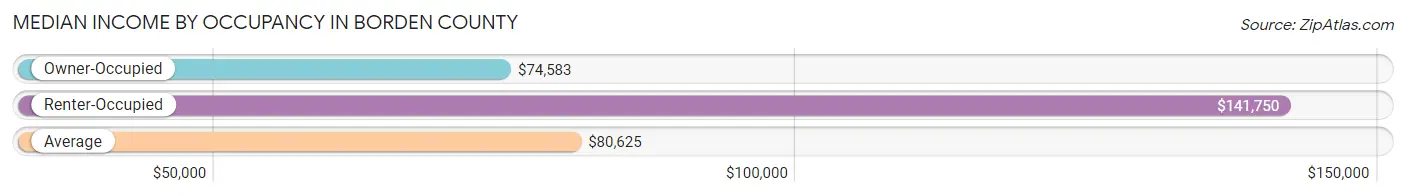
| Occupancy Type | # Households | Median Income |
| Owner-Occupied | 158 (73.5%) | $74,583 |
| Renter-Occupied | 57 (26.5%) | $141,750 |
| Average | 215 (100.0%) | $80,625 |
Occupancy by Householder Income Bracket in Borden County
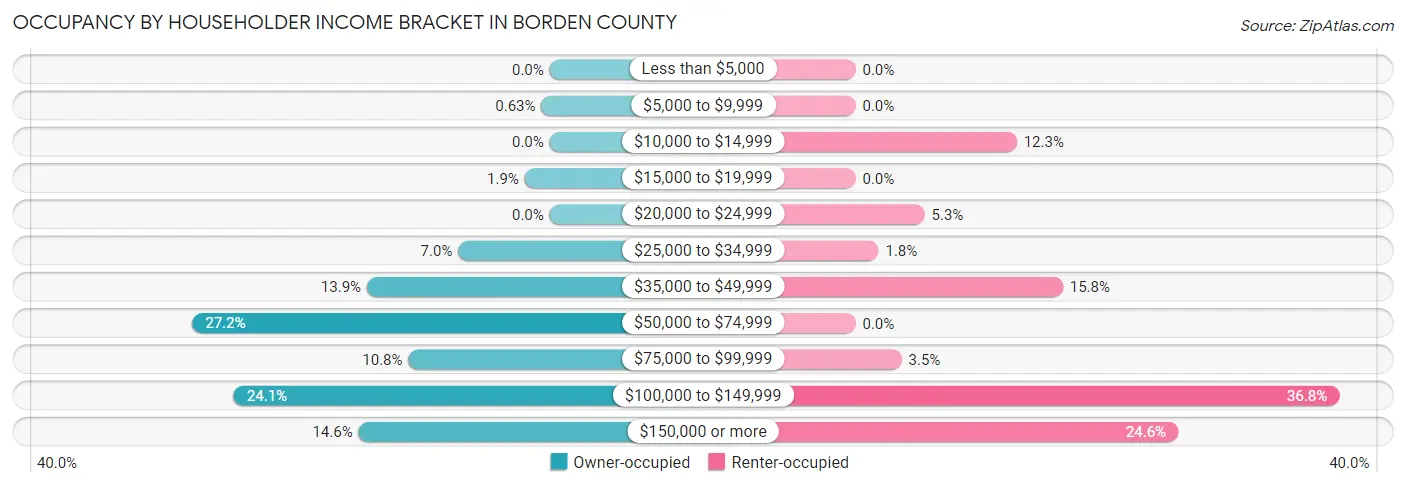
| Income Bracket | Owner-occupied | Renter-occupied |
| Less than $5,000 | 0 (0.0%) | 0 (0.0%) |
| $5,000 to $9,999 | 1 (0.6%) | 0 (0.0%) |
| $10,000 to $14,999 | 0 (0.0%) | 7 (12.3%) |
| $15,000 to $19,999 | 3 (1.9%) | 0 (0.0%) |
| $20,000 to $24,999 | 0 (0.0%) | 3 (5.3%) |
| $25,000 to $34,999 | 11 (7.0%) | 1 (1.8%) |
| $35,000 to $49,999 | 22 (13.9%) | 9 (15.8%) |
| $50,000 to $74,999 | 43 (27.2%) | 0 (0.0%) |
| $75,000 to $99,999 | 17 (10.8%) | 2 (3.5%) |
| $100,000 to $149,999 | 38 (24.0%) | 21 (36.8%) |
| $150,000 or more | 23 (14.6%) | 14 (24.6%) |
| Total | 158 (100.0%) | 57 (100.0%) |
Monthly Housing Cost Tiers in Borden County
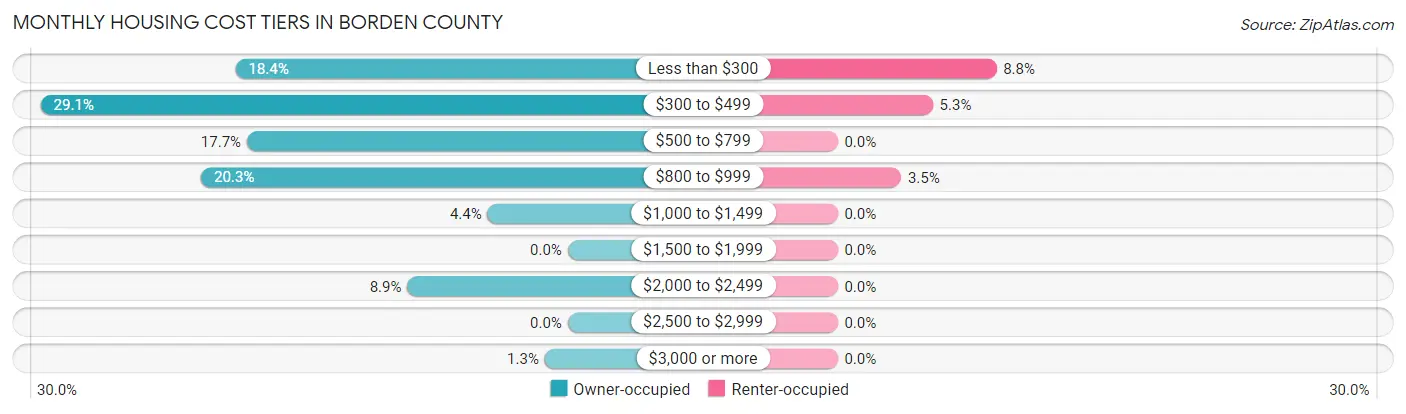
| Monthly Cost | Owner-occupied | Renter-occupied |
| Less than $300 | 29 (18.3%) | 5 (8.8%) |
| $300 to $499 | 46 (29.1%) | 3 (5.3%) |
| $500 to $799 | 28 (17.7%) | 0 (0.0%) |
| $800 to $999 | 32 (20.3%) | 2 (3.5%) |
| $1,000 to $1,499 | 7 (4.4%) | 0 (0.0%) |
| $1,500 to $1,999 | 0 (0.0%) | 0 (0.0%) |
| $2,000 to $2,499 | 14 (8.9%) | 0 (0.0%) |
| $2,500 to $2,999 | 0 (0.0%) | 0 (0.0%) |
| $3,000 or more | 2 (1.3%) | 0 (0.0%) |
| Total | 158 (100.0%) | 57 (100.0%) |
Physical Housing Characteristics in Borden County
Housing Structures in Borden County
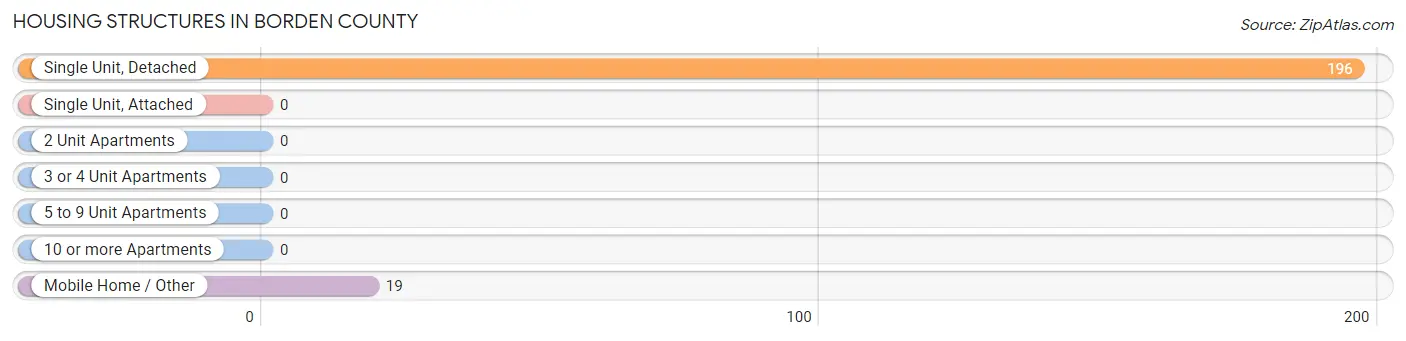
| Structure Type | # Housing Units | % Housing Units |
| Single Unit, Detached | 196 | 91.2% |
| Single Unit, Attached | 0 | 0.0% |
| 2 Unit Apartments | 0 | 0.0% |
| 3 or 4 Unit Apartments | 0 | 0.0% |
| 5 to 9 Unit Apartments | 0 | 0.0% |
| 10 or more Apartments | 0 | 0.0% |
| Mobile Home / Other | 19 | 8.8% |
| Total | 215 | 100.0% |
Housing Structures by Occupancy in Borden County
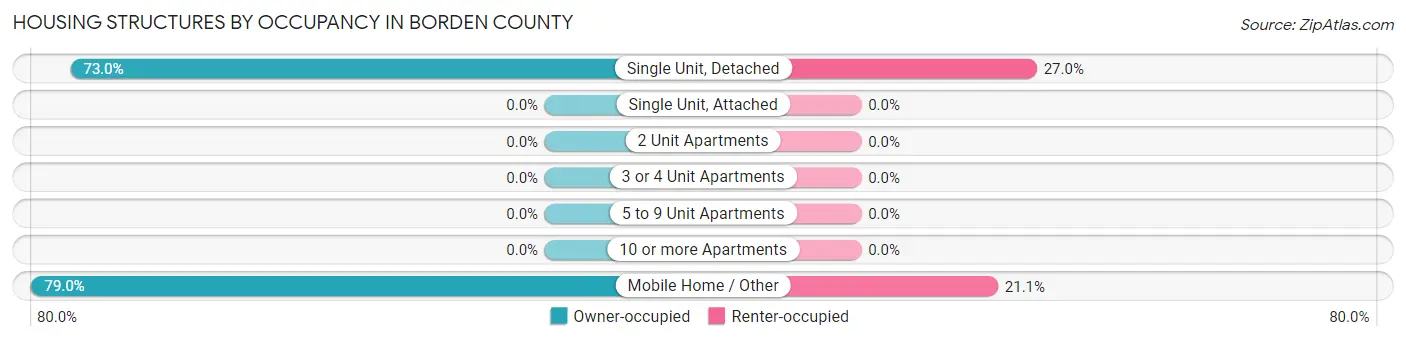
| Structure Type | Owner-occupied | Renter-occupied |
| Single Unit, Detached | 143 (73.0%) | 53 (27.0%) |
| Single Unit, Attached | 0 (0.0%) | 0 (0.0%) |
| 2 Unit Apartments | 0 (0.0%) | 0 (0.0%) |
| 3 or 4 Unit Apartments | 0 (0.0%) | 0 (0.0%) |
| 5 to 9 Unit Apartments | 0 (0.0%) | 0 (0.0%) |
| 10 or more Apartments | 0 (0.0%) | 0 (0.0%) |
| Mobile Home / Other | 15 (78.9%) | 4 (21.0%) |
| Total | 158 (73.5%) | 57 (26.5%) |
Housing Structures by Number of Rooms in Borden County
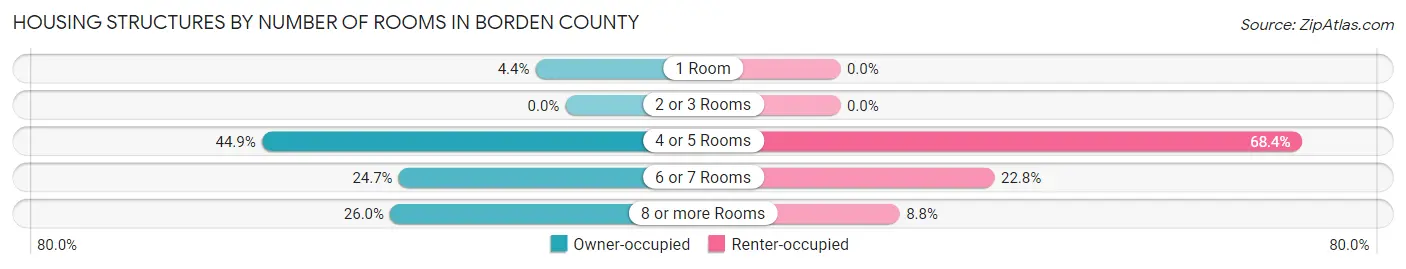
| Number of Rooms | Owner-occupied | Renter-occupied |
| 1 Room | 7 (4.4%) | 0 (0.0%) |
| 2 or 3 Rooms | 0 (0.0%) | 0 (0.0%) |
| 4 or 5 Rooms | 71 (44.9%) | 39 (68.4%) |
| 6 or 7 Rooms | 39 (24.7%) | 13 (22.8%) |
| 8 or more Rooms | 41 (26.0%) | 5 (8.8%) |
| Total | 158 (100.0%) | 57 (100.0%) |
Housing Structure by Heating Type in Borden County
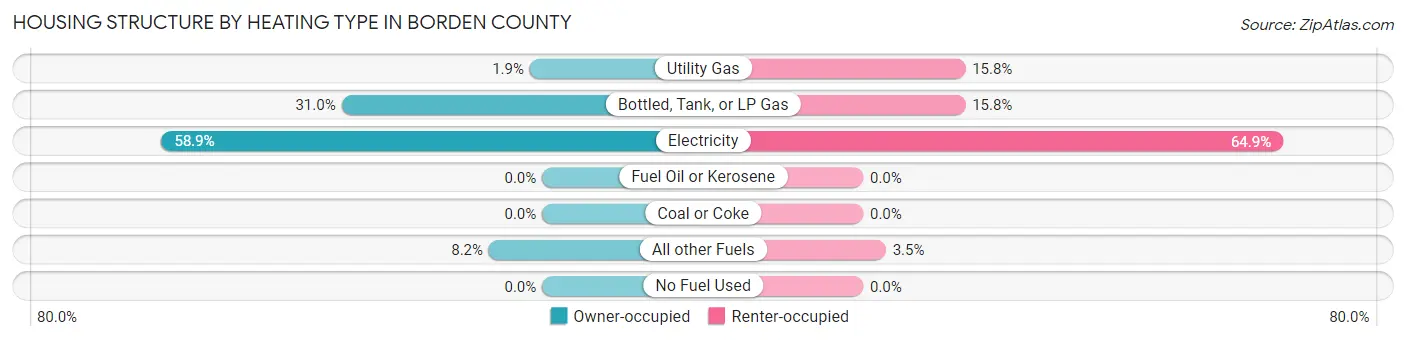
| Heating Type | Owner-occupied | Renter-occupied |
| Utility Gas | 3 (1.9%) | 9 (15.8%) |
| Bottled, Tank, or LP Gas | 49 (31.0%) | 9 (15.8%) |
| Electricity | 93 (58.9%) | 37 (64.9%) |
| Fuel Oil or Kerosene | 0 (0.0%) | 0 (0.0%) |
| Coal or Coke | 0 (0.0%) | 0 (0.0%) |
| All other Fuels | 13 (8.2%) | 2 (3.5%) |
| No Fuel Used | 0 (0.0%) | 0 (0.0%) |
| Total | 158 (100.0%) | 57 (100.0%) |
Household Vehicle Usage in Borden County
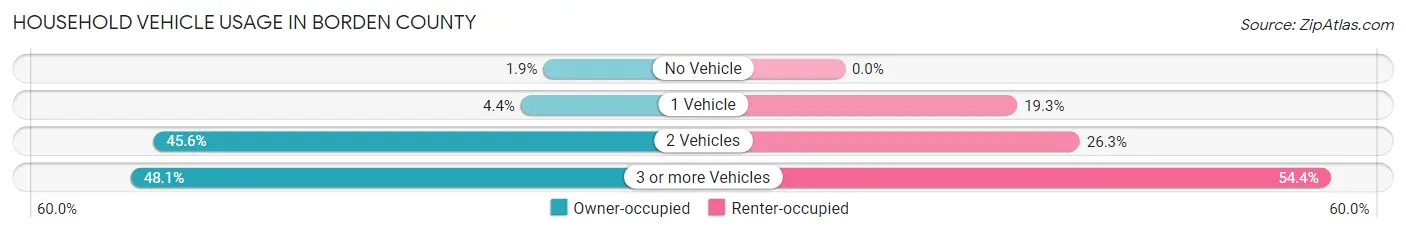
| Vehicles per Household | Owner-occupied | Renter-occupied |
| No Vehicle | 3 (1.9%) | 0 (0.0%) |
| 1 Vehicle | 7 (4.4%) | 11 (19.3%) |
| 2 Vehicles | 72 (45.6%) | 15 (26.3%) |
| 3 or more Vehicles | 76 (48.1%) | 31 (54.4%) |
| Total | 158 (100.0%) | 57 (100.0%) |
Real Estate & Mortgages in Borden County
Real Estate and Mortgage Overview in Borden County
| Characteristic | Without Mortgage | With Mortgage |
| Housing Units | 122 | 36 |
| Median Property Value | $88,600 | $0 |
| Median Household Income | $62,500 | $0 |
| Monthly Housing Costs | $391 | $0 |
| Real Estate Taxes | $400 | $0 |
Property Value by Mortgage Status in Borden County
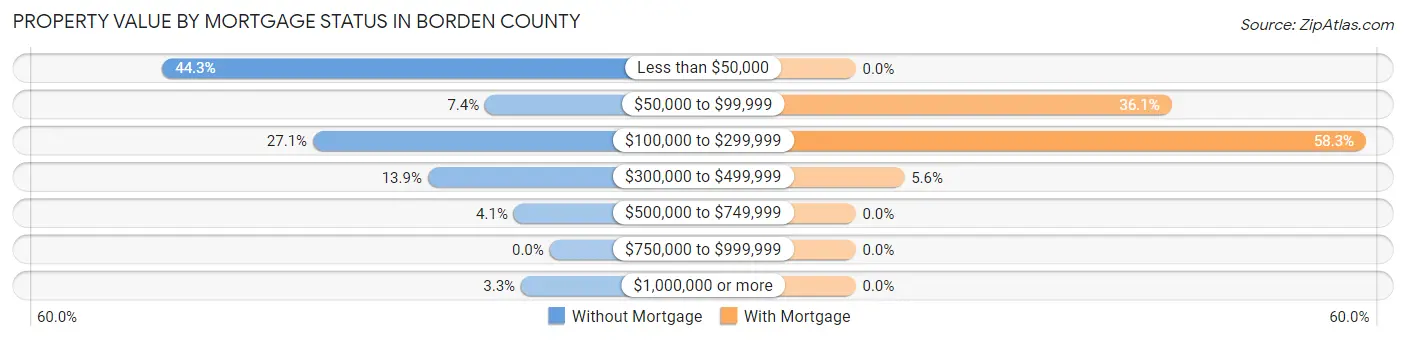
| Property Value | Without Mortgage | With Mortgage |
| Less than $50,000 | 54 (44.3%) | 0 (0.0%) |
| $50,000 to $99,999 | 9 (7.4%) | 13 (36.1%) |
| $100,000 to $299,999 | 33 (27.1%) | 21 (58.3%) |
| $300,000 to $499,999 | 17 (13.9%) | 2 (5.6%) |
| $500,000 to $749,999 | 5 (4.1%) | 0 (0.0%) |
| $750,000 to $999,999 | 0 (0.0%) | 0 (0.0%) |
| $1,000,000 or more | 4 (3.3%) | 0 (0.0%) |
| Total | 122 (100.0%) | 36 (100.0%) |
Household Income by Mortgage Status in Borden County
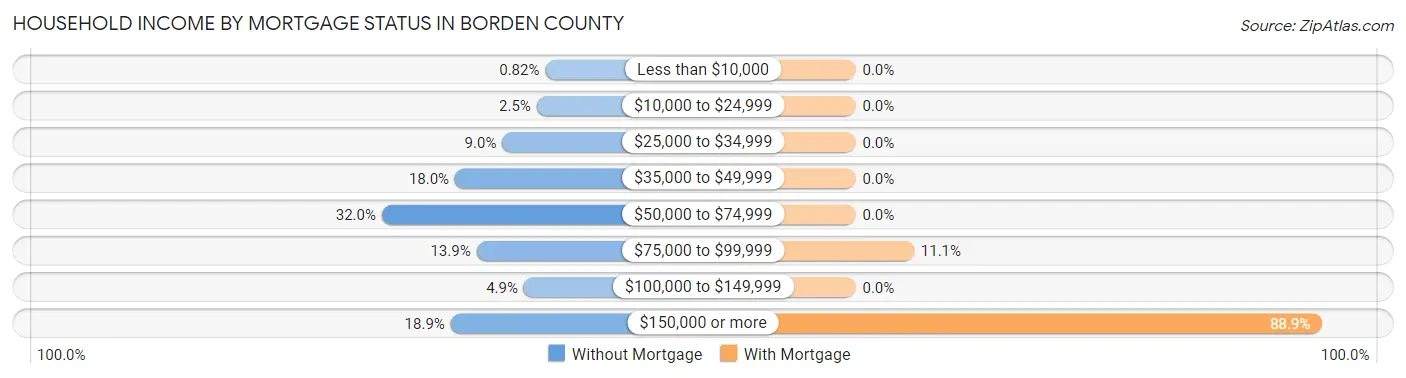
| Household Income | Without Mortgage | With Mortgage |
| Less than $10,000 | 1 (0.8%) | 0 (0.0%) |
| $10,000 to $24,999 | 3 (2.5%) | 0 (0.0%) |
| $25,000 to $34,999 | 11 (9.0%) | 0 (0.0%) |
| $35,000 to $49,999 | 22 (18.0%) | 0 (0.0%) |
| $50,000 to $74,999 | 39 (32.0%) | 0 (0.0%) |
| $75,000 to $99,999 | 17 (13.9%) | 4 (11.1%) |
| $100,000 to $149,999 | 6 (4.9%) | 0 (0.0%) |
| $150,000 or more | 23 (18.9%) | 32 (88.9%) |
| Total | 122 (100.0%) | 36 (100.0%) |
Property Value to Household Income Ratio in Borden County
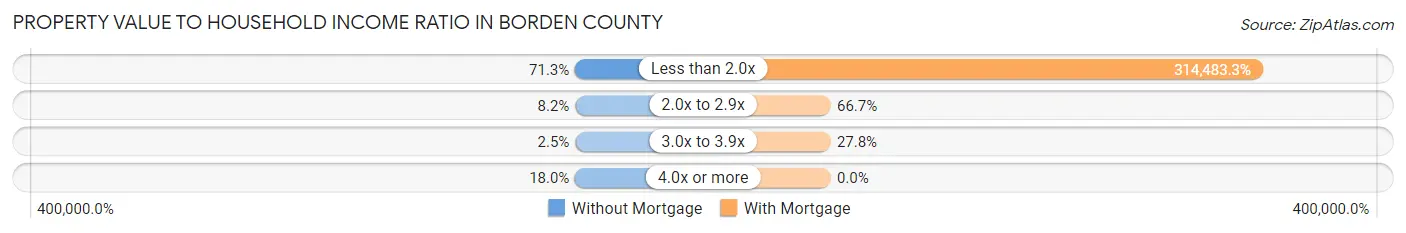
| Value-to-Income Ratio | Without Mortgage | With Mortgage |
| Less than 2.0x | 87 (71.3%) | 113,214 (314,483.3%) |
| 2.0x to 2.9x | 10 (8.2%) | 24 (66.7%) |
| 3.0x to 3.9x | 3 (2.5%) | 10 (27.8%) |
| 4.0x or more | 22 (18.0%) | 0 (0.0%) |
| Total | 122 (100.0%) | 36 (100.0%) |
Real Estate Taxes by Mortgage Status in Borden County
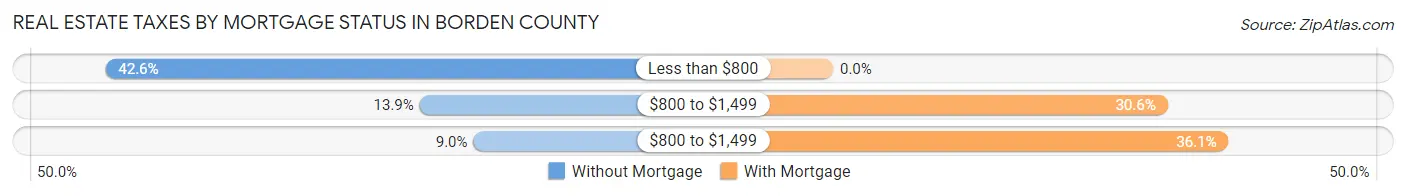
| Property Taxes | Without Mortgage | With Mortgage |
| Less than $800 | 52 (42.6%) | 0 (0.0%) |
| $800 to $1,499 | 17 (13.9%) | 11 (30.6%) |
| $800 to $1,499 | 11 (9.0%) | 13 (36.1%) |
| Total | 122 (100.0%) | 36 (100.0%) |
Health & Disability in Borden County
Health Insurance Coverage by Age in Borden County
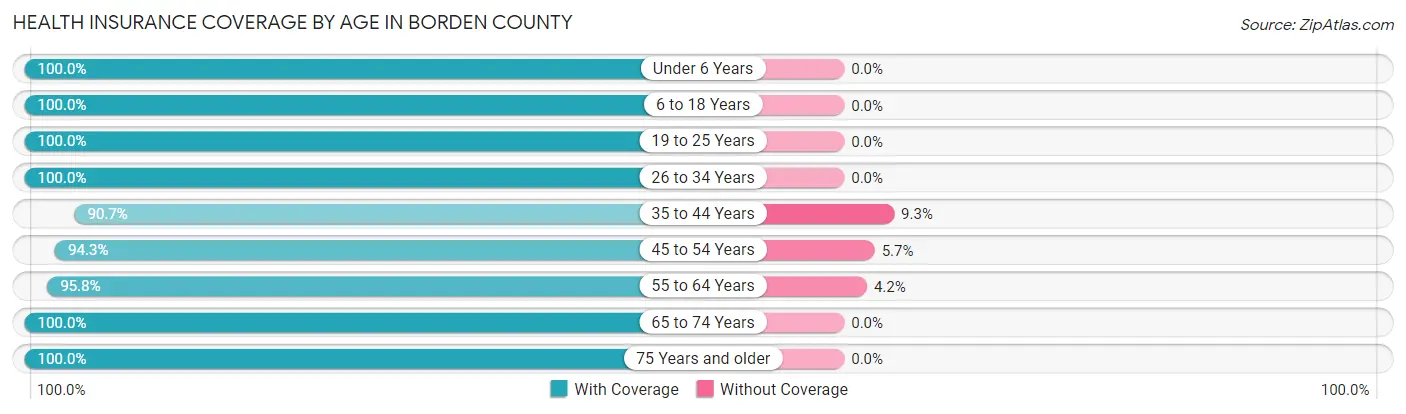
| Age Bracket | With Coverage | Without Coverage |
| Under 6 Years | 76 (100.0%) | 0 (0.0%) |
| 6 to 18 Years | 171 (100.0%) | 0 (0.0%) |
| 19 to 25 Years | 9 (100.0%) | 0 (0.0%) |
| 26 to 34 Years | 59 (100.0%) | 0 (0.0%) |
| 35 to 44 Years | 78 (90.7%) | 8 (9.3%) |
| 45 to 54 Years | 83 (94.3%) | 5 (5.7%) |
| 55 to 64 Years | 68 (95.8%) | 3 (4.2%) |
| 65 to 74 Years | 87 (100.0%) | 0 (0.0%) |
| 75 Years and older | 39 (100.0%) | 0 (0.0%) |
| Total | 670 (97.7%) | 16 (2.3%) |
Health Insurance Coverage by Citizenship Status in Borden County
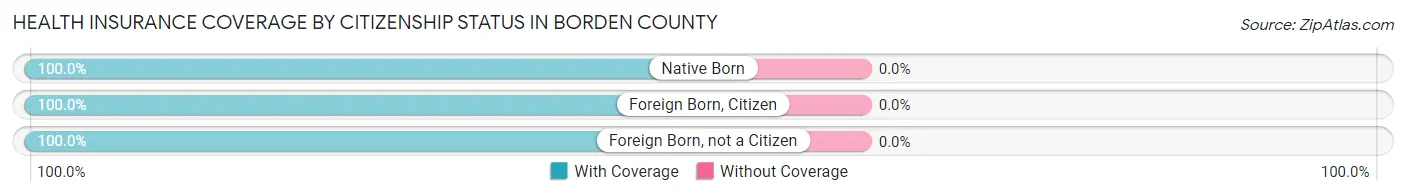
| Citizenship Status | With Coverage | Without Coverage |
| Native Born | 76 (100.0%) | 0 (0.0%) |
| Foreign Born, Citizen | 171 (100.0%) | 0 (0.0%) |
| Foreign Born, not a Citizen | 9 (100.0%) | 0 (0.0%) |
Health Insurance Coverage by Household Income in Borden County
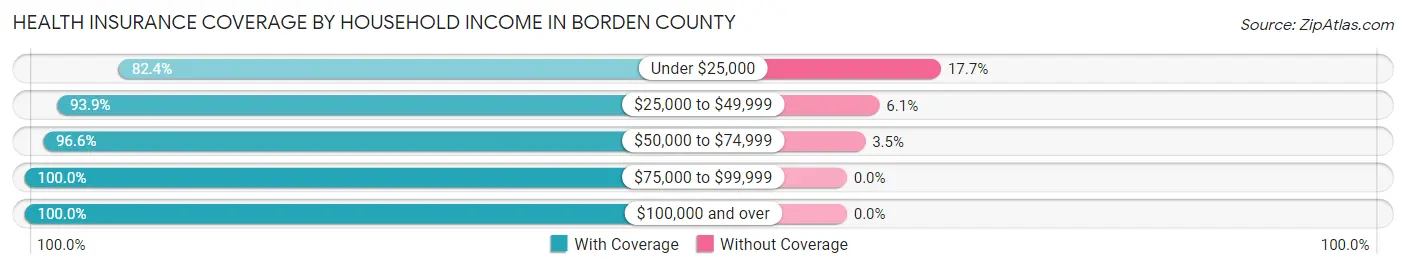
| Household Income | With Coverage | Without Coverage |
| Under $25,000 | 14 (82.4%) | 3 (17.6%) |
| $25,000 to $49,999 | 123 (93.9%) | 8 (6.1%) |
| $50,000 to $74,999 | 140 (96.6%) | 5 (3.5%) |
| $75,000 to $99,999 | 38 (100.0%) | 0 (0.0%) |
| $100,000 and over | 355 (100.0%) | 0 (0.0%) |
Public vs Private Health Insurance Coverage by Age in Borden County
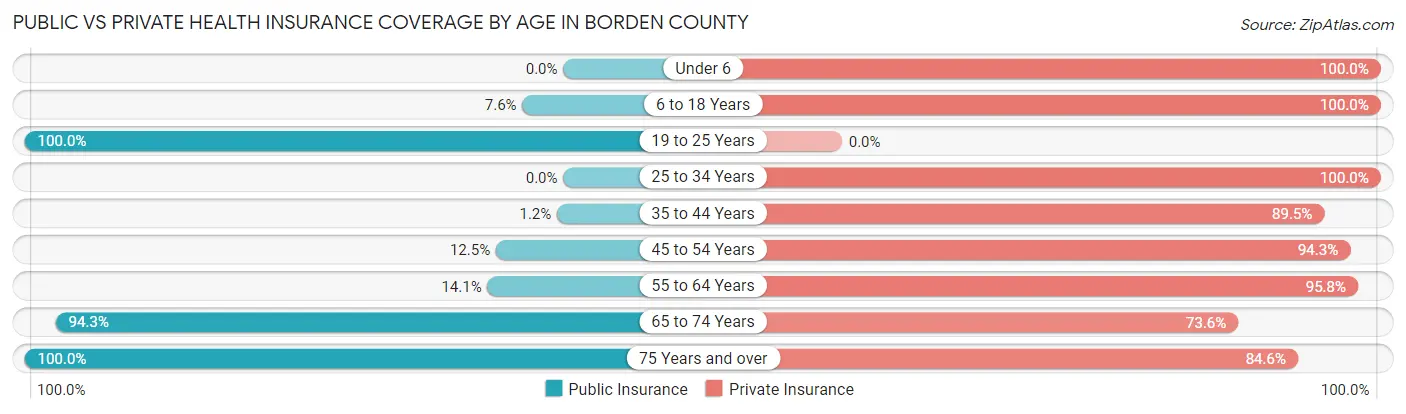
| Age Bracket | Public Insurance | Private Insurance |
| Under 6 | 0 (0.0%) | 76 (100.0%) |
| 6 to 18 Years | 13 (7.6%) | 171 (100.0%) |
| 19 to 25 Years | 9 (100.0%) | 0 (0.0%) |
| 25 to 34 Years | 0 (0.0%) | 59 (100.0%) |
| 35 to 44 Years | 1 (1.2%) | 77 (89.5%) |
| 45 to 54 Years | 11 (12.5%) | 83 (94.3%) |
| 55 to 64 Years | 10 (14.1%) | 68 (95.8%) |
| 65 to 74 Years | 82 (94.3%) | 64 (73.6%) |
| 75 Years and over | 39 (100.0%) | 33 (84.6%) |
| Total | 165 (24.0%) | 631 (92.0%) |
Disability Status by Sex by Age in Borden County
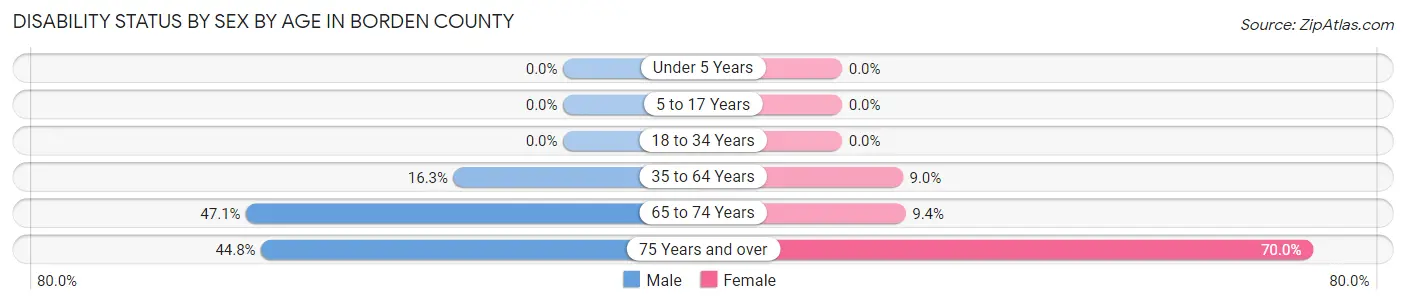
| Age Bracket | Male | Female |
| Under 5 Years | 0 (0.0%) | 0 (0.0%) |
| 5 to 17 Years | 0 (0.0%) | 0 (0.0%) |
| 18 to 34 Years | 0 (0.0%) | 0 (0.0%) |
| 35 to 64 Years | 20 (16.3%) | 11 (9.0%) |
| 65 to 74 Years | 16 (47.1%) | 5 (9.4%) |
| 75 Years and over | 13 (44.8%) | 7 (70.0%) |
Disability Class by Sex by Age in Borden County
Disability Class: Hearing Difficulty
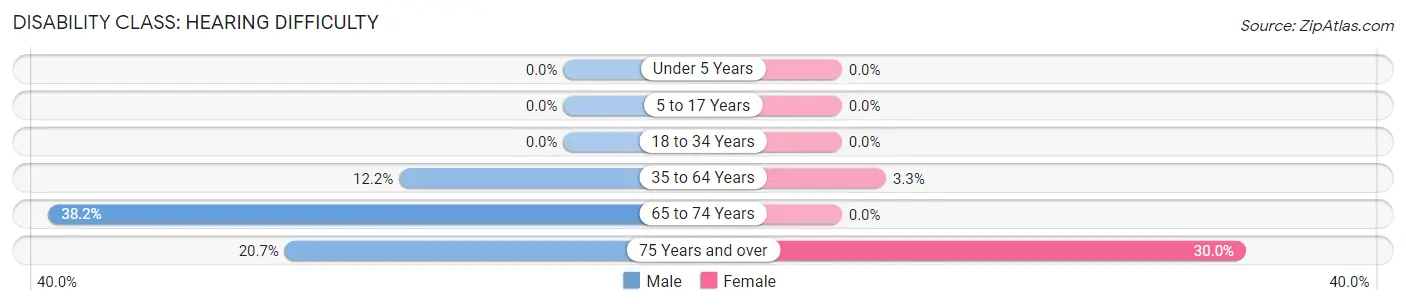
| Age Bracket | Male | Female |
| Under 5 Years | 0 (0.0%) | 0 (0.0%) |
| 5 to 17 Years | 0 (0.0%) | 0 (0.0%) |
| 18 to 34 Years | 0 (0.0%) | 0 (0.0%) |
| 35 to 64 Years | 15 (12.2%) | 4 (3.3%) |
| 65 to 74 Years | 13 (38.2%) | 0 (0.0%) |
| 75 Years and over | 6 (20.7%) | 3 (30.0%) |
Disability Class: Vision Difficulty
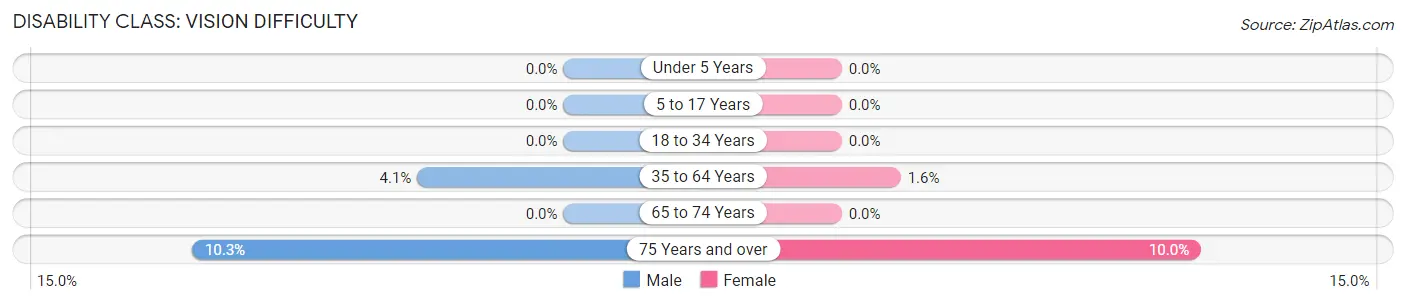
| Age Bracket | Male | Female |
| Under 5 Years | 0 (0.0%) | 0 (0.0%) |
| 5 to 17 Years | 0 (0.0%) | 0 (0.0%) |
| 18 to 34 Years | 0 (0.0%) | 0 (0.0%) |
| 35 to 64 Years | 5 (4.1%) | 2 (1.6%) |
| 65 to 74 Years | 0 (0.0%) | 0 (0.0%) |
| 75 Years and over | 3 (10.3%) | 1 (10.0%) |
Disability Class: Cognitive Difficulty
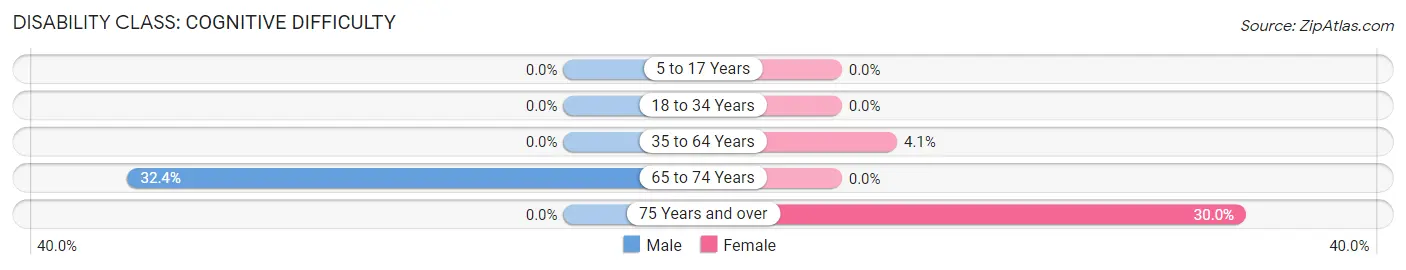
| Age Bracket | Male | Female |
| 5 to 17 Years | 0 (0.0%) | 0 (0.0%) |
| 18 to 34 Years | 0 (0.0%) | 0 (0.0%) |
| 35 to 64 Years | 0 (0.0%) | 5 (4.1%) |
| 65 to 74 Years | 11 (32.4%) | 0 (0.0%) |
| 75 Years and over | 0 (0.0%) | 3 (30.0%) |
Disability Class: Ambulatory Difficulty
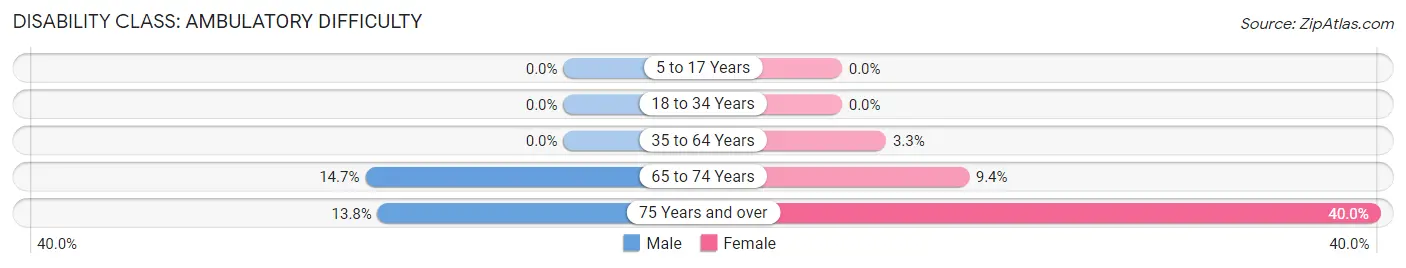
| Age Bracket | Male | Female |
| 5 to 17 Years | 0 (0.0%) | 0 (0.0%) |
| 18 to 34 Years | 0 (0.0%) | 0 (0.0%) |
| 35 to 64 Years | 0 (0.0%) | 4 (3.3%) |
| 65 to 74 Years | 5 (14.7%) | 5 (9.4%) |
| 75 Years and over | 4 (13.8%) | 4 (40.0%) |
Disability Class: Self-Care Difficulty
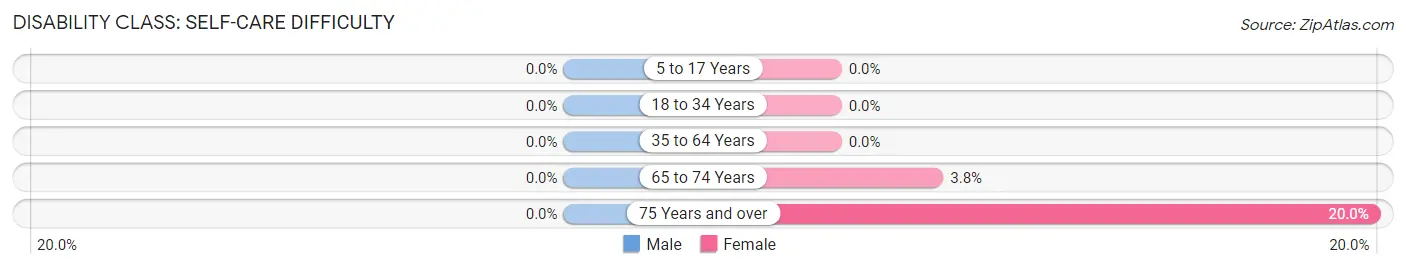
| Age Bracket | Male | Female |
| 5 to 17 Years | 0 (0.0%) | 0 (0.0%) |
| 18 to 34 Years | 0 (0.0%) | 0 (0.0%) |
| 35 to 64 Years | 0 (0.0%) | 0 (0.0%) |
| 65 to 74 Years | 0 (0.0%) | 2 (3.8%) |
| 75 Years and over | 0 (0.0%) | 2 (20.0%) |
Technology Access in Borden County
Computing Device Access in Borden County
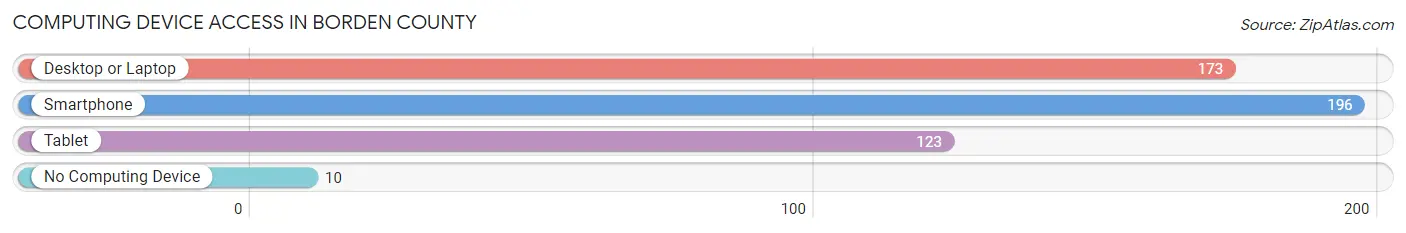
| Device Type | # Households | % Households |
| Desktop or Laptop | 173 | 80.5% |
| Smartphone | 196 | 91.2% |
| Tablet | 123 | 57.2% |
| No Computing Device | 10 | 4.6% |
| Total | 215 | 100.0% |
Internet Access in Borden County
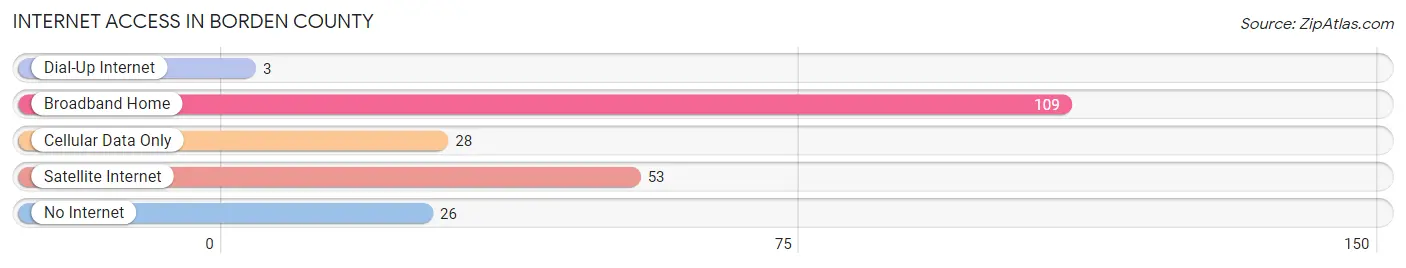
| Internet Type | # Households | % Households |
| Dial-Up Internet | 3 | 1.4% |
| Broadband Home | 109 | 50.7% |
| Cellular Data Only | 28 | 13.0% |
| Satellite Internet | 53 | 24.6% |
| No Internet | 26 | 12.1% |
| Total | 215 | 100.0% |
Borden County Summary
Borden County is a county located in the U.S. state of Texas. As of the 2010 census, its population was 641, making it the second-least populous county in Texas and the ninth-least populous county in the United States. Its county seat is Gail. The county was created in 1876 and organized in 1891. It is named for Gail Borden, Jr., a publisher and inventor.
Geography
Borden County is located in the western part of the state of Texas. It is bordered by Scurry County to the north, Fisher County to the east, Mitchell County to the south, and Howard County to the west. The county has a total area of 910 square miles, of which 909 square miles is land and 1 square mile (0.1%) is water.
The terrain of Borden County is generally flat, with some rolling hills in the northern part of the county. The county is drained by the Colorado River, which forms its western boundary. The county is part of the High Plains region of Texas, and is mostly covered in grasslands.
Demographics
As of the 2010 census, there were 641 people, 246 households, and 181 families residing in the county. The population density was 0.7 people per square mile. There were 305 housing units at an average density of 0.3 per square mile. The racial makeup of the county was 94.2% White, 0.2% Black or African American, 0.2% Native American, 0.2% Asian, 0.2% Pacific Islander, 4.2% from other races, and 0.9% from two or more races. 11.2% of the population were Hispanic or Latino of any race.
There were 246 households, out of which 28.9% had children under the age of 18 living with them, 63.6% were married couples living together, 5.7% had a female householder with no husband present, and 27.2% were non-families. 24.2% of all households were made up of individuals, and 11.4% had someone living alone who was 65 years of age or older. The average household size was 2.60 and the average family size was 3.10.
In the county, the population was spread out, with 25.7% under the age of 18, 6.2% from 18 to 24, 24.2% from 25 to 44, 28.2% from 45 to 64, and 15.7% who were 65 years of age or older. The median age was 41 years. For every 100 females there were 103.2 males. For every 100 females age 18 and over, there were 103.2 males.
The median income for a household in the county was $37,500, and the median income for a family was $45,000. Males had a median income of $30,000 versus $20,000 for females. The per capita income for the county was $17,845. About 8.2% of families and 10.2% of the population were below the poverty line, including 11.4% of those under age 18 and 11.1% of those age 65 or over.
Economy
The economy of Borden County is largely based on agriculture. The county is home to a variety of crops, including cotton, corn, wheat, sorghum, and hay. Livestock production is also important to the local economy, with cattle, sheep, and goats being raised in the area.
The county is also home to several oil and gas fields, which provide jobs and revenue to the local economy. The county is served by the Gail-Borden Public Utility District, which provides electricity and water to the area.
The county is served by the Gail Independent School District, which operates one elementary school, one middle school, and one high school. The county is also home to the Gail Public Library, which provides library services to the community.
Conclusion
Borden County is a rural county located in the western part of the state of Texas. It is home to a variety of crops and livestock, as well as oil and gas fields. The county is served by the Gail Independent School District and the Gail Public Library. The population of the county is small, but it is a vibrant and diverse community.
Common Questions
What is Per Capita Income in Borden County?
Per Capita income in Borden County is $39,276.
What is the Median Family Income in Borden County?
Median Family Income in Borden County is $82,222.
What is the Median Household income in Borden County?
Median Household Income in Borden County is $80,625.
What is Income or Wage Gap in Borden County?
Income or Wage Gap in Borden County is 47.7%.
Women in Borden County earn 52.3 cents for every dollar earned by a man.
What is Inequality or Gini Index in Borden County?
Inequality or Gini Index in Borden County is 0.46.
What is the Total Population of Borden County?
Total Population of Borden County is 686.
What is the Total Male Population of Borden County?
Total Male Population of Borden County is 301.
What is the Total Female Population of Borden County?
Total Female Population of Borden County is 385.
What is the Ratio of Males per 100 Females in Borden County?
There are 78.18 Males per 100 Females in Borden County.
What is the Ratio of Females per 100 Males in Borden County?
There are 127.91 Females per 100 Males in Borden County.
What is the Median Population Age in Borden County?
Median Population Age in Borden County is 36.5 Years.
What is the Average Family Size in Borden County
Average Family Size in Borden County is 3.5 People.
What is the Average Household Size in Borden County
Average Household Size in Borden County is 3.2 People.
How Large is the Labor Force in Borden County?
There are 284 People in the Labor Forcein in Borden County.
What is the Percentage of People in the Labor Force in Borden County?
57.5% of People are in the Labor Force in Borden County.
What is the Unemployment Rate in Borden County?
Unemployment Rate in Borden County is 1.8%.