Blanco County, TX Map & Demographics
Blanco County Overview
$46,356
PER CAPITA INCOME
$95,333
AVG FAMILY INCOME
$79,717
AVG HOUSEHOLD INCOME
30.9%
WAGE / INCOME GAP [ % ]
69.1¢/ $1
WAGE / INCOME GAP [ $ ]
0.46
INEQUALITY / GINI INDEX
11,608
TOTAL POPULATION
5,853
MALE POPULATION
5,755
FEMALE POPULATION
101.70
MALES / 100 FEMALES
98.33
FEMALES / 100 MALES
49.5
MEDIAN AGE
2.9
AVG FAMILY SIZE
2.4
AVG HOUSEHOLD SIZE
5,722
LABOR FORCE [ PEOPLE ]
58.3%
PERCENT IN LABOR FORCE
3.9%
UNEMPLOYMENT RATE
Blanco County Area Codes
Income in Blanco County
Income Overview in Blanco County
Per Capita Income in Blanco County is $46,356, while median incomes of families and households are $95,333 and $79,717 respectively.
| Characteristic | Number | Measure |
| Per Capita Income | 11,608 | $46,356 |
| Median Family Income | 3,362 | $95,333 |
| Mean Family Income | 3,362 | $124,150 |
| Median Household Income | 4,836 | $79,717 |
| Mean Household Income | 4,836 | $106,901 |
| Income Deficit | 3,362 | $0 |
| Wage / Income Gap (%) | 11,608 | 30.92% |
| Wage / Income Gap ($) | 11,608 | 69.08¢ per $1 |
| Gini / Inequality Index | 11,608 | 0.46 |
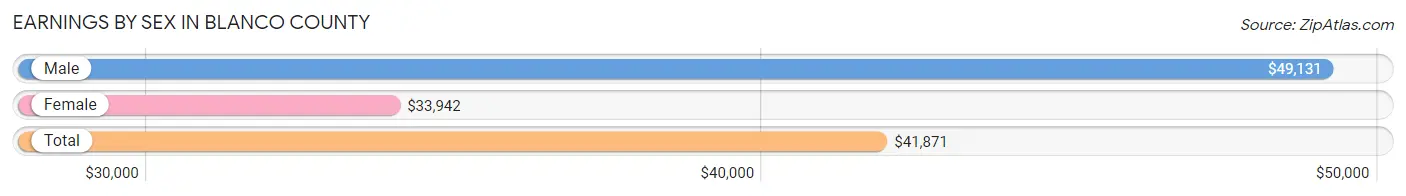
Earnings by Sex in Blanco County
Average Earnings in Blanco County are $41,871, $49,131 for men and $33,942 for women, a difference of 30.9%.
| Sex | Number | Average Earnings |
| Male | 3,560 (57.7%) | $49,131 |
| Female | 2,614 (42.3%) | $33,942 |
| Total | 6,174 (100.0%) | $41,871 |
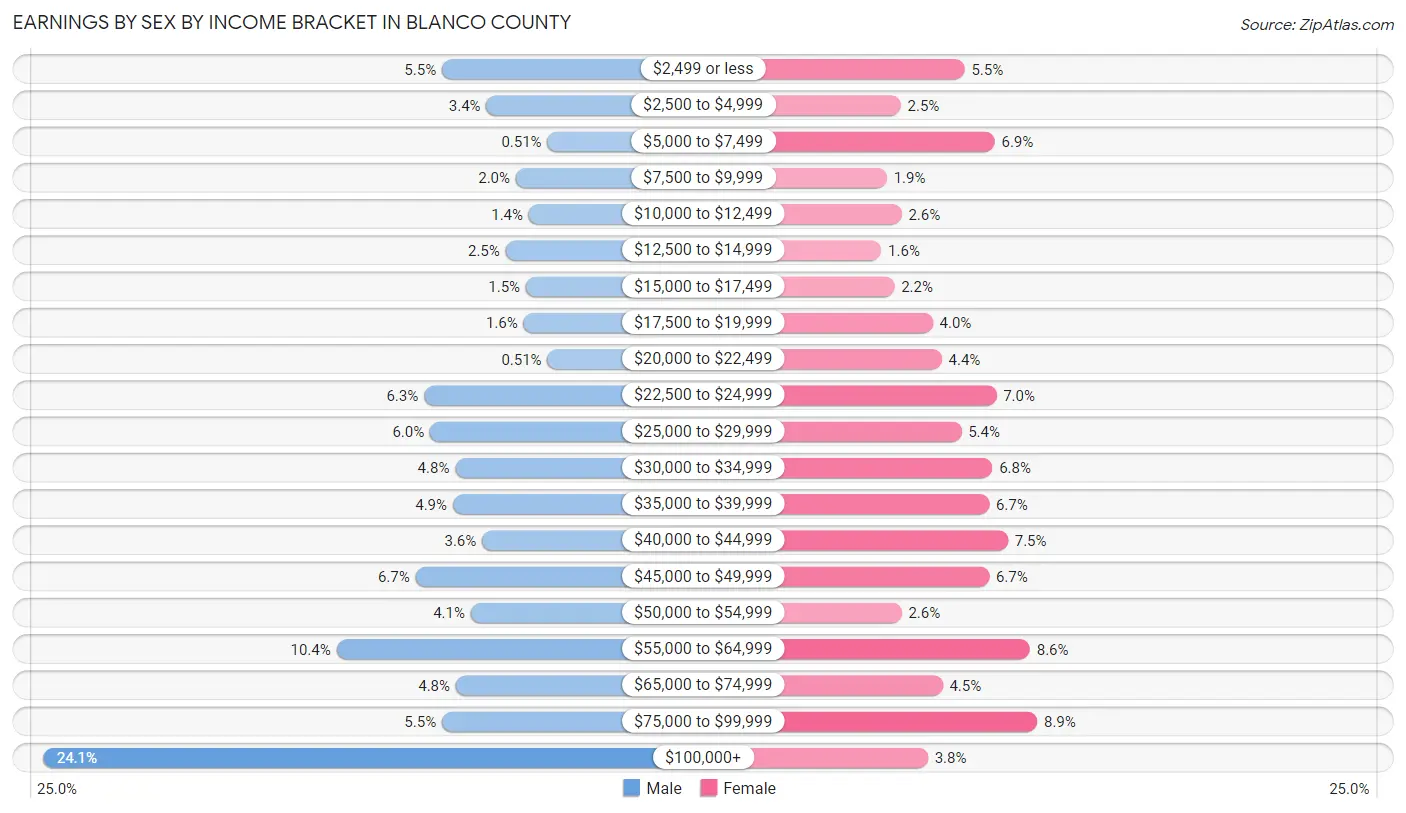
Earnings by Sex by Income Bracket in Blanco County
The most common earnings brackets in Blanco County are $100,000+ for men (858 | 24.1%) and $75,000 to $99,999 for women (233 | 8.9%).
| Income | Male | Female |
| $2,499 or less | 194 (5.4%) | 144 (5.5%) |
| $2,500 to $4,999 | 120 (3.4%) | 66 (2.5%) |
| $5,000 to $7,499 | 18 (0.5%) | 181 (6.9%) |
| $7,500 to $9,999 | 71 (2.0%) | 49 (1.9%) |
| $10,000 to $12,499 | 49 (1.4%) | 67 (2.6%) |
| $12,500 to $14,999 | 88 (2.5%) | 42 (1.6%) |
| $15,000 to $17,499 | 54 (1.5%) | 58 (2.2%) |
| $17,500 to $19,999 | 58 (1.6%) | 105 (4.0%) |
| $20,000 to $22,499 | 18 (0.5%) | 116 (4.4%) |
| $22,500 to $24,999 | 224 (6.3%) | 183 (7.0%) |
| $25,000 to $29,999 | 214 (6.0%) | 140 (5.4%) |
| $30,000 to $34,999 | 172 (4.8%) | 178 (6.8%) |
| $35,000 to $39,999 | 176 (4.9%) | 174 (6.7%) |
| $40,000 to $44,999 | 127 (3.6%) | 197 (7.5%) |
| $45,000 to $49,999 | 238 (6.7%) | 174 (6.7%) |
| $50,000 to $54,999 | 146 (4.1%) | 67 (2.6%) |
| $55,000 to $64,999 | 370 (10.4%) | 224 (8.6%) |
| $65,000 to $74,999 | 171 (4.8%) | 117 (4.5%) |
| $75,000 to $99,999 | 194 (5.4%) | 233 (8.9%) |
| $100,000+ | 858 (24.1%) | 99 (3.8%) |
| Total | 3,560 (100.0%) | 2,614 (100.0%) |
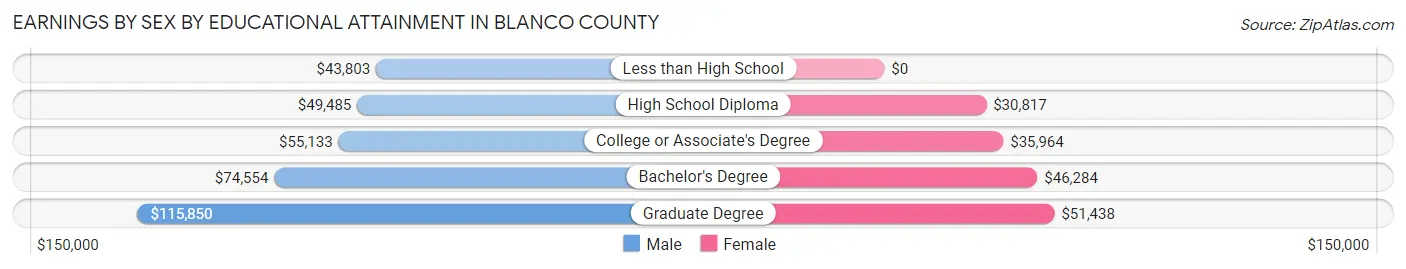
Earnings by Sex by Educational Attainment in Blanco County
Average earnings in Blanco County are $54,880 for men and $37,591 for women, a difference of 31.5%. Men with an educational attainment of graduate degree enjoy the highest average annual earnings of $115,850, while those with less than high school education earn the least with $43,803. Women with an educational attainment of graduate degree earn the most with the average annual earnings of $51,438, while those with high school diploma education have the smallest earnings of $30,817.
| Educational Attainment | Male Income | Female Income |
| Less than High School | $43,803 | $0 |
| High School Diploma | $49,485 | $30,817 |
| College or Associate's Degree | $55,133 | $35,964 |
| Bachelor's Degree | $74,554 | $46,284 |
| Graduate Degree | $115,850 | $51,438 |
| Total | $54,880 | $37,591 |
Family Income in Blanco County
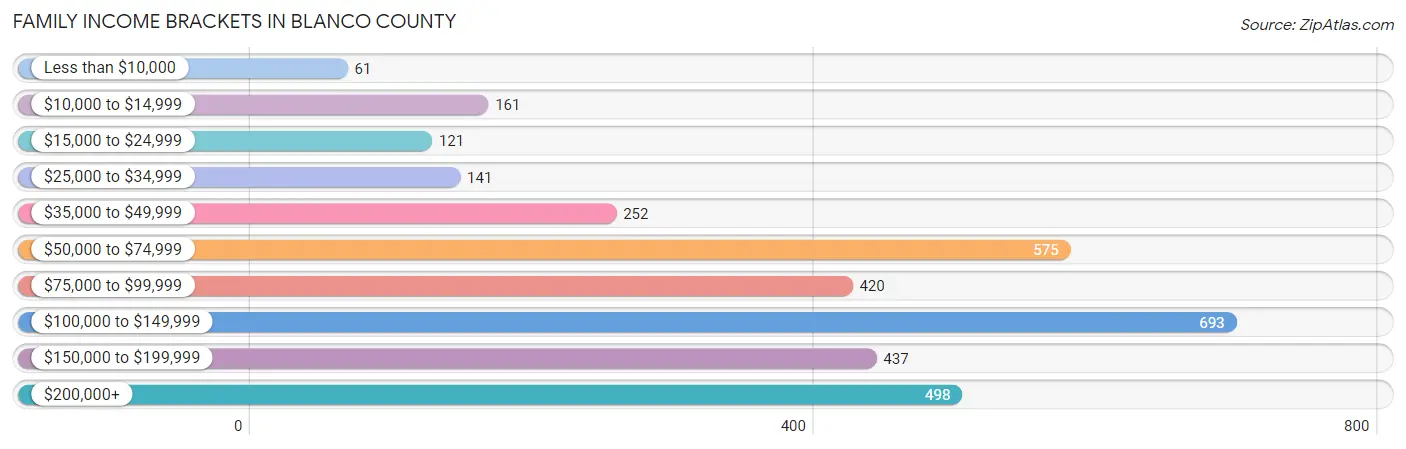
Family Income Brackets in Blanco County
According to the Blanco County family income data, there are 693 families falling into the $100,000 to $149,999 income range, which is the most common income bracket and makes up 20.6% of all families. Conversely, the less than $10,000 income bracket is the least frequent group with only 61 families (1.8%) belonging to this category.
| Income Bracket | # Families | % Families |
| Less than $10,000 | 61 | 1.8% |
| $10,000 to $14,999 | 161 | 4.8% |
| $15,000 to $24,999 | 121 | 3.6% |
| $25,000 to $34,999 | 141 | 4.2% |
| $35,000 to $49,999 | 252 | 7.5% |
| $50,000 to $74,999 | 575 | 17.1% |
| $75,000 to $99,999 | 420 | 12.5% |
| $100,000 to $149,999 | 693 | 20.6% |
| $150,000 to $199,999 | 437 | 13.0% |
| $200,000+ | 498 | 14.8% |
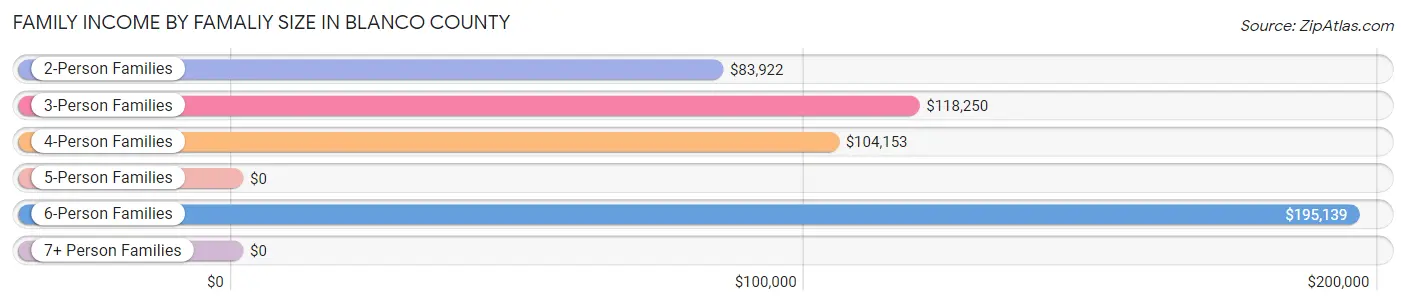
Family Income by Famaliy Size in Blanco County
6-person families (53 | 1.6%) account for the highest median family income in Blanco County with $195,139 per family, while 2-person families (2,086 | 62.1%) have the highest median income of $41,961 per family member.
| Income Bracket | # Families | Median Income |
| 2-Person Families | 2,086 (62.1%) | $83,922 |
| 3-Person Families | 387 (11.5%) | $118,250 |
| 4-Person Families | 521 (15.5%) | $104,153 |
| 5-Person Families | 273 (8.1%) | $0 |
| 6-Person Families | 53 (1.6%) | $195,139 |
| 7+ Person Families | 42 (1.3%) | $0 |
| Total | 3,362 (100.0%) | $95,333 |
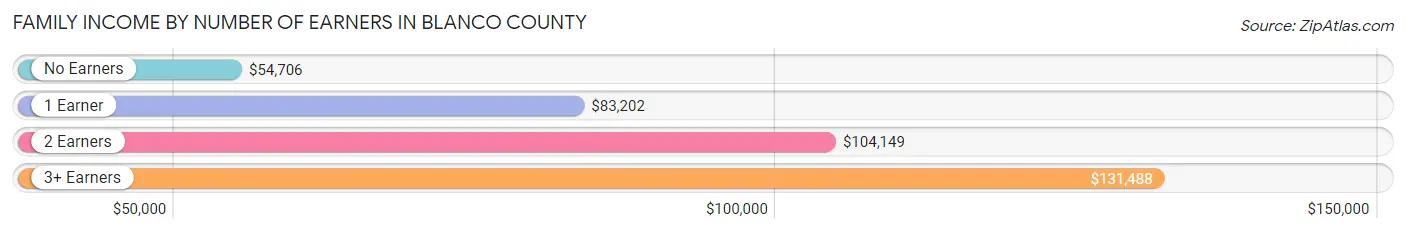
Family Income by Number of Earners in Blanco County
The median family income in Blanco County is $95,333, with families comprising 3+ earners (308) having the highest median family income of $131,488, while families with no earners (708) have the lowest median family income of $54,706, accounting for 9.2% and 21.1% of families, respectively.
| Number of Earners | # Families | Median Income |
| No Earners | 708 (21.1%) | $54,706 |
| 1 Earner | 1,060 (31.5%) | $83,202 |
| 2 Earners | 1,286 (38.3%) | $104,149 |
| 3+ Earners | 308 (9.2%) | $131,488 |
| Total | 3,362 (100.0%) | $95,333 |
Household Income in Blanco County
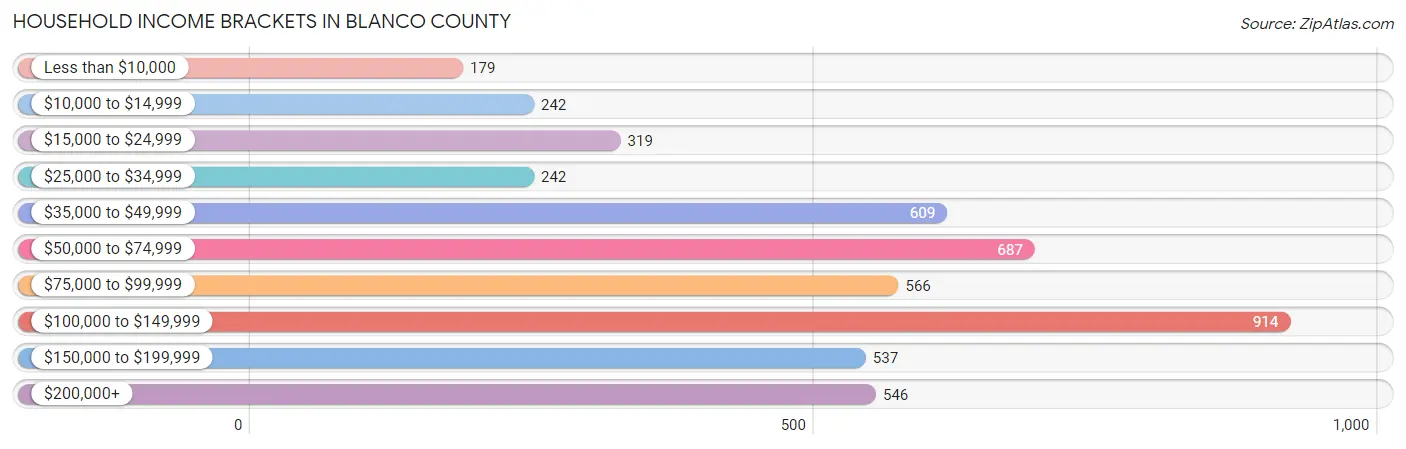
Household Income Brackets in Blanco County
With 914 households falling in the category, the $100,000 to $149,999 income range is the most frequent in Blanco County, accounting for 18.9% of all households. In contrast, only 179 households (3.7%) fall into the less than $10,000 income bracket, making it the least populous group.
| Income Bracket | # Households | % Households |
| Less than $10,000 | 179 | 3.7% |
| $10,000 to $14,999 | 242 | 5.0% |
| $15,000 to $24,999 | 319 | 6.6% |
| $25,000 to $34,999 | 242 | 5.0% |
| $35,000 to $49,999 | 609 | 12.6% |
| $50,000 to $74,999 | 687 | 14.2% |
| $75,000 to $99,999 | 566 | 11.7% |
| $100,000 to $149,999 | 914 | 18.9% |
| $150,000 to $199,999 | 537 | 11.1% |
| $200,000+ | 546 | 11.3% |
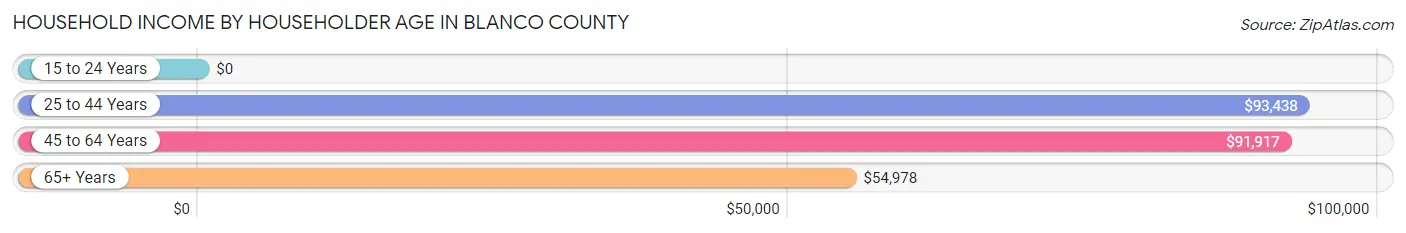
Household Income by Householder Age in Blanco County
The median household income in Blanco County is $79,717, with the highest median household income of $93,438 found in the 25 to 44 years age bracket for the primary householder. A total of 1,090 households (22.5%) fall into this category. Meanwhile, the 15 to 24 years age bracket for the primary householder has the lowest median household income of $0, with 130 households (2.7%) in this group.
| Income Bracket | # Households | Median Income |
| 15 to 24 Years | 130 (2.7%) | $0 |
| 25 to 44 Years | 1,090 (22.5%) | $93,438 |
| 45 to 64 Years | 1,881 (38.9%) | $91,917 |
| 65+ Years | 1,735 (35.9%) | $54,978 |
| Total | 4,836 (100.0%) | $79,717 |
Poverty in Blanco County
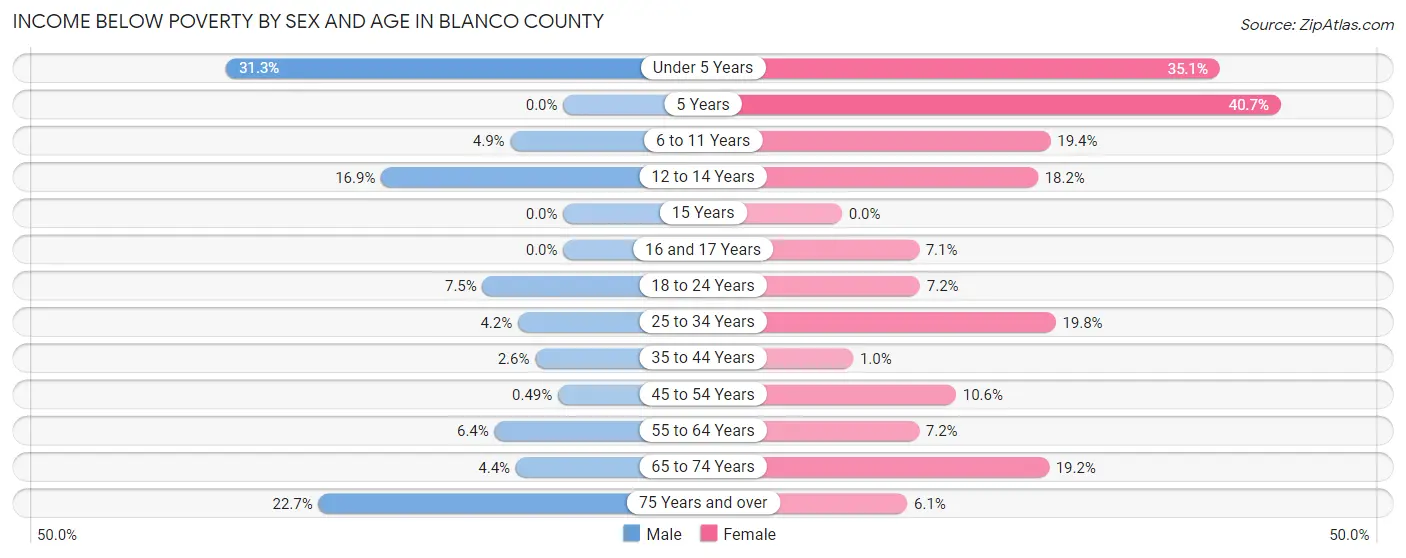
Income Below Poverty by Sex and Age in Blanco County
With 6.9% poverty level for males and 12.7% for females among the residents of Blanco County, under 5 year old males and 5 year old females are the most vulnerable to poverty, with 67 males (31.3%) and 11 females (40.7%) in their respective age groups living below the poverty level.
| Age Bracket | Male | Female |
| Under 5 Years | 67 (31.3%) | 67 (35.1%) |
| 5 Years | 0 (0.0%) | 11 (40.7%) |
| 6 to 11 Years | 21 (4.9%) | 66 (19.4%) |
| 12 to 14 Years | 24 (16.9%) | 48 (18.2%) |
| 15 Years | 0 (0.0%) | 0 (0.0%) |
| 16 and 17 Years | 0 (0.0%) | 6 (7.1%) |
| 18 to 24 Years | 31 (7.5%) | 21 (7.2%) |
| 25 to 34 Years | 23 (4.2%) | 140 (19.8%) |
| 35 to 44 Years | 15 (2.6%) | 5 (1.0%) |
| 45 to 54 Years | 4 (0.5%) | 73 (10.6%) |
| 55 to 64 Years | 70 (6.4%) | 77 (7.1%) |
| 65 to 74 Years | 36 (4.4%) | 177 (19.2%) |
| 75 Years and over | 107 (22.7%) | 33 (6.1%) |
| Total | 398 (6.9%) | 724 (12.7%) |
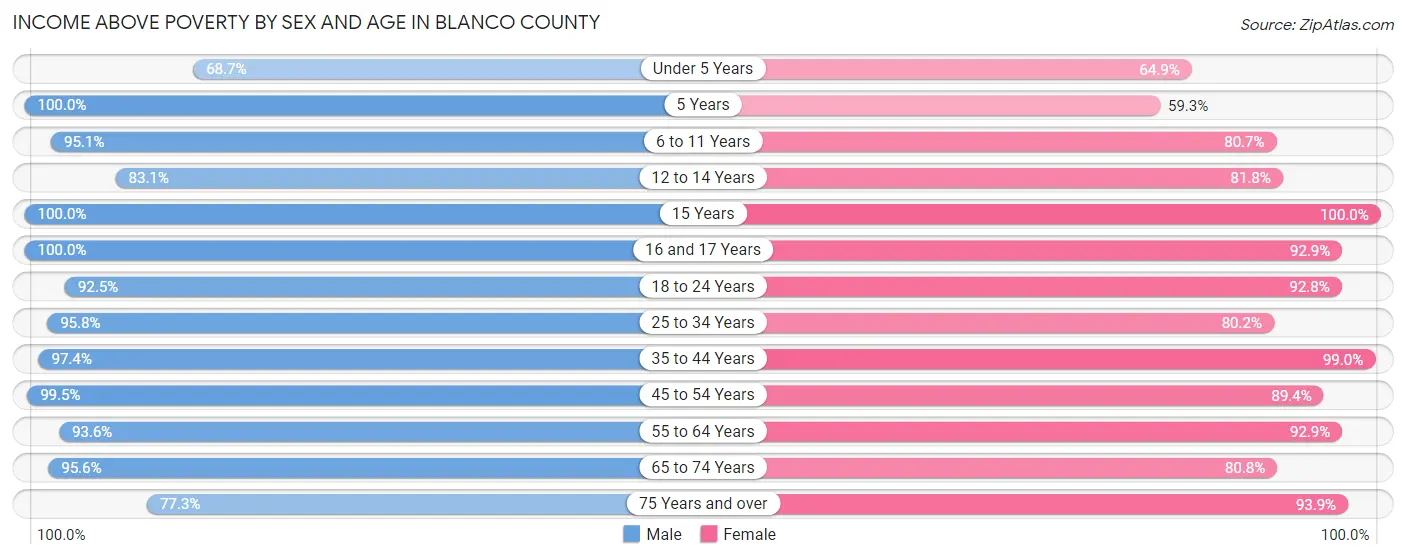
Income Above Poverty by Sex and Age in Blanco County
According to the poverty statistics in Blanco County, males aged 5 years and females aged 15 years are the age groups that are most secure financially, with 100.0% of males and 100.0% of females in these age groups living above the poverty line.
| Age Bracket | Male | Female |
| Under 5 Years | 147 (68.7%) | 124 (64.9%) |
| 5 Years | 47 (100.0%) | 16 (59.3%) |
| 6 to 11 Years | 407 (95.1%) | 275 (80.6%) |
| 12 to 14 Years | 118 (83.1%) | 216 (81.8%) |
| 15 Years | 49 (100.0%) | 72 (100.0%) |
| 16 and 17 Years | 177 (100.0%) | 78 (92.9%) |
| 18 to 24 Years | 383 (92.5%) | 269 (92.8%) |
| 25 to 34 Years | 525 (95.8%) | 566 (80.2%) |
| 35 to 44 Years | 561 (97.4%) | 474 (99.0%) |
| 45 to 54 Years | 808 (99.5%) | 617 (89.4%) |
| 55 to 64 Years | 1,028 (93.6%) | 1,000 (92.8%) |
| 65 to 74 Years | 782 (95.6%) | 745 (80.8%) |
| 75 Years and over | 364 (77.3%) | 512 (93.9%) |
| Total | 5,396 (93.1%) | 4,964 (87.3%) |
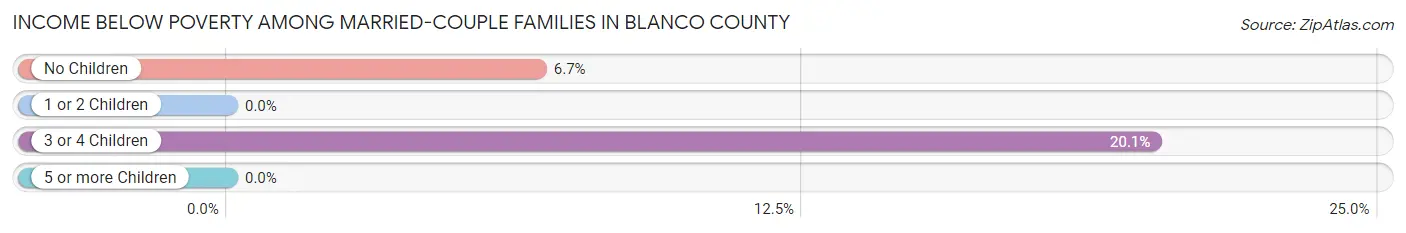
Income Below Poverty Among Married-Couple Families in Blanco County
The poverty statistics for married-couple families in Blanco County show that 6.2% or 172 of the total 2,771 families live below the poverty line. Families with 3 or 4 children have the highest poverty rate of 20.1%, comprising of 36 families. On the other hand, families with 1 or 2 children have the lowest poverty rate of 0.0%, which includes 0 families.
| Children | Above Poverty | Below Poverty |
| No Children | 1,888 (93.3%) | 136 (6.7%) |
| 1 or 2 Children | 568 (100.0%) | 0 (0.0%) |
| 3 or 4 Children | 143 (79.9%) | 36 (20.1%) |
| 5 or more Children | 0 (0.0%) | 0 (0.0%) |
| Total | 2,599 (93.8%) | 172 (6.2%) |
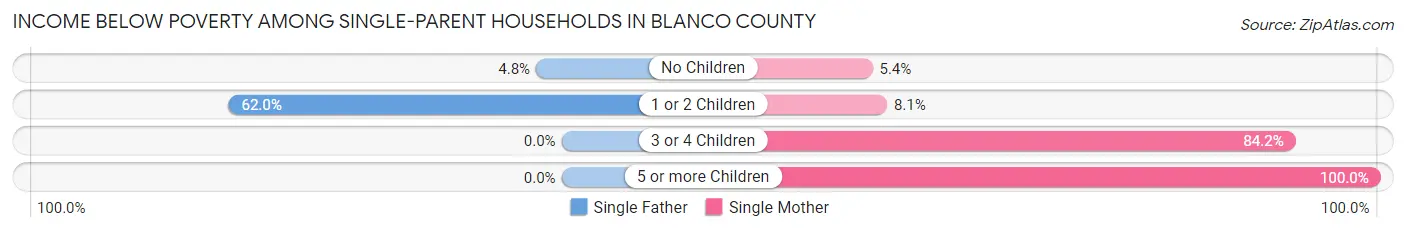
Income Below Poverty Among Single-Parent Households in Blanco County
According to the poverty data in Blanco County, 28.1% or 34 single-father households and 20.6% or 97 single-mother households are living below the poverty line. Among single-father households, those with 1 or 2 children have the highest poverty rate, with 31 households (62.0%) experiencing poverty. Likewise, among single-mother households, those with 5 or more children have the highest poverty rate, with 4 households (100.0%) falling below the poverty line.
| Children | Single Father | Single Mother |
| No Children | 3 (4.8%) | 14 (5.4%) |
| 1 or 2 Children | 31 (62.0%) | 10 (8.1%) |
| 3 or 4 Children | 0 (0.0%) | 69 (84.2%) |
| 5 or more Children | 0 (0.0%) | 4 (100.0%) |
| Total | 34 (28.1%) | 97 (20.6%) |
Income Below Poverty Among Married-Couple vs Single-Parent Households in Blanco County
The poverty data for Blanco County shows that 172 of the married-couple family households (6.2%) and 131 of the single-parent households (22.2%) are living below the poverty level. Within the married-couple family households, those with 3 or 4 children have the highest poverty rate, with 36 households (20.1%) falling below the poverty line. Among the single-parent households, those with 5 or more children have the highest poverty rate, with 4 household (100.0%) living below poverty.
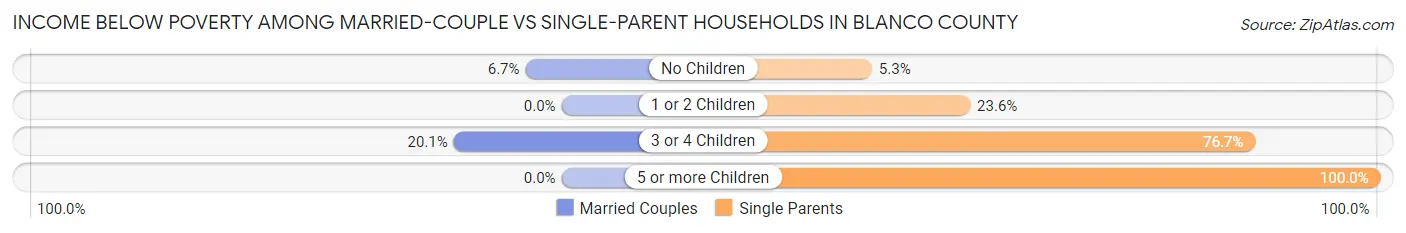
| Children | Married-Couple Families | Single-Parent Households |
| No Children | 136 (6.7%) | 17 (5.3%) |
| 1 or 2 Children | 0 (0.0%) | 41 (23.6%) |
| 3 or 4 Children | 36 (20.1%) | 69 (76.7%) |
| 5 or more Children | 0 (0.0%) | 4 (100.0%) |
| Total | 172 (6.2%) | 131 (22.2%) |
Race in Blanco County
The most populous races in Blanco County are White / Caucasian (9,384 | 80.8%), Hispanic or Latino (2,322 | 20.0%), and Two or more Races (1,268 | 10.9%).
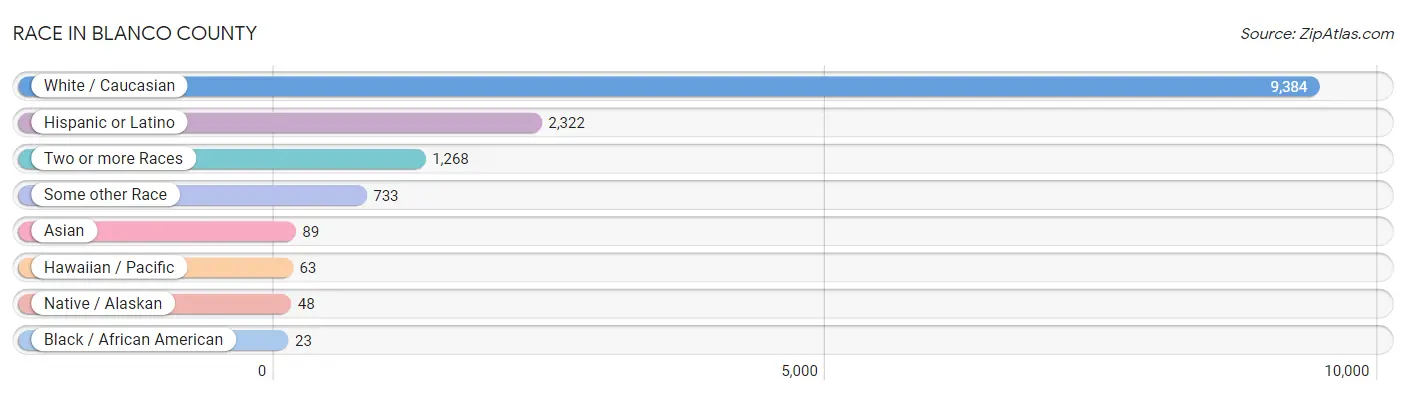
| Race | # Population | % Population |
| Asian | 89 | 0.8% |
| Black / African American | 23 | 0.2% |
| Hawaiian / Pacific | 63 | 0.5% |
| Hispanic or Latino | 2,322 | 20.0% |
| Native / Alaskan | 48 | 0.4% |
| White / Caucasian | 9,384 | 80.8% |
| Two or more Races | 1,268 | 10.9% |
| Some other Race | 733 | 6.3% |
| Total | 11,608 | 100.0% |
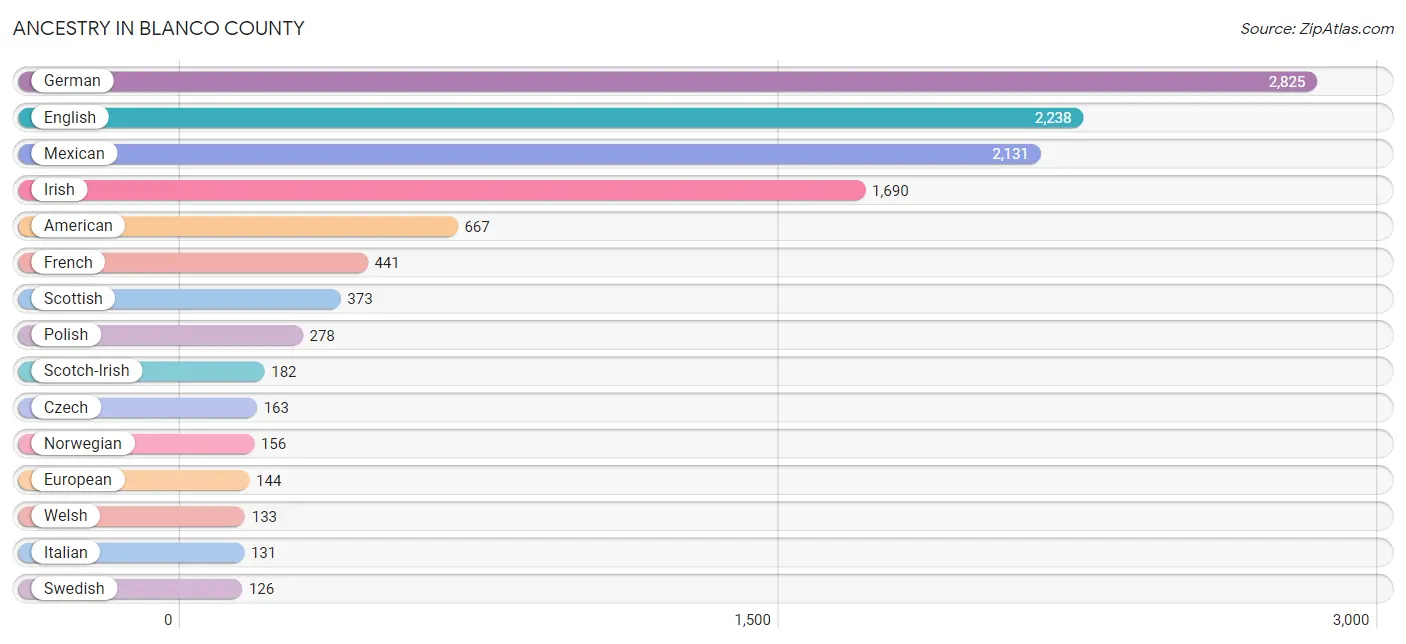
Ancestry in Blanco County
The most populous ancestries reported in Blanco County are German (2,825 | 24.3%), English (2,238 | 19.3%), Mexican (2,131 | 18.4%), Irish (1,690 | 14.6%), and American (667 | 5.8%), together accounting for 82.3% of all Blanco County residents.
| Ancestry | # Population | % Population |
| American | 667 | 5.8% |
| Apache | 59 | 0.5% |
| Arab | 42 | 0.4% |
| Austrian | 7 | 0.1% |
| Bhutanese | 115 | 1.0% |
| Brazilian | 16 | 0.1% |
| British | 24 | 0.2% |
| Cajun | 42 | 0.4% |
| Canadian | 45 | 0.4% |
| Central American | 34 | 0.3% |
| Cherokee | 88 | 0.8% |
| Chickasaw | 4 | 0.0% |
| Chippewa | 7 | 0.1% |
| Crow | 6 | 0.1% |
| Cuban | 2 | 0.0% |
| Czech | 163 | 1.4% |
| Czechoslovakian | 15 | 0.1% |
| Danish | 19 | 0.2% |
| Dutch | 74 | 0.6% |
| Eastern European | 2 | 0.0% |
| Egyptian | 17 | 0.2% |
| English | 2,238 | 19.3% |
| European | 144 | 1.2% |
| Finnish | 4 | 0.0% |
| French | 441 | 3.8% |
| French American Indian | 2 | 0.0% |
| French Canadian | 48 | 0.4% |
| German | 2,825 | 24.3% |
| Greek | 10 | 0.1% |
| Honduran | 34 | 0.3% |
| Houma | 6 | 0.1% |
| Hungarian | 14 | 0.1% |
| Indian (Asian) | 12 | 0.1% |
| Irish | 1,690 | 14.6% |
| Italian | 131 | 1.1% |
| Korean | 9 | 0.1% |
| Lithuanian | 6 | 0.1% |
| Mexican | 2,131 | 18.4% |
| Mexican American Indian | 22 | 0.2% |
| Native Hawaiian | 63 | 0.5% |
| Norwegian | 156 | 1.3% |
| Pakistani | 40 | 0.3% |
| Polish | 278 | 2.4% |
| Romanian | 17 | 0.2% |
| Russian | 5 | 0.0% |
| Scandinavian | 61 | 0.5% |
| Scotch-Irish | 182 | 1.6% |
| Scottish | 373 | 3.2% |
| Slovak | 9 | 0.1% |
| Spaniard | 61 | 0.5% |
| Spanish | 66 | 0.6% |
| Swedish | 126 | 1.1% |
| Swiss | 32 | 0.3% |
| Ukrainian | 28 | 0.2% |
| Welsh | 133 | 1.1% | View All 55 Rows |
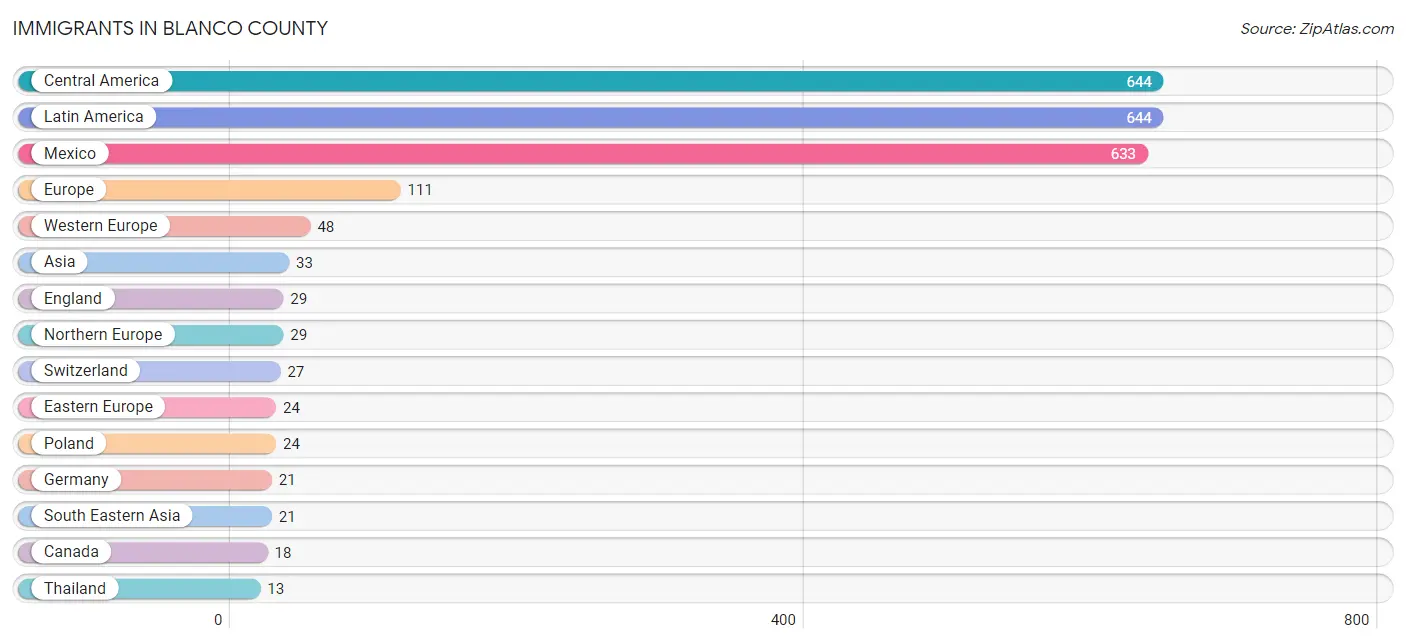
Immigrants in Blanco County
The most numerous immigrant groups reported in Blanco County came from Central America (644 | 5.6%), Latin America (644 | 5.6%), Mexico (633 | 5.4%), Europe (111 | 1.0%), and Western Europe (48 | 0.4%), together accounting for 17.9% of all Blanco County residents.
| Immigration Origin | # Population | % Population |
| Africa | 1 | 0.0% |
| Asia | 33 | 0.3% |
| Canada | 18 | 0.2% |
| Central America | 644 | 5.6% |
| China | 12 | 0.1% |
| Eastern Asia | 12 | 0.1% |
| Eastern Europe | 24 | 0.2% |
| Egypt | 1 | 0.0% |
| England | 29 | 0.3% |
| Europe | 111 | 1.0% |
| Germany | 21 | 0.2% |
| Greece | 10 | 0.1% |
| Honduras | 11 | 0.1% |
| Latin America | 644 | 5.6% |
| Mexico | 633 | 5.4% |
| Northern Africa | 1 | 0.0% |
| Northern Europe | 29 | 0.3% |
| Philippines | 8 | 0.1% |
| Poland | 24 | 0.2% |
| South Eastern Asia | 21 | 0.2% |
| Southern Europe | 10 | 0.1% |
| Switzerland | 27 | 0.2% |
| Thailand | 13 | 0.1% |
| Western Europe | 48 | 0.4% | View All 24 Rows |
Sex and Age in Blanco County
Sex and Age in Blanco County
The most populous age groups in Blanco County are 55 to 59 Years (632 | 10.8%) for men and 60 to 64 Years (646 | 11.2%) for women.
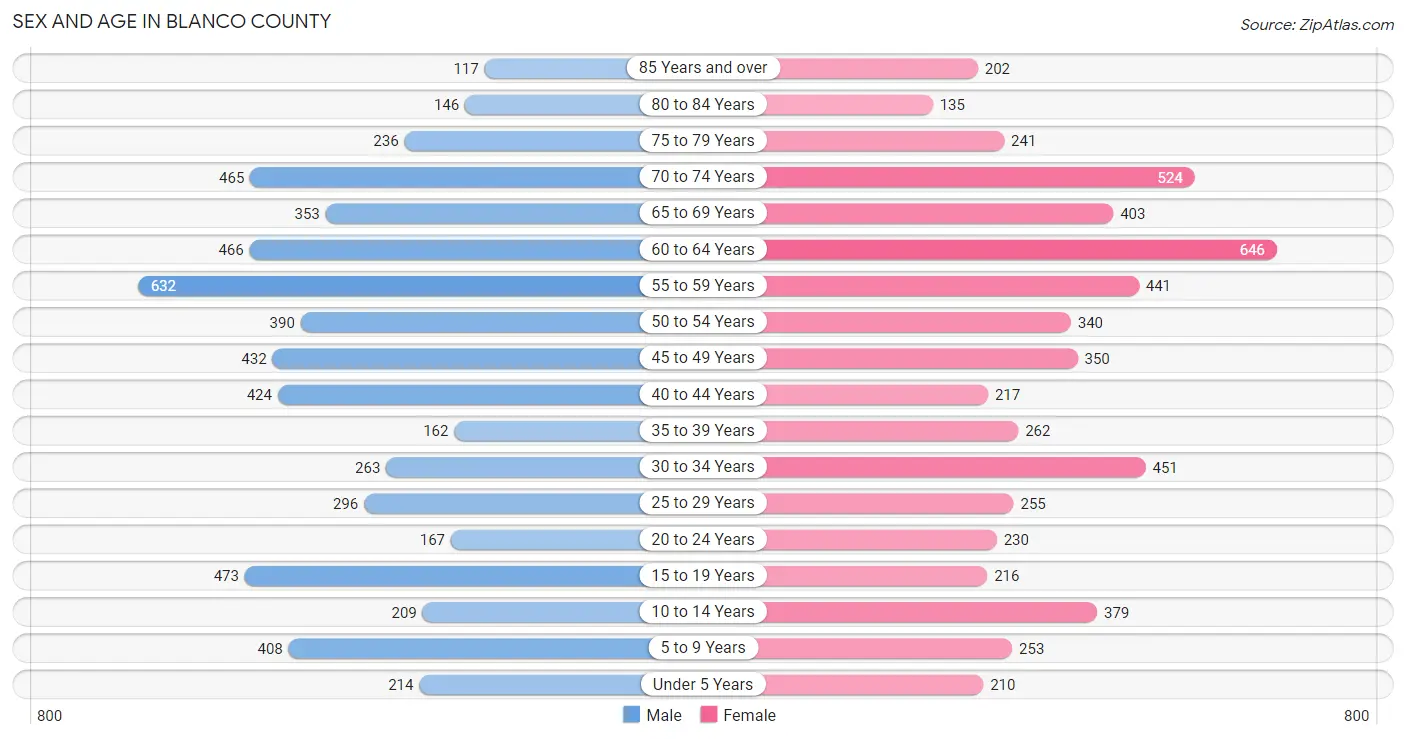
| Age Bracket | Male | Female |
| Under 5 Years | 214 (3.7%) | 210 (3.6%) |
| 5 to 9 Years | 408 (7.0%) | 253 (4.4%) |
| 10 to 14 Years | 209 (3.6%) | 379 (6.6%) |
| 15 to 19 Years | 473 (8.1%) | 216 (3.7%) |
| 20 to 24 Years | 167 (2.9%) | 230 (4.0%) |
| 25 to 29 Years | 296 (5.1%) | 255 (4.4%) |
| 30 to 34 Years | 263 (4.5%) | 451 (7.8%) |
| 35 to 39 Years | 162 (2.8%) | 262 (4.5%) |
| 40 to 44 Years | 424 (7.2%) | 217 (3.8%) |
| 45 to 49 Years | 432 (7.4%) | 350 (6.1%) |
| 50 to 54 Years | 390 (6.7%) | 340 (5.9%) |
| 55 to 59 Years | 632 (10.8%) | 441 (7.7%) |
| 60 to 64 Years | 466 (8.0%) | 646 (11.2%) |
| 65 to 69 Years | 353 (6.0%) | 403 (7.0%) |
| 70 to 74 Years | 465 (7.9%) | 524 (9.1%) |
| 75 to 79 Years | 236 (4.0%) | 241 (4.2%) |
| 80 to 84 Years | 146 (2.5%) | 135 (2.4%) |
| 85 Years and over | 117 (2.0%) | 202 (3.5%) |
| Total | 5,853 (100.0%) | 5,755 (100.0%) |
Families and Households in Blanco County
Median Family Size in Blanco County
The median family size in Blanco County is 2.85 persons per family, with married-couple families (2,771 | 82.4%) accounting for the largest median family size of 2.88 persons per family. On the other hand, single male/father families (121 | 3.6%) represent the smallest median family size with 2.68 persons per family.
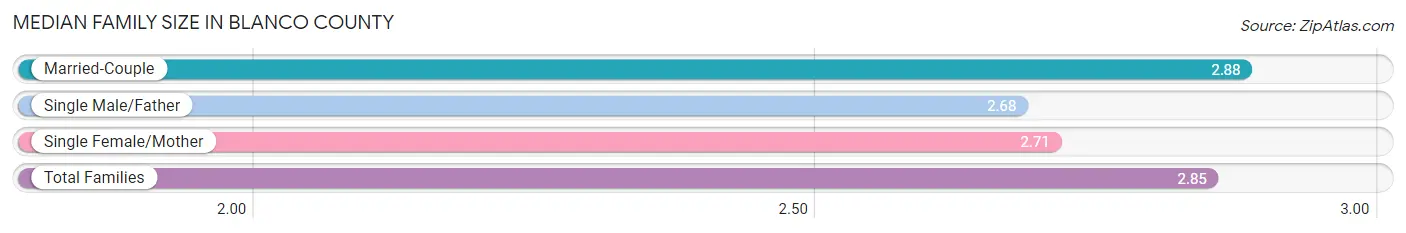
| Family Type | # Families | Family Size |
| Married-Couple | 2,771 (82.4%) | 2.88 |
| Single Male/Father | 121 (3.6%) | 2.68 |
| Single Female/Mother | 470 (14.0%) | 2.71 |
| Total Families | 3,362 (100.0%) | 2.85 |
Median Household Size in Blanco County
The median household size in Blanco County is 2.37 persons per household, with single male/father households (121 | 2.5%) accounting for the largest median household size of 2.96 persons per household. non-family households (1,474 | 30.5%) represent the smallest median household size with 1.16 persons per household.
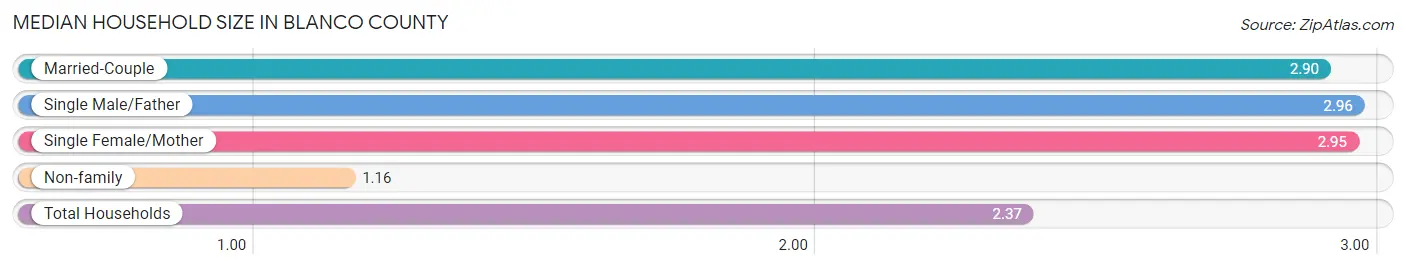
| Household Type | # Households | Household Size |
| Married-Couple | 2,771 (57.3%) | 2.90 |
| Single Male/Father | 121 (2.5%) | 2.96 |
| Single Female/Mother | 470 (9.7%) | 2.95 |
| Non-family | 1,474 (30.5%) | 1.16 |
| Total Households | 4,836 (100.0%) | 2.37 |
Household Size by Marriage Status in Blanco County
Out of a total of 4,836 households in Blanco County, 3,362 (69.5%) are family households, while 1,474 (30.5%) are nonfamily households. The most numerous type of family households are 2-person households, comprising 2,032, and the most common type of nonfamily households are 1-person households, comprising 1,208.
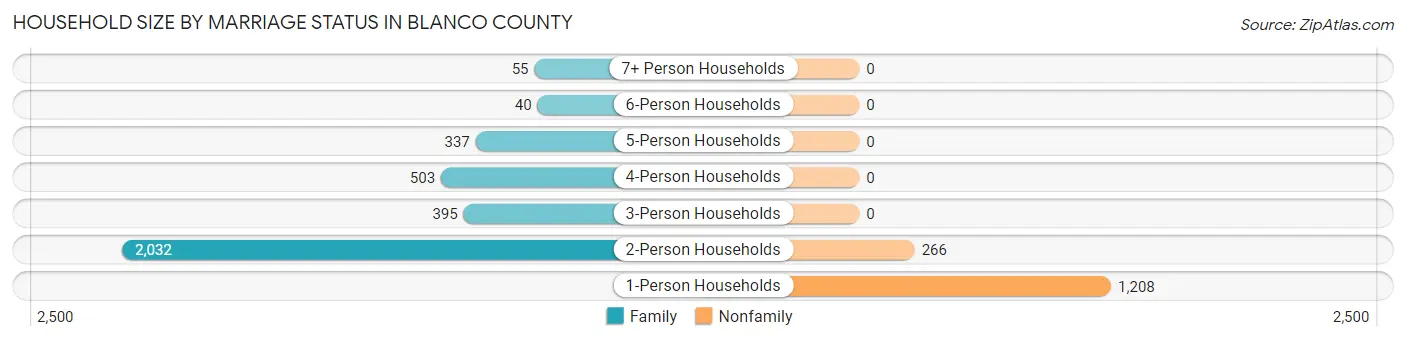
| Household Size | Family Households | Nonfamily Households |
| 1-Person Households | - | 1,208 (25.0%) |
| 2-Person Households | 2,032 (42.0%) | 266 (5.5%) |
| 3-Person Households | 395 (8.2%) | 0 (0.0%) |
| 4-Person Households | 503 (10.4%) | 0 (0.0%) |
| 5-Person Households | 337 (7.0%) | 0 (0.0%) |
| 6-Person Households | 40 (0.8%) | 0 (0.0%) |
| 7+ Person Households | 55 (1.1%) | 0 (0.0%) |
| Total | 3,362 (69.5%) | 1,474 (30.5%) |
Female Fertility in Blanco County
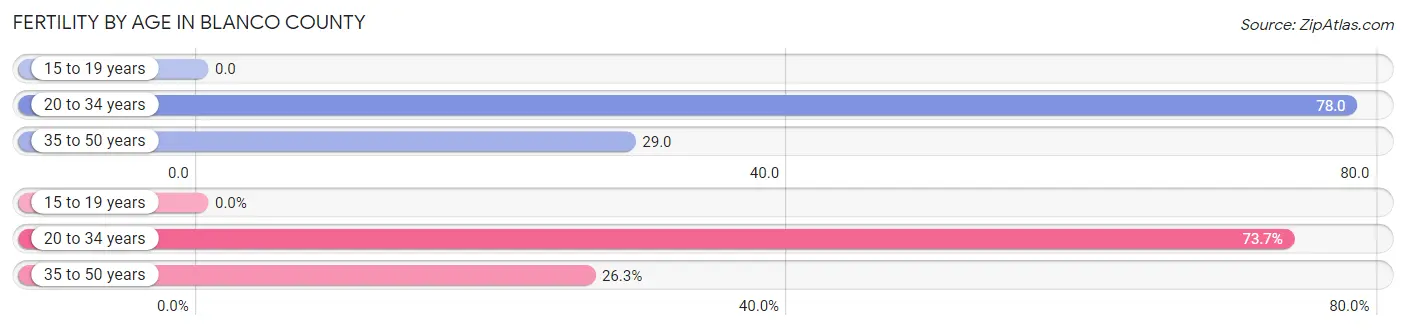
Fertility by Age in Blanco County
Average fertility rate in Blanco County is 48.0 births per 1,000 women. Women in the age bracket of 20 to 34 years have the highest fertility rate with 78.0 births per 1,000 women. Women in the age bracket of 20 to 34 years acount for 73.7% of all women with births.
| Age Bracket | Women with Births | Births / 1,000 Women |
| 15 to 19 years | 0 (0.0%) | 0.0 |
| 20 to 34 years | 73 (73.7%) | 78.0 |
| 35 to 50 years | 26 (26.3%) | 29.0 |
| Total | 99 (100.0%) | 48.0 |
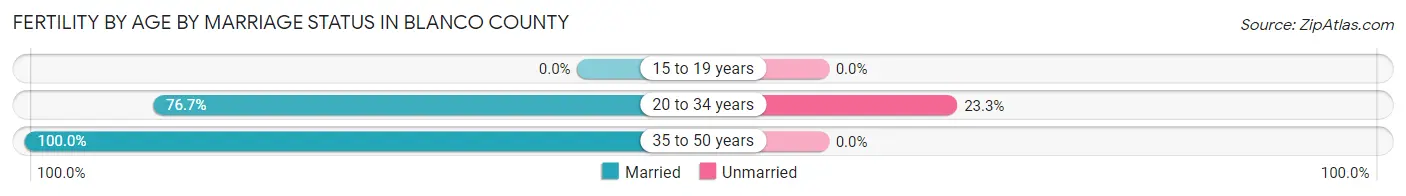
Fertility by Age by Marriage Status in Blanco County
82.8% of women with births (99) in Blanco County are married. The highest percentage of unmarried women with births falls into 20 to 34 years age bracket with 23.3% of them unmarried at the time of birth, while the lowest percentage of unmarried women with births belong to 35 to 50 years age bracket with 0.0% of them unmarried.
| Age Bracket | Married | Unmarried |
| 15 to 19 years | 0 (0.0%) | 0 (0.0%) |
| 20 to 34 years | 56 (76.7%) | 17 (23.3%) |
| 35 to 50 years | 26 (100.0%) | 0 (0.0%) |
| Total | 82 (82.8%) | 17 (17.2%) |
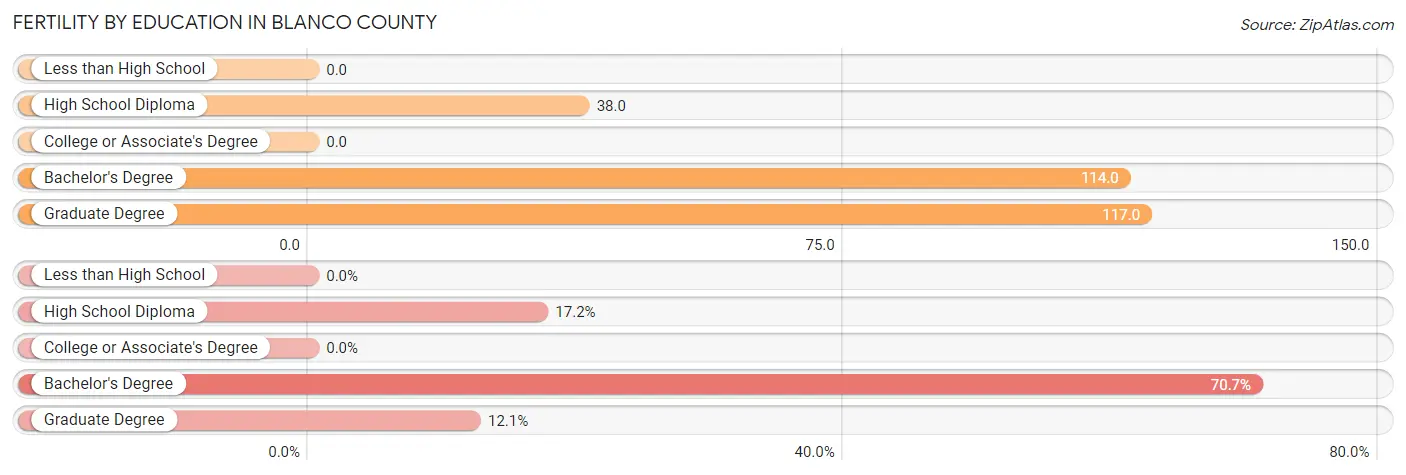
Fertility by Education in Blanco County
| Educational Attainment | Women with Births | Births / 1,000 Women |
| Less than High School | 0 (0.0%) | 0.0 |
| High School Diploma | 17 (17.2%) | 38.0 |
| College or Associate's Degree | 0 (0.0%) | 0.0 |
| Bachelor's Degree | 70 (70.7%) | 114.0 |
| Graduate Degree | 12 (12.1%) | 117.0 |
| Total | 99 (100.0%) | 48.0 |
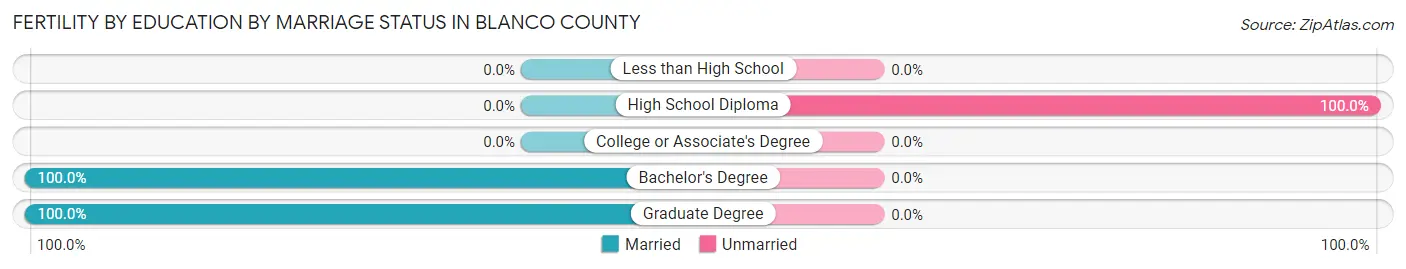
Fertility by Education by Marriage Status in Blanco County
17.2% of women with births in Blanco County are unmarried. Women with the educational attainment of bachelor's degree are most likely to be married with 100.0% of them married at childbirth, while women with the educational attainment of high school diploma are least likely to be married with 100.0% of them unmarried at childbirth.
| Educational Attainment | Married | Unmarried |
| Less than High School | 0 (0.0%) | 0 (0.0%) |
| High School Diploma | 0 (0.0%) | 17 (100.0%) |
| College or Associate's Degree | 0 (0.0%) | 0 (0.0%) |
| Bachelor's Degree | 70 (100.0%) | 0 (0.0%) |
| Graduate Degree | 12 (100.0%) | 0 (0.0%) |
| Total | 82 (82.8%) | 17 (17.2%) |
Employment Characteristics in Blanco County
Employment by Class of Employer in Blanco County
Among the 5,329 employed individuals in Blanco County, private company employees (3,320 | 62.3%), local government employees (621 | 11.7%), and self-employed (not incorporated) (515 | 9.7%) make up the most common classes of employment.
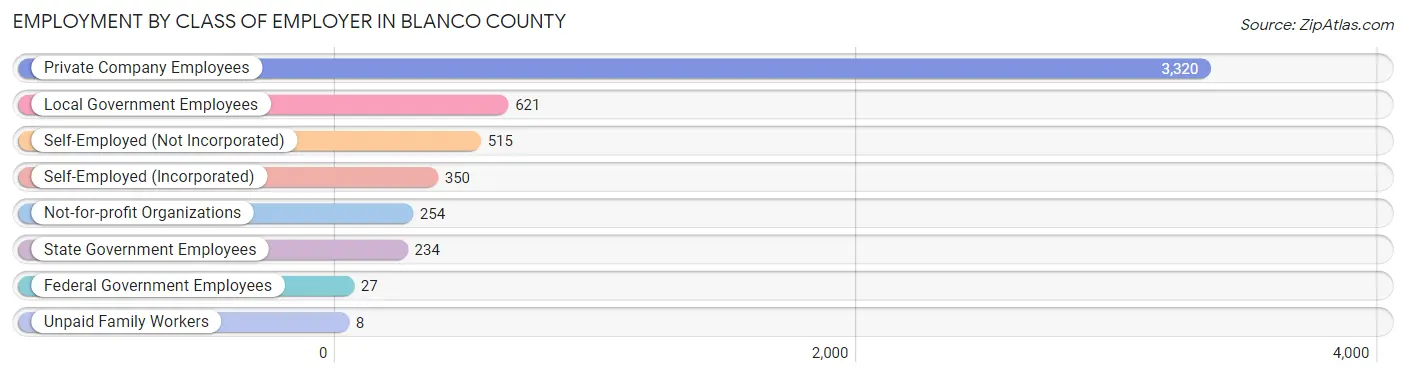
| Employer Class | # Employees | % Employees |
| Private Company Employees | 3,320 | 62.3% |
| Self-Employed (Incorporated) | 350 | 6.6% |
| Self-Employed (Not Incorporated) | 515 | 9.7% |
| Not-for-profit Organizations | 254 | 4.8% |
| Local Government Employees | 621 | 11.7% |
| State Government Employees | 234 | 4.4% |
| Federal Government Employees | 27 | 0.5% |
| Unpaid Family Workers | 8 | 0.2% |
| Total | 5,329 | 100.0% |
Employment Status by Age in Blanco County
According to the labor force statistics for Blanco County, out of the total population over 16 years of age (9,814), 58.3% or 5,722 individuals are in the labor force, with 3.9% or 223 of them unemployed. The age group with the highest labor force participation rate is 35 to 44 years, with 96.3% or 1,026 individuals in the labor force. Within the labor force, the 25 to 29 years age range has the highest percentage of unemployed individuals, with 11.3% or 59 of them being unemployed.
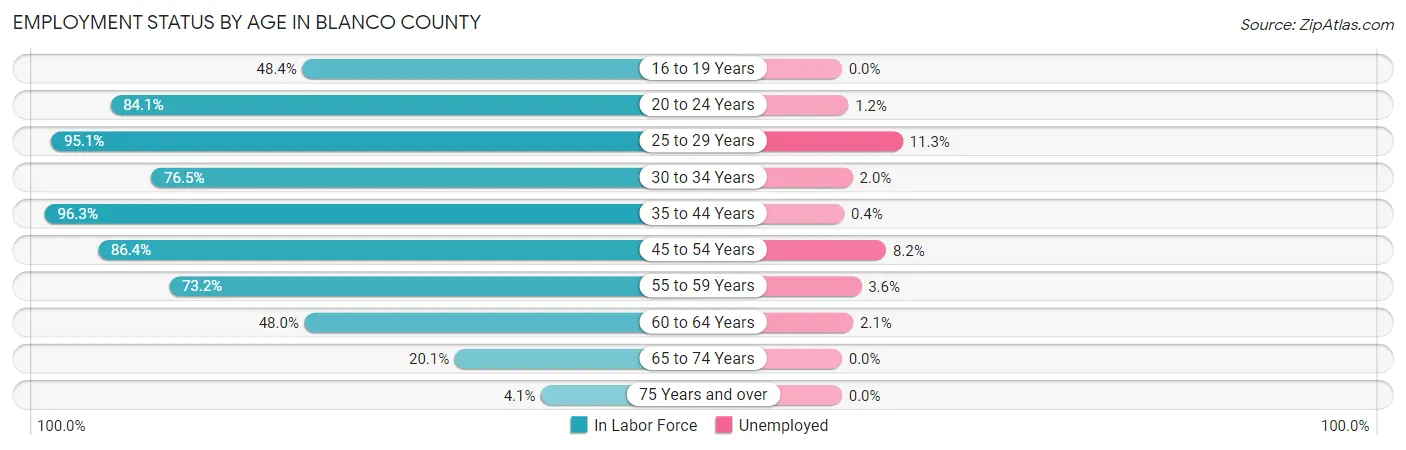
| Age Bracket | In Labor Force | Unemployed |
| 16 to 19 Years | 275 (48.4%) | 0 (0.0%) |
| 20 to 24 Years | 334 (84.1%) | 4 (1.2%) |
| 25 to 29 Years | 524 (95.1%) | 59 (11.3%) |
| 30 to 34 Years | 546 (76.5%) | 11 (2.0%) |
| 35 to 44 Years | 1,026 (96.3%) | 4 (0.4%) |
| 45 to 54 Years | 1,306 (86.4%) | 107 (8.2%) |
| 55 to 59 Years | 785 (73.2%) | 28 (3.6%) |
| 60 to 64 Years | 534 (48.0%) | 11 (2.1%) |
| 65 to 74 Years | 351 (20.1%) | 0 (0.0%) |
| 75 Years and over | 44 (4.1%) | 0 (0.0%) |
| Total | 5,722 (58.3%) | 223 (3.9%) |
Employment Status by Educational Attainment in Blanco County
According to labor force statistics for Blanco County, 78.3% of individuals (4,719) out of the total population between 25 and 64 years of age (6,027) are in the labor force, with 4.7% or 222 of them being unemployed. The group with the highest labor force participation rate are those with the educational attainment of high school diploma, with 85.0% or 1,423 individuals in the labor force. Within the labor force, individuals with high school diploma education have the highest percentage of unemployment, with 8.2% or 117 of them being unemployed.
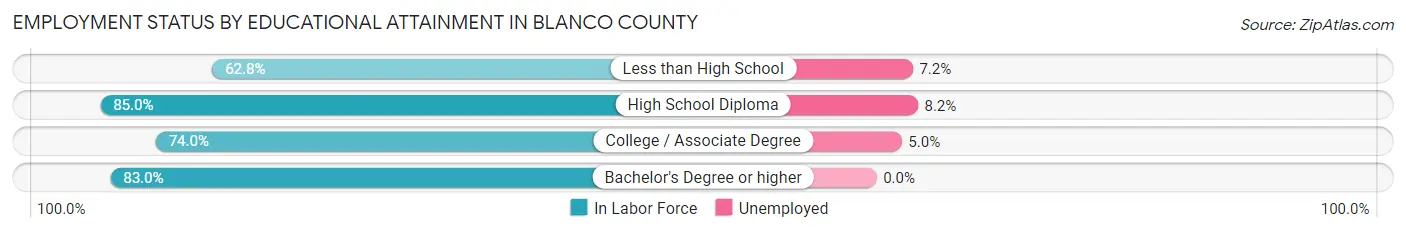
| Educational Attainment | In Labor Force | Unemployed |
| Less than High School | 429 (62.8%) | 49 (7.2%) |
| High School Diploma | 1,423 (85.0%) | 137 (8.2%) |
| College / Associate Degree | 1,441 (74.0%) | 97 (5.0%) |
| Bachelor's Degree or higher | 1,430 (83.0%) | 0 (0.0%) |
| Total | 4,719 (78.3%) | 283 (4.7%) |
Employment Occupations by Sex in Blanco County
Management, Business, Science and Arts Occupations
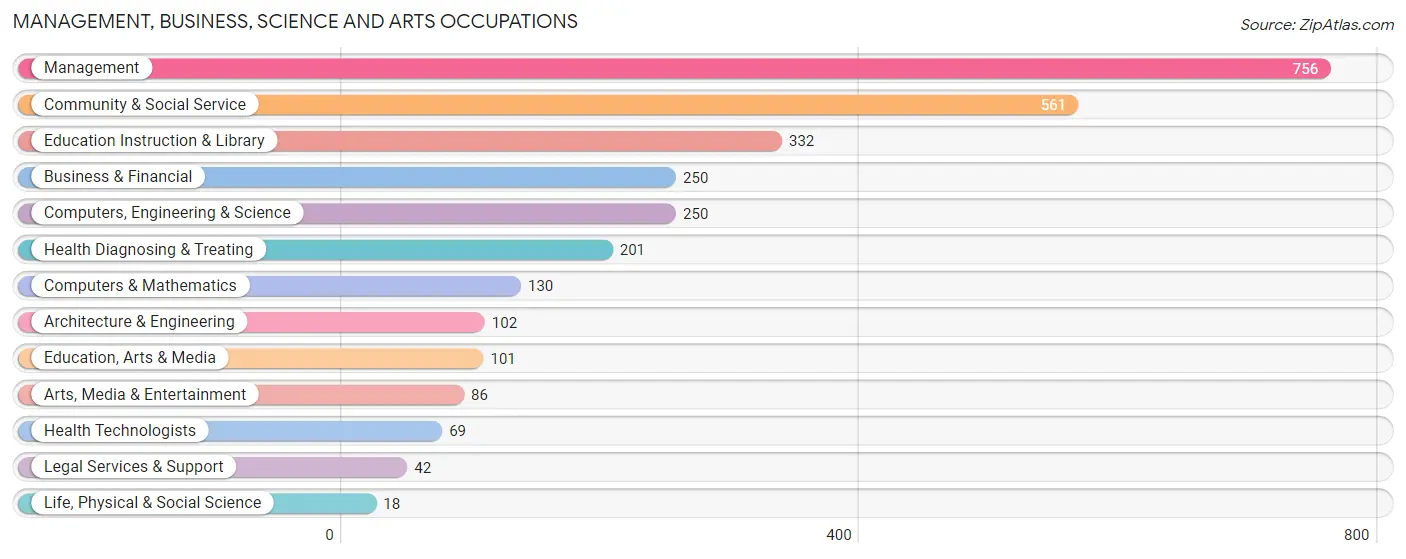
The most common Management, Business, Science and Arts occupations in Blanco County are Management (756 | 13.7%), Community & Social Service (561 | 10.2%), Education Instruction & Library (332 | 6.0%), Business & Financial (250 | 4.5%), and Computers, Engineering & Science (250 | 4.5%).
Management, Business, Science and Arts Occupations by Sex
Within the Management, Business, Science and Arts occupations in Blanco County, the most male-oriented occupations are Architecture & Engineering (100.0%), Life, Physical & Social Science (100.0%), and Computers, Engineering & Science (98.0%), while the most female-oriented occupations are Health Technologists (98.6%), Arts, Media & Entertainment (87.2%), and Health Diagnosing & Treating (78.1%).
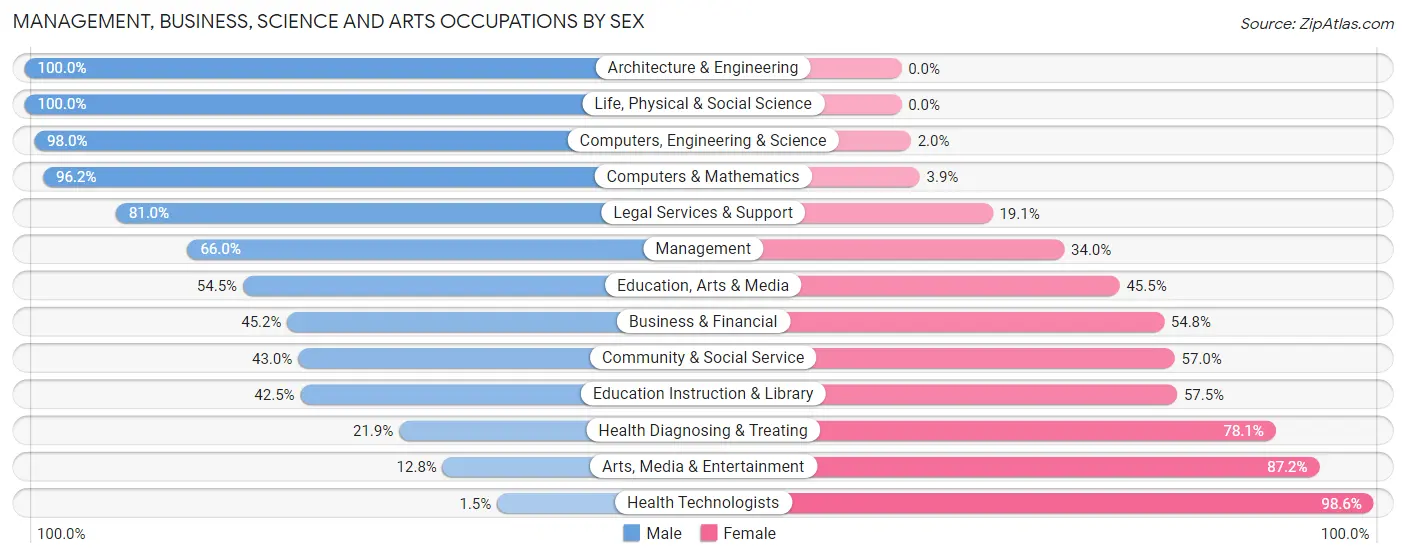
| Occupation | Male | Female |
| Management | 499 (66.0%) | 257 (34.0%) |
| Business & Financial | 113 (45.2%) | 137 (54.8%) |
| Computers, Engineering & Science | 245 (98.0%) | 5 (2.0%) |
| Computers & Mathematics | 125 (96.2%) | 5 (3.8%) |
| Architecture & Engineering | 102 (100.0%) | 0 (0.0%) |
| Life, Physical & Social Science | 18 (100.0%) | 0 (0.0%) |
| Community & Social Service | 241 (43.0%) | 320 (57.0%) |
| Education, Arts & Media | 55 (54.5%) | 46 (45.5%) |
| Legal Services & Support | 34 (80.9%) | 8 (19.1%) |
| Education Instruction & Library | 141 (42.5%) | 191 (57.5%) |
| Arts, Media & Entertainment | 11 (12.8%) | 75 (87.2%) |
| Health Diagnosing & Treating | 44 (21.9%) | 157 (78.1%) |
| Health Technologists | 1 (1.5%) | 68 (98.6%) |
| Total (Category) | 1,142 (56.6%) | 876 (43.4%) |
| Total (Overall) | 3,052 (55.5%) | 2,450 (44.5%) |
Services Occupations
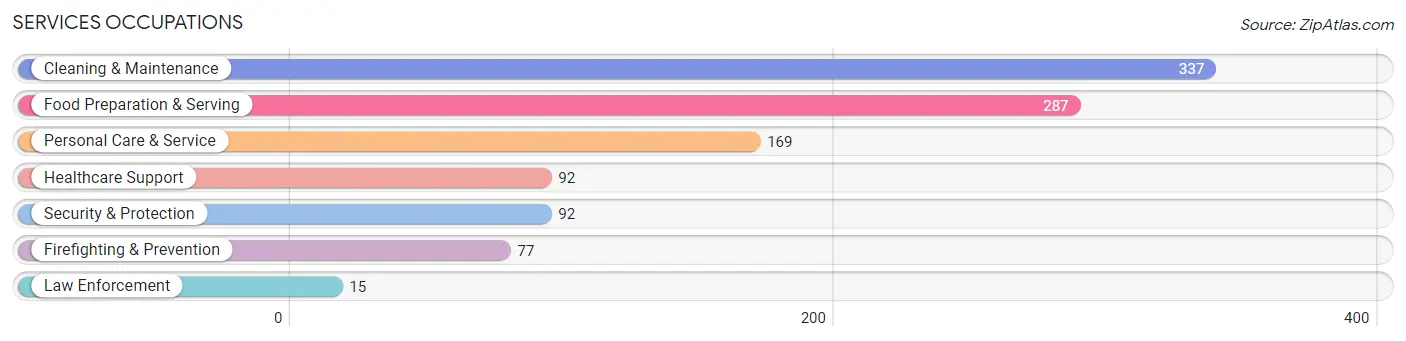
The most common Services occupations in Blanco County are Cleaning & Maintenance (337 | 6.1%), Food Preparation & Serving (287 | 5.2%), Personal Care & Service (169 | 3.1%), Healthcare Support (92 | 1.7%), and Security & Protection (92 | 1.7%).
Services Occupations by Sex
Within the Services occupations in Blanco County, the most male-oriented occupations are Firefighting & Prevention (100.0%), Security & Protection (93.5%), and Law Enforcement (60.0%), while the most female-oriented occupations are Healthcare Support (100.0%), Personal Care & Service (87.0%), and Cleaning & Maintenance (60.5%).
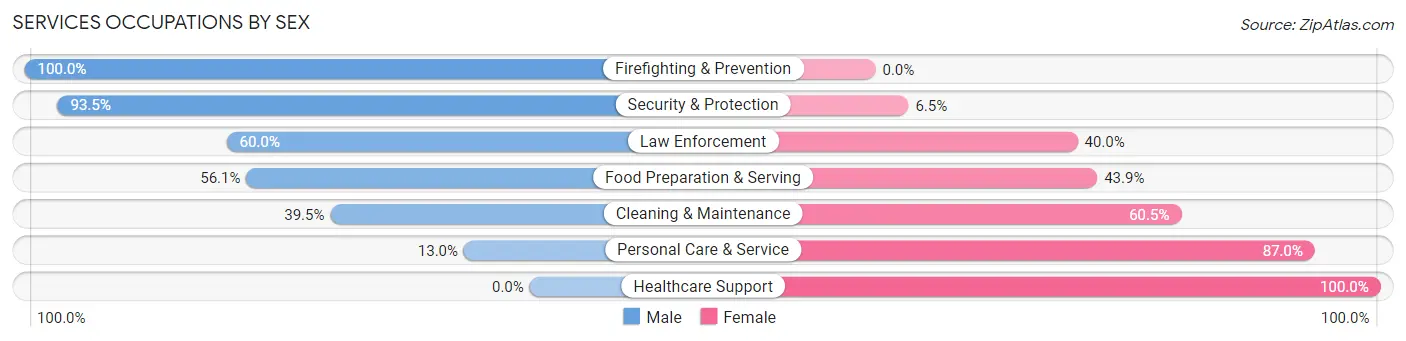
| Occupation | Male | Female |
| Healthcare Support | 0 (0.0%) | 92 (100.0%) |
| Security & Protection | 86 (93.5%) | 6 (6.5%) |
| Firefighting & Prevention | 77 (100.0%) | 0 (0.0%) |
| Law Enforcement | 9 (60.0%) | 6 (40.0%) |
| Food Preparation & Serving | 161 (56.1%) | 126 (43.9%) |
| Cleaning & Maintenance | 133 (39.5%) | 204 (60.5%) |
| Personal Care & Service | 22 (13.0%) | 147 (87.0%) |
| Total (Category) | 402 (41.1%) | 575 (58.9%) |
| Total (Overall) | 3,052 (55.5%) | 2,450 (44.5%) |
Sales and Office Occupations
The most common Sales and Office occupations in Blanco County are Sales & Related (697 | 12.7%), and Office & Administration (536 | 9.7%).

Sales and Office Occupations by Sex

| Occupation | Male | Female |
| Sales & Related | 304 (43.6%) | 393 (56.4%) |
| Office & Administration | 14 (2.6%) | 522 (97.4%) |
| Total (Category) | 318 (25.8%) | 915 (74.2%) |
| Total (Overall) | 3,052 (55.5%) | 2,450 (44.5%) |
Natural Resources, Construction and Maintenance Occupations
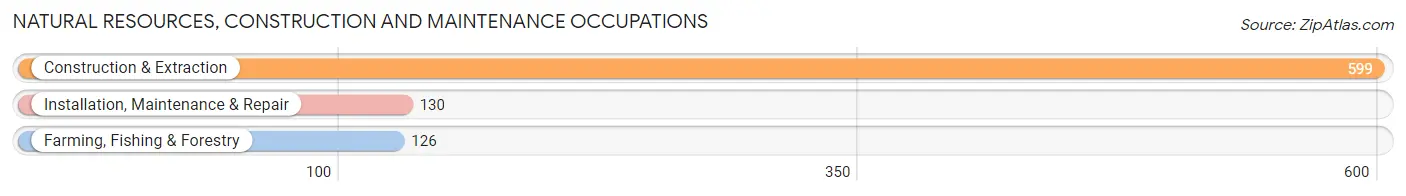
The most common Natural Resources, Construction and Maintenance occupations in Blanco County are Construction & Extraction (599 | 10.9%), Installation, Maintenance & Repair (130 | 2.4%), and Farming, Fishing & Forestry (126 | 2.3%).
Natural Resources, Construction and Maintenance Occupations by Sex
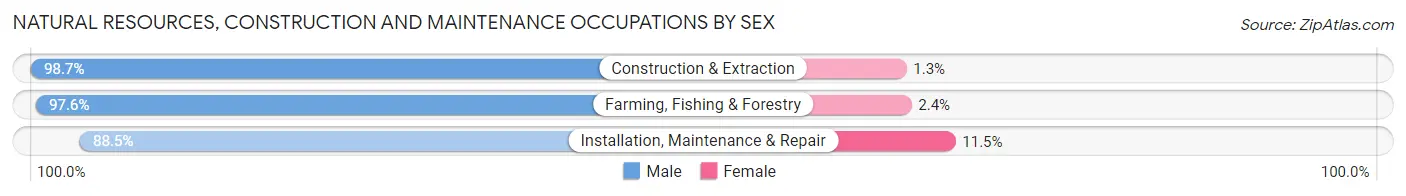
| Occupation | Male | Female |
| Farming, Fishing & Forestry | 123 (97.6%) | 3 (2.4%) |
| Construction & Extraction | 591 (98.7%) | 8 (1.3%) |
| Installation, Maintenance & Repair | 115 (88.5%) | 15 (11.5%) |
| Total (Category) | 829 (97.0%) | 26 (3.0%) |
| Total (Overall) | 3,052 (55.5%) | 2,450 (44.5%) |
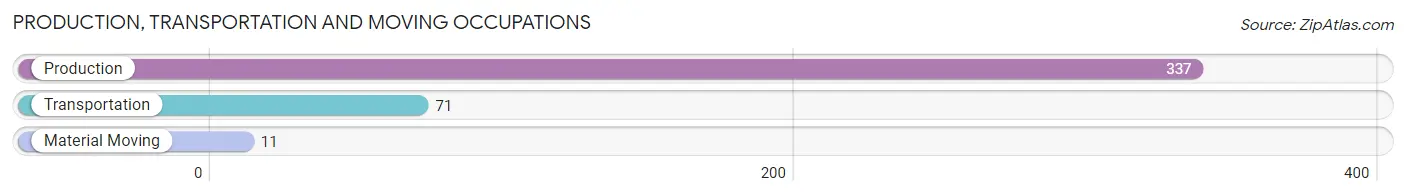
Production, Transportation and Moving Occupations
The most common Production, Transportation and Moving occupations in Blanco County are Production (337 | 6.1%), Transportation (71 | 1.3%), and Material Moving (11 | 0.2%).
Production, Transportation and Moving Occupations by Sex
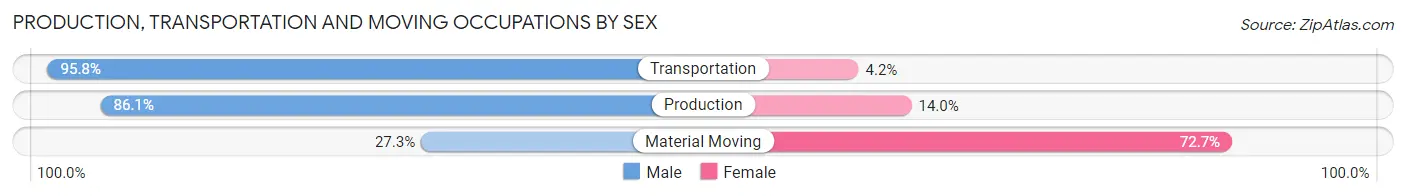
| Occupation | Male | Female |
| Production | 290 (86.1%) | 47 (14.0%) |
| Transportation | 68 (95.8%) | 3 (4.2%) |
| Material Moving | 3 (27.3%) | 8 (72.7%) |
| Total (Category) | 361 (86.2%) | 58 (13.8%) |
| Total (Overall) | 3,052 (55.5%) | 2,450 (44.5%) |
Employment Industries by Sex in Blanco County
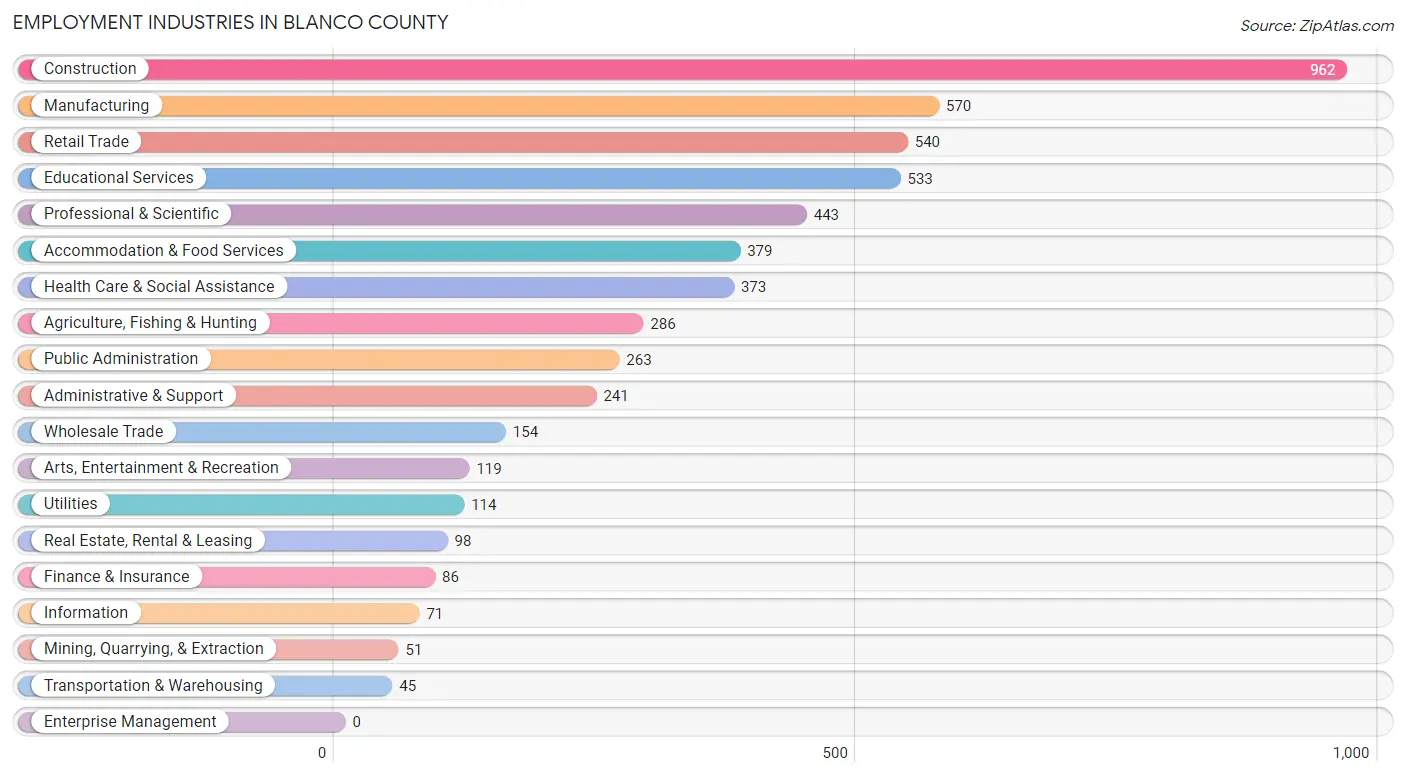
Employment Industries in Blanco County
The major employment industries in Blanco County include Construction (962 | 17.5%), Manufacturing (570 | 10.4%), Retail Trade (540 | 9.8%), Educational Services (533 | 9.7%), and Professional & Scientific (443 | 8.1%).
Employment Industries by Sex in Blanco County
The Blanco County industries that see more men than women are Mining, Quarrying, & Extraction (100.0%), Transportation & Warehousing (100.0%), and Construction (91.2%), whereas the industries that tend to have a higher number of women are Public Administration (83.7%), Health Care & Social Assistance (81.8%), and Real Estate, Rental & Leasing (75.5%).
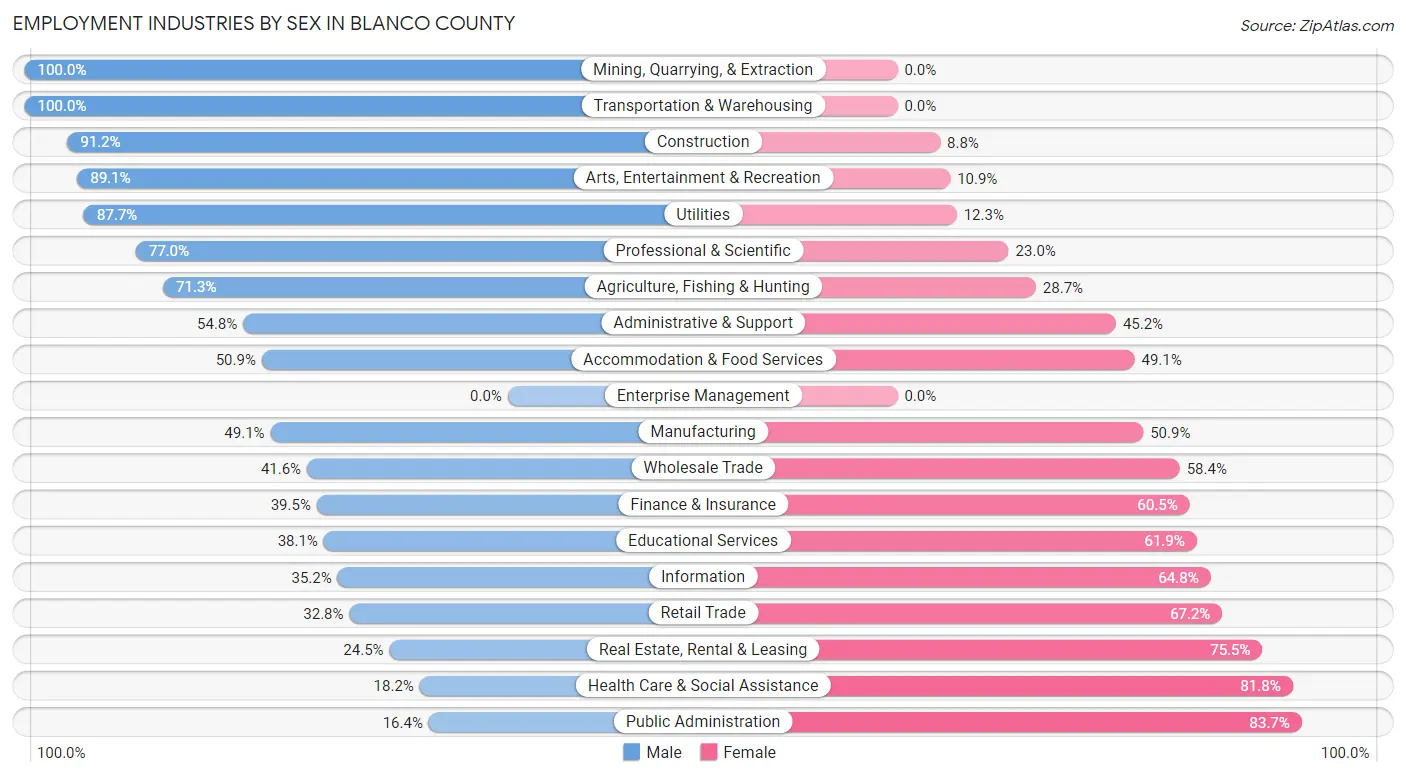
| Industry | Male | Female |
| Agriculture, Fishing & Hunting | 204 (71.3%) | 82 (28.7%) |
| Mining, Quarrying, & Extraction | 51 (100.0%) | 0 (0.0%) |
| Construction | 877 (91.2%) | 85 (8.8%) |
| Manufacturing | 280 (49.1%) | 290 (50.9%) |
| Wholesale Trade | 64 (41.6%) | 90 (58.4%) |
| Retail Trade | 177 (32.8%) | 363 (67.2%) |
| Transportation & Warehousing | 45 (100.0%) | 0 (0.0%) |
| Utilities | 100 (87.7%) | 14 (12.3%) |
| Information | 25 (35.2%) | 46 (64.8%) |
| Finance & Insurance | 34 (39.5%) | 52 (60.5%) |
| Real Estate, Rental & Leasing | 24 (24.5%) | 74 (75.5%) |
| Professional & Scientific | 341 (77.0%) | 102 (23.0%) |
| Enterprise Management | 0 (0.0%) | 0 (0.0%) |
| Administrative & Support | 132 (54.8%) | 109 (45.2%) |
| Educational Services | 203 (38.1%) | 330 (61.9%) |
| Health Care & Social Assistance | 68 (18.2%) | 305 (81.8%) |
| Arts, Entertainment & Recreation | 106 (89.1%) | 13 (10.9%) |
| Accommodation & Food Services | 193 (50.9%) | 186 (49.1%) |
| Public Administration | 43 (16.4%) | 220 (83.7%) |
| Total | 3,052 (55.5%) | 2,450 (44.5%) |
Education in Blanco County
School Enrollment in Blanco County
The most common levels of schooling among the 1,980 students in Blanco County are elementary school (582 | 29.4%), high school (528 | 26.7%), and middle school (452 | 22.8%).
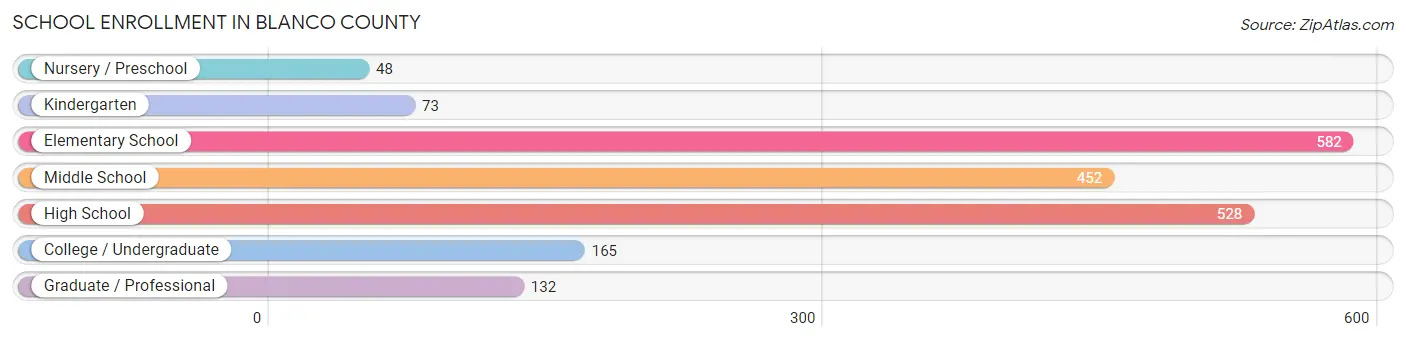
| School Level | # Students | % Students |
| Nursery / Preschool | 48 | 2.4% |
| Kindergarten | 73 | 3.7% |
| Elementary School | 582 | 29.4% |
| Middle School | 452 | 22.8% |
| High School | 528 | 26.7% |
| College / Undergraduate | 165 | 8.3% |
| Graduate / Professional | 132 | 6.7% |
| Total | 1,980 | 100.0% |
School Enrollment by Age by Funding Source in Blanco County
Out of a total of 1,980 students who are enrolled in schools in Blanco County, 111 (5.6%) attend a private institution, while the remaining 1,869 (94.4%) are enrolled in public schools. The age group of 35 years and over has the highest likelihood of being enrolled in private schools, with 26 (21.1% in the age bracket) enrolled. Conversely, the age group of 3 to 4 year olds has the lowest likelihood of being enrolled in a private school, with 29 (100.0% in the age bracket) attending a public institution.
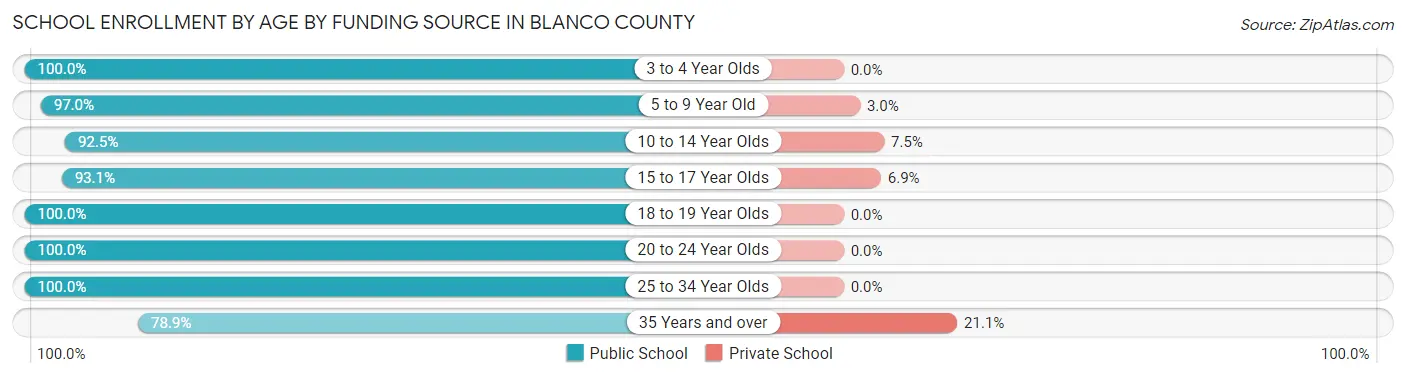
| Age Bracket | Public School | Private School |
| 3 to 4 Year Olds | 29 (100.0%) | 0 (0.0%) |
| 5 to 9 Year Old | 576 (97.0%) | 18 (3.0%) |
| 10 to 14 Year Olds | 516 (92.5%) | 42 (7.5%) |
| 15 to 17 Year Olds | 323 (93.1%) | 24 (6.9%) |
| 18 to 19 Year Olds | 222 (100.0%) | 0 (0.0%) |
| 20 to 24 Year Olds | 41 (100.0%) | 0 (0.0%) |
| 25 to 34 Year Olds | 66 (100.0%) | 0 (0.0%) |
| 35 Years and over | 97 (78.9%) | 26 (21.1%) |
| Total | 1,869 (94.4%) | 111 (5.6%) |
Educational Attainment by Field of Study in Blanco County
Business (637 | 21.7%), education (492 | 16.8%), bio, nature & agricultural (345 | 11.7%), engineering (195 | 6.6%), and physical & health sciences (193 | 6.6%) are the most common fields of study among 2,937 individuals in Blanco County who have obtained a bachelor's degree or higher.
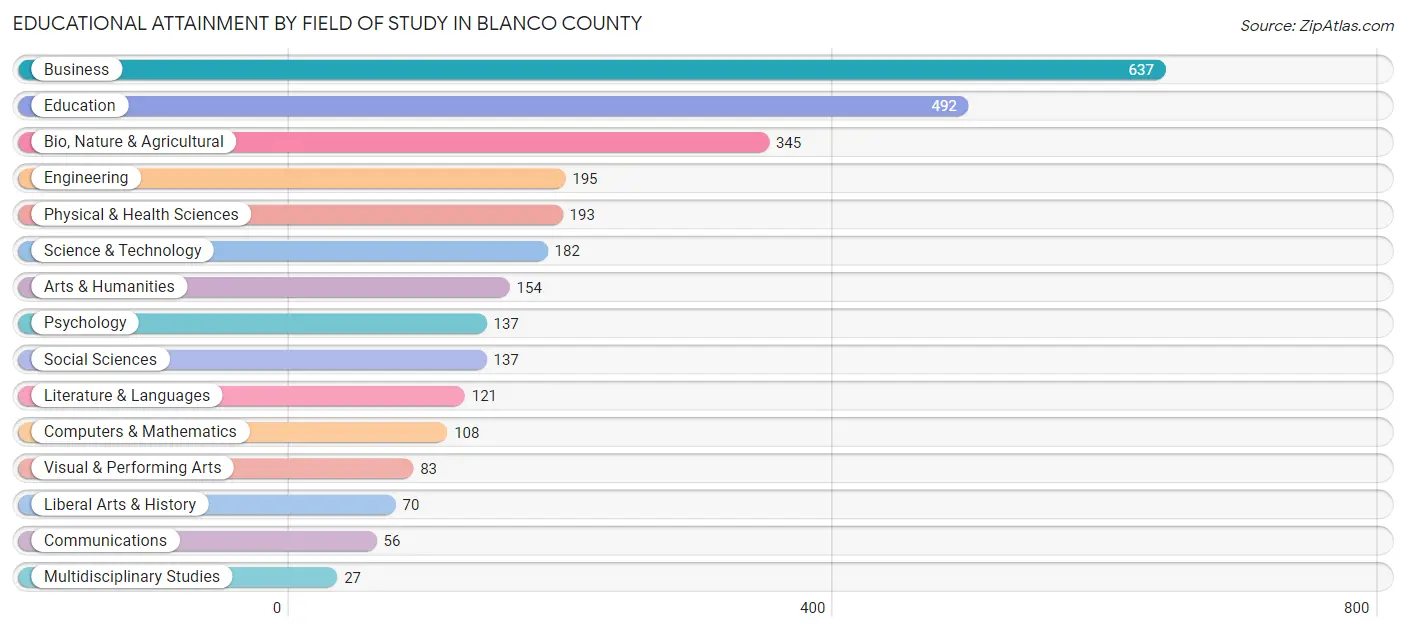
| Field of Study | # Graduates | % Graduates |
| Computers & Mathematics | 108 | 3.7% |
| Bio, Nature & Agricultural | 345 | 11.7% |
| Physical & Health Sciences | 193 | 6.6% |
| Psychology | 137 | 4.7% |
| Social Sciences | 137 | 4.7% |
| Engineering | 195 | 6.6% |
| Multidisciplinary Studies | 27 | 0.9% |
| Science & Technology | 182 | 6.2% |
| Business | 637 | 21.7% |
| Education | 492 | 16.8% |
| Literature & Languages | 121 | 4.1% |
| Liberal Arts & History | 70 | 2.4% |
| Visual & Performing Arts | 83 | 2.8% |
| Communications | 56 | 1.9% |
| Arts & Humanities | 154 | 5.2% |
| Total | 2,937 | 100.0% |
Transportation & Commute in Blanco County
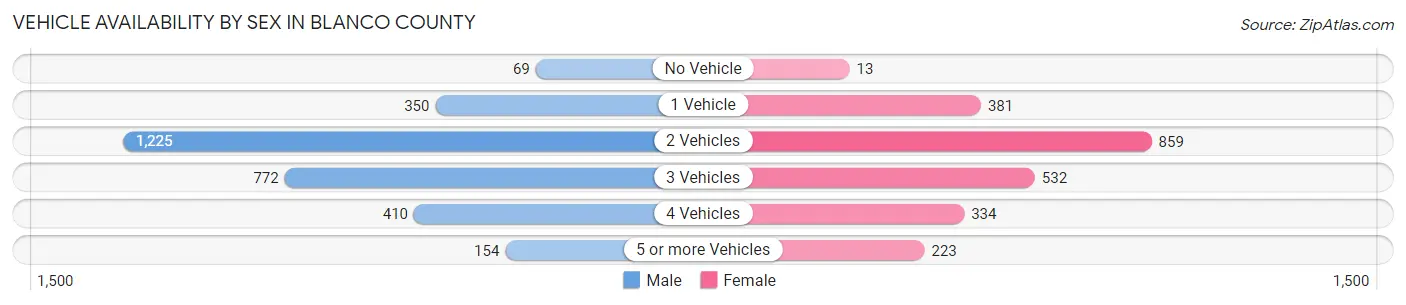
Vehicle Availability by Sex in Blanco County
The most prevalent vehicle ownership categories in Blanco County are males with 2 vehicles (1,225, accounting for 41.1%) and females with 2 vehicles (859, making up 52.3%).
| Vehicles Available | Male | Female |
| No Vehicle | 69 (2.3%) | 13 (0.6%) |
| 1 Vehicle | 350 (11.7%) | 381 (16.3%) |
| 2 Vehicles | 1,225 (41.1%) | 859 (36.7%) |
| 3 Vehicles | 772 (25.9%) | 532 (22.7%) |
| 4 Vehicles | 410 (13.8%) | 334 (14.3%) |
| 5 or more Vehicles | 154 (5.2%) | 223 (9.5%) |
| Total | 2,980 (100.0%) | 2,342 (100.0%) |
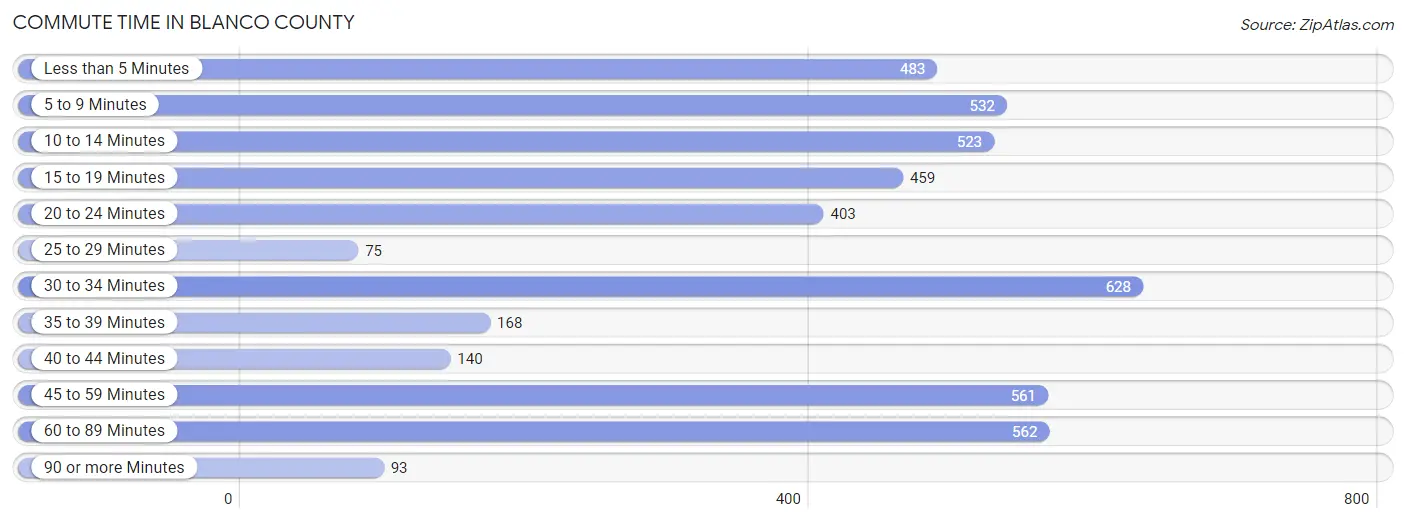
Commute Time in Blanco County
The most frequently occuring commute durations in Blanco County are 30 to 34 minutes (628 commuters, 13.6%), 60 to 89 minutes (562 commuters, 12.1%), and 45 to 59 minutes (561 commuters, 12.1%).
| Commute Time | # Commuters | % Commuters |
| Less than 5 Minutes | 483 | 10.4% |
| 5 to 9 Minutes | 532 | 11.5% |
| 10 to 14 Minutes | 523 | 11.3% |
| 15 to 19 Minutes | 459 | 9.9% |
| 20 to 24 Minutes | 403 | 8.7% |
| 25 to 29 Minutes | 75 | 1.6% |
| 30 to 34 Minutes | 628 | 13.6% |
| 35 to 39 Minutes | 168 | 3.6% |
| 40 to 44 Minutes | 140 | 3.0% |
| 45 to 59 Minutes | 561 | 12.1% |
| 60 to 89 Minutes | 562 | 12.1% |
| 90 or more Minutes | 93 | 2.0% |
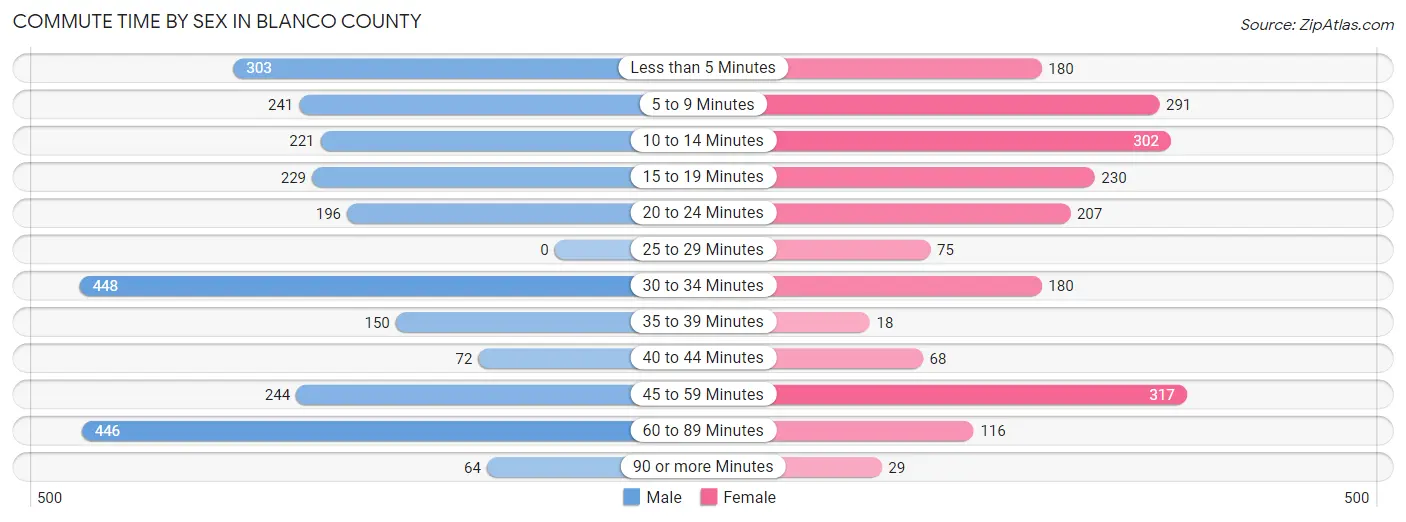
Commute Time by Sex in Blanco County
The most common commute times in Blanco County are 30 to 34 minutes (448 commuters, 17.1%) for males and 45 to 59 minutes (317 commuters, 15.8%) for females.
| Commute Time | Male | Female |
| Less than 5 Minutes | 303 (11.6%) | 180 (8.9%) |
| 5 to 9 Minutes | 241 (9.2%) | 291 (14.5%) |
| 10 to 14 Minutes | 221 (8.5%) | 302 (15.0%) |
| 15 to 19 Minutes | 229 (8.8%) | 230 (11.4%) |
| 20 to 24 Minutes | 196 (7.5%) | 207 (10.3%) |
| 25 to 29 Minutes | 0 (0.0%) | 75 (3.7%) |
| 30 to 34 Minutes | 448 (17.1%) | 180 (8.9%) |
| 35 to 39 Minutes | 150 (5.7%) | 18 (0.9%) |
| 40 to 44 Minutes | 72 (2.8%) | 68 (3.4%) |
| 45 to 59 Minutes | 244 (9.3%) | 317 (15.8%) |
| 60 to 89 Minutes | 446 (17.1%) | 116 (5.8%) |
| 90 or more Minutes | 64 (2.5%) | 29 (1.4%) |
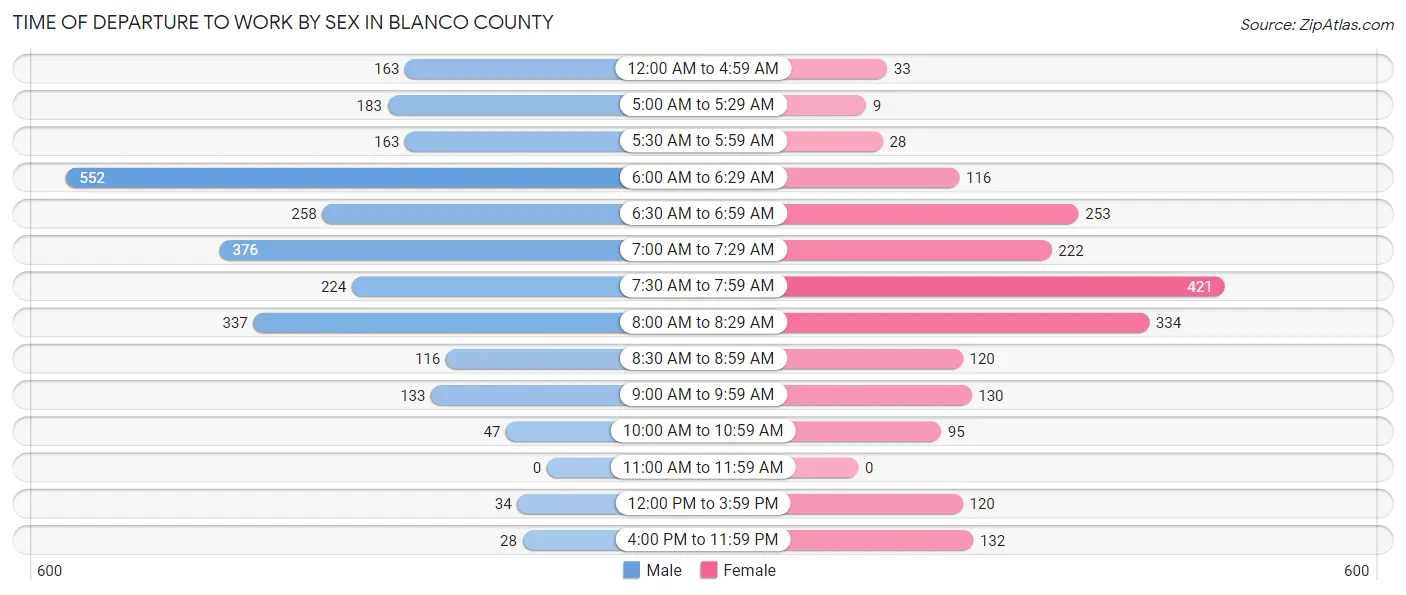
Time of Departure to Work by Sex in Blanco County
The most frequent times of departure to work in Blanco County are 6:00 AM to 6:29 AM (552, 21.1%) for males and 7:30 AM to 7:59 AM (421, 20.9%) for females.
| Time of Departure | Male | Female |
| 12:00 AM to 4:59 AM | 163 (6.2%) | 33 (1.6%) |
| 5:00 AM to 5:29 AM | 183 (7.0%) | 9 (0.4%) |
| 5:30 AM to 5:59 AM | 163 (6.2%) | 28 (1.4%) |
| 6:00 AM to 6:29 AM | 552 (21.1%) | 116 (5.8%) |
| 6:30 AM to 6:59 AM | 258 (9.9%) | 253 (12.6%) |
| 7:00 AM to 7:29 AM | 376 (14.4%) | 222 (11.0%) |
| 7:30 AM to 7:59 AM | 224 (8.6%) | 421 (20.9%) |
| 8:00 AM to 8:29 AM | 337 (12.9%) | 334 (16.6%) |
| 8:30 AM to 8:59 AM | 116 (4.4%) | 120 (6.0%) |
| 9:00 AM to 9:59 AM | 133 (5.1%) | 130 (6.5%) |
| 10:00 AM to 10:59 AM | 47 (1.8%) | 95 (4.7%) |
| 11:00 AM to 11:59 AM | 0 (0.0%) | 0 (0.0%) |
| 12:00 PM to 3:59 PM | 34 (1.3%) | 120 (6.0%) |
| 4:00 PM to 11:59 PM | 28 (1.1%) | 132 (6.6%) |
| Total | 2,614 (100.0%) | 2,013 (100.0%) |
Housing Occupancy in Blanco County
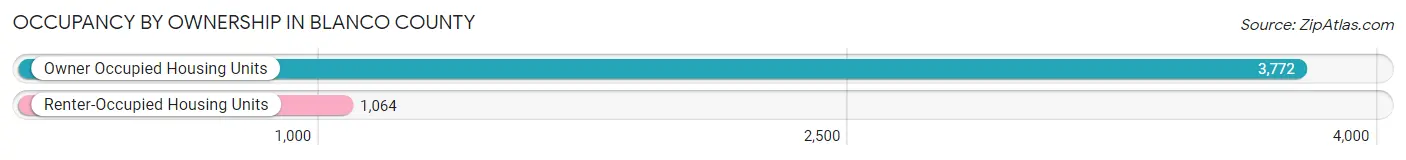
Occupancy by Ownership in Blanco County
Of the total 4,836 dwellings in Blanco County, owner-occupied units account for 3,772 (78.0%), while renter-occupied units make up 1,064 (22.0%).
| Occupancy | # Housing Units | % Housing Units |
| Owner Occupied Housing Units | 3,772 | 78.0% |
| Renter-Occupied Housing Units | 1,064 | 22.0% |
| Total Occupied Housing Units | 4,836 | 100.0% |
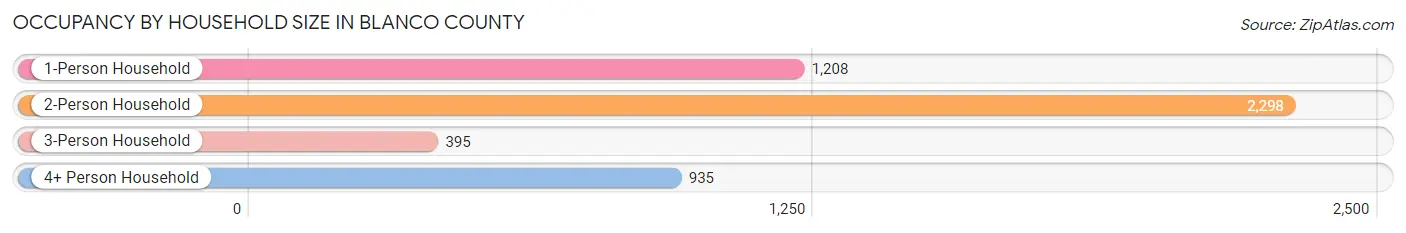
Occupancy by Household Size in Blanco County
| Household Size | # Housing Units | % Housing Units |
| 1-Person Household | 1,208 | 25.0% |
| 2-Person Household | 2,298 | 47.5% |
| 3-Person Household | 395 | 8.2% |
| 4+ Person Household | 935 | 19.3% |
| Total Housing Units | 4,836 | 100.0% |
Occupancy by Ownership by Household Size in Blanco County
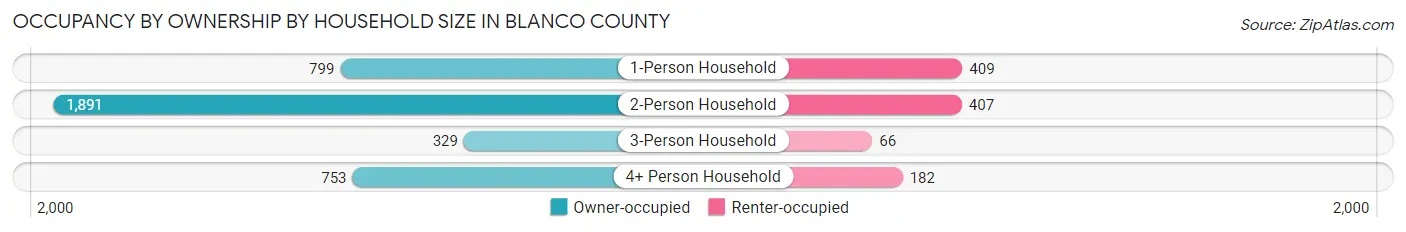
| Household Size | Owner-occupied | Renter-occupied |
| 1-Person Household | 799 (66.1%) | 409 (33.9%) |
| 2-Person Household | 1,891 (82.3%) | 407 (17.7%) |
| 3-Person Household | 329 (83.3%) | 66 (16.7%) |
| 4+ Person Household | 753 (80.5%) | 182 (19.5%) |
| Total Housing Units | 3,772 (78.0%) | 1,064 (22.0%) |
Occupancy by Educational Attainment in Blanco County
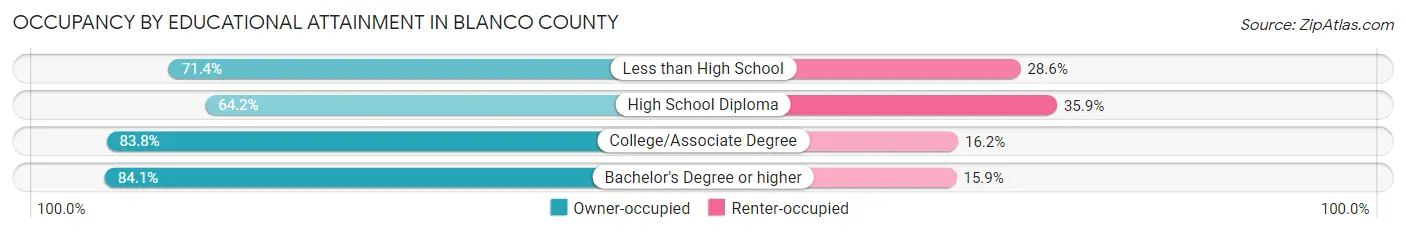
| Household Size | Owner-occupied | Renter-occupied |
| Less than High School | 302 (71.4%) | 121 (28.6%) |
| High School Diploma | 757 (64.1%) | 423 (35.8%) |
| College/Associate Degree | 1,388 (83.8%) | 269 (16.2%) |
| Bachelor's Degree or higher | 1,325 (84.1%) | 251 (15.9%) |
Occupancy by Age of Householder in Blanco County
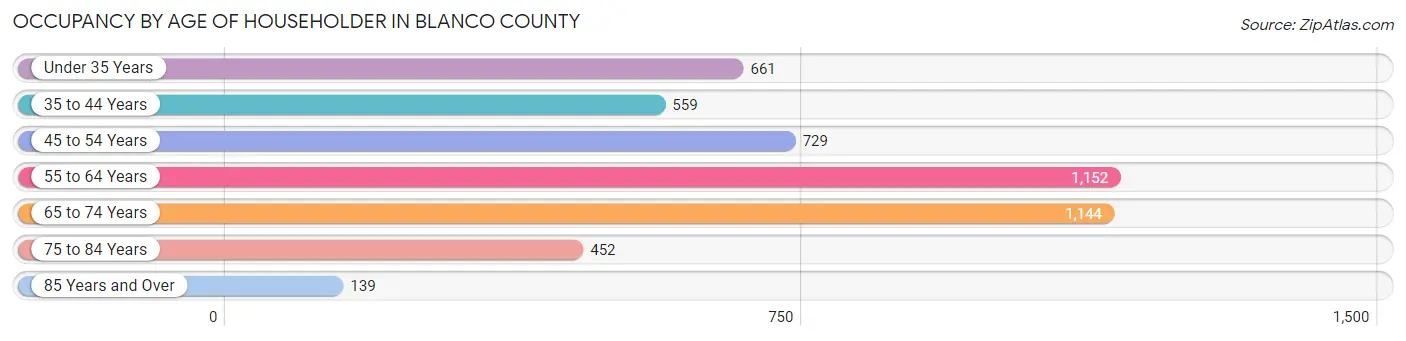
| Age Bracket | # Households | % Households |
| Under 35 Years | 661 | 13.7% |
| 35 to 44 Years | 559 | 11.6% |
| 45 to 54 Years | 729 | 15.1% |
| 55 to 64 Years | 1,152 | 23.8% |
| 65 to 74 Years | 1,144 | 23.7% |
| 75 to 84 Years | 452 | 9.3% |
| 85 Years and Over | 139 | 2.9% |
| Total | 4,836 | 100.0% |
Housing Finances in Blanco County
Median Income by Occupancy in Blanco County
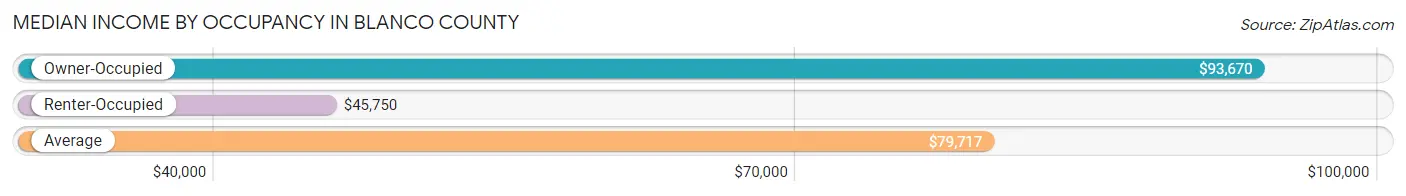
| Occupancy Type | # Households | Median Income |
| Owner-Occupied | 3,772 (78.0%) | $93,670 |
| Renter-Occupied | 1,064 (22.0%) | $45,750 |
| Average | 4,836 (100.0%) | $79,717 |
Occupancy by Householder Income Bracket in Blanco County
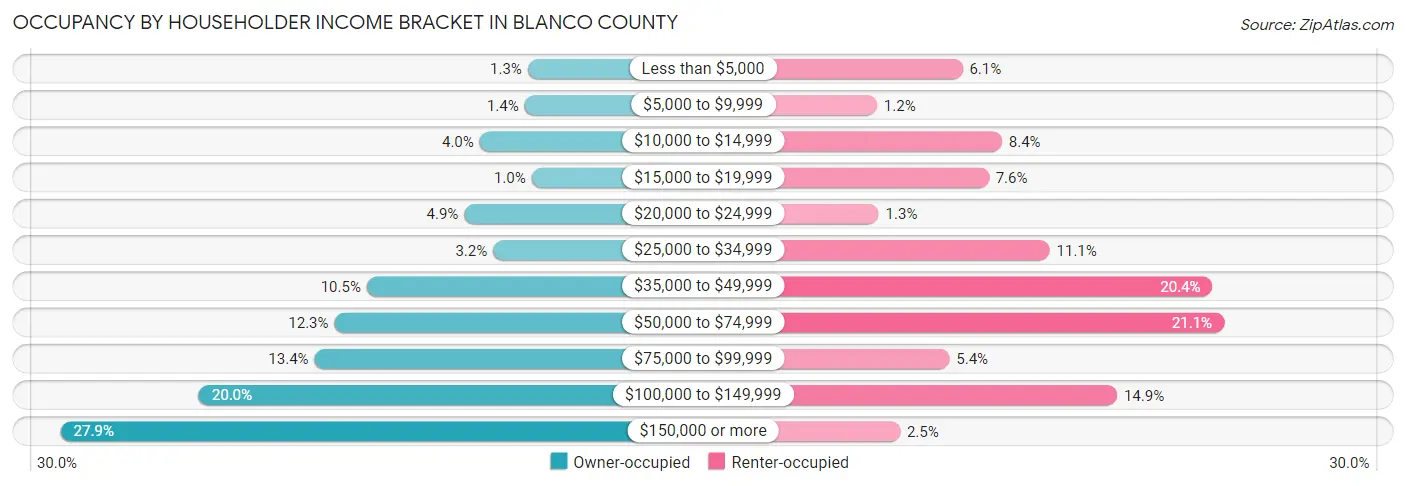
| Income Bracket | Owner-occupied | Renter-occupied |
| Less than $5,000 | 47 (1.3%) | 65 (6.1%) |
| $5,000 to $9,999 | 54 (1.4%) | 13 (1.2%) |
| $10,000 to $14,999 | 151 (4.0%) | 89 (8.4%) |
| $15,000 to $19,999 | 39 (1.0%) | 81 (7.6%) |
| $20,000 to $24,999 | 184 (4.9%) | 14 (1.3%) |
| $25,000 to $34,999 | 122 (3.2%) | 118 (11.1%) |
| $35,000 to $49,999 | 394 (10.4%) | 217 (20.4%) |
| $50,000 to $74,999 | 464 (12.3%) | 224 (21.0%) |
| $75,000 to $99,999 | 507 (13.4%) | 57 (5.4%) |
| $100,000 to $149,999 | 756 (20.0%) | 159 (14.9%) |
| $150,000 or more | 1,054 (27.9%) | 27 (2.5%) |
| Total | 3,772 (100.0%) | 1,064 (100.0%) |
Monthly Housing Cost Tiers in Blanco County
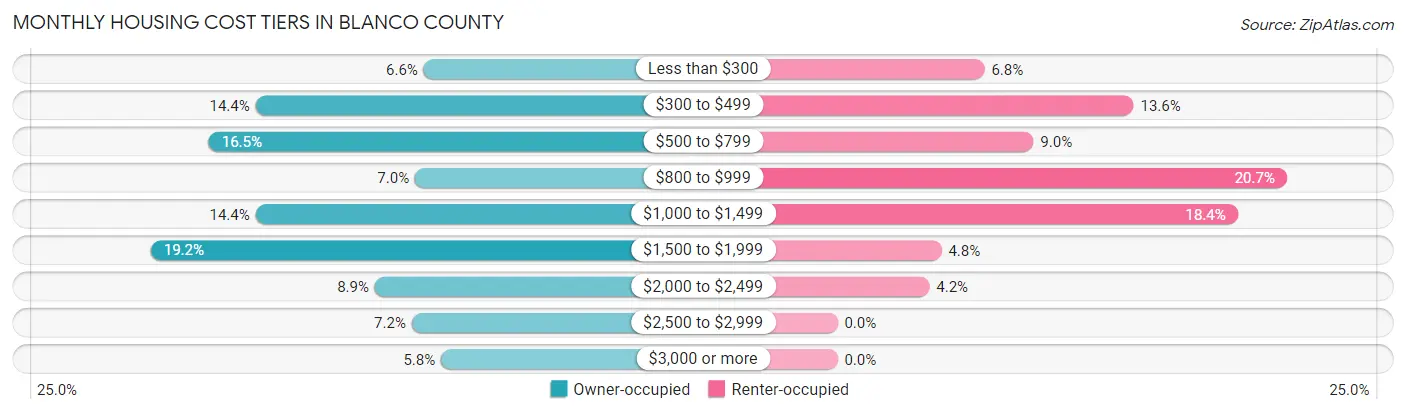
| Monthly Cost | Owner-occupied | Renter-occupied |
| Less than $300 | 250 (6.6%) | 72 (6.8%) |
| $300 to $499 | 542 (14.4%) | 145 (13.6%) |
| $500 to $799 | 623 (16.5%) | 96 (9.0%) |
| $800 to $999 | 265 (7.0%) | 220 (20.7%) |
| $1,000 to $1,499 | 542 (14.4%) | 196 (18.4%) |
| $1,500 to $1,999 | 724 (19.2%) | 51 (4.8%) |
| $2,000 to $2,499 | 335 (8.9%) | 45 (4.2%) |
| $2,500 to $2,999 | 271 (7.2%) | 0 (0.0%) |
| $3,000 or more | 220 (5.8%) | 0 (0.0%) |
| Total | 3,772 (100.0%) | 1,064 (100.0%) |
Physical Housing Characteristics in Blanco County
Housing Structures in Blanco County
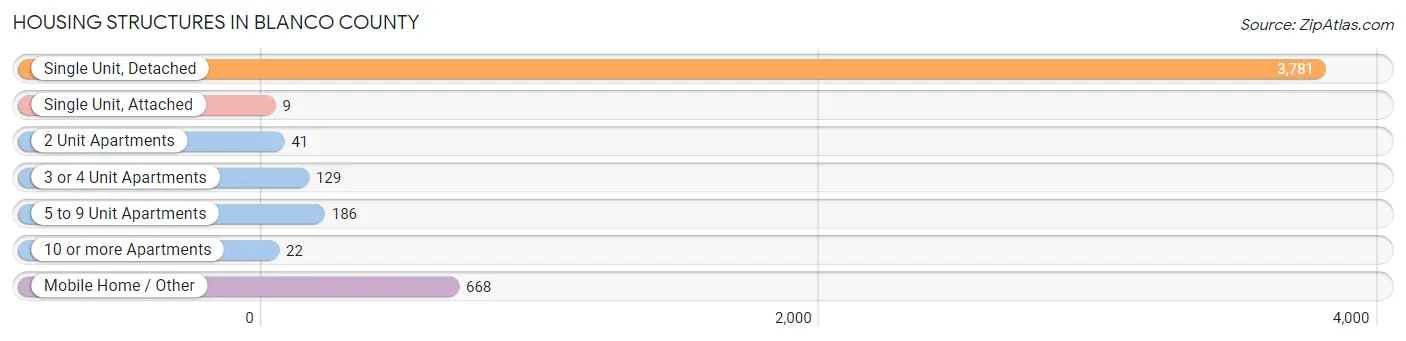
| Structure Type | # Housing Units | % Housing Units |
| Single Unit, Detached | 3,781 | 78.2% |
| Single Unit, Attached | 9 | 0.2% |
| 2 Unit Apartments | 41 | 0.9% |
| 3 or 4 Unit Apartments | 129 | 2.7% |
| 5 to 9 Unit Apartments | 186 | 3.8% |
| 10 or more Apartments | 22 | 0.4% |
| Mobile Home / Other | 668 | 13.8% |
| Total | 4,836 | 100.0% |
Housing Structures by Occupancy in Blanco County
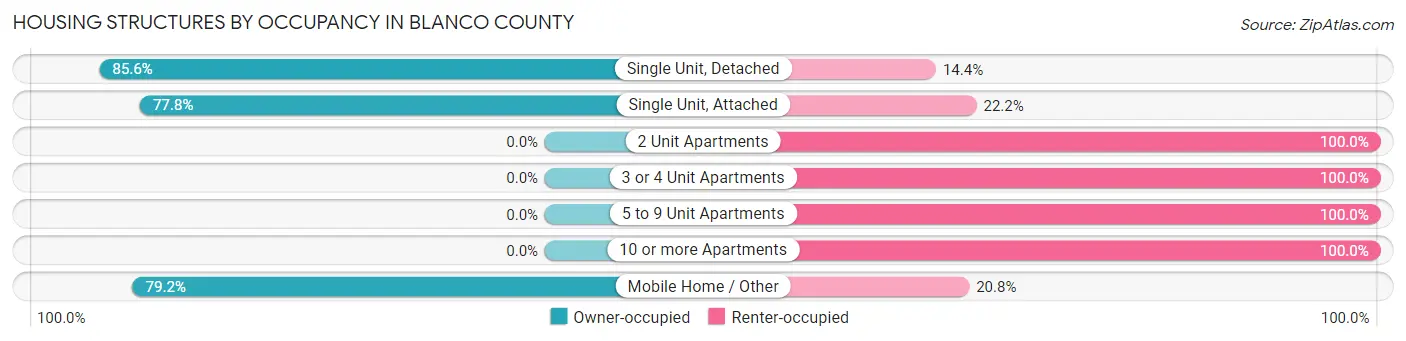
| Structure Type | Owner-occupied | Renter-occupied |
| Single Unit, Detached | 3,236 (85.6%) | 545 (14.4%) |
| Single Unit, Attached | 7 (77.8%) | 2 (22.2%) |
| 2 Unit Apartments | 0 (0.0%) | 41 (100.0%) |
| 3 or 4 Unit Apartments | 0 (0.0%) | 129 (100.0%) |
| 5 to 9 Unit Apartments | 0 (0.0%) | 186 (100.0%) |
| 10 or more Apartments | 0 (0.0%) | 22 (100.0%) |
| Mobile Home / Other | 529 (79.2%) | 139 (20.8%) |
| Total | 3,772 (78.0%) | 1,064 (22.0%) |
Housing Structures by Number of Rooms in Blanco County
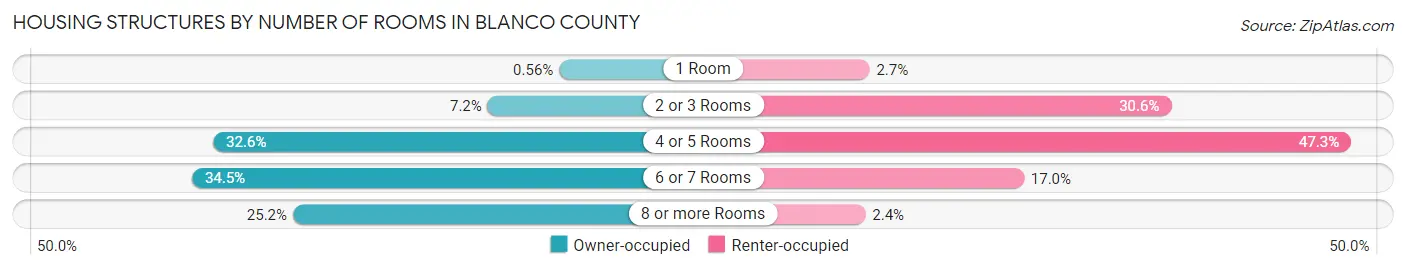
| Number of Rooms | Owner-occupied | Renter-occupied |
| 1 Room | 21 (0.6%) | 29 (2.7%) |
| 2 or 3 Rooms | 271 (7.2%) | 326 (30.6%) |
| 4 or 5 Rooms | 1,228 (32.6%) | 503 (47.3%) |
| 6 or 7 Rooms | 1,302 (34.5%) | 181 (17.0%) |
| 8 or more Rooms | 950 (25.2%) | 25 (2.4%) |
| Total | 3,772 (100.0%) | 1,064 (100.0%) |
Housing Structure by Heating Type in Blanco County
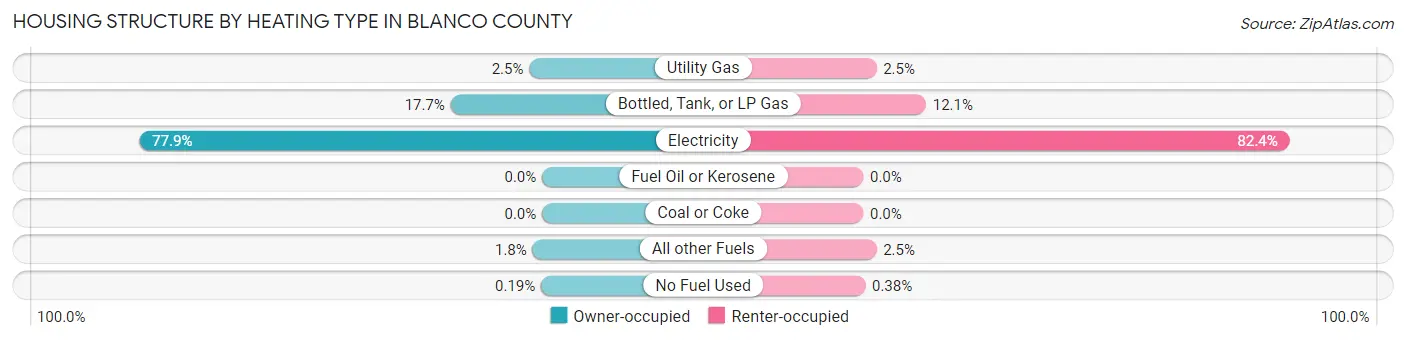
| Heating Type | Owner-occupied | Renter-occupied |
| Utility Gas | 93 (2.5%) | 27 (2.5%) |
| Bottled, Tank, or LP Gas | 666 (17.7%) | 129 (12.1%) |
| Electricity | 2,937 (77.9%) | 877 (82.4%) |
| Fuel Oil or Kerosene | 0 (0.0%) | 0 (0.0%) |
| Coal or Coke | 0 (0.0%) | 0 (0.0%) |
| All other Fuels | 69 (1.8%) | 27 (2.5%) |
| No Fuel Used | 7 (0.2%) | 4 (0.4%) |
| Total | 3,772 (100.0%) | 1,064 (100.0%) |
Household Vehicle Usage in Blanco County
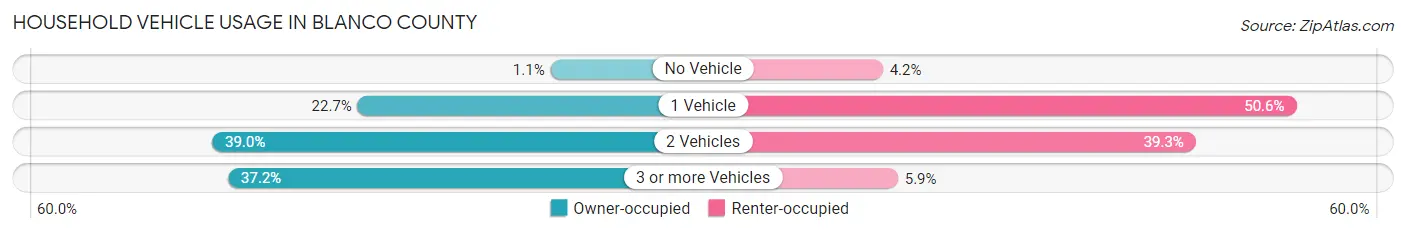
| Vehicles per Household | Owner-occupied | Renter-occupied |
| No Vehicle | 41 (1.1%) | 45 (4.2%) |
| 1 Vehicle | 856 (22.7%) | 538 (50.6%) |
| 2 Vehicles | 1,471 (39.0%) | 418 (39.3%) |
| 3 or more Vehicles | 1,404 (37.2%) | 63 (5.9%) |
| Total | 3,772 (100.0%) | 1,064 (100.0%) |
Real Estate & Mortgages in Blanco County
Real Estate and Mortgage Overview in Blanco County
| Characteristic | Without Mortgage | With Mortgage |
| Housing Units | 1,995 | 1,777 |
| Median Property Value | $247,300 | $379,000 |
| Median Household Income | $77,645 | $641 |
| Monthly Housing Costs | $607 | $220 |
| Real Estate Taxes | $2,575 | $132 |
Property Value by Mortgage Status in Blanco County
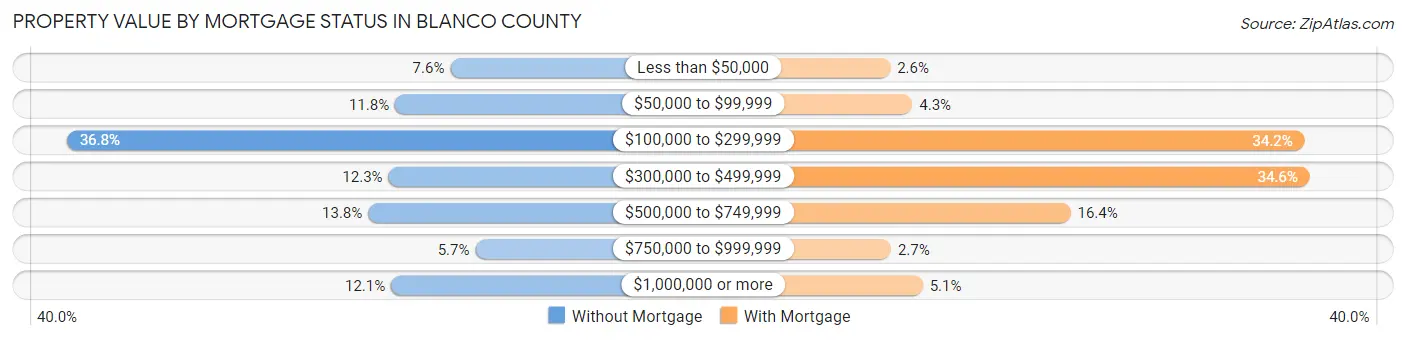
| Property Value | Without Mortgage | With Mortgage |
| Less than $50,000 | 151 (7.6%) | 47 (2.6%) |
| $50,000 to $99,999 | 235 (11.8%) | 77 (4.3%) |
| $100,000 to $299,999 | 734 (36.8%) | 608 (34.2%) |
| $300,000 to $499,999 | 245 (12.3%) | 615 (34.6%) |
| $500,000 to $749,999 | 276 (13.8%) | 291 (16.4%) |
| $750,000 to $999,999 | 113 (5.7%) | 48 (2.7%) |
| $1,000,000 or more | 241 (12.1%) | 91 (5.1%) |
| Total | 1,995 (100.0%) | 1,777 (100.0%) |
Household Income by Mortgage Status in Blanco County
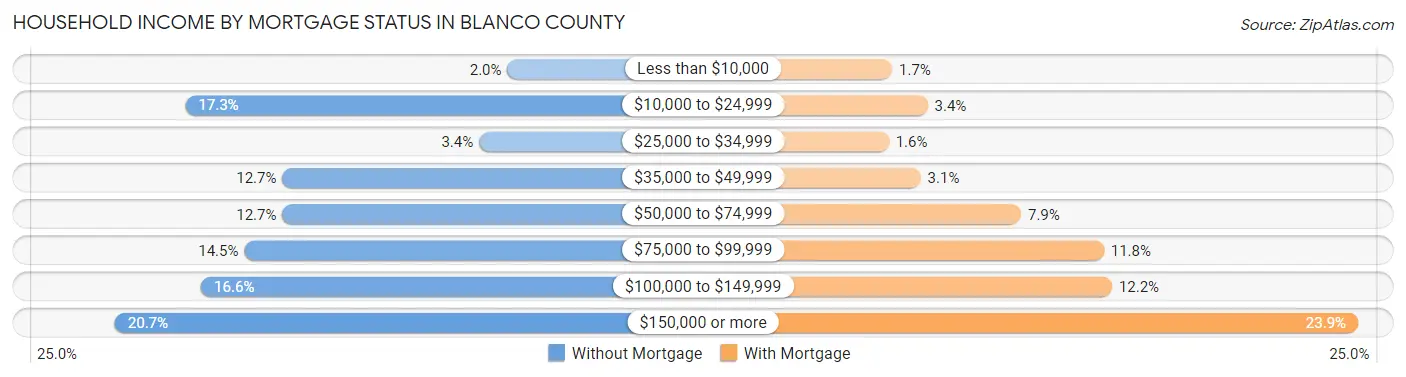
| Household Income | Without Mortgage | With Mortgage |
| Less than $10,000 | 40 (2.0%) | 31 (1.7%) |
| $10,000 to $24,999 | 346 (17.3%) | 61 (3.4%) |
| $25,000 to $34,999 | 67 (3.4%) | 28 (1.6%) |
| $35,000 to $49,999 | 254 (12.7%) | 55 (3.1%) |
| $50,000 to $74,999 | 254 (12.7%) | 140 (7.9%) |
| $75,000 to $99,999 | 290 (14.5%) | 210 (11.8%) |
| $100,000 to $149,999 | 331 (16.6%) | 217 (12.2%) |
| $150,000 or more | 413 (20.7%) | 425 (23.9%) |
| Total | 1,995 (100.0%) | 1,777 (100.0%) |
Property Value to Household Income Ratio in Blanco County
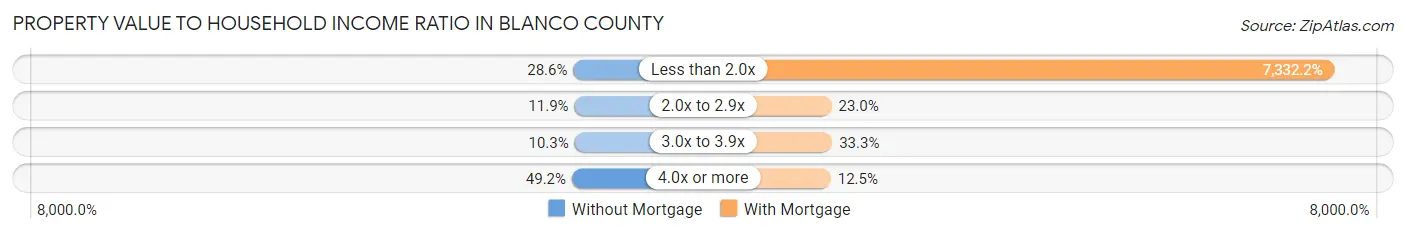
| Value-to-Income Ratio | Without Mortgage | With Mortgage |
| Less than 2.0x | 570 (28.6%) | 130,293 (7,332.2%) |
| 2.0x to 2.9x | 237 (11.9%) | 409 (23.0%) |
| 3.0x to 3.9x | 206 (10.3%) | 591 (33.3%) |
| 4.0x or more | 982 (49.2%) | 222 (12.5%) |
| Total | 1,995 (100.0%) | 1,777 (100.0%) |
Real Estate Taxes by Mortgage Status in Blanco County

| Property Taxes | Without Mortgage | With Mortgage |
| Less than $800 | 176 (8.8%) | 20 (1.1%) |
| $800 to $1,499 | 460 (23.1%) | 54 (3.0%) |
| $800 to $1,499 | 1,271 (63.7%) | 274 (15.4%) |
| Total | 1,995 (100.0%) | 1,777 (100.0%) |
Health & Disability in Blanco County
Health Insurance Coverage by Age in Blanco County
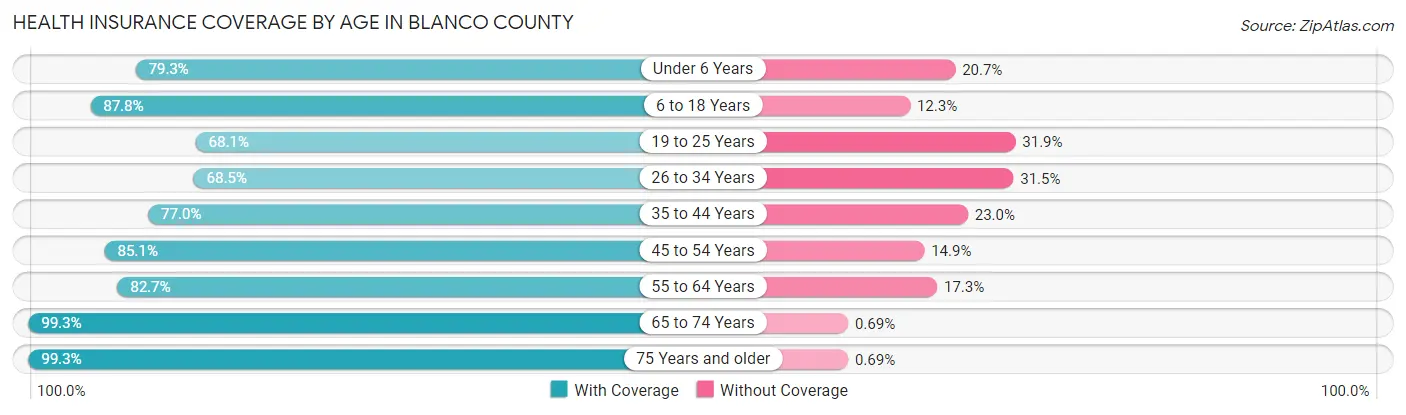
| Age Bracket | With Coverage | Without Coverage |
| Under 6 Years | 395 (79.3%) | 103 (20.7%) |
| 6 to 18 Years | 1,504 (87.7%) | 210 (12.2%) |
| 19 to 25 Years | 412 (68.1%) | 193 (31.9%) |
| 26 to 34 Years | 819 (68.5%) | 377 (31.5%) |
| 35 to 44 Years | 812 (77.0%) | 243 (23.0%) |
| 45 to 54 Years | 1,278 (85.1%) | 224 (14.9%) |
| 55 to 64 Years | 1,799 (82.7%) | 376 (17.3%) |
| 65 to 74 Years | 1,728 (99.3%) | 12 (0.7%) |
| 75 Years and older | 1,009 (99.3%) | 7 (0.7%) |
| Total | 9,756 (84.8%) | 1,745 (15.2%) |
Health Insurance Coverage by Citizenship Status in Blanco County
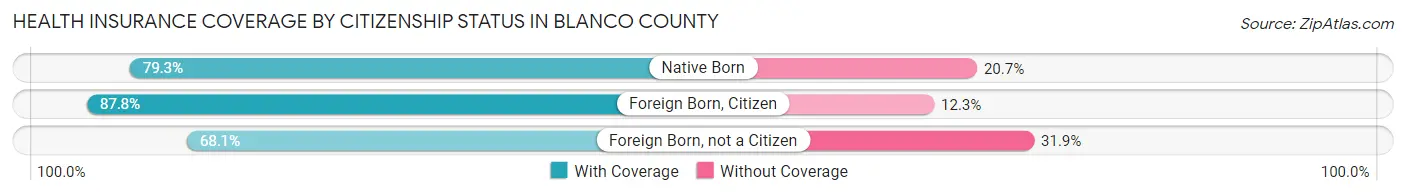
| Citizenship Status | With Coverage | Without Coverage |
| Native Born | 395 (79.3%) | 103 (20.7%) |
| Foreign Born, Citizen | 1,504 (87.7%) | 210 (12.2%) |
| Foreign Born, not a Citizen | 412 (68.1%) | 193 (31.9%) |
Health Insurance Coverage by Household Income in Blanco County
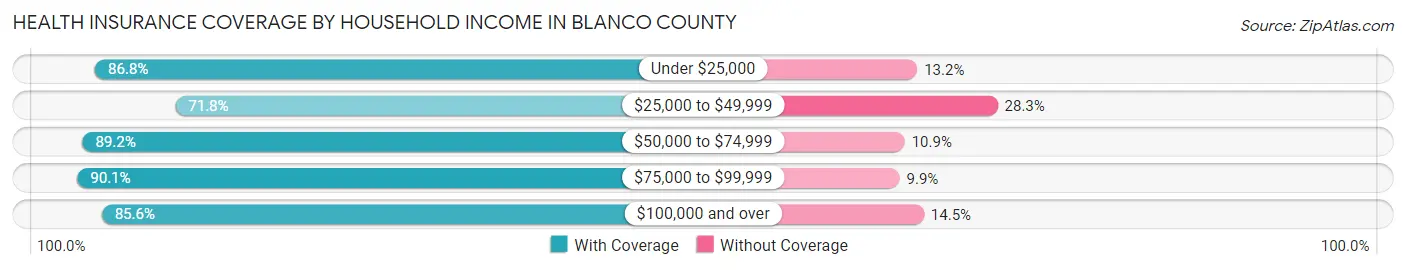
| Household Income | With Coverage | Without Coverage |
| Under $25,000 | 1,092 (86.8%) | 166 (13.2%) |
| $25,000 to $49,999 | 1,115 (71.8%) | 439 (28.2%) |
| $50,000 to $74,999 | 1,405 (89.1%) | 171 (10.8%) |
| $75,000 to $99,999 | 1,193 (90.1%) | 131 (9.9%) |
| $100,000 and over | 4,939 (85.6%) | 834 (14.4%) |
Public vs Private Health Insurance Coverage by Age in Blanco County
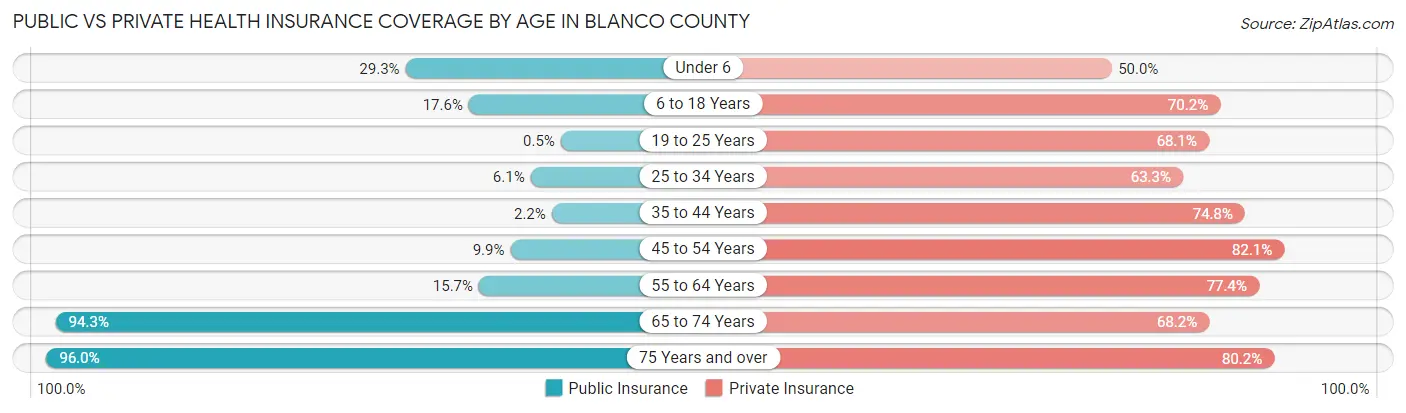
| Age Bracket | Public Insurance | Private Insurance |
| Under 6 | 146 (29.3%) | 249 (50.0%) |
| 6 to 18 Years | 301 (17.6%) | 1,203 (70.2%) |
| 19 to 25 Years | 3 (0.5%) | 412 (68.1%) |
| 25 to 34 Years | 73 (6.1%) | 757 (63.3%) |
| 35 to 44 Years | 23 (2.2%) | 789 (74.8%) |
| 45 to 54 Years | 148 (9.9%) | 1,233 (82.1%) |
| 55 to 64 Years | 341 (15.7%) | 1,683 (77.4%) |
| 65 to 74 Years | 1,640 (94.3%) | 1,186 (68.2%) |
| 75 Years and over | 975 (96.0%) | 815 (80.2%) |
| Total | 3,650 (31.7%) | 8,327 (72.4%) |
Disability Status by Sex by Age in Blanco County
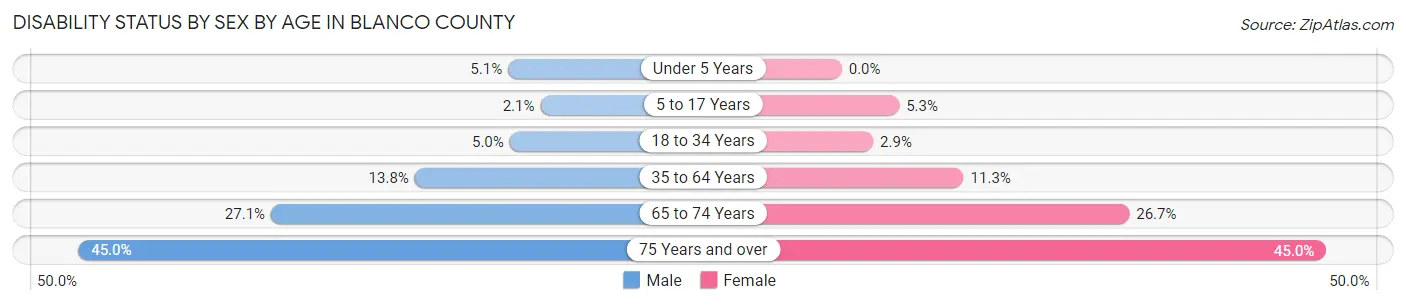
| Age Bracket | Male | Female |
| Under 5 Years | 11 (5.1%) | 0 (0.0%) |
| 5 to 17 Years | 18 (2.1%) | 42 (5.3%) |
| 18 to 34 Years | 48 (5.0%) | 29 (2.9%) |
| 35 to 64 Years | 343 (13.8%) | 254 (11.3%) |
| 65 to 74 Years | 222 (27.1%) | 246 (26.7%) |
| 75 Years and over | 212 (45.0%) | 245 (45.0%) |
Disability Class by Sex by Age in Blanco County
Disability Class: Hearing Difficulty
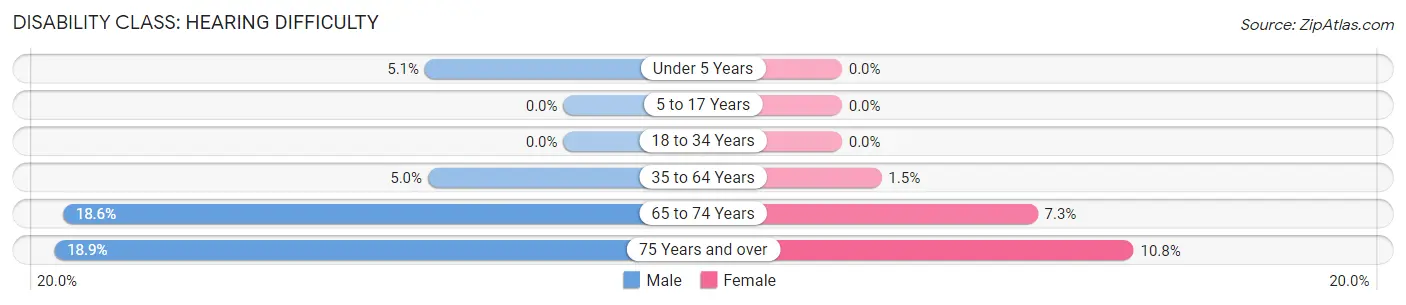
| Age Bracket | Male | Female |
| Under 5 Years | 11 (5.1%) | 0 (0.0%) |
| 5 to 17 Years | 0 (0.0%) | 0 (0.0%) |
| 18 to 34 Years | 0 (0.0%) | 0 (0.0%) |
| 35 to 64 Years | 125 (5.0%) | 33 (1.5%) |
| 65 to 74 Years | 152 (18.6%) | 67 (7.3%) |
| 75 Years and over | 89 (18.9%) | 59 (10.8%) |
Disability Class: Vision Difficulty
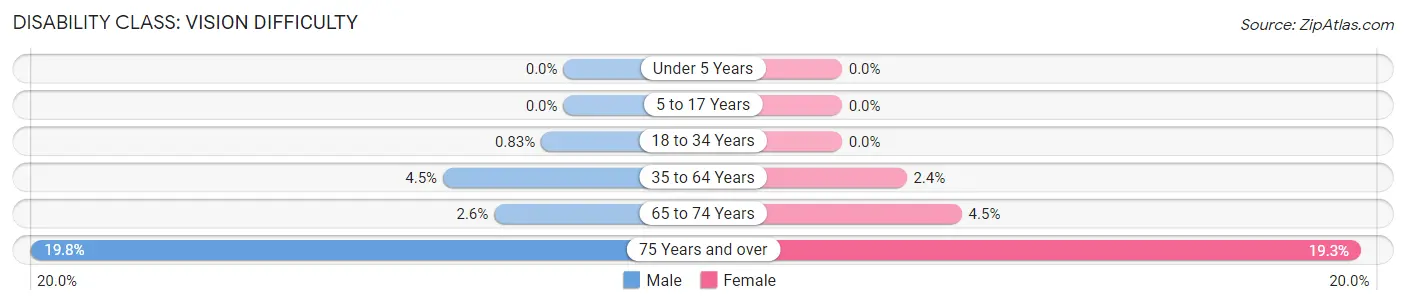
| Age Bracket | Male | Female |
| Under 5 Years | 0 (0.0%) | 0 (0.0%) |
| 5 to 17 Years | 0 (0.0%) | 0 (0.0%) |
| 18 to 34 Years | 8 (0.8%) | 0 (0.0%) |
| 35 to 64 Years | 111 (4.5%) | 54 (2.4%) |
| 65 to 74 Years | 21 (2.6%) | 41 (4.4%) |
| 75 Years and over | 93 (19.8%) | 105 (19.3%) |
Disability Class: Cognitive Difficulty
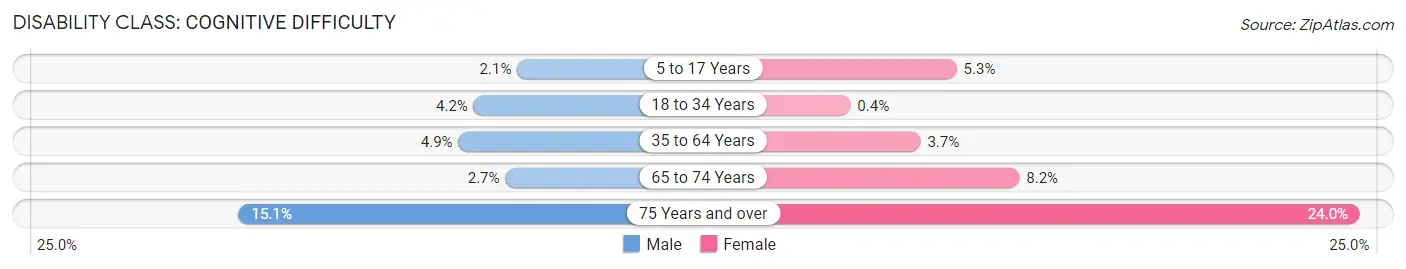
| Age Bracket | Male | Female |
| 5 to 17 Years | 18 (2.1%) | 42 (5.3%) |
| 18 to 34 Years | 40 (4.2%) | 4 (0.4%) |
| 35 to 64 Years | 121 (4.9%) | 82 (3.6%) |
| 65 to 74 Years | 22 (2.7%) | 76 (8.2%) |
| 75 Years and over | 71 (15.1%) | 131 (24.0%) |
Disability Class: Ambulatory Difficulty
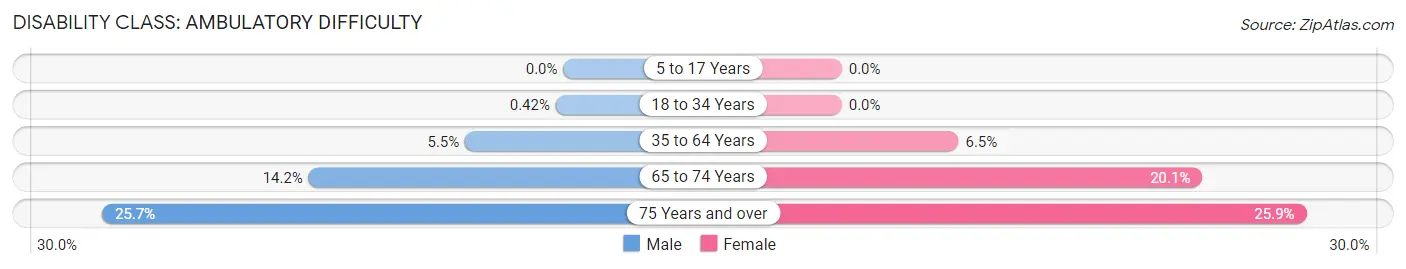
| Age Bracket | Male | Female |
| 5 to 17 Years | 0 (0.0%) | 0 (0.0%) |
| 18 to 34 Years | 4 (0.4%) | 0 (0.0%) |
| 35 to 64 Years | 136 (5.5%) | 146 (6.5%) |
| 65 to 74 Years | 116 (14.2%) | 185 (20.1%) |
| 75 Years and over | 121 (25.7%) | 141 (25.9%) |
Disability Class: Self-Care Difficulty
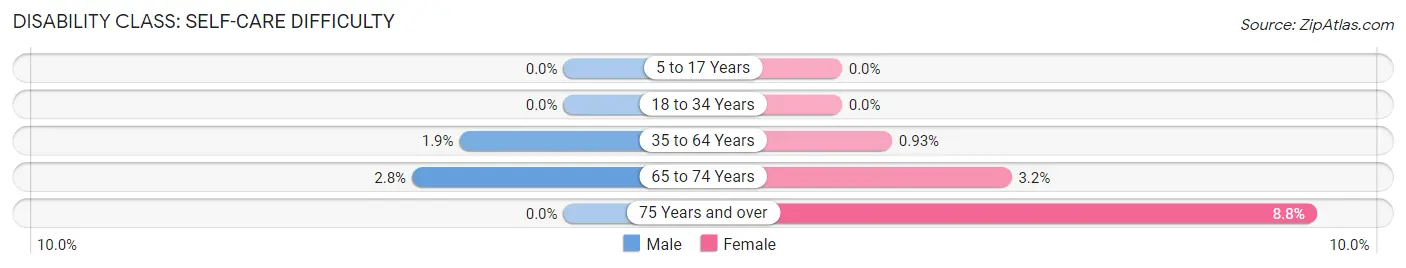
| Age Bracket | Male | Female |
| 5 to 17 Years | 0 (0.0%) | 0 (0.0%) |
| 18 to 34 Years | 0 (0.0%) | 0 (0.0%) |
| 35 to 64 Years | 48 (1.9%) | 21 (0.9%) |
| 65 to 74 Years | 23 (2.8%) | 29 (3.2%) |
| 75 Years and over | 0 (0.0%) | 48 (8.8%) |
Technology Access in Blanco County
Computing Device Access in Blanco County
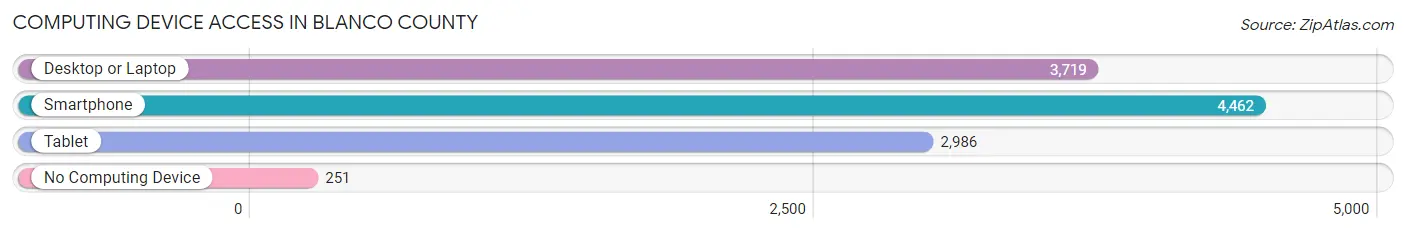
| Device Type | # Households | % Households |
| Desktop or Laptop | 3,719 | 76.9% |
| Smartphone | 4,462 | 92.3% |
| Tablet | 2,986 | 61.8% |
| No Computing Device | 251 | 5.2% |
| Total | 4,836 | 100.0% |
Internet Access in Blanco County
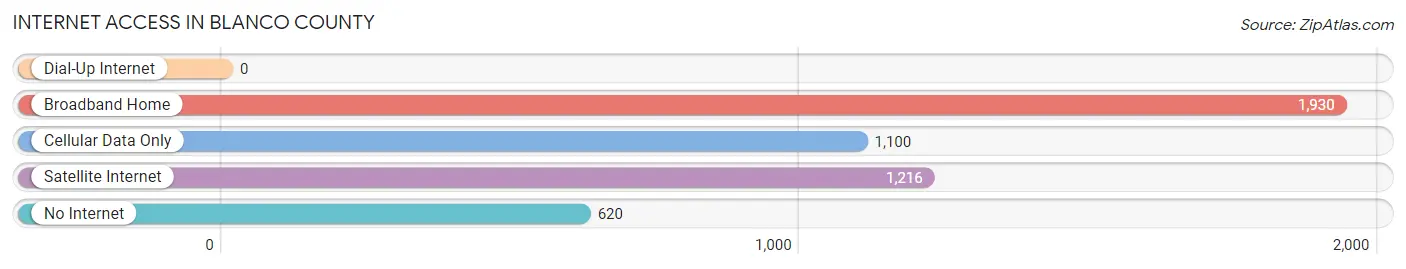
| Internet Type | # Households | % Households |
| Dial-Up Internet | 0 | 0.0% |
| Broadband Home | 1,930 | 39.9% |
| Cellular Data Only | 1,100 | 22.8% |
| Satellite Internet | 1,216 | 25.1% |
| No Internet | 620 | 12.8% |
| Total | 4,836 | 100.0% |
Blanco County Summary
Blanco County is located in the Hill Country region of Central Texas, approximately 50 miles west of Austin. The county is bordered by Burnet, Llano, Hays, Comal, Kendall, and Gillespie counties. The county seat is Johnson City, and the largest city is Blanco. The county has a total area of 590 square miles, of which 589 square miles is land and 1 square mile is water.
History
Blanco County was established in 1858 from portions of Burnet, Comal, and Gillespie counties. It was named for the Blanco River, which runs through the county. The first settlers in the area were German immigrants who arrived in the 1840s. The county was primarily an agricultural area, with cotton, corn, and wheat being the main crops.
In the late 19th century, the county began to develop a tourism industry, with the establishment of resorts and dude ranches. The county also became known for its wineries, with the first winery being established in 1883.
Geography
Blanco County is located in the Hill Country region of Central Texas. The county is bordered by Burnet, Llano, Hays, Comal, Kendall, and Gillespie counties. The county has a total area of 590 square miles, of which 589 square miles is land and 1 square mile is water. The terrain is mostly rolling hills, with some flat areas in the western part of the county. The highest point in the county is the summit of Pedernales Peak, which is 1,822 feet above sea level.
The county is home to several rivers and creeks, including the Blanco River, Pedernales River, and Onion Creek. The county also contains several lakes, including Lake Buchanan, Lake Travis, and Lake LBJ.
Economy
The economy of Blanco County is largely based on agriculture and tourism. The county is home to several wineries, and the wine industry is a major contributor to the local economy. The county is also home to several dude ranches, which attract tourists from all over the world.
The county is also home to several manufacturing companies, including a furniture manufacturer, a metal fabrication company, and a plastics manufacturer. The county is also home to several technology companies, including a software development company and a computer hardware manufacturer.
Demographics
As of the 2010 census, the population of Blanco County was 10,497. The racial makeup of the county was 87.3% White, 0.7% African American, 0.7% Native American, 0.3% Asian, 0.1% Pacific Islander, 9.3% from other races, and 1.6% from two or more races. Hispanic or Latino of any race were 20.2% of the population.
The median income for a household in the county was $45,945, and the median income for a family was $51,945. The per capita income for the county was $22,945. About 11.3% of families and 14.2% of the population were below the poverty line, including 18.2% of those under age 18 and 8.2% of those age 65 or over.
Common Questions
What is Per Capita Income in Blanco County?
Per Capita income in Blanco County is $46,356.
What is the Median Family Income in Blanco County?
Median Family Income in Blanco County is $95,333.
What is the Median Household income in Blanco County?
Median Household Income in Blanco County is $79,717.
What is Income or Wage Gap in Blanco County?
Income or Wage Gap in Blanco County is 30.9%.
Women in Blanco County earn 69.1 cents for every dollar earned by a man.
What is Inequality or Gini Index in Blanco County?
Inequality or Gini Index in Blanco County is 0.46.
What is the Total Population of Blanco County?
Total Population of Blanco County is 11,608.
What is the Total Male Population of Blanco County?
Total Male Population of Blanco County is 5,853.
What is the Total Female Population of Blanco County?
Total Female Population of Blanco County is 5,755.
What is the Ratio of Males per 100 Females in Blanco County?
There are 101.70 Males per 100 Females in Blanco County.
What is the Ratio of Females per 100 Males in Blanco County?
There are 98.33 Females per 100 Males in Blanco County.
What is the Median Population Age in Blanco County?
Median Population Age in Blanco County is 49.5 Years.
What is the Average Family Size in Blanco County
Average Family Size in Blanco County is 2.9 People.
What is the Average Household Size in Blanco County
Average Household Size in Blanco County is 2.4 People.
How Large is the Labor Force in Blanco County?
There are 5,722 People in the Labor Forcein in Blanco County.
What is the Percentage of People in the Labor Force in Blanco County?
58.3% of People are in the Labor Force in Blanco County.
What is the Unemployment Rate in Blanco County?
Unemployment Rate in Blanco County is 3.9%.