Bee County, TX Map & Demographics
Bee County Map
Bee County Overview
$22,347
PER CAPITA INCOME
$66,602
AVG FAMILY INCOME
$50,283
AVG HOUSEHOLD INCOME
34.3%
WAGE / INCOME GAP [ % ]
65.7¢/ $1
WAGE / INCOME GAP [ $ ]
$13,264
FAMILY INCOME DEFICIT
0.49
INEQUALITY / GINI INDEX
30,977
TOTAL POPULATION
19,218
MALE POPULATION
11,759
FEMALE POPULATION
163.43
MALES / 100 FEMALES
61.19
FEMALES / 100 MALES
35.6
MEDIAN AGE
3.5
AVG FAMILY SIZE
2.8
AVG HOUSEHOLD SIZE
11,095
LABOR FORCE [ PEOPLE ]
43.5%
PERCENT IN LABOR FORCE
6.4%
UNEMPLOYMENT RATE
Bee County Area Codes
Income in Bee County
Income Overview in Bee County
Per Capita Income in Bee County is $22,347, while median incomes of families and households are $66,602 and $50,283 respectively.
| Characteristic | Number | Measure |
| Per Capita Income | 30,977 | $22,347 |
| Median Family Income | 5,667 | $66,602 |
| Mean Family Income | 5,667 | $88,882 |
| Median Household Income | 8,563 | $50,283 |
| Mean Household Income | 8,563 | $72,582 |
| Income Deficit | 5,667 | $13,264 |
| Wage / Income Gap (%) | 30,977 | 34.32% |
| Wage / Income Gap ($) | 30,977 | 65.68¢ per $1 |
| Gini / Inequality Index | 30,977 | 0.49 |
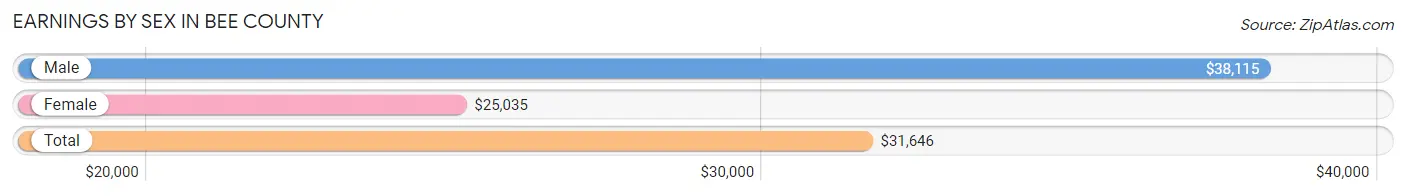
Earnings by Sex in Bee County
Average Earnings in Bee County are $31,646, $38,115 for men and $25,035 for women, a difference of 34.3%.
| Sex | Number | Average Earnings |
| Male | 6,981 (57.0%) | $38,115 |
| Female | 5,257 (43.0%) | $25,035 |
| Total | 12,238 (100.0%) | $31,646 |
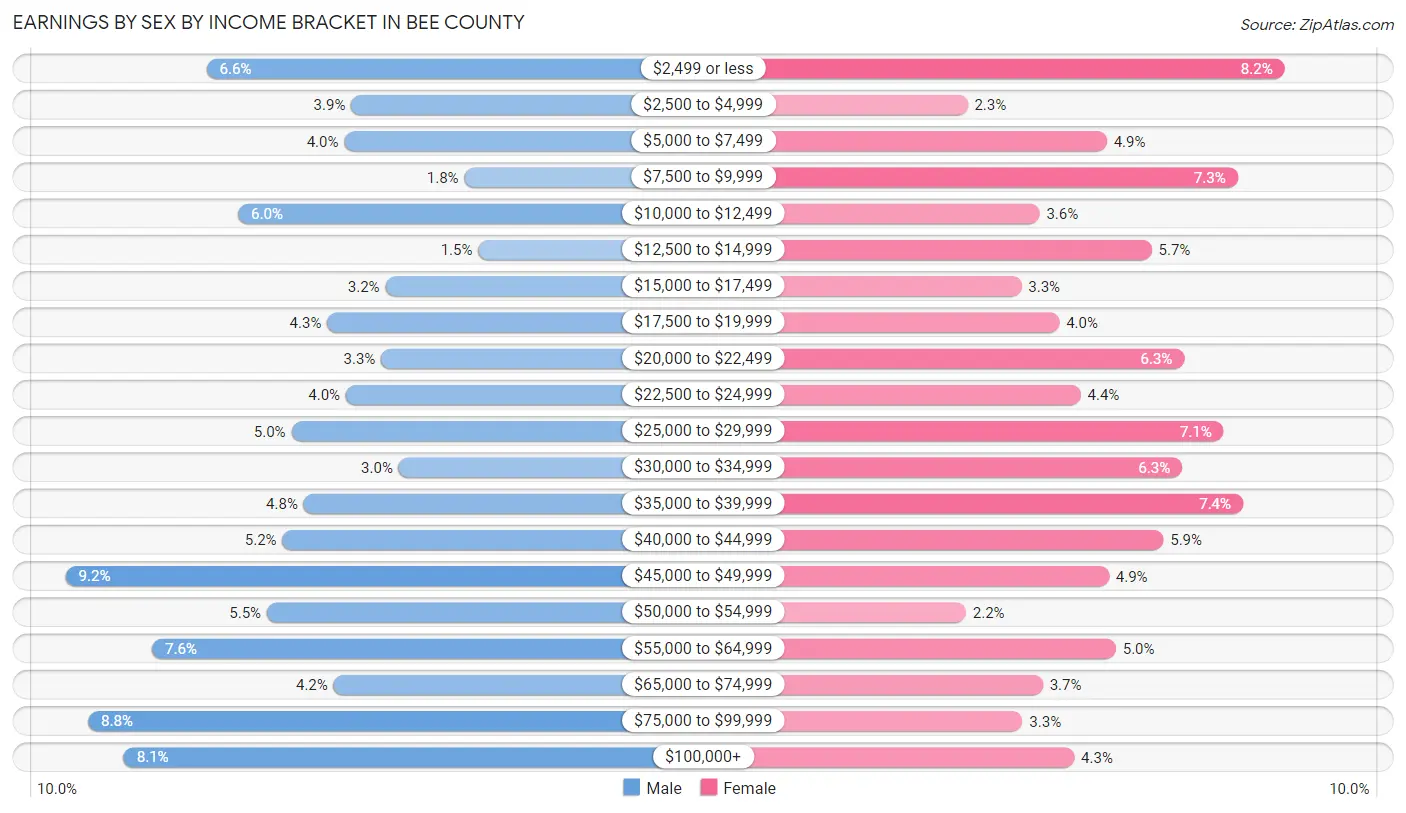
Earnings by Sex by Income Bracket in Bee County
The most common earnings brackets in Bee County are $45,000 to $49,999 for men (644 | 9.2%) and $2,499 or less for women (431 | 8.2%).
| Income | Male | Female |
| $2,499 or less | 460 (6.6%) | 431 (8.2%) |
| $2,500 to $4,999 | 271 (3.9%) | 119 (2.3%) |
| $5,000 to $7,499 | 280 (4.0%) | 256 (4.9%) |
| $7,500 to $9,999 | 123 (1.8%) | 385 (7.3%) |
| $10,000 to $12,499 | 419 (6.0%) | 190 (3.6%) |
| $12,500 to $14,999 | 105 (1.5%) | 300 (5.7%) |
| $15,000 to $17,499 | 226 (3.2%) | 172 (3.3%) |
| $17,500 to $19,999 | 302 (4.3%) | 209 (4.0%) |
| $20,000 to $22,499 | 232 (3.3%) | 332 (6.3%) |
| $22,500 to $24,999 | 278 (4.0%) | 230 (4.4%) |
| $25,000 to $29,999 | 349 (5.0%) | 371 (7.1%) |
| $30,000 to $34,999 | 209 (3.0%) | 330 (6.3%) |
| $35,000 to $39,999 | 333 (4.8%) | 390 (7.4%) |
| $40,000 to $44,999 | 361 (5.2%) | 312 (5.9%) |
| $45,000 to $49,999 | 644 (9.2%) | 258 (4.9%) |
| $50,000 to $54,999 | 381 (5.5%) | 117 (2.2%) |
| $55,000 to $64,999 | 531 (7.6%) | 265 (5.0%) |
| $65,000 to $74,999 | 294 (4.2%) | 193 (3.7%) |
| $75,000 to $99,999 | 615 (8.8%) | 173 (3.3%) |
| $100,000+ | 568 (8.1%) | 224 (4.3%) |
| Total | 6,981 (100.0%) | 5,257 (100.0%) |
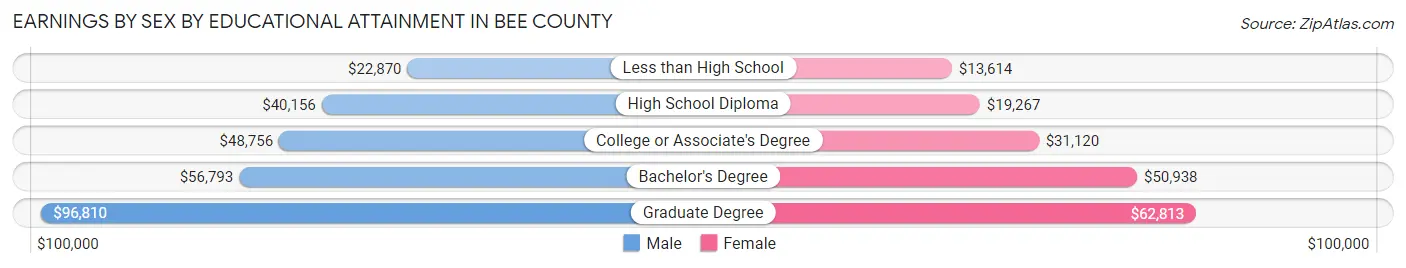
Earnings by Sex by Educational Attainment in Bee County
Average earnings in Bee County are $47,210 for men and $26,992 for women, a difference of 42.8%. Men with an educational attainment of graduate degree enjoy the highest average annual earnings of $96,810, while those with less than high school education earn the least with $22,870. Women with an educational attainment of graduate degree earn the most with the average annual earnings of $62,813, while those with less than high school education have the smallest earnings of $13,614.
| Educational Attainment | Male Income | Female Income |
| Less than High School | $22,870 | $13,614 |
| High School Diploma | $40,156 | $19,267 |
| College or Associate's Degree | $48,756 | $31,120 |
| Bachelor's Degree | $56,793 | $50,938 |
| Graduate Degree | $96,810 | $62,813 |
| Total | $47,210 | $26,992 |
Family Income in Bee County
Family Income Brackets in Bee County
According to the Bee County family income data, there are 935 families falling into the $50,000 to $74,999 income range, which is the most common income bracket and makes up 16.5% of all families. Conversely, the $10,000 to $14,999 income bracket is the least frequent group with only 119 families (2.1%) belonging to this category.
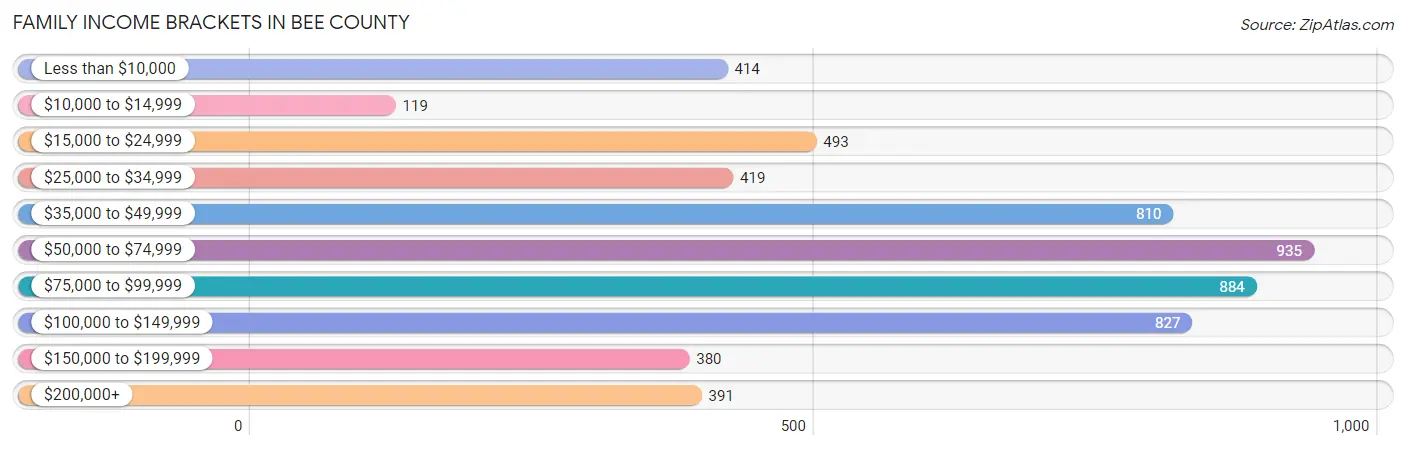
| Income Bracket | # Families | % Families |
| Less than $10,000 | 414 | 7.3% |
| $10,000 to $14,999 | 119 | 2.1% |
| $15,000 to $24,999 | 493 | 8.7% |
| $25,000 to $34,999 | 419 | 7.4% |
| $35,000 to $49,999 | 810 | 14.3% |
| $50,000 to $74,999 | 935 | 16.5% |
| $75,000 to $99,999 | 884 | 15.6% |
| $100,000 to $149,999 | 827 | 14.6% |
| $150,000 to $199,999 | 380 | 6.7% |
| $200,000+ | 391 | 6.9% |
Family Income by Famaliy Size in Bee County
7+ person families (150 | 2.6%) account for the highest median family income in Bee County with $97,250 per family, while 2-person families (2,274 | 40.1%) have the highest median income of $33,444 per family member.
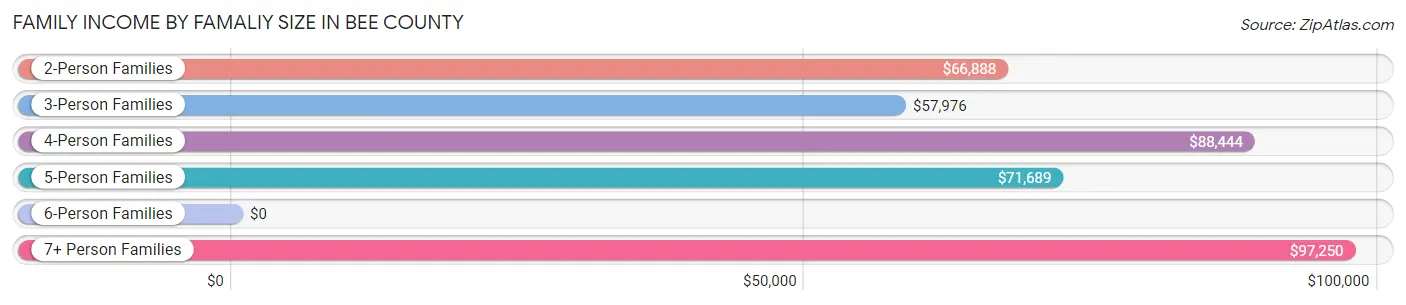
| Income Bracket | # Families | Median Income |
| 2-Person Families | 2,274 (40.1%) | $66,888 |
| 3-Person Families | 1,342 (23.7%) | $57,976 |
| 4-Person Families | 1,206 (21.3%) | $88,444 |
| 5-Person Families | 366 (6.5%) | $71,689 |
| 6-Person Families | 329 (5.8%) | $0 |
| 7+ Person Families | 150 (2.6%) | $97,250 |
| Total | 5,667 (100.0%) | $66,602 |
Family Income by Number of Earners in Bee County
The median family income in Bee County is $66,602, with families comprising 3+ earners (707) having the highest median family income of $110,781, while families with no earners (793) have the lowest median family income of $40,231, accounting for 12.5% and 14.0% of families, respectively.
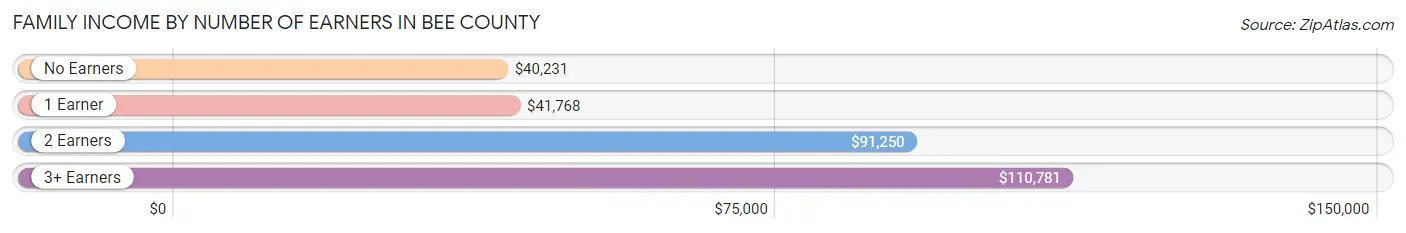
| Number of Earners | # Families | Median Income |
| No Earners | 793 (14.0%) | $40,231 |
| 1 Earner | 2,312 (40.8%) | $41,768 |
| 2 Earners | 1,855 (32.7%) | $91,250 |
| 3+ Earners | 707 (12.5%) | $110,781 |
| Total | 5,667 (100.0%) | $66,602 |
Household Income in Bee County
Household Income Brackets in Bee County
With 1,507 households falling in the category, the $50,000 to $74,999 income range is the most frequent in Bee County, accounting for 17.6% of all households. In contrast, only 325 households (3.8%) fall into the $150,000 to $199,999 income bracket, making it the least populous group.
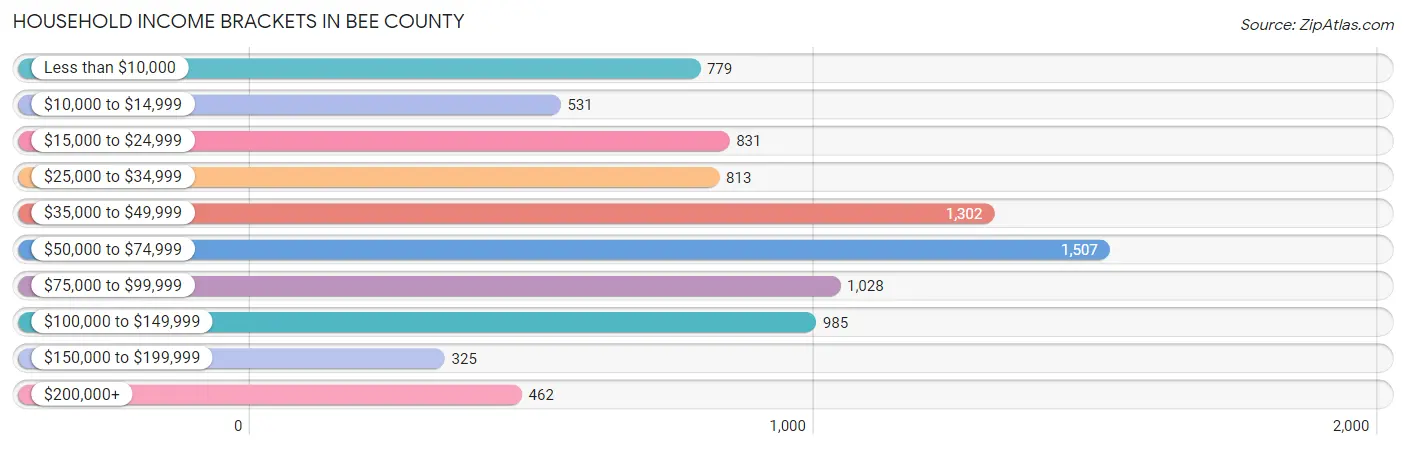
| Income Bracket | # Households | % Households |
| Less than $10,000 | 779 | 9.1% |
| $10,000 to $14,999 | 531 | 6.2% |
| $15,000 to $24,999 | 831 | 9.7% |
| $25,000 to $34,999 | 813 | 9.5% |
| $35,000 to $49,999 | 1,302 | 15.2% |
| $50,000 to $74,999 | 1,507 | 17.6% |
| $75,000 to $99,999 | 1,028 | 12.0% |
| $100,000 to $149,999 | 985 | 11.5% |
| $150,000 to $199,999 | 325 | 3.8% |
| $200,000+ | 462 | 5.4% |
Household Income by Householder Age in Bee County
The median household income in Bee County is $50,283, with the highest median household income of $66,645 found in the 45 to 64 years age bracket for the primary householder. A total of 2,771 households (32.4%) fall into this category. Meanwhile, the 15 to 24 years age bracket for the primary householder has the lowest median household income of $0, with 220 households (2.6%) in this group.
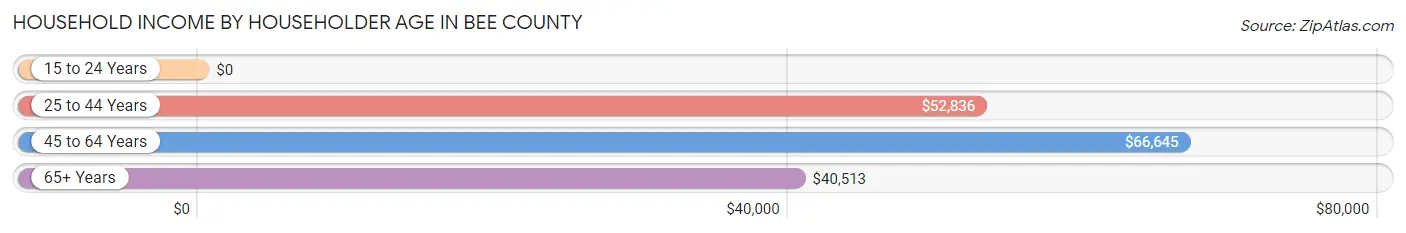
| Income Bracket | # Households | Median Income |
| 15 to 24 Years | 220 (2.6%) | $0 |
| 25 to 44 Years | 3,199 (37.4%) | $52,836 |
| 45 to 64 Years | 2,771 (32.4%) | $66,645 |
| 65+ Years | 2,373 (27.7%) | $40,513 |
| Total | 8,563 (100.0%) | $50,283 |
Poverty in Bee County
Income Below Poverty by Sex and Age in Bee County
With 16.4% poverty level for males and 23.7% for females among the residents of Bee County, 5 year old males and 5 year old females are the most vulnerable to poverty, with 102 males (41.1%) and 74 females (64.3%) in their respective age groups living below the poverty level.
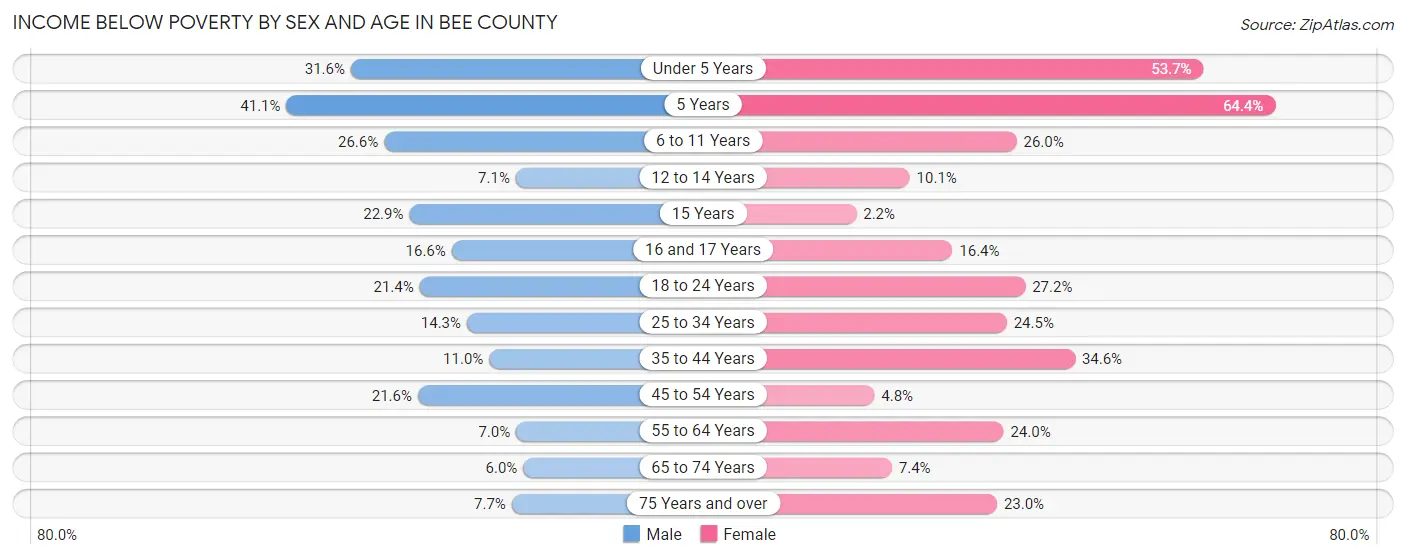
| Age Bracket | Male | Female |
| Under 5 Years | 255 (31.6%) | 393 (53.7%) |
| 5 Years | 102 (41.1%) | 74 (64.3%) |
| 6 to 11 Years | 279 (26.6%) | 314 (26.0%) |
| 12 to 14 Years | 34 (7.1%) | 40 (10.1%) |
| 15 Years | 27 (22.9%) | 4 (2.1%) |
| 16 and 17 Years | 71 (16.6%) | 56 (16.4%) |
| 18 to 24 Years | 317 (21.4%) | 268 (27.2%) |
| 25 to 34 Years | 293 (14.3%) | 373 (24.5%) |
| 35 to 44 Years | 168 (11.0%) | 539 (34.6%) |
| 45 to 54 Years | 255 (21.6%) | 54 (4.8%) |
| 55 to 64 Years | 72 (7.0%) | 323 (24.0%) |
| 65 to 74 Years | 62 (6.0%) | 84 (7.4%) |
| 75 Years and over | 49 (7.7%) | 197 (23.0%) |
| Total | 1,984 (16.4%) | 2,719 (23.7%) |
Income Above Poverty by Sex and Age in Bee County
According to the poverty statistics in Bee County, males aged 65 to 74 years and females aged 15 years are the age groups that are most secure financially, with 94.0% of males and 97.9% of females in these age groups living above the poverty line.
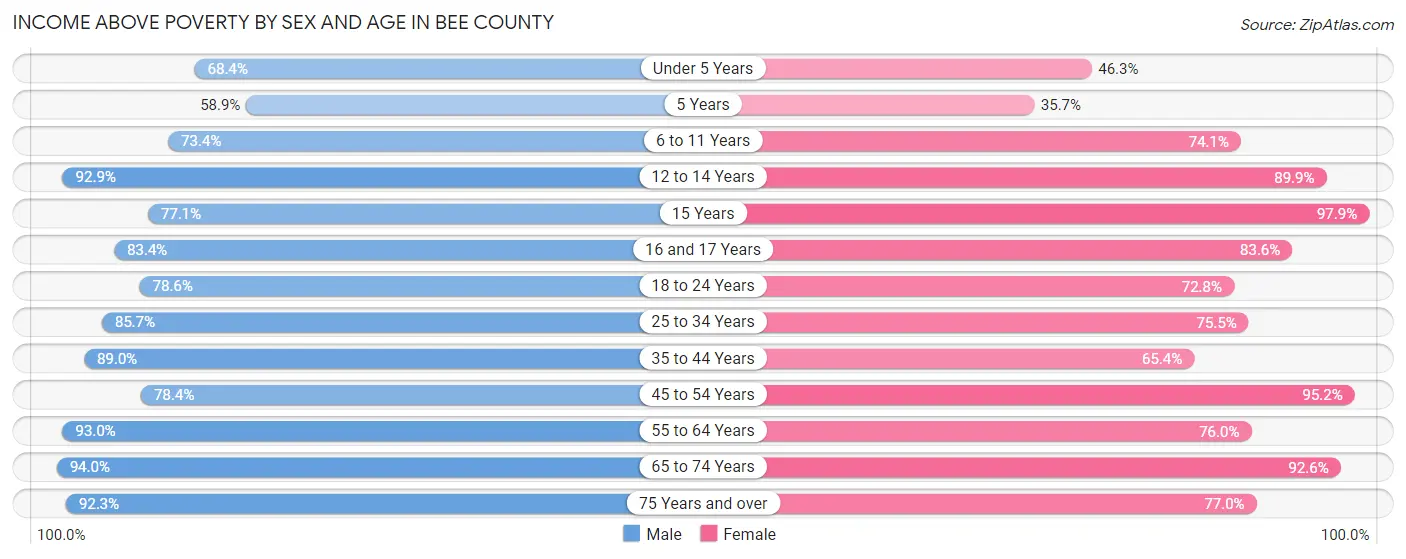
| Age Bracket | Male | Female |
| Under 5 Years | 553 (68.4%) | 339 (46.3%) |
| 5 Years | 146 (58.9%) | 41 (35.6%) |
| 6 to 11 Years | 769 (73.4%) | 896 (74.1%) |
| 12 to 14 Years | 447 (92.9%) | 357 (89.9%) |
| 15 Years | 91 (77.1%) | 182 (97.9%) |
| 16 and 17 Years | 357 (83.4%) | 285 (83.6%) |
| 18 to 24 Years | 1,167 (78.6%) | 716 (72.8%) |
| 25 to 34 Years | 1,751 (85.7%) | 1,150 (75.5%) |
| 35 to 44 Years | 1,356 (89.0%) | 1,018 (65.4%) |
| 45 to 54 Years | 925 (78.4%) | 1,064 (95.2%) |
| 55 to 64 Years | 953 (93.0%) | 1,022 (76.0%) |
| 65 to 74 Years | 978 (94.0%) | 1,046 (92.6%) |
| 75 Years and over | 590 (92.3%) | 658 (77.0%) |
| Total | 10,083 (83.6%) | 8,774 (76.3%) |
Income Below Poverty Among Married-Couple Families in Bee County
The poverty statistics for married-couple families in Bee County show that 11.3% or 448 of the total 3,962 families live below the poverty line. Families with 3 or 4 children have the highest poverty rate of 28.3%, comprising of 124 families. On the other hand, families with no children have the lowest poverty rate of 3.5%, which includes 70 families.
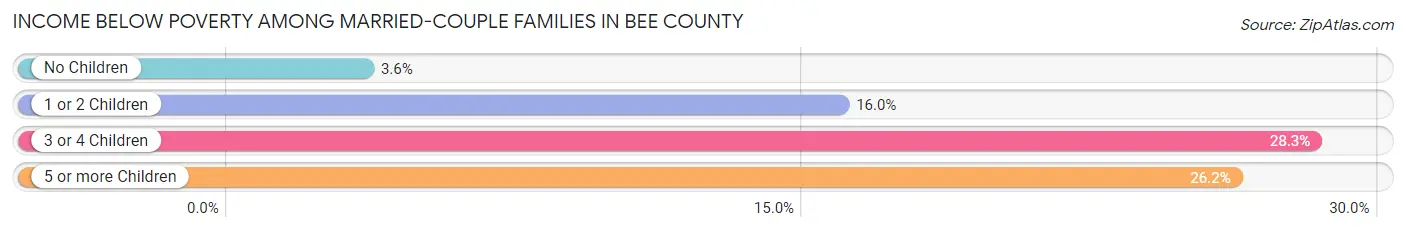
| Children | Above Poverty | Below Poverty |
| No Children | 1,902 (96.5%) | 70 (3.5%) |
| 1 or 2 Children | 1,253 (84.0%) | 238 (16.0%) |
| 3 or 4 Children | 314 (71.7%) | 124 (28.3%) |
| 5 or more Children | 45 (73.8%) | 16 (26.2%) |
| Total | 3,514 (88.7%) | 448 (11.3%) |
Income Below Poverty Among Single-Parent Households in Bee County
According to the poverty data in Bee County, 8.5% or 44 single-father households and 40.9% or 486 single-mother households are living below the poverty line. Among single-father households, those with 1 or 2 children have the highest poverty rate, with 37 households (21.8%) experiencing poverty. Likewise, among single-mother households, those with 3 or 4 children have the highest poverty rate, with 47 households (49.5%) falling below the poverty line.
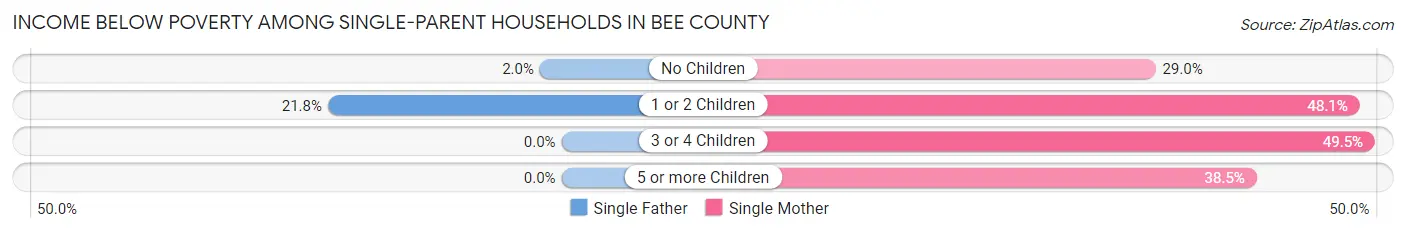
| Children | Single Father | Single Mother |
| No Children | 7 (2.0%) | 124 (29.0%) |
| 1 or 2 Children | 37 (21.8%) | 295 (48.0%) |
| 3 or 4 Children | 0 (0.0%) | 47 (49.5%) |
| 5 or more Children | 0 (0.0%) | 20 (38.5%) |
| Total | 44 (8.5%) | 486 (40.9%) |
Income Below Poverty Among Married-Couple vs Single-Parent Households in Bee County
The poverty data for Bee County shows that 448 of the married-couple family households (11.3%) and 530 of the single-parent households (31.1%) are living below the poverty level. Within the married-couple family households, those with 3 or 4 children have the highest poverty rate, with 124 households (28.3%) falling below the poverty line. Among the single-parent households, those with 3 or 4 children have the highest poverty rate, with 47 household (49.5%) living below poverty.
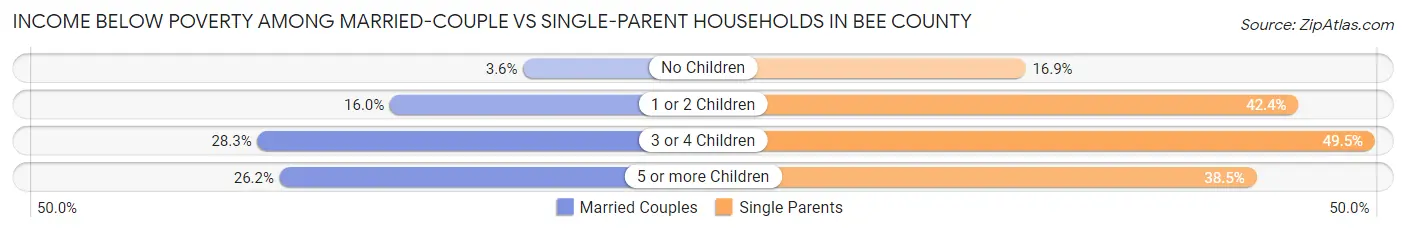
| Children | Married-Couple Families | Single-Parent Households |
| No Children | 70 (3.5%) | 131 (16.9%) |
| 1 or 2 Children | 238 (16.0%) | 332 (42.3%) |
| 3 or 4 Children | 124 (28.3%) | 47 (49.5%) |
| 5 or more Children | 16 (26.2%) | 20 (38.5%) |
| Total | 448 (11.3%) | 530 (31.1%) |
Race in Bee County
The most populous races in Bee County are White / Caucasian (20,148 | 65.0%), Hispanic or Latino (18,526 | 59.8%), and Two or more Races (6,616 | 21.4%).
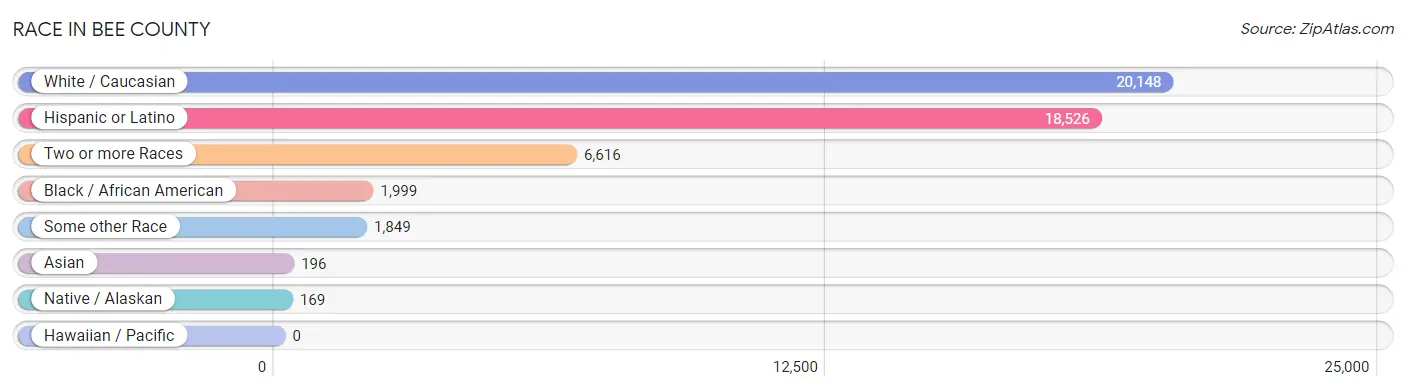
| Race | # Population | % Population |
| Asian | 196 | 0.6% |
| Black / African American | 1,999 | 6.5% |
| Hawaiian / Pacific | 0 | 0.0% |
| Hispanic or Latino | 18,526 | 59.8% |
| Native / Alaskan | 169 | 0.5% |
| White / Caucasian | 20,148 | 65.0% |
| Two or more Races | 6,616 | 21.4% |
| Some other Race | 1,849 | 6.0% |
| Total | 30,977 | 100.0% |
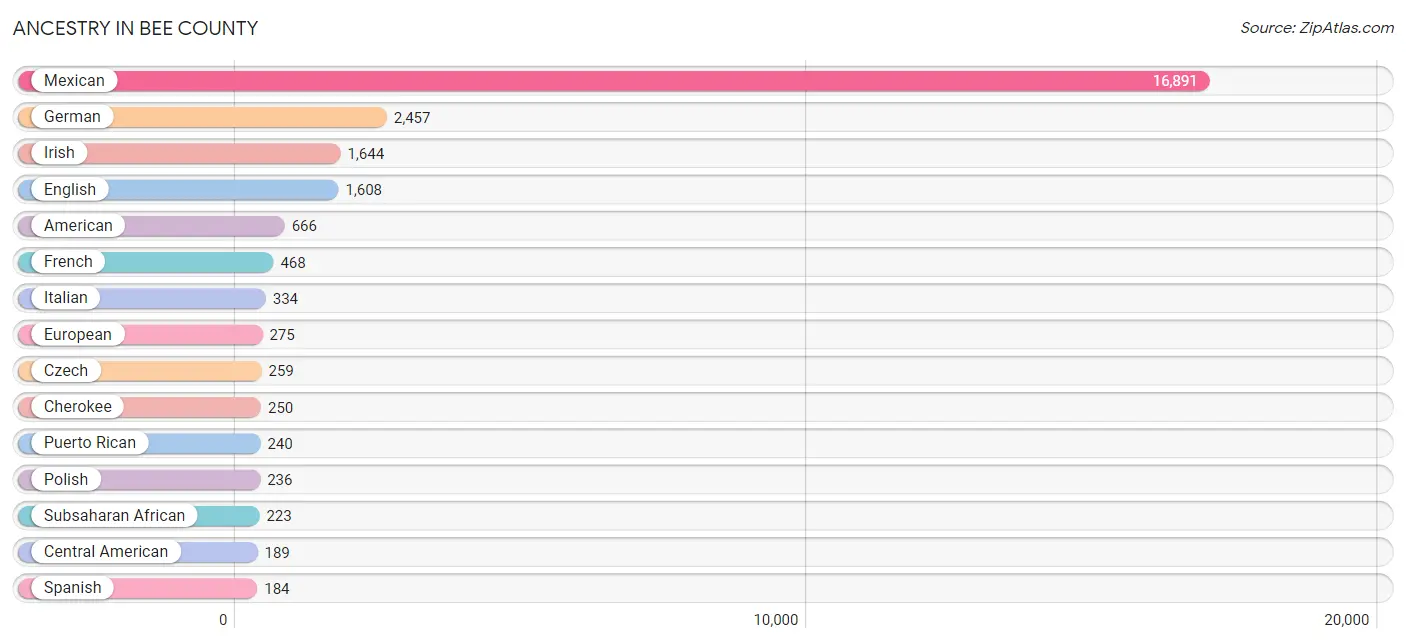
Ancestry in Bee County
The most populous ancestries reported in Bee County are Mexican (16,891 | 54.5%), German (2,457 | 7.9%), Irish (1,644 | 5.3%), English (1,608 | 5.2%), and American (666 | 2.1%), together accounting for 75.1% of all Bee County residents.
| Ancestry | # Population | % Population |
| African | 161 | 0.5% |
| Albanian | 16 | 0.1% |
| American | 666 | 2.1% |
| Apache | 151 | 0.5% |
| Arab | 58 | 0.2% |
| Bahamian | 13 | 0.0% |
| Bhutanese | 9 | 0.0% |
| Blackfeet | 58 | 0.2% |
| British | 68 | 0.2% |
| Burmese | 9 | 0.0% |
| Cajun | 69 | 0.2% |
| Canadian | 13 | 0.0% |
| Celtic | 2 | 0.0% |
| Central American | 189 | 0.6% |
| Central American Indian | 13 | 0.0% |
| Cherokee | 250 | 0.8% |
| Choctaw | 78 | 0.3% |
| Colombian | 18 | 0.1% |
| Comanche | 6 | 0.0% |
| Costa Rican | 10 | 0.0% |
| Creek | 16 | 0.1% |
| Crow | 19 | 0.1% |
| Cuban | 25 | 0.1% |
| Czech | 259 | 0.8% |
| Czechoslovakian | 57 | 0.2% |
| Danish | 9 | 0.0% |
| Dutch | 74 | 0.2% |
| Eastern European | 23 | 0.1% |
| Egyptian | 9 | 0.0% |
| English | 1,608 | 5.2% |
| European | 275 | 0.9% |
| Finnish | 30 | 0.1% |
| French | 468 | 1.5% |
| French Canadian | 48 | 0.2% |
| German | 2,457 | 7.9% |
| Greek | 32 | 0.1% |
| Guatemalan | 9 | 0.0% |
| Honduran | 49 | 0.2% |
| Indian (Asian) | 18 | 0.1% |
| Iranian | 13 | 0.0% |
| Irish | 1,644 | 5.3% |
| Italian | 334 | 1.1% |
| Jamaican | 8 | 0.0% |
| Kiowa | 7 | 0.0% |
| Korean | 80 | 0.3% |
| Laotian | 11 | 0.0% |
| Lebanese | 49 | 0.2% |
| Lithuanian | 22 | 0.1% |
| Macedonian | 20 | 0.1% |
| Malaysian | 8 | 0.0% |
| Mexican | 16,891 | 54.5% |
| Mexican American Indian | 83 | 0.3% |
| Navajo | 55 | 0.2% |
| Nigerian | 32 | 0.1% |
| Northern European | 114 | 0.4% |
| Norwegian | 67 | 0.2% |
| Panamanian | 18 | 0.1% |
| Peruvian | 6 | 0.0% |
| Polish | 236 | 0.8% |
| Portuguese | 6 | 0.0% |
| Puerto Rican | 240 | 0.8% |
| Russian | 69 | 0.2% |
| Salvadoran | 103 | 0.3% |
| Scandinavian | 65 | 0.2% |
| Scotch-Irish | 56 | 0.2% |
| Scottish | 149 | 0.5% |
| Sioux | 45 | 0.2% |
| Somali | 7 | 0.0% |
| South African | 17 | 0.1% |
| South American | 24 | 0.1% |
| Spaniard | 148 | 0.5% |
| Spanish | 184 | 0.6% |
| Subsaharan African | 223 | 0.7% |
| Swedish | 56 | 0.2% |
| Swiss | 21 | 0.1% |
| Thai | 112 | 0.4% |
| Trinidadian and Tobagonian | 7 | 0.0% |
| Ukrainian | 12 | 0.0% |
| Welsh | 50 | 0.2% | View All 79 Rows |
Immigrants in Bee County
The most numerous immigrant groups reported in Bee County came from Latin America (958 | 3.1%), Central America (897 | 2.9%), Mexico (717 | 2.3%), Asia (183 | 0.6%), and South Central Asia (102 | 0.3%), together accounting for 9.2% of all Bee County residents.
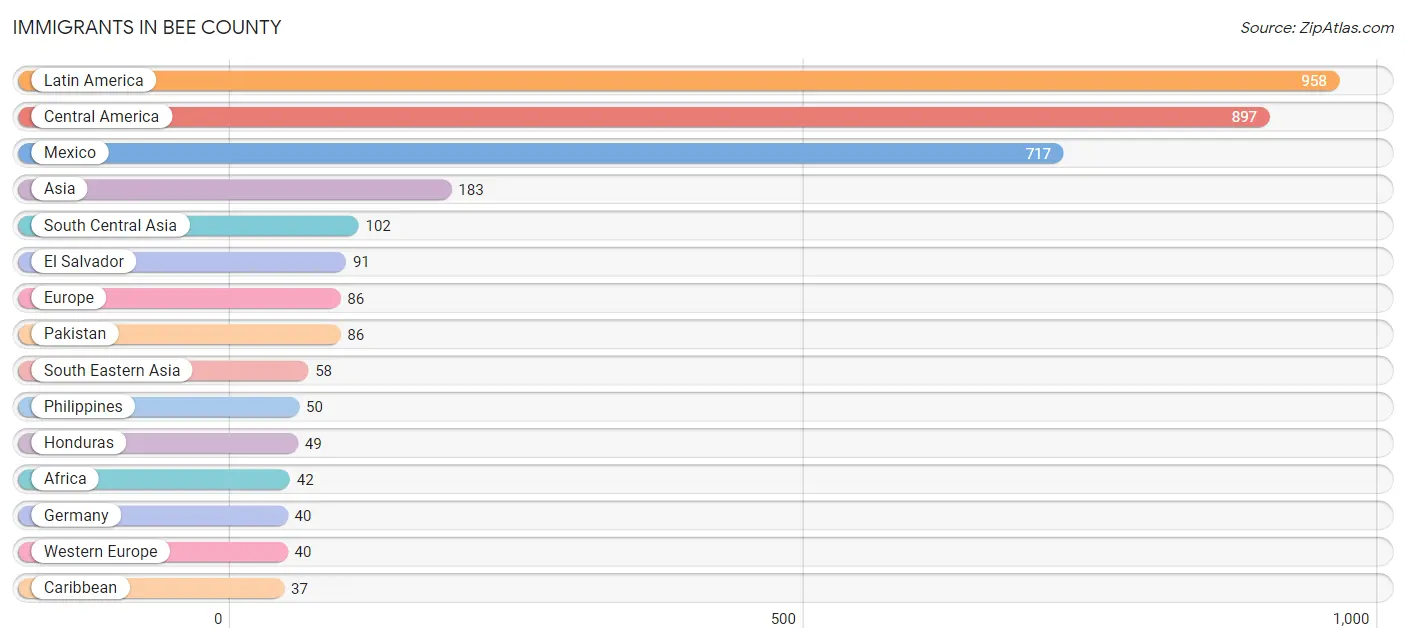
| Immigration Origin | # Population | % Population |
| Africa | 42 | 0.1% |
| Asia | 183 | 0.6% |
| Bahamas | 13 | 0.0% |
| Canada | 19 | 0.1% |
| Caribbean | 37 | 0.1% |
| Central America | 897 | 2.9% |
| China | 12 | 0.0% |
| Colombia | 18 | 0.1% |
| Cuba | 17 | 0.1% |
| Eastern Africa | 17 | 0.1% |
| Eastern Asia | 15 | 0.1% |
| Eastern Europe | 20 | 0.1% |
| Egypt | 1 | 0.0% |
| El Salvador | 91 | 0.3% |
| England | 26 | 0.1% |
| Europe | 86 | 0.3% |
| Germany | 40 | 0.1% |
| Guatemala | 9 | 0.0% |
| Honduras | 49 | 0.2% |
| India | 16 | 0.1% |
| Iraq | 8 | 0.0% |
| Kenya | 10 | 0.0% |
| Korea | 3 | 0.0% |
| Laos | 8 | 0.0% |
| Latin America | 958 | 3.1% |
| Mexico | 717 | 2.3% |
| Nicaragua | 31 | 0.1% |
| Nigeria | 7 | 0.0% |
| Northern Africa | 1 | 0.0% |
| Northern Europe | 26 | 0.1% |
| Pakistan | 86 | 0.3% |
| Peru | 6 | 0.0% |
| Philippines | 50 | 0.2% |
| Somalia | 7 | 0.0% |
| South Africa | 17 | 0.1% |
| South America | 24 | 0.1% |
| South Central Asia | 102 | 0.3% |
| South Eastern Asia | 58 | 0.2% |
| Trinidad and Tobago | 7 | 0.0% |
| Western Africa | 7 | 0.0% |
| Western Asia | 8 | 0.0% |
| Western Europe | 40 | 0.1% | View All 42 Rows |
Sex and Age in Bee County
Sex and Age in Bee County
The most populous age groups in Bee County are 25 to 29 Years (2,292 | 11.9%) for men and 35 to 39 Years (965 | 8.2%) for women.
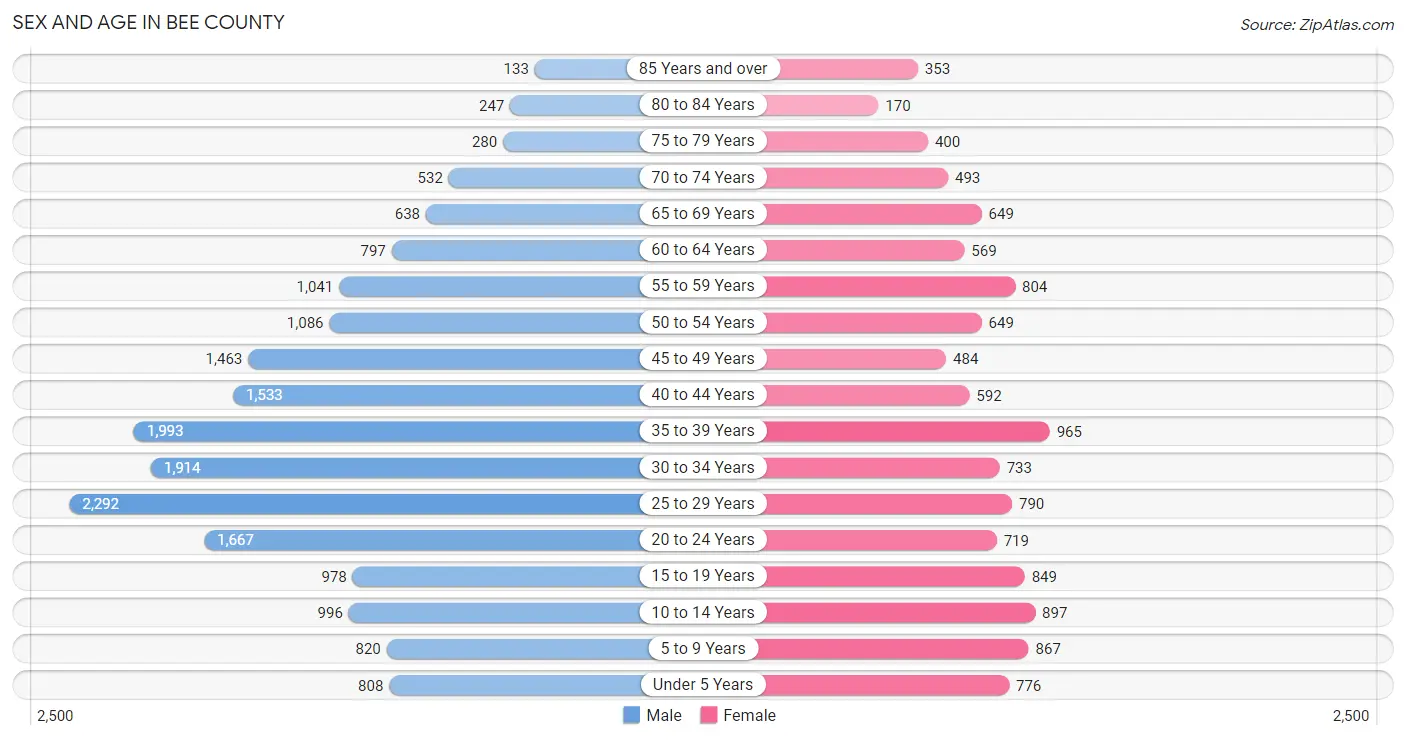
| Age Bracket | Male | Female |
| Under 5 Years | 808 (4.2%) | 776 (6.6%) |
| 5 to 9 Years | 820 (4.3%) | 867 (7.4%) |
| 10 to 14 Years | 996 (5.2%) | 897 (7.6%) |
| 15 to 19 Years | 978 (5.1%) | 849 (7.2%) |
| 20 to 24 Years | 1,667 (8.7%) | 719 (6.1%) |
| 25 to 29 Years | 2,292 (11.9%) | 790 (6.7%) |
| 30 to 34 Years | 1,914 (10.0%) | 733 (6.2%) |
| 35 to 39 Years | 1,993 (10.4%) | 965 (8.2%) |
| 40 to 44 Years | 1,533 (8.0%) | 592 (5.0%) |
| 45 to 49 Years | 1,463 (7.6%) | 484 (4.1%) |
| 50 to 54 Years | 1,086 (5.7%) | 649 (5.5%) |
| 55 to 59 Years | 1,041 (5.4%) | 804 (6.8%) |
| 60 to 64 Years | 797 (4.2%) | 569 (4.8%) |
| 65 to 69 Years | 638 (3.3%) | 649 (5.5%) |
| 70 to 74 Years | 532 (2.8%) | 493 (4.2%) |
| 75 to 79 Years | 280 (1.5%) | 400 (3.4%) |
| 80 to 84 Years | 247 (1.3%) | 170 (1.5%) |
| 85 Years and over | 133 (0.7%) | 353 (3.0%) |
| Total | 19,218 (100.0%) | 11,759 (100.0%) |
Families and Households in Bee County
Median Family Size in Bee County
The median family size in Bee County is 3.47 persons per family, with married-couple families (3,962 | 69.9%) accounting for the largest median family size of 3.61 persons per family. On the other hand, single male/father families (517 | 9.1%) represent the smallest median family size with 2.86 persons per family.
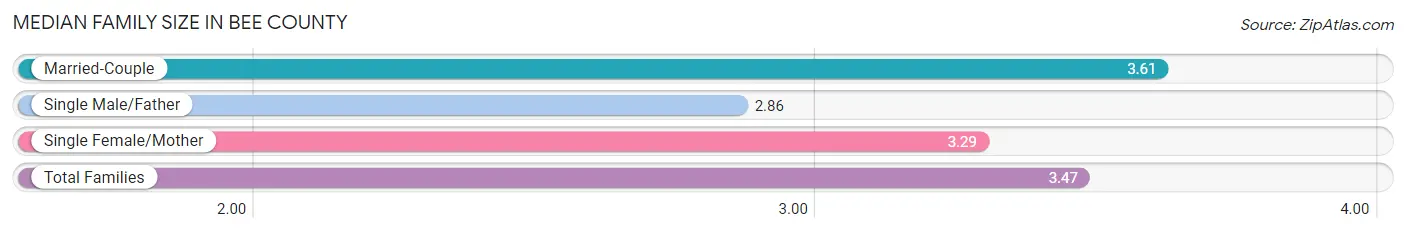
| Family Type | # Families | Family Size |
| Married-Couple | 3,962 (69.9%) | 3.61 |
| Single Male/Father | 517 (9.1%) | 2.86 |
| Single Female/Mother | 1,188 (21.0%) | 3.29 |
| Total Families | 5,667 (100.0%) | 3.47 |
Median Household Size in Bee County
The median household size in Bee County is 2.76 persons per household, with married-couple households (3,962 | 46.3%) accounting for the largest median household size of 3.67 persons per household. non-family households (2,896 | 33.8%) represent the smallest median household size with 1.23 persons per household.
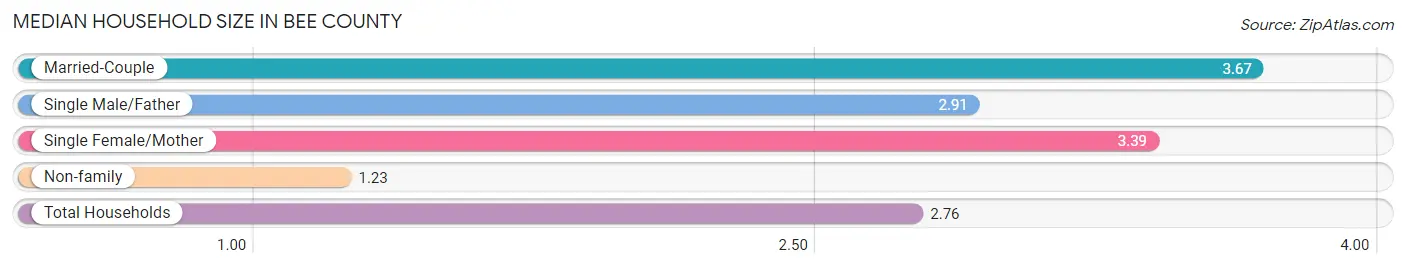
| Household Type | # Households | Household Size |
| Married-Couple | 3,962 (46.3%) | 3.67 |
| Single Male/Father | 517 (6.0%) | 2.91 |
| Single Female/Mother | 1,188 (13.9%) | 3.39 |
| Non-family | 2,896 (33.8%) | 1.23 |
| Total Households | 8,563 (100.0%) | 2.76 |
Household Size by Marriage Status in Bee County
Out of a total of 8,563 households in Bee County, 5,667 (66.2%) are family households, while 2,896 (33.8%) are nonfamily households. The most numerous type of family households are 2-person households, comprising 2,246, and the most common type of nonfamily households are 1-person households, comprising 2,431.
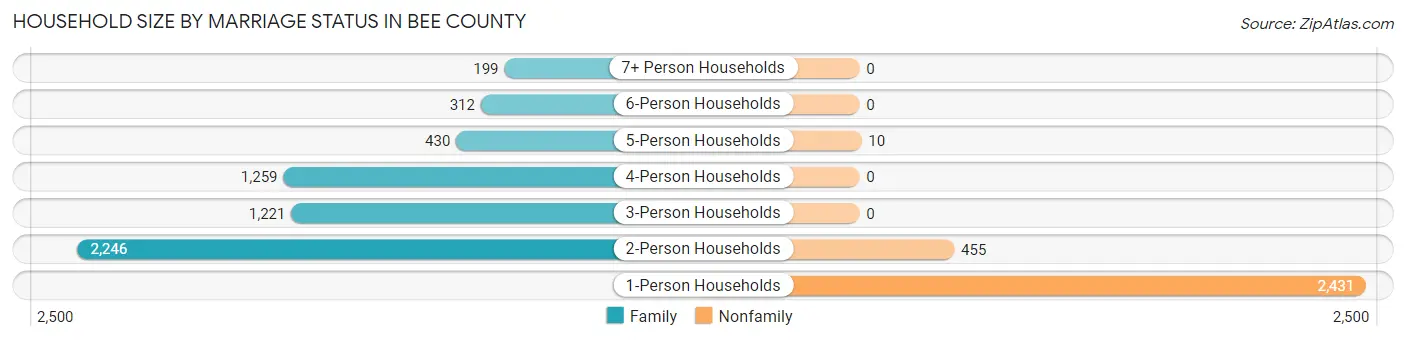
| Household Size | Family Households | Nonfamily Households |
| 1-Person Households | - | 2,431 (28.4%) |
| 2-Person Households | 2,246 (26.2%) | 455 (5.3%) |
| 3-Person Households | 1,221 (14.3%) | 0 (0.0%) |
| 4-Person Households | 1,259 (14.7%) | 0 (0.0%) |
| 5-Person Households | 430 (5.0%) | 10 (0.1%) |
| 6-Person Households | 312 (3.6%) | 0 (0.0%) |
| 7+ Person Households | 199 (2.3%) | 0 (0.0%) |
| Total | 5,667 (66.2%) | 2,896 (33.8%) |
Female Fertility in Bee County
Fertility by Age in Bee County
Average fertility rate in Bee County is 59.0 births per 1,000 women. Women in the age bracket of 20 to 34 years have the highest fertility rate with 83.0 births per 1,000 women. Women in the age bracket of 20 to 34 years acount for 61.2% of all women with births.
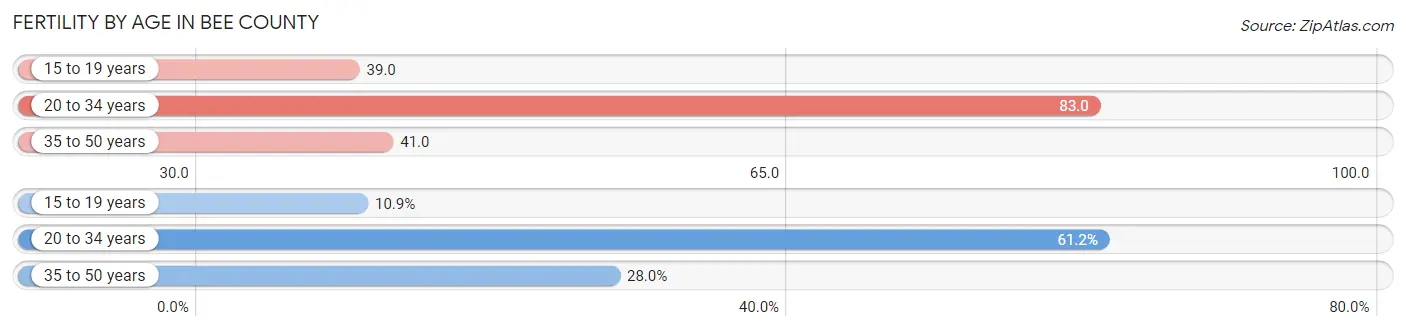
| Age Bracket | Women with Births | Births / 1,000 Women |
| 15 to 19 years | 33 (10.9%) | 39.0 |
| 20 to 34 years | 186 (61.2%) | 83.0 |
| 35 to 50 years | 85 (28.0%) | 41.0 |
| Total | 304 (100.0%) | 59.0 |
Fertility by Age by Marriage Status in Bee County
66.1% of women with births (304) in Bee County are married. The highest percentage of unmarried women with births falls into 35 to 50 years age bracket with 72.9% of them unmarried at the time of birth, while the lowest percentage of unmarried women with births belong to 20 to 34 years age bracket with 11.3% of them unmarried.
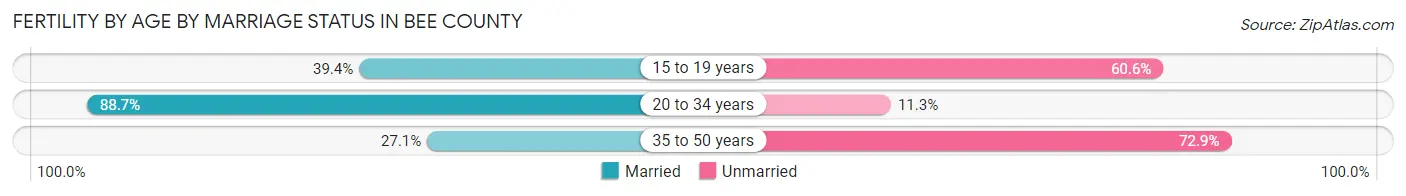
| Age Bracket | Married | Unmarried |
| 15 to 19 years | 13 (39.4%) | 20 (60.6%) |
| 20 to 34 years | 165 (88.7%) | 21 (11.3%) |
| 35 to 50 years | 23 (27.1%) | 62 (72.9%) |
| Total | 201 (66.1%) | 103 (33.9%) |
Fertility by Education in Bee County
Average fertility rate in Bee County is 59.0 births per 1,000 women. Women with the education attainment of graduate degree have the highest fertility rate of 226.0 births per 1,000 women, while women with the education attainment of less than high school have the lowest fertility at 23.0 births per 1,000 women. Women with the education attainment of high school diploma represent 41.1% of all women with births.
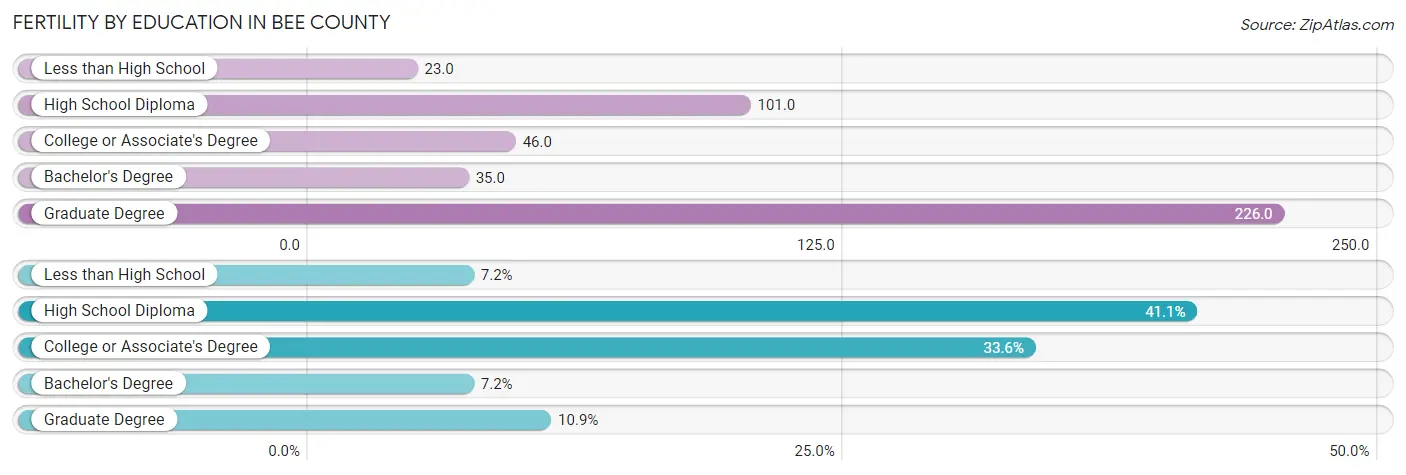
| Educational Attainment | Women with Births | Births / 1,000 Women |
| Less than High School | 22 (7.2%) | 23.0 |
| High School Diploma | 125 (41.1%) | 101.0 |
| College or Associate's Degree | 102 (33.6%) | 46.0 |
| Bachelor's Degree | 22 (7.2%) | 35.0 |
| Graduate Degree | 33 (10.9%) | 226.0 |
| Total | 304 (100.0%) | 59.0 |
Fertility by Education by Marriage Status in Bee County
33.9% of women with births in Bee County are unmarried. Women with the educational attainment of less than high school are most likely to be married with 100.0% of them married at childbirth, while women with the educational attainment of college or associate's degree are least likely to be married with 60.8% of them unmarried at childbirth.
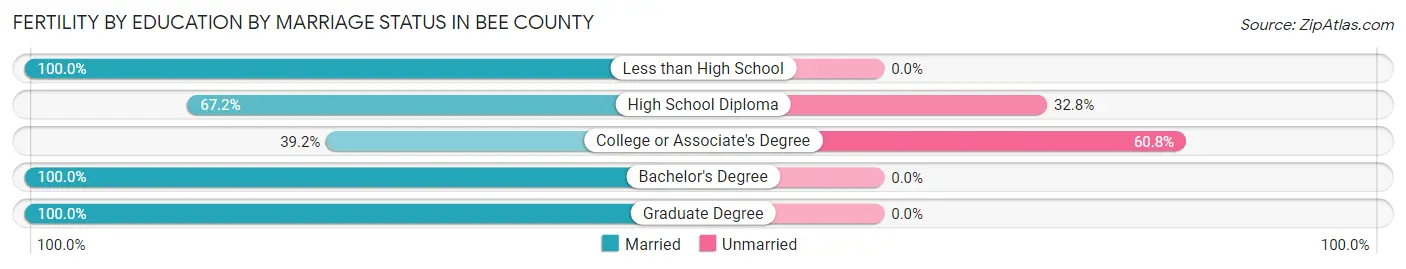
| Educational Attainment | Married | Unmarried |
| Less than High School | 22 (100.0%) | 0 (0.0%) |
| High School Diploma | 84 (67.2%) | 41 (32.8%) |
| College or Associate's Degree | 40 (39.2%) | 62 (60.8%) |
| Bachelor's Degree | 22 (100.0%) | 0 (0.0%) |
| Graduate Degree | 33 (100.0%) | 0 (0.0%) |
| Total | 201 (66.1%) | 103 (33.9%) |
Employment Characteristics in Bee County
Employment by Class of Employer in Bee County
Among the 9,981 employed individuals in Bee County, private company employees (6,351 | 63.6%), state government employees (1,265 | 12.7%), and self-employed (not incorporated) (813 | 8.2%) make up the most common classes of employment.
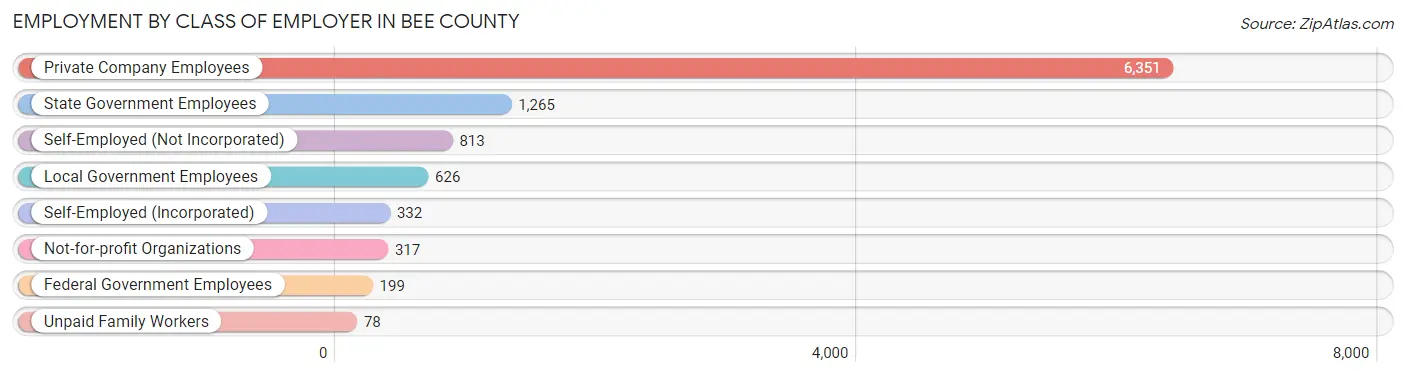
| Employer Class | # Employees | % Employees |
| Private Company Employees | 6,351 | 63.6% |
| Self-Employed (Incorporated) | 332 | 3.3% |
| Self-Employed (Not Incorporated) | 813 | 8.2% |
| Not-for-profit Organizations | 317 | 3.2% |
| Local Government Employees | 626 | 6.3% |
| State Government Employees | 1,265 | 12.7% |
| Federal Government Employees | 199 | 2.0% |
| Unpaid Family Workers | 78 | 0.8% |
| Total | 9,981 | 100.0% |
Employment Status by Age in Bee County
According to the labor force statistics for Bee County, out of the total population over 16 years of age (25,506), 43.5% or 11,095 individuals are in the labor force, with 6.4% or 710 of them unemployed. The age group with the highest labor force participation rate is 20 to 24 years, with 61.5% or 1,467 individuals in the labor force. Within the labor force, the 20 to 24 years age range has the highest percentage of unemployed individuals, with 22.8% or 334 of them being unemployed.
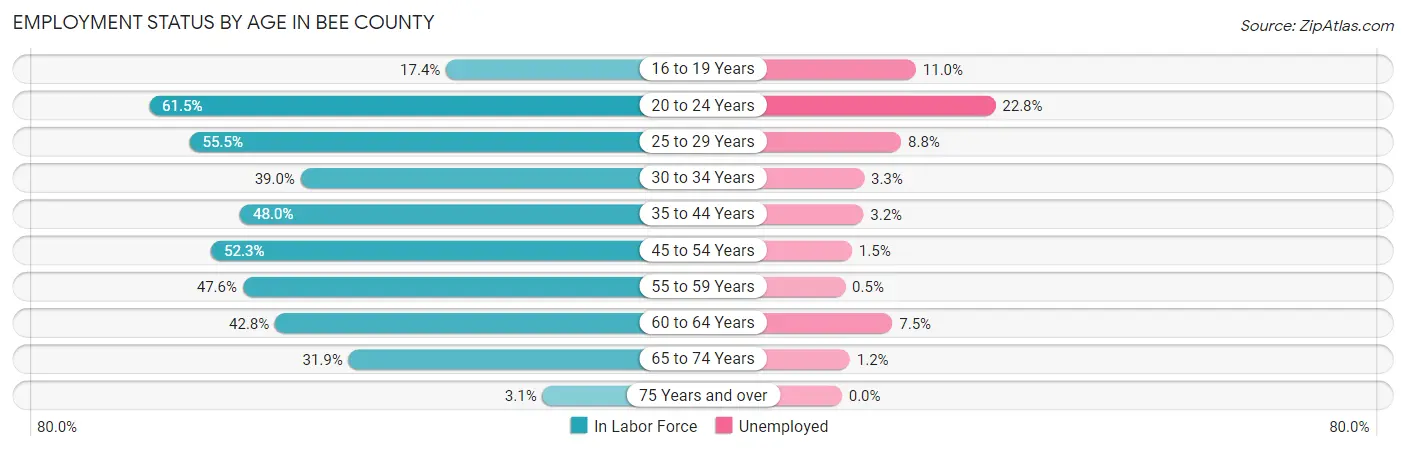
| Age Bracket | In Labor Force | Unemployed |
| 16 to 19 Years | 264 (17.4%) | 29 (11.0%) |
| 20 to 24 Years | 1,467 (61.5%) | 334 (22.8%) |
| 25 to 29 Years | 1,711 (55.5%) | 151 (8.8%) |
| 30 to 34 Years | 1,032 (39.0%) | 34 (3.3%) |
| 35 to 44 Years | 2,440 (48.0%) | 78 (3.2%) |
| 45 to 54 Years | 1,926 (52.3%) | 29 (1.5%) |
| 55 to 59 Years | 878 (47.6%) | 4 (0.5%) |
| 60 to 64 Years | 585 (42.8%) | 44 (7.5%) |
| 65 to 74 Years | 738 (31.9%) | 9 (1.2%) |
| 75 Years and over | 49 (3.1%) | 0 (0.0%) |
| Total | 11,095 (43.5%) | 710 (6.4%) |
Employment Status by Educational Attainment in Bee County
According to labor force statistics for Bee County, 48.4% of individuals (8,569) out of the total population between 25 and 64 years of age (17,705) are in the labor force, with 3.9% or 334 of them being unemployed. The group with the highest labor force participation rate are those with the educational attainment of bachelor's degree or higher, with 68.0% or 1,210 individuals in the labor force. Within the labor force, individuals with less than high school education have the highest percentage of unemployment, with 8.0% or 52 of them being unemployed.
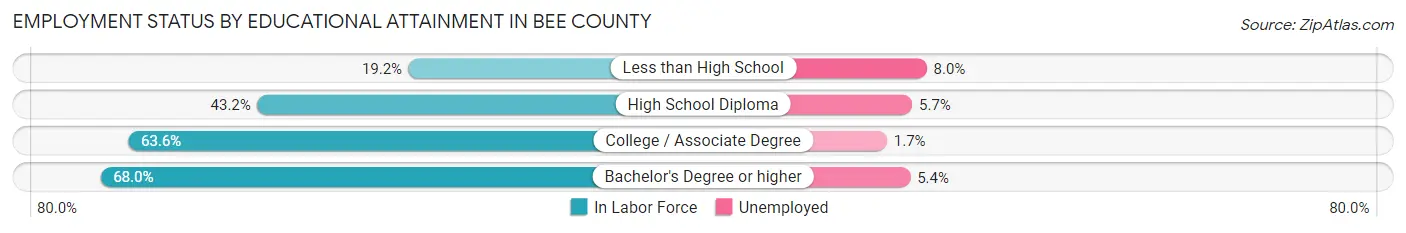
| Educational Attainment | In Labor Force | Unemployed |
| Less than High School | 648 (19.2%) | 270 (8.0%) |
| High School Diploma | 2,695 (43.2%) | 356 (5.7%) |
| College / Associate Degree | 4,015 (63.6%) | 107 (1.7%) |
| Bachelor's Degree or higher | 1,210 (68.0%) | 96 (5.4%) |
| Total | 8,569 (48.4%) | 690 (3.9%) |
Employment Occupations by Sex in Bee County
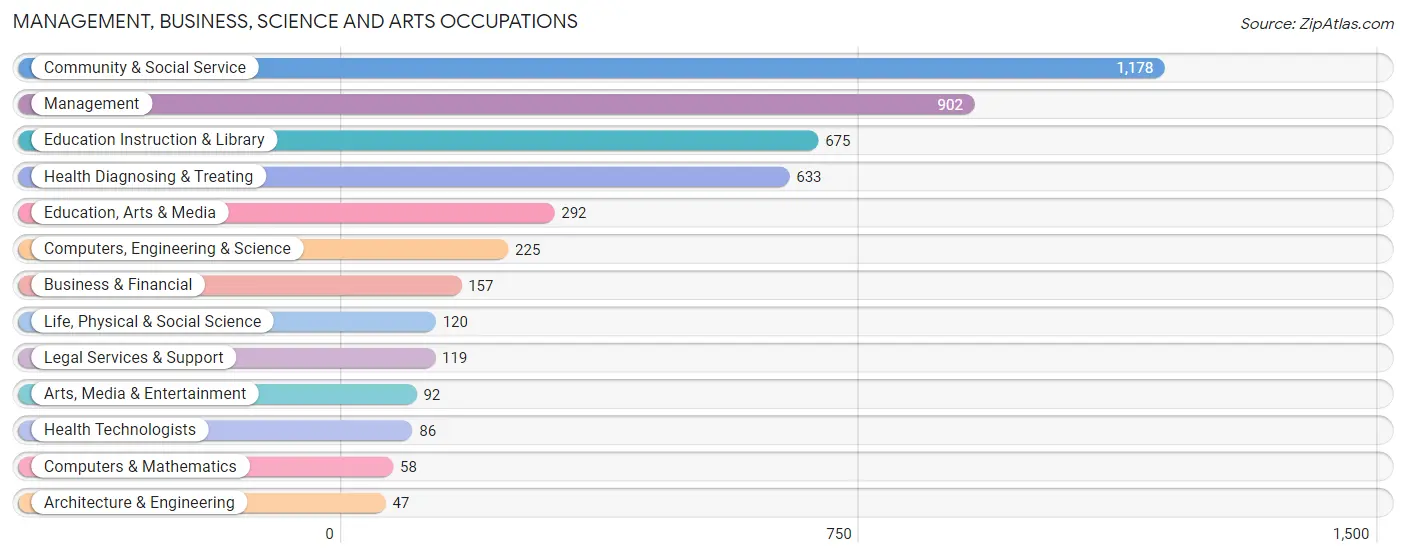
Management, Business, Science and Arts Occupations
The most common Management, Business, Science and Arts occupations in Bee County are Community & Social Service (1,178 | 11.4%), Management (902 | 8.7%), Education Instruction & Library (675 | 6.5%), Health Diagnosing & Treating (633 | 6.1%), and Education, Arts & Media (292 | 2.8%).
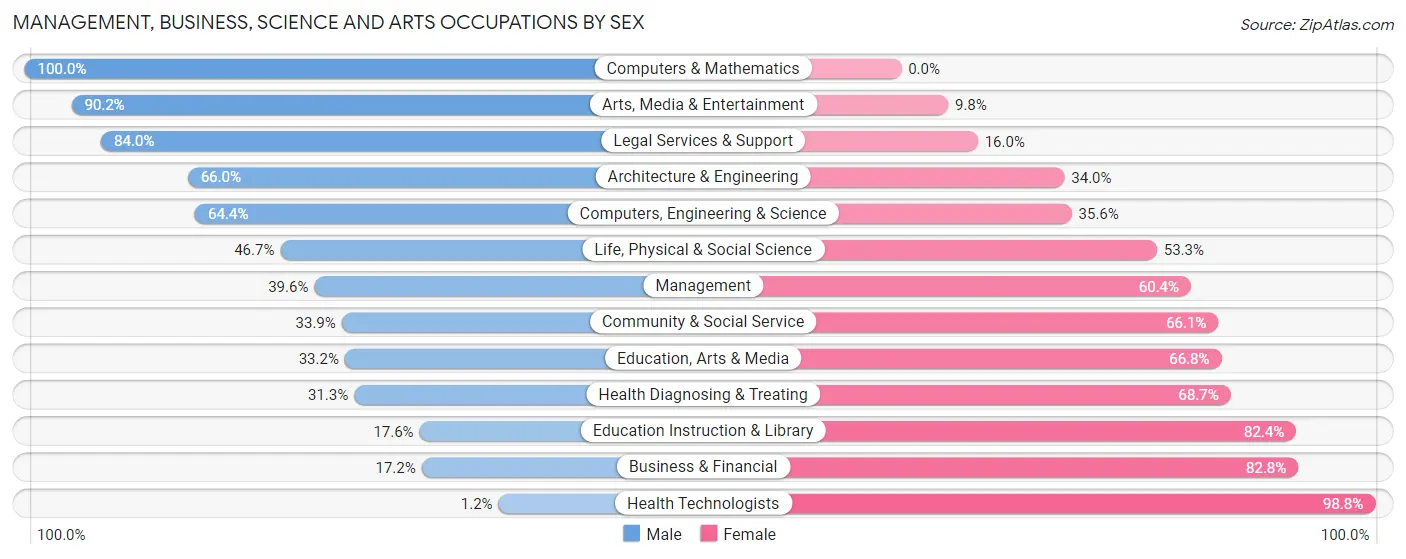
Management, Business, Science and Arts Occupations by Sex
Within the Management, Business, Science and Arts occupations in Bee County, the most male-oriented occupations are Computers & Mathematics (100.0%), Arts, Media & Entertainment (90.2%), and Legal Services & Support (84.0%), while the most female-oriented occupations are Health Technologists (98.8%), Business & Financial (82.8%), and Education Instruction & Library (82.4%).
| Occupation | Male | Female |
| Management | 357 (39.6%) | 545 (60.4%) |
| Business & Financial | 27 (17.2%) | 130 (82.8%) |
| Computers, Engineering & Science | 145 (64.4%) | 80 (35.6%) |
| Computers & Mathematics | 58 (100.0%) | 0 (0.0%) |
| Architecture & Engineering | 31 (66.0%) | 16 (34.0%) |
| Life, Physical & Social Science | 56 (46.7%) | 64 (53.3%) |
| Community & Social Service | 399 (33.9%) | 779 (66.1%) |
| Education, Arts & Media | 97 (33.2%) | 195 (66.8%) |
| Legal Services & Support | 100 (84.0%) | 19 (16.0%) |
| Education Instruction & Library | 119 (17.6%) | 556 (82.4%) |
| Arts, Media & Entertainment | 83 (90.2%) | 9 (9.8%) |
| Health Diagnosing & Treating | 198 (31.3%) | 435 (68.7%) |
| Health Technologists | 1 (1.2%) | 85 (98.8%) |
| Total (Category) | 1,126 (36.4%) | 1,969 (63.6%) |
| Total (Overall) | 5,707 (55.0%) | 4,674 (45.0%) |
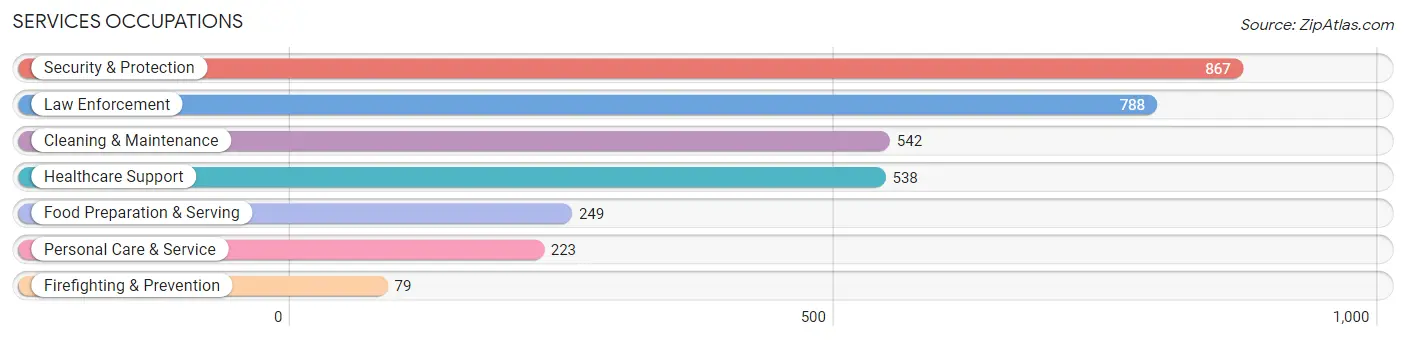
Services Occupations
The most common Services occupations in Bee County are Security & Protection (867 | 8.4%), Law Enforcement (788 | 7.6%), Cleaning & Maintenance (542 | 5.2%), Healthcare Support (538 | 5.2%), and Food Preparation & Serving (249 | 2.4%).
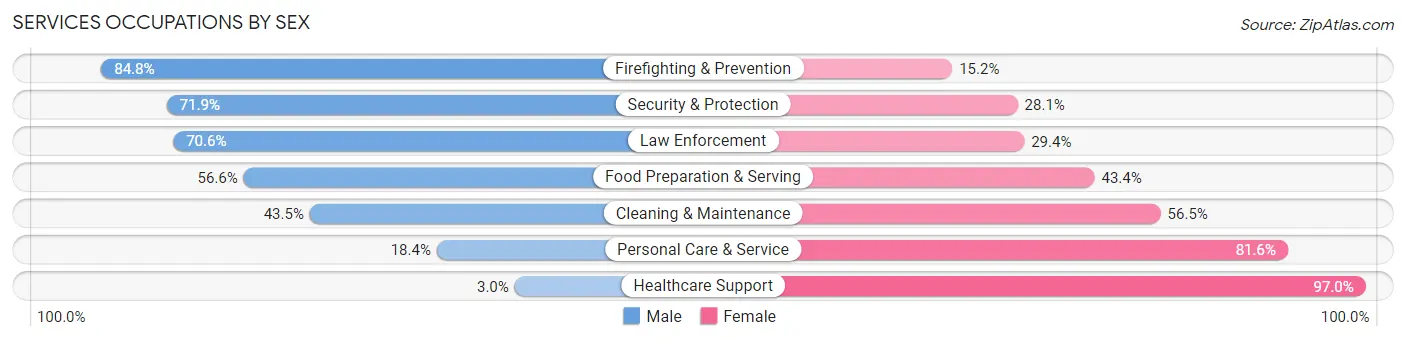
Services Occupations by Sex
Within the Services occupations in Bee County, the most male-oriented occupations are Firefighting & Prevention (84.8%), Security & Protection (71.9%), and Law Enforcement (70.6%), while the most female-oriented occupations are Healthcare Support (97.0%), Personal Care & Service (81.6%), and Cleaning & Maintenance (56.5%).
| Occupation | Male | Female |
| Healthcare Support | 16 (3.0%) | 522 (97.0%) |
| Security & Protection | 623 (71.9%) | 244 (28.1%) |
| Firefighting & Prevention | 67 (84.8%) | 12 (15.2%) |
| Law Enforcement | 556 (70.6%) | 232 (29.4%) |
| Food Preparation & Serving | 141 (56.6%) | 108 (43.4%) |
| Cleaning & Maintenance | 236 (43.5%) | 306 (56.5%) |
| Personal Care & Service | 41 (18.4%) | 182 (81.6%) |
| Total (Category) | 1,057 (43.7%) | 1,362 (56.3%) |
| Total (Overall) | 5,707 (55.0%) | 4,674 (45.0%) |
Sales and Office Occupations
The most common Sales and Office occupations in Bee County are Sales & Related (1,044 | 10.1%), and Office & Administration (918 | 8.8%).

Sales and Office Occupations by Sex
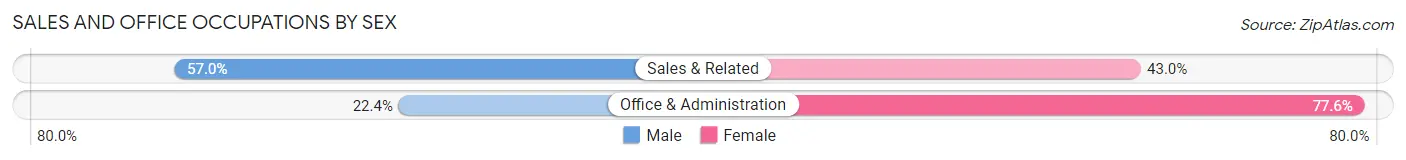
| Occupation | Male | Female |
| Sales & Related | 595 (57.0%) | 449 (43.0%) |
| Office & Administration | 206 (22.4%) | 712 (77.6%) |
| Total (Category) | 801 (40.8%) | 1,161 (59.2%) |
| Total (Overall) | 5,707 (55.0%) | 4,674 (45.0%) |
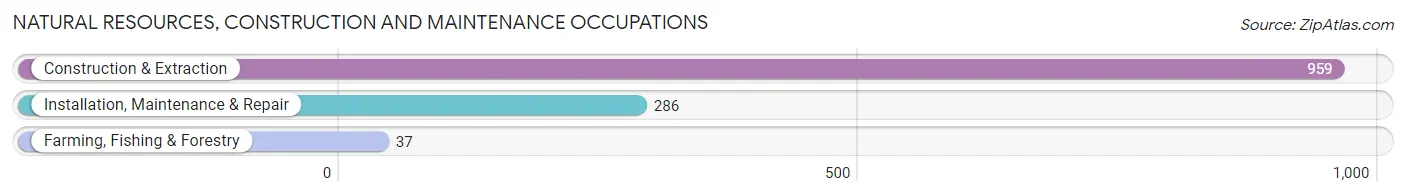
Natural Resources, Construction and Maintenance Occupations
The most common Natural Resources, Construction and Maintenance occupations in Bee County are Construction & Extraction (959 | 9.2%), Installation, Maintenance & Repair (286 | 2.8%), and Farming, Fishing & Forestry (37 | 0.4%).
Natural Resources, Construction and Maintenance Occupations by Sex
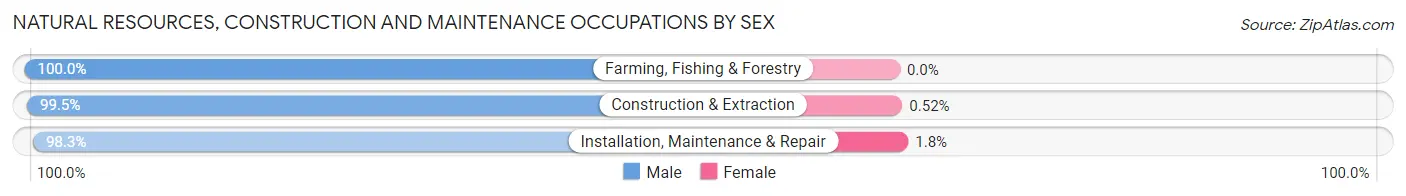
| Occupation | Male | Female |
| Farming, Fishing & Forestry | 37 (100.0%) | 0 (0.0%) |
| Construction & Extraction | 954 (99.5%) | 5 (0.5%) |
| Installation, Maintenance & Repair | 281 (98.3%) | 5 (1.8%) |
| Total (Category) | 1,272 (99.2%) | 10 (0.8%) |
| Total (Overall) | 5,707 (55.0%) | 4,674 (45.0%) |
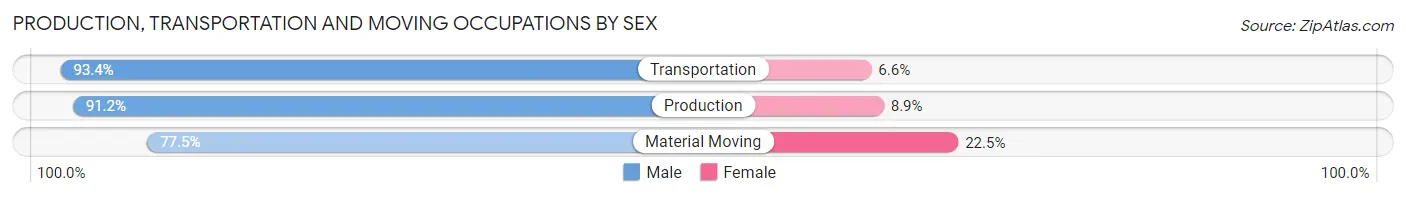
Production, Transportation and Moving Occupations
The most common Production, Transportation and Moving occupations in Bee County are Production (689 | 6.6%), Transportation (623 | 6.0%), and Material Moving (311 | 3.0%).
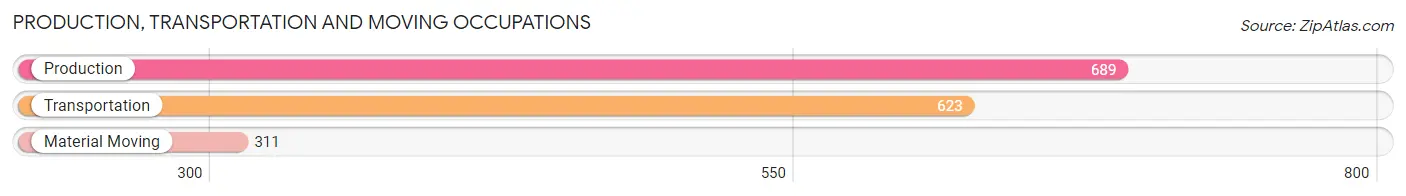
Production, Transportation and Moving Occupations by Sex
| Occupation | Male | Female |
| Production | 628 (91.1%) | 61 (8.8%) |
| Transportation | 582 (93.4%) | 41 (6.6%) |
| Material Moving | 241 (77.5%) | 70 (22.5%) |
| Total (Category) | 1,451 (89.4%) | 172 (10.6%) |
| Total (Overall) | 5,707 (55.0%) | 4,674 (45.0%) |
Employment Industries by Sex in Bee County
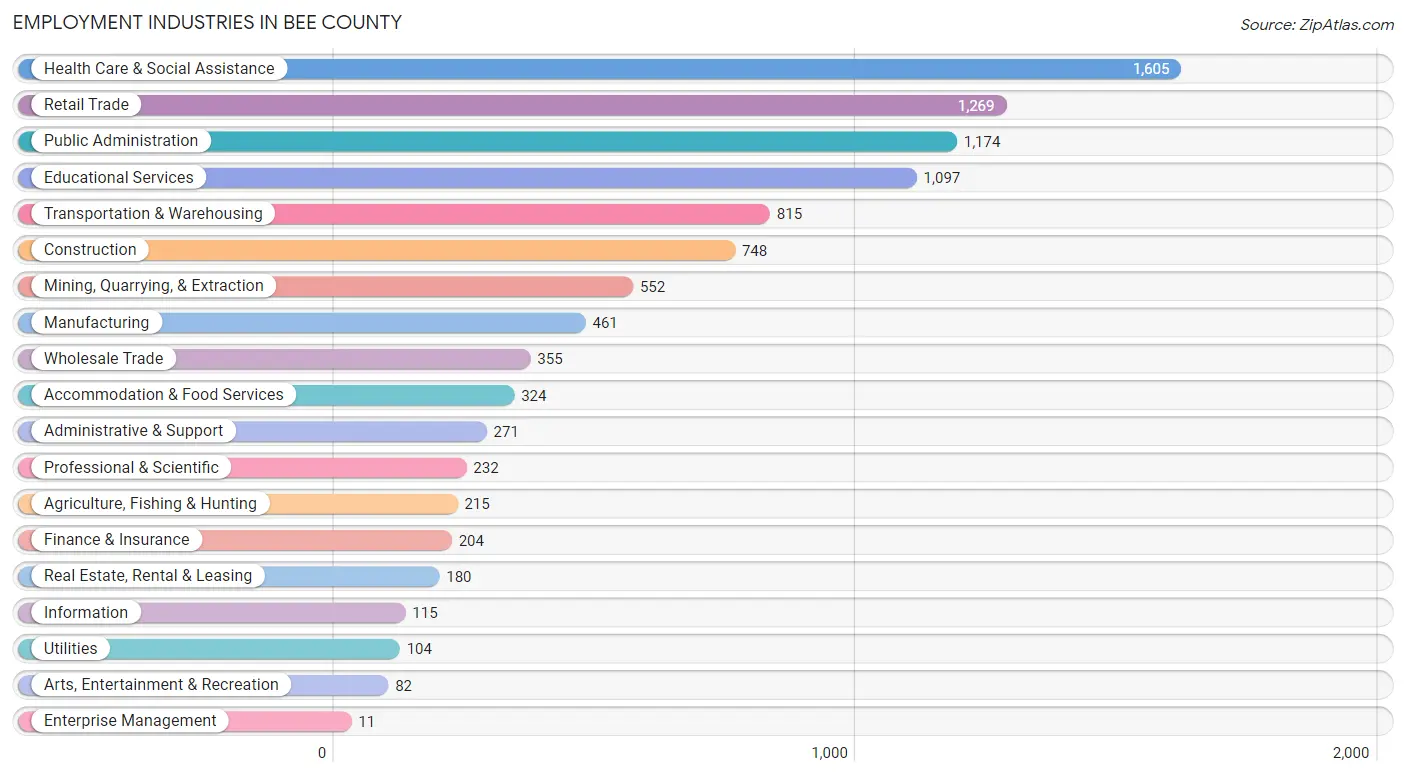
Employment Industries in Bee County
The major employment industries in Bee County include Health Care & Social Assistance (1,605 | 15.5%), Retail Trade (1,269 | 12.2%), Public Administration (1,174 | 11.3%), Educational Services (1,097 | 10.6%), and Transportation & Warehousing (815 | 7.9%).
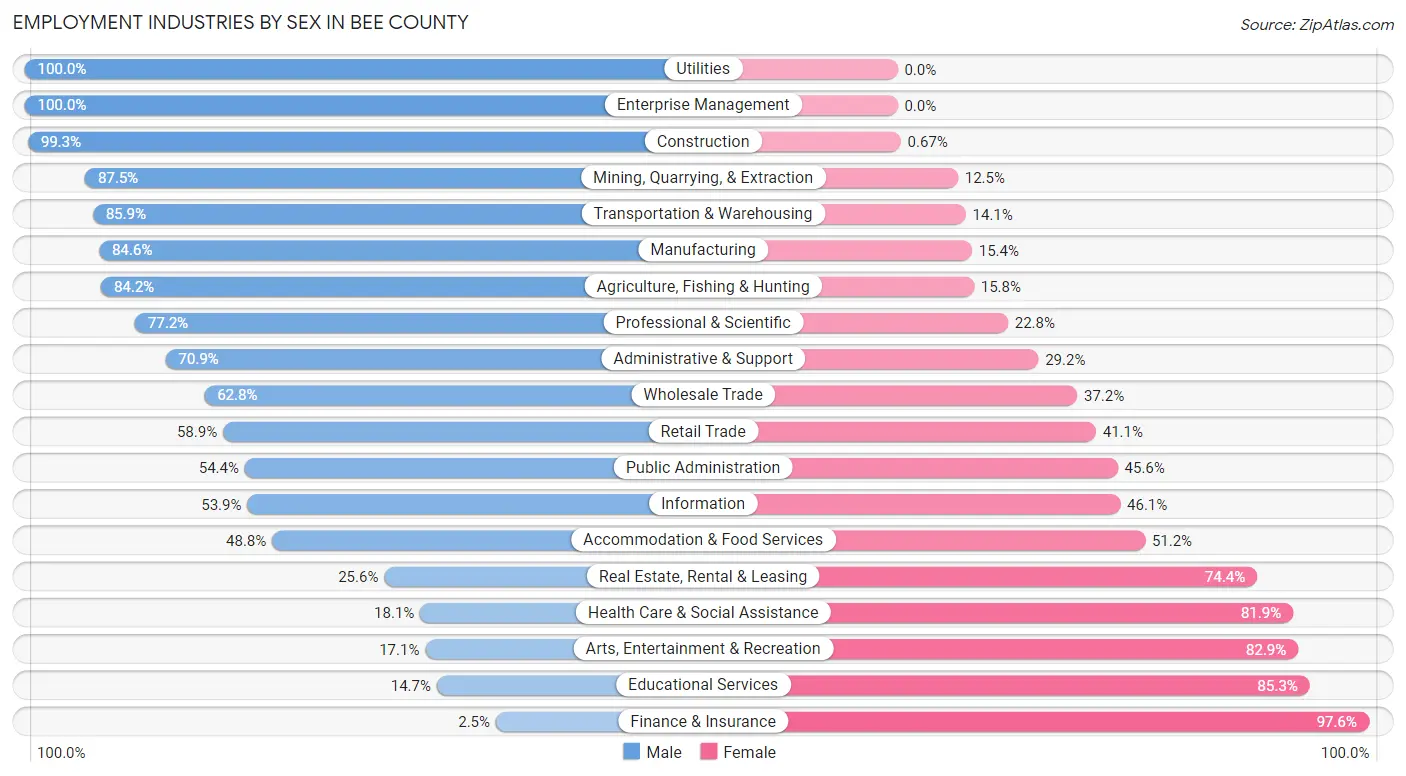
Employment Industries by Sex in Bee County
The Bee County industries that see more men than women are Utilities (100.0%), Enterprise Management (100.0%), and Construction (99.3%), whereas the industries that tend to have a higher number of women are Finance & Insurance (97.6%), Educational Services (85.3%), and Arts, Entertainment & Recreation (82.9%).
| Industry | Male | Female |
| Agriculture, Fishing & Hunting | 181 (84.2%) | 34 (15.8%) |
| Mining, Quarrying, & Extraction | 483 (87.5%) | 69 (12.5%) |
| Construction | 743 (99.3%) | 5 (0.7%) |
| Manufacturing | 390 (84.6%) | 71 (15.4%) |
| Wholesale Trade | 223 (62.8%) | 132 (37.2%) |
| Retail Trade | 748 (58.9%) | 521 (41.1%) |
| Transportation & Warehousing | 700 (85.9%) | 115 (14.1%) |
| Utilities | 104 (100.0%) | 0 (0.0%) |
| Information | 62 (53.9%) | 53 (46.1%) |
| Finance & Insurance | 5 (2.5%) | 199 (97.6%) |
| Real Estate, Rental & Leasing | 46 (25.6%) | 134 (74.4%) |
| Professional & Scientific | 179 (77.2%) | 53 (22.8%) |
| Enterprise Management | 11 (100.0%) | 0 (0.0%) |
| Administrative & Support | 192 (70.9%) | 79 (29.1%) |
| Educational Services | 161 (14.7%) | 936 (85.3%) |
| Health Care & Social Assistance | 291 (18.1%) | 1,314 (81.9%) |
| Arts, Entertainment & Recreation | 14 (17.1%) | 68 (82.9%) |
| Accommodation & Food Services | 158 (48.8%) | 166 (51.2%) |
| Public Administration | 639 (54.4%) | 535 (45.6%) |
| Total | 5,707 (55.0%) | 4,674 (45.0%) |
Education in Bee County
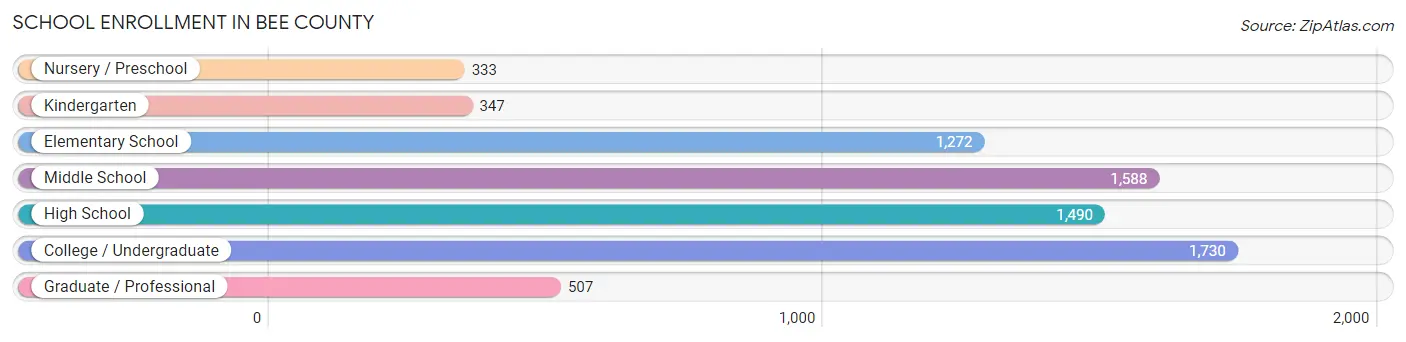
School Enrollment in Bee County
The most common levels of schooling among the 7,267 students in Bee County are college / undergraduate (1,730 | 23.8%), middle school (1,588 | 21.8%), and high school (1,490 | 20.5%).
| School Level | # Students | % Students |
| Nursery / Preschool | 333 | 4.6% |
| Kindergarten | 347 | 4.8% |
| Elementary School | 1,272 | 17.5% |
| Middle School | 1,588 | 21.8% |
| High School | 1,490 | 20.5% |
| College / Undergraduate | 1,730 | 23.8% |
| Graduate / Professional | 507 | 7.0% |
| Total | 7,267 | 100.0% |
School Enrollment by Age by Funding Source in Bee County
Out of a total of 7,267 students who are enrolled in schools in Bee County, 443 (6.1%) attend a private institution, while the remaining 6,824 (93.9%) are enrolled in public schools. The age group of 35 years and over has the highest likelihood of being enrolled in private schools, with 86 (28.6% in the age bracket) enrolled. Conversely, the age group of 15 to 17 year olds has the lowest likelihood of being enrolled in a private school, with 1,099 (99.9% in the age bracket) attending a public institution.
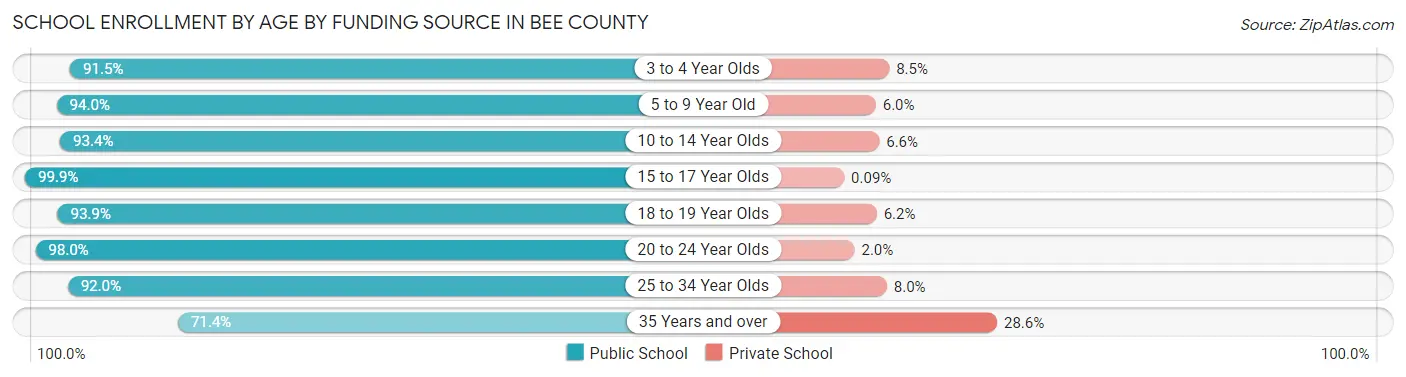
| Age Bracket | Public School | Private School |
| 3 to 4 Year Olds | 194 (91.5%) | 18 (8.5%) |
| 5 to 9 Year Old | 1,493 (94.0%) | 95 (6.0%) |
| 10 to 14 Year Olds | 1,703 (93.4%) | 121 (6.6%) |
| 15 to 17 Year Olds | 1,099 (99.9%) | 1 (0.1%) |
| 18 to 19 Year Olds | 427 (93.9%) | 28 (6.1%) |
| 20 to 24 Year Olds | 776 (98.0%) | 16 (2.0%) |
| 25 to 34 Year Olds | 915 (92.0%) | 80 (8.0%) |
| 35 Years and over | 215 (71.4%) | 86 (28.6%) |
| Total | 6,824 (93.9%) | 443 (6.1%) |
Educational Attainment by Field of Study in Bee County
Education (1,015 | 39.4%), business (291 | 11.3%), arts & humanities (246 | 9.6%), liberal arts & history (225 | 8.7%), and communications (135 | 5.2%) are the most common fields of study among 2,574 individuals in Bee County who have obtained a bachelor's degree or higher.
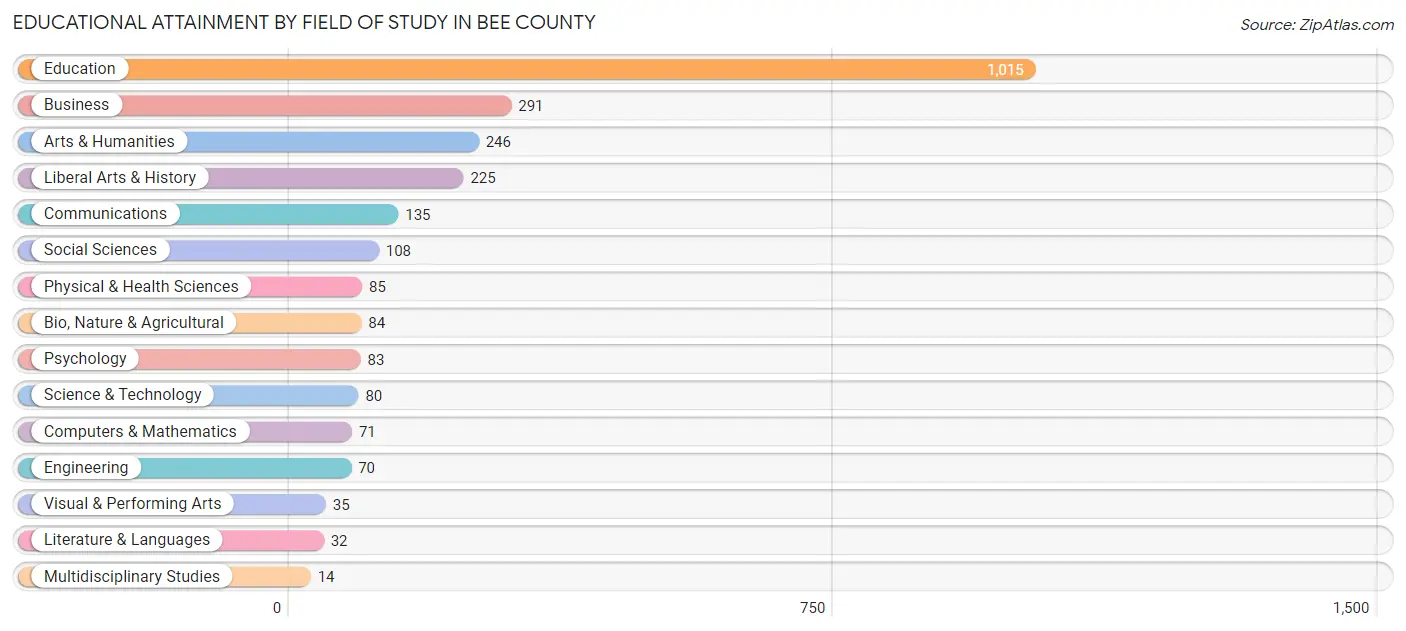
| Field of Study | # Graduates | % Graduates |
| Computers & Mathematics | 71 | 2.8% |
| Bio, Nature & Agricultural | 84 | 3.3% |
| Physical & Health Sciences | 85 | 3.3% |
| Psychology | 83 | 3.2% |
| Social Sciences | 108 | 4.2% |
| Engineering | 70 | 2.7% |
| Multidisciplinary Studies | 14 | 0.5% |
| Science & Technology | 80 | 3.1% |
| Business | 291 | 11.3% |
| Education | 1,015 | 39.4% |
| Literature & Languages | 32 | 1.2% |
| Liberal Arts & History | 225 | 8.7% |
| Visual & Performing Arts | 35 | 1.4% |
| Communications | 135 | 5.2% |
| Arts & Humanities | 246 | 9.6% |
| Total | 2,574 | 100.0% |
Transportation & Commute in Bee County
Vehicle Availability by Sex in Bee County
The most prevalent vehicle ownership categories in Bee County are males with 2 vehicles (2,538, accounting for 45.7%) and females with 2 vehicles (1,831, making up 57.5%).
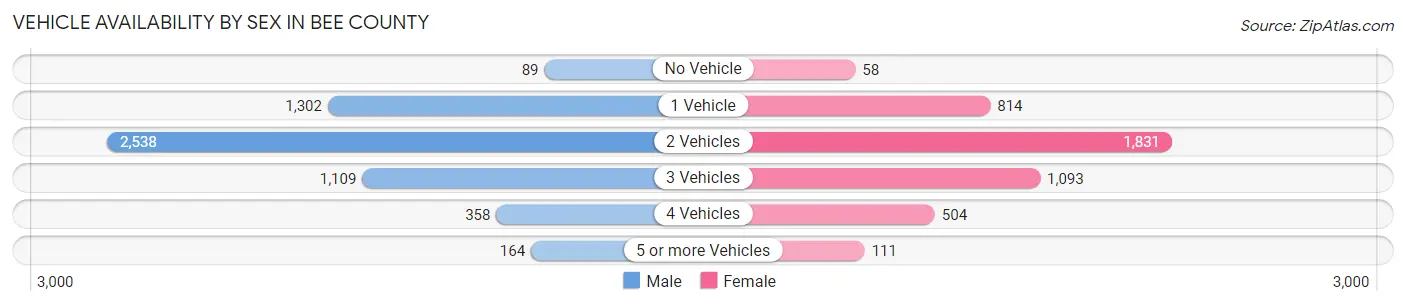
| Vehicles Available | Male | Female |
| No Vehicle | 89 (1.6%) | 58 (1.3%) |
| 1 Vehicle | 1,302 (23.4%) | 814 (18.4%) |
| 2 Vehicles | 2,538 (45.7%) | 1,831 (41.5%) |
| 3 Vehicles | 1,109 (20.0%) | 1,093 (24.8%) |
| 4 Vehicles | 358 (6.4%) | 504 (11.4%) |
| 5 or more Vehicles | 164 (2.9%) | 111 (2.5%) |
| Total | 5,560 (100.0%) | 4,411 (100.0%) |
Commute Time in Bee County
The most frequently occuring commute durations in Bee County are 10 to 14 minutes (2,166 commuters, 22.7%), 5 to 9 minutes (1,990 commuters, 20.9%), and 15 to 19 minutes (1,186 commuters, 12.4%).
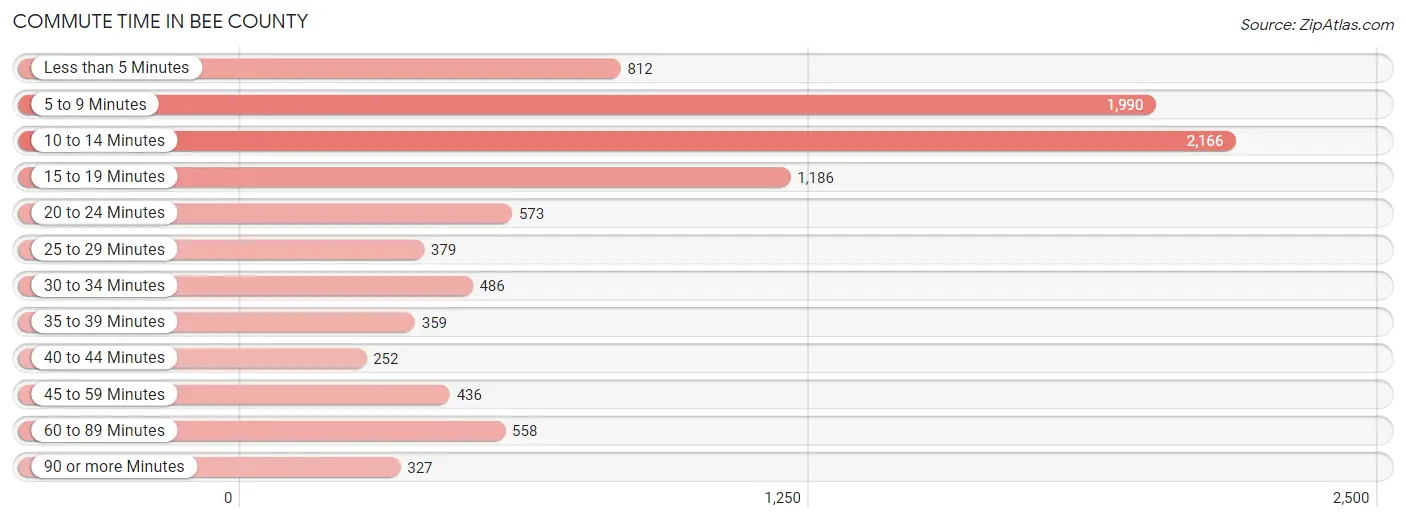
| Commute Time | # Commuters | % Commuters |
| Less than 5 Minutes | 812 | 8.5% |
| 5 to 9 Minutes | 1,990 | 20.9% |
| 10 to 14 Minutes | 2,166 | 22.7% |
| 15 to 19 Minutes | 1,186 | 12.4% |
| 20 to 24 Minutes | 573 | 6.0% |
| 25 to 29 Minutes | 379 | 4.0% |
| 30 to 34 Minutes | 486 | 5.1% |
| 35 to 39 Minutes | 359 | 3.8% |
| 40 to 44 Minutes | 252 | 2.6% |
| 45 to 59 Minutes | 436 | 4.6% |
| 60 to 89 Minutes | 558 | 5.9% |
| 90 or more Minutes | 327 | 3.4% |
Commute Time by Sex in Bee County
The most common commute times in Bee County are 10 to 14 minutes (1,106 commuters, 21.1%) for males and 5 to 9 minutes (1,097 commuters, 25.7%) for females.
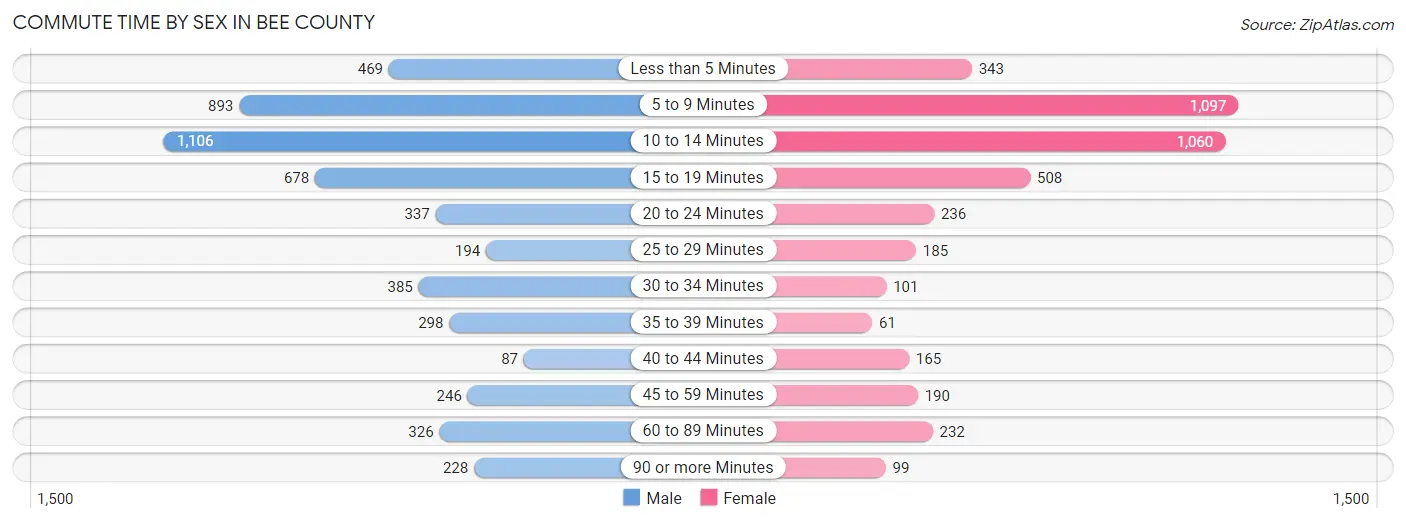
| Commute Time | Male | Female |
| Less than 5 Minutes | 469 (8.9%) | 343 (8.0%) |
| 5 to 9 Minutes | 893 (17.0%) | 1,097 (25.7%) |
| 10 to 14 Minutes | 1,106 (21.1%) | 1,060 (24.8%) |
| 15 to 19 Minutes | 678 (12.9%) | 508 (11.9%) |
| 20 to 24 Minutes | 337 (6.4%) | 236 (5.5%) |
| 25 to 29 Minutes | 194 (3.7%) | 185 (4.3%) |
| 30 to 34 Minutes | 385 (7.3%) | 101 (2.4%) |
| 35 to 39 Minutes | 298 (5.7%) | 61 (1.4%) |
| 40 to 44 Minutes | 87 (1.7%) | 165 (3.9%) |
| 45 to 59 Minutes | 246 (4.7%) | 190 (4.4%) |
| 60 to 89 Minutes | 326 (6.2%) | 232 (5.4%) |
| 90 or more Minutes | 228 (4.3%) | 99 (2.3%) |
Time of Departure to Work by Sex in Bee County
The most frequent times of departure to work in Bee County are 7:00 AM to 7:29 AM (766, 14.6%) for males and 7:30 AM to 7:59 AM (685, 16.0%) for females.
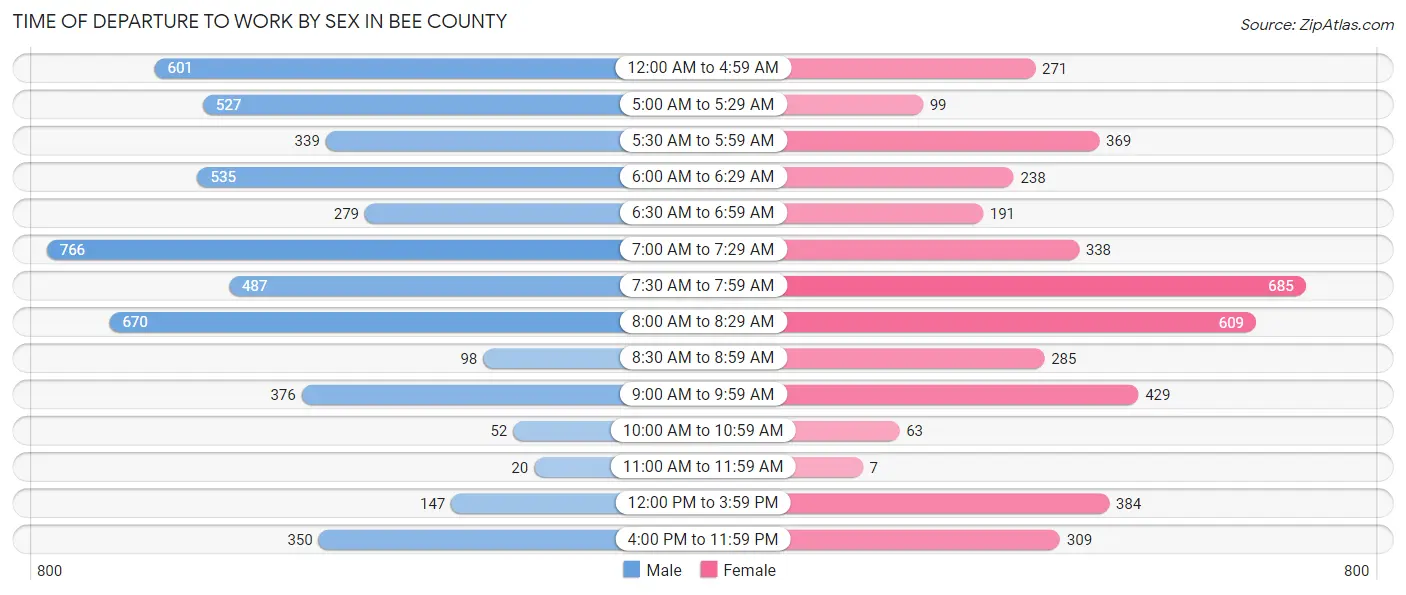
| Time of Departure | Male | Female |
| 12:00 AM to 4:59 AM | 601 (11.5%) | 271 (6.3%) |
| 5:00 AM to 5:29 AM | 527 (10.0%) | 99 (2.3%) |
| 5:30 AM to 5:59 AM | 339 (6.5%) | 369 (8.6%) |
| 6:00 AM to 6:29 AM | 535 (10.2%) | 238 (5.6%) |
| 6:30 AM to 6:59 AM | 279 (5.3%) | 191 (4.5%) |
| 7:00 AM to 7:29 AM | 766 (14.6%) | 338 (7.9%) |
| 7:30 AM to 7:59 AM | 487 (9.3%) | 685 (16.0%) |
| 8:00 AM to 8:29 AM | 670 (12.8%) | 609 (14.2%) |
| 8:30 AM to 8:59 AM | 98 (1.9%) | 285 (6.7%) |
| 9:00 AM to 9:59 AM | 376 (7.2%) | 429 (10.0%) |
| 10:00 AM to 10:59 AM | 52 (1.0%) | 63 (1.5%) |
| 11:00 AM to 11:59 AM | 20 (0.4%) | 7 (0.2%) |
| 12:00 PM to 3:59 PM | 147 (2.8%) | 384 (9.0%) |
| 4:00 PM to 11:59 PM | 350 (6.7%) | 309 (7.2%) |
| Total | 5,247 (100.0%) | 4,277 (100.0%) |
Housing Occupancy in Bee County
Occupancy by Ownership in Bee County
Of the total 8,563 dwellings in Bee County, owner-occupied units account for 5,765 (67.3%), while renter-occupied units make up 2,798 (32.7%).
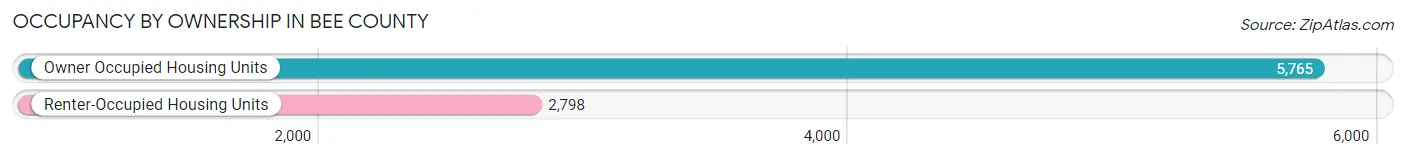
| Occupancy | # Housing Units | % Housing Units |
| Owner Occupied Housing Units | 5,765 | 67.3% |
| Renter-Occupied Housing Units | 2,798 | 32.7% |
| Total Occupied Housing Units | 8,563 | 100.0% |
Occupancy by Household Size in Bee County
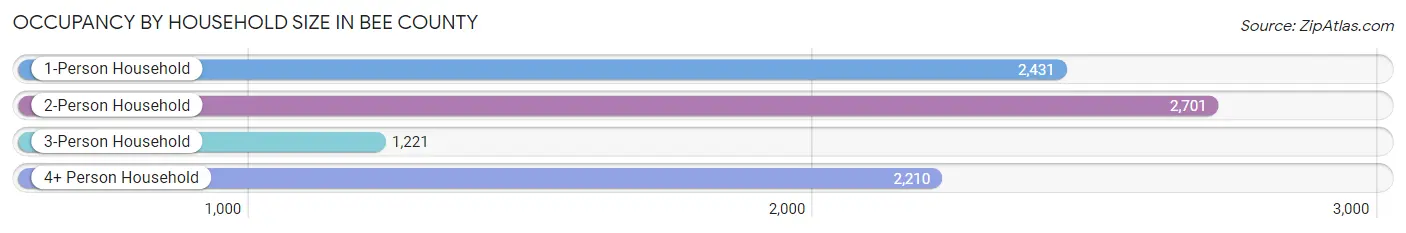
| Household Size | # Housing Units | % Housing Units |
| 1-Person Household | 2,431 | 28.4% |
| 2-Person Household | 2,701 | 31.5% |
| 3-Person Household | 1,221 | 14.3% |
| 4+ Person Household | 2,210 | 25.8% |
| Total Housing Units | 8,563 | 100.0% |
Occupancy by Ownership by Household Size in Bee County
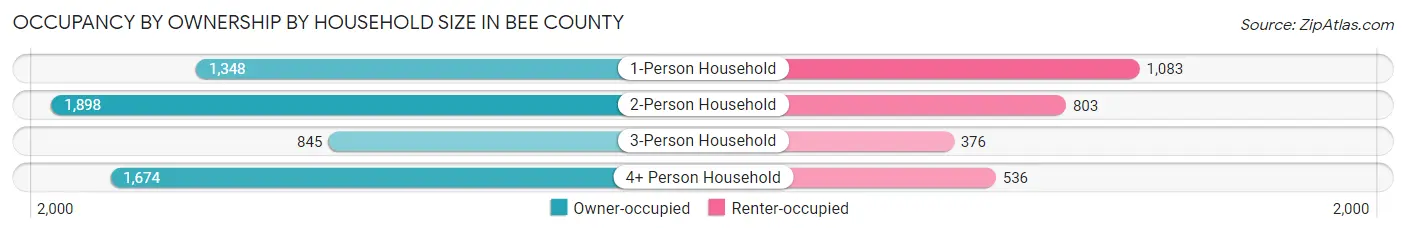
| Household Size | Owner-occupied | Renter-occupied |
| 1-Person Household | 1,348 (55.4%) | 1,083 (44.6%) |
| 2-Person Household | 1,898 (70.3%) | 803 (29.7%) |
| 3-Person Household | 845 (69.2%) | 376 (30.8%) |
| 4+ Person Household | 1,674 (75.7%) | 536 (24.2%) |
| Total Housing Units | 5,765 (67.3%) | 2,798 (32.7%) |
Occupancy by Educational Attainment in Bee County
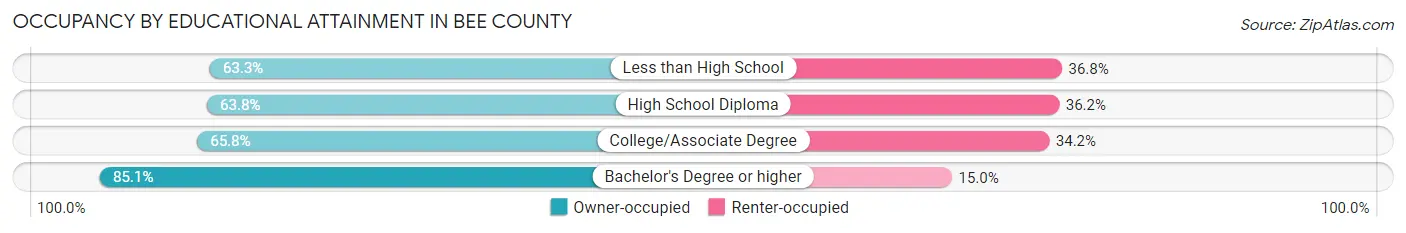
| Household Size | Owner-occupied | Renter-occupied |
| Less than High School | 790 (63.2%) | 459 (36.7%) |
| High School Diploma | 1,507 (63.8%) | 855 (36.2%) |
| College/Associate Degree | 2,535 (65.8%) | 1,320 (34.2%) |
| Bachelor's Degree or higher | 933 (85.1%) | 164 (14.9%) |
Occupancy by Age of Householder in Bee County
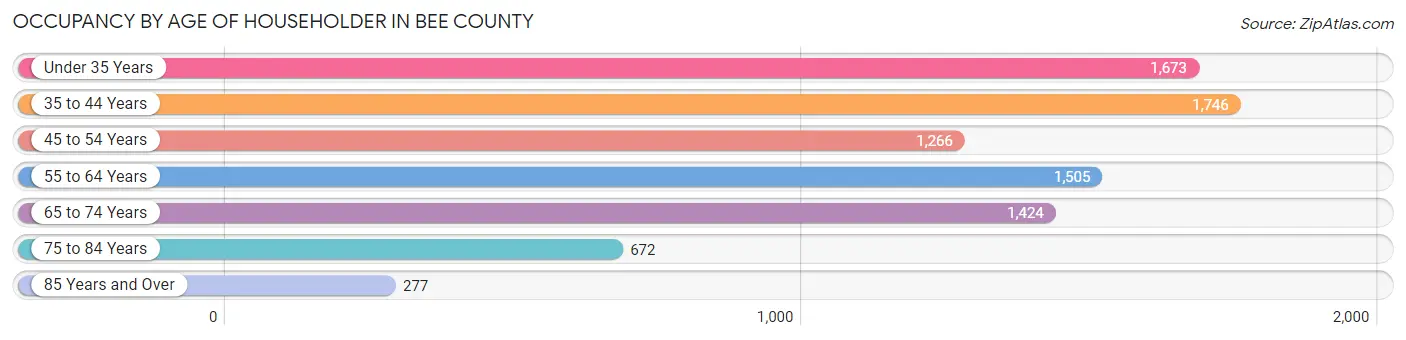
| Age Bracket | # Households | % Households |
| Under 35 Years | 1,673 | 19.5% |
| 35 to 44 Years | 1,746 | 20.4% |
| 45 to 54 Years | 1,266 | 14.8% |
| 55 to 64 Years | 1,505 | 17.6% |
| 65 to 74 Years | 1,424 | 16.6% |
| 75 to 84 Years | 672 | 7.9% |
| 85 Years and Over | 277 | 3.2% |
| Total | 8,563 | 100.0% |
Housing Finances in Bee County
Median Income by Occupancy in Bee County
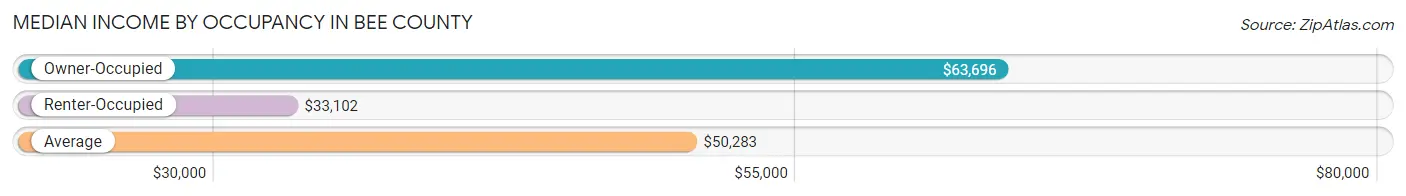
| Occupancy Type | # Households | Median Income |
| Owner-Occupied | 5,765 (67.3%) | $63,696 |
| Renter-Occupied | 2,798 (32.7%) | $33,102 |
| Average | 8,563 (100.0%) | $50,283 |
Occupancy by Householder Income Bracket in Bee County
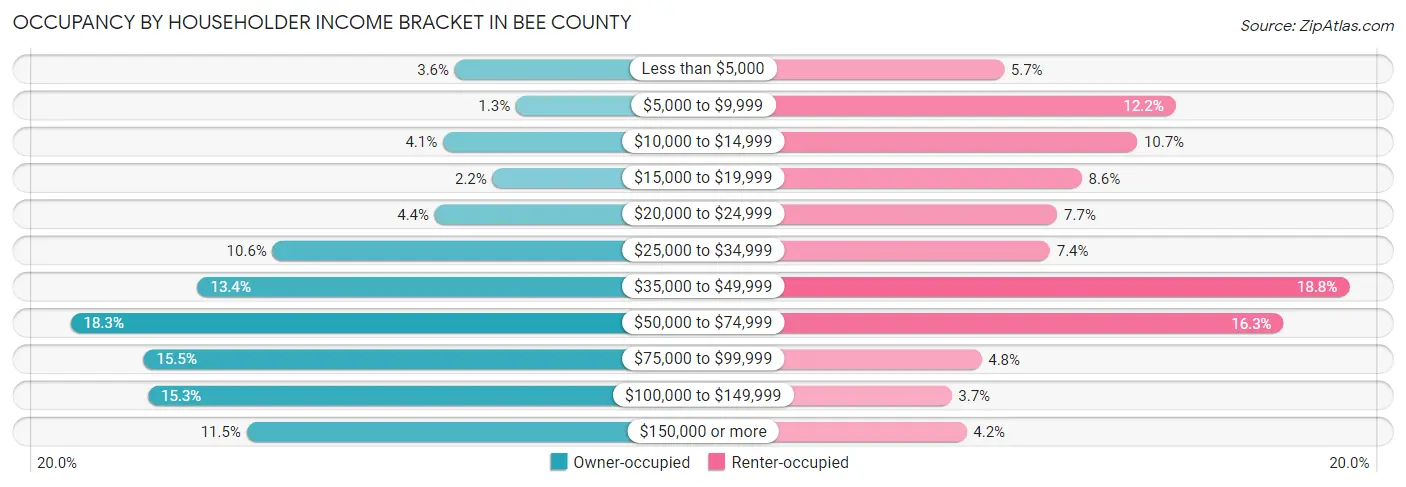
| Income Bracket | Owner-occupied | Renter-occupied |
| Less than $5,000 | 208 (3.6%) | 158 (5.7%) |
| $5,000 to $9,999 | 74 (1.3%) | 341 (12.2%) |
| $10,000 to $14,999 | 234 (4.1%) | 300 (10.7%) |
| $15,000 to $19,999 | 125 (2.2%) | 241 (8.6%) |
| $20,000 to $24,999 | 252 (4.4%) | 215 (7.7%) |
| $25,000 to $34,999 | 608 (10.5%) | 207 (7.4%) |
| $35,000 to $49,999 | 773 (13.4%) | 526 (18.8%) |
| $50,000 to $74,999 | 1,052 (18.2%) | 456 (16.3%) |
| $75,000 to $99,999 | 892 (15.5%) | 134 (4.8%) |
| $100,000 to $149,999 | 882 (15.3%) | 102 (3.6%) |
| $150,000 or more | 665 (11.5%) | 118 (4.2%) |
| Total | 5,765 (100.0%) | 2,798 (100.0%) |
Monthly Housing Cost Tiers in Bee County
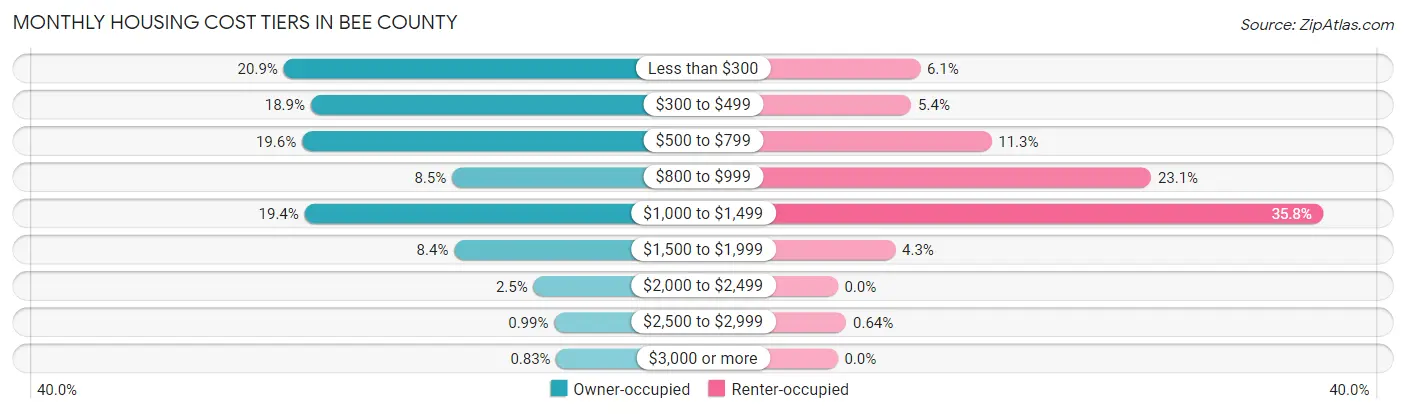
| Monthly Cost | Owner-occupied | Renter-occupied |
| Less than $300 | 1,206 (20.9%) | 170 (6.1%) |
| $300 to $499 | 1,091 (18.9%) | 152 (5.4%) |
| $500 to $799 | 1,128 (19.6%) | 317 (11.3%) |
| $800 to $999 | 491 (8.5%) | 646 (23.1%) |
| $1,000 to $1,499 | 1,117 (19.4%) | 1,002 (35.8%) |
| $1,500 to $1,999 | 482 (8.4%) | 119 (4.3%) |
| $2,000 to $2,499 | 145 (2.5%) | 0 (0.0%) |
| $2,500 to $2,999 | 57 (1.0%) | 18 (0.6%) |
| $3,000 or more | 48 (0.8%) | 0 (0.0%) |
| Total | 5,765 (100.0%) | 2,798 (100.0%) |
Physical Housing Characteristics in Bee County
Housing Structures in Bee County
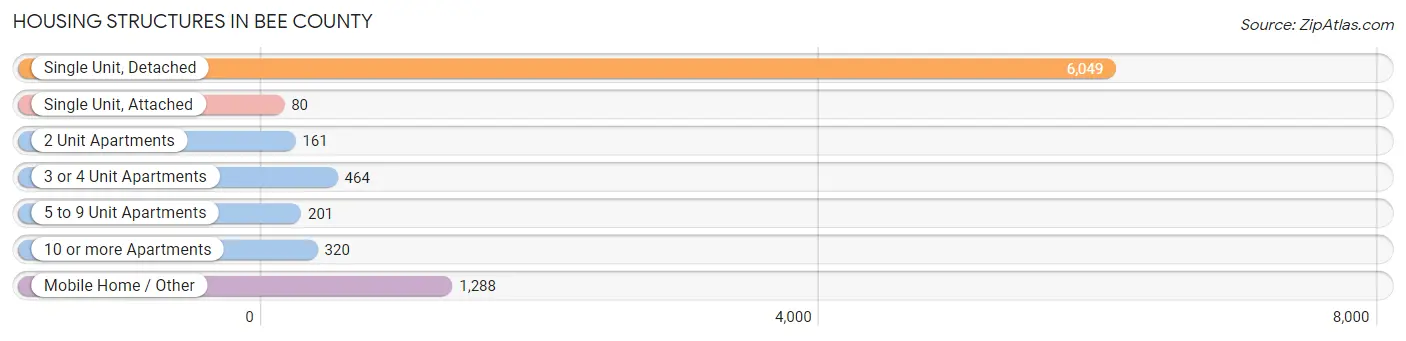
| Structure Type | # Housing Units | % Housing Units |
| Single Unit, Detached | 6,049 | 70.6% |
| Single Unit, Attached | 80 | 0.9% |
| 2 Unit Apartments | 161 | 1.9% |
| 3 or 4 Unit Apartments | 464 | 5.4% |
| 5 to 9 Unit Apartments | 201 | 2.4% |
| 10 or more Apartments | 320 | 3.7% |
| Mobile Home / Other | 1,288 | 15.0% |
| Total | 8,563 | 100.0% |
Housing Structures by Occupancy in Bee County
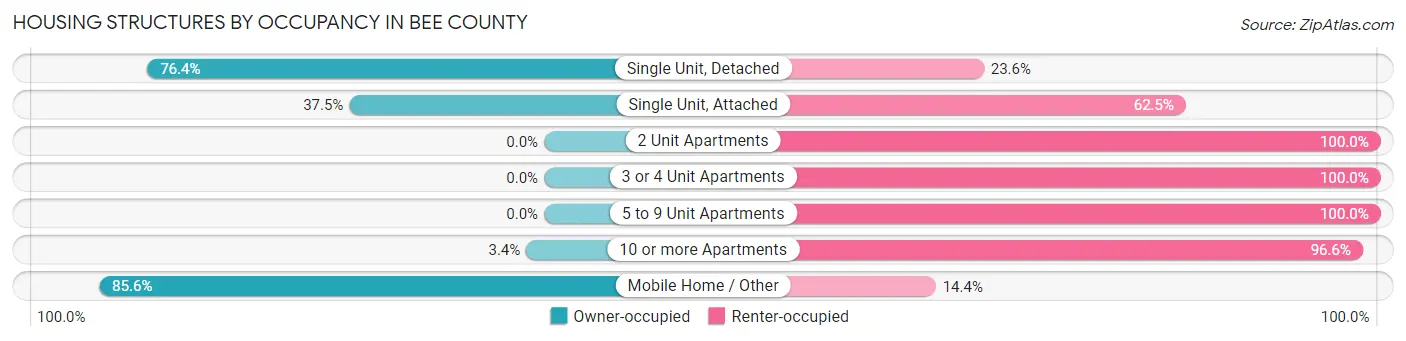
| Structure Type | Owner-occupied | Renter-occupied |
| Single Unit, Detached | 4,621 (76.4%) | 1,428 (23.6%) |
| Single Unit, Attached | 30 (37.5%) | 50 (62.5%) |
| 2 Unit Apartments | 0 (0.0%) | 161 (100.0%) |
| 3 or 4 Unit Apartments | 0 (0.0%) | 464 (100.0%) |
| 5 to 9 Unit Apartments | 0 (0.0%) | 201 (100.0%) |
| 10 or more Apartments | 11 (3.4%) | 309 (96.6%) |
| Mobile Home / Other | 1,103 (85.6%) | 185 (14.4%) |
| Total | 5,765 (67.3%) | 2,798 (32.7%) |
Housing Structures by Number of Rooms in Bee County
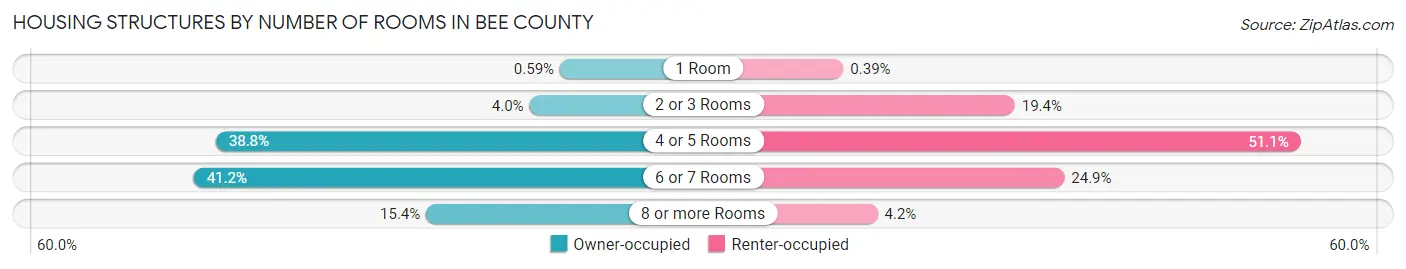
| Number of Rooms | Owner-occupied | Renter-occupied |
| 1 Room | 34 (0.6%) | 11 (0.4%) |
| 2 or 3 Rooms | 229 (4.0%) | 543 (19.4%) |
| 4 or 5 Rooms | 2,235 (38.8%) | 1,430 (51.1%) |
| 6 or 7 Rooms | 2,377 (41.2%) | 697 (24.9%) |
| 8 or more Rooms | 890 (15.4%) | 117 (4.2%) |
| Total | 5,765 (100.0%) | 2,798 (100.0%) |
Housing Structure by Heating Type in Bee County
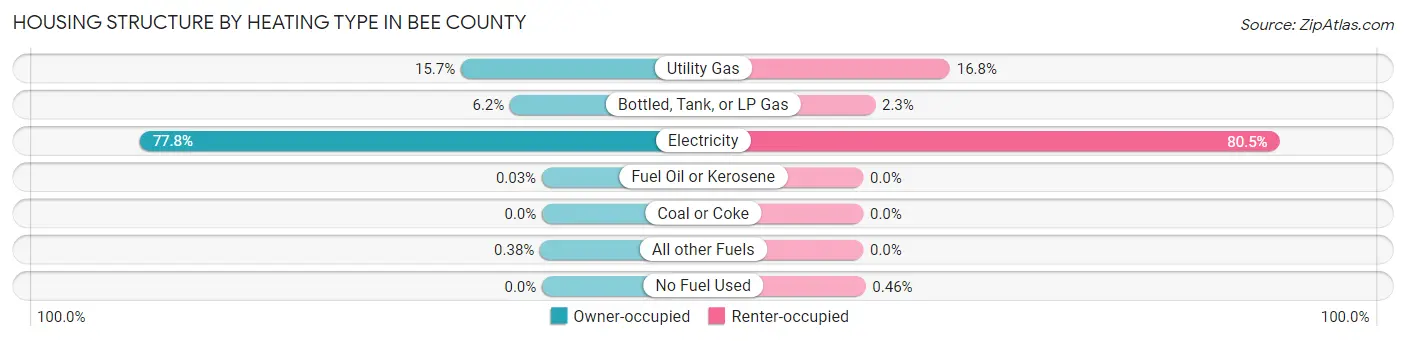
| Heating Type | Owner-occupied | Renter-occupied |
| Utility Gas | 903 (15.7%) | 469 (16.8%) |
| Bottled, Tank, or LP Gas | 356 (6.2%) | 65 (2.3%) |
| Electricity | 4,482 (77.7%) | 2,251 (80.4%) |
| Fuel Oil or Kerosene | 2 (0.0%) | 0 (0.0%) |
| Coal or Coke | 0 (0.0%) | 0 (0.0%) |
| All other Fuels | 22 (0.4%) | 0 (0.0%) |
| No Fuel Used | 0 (0.0%) | 13 (0.5%) |
| Total | 5,765 (100.0%) | 2,798 (100.0%) |
Household Vehicle Usage in Bee County
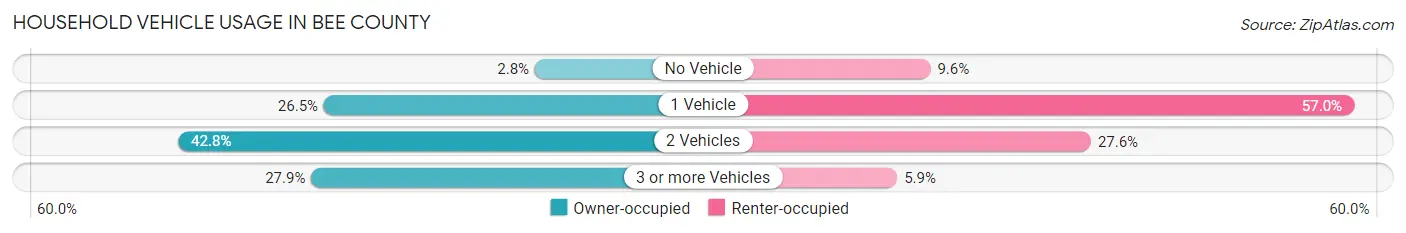
| Vehicles per Household | Owner-occupied | Renter-occupied |
| No Vehicle | 163 (2.8%) | 268 (9.6%) |
| 1 Vehicle | 1,526 (26.5%) | 1,595 (57.0%) |
| 2 Vehicles | 2,468 (42.8%) | 771 (27.6%) |
| 3 or more Vehicles | 1,608 (27.9%) | 164 (5.9%) |
| Total | 5,765 (100.0%) | 2,798 (100.0%) |
Real Estate & Mortgages in Bee County
Real Estate and Mortgage Overview in Bee County
| Characteristic | Without Mortgage | With Mortgage |
| Housing Units | 3,703 | 2,062 |
| Median Property Value | $88,500 | $142,200 |
| Median Household Income | $52,372 | $382 |
| Monthly Housing Costs | $383 | $48 |
| Real Estate Taxes | $1,008 | $89 |
Property Value by Mortgage Status in Bee County
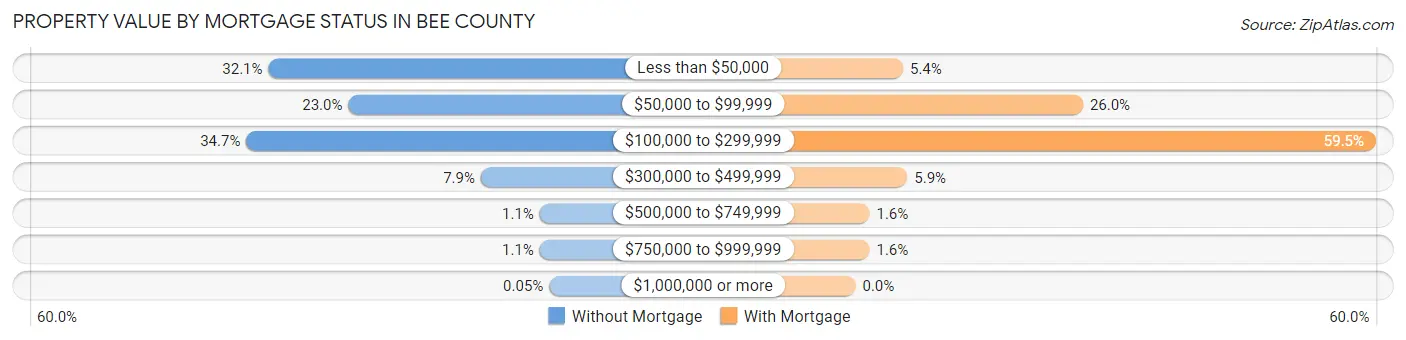
| Property Value | Without Mortgage | With Mortgage |
| Less than $50,000 | 1,190 (32.1%) | 112 (5.4%) |
| $50,000 to $99,999 | 852 (23.0%) | 536 (26.0%) |
| $100,000 to $299,999 | 1,284 (34.7%) | 1,226 (59.5%) |
| $300,000 to $499,999 | 291 (7.9%) | 122 (5.9%) |
| $500,000 to $749,999 | 42 (1.1%) | 33 (1.6%) |
| $750,000 to $999,999 | 42 (1.1%) | 33 (1.6%) |
| $1,000,000 or more | 2 (0.1%) | 0 (0.0%) |
| Total | 3,703 (100.0%) | 2,062 (100.0%) |
Household Income by Mortgage Status in Bee County
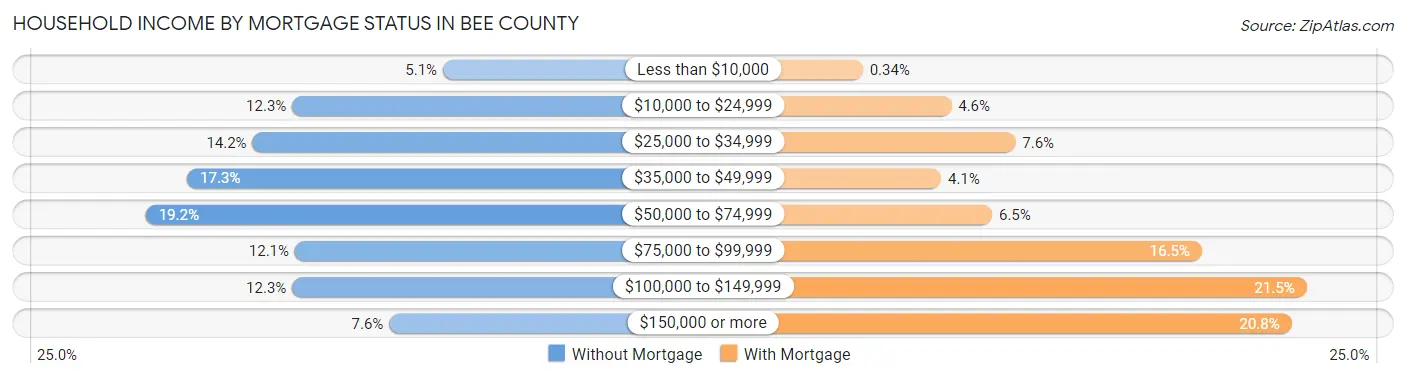
| Household Income | Without Mortgage | With Mortgage |
| Less than $10,000 | 188 (5.1%) | 7 (0.3%) |
| $10,000 to $24,999 | 454 (12.3%) | 94 (4.6%) |
| $25,000 to $34,999 | 524 (14.1%) | 157 (7.6%) |
| $35,000 to $49,999 | 639 (17.3%) | 84 (4.1%) |
| $50,000 to $74,999 | 712 (19.2%) | 134 (6.5%) |
| $75,000 to $99,999 | 449 (12.1%) | 340 (16.5%) |
| $100,000 to $149,999 | 454 (12.3%) | 443 (21.5%) |
| $150,000 or more | 283 (7.6%) | 428 (20.8%) |
| Total | 3,703 (100.0%) | 2,062 (100.0%) |
Property Value to Household Income Ratio in Bee County
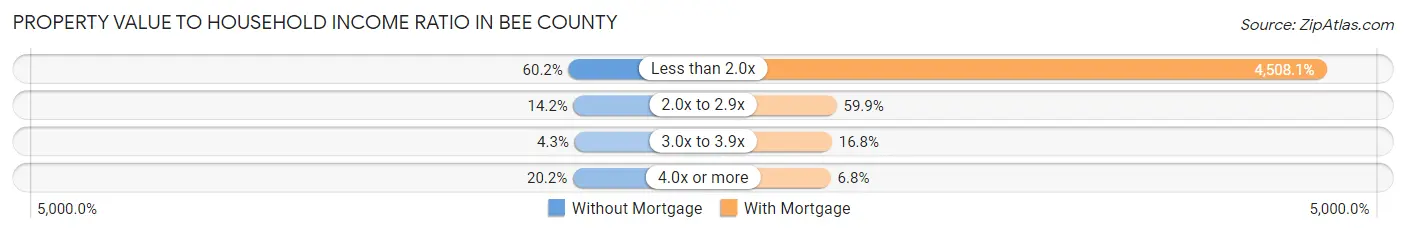
| Value-to-Income Ratio | Without Mortgage | With Mortgage |
| Less than 2.0x | 2,228 (60.2%) | 92,956 (4,508.1%) |
| 2.0x to 2.9x | 525 (14.2%) | 1,235 (59.9%) |
| 3.0x to 3.9x | 160 (4.3%) | 347 (16.8%) |
| 4.0x or more | 746 (20.2%) | 140 (6.8%) |
| Total | 3,703 (100.0%) | 2,062 (100.0%) |
Real Estate Taxes by Mortgage Status in Bee County
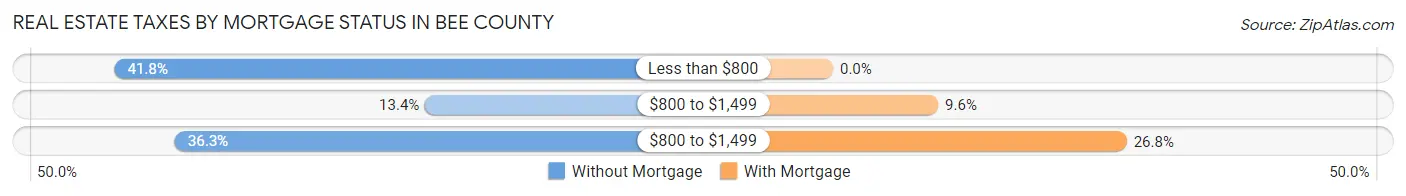
| Property Taxes | Without Mortgage | With Mortgage |
| Less than $800 | 1,547 (41.8%) | 0 (0.0%) |
| $800 to $1,499 | 497 (13.4%) | 198 (9.6%) |
| $800 to $1,499 | 1,343 (36.3%) | 553 (26.8%) |
| Total | 3,703 (100.0%) | 2,062 (100.0%) |
Health & Disability in Bee County
Health Insurance Coverage by Age in Bee County
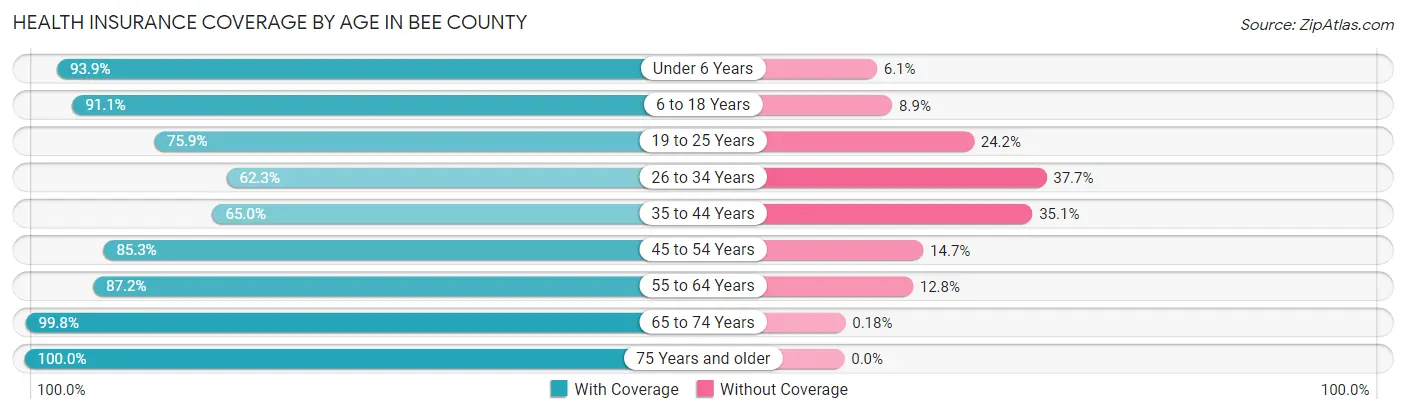
| Age Bracket | With Coverage | Without Coverage |
| Under 6 Years | 1,829 (93.9%) | 118 (6.1%) |
| 6 to 18 Years | 4,009 (91.1%) | 393 (8.9%) |
| 19 to 25 Years | 2,255 (75.8%) | 718 (24.1%) |
| 26 to 34 Years | 1,886 (62.3%) | 1,140 (37.7%) |
| 35 to 44 Years | 2,001 (64.9%) | 1,080 (35.0%) |
| 45 to 54 Years | 1,960 (85.3%) | 338 (14.7%) |
| 55 to 64 Years | 2,067 (87.2%) | 303 (12.8%) |
| 65 to 74 Years | 2,166 (99.8%) | 4 (0.2%) |
| 75 Years and older | 1,494 (100.0%) | 0 (0.0%) |
| Total | 19,667 (82.8%) | 4,094 (17.2%) |
Health Insurance Coverage by Citizenship Status in Bee County

| Citizenship Status | With Coverage | Without Coverage |
| Native Born | 1,829 (93.9%) | 118 (6.1%) |
| Foreign Born, Citizen | 4,009 (91.1%) | 393 (8.9%) |
| Foreign Born, not a Citizen | 2,255 (75.8%) | 718 (24.1%) |
Health Insurance Coverage by Household Income in Bee County
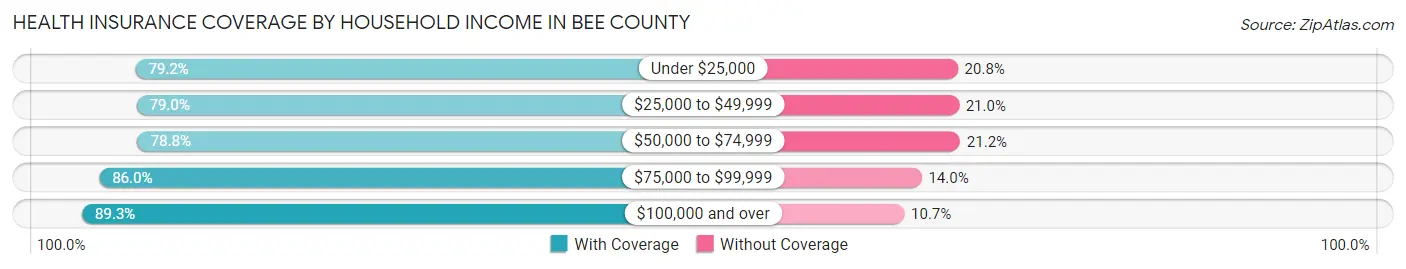
| Household Income | With Coverage | Without Coverage |
| Under $25,000 | 3,394 (79.2%) | 890 (20.8%) |
| $25,000 to $49,999 | 4,225 (79.0%) | 1,121 (21.0%) |
| $50,000 to $74,999 | 3,470 (78.8%) | 933 (21.2%) |
| $75,000 to $99,999 | 2,754 (86.0%) | 448 (14.0%) |
| $100,000 and over | 5,716 (89.3%) | 688 (10.7%) |
Public vs Private Health Insurance Coverage by Age in Bee County
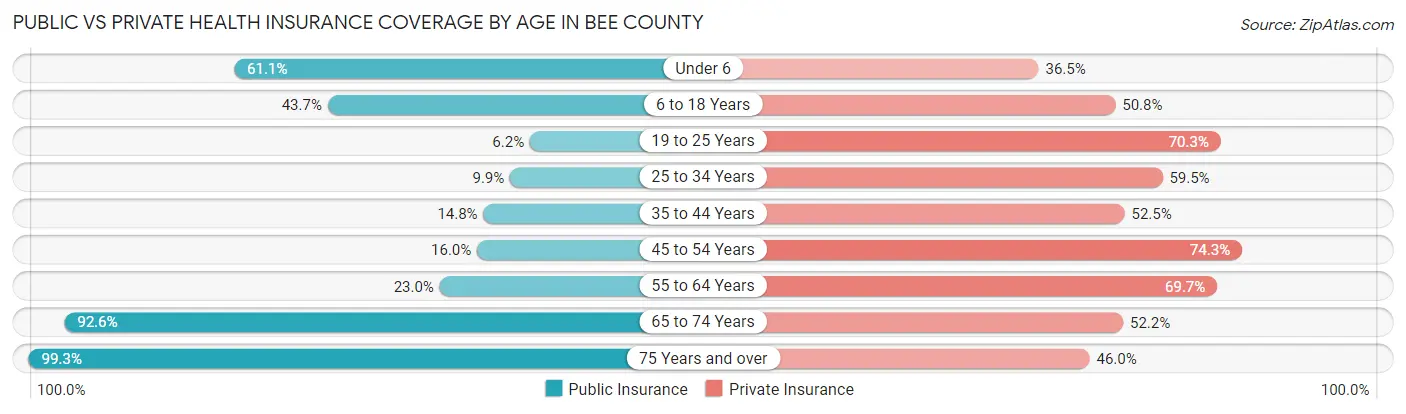
| Age Bracket | Public Insurance | Private Insurance |
| Under 6 | 1,190 (61.1%) | 711 (36.5%) |
| 6 to 18 Years | 1,925 (43.7%) | 2,235 (50.8%) |
| 19 to 25 Years | 184 (6.2%) | 2,091 (70.3%) |
| 25 to 34 Years | 299 (9.9%) | 1,801 (59.5%) |
| 35 to 44 Years | 457 (14.8%) | 1,617 (52.5%) |
| 45 to 54 Years | 368 (16.0%) | 1,707 (74.3%) |
| 55 to 64 Years | 544 (23.0%) | 1,651 (69.7%) |
| 65 to 74 Years | 2,010 (92.6%) | 1,133 (52.2%) |
| 75 Years and over | 1,483 (99.3%) | 687 (46.0%) |
| Total | 8,460 (35.6%) | 13,633 (57.4%) |
Disability Status by Sex by Age in Bee County
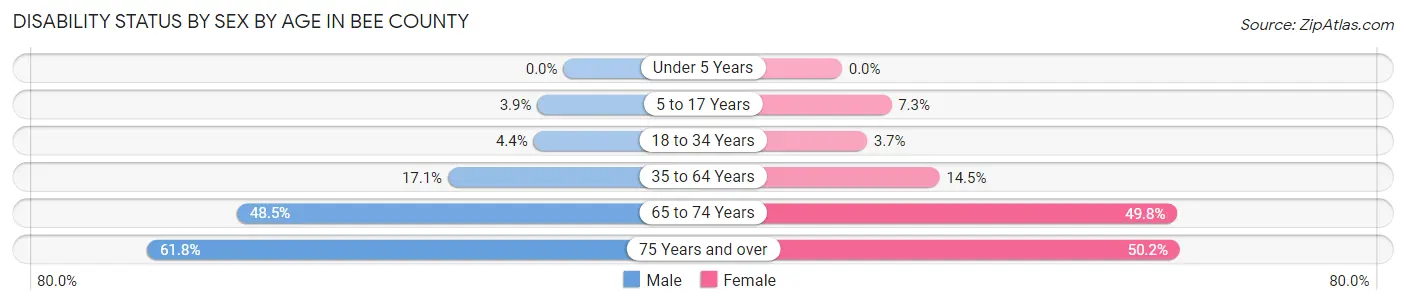
| Age Bracket | Male | Female |
| Under 5 Years | 0 (0.0%) | 0 (0.0%) |
| 5 to 17 Years | 91 (3.9%) | 167 (7.3%) |
| 18 to 34 Years | 158 (4.4%) | 95 (3.7%) |
| 35 to 64 Years | 639 (17.1%) | 582 (14.5%) |
| 65 to 74 Years | 504 (48.5%) | 563 (49.8%) |
| 75 Years and over | 395 (61.8%) | 429 (50.2%) |
Disability Class by Sex by Age in Bee County
Disability Class: Hearing Difficulty
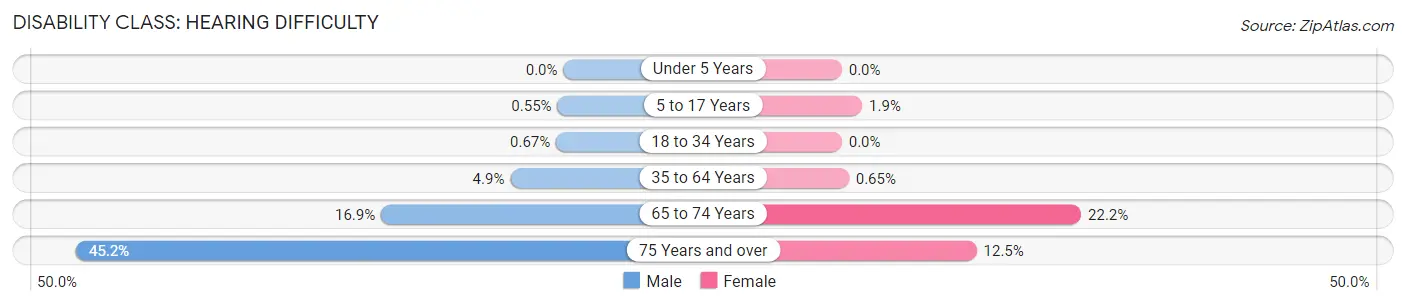
| Age Bracket | Male | Female |
| Under 5 Years | 0 (0.0%) | 0 (0.0%) |
| 5 to 17 Years | 13 (0.5%) | 43 (1.9%) |
| 18 to 34 Years | 24 (0.7%) | 0 (0.0%) |
| 35 to 64 Years | 184 (4.9%) | 26 (0.6%) |
| 65 to 74 Years | 176 (16.9%) | 251 (22.2%) |
| 75 Years and over | 289 (45.2%) | 107 (12.5%) |
Disability Class: Vision Difficulty
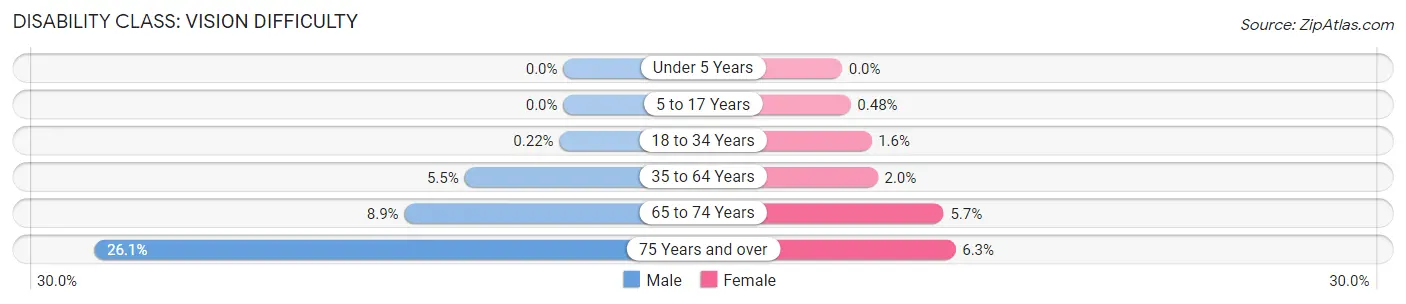
| Age Bracket | Male | Female |
| Under 5 Years | 0 (0.0%) | 0 (0.0%) |
| 5 to 17 Years | 0 (0.0%) | 11 (0.5%) |
| 18 to 34 Years | 8 (0.2%) | 42 (1.6%) |
| 35 to 64 Years | 205 (5.5%) | 80 (2.0%) |
| 65 to 74 Years | 92 (8.8%) | 64 (5.7%) |
| 75 Years and over | 167 (26.1%) | 54 (6.3%) |
Disability Class: Cognitive Difficulty
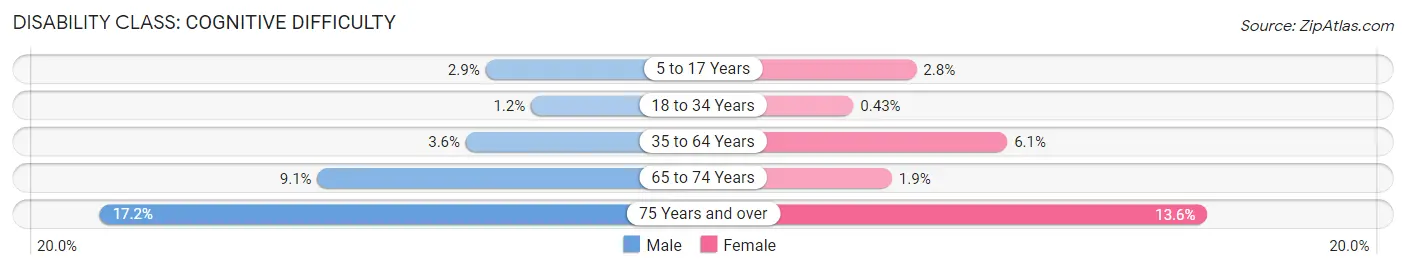
| Age Bracket | Male | Female |
| 5 to 17 Years | 68 (2.9%) | 63 (2.8%) |
| 18 to 34 Years | 43 (1.2%) | 11 (0.4%) |
| 35 to 64 Years | 135 (3.6%) | 247 (6.1%) |
| 65 to 74 Years | 95 (9.1%) | 21 (1.9%) |
| 75 Years and over | 110 (17.2%) | 116 (13.6%) |
Disability Class: Ambulatory Difficulty
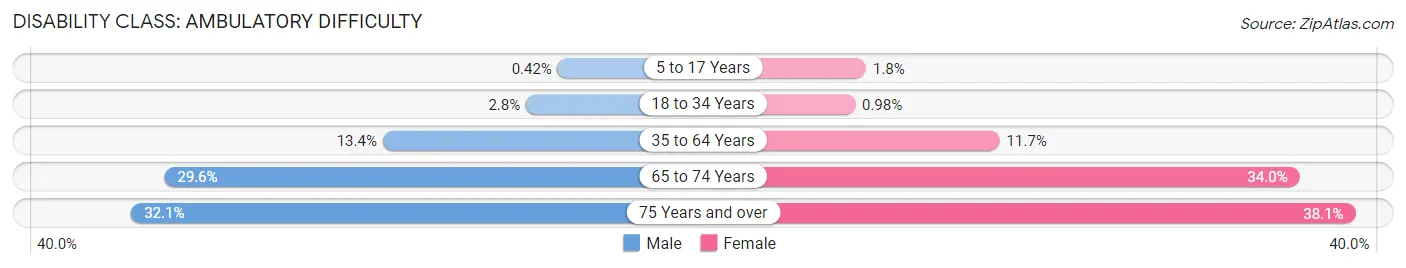
| Age Bracket | Male | Female |
| 5 to 17 Years | 10 (0.4%) | 41 (1.8%) |
| 18 to 34 Years | 99 (2.8%) | 25 (1.0%) |
| 35 to 64 Years | 500 (13.4%) | 471 (11.7%) |
| 65 to 74 Years | 308 (29.6%) | 384 (34.0%) |
| 75 Years and over | 205 (32.1%) | 326 (38.1%) |
Disability Class: Self-Care Difficulty
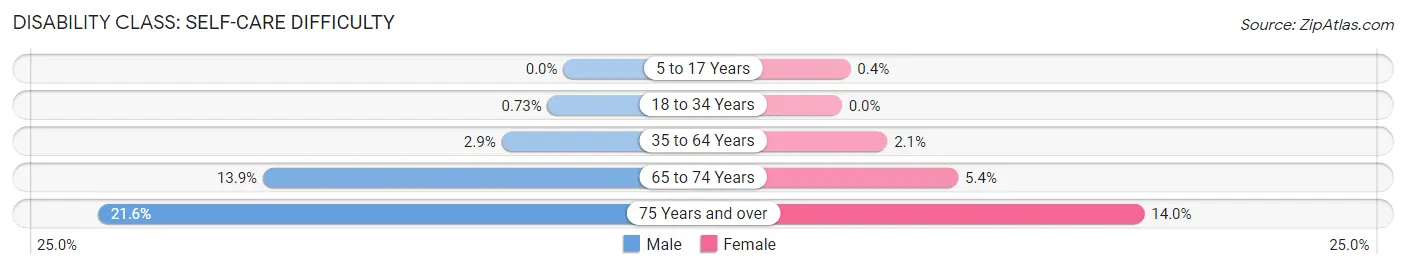
| Age Bracket | Male | Female |
| 5 to 17 Years | 0 (0.0%) | 9 (0.4%) |
| 18 to 34 Years | 26 (0.7%) | 0 (0.0%) |
| 35 to 64 Years | 107 (2.9%) | 85 (2.1%) |
| 65 to 74 Years | 145 (13.9%) | 61 (5.4%) |
| 75 Years and over | 138 (21.6%) | 120 (14.0%) |
Technology Access in Bee County
Computing Device Access in Bee County
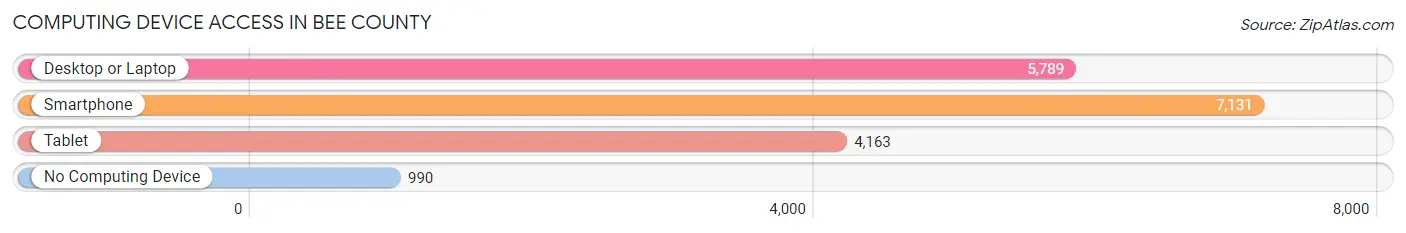
| Device Type | # Households | % Households |
| Desktop or Laptop | 5,789 | 67.6% |
| Smartphone | 7,131 | 83.3% |
| Tablet | 4,163 | 48.6% |
| No Computing Device | 990 | 11.6% |
| Total | 8,563 | 100.0% |
Internet Access in Bee County
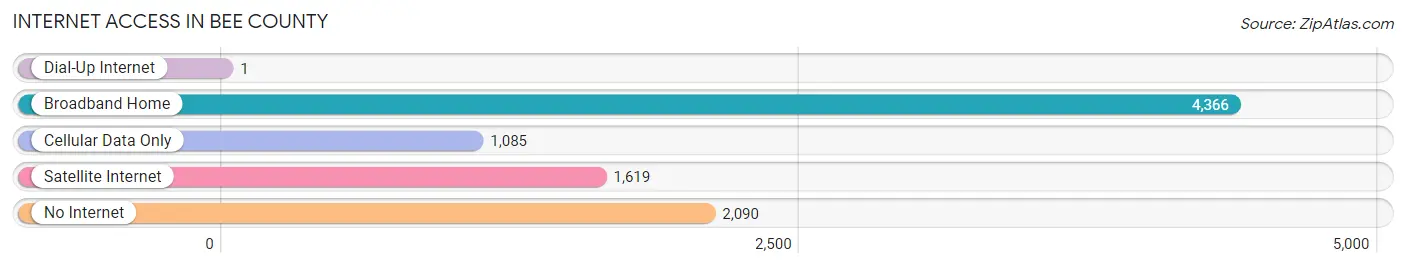
| Internet Type | # Households | % Households |
| Dial-Up Internet | 1 | 0.0% |
| Broadband Home | 4,366 | 51.0% |
| Cellular Data Only | 1,085 | 12.7% |
| Satellite Internet | 1,619 | 18.9% |
| No Internet | 2,090 | 24.4% |
| Total | 8,563 | 100.0% |
Bee County Summary
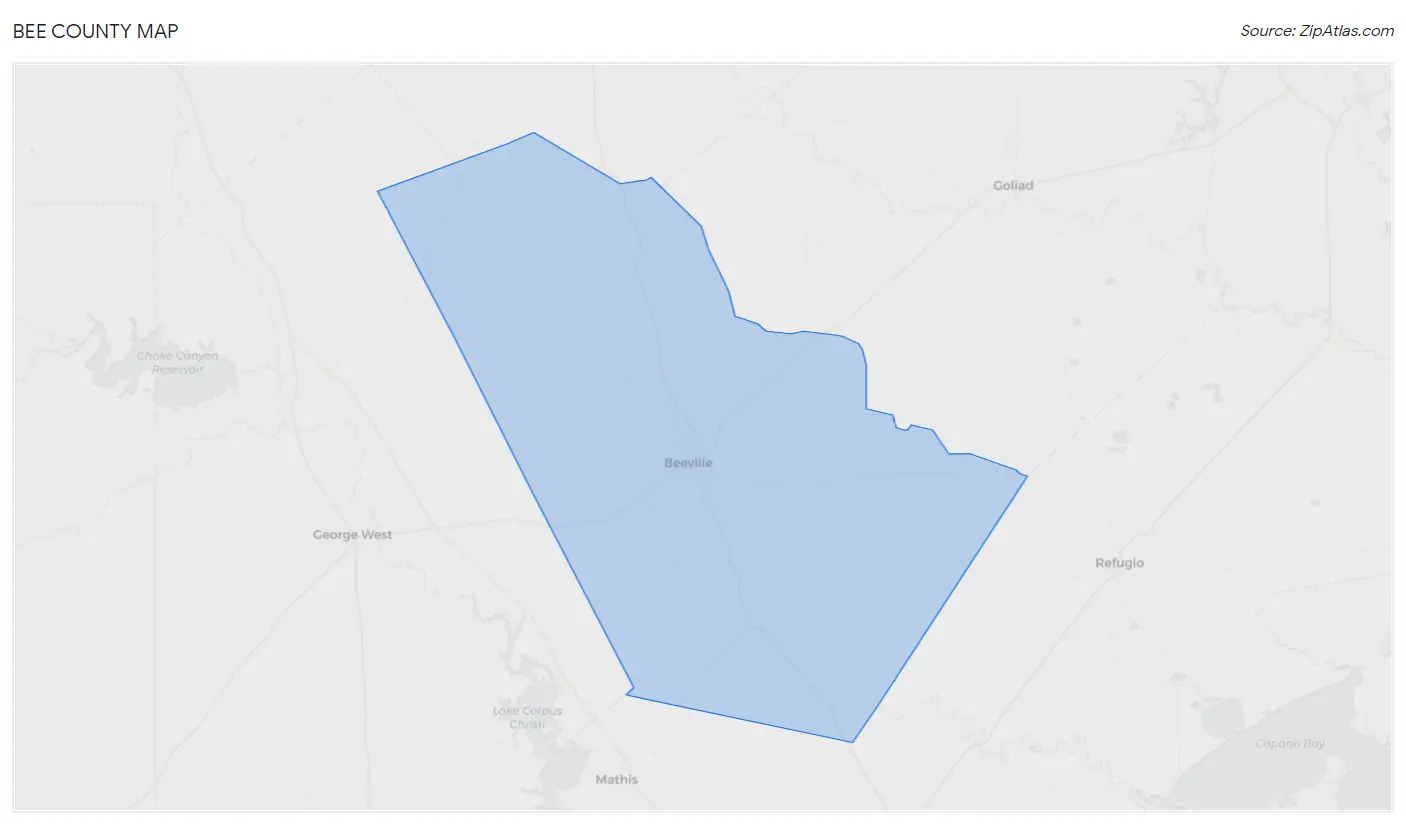
Bee County is located in the south-central region of Texas, and is part of the Coastal Bend region. It is bordered by San Patricio County to the east, Live Oak County to the north, Karnes County to the west, and Goliad County to the south. The county seat is Beeville, and the county has a total area of 890 square miles.
History
Bee County was established in 1857 from parts of Live Oak and Refugio counties. It was named for Barnard E. Bee, Sr., a Secretary of State for the Republic of Texas. The county was originally populated by Native Americans, including the Karankawa, Coahuiltecan, and Tonkawa tribes.
In the late 19th century, the county was home to a large number of German and Czech immigrants, who established several small towns in the area. The county was also home to a large number of African-American residents, many of whom were former slaves.
Geography
Bee County is located in the Coastal Plains region of Texas, and is characterized by flat to rolling terrain. The county is drained by the Nueces River, which flows through the western part of the county. The county is home to several small lakes, including Lake Corpus Christi, Lake Texana, and Lake Mathis.
The county is home to several state parks, including Choke Canyon State Park, Lake Corpus Christi State Park, and Lake Texana State Park. The county is also home to several wildlife refuges, including the Aransas National Wildlife Refuge and the San Bernard National Wildlife Refuge.
Economy
Bee County’s economy is largely based on agriculture, with cotton, corn, sorghum, and wheat being the primary crops. The county is also home to several oil and gas fields, and is a major producer of oil and natural gas.
The county is home to several manufacturing companies, including a large paper mill and a large food processing plant. The county is also home to several retail stores, including a Walmart Supercenter and several smaller stores.
Demographics
As of the 2010 census, Bee County had a population of 31,861. The racial makeup of the county was 75.3% White, 0.9% African American, 0.7% Native American, 0.4% Asian, 0.1% Pacific Islander, 20.2% from other races, and 2.4% from two or more races. Hispanic or Latino of any race were 44.2% of the population.
The median income for a household in the county was $35,945, and the median income for a family was $41,945. The per capita income for the county was $17,845. About 19.2% of families and 23.2% of the population were below the poverty line, including 33.2% of those under age 18 and 16.2% of those age 65 or over.
Common Questions
What is Per Capita Income in Bee County?
Per Capita income in Bee County is $22,347.
What is the Median Family Income in Bee County?
Median Family Income in Bee County is $66,602.
What is the Median Household income in Bee County?
Median Household Income in Bee County is $50,283.
What is Income or Wage Gap in Bee County?
Income or Wage Gap in Bee County is 34.3%.
Women in Bee County earn 65.7 cents for every dollar earned by a man.
What is Family Income Deficit in Bee County?
Family Income Deficit in Bee County is $13,264.
Families that are below poverty line in Bee County earn $13,264 less on average than the poverty threshold level.
What is Inequality or Gini Index in Bee County?
Inequality or Gini Index in Bee County is 0.49.
What is the Total Population of Bee County?
Total Population of Bee County is 30,977.
What is the Total Male Population of Bee County?
Total Male Population of Bee County is 19,218.
What is the Total Female Population of Bee County?
Total Female Population of Bee County is 11,759.
What is the Ratio of Males per 100 Females in Bee County?
There are 163.43 Males per 100 Females in Bee County.
What is the Ratio of Females per 100 Males in Bee County?
There are 61.19 Females per 100 Males in Bee County.
What is the Median Population Age in Bee County?
Median Population Age in Bee County is 35.6 Years.
What is the Average Family Size in Bee County
Average Family Size in Bee County is 3.5 People.
What is the Average Household Size in Bee County
Average Household Size in Bee County is 2.8 People.
How Large is the Labor Force in Bee County?
There are 11,095 People in the Labor Forcein in Bee County.
What is the Percentage of People in the Labor Force in Bee County?
43.5% of People are in the Labor Force in Bee County.
What is the Unemployment Rate in Bee County?
Unemployment Rate in Bee County is 6.4%.