Baylor County, TX Map & Demographics
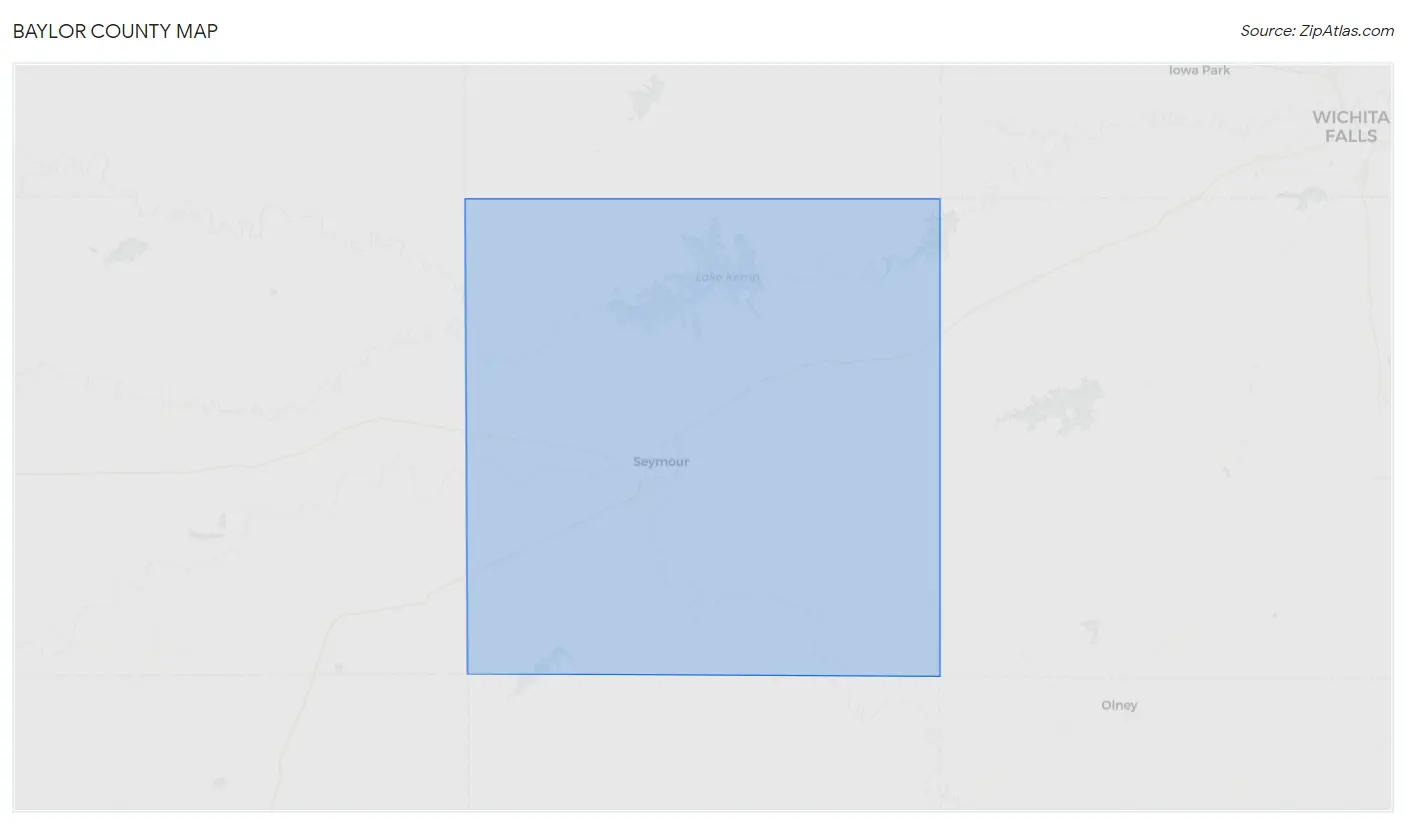
Baylor County Map
Baylor County Overview
$31,392
PER CAPITA INCOME
$73,462
AVG FAMILY INCOME
$52,716
AVG HOUSEHOLD INCOME
36.8%
WAGE / INCOME GAP [ % ]
63.2¢/ $1
WAGE / INCOME GAP [ $ ]
0.48
INEQUALITY / GINI INDEX
3,475
TOTAL POPULATION
1,738
MALE POPULATION
1,737
FEMALE POPULATION
100.06
MALES / 100 FEMALES
99.94
FEMALES / 100 MALES
46.7
MEDIAN AGE
2.9
AVG FAMILY SIZE
2.3
AVG HOUSEHOLD SIZE
1,507
LABOR FORCE [ PEOPLE ]
54.0%
PERCENT IN LABOR FORCE
1.1%
UNEMPLOYMENT RATE
Baylor County Area Codes
Income in Baylor County
Income Overview in Baylor County
Per Capita Income in Baylor County is $31,392, while median incomes of families and households are $73,462 and $52,716 respectively.
| Characteristic | Number | Measure |
| Per Capita Income | 3,475 | $31,392 |
| Median Family Income | 976 | $73,462 |
| Mean Family Income | 976 | $91,554 |
| Median Household Income | 1,477 | $52,716 |
| Mean Household Income | 1,477 | $71,186 |
| Income Deficit | 976 | $0 |
| Wage / Income Gap (%) | 3,475 | 36.81% |
| Wage / Income Gap ($) | 3,475 | 63.19¢ per $1 |
| Gini / Inequality Index | 3,475 | 0.48 |
Earnings by Sex in Baylor County
Average Earnings in Baylor County are $34,258, $45,433 for men and $28,710 for women, a difference of 36.8%.
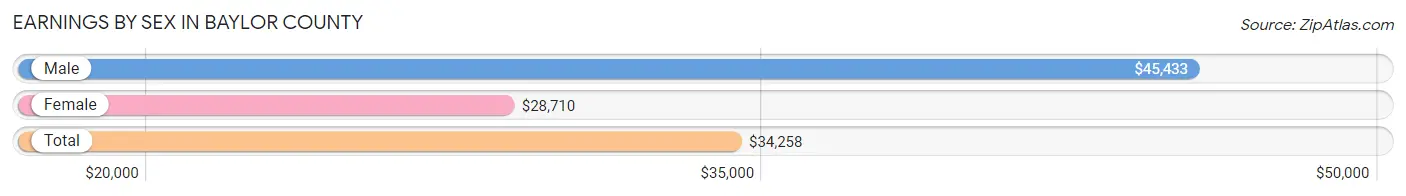
| Sex | Number | Average Earnings |
| Male | 840 (51.0%) | $45,433 |
| Female | 807 (49.0%) | $28,710 |
| Total | 1,647 (100.0%) | $34,258 |
Earnings by Sex by Income Bracket in Baylor County
The most common earnings brackets in Baylor County are $100,000+ for men (167 | 19.9%) and $40,000 to $44,999 for women (126 | 15.6%).
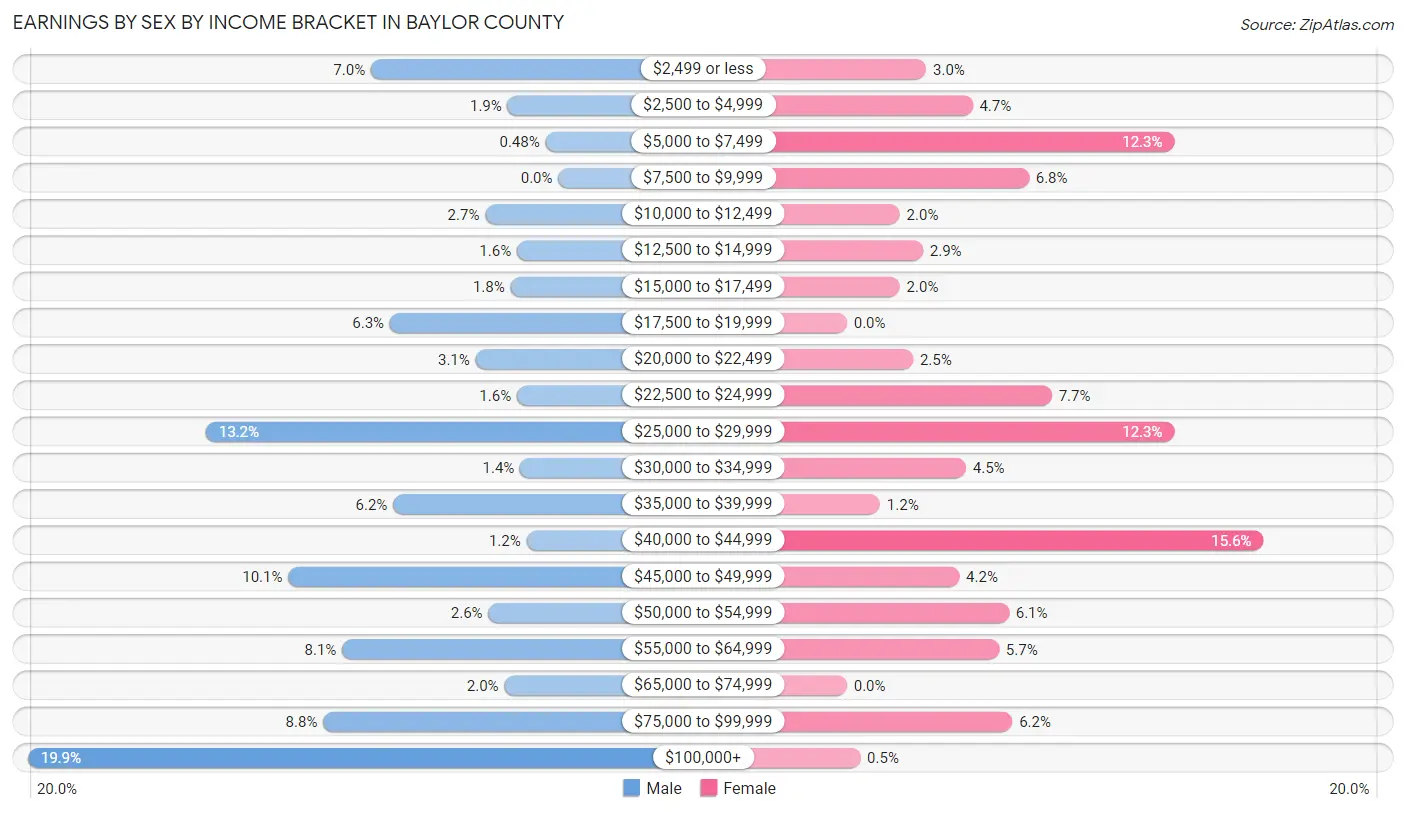
| Income | Male | Female |
| $2,499 or less | 59 (7.0%) | 24 (3.0%) |
| $2,500 to $4,999 | 16 (1.9%) | 38 (4.7%) |
| $5,000 to $7,499 | 4 (0.5%) | 99 (12.3%) |
| $7,500 to $9,999 | 0 (0.0%) | 55 (6.8%) |
| $10,000 to $12,499 | 23 (2.7%) | 16 (2.0%) |
| $12,500 to $14,999 | 13 (1.5%) | 23 (2.9%) |
| $15,000 to $17,499 | 15 (1.8%) | 16 (2.0%) |
| $17,500 to $19,999 | 53 (6.3%) | 0 (0.0%) |
| $20,000 to $22,499 | 26 (3.1%) | 20 (2.5%) |
| $22,500 to $24,999 | 13 (1.5%) | 62 (7.7%) |
| $25,000 to $29,999 | 111 (13.2%) | 99 (12.3%) |
| $30,000 to $34,999 | 12 (1.4%) | 36 (4.5%) |
| $35,000 to $39,999 | 52 (6.2%) | 10 (1.2%) |
| $40,000 to $44,999 | 10 (1.2%) | 126 (15.6%) |
| $45,000 to $49,999 | 85 (10.1%) | 34 (4.2%) |
| $50,000 to $54,999 | 22 (2.6%) | 49 (6.1%) |
| $55,000 to $64,999 | 68 (8.1%) | 46 (5.7%) |
| $65,000 to $74,999 | 17 (2.0%) | 0 (0.0%) |
| $75,000 to $99,999 | 74 (8.8%) | 50 (6.2%) |
| $100,000+ | 167 (19.9%) | 4 (0.5%) |
| Total | 840 (100.0%) | 807 (100.0%) |
Earnings by Sex by Educational Attainment in Baylor County
Average earnings in Baylor County are $49,875 for men and $29,774 for women, a difference of 40.3%. Men with an educational attainment of bachelor's degree enjoy the highest average annual earnings of $170,565, while those with college or associate's degree education earn the least with $35,368. Women with an educational attainment of bachelor's degree earn the most with the average annual earnings of $60,000, while those with college or associate's degree education have the smallest earnings of $27,699.
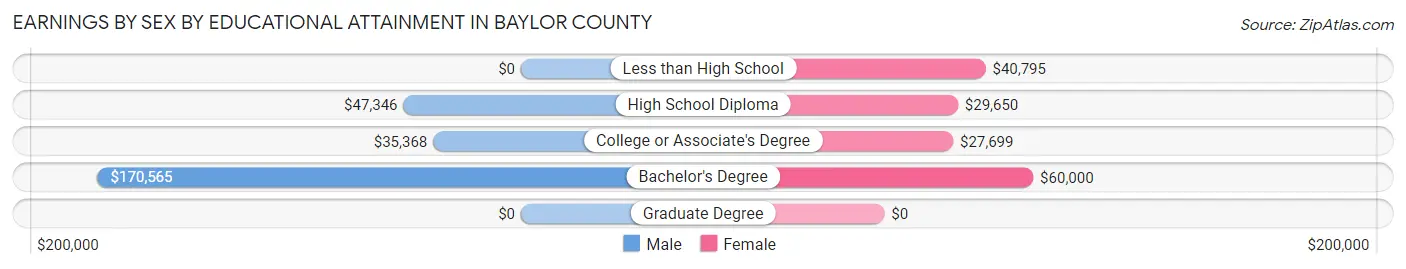
| Educational Attainment | Male Income | Female Income |
| Less than High School | - | - |
| High School Diploma | $47,346 | $29,650 |
| College or Associate's Degree | $35,368 | $27,699 |
| Bachelor's Degree | $170,565 | $60,000 |
| Graduate Degree | - | - |
| Total | $49,875 | $29,774 |
Family Income in Baylor County
Family Income Brackets in Baylor County
According to the Baylor County family income data, there are 218 families falling into the $50,000 to $74,999 income range, which is the most common income bracket and makes up 22.3% of all families. Conversely, the $10,000 to $14,999 income bracket is the least frequent group with only 14 families (1.4%) belonging to this category.
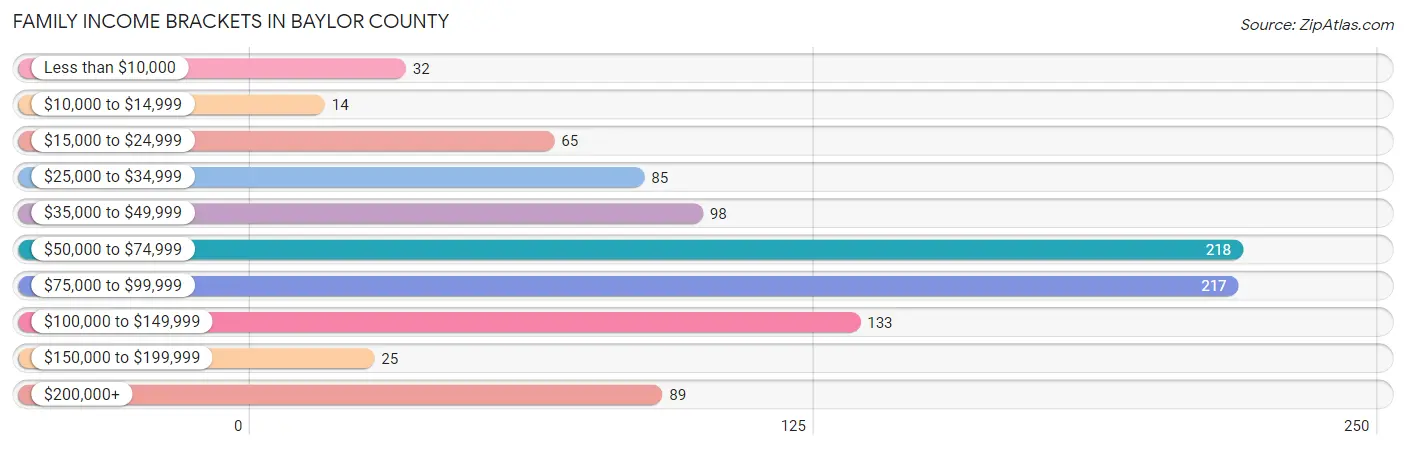
| Income Bracket | # Families | % Families |
| Less than $10,000 | 32 | 3.3% |
| $10,000 to $14,999 | 14 | 1.4% |
| $15,000 to $24,999 | 65 | 6.7% |
| $25,000 to $34,999 | 85 | 8.7% |
| $35,000 to $49,999 | 98 | 10.0% |
| $50,000 to $74,999 | 218 | 22.3% |
| $75,000 to $99,999 | 217 | 22.2% |
| $100,000 to $149,999 | 133 | 13.6% |
| $150,000 to $199,999 | 25 | 2.6% |
| $200,000+ | 89 | 9.1% |
Family Income by Famaliy Size in Baylor County
4-person families (182 | 18.6%) account for the highest median family income in Baylor County with $88,818 per family, while 2-person families (598 | 61.3%) have the highest median income of $32,614 per family member.
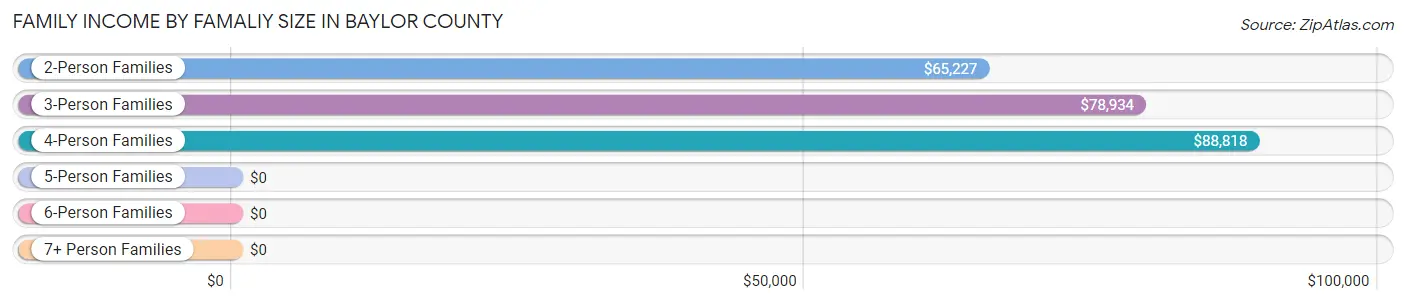
| Income Bracket | # Families | Median Income |
| 2-Person Families | 598 (61.3%) | $65,227 |
| 3-Person Families | 161 (16.5%) | $78,934 |
| 4-Person Families | 182 (18.6%) | $88,818 |
| 5-Person Families | 22 (2.2%) | $0 |
| 6-Person Families | 13 (1.3%) | $0 |
| 7+ Person Families | 0 (0.0%) | $0 |
| Total | 976 (100.0%) | $73,462 |
Family Income by Number of Earners in Baylor County
The median family income in Baylor County is $73,462, with families comprising 3+ earners (88) having the highest median family income of $143,603, while families with no earners (177) have the lowest median family income of $39,338, accounting for 9.0% and 18.1% of families, respectively.
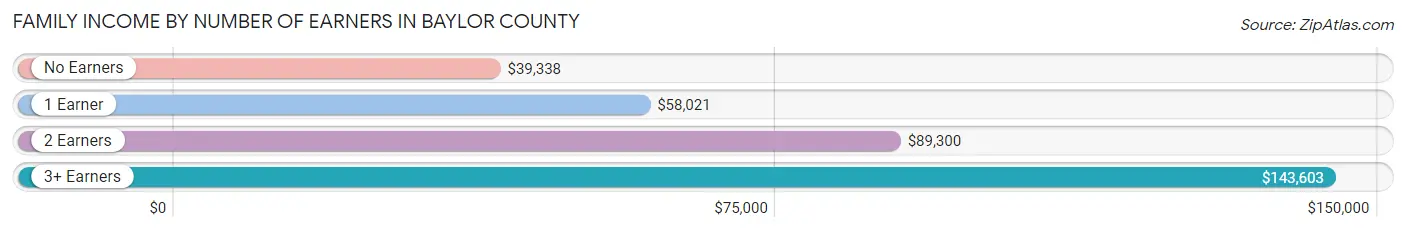
| Number of Earners | # Families | Median Income |
| No Earners | 177 (18.1%) | $39,338 |
| 1 Earner | 323 (33.1%) | $58,021 |
| 2 Earners | 388 (39.8%) | $89,300 |
| 3+ Earners | 88 (9.0%) | $143,603 |
| Total | 976 (100.0%) | $73,462 |
Household Income in Baylor County
Household Income Brackets in Baylor County
With 239 households falling in the category, the $50,000 to $74,999 income range is the most frequent in Baylor County, accounting for 16.2% of all households. In contrast, only 25 households (1.7%) fall into the $150,000 to $199,999 income bracket, making it the least populous group.
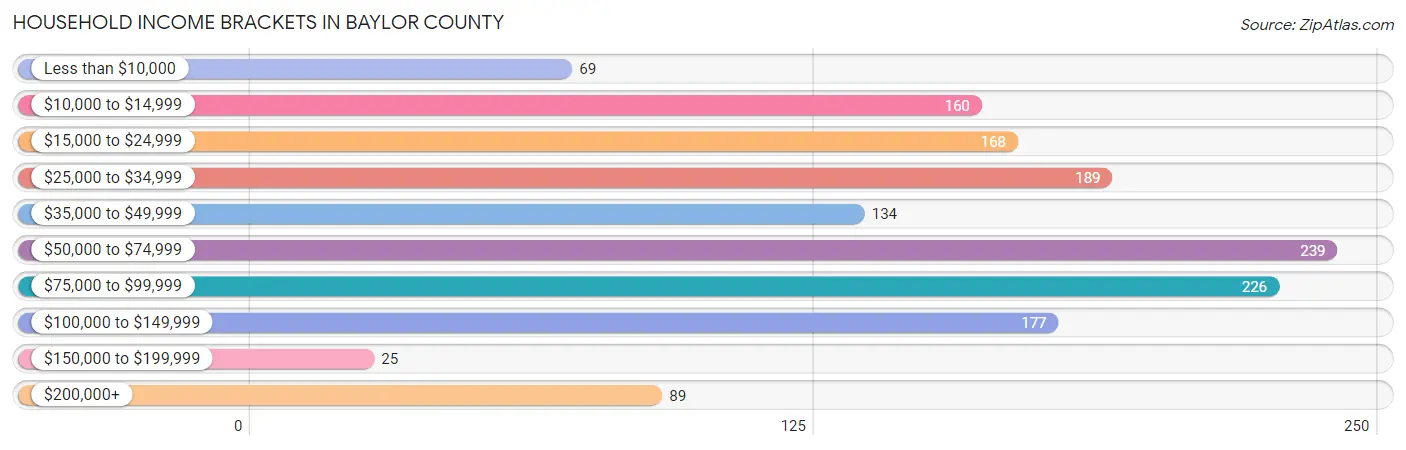
| Income Bracket | # Households | % Households |
| Less than $10,000 | 69 | 4.7% |
| $10,000 to $14,999 | 160 | 10.8% |
| $15,000 to $24,999 | 168 | 11.4% |
| $25,000 to $34,999 | 189 | 12.8% |
| $35,000 to $49,999 | 134 | 9.1% |
| $50,000 to $74,999 | 239 | 16.2% |
| $75,000 to $99,999 | 226 | 15.3% |
| $100,000 to $149,999 | 177 | 12.0% |
| $150,000 to $199,999 | 25 | 1.7% |
| $200,000+ | 89 | 6.0% |
Household Income by Householder Age in Baylor County
The median household income in Baylor County is $52,716, with the highest median household income of $73,050 found in the 45 to 64 years age bracket for the primary householder. A total of 539 households (36.5%) fall into this category. Meanwhile, the 15 to 24 years age bracket for the primary householder has the lowest median household income of $26,467, with 91 households (6.2%) in this group.
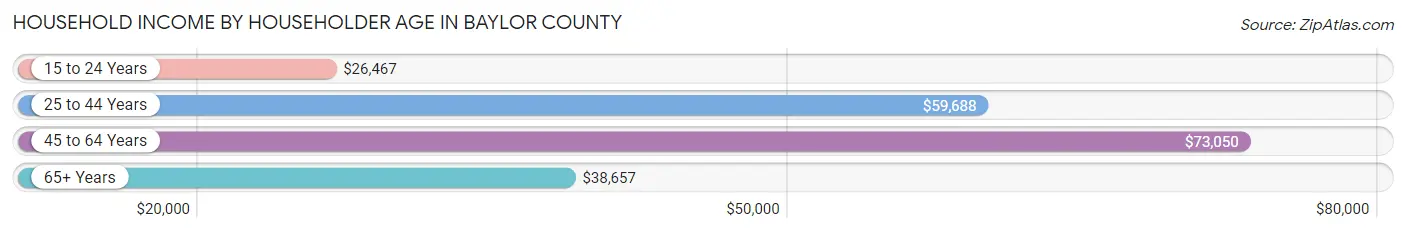
| Income Bracket | # Households | Median Income |
| 15 to 24 Years | 91 (6.2%) | $26,467 |
| 25 to 44 Years | 350 (23.7%) | $59,688 |
| 45 to 64 Years | 539 (36.5%) | $73,050 |
| 65+ Years | 497 (33.7%) | $38,657 |
| Total | 1,477 (100.0%) | $52,716 |
Poverty in Baylor County
Income Below Poverty by Sex and Age in Baylor County
With 9.9% poverty level for males and 13.5% for females among the residents of Baylor County, 65 to 74 year old males and 55 to 64 year old females are the most vulnerable to poverty, with 53 males (22.8%) and 126 females (39.1%) in their respective age groups living below the poverty level.
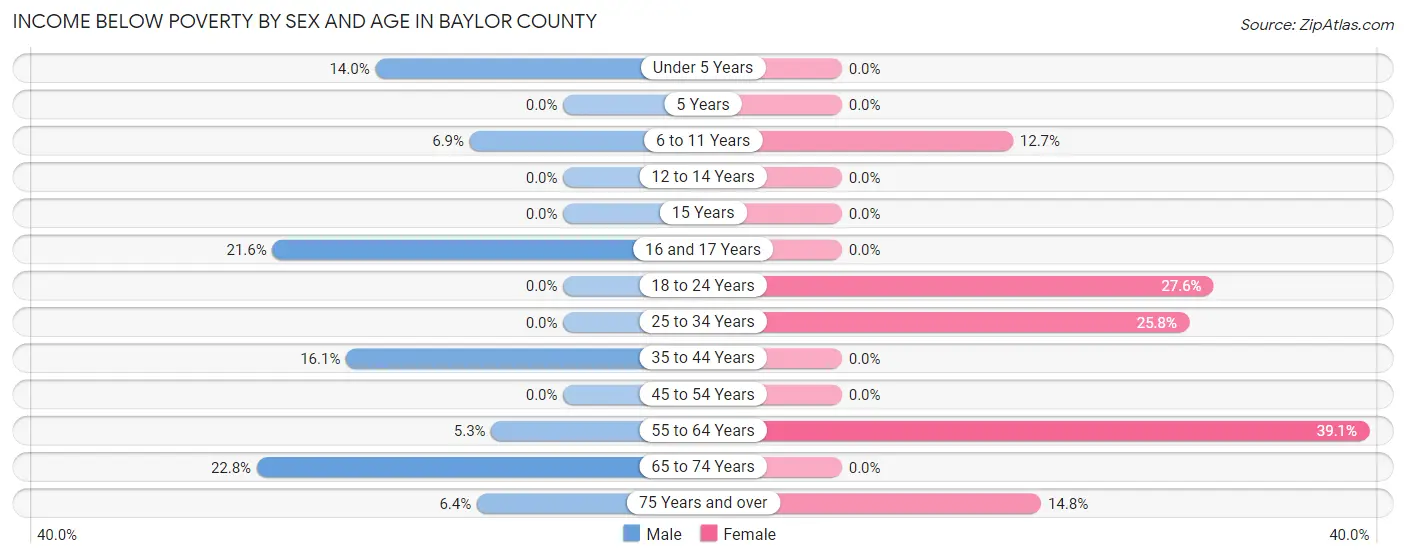
| Age Bracket | Male | Female |
| Under 5 Years | 18 (14.0%) | 0 (0.0%) |
| 5 Years | 0 (0.0%) | 0 (0.0%) |
| 6 to 11 Years | 17 (6.9%) | 8 (12.7%) |
| 12 to 14 Years | 0 (0.0%) | 0 (0.0%) |
| 15 Years | 0 (0.0%) | 0 (0.0%) |
| 16 and 17 Years | 19 (21.6%) | 0 (0.0%) |
| 18 to 24 Years | 0 (0.0%) | 32 (27.6%) |
| 25 to 34 Years | 0 (0.0%) | 34 (25.8%) |
| 35 to 44 Years | 39 (16.1%) | 0 (0.0%) |
| 45 to 54 Years | 0 (0.0%) | 0 (0.0%) |
| 55 to 64 Years | 14 (5.3%) | 126 (39.1%) |
| 65 to 74 Years | 53 (22.8%) | 0 (0.0%) |
| 75 Years and over | 10 (6.4%) | 25 (14.8%) |
| Total | 170 (9.9%) | 225 (13.5%) |
Income Above Poverty by Sex and Age in Baylor County
According to the poverty statistics in Baylor County, males aged 5 years and females aged under 5 years are the age groups that are most secure financially, with 100.0% of males and 100.0% of females in these age groups living above the poverty line.
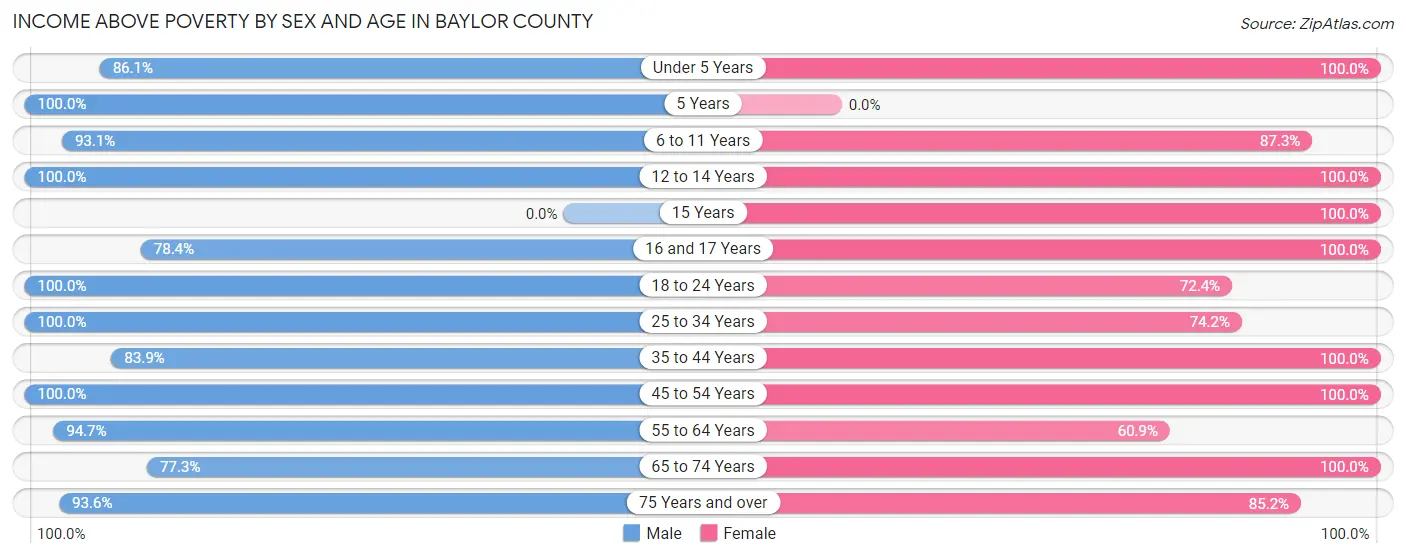
| Age Bracket | Male | Female |
| Under 5 Years | 111 (86.1%) | 33 (100.0%) |
| 5 Years | 11 (100.0%) | 0 (0.0%) |
| 6 to 11 Years | 228 (93.1%) | 55 (87.3%) |
| 12 to 14 Years | 44 (100.0%) | 141 (100.0%) |
| 15 Years | 0 (0.0%) | 18 (100.0%) |
| 16 and 17 Years | 69 (78.4%) | 45 (100.0%) |
| 18 to 24 Years | 74 (100.0%) | 84 (72.4%) |
| 25 to 34 Years | 95 (100.0%) | 98 (74.2%) |
| 35 to 44 Years | 203 (83.9%) | 211 (100.0%) |
| 45 to 54 Years | 146 (100.0%) | 222 (100.0%) |
| 55 to 64 Years | 248 (94.7%) | 196 (60.9%) |
| 65 to 74 Years | 180 (77.2%) | 199 (100.0%) |
| 75 Years and over | 146 (93.6%) | 144 (85.2%) |
| Total | 1,555 (90.1%) | 1,446 (86.5%) |
Income Below Poverty Among Married-Couple Families in Baylor County
The poverty statistics for married-couple families in Baylor County show that 2.0% or 17 of the total 861 families live below the poverty line. Families with no children have the highest poverty rate of 3.0%, comprising of 17 families. On the other hand, families with 1 or 2 children have the lowest poverty rate of 0.0%, which includes 0 families.
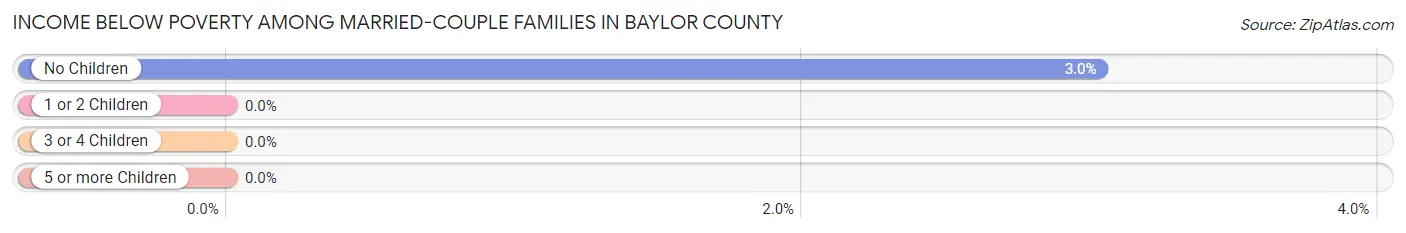
| Children | Above Poverty | Below Poverty |
| No Children | 544 (97.0%) | 17 (3.0%) |
| 1 or 2 Children | 265 (100.0%) | 0 (0.0%) |
| 3 or 4 Children | 35 (100.0%) | 0 (0.0%) |
| 5 or more Children | 0 (0.0%) | 0 (0.0%) |
| Total | 844 (98.0%) | 17 (2.0%) |
Income Below Poverty Among Single-Parent Households in Baylor County
According to the poverty data in Baylor County, 46.2% or 6 single-father households and 51.0% or 52 single-mother households are living below the poverty line. Among single-father households, those with no children have the highest poverty rate, with 6 households (46.2%) experiencing poverty. Likewise, among single-mother households, those with 1 or 2 children have the highest poverty rate, with 52 households (67.5%) falling below the poverty line.
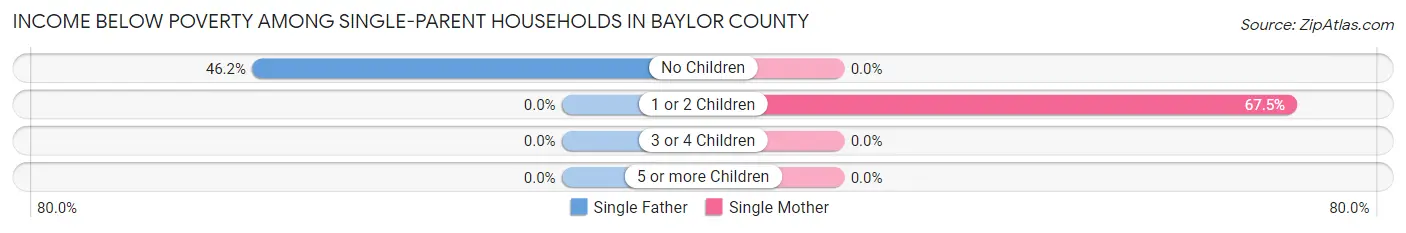
| Children | Single Father | Single Mother |
| No Children | 6 (46.2%) | 0 (0.0%) |
| 1 or 2 Children | 0 (0.0%) | 52 (67.5%) |
| 3 or 4 Children | 0 (0.0%) | 0 (0.0%) |
| 5 or more Children | 0 (0.0%) | 0 (0.0%) |
| Total | 6 (46.2%) | 52 (51.0%) |
Income Below Poverty Among Married-Couple vs Single-Parent Households in Baylor County
The poverty data for Baylor County shows that 17 of the married-couple family households (2.0%) and 58 of the single-parent households (50.4%) are living below the poverty level. Within the married-couple family households, those with no children have the highest poverty rate, with 17 households (3.0%) falling below the poverty line. Among the single-parent households, those with 1 or 2 children have the highest poverty rate, with 52 household (67.5%) living below poverty.
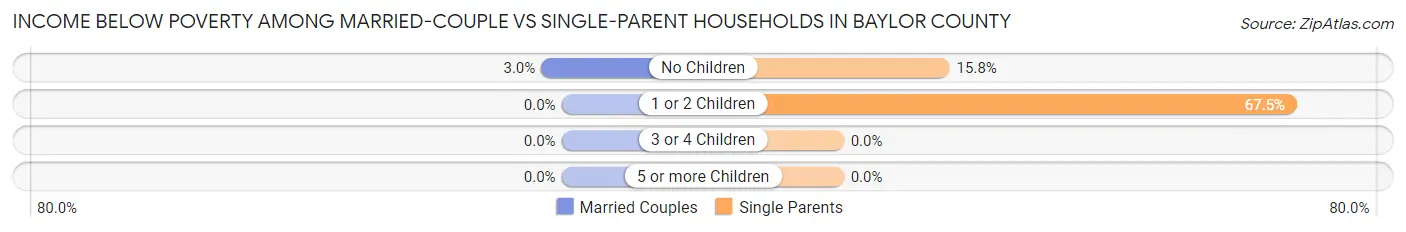
| Children | Married-Couple Families | Single-Parent Households |
| No Children | 17 (3.0%) | 6 (15.8%) |
| 1 or 2 Children | 0 (0.0%) | 52 (67.5%) |
| 3 or 4 Children | 0 (0.0%) | 0 (0.0%) |
| 5 or more Children | 0 (0.0%) | 0 (0.0%) |
| Total | 17 (2.0%) | 58 (50.4%) |
Race in Baylor County
The most populous races in Baylor County are White / Caucasian (3,071 | 88.4%), Hispanic or Latino (390 | 11.2%), and Two or more Races (252 | 7.2%).
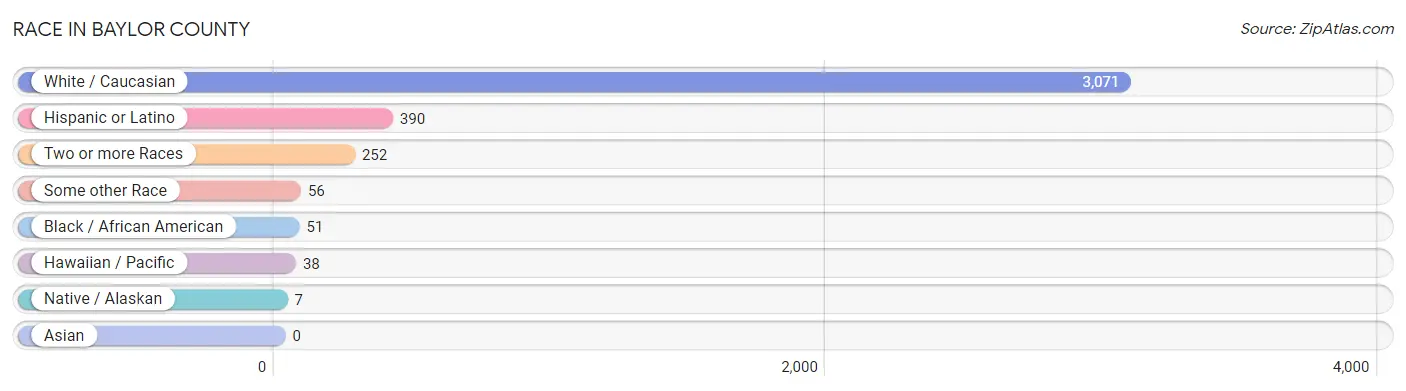
| Race | # Population | % Population |
| Asian | 0 | 0.0% |
| Black / African American | 51 | 1.5% |
| Hawaiian / Pacific | 38 | 1.1% |
| Hispanic or Latino | 390 | 11.2% |
| Native / Alaskan | 7 | 0.2% |
| White / Caucasian | 3,071 | 88.4% |
| Two or more Races | 252 | 7.2% |
| Some other Race | 56 | 1.6% |
| Total | 3,475 | 100.0% |
Ancestry in Baylor County
The most populous ancestries reported in Baylor County are German (547 | 15.7%), English (400 | 11.5%), Mexican (338 | 9.7%), Irish (284 | 8.2%), and Czech (236 | 6.8%), together accounting for 51.9% of all Baylor County residents.
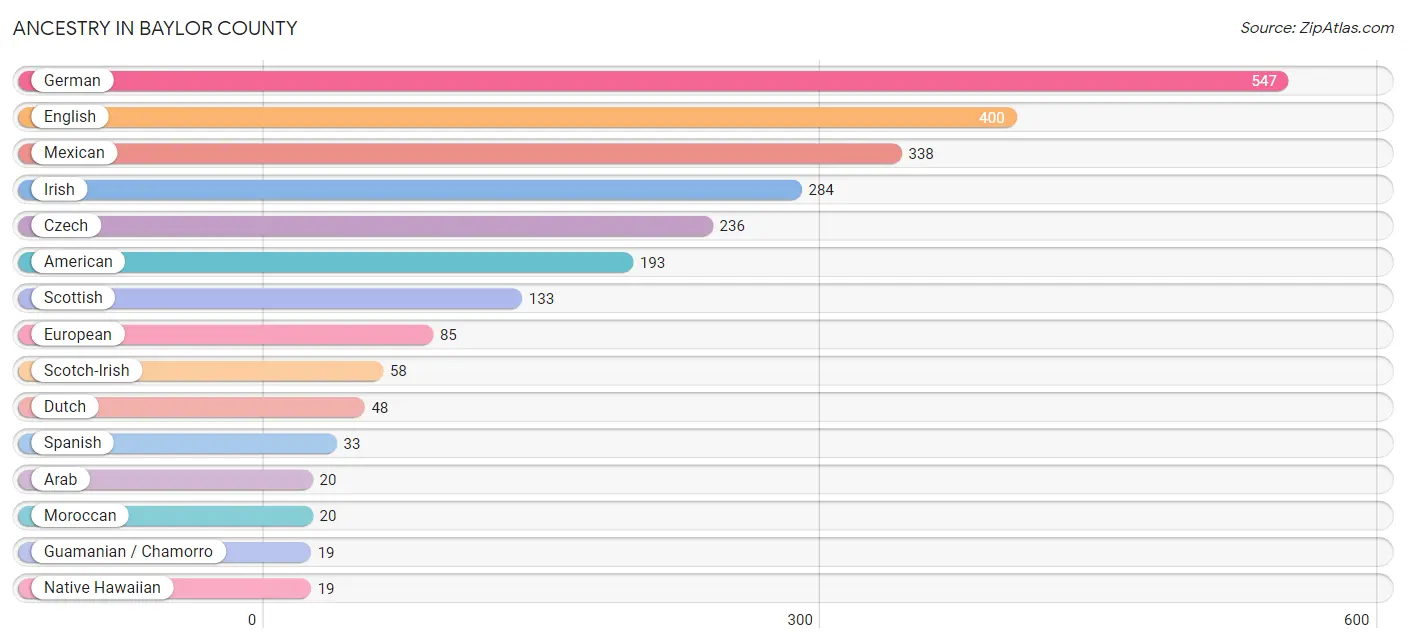
| Ancestry | # Population | % Population |
| American | 193 | 5.6% |
| Arab | 20 | 0.6% |
| Australian | 13 | 0.4% |
| Chickasaw | 4 | 0.1% |
| Choctaw | 3 | 0.1% |
| Czech | 236 | 6.8% |
| Dutch | 48 | 1.4% |
| English | 400 | 11.5% |
| European | 85 | 2.5% |
| French | 4 | 0.1% |
| German | 547 | 15.7% |
| Guamanian / Chamorro | 19 | 0.5% |
| Irish | 284 | 8.2% |
| Italian | 11 | 0.3% |
| Mexican | 338 | 9.7% |
| Moroccan | 20 | 0.6% |
| Native Hawaiian | 19 | 0.5% |
| Polish | 16 | 0.5% |
| Scandinavian | 16 | 0.5% |
| Scotch-Irish | 58 | 1.7% |
| Scottish | 133 | 3.8% |
| Sioux | 4 | 0.1% |
| Spaniard | 5 | 0.1% |
| Spanish | 33 | 0.9% | View All 24 Rows |
Immigrants in Baylor County
The most numerous immigrant groups reported in Baylor County came from Central America (50 | 1.4%), Latin America (50 | 1.4%), Mexico (50 | 1.4%), Europe (24 | 0.7%), and Germany (24 | 0.7%), together accounting for 5.7% of all Baylor County residents.
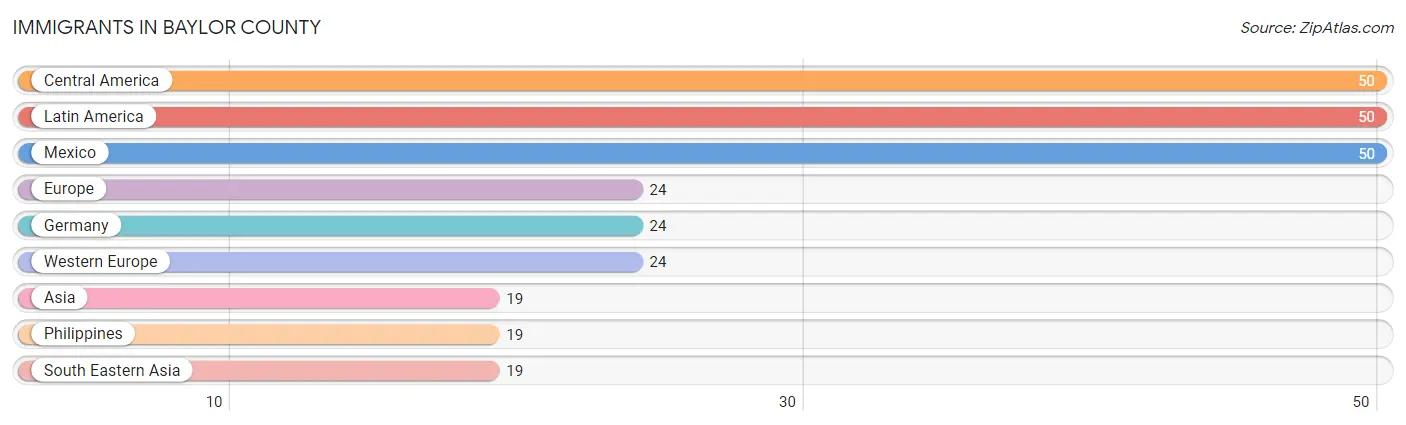
| Immigration Origin | # Population | % Population |
| Asia | 19 | 0.5% |
| Central America | 50 | 1.4% |
| Europe | 24 | 0.7% |
| Germany | 24 | 0.7% |
| Latin America | 50 | 1.4% |
| Mexico | 50 | 1.4% |
| Philippines | 19 | 0.5% |
| South Eastern Asia | 19 | 0.5% |
| Western Europe | 24 | 0.7% | View All 9 Rows |
Sex and Age in Baylor County
Sex and Age in Baylor County
The most populous age groups in Baylor County are 55 to 59 Years (157 | 9.0%) for men and 55 to 59 Years (177 | 10.2%) for women.

| Age Bracket | Male | Female |
| Under 5 Years | 129 (7.4%) | 33 (1.9%) |
| 5 to 9 Years | 148 (8.5%) | 63 (3.6%) |
| 10 to 14 Years | 152 (8.7%) | 141 (8.1%) |
| 15 to 19 Years | 111 (6.4%) | 63 (3.6%) |
| 20 to 24 Years | 51 (2.9%) | 116 (6.7%) |
| 25 to 29 Years | 45 (2.6%) | 53 (3.0%) |
| 30 to 34 Years | 50 (2.9%) | 79 (4.5%) |
| 35 to 39 Years | 125 (7.2%) | 140 (8.1%) |
| 40 to 44 Years | 117 (6.7%) | 74 (4.3%) |
| 45 to 49 Years | 73 (4.2%) | 110 (6.3%) |
| 50 to 54 Years | 73 (4.2%) | 112 (6.5%) |
| 55 to 59 Years | 157 (9.0%) | 177 (10.2%) |
| 60 to 64 Years | 105 (6.0%) | 149 (8.6%) |
| 65 to 69 Years | 138 (7.9%) | 150 (8.6%) |
| 70 to 74 Years | 99 (5.7%) | 56 (3.2%) |
| 75 to 79 Years | 69 (4.0%) | 103 (5.9%) |
| 80 to 84 Years | 77 (4.4%) | 45 (2.6%) |
| 85 Years and over | 19 (1.1%) | 73 (4.2%) |
| Total | 1,738 (100.0%) | 1,737 (100.0%) |
Families and Households in Baylor County
Median Family Size in Baylor County
The median family size in Baylor County is 2.86 persons per family, with single male/father families (13 | 1.3%) accounting for the largest median family size of 2.92 persons per family. On the other hand, single female/mother families (102 | 10.4%) represent the smallest median family size with 2.49 persons per family.

| Family Type | # Families | Family Size |
| Married-Couple | 861 (88.2%) | 2.91 |
| Single Male/Father | 13 (1.3%) | 2.92 |
| Single Female/Mother | 102 (10.4%) | 2.49 |
| Total Families | 976 (100.0%) | 2.86 |
Median Household Size in Baylor County
The median household size in Baylor County is 2.30 persons per household, with single male/father households (13 | 0.9%) accounting for the largest median household size of 2.92 persons per household. non-family households (501 | 33.9%) represent the smallest median household size with 1.14 persons per household.

| Household Type | # Households | Household Size |
| Married-Couple | 861 (58.3%) | 2.91 |
| Single Male/Father | 13 (0.9%) | 2.92 |
| Single Female/Mother | 102 (6.9%) | 2.80 |
| Non-family | 501 (33.9%) | 1.14 |
| Total Households | 1,477 (100.0%) | 2.30 |
Household Size by Marriage Status in Baylor County
Out of a total of 1,477 households in Baylor County, 976 (66.1%) are family households, while 501 (33.9%) are nonfamily households. The most numerous type of family households are 2-person households, comprising 566, and the most common type of nonfamily households are 1-person households, comprising 464.
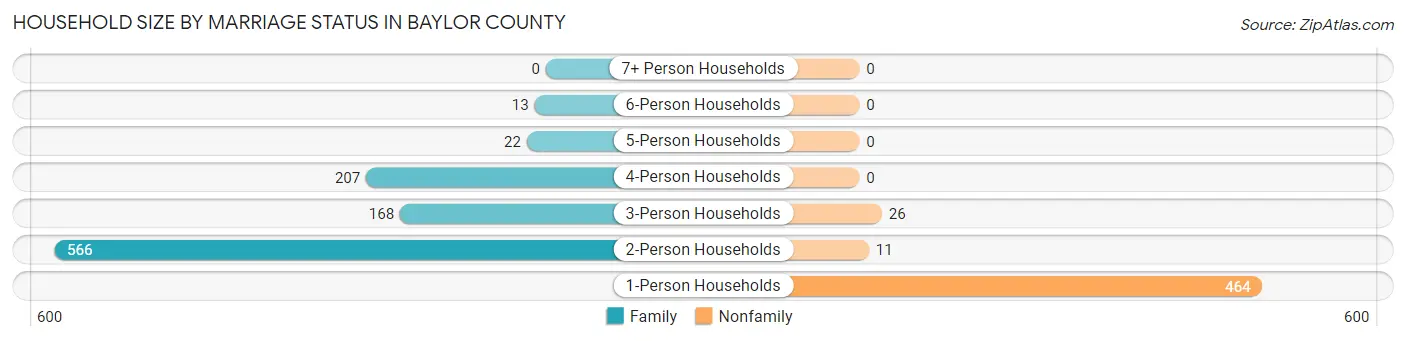
| Household Size | Family Households | Nonfamily Households |
| 1-Person Households | - | 464 (31.4%) |
| 2-Person Households | 566 (38.3%) | 11 (0.7%) |
| 3-Person Households | 168 (11.4%) | 26 (1.8%) |
| 4-Person Households | 207 (14.0%) | 0 (0.0%) |
| 5-Person Households | 22 (1.5%) | 0 (0.0%) |
| 6-Person Households | 13 (0.9%) | 0 (0.0%) |
| 7+ Person Households | 0 (0.0%) | 0 (0.0%) |
| Total | 976 (66.1%) | 501 (33.9%) |
Female Fertility in Baylor County
Fertility by Age in Baylor County
Average fertility rate in Baylor County is 31.0 births per 1,000 women. Women in the age bracket of 20 to 34 years have the highest fertility rate with 81.0 births per 1,000 women. Women in the age bracket of 20 to 34 years acount for 100.0% of all women with births.
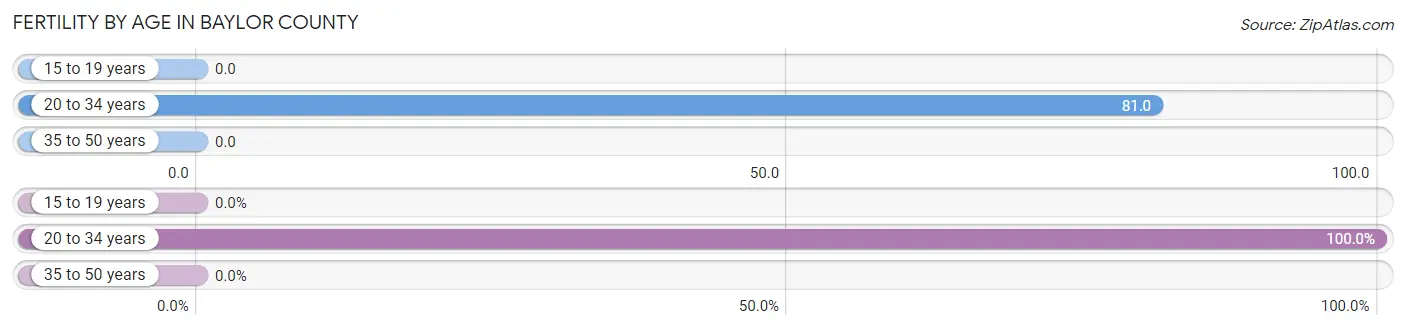
| Age Bracket | Women with Births | Births / 1,000 Women |
| 15 to 19 years | 0 (0.0%) | 0.0 |
| 20 to 34 years | 20 (100.0%) | 81.0 |
| 35 to 50 years | 0 (0.0%) | 0.0 |
| Total | 20 (100.0%) | 31.0 |
Fertility by Age by Marriage Status in Baylor County
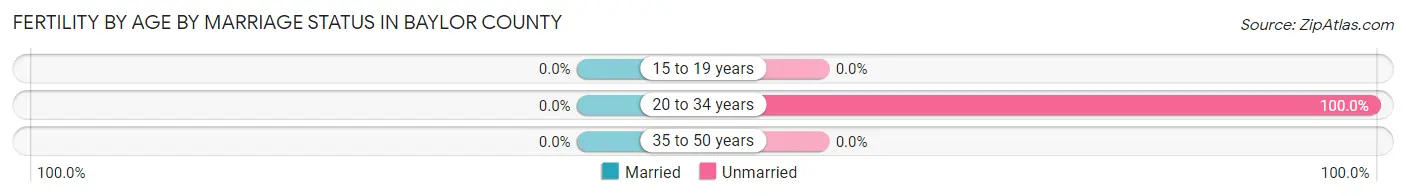
| Age Bracket | Married | Unmarried |
| 15 to 19 years | 0 (0.0%) | 0 (0.0%) |
| 20 to 34 years | 0 (0.0%) | 20 (100.0%) |
| 35 to 50 years | 0 (0.0%) | 0 (0.0%) |
| Total | 0 (0.0%) | 20 (100.0%) |
Fertility by Education in Baylor County
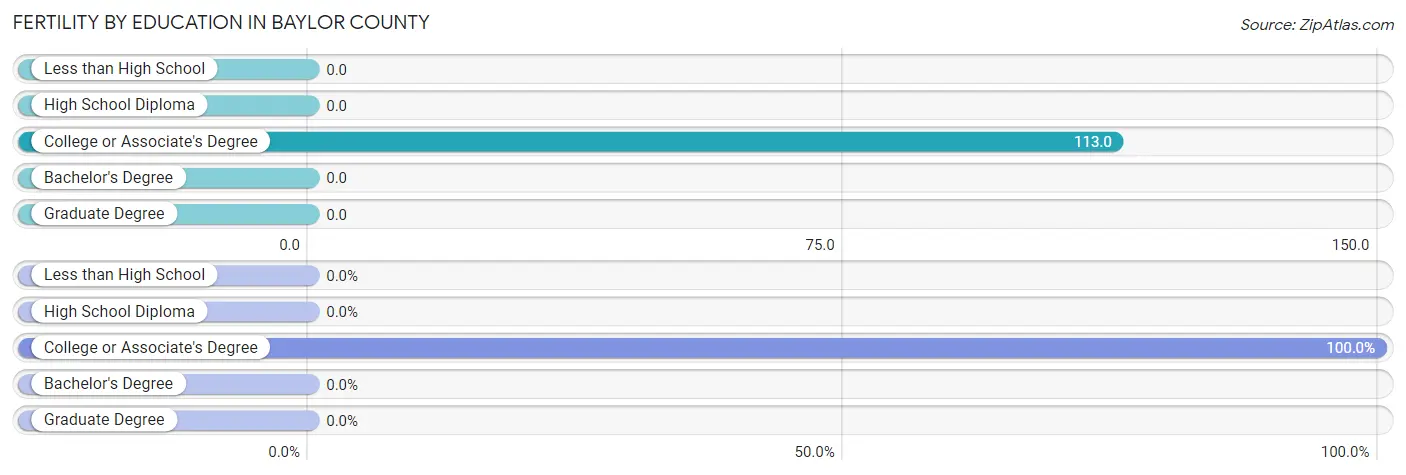
| Educational Attainment | Women with Births | Births / 1,000 Women |
| Less than High School | 0 (0.0%) | 0.0 |
| High School Diploma | 0 (0.0%) | 0.0 |
| College or Associate's Degree | 20 (100.0%) | 113.0 |
| Bachelor's Degree | 0 (0.0%) | 0.0 |
| Graduate Degree | 0 (0.0%) | 0.0 |
| Total | 20 (100.0%) | 31.0 |
Fertility by Education by Marriage Status in Baylor County
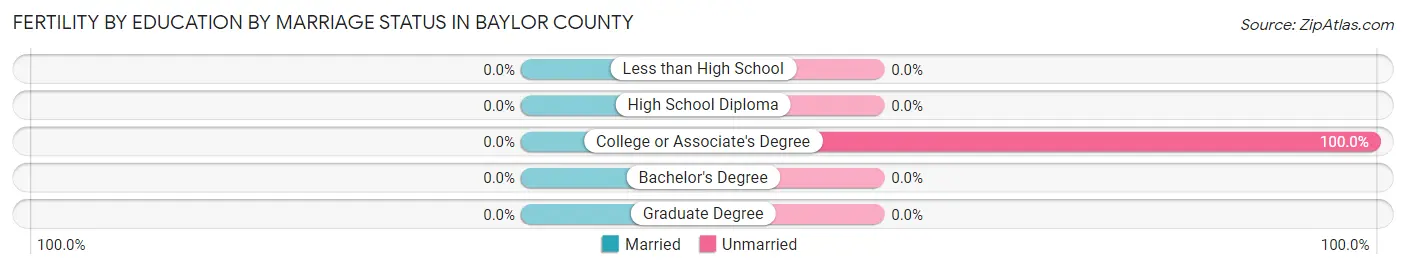
| Educational Attainment | Married | Unmarried |
| Less than High School | 0 (0.0%) | 0 (0.0%) |
| High School Diploma | 0 (0.0%) | 0 (0.0%) |
| College or Associate's Degree | 0 (0.0%) | 20 (100.0%) |
| Bachelor's Degree | 0 (0.0%) | 0 (0.0%) |
| Graduate Degree | 0 (0.0%) | 0 (0.0%) |
| Total | 0 (0.0%) | 20 (100.0%) |
Employment Characteristics in Baylor County
Employment by Class of Employer in Baylor County
Among the 1,466 employed individuals in Baylor County, private company employees (768 | 52.4%), self-employed (not incorporated) (323 | 22.0%), and self-employed (incorporated) (141 | 9.6%) make up the most common classes of employment.
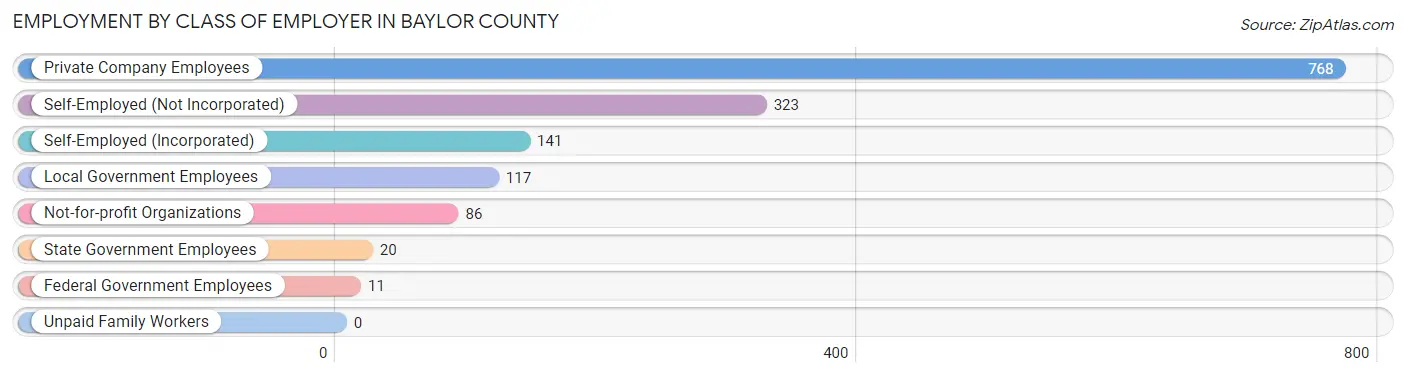
| Employer Class | # Employees | % Employees |
| Private Company Employees | 768 | 52.4% |
| Self-Employed (Incorporated) | 141 | 9.6% |
| Self-Employed (Not Incorporated) | 323 | 22.0% |
| Not-for-profit Organizations | 86 | 5.9% |
| Local Government Employees | 117 | 8.0% |
| State Government Employees | 20 | 1.4% |
| Federal Government Employees | 11 | 0.7% |
| Unpaid Family Workers | 0 | 0.0% |
| Total | 1,466 | 100.0% |
Employment Status by Age in Baylor County
According to the labor force statistics for Baylor County, out of the total population over 16 years of age (2,791), 54.0% or 1,507 individuals are in the labor force, with 1.1% or 17 of them unemployed. The age group with the highest labor force participation rate is 30 to 34 years, with 93.0% or 120 individuals in the labor force. Within the labor force, the 30 to 34 years age range has the highest percentage of unemployed individuals, with 5.0% or 6 of them being unemployed.
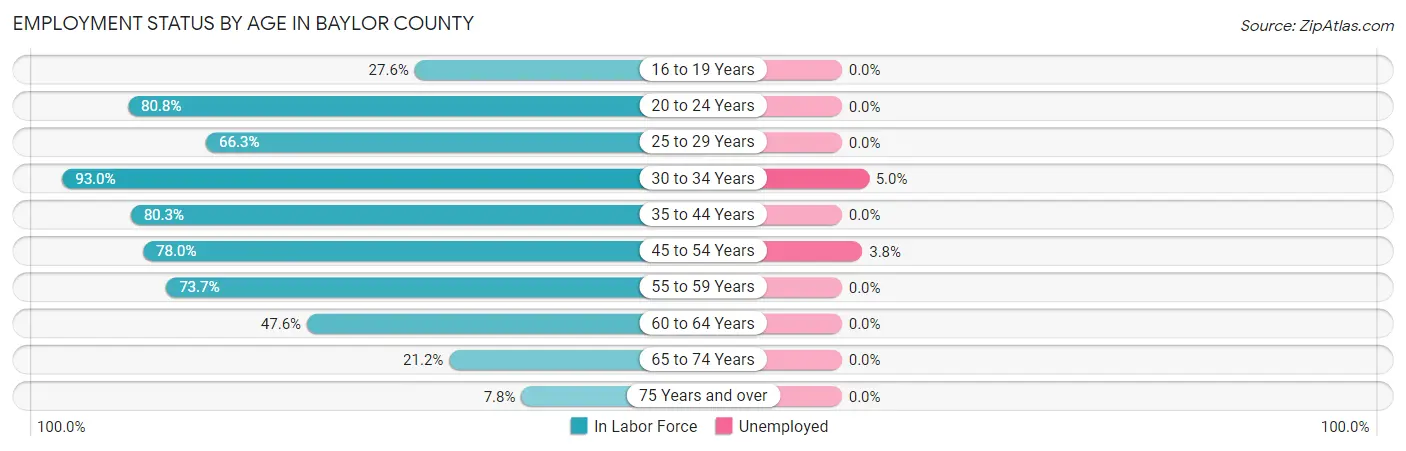
| Age Bracket | In Labor Force | Unemployed |
| 16 to 19 Years | 43 (27.6%) | 0 (0.0%) |
| 20 to 24 Years | 135 (80.8%) | 0 (0.0%) |
| 25 to 29 Years | 65 (66.3%) | 0 (0.0%) |
| 30 to 34 Years | 120 (93.0%) | 6 (5.0%) |
| 35 to 44 Years | 366 (80.3%) | 0 (0.0%) |
| 45 to 54 Years | 287 (78.0%) | 11 (3.8%) |
| 55 to 59 Years | 246 (73.7%) | 0 (0.0%) |
| 60 to 64 Years | 121 (47.6%) | 0 (0.0%) |
| 65 to 74 Years | 94 (21.2%) | 0 (0.0%) |
| 75 Years and over | 30 (7.8%) | 0 (0.0%) |
| Total | 1,507 (54.0%) | 17 (1.1%) |
Employment Status by Educational Attainment in Baylor County
According to labor force statistics for Baylor County, 73.5% of individuals (1,205) out of the total population between 25 and 64 years of age (1,639) are in the labor force, with 1.4% or 17 of them being unemployed. The group with the highest labor force participation rate are those with the educational attainment of bachelor's degree or higher, with 84.4% or 293 individuals in the labor force. Within the labor force, individuals with less than high school education have the highest percentage of unemployment, with 5.9% or 6 of them being unemployed.
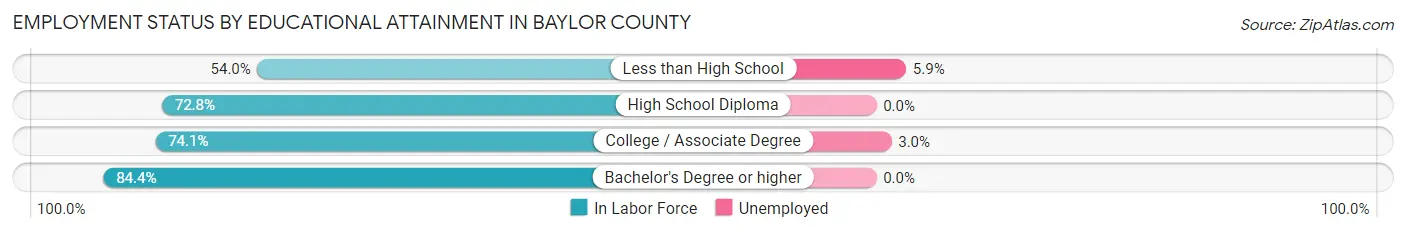
| Educational Attainment | In Labor Force | Unemployed |
| Less than High School | 101 (54.0%) | 11 (5.9%) |
| High School Diploma | 448 (72.8%) | 0 (0.0%) |
| College / Associate Degree | 363 (74.1%) | 15 (3.0%) |
| Bachelor's Degree or higher | 293 (84.4%) | 0 (0.0%) |
| Total | 1,205 (73.5%) | 23 (1.4%) |
Employment Occupations by Sex in Baylor County
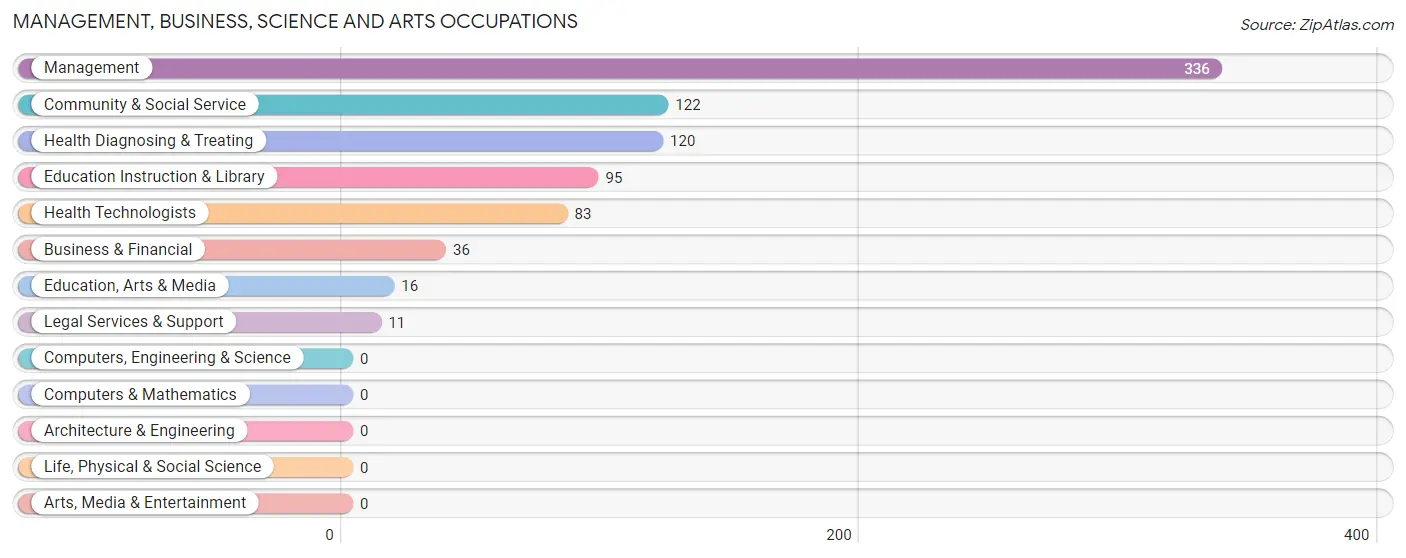
Management, Business, Science and Arts Occupations
The most common Management, Business, Science and Arts occupations in Baylor County are Management (336 | 22.6%), Community & Social Service (122 | 8.2%), Health Diagnosing & Treating (120 | 8.1%), Education Instruction & Library (95 | 6.4%), and Health Technologists (83 | 5.6%).
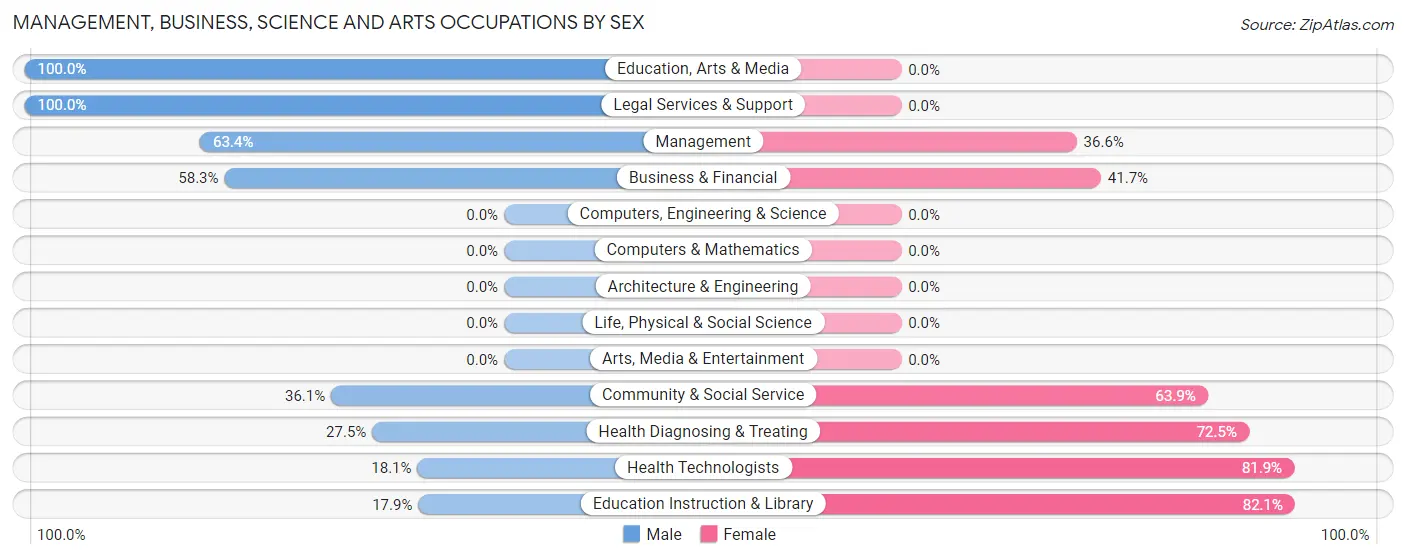
Management, Business, Science and Arts Occupations by Sex
Within the Management, Business, Science and Arts occupations in Baylor County, the most male-oriented occupations are Education, Arts & Media (100.0%), Legal Services & Support (100.0%), and Management (63.4%), while the most female-oriented occupations are Education Instruction & Library (82.1%), Health Technologists (81.9%), and Health Diagnosing & Treating (72.5%).
| Occupation | Male | Female |
| Management | 213 (63.4%) | 123 (36.6%) |
| Business & Financial | 21 (58.3%) | 15 (41.7%) |
| Computers, Engineering & Science | 0 (0.0%) | 0 (0.0%) |
| Computers & Mathematics | 0 (0.0%) | 0 (0.0%) |
| Architecture & Engineering | 0 (0.0%) | 0 (0.0%) |
| Life, Physical & Social Science | 0 (0.0%) | 0 (0.0%) |
| Community & Social Service | 44 (36.1%) | 78 (63.9%) |
| Education, Arts & Media | 16 (100.0%) | 0 (0.0%) |
| Legal Services & Support | 11 (100.0%) | 0 (0.0%) |
| Education Instruction & Library | 17 (17.9%) | 78 (82.1%) |
| Arts, Media & Entertainment | 0 (0.0%) | 0 (0.0%) |
| Health Diagnosing & Treating | 33 (27.5%) | 87 (72.5%) |
| Health Technologists | 15 (18.1%) | 68 (81.9%) |
| Total (Category) | 311 (50.6%) | 303 (49.3%) |
| Total (Overall) | 750 (50.3%) | 740 (49.7%) |
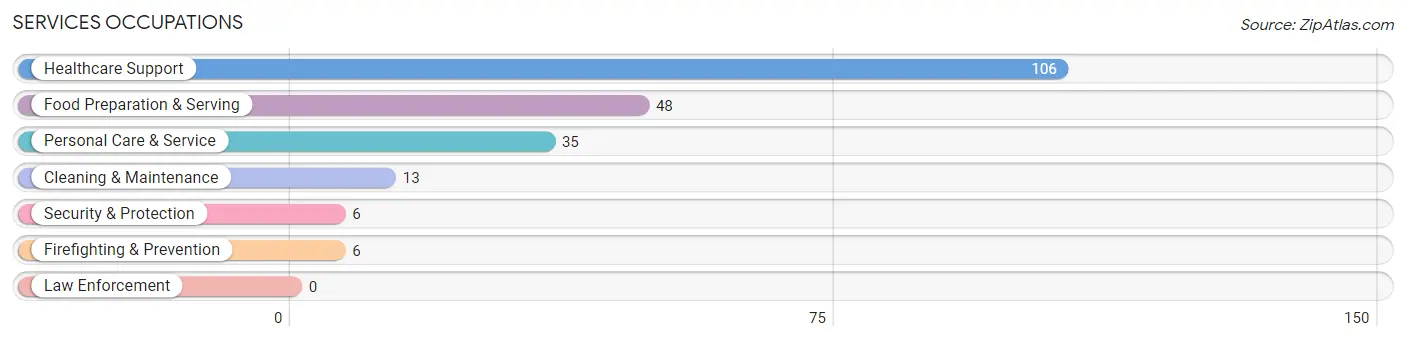
Services Occupations
The most common Services occupations in Baylor County are Healthcare Support (106 | 7.1%), Food Preparation & Serving (48 | 3.2%), Personal Care & Service (35 | 2.4%), Cleaning & Maintenance (13 | 0.9%), and Security & Protection (6 | 0.4%).
Services Occupations by Sex
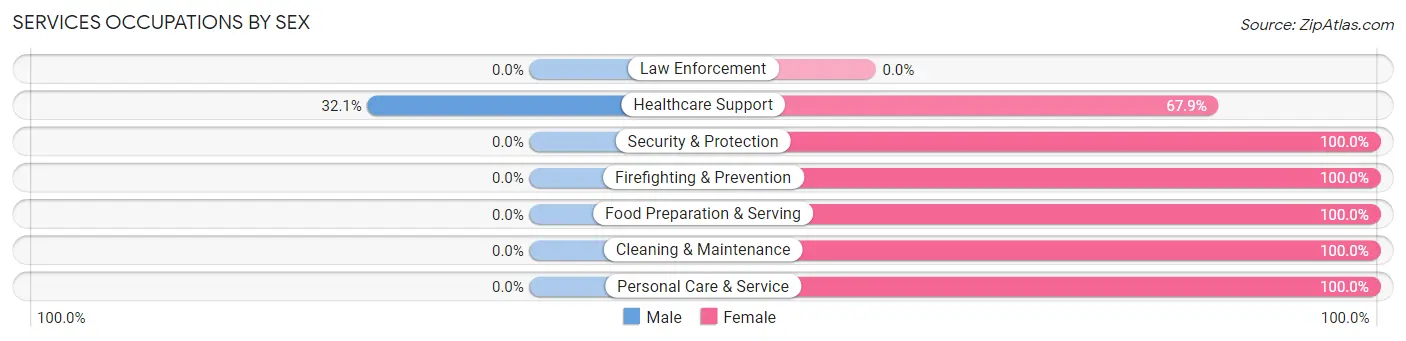
| Occupation | Male | Female |
| Healthcare Support | 34 (32.1%) | 72 (67.9%) |
| Security & Protection | 0 (0.0%) | 6 (100.0%) |
| Firefighting & Prevention | 0 (0.0%) | 6 (100.0%) |
| Law Enforcement | 0 (0.0%) | 0 (0.0%) |
| Food Preparation & Serving | 0 (0.0%) | 48 (100.0%) |
| Cleaning & Maintenance | 0 (0.0%) | 13 (100.0%) |
| Personal Care & Service | 0 (0.0%) | 35 (100.0%) |
| Total (Category) | 34 (16.4%) | 174 (83.7%) |
| Total (Overall) | 750 (50.3%) | 740 (49.7%) |
Sales and Office Occupations
The most common Sales and Office occupations in Baylor County are Office & Administration (120 | 8.1%), and Sales & Related (94 | 6.3%).

Sales and Office Occupations by Sex

| Occupation | Male | Female |
| Sales & Related | 67 (71.3%) | 27 (28.7%) |
| Office & Administration | 10 (8.3%) | 110 (91.7%) |
| Total (Category) | 77 (36.0%) | 137 (64.0%) |
| Total (Overall) | 750 (50.3%) | 740 (49.7%) |
Natural Resources, Construction and Maintenance Occupations
The most common Natural Resources, Construction and Maintenance occupations in Baylor County are Construction & Extraction (159 | 10.7%), Installation, Maintenance & Repair (85 | 5.7%), and Farming, Fishing & Forestry (2 | 0.1%).
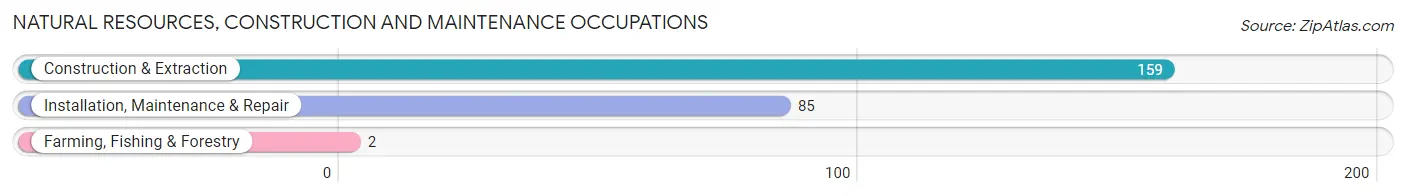
Natural Resources, Construction and Maintenance Occupations by Sex

| Occupation | Male | Female |
| Farming, Fishing & Forestry | 0 (0.0%) | 2 (100.0%) |
| Construction & Extraction | 135 (84.9%) | 24 (15.1%) |
| Installation, Maintenance & Repair | 85 (100.0%) | 0 (0.0%) |
| Total (Category) | 220 (89.4%) | 26 (10.6%) |
| Total (Overall) | 750 (50.3%) | 740 (49.7%) |
Production, Transportation and Moving Occupations
The most common Production, Transportation and Moving occupations in Baylor County are Production (155 | 10.4%), Material Moving (39 | 2.6%), and Transportation (14 | 0.9%).
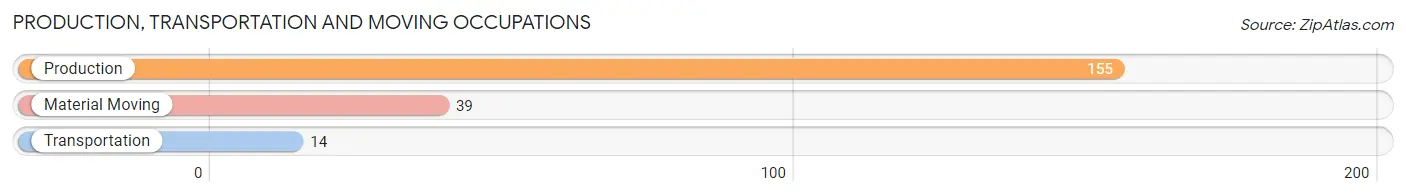
Production, Transportation and Moving Occupations by Sex
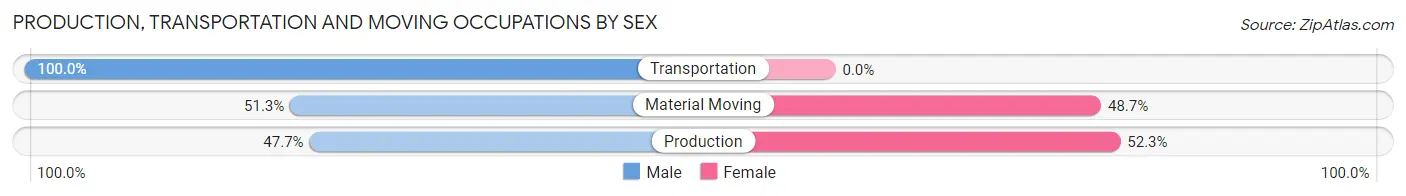
| Occupation | Male | Female |
| Production | 74 (47.7%) | 81 (52.3%) |
| Transportation | 14 (100.0%) | 0 (0.0%) |
| Material Moving | 20 (51.3%) | 19 (48.7%) |
| Total (Category) | 108 (51.9%) | 100 (48.1%) |
| Total (Overall) | 750 (50.3%) | 740 (49.7%) |
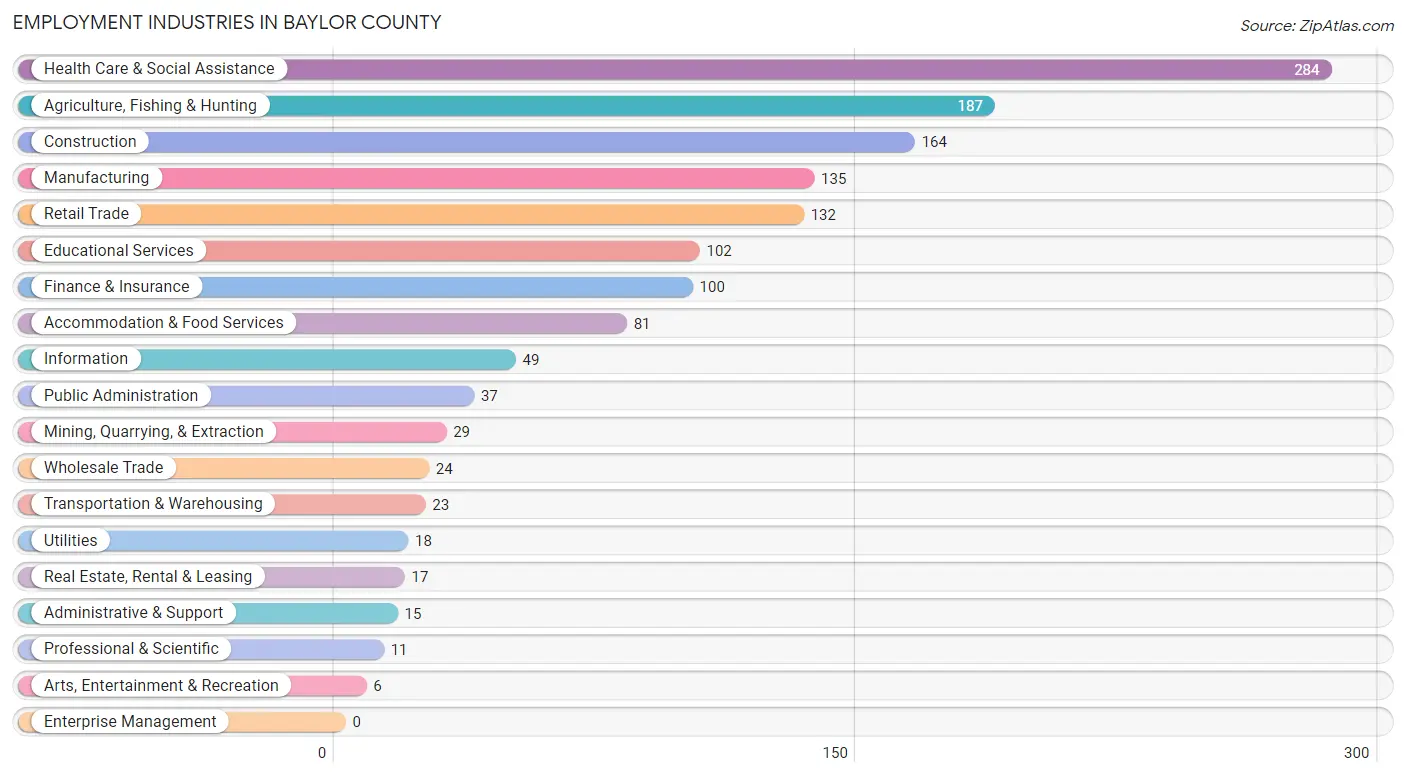
Employment Industries by Sex in Baylor County
Employment Industries in Baylor County
The major employment industries in Baylor County include Health Care & Social Assistance (284 | 19.1%), Agriculture, Fishing & Hunting (187 | 12.6%), Construction (164 | 11.0%), Manufacturing (135 | 9.1%), and Retail Trade (132 | 8.9%).
Employment Industries by Sex in Baylor County
The Baylor County industries that see more men than women are Mining, Quarrying, & Extraction (100.0%), Transportation & Warehousing (100.0%), and Utilities (100.0%), whereas the industries that tend to have a higher number of women are Administrative & Support (100.0%), Accommodation & Food Services (100.0%), and Public Administration (100.0%).
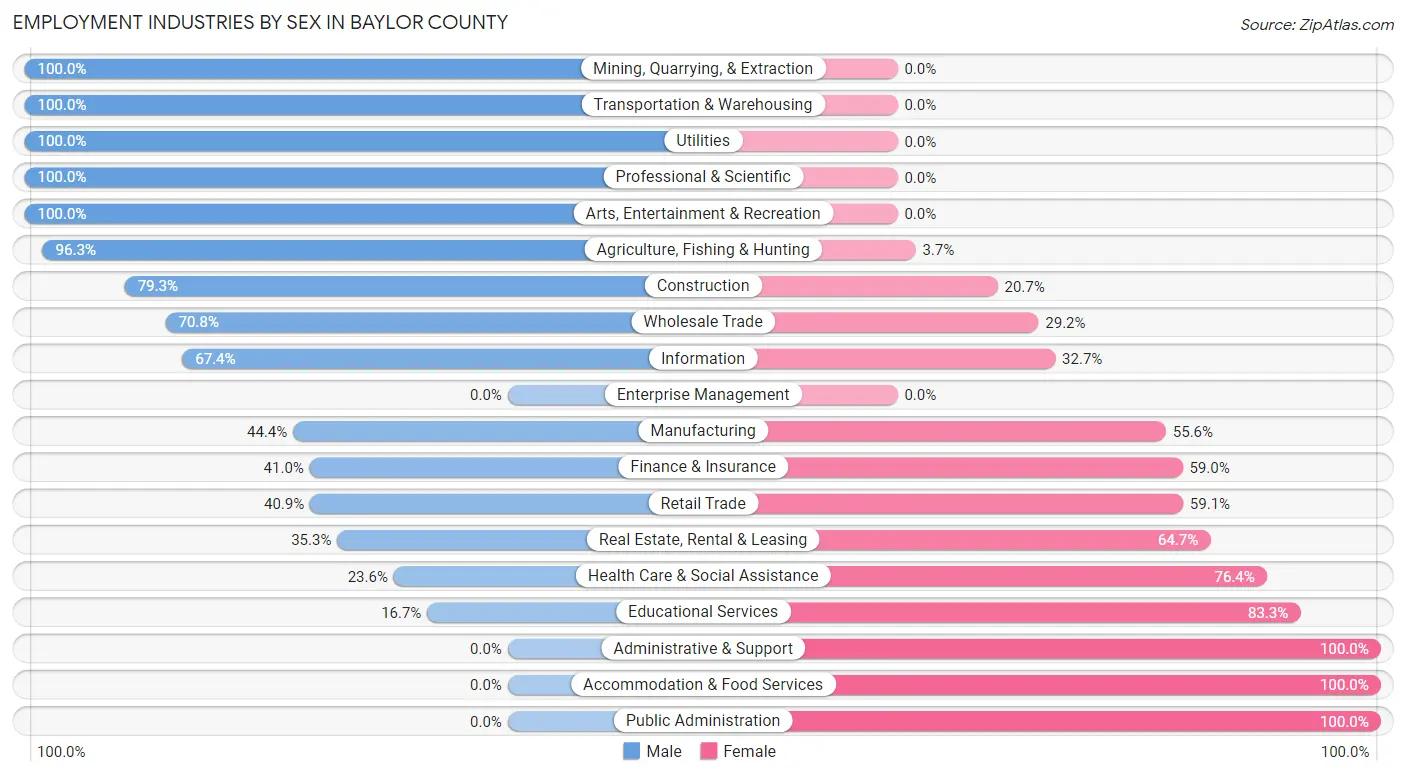
| Industry | Male | Female |
| Agriculture, Fishing & Hunting | 180 (96.3%) | 7 (3.7%) |
| Mining, Quarrying, & Extraction | 29 (100.0%) | 0 (0.0%) |
| Construction | 130 (79.3%) | 34 (20.7%) |
| Manufacturing | 60 (44.4%) | 75 (55.6%) |
| Wholesale Trade | 17 (70.8%) | 7 (29.2%) |
| Retail Trade | 54 (40.9%) | 78 (59.1%) |
| Transportation & Warehousing | 23 (100.0%) | 0 (0.0%) |
| Utilities | 18 (100.0%) | 0 (0.0%) |
| Information | 33 (67.3%) | 16 (32.7%) |
| Finance & Insurance | 41 (41.0%) | 59 (59.0%) |
| Real Estate, Rental & Leasing | 6 (35.3%) | 11 (64.7%) |
| Professional & Scientific | 11 (100.0%) | 0 (0.0%) |
| Enterprise Management | 0 (0.0%) | 0 (0.0%) |
| Administrative & Support | 0 (0.0%) | 15 (100.0%) |
| Educational Services | 17 (16.7%) | 85 (83.3%) |
| Health Care & Social Assistance | 67 (23.6%) | 217 (76.4%) |
| Arts, Entertainment & Recreation | 6 (100.0%) | 0 (0.0%) |
| Accommodation & Food Services | 0 (0.0%) | 81 (100.0%) |
| Public Administration | 0 (0.0%) | 37 (100.0%) |
| Total | 750 (50.3%) | 740 (49.7%) |
Education in Baylor County
School Enrollment in Baylor County
The most common levels of schooling among the 684 students in Baylor County are middle school (250 | 36.5%), elementary school (198 | 28.9%), and high school (157 | 23.0%).
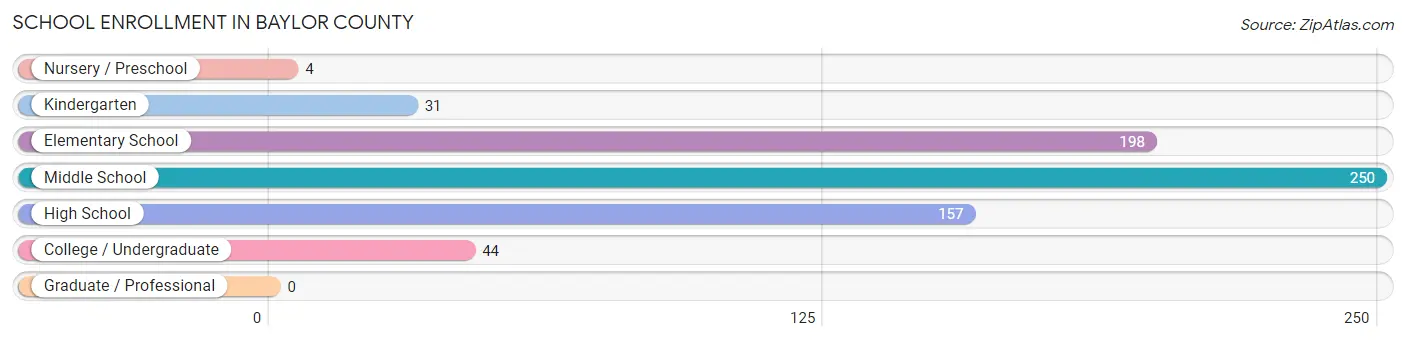
| School Level | # Students | % Students |
| Nursery / Preschool | 4 | 0.6% |
| Kindergarten | 31 | 4.5% |
| Elementary School | 198 | 28.9% |
| Middle School | 250 | 36.5% |
| High School | 157 | 23.0% |
| College / Undergraduate | 44 | 6.4% |
| Graduate / Professional | 0 | 0.0% |
| Total | 684 | 100.0% |
School Enrollment by Age by Funding Source in Baylor County
Out of a total of 684 students who are enrolled in schools in Baylor County, 58 (8.5%) attend a private institution, while the remaining 626 (91.5%) are enrolled in public schools. The age group of 5 to 9 year old has the highest likelihood of being enrolled in private schools, with 41 (19.4% in the age bracket) enrolled. Conversely, the age group of 3 to 4 year olds has the lowest likelihood of being enrolled in a private school, with 4 (100.0% in the age bracket) attending a public institution.
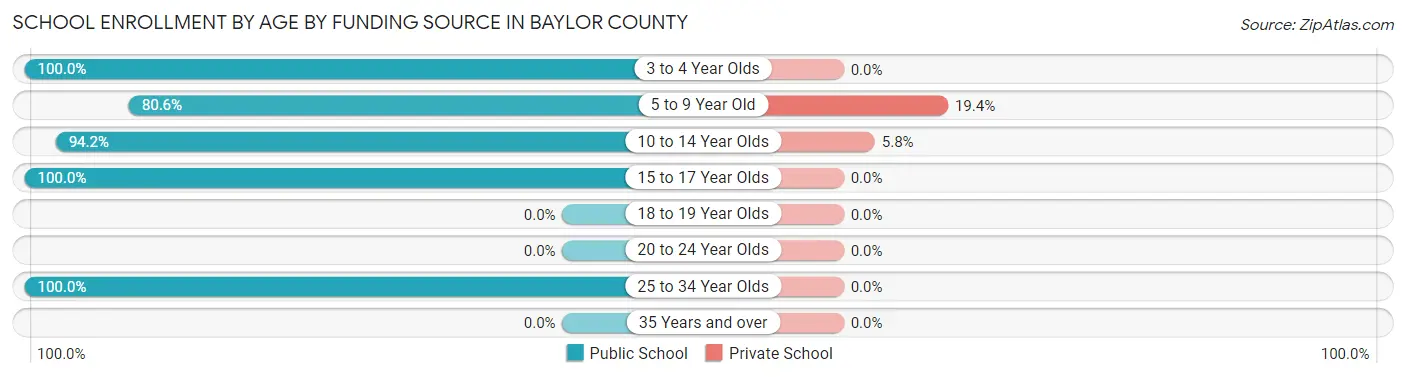
| Age Bracket | Public School | Private School |
| 3 to 4 Year Olds | 4 (100.0%) | 0 (0.0%) |
| 5 to 9 Year Old | 170 (80.6%) | 41 (19.4%) |
| 10 to 14 Year Olds | 276 (94.2%) | 17 (5.8%) |
| 15 to 17 Year Olds | 132 (100.0%) | 0 (0.0%) |
| 18 to 19 Year Olds | 0 (0.0%) | 0 (0.0%) |
| 20 to 24 Year Olds | 0 (0.0%) | 0 (0.0%) |
| 25 to 34 Year Olds | 44 (100.0%) | 0 (0.0%) |
| 35 Years and over | 0 (0.0%) | 0 (0.0%) |
| Total | 626 (91.5%) | 58 (8.5%) |
Educational Attainment by Field of Study in Baylor County
Business (98 | 16.8%), science & technology (85 | 14.5%), education (75 | 12.8%), visual & performing arts (73 | 12.5%), and bio, nature & agricultural (64 | 10.9%) are the most common fields of study among 585 individuals in Baylor County who have obtained a bachelor's degree or higher.
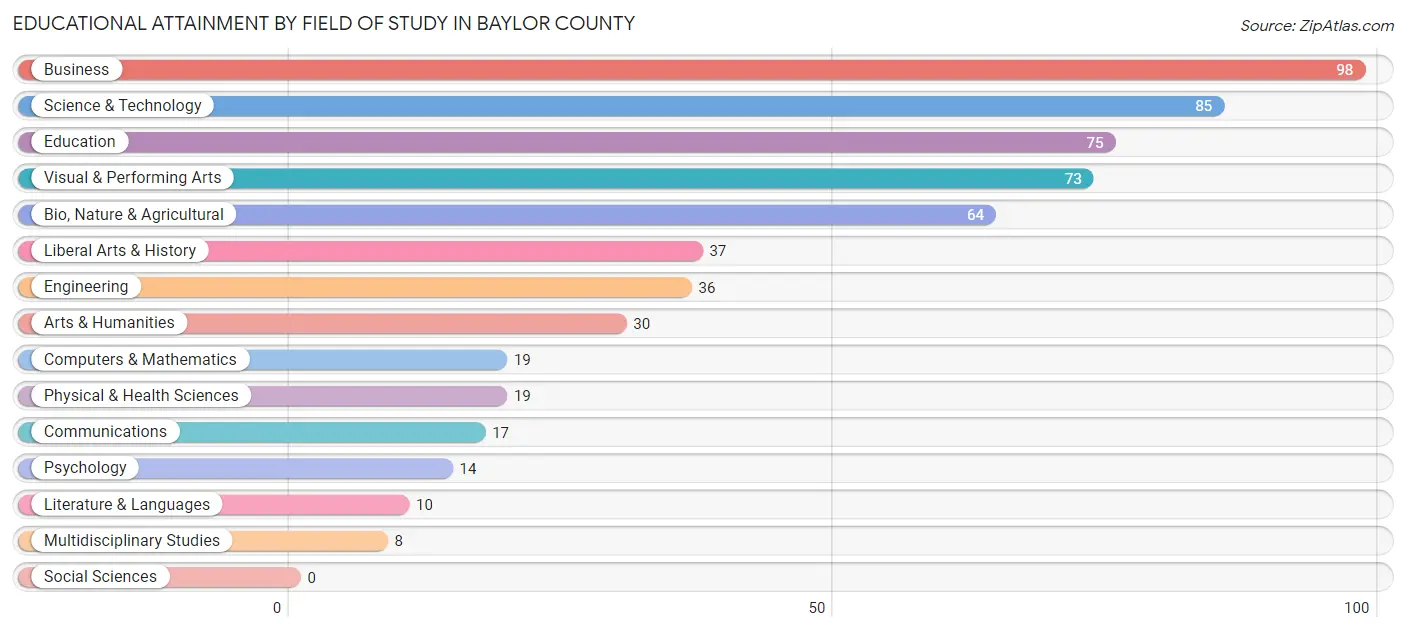
| Field of Study | # Graduates | % Graduates |
| Computers & Mathematics | 19 | 3.3% |
| Bio, Nature & Agricultural | 64 | 10.9% |
| Physical & Health Sciences | 19 | 3.3% |
| Psychology | 14 | 2.4% |
| Social Sciences | 0 | 0.0% |
| Engineering | 36 | 6.1% |
| Multidisciplinary Studies | 8 | 1.4% |
| Science & Technology | 85 | 14.5% |
| Business | 98 | 16.8% |
| Education | 75 | 12.8% |
| Literature & Languages | 10 | 1.7% |
| Liberal Arts & History | 37 | 6.3% |
| Visual & Performing Arts | 73 | 12.5% |
| Communications | 17 | 2.9% |
| Arts & Humanities | 30 | 5.1% |
| Total | 585 | 100.0% |
Transportation & Commute in Baylor County
Vehicle Availability by Sex in Baylor County
The most prevalent vehicle ownership categories in Baylor County are males with 2 vehicles (337, accounting for 46.4%) and females with 2 vehicles (354, making up 45.5%).
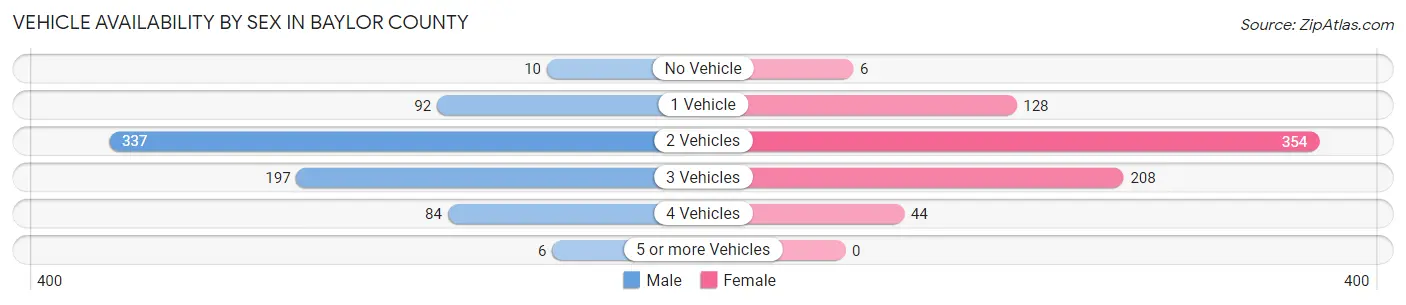
| Vehicles Available | Male | Female |
| No Vehicle | 10 (1.4%) | 6 (0.8%) |
| 1 Vehicle | 92 (12.7%) | 128 (17.3%) |
| 2 Vehicles | 337 (46.4%) | 354 (47.8%) |
| 3 Vehicles | 197 (27.1%) | 208 (28.1%) |
| 4 Vehicles | 84 (11.6%) | 44 (5.9%) |
| 5 or more Vehicles | 6 (0.8%) | 0 (0.0%) |
| Total | 726 (100.0%) | 740 (100.0%) |
Commute Time in Baylor County
The most frequently occuring commute durations in Baylor County are 5 to 9 minutes (573 commuters, 40.9%), less than 5 minutes (243 commuters, 17.3%), and 30 to 34 minutes (167 commuters, 11.9%).
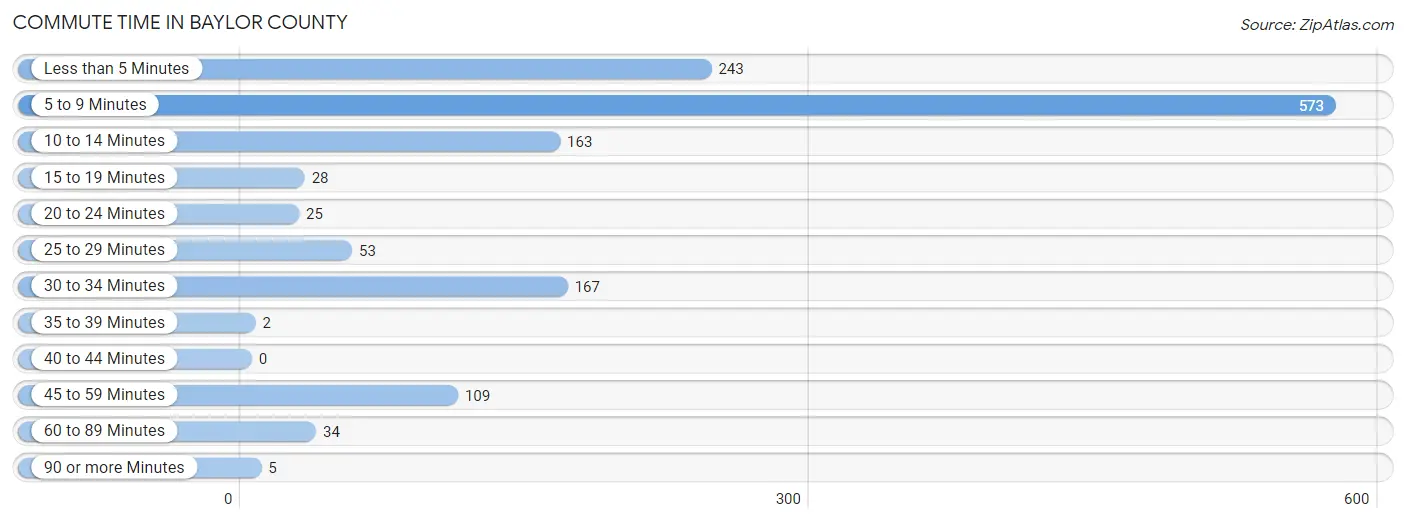
| Commute Time | # Commuters | % Commuters |
| Less than 5 Minutes | 243 | 17.3% |
| 5 to 9 Minutes | 573 | 40.9% |
| 10 to 14 Minutes | 163 | 11.6% |
| 15 to 19 Minutes | 28 | 2.0% |
| 20 to 24 Minutes | 25 | 1.8% |
| 25 to 29 Minutes | 53 | 3.8% |
| 30 to 34 Minutes | 167 | 11.9% |
| 35 to 39 Minutes | 2 | 0.1% |
| 40 to 44 Minutes | 0 | 0.0% |
| 45 to 59 Minutes | 109 | 7.8% |
| 60 to 89 Minutes | 34 | 2.4% |
| 90 or more Minutes | 5 | 0.4% |
Commute Time by Sex in Baylor County
The most common commute times in Baylor County are 5 to 9 minutes (295 commuters, 42.9%) for males and 5 to 9 minutes (278 commuters, 38.9%) for females.
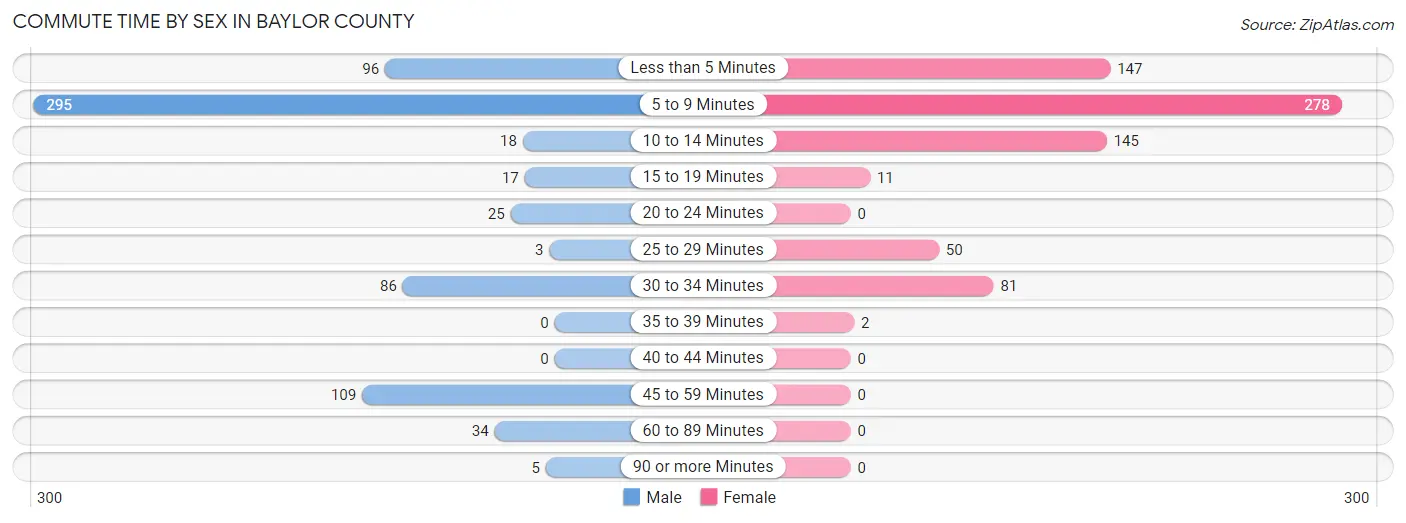
| Commute Time | Male | Female |
| Less than 5 Minutes | 96 (14.0%) | 147 (20.6%) |
| 5 to 9 Minutes | 295 (42.9%) | 278 (38.9%) |
| 10 to 14 Minutes | 18 (2.6%) | 145 (20.3%) |
| 15 to 19 Minutes | 17 (2.5%) | 11 (1.5%) |
| 20 to 24 Minutes | 25 (3.6%) | 0 (0.0%) |
| 25 to 29 Minutes | 3 (0.4%) | 50 (7.0%) |
| 30 to 34 Minutes | 86 (12.5%) | 81 (11.3%) |
| 35 to 39 Minutes | 0 (0.0%) | 2 (0.3%) |
| 40 to 44 Minutes | 0 (0.0%) | 0 (0.0%) |
| 45 to 59 Minutes | 109 (15.8%) | 0 (0.0%) |
| 60 to 89 Minutes | 34 (4.9%) | 0 (0.0%) |
| 90 or more Minutes | 5 (0.7%) | 0 (0.0%) |
Time of Departure to Work by Sex in Baylor County
The most frequent times of departure to work in Baylor County are 7:30 AM to 7:59 AM (164, 23.8%) for males and 7:30 AM to 7:59 AM (210, 29.4%) for females.
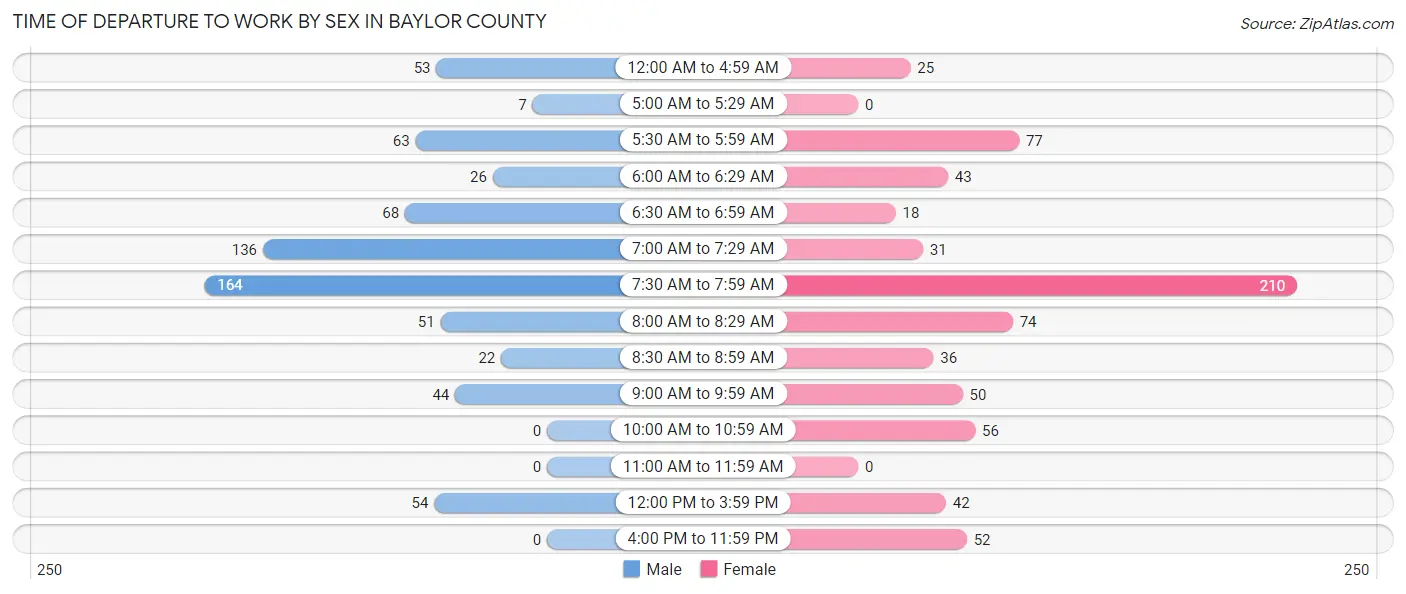
| Time of Departure | Male | Female |
| 12:00 AM to 4:59 AM | 53 (7.7%) | 25 (3.5%) |
| 5:00 AM to 5:29 AM | 7 (1.0%) | 0 (0.0%) |
| 5:30 AM to 5:59 AM | 63 (9.2%) | 77 (10.8%) |
| 6:00 AM to 6:29 AM | 26 (3.8%) | 43 (6.0%) |
| 6:30 AM to 6:59 AM | 68 (9.9%) | 18 (2.5%) |
| 7:00 AM to 7:29 AM | 136 (19.8%) | 31 (4.3%) |
| 7:30 AM to 7:59 AM | 164 (23.8%) | 210 (29.4%) |
| 8:00 AM to 8:29 AM | 51 (7.4%) | 74 (10.4%) |
| 8:30 AM to 8:59 AM | 22 (3.2%) | 36 (5.0%) |
| 9:00 AM to 9:59 AM | 44 (6.4%) | 50 (7.0%) |
| 10:00 AM to 10:59 AM | 0 (0.0%) | 56 (7.8%) |
| 11:00 AM to 11:59 AM | 0 (0.0%) | 0 (0.0%) |
| 12:00 PM to 3:59 PM | 54 (7.9%) | 42 (5.9%) |
| 4:00 PM to 11:59 PM | 0 (0.0%) | 52 (7.3%) |
| Total | 688 (100.0%) | 714 (100.0%) |
Housing Occupancy in Baylor County
Occupancy by Ownership in Baylor County
Of the total 1,477 dwellings in Baylor County, owner-occupied units account for 1,004 (68.0%), while renter-occupied units make up 473 (32.0%).
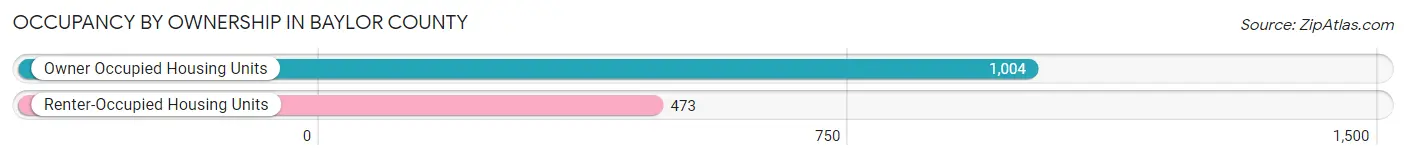
| Occupancy | # Housing Units | % Housing Units |
| Owner Occupied Housing Units | 1,004 | 68.0% |
| Renter-Occupied Housing Units | 473 | 32.0% |
| Total Occupied Housing Units | 1,477 | 100.0% |
Occupancy by Household Size in Baylor County
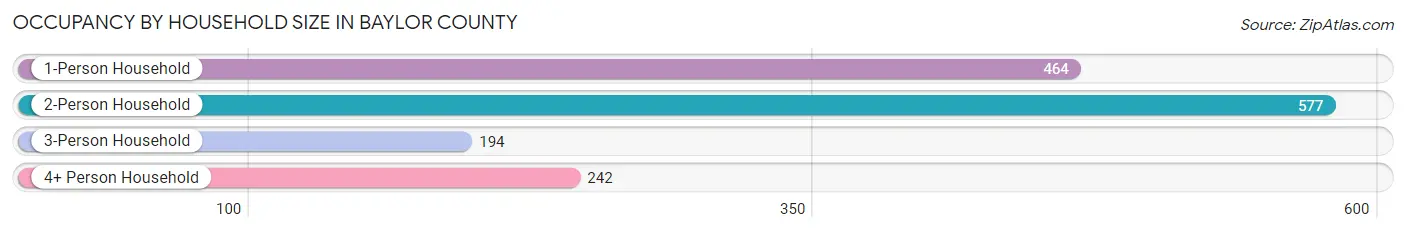
| Household Size | # Housing Units | % Housing Units |
| 1-Person Household | 464 | 31.4% |
| 2-Person Household | 577 | 39.1% |
| 3-Person Household | 194 | 13.1% |
| 4+ Person Household | 242 | 16.4% |
| Total Housing Units | 1,477 | 100.0% |
Occupancy by Ownership by Household Size in Baylor County
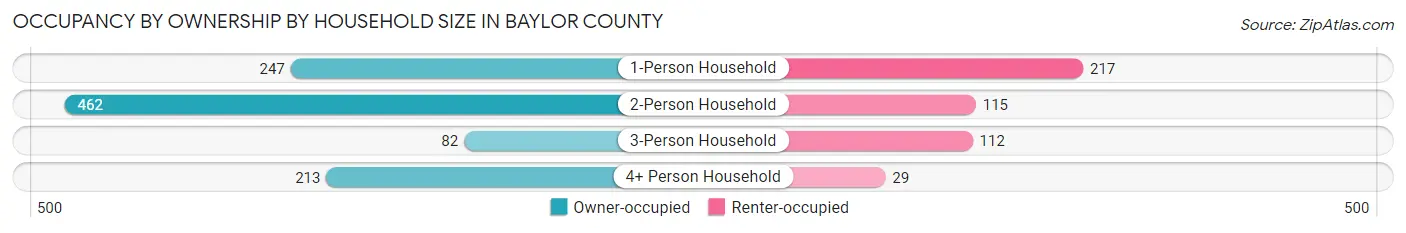
| Household Size | Owner-occupied | Renter-occupied |
| 1-Person Household | 247 (53.2%) | 217 (46.8%) |
| 2-Person Household | 462 (80.1%) | 115 (19.9%) |
| 3-Person Household | 82 (42.3%) | 112 (57.7%) |
| 4+ Person Household | 213 (88.0%) | 29 (12.0%) |
| Total Housing Units | 1,004 (68.0%) | 473 (32.0%) |
Occupancy by Educational Attainment in Baylor County
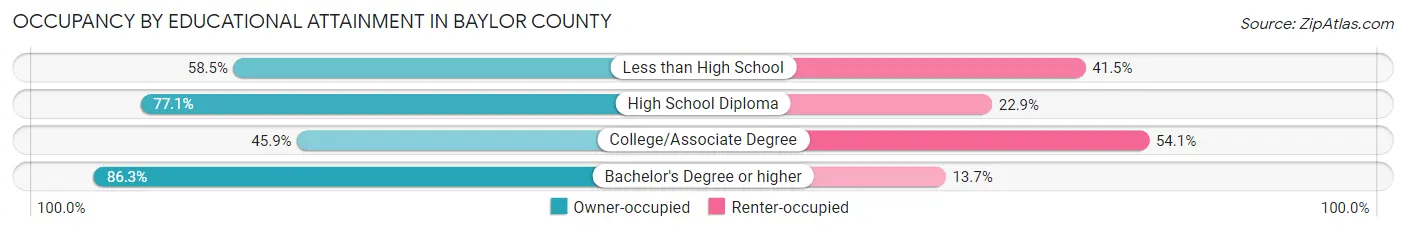
| Household Size | Owner-occupied | Renter-occupied |
| Less than High School | 127 (58.5%) | 90 (41.5%) |
| High School Diploma | 477 (77.1%) | 142 (22.9%) |
| College/Associate Degree | 174 (45.9%) | 205 (54.1%) |
| Bachelor's Degree or higher | 226 (86.3%) | 36 (13.7%) |
Occupancy by Age of Householder in Baylor County
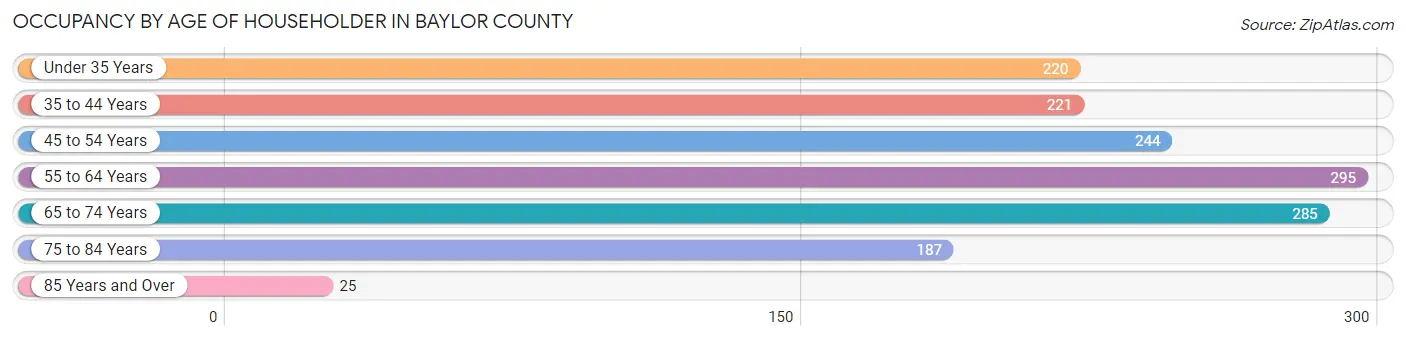
| Age Bracket | # Households | % Households |
| Under 35 Years | 220 | 14.9% |
| 35 to 44 Years | 221 | 15.0% |
| 45 to 54 Years | 244 | 16.5% |
| 55 to 64 Years | 295 | 20.0% |
| 65 to 74 Years | 285 | 19.3% |
| 75 to 84 Years | 187 | 12.7% |
| 85 Years and Over | 25 | 1.7% |
| Total | 1,477 | 100.0% |
Housing Finances in Baylor County
Median Income by Occupancy in Baylor County
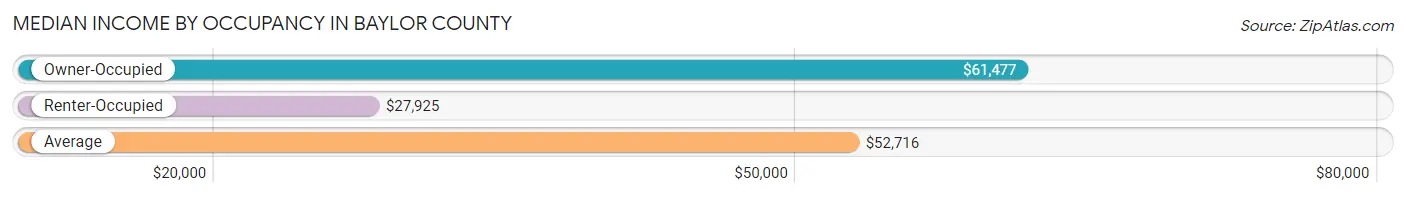
| Occupancy Type | # Households | Median Income |
| Owner-Occupied | 1,004 (68.0%) | $61,477 |
| Renter-Occupied | 473 (32.0%) | $27,925 |
| Average | 1,477 (100.0%) | $52,716 |
Occupancy by Householder Income Bracket in Baylor County
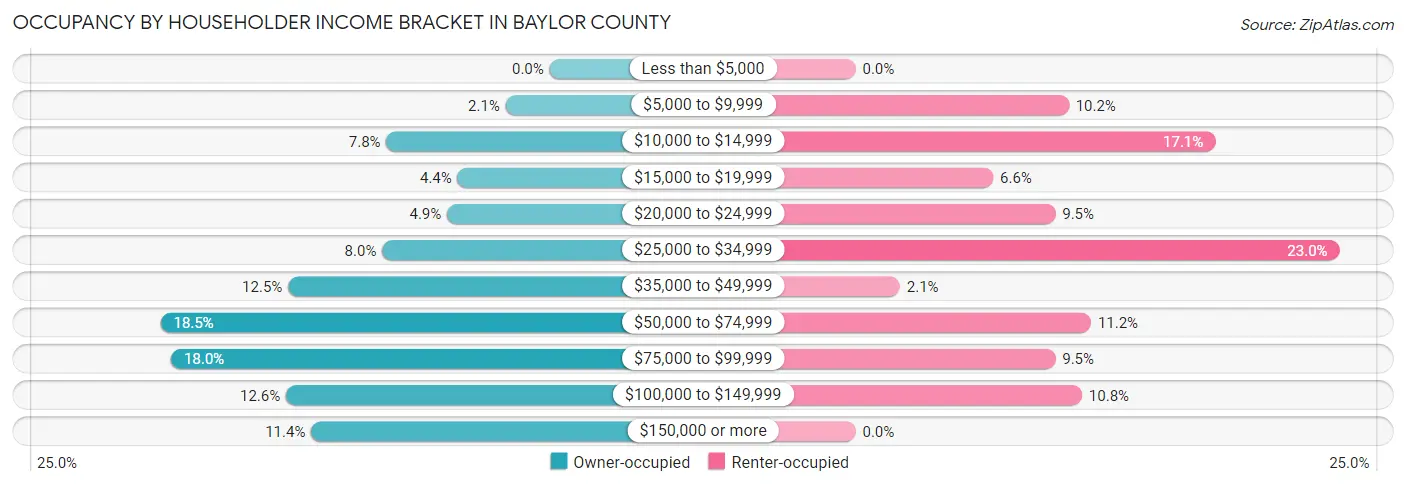
| Income Bracket | Owner-occupied | Renter-occupied |
| Less than $5,000 | 0 (0.0%) | 0 (0.0%) |
| $5,000 to $9,999 | 21 (2.1%) | 48 (10.2%) |
| $10,000 to $14,999 | 78 (7.8%) | 81 (17.1%) |
| $15,000 to $19,999 | 44 (4.4%) | 31 (6.6%) |
| $20,000 to $24,999 | 49 (4.9%) | 45 (9.5%) |
| $25,000 to $34,999 | 80 (8.0%) | 109 (23.0%) |
| $35,000 to $49,999 | 125 (12.4%) | 10 (2.1%) |
| $50,000 to $74,999 | 186 (18.5%) | 53 (11.2%) |
| $75,000 to $99,999 | 181 (18.0%) | 45 (9.5%) |
| $100,000 to $149,999 | 126 (12.6%) | 51 (10.8%) |
| $150,000 or more | 114 (11.4%) | 0 (0.0%) |
| Total | 1,004 (100.0%) | 473 (100.0%) |
Monthly Housing Cost Tiers in Baylor County
| Monthly Cost | Owner-occupied | Renter-occupied |
| Less than $300 | 165 (16.4%) | 59 (12.5%) |
| $300 to $499 | 231 (23.0%) | 126 (26.6%) |
| $500 to $799 | 255 (25.4%) | 98 (20.7%) |
| $800 to $999 | 94 (9.4%) | 67 (14.2%) |
| $1,000 to $1,499 | 111 (11.1%) | 51 (10.8%) |
| $1,500 to $1,999 | 84 (8.4%) | 0 (0.0%) |
| $2,000 to $2,499 | 15 (1.5%) | 0 (0.0%) |
| $2,500 to $2,999 | 0 (0.0%) | 0 (0.0%) |
| $3,000 or more | 49 (4.9%) | 0 (0.0%) |
| Total | 1,004 (100.0%) | 473 (100.0%) |
Physical Housing Characteristics in Baylor County
Housing Structures in Baylor County
| Structure Type | # Housing Units | % Housing Units |
| Single Unit, Detached | 1,173 | 79.4% |
| Single Unit, Attached | 13 | 0.9% |
| 2 Unit Apartments | 134 | 9.1% |
| 3 or 4 Unit Apartments | 45 | 3.0% |
| 5 to 9 Unit Apartments | 6 | 0.4% |
| 10 or more Apartments | 12 | 0.8% |
| Mobile Home / Other | 94 | 6.4% |
| Total | 1,477 | 100.0% |
Housing Structures by Occupancy in Baylor County
| Structure Type | Owner-occupied | Renter-occupied |
| Single Unit, Detached | 933 (79.5%) | 240 (20.5%) |
| Single Unit, Attached | 13 (100.0%) | 0 (0.0%) |
| 2 Unit Apartments | 0 (0.0%) | 134 (100.0%) |
| 3 or 4 Unit Apartments | 0 (0.0%) | 45 (100.0%) |
| 5 to 9 Unit Apartments | 0 (0.0%) | 6 (100.0%) |
| 10 or more Apartments | 0 (0.0%) | 12 (100.0%) |
| Mobile Home / Other | 58 (61.7%) | 36 (38.3%) |
| Total | 1,004 (68.0%) | 473 (32.0%) |
Housing Structures by Number of Rooms in Baylor County
| Number of Rooms | Owner-occupied | Renter-occupied |
| 1 Room | 53 (5.3%) | 0 (0.0%) |
| 2 or 3 Rooms | 40 (4.0%) | 74 (15.6%) |
| 4 or 5 Rooms | 208 (20.7%) | 206 (43.5%) |
| 6 or 7 Rooms | 526 (52.4%) | 145 (30.7%) |
| 8 or more Rooms | 177 (17.6%) | 48 (10.2%) |
| Total | 1,004 (100.0%) | 473 (100.0%) |
Housing Structure by Heating Type in Baylor County
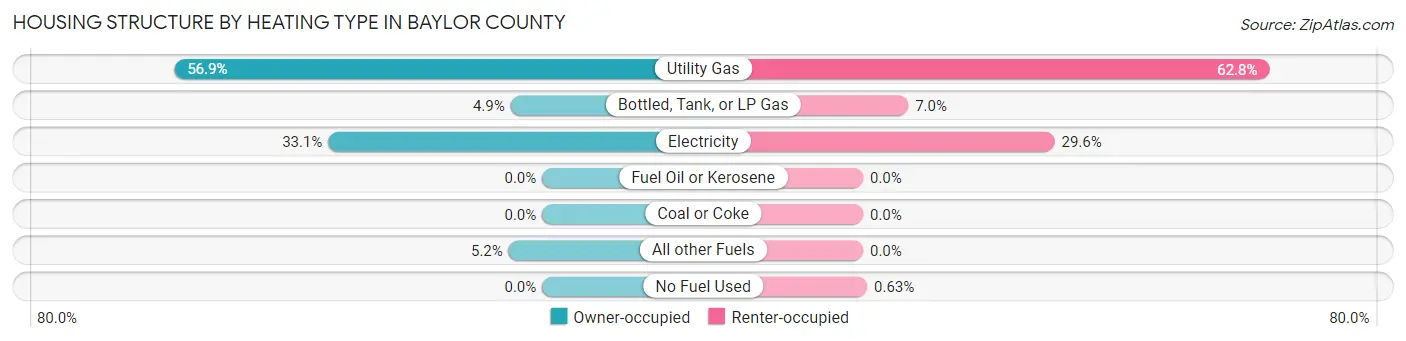
| Heating Type | Owner-occupied | Renter-occupied |
| Utility Gas | 571 (56.9%) | 297 (62.8%) |
| Bottled, Tank, or LP Gas | 49 (4.9%) | 33 (7.0%) |
| Electricity | 332 (33.1%) | 140 (29.6%) |
| Fuel Oil or Kerosene | 0 (0.0%) | 0 (0.0%) |
| Coal or Coke | 0 (0.0%) | 0 (0.0%) |
| All other Fuels | 52 (5.2%) | 0 (0.0%) |
| No Fuel Used | 0 (0.0%) | 3 (0.6%) |
| Total | 1,004 (100.0%) | 473 (100.0%) |
Household Vehicle Usage in Baylor County
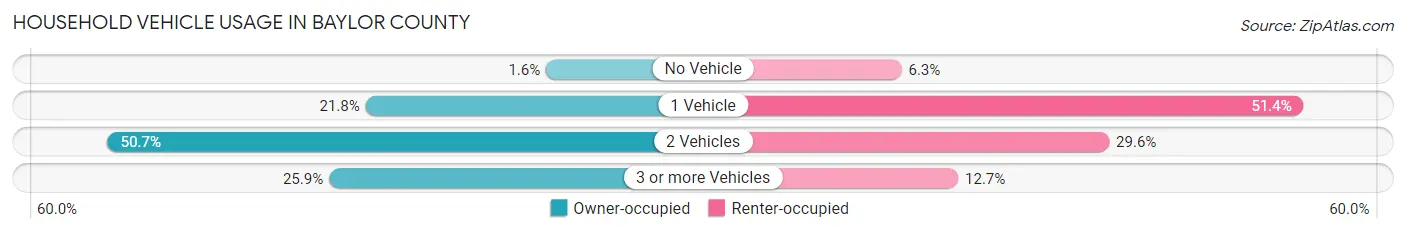
| Vehicles per Household | Owner-occupied | Renter-occupied |
| No Vehicle | 16 (1.6%) | 30 (6.3%) |
| 1 Vehicle | 219 (21.8%) | 243 (51.4%) |
| 2 Vehicles | 509 (50.7%) | 140 (29.6%) |
| 3 or more Vehicles | 260 (25.9%) | 60 (12.7%) |
| Total | 1,004 (100.0%) | 473 (100.0%) |
Real Estate & Mortgages in Baylor County
Real Estate and Mortgage Overview in Baylor County
| Characteristic | Without Mortgage | With Mortgage |
| Housing Units | 773 | 231 |
| Median Property Value | $83,600 | $261,100 |
| Median Household Income | $52,674 | $37 |
| Monthly Housing Costs | $492 | $49 |
| Real Estate Taxes | $978 | $6 |
Property Value by Mortgage Status in Baylor County
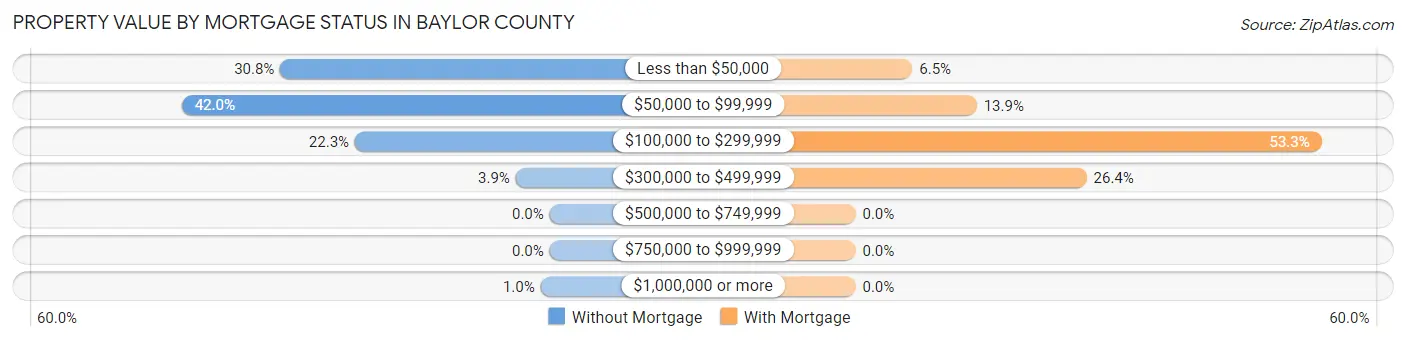
| Property Value | Without Mortgage | With Mortgage |
| Less than $50,000 | 238 (30.8%) | 15 (6.5%) |
| $50,000 to $99,999 | 325 (42.0%) | 32 (13.9%) |
| $100,000 to $299,999 | 172 (22.3%) | 123 (53.2%) |
| $300,000 to $499,999 | 30 (3.9%) | 61 (26.4%) |
| $500,000 to $749,999 | 0 (0.0%) | 0 (0.0%) |
| $750,000 to $999,999 | 0 (0.0%) | 0 (0.0%) |
| $1,000,000 or more | 8 (1.0%) | 0 (0.0%) |
| Total | 773 (100.0%) | 231 (100.0%) |
Household Income by Mortgage Status in Baylor County
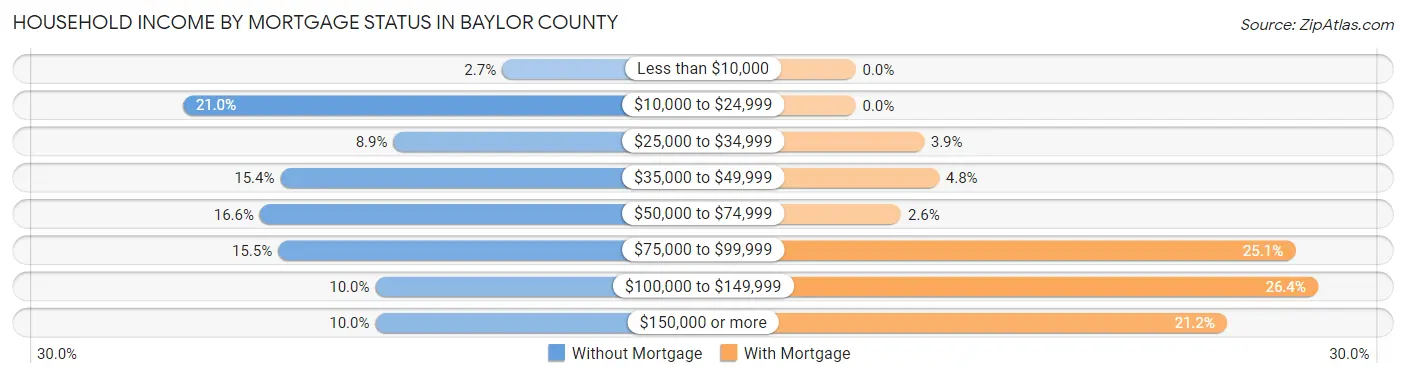
| Household Income | Without Mortgage | With Mortgage |
| Less than $10,000 | 21 (2.7%) | 0 (0.0%) |
| $10,000 to $24,999 | 162 (21.0%) | 0 (0.0%) |
| $25,000 to $34,999 | 69 (8.9%) | 9 (3.9%) |
| $35,000 to $49,999 | 119 (15.4%) | 11 (4.8%) |
| $50,000 to $74,999 | 128 (16.6%) | 6 (2.6%) |
| $75,000 to $99,999 | 120 (15.5%) | 58 (25.1%) |
| $100,000 to $149,999 | 77 (10.0%) | 61 (26.4%) |
| $150,000 or more | 77 (10.0%) | 49 (21.2%) |
| Total | 773 (100.0%) | 231 (100.0%) |
Property Value to Household Income Ratio in Baylor County
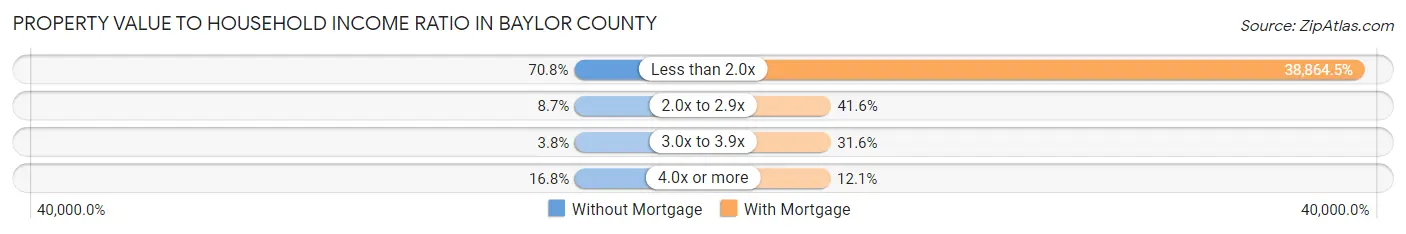
| Value-to-Income Ratio | Without Mortgage | With Mortgage |
| Less than 2.0x | 547 (70.8%) | 89,777 (38,864.5%) |
| 2.0x to 2.9x | 67 (8.7%) | 96 (41.6%) |
| 3.0x to 3.9x | 29 (3.7%) | 73 (31.6%) |
| 4.0x or more | 130 (16.8%) | 28 (12.1%) |
| Total | 773 (100.0%) | 231 (100.0%) |
Real Estate Taxes by Mortgage Status in Baylor County
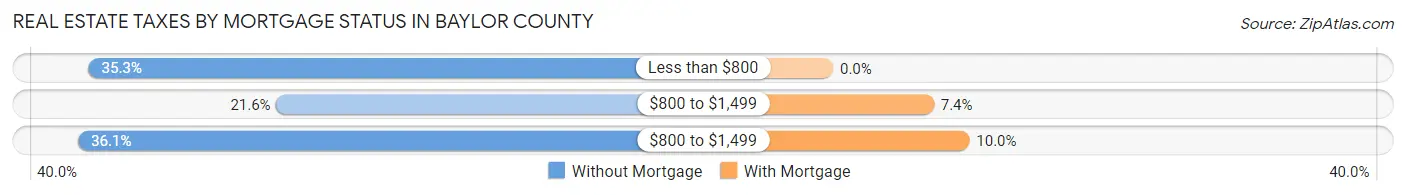
| Property Taxes | Without Mortgage | With Mortgage |
| Less than $800 | 273 (35.3%) | 0 (0.0%) |
| $800 to $1,499 | 167 (21.6%) | 17 (7.4%) |
| $800 to $1,499 | 279 (36.1%) | 23 (10.0%) |
| Total | 773 (100.0%) | 231 (100.0%) |
Health & Disability in Baylor County
Health Insurance Coverage by Age in Baylor County
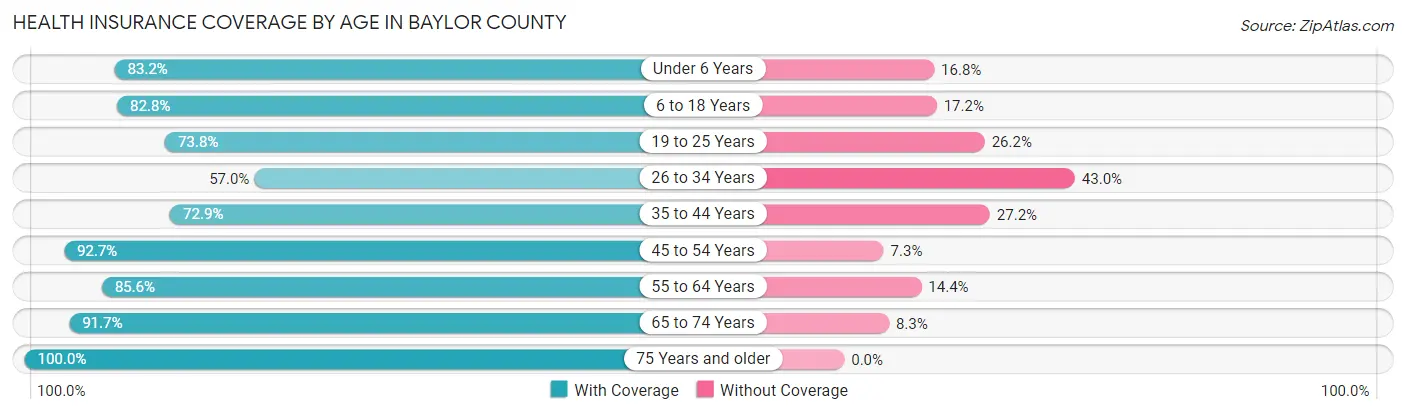
| Age Bracket | With Coverage | Without Coverage |
| Under 6 Years | 144 (83.2%) | 29 (16.8%) |
| 6 to 18 Years | 533 (82.8%) | 111 (17.2%) |
| 19 to 25 Years | 155 (73.8%) | 55 (26.2%) |
| 26 to 34 Years | 118 (57.0%) | 89 (43.0%) |
| 35 to 44 Years | 330 (72.9%) | 123 (27.2%) |
| 45 to 54 Years | 341 (92.7%) | 27 (7.3%) |
| 55 to 64 Years | 500 (85.6%) | 84 (14.4%) |
| 65 to 74 Years | 396 (91.7%) | 36 (8.3%) |
| 75 Years and older | 325 (100.0%) | 0 (0.0%) |
| Total | 2,842 (83.7%) | 554 (16.3%) |
Health Insurance Coverage by Citizenship Status in Baylor County
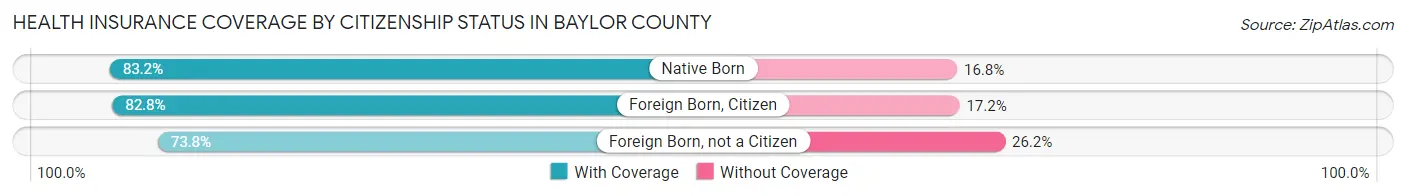
| Citizenship Status | With Coverage | Without Coverage |
| Native Born | 144 (83.2%) | 29 (16.8%) |
| Foreign Born, Citizen | 533 (82.8%) | 111 (17.2%) |
| Foreign Born, not a Citizen | 155 (73.8%) | 55 (26.2%) |
Health Insurance Coverage by Household Income in Baylor County
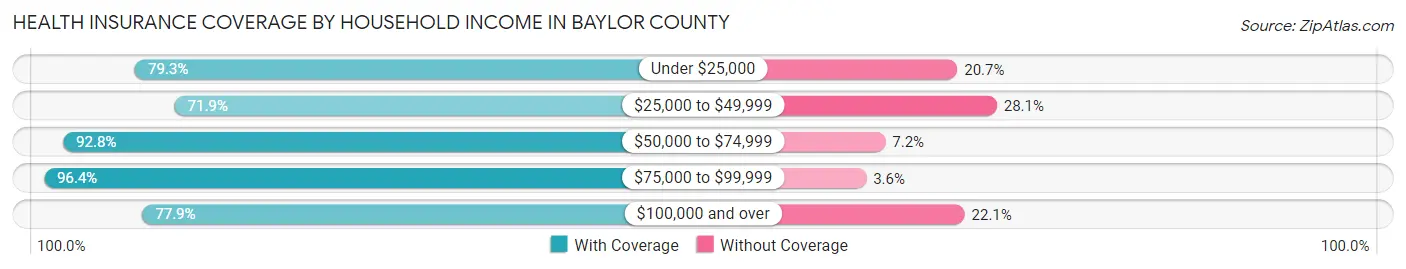
| Household Income | With Coverage | Without Coverage |
| Under $25,000 | 410 (79.3%) | 107 (20.7%) |
| $25,000 to $49,999 | 468 (71.9%) | 183 (28.1%) |
| $50,000 to $74,999 | 629 (92.8%) | 49 (7.2%) |
| $75,000 to $99,999 | 664 (96.4%) | 25 (3.6%) |
| $100,000 and over | 671 (77.9%) | 190 (22.1%) |
Public vs Private Health Insurance Coverage by Age in Baylor County
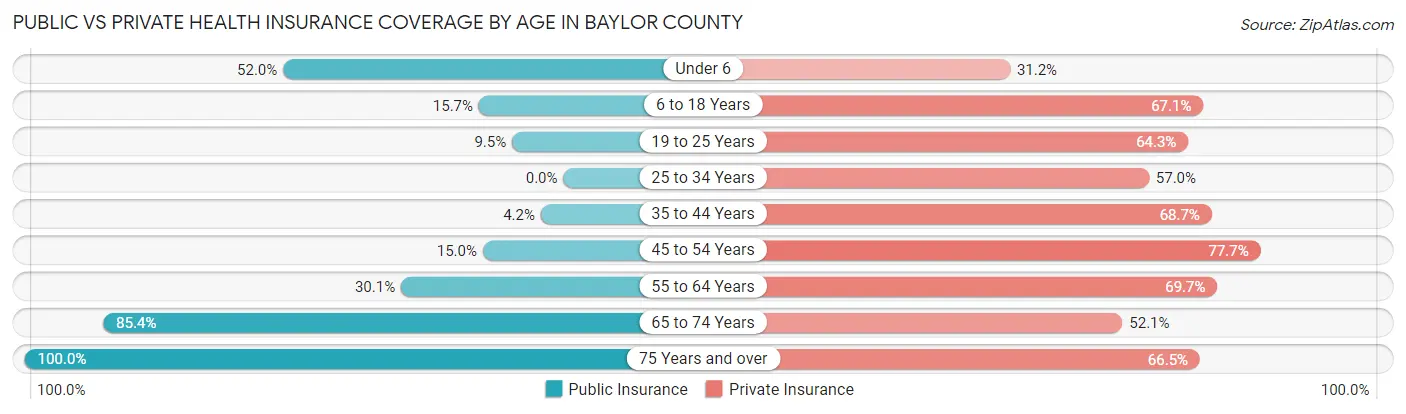
| Age Bracket | Public Insurance | Private Insurance |
| Under 6 | 90 (52.0%) | 54 (31.2%) |
| 6 to 18 Years | 101 (15.7%) | 432 (67.1%) |
| 19 to 25 Years | 20 (9.5%) | 135 (64.3%) |
| 25 to 34 Years | 0 (0.0%) | 118 (57.0%) |
| 35 to 44 Years | 19 (4.2%) | 311 (68.6%) |
| 45 to 54 Years | 55 (14.9%) | 286 (77.7%) |
| 55 to 64 Years | 176 (30.1%) | 407 (69.7%) |
| 65 to 74 Years | 369 (85.4%) | 225 (52.1%) |
| 75 Years and over | 325 (100.0%) | 216 (66.5%) |
| Total | 1,155 (34.0%) | 2,184 (64.3%) |
Disability Status by Sex by Age in Baylor County
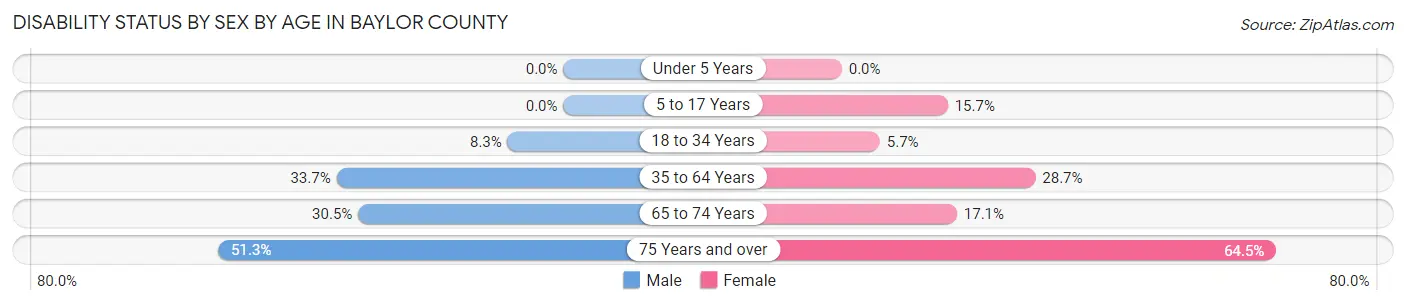
| Age Bracket | Male | Female |
| Under 5 Years | 0 (0.0%) | 0 (0.0%) |
| 5 to 17 Years | 0 (0.0%) | 42 (15.7%) |
| 18 to 34 Years | 14 (8.3%) | 14 (5.7%) |
| 35 to 64 Years | 219 (33.7%) | 217 (28.7%) |
| 65 to 74 Years | 71 (30.5%) | 34 (17.1%) |
| 75 Years and over | 80 (51.3%) | 109 (64.5%) |
Disability Class by Sex by Age in Baylor County
Disability Class: Hearing Difficulty
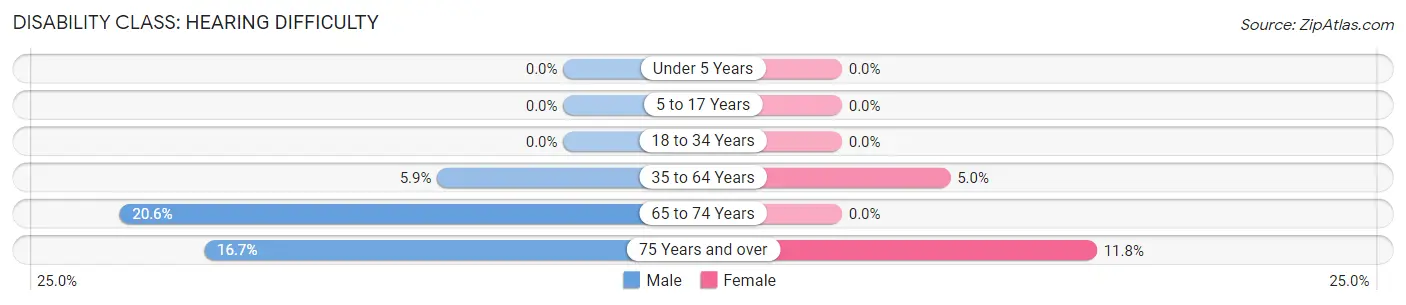
| Age Bracket | Male | Female |
| Under 5 Years | 0 (0.0%) | 0 (0.0%) |
| 5 to 17 Years | 0 (0.0%) | 0 (0.0%) |
| 18 to 34 Years | 0 (0.0%) | 0 (0.0%) |
| 35 to 64 Years | 38 (5.9%) | 38 (5.0%) |
| 65 to 74 Years | 48 (20.6%) | 0 (0.0%) |
| 75 Years and over | 26 (16.7%) | 20 (11.8%) |
Disability Class: Vision Difficulty
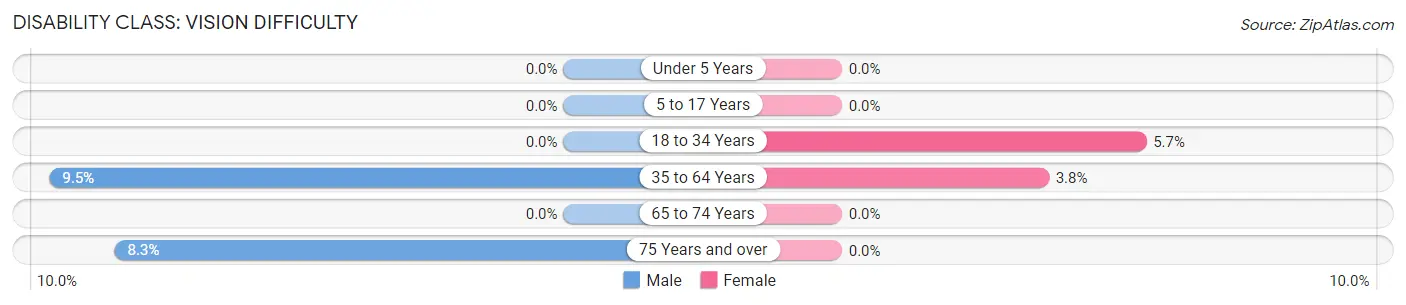
| Age Bracket | Male | Female |
| Under 5 Years | 0 (0.0%) | 0 (0.0%) |
| 5 to 17 Years | 0 (0.0%) | 0 (0.0%) |
| 18 to 34 Years | 0 (0.0%) | 14 (5.7%) |
| 35 to 64 Years | 62 (9.5%) | 29 (3.8%) |
| 65 to 74 Years | 0 (0.0%) | 0 (0.0%) |
| 75 Years and over | 13 (8.3%) | 0 (0.0%) |
Disability Class: Cognitive Difficulty
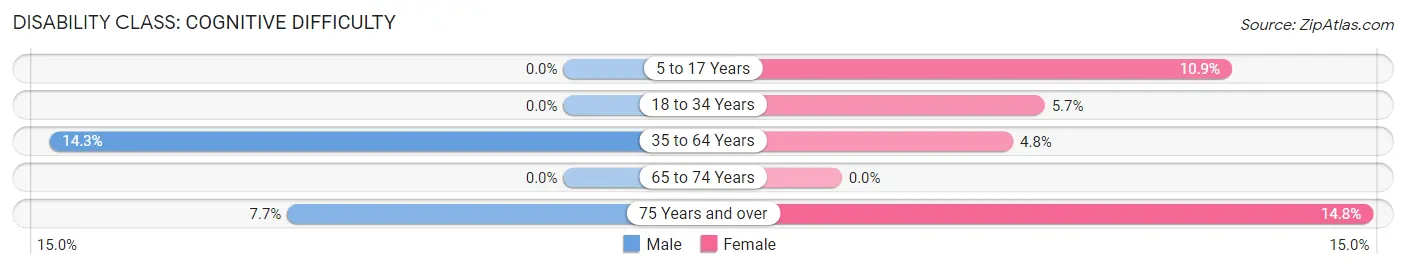
| Age Bracket | Male | Female |
| 5 to 17 Years | 0 (0.0%) | 29 (10.9%) |
| 18 to 34 Years | 0 (0.0%) | 14 (5.7%) |
| 35 to 64 Years | 93 (14.3%) | 36 (4.8%) |
| 65 to 74 Years | 0 (0.0%) | 0 (0.0%) |
| 75 Years and over | 12 (7.7%) | 25 (14.8%) |
Disability Class: Ambulatory Difficulty
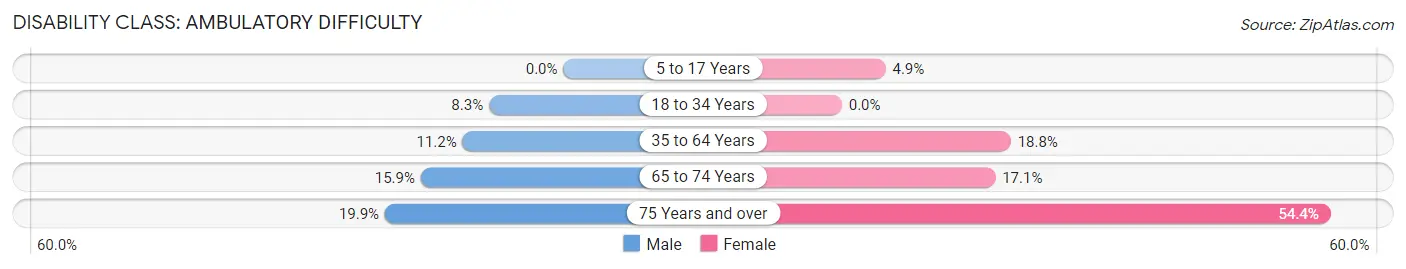
| Age Bracket | Male | Female |
| 5 to 17 Years | 0 (0.0%) | 13 (4.9%) |
| 18 to 34 Years | 14 (8.3%) | 0 (0.0%) |
| 35 to 64 Years | 73 (11.2%) | 142 (18.8%) |
| 65 to 74 Years | 37 (15.9%) | 34 (17.1%) |
| 75 Years and over | 31 (19.9%) | 92 (54.4%) |
Disability Class: Self-Care Difficulty
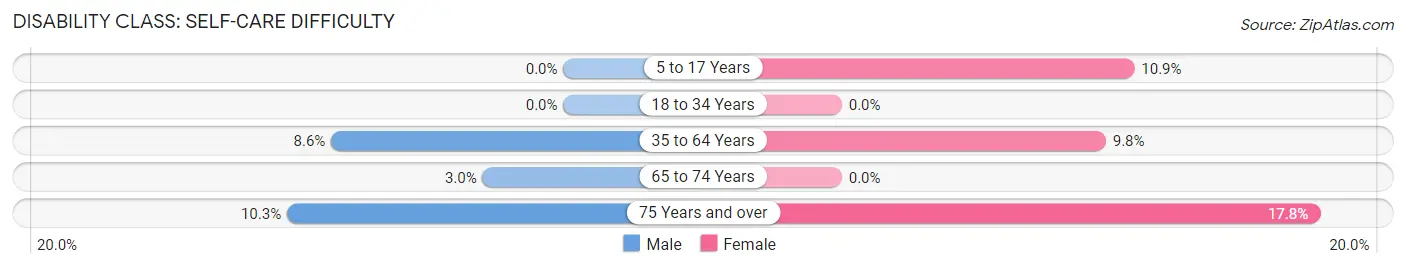
| Age Bracket | Male | Female |
| 5 to 17 Years | 0 (0.0%) | 29 (10.9%) |
| 18 to 34 Years | 0 (0.0%) | 0 (0.0%) |
| 35 to 64 Years | 56 (8.6%) | 74 (9.8%) |
| 65 to 74 Years | 7 (3.0%) | 0 (0.0%) |
| 75 Years and over | 16 (10.3%) | 30 (17.7%) |
Technology Access in Baylor County
Computing Device Access in Baylor County
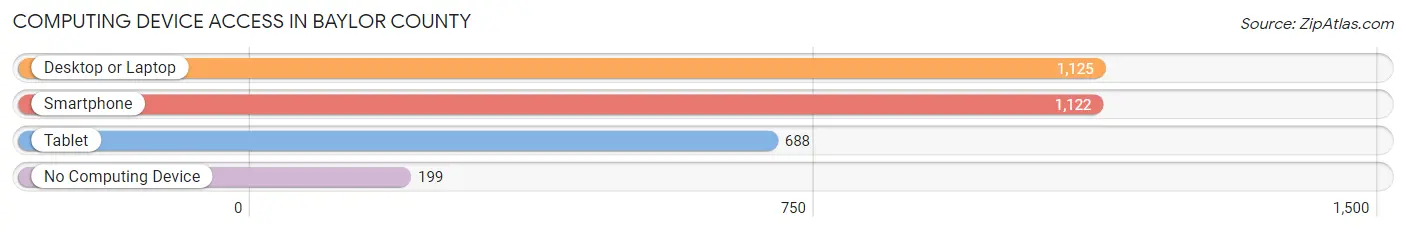
| Device Type | # Households | % Households |
| Desktop or Laptop | 1,125 | 76.2% |
| Smartphone | 1,122 | 76.0% |
| Tablet | 688 | 46.6% |
| No Computing Device | 199 | 13.5% |
| Total | 1,477 | 100.0% |
Internet Access in Baylor County
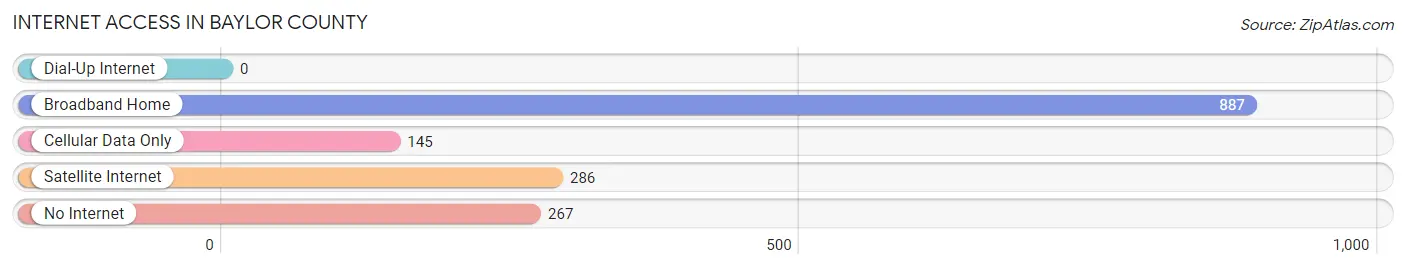
| Internet Type | # Households | % Households |
| Dial-Up Internet | 0 | 0.0% |
| Broadband Home | 887 | 60.1% |
| Cellular Data Only | 145 | 9.8% |
| Satellite Internet | 286 | 19.4% |
| No Internet | 267 | 18.1% |
| Total | 1,477 | 100.0% |
Baylor County Summary
Baylor County is located in the northern part of Texas, in the United States. It is bordered by Wilbarger County to the north, Archer County to the east, Throckmorton County to the south, and Knox County to the west. The county seat is Seymour, and the largest city is Seymour. As of the 2010 census, the population was 3,726, making it the second-least populous county in Texas.
History
Baylor County was established in 1858 and named for Henry W. Baylor, a surgeon in the Texas Revolution. The county was originally part of Fannin County, but was later divided into its own county. The first county seat was located in the town of Belknap, but it was moved to Seymour in 1879.
Geography
Baylor County is located in the northern part of Texas, in the United States. It is bordered by Wilbarger County to the north, Archer County to the east, Throckmorton County to the south, and Knox County to the west. The county has a total area of 890 square miles, of which 889 square miles is land and 1.2 square miles is water.
The terrain of Baylor County is mostly flat, with some rolling hills in the western part of the county. The county is drained by the Red River, which forms its northern border. The county is also home to several small lakes, including Lake Kemp, Lake Arrowhead, and Lake Graham.
Economy
Agriculture is the main economic activity in Baylor County. The county is home to several large farms, which produce cotton, wheat, corn, and other crops. Cattle ranching is also an important part of the local economy.
The county is also home to several oil and gas fields, which produce natural gas and crude oil. The county is home to several oil and gas companies, including Chevron, ExxonMobil, and ConocoPhillips.
Demographics
As of the 2010 census, there were 3,726 people, 1,521 households, and 1,039 families living in Baylor County. The population density was 4.2 people per square mile. The racial makeup of the county was 92.3% White, 0.3% African American, 0.7% Native American, 0.2% Asian, 0.1% Pacific Islander, 5.2% from other races, and 1.3% from two or more races. Hispanic or Latino of any race were 11.3% of the population.
The median income for a household in the county was $37,917, and the median income for a family was $45,938. The per capita income for the county was $18,945. About 11.3% of families and 14.2% of the population were below the poverty line, including 17.2% of those under age 18 and 11.2% of those age 65 or over.
Common Questions
What is Per Capita Income in Baylor County?
Per Capita income in Baylor County is $31,392.
What is the Median Family Income in Baylor County?
Median Family Income in Baylor County is $73,462.
What is the Median Household income in Baylor County?
Median Household Income in Baylor County is $52,716.
What is Income or Wage Gap in Baylor County?
Income or Wage Gap in Baylor County is 36.8%.
Women in Baylor County earn 63.2 cents for every dollar earned by a man.
What is Inequality or Gini Index in Baylor County?
Inequality or Gini Index in Baylor County is 0.48.
What is the Total Population of Baylor County?
Total Population of Baylor County is 3,475.
What is the Total Male Population of Baylor County?
Total Male Population of Baylor County is 1,738.
What is the Total Female Population of Baylor County?
Total Female Population of Baylor County is 1,737.
What is the Ratio of Males per 100 Females in Baylor County?
There are 100.06 Males per 100 Females in Baylor County.
What is the Ratio of Females per 100 Males in Baylor County?
There are 99.94 Females per 100 Males in Baylor County.
What is the Median Population Age in Baylor County?
Median Population Age in Baylor County is 46.7 Years.
What is the Average Family Size in Baylor County
Average Family Size in Baylor County is 2.9 People.
What is the Average Household Size in Baylor County
Average Household Size in Baylor County is 2.3 People.
How Large is the Labor Force in Baylor County?
There are 1,507 People in the Labor Forcein in Baylor County.
What is the Percentage of People in the Labor Force in Baylor County?
54.0% of People are in the Labor Force in Baylor County.
What is the Unemployment Rate in Baylor County?
Unemployment Rate in Baylor County is 1.1%.