Bandera County, TX Map & Demographics
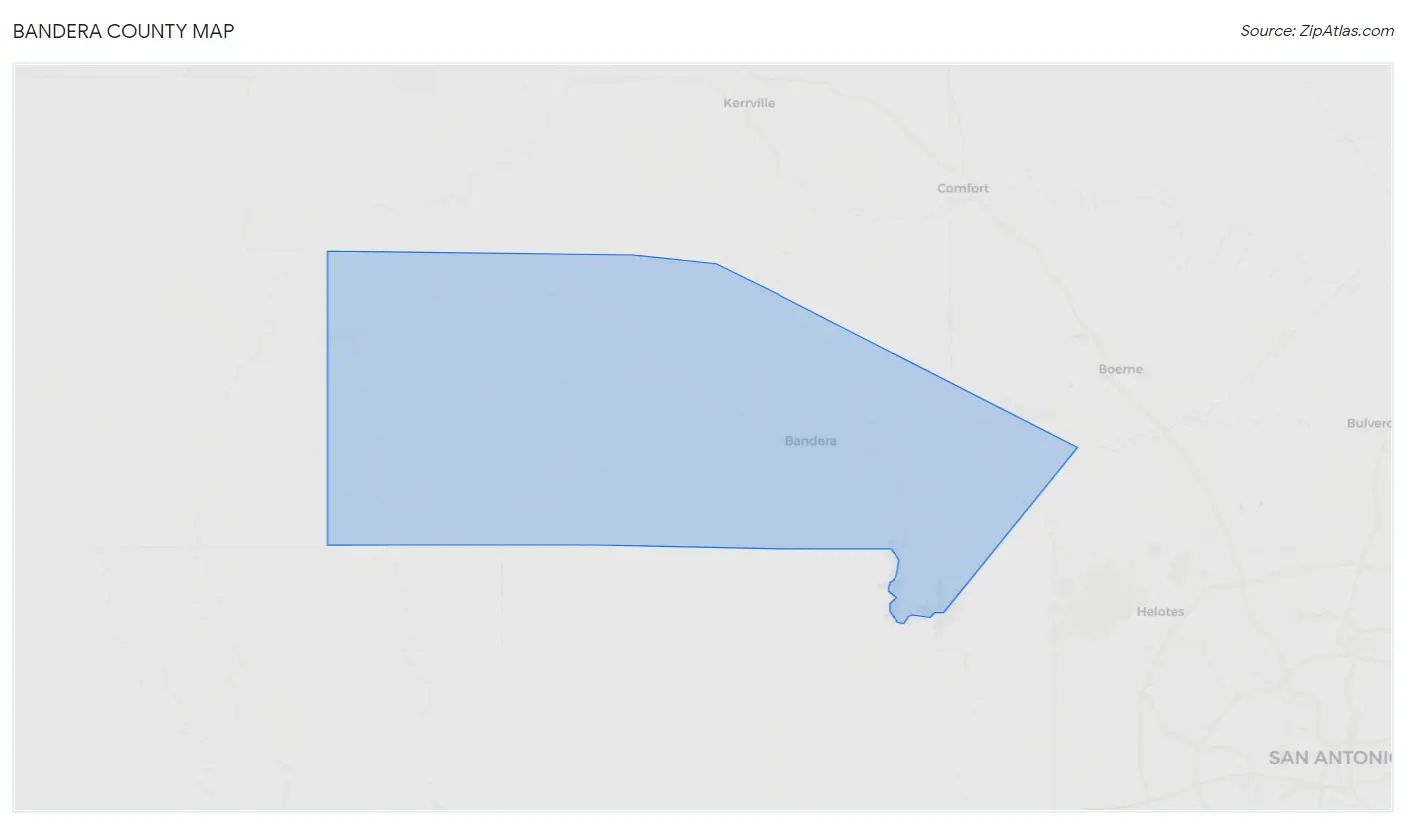
Bandera County Map
Bandera County Overview
$39,162
PER CAPITA INCOME
$85,710
AVG FAMILY INCOME
$70,965
AVG HOUSEHOLD INCOME
40.4%
WAGE / INCOME GAP [ % ]
59.6¢/ $1
WAGE / INCOME GAP [ $ ]
0.46
INEQUALITY / GINI INDEX
21,182
TOTAL POPULATION
10,479
MALE POPULATION
10,703
FEMALE POPULATION
97.91
MALES / 100 FEMALES
102.14
FEMALES / 100 MALES
53.4
MEDIAN AGE
2.9
AVG FAMILY SIZE
2.4
AVG HOUSEHOLD SIZE
9,853
LABOR FORCE [ PEOPLE ]
54.4%
PERCENT IN LABOR FORCE
6.7%
UNEMPLOYMENT RATE
Bandera County Area Codes
Income in Bandera County
Income Overview in Bandera County
Per Capita Income in Bandera County is $39,162, while median incomes of families and households are $85,710 and $70,965 respectively.
| Characteristic | Number | Measure |
| Per Capita Income | 21,182 | $39,162 |
| Median Family Income | 5,675 | $85,710 |
| Mean Family Income | 5,675 | $107,160 |
| Median Household Income | 8,532 | $70,965 |
| Mean Household Income | 8,532 | $93,223 |
| Income Deficit | 5,675 | $0 |
| Wage / Income Gap (%) | 21,182 | 40.43% |
| Wage / Income Gap ($) | 21,182 | 59.57¢ per $1 |
| Gini / Inequality Index | 21,182 | 0.46 |
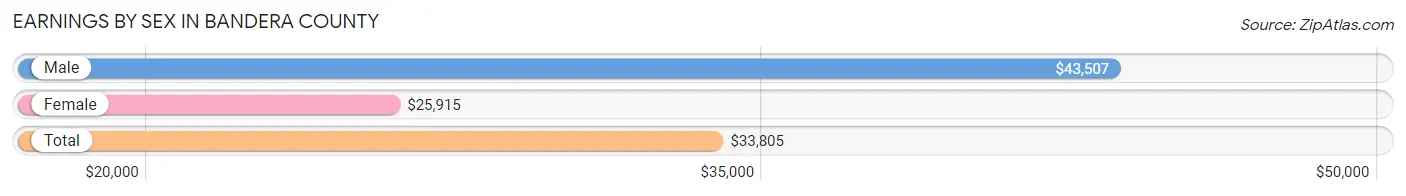
Earnings by Sex in Bandera County
Average Earnings in Bandera County are $33,805, $43,507 for men and $25,915 for women, a difference of 40.4%.
| Sex | Number | Average Earnings |
| Male | 5,437 (52.6%) | $43,507 |
| Female | 4,890 (47.3%) | $25,915 |
| Total | 10,327 (100.0%) | $33,805 |
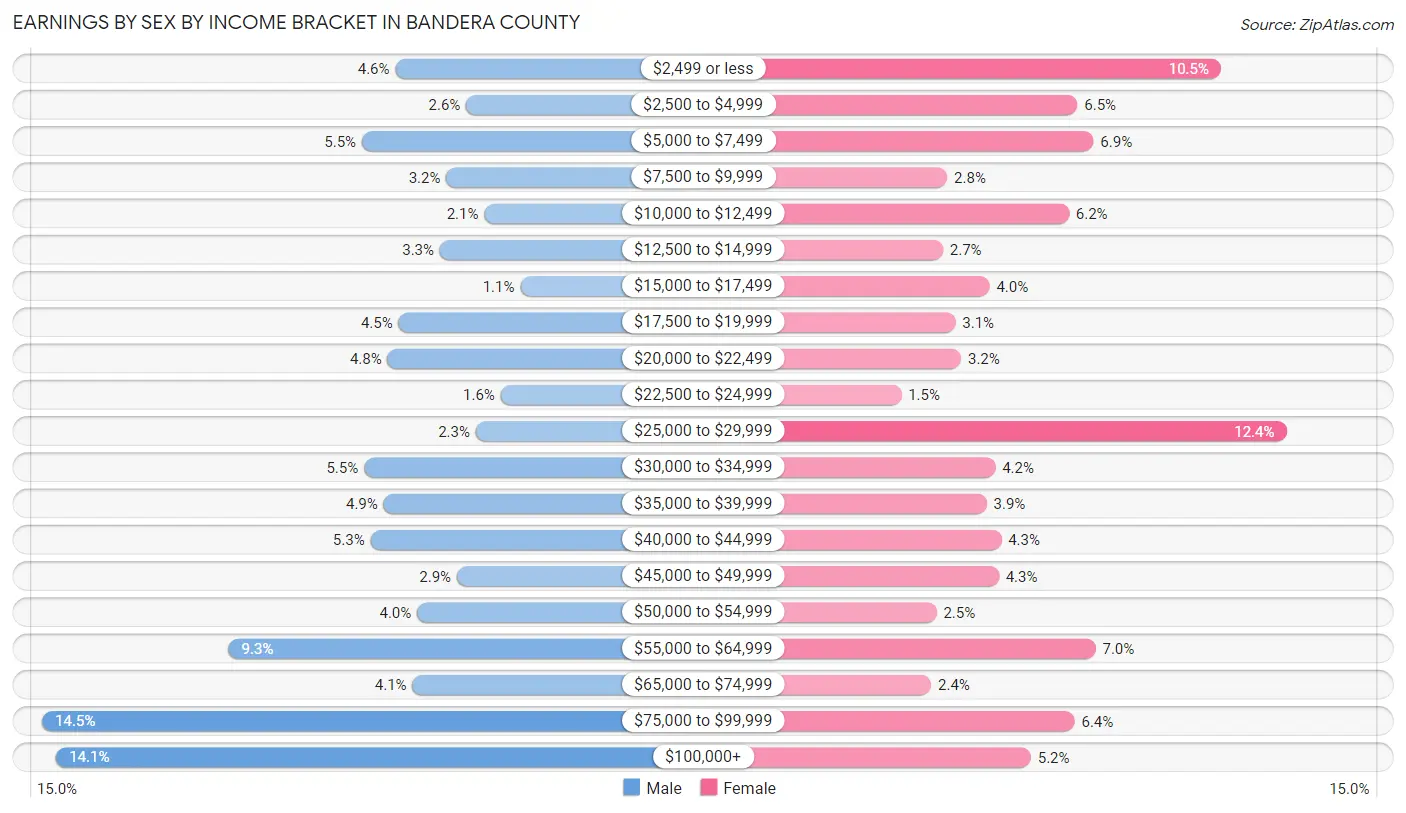
Earnings by Sex by Income Bracket in Bandera County
The most common earnings brackets in Bandera County are $75,000 to $99,999 for men (789 | 14.5%) and $25,000 to $29,999 for women (604 | 12.3%).
| Income | Male | Female |
| $2,499 or less | 249 (4.6%) | 514 (10.5%) |
| $2,500 to $4,999 | 141 (2.6%) | 317 (6.5%) |
| $5,000 to $7,499 | 300 (5.5%) | 339 (6.9%) |
| $7,500 to $9,999 | 171 (3.2%) | 138 (2.8%) |
| $10,000 to $12,499 | 113 (2.1%) | 305 (6.2%) |
| $12,500 to $14,999 | 181 (3.3%) | 132 (2.7%) |
| $15,000 to $17,499 | 58 (1.1%) | 196 (4.0%) |
| $17,500 to $19,999 | 244 (4.5%) | 149 (3.0%) |
| $20,000 to $22,499 | 261 (4.8%) | 157 (3.2%) |
| $22,500 to $24,999 | 88 (1.6%) | 75 (1.5%) |
| $25,000 to $29,999 | 126 (2.3%) | 604 (12.3%) |
| $30,000 to $34,999 | 297 (5.5%) | 204 (4.2%) |
| $35,000 to $39,999 | 267 (4.9%) | 192 (3.9%) |
| $40,000 to $44,999 | 287 (5.3%) | 212 (4.3%) |
| $45,000 to $49,999 | 155 (2.9%) | 209 (4.3%) |
| $50,000 to $54,999 | 216 (4.0%) | 123 (2.5%) |
| $55,000 to $64,999 | 504 (9.3%) | 342 (7.0%) |
| $65,000 to $74,999 | 223 (4.1%) | 116 (2.4%) |
| $75,000 to $99,999 | 789 (14.5%) | 313 (6.4%) |
| $100,000+ | 767 (14.1%) | 253 (5.2%) |
| Total | 5,437 (100.0%) | 4,890 (100.0%) |
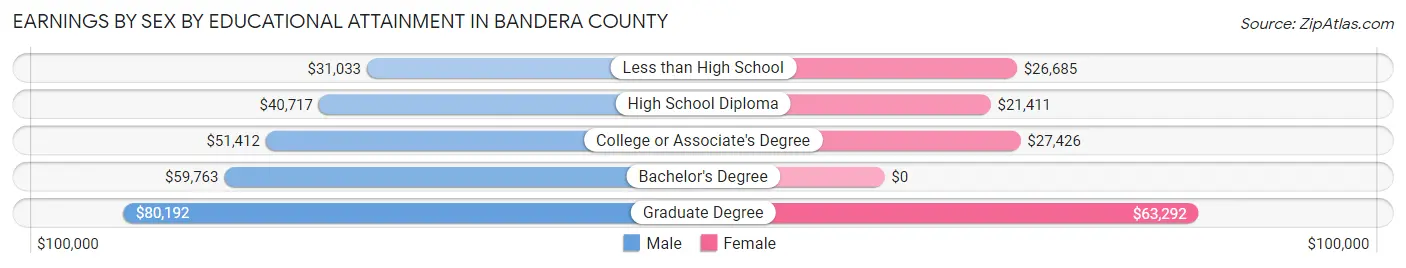
Earnings by Sex by Educational Attainment in Bandera County
Average earnings in Bandera County are $49,435 for men and $27,300 for women, a difference of 44.8%. Men with an educational attainment of graduate degree enjoy the highest average annual earnings of $80,192, while those with less than high school education earn the least with $31,033. Women with an educational attainment of graduate degree earn the most with the average annual earnings of $63,292, while those with high school diploma education have the smallest earnings of $21,411.
| Educational Attainment | Male Income | Female Income |
| Less than High School | $31,033 | $26,685 |
| High School Diploma | $40,717 | $21,411 |
| College or Associate's Degree | $51,412 | $27,426 |
| Bachelor's Degree | $59,763 | $0 |
| Graduate Degree | $80,192 | $63,292 |
| Total | $49,435 | $27,300 |
Family Income in Bandera County
Family Income Brackets in Bandera County
According to the Bandera County family income data, there are 1,118 families falling into the $50,000 to $74,999 income range, which is the most common income bracket and makes up 19.7% of all families. Conversely, the $15,000 to $24,999 income bracket is the least frequent group with only 176 families (3.1%) belonging to this category.
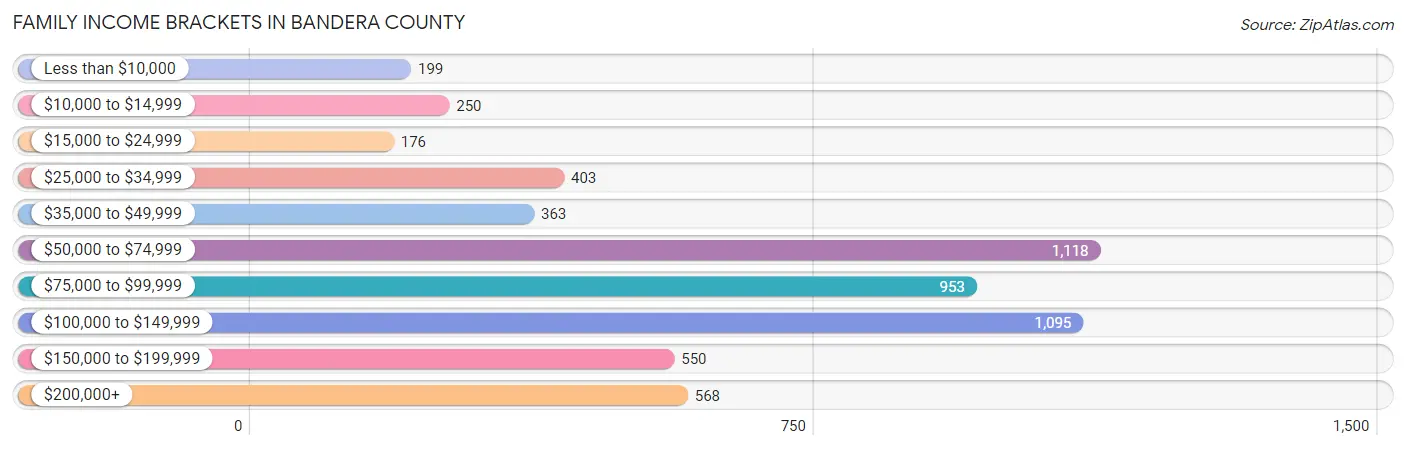
| Income Bracket | # Families | % Families |
| Less than $10,000 | 199 | 3.5% |
| $10,000 to $14,999 | 250 | 4.4% |
| $15,000 to $24,999 | 176 | 3.1% |
| $25,000 to $34,999 | 403 | 7.1% |
| $35,000 to $49,999 | 363 | 6.4% |
| $50,000 to $74,999 | 1,118 | 19.7% |
| $75,000 to $99,999 | 953 | 16.8% |
| $100,000 to $149,999 | 1,095 | 19.3% |
| $150,000 to $199,999 | 550 | 9.7% |
| $200,000+ | 568 | 10.0% |
Family Income by Famaliy Size in Bandera County
4-person families (516 | 9.1%) account for the highest median family income in Bandera County with $127,857 per family, while 2-person families (3,301 | 58.2%) have the highest median income of $36,318 per family member.
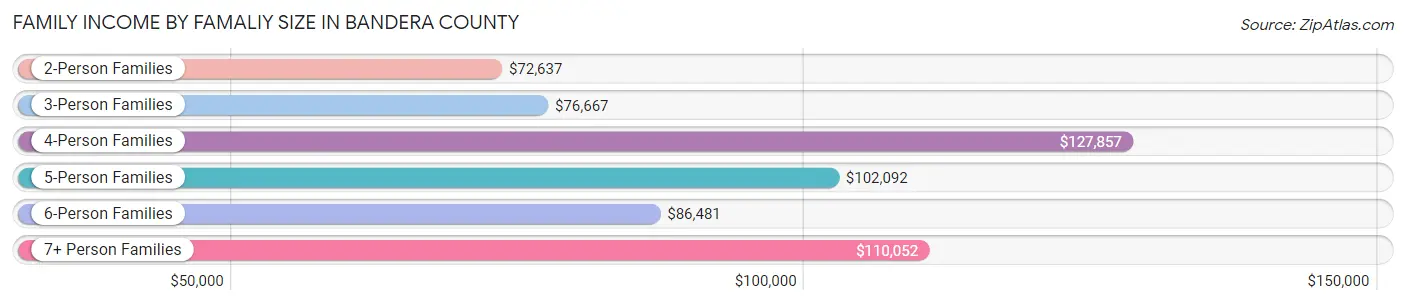
| Income Bracket | # Families | Median Income |
| 2-Person Families | 3,301 (58.2%) | $72,637 |
| 3-Person Families | 1,266 (22.3%) | $76,667 |
| 4-Person Families | 516 (9.1%) | $127,857 |
| 5-Person Families | 275 (4.9%) | $102,092 |
| 6-Person Families | 252 (4.4%) | $86,481 |
| 7+ Person Families | 65 (1.1%) | $110,052 |
| Total | 5,675 (100.0%) | $85,710 |
Family Income by Number of Earners in Bandera County
The median family income in Bandera County is $85,710, with families comprising 3+ earners (658) having the highest median family income of $123,397, while families with no earners (1,383) have the lowest median family income of $55,708, accounting for 11.6% and 24.4% of families, respectively.
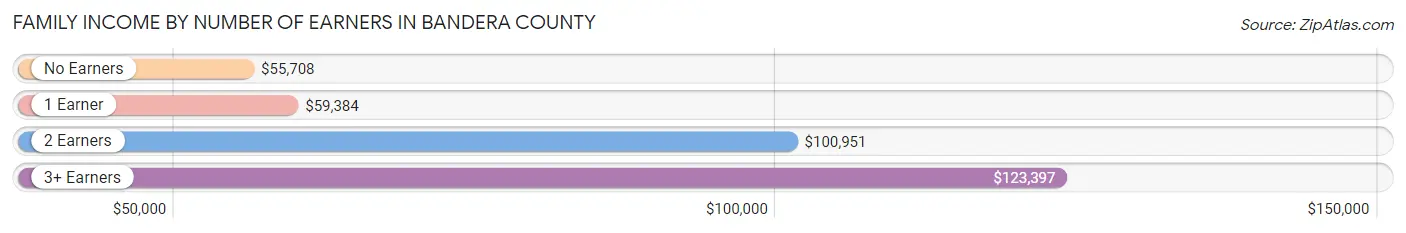
| Number of Earners | # Families | Median Income |
| No Earners | 1,383 (24.4%) | $55,708 |
| 1 Earner | 1,597 (28.1%) | $59,384 |
| 2 Earners | 2,037 (35.9%) | $100,951 |
| 3+ Earners | 658 (11.6%) | $123,397 |
| Total | 5,675 (100.0%) | $85,710 |
Household Income in Bandera County
Household Income Brackets in Bandera County
With 1,519 households falling in the category, the $50,000 to $74,999 income range is the most frequent in Bandera County, accounting for 17.8% of all households. In contrast, only 367 households (4.3%) fall into the less than $10,000 income bracket, making it the least populous group.
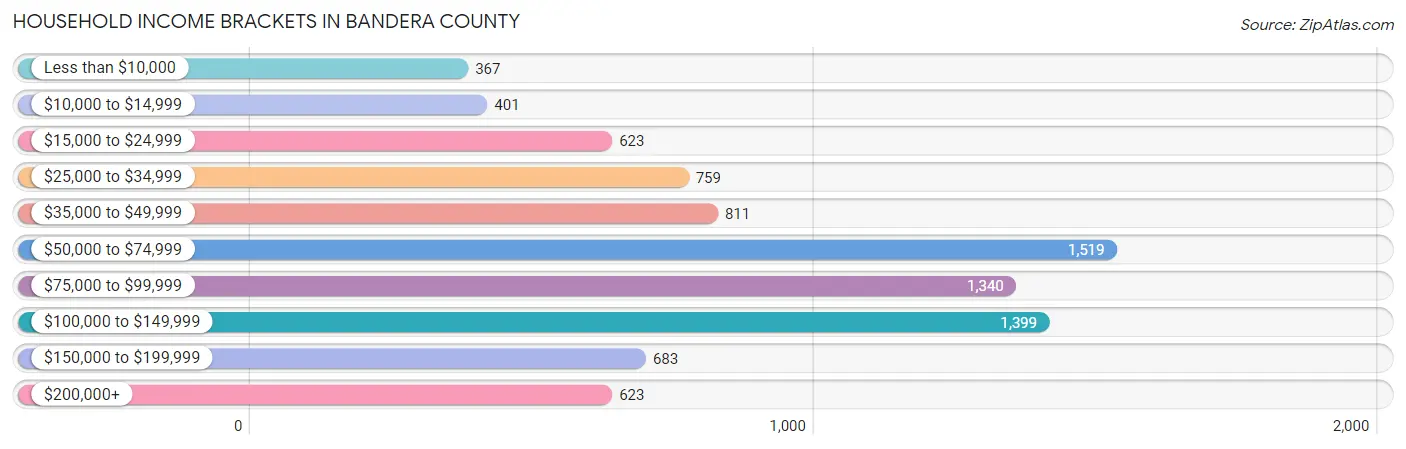
| Income Bracket | # Households | % Households |
| Less than $10,000 | 367 | 4.3% |
| $10,000 to $14,999 | 401 | 4.7% |
| $15,000 to $24,999 | 623 | 7.3% |
| $25,000 to $34,999 | 759 | 8.9% |
| $35,000 to $49,999 | 811 | 9.5% |
| $50,000 to $74,999 | 1,519 | 17.8% |
| $75,000 to $99,999 | 1,340 | 15.7% |
| $100,000 to $149,999 | 1,399 | 16.4% |
| $150,000 to $199,999 | 683 | 8.0% |
| $200,000+ | 623 | 7.3% |
Household Income by Householder Age in Bandera County
The median household income in Bandera County is $70,965, with the highest median household income of $87,123 found in the 25 to 44 years age bracket for the primary householder. A total of 1,123 households (13.2%) fall into this category. Meanwhile, the 15 to 24 years age bracket for the primary householder has the lowest median household income of $0, with 84 households (1.0%) in this group.
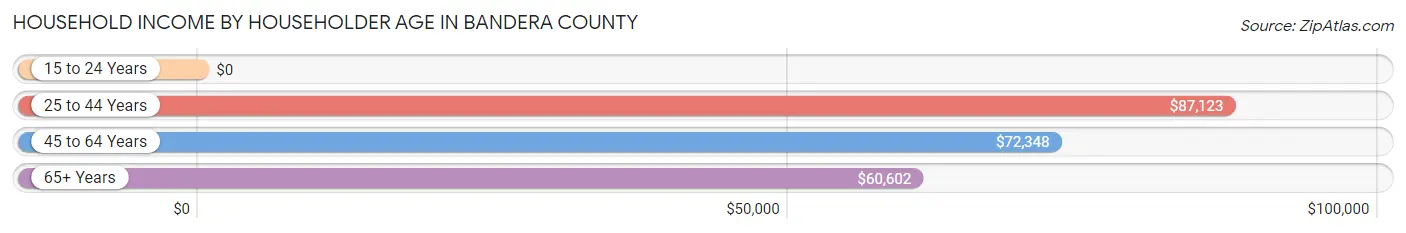
| Income Bracket | # Households | Median Income |
| 15 to 24 Years | 84 (1.0%) | $0 |
| 25 to 44 Years | 1,123 (13.2%) | $87,123 |
| 45 to 64 Years | 3,563 (41.8%) | $72,348 |
| 65+ Years | 3,762 (44.1%) | $60,602 |
| Total | 8,532 (100.0%) | $70,965 |
Poverty in Bandera County
Income Below Poverty by Sex and Age in Bandera County
With 14.4% poverty level for males and 14.1% for females among the residents of Bandera County, 18 to 24 year old males and 16 and 17 year old females are the most vulnerable to poverty, with 233 males (34.9%) and 147 females (50.9%) in their respective age groups living below the poverty level.
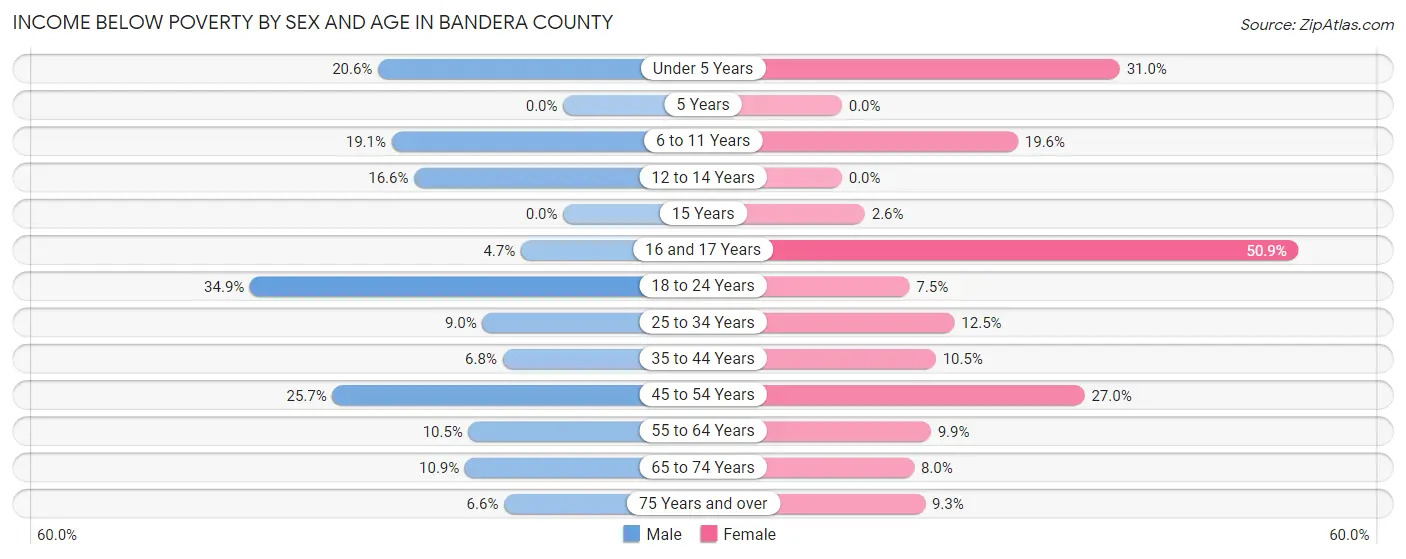
| Age Bracket | Male | Female |
| Under 5 Years | 73 (20.6%) | 117 (30.9%) |
| 5 Years | 0 (0.0%) | 0 (0.0%) |
| 6 to 11 Years | 154 (19.1%) | 132 (19.6%) |
| 12 to 14 Years | 41 (16.6%) | 0 (0.0%) |
| 15 Years | 0 (0.0%) | 1 (2.6%) |
| 16 and 17 Years | 9 (4.7%) | 147 (50.9%) |
| 18 to 24 Years | 233 (34.9%) | 51 (7.5%) |
| 25 to 34 Years | 67 (9.0%) | 87 (12.5%) |
| 35 to 44 Years | 63 (6.8%) | 106 (10.5%) |
| 45 to 54 Years | 374 (25.7%) | 382 (27.0%) |
| 55 to 64 Years | 198 (10.5%) | 214 (9.9%) |
| 65 to 74 Years | 197 (10.9%) | 142 (8.0%) |
| 75 Years and over | 73 (6.6%) | 107 (9.3%) |
| Total | 1,482 (14.4%) | 1,486 (14.1%) |
Income Above Poverty by Sex and Age in Bandera County
According to the poverty statistics in Bandera County, males aged 5 years and females aged 5 years are the age groups that are most secure financially, with 100.0% of males and 100.0% of females in these age groups living above the poverty line.
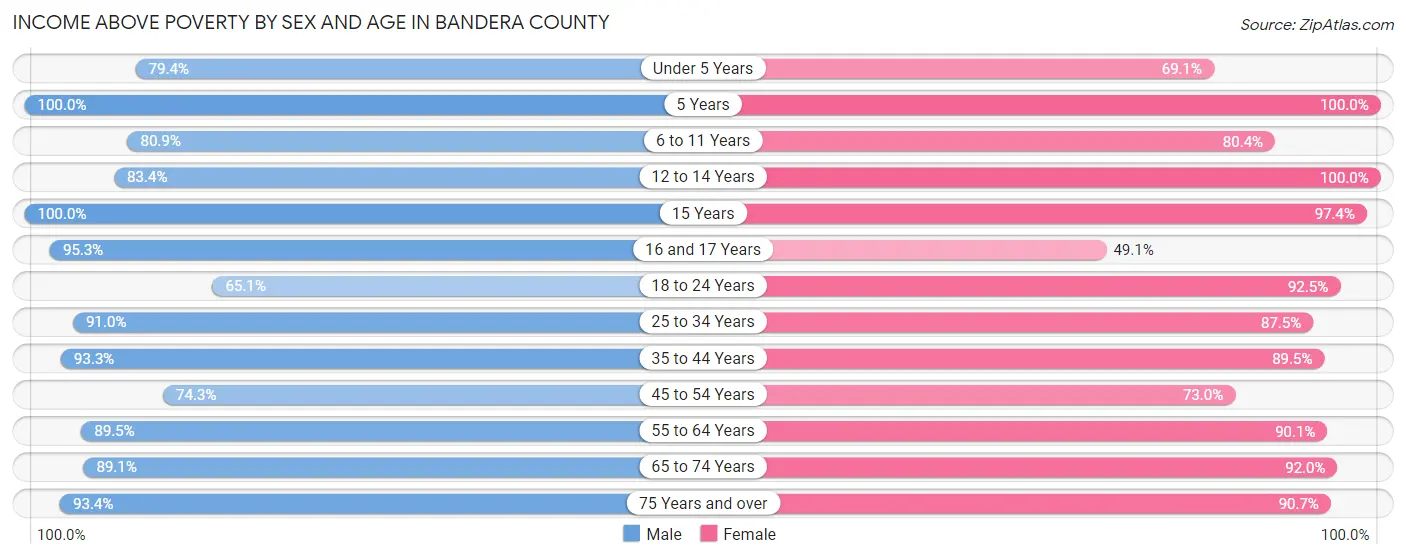
| Age Bracket | Male | Female |
| Under 5 Years | 281 (79.4%) | 261 (69.1%) |
| 5 Years | 41 (100.0%) | 33 (100.0%) |
| 6 to 11 Years | 652 (80.9%) | 541 (80.4%) |
| 12 to 14 Years | 206 (83.4%) | 224 (100.0%) |
| 15 Years | 57 (100.0%) | 38 (97.4%) |
| 16 and 17 Years | 182 (95.3%) | 142 (49.1%) |
| 18 to 24 Years | 435 (65.1%) | 626 (92.5%) |
| 25 to 34 Years | 678 (91.0%) | 607 (87.5%) |
| 35 to 44 Years | 870 (93.2%) | 907 (89.5%) |
| 45 to 54 Years | 1,081 (74.3%) | 1,031 (73.0%) |
| 55 to 64 Years | 1,681 (89.5%) | 1,948 (90.1%) |
| 65 to 74 Years | 1,603 (89.1%) | 1,625 (92.0%) |
| 75 Years and over | 1,036 (93.4%) | 1,048 (90.7%) |
| Total | 8,803 (85.6%) | 9,031 (85.9%) |
Income Below Poverty Among Married-Couple Families in Bandera County
The poverty statistics for married-couple families in Bandera County show that 6.0% or 289 of the total 4,786 families live below the poverty line. Families with 3 or 4 children have the highest poverty rate of 8.7%, comprising of 30 families. On the other hand, families with no children have the lowest poverty rate of 5.4%, which includes 199 families.
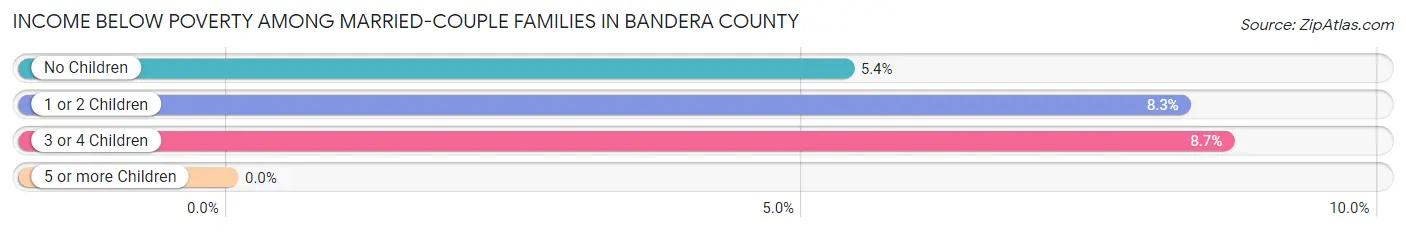
| Children | Above Poverty | Below Poverty |
| No Children | 3,517 (94.6%) | 199 (5.4%) |
| 1 or 2 Children | 664 (91.7%) | 60 (8.3%) |
| 3 or 4 Children | 316 (91.3%) | 30 (8.7%) |
| 5 or more Children | 0 (0.0%) | 0 (0.0%) |
| Total | 4,497 (94.0%) | 289 (6.0%) |
Income Below Poverty Among Single-Parent Households in Bandera County
According to the poverty data in Bandera County, 9.5% or 16 single-father households and 33.5% or 241 single-mother households are living below the poverty line. Among single-father households, those with 5 or more children have the highest poverty rate, with 10 households (100.0%) experiencing poverty. Likewise, among single-mother households, those with 1 or 2 children have the highest poverty rate, with 144 households (34.2%) falling below the poverty line.
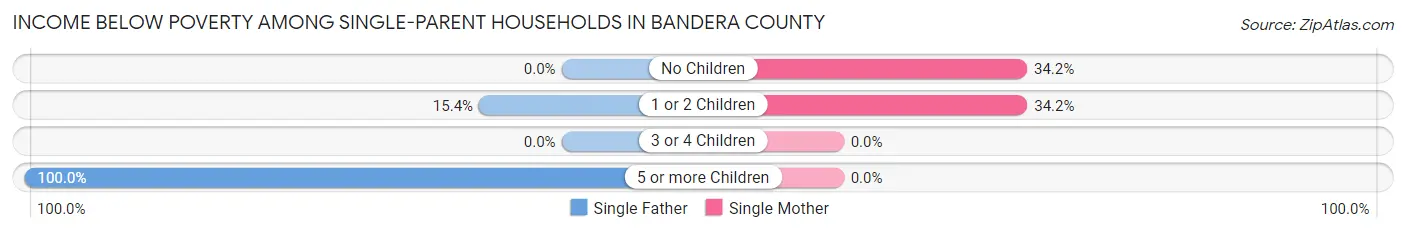
| Children | Single Father | Single Mother |
| No Children | 0 (0.0%) | 97 (34.2%) |
| 1 or 2 Children | 6 (15.4%) | 144 (34.2%) |
| 3 or 4 Children | 0 (0.0%) | 0 (0.0%) |
| 5 or more Children | 10 (100.0%) | 0 (0.0%) |
| Total | 16 (9.5%) | 241 (33.5%) |
Income Below Poverty Among Married-Couple vs Single-Parent Households in Bandera County
The poverty data for Bandera County shows that 289 of the married-couple family households (6.0%) and 257 of the single-parent households (28.9%) are living below the poverty level. Within the married-couple family households, those with 3 or 4 children have the highest poverty rate, with 30 households (8.7%) falling below the poverty line. Among the single-parent households, those with 5 or more children have the highest poverty rate, with 10 household (100.0%) living below poverty.
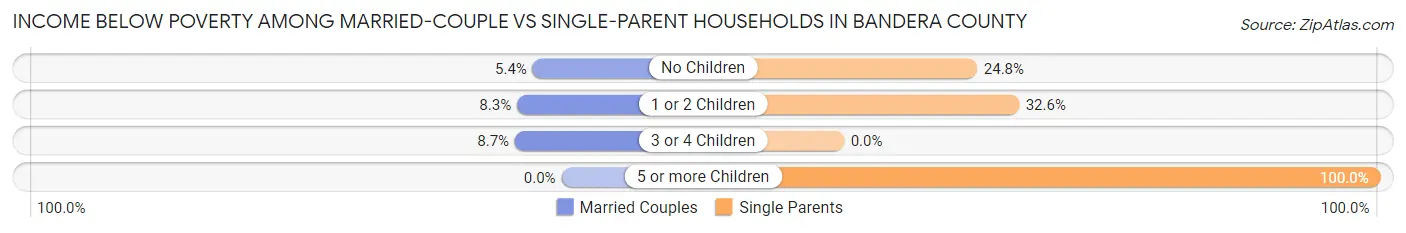
| Children | Married-Couple Families | Single-Parent Households |
| No Children | 199 (5.4%) | 97 (24.8%) |
| 1 or 2 Children | 60 (8.3%) | 150 (32.6%) |
| 3 or 4 Children | 30 (8.7%) | 0 (0.0%) |
| 5 or more Children | 0 (0.0%) | 10 (100.0%) |
| Total | 289 (6.0%) | 257 (28.9%) |
Race in Bandera County
The most populous races in Bandera County are White / Caucasian (16,997 | 80.2%), Hispanic or Latino (4,342 | 20.5%), and Two or more Races (2,824 | 13.3%).
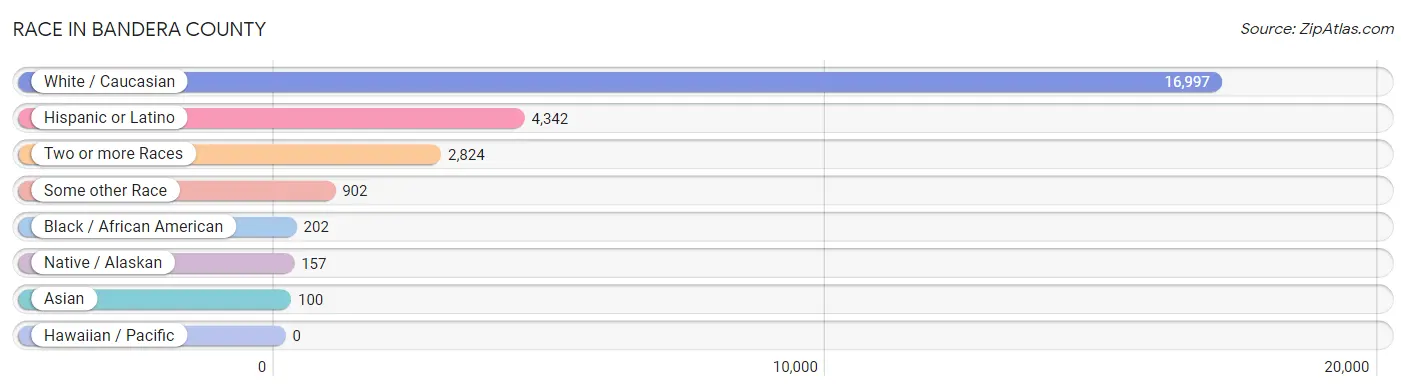
| Race | # Population | % Population |
| Asian | 100 | 0.5% |
| Black / African American | 202 | 0.9% |
| Hawaiian / Pacific | 0 | 0.0% |
| Hispanic or Latino | 4,342 | 20.5% |
| Native / Alaskan | 157 | 0.7% |
| White / Caucasian | 16,997 | 80.2% |
| Two or more Races | 2,824 | 13.3% |
| Some other Race | 902 | 4.3% |
| Total | 21,182 | 100.0% |
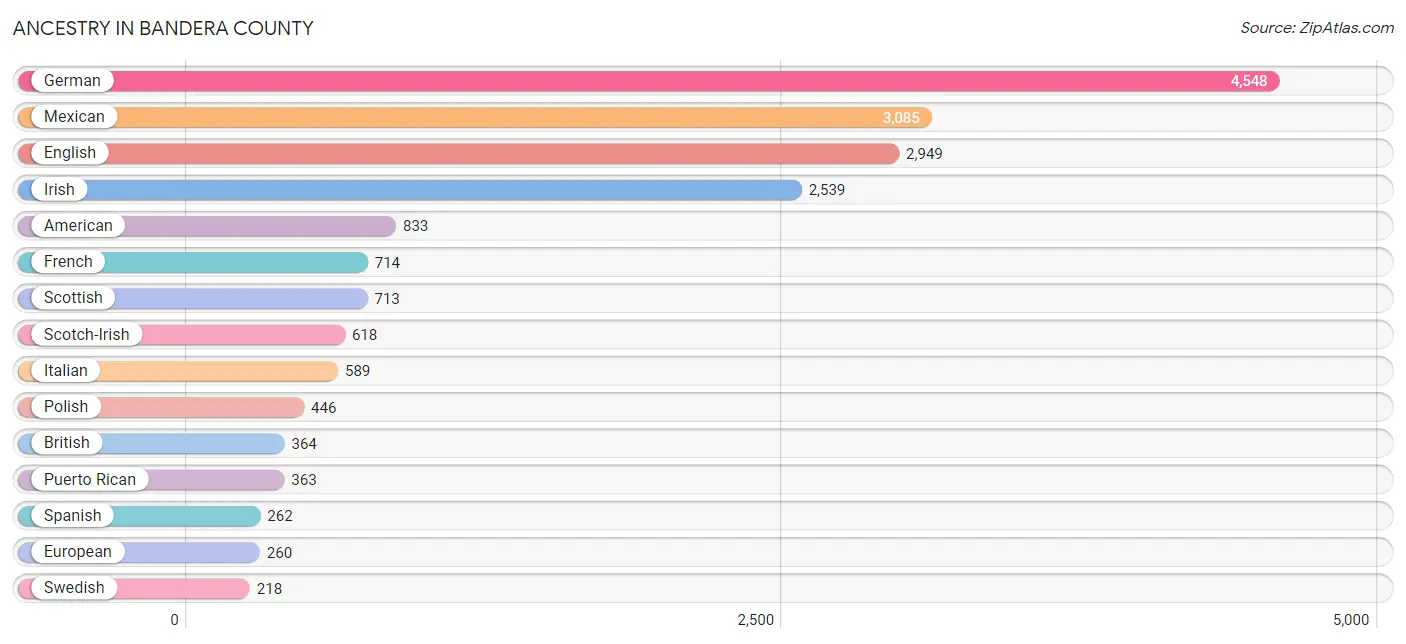
Ancestry in Bandera County
The most populous ancestries reported in Bandera County are German (4,548 | 21.5%), Mexican (3,085 | 14.6%), English (2,949 | 13.9%), Irish (2,539 | 12.0%), and American (833 | 3.9%), together accounting for 65.9% of all Bandera County residents.
| Ancestry | # Population | % Population |
| African | 3 | 0.0% |
| American | 833 | 3.9% |
| Arab | 31 | 0.2% |
| Argentinean | 11 | 0.1% |
| Australian | 25 | 0.1% |
| Austrian | 33 | 0.2% |
| Belgian | 8 | 0.0% |
| Bhutanese | 58 | 0.3% |
| Blackfeet | 9 | 0.0% |
| British | 364 | 1.7% |
| Burmese | 4 | 0.0% |
| Cajun | 18 | 0.1% |
| Central American | 64 | 0.3% |
| Central American Indian | 23 | 0.1% |
| Cherokee | 98 | 0.5% |
| Choctaw | 115 | 0.5% |
| Colombian | 160 | 0.8% |
| Croatian | 33 | 0.2% |
| Czech | 181 | 0.9% |
| Czechoslovakian | 12 | 0.1% |
| Danish | 32 | 0.2% |
| Dutch | 152 | 0.7% |
| Eastern European | 72 | 0.3% |
| English | 2,949 | 13.9% |
| European | 260 | 1.2% |
| Finnish | 133 | 0.6% |
| French | 714 | 3.4% |
| French Canadian | 43 | 0.2% |
| German | 4,548 | 21.5% |
| Greek | 30 | 0.1% |
| Guatemalan | 34 | 0.2% |
| Haitian | 1 | 0.0% |
| Honduran | 23 | 0.1% |
| Hungarian | 23 | 0.1% |
| Irish | 2,539 | 12.0% |
| Italian | 589 | 2.8% |
| Jordanian | 31 | 0.2% |
| Korean | 106 | 0.5% |
| Lithuanian | 24 | 0.1% |
| Mexican | 3,085 | 14.6% |
| Mexican American Indian | 63 | 0.3% |
| Native Hawaiian | 15 | 0.1% |
| Navajo | 1 | 0.0% |
| Northern European | 103 | 0.5% |
| Norwegian | 173 | 0.8% |
| Peruvian | 6 | 0.0% |
| Polish | 446 | 2.1% |
| Portuguese | 42 | 0.2% |
| Potawatomi | 1 | 0.0% |
| Puerto Rican | 363 | 1.7% |
| Romanian | 19 | 0.1% |
| Russian | 53 | 0.3% |
| Salvadoran | 7 | 0.0% |
| Scandinavian | 43 | 0.2% |
| Scotch-Irish | 618 | 2.9% |
| Scottish | 713 | 3.4% |
| Sioux | 15 | 0.1% |
| Slovak | 19 | 0.1% |
| South American | 177 | 0.8% |
| Spanish | 262 | 1.2% |
| Sri Lankan | 46 | 0.2% |
| Subsaharan African | 3 | 0.0% |
| Swedish | 218 | 1.0% |
| Swiss | 10 | 0.1% |
| Ukrainian | 40 | 0.2% |
| Welsh | 102 | 0.5% | View All 66 Rows |
Immigrants in Bandera County
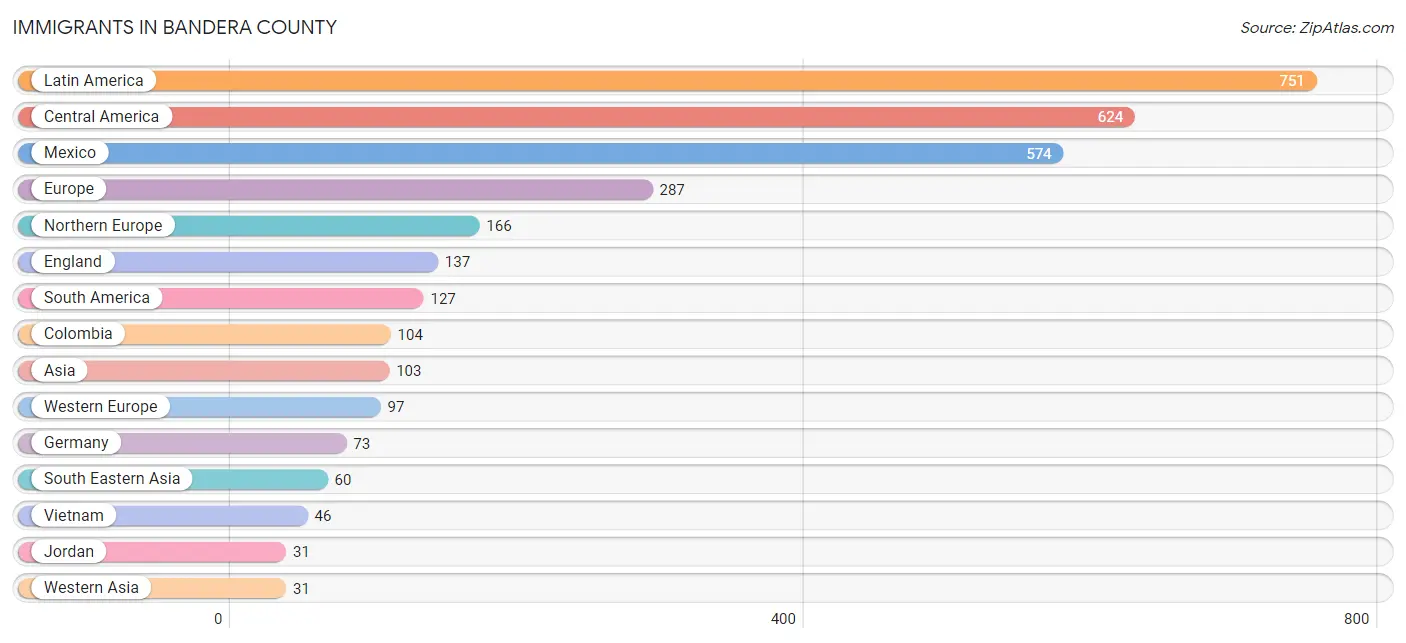
The most numerous immigrant groups reported in Bandera County came from Latin America (751 | 3.5%), Central America (624 | 2.9%), Mexico (574 | 2.7%), Europe (287 | 1.3%), and Northern Europe (166 | 0.8%), together accounting for 11.3% of all Bandera County residents.
| Immigration Origin | # Population | % Population |
| Argentina | 11 | 0.1% |
| Asia | 103 | 0.5% |
| Canada | 20 | 0.1% |
| Central America | 624 | 2.9% |
| Chile | 12 | 0.1% |
| China | 8 | 0.0% |
| Colombia | 104 | 0.5% |
| Eastern Asia | 12 | 0.1% |
| Eastern Europe | 10 | 0.1% |
| England | 137 | 0.6% |
| Europe | 287 | 1.3% |
| Germany | 73 | 0.3% |
| Guatemala | 27 | 0.1% |
| Honduras | 23 | 0.1% |
| Hong Kong | 8 | 0.0% |
| Jordan | 31 | 0.2% |
| Korea | 4 | 0.0% |
| Latin America | 751 | 3.5% |
| Mexico | 574 | 2.7% |
| Netherlands | 24 | 0.1% |
| Northern Europe | 166 | 0.8% |
| Philippines | 14 | 0.1% |
| Poland | 10 | 0.1% |
| Portugal | 14 | 0.1% |
| South America | 127 | 0.6% |
| South Eastern Asia | 60 | 0.3% |
| Southern Europe | 14 | 0.1% |
| Vietnam | 46 | 0.2% |
| Western Asia | 31 | 0.2% |
| Western Europe | 97 | 0.5% | View All 30 Rows |
Sex and Age in Bandera County
Sex and Age in Bandera County
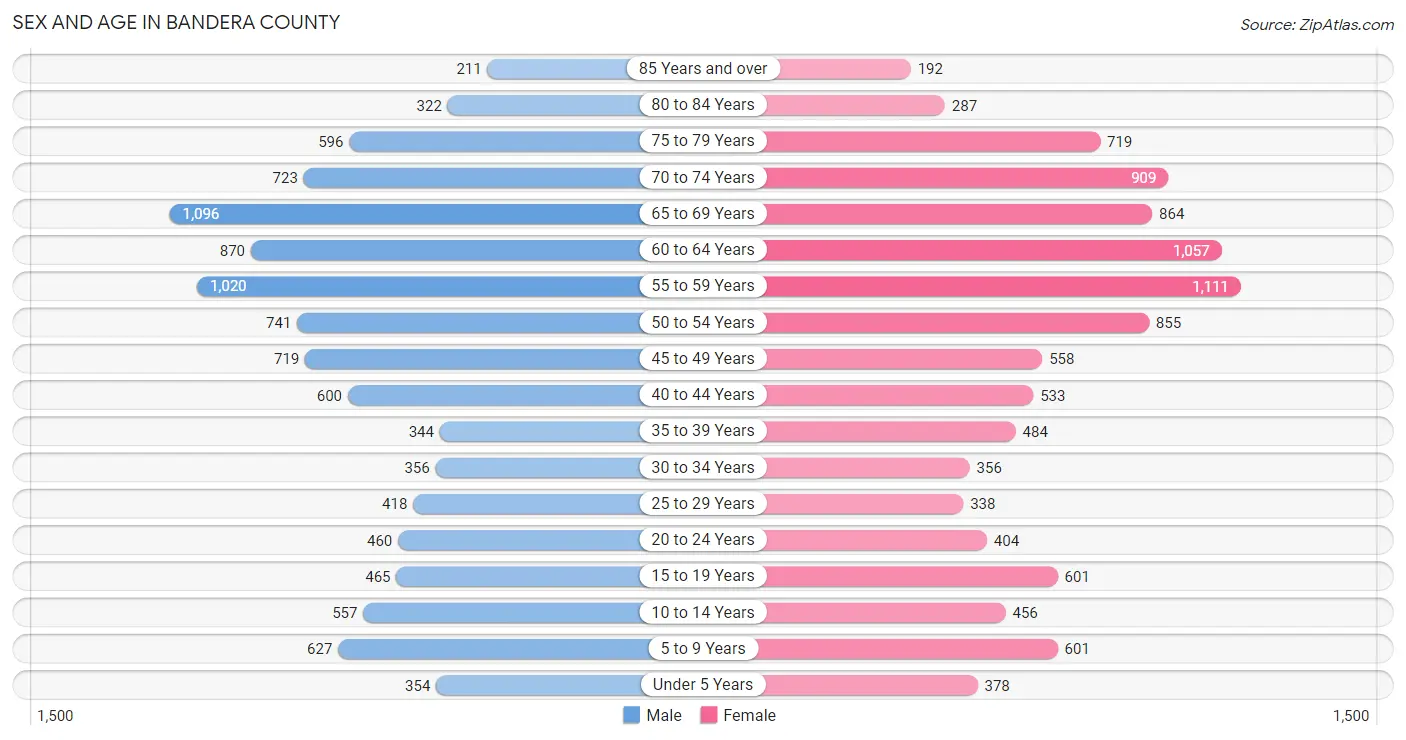
The most populous age groups in Bandera County are 65 to 69 Years (1,096 | 10.5%) for men and 55 to 59 Years (1,111 | 10.4%) for women.
| Age Bracket | Male | Female |
| Under 5 Years | 354 (3.4%) | 378 (3.5%) |
| 5 to 9 Years | 627 (6.0%) | 601 (5.6%) |
| 10 to 14 Years | 557 (5.3%) | 456 (4.3%) |
| 15 to 19 Years | 465 (4.4%) | 601 (5.6%) |
| 20 to 24 Years | 460 (4.4%) | 404 (3.8%) |
| 25 to 29 Years | 418 (4.0%) | 338 (3.2%) |
| 30 to 34 Years | 356 (3.4%) | 356 (3.3%) |
| 35 to 39 Years | 344 (3.3%) | 484 (4.5%) |
| 40 to 44 Years | 600 (5.7%) | 533 (5.0%) |
| 45 to 49 Years | 719 (6.9%) | 558 (5.2%) |
| 50 to 54 Years | 741 (7.1%) | 855 (8.0%) |
| 55 to 59 Years | 1,020 (9.7%) | 1,111 (10.4%) |
| 60 to 64 Years | 870 (8.3%) | 1,057 (9.9%) |
| 65 to 69 Years | 1,096 (10.5%) | 864 (8.1%) |
| 70 to 74 Years | 723 (6.9%) | 909 (8.5%) |
| 75 to 79 Years | 596 (5.7%) | 719 (6.7%) |
| 80 to 84 Years | 322 (3.1%) | 287 (2.7%) |
| 85 Years and over | 211 (2.0%) | 192 (1.8%) |
| Total | 10,479 (100.0%) | 10,703 (100.0%) |
Families and Households in Bandera County
Median Family Size in Bandera County
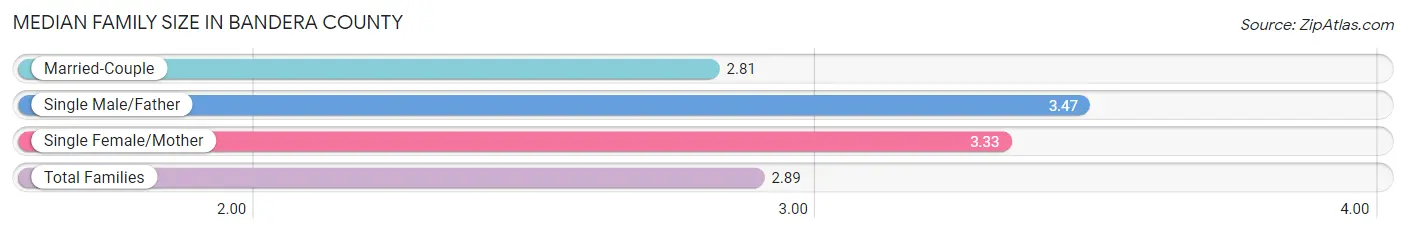
The median family size in Bandera County is 2.89 persons per family, with single male/father families (169 | 3.0%) accounting for the largest median family size of 3.47 persons per family. On the other hand, married-couple families (4,786 | 84.3%) represent the smallest median family size with 2.81 persons per family.
| Family Type | # Families | Family Size |
| Married-Couple | 4,786 (84.3%) | 2.81 |
| Single Male/Father | 169 (3.0%) | 3.47 |
| Single Female/Mother | 720 (12.7%) | 3.33 |
| Total Families | 5,675 (100.0%) | 2.89 |
Median Household Size in Bandera County
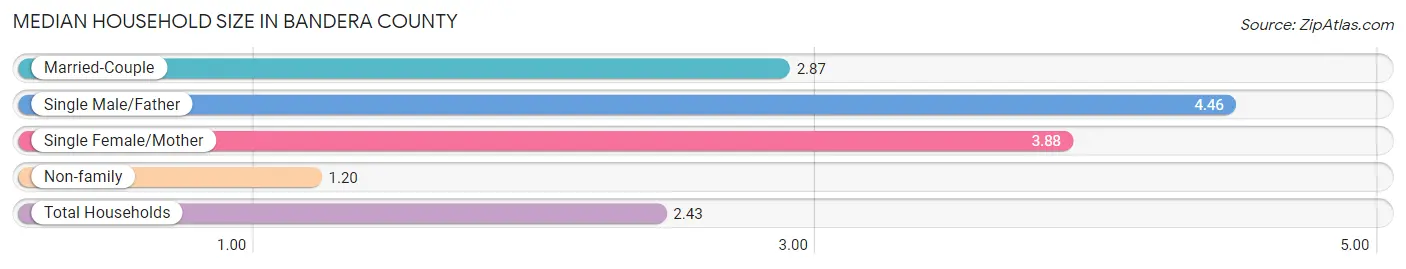
The median household size in Bandera County is 2.43 persons per household, with single male/father households (169 | 2.0%) accounting for the largest median household size of 4.46 persons per household. non-family households (2,857 | 33.5%) represent the smallest median household size with 1.20 persons per household.
| Household Type | # Households | Household Size |
| Married-Couple | 4,786 (56.1%) | 2.87 |
| Single Male/Father | 169 (2.0%) | 4.46 |
| Single Female/Mother | 720 (8.4%) | 3.88 |
| Non-family | 2,857 (33.5%) | 1.20 |
| Total Households | 8,532 (100.0%) | 2.43 |
Household Size by Marriage Status in Bandera County
Out of a total of 8,532 households in Bandera County, 5,675 (66.5%) are family households, while 2,857 (33.5%) are nonfamily households. The most numerous type of family households are 2-person households, comprising 3,162, and the most common type of nonfamily households are 1-person households, comprising 2,368.
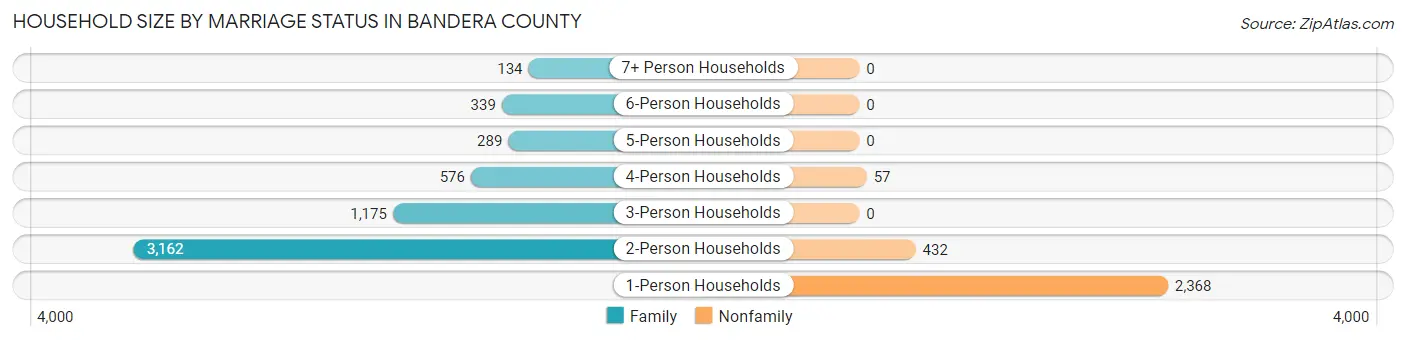
| Household Size | Family Households | Nonfamily Households |
| 1-Person Households | - | 2,368 (27.8%) |
| 2-Person Households | 3,162 (37.1%) | 432 (5.1%) |
| 3-Person Households | 1,175 (13.8%) | 0 (0.0%) |
| 4-Person Households | 576 (6.8%) | 57 (0.7%) |
| 5-Person Households | 289 (3.4%) | 0 (0.0%) |
| 6-Person Households | 339 (4.0%) | 0 (0.0%) |
| 7+ Person Households | 134 (1.6%) | 0 (0.0%) |
| Total | 5,675 (66.5%) | 2,857 (33.5%) |
Female Fertility in Bandera County
Fertility by Age in Bandera County
Average fertility rate in Bandera County is 19.0 births per 1,000 women. Women in the age bracket of 20 to 34 years have the highest fertility rate with 48.0 births per 1,000 women. Women in the age bracket of 20 to 34 years acount for 81.5% of all women with births.
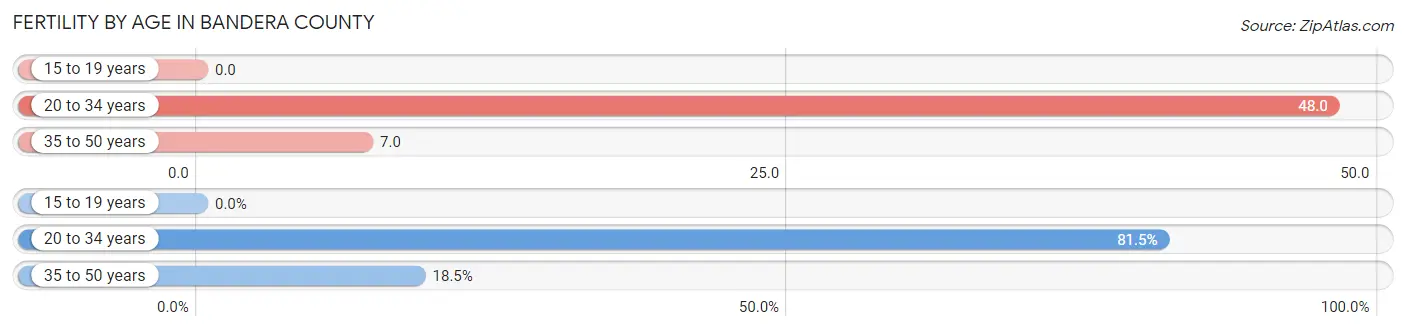
| Age Bracket | Women with Births | Births / 1,000 Women |
| 15 to 19 years | 0 (0.0%) | 0.0 |
| 20 to 34 years | 53 (81.5%) | 48.0 |
| 35 to 50 years | 12 (18.5%) | 7.0 |
| Total | 65 (100.0%) | 19.0 |
Fertility by Age by Marriage Status in Bandera County
69.2% of women with births (65) in Bandera County are married. The highest percentage of unmarried women with births falls into 35 to 50 years age bracket with 100.0% of them unmarried at the time of birth, while the lowest percentage of unmarried women with births belong to 20 to 34 years age bracket with 15.1% of them unmarried.
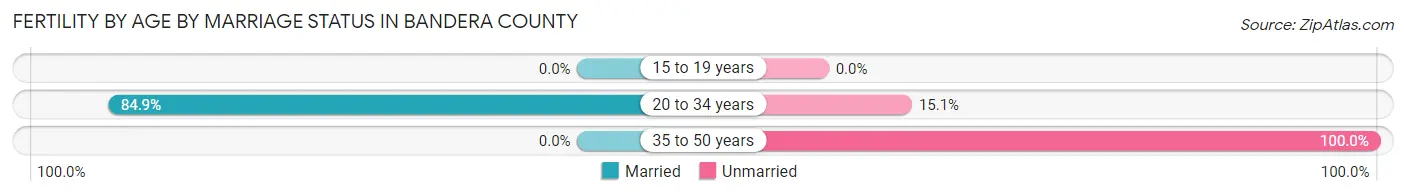
| Age Bracket | Married | Unmarried |
| 15 to 19 years | 0 (0.0%) | 0 (0.0%) |
| 20 to 34 years | 45 (84.9%) | 8 (15.1%) |
| 35 to 50 years | 0 (0.0%) | 12 (100.0%) |
| Total | 45 (69.2%) | 20 (30.8%) |
Fertility by Education in Bandera County
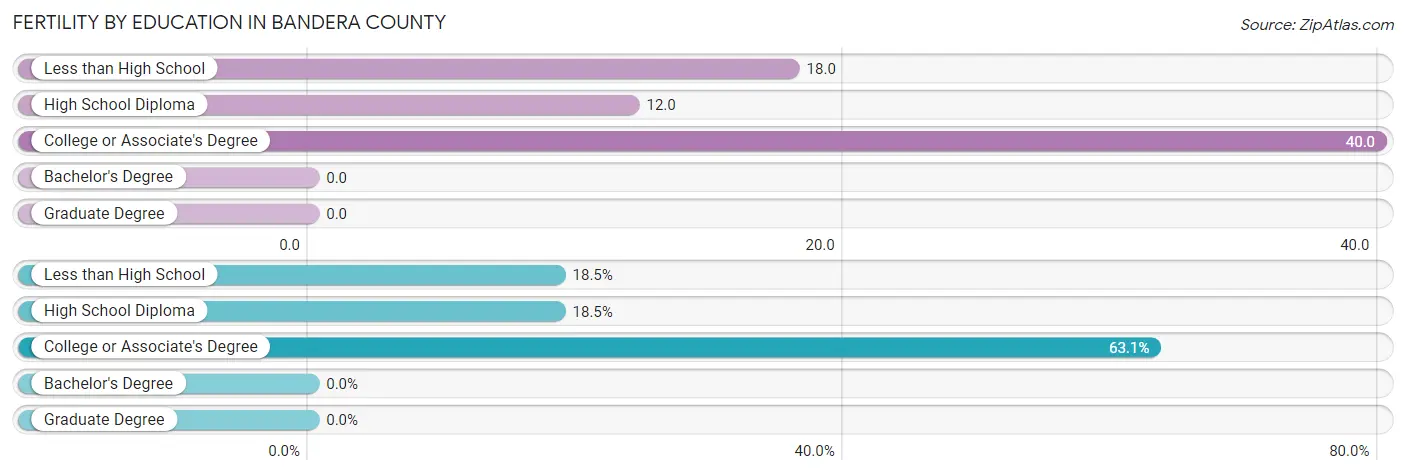
| Educational Attainment | Women with Births | Births / 1,000 Women |
| Less than High School | 12 (18.5%) | 18.0 |
| High School Diploma | 12 (18.5%) | 12.0 |
| College or Associate's Degree | 41 (63.1%) | 40.0 |
| Bachelor's Degree | 0 (0.0%) | 0.0 |
| Graduate Degree | 0 (0.0%) | 0.0 |
| Total | 65 (100.0%) | 19.0 |
Fertility by Education by Marriage Status in Bandera County
30.8% of women with births in Bandera County are unmarried. Women with the educational attainment of high school diploma are most likely to be married with 100.0% of them married at childbirth, while women with the educational attainment of less than high school are least likely to be married with 100.0% of them unmarried at childbirth.
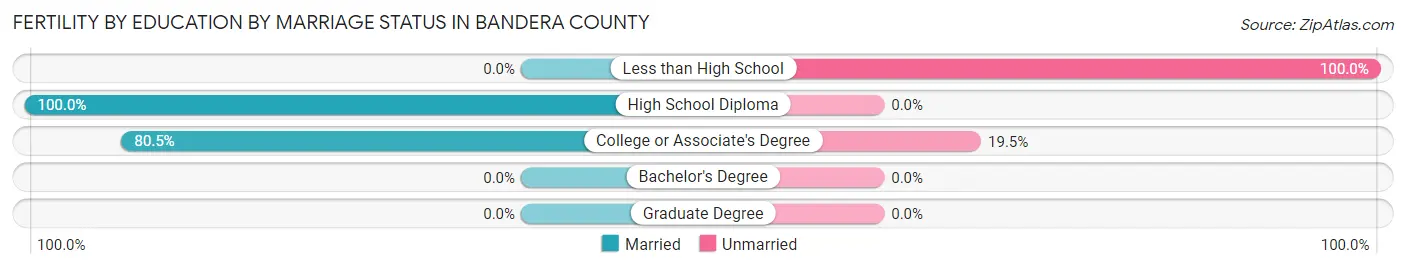
| Educational Attainment | Married | Unmarried |
| Less than High School | 0 (0.0%) | 12 (100.0%) |
| High School Diploma | 12 (100.0%) | 0 (0.0%) |
| College or Associate's Degree | 33 (80.5%) | 8 (19.5%) |
| Bachelor's Degree | 0 (0.0%) | 0 (0.0%) |
| Graduate Degree | 0 (0.0%) | 0 (0.0%) |
| Total | 45 (69.2%) | 20 (30.8%) |
Employment Characteristics in Bandera County
Employment by Class of Employer in Bandera County
Among the 8,952 employed individuals in Bandera County, private company employees (5,608 | 62.6%), self-employed (not incorporated) (1,077 | 12.0%), and not-for-profit organizations (705 | 7.9%) make up the most common classes of employment.
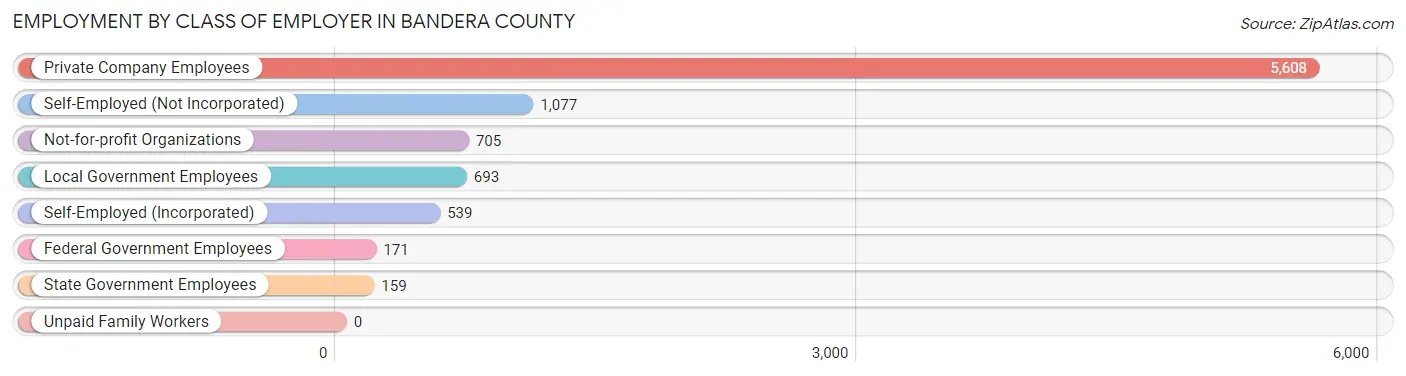
| Employer Class | # Employees | % Employees |
| Private Company Employees | 5,608 | 62.6% |
| Self-Employed (Incorporated) | 539 | 6.0% |
| Self-Employed (Not Incorporated) | 1,077 | 12.0% |
| Not-for-profit Organizations | 705 | 7.9% |
| Local Government Employees | 693 | 7.7% |
| State Government Employees | 159 | 1.8% |
| Federal Government Employees | 171 | 1.9% |
| Unpaid Family Workers | 0 | 0.0% |
| Total | 8,952 | 100.0% |
Employment Status by Age in Bandera County
According to the labor force statistics for Bandera County, out of the total population over 16 years of age (18,113), 54.4% or 9,853 individuals are in the labor force, with 6.7% or 660 of them unemployed. The age group with the highest labor force participation rate is 35 to 44 years, with 85.2% or 1,671 individuals in the labor force. Within the labor force, the 20 to 24 years age range has the highest percentage of unemployed individuals, with 13.3% or 87 of them being unemployed.
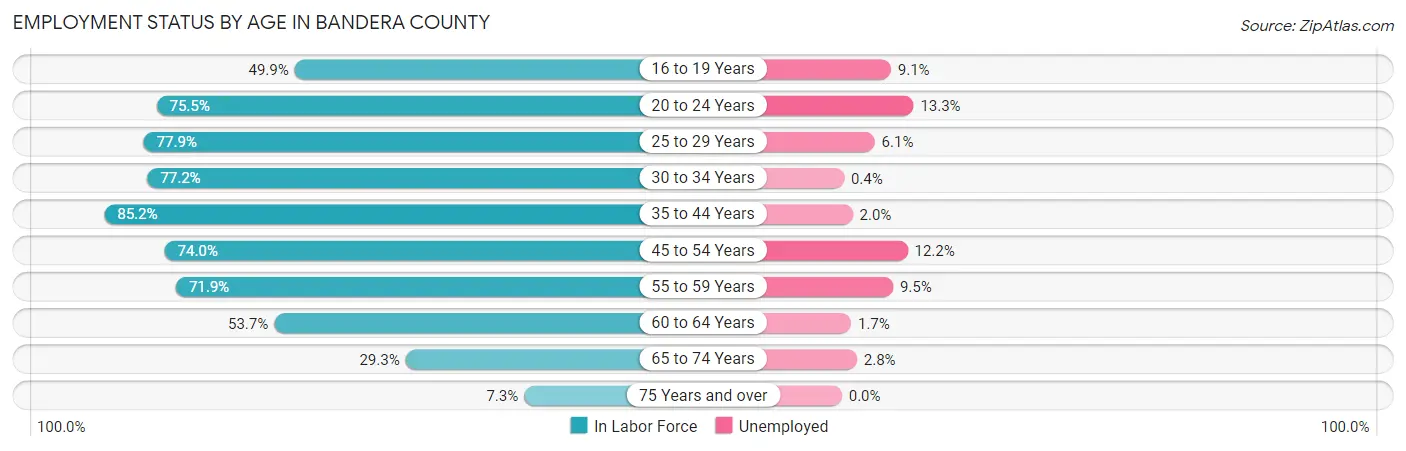
| Age Bracket | In Labor Force | Unemployed |
| 16 to 19 Years | 484 (49.9%) | 44 (9.1%) |
| 20 to 24 Years | 652 (75.5%) | 87 (13.3%) |
| 25 to 29 Years | 589 (77.9%) | 36 (6.1%) |
| 30 to 34 Years | 550 (77.2%) | 2 (0.4%) |
| 35 to 44 Years | 1,671 (85.2%) | 33 (2.0%) |
| 45 to 54 Years | 2,126 (74.0%) | 259 (12.2%) |
| 55 to 59 Years | 1,532 (71.9%) | 146 (9.5%) |
| 60 to 64 Years | 1,035 (53.7%) | 18 (1.7%) |
| 65 to 74 Years | 1,052 (29.3%) | 29 (2.8%) |
| 75 Years and over | 170 (7.3%) | 0 (0.0%) |
| Total | 9,853 (54.4%) | 660 (6.7%) |
Employment Status by Educational Attainment in Bandera County
According to labor force statistics for Bandera County, 72.4% of individuals (7,501) out of the total population between 25 and 64 years of age (10,360) are in the labor force, with 6.6% or 495 of them being unemployed. The group with the highest labor force participation rate are those with the educational attainment of college / associate degree, with 75.8% or 2,877 individuals in the labor force. Within the labor force, individuals with college / associate degree education have the highest percentage of unemployment, with 8.6% or 247 of them being unemployed.
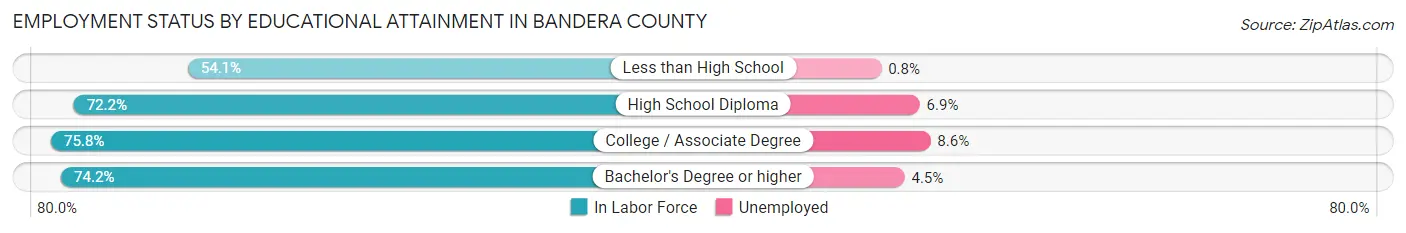
| Educational Attainment | In Labor Force | Unemployed |
| Less than High School | 487 (54.1%) | 7 (0.8%) |
| High School Diploma | 2,362 (72.2%) | 226 (6.9%) |
| College / Associate Degree | 2,877 (75.8%) | 326 (8.6%) |
| Bachelor's Degree or higher | 1,776 (74.2%) | 108 (4.5%) |
| Total | 7,501 (72.4%) | 684 (6.6%) |
Employment Occupations by Sex in Bandera County
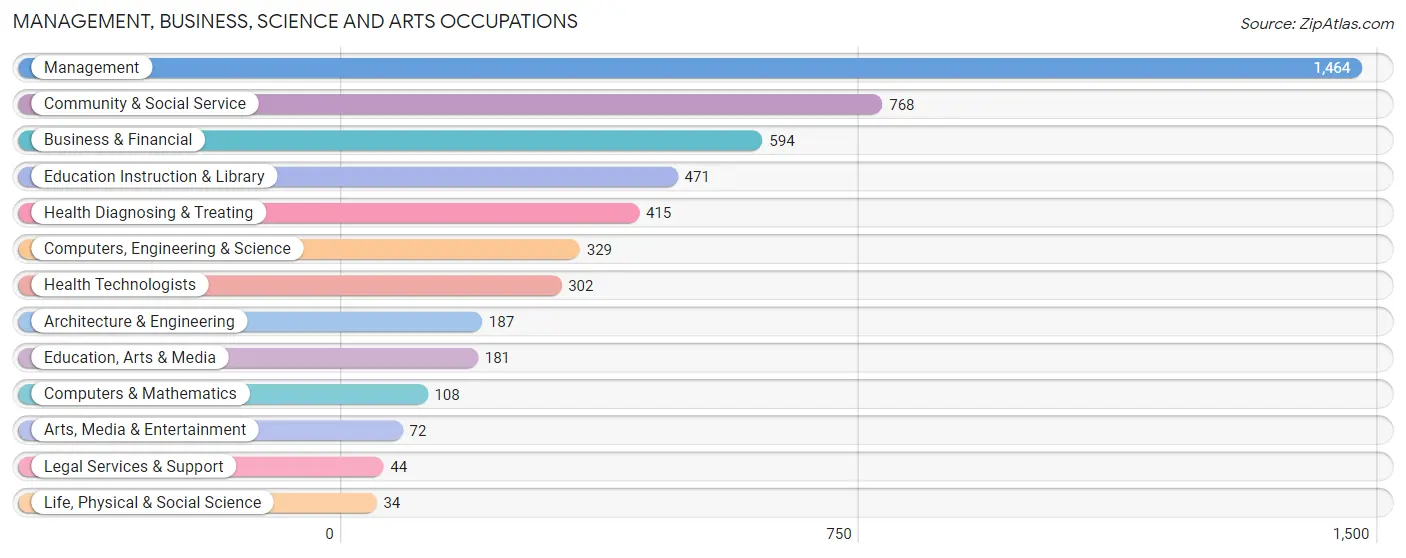
Management, Business, Science and Arts Occupations
The most common Management, Business, Science and Arts occupations in Bandera County are Management (1,464 | 15.9%), Community & Social Service (768 | 8.3%), Business & Financial (594 | 6.5%), Education Instruction & Library (471 | 5.1%), and Health Diagnosing & Treating (415 | 4.5%).
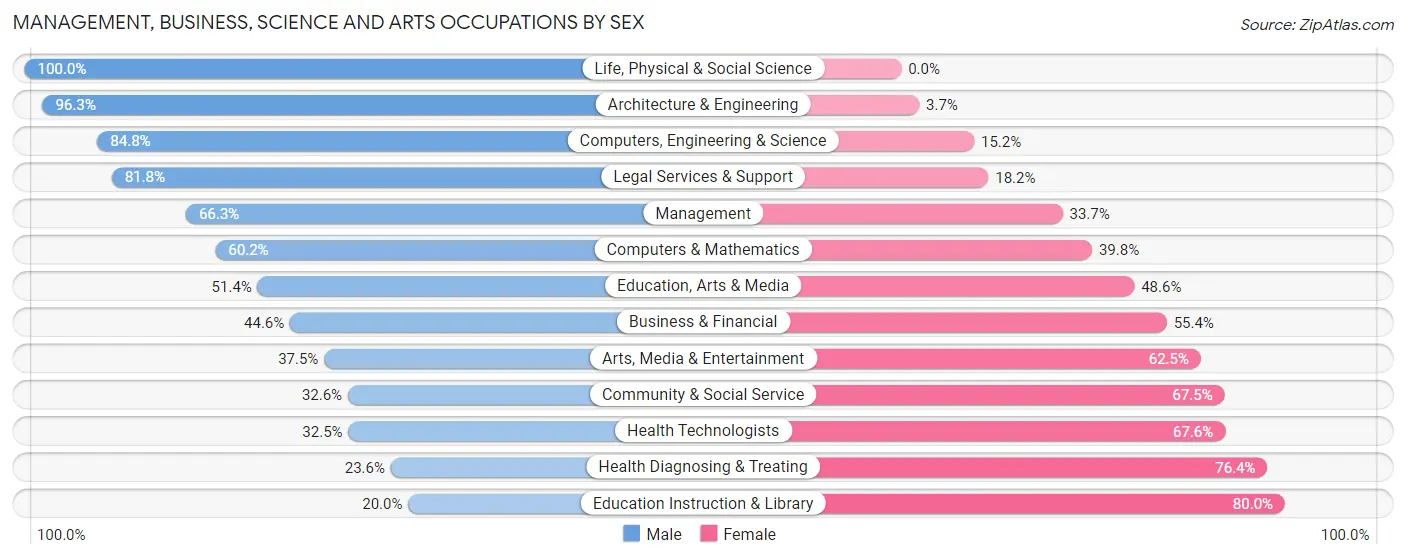
Management, Business, Science and Arts Occupations by Sex
Within the Management, Business, Science and Arts occupations in Bandera County, the most male-oriented occupations are Life, Physical & Social Science (100.0%), Architecture & Engineering (96.3%), and Computers, Engineering & Science (84.8%), while the most female-oriented occupations are Education Instruction & Library (80.0%), Health Diagnosing & Treating (76.4%), and Health Technologists (67.5%).
| Occupation | Male | Female |
| Management | 971 (66.3%) | 493 (33.7%) |
| Business & Financial | 265 (44.6%) | 329 (55.4%) |
| Computers, Engineering & Science | 279 (84.8%) | 50 (15.2%) |
| Computers & Mathematics | 65 (60.2%) | 43 (39.8%) |
| Architecture & Engineering | 180 (96.3%) | 7 (3.7%) |
| Life, Physical & Social Science | 34 (100.0%) | 0 (0.0%) |
| Community & Social Service | 250 (32.6%) | 518 (67.4%) |
| Education, Arts & Media | 93 (51.4%) | 88 (48.6%) |
| Legal Services & Support | 36 (81.8%) | 8 (18.2%) |
| Education Instruction & Library | 94 (20.0%) | 377 (80.0%) |
| Arts, Media & Entertainment | 27 (37.5%) | 45 (62.5%) |
| Health Diagnosing & Treating | 98 (23.6%) | 317 (76.4%) |
| Health Technologists | 98 (32.5%) | 204 (67.5%) |
| Total (Category) | 1,863 (52.2%) | 1,707 (47.8%) |
| Total (Overall) | 4,945 (53.7%) | 4,261 (46.3%) |
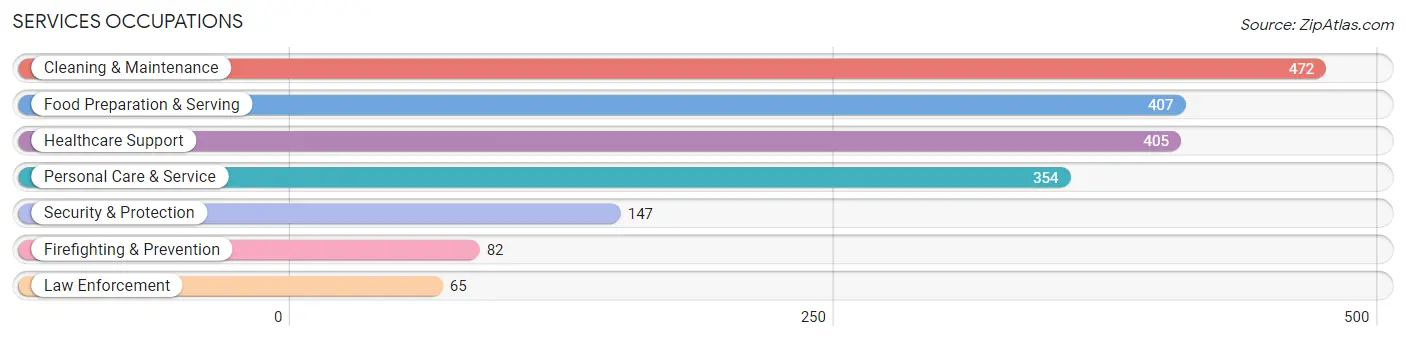
Services Occupations
The most common Services occupations in Bandera County are Cleaning & Maintenance (472 | 5.1%), Food Preparation & Serving (407 | 4.4%), Healthcare Support (405 | 4.4%), Personal Care & Service (354 | 3.8%), and Security & Protection (147 | 1.6%).
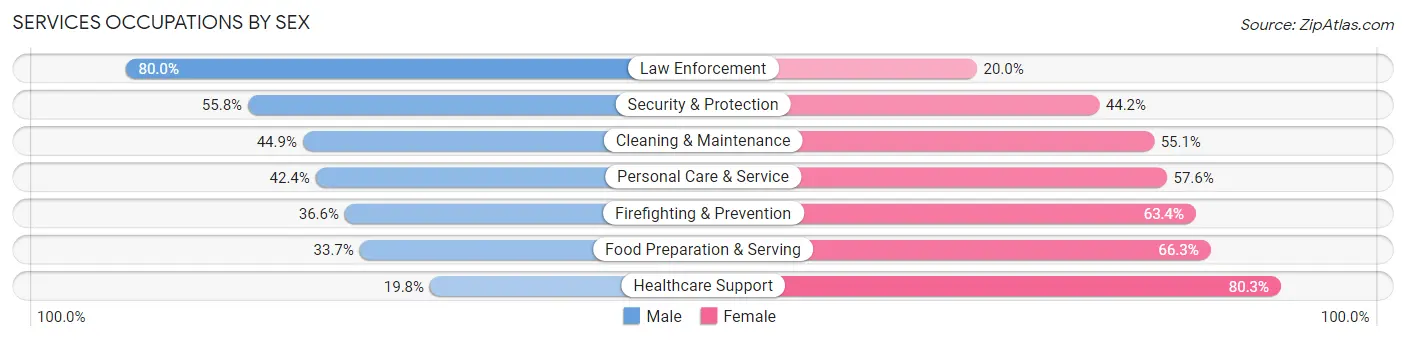
Services Occupations by Sex
Within the Services occupations in Bandera County, the most male-oriented occupations are Law Enforcement (80.0%), Security & Protection (55.8%), and Cleaning & Maintenance (44.9%), while the most female-oriented occupations are Healthcare Support (80.2%), Food Preparation & Serving (66.3%), and Firefighting & Prevention (63.4%).
| Occupation | Male | Female |
| Healthcare Support | 80 (19.8%) | 325 (80.2%) |
| Security & Protection | 82 (55.8%) | 65 (44.2%) |
| Firefighting & Prevention | 30 (36.6%) | 52 (63.4%) |
| Law Enforcement | 52 (80.0%) | 13 (20.0%) |
| Food Preparation & Serving | 137 (33.7%) | 270 (66.3%) |
| Cleaning & Maintenance | 212 (44.9%) | 260 (55.1%) |
| Personal Care & Service | 150 (42.4%) | 204 (57.6%) |
| Total (Category) | 661 (37.0%) | 1,124 (63.0%) |
| Total (Overall) | 4,945 (53.7%) | 4,261 (46.3%) |
Sales and Office Occupations
The most common Sales and Office occupations in Bandera County are Office & Administration (928 | 10.1%), and Sales & Related (860 | 9.3%).
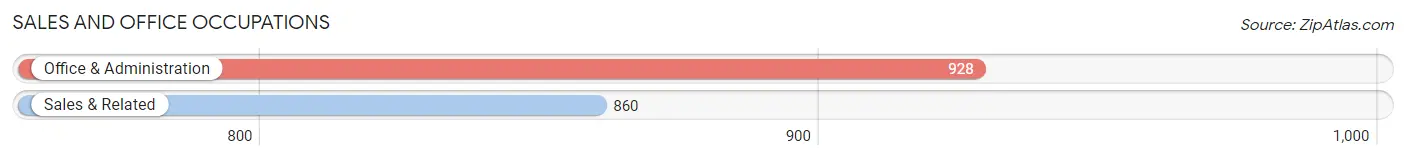
Sales and Office Occupations by Sex

| Occupation | Male | Female |
| Sales & Related | 404 (47.0%) | 456 (53.0%) |
| Office & Administration | 117 (12.6%) | 811 (87.4%) |
| Total (Category) | 521 (29.1%) | 1,267 (70.9%) |
| Total (Overall) | 4,945 (53.7%) | 4,261 (46.3%) |
Natural Resources, Construction and Maintenance Occupations
The most common Natural Resources, Construction and Maintenance occupations in Bandera County are Construction & Extraction (756 | 8.2%), Installation, Maintenance & Repair (389 | 4.2%), and Farming, Fishing & Forestry (87 | 0.9%).
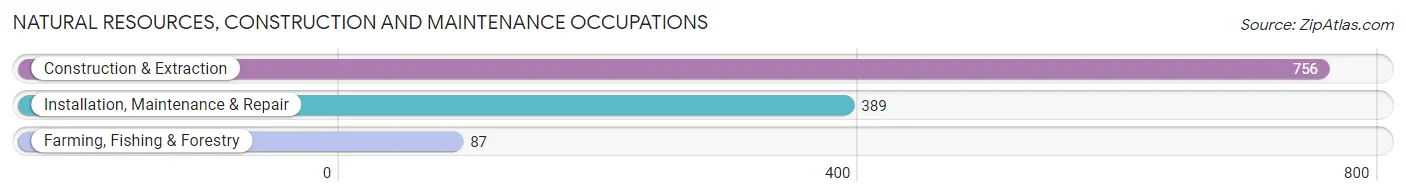
Natural Resources, Construction and Maintenance Occupations by Sex
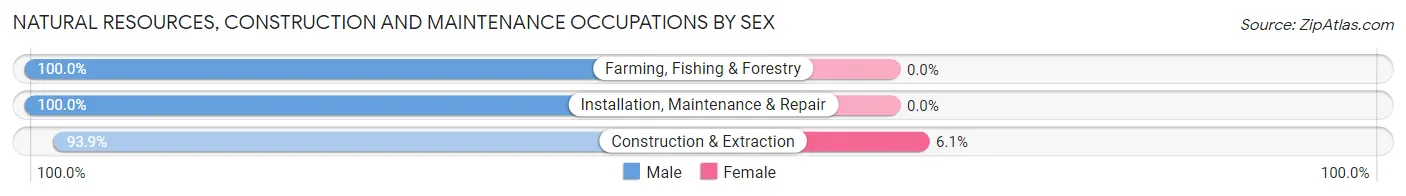
| Occupation | Male | Female |
| Farming, Fishing & Forestry | 87 (100.0%) | 0 (0.0%) |
| Construction & Extraction | 710 (93.9%) | 46 (6.1%) |
| Installation, Maintenance & Repair | 389 (100.0%) | 0 (0.0%) |
| Total (Category) | 1,186 (96.3%) | 46 (3.7%) |
| Total (Overall) | 4,945 (53.7%) | 4,261 (46.3%) |
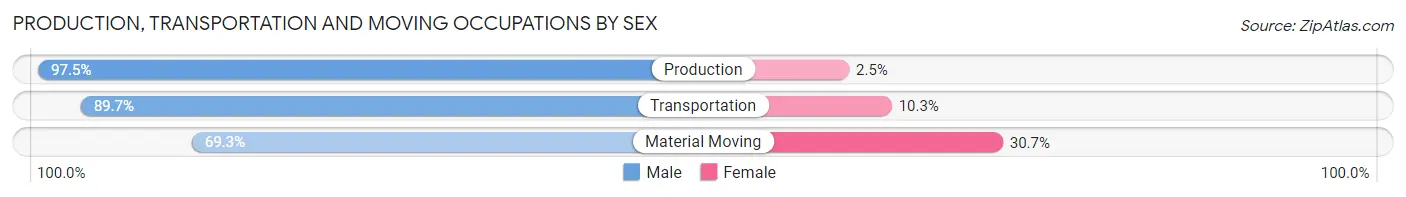
Production, Transportation and Moving Occupations
The most common Production, Transportation and Moving occupations in Bandera County are Production (321 | 3.5%), Material Moving (277 | 3.0%), and Transportation (233 | 2.5%).
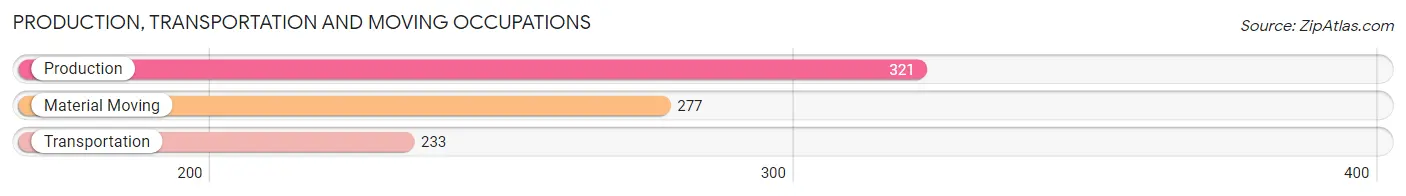
Production, Transportation and Moving Occupations by Sex
| Occupation | Male | Female |
| Production | 313 (97.5%) | 8 (2.5%) |
| Transportation | 209 (89.7%) | 24 (10.3%) |
| Material Moving | 192 (69.3%) | 85 (30.7%) |
| Total (Category) | 714 (85.9%) | 117 (14.1%) |
| Total (Overall) | 4,945 (53.7%) | 4,261 (46.3%) |
Employment Industries by Sex in Bandera County
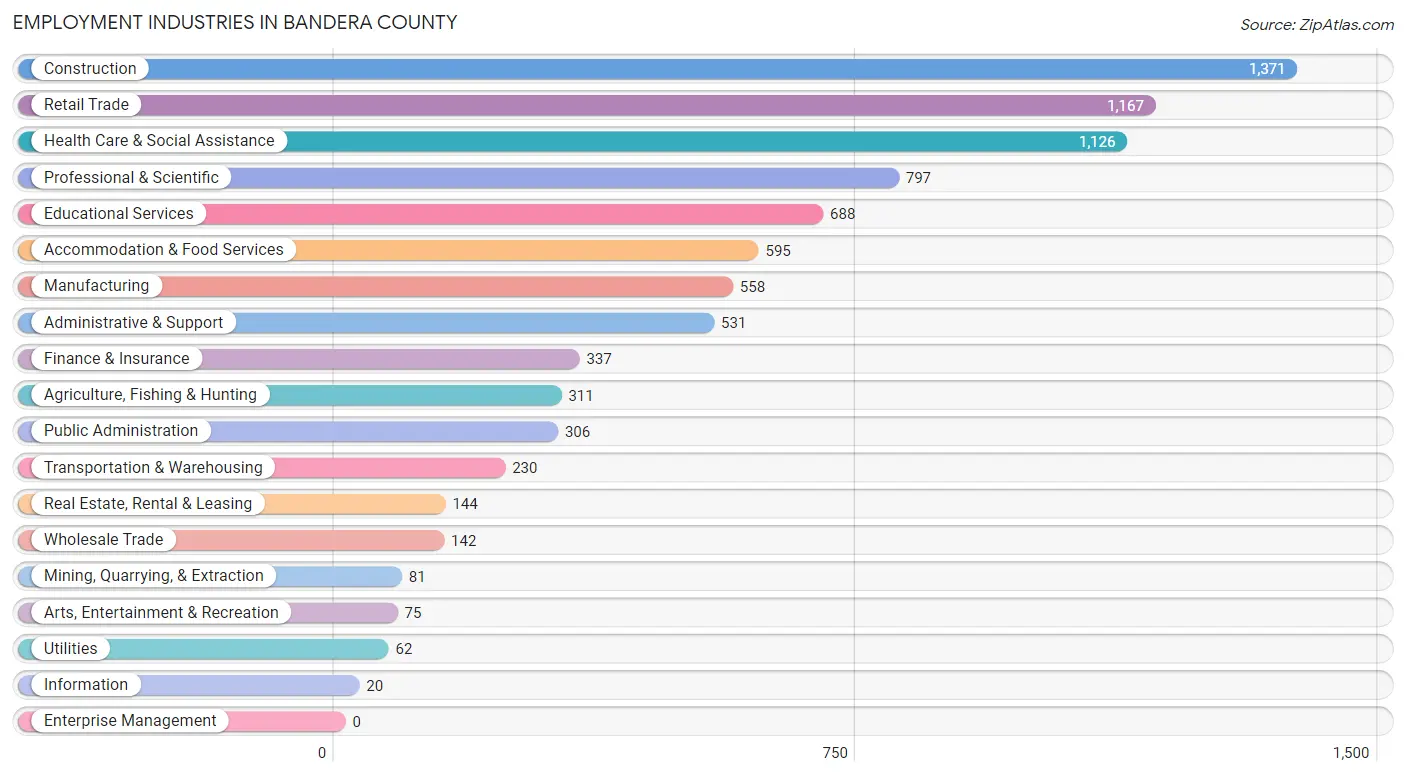
Employment Industries in Bandera County
The major employment industries in Bandera County include Construction (1,371 | 14.9%), Retail Trade (1,167 | 12.7%), Health Care & Social Assistance (1,126 | 12.2%), Professional & Scientific (797 | 8.7%), and Educational Services (688 | 7.5%).
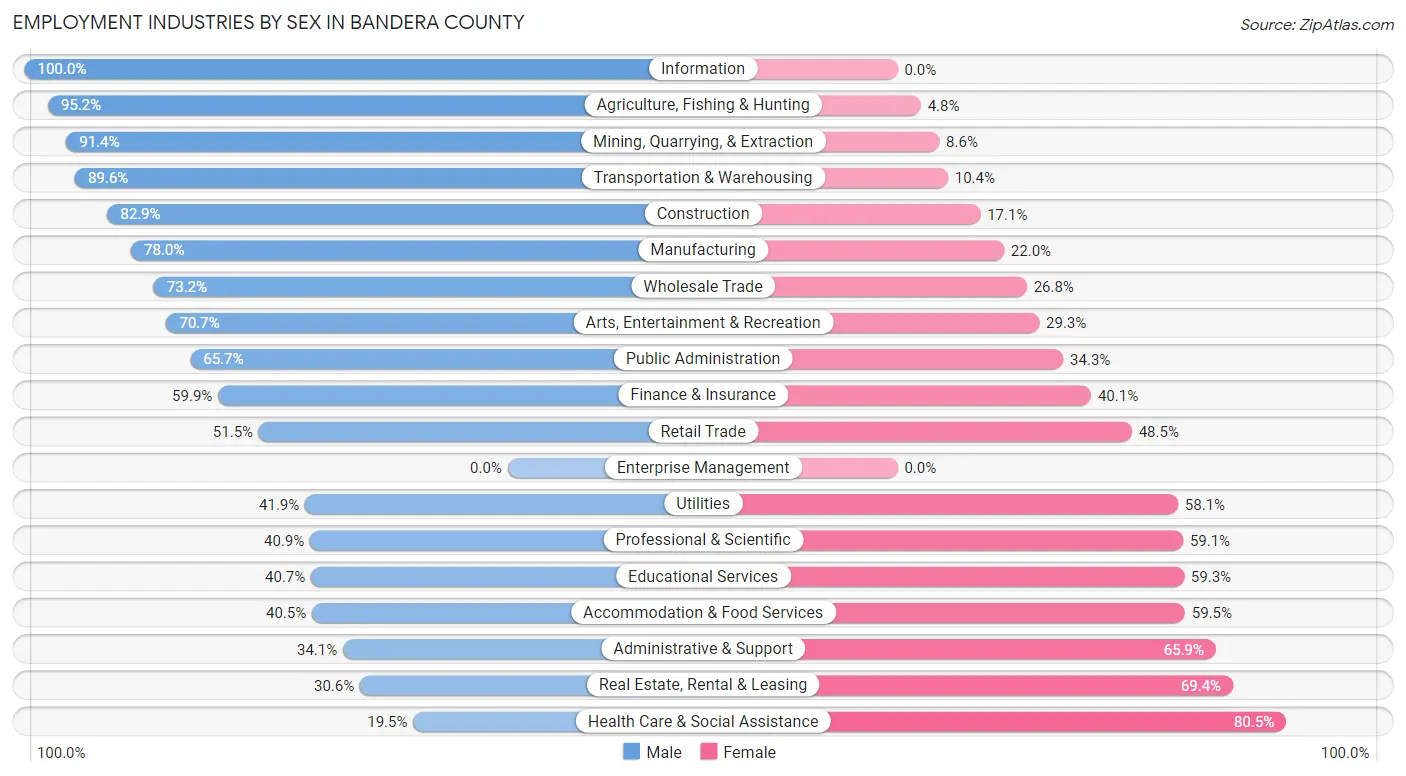
Employment Industries by Sex in Bandera County
The Bandera County industries that see more men than women are Information (100.0%), Agriculture, Fishing & Hunting (95.2%), and Mining, Quarrying, & Extraction (91.4%), whereas the industries that tend to have a higher number of women are Health Care & Social Assistance (80.5%), Real Estate, Rental & Leasing (69.4%), and Administrative & Support (65.9%).
| Industry | Male | Female |
| Agriculture, Fishing & Hunting | 296 (95.2%) | 15 (4.8%) |
| Mining, Quarrying, & Extraction | 74 (91.4%) | 7 (8.6%) |
| Construction | 1,136 (82.9%) | 235 (17.1%) |
| Manufacturing | 435 (78.0%) | 123 (22.0%) |
| Wholesale Trade | 104 (73.2%) | 38 (26.8%) |
| Retail Trade | 601 (51.5%) | 566 (48.5%) |
| Transportation & Warehousing | 206 (89.6%) | 24 (10.4%) |
| Utilities | 26 (41.9%) | 36 (58.1%) |
| Information | 20 (100.0%) | 0 (0.0%) |
| Finance & Insurance | 202 (59.9%) | 135 (40.1%) |
| Real Estate, Rental & Leasing | 44 (30.6%) | 100 (69.4%) |
| Professional & Scientific | 326 (40.9%) | 471 (59.1%) |
| Enterprise Management | 0 (0.0%) | 0 (0.0%) |
| Administrative & Support | 181 (34.1%) | 350 (65.9%) |
| Educational Services | 280 (40.7%) | 408 (59.3%) |
| Health Care & Social Assistance | 220 (19.5%) | 906 (80.5%) |
| Arts, Entertainment & Recreation | 53 (70.7%) | 22 (29.3%) |
| Accommodation & Food Services | 241 (40.5%) | 354 (59.5%) |
| Public Administration | 201 (65.7%) | 105 (34.3%) |
| Total | 4,945 (53.7%) | 4,261 (46.3%) |
Education in Bandera County
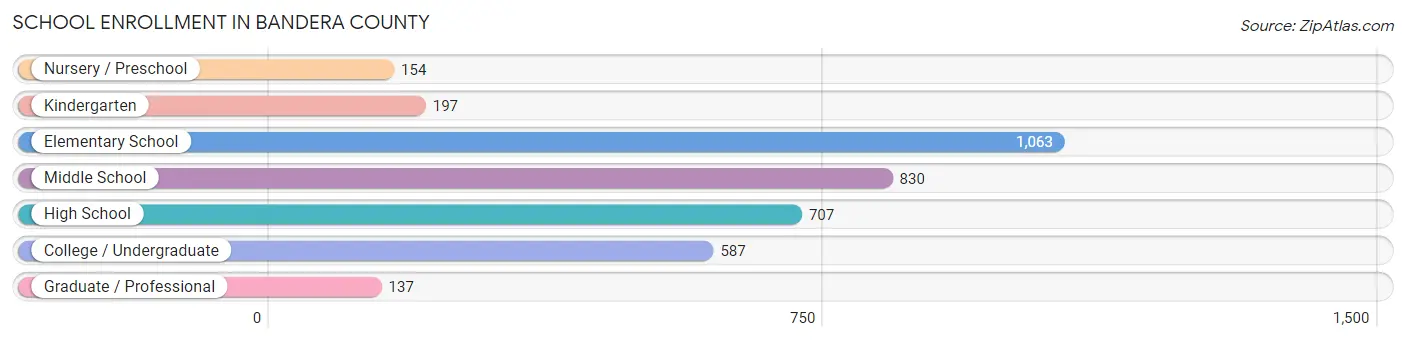
School Enrollment in Bandera County
The most common levels of schooling among the 3,675 students in Bandera County are elementary school (1,063 | 28.9%), middle school (830 | 22.6%), and high school (707 | 19.2%).
| School Level | # Students | % Students |
| Nursery / Preschool | 154 | 4.2% |
| Kindergarten | 197 | 5.4% |
| Elementary School | 1,063 | 28.9% |
| Middle School | 830 | 22.6% |
| High School | 707 | 19.2% |
| College / Undergraduate | 587 | 16.0% |
| Graduate / Professional | 137 | 3.7% |
| Total | 3,675 | 100.0% |
School Enrollment by Age by Funding Source in Bandera County
Out of a total of 3,675 students who are enrolled in schools in Bandera County, 706 (19.2%) attend a private institution, while the remaining 2,969 (80.8%) are enrolled in public schools. The age group of 25 to 34 year olds has the highest likelihood of being enrolled in private schools, with 40 (34.5% in the age bracket) enrolled. Conversely, the age group of 18 to 19 year olds has the lowest likelihood of being enrolled in a private school, with 220 (90.2% in the age bracket) attending a public institution.
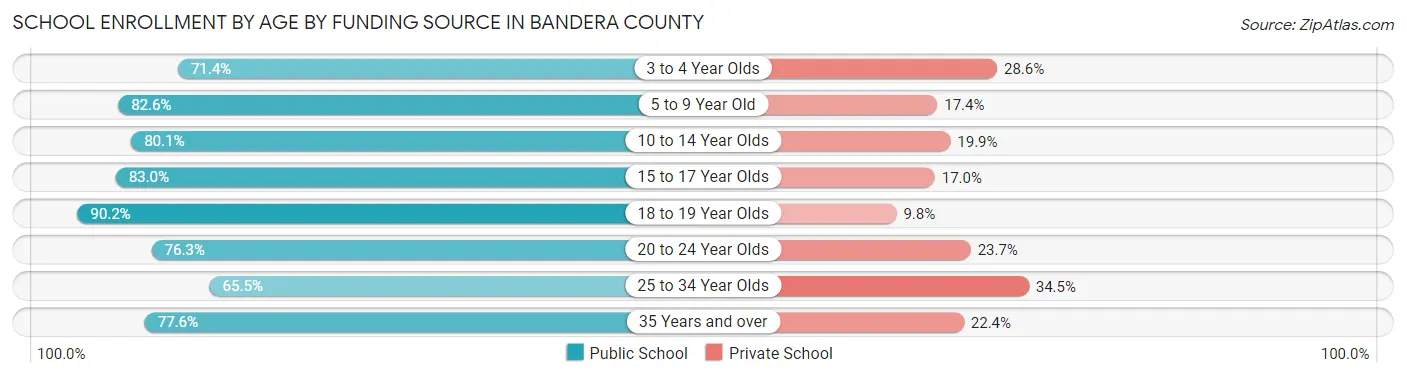
| Age Bracket | Public School | Private School |
| 3 to 4 Year Olds | 85 (71.4%) | 34 (28.6%) |
| 5 to 9 Year Old | 994 (82.6%) | 210 (17.4%) |
| 10 to 14 Year Olds | 742 (80.1%) | 184 (19.9%) |
| 15 to 17 Year Olds | 479 (83.0%) | 98 (17.0%) |
| 18 to 19 Year Olds | 220 (90.2%) | 24 (9.8%) |
| 20 to 24 Year Olds | 271 (76.3%) | 84 (23.7%) |
| 25 to 34 Year Olds | 76 (65.5%) | 40 (34.5%) |
| 35 Years and over | 104 (77.6%) | 30 (22.4%) |
| Total | 2,969 (80.8%) | 706 (19.2%) |
Educational Attainment by Field of Study in Bandera County
Business (911 | 19.1%), education (826 | 17.3%), engineering (467 | 9.8%), science & technology (437 | 9.2%), and bio, nature & agricultural (346 | 7.2%) are the most common fields of study among 4,772 individuals in Bandera County who have obtained a bachelor's degree or higher.
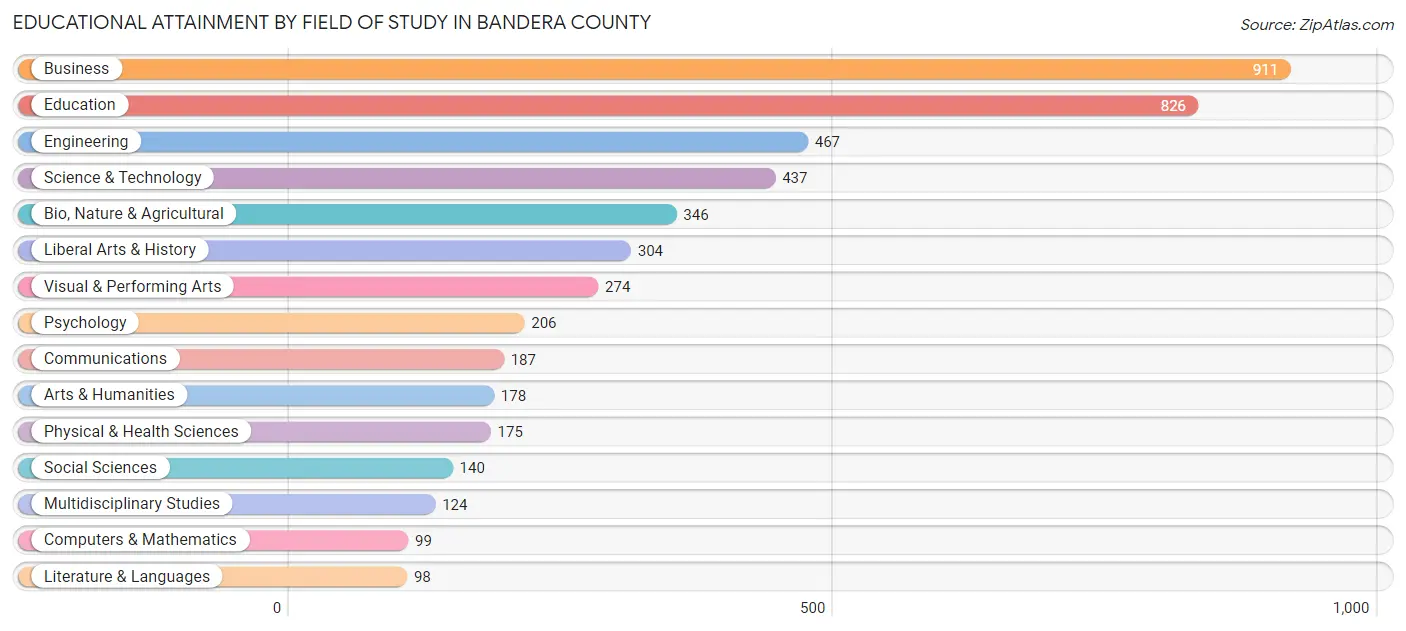
| Field of Study | # Graduates | % Graduates |
| Computers & Mathematics | 99 | 2.1% |
| Bio, Nature & Agricultural | 346 | 7.2% |
| Physical & Health Sciences | 175 | 3.7% |
| Psychology | 206 | 4.3% |
| Social Sciences | 140 | 2.9% |
| Engineering | 467 | 9.8% |
| Multidisciplinary Studies | 124 | 2.6% |
| Science & Technology | 437 | 9.2% |
| Business | 911 | 19.1% |
| Education | 826 | 17.3% |
| Literature & Languages | 98 | 2.1% |
| Liberal Arts & History | 304 | 6.4% |
| Visual & Performing Arts | 274 | 5.7% |
| Communications | 187 | 3.9% |
| Arts & Humanities | 178 | 3.7% |
| Total | 4,772 | 100.0% |
Transportation & Commute in Bandera County
Vehicle Availability by Sex in Bandera County
The most prevalent vehicle ownership categories in Bandera County are males with 2 vehicles (1,781, accounting for 36.6%) and females with 2 vehicles (1,322, making up 43.6%).
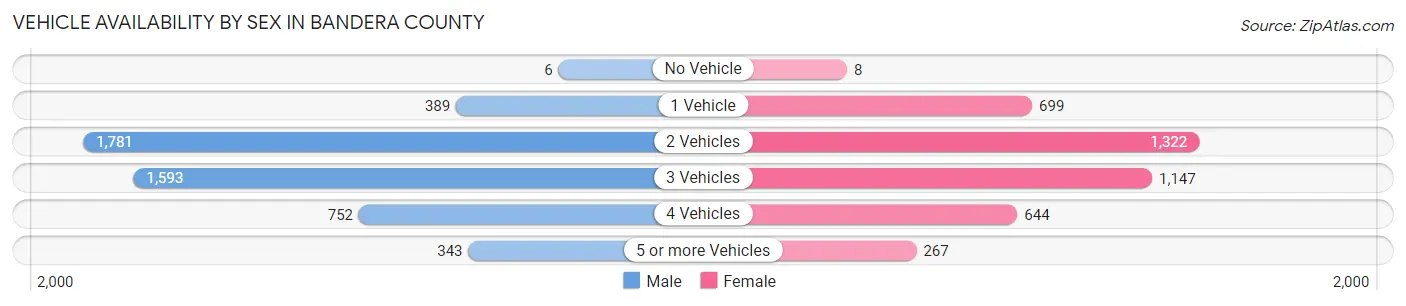
| Vehicles Available | Male | Female |
| No Vehicle | 6 (0.1%) | 8 (0.2%) |
| 1 Vehicle | 389 (8.0%) | 699 (17.1%) |
| 2 Vehicles | 1,781 (36.6%) | 1,322 (32.4%) |
| 3 Vehicles | 1,593 (32.8%) | 1,147 (28.1%) |
| 4 Vehicles | 752 (15.5%) | 644 (15.8%) |
| 5 or more Vehicles | 343 (7.0%) | 267 (6.5%) |
| Total | 4,864 (100.0%) | 4,087 (100.0%) |
Commute Time in Bandera County
The most frequently occuring commute durations in Bandera County are 45 to 59 minutes (1,310 commuters, 15.7%), 60 to 89 minutes (1,300 commuters, 15.6%), and 30 to 34 minutes (1,210 commuters, 14.5%).
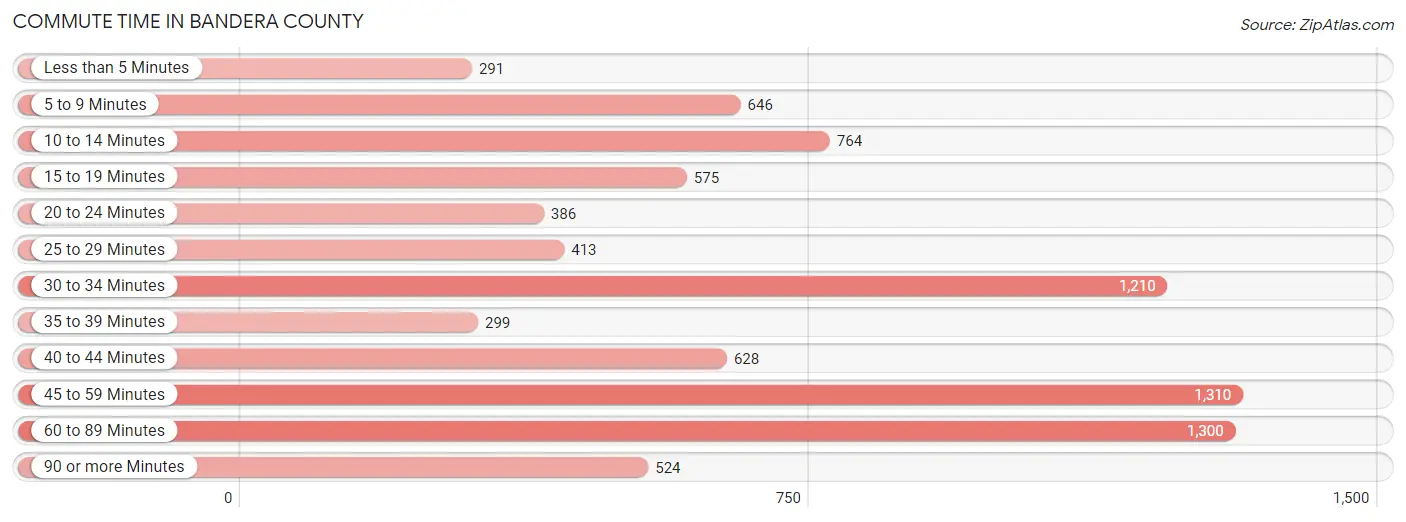
| Commute Time | # Commuters | % Commuters |
| Less than 5 Minutes | 291 | 3.5% |
| 5 to 9 Minutes | 646 | 7.7% |
| 10 to 14 Minutes | 764 | 9.1% |
| 15 to 19 Minutes | 575 | 6.9% |
| 20 to 24 Minutes | 386 | 4.6% |
| 25 to 29 Minutes | 413 | 5.0% |
| 30 to 34 Minutes | 1,210 | 14.5% |
| 35 to 39 Minutes | 299 | 3.6% |
| 40 to 44 Minutes | 628 | 7.5% |
| 45 to 59 Minutes | 1,310 | 15.7% |
| 60 to 89 Minutes | 1,300 | 15.6% |
| 90 or more Minutes | 524 | 6.3% |
Commute Time by Sex in Bandera County
The most common commute times in Bandera County are 45 to 59 minutes (966 commuters, 20.7%) for males and 30 to 34 minutes (658 commuters, 17.9%) for females.
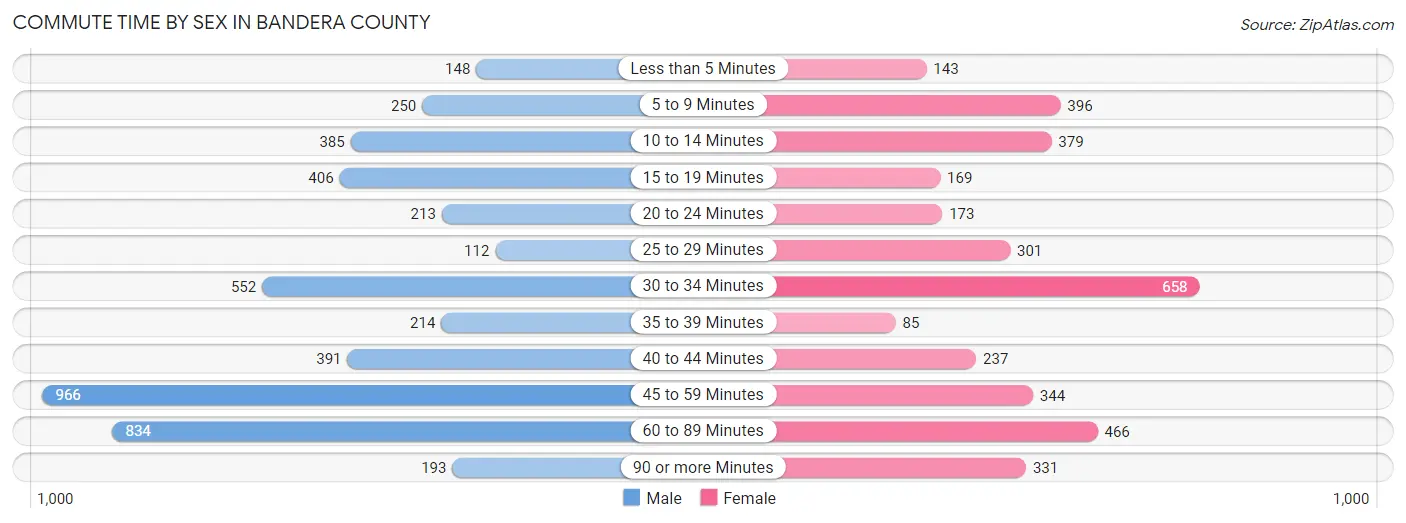
| Commute Time | Male | Female |
| Less than 5 Minutes | 148 (3.2%) | 143 (3.9%) |
| 5 to 9 Minutes | 250 (5.4%) | 396 (10.8%) |
| 10 to 14 Minutes | 385 (8.3%) | 379 (10.3%) |
| 15 to 19 Minutes | 406 (8.7%) | 169 (4.6%) |
| 20 to 24 Minutes | 213 (4.6%) | 173 (4.7%) |
| 25 to 29 Minutes | 112 (2.4%) | 301 (8.2%) |
| 30 to 34 Minutes | 552 (11.8%) | 658 (17.9%) |
| 35 to 39 Minutes | 214 (4.6%) | 85 (2.3%) |
| 40 to 44 Minutes | 391 (8.4%) | 237 (6.4%) |
| 45 to 59 Minutes | 966 (20.7%) | 344 (9.3%) |
| 60 to 89 Minutes | 834 (17.9%) | 466 (12.7%) |
| 90 or more Minutes | 193 (4.1%) | 331 (9.0%) |
Time of Departure to Work by Sex in Bandera County
The most frequent times of departure to work in Bandera County are 7:00 AM to 7:29 AM (615, 13.2%) for males and 7:00 AM to 7:29 AM (542, 14.7%) for females.
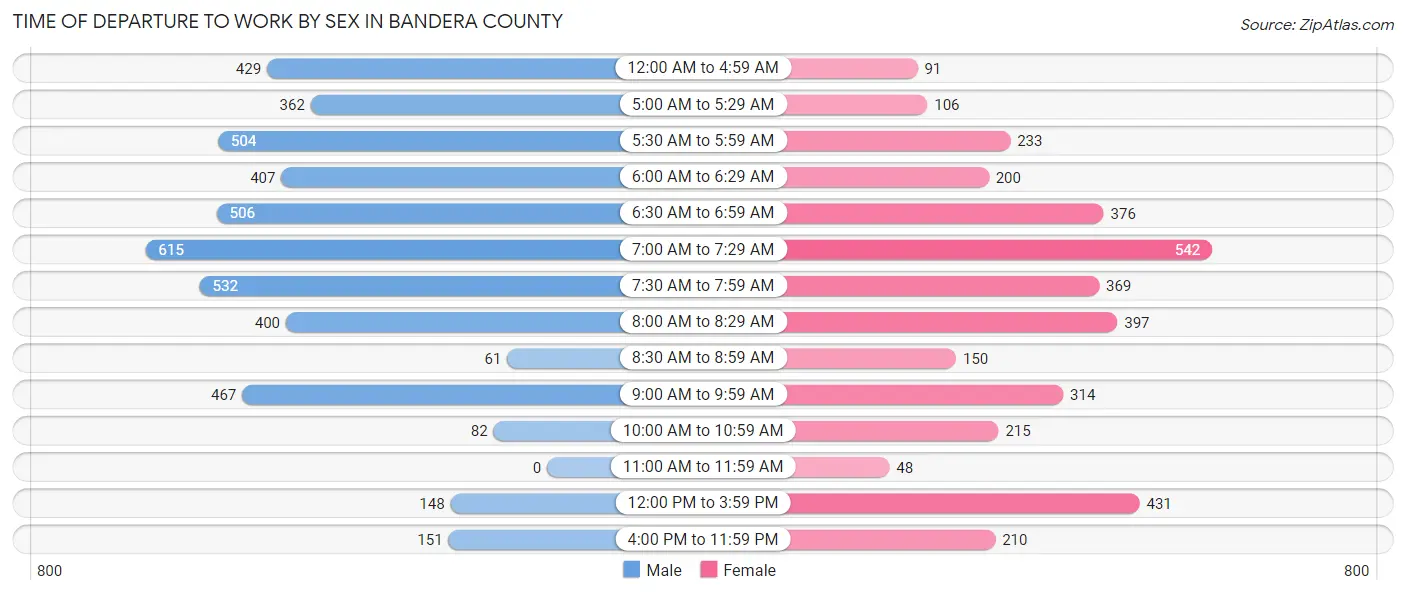
| Time of Departure | Male | Female |
| 12:00 AM to 4:59 AM | 429 (9.2%) | 91 (2.5%) |
| 5:00 AM to 5:29 AM | 362 (7.8%) | 106 (2.9%) |
| 5:30 AM to 5:59 AM | 504 (10.8%) | 233 (6.3%) |
| 6:00 AM to 6:29 AM | 407 (8.7%) | 200 (5.4%) |
| 6:30 AM to 6:59 AM | 506 (10.8%) | 376 (10.2%) |
| 7:00 AM to 7:29 AM | 615 (13.2%) | 542 (14.7%) |
| 7:30 AM to 7:59 AM | 532 (11.4%) | 369 (10.0%) |
| 8:00 AM to 8:29 AM | 400 (8.6%) | 397 (10.8%) |
| 8:30 AM to 8:59 AM | 61 (1.3%) | 150 (4.1%) |
| 9:00 AM to 9:59 AM | 467 (10.0%) | 314 (8.5%) |
| 10:00 AM to 10:59 AM | 82 (1.8%) | 215 (5.8%) |
| 11:00 AM to 11:59 AM | 0 (0.0%) | 48 (1.3%) |
| 12:00 PM to 3:59 PM | 148 (3.2%) | 431 (11.7%) |
| 4:00 PM to 11:59 PM | 151 (3.2%) | 210 (5.7%) |
| Total | 4,664 (100.0%) | 3,682 (100.0%) |
Housing Occupancy in Bandera County
Occupancy by Ownership in Bandera County
Of the total 8,532 dwellings in Bandera County, owner-occupied units account for 7,464 (87.5%), while renter-occupied units make up 1,068 (12.5%).
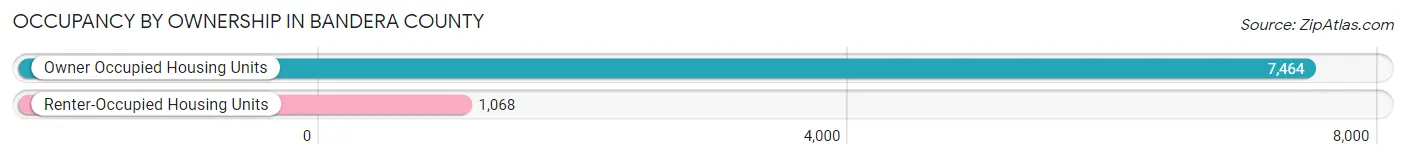
| Occupancy | # Housing Units | % Housing Units |
| Owner Occupied Housing Units | 7,464 | 87.5% |
| Renter-Occupied Housing Units | 1,068 | 12.5% |
| Total Occupied Housing Units | 8,532 | 100.0% |
Occupancy by Household Size in Bandera County
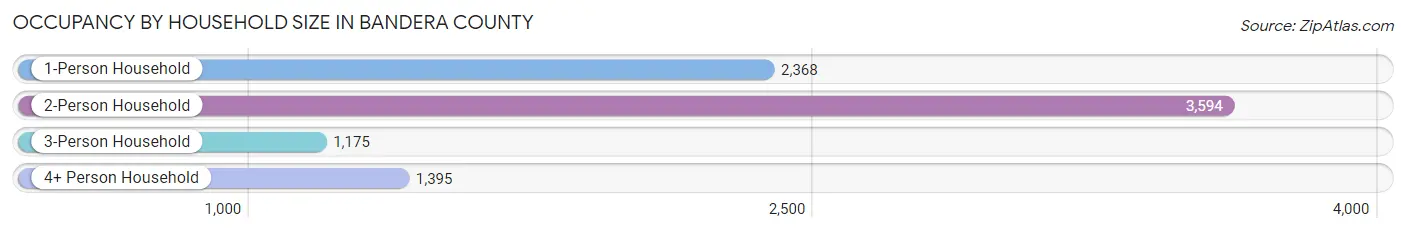
| Household Size | # Housing Units | % Housing Units |
| 1-Person Household | 2,368 | 27.8% |
| 2-Person Household | 3,594 | 42.1% |
| 3-Person Household | 1,175 | 13.8% |
| 4+ Person Household | 1,395 | 16.4% |
| Total Housing Units | 8,532 | 100.0% |
Occupancy by Ownership by Household Size in Bandera County
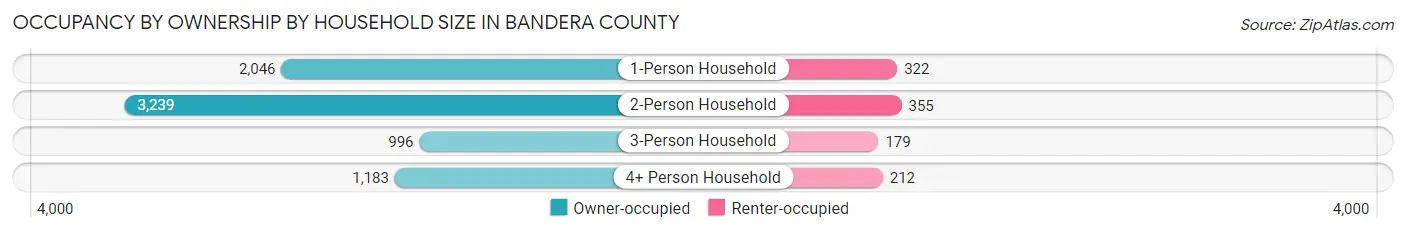
| Household Size | Owner-occupied | Renter-occupied |
| 1-Person Household | 2,046 (86.4%) | 322 (13.6%) |
| 2-Person Household | 3,239 (90.1%) | 355 (9.9%) |
| 3-Person Household | 996 (84.8%) | 179 (15.2%) |
| 4+ Person Household | 1,183 (84.8%) | 212 (15.2%) |
| Total Housing Units | 7,464 (87.5%) | 1,068 (12.5%) |
Occupancy by Educational Attainment in Bandera County
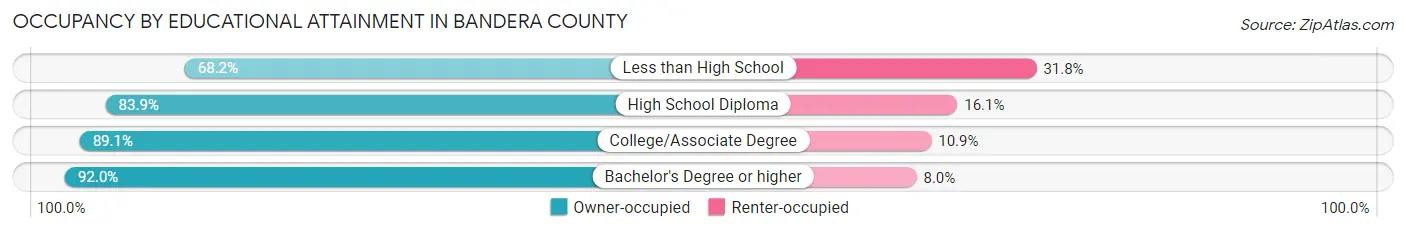
| Household Size | Owner-occupied | Renter-occupied |
| Less than High School | 367 (68.2%) | 171 (31.8%) |
| High School Diploma | 1,727 (83.9%) | 331 (16.1%) |
| College/Associate Degree | 2,770 (89.1%) | 340 (10.9%) |
| Bachelor's Degree or higher | 2,600 (92.0%) | 226 (8.0%) |
Occupancy by Age of Householder in Bandera County
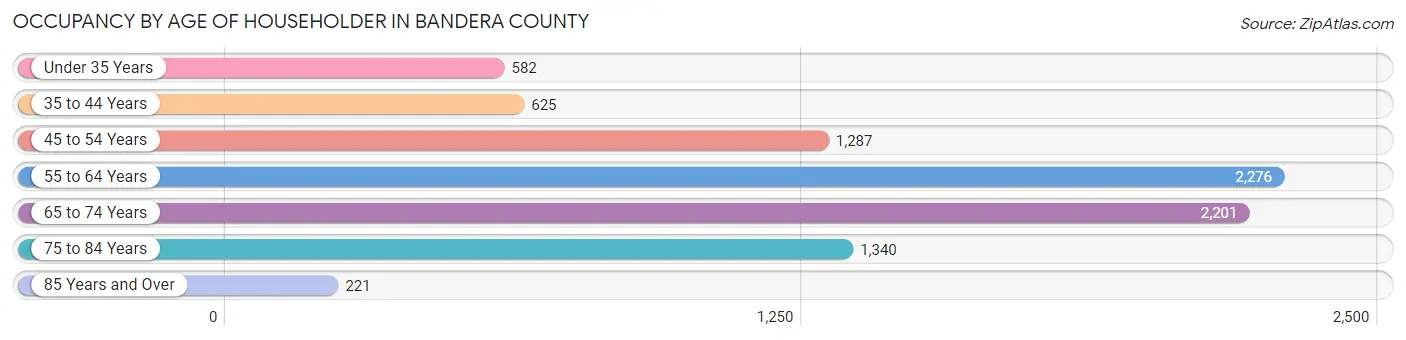
| Age Bracket | # Households | % Households |
| Under 35 Years | 582 | 6.8% |
| 35 to 44 Years | 625 | 7.3% |
| 45 to 54 Years | 1,287 | 15.1% |
| 55 to 64 Years | 2,276 | 26.7% |
| 65 to 74 Years | 2,201 | 25.8% |
| 75 to 84 Years | 1,340 | 15.7% |
| 85 Years and Over | 221 | 2.6% |
| Total | 8,532 | 100.0% |
Housing Finances in Bandera County
Median Income by Occupancy in Bandera County
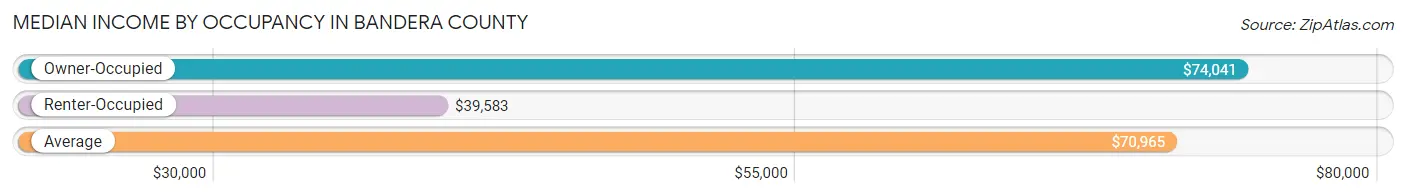
| Occupancy Type | # Households | Median Income |
| Owner-Occupied | 7,464 (87.5%) | $74,041 |
| Renter-Occupied | 1,068 (12.5%) | $39,583 |
| Average | 8,532 (100.0%) | $70,965 |
Occupancy by Householder Income Bracket in Bandera County
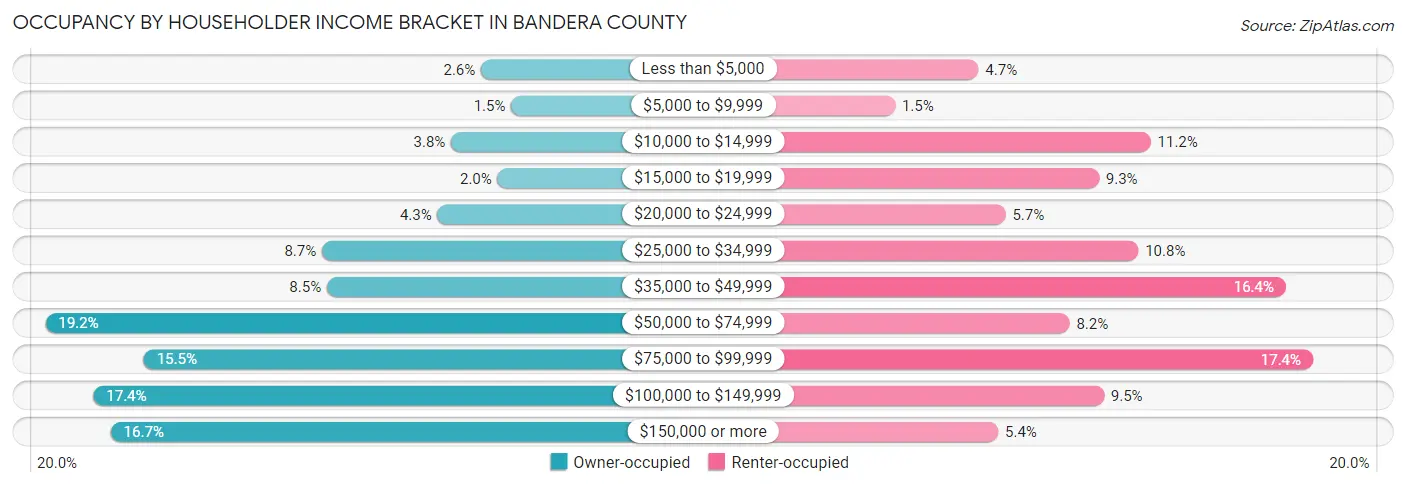
| Income Bracket | Owner-occupied | Renter-occupied |
| Less than $5,000 | 195 (2.6%) | 50 (4.7%) |
| $5,000 to $9,999 | 109 (1.5%) | 16 (1.5%) |
| $10,000 to $14,999 | 280 (3.7%) | 120 (11.2%) |
| $15,000 to $19,999 | 148 (2.0%) | 99 (9.3%) |
| $20,000 to $24,999 | 319 (4.3%) | 61 (5.7%) |
| $25,000 to $34,999 | 647 (8.7%) | 115 (10.8%) |
| $35,000 to $49,999 | 633 (8.5%) | 175 (16.4%) |
| $50,000 to $74,999 | 1,434 (19.2%) | 87 (8.2%) |
| $75,000 to $99,999 | 1,154 (15.5%) | 186 (17.4%) |
| $100,000 to $149,999 | 1,297 (17.4%) | 101 (9.5%) |
| $150,000 or more | 1,248 (16.7%) | 58 (5.4%) |
| Total | 7,464 (100.0%) | 1,068 (100.0%) |
Monthly Housing Cost Tiers in Bandera County
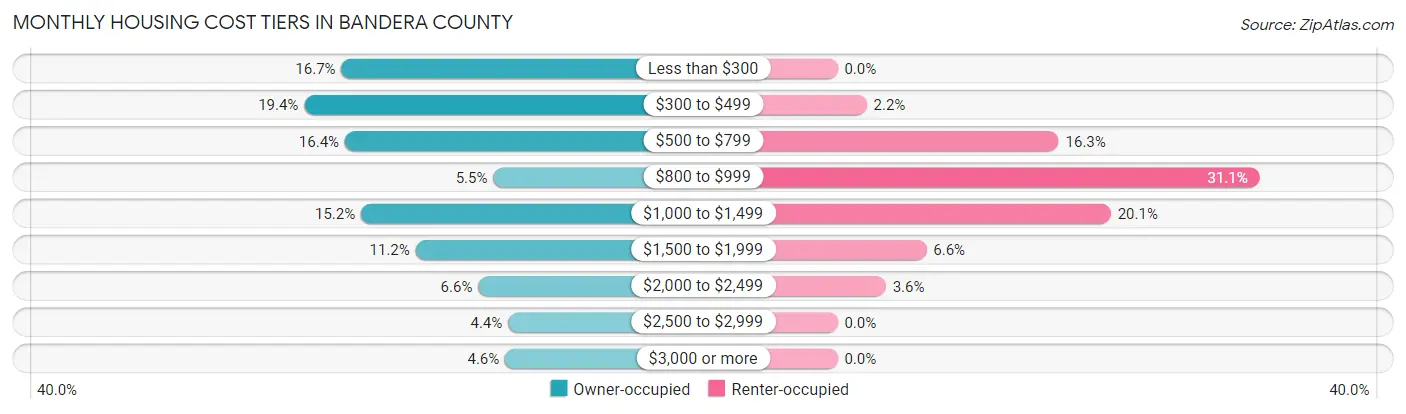
| Monthly Cost | Owner-occupied | Renter-occupied |
| Less than $300 | 1,244 (16.7%) | 0 (0.0%) |
| $300 to $499 | 1,449 (19.4%) | 23 (2.1%) |
| $500 to $799 | 1,225 (16.4%) | 174 (16.3%) |
| $800 to $999 | 409 (5.5%) | 332 (31.1%) |
| $1,000 to $1,499 | 1,136 (15.2%) | 215 (20.1%) |
| $1,500 to $1,999 | 837 (11.2%) | 70 (6.6%) |
| $2,000 to $2,499 | 492 (6.6%) | 38 (3.6%) |
| $2,500 to $2,999 | 328 (4.4%) | 0 (0.0%) |
| $3,000 or more | 344 (4.6%) | 0 (0.0%) |
| Total | 7,464 (100.0%) | 1,068 (100.0%) |
Physical Housing Characteristics in Bandera County
Housing Structures in Bandera County
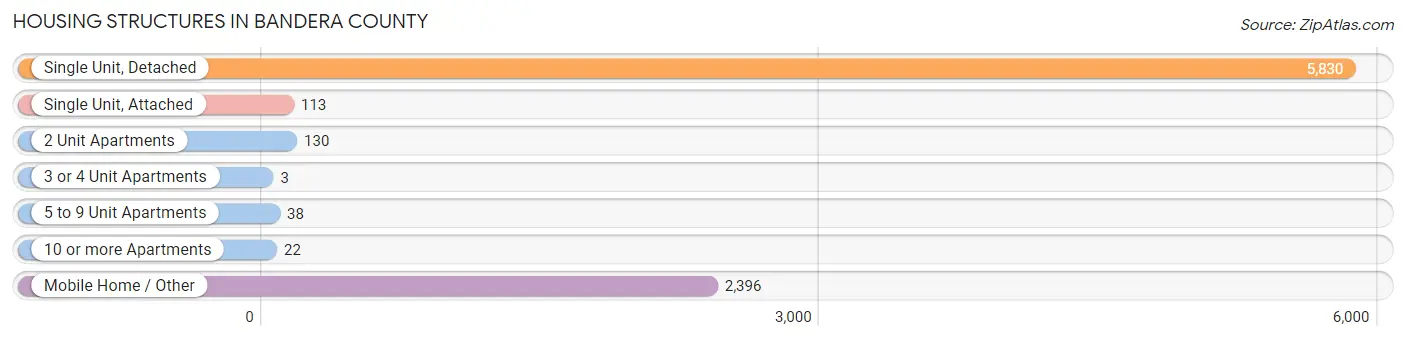
| Structure Type | # Housing Units | % Housing Units |
| Single Unit, Detached | 5,830 | 68.3% |
| Single Unit, Attached | 113 | 1.3% |
| 2 Unit Apartments | 130 | 1.5% |
| 3 or 4 Unit Apartments | 3 | 0.0% |
| 5 to 9 Unit Apartments | 38 | 0.4% |
| 10 or more Apartments | 22 | 0.3% |
| Mobile Home / Other | 2,396 | 28.1% |
| Total | 8,532 | 100.0% |
Housing Structures by Occupancy in Bandera County
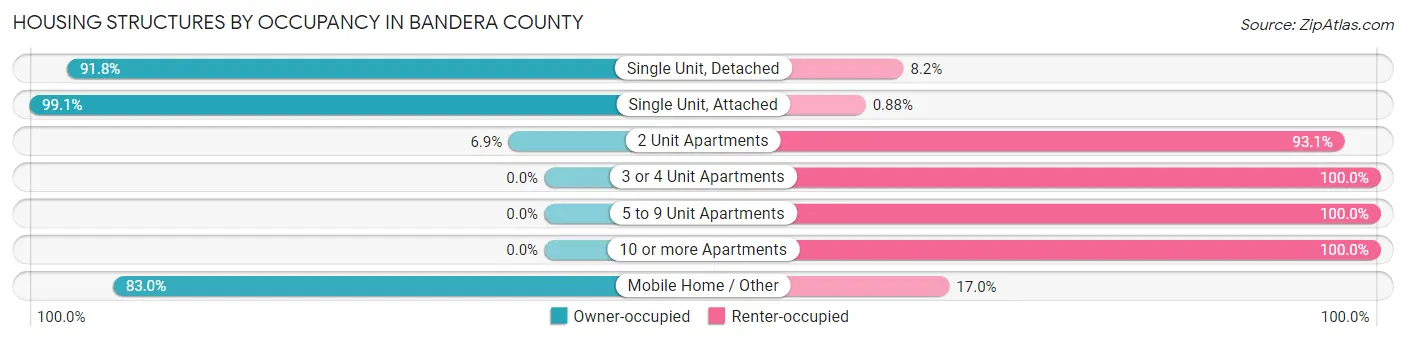
| Structure Type | Owner-occupied | Renter-occupied |
| Single Unit, Detached | 5,354 (91.8%) | 476 (8.2%) |
| Single Unit, Attached | 112 (99.1%) | 1 (0.9%) |
| 2 Unit Apartments | 9 (6.9%) | 121 (93.1%) |
| 3 or 4 Unit Apartments | 0 (0.0%) | 3 (100.0%) |
| 5 to 9 Unit Apartments | 0 (0.0%) | 38 (100.0%) |
| 10 or more Apartments | 0 (0.0%) | 22 (100.0%) |
| Mobile Home / Other | 1,989 (83.0%) | 407 (17.0%) |
| Total | 7,464 (87.5%) | 1,068 (12.5%) |
Housing Structures by Number of Rooms in Bandera County
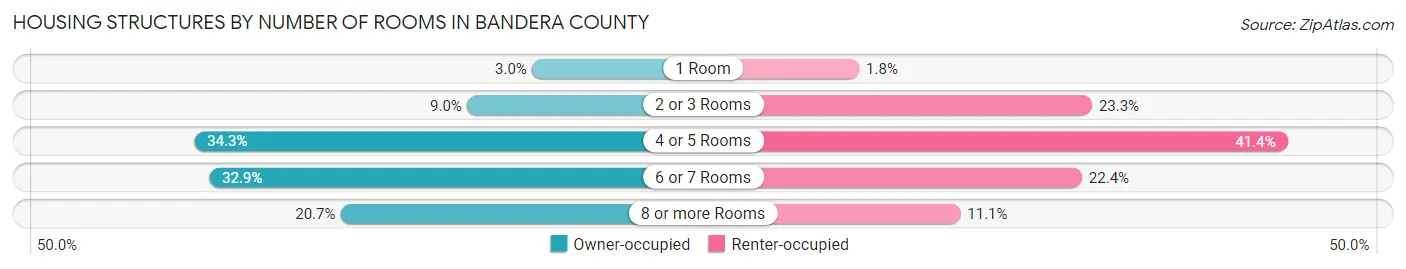
| Number of Rooms | Owner-occupied | Renter-occupied |
| 1 Room | 225 (3.0%) | 19 (1.8%) |
| 2 or 3 Rooms | 673 (9.0%) | 249 (23.3%) |
| 4 or 5 Rooms | 2,562 (34.3%) | 442 (41.4%) |
| 6 or 7 Rooms | 2,458 (32.9%) | 239 (22.4%) |
| 8 or more Rooms | 1,546 (20.7%) | 119 (11.1%) |
| Total | 7,464 (100.0%) | 1,068 (100.0%) |
Housing Structure by Heating Type in Bandera County
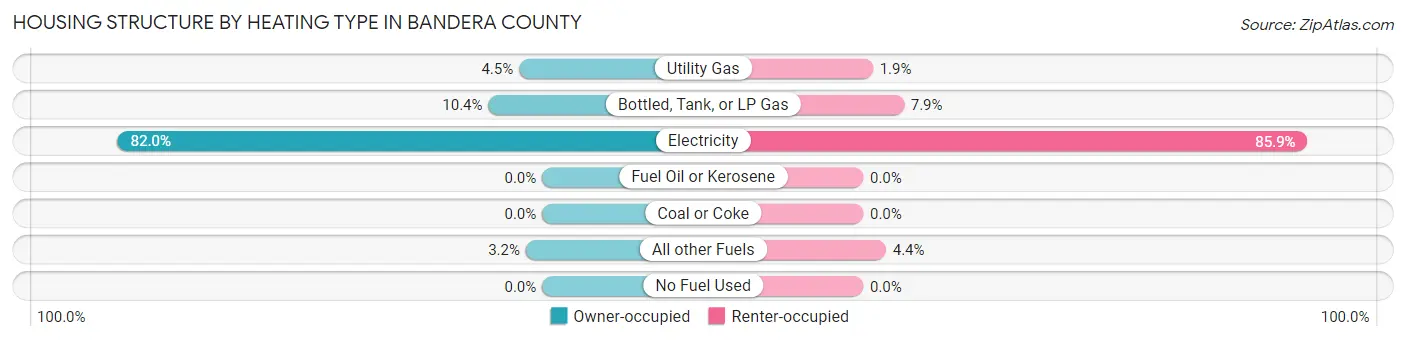
| Heating Type | Owner-occupied | Renter-occupied |
| Utility Gas | 332 (4.4%) | 20 (1.9%) |
| Bottled, Tank, or LP Gas | 775 (10.4%) | 84 (7.9%) |
| Electricity | 6,122 (82.0%) | 917 (85.9%) |
| Fuel Oil or Kerosene | 0 (0.0%) | 0 (0.0%) |
| Coal or Coke | 0 (0.0%) | 0 (0.0%) |
| All other Fuels | 235 (3.2%) | 47 (4.4%) |
| No Fuel Used | 0 (0.0%) | 0 (0.0%) |
| Total | 7,464 (100.0%) | 1,068 (100.0%) |
Household Vehicle Usage in Bandera County
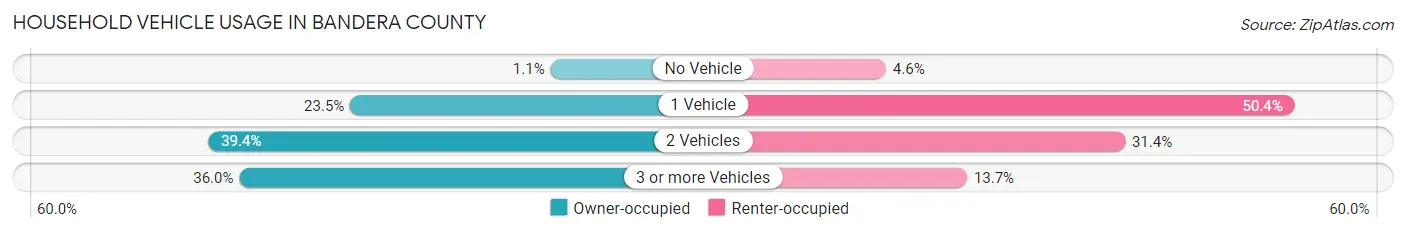
| Vehicles per Household | Owner-occupied | Renter-occupied |
| No Vehicle | 81 (1.1%) | 49 (4.6%) |
| 1 Vehicle | 1,756 (23.5%) | 538 (50.4%) |
| 2 Vehicles | 2,944 (39.4%) | 335 (31.4%) |
| 3 or more Vehicles | 2,683 (35.9%) | 146 (13.7%) |
| Total | 7,464 (100.0%) | 1,068 (100.0%) |
Real Estate & Mortgages in Bandera County
Real Estate and Mortgage Overview in Bandera County
| Characteristic | Without Mortgage | With Mortgage |
| Housing Units | 4,245 | 3,219 |
| Median Property Value | $210,900 | $269,800 |
| Median Household Income | $65,465 | $687 |
| Monthly Housing Costs | $443 | $305 |
| Real Estate Taxes | $1,917 | $226 |
Property Value by Mortgage Status in Bandera County
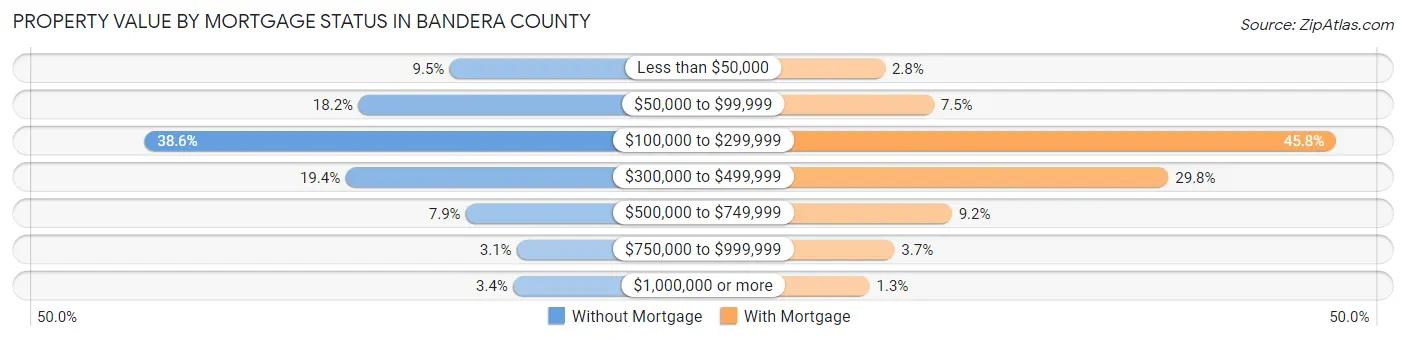
| Property Value | Without Mortgage | With Mortgage |
| Less than $50,000 | 402 (9.5%) | 90 (2.8%) |
| $50,000 to $99,999 | 771 (18.2%) | 240 (7.5%) |
| $100,000 to $299,999 | 1,638 (38.6%) | 1,473 (45.8%) |
| $300,000 to $499,999 | 823 (19.4%) | 959 (29.8%) |
| $500,000 to $749,999 | 336 (7.9%) | 295 (9.2%) |
| $750,000 to $999,999 | 130 (3.1%) | 119 (3.7%) |
| $1,000,000 or more | 145 (3.4%) | 43 (1.3%) |
| Total | 4,245 (100.0%) | 3,219 (100.0%) |
Household Income by Mortgage Status in Bandera County
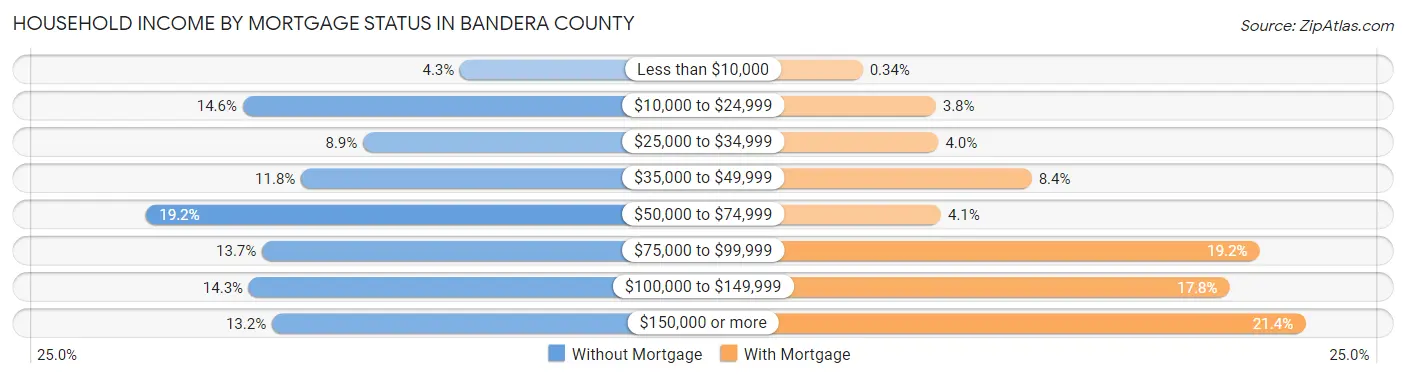
| Household Income | Without Mortgage | With Mortgage |
| Less than $10,000 | 181 (4.3%) | 11 (0.3%) |
| $10,000 to $24,999 | 620 (14.6%) | 123 (3.8%) |
| $25,000 to $34,999 | 377 (8.9%) | 127 (4.0%) |
| $35,000 to $49,999 | 502 (11.8%) | 270 (8.4%) |
| $50,000 to $74,999 | 815 (19.2%) | 131 (4.1%) |
| $75,000 to $99,999 | 581 (13.7%) | 619 (19.2%) |
| $100,000 to $149,999 | 608 (14.3%) | 573 (17.8%) |
| $150,000 or more | 561 (13.2%) | 689 (21.4%) |
| Total | 4,245 (100.0%) | 3,219 (100.0%) |
Property Value to Household Income Ratio in Bandera County
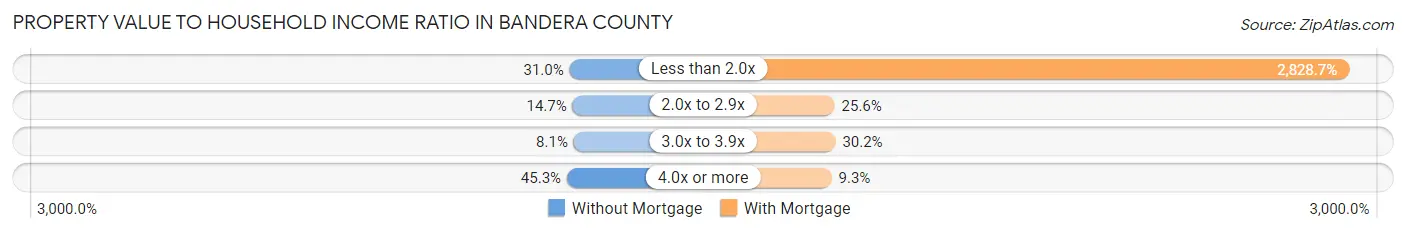
| Value-to-Income Ratio | Without Mortgage | With Mortgage |
| Less than 2.0x | 1,315 (31.0%) | 91,055 (2,828.7%) |
| 2.0x to 2.9x | 624 (14.7%) | 823 (25.6%) |
| 3.0x to 3.9x | 344 (8.1%) | 971 (30.2%) |
| 4.0x or more | 1,921 (45.3%) | 298 (9.3%) |
| Total | 4,245 (100.0%) | 3,219 (100.0%) |
Real Estate Taxes by Mortgage Status in Bandera County
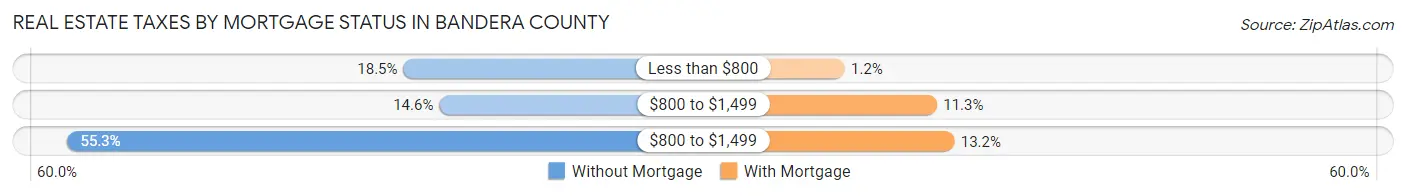
| Property Taxes | Without Mortgage | With Mortgage |
| Less than $800 | 785 (18.5%) | 39 (1.2%) |
| $800 to $1,499 | 618 (14.6%) | 364 (11.3%) |
| $800 to $1,499 | 2,348 (55.3%) | 426 (13.2%) |
| Total | 4,245 (100.0%) | 3,219 (100.0%) |
Health & Disability in Bandera County
Health Insurance Coverage by Age in Bandera County
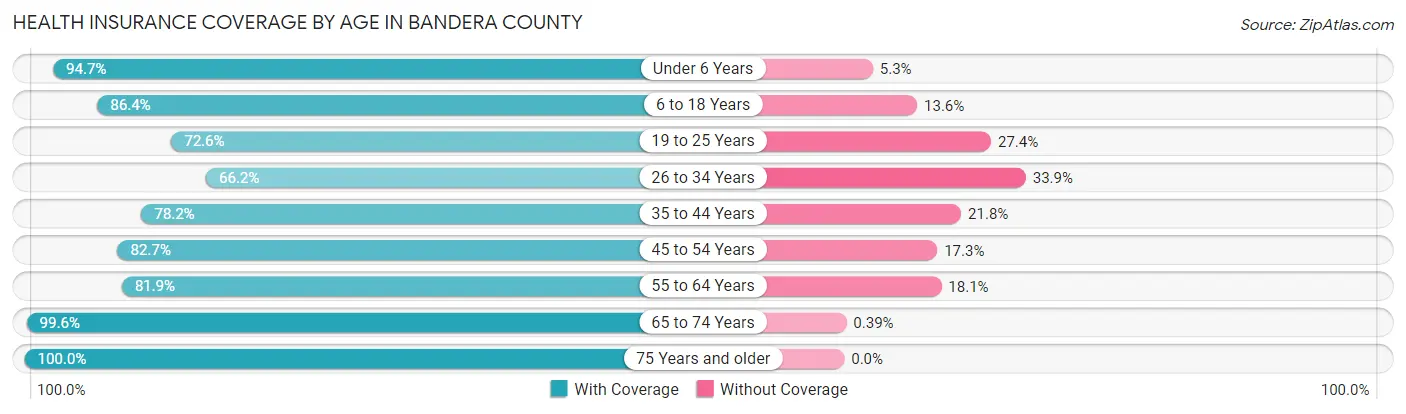
| Age Bracket | With Coverage | Without Coverage |
| Under 6 Years | 763 (94.7%) | 43 (5.3%) |
| 6 to 18 Years | 2,482 (86.4%) | 390 (13.6%) |
| 19 to 25 Years | 950 (72.6%) | 358 (27.4%) |
| 26 to 34 Years | 891 (66.1%) | 456 (33.9%) |
| 35 to 44 Years | 1,522 (78.2%) | 424 (21.8%) |
| 45 to 54 Years | 2,371 (82.7%) | 497 (17.3%) |
| 55 to 64 Years | 3,309 (81.9%) | 732 (18.1%) |
| 65 to 74 Years | 3,553 (99.6%) | 14 (0.4%) |
| 75 Years and older | 2,264 (100.0%) | 0 (0.0%) |
| Total | 18,105 (86.1%) | 2,914 (13.9%) |
Health Insurance Coverage by Citizenship Status in Bandera County
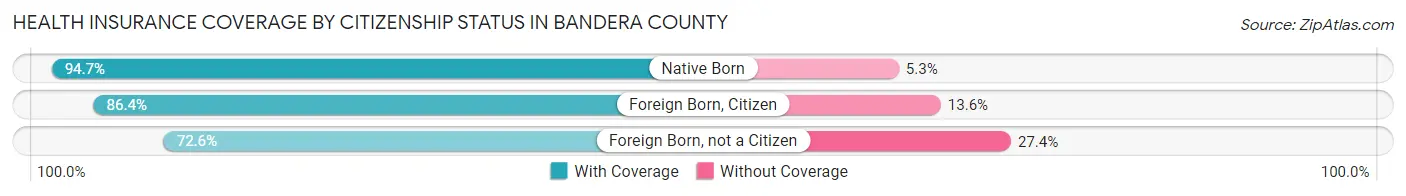
| Citizenship Status | With Coverage | Without Coverage |
| Native Born | 763 (94.7%) | 43 (5.3%) |
| Foreign Born, Citizen | 2,482 (86.4%) | 390 (13.6%) |
| Foreign Born, not a Citizen | 950 (72.6%) | 358 (27.4%) |
Health Insurance Coverage by Household Income in Bandera County
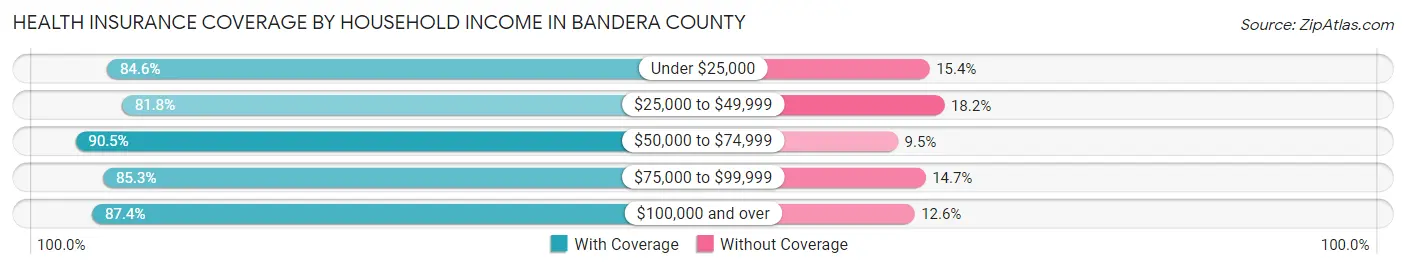
| Household Income | With Coverage | Without Coverage |
| Under $25,000 | 2,157 (84.6%) | 394 (15.4%) |
| $25,000 to $49,999 | 2,317 (81.8%) | 516 (18.2%) |
| $50,000 to $74,999 | 2,831 (90.5%) | 298 (9.5%) |
| $75,000 to $99,999 | 4,078 (85.3%) | 702 (14.7%) |
| $100,000 and over | 6,480 (87.4%) | 937 (12.6%) |
Public vs Private Health Insurance Coverage by Age in Bandera County
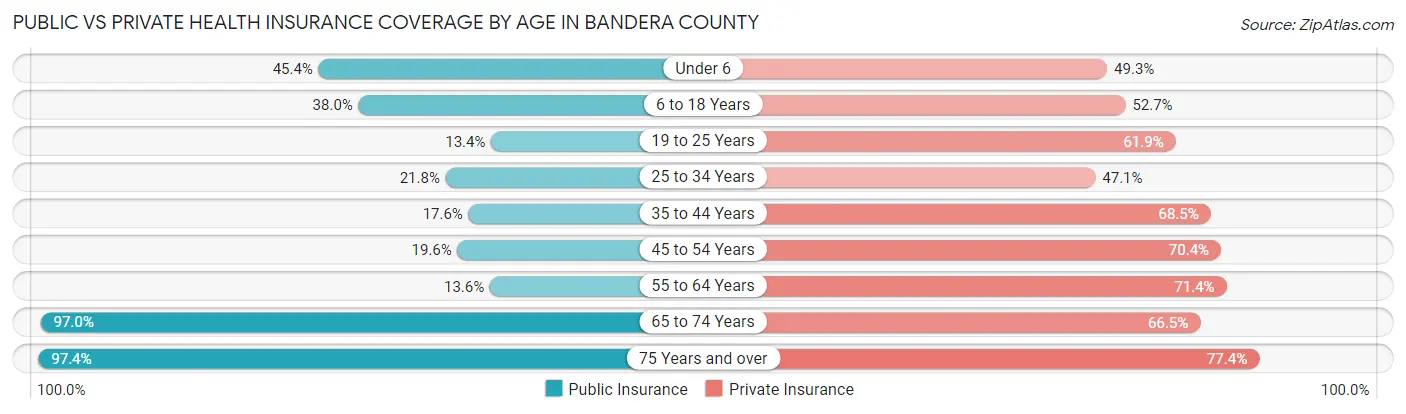
| Age Bracket | Public Insurance | Private Insurance |
| Under 6 | 366 (45.4%) | 397 (49.3%) |
| 6 to 18 Years | 1,091 (38.0%) | 1,512 (52.6%) |
| 19 to 25 Years | 175 (13.4%) | 810 (61.9%) |
| 25 to 34 Years | 294 (21.8%) | 634 (47.1%) |
| 35 to 44 Years | 342 (17.6%) | 1,332 (68.4%) |
| 45 to 54 Years | 563 (19.6%) | 2,018 (70.4%) |
| 55 to 64 Years | 550 (13.6%) | 2,885 (71.4%) |
| 65 to 74 Years | 3,461 (97.0%) | 2,372 (66.5%) |
| 75 Years and over | 2,206 (97.4%) | 1,753 (77.4%) |
| Total | 9,048 (43.0%) | 13,713 (65.2%) |
Disability Status by Sex by Age in Bandera County
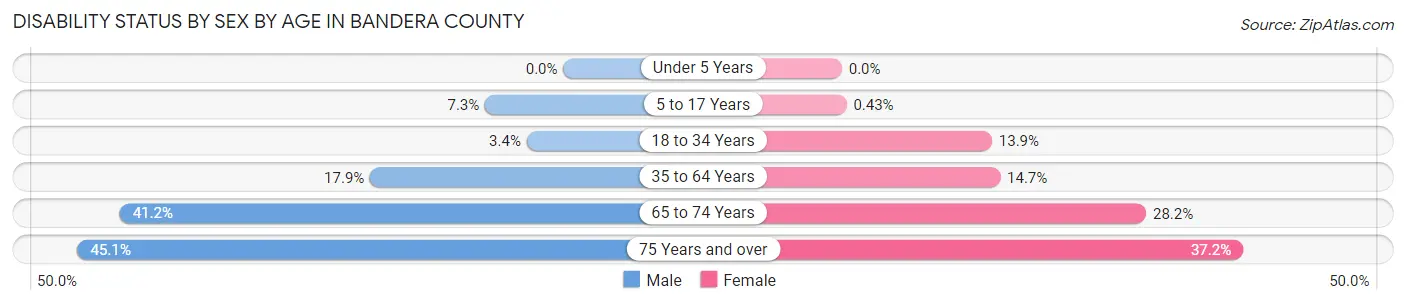
| Age Bracket | Male | Female |
| Under 5 Years | 0 (0.0%) | 0 (0.0%) |
| 5 to 17 Years | 104 (7.3%) | 6 (0.4%) |
| 18 to 34 Years | 48 (3.4%) | 191 (13.9%) |
| 35 to 64 Years | 765 (17.9%) | 674 (14.7%) |
| 65 to 74 Years | 741 (41.2%) | 499 (28.2%) |
| 75 Years and over | 500 (45.1%) | 430 (37.2%) |
Disability Class by Sex by Age in Bandera County
Disability Class: Hearing Difficulty
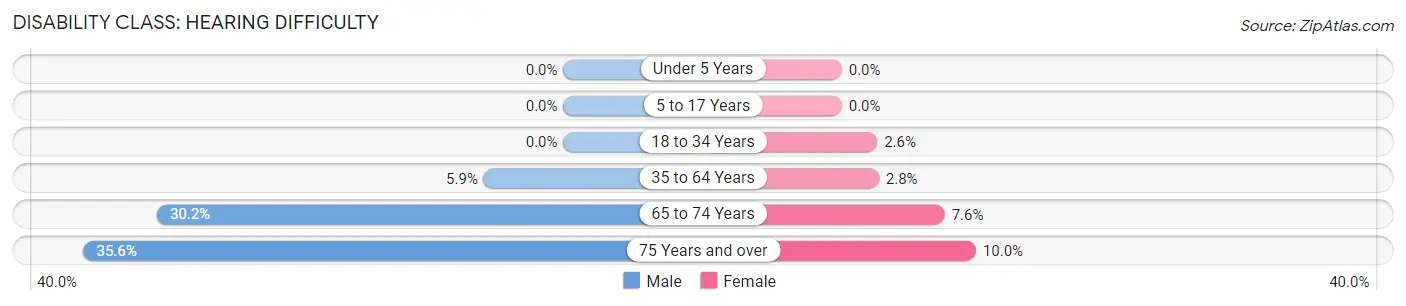
| Age Bracket | Male | Female |
| Under 5 Years | 0 (0.0%) | 0 (0.0%) |
| 5 to 17 Years | 0 (0.0%) | 0 (0.0%) |
| 18 to 34 Years | 0 (0.0%) | 36 (2.6%) |
| 35 to 64 Years | 252 (5.9%) | 126 (2.8%) |
| 65 to 74 Years | 543 (30.2%) | 135 (7.6%) |
| 75 Years and over | 395 (35.6%) | 115 (10.0%) |
Disability Class: Vision Difficulty
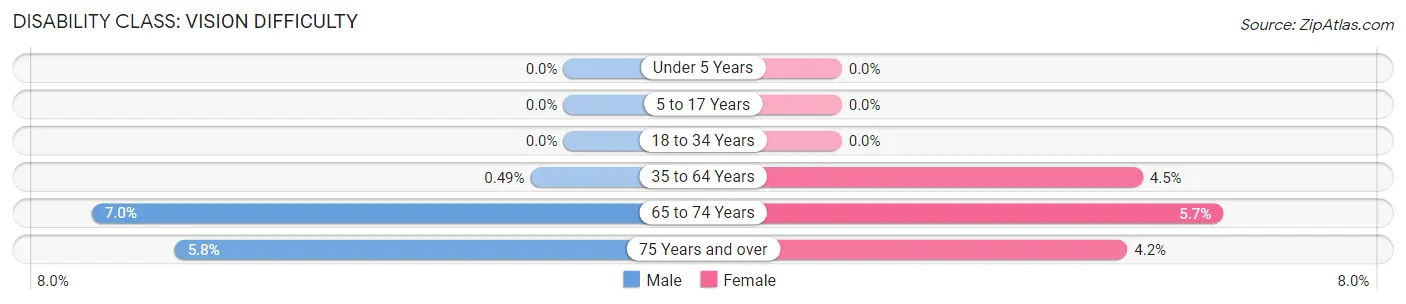
| Age Bracket | Male | Female |
| Under 5 Years | 0 (0.0%) | 0 (0.0%) |
| 5 to 17 Years | 0 (0.0%) | 0 (0.0%) |
| 18 to 34 Years | 0 (0.0%) | 0 (0.0%) |
| 35 to 64 Years | 21 (0.5%) | 205 (4.5%) |
| 65 to 74 Years | 126 (7.0%) | 100 (5.7%) |
| 75 Years and over | 64 (5.8%) | 49 (4.2%) |
Disability Class: Cognitive Difficulty
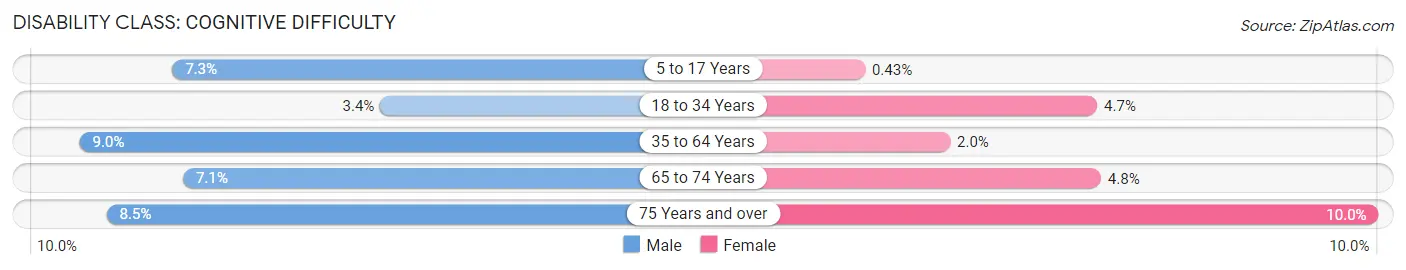
| Age Bracket | Male | Female |
| 5 to 17 Years | 104 (7.3%) | 6 (0.4%) |
| 18 to 34 Years | 48 (3.4%) | 65 (4.7%) |
| 35 to 64 Years | 383 (9.0%) | 92 (2.0%) |
| 65 to 74 Years | 127 (7.1%) | 85 (4.8%) |
| 75 Years and over | 94 (8.5%) | 115 (10.0%) |
Disability Class: Ambulatory Difficulty
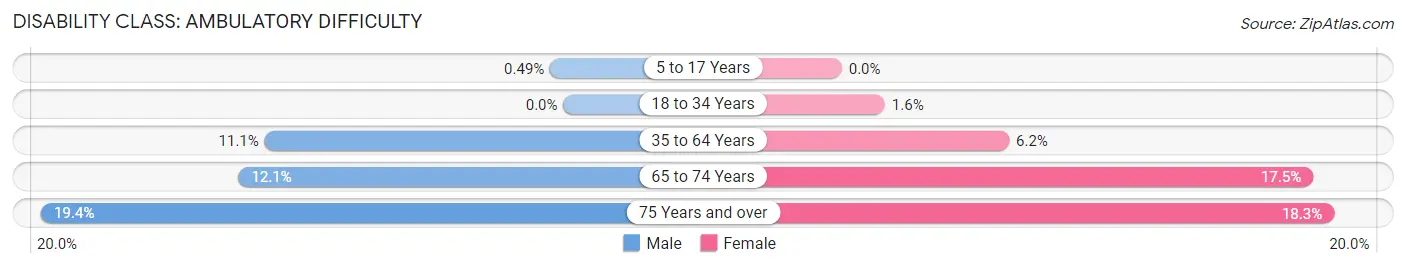
| Age Bracket | Male | Female |
| 5 to 17 Years | 7 (0.5%) | 0 (0.0%) |
| 18 to 34 Years | 0 (0.0%) | 22 (1.6%) |
| 35 to 64 Years | 473 (11.1%) | 285 (6.2%) |
| 65 to 74 Years | 217 (12.1%) | 309 (17.5%) |
| 75 Years and over | 215 (19.4%) | 211 (18.3%) |
Disability Class: Self-Care Difficulty
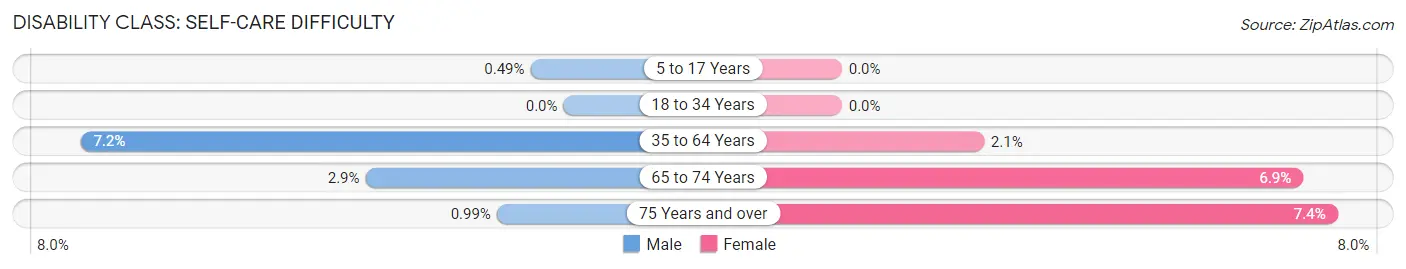
| Age Bracket | Male | Female |
| 5 to 17 Years | 7 (0.5%) | 0 (0.0%) |
| 18 to 34 Years | 0 (0.0%) | 0 (0.0%) |
| 35 to 64 Years | 306 (7.2%) | 97 (2.1%) |
| 65 to 74 Years | 53 (2.9%) | 121 (6.9%) |
| 75 Years and over | 11 (1.0%) | 85 (7.4%) |
Technology Access in Bandera County
Computing Device Access in Bandera County
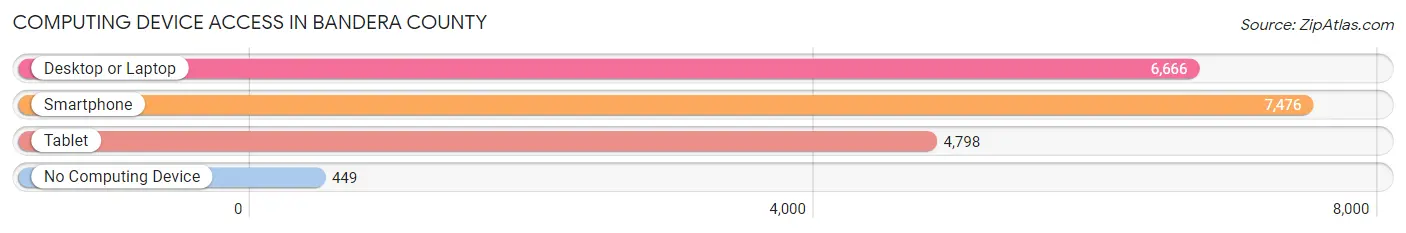
| Device Type | # Households | % Households |
| Desktop or Laptop | 6,666 | 78.1% |
| Smartphone | 7,476 | 87.6% |
| Tablet | 4,798 | 56.2% |
| No Computing Device | 449 | 5.3% |
| Total | 8,532 | 100.0% |
Internet Access in Bandera County
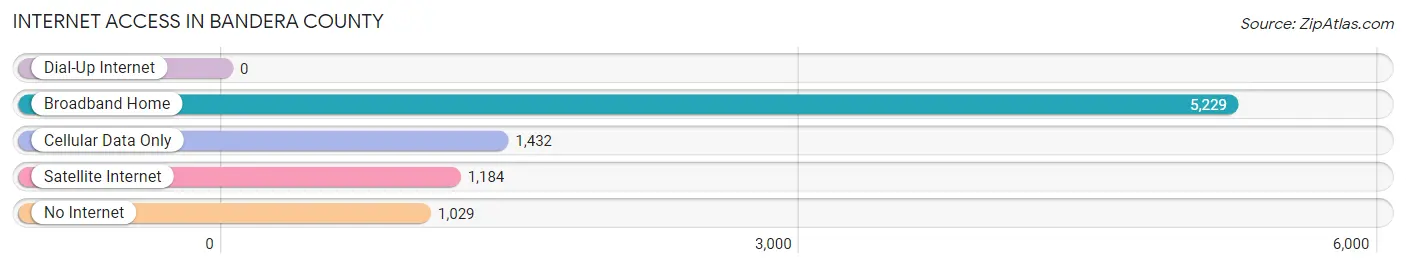
| Internet Type | # Households | % Households |
| Dial-Up Internet | 0 | 0.0% |
| Broadband Home | 5,229 | 61.3% |
| Cellular Data Only | 1,432 | 16.8% |
| Satellite Internet | 1,184 | 13.9% |
| No Internet | 1,029 | 12.1% |
| Total | 8,532 | 100.0% |
Bandera County Summary
Bandera County is located in the state of Texas, in the United States of America. It is situated in the Hill Country region of the state, and is bordered by Kerr, Kendall, and Medina counties. The county seat is Bandera, and the county has a population of approximately 20,485 people, as of the 2020 census.
Geography
Bandera County is located in the Hill Country region of Texas, and is bordered by Kerr, Kendall, and Medina counties. The county covers an area of 1,053 square miles, and is home to numerous rivers, creeks, and streams, including the Medina, Sabinal, and Frio rivers. The terrain is mostly hilly, with some flat areas in the northern and eastern parts of the county. The highest point in the county is located at the intersection of Medina and Frio counties, at an elevation of 1,890 feet.
The climate of Bandera County is generally mild, with hot summers and cool winters. The average annual temperature is around 68 degrees Fahrenheit, and the average annual precipitation is around 33 inches.
Economy
The economy of Bandera County is largely based on agriculture and tourism. The county is home to numerous ranches and farms, which produce a variety of crops, including corn, wheat, hay, and cotton. The county is also home to several wineries, which produce a variety of wines.
Tourism is also an important part of the economy, as the county is home to numerous attractions, including the Hill Country State Natural Area, the Bandera County Historical Museum, and the Bandera County Courthouse. The county is also home to numerous festivals and events, such as the Bandera County Fair and the Bandera County Cowboy Capital of the World Celebration.
Demographics
As of the 2020 census, Bandera County had a population of 20,485 people. The racial makeup of the county was 87.3% White, 0.7% African American, 0.7% Native American, 0.3% Asian, 0.1% Pacific Islander, 9.3% from other races, and 1.9% from two or more races. Hispanic or Latino of any race were 24.2% of the population.
The median household income in Bandera County was $45,945, and the median family income was $51,945. The per capita income was $22,945. About 11.3% of the population was below the poverty line.
History
Bandera County was established in 1856, and was named after the Spanish word for flag. The county was originally part of the larger Bexar County, and was later divided into its own county.
The county was home to numerous Native American tribes, including the Comanche, Apache, and Tonkawa. The first European settlers arrived in the area in the early 1800s, and the county was officially organized in 1856.
The county was home to numerous ranches and farms, and the economy was largely based on agriculture. The county was also home to numerous saloons and gambling halls, which were popular with cowboys and other travelers.
In the late 1800s, the county began to experience a population boom, as more people moved to the area to take advantage of the fertile land and the booming economy. The population continued to grow throughout the 20th century, and the county remains a popular destination for tourists and outdoor enthusiasts.
Common Questions
What is Per Capita Income in Bandera County?
Per Capita income in Bandera County is $39,162.
What is the Median Family Income in Bandera County?
Median Family Income in Bandera County is $85,710.
What is the Median Household income in Bandera County?
Median Household Income in Bandera County is $70,965.
What is Income or Wage Gap in Bandera County?
Income or Wage Gap in Bandera County is 40.4%.
Women in Bandera County earn 59.6 cents for every dollar earned by a man.
What is Inequality or Gini Index in Bandera County?
Inequality or Gini Index in Bandera County is 0.46.
What is the Total Population of Bandera County?
Total Population of Bandera County is 21,182.
What is the Total Male Population of Bandera County?
Total Male Population of Bandera County is 10,479.
What is the Total Female Population of Bandera County?
Total Female Population of Bandera County is 10,703.
What is the Ratio of Males per 100 Females in Bandera County?
There are 97.91 Males per 100 Females in Bandera County.
What is the Ratio of Females per 100 Males in Bandera County?
There are 102.14 Females per 100 Males in Bandera County.
What is the Median Population Age in Bandera County?
Median Population Age in Bandera County is 53.4 Years.
What is the Average Family Size in Bandera County
Average Family Size in Bandera County is 2.9 People.
What is the Average Household Size in Bandera County
Average Household Size in Bandera County is 2.4 People.
How Large is the Labor Force in Bandera County?
There are 9,853 People in the Labor Forcein in Bandera County.
What is the Percentage of People in the Labor Force in Bandera County?
54.4% of People are in the Labor Force in Bandera County.
What is the Unemployment Rate in Bandera County?
Unemployment Rate in Bandera County is 6.7%.