Bailey County, TX Map & Demographics
Bailey County Map
Bailey County Overview
$29,674
PER CAPITA INCOME
$81,536
AVG FAMILY INCOME
$69,830
AVG HOUSEHOLD INCOME
35.7%
WAGE / INCOME GAP [ % ]
64.3¢/ $1
WAGE / INCOME GAP [ $ ]
0.44
INEQUALITY / GINI INDEX
6,902
TOTAL POPULATION
3,287
MALE POPULATION
3,615
FEMALE POPULATION
90.93
MALES / 100 FEMALES
109.98
FEMALES / 100 MALES
30.3
MEDIAN AGE
4.0
AVG FAMILY SIZE
3.5
AVG HOUSEHOLD SIZE
3,052
LABOR FORCE [ PEOPLE ]
57.9%
PERCENT IN LABOR FORCE
2.1%
UNEMPLOYMENT RATE
Bailey County Area Codes
Income in Bailey County
Income Overview in Bailey County
Per Capita Income in Bailey County is $29,674, while median incomes of families and households are $81,536 and $69,830 respectively.
| Characteristic | Number | Measure |
| Per Capita Income | 6,902 | $29,674 |
| Median Family Income | 1,338 | $81,536 |
| Mean Family Income | 1,338 | $97,736 |
| Median Household Income | 1,933 | $69,830 |
| Mean Household Income | 1,933 | $82,529 |
| Income Deficit | 1,338 | $0 |
| Wage / Income Gap (%) | 6,902 | 35.72% |
| Wage / Income Gap ($) | 6,902 | 64.28¢ per $1 |
| Gini / Inequality Index | 6,902 | 0.44 |
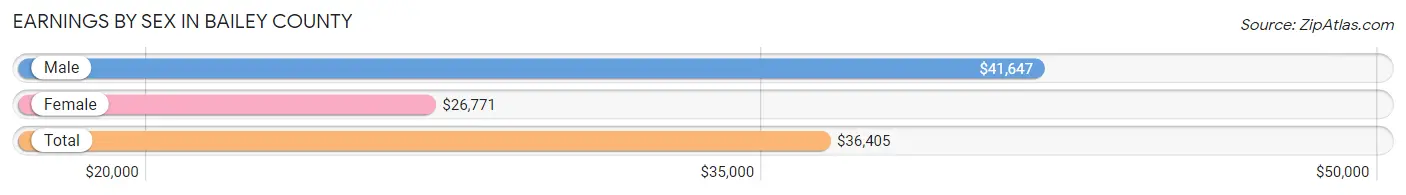
Earnings by Sex in Bailey County
Average Earnings in Bailey County are $36,405, $41,647 for men and $26,771 for women, a difference of 35.7%.
| Sex | Number | Average Earnings |
| Male | 1,984 (57.9%) | $41,647 |
| Female | 1,444 (42.1%) | $26,771 |
| Total | 3,428 (100.0%) | $36,405 |
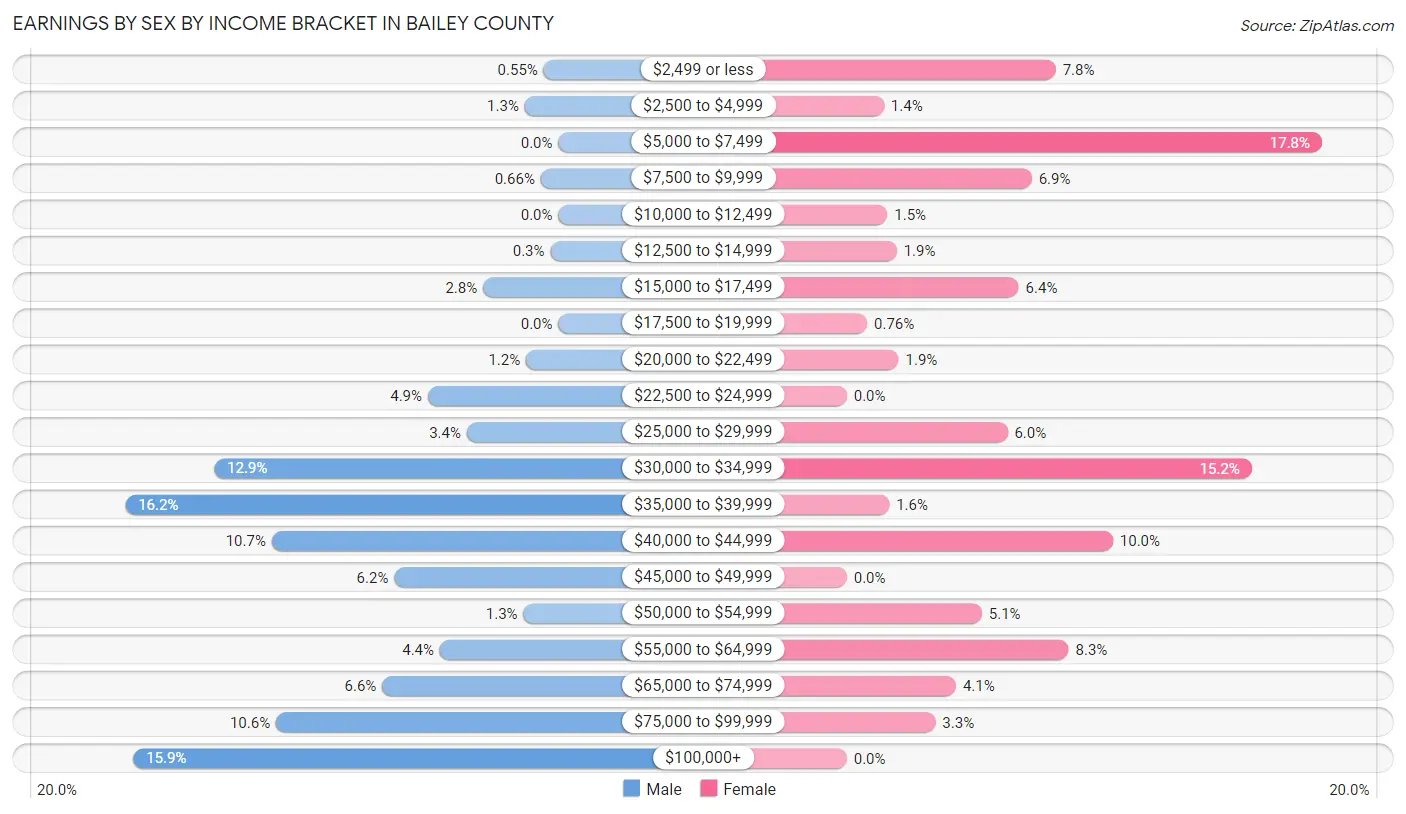
Earnings by Sex by Income Bracket in Bailey County
The most common earnings brackets in Bailey County are $35,000 to $39,999 for men (322 | 16.2%) and $5,000 to $7,499 for women (257 | 17.8%).
| Income | Male | Female |
| $2,499 or less | 11 (0.5%) | 113 (7.8%) |
| $2,500 to $4,999 | 25 (1.3%) | 20 (1.4%) |
| $5,000 to $7,499 | 0 (0.0%) | 257 (17.8%) |
| $7,500 to $9,999 | 13 (0.7%) | 100 (6.9%) |
| $10,000 to $12,499 | 0 (0.0%) | 22 (1.5%) |
| $12,500 to $14,999 | 6 (0.3%) | 27 (1.9%) |
| $15,000 to $17,499 | 56 (2.8%) | 93 (6.4%) |
| $17,500 to $19,999 | 0 (0.0%) | 11 (0.8%) |
| $20,000 to $22,499 | 24 (1.2%) | 28 (1.9%) |
| $22,500 to $24,999 | 97 (4.9%) | 0 (0.0%) |
| $25,000 to $29,999 | 68 (3.4%) | 87 (6.0%) |
| $30,000 to $34,999 | 256 (12.9%) | 219 (15.2%) |
| $35,000 to $39,999 | 322 (16.2%) | 23 (1.6%) |
| $40,000 to $44,999 | 213 (10.7%) | 144 (10.0%) |
| $45,000 to $49,999 | 122 (6.1%) | 0 (0.0%) |
| $50,000 to $54,999 | 26 (1.3%) | 73 (5.1%) |
| $55,000 to $64,999 | 88 (4.4%) | 120 (8.3%) |
| $65,000 to $74,999 | 131 (6.6%) | 59 (4.1%) |
| $75,000 to $99,999 | 210 (10.6%) | 48 (3.3%) |
| $100,000+ | 316 (15.9%) | 0 (0.0%) |
| Total | 1,984 (100.0%) | 1,444 (100.0%) |
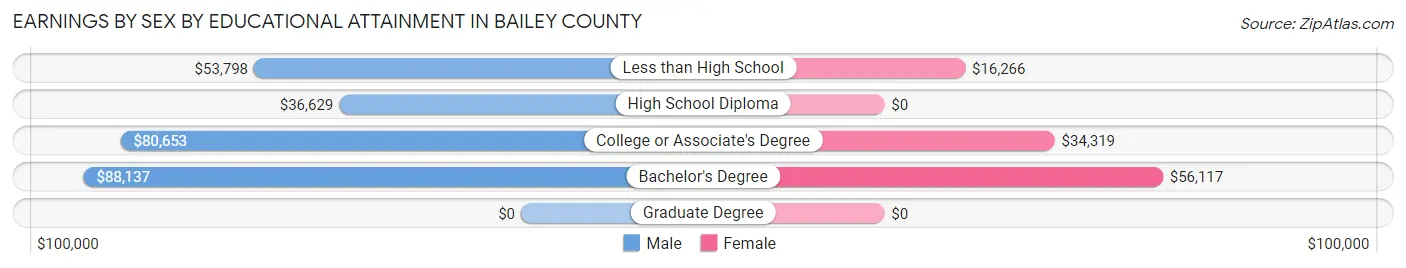
Earnings by Sex by Educational Attainment in Bailey County
Average earnings in Bailey County are $49,519 for men and $32,894 for women, a difference of 33.6%. Men with an educational attainment of bachelor's degree enjoy the highest average annual earnings of $88,137, while those with high school diploma education earn the least with $36,629. Women with an educational attainment of bachelor's degree earn the most with the average annual earnings of $56,117, while those with less than high school education have the smallest earnings of $16,266.
| Educational Attainment | Male Income | Female Income |
| Less than High School | $53,798 | $16,266 |
| High School Diploma | $36,629 | $0 |
| College or Associate's Degree | $80,653 | $34,319 |
| Bachelor's Degree | $88,137 | $56,117 |
| Graduate Degree | - | - |
| Total | $49,519 | $32,894 |
Family Income in Bailey County
Family Income Brackets in Bailey County
According to the Bailey County family income data, there are 332 families falling into the $75,000 to $99,999 income range, which is the most common income bracket and makes up 24.8% of all families. Conversely, the less than $10,000 income bracket is the least frequent group with only 29 families (2.2%) belonging to this category.
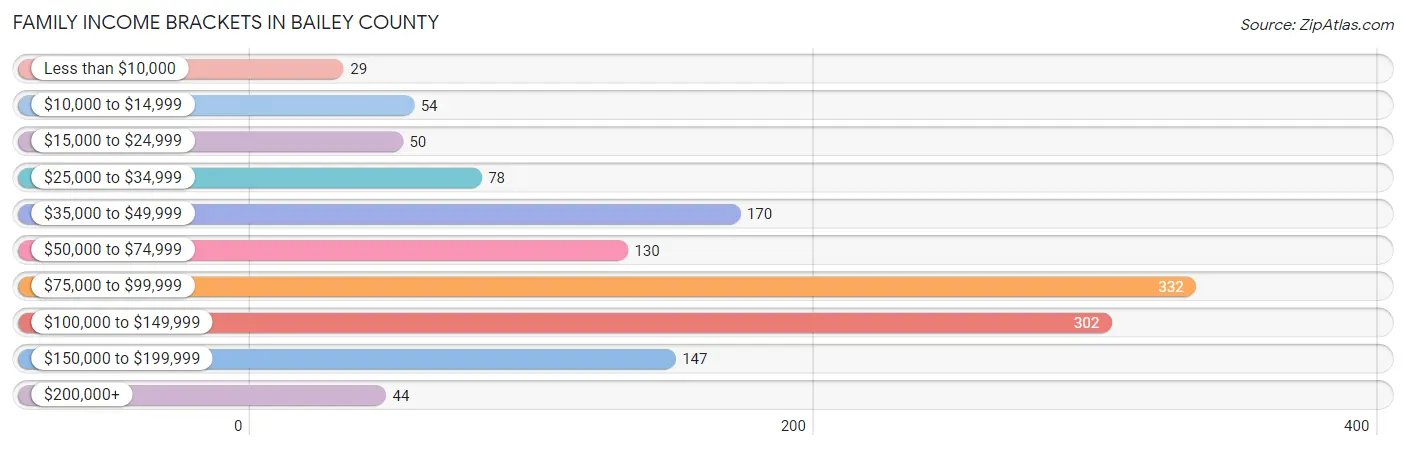
| Income Bracket | # Families | % Families |
| Less than $10,000 | 29 | 2.2% |
| $10,000 to $14,999 | 54 | 4.0% |
| $15,000 to $24,999 | 50 | 3.7% |
| $25,000 to $34,999 | 78 | 5.8% |
| $35,000 to $49,999 | 170 | 12.7% |
| $50,000 to $74,999 | 130 | 9.7% |
| $75,000 to $99,999 | 332 | 24.8% |
| $100,000 to $149,999 | 302 | 22.6% |
| $150,000 to $199,999 | 147 | 11.0% |
| $200,000+ | 44 | 3.3% |
Family Income by Famaliy Size in Bailey County
4-person families (301 | 22.5%) account for the highest median family income in Bailey County with $107,545 per family, while 2-person families (774 | 57.9%) have the highest median income of $40,250 per family member.
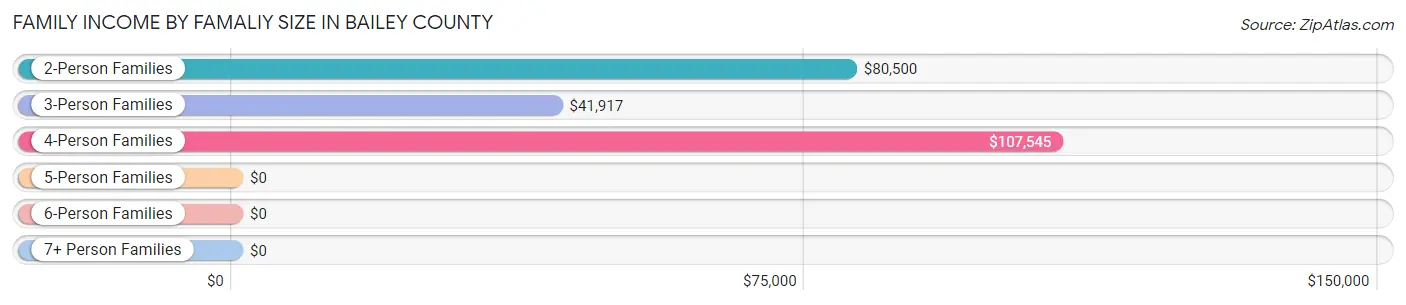
| Income Bracket | # Families | Median Income |
| 2-Person Families | 774 (57.9%) | $80,500 |
| 3-Person Families | 106 (7.9%) | $41,917 |
| 4-Person Families | 301 (22.5%) | $107,545 |
| 5-Person Families | 72 (5.4%) | $0 |
| 6-Person Families | 8 (0.6%) | $0 |
| 7+ Person Families | 77 (5.8%) | $0 |
| Total | 1,338 (100.0%) | $81,536 |
Family Income by Number of Earners in Bailey County
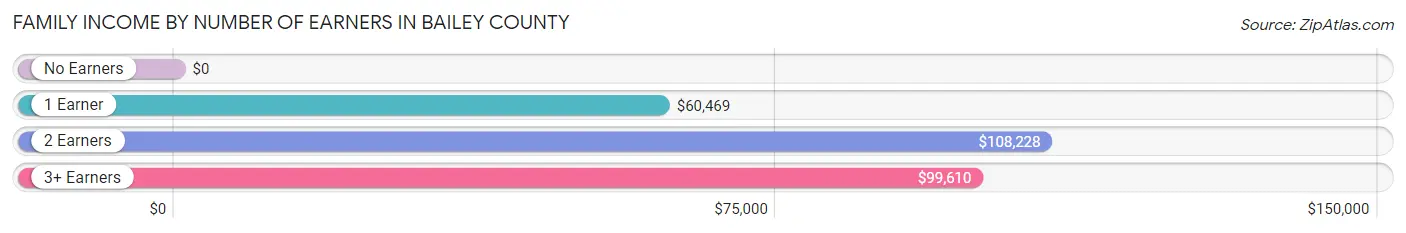
| Number of Earners | # Families | Median Income |
| No Earners | 191 (14.3%) | $0 |
| 1 Earner | 538 (40.2%) | $60,469 |
| 2 Earners | 453 (33.9%) | $108,228 |
| 3+ Earners | 156 (11.7%) | $99,610 |
| Total | 1,338 (100.0%) | $81,536 |
Household Income in Bailey County
Household Income Brackets in Bailey County
With 385 households falling in the category, the $100,000 to $149,999 income range is the most frequent in Bailey County, accounting for 19.9% of all households. In contrast, only 56 households (2.9%) fall into the $200,000+ income bracket, making it the least populous group.
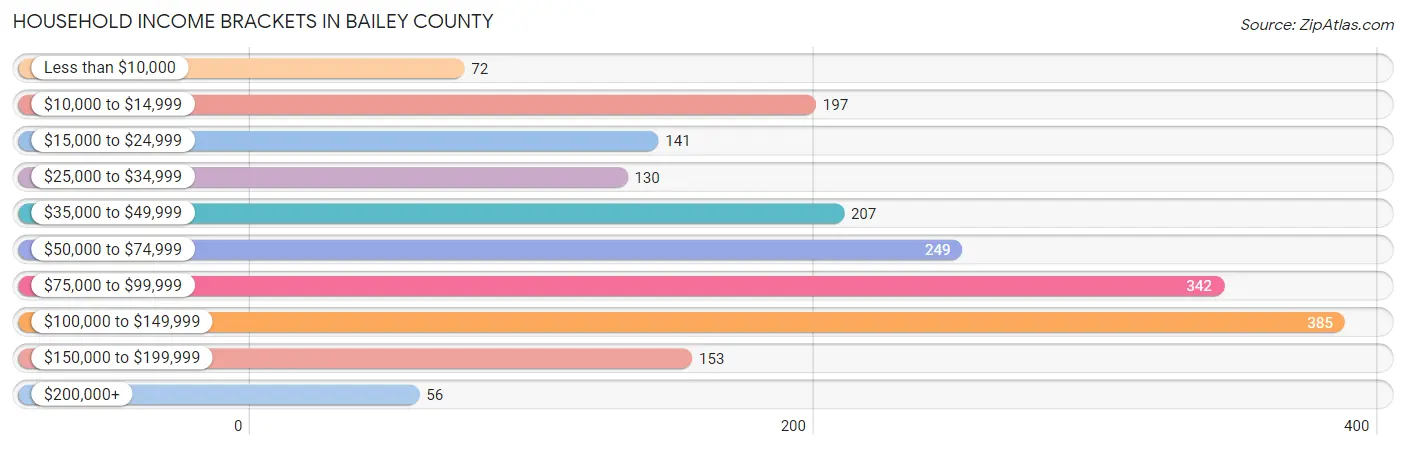
| Income Bracket | # Households | % Households |
| Less than $10,000 | 72 | 3.7% |
| $10,000 to $14,999 | 197 | 10.2% |
| $15,000 to $24,999 | 141 | 7.3% |
| $25,000 to $34,999 | 130 | 6.7% |
| $35,000 to $49,999 | 207 | 10.7% |
| $50,000 to $74,999 | 249 | 12.9% |
| $75,000 to $99,999 | 342 | 17.7% |
| $100,000 to $149,999 | 385 | 19.9% |
| $150,000 to $199,999 | 153 | 7.9% |
| $200,000+ | 56 | 2.9% |
Household Income by Householder Age in Bailey County
The median household income in Bailey County is $69,830, with the highest median household income of $99,803 found in the 25 to 44 years age bracket for the primary householder. A total of 593 households (30.7%) fall into this category. Meanwhile, the 15 to 24 years age bracket for the primary householder has the lowest median household income of $0, with 45 households (2.3%) in this group.
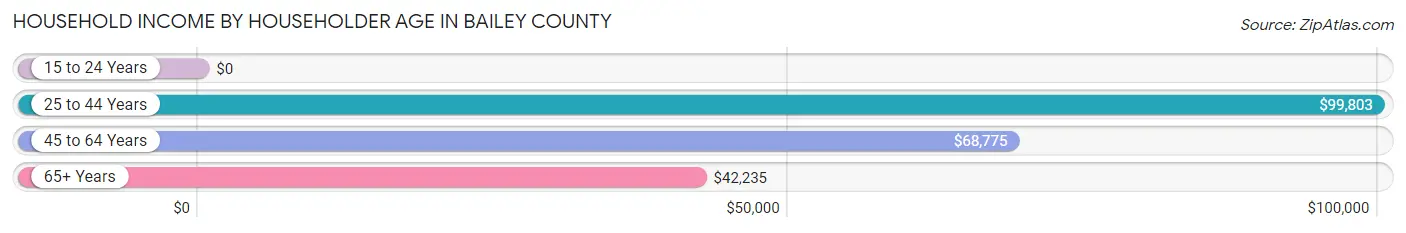
| Income Bracket | # Households | Median Income |
| 15 to 24 Years | 45 (2.3%) | $0 |
| 25 to 44 Years | 593 (30.7%) | $99,803 |
| 45 to 64 Years | 748 (38.7%) | $68,775 |
| 65+ Years | 547 (28.3%) | $42,235 |
| Total | 1,933 (100.0%) | $69,830 |
Poverty in Bailey County
Income Below Poverty by Sex and Age in Bailey County
With 13.5% poverty level for males and 12.1% for females among the residents of Bailey County, 6 to 11 year old males and 75 year old and over females are the most vulnerable to poverty, with 73 males (67.0%) and 80 females (37.7%) in their respective age groups living below the poverty level.
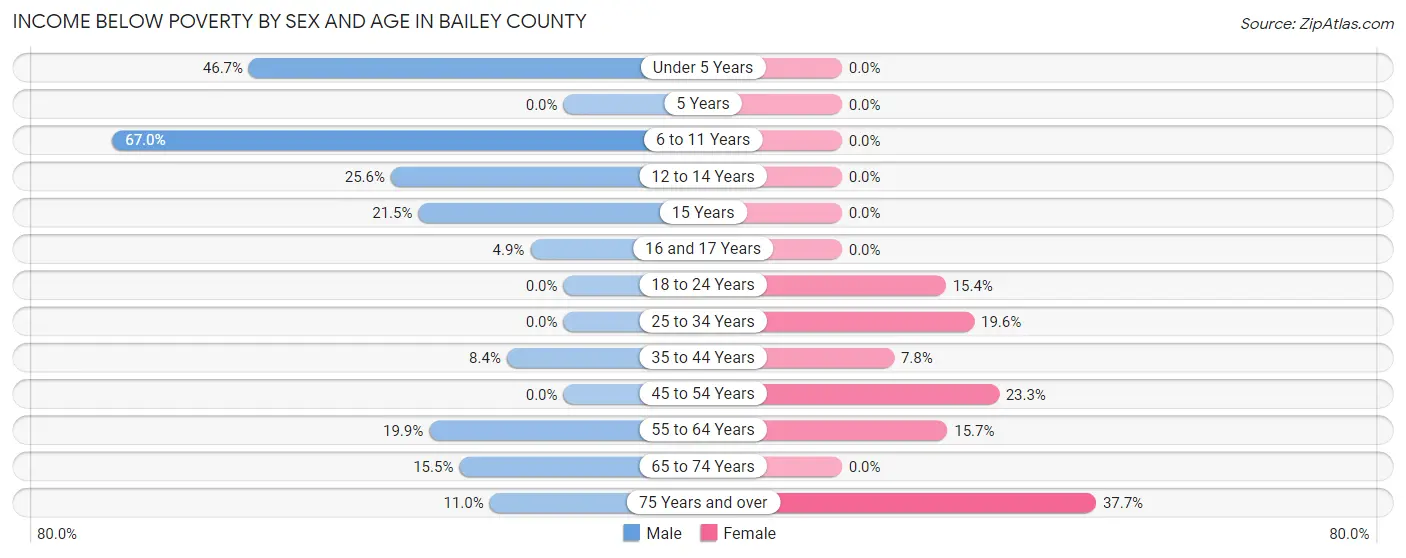
| Age Bracket | Male | Female |
| Under 5 Years | 99 (46.7%) | 0 (0.0%) |
| 5 Years | 0 (0.0%) | 0 (0.0%) |
| 6 to 11 Years | 73 (67.0%) | 0 (0.0%) |
| 12 to 14 Years | 72 (25.6%) | 0 (0.0%) |
| 15 Years | 28 (21.5%) | 0 (0.0%) |
| 16 and 17 Years | 3 (4.9%) | 0 (0.0%) |
| 18 to 24 Years | 0 (0.0%) | 52 (15.4%) |
| 25 to 34 Years | 0 (0.0%) | 119 (19.6%) |
| 35 to 44 Years | 29 (8.4%) | 31 (7.7%) |
| 45 to 54 Years | 0 (0.0%) | 65 (23.3%) |
| 55 to 64 Years | 67 (19.9%) | 79 (15.7%) |
| 65 to 74 Years | 30 (15.5%) | 0 (0.0%) |
| 75 Years and over | 24 (11.0%) | 80 (37.7%) |
| Total | 425 (13.5%) | 426 (12.1%) |
Income Above Poverty by Sex and Age in Bailey County
According to the poverty statistics in Bailey County, males aged 5 years and females aged under 5 years are the age groups that are most secure financially, with 100.0% of males and 100.0% of females in these age groups living above the poverty line.
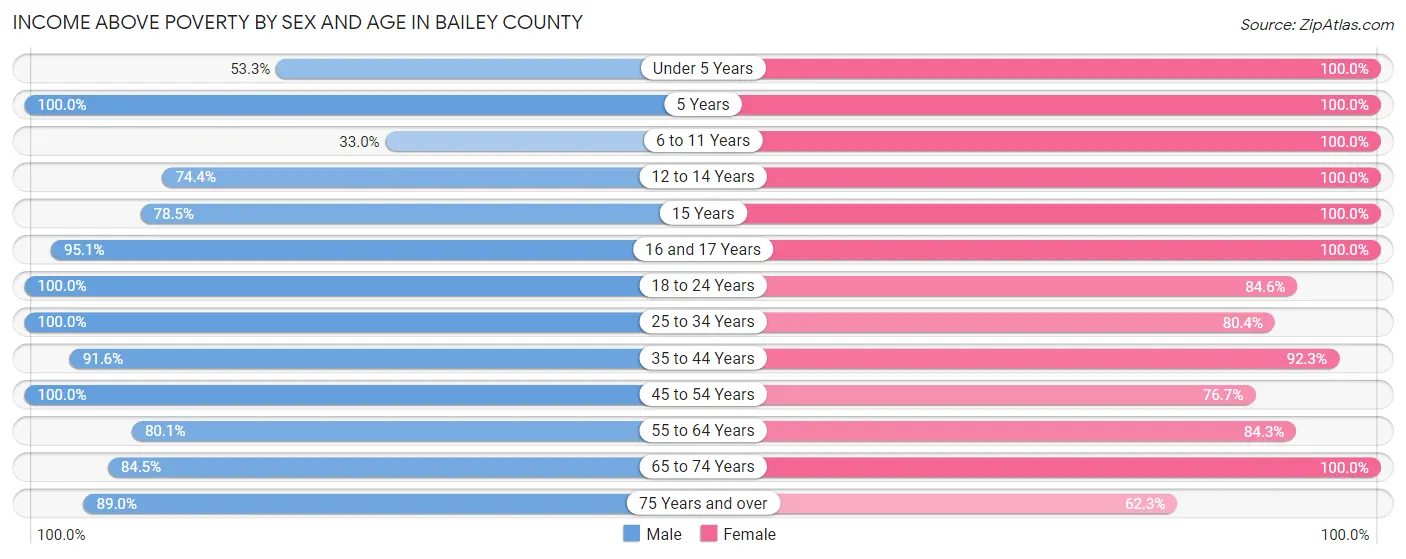
| Age Bracket | Male | Female |
| Under 5 Years | 113 (53.3%) | 348 (100.0%) |
| 5 Years | 38 (100.0%) | 11 (100.0%) |
| 6 to 11 Years | 36 (33.0%) | 390 (100.0%) |
| 12 to 14 Years | 209 (74.4%) | 59 (100.0%) |
| 15 Years | 102 (78.5%) | 14 (100.0%) |
| 16 and 17 Years | 58 (95.1%) | 167 (100.0%) |
| 18 to 24 Years | 349 (100.0%) | 285 (84.6%) |
| 25 to 34 Years | 677 (100.0%) | 487 (80.4%) |
| 35 to 44 Years | 316 (91.6%) | 369 (92.2%) |
| 45 to 54 Years | 210 (100.0%) | 214 (76.7%) |
| 55 to 64 Years | 269 (80.1%) | 425 (84.3%) |
| 65 to 74 Years | 164 (84.5%) | 192 (100.0%) |
| 75 Years and over | 195 (89.0%) | 132 (62.3%) |
| Total | 2,736 (86.6%) | 3,093 (87.9%) |
Income Below Poverty Among Married-Couple Families in Bailey County
The poverty statistics for married-couple families in Bailey County show that 3.6% or 31 of the total 857 families live below the poverty line. Families with no children have the highest poverty rate of 6.0%, comprising of 31 families. On the other hand, families with 1 or 2 children have the lowest poverty rate of 0.0%, which includes 0 families.
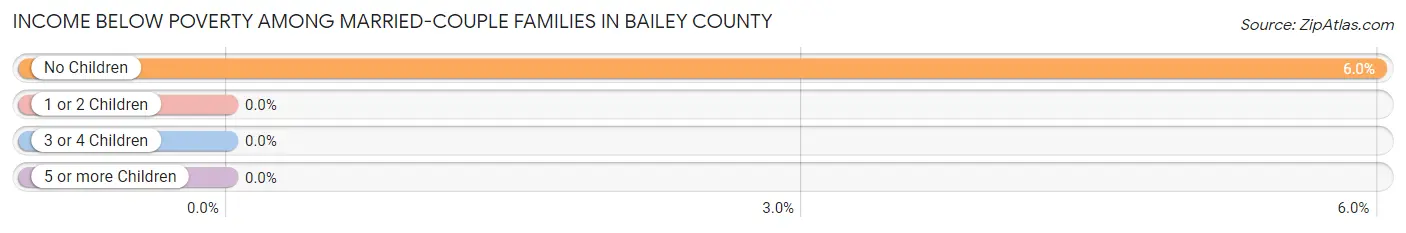
| Children | Above Poverty | Below Poverty |
| No Children | 486 (94.0%) | 31 (6.0%) |
| 1 or 2 Children | 268 (100.0%) | 0 (0.0%) |
| 3 or 4 Children | 72 (100.0%) | 0 (0.0%) |
| 5 or more Children | 0 (0.0%) | 0 (0.0%) |
| Total | 826 (96.4%) | 31 (3.6%) |
Income Below Poverty Among Single-Parent Households in Bailey County
According to the poverty data in Bailey County, 1.8% or 3 single-father households and 15.9% or 50 single-mother households are living below the poverty line. Among single-father households, those with 1 or 2 children have the highest poverty rate, with 3 households (2.4%) experiencing poverty. Likewise, among single-mother households, those with 3 or 4 children have the highest poverty rate, with 23 households (21.7%) falling below the poverty line.
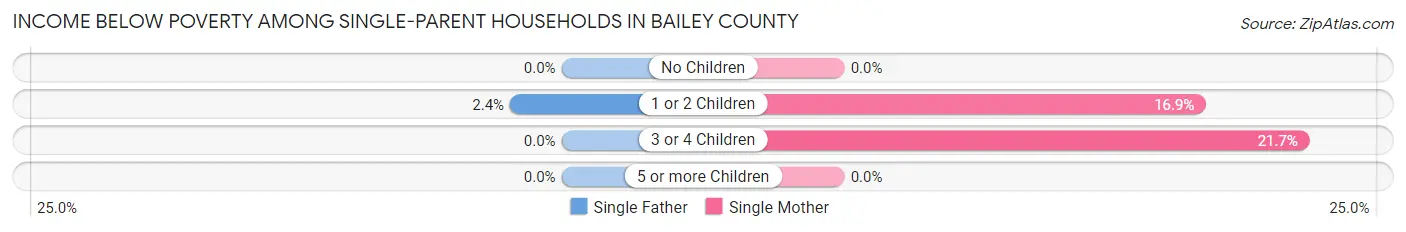
| Children | Single Father | Single Mother |
| No Children | 0 (0.0%) | 0 (0.0%) |
| 1 or 2 Children | 3 (2.4%) | 27 (16.9%) |
| 3 or 4 Children | 0 (0.0%) | 23 (21.7%) |
| 5 or more Children | 0 (0.0%) | 0 (0.0%) |
| Total | 3 (1.8%) | 50 (15.9%) |
Income Below Poverty Among Married-Couple vs Single-Parent Households in Bailey County
The poverty data for Bailey County shows that 31 of the married-couple family households (3.6%) and 53 of the single-parent households (11.0%) are living below the poverty level. Within the married-couple family households, those with no children have the highest poverty rate, with 31 households (6.0%) falling below the poverty line. Among the single-parent households, those with 3 or 4 children have the highest poverty rate, with 23 household (21.7%) living below poverty.
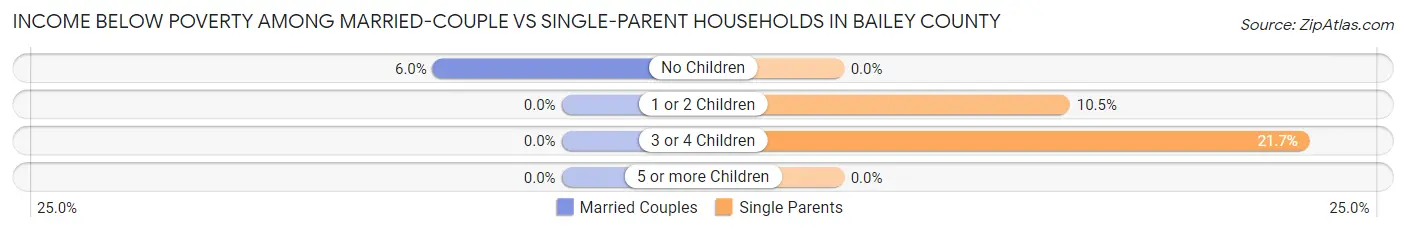
| Children | Married-Couple Families | Single-Parent Households |
| No Children | 31 (6.0%) | 0 (0.0%) |
| 1 or 2 Children | 0 (0.0%) | 30 (10.5%) |
| 3 or 4 Children | 0 (0.0%) | 23 (21.7%) |
| 5 or more Children | 0 (0.0%) | 0 (0.0%) |
| Total | 31 (3.6%) | 53 (11.0%) |
Race in Bailey County
The most populous races in Bailey County are White / Caucasian (5,499 | 79.7%), Hispanic or Latino (4,688 | 67.9%), and Some other Race (898 | 13.0%).
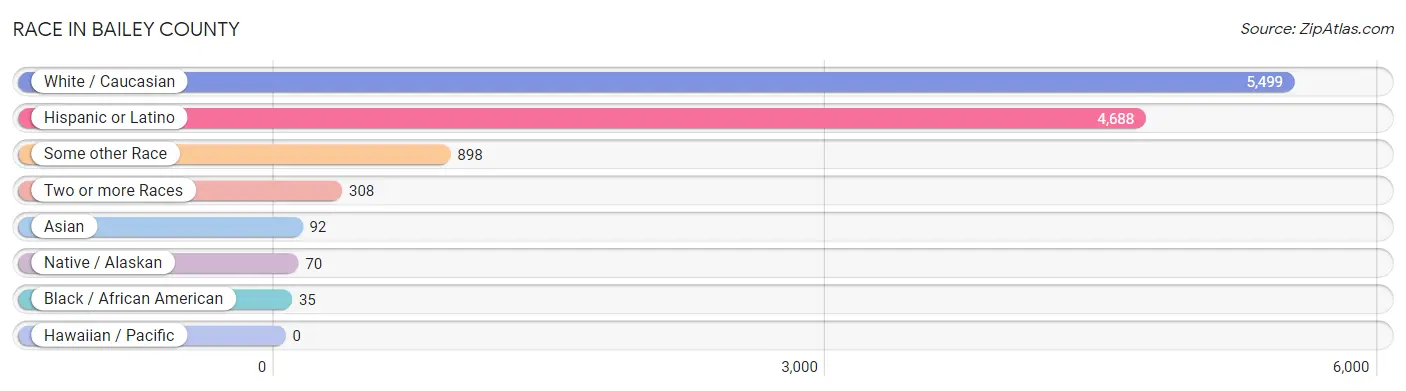
| Race | # Population | % Population |
| Asian | 92 | 1.3% |
| Black / African American | 35 | 0.5% |
| Hawaiian / Pacific | 0 | 0.0% |
| Hispanic or Latino | 4,688 | 67.9% |
| Native / Alaskan | 70 | 1.0% |
| White / Caucasian | 5,499 | 79.7% |
| Two or more Races | 308 | 4.5% |
| Some other Race | 898 | 13.0% |
| Total | 6,902 | 100.0% |
Ancestry in Bailey County
The most populous ancestries reported in Bailey County are Mexican (4,402 | 63.8%), Central American (267 | 3.9%), Guatemalan (267 | 3.9%), English (238 | 3.5%), and American (228 | 3.3%), together accounting for 78.3% of all Bailey County residents.
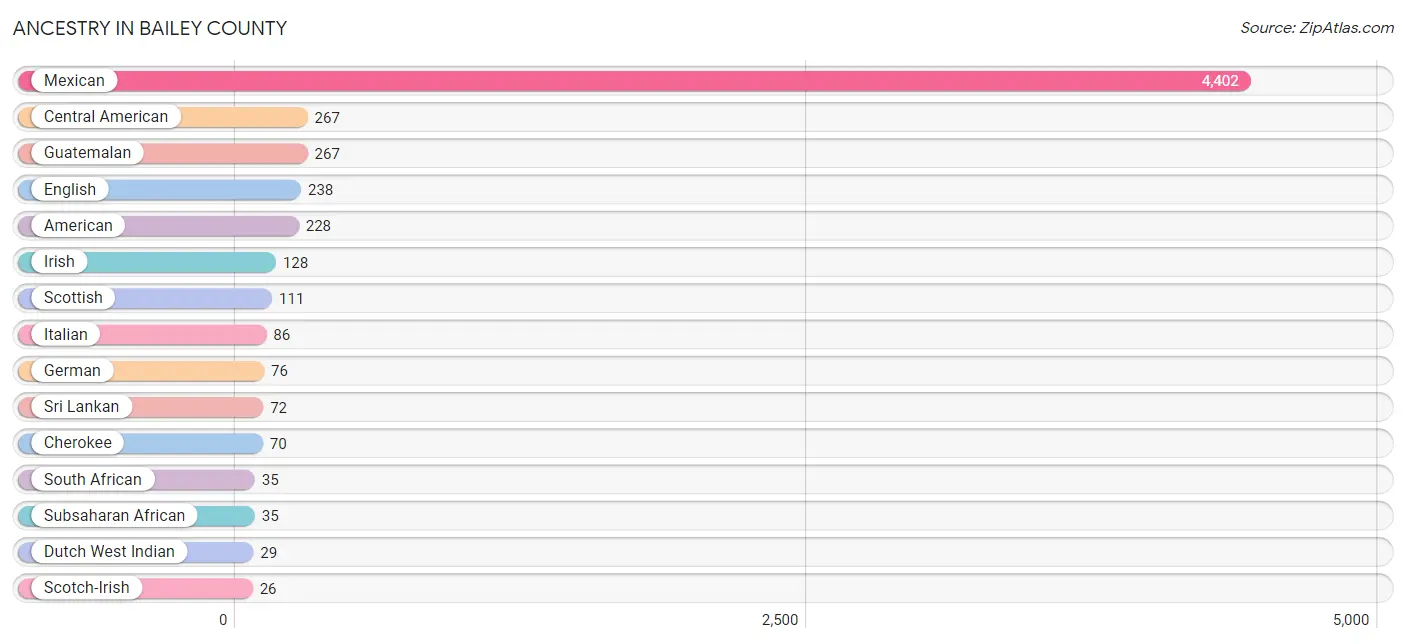
| Ancestry | # Population | % Population |
| American | 228 | 3.3% |
| Canadian | 24 | 0.4% |
| Central American | 267 | 3.9% |
| Cherokee | 70 | 1.0% |
| Cuban | 13 | 0.2% |
| Czech | 2 | 0.0% |
| Dutch West Indian | 29 | 0.4% |
| Eastern European | 8 | 0.1% |
| English | 238 | 3.5% |
| European | 8 | 0.1% |
| French | 8 | 0.1% |
| German | 76 | 1.1% |
| Guatemalan | 267 | 3.9% |
| Irish | 128 | 1.8% |
| Italian | 86 | 1.3% |
| Mexican | 4,402 | 63.8% |
| Puerto Rican | 6 | 0.1% |
| Scotch-Irish | 26 | 0.4% |
| Scottish | 111 | 1.6% |
| South African | 35 | 0.5% |
| Sri Lankan | 72 | 1.0% |
| Subsaharan African | 35 | 0.5% |
| Swedish | 6 | 0.1% |
| Trinidadian and Tobagonian | 6 | 0.1% |
| Vietnamese | 20 | 0.3% | View All 25 Rows |
Immigrants in Bailey County
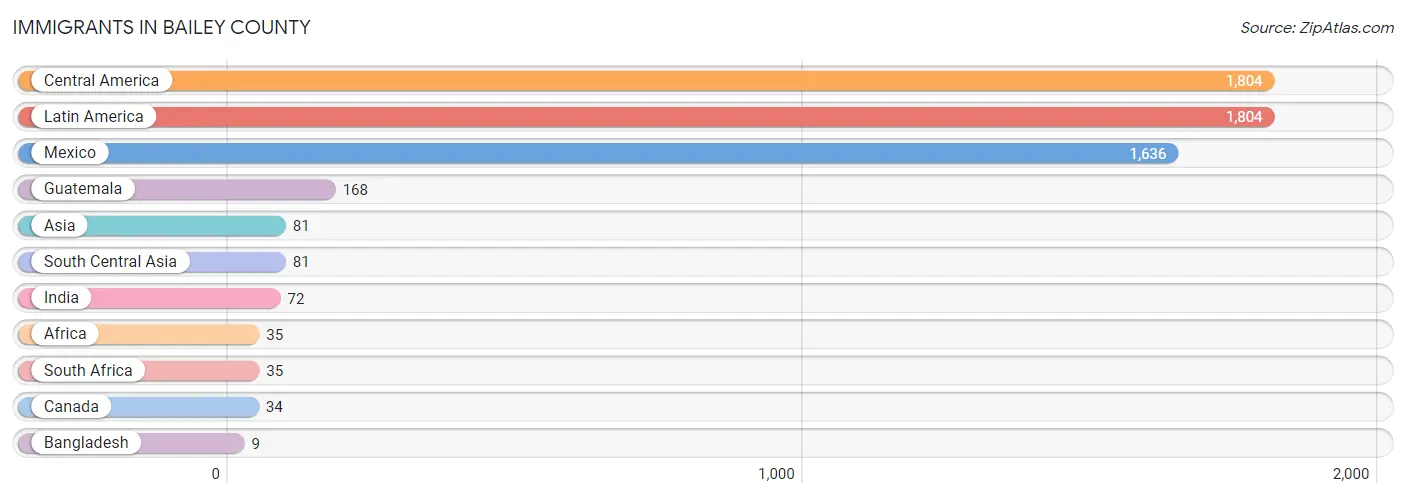
The most numerous immigrant groups reported in Bailey County came from Central America (1,804 | 26.1%), Latin America (1,804 | 26.1%), Mexico (1,636 | 23.7%), Guatemala (168 | 2.4%), and Asia (81 | 1.2%), together accounting for 79.6% of all Bailey County residents.
| Immigration Origin | # Population | % Population |
| Africa | 35 | 0.5% |
| Asia | 81 | 1.2% |
| Bangladesh | 9 | 0.1% |
| Canada | 34 | 0.5% |
| Central America | 1,804 | 26.1% |
| Guatemala | 168 | 2.4% |
| India | 72 | 1.0% |
| Latin America | 1,804 | 26.1% |
| Mexico | 1,636 | 23.7% |
| South Africa | 35 | 0.5% |
| South Central Asia | 81 | 1.2% | View All 11 Rows |
Sex and Age in Bailey County
Sex and Age in Bailey County
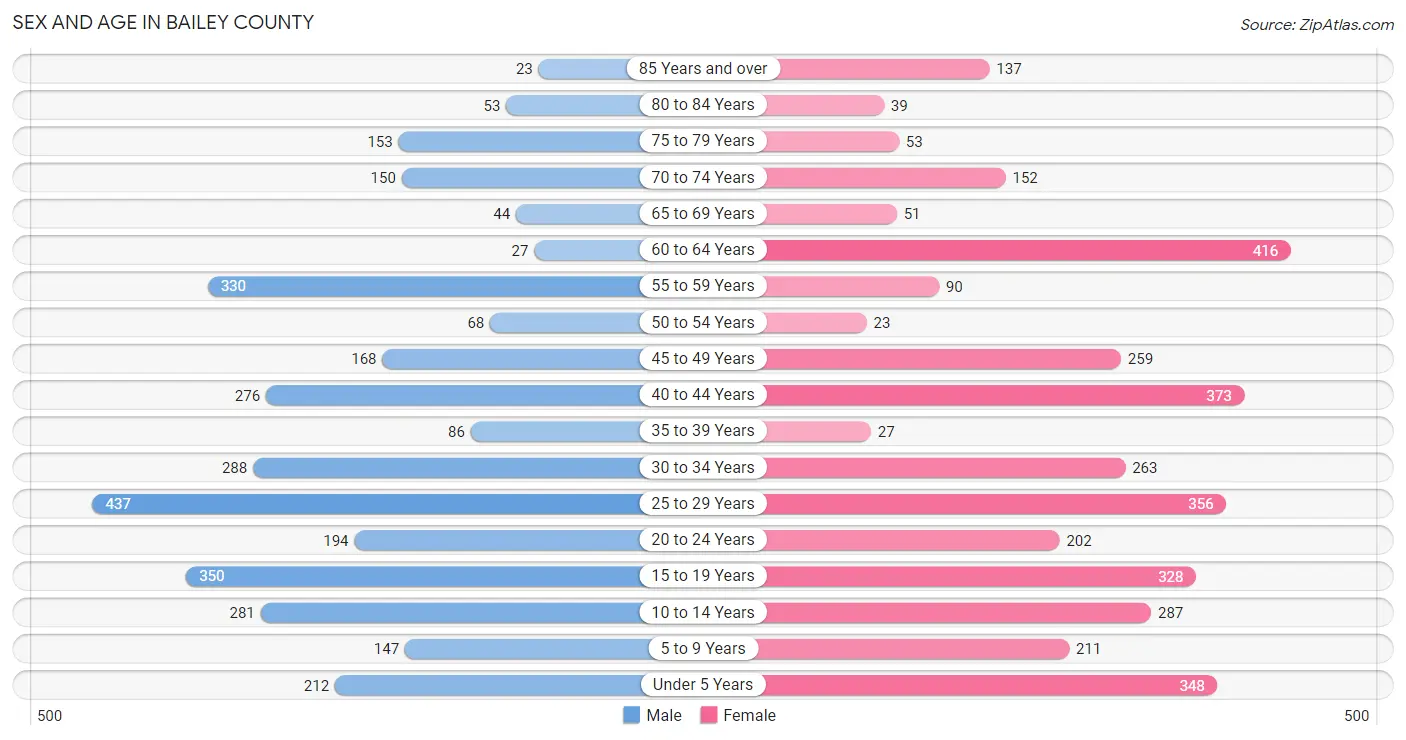
The most populous age groups in Bailey County are 25 to 29 Years (437 | 13.3%) for men and 60 to 64 Years (416 | 11.5%) for women.
| Age Bracket | Male | Female |
| Under 5 Years | 212 (6.5%) | 348 (9.6%) |
| 5 to 9 Years | 147 (4.5%) | 211 (5.8%) |
| 10 to 14 Years | 281 (8.6%) | 287 (7.9%) |
| 15 to 19 Years | 350 (10.6%) | 328 (9.1%) |
| 20 to 24 Years | 194 (5.9%) | 202 (5.6%) |
| 25 to 29 Years | 437 (13.3%) | 356 (9.9%) |
| 30 to 34 Years | 288 (8.8%) | 263 (7.3%) |
| 35 to 39 Years | 86 (2.6%) | 27 (0.7%) |
| 40 to 44 Years | 276 (8.4%) | 373 (10.3%) |
| 45 to 49 Years | 168 (5.1%) | 259 (7.2%) |
| 50 to 54 Years | 68 (2.1%) | 23 (0.6%) |
| 55 to 59 Years | 330 (10.0%) | 90 (2.5%) |
| 60 to 64 Years | 27 (0.8%) | 416 (11.5%) |
| 65 to 69 Years | 44 (1.3%) | 51 (1.4%) |
| 70 to 74 Years | 150 (4.6%) | 152 (4.2%) |
| 75 to 79 Years | 153 (4.6%) | 53 (1.5%) |
| 80 to 84 Years | 53 (1.6%) | 39 (1.1%) |
| 85 Years and over | 23 (0.7%) | 137 (3.8%) |
| Total | 3,287 (100.0%) | 3,615 (100.0%) |
Families and Households in Bailey County
Median Family Size in Bailey County
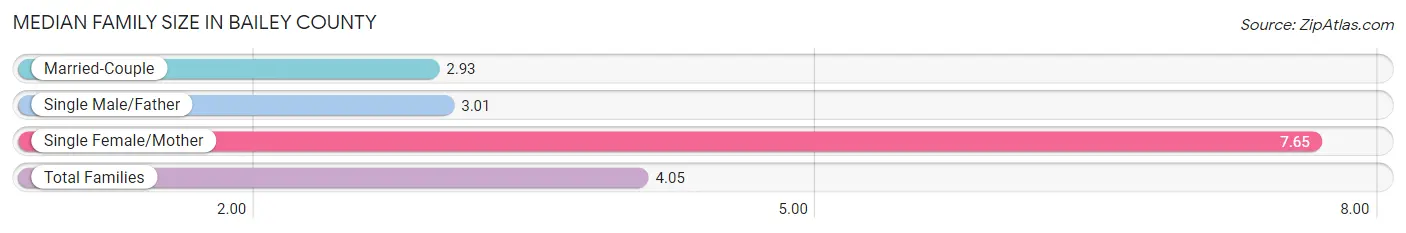
The median family size in Bailey County is 4.05 persons per family, with single female/mother families (315 | 23.5%) accounting for the largest median family size of 7.65 persons per family. On the other hand, married-couple families (857 | 64.0%) represent the smallest median family size with 2.93 persons per family.
| Family Type | # Families | Family Size |
| Married-Couple | 857 (64.0%) | 2.93 |
| Single Male/Father | 166 (12.4%) | 3.01 |
| Single Female/Mother | 315 (23.5%) | 7.65 |
| Total Families | 1,338 (100.0%) | 4.05 |
Median Household Size in Bailey County
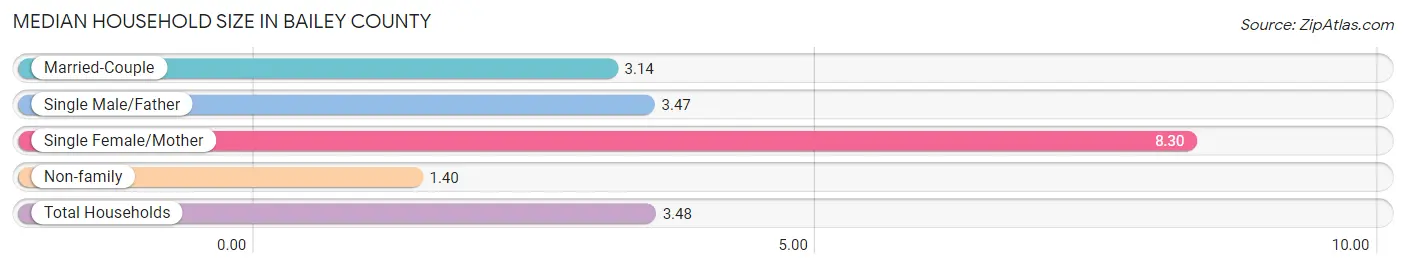
The median household size in Bailey County is 3.48 persons per household, with single female/mother households (315 | 16.3%) accounting for the largest median household size of 8.3 persons per household. non-family households (595 | 30.8%) represent the smallest median household size with 1.40 persons per household.
| Household Type | # Households | Household Size |
| Married-Couple | 857 (44.3%) | 3.14 |
| Single Male/Father | 166 (8.6%) | 3.47 |
| Single Female/Mother | 315 (16.3%) | 8.30 |
| Non-family | 595 (30.8%) | 1.40 |
| Total Households | 1,933 (100.0%) | 3.48 |
Household Size by Marriage Status in Bailey County
Out of a total of 1,933 households in Bailey County, 1,338 (69.2%) are family households, while 595 (30.8%) are nonfamily households. The most numerous type of family households are 2-person households, comprising 621, and the most common type of nonfamily households are 1-person households, comprising 476.
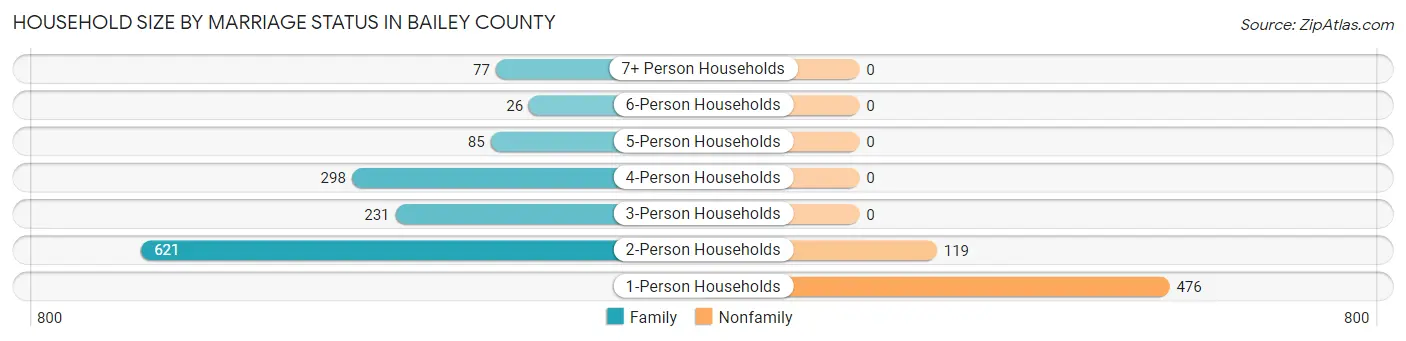
| Household Size | Family Households | Nonfamily Households |
| 1-Person Households | - | 476 (24.6%) |
| 2-Person Households | 621 (32.1%) | 119 (6.2%) |
| 3-Person Households | 231 (11.9%) | 0 (0.0%) |
| 4-Person Households | 298 (15.4%) | 0 (0.0%) |
| 5-Person Households | 85 (4.4%) | 0 (0.0%) |
| 6-Person Households | 26 (1.3%) | 0 (0.0%) |
| 7+ Person Households | 77 (4.0%) | 0 (0.0%) |
| Total | 1,338 (69.2%) | 595 (30.8%) |
Female Fertility in Bailey County
Fertility by Age in Bailey County
Average fertility rate in Bailey County is 45.0 births per 1,000 women. Women in the age bracket of 20 to 34 years have the highest fertility rate with 101.0 births per 1,000 women. Women in the age bracket of 20 to 34 years acount for 100.0% of all women with births.
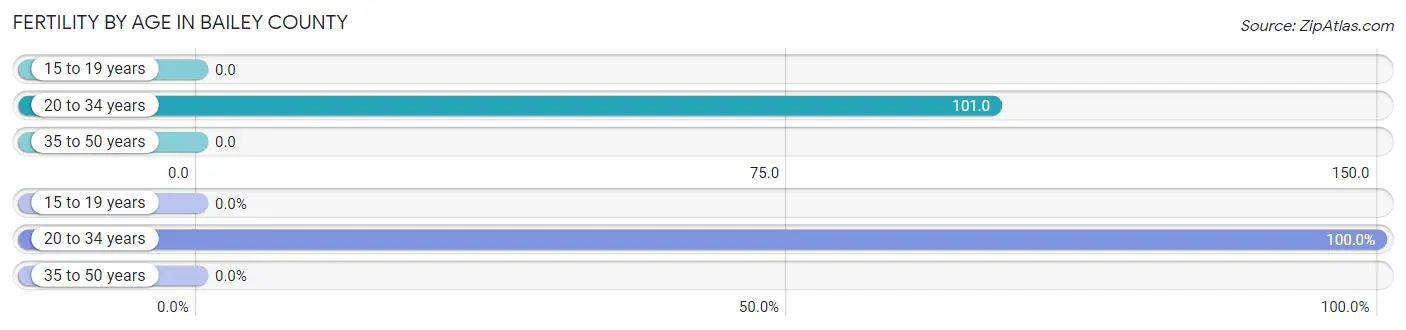
| Age Bracket | Women with Births | Births / 1,000 Women |
| 15 to 19 years | 0 (0.0%) | 0.0 |
| 20 to 34 years | 83 (100.0%) | 101.0 |
| 35 to 50 years | 0 (0.0%) | 0.0 |
| Total | 83 (100.0%) | 45.0 |
Fertility by Age by Marriage Status in Bailey County
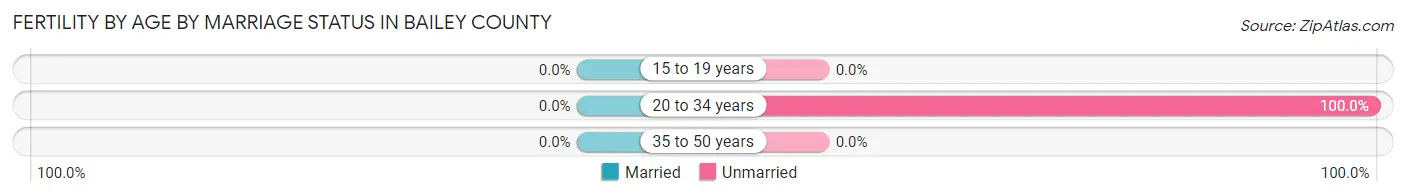
| Age Bracket | Married | Unmarried |
| 15 to 19 years | 0 (0.0%) | 0 (0.0%) |
| 20 to 34 years | 0 (0.0%) | 83 (100.0%) |
| 35 to 50 years | 0 (0.0%) | 0 (0.0%) |
| Total | 0 (0.0%) | 83 (100.0%) |
Fertility by Education in Bailey County
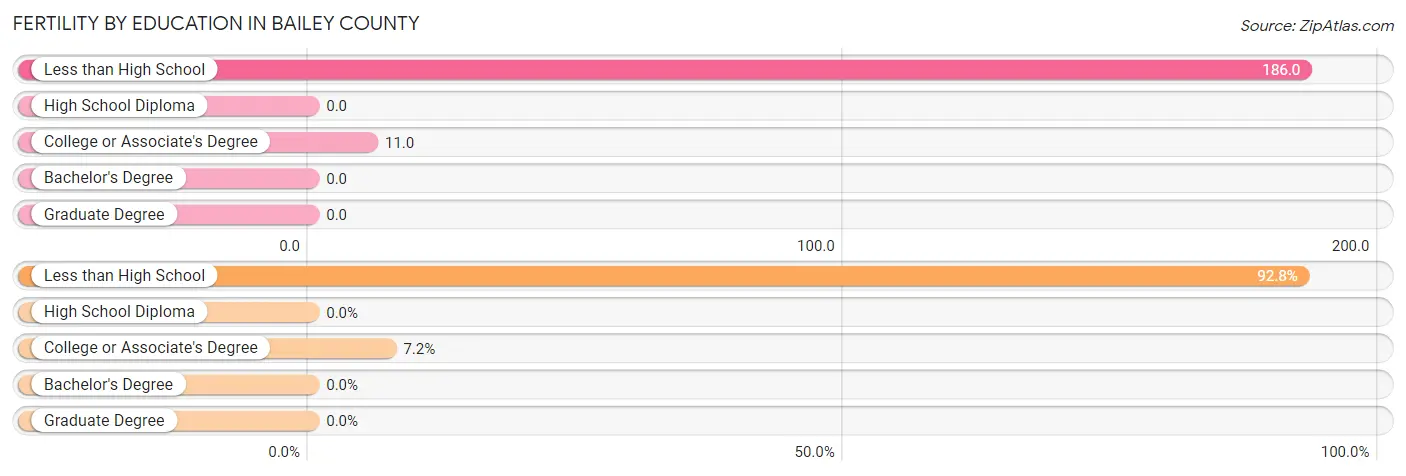
| Educational Attainment | Women with Births | Births / 1,000 Women |
| Less than High School | 77 (92.8%) | 186.0 |
| High School Diploma | 0 (0.0%) | 0.0 |
| College or Associate's Degree | 6 (7.2%) | 11.0 |
| Bachelor's Degree | 0 (0.0%) | 0.0 |
| Graduate Degree | 0 (0.0%) | 0.0 |
| Total | 83 (100.0%) | 45.0 |
Fertility by Education by Marriage Status in Bailey County
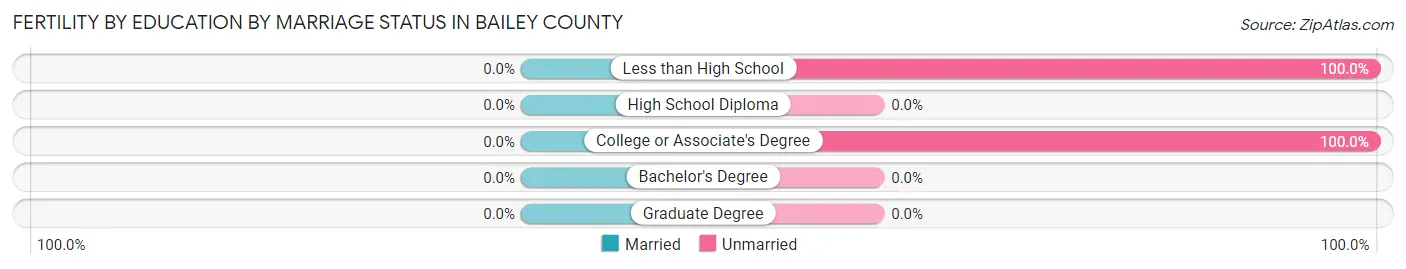
| Educational Attainment | Married | Unmarried |
| Less than High School | 0 (0.0%) | 77 (100.0%) |
| High School Diploma | 0 (0.0%) | 0 (0.0%) |
| College or Associate's Degree | 0 (0.0%) | 6 (100.0%) |
| Bachelor's Degree | 0 (0.0%) | 0 (0.0%) |
| Graduate Degree | 0 (0.0%) | 0 (0.0%) |
| Total | 0 (0.0%) | 83 (100.0%) |
Employment Characteristics in Bailey County
Employment by Class of Employer in Bailey County
Among the 2,813 employed individuals in Bailey County, private company employees (2,174 | 77.3%), self-employed (not incorporated) (197 | 7.0%), and local government employees (197 | 7.0%) make up the most common classes of employment.
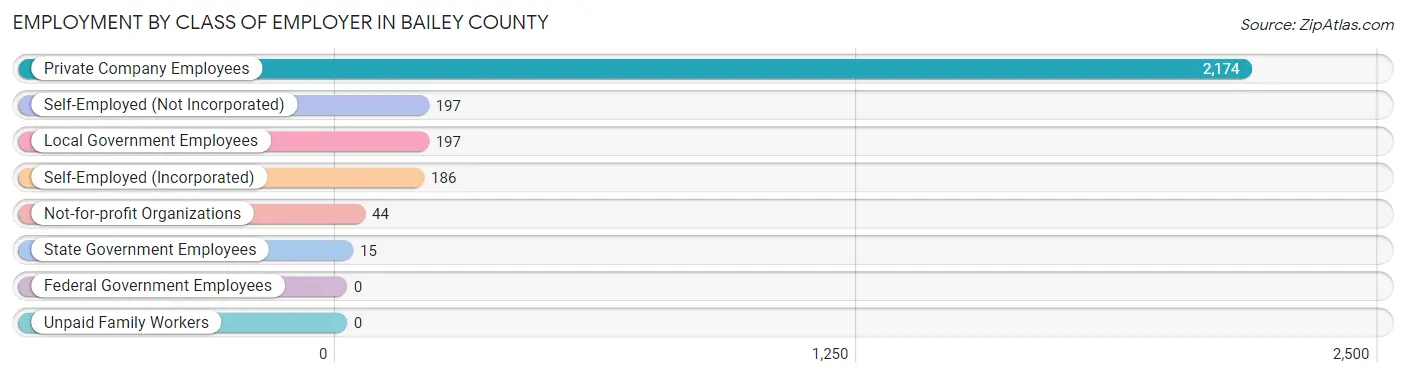
| Employer Class | # Employees | % Employees |
| Private Company Employees | 2,174 | 77.3% |
| Self-Employed (Incorporated) | 186 | 6.6% |
| Self-Employed (Not Incorporated) | 197 | 7.0% |
| Not-for-profit Organizations | 44 | 1.6% |
| Local Government Employees | 197 | 7.0% |
| State Government Employees | 15 | 0.5% |
| Federal Government Employees | 0 | 0.0% |
| Unpaid Family Workers | 0 | 0.0% |
| Total | 2,813 | 100.0% |
Employment Status by Age in Bailey County
According to the labor force statistics for Bailey County, out of the total population over 16 years of age (5,272), 57.9% or 3,052 individuals are in the labor force, with 2.1% or 64 of them unemployed. The age group with the highest labor force participation rate is 25 to 29 years, with 92.7% or 735 individuals in the labor force. Within the labor force, the 20 to 24 years age range has the highest percentage of unemployed individuals, with 15.1% or 52 of them being unemployed.
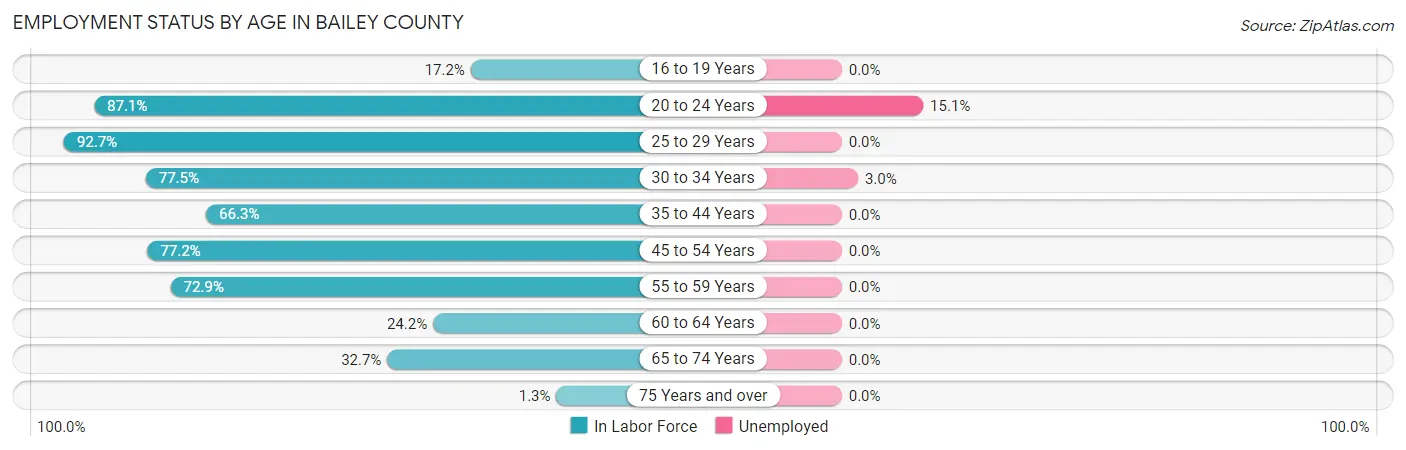
| Age Bracket | In Labor Force | Unemployed |
| 16 to 19 Years | 92 (17.2%) | 0 (0.0%) |
| 20 to 24 Years | 345 (87.1%) | 52 (15.1%) |
| 25 to 29 Years | 735 (92.7%) | 0 (0.0%) |
| 30 to 34 Years | 427 (77.5%) | 13 (3.0%) |
| 35 to 44 Years | 505 (66.3%) | 0 (0.0%) |
| 45 to 54 Years | 400 (77.2%) | 0 (0.0%) |
| 55 to 59 Years | 306 (72.9%) | 0 (0.0%) |
| 60 to 64 Years | 107 (24.2%) | 0 (0.0%) |
| 65 to 74 Years | 130 (32.7%) | 0 (0.0%) |
| 75 Years and over | 6 (1.3%) | 0 (0.0%) |
| Total | 3,052 (57.9%) | 64 (2.1%) |
Employment Status by Educational Attainment in Bailey County
According to labor force statistics for Bailey County, 71.1% of individuals (2,479) out of the total population between 25 and 64 years of age (3,487) are in the labor force, with 0.5% or 12 of them being unemployed. The group with the highest labor force participation rate are those with the educational attainment of college / associate degree, with 81.6% or 748 individuals in the labor force. Within the labor force, individuals with high school diploma education have the highest percentage of unemployment, with 1.5% or 13 of them being unemployed.
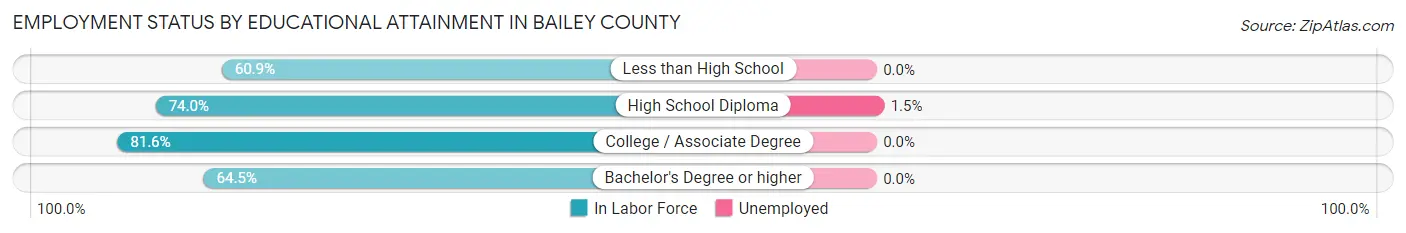
| Educational Attainment | In Labor Force | Unemployed |
| Less than High School | 628 (60.9%) | 0 (0.0%) |
| High School Diploma | 861 (74.0%) | 17 (1.5%) |
| College / Associate Degree | 748 (81.6%) | 0 (0.0%) |
| Bachelor's Degree or higher | 242 (64.5%) | 0 (0.0%) |
| Total | 2,479 (71.1%) | 17 (0.5%) |
Employment Occupations by Sex in Bailey County
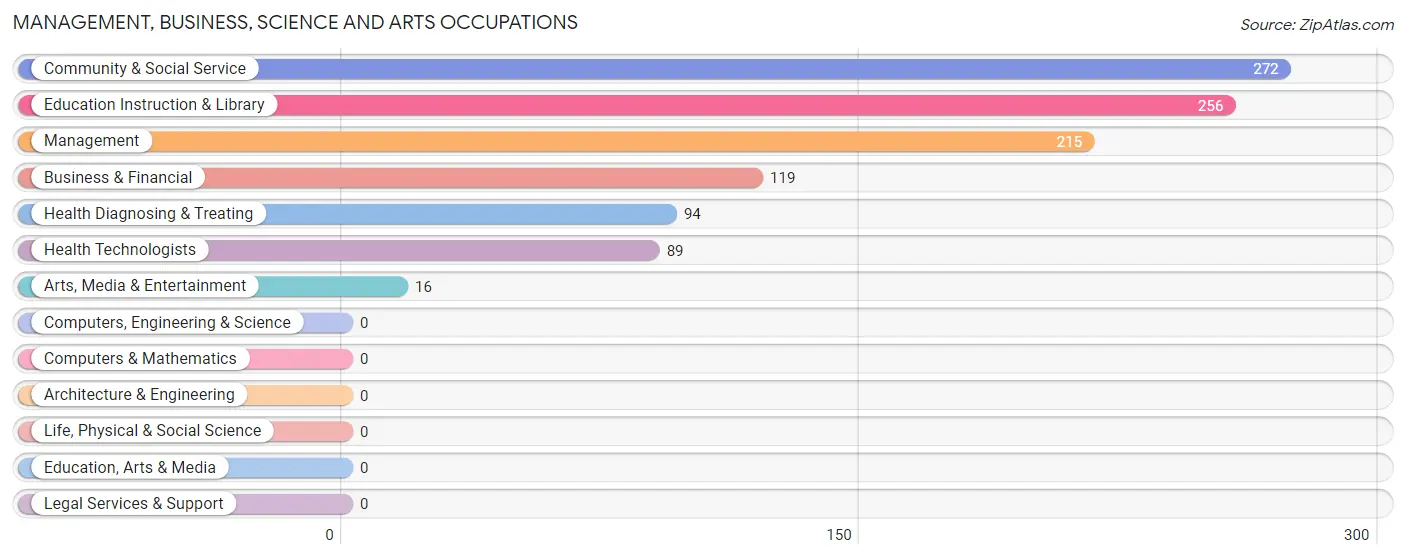
Management, Business, Science and Arts Occupations
The most common Management, Business, Science and Arts occupations in Bailey County are Community & Social Service (272 | 9.1%), Education Instruction & Library (256 | 8.6%), Management (215 | 7.2%), Business & Financial (119 | 4.0%), and Health Diagnosing & Treating (94 | 3.2%).
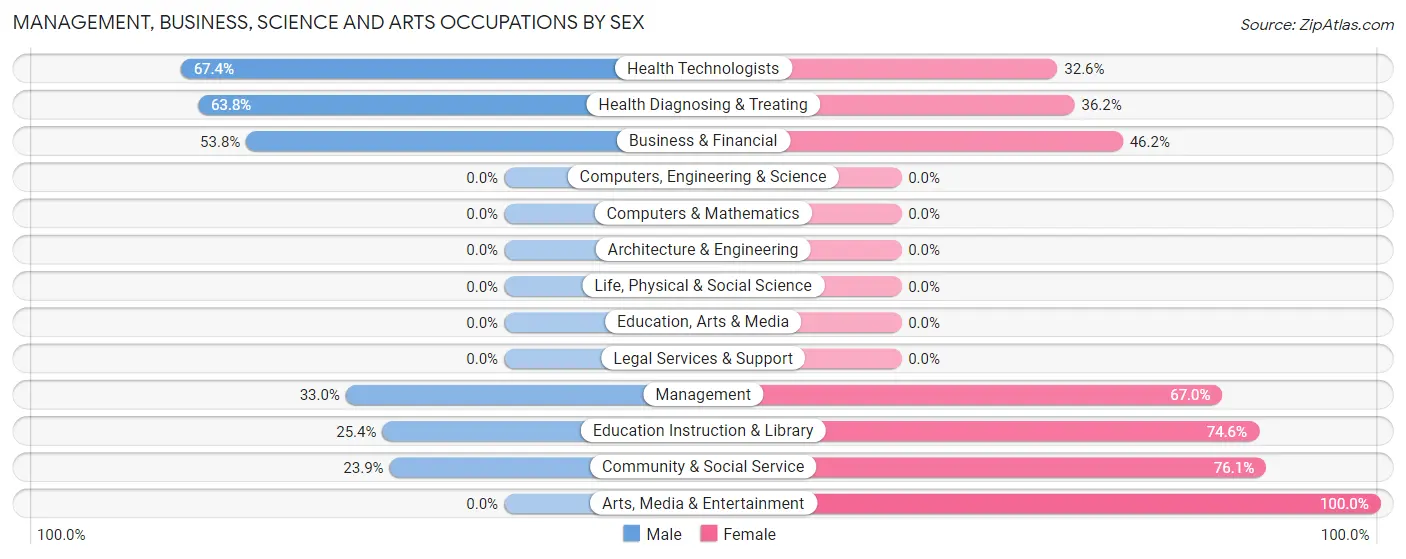
Management, Business, Science and Arts Occupations by Sex
Within the Management, Business, Science and Arts occupations in Bailey County, the most male-oriented occupations are Health Technologists (67.4%), Health Diagnosing & Treating (63.8%), and Business & Financial (53.8%), while the most female-oriented occupations are Arts, Media & Entertainment (100.0%), Community & Social Service (76.1%), and Education Instruction & Library (74.6%).
| Occupation | Male | Female |
| Management | 71 (33.0%) | 144 (67.0%) |
| Business & Financial | 64 (53.8%) | 55 (46.2%) |
| Computers, Engineering & Science | 0 (0.0%) | 0 (0.0%) |
| Computers & Mathematics | 0 (0.0%) | 0 (0.0%) |
| Architecture & Engineering | 0 (0.0%) | 0 (0.0%) |
| Life, Physical & Social Science | 0 (0.0%) | 0 (0.0%) |
| Community & Social Service | 65 (23.9%) | 207 (76.1%) |
| Education, Arts & Media | 0 (0.0%) | 0 (0.0%) |
| Legal Services & Support | 0 (0.0%) | 0 (0.0%) |
| Education Instruction & Library | 65 (25.4%) | 191 (74.6%) |
| Arts, Media & Entertainment | 0 (0.0%) | 16 (100.0%) |
| Health Diagnosing & Treating | 60 (63.8%) | 34 (36.2%) |
| Health Technologists | 60 (67.4%) | 29 (32.6%) |
| Total (Category) | 260 (37.1%) | 440 (62.9%) |
| Total (Overall) | 1,802 (60.3%) | 1,186 (39.7%) |
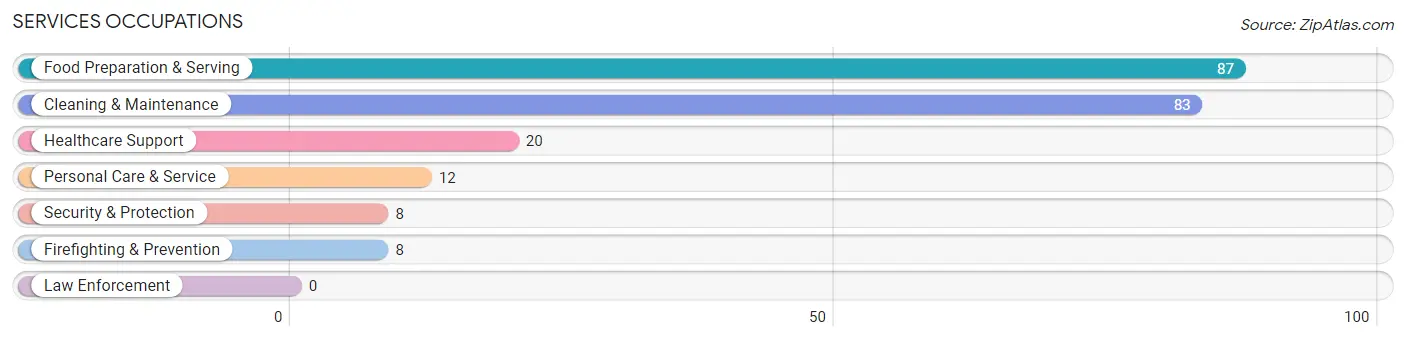
Services Occupations
The most common Services occupations in Bailey County are Food Preparation & Serving (87 | 2.9%), Cleaning & Maintenance (83 | 2.8%), Healthcare Support (20 | 0.7%), Personal Care & Service (12 | 0.4%), and Security & Protection (8 | 0.3%).
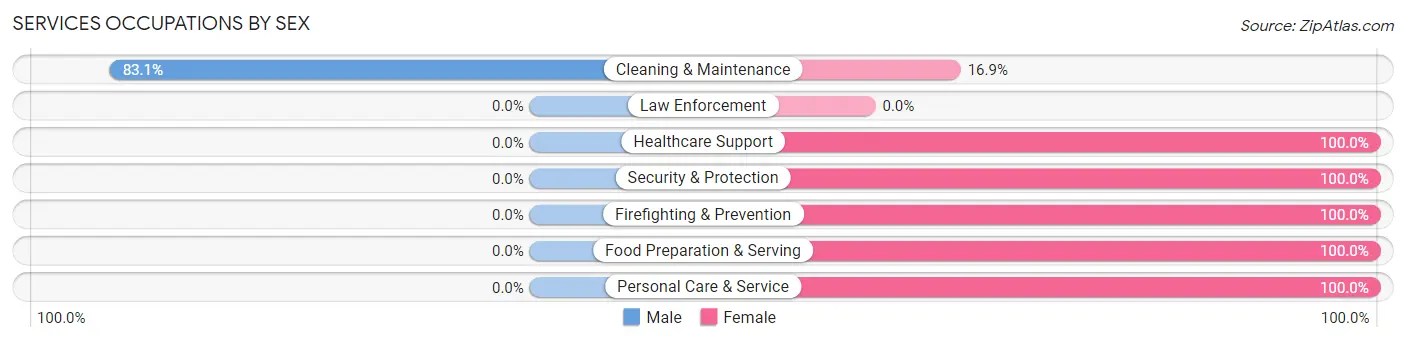
Services Occupations by Sex
| Occupation | Male | Female |
| Healthcare Support | 0 (0.0%) | 20 (100.0%) |
| Security & Protection | 0 (0.0%) | 8 (100.0%) |
| Firefighting & Prevention | 0 (0.0%) | 8 (100.0%) |
| Law Enforcement | 0 (0.0%) | 0 (0.0%) |
| Food Preparation & Serving | 0 (0.0%) | 87 (100.0%) |
| Cleaning & Maintenance | 69 (83.1%) | 14 (16.9%) |
| Personal Care & Service | 0 (0.0%) | 12 (100.0%) |
| Total (Category) | 69 (32.9%) | 141 (67.1%) |
| Total (Overall) | 1,802 (60.3%) | 1,186 (39.7%) |
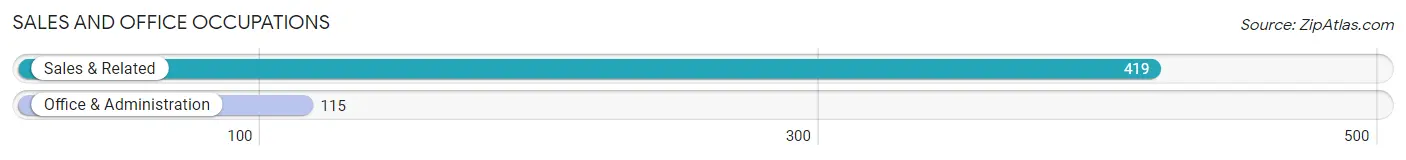
Sales and Office Occupations
The most common Sales and Office occupations in Bailey County are Sales & Related (419 | 14.0%), and Office & Administration (115 | 3.8%).
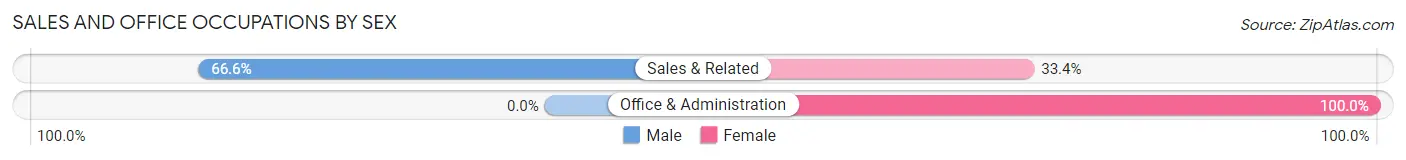
Sales and Office Occupations by Sex
| Occupation | Male | Female |
| Sales & Related | 279 (66.6%) | 140 (33.4%) |
| Office & Administration | 0 (0.0%) | 115 (100.0%) |
| Total (Category) | 279 (52.2%) | 255 (47.7%) |
| Total (Overall) | 1,802 (60.3%) | 1,186 (39.7%) |
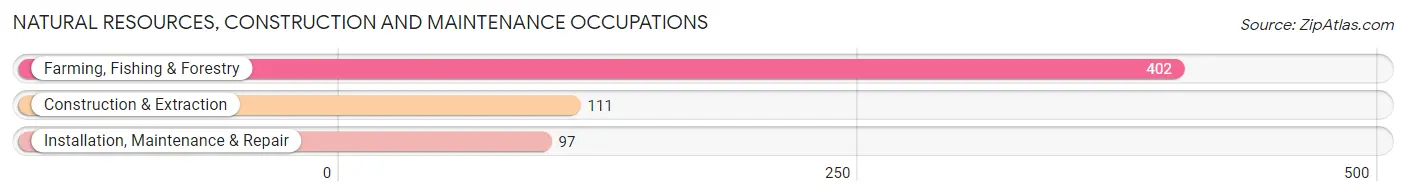
Natural Resources, Construction and Maintenance Occupations
The most common Natural Resources, Construction and Maintenance occupations in Bailey County are Farming, Fishing & Forestry (402 | 13.5%), Construction & Extraction (111 | 3.7%), and Installation, Maintenance & Repair (97 | 3.3%).
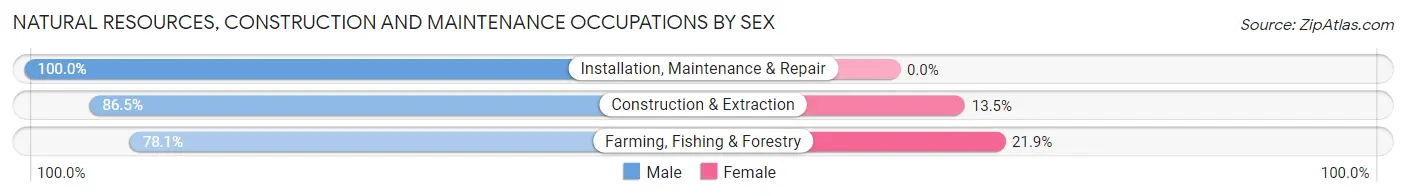
Natural Resources, Construction and Maintenance Occupations by Sex
| Occupation | Male | Female |
| Farming, Fishing & Forestry | 314 (78.1%) | 88 (21.9%) |
| Construction & Extraction | 96 (86.5%) | 15 (13.5%) |
| Installation, Maintenance & Repair | 97 (100.0%) | 0 (0.0%) |
| Total (Category) | 507 (83.1%) | 103 (16.9%) |
| Total (Overall) | 1,802 (60.3%) | 1,186 (39.7%) |
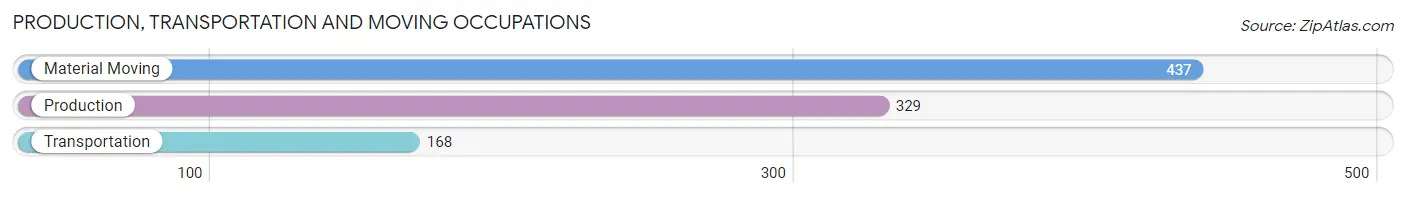
Production, Transportation and Moving Occupations
The most common Production, Transportation and Moving occupations in Bailey County are Material Moving (437 | 14.6%), Production (329 | 11.0%), and Transportation (168 | 5.6%).
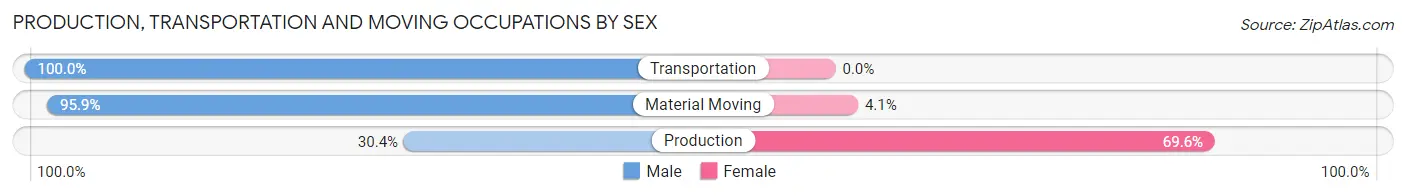
Production, Transportation and Moving Occupations by Sex
| Occupation | Male | Female |
| Production | 100 (30.4%) | 229 (69.6%) |
| Transportation | 168 (100.0%) | 0 (0.0%) |
| Material Moving | 419 (95.9%) | 18 (4.1%) |
| Total (Category) | 687 (73.6%) | 247 (26.5%) |
| Total (Overall) | 1,802 (60.3%) | 1,186 (39.7%) |
Employment Industries by Sex in Bailey County
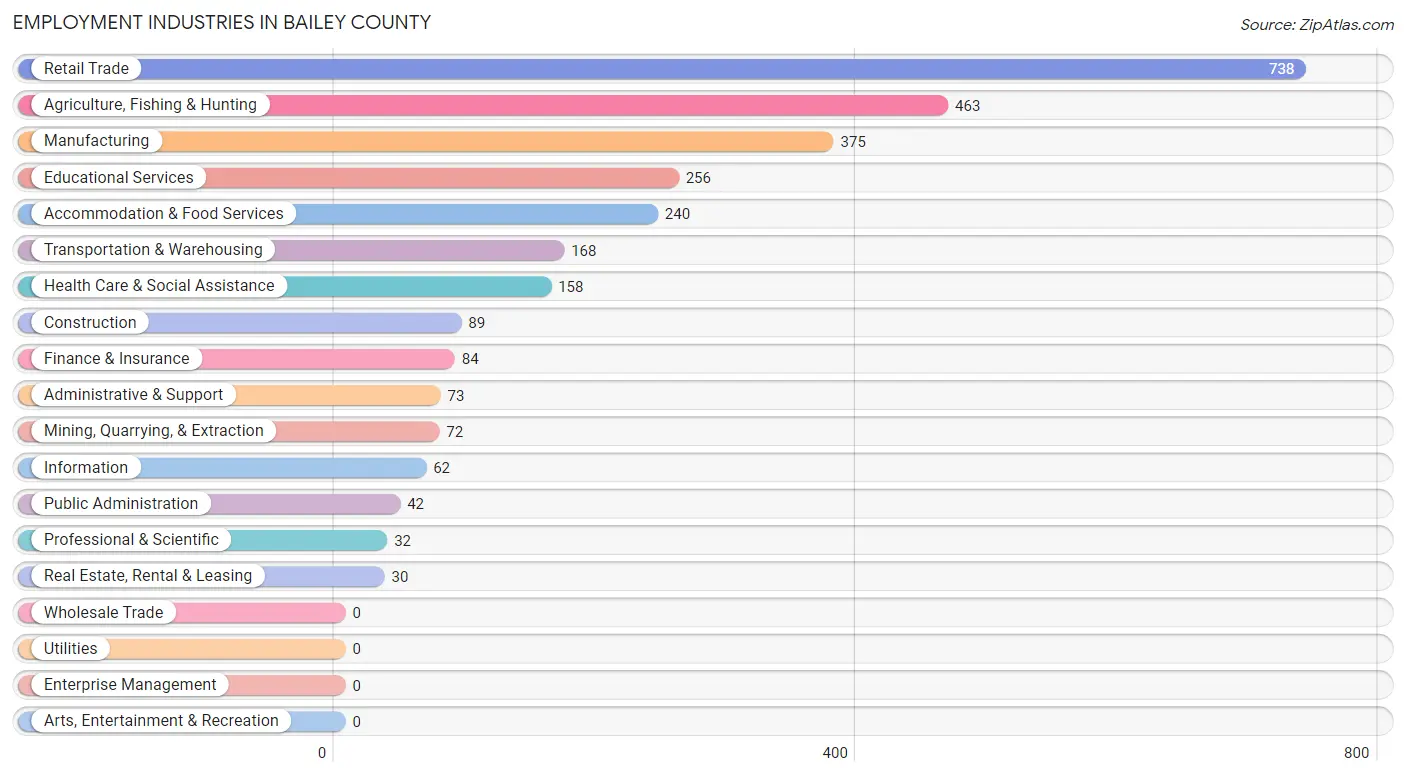
Employment Industries in Bailey County
The major employment industries in Bailey County include Retail Trade (738 | 24.7%), Agriculture, Fishing & Hunting (463 | 15.5%), Manufacturing (375 | 12.6%), Educational Services (256 | 8.6%), and Accommodation & Food Services (240 | 8.0%).
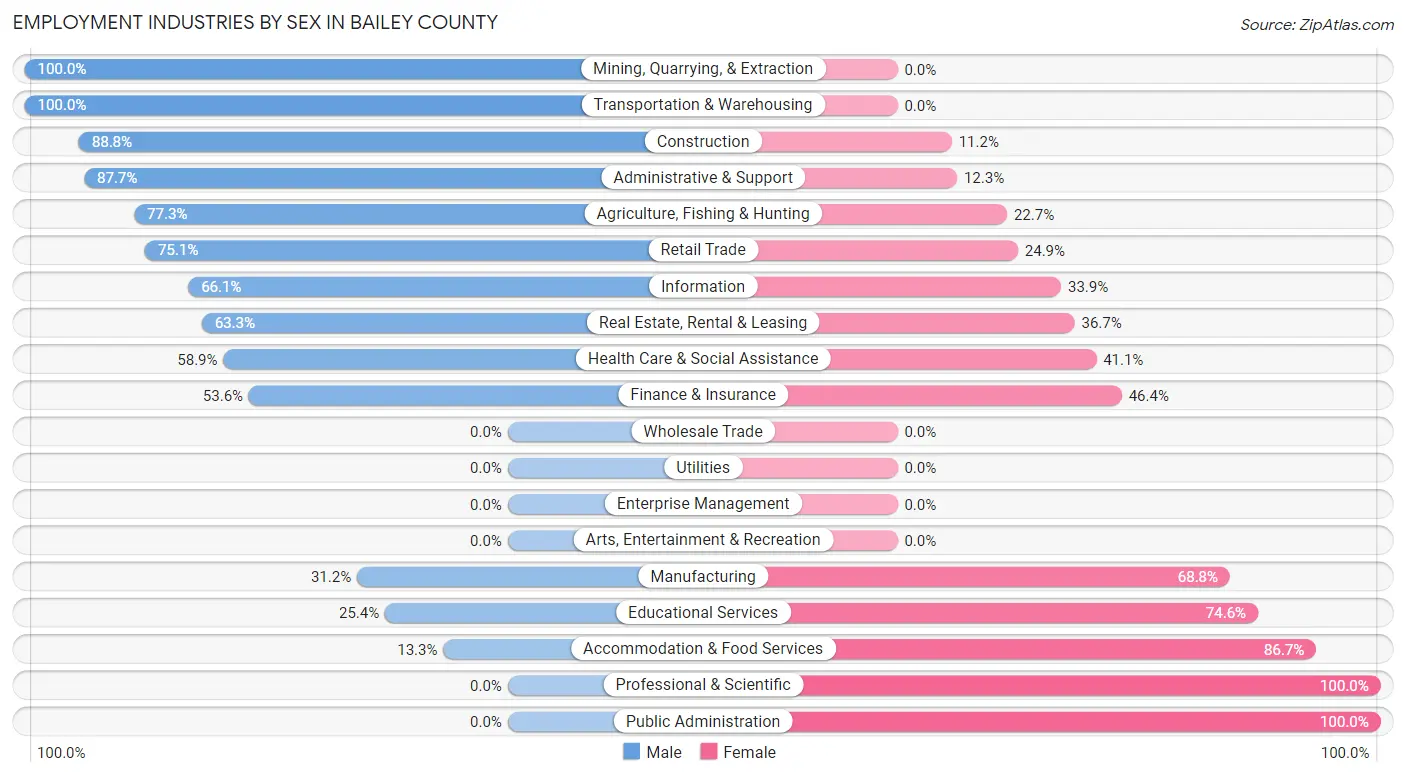
Employment Industries by Sex in Bailey County
The Bailey County industries that see more men than women are Mining, Quarrying, & Extraction (100.0%), Transportation & Warehousing (100.0%), and Construction (88.8%), whereas the industries that tend to have a higher number of women are Professional & Scientific (100.0%), Public Administration (100.0%), and Accommodation & Food Services (86.7%).
| Industry | Male | Female |
| Agriculture, Fishing & Hunting | 358 (77.3%) | 105 (22.7%) |
| Mining, Quarrying, & Extraction | 72 (100.0%) | 0 (0.0%) |
| Construction | 79 (88.8%) | 10 (11.2%) |
| Manufacturing | 117 (31.2%) | 258 (68.8%) |
| Wholesale Trade | 0 (0.0%) | 0 (0.0%) |
| Retail Trade | 554 (75.1%) | 184 (24.9%) |
| Transportation & Warehousing | 168 (100.0%) | 0 (0.0%) |
| Utilities | 0 (0.0%) | 0 (0.0%) |
| Information | 41 (66.1%) | 21 (33.9%) |
| Finance & Insurance | 45 (53.6%) | 39 (46.4%) |
| Real Estate, Rental & Leasing | 19 (63.3%) | 11 (36.7%) |
| Professional & Scientific | 0 (0.0%) | 32 (100.0%) |
| Enterprise Management | 0 (0.0%) | 0 (0.0%) |
| Administrative & Support | 64 (87.7%) | 9 (12.3%) |
| Educational Services | 65 (25.4%) | 191 (74.6%) |
| Health Care & Social Assistance | 93 (58.9%) | 65 (41.1%) |
| Arts, Entertainment & Recreation | 0 (0.0%) | 0 (0.0%) |
| Accommodation & Food Services | 32 (13.3%) | 208 (86.7%) |
| Public Administration | 0 (0.0%) | 42 (100.0%) |
| Total | 1,802 (60.3%) | 1,186 (39.7%) |
Education in Bailey County
School Enrollment in Bailey County
The most common levels of schooling among the 1,291 students in Bailey County are high school (484 | 37.5%), middle school (401 | 31.1%), and kindergarten (176 | 13.6%).
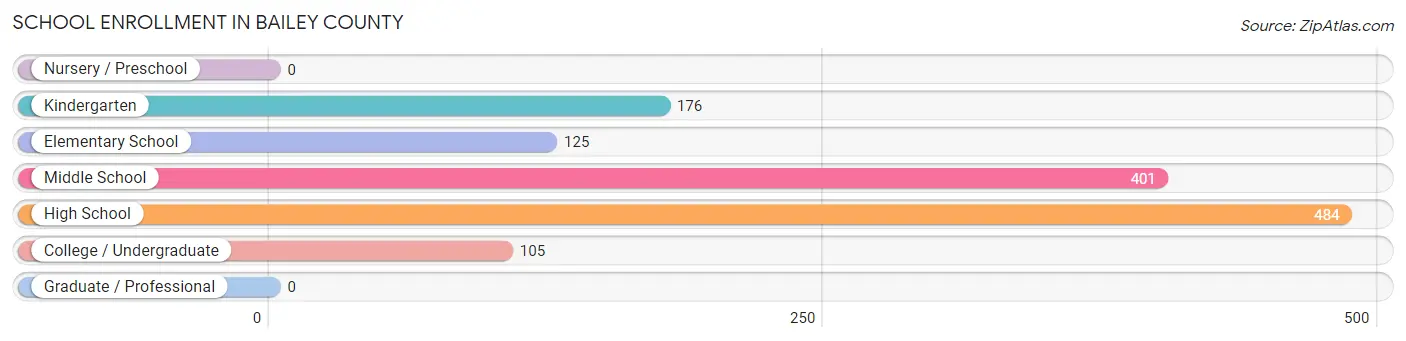
| School Level | # Students | % Students |
| Nursery / Preschool | 0 | 0.0% |
| Kindergarten | 176 | 13.6% |
| Elementary School | 125 | 9.7% |
| Middle School | 401 | 31.1% |
| High School | 484 | 37.5% |
| College / Undergraduate | 105 | 8.1% |
| Graduate / Professional | 0 | 0.0% |
| Total | 1,291 | 100.0% |
School Enrollment by Age by Funding Source in Bailey County
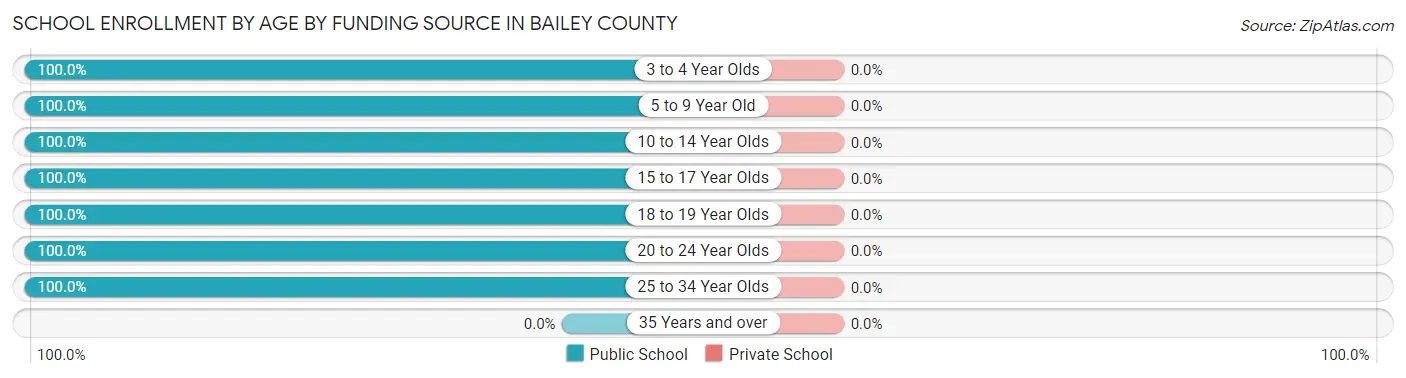
| Age Bracket | Public School | Private School |
| 3 to 4 Year Olds | 16 (100.0%) | 0 (0.0%) |
| 5 to 9 Year Old | 285 (100.0%) | 0 (0.0%) |
| 10 to 14 Year Olds | 352 (100.0%) | 0 (0.0%) |
| 15 to 17 Year Olds | 372 (100.0%) | 0 (0.0%) |
| 18 to 19 Year Olds | 200 (100.0%) | 0 (0.0%) |
| 20 to 24 Year Olds | 23 (100.0%) | 0 (0.0%) |
| 25 to 34 Year Olds | 43 (100.0%) | 0 (0.0%) |
| 35 Years and over | 0 (0.0%) | 0 (0.0%) |
| Total | 1,291 (100.0%) | 0 (0.0%) |
Educational Attainment by Field of Study in Bailey County
Business (156 | 21.4%), education (119 | 16.4%), social sciences (106 | 14.6%), bio, nature & agricultural (96 | 13.2%), and psychology (57 | 7.8%) are the most common fields of study among 728 individuals in Bailey County who have obtained a bachelor's degree or higher.
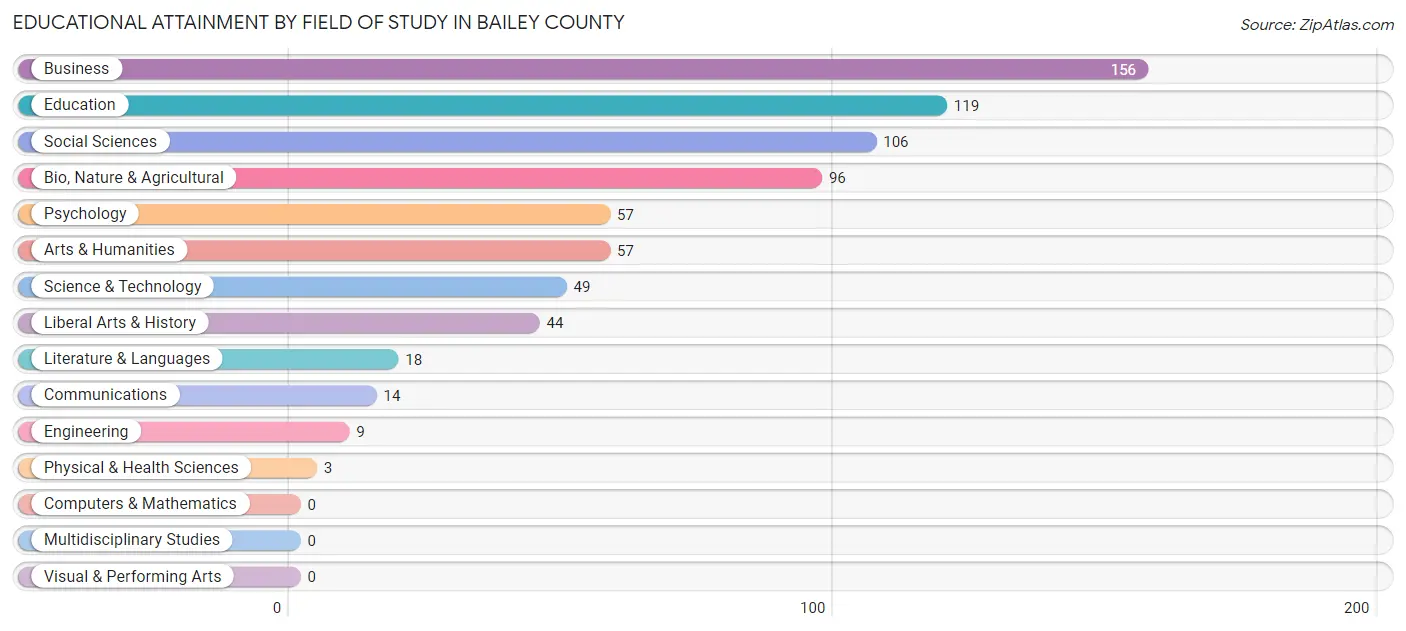
| Field of Study | # Graduates | % Graduates |
| Computers & Mathematics | 0 | 0.0% |
| Bio, Nature & Agricultural | 96 | 13.2% |
| Physical & Health Sciences | 3 | 0.4% |
| Psychology | 57 | 7.8% |
| Social Sciences | 106 | 14.6% |
| Engineering | 9 | 1.2% |
| Multidisciplinary Studies | 0 | 0.0% |
| Science & Technology | 49 | 6.7% |
| Business | 156 | 21.4% |
| Education | 119 | 16.4% |
| Literature & Languages | 18 | 2.5% |
| Liberal Arts & History | 44 | 6.0% |
| Visual & Performing Arts | 0 | 0.0% |
| Communications | 14 | 1.9% |
| Arts & Humanities | 57 | 7.8% |
| Total | 728 | 100.0% |
Transportation & Commute in Bailey County
Vehicle Availability by Sex in Bailey County
The most prevalent vehicle ownership categories in Bailey County are males with 1 vehicle (532, accounting for 30.1%) and females with 1 vehicle (191, making up 51.0%).
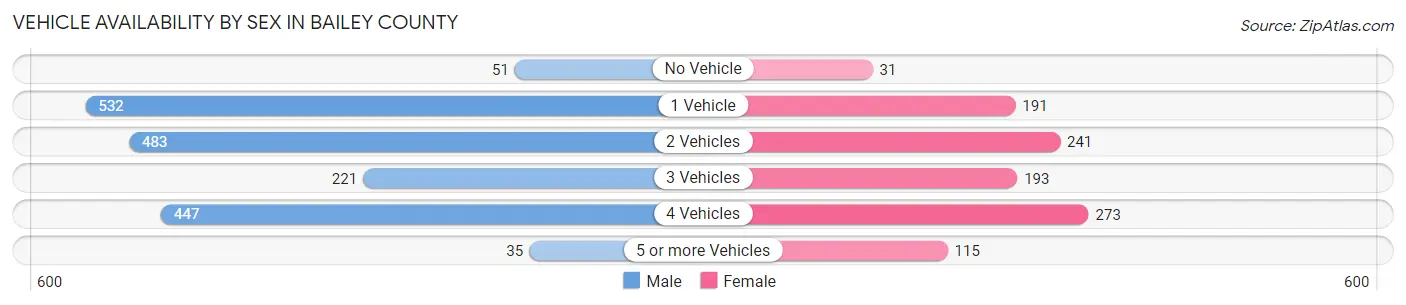
| Vehicles Available | Male | Female |
| No Vehicle | 51 (2.9%) | 31 (3.0%) |
| 1 Vehicle | 532 (30.1%) | 191 (18.3%) |
| 2 Vehicles | 483 (27.3%) | 241 (23.1%) |
| 3 Vehicles | 221 (12.5%) | 193 (18.5%) |
| 4 Vehicles | 447 (25.3%) | 273 (26.2%) |
| 5 or more Vehicles | 35 (2.0%) | 115 (11.0%) |
| Total | 1,769 (100.0%) | 1,044 (100.0%) |
Commute Time in Bailey County
The most frequently occuring commute durations in Bailey County are 5 to 9 minutes (943 commuters, 34.3%), 30 to 34 minutes (689 commuters, 25.1%), and less than 5 minutes (304 commuters, 11.1%).
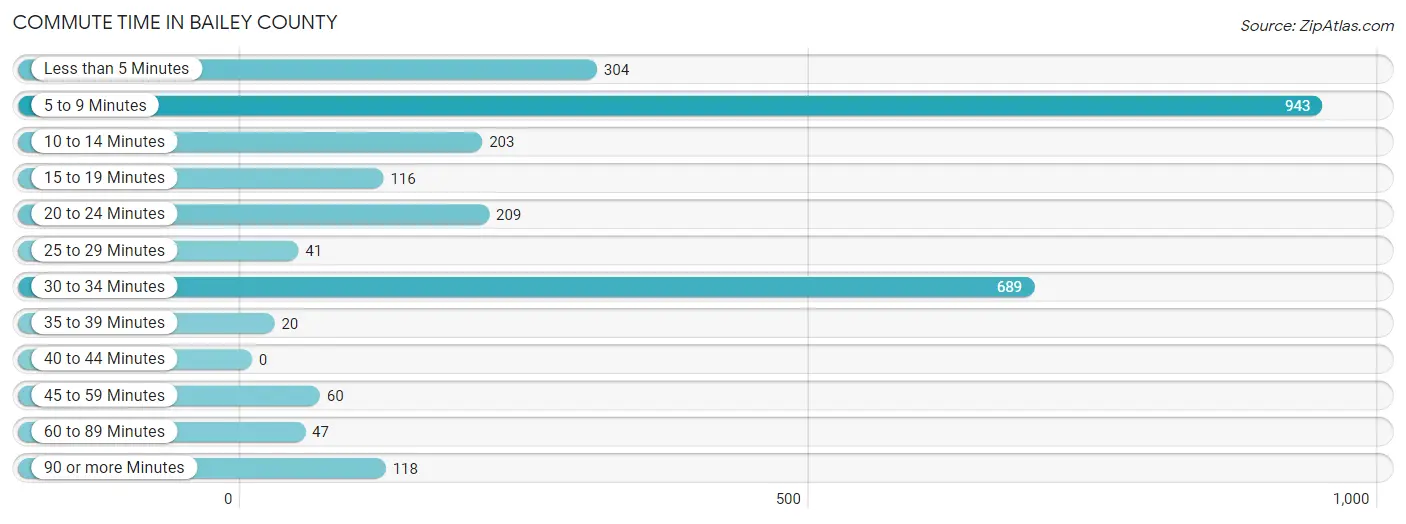
| Commute Time | # Commuters | % Commuters |
| Less than 5 Minutes | 304 | 11.1% |
| 5 to 9 Minutes | 943 | 34.3% |
| 10 to 14 Minutes | 203 | 7.4% |
| 15 to 19 Minutes | 116 | 4.2% |
| 20 to 24 Minutes | 209 | 7.6% |
| 25 to 29 Minutes | 41 | 1.5% |
| 30 to 34 Minutes | 689 | 25.1% |
| 35 to 39 Minutes | 20 | 0.7% |
| 40 to 44 Minutes | 0 | 0.0% |
| 45 to 59 Minutes | 60 | 2.2% |
| 60 to 89 Minutes | 47 | 1.7% |
| 90 or more Minutes | 118 | 4.3% |
Commute Time by Sex in Bailey County
The most common commute times in Bailey County are 5 to 9 minutes (591 commuters, 33.8%) for males and 5 to 9 minutes (352 commuters, 35.2%) for females.
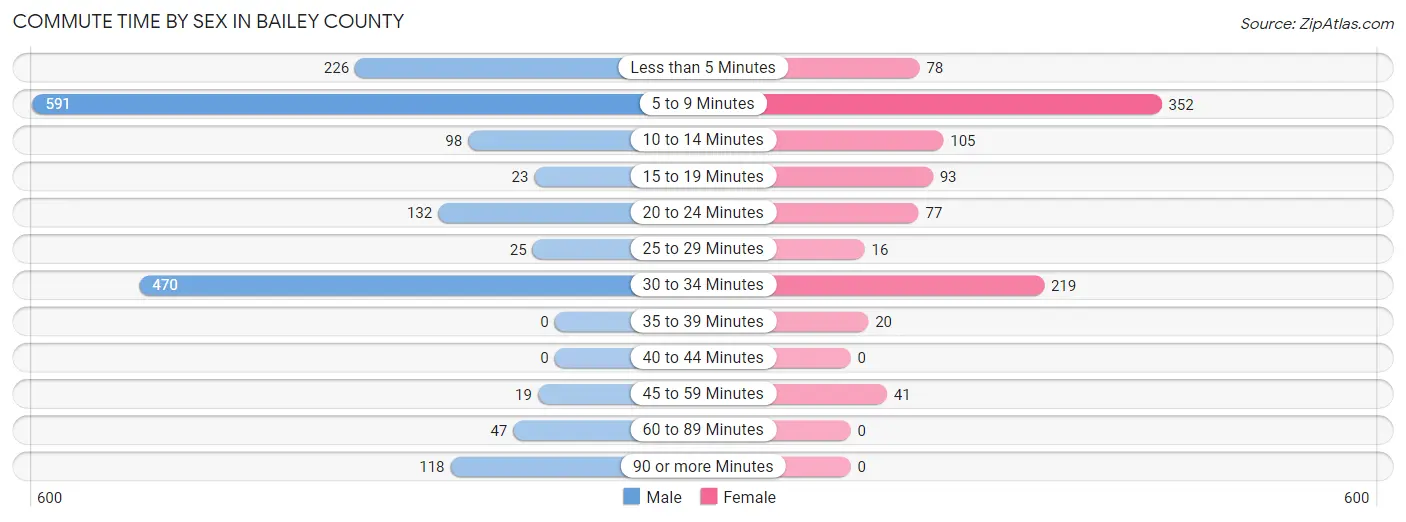
| Commute Time | Male | Female |
| Less than 5 Minutes | 226 (12.9%) | 78 (7.8%) |
| 5 to 9 Minutes | 591 (33.8%) | 352 (35.2%) |
| 10 to 14 Minutes | 98 (5.6%) | 105 (10.5%) |
| 15 to 19 Minutes | 23 (1.3%) | 93 (9.3%) |
| 20 to 24 Minutes | 132 (7.5%) | 77 (7.7%) |
| 25 to 29 Minutes | 25 (1.4%) | 16 (1.6%) |
| 30 to 34 Minutes | 470 (26.9%) | 219 (21.9%) |
| 35 to 39 Minutes | 0 (0.0%) | 20 (2.0%) |
| 40 to 44 Minutes | 0 (0.0%) | 0 (0.0%) |
| 45 to 59 Minutes | 19 (1.1%) | 41 (4.1%) |
| 60 to 89 Minutes | 47 (2.7%) | 0 (0.0%) |
| 90 or more Minutes | 118 (6.8%) | 0 (0.0%) |
Time of Departure to Work by Sex in Bailey County
The most frequent times of departure to work in Bailey County are 12:00 PM to 3:59 PM (388, 22.2%) for males and 12:00 PM to 3:59 PM (355, 35.5%) for females.
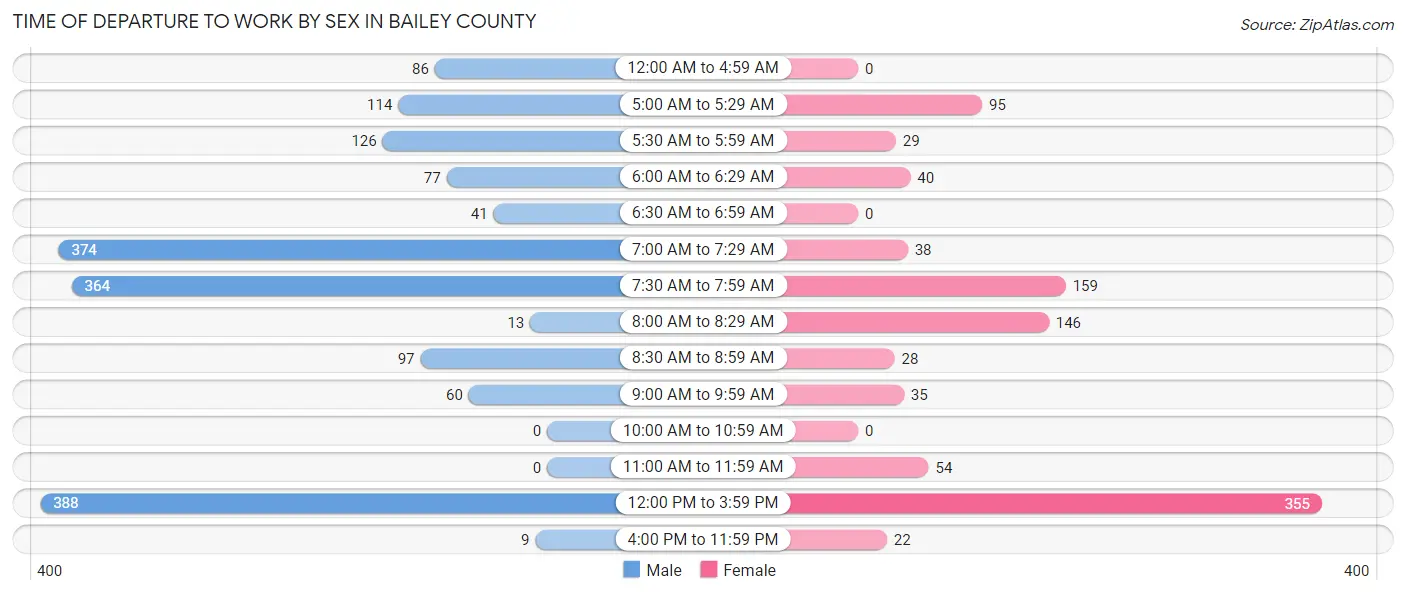
| Time of Departure | Male | Female |
| 12:00 AM to 4:59 AM | 86 (4.9%) | 0 (0.0%) |
| 5:00 AM to 5:29 AM | 114 (6.5%) | 95 (9.5%) |
| 5:30 AM to 5:59 AM | 126 (7.2%) | 29 (2.9%) |
| 6:00 AM to 6:29 AM | 77 (4.4%) | 40 (4.0%) |
| 6:30 AM to 6:59 AM | 41 (2.3%) | 0 (0.0%) |
| 7:00 AM to 7:29 AM | 374 (21.4%) | 38 (3.8%) |
| 7:30 AM to 7:59 AM | 364 (20.8%) | 159 (15.9%) |
| 8:00 AM to 8:29 AM | 13 (0.7%) | 146 (14.6%) |
| 8:30 AM to 8:59 AM | 97 (5.6%) | 28 (2.8%) |
| 9:00 AM to 9:59 AM | 60 (3.4%) | 35 (3.5%) |
| 10:00 AM to 10:59 AM | 0 (0.0%) | 0 (0.0%) |
| 11:00 AM to 11:59 AM | 0 (0.0%) | 54 (5.4%) |
| 12:00 PM to 3:59 PM | 388 (22.2%) | 355 (35.5%) |
| 4:00 PM to 11:59 PM | 9 (0.5%) | 22 (2.2%) |
| Total | 1,749 (100.0%) | 1,001 (100.0%) |
Housing Occupancy in Bailey County
Occupancy by Ownership in Bailey County
Of the total 1,933 dwellings in Bailey County, owner-occupied units account for 1,415 (73.2%), while renter-occupied units make up 518 (26.8%).
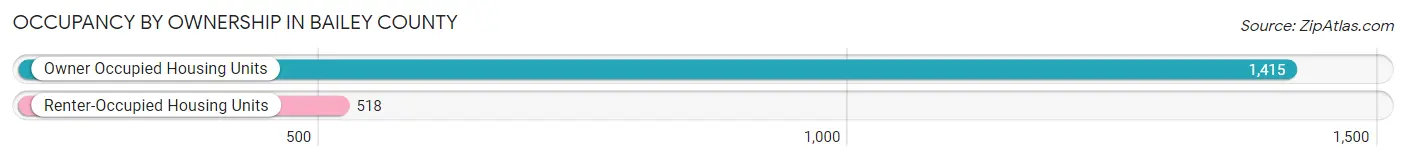
| Occupancy | # Housing Units | % Housing Units |
| Owner Occupied Housing Units | 1,415 | 73.2% |
| Renter-Occupied Housing Units | 518 | 26.8% |
| Total Occupied Housing Units | 1,933 | 100.0% |
Occupancy by Household Size in Bailey County
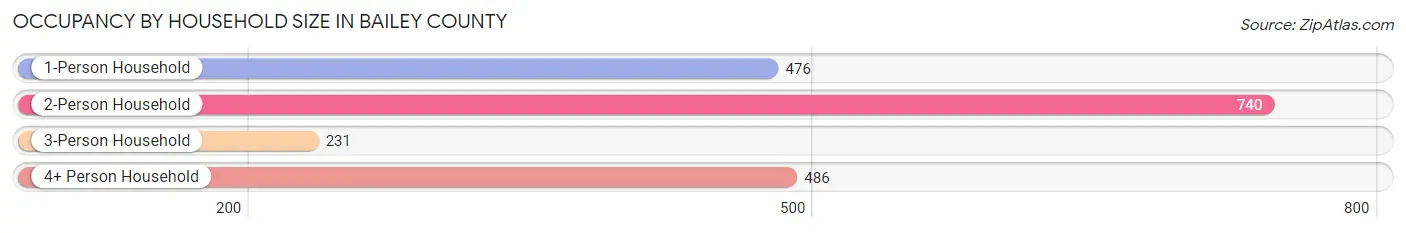
| Household Size | # Housing Units | % Housing Units |
| 1-Person Household | 476 | 24.6% |
| 2-Person Household | 740 | 38.3% |
| 3-Person Household | 231 | 11.9% |
| 4+ Person Household | 486 | 25.1% |
| Total Housing Units | 1,933 | 100.0% |
Occupancy by Ownership by Household Size in Bailey County
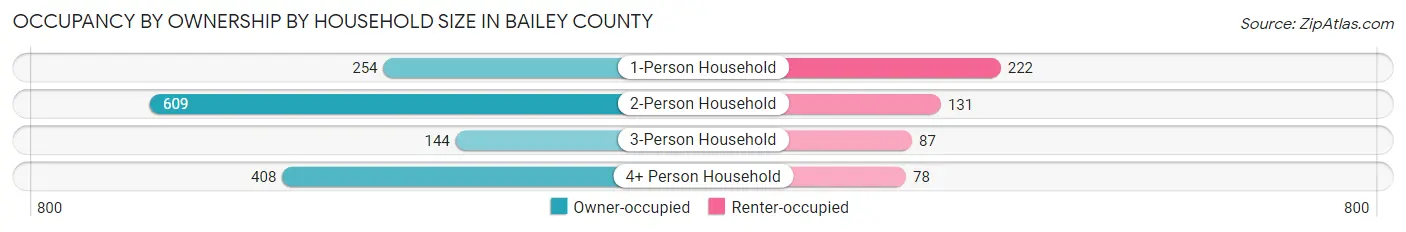
| Household Size | Owner-occupied | Renter-occupied |
| 1-Person Household | 254 (53.4%) | 222 (46.6%) |
| 2-Person Household | 609 (82.3%) | 131 (17.7%) |
| 3-Person Household | 144 (62.3%) | 87 (37.7%) |
| 4+ Person Household | 408 (84.0%) | 78 (16.1%) |
| Total Housing Units | 1,415 (73.2%) | 518 (26.8%) |
Occupancy by Educational Attainment in Bailey County
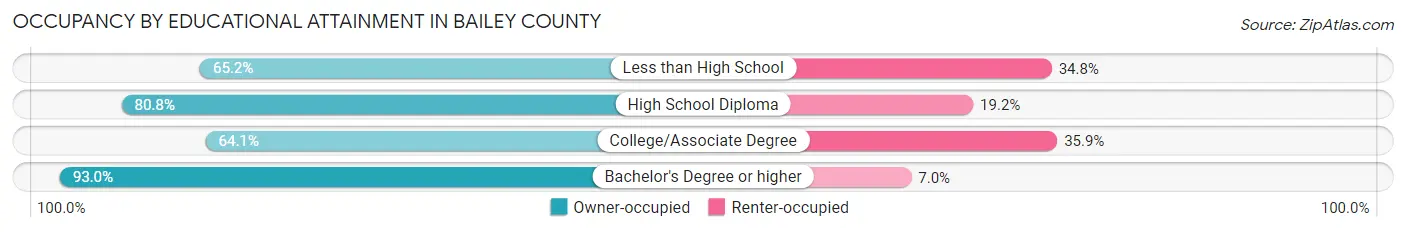
| Household Size | Owner-occupied | Renter-occupied |
| Less than High School | 401 (65.2%) | 214 (34.8%) |
| High School Diploma | 378 (80.8%) | 90 (19.2%) |
| College/Associate Degree | 343 (64.1%) | 192 (35.9%) |
| Bachelor's Degree or higher | 293 (93.0%) | 22 (7.0%) |
Occupancy by Age of Householder in Bailey County
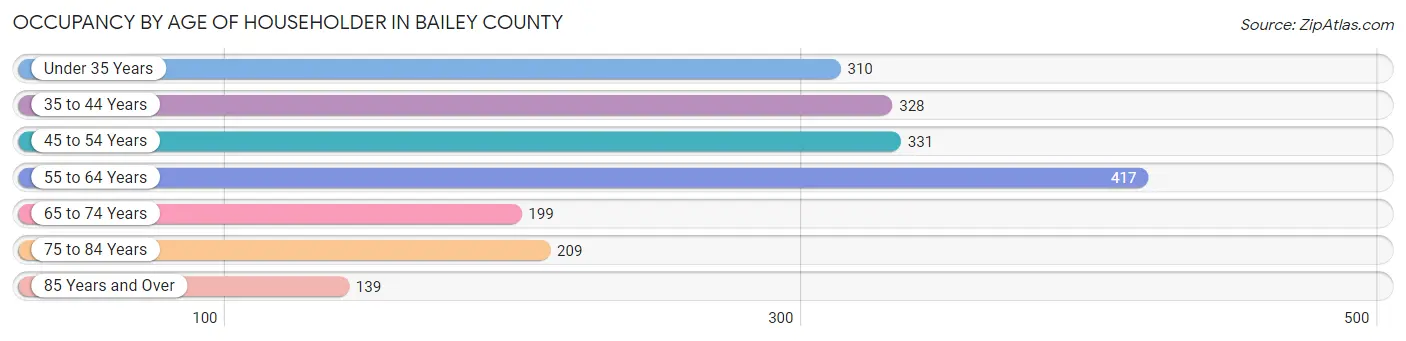
| Age Bracket | # Households | % Households |
| Under 35 Years | 310 | 16.0% |
| 35 to 44 Years | 328 | 17.0% |
| 45 to 54 Years | 331 | 17.1% |
| 55 to 64 Years | 417 | 21.6% |
| 65 to 74 Years | 199 | 10.3% |
| 75 to 84 Years | 209 | 10.8% |
| 85 Years and Over | 139 | 7.2% |
| Total | 1,933 | 100.0% |
Housing Finances in Bailey County
Median Income by Occupancy in Bailey County
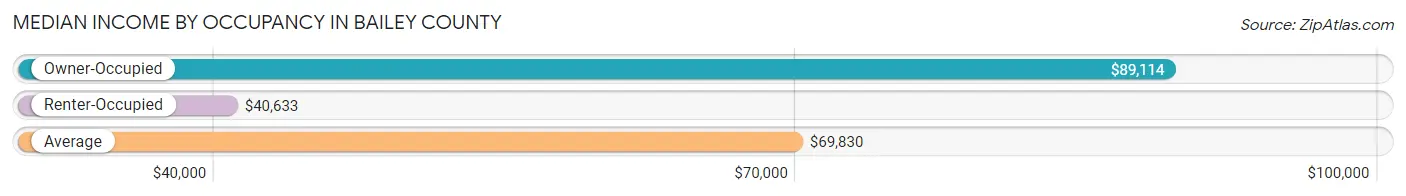
| Occupancy Type | # Households | Median Income |
| Owner-Occupied | 1,415 (73.2%) | $89,114 |
| Renter-Occupied | 518 (26.8%) | $40,633 |
| Average | 1,933 (100.0%) | $69,830 |
Occupancy by Householder Income Bracket in Bailey County
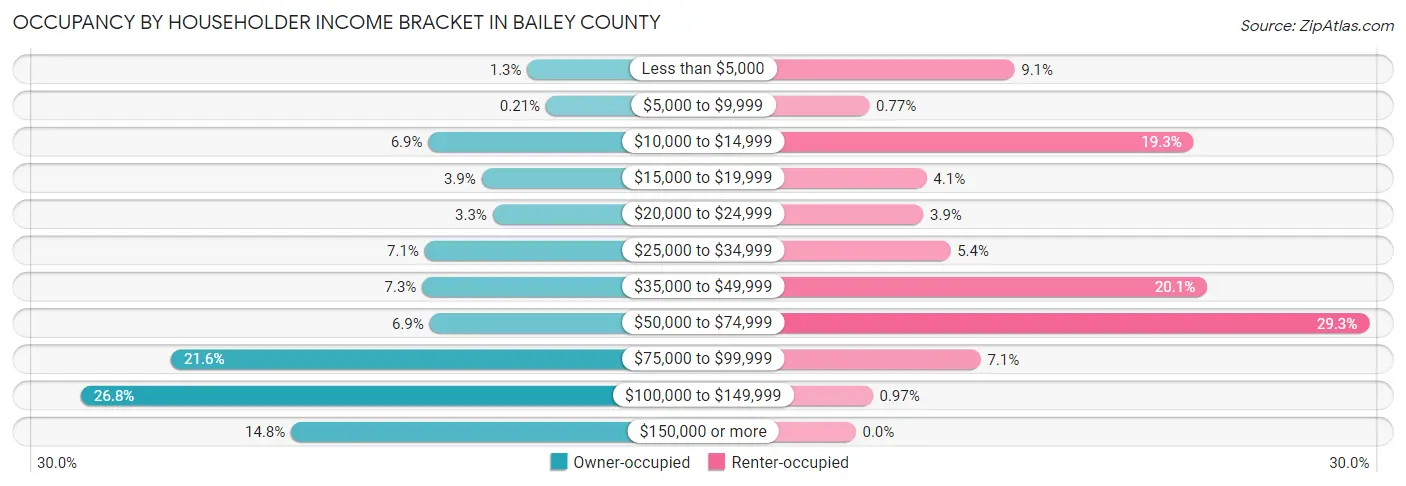
| Income Bracket | Owner-occupied | Renter-occupied |
| Less than $5,000 | 18 (1.3%) | 47 (9.1%) |
| $5,000 to $9,999 | 3 (0.2%) | 4 (0.8%) |
| $10,000 to $14,999 | 98 (6.9%) | 100 (19.3%) |
| $15,000 to $19,999 | 55 (3.9%) | 21 (4.1%) |
| $20,000 to $24,999 | 46 (3.3%) | 20 (3.9%) |
| $25,000 to $34,999 | 101 (7.1%) | 28 (5.4%) |
| $35,000 to $49,999 | 103 (7.3%) | 104 (20.1%) |
| $50,000 to $74,999 | 97 (6.9%) | 152 (29.3%) |
| $75,000 to $99,999 | 306 (21.6%) | 37 (7.1%) |
| $100,000 to $149,999 | 379 (26.8%) | 5 (1.0%) |
| $150,000 or more | 209 (14.8%) | 0 (0.0%) |
| Total | 1,415 (100.0%) | 518 (100.0%) |
Monthly Housing Cost Tiers in Bailey County
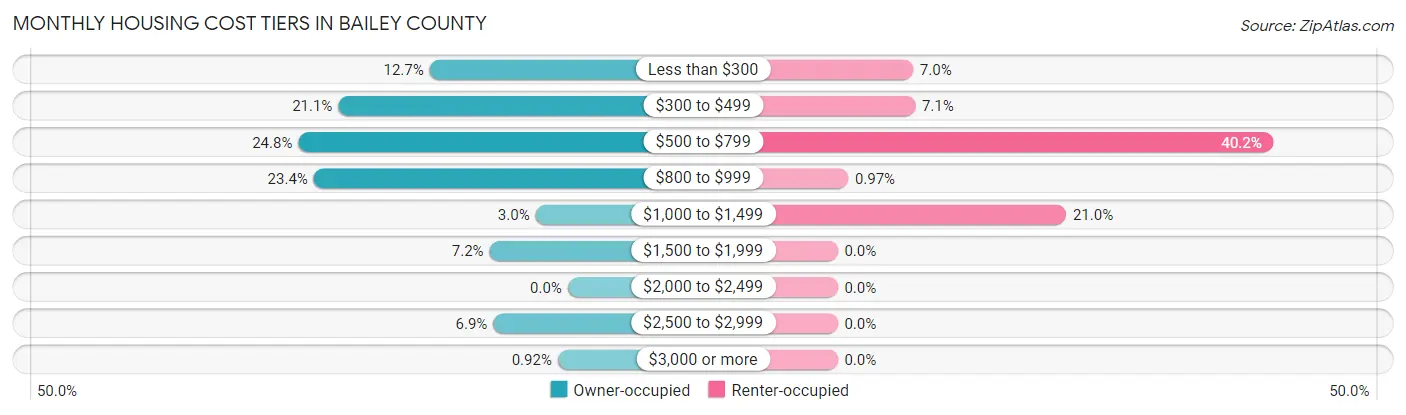
| Monthly Cost | Owner-occupied | Renter-occupied |
| Less than $300 | 180 (12.7%) | 36 (7.0%) |
| $300 to $499 | 299 (21.1%) | 37 (7.1%) |
| $500 to $799 | 351 (24.8%) | 208 (40.2%) |
| $800 to $999 | 331 (23.4%) | 5 (1.0%) |
| $1,000 to $1,499 | 42 (3.0%) | 109 (21.0%) |
| $1,500 to $1,999 | 102 (7.2%) | 0 (0.0%) |
| $2,000 to $2,499 | 0 (0.0%) | 0 (0.0%) |
| $2,500 to $2,999 | 97 (6.9%) | 0 (0.0%) |
| $3,000 or more | 13 (0.9%) | 0 (0.0%) |
| Total | 1,415 (100.0%) | 518 (100.0%) |
Physical Housing Characteristics in Bailey County
Housing Structures in Bailey County
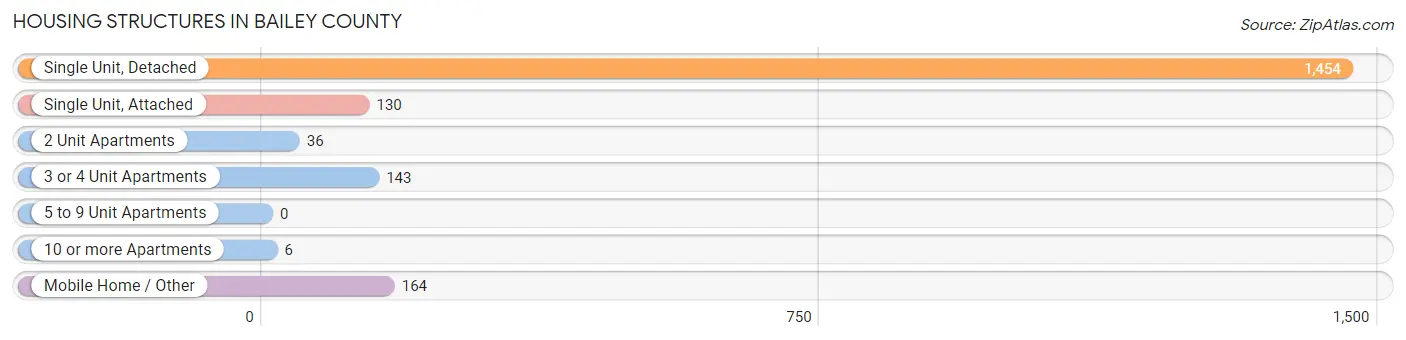
| Structure Type | # Housing Units | % Housing Units |
| Single Unit, Detached | 1,454 | 75.2% |
| Single Unit, Attached | 130 | 6.7% |
| 2 Unit Apartments | 36 | 1.9% |
| 3 or 4 Unit Apartments | 143 | 7.4% |
| 5 to 9 Unit Apartments | 0 | 0.0% |
| 10 or more Apartments | 6 | 0.3% |
| Mobile Home / Other | 164 | 8.5% |
| Total | 1,933 | 100.0% |
Housing Structures by Occupancy in Bailey County
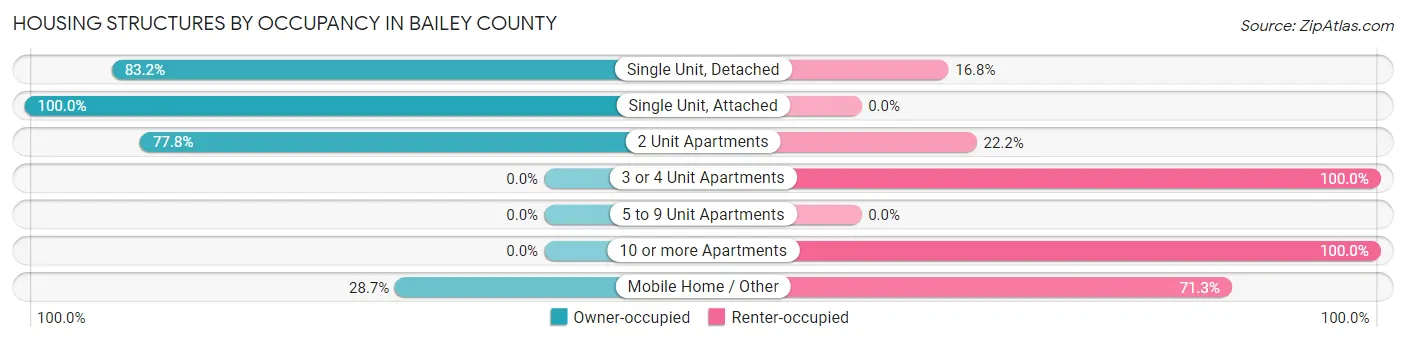
| Structure Type | Owner-occupied | Renter-occupied |
| Single Unit, Detached | 1,210 (83.2%) | 244 (16.8%) |
| Single Unit, Attached | 130 (100.0%) | 0 (0.0%) |
| 2 Unit Apartments | 28 (77.8%) | 8 (22.2%) |
| 3 or 4 Unit Apartments | 0 (0.0%) | 143 (100.0%) |
| 5 to 9 Unit Apartments | 0 (0.0%) | 0 (0.0%) |
| 10 or more Apartments | 0 (0.0%) | 6 (100.0%) |
| Mobile Home / Other | 47 (28.7%) | 117 (71.3%) |
| Total | 1,415 (73.2%) | 518 (26.8%) |
Housing Structures by Number of Rooms in Bailey County
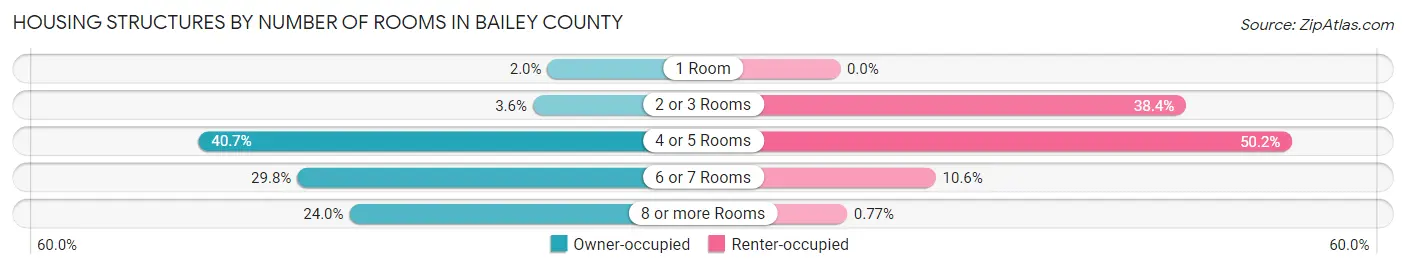
| Number of Rooms | Owner-occupied | Renter-occupied |
| 1 Room | 28 (2.0%) | 0 (0.0%) |
| 2 or 3 Rooms | 51 (3.6%) | 199 (38.4%) |
| 4 or 5 Rooms | 576 (40.7%) | 260 (50.2%) |
| 6 or 7 Rooms | 421 (29.7%) | 55 (10.6%) |
| 8 or more Rooms | 339 (24.0%) | 4 (0.8%) |
| Total | 1,415 (100.0%) | 518 (100.0%) |
Housing Structure by Heating Type in Bailey County
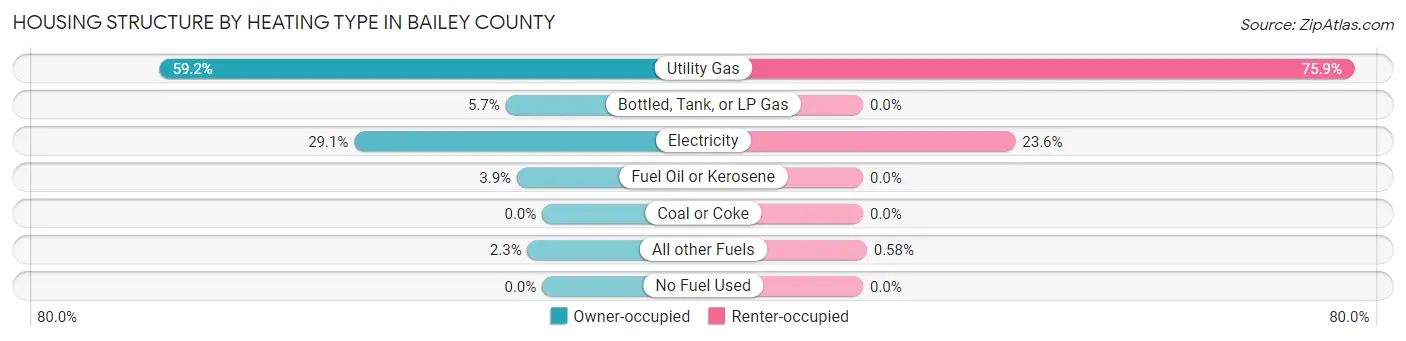
| Heating Type | Owner-occupied | Renter-occupied |
| Utility Gas | 837 (59.2%) | 393 (75.9%) |
| Bottled, Tank, or LP Gas | 80 (5.7%) | 0 (0.0%) |
| Electricity | 411 (29.0%) | 122 (23.5%) |
| Fuel Oil or Kerosene | 55 (3.9%) | 0 (0.0%) |
| Coal or Coke | 0 (0.0%) | 0 (0.0%) |
| All other Fuels | 32 (2.3%) | 3 (0.6%) |
| No Fuel Used | 0 (0.0%) | 0 (0.0%) |
| Total | 1,415 (100.0%) | 518 (100.0%) |
Household Vehicle Usage in Bailey County
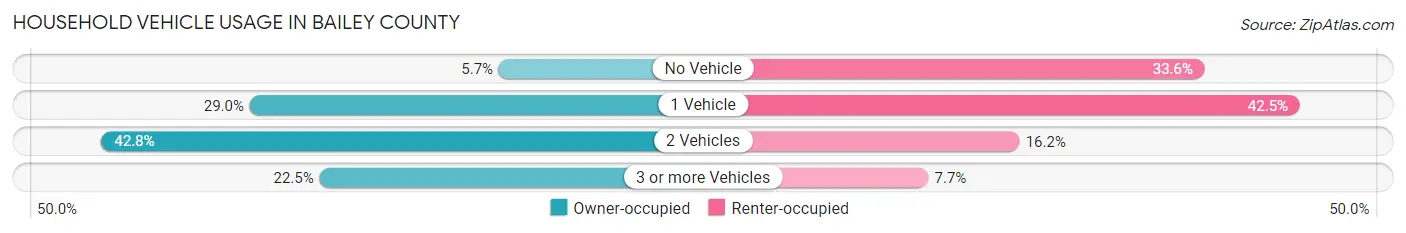
| Vehicles per Household | Owner-occupied | Renter-occupied |
| No Vehicle | 81 (5.7%) | 174 (33.6%) |
| 1 Vehicle | 410 (29.0%) | 220 (42.5%) |
| 2 Vehicles | 606 (42.8%) | 84 (16.2%) |
| 3 or more Vehicles | 318 (22.5%) | 40 (7.7%) |
| Total | 1,415 (100.0%) | 518 (100.0%) |
Real Estate & Mortgages in Bailey County
Real Estate and Mortgage Overview in Bailey County
| Characteristic | Without Mortgage | With Mortgage |
| Housing Units | 871 | 544 |
| Median Property Value | $101,000 | $117,900 |
| Median Household Income | $75,320 | $101 |
| Monthly Housing Costs | $471 | $13 |
| Real Estate Taxes | $1,409 | $0 |
Property Value by Mortgage Status in Bailey County
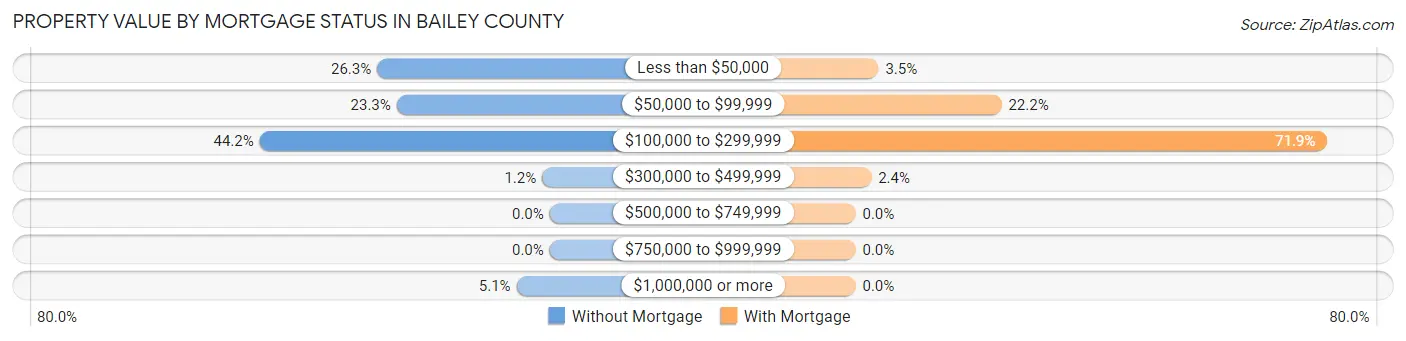
| Property Value | Without Mortgage | With Mortgage |
| Less than $50,000 | 229 (26.3%) | 19 (3.5%) |
| $50,000 to $99,999 | 203 (23.3%) | 121 (22.2%) |
| $100,000 to $299,999 | 385 (44.2%) | 391 (71.9%) |
| $300,000 to $499,999 | 10 (1.1%) | 13 (2.4%) |
| $500,000 to $749,999 | 0 (0.0%) | 0 (0.0%) |
| $750,000 to $999,999 | 0 (0.0%) | 0 (0.0%) |
| $1,000,000 or more | 44 (5.1%) | 0 (0.0%) |
| Total | 871 (100.0%) | 544 (100.0%) |
Household Income by Mortgage Status in Bailey County
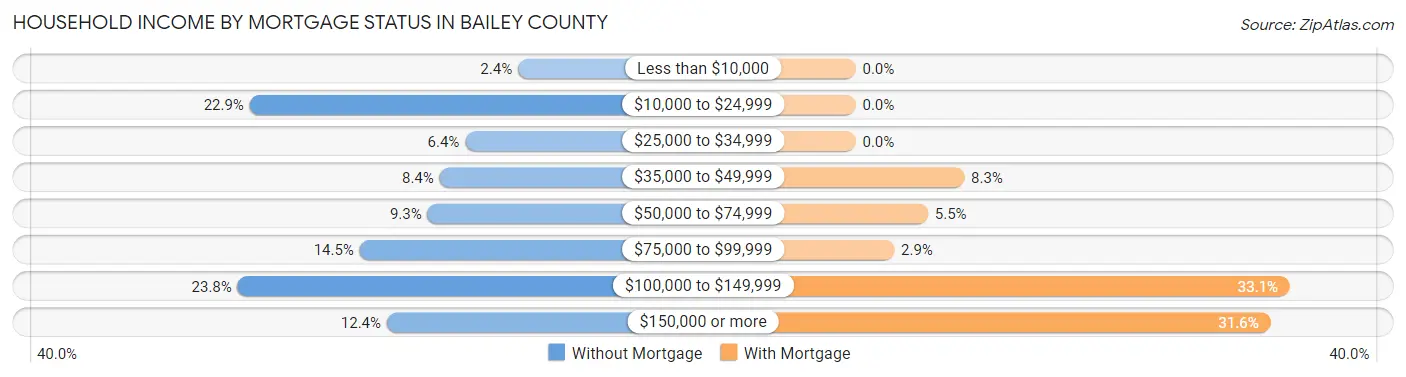
| Household Income | Without Mortgage | With Mortgage |
| Less than $10,000 | 21 (2.4%) | 0 (0.0%) |
| $10,000 to $24,999 | 199 (22.9%) | 0 (0.0%) |
| $25,000 to $34,999 | 56 (6.4%) | 0 (0.0%) |
| $35,000 to $49,999 | 73 (8.4%) | 45 (8.3%) |
| $50,000 to $74,999 | 81 (9.3%) | 30 (5.5%) |
| $75,000 to $99,999 | 126 (14.5%) | 16 (2.9%) |
| $100,000 to $149,999 | 207 (23.8%) | 180 (33.1%) |
| $150,000 or more | 108 (12.4%) | 172 (31.6%) |
| Total | 871 (100.0%) | 544 (100.0%) |
Property Value to Household Income Ratio in Bailey County
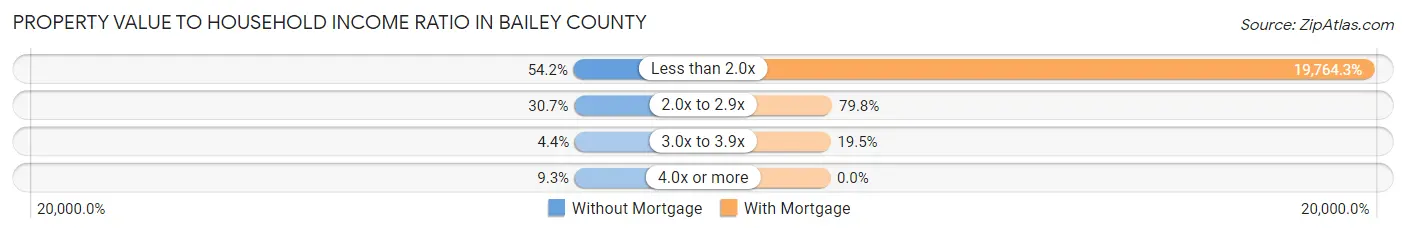
| Value-to-Income Ratio | Without Mortgage | With Mortgage |
| Less than 2.0x | 472 (54.2%) | 107,518 (19,764.3%) |
| 2.0x to 2.9x | 267 (30.6%) | 434 (79.8%) |
| 3.0x to 3.9x | 38 (4.4%) | 106 (19.5%) |
| 4.0x or more | 81 (9.3%) | 0 (0.0%) |
| Total | 871 (100.0%) | 544 (100.0%) |
Real Estate Taxes by Mortgage Status in Bailey County
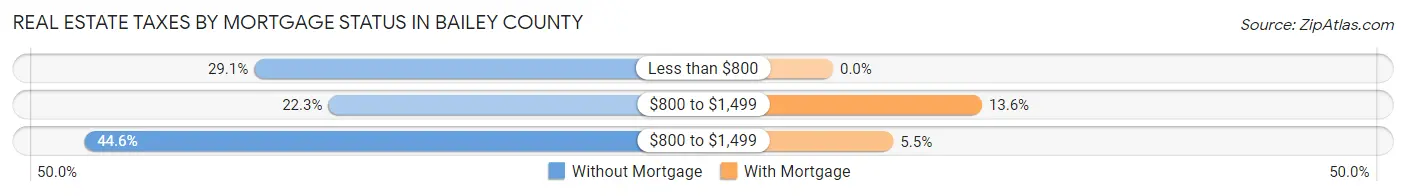
| Property Taxes | Without Mortgage | With Mortgage |
| Less than $800 | 253 (29.0%) | 0 (0.0%) |
| $800 to $1,499 | 194 (22.3%) | 74 (13.6%) |
| $800 to $1,499 | 388 (44.6%) | 30 (5.5%) |
| Total | 871 (100.0%) | 544 (100.0%) |
Health & Disability in Bailey County
Health Insurance Coverage by Age in Bailey County
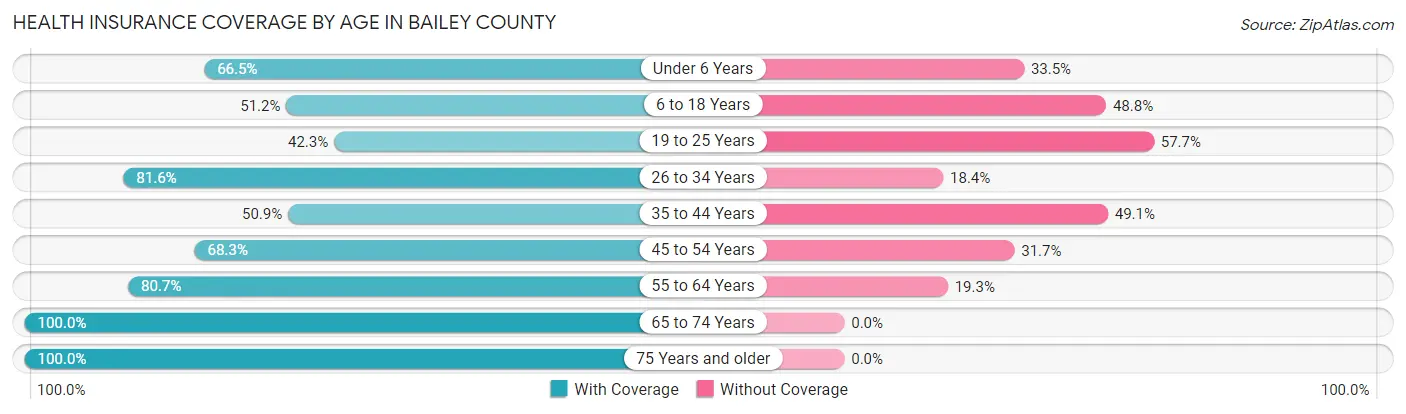
| Age Bracket | With Coverage | Without Coverage |
| Under 6 Years | 405 (66.5%) | 204 (33.5%) |
| 6 to 18 Years | 771 (51.2%) | 735 (48.8%) |
| 19 to 25 Years | 233 (42.3%) | 318 (57.7%) |
| 26 to 34 Years | 947 (81.6%) | 214 (18.4%) |
| 35 to 44 Years | 379 (50.9%) | 366 (49.1%) |
| 45 to 54 Years | 334 (68.3%) | 155 (31.7%) |
| 55 to 64 Years | 678 (80.7%) | 162 (19.3%) |
| 65 to 74 Years | 386 (100.0%) | 0 (0.0%) |
| 75 Years and older | 431 (100.0%) | 0 (0.0%) |
| Total | 4,564 (67.9%) | 2,154 (32.1%) |
Health Insurance Coverage by Citizenship Status in Bailey County
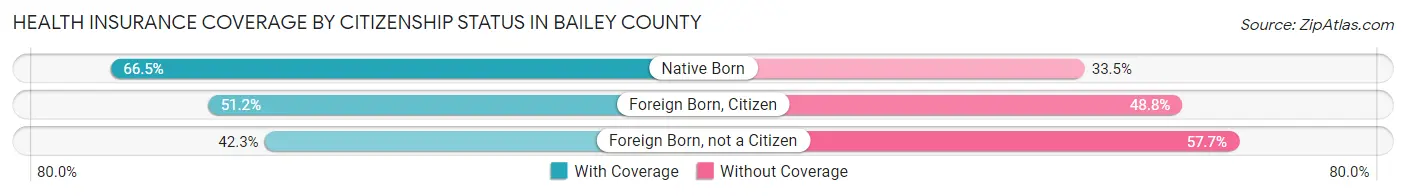
| Citizenship Status | With Coverage | Without Coverage |
| Native Born | 405 (66.5%) | 204 (33.5%) |
| Foreign Born, Citizen | 771 (51.2%) | 735 (48.8%) |
| Foreign Born, not a Citizen | 233 (42.3%) | 318 (57.7%) |
Health Insurance Coverage by Household Income in Bailey County
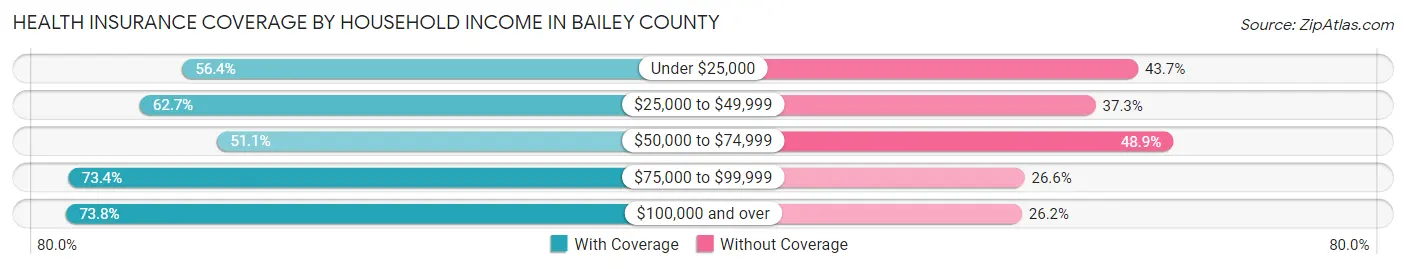
| Household Income | With Coverage | Without Coverage |
| Under $25,000 | 475 (56.4%) | 368 (43.6%) |
| $25,000 to $49,999 | 592 (62.7%) | 352 (37.3%) |
| $50,000 to $74,999 | 298 (51.1%) | 285 (48.9%) |
| $75,000 to $99,999 | 1,465 (73.4%) | 532 (26.6%) |
| $100,000 and over | 1,734 (73.8%) | 617 (26.2%) |
Public vs Private Health Insurance Coverage by Age in Bailey County
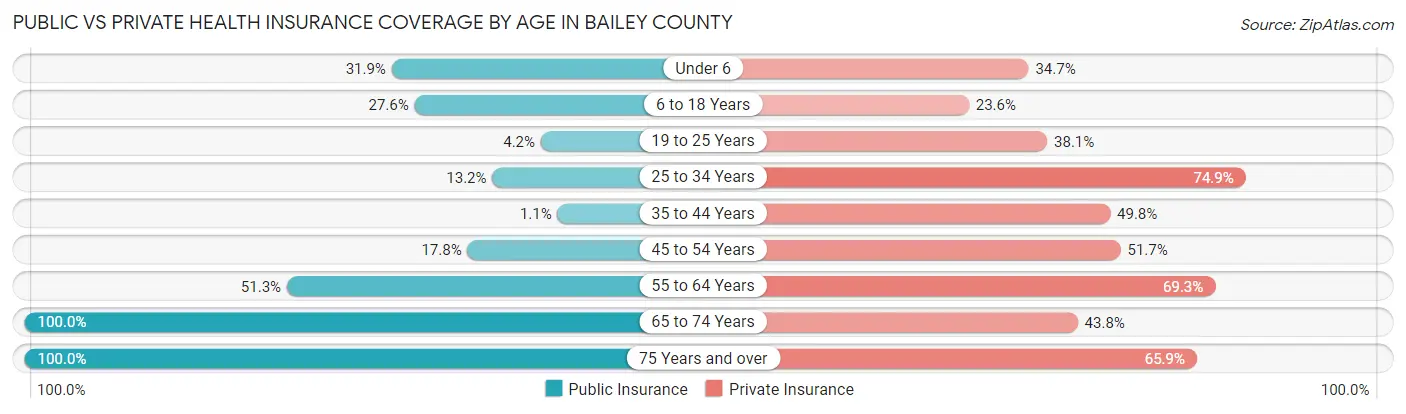
| Age Bracket | Public Insurance | Private Insurance |
| Under 6 | 194 (31.9%) | 211 (34.6%) |
| 6 to 18 Years | 416 (27.6%) | 355 (23.6%) |
| 19 to 25 Years | 23 (4.2%) | 210 (38.1%) |
| 25 to 34 Years | 153 (13.2%) | 870 (74.9%) |
| 35 to 44 Years | 8 (1.1%) | 371 (49.8%) |
| 45 to 54 Years | 87 (17.8%) | 253 (51.7%) |
| 55 to 64 Years | 431 (51.3%) | 582 (69.3%) |
| 65 to 74 Years | 386 (100.0%) | 169 (43.8%) |
| 75 Years and over | 431 (100.0%) | 284 (65.9%) |
| Total | 2,129 (31.7%) | 3,305 (49.2%) |
Disability Status by Sex by Age in Bailey County
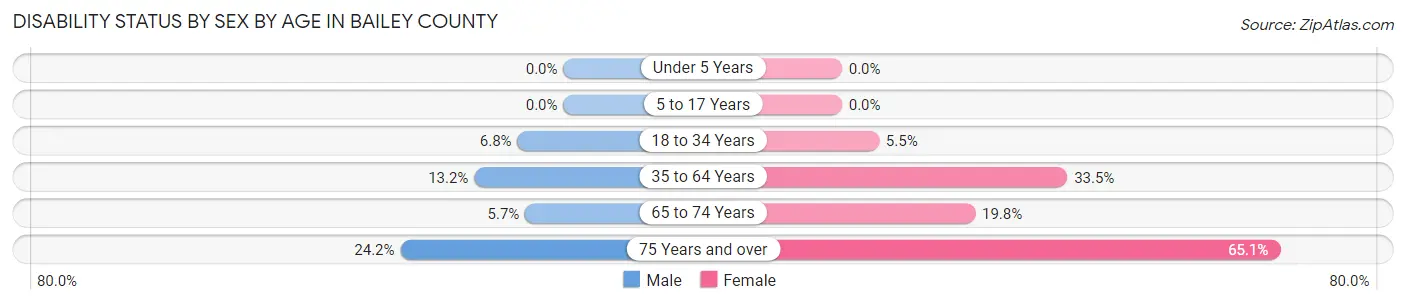
| Age Bracket | Male | Female |
| Under 5 Years | 0 (0.0%) | 0 (0.0%) |
| 5 to 17 Years | 0 (0.0%) | 0 (0.0%) |
| 18 to 34 Years | 70 (6.8%) | 52 (5.5%) |
| 35 to 64 Years | 118 (13.2%) | 396 (33.5%) |
| 65 to 74 Years | 11 (5.7%) | 38 (19.8%) |
| 75 Years and over | 53 (24.2%) | 138 (65.1%) |
Disability Class by Sex by Age in Bailey County
Disability Class: Hearing Difficulty
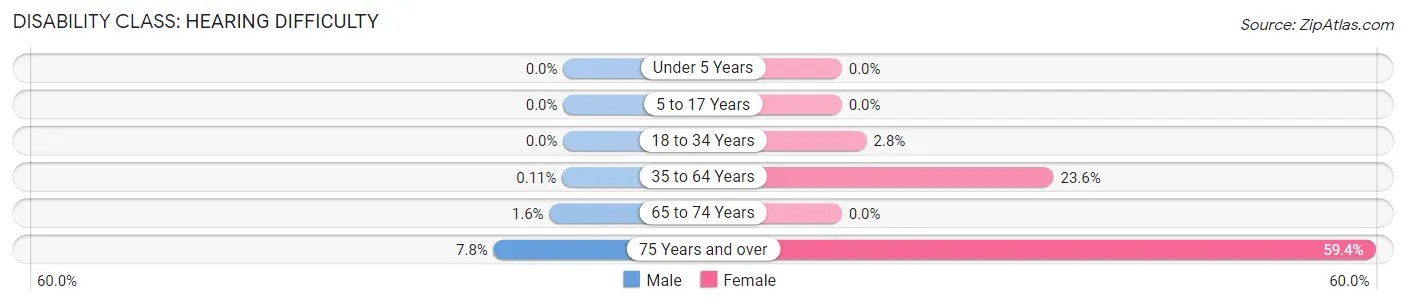
| Age Bracket | Male | Female |
| Under 5 Years | 0 (0.0%) | 0 (0.0%) |
| 5 to 17 Years | 0 (0.0%) | 0 (0.0%) |
| 18 to 34 Years | 0 (0.0%) | 26 (2.8%) |
| 35 to 64 Years | 1 (0.1%) | 279 (23.6%) |
| 65 to 74 Years | 3 (1.5%) | 0 (0.0%) |
| 75 Years and over | 17 (7.8%) | 126 (59.4%) |
Disability Class: Vision Difficulty
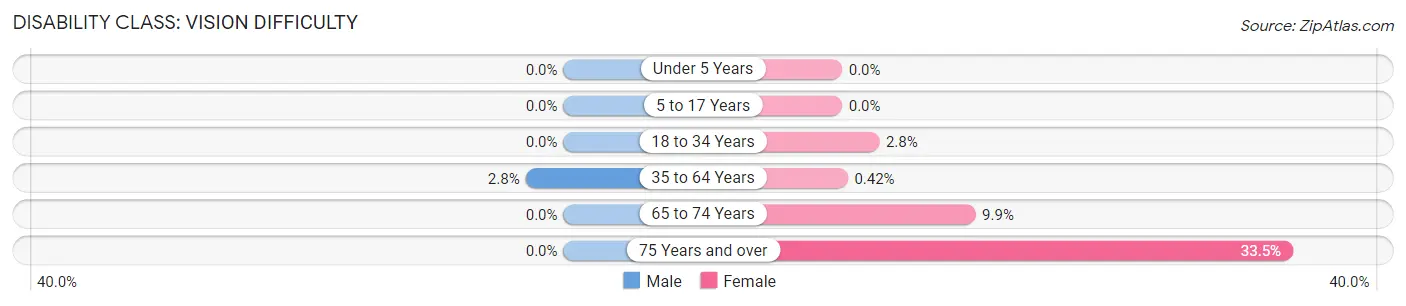
| Age Bracket | Male | Female |
| Under 5 Years | 0 (0.0%) | 0 (0.0%) |
| 5 to 17 Years | 0 (0.0%) | 0 (0.0%) |
| 18 to 34 Years | 0 (0.0%) | 26 (2.8%) |
| 35 to 64 Years | 25 (2.8%) | 5 (0.4%) |
| 65 to 74 Years | 0 (0.0%) | 19 (9.9%) |
| 75 Years and over | 0 (0.0%) | 71 (33.5%) |
Disability Class: Cognitive Difficulty
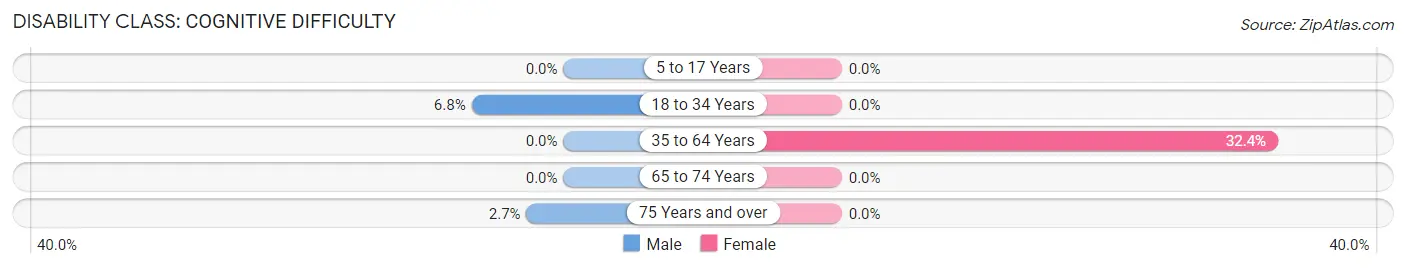
| Age Bracket | Male | Female |
| 5 to 17 Years | 0 (0.0%) | 0 (0.0%) |
| 18 to 34 Years | 70 (6.8%) | 0 (0.0%) |
| 35 to 64 Years | 0 (0.0%) | 383 (32.4%) |
| 65 to 74 Years | 0 (0.0%) | 0 (0.0%) |
| 75 Years and over | 6 (2.7%) | 0 (0.0%) |
Disability Class: Ambulatory Difficulty
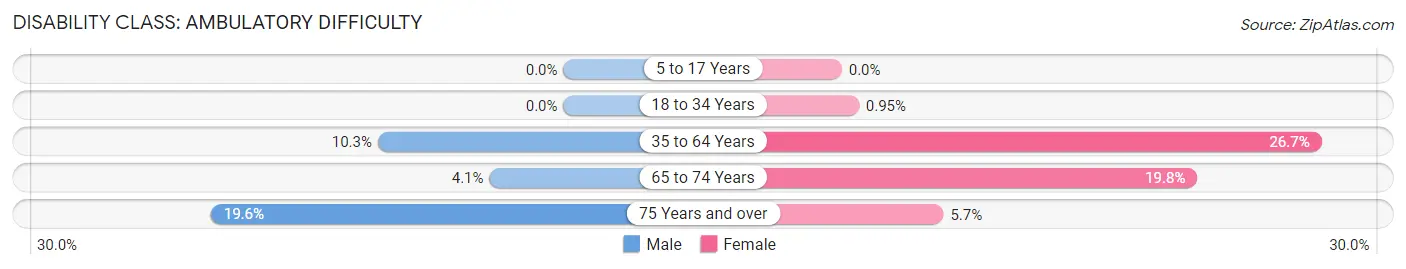
| Age Bracket | Male | Female |
| 5 to 17 Years | 0 (0.0%) | 0 (0.0%) |
| 18 to 34 Years | 0 (0.0%) | 9 (0.9%) |
| 35 to 64 Years | 92 (10.3%) | 316 (26.7%) |
| 65 to 74 Years | 8 (4.1%) | 38 (19.8%) |
| 75 Years and over | 43 (19.6%) | 12 (5.7%) |
Disability Class: Self-Care Difficulty
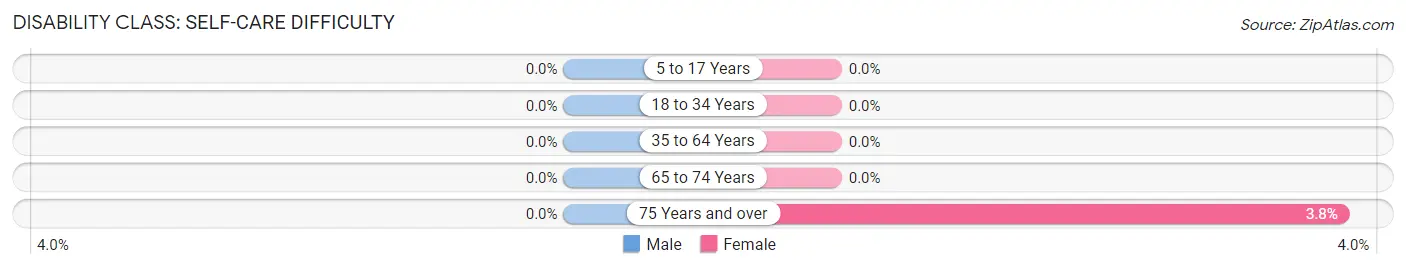
| Age Bracket | Male | Female |
| 5 to 17 Years | 0 (0.0%) | 0 (0.0%) |
| 18 to 34 Years | 0 (0.0%) | 0 (0.0%) |
| 35 to 64 Years | 0 (0.0%) | 0 (0.0%) |
| 65 to 74 Years | 0 (0.0%) | 0 (0.0%) |
| 75 Years and over | 0 (0.0%) | 8 (3.8%) |
Technology Access in Bailey County
Computing Device Access in Bailey County
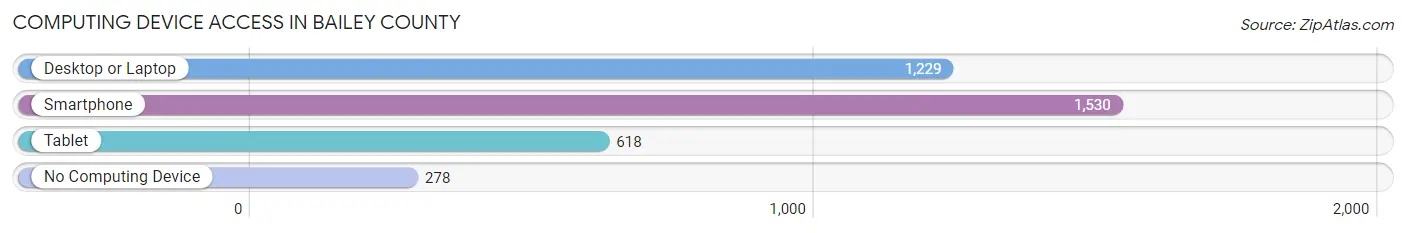
| Device Type | # Households | % Households |
| Desktop or Laptop | 1,229 | 63.6% |
| Smartphone | 1,530 | 79.1% |
| Tablet | 618 | 32.0% |
| No Computing Device | 278 | 14.4% |
| Total | 1,933 | 100.0% |
Internet Access in Bailey County
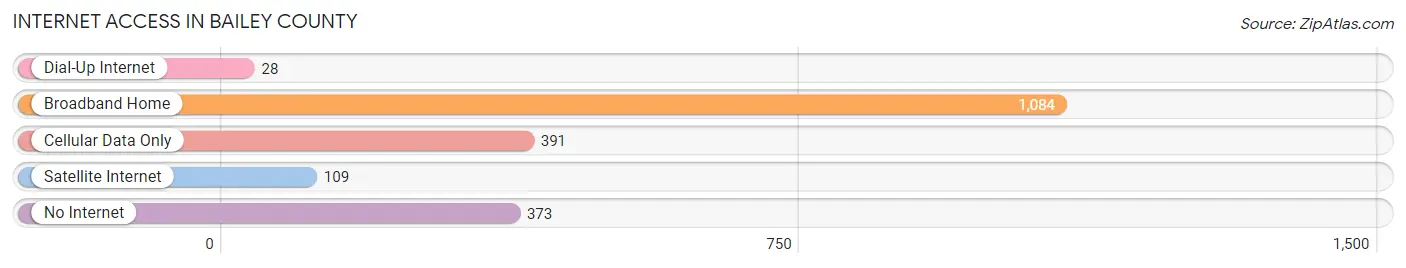
| Internet Type | # Households | % Households |
| Dial-Up Internet | 28 | 1.5% |
| Broadband Home | 1,084 | 56.1% |
| Cellular Data Only | 391 | 20.2% |
| Satellite Internet | 109 | 5.6% |
| No Internet | 373 | 19.3% |
| Total | 1,933 | 100.0% |
Bailey County Summary
Bailey County is located in the northwestern corner of Texas, and is bordered by Lamb County to the north, Parmer County to the east, Cochran County to the south, and New Mexico to the west. The county seat is Muleshoe, and the county was named for Peter James Bailey, a Confederate soldier who died in the Civil War.
Geography
Bailey County covers an area of 902 square miles, and is mostly flat, with some rolling hills in the western part of the county. The terrain is mostly covered in grasslands, with some areas of mesquite and cactus. The county is drained by the Salt Fork of the Brazos River, which flows through the center of the county. The county is also home to several small lakes, including Lake Muleshoe, which is located in the western part of the county.
Climate
Bailey County has a semi-arid climate, with hot summers and mild winters. The average annual temperature is around 65°F, and the average annual precipitation is around 17 inches.
Demographics
As of the 2010 census, there were 7,165 people, 2,541 households, and 1,845 families living in Bailey County. The population density was 8 people per square mile. The racial makeup of the county was 75.3% White, 0.7% African American, 0.7% Native American, 0.3% Asian, 0.1% Pacific Islander, 20.7% from other races, and 2.1% from two or more races. Hispanic or Latino of any race were 43.3% of the population.
The median income for a household in the county was $31,944, and the median income for a family was $37,813. The per capita income for the county was $14,945. About 18.2% of families and 22.2% of the population were below the poverty line, including 28.2% of those under age 18 and 16.2% of those age 65 or over.
Economy
Agriculture is the main economic activity in Bailey County, with cotton, wheat, and sorghum being the main crops. Cattle ranching is also an important part of the economy, and the county is home to several large ranches. The county is also home to several oil and gas fields, and the oil and gas industry is an important part of the local economy.
In addition to agriculture and oil and gas, Bailey County is home to several manufacturing companies, including a plastics plant and a food processing plant. The county is also home to several retail stores, restaurants, and other businesses.
Conclusion
Bailey County is a rural county located in the northwestern corner of Texas. The county is mostly flat, with some rolling hills in the western part of the county. Agriculture is the main economic activity in the county, with cotton, wheat, and sorghum being the main crops. The county is also home to several oil and gas fields, and the oil and gas industry is an important part of the local economy. The county is also home to several manufacturing companies, retail stores, restaurants, and other businesses. As of the 2010 census, the population of Bailey County was 7,165.
Common Questions
What is Per Capita Income in Bailey County?
Per Capita income in Bailey County is $29,674.
What is the Median Family Income in Bailey County?
Median Family Income in Bailey County is $81,536.
What is the Median Household income in Bailey County?
Median Household Income in Bailey County is $69,830.
What is Income or Wage Gap in Bailey County?
Income or Wage Gap in Bailey County is 35.7%.
Women in Bailey County earn 64.3 cents for every dollar earned by a man.
What is Inequality or Gini Index in Bailey County?
Inequality or Gini Index in Bailey County is 0.44.
What is the Total Population of Bailey County?
Total Population of Bailey County is 6,902.
What is the Total Male Population of Bailey County?
Total Male Population of Bailey County is 3,287.
What is the Total Female Population of Bailey County?
Total Female Population of Bailey County is 3,615.
What is the Ratio of Males per 100 Females in Bailey County?
There are 90.93 Males per 100 Females in Bailey County.
What is the Ratio of Females per 100 Males in Bailey County?
There are 109.98 Females per 100 Males in Bailey County.
What is the Median Population Age in Bailey County?
Median Population Age in Bailey County is 30.3 Years.
What is the Average Family Size in Bailey County
Average Family Size in Bailey County is 4.0 People.
What is the Average Household Size in Bailey County
Average Household Size in Bailey County is 3.5 People.
How Large is the Labor Force in Bailey County?
There are 3,052 People in the Labor Forcein in Bailey County.
What is the Percentage of People in the Labor Force in Bailey County?
57.9% of People are in the Labor Force in Bailey County.
What is the Unemployment Rate in Bailey County?
Unemployment Rate in Bailey County is 2.1%.