Austin County, TX Map & Demographics
Austin County Map
Austin County Overview
$36,399
PER CAPITA INCOME
$87,105
AVG FAMILY INCOME
$73,556
AVG HOUSEHOLD INCOME
44.2%
WAGE / INCOME GAP [ % ]
55.8¢/ $1
WAGE / INCOME GAP [ $ ]
$10,222
FAMILY INCOME DEFICIT
0.42
INEQUALITY / GINI INDEX
30,406
TOTAL POPULATION
15,298
MALE POPULATION
15,108
FEMALE POPULATION
101.26
MALES / 100 FEMALES
98.76
FEMALES / 100 MALES
41.0
MEDIAN AGE
2.9
AVG FAMILY SIZE
2.5
AVG HOUSEHOLD SIZE
15,134
LABOR FORCE [ PEOPLE ]
62.9%
PERCENT IN LABOR FORCE
3.8%
UNEMPLOYMENT RATE
Income in Austin County
Income Overview in Austin County
Per Capita Income in Austin County is $36,399, while median incomes of families and households are $87,105 and $73,556 respectively.
| Characteristic | Number | Measure |
| Per Capita Income | 30,406 | $36,399 |
| Median Family Income | 9,023 | $87,105 |
| Mean Family Income | 9,023 | $101,392 |
| Median Household Income | 11,913 | $73,556 |
| Mean Household Income | 11,913 | $92,446 |
| Income Deficit | 9,023 | $10,222 |
| Wage / Income Gap (%) | 30,406 | 44.19% |
| Wage / Income Gap ($) | 30,406 | 55.81¢ per $1 |
| Gini / Inequality Index | 30,406 | 0.42 |
Earnings by Sex in Austin County
Average Earnings in Austin County are $41,364, $54,260 for men and $30,280 for women, a difference of 44.2%.
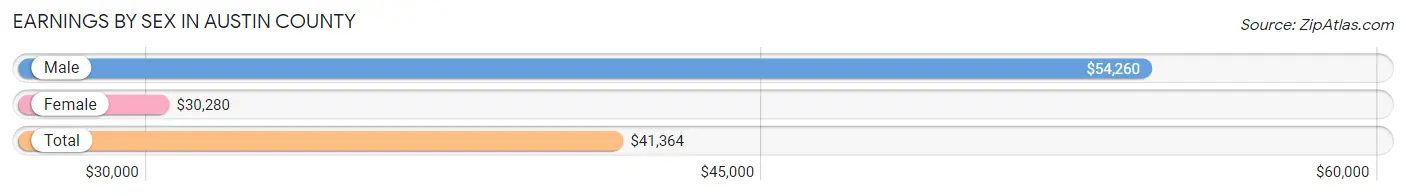
| Sex | Number | Average Earnings |
| Male | 8,481 (54.3%) | $54,260 |
| Female | 7,150 (45.7%) | $30,280 |
| Total | 15,631 (100.0%) | $41,364 |
Earnings by Sex by Income Bracket in Austin County
The most common earnings brackets in Austin County are $100,000+ for men (1,718 | 20.3%) and $100,000+ for women (554 | 7.7%).
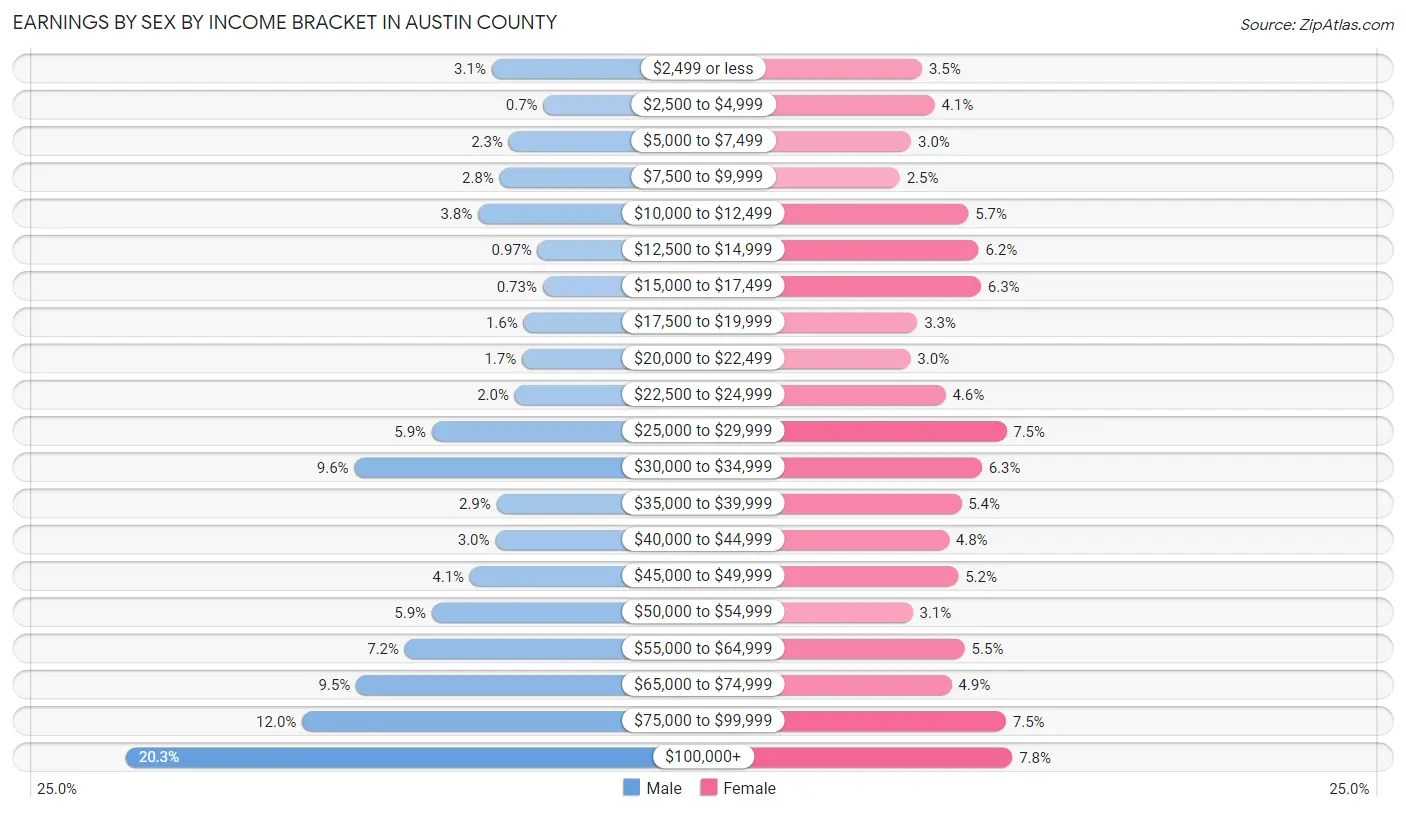
| Income | Male | Female |
| $2,499 or less | 265 (3.1%) | 252 (3.5%) |
| $2,500 to $4,999 | 59 (0.7%) | 294 (4.1%) |
| $5,000 to $7,499 | 197 (2.3%) | 215 (3.0%) |
| $7,500 to $9,999 | 233 (2.8%) | 177 (2.5%) |
| $10,000 to $12,499 | 319 (3.8%) | 407 (5.7%) |
| $12,500 to $14,999 | 82 (1.0%) | 441 (6.2%) |
| $15,000 to $17,499 | 62 (0.7%) | 449 (6.3%) |
| $17,500 to $19,999 | 138 (1.6%) | 236 (3.3%) |
| $20,000 to $22,499 | 144 (1.7%) | 213 (3.0%) |
| $22,500 to $24,999 | 173 (2.0%) | 330 (4.6%) |
| $25,000 to $29,999 | 502 (5.9%) | 534 (7.5%) |
| $30,000 to $34,999 | 810 (9.6%) | 452 (6.3%) |
| $35,000 to $39,999 | 245 (2.9%) | 383 (5.4%) |
| $40,000 to $44,999 | 250 (2.9%) | 342 (4.8%) |
| $45,000 to $49,999 | 351 (4.1%) | 373 (5.2%) |
| $50,000 to $54,999 | 502 (5.9%) | 220 (3.1%) |
| $55,000 to $64,999 | 610 (7.2%) | 395 (5.5%) |
| $65,000 to $74,999 | 803 (9.5%) | 350 (4.9%) |
| $75,000 to $99,999 | 1,018 (12.0%) | 533 (7.4%) |
| $100,000+ | 1,718 (20.3%) | 554 (7.7%) |
| Total | 8,481 (100.0%) | 7,150 (100.0%) |
Earnings by Sex by Educational Attainment in Austin County
Average earnings in Austin County are $59,391 for men and $34,955 for women, a difference of 41.1%. Men with an educational attainment of graduate degree enjoy the highest average annual earnings of $111,719, while those with less than high school education earn the least with $34,156. Women with an educational attainment of graduate degree earn the most with the average annual earnings of $67,500, while those with less than high school education have the smallest earnings of $19,288.
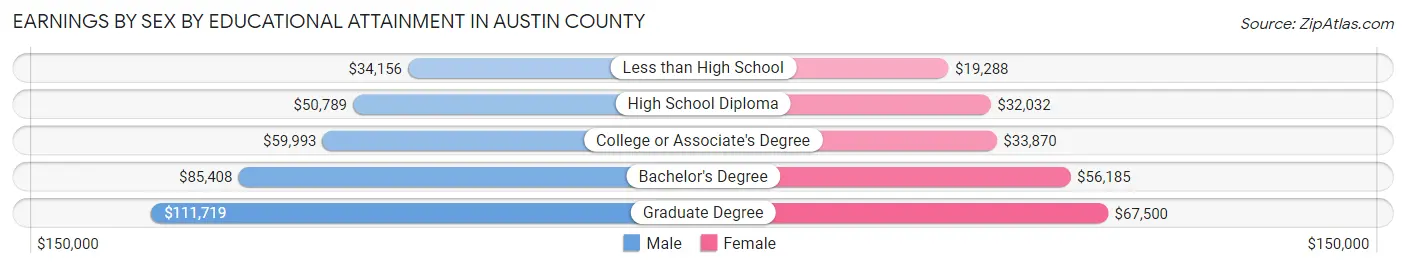
| Educational Attainment | Male Income | Female Income |
| Less than High School | $34,156 | $19,288 |
| High School Diploma | $50,789 | $32,032 |
| College or Associate's Degree | $59,993 | $33,870 |
| Bachelor's Degree | $85,408 | $56,185 |
| Graduate Degree | $111,719 | $67,500 |
| Total | $59,391 | $34,955 |
Family Income in Austin County
Family Income Brackets in Austin County
According to the Austin County family income data, there are 1,931 families falling into the $100,000 to $149,999 income range, which is the most common income bracket and makes up 21.4% of all families. Conversely, the $10,000 to $14,999 income bracket is the least frequent group with only 162 families (1.8%) belonging to this category.
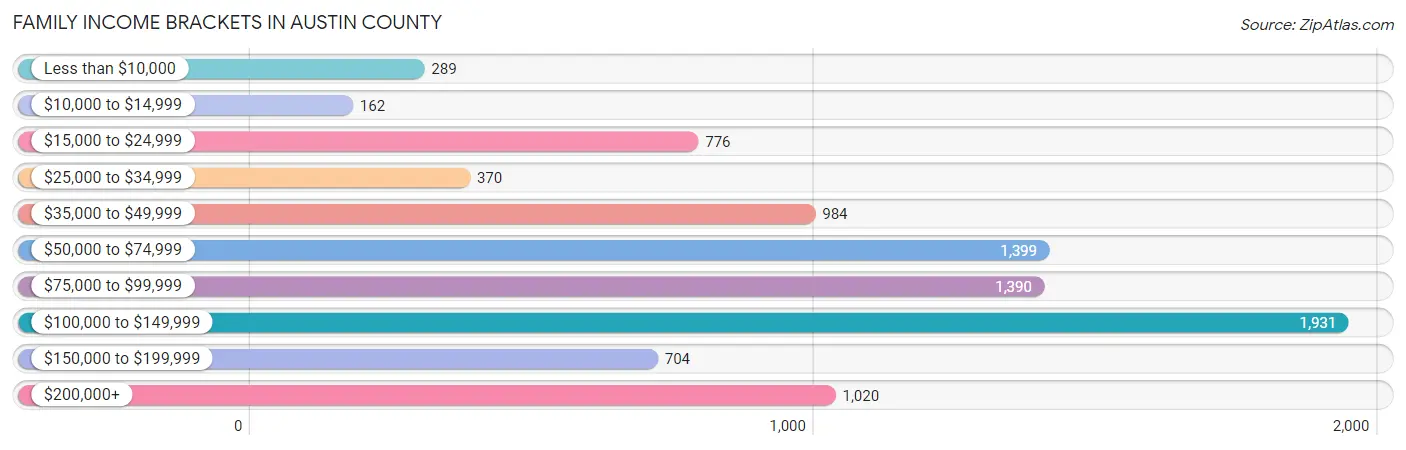
| Income Bracket | # Families | % Families |
| Less than $10,000 | 289 | 3.2% |
| $10,000 to $14,999 | 162 | 1.8% |
| $15,000 to $24,999 | 776 | 8.6% |
| $25,000 to $34,999 | 370 | 4.1% |
| $35,000 to $49,999 | 984 | 10.9% |
| $50,000 to $74,999 | 1,399 | 15.5% |
| $75,000 to $99,999 | 1,390 | 15.4% |
| $100,000 to $149,999 | 1,931 | 21.4% |
| $150,000 to $199,999 | 704 | 7.8% |
| $200,000+ | 1,020 | 11.3% |
Family Income by Famaliy Size in Austin County
6-person families (363 | 4.0%) account for the highest median family income in Austin County with $98,396 per family, while 2-person families (4,546 | 50.4%) have the highest median income of $39,981 per family member.
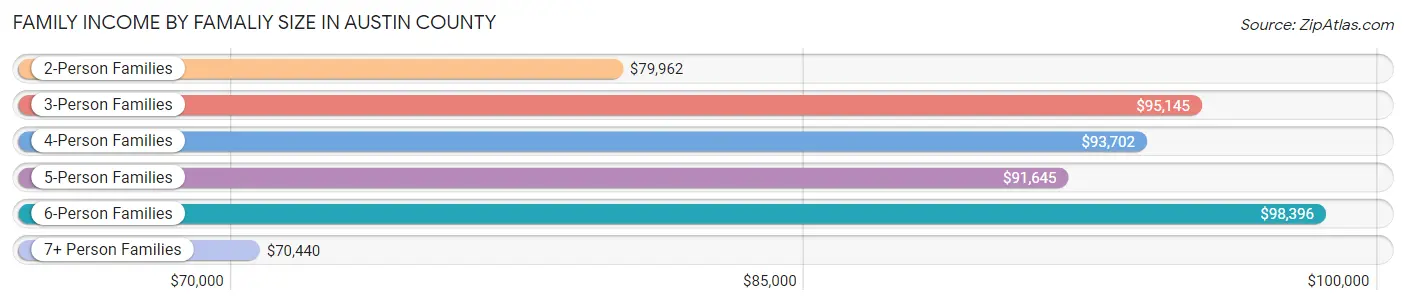
| Income Bracket | # Families | Median Income |
| 2-Person Families | 4,546 (50.4%) | $79,962 |
| 3-Person Families | 1,570 (17.4%) | $95,145 |
| 4-Person Families | 1,653 (18.3%) | $93,702 |
| 5-Person Families | 736 (8.2%) | $91,645 |
| 6-Person Families | 363 (4.0%) | $98,396 |
| 7+ Person Families | 155 (1.7%) | $70,440 |
| Total | 9,023 (100.0%) | $87,105 |
Family Income by Number of Earners in Austin County
The median family income in Austin County is $87,105, with families comprising 3+ earners (940) having the highest median family income of $115,167, while families with no earners (1,404) have the lowest median family income of $41,023, accounting for 10.4% and 15.6% of families, respectively.
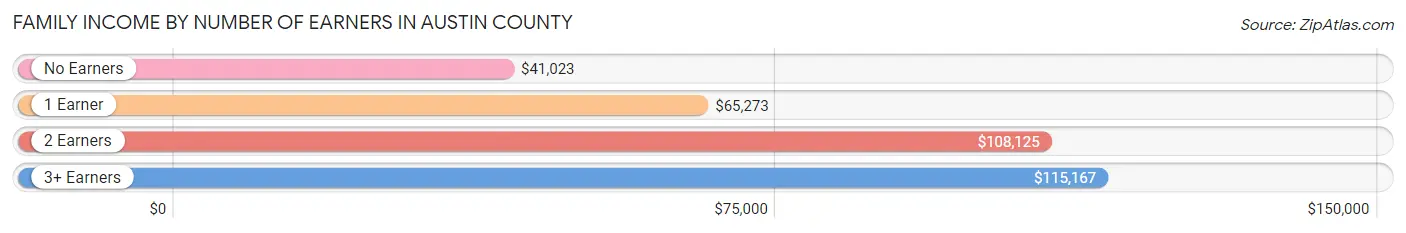
| Number of Earners | # Families | Median Income |
| No Earners | 1,404 (15.6%) | $41,023 |
| 1 Earner | 2,990 (33.1%) | $65,273 |
| 2 Earners | 3,689 (40.9%) | $108,125 |
| 3+ Earners | 940 (10.4%) | $115,167 |
| Total | 9,023 (100.0%) | $87,105 |
Household Income in Austin County
Household Income Brackets in Austin County
With 2,156 households falling in the category, the $100,000 to $149,999 income range is the most frequent in Austin County, accounting for 18.1% of all households. In contrast, only 357 households (3.0%) fall into the less than $10,000 income bracket, making it the least populous group.
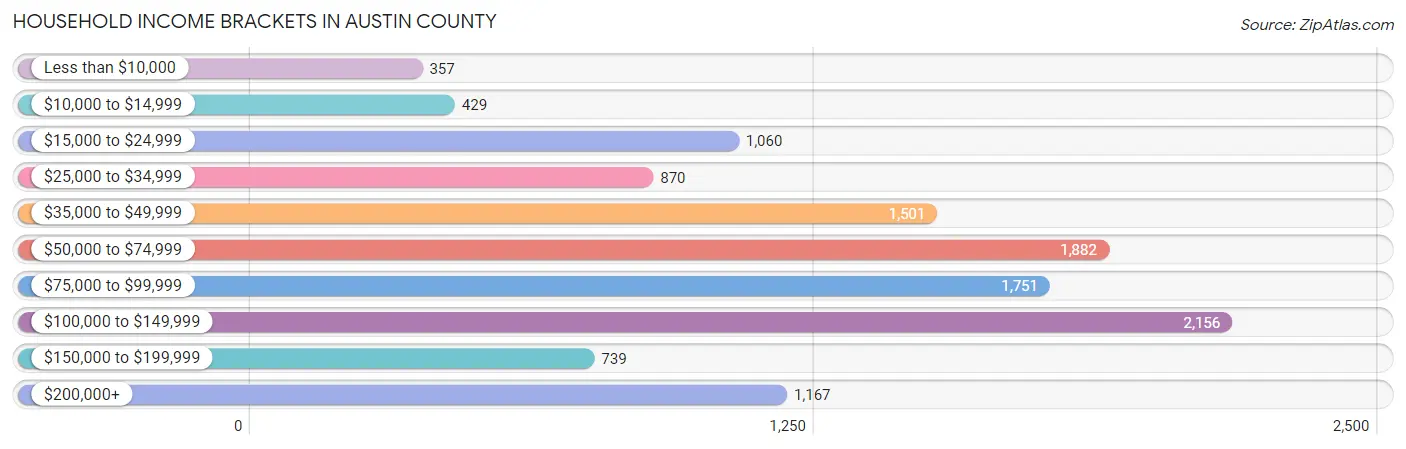
| Income Bracket | # Households | % Households |
| Less than $10,000 | 357 | 3.0% |
| $10,000 to $14,999 | 429 | 3.6% |
| $15,000 to $24,999 | 1,060 | 8.9% |
| $25,000 to $34,999 | 870 | 7.3% |
| $35,000 to $49,999 | 1,501 | 12.6% |
| $50,000 to $74,999 | 1,882 | 15.8% |
| $75,000 to $99,999 | 1,751 | 14.7% |
| $100,000 to $149,999 | 2,156 | 18.1% |
| $150,000 to $199,999 | 739 | 6.2% |
| $200,000+ | 1,167 | 9.8% |
Household Income by Householder Age in Austin County
The median household income in Austin County is $73,556, with the highest median household income of $84,017 found in the 25 to 44 years age bracket for the primary householder. A total of 3,689 households (31.0%) fall into this category. Meanwhile, the 15 to 24 years age bracket for the primary householder has the lowest median household income of $0, with 259 households (2.2%) in this group.
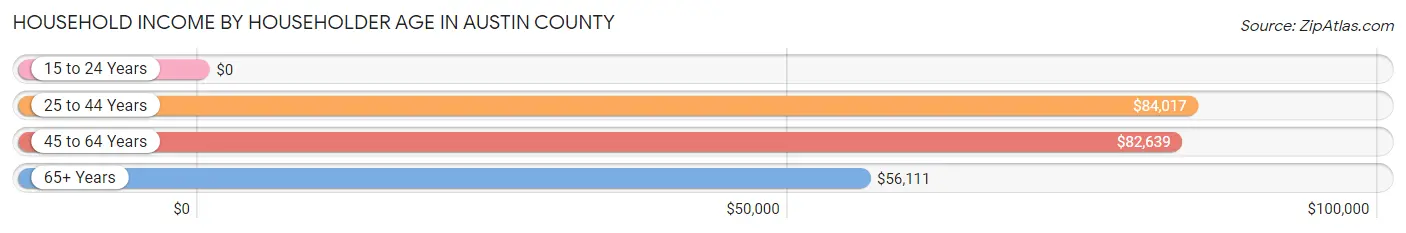
| Income Bracket | # Households | Median Income |
| 15 to 24 Years | 259 (2.2%) | $0 |
| 25 to 44 Years | 3,689 (31.0%) | $84,017 |
| 45 to 64 Years | 4,389 (36.8%) | $82,639 |
| 65+ Years | 3,576 (30.0%) | $56,111 |
| Total | 11,913 (100.0%) | $73,556 |
Poverty in Austin County
Income Below Poverty by Sex and Age in Austin County
With 10.6% poverty level for males and 13.3% for females among the residents of Austin County, under 5 year old males and 5 year old females are the most vulnerable to poverty, with 256 males (28.1%) and 34 females (39.5%) in their respective age groups living below the poverty level.
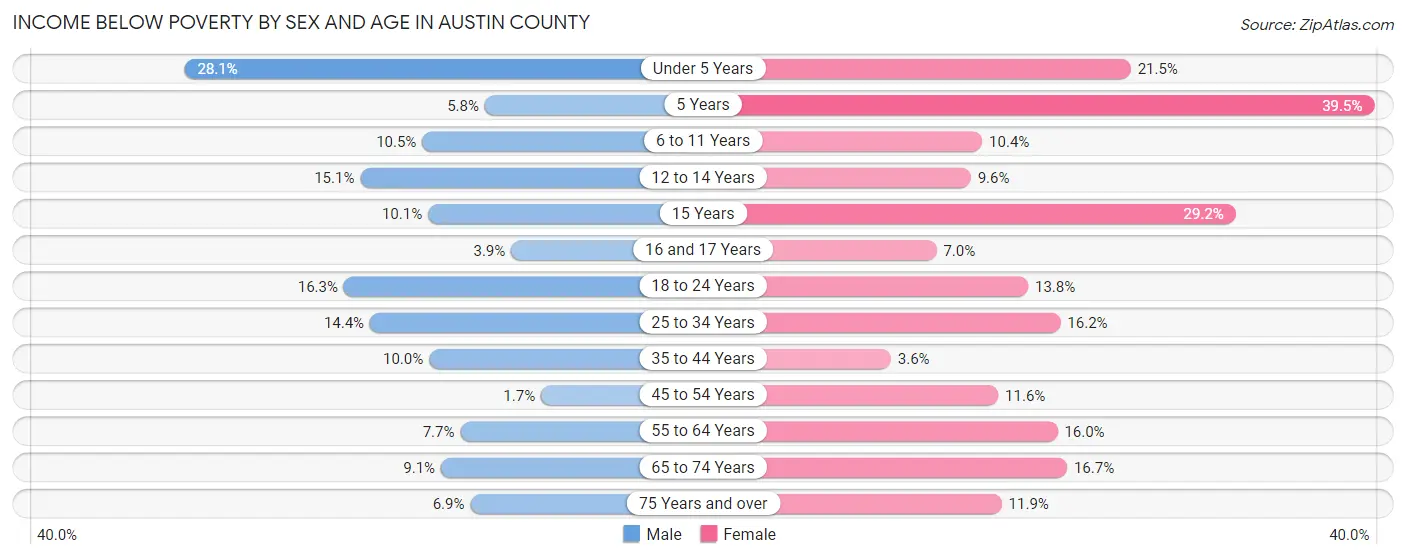
| Age Bracket | Male | Female |
| Under 5 Years | 256 (28.1%) | 151 (21.4%) |
| 5 Years | 7 (5.8%) | 34 (39.5%) |
| 6 to 11 Years | 145 (10.5%) | 117 (10.4%) |
| 12 to 14 Years | 98 (15.1%) | 80 (9.6%) |
| 15 Years | 21 (10.1%) | 69 (29.2%) |
| 16 and 17 Years | 15 (3.9%) | 30 (7.0%) |
| 18 to 24 Years | 184 (16.3%) | 157 (13.8%) |
| 25 to 34 Years | 261 (14.4%) | 281 (16.2%) |
| 35 to 44 Years | 188 (10.0%) | 60 (3.6%) |
| 45 to 54 Years | 27 (1.7%) | 208 (11.6%) |
| 55 to 64 Years | 165 (7.6%) | 347 (16.0%) |
| 65 to 74 Years | 160 (9.1%) | 310 (16.7%) |
| 75 Years and over | 74 (6.9%) | 148 (11.9%) |
| Total | 1,601 (10.6%) | 1,992 (13.3%) |
Income Above Poverty by Sex and Age in Austin County
According to the poverty statistics in Austin County, males aged 45 to 54 years and females aged 35 to 44 years are the age groups that are most secure financially, with 98.3% of males and 96.4% of females in these age groups living above the poverty line.
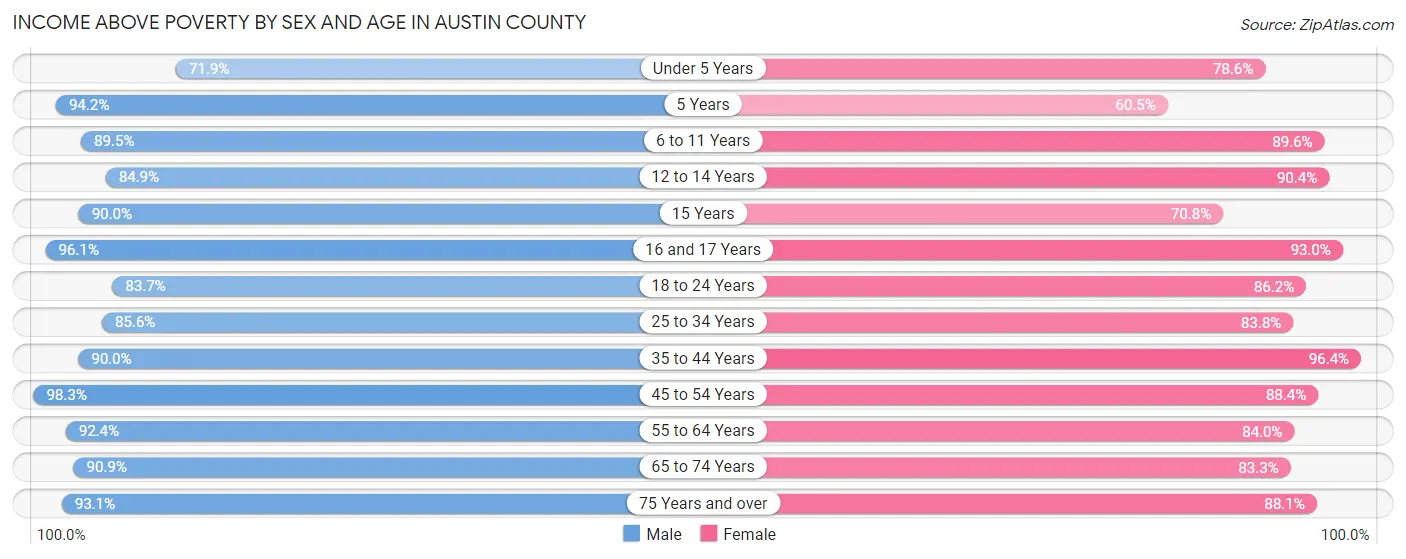
| Age Bracket | Male | Female |
| Under 5 Years | 654 (71.9%) | 553 (78.5%) |
| 5 Years | 113 (94.2%) | 52 (60.5%) |
| 6 to 11 Years | 1,238 (89.5%) | 1,006 (89.6%) |
| 12 to 14 Years | 552 (84.9%) | 756 (90.4%) |
| 15 Years | 188 (89.9%) | 167 (70.8%) |
| 16 and 17 Years | 372 (96.1%) | 397 (93.0%) |
| 18 to 24 Years | 945 (83.7%) | 978 (86.2%) |
| 25 to 34 Years | 1,556 (85.6%) | 1,450 (83.8%) |
| 35 to 44 Years | 1,698 (90.0%) | 1,589 (96.4%) |
| 45 to 54 Years | 1,601 (98.3%) | 1,584 (88.4%) |
| 55 to 64 Years | 1,991 (92.3%) | 1,820 (84.0%) |
| 65 to 74 Years | 1,600 (90.9%) | 1,544 (83.3%) |
| 75 Years and over | 997 (93.1%) | 1,099 (88.1%) |
| Total | 13,505 (89.4%) | 12,995 (86.7%) |
Income Below Poverty Among Married-Couple Families in Austin County
The poverty statistics for married-couple families in Austin County show that 4.0% or 279 of the total 6,965 families live below the poverty line. Families with 3 or 4 children have the highest poverty rate of 7.7%, comprising of 55 families. On the other hand, families with 5 or more children have the lowest poverty rate of 0.0%, which includes 0 families.
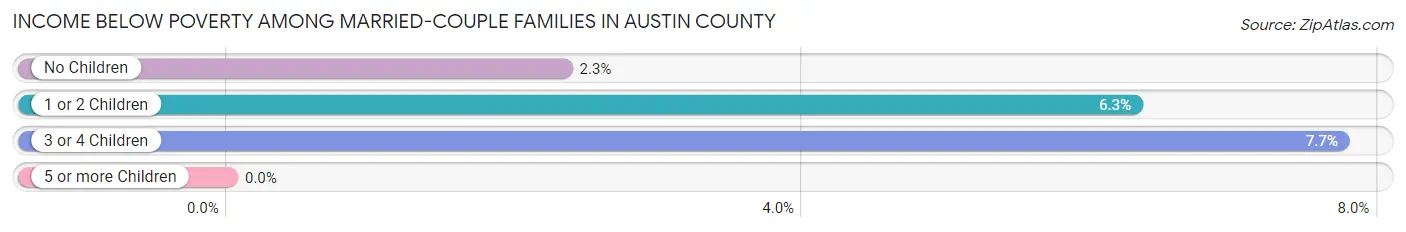
| Children | Above Poverty | Below Poverty |
| No Children | 4,073 (97.7%) | 97 (2.3%) |
| 1 or 2 Children | 1,889 (93.7%) | 127 (6.3%) |
| 3 or 4 Children | 656 (92.3%) | 55 (7.7%) |
| 5 or more Children | 68 (100.0%) | 0 (0.0%) |
| Total | 6,686 (96.0%) | 279 (4.0%) |
Income Below Poverty Among Single-Parent Households in Austin County
According to the poverty data in Austin County, 37.8% or 273 single-father households and 36.1% or 483 single-mother households are living below the poverty line. Among single-father households, those with 3 or 4 children have the highest poverty rate, with 137 households (95.1%) experiencing poverty. Likewise, among single-mother households, those with 3 or 4 children have the highest poverty rate, with 114 households (64.0%) falling below the poverty line.
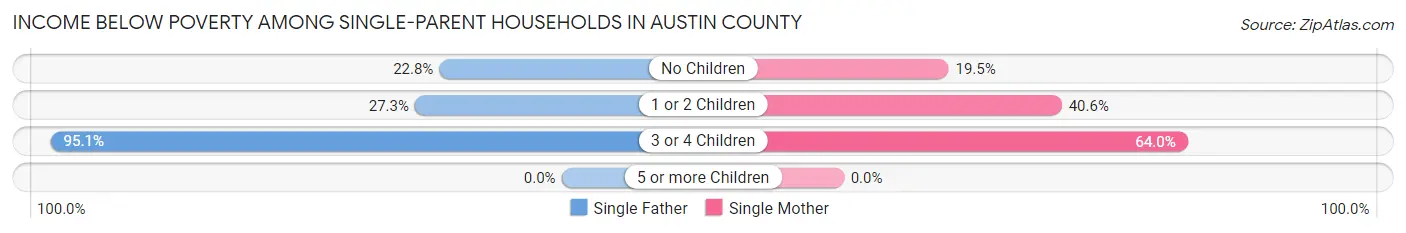
| Children | Single Father | Single Mother |
| No Children | 36 (22.8%) | 94 (19.5%) |
| 1 or 2 Children | 100 (27.3%) | 275 (40.6%) |
| 3 or 4 Children | 137 (95.1%) | 114 (64.0%) |
| 5 or more Children | 0 (0.0%) | 0 (0.0%) |
| Total | 273 (37.8%) | 483 (36.1%) |
Income Below Poverty Among Married-Couple vs Single-Parent Households in Austin County
The poverty data for Austin County shows that 279 of the married-couple family households (4.0%) and 756 of the single-parent households (36.7%) are living below the poverty level. Within the married-couple family households, those with 3 or 4 children have the highest poverty rate, with 55 households (7.7%) falling below the poverty line. Among the single-parent households, those with 3 or 4 children have the highest poverty rate, with 251 household (77.9%) living below poverty.
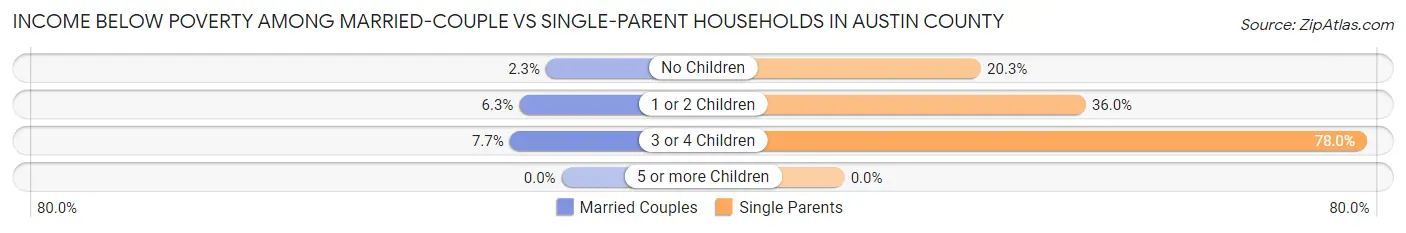
| Children | Married-Couple Families | Single-Parent Households |
| No Children | 97 (2.3%) | 130 (20.3%) |
| 1 or 2 Children | 127 (6.3%) | 375 (35.9%) |
| 3 or 4 Children | 55 (7.7%) | 251 (77.9%) |
| 5 or more Children | 0 (0.0%) | 0 (0.0%) |
| Total | 279 (4.0%) | 756 (36.7%) |
Race in Austin County
The most populous races in Austin County are White / Caucasian (22,162 | 72.9%), Hispanic or Latino (8,572 | 28.2%), and Some other Race (3,562 | 11.7%).
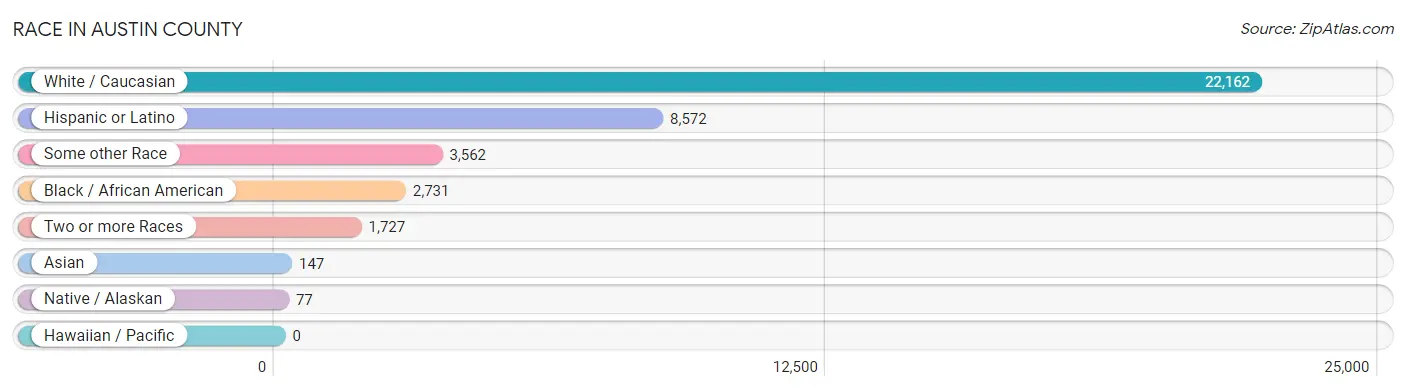
| Race | # Population | % Population |
| Asian | 147 | 0.5% |
| Black / African American | 2,731 | 9.0% |
| Hawaiian / Pacific | 0 | 0.0% |
| Hispanic or Latino | 8,572 | 28.2% |
| Native / Alaskan | 77 | 0.3% |
| White / Caucasian | 22,162 | 72.9% |
| Two or more Races | 1,727 | 5.7% |
| Some other Race | 3,562 | 11.7% |
| Total | 30,406 | 100.0% |
Ancestry in Austin County
The most populous ancestries reported in Austin County are Mexican (7,686 | 25.3%), German (5,823 | 19.2%), English (2,487 | 8.2%), Czech (1,980 | 6.5%), and Irish (1,730 | 5.7%), together accounting for 64.8% of all Austin County residents.
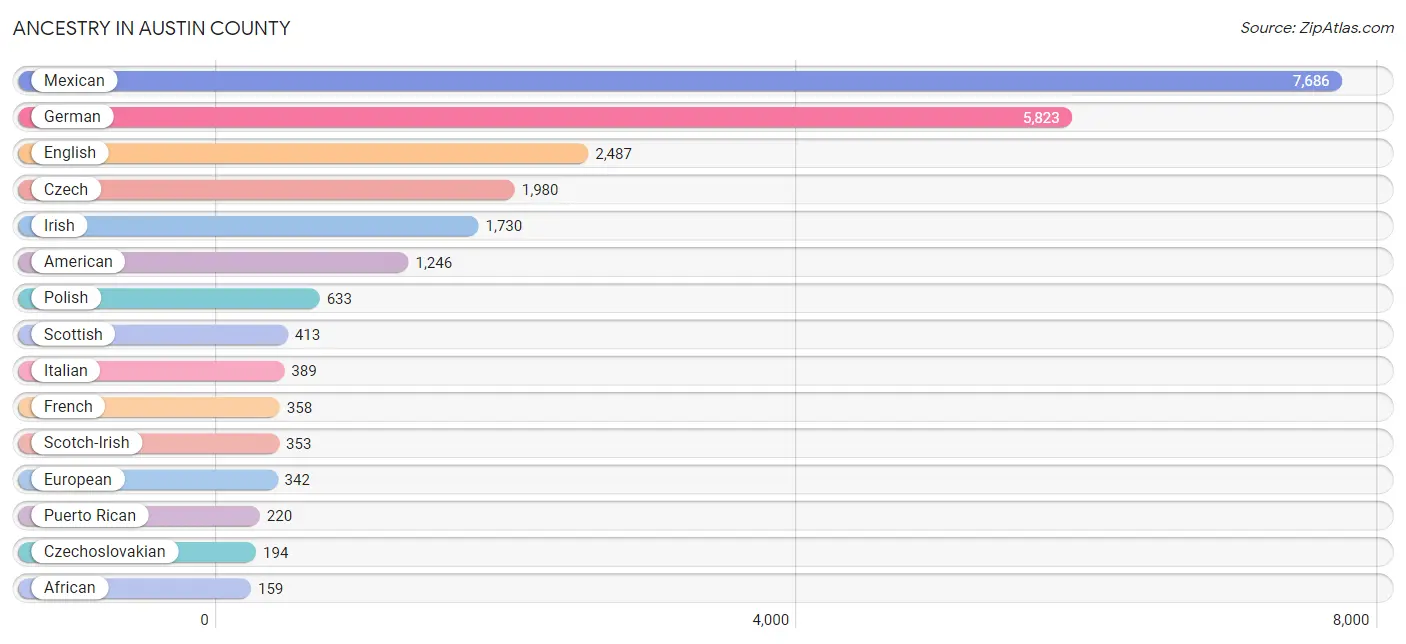
| Ancestry | # Population | % Population |
| African | 159 | 0.5% |
| American | 1,246 | 4.1% |
| Apache | 16 | 0.1% |
| Arab | 1 | 0.0% |
| Basque | 1 | 0.0% |
| Belgian | 12 | 0.0% |
| Bhutanese | 84 | 0.3% |
| British | 82 | 0.3% |
| Burmese | 41 | 0.1% |
| Canadian | 110 | 0.4% |
| Central American | 144 | 0.5% |
| Cherokee | 134 | 0.4% |
| Choctaw | 52 | 0.2% |
| Colombian | 8 | 0.0% |
| Creek | 10 | 0.0% |
| Croatian | 17 | 0.1% |
| Cuban | 31 | 0.1% |
| Czech | 1,980 | 6.5% |
| Czechoslovakian | 194 | 0.6% |
| Danish | 28 | 0.1% |
| Dutch | 77 | 0.3% |
| Eastern European | 5 | 0.0% |
| English | 2,487 | 8.2% |
| European | 342 | 1.1% |
| French | 358 | 1.2% |
| French Canadian | 87 | 0.3% |
| German | 5,823 | 19.2% |
| Greek | 59 | 0.2% |
| Guatemalan | 1 | 0.0% |
| Honduran | 67 | 0.2% |
| Hungarian | 16 | 0.1% |
| Iranian | 103 | 0.3% |
| Irish | 1,730 | 5.7% |
| Italian | 389 | 1.3% |
| Lithuanian | 14 | 0.1% |
| Mexican | 7,686 | 25.3% |
| Mexican American Indian | 43 | 0.1% |
| Native Hawaiian | 30 | 0.1% |
| Norwegian | 59 | 0.2% |
| Pakistani | 29 | 0.1% |
| Polish | 633 | 2.1% |
| Portuguese | 24 | 0.1% |
| Puerto Rican | 220 | 0.7% |
| Russian | 10 | 0.0% |
| Salvadoran | 76 | 0.3% |
| Scandinavian | 20 | 0.1% |
| Scotch-Irish | 353 | 1.2% |
| Scottish | 413 | 1.4% |
| Sioux | 3 | 0.0% |
| South American | 10 | 0.0% |
| Spaniard | 43 | 0.1% |
| Spanish | 6 | 0.0% |
| Sri Lankan | 80 | 0.3% |
| Subsaharan African | 159 | 0.5% |
| Swedish | 117 | 0.4% |
| Swiss | 75 | 0.3% |
| Syrian | 1 | 0.0% |
| Thai | 51 | 0.2% |
| Ukrainian | 9 | 0.0% |
| Venezuelan | 2 | 0.0% |
| Welsh | 149 | 0.5% |
| Yugoslavian | 24 | 0.1% | View All 62 Rows |
Immigrants in Austin County
The most numerous immigrant groups reported in Austin County came from Latin America (2,220 | 7.3%), Central America (2,208 | 7.3%), Mexico (2,098 | 6.9%), Europe (299 | 1.0%), and Asia (239 | 0.8%), together accounting for 23.2% of all Austin County residents.
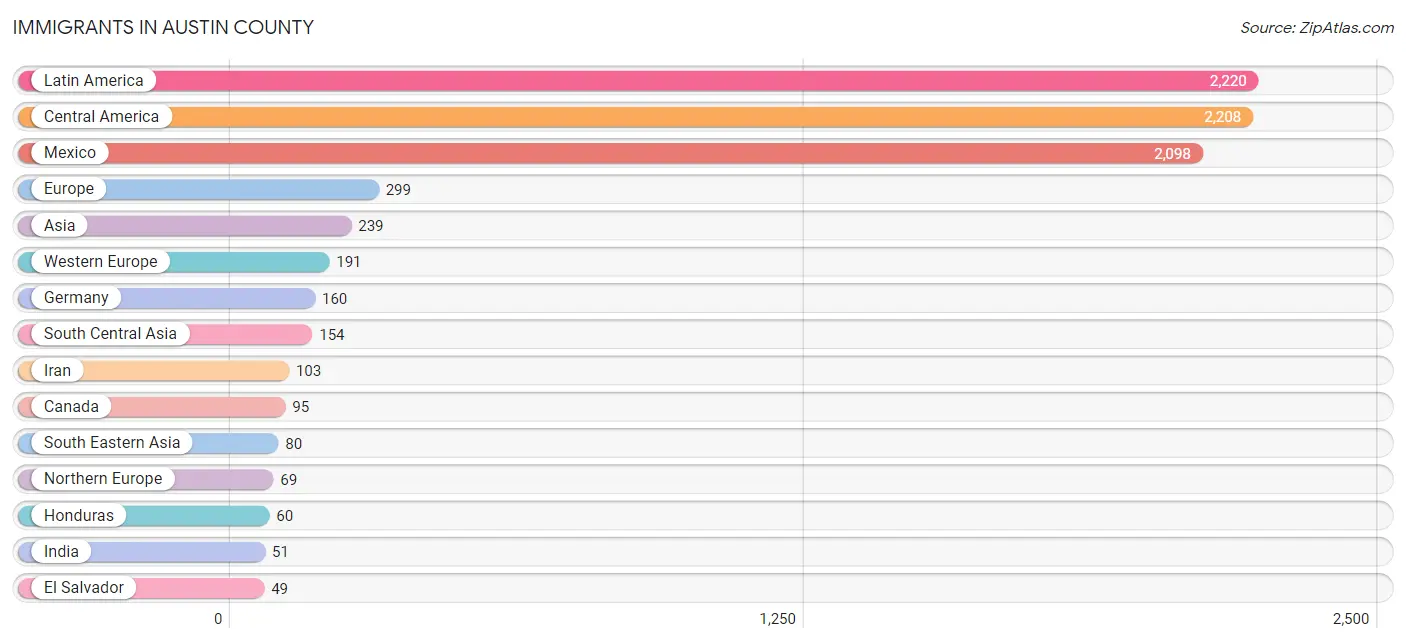
| Immigration Origin | # Population | % Population |
| Asia | 239 | 0.8% |
| Belgium | 12 | 0.0% |
| Cambodia | 37 | 0.1% |
| Canada | 95 | 0.3% |
| Caribbean | 10 | 0.0% |
| Central America | 2,208 | 7.3% |
| Cuba | 10 | 0.0% |
| Eastern Europe | 22 | 0.1% |
| El Salvador | 49 | 0.2% |
| England | 15 | 0.1% |
| Europe | 299 | 1.0% |
| France | 8 | 0.0% |
| Germany | 160 | 0.5% |
| Greece | 4 | 0.0% |
| Guatemala | 1 | 0.0% |
| Honduras | 60 | 0.2% |
| India | 51 | 0.2% |
| Iran | 103 | 0.3% |
| Latin America | 2,220 | 7.3% |
| Mexico | 2,098 | 6.9% |
| Netherlands | 9 | 0.0% |
| Northern Europe | 69 | 0.2% |
| Poland | 9 | 0.0% |
| Portugal | 13 | 0.0% |
| Scotland | 11 | 0.0% |
| South America | 2 | 0.0% |
| South Central Asia | 154 | 0.5% |
| South Eastern Asia | 80 | 0.3% |
| Southern Europe | 17 | 0.1% |
| Switzerland | 2 | 0.0% |
| Syria | 5 | 0.0% |
| Venezuela | 2 | 0.0% |
| Vietnam | 43 | 0.1% |
| Western Asia | 5 | 0.0% |
| Western Europe | 191 | 0.6% | View All 35 Rows |
Sex and Age in Austin County
Sex and Age in Austin County
The most populous age groups in Austin County are 10 to 14 Years (1,255 | 8.2%) for men and 10 to 14 Years (1,348 | 8.9%) for women.
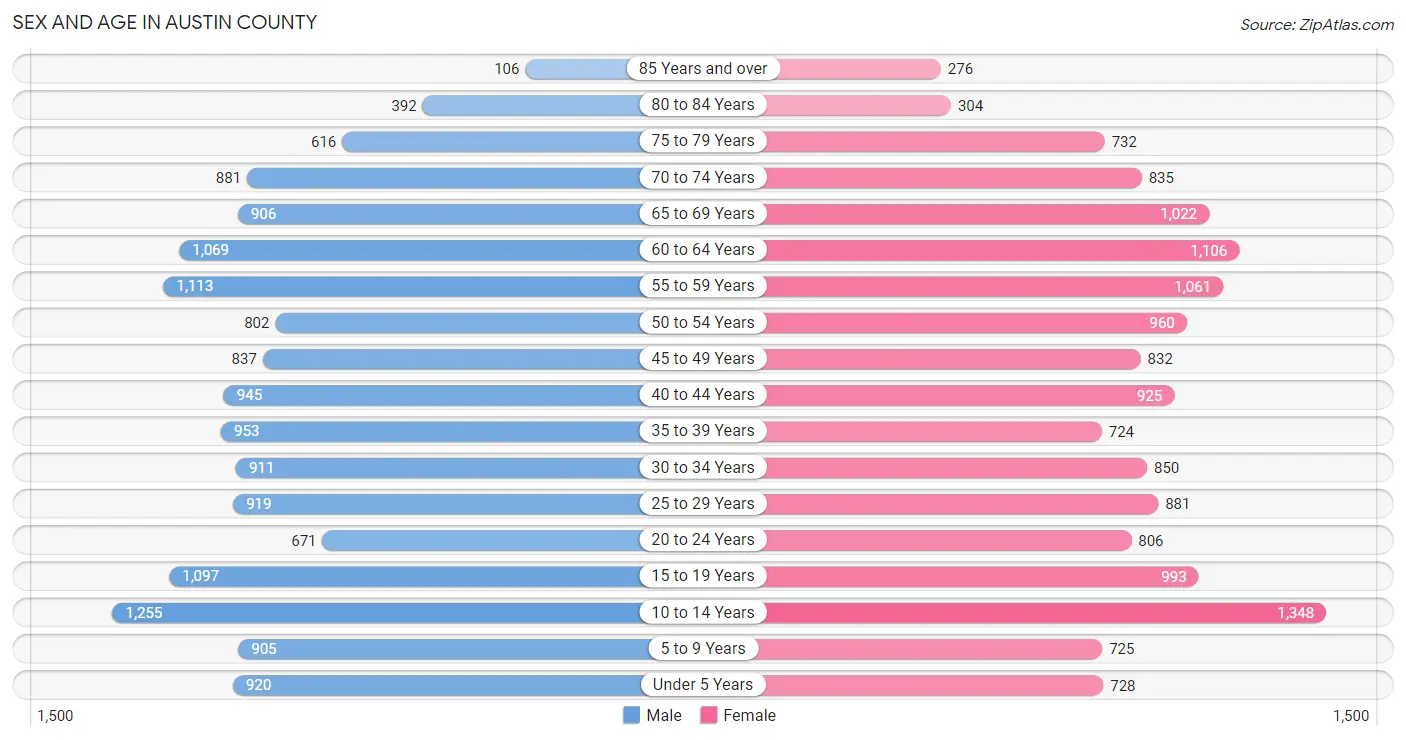
| Age Bracket | Male | Female |
| Under 5 Years | 920 (6.0%) | 728 (4.8%) |
| 5 to 9 Years | 905 (5.9%) | 725 (4.8%) |
| 10 to 14 Years | 1,255 (8.2%) | 1,348 (8.9%) |
| 15 to 19 Years | 1,097 (7.2%) | 993 (6.6%) |
| 20 to 24 Years | 671 (4.4%) | 806 (5.3%) |
| 25 to 29 Years | 919 (6.0%) | 881 (5.8%) |
| 30 to 34 Years | 911 (6.0%) | 850 (5.6%) |
| 35 to 39 Years | 953 (6.2%) | 724 (4.8%) |
| 40 to 44 Years | 945 (6.2%) | 925 (6.1%) |
| 45 to 49 Years | 837 (5.5%) | 832 (5.5%) |
| 50 to 54 Years | 802 (5.2%) | 960 (6.4%) |
| 55 to 59 Years | 1,113 (7.3%) | 1,061 (7.0%) |
| 60 to 64 Years | 1,069 (7.0%) | 1,106 (7.3%) |
| 65 to 69 Years | 906 (5.9%) | 1,022 (6.8%) |
| 70 to 74 Years | 881 (5.8%) | 835 (5.5%) |
| 75 to 79 Years | 616 (4.0%) | 732 (4.9%) |
| 80 to 84 Years | 392 (2.6%) | 304 (2.0%) |
| 85 Years and over | 106 (0.7%) | 276 (1.8%) |
| Total | 15,298 (100.0%) | 15,108 (100.0%) |
Families and Households in Austin County
Median Family Size in Austin County
The median family size in Austin County is 2.88 persons per family, with married-couple families (6,965 | 77.2%) accounting for the largest median family size of 3.01 persons per family. On the other hand, single male/father families (722 | 8.0%) represent the smallest median family size with 2.18 persons per family.
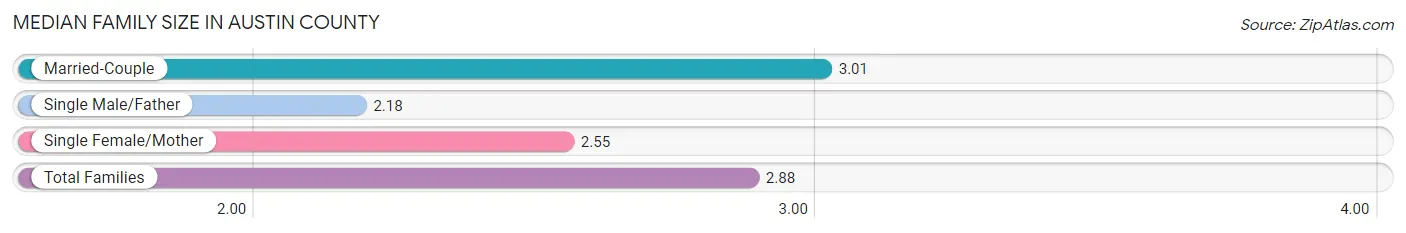
| Family Type | # Families | Family Size |
| Married-Couple | 6,965 (77.2%) | 3.01 |
| Single Male/Father | 722 (8.0%) | 2.18 |
| Single Female/Mother | 1,336 (14.8%) | 2.55 |
| Total Families | 9,023 (100.0%) | 2.88 |
Median Household Size in Austin County
The median household size in Austin County is 2.53 persons per household, with married-couple households (6,965 | 58.5%) accounting for the largest median household size of 3.02 persons per household. non-family households (2,890 | 24.3%) represent the smallest median household size with 1.14 persons per household.
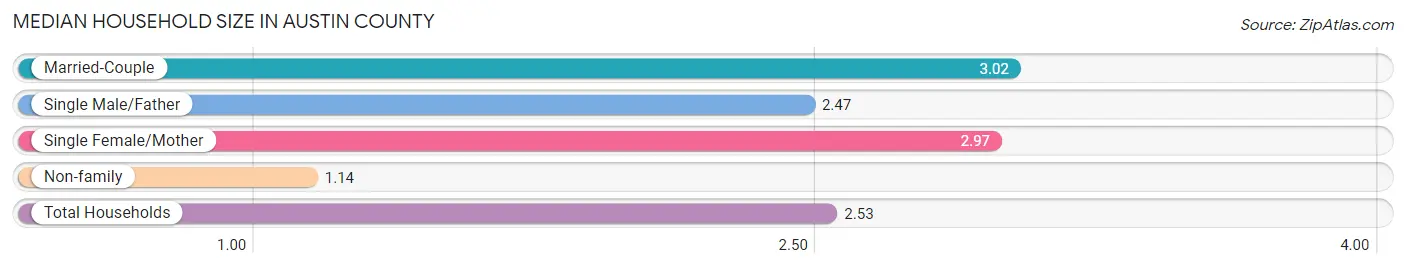
| Household Type | # Households | Household Size |
| Married-Couple | 6,965 (58.5%) | 3.02 |
| Single Male/Father | 722 (6.1%) | 2.47 |
| Single Female/Mother | 1,336 (11.2%) | 2.97 |
| Non-family | 2,890 (24.3%) | 1.14 |
| Total Households | 11,913 (100.0%) | 2.53 |
Household Size by Marriage Status in Austin County
Out of a total of 11,913 households in Austin County, 9,023 (75.7%) are family households, while 2,890 (24.3%) are nonfamily households. The most numerous type of family households are 2-person households, comprising 4,189, and the most common type of nonfamily households are 1-person households, comprising 2,457.
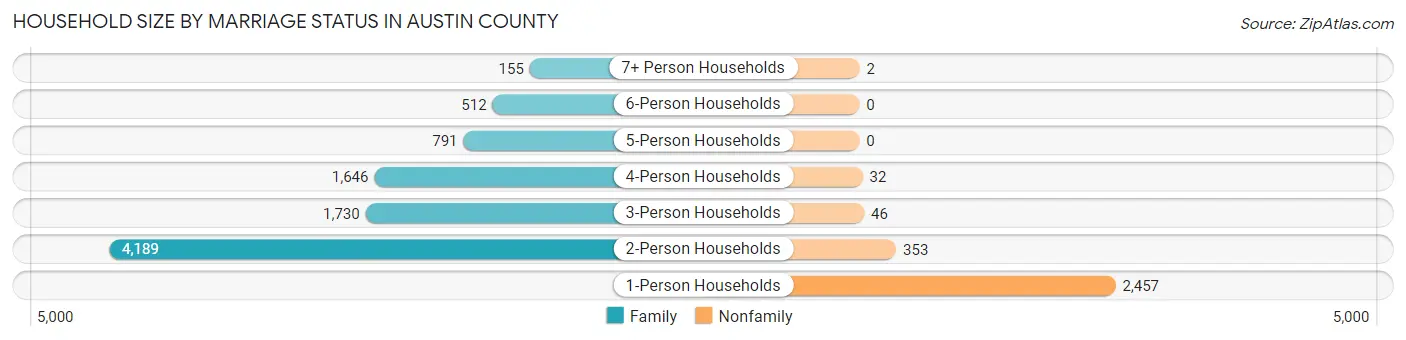
| Household Size | Family Households | Nonfamily Households |
| 1-Person Households | - | 2,457 (20.6%) |
| 2-Person Households | 4,189 (35.2%) | 353 (3.0%) |
| 3-Person Households | 1,730 (14.5%) | 46 (0.4%) |
| 4-Person Households | 1,646 (13.8%) | 32 (0.3%) |
| 5-Person Households | 791 (6.6%) | 0 (0.0%) |
| 6-Person Households | 512 (4.3%) | 0 (0.0%) |
| 7+ Person Households | 155 (1.3%) | 2 (0.0%) |
| Total | 9,023 (75.7%) | 2,890 (24.3%) |
Female Fertility in Austin County
Fertility by Age in Austin County
Average fertility rate in Austin County is 64.0 births per 1,000 women. Women in the age bracket of 20 to 34 years have the highest fertility rate with 132.0 births per 1,000 women. Women in the age bracket of 20 to 34 years acount for 84.6% of all women with births.
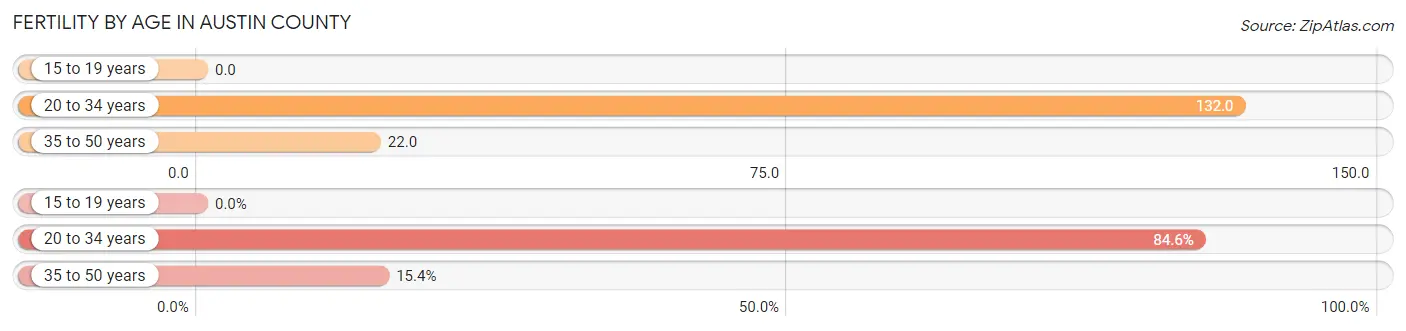
| Age Bracket | Women with Births | Births / 1,000 Women |
| 15 to 19 years | 0 (0.0%) | 0.0 |
| 20 to 34 years | 336 (84.6%) | 132.0 |
| 35 to 50 years | 61 (15.4%) | 22.0 |
| Total | 397 (100.0%) | 64.0 |
Fertility by Age by Marriage Status in Austin County
78.8% of women with births (397) in Austin County are married. The highest percentage of unmarried women with births falls into 20 to 34 years age bracket with 25.0% of them unmarried at the time of birth, while the lowest percentage of unmarried women with births belong to 35 to 50 years age bracket with 0.0% of them unmarried.
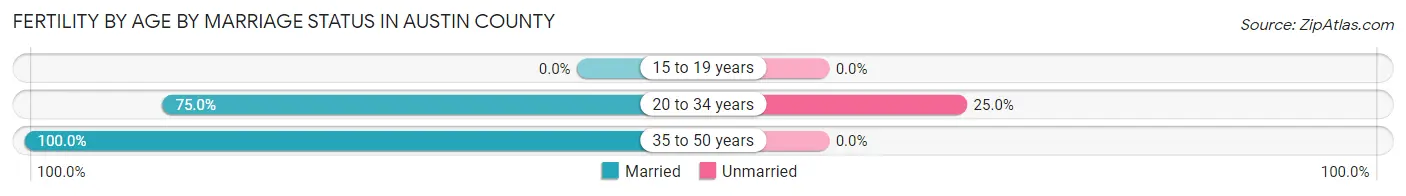
| Age Bracket | Married | Unmarried |
| 15 to 19 years | 0 (0.0%) | 0 (0.0%) |
| 20 to 34 years | 252 (75.0%) | 84 (25.0%) |
| 35 to 50 years | 61 (100.0%) | 0 (0.0%) |
| Total | 313 (78.8%) | 84 (21.2%) |
Fertility by Education in Austin County
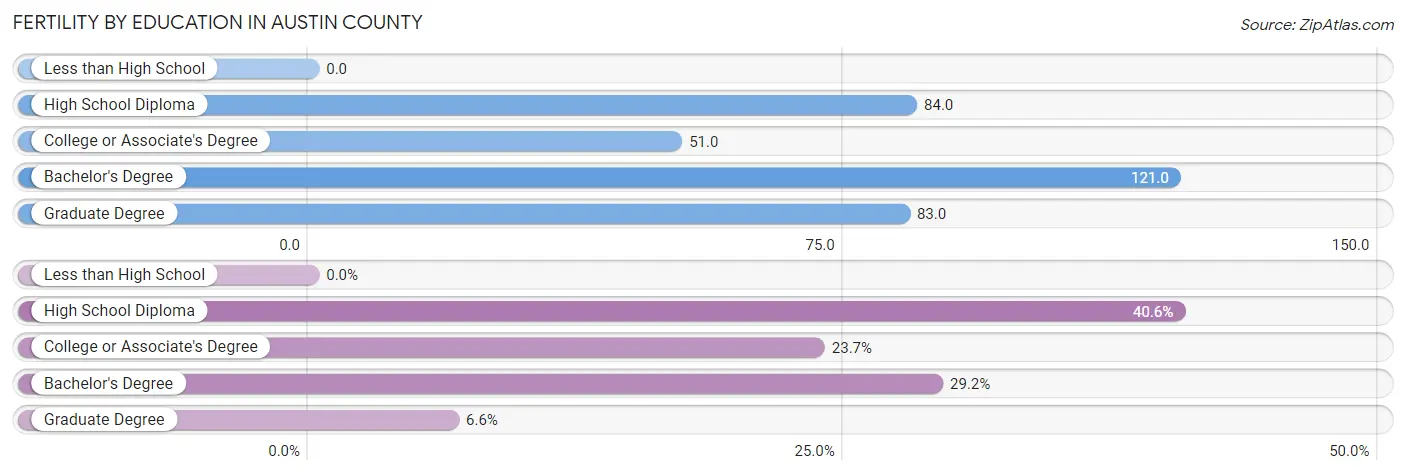
| Educational Attainment | Women with Births | Births / 1,000 Women |
| Less than High School | 0 (0.0%) | 0.0 |
| High School Diploma | 161 (40.6%) | 84.0 |
| College or Associate's Degree | 94 (23.7%) | 51.0 |
| Bachelor's Degree | 116 (29.2%) | 121.0 |
| Graduate Degree | 26 (6.6%) | 83.0 |
| Total | 397 (100.0%) | 64.0 |
Fertility by Education by Marriage Status in Austin County
21.2% of women with births in Austin County are unmarried. Women with the educational attainment of bachelor's degree are most likely to be married with 100.0% of them married at childbirth, while women with the educational attainment of college or associate's degree are least likely to be married with 38.3% of them unmarried at childbirth.
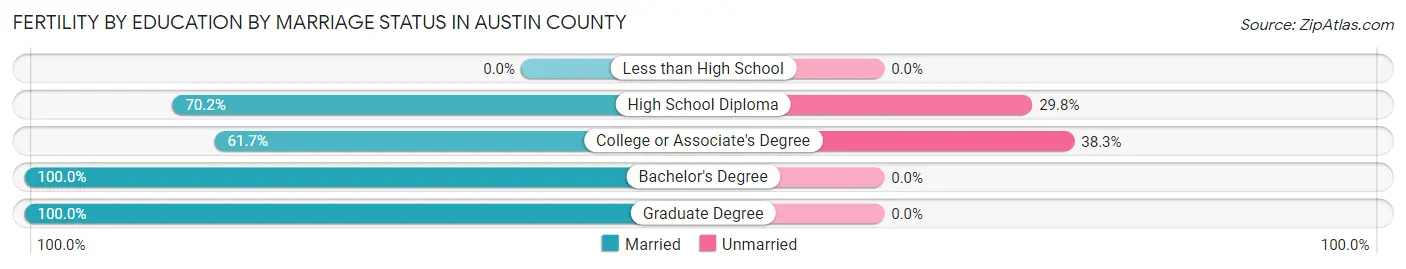
| Educational Attainment | Married | Unmarried |
| Less than High School | 0 (0.0%) | 0 (0.0%) |
| High School Diploma | 113 (70.2%) | 48 (29.8%) |
| College or Associate's Degree | 58 (61.7%) | 36 (38.3%) |
| Bachelor's Degree | 116 (100.0%) | 0 (0.0%) |
| Graduate Degree | 26 (100.0%) | 0 (0.0%) |
| Total | 313 (78.8%) | 84 (21.2%) |
Employment Characteristics in Austin County
Employment by Class of Employer in Austin County
Among the 14,424 employed individuals in Austin County, private company employees (9,817 | 68.1%), self-employed (not incorporated) (1,324 | 9.2%), and local government employees (1,057 | 7.3%) make up the most common classes of employment.
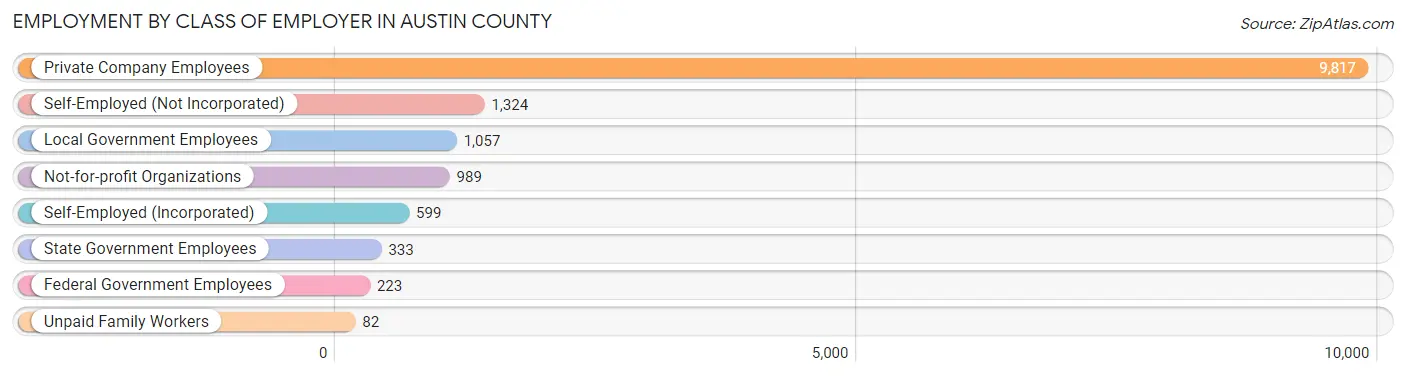
| Employer Class | # Employees | % Employees |
| Private Company Employees | 9,817 | 68.1% |
| Self-Employed (Incorporated) | 599 | 4.2% |
| Self-Employed (Not Incorporated) | 1,324 | 9.2% |
| Not-for-profit Organizations | 989 | 6.9% |
| Local Government Employees | 1,057 | 7.3% |
| State Government Employees | 333 | 2.3% |
| Federal Government Employees | 223 | 1.5% |
| Unpaid Family Workers | 82 | 0.6% |
| Total | 14,424 | 100.0% |
Employment Status by Age in Austin County
According to the labor force statistics for Austin County, out of the total population over 16 years of age (24,061), 62.9% or 15,134 individuals are in the labor force, with 3.8% or 575 of them unemployed. The age group with the highest labor force participation rate is 35 to 44 years, with 87.6% or 3,107 individuals in the labor force. Within the labor force, the 20 to 24 years age range has the highest percentage of unemployed individuals, with 13.9% or 167 of them being unemployed.
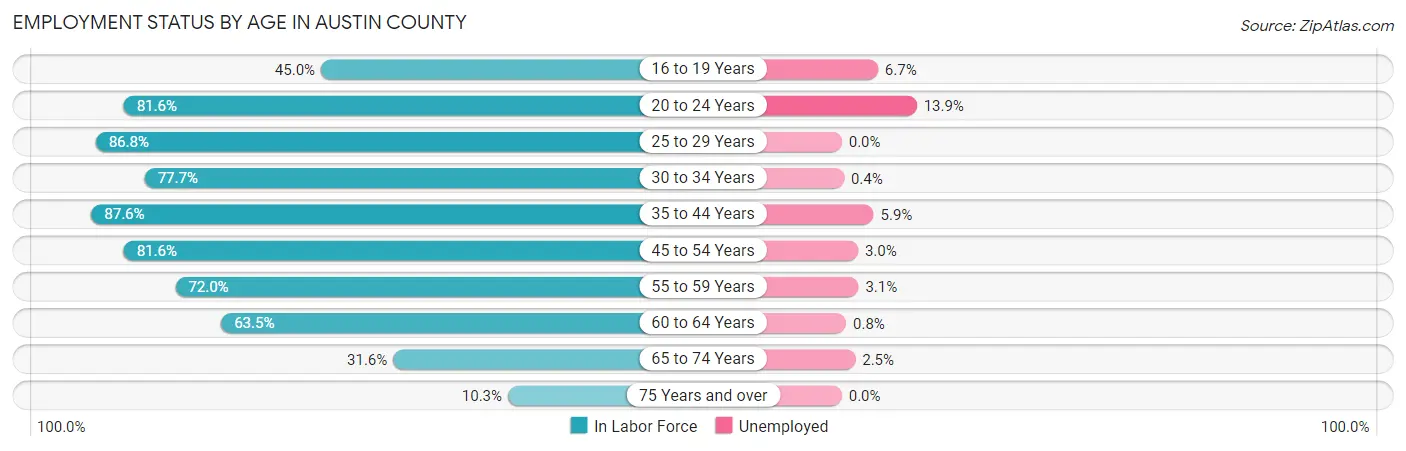
| Age Bracket | In Labor Force | Unemployed |
| 16 to 19 Years | 732 (45.0%) | 49 (6.7%) |
| 20 to 24 Years | 1,205 (81.6%) | 167 (13.9%) |
| 25 to 29 Years | 1,562 (86.8%) | 0 (0.0%) |
| 30 to 34 Years | 1,368 (77.7%) | 5 (0.4%) |
| 35 to 44 Years | 3,107 (87.6%) | 183 (5.9%) |
| 45 to 54 Years | 2,800 (81.6%) | 84 (3.0%) |
| 55 to 59 Years | 1,565 (72.0%) | 49 (3.1%) |
| 60 to 64 Years | 1,381 (63.5%) | 11 (0.8%) |
| 65 to 74 Years | 1,152 (31.6%) | 29 (2.5%) |
| 75 Years and over | 250 (10.3%) | 0 (0.0%) |
| Total | 15,134 (62.9%) | 575 (3.8%) |
Employment Status by Educational Attainment in Austin County
According to labor force statistics for Austin County, 79.2% of individuals (11,791) out of the total population between 25 and 64 years of age (14,888) are in the labor force, with 2.8% or 330 of them being unemployed. The group with the highest labor force participation rate are those with the educational attainment of bachelor's degree or higher, with 87.5% or 2,936 individuals in the labor force. Within the labor force, individuals with college / associate degree education have the highest percentage of unemployment, with 4.7% or 183 of them being unemployed.
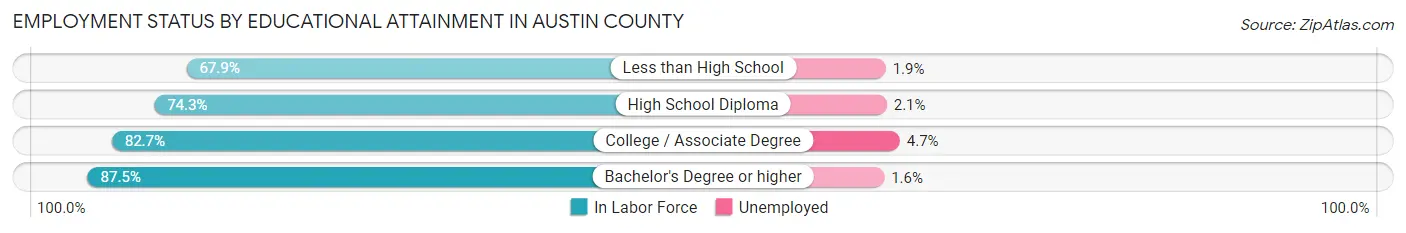
| Educational Attainment | In Labor Force | Unemployed |
| Less than High School | 1,223 (67.9%) | 34 (1.9%) |
| High School Diploma | 3,737 (74.3%) | 106 (2.1%) |
| College / Associate Degree | 3,888 (82.7%) | 221 (4.7%) |
| Bachelor's Degree or higher | 2,936 (87.5%) | 54 (1.6%) |
| Total | 11,791 (79.2%) | 417 (2.8%) |
Employment Occupations by Sex in Austin County
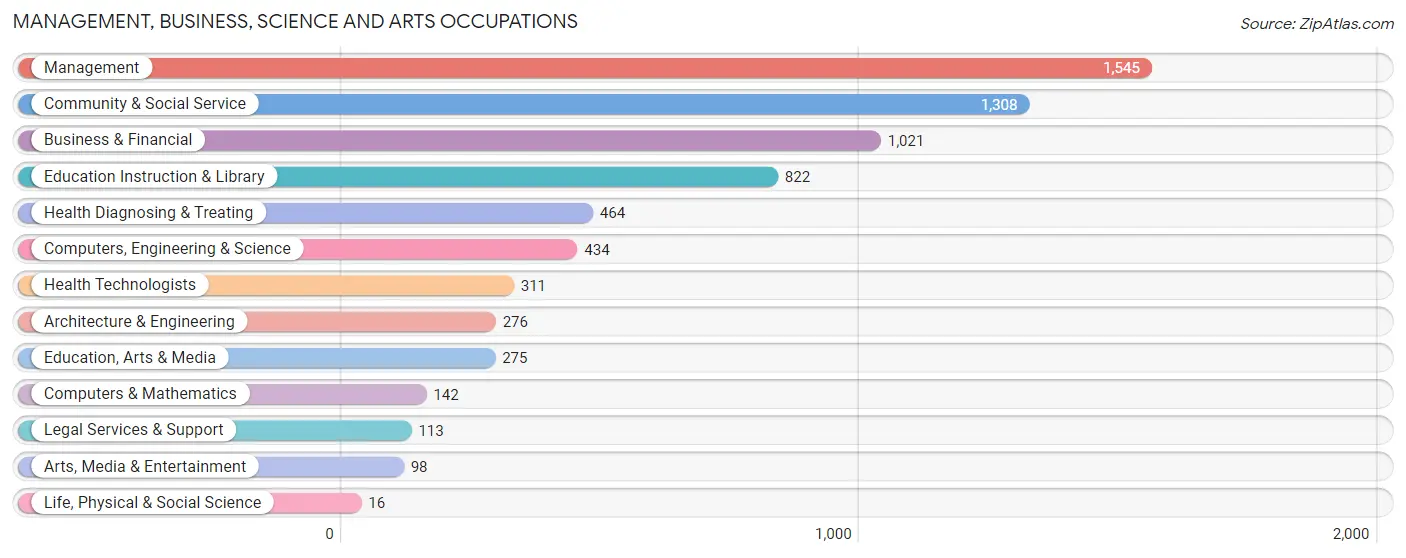
Management, Business, Science and Arts Occupations
The most common Management, Business, Science and Arts occupations in Austin County are Management (1,545 | 10.6%), Community & Social Service (1,308 | 9.0%), Business & Financial (1,021 | 7.0%), Education Instruction & Library (822 | 5.7%), and Health Diagnosing & Treating (464 | 3.2%).
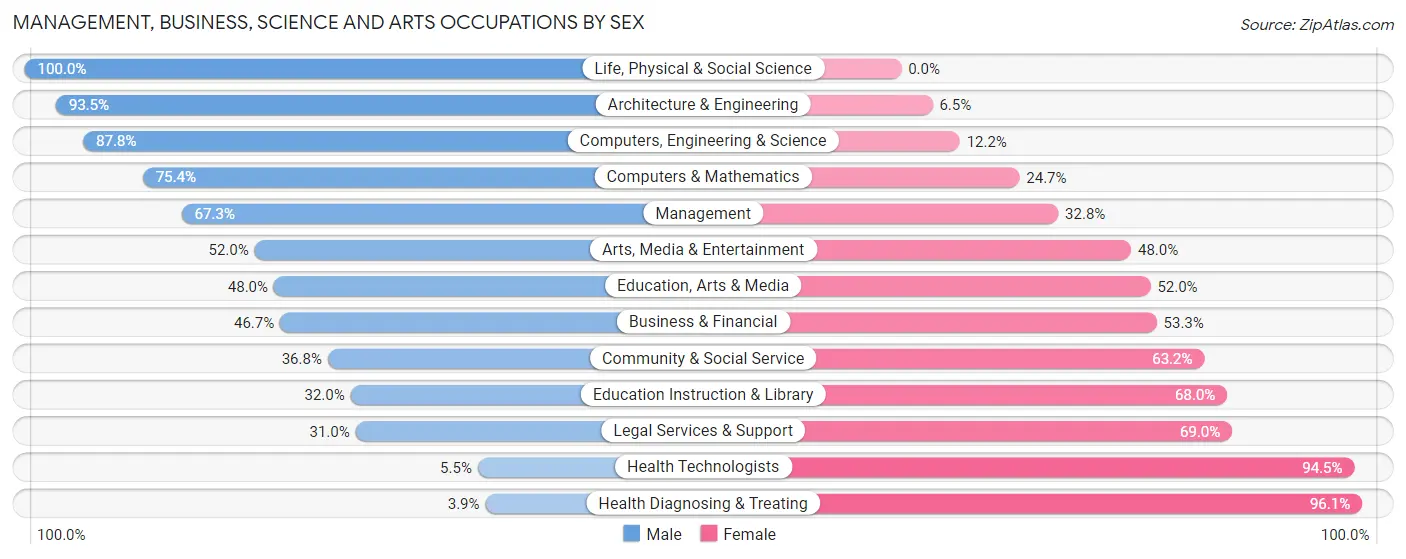
Management, Business, Science and Arts Occupations by Sex
Within the Management, Business, Science and Arts occupations in Austin County, the most male-oriented occupations are Life, Physical & Social Science (100.0%), Architecture & Engineering (93.5%), and Computers, Engineering & Science (87.8%), while the most female-oriented occupations are Health Diagnosing & Treating (96.1%), Health Technologists (94.5%), and Legal Services & Support (69.0%).
| Occupation | Male | Female |
| Management | 1,039 (67.2%) | 506 (32.8%) |
| Business & Financial | 477 (46.7%) | 544 (53.3%) |
| Computers, Engineering & Science | 381 (87.8%) | 53 (12.2%) |
| Computers & Mathematics | 107 (75.3%) | 35 (24.6%) |
| Architecture & Engineering | 258 (93.5%) | 18 (6.5%) |
| Life, Physical & Social Science | 16 (100.0%) | 0 (0.0%) |
| Community & Social Service | 481 (36.8%) | 827 (63.2%) |
| Education, Arts & Media | 132 (48.0%) | 143 (52.0%) |
| Legal Services & Support | 35 (31.0%) | 78 (69.0%) |
| Education Instruction & Library | 263 (32.0%) | 559 (68.0%) |
| Arts, Media & Entertainment | 51 (52.0%) | 47 (48.0%) |
| Health Diagnosing & Treating | 18 (3.9%) | 446 (96.1%) |
| Health Technologists | 17 (5.5%) | 294 (94.5%) |
| Total (Category) | 2,396 (50.2%) | 2,376 (49.8%) |
| Total (Overall) | 7,980 (54.9%) | 6,561 (45.1%) |
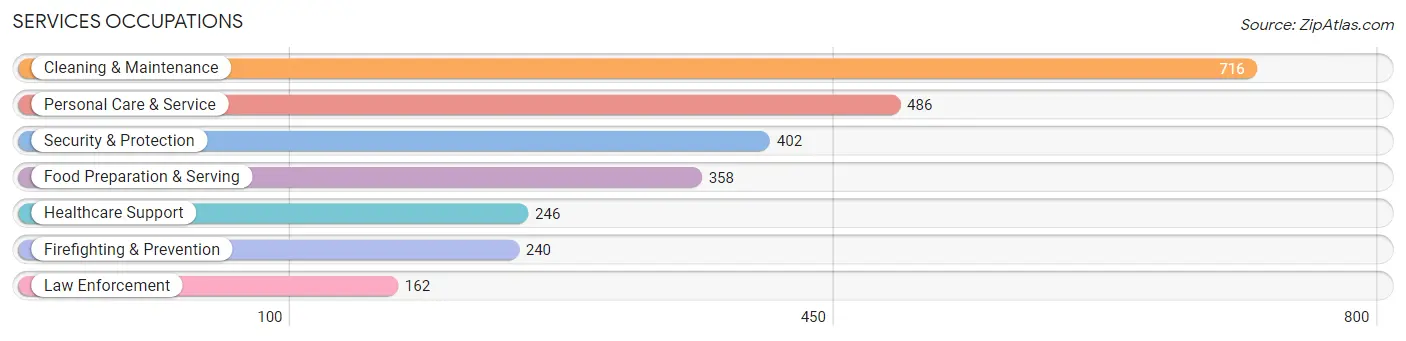
Services Occupations
The most common Services occupations in Austin County are Cleaning & Maintenance (716 | 4.9%), Personal Care & Service (486 | 3.3%), Security & Protection (402 | 2.8%), Food Preparation & Serving (358 | 2.5%), and Healthcare Support (246 | 1.7%).
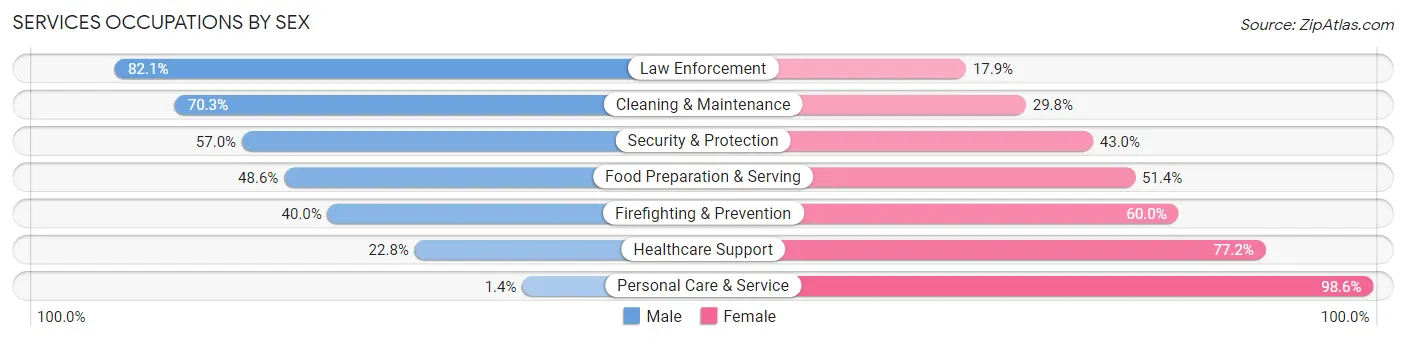
Services Occupations by Sex
Within the Services occupations in Austin County, the most male-oriented occupations are Law Enforcement (82.1%), Cleaning & Maintenance (70.3%), and Security & Protection (57.0%), while the most female-oriented occupations are Personal Care & Service (98.6%), Healthcare Support (77.2%), and Firefighting & Prevention (60.0%).
| Occupation | Male | Female |
| Healthcare Support | 56 (22.8%) | 190 (77.2%) |
| Security & Protection | 229 (57.0%) | 173 (43.0%) |
| Firefighting & Prevention | 96 (40.0%) | 144 (60.0%) |
| Law Enforcement | 133 (82.1%) | 29 (17.9%) |
| Food Preparation & Serving | 174 (48.6%) | 184 (51.4%) |
| Cleaning & Maintenance | 503 (70.3%) | 213 (29.7%) |
| Personal Care & Service | 7 (1.4%) | 479 (98.6%) |
| Total (Category) | 969 (43.9%) | 1,239 (56.1%) |
| Total (Overall) | 7,980 (54.9%) | 6,561 (45.1%) |
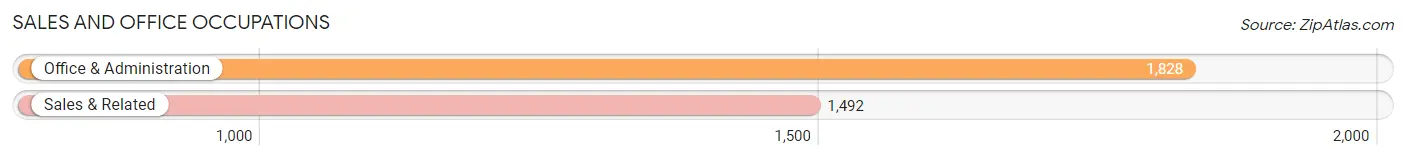
Sales and Office Occupations
The most common Sales and Office occupations in Austin County are Office & Administration (1,828 | 12.6%), and Sales & Related (1,492 | 10.3%).
Sales and Office Occupations by Sex
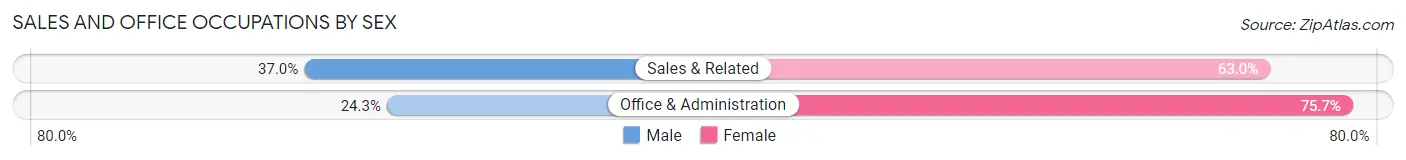
| Occupation | Male | Female |
| Sales & Related | 552 (37.0%) | 940 (63.0%) |
| Office & Administration | 444 (24.3%) | 1,384 (75.7%) |
| Total (Category) | 996 (30.0%) | 2,324 (70.0%) |
| Total (Overall) | 7,980 (54.9%) | 6,561 (45.1%) |
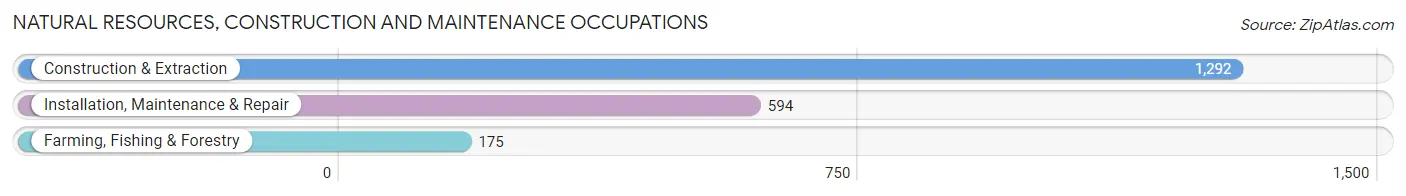
Natural Resources, Construction and Maintenance Occupations
The most common Natural Resources, Construction and Maintenance occupations in Austin County are Construction & Extraction (1,292 | 8.9%), Installation, Maintenance & Repair (594 | 4.1%), and Farming, Fishing & Forestry (175 | 1.2%).
Natural Resources, Construction and Maintenance Occupations by Sex
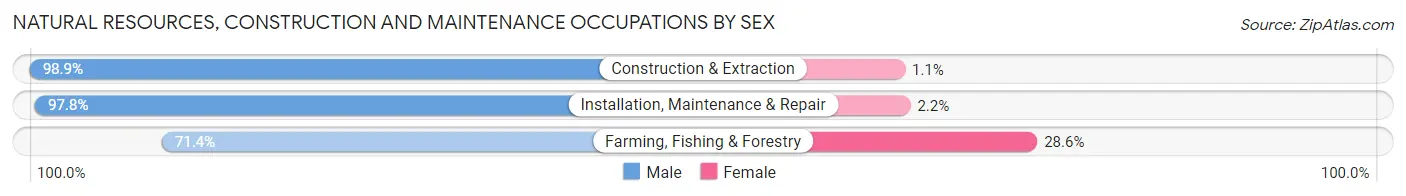
| Occupation | Male | Female |
| Farming, Fishing & Forestry | 125 (71.4%) | 50 (28.6%) |
| Construction & Extraction | 1,278 (98.9%) | 14 (1.1%) |
| Installation, Maintenance & Repair | 581 (97.8%) | 13 (2.2%) |
| Total (Category) | 1,984 (96.3%) | 77 (3.7%) |
| Total (Overall) | 7,980 (54.9%) | 6,561 (45.1%) |
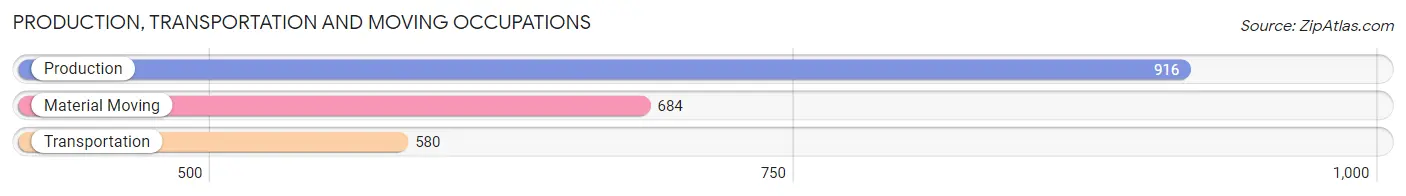
Production, Transportation and Moving Occupations
The most common Production, Transportation and Moving occupations in Austin County are Production (916 | 6.3%), Material Moving (684 | 4.7%), and Transportation (580 | 4.0%).
Production, Transportation and Moving Occupations by Sex
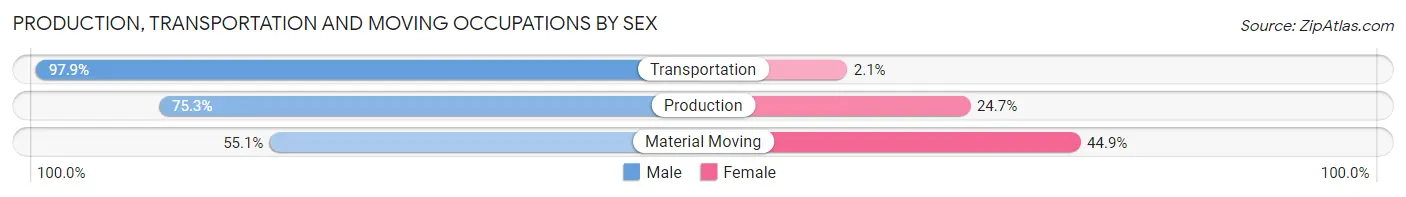
| Occupation | Male | Female |
| Production | 690 (75.3%) | 226 (24.7%) |
| Transportation | 568 (97.9%) | 12 (2.1%) |
| Material Moving | 377 (55.1%) | 307 (44.9%) |
| Total (Category) | 1,635 (75.0%) | 545 (25.0%) |
| Total (Overall) | 7,980 (54.9%) | 6,561 (45.1%) |
Employment Industries by Sex in Austin County
Employment Industries in Austin County
The major employment industries in Austin County include Retail Trade (2,194 | 15.1%), Construction (1,846 | 12.7%), Manufacturing (1,477 | 10.2%), Health Care & Social Assistance (1,351 | 9.3%), and Educational Services (966 | 6.6%).
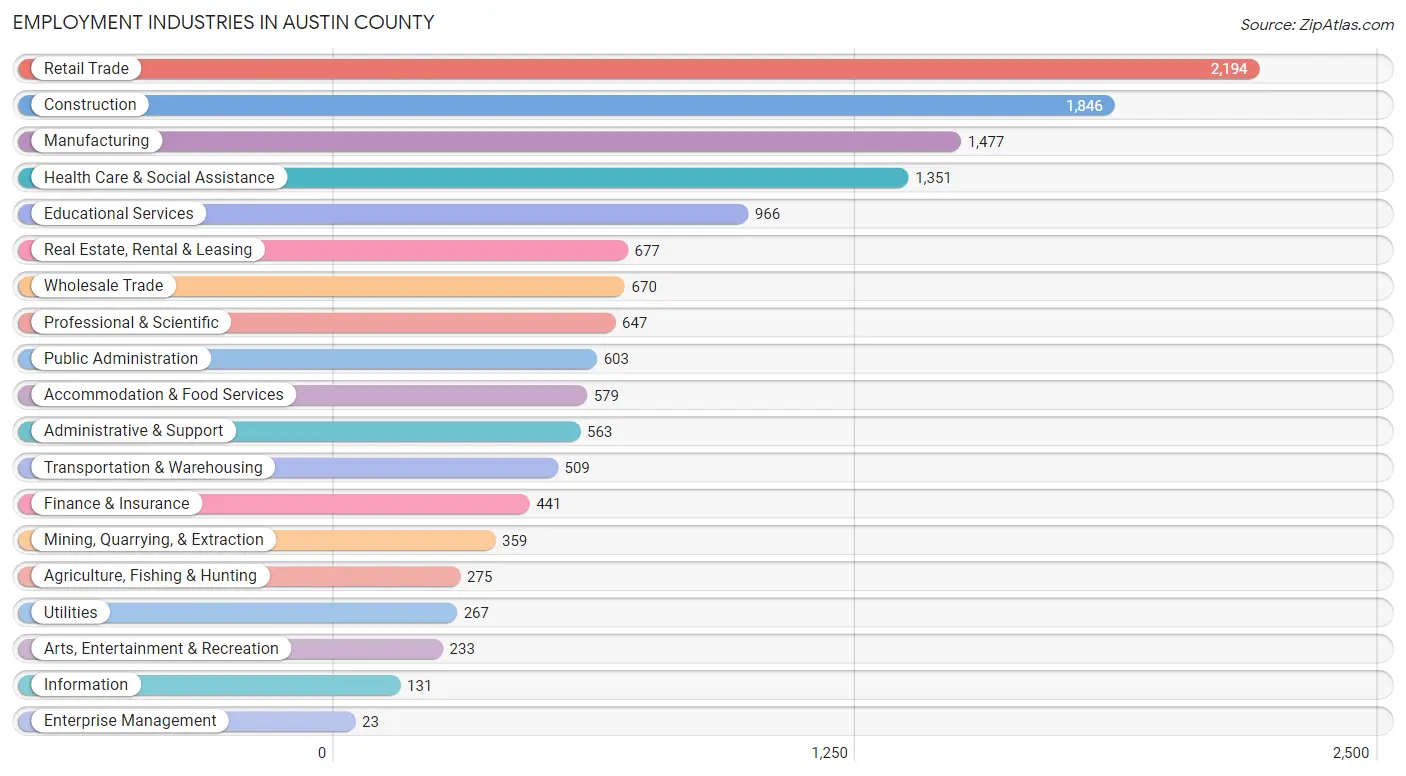
Employment Industries by Sex in Austin County
The Austin County industries that see more men than women are Enterprise Management (100.0%), Mining, Quarrying, & Extraction (96.9%), and Construction (88.5%), whereas the industries that tend to have a higher number of women are Arts, Entertainment & Recreation (79.0%), Health Care & Social Assistance (73.8%), and Educational Services (70.6%).
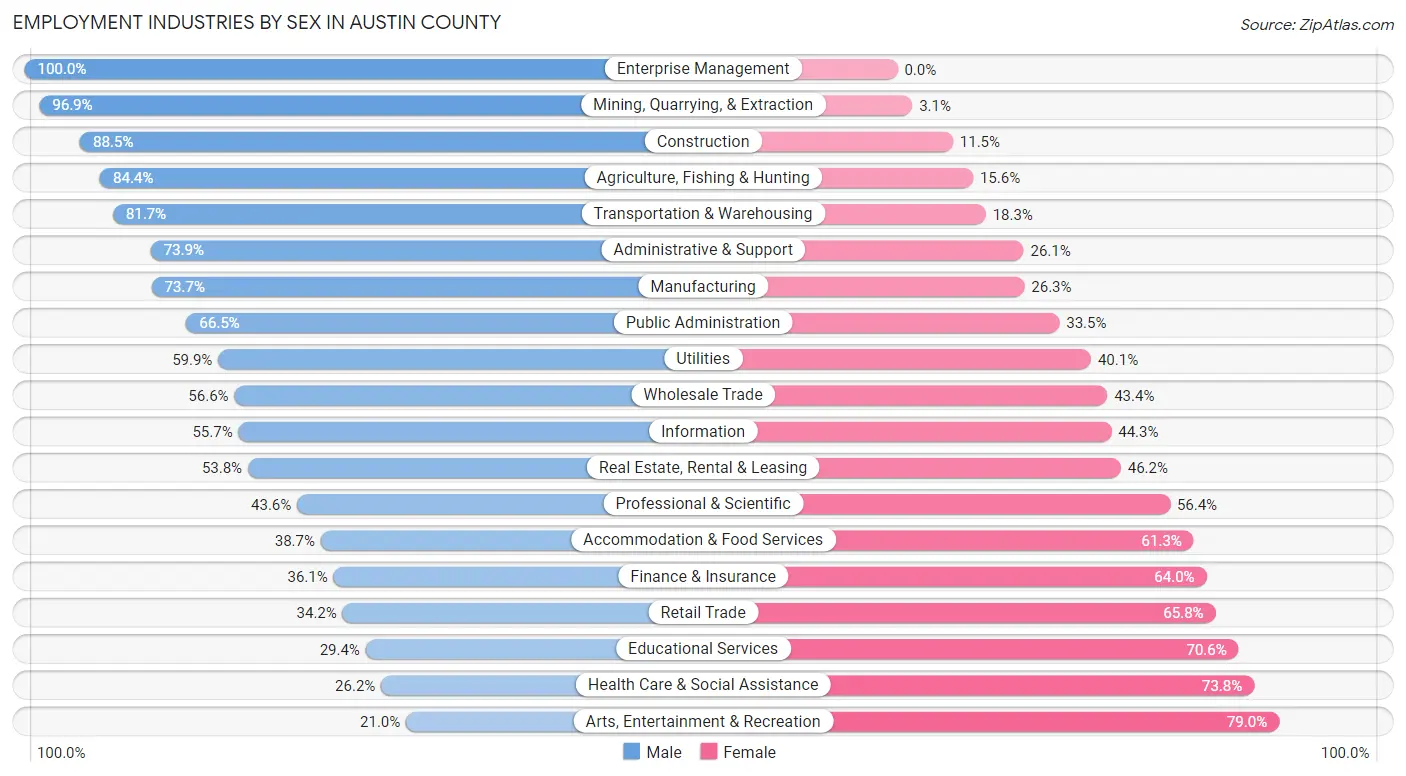
| Industry | Male | Female |
| Agriculture, Fishing & Hunting | 232 (84.4%) | 43 (15.6%) |
| Mining, Quarrying, & Extraction | 348 (96.9%) | 11 (3.1%) |
| Construction | 1,634 (88.5%) | 212 (11.5%) |
| Manufacturing | 1,089 (73.7%) | 388 (26.3%) |
| Wholesale Trade | 379 (56.6%) | 291 (43.4%) |
| Retail Trade | 750 (34.2%) | 1,444 (65.8%) |
| Transportation & Warehousing | 416 (81.7%) | 93 (18.3%) |
| Utilities | 160 (59.9%) | 107 (40.1%) |
| Information | 73 (55.7%) | 58 (44.3%) |
| Finance & Insurance | 159 (36.0%) | 282 (63.9%) |
| Real Estate, Rental & Leasing | 364 (53.8%) | 313 (46.2%) |
| Professional & Scientific | 282 (43.6%) | 365 (56.4%) |
| Enterprise Management | 23 (100.0%) | 0 (0.0%) |
| Administrative & Support | 416 (73.9%) | 147 (26.1%) |
| Educational Services | 284 (29.4%) | 682 (70.6%) |
| Health Care & Social Assistance | 354 (26.2%) | 997 (73.8%) |
| Arts, Entertainment & Recreation | 49 (21.0%) | 184 (79.0%) |
| Accommodation & Food Services | 224 (38.7%) | 355 (61.3%) |
| Public Administration | 401 (66.5%) | 202 (33.5%) |
| Total | 7,980 (54.9%) | 6,561 (45.1%) |
Education in Austin County
School Enrollment in Austin County
The most common levels of schooling among the 6,945 students in Austin County are middle school (2,114 | 30.4%), high school (1,671 | 24.1%), and elementary school (1,424 | 20.5%).
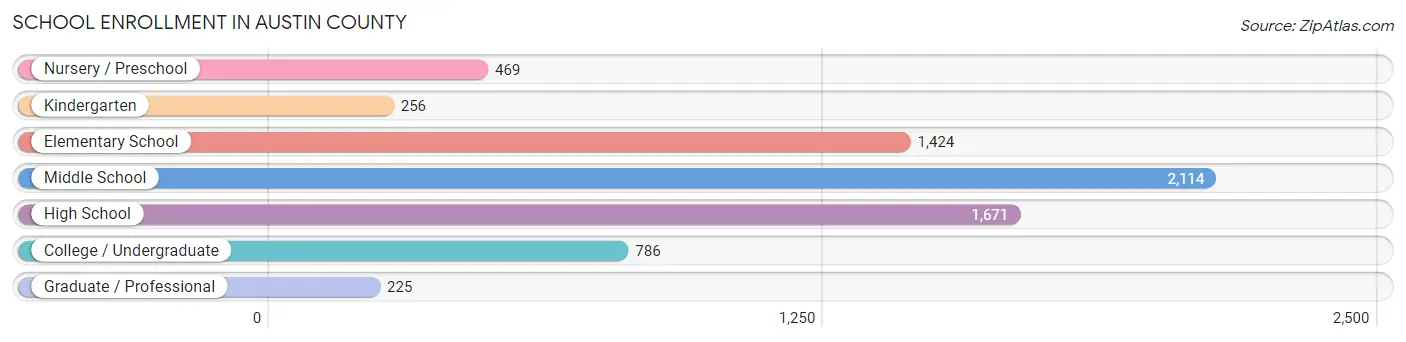
| School Level | # Students | % Students |
| Nursery / Preschool | 469 | 6.8% |
| Kindergarten | 256 | 3.7% |
| Elementary School | 1,424 | 20.5% |
| Middle School | 2,114 | 30.4% |
| High School | 1,671 | 24.1% |
| College / Undergraduate | 786 | 11.3% |
| Graduate / Professional | 225 | 3.2% |
| Total | 6,945 | 100.0% |
School Enrollment by Age by Funding Source in Austin County
Out of a total of 6,945 students who are enrolled in schools in Austin County, 792 (11.4%) attend a private institution, while the remaining 6,153 (88.6%) are enrolled in public schools. The age group of 35 years and over has the highest likelihood of being enrolled in private schools, with 171 (53.9% in the age bracket) enrolled. Conversely, the age group of 25 to 34 year olds has the lowest likelihood of being enrolled in a private school, with 239 (100.0% in the age bracket) attending a public institution.
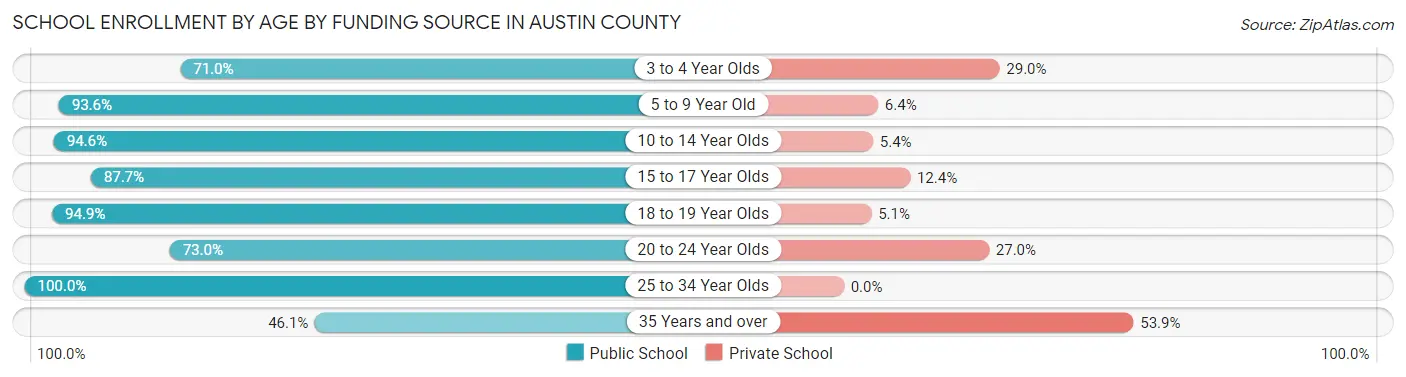
| Age Bracket | Public School | Private School |
| 3 to 4 Year Olds | 284 (71.0%) | 116 (29.0%) |
| 5 to 9 Year Old | 1,437 (93.6%) | 98 (6.4%) |
| 10 to 14 Year Olds | 2,401 (94.6%) | 138 (5.4%) |
| 15 to 17 Year Olds | 1,128 (87.6%) | 159 (12.3%) |
| 18 to 19 Year Olds | 259 (94.9%) | 14 (5.1%) |
| 20 to 24 Year Olds | 259 (73.0%) | 96 (27.0%) |
| 25 to 34 Year Olds | 239 (100.0%) | 0 (0.0%) |
| 35 Years and over | 146 (46.1%) | 171 (53.9%) |
| Total | 6,153 (88.6%) | 792 (11.4%) |
Educational Attainment by Field of Study in Austin County
Business (1,605 | 29.9%), education (961 | 17.9%), arts & humanities (461 | 8.6%), bio, nature & agricultural (424 | 7.9%), and engineering (403 | 7.5%) are the most common fields of study among 5,366 individuals in Austin County who have obtained a bachelor's degree or higher.
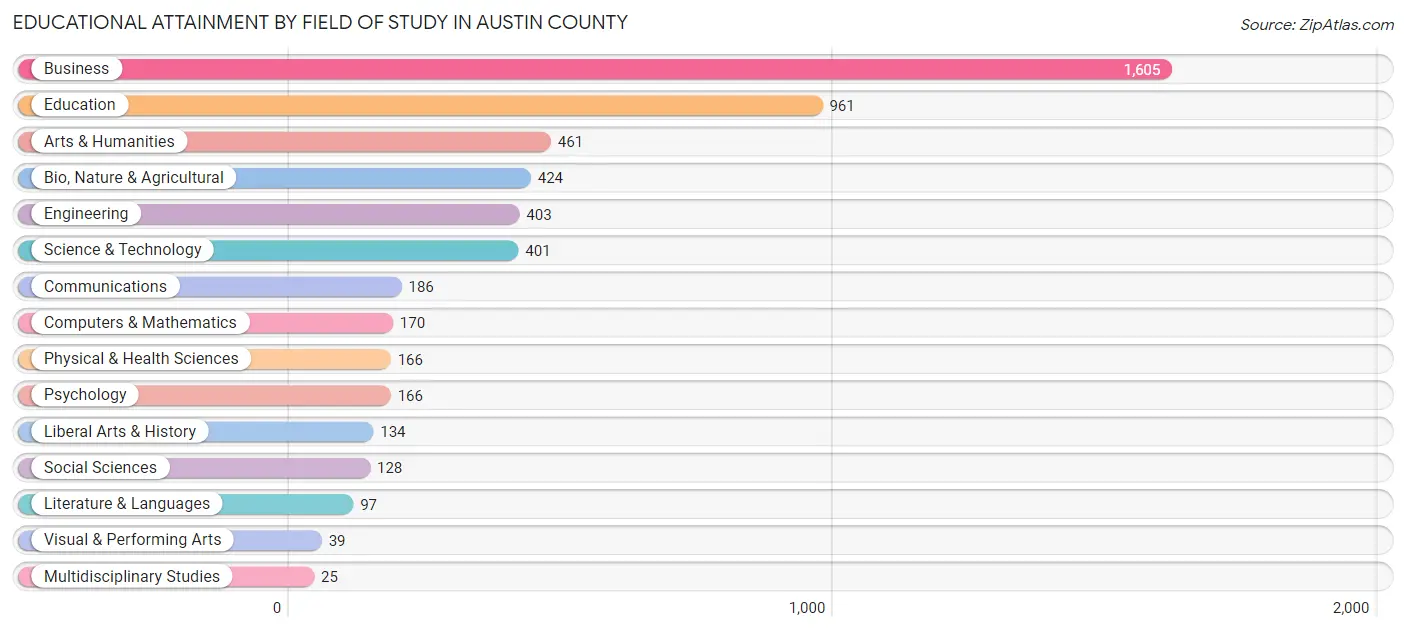
| Field of Study | # Graduates | % Graduates |
| Computers & Mathematics | 170 | 3.2% |
| Bio, Nature & Agricultural | 424 | 7.9% |
| Physical & Health Sciences | 166 | 3.1% |
| Psychology | 166 | 3.1% |
| Social Sciences | 128 | 2.4% |
| Engineering | 403 | 7.5% |
| Multidisciplinary Studies | 25 | 0.5% |
| Science & Technology | 401 | 7.5% |
| Business | 1,605 | 29.9% |
| Education | 961 | 17.9% |
| Literature & Languages | 97 | 1.8% |
| Liberal Arts & History | 134 | 2.5% |
| Visual & Performing Arts | 39 | 0.7% |
| Communications | 186 | 3.5% |
| Arts & Humanities | 461 | 8.6% |
| Total | 5,366 | 100.0% |
Transportation & Commute in Austin County
Vehicle Availability by Sex in Austin County
The most prevalent vehicle ownership categories in Austin County are males with 2 vehicles (3,124, accounting for 39.4%) and females with 2 vehicles (2,268, making up 48.2%).
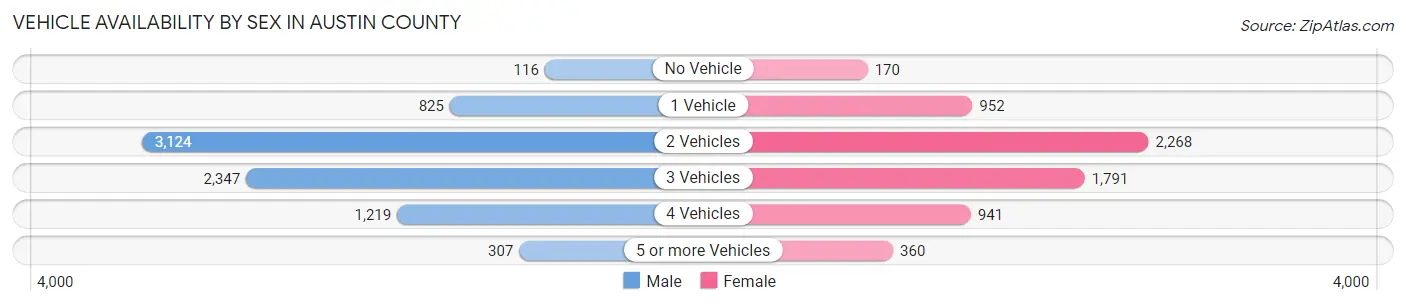
| Vehicles Available | Male | Female |
| No Vehicle | 116 (1.5%) | 170 (2.6%) |
| 1 Vehicle | 825 (10.4%) | 952 (14.7%) |
| 2 Vehicles | 3,124 (39.4%) | 2,268 (35.0%) |
| 3 Vehicles | 2,347 (29.6%) | 1,791 (27.6%) |
| 4 Vehicles | 1,219 (15.4%) | 941 (14.5%) |
| 5 or more Vehicles | 307 (3.9%) | 360 (5.6%) |
| Total | 7,938 (100.0%) | 6,482 (100.0%) |
Commute Time in Austin County
The most frequently occuring commute durations in Austin County are 10 to 14 minutes (1,990 commuters, 15.0%), 30 to 34 minutes (1,782 commuters, 13.4%), and 20 to 24 minutes (1,554 commuters, 11.7%).
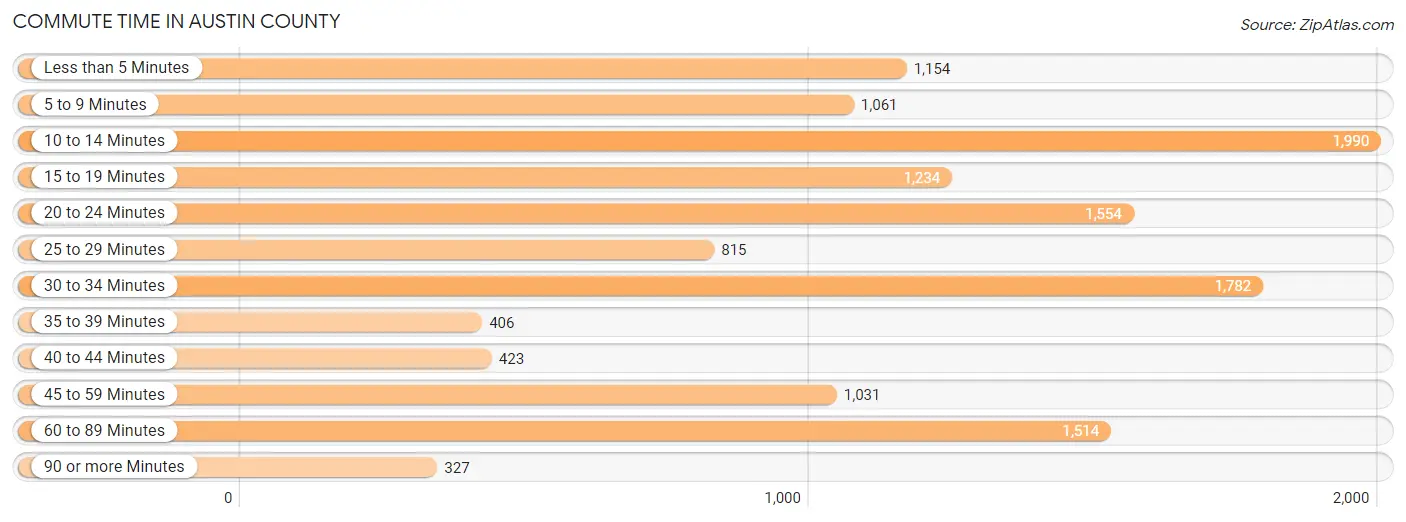
| Commute Time | # Commuters | % Commuters |
| Less than 5 Minutes | 1,154 | 8.7% |
| 5 to 9 Minutes | 1,061 | 8.0% |
| 10 to 14 Minutes | 1,990 | 15.0% |
| 15 to 19 Minutes | 1,234 | 9.3% |
| 20 to 24 Minutes | 1,554 | 11.7% |
| 25 to 29 Minutes | 815 | 6.1% |
| 30 to 34 Minutes | 1,782 | 13.4% |
| 35 to 39 Minutes | 406 | 3.0% |
| 40 to 44 Minutes | 423 | 3.2% |
| 45 to 59 Minutes | 1,031 | 7.8% |
| 60 to 89 Minutes | 1,514 | 11.4% |
| 90 or more Minutes | 327 | 2.5% |
Commute Time by Sex in Austin County
The most common commute times in Austin County are 60 to 89 minutes (1,154 commuters, 16.0%) for males and 10 to 14 minutes (1,109 commuters, 18.3%) for females.
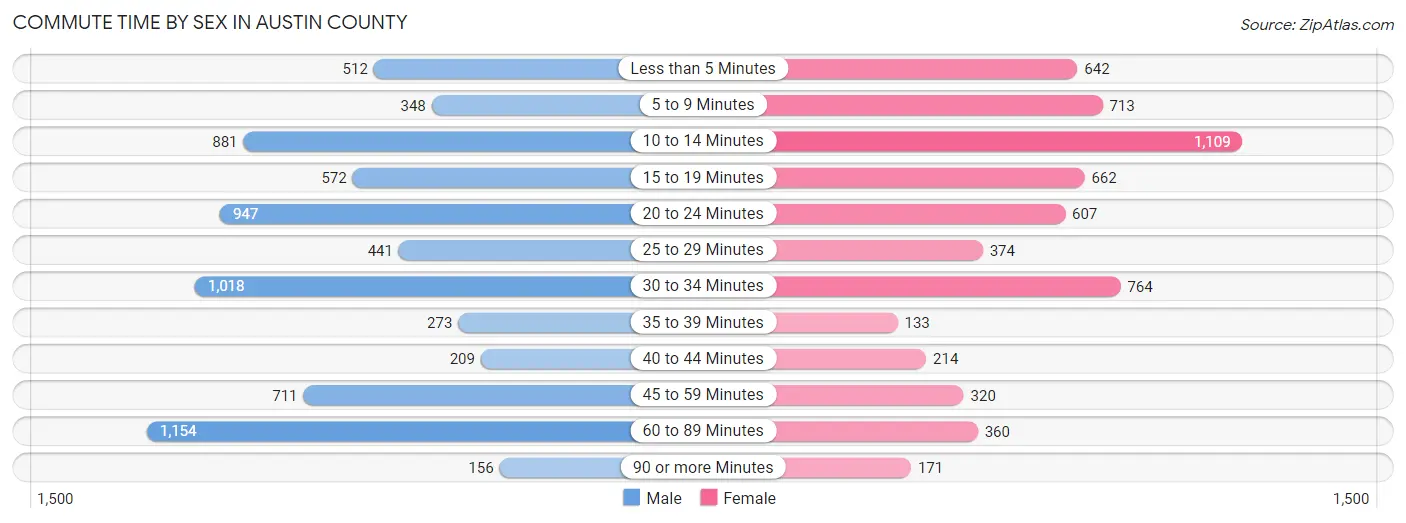
| Commute Time | Male | Female |
| Less than 5 Minutes | 512 (7.1%) | 642 (10.6%) |
| 5 to 9 Minutes | 348 (4.8%) | 713 (11.7%) |
| 10 to 14 Minutes | 881 (12.2%) | 1,109 (18.3%) |
| 15 to 19 Minutes | 572 (7.9%) | 662 (10.9%) |
| 20 to 24 Minutes | 947 (13.1%) | 607 (10.0%) |
| 25 to 29 Minutes | 441 (6.1%) | 374 (6.2%) |
| 30 to 34 Minutes | 1,018 (14.1%) | 764 (12.6%) |
| 35 to 39 Minutes | 273 (3.8%) | 133 (2.2%) |
| 40 to 44 Minutes | 209 (2.9%) | 214 (3.5%) |
| 45 to 59 Minutes | 711 (9.8%) | 320 (5.3%) |
| 60 to 89 Minutes | 1,154 (16.0%) | 360 (5.9%) |
| 90 or more Minutes | 156 (2.2%) | 171 (2.8%) |
Time of Departure to Work by Sex in Austin County
The most frequent times of departure to work in Austin County are 7:00 AM to 7:29 AM (1,497, 20.7%) for males and 7:00 AM to 7:29 AM (1,115, 18.4%) for females.
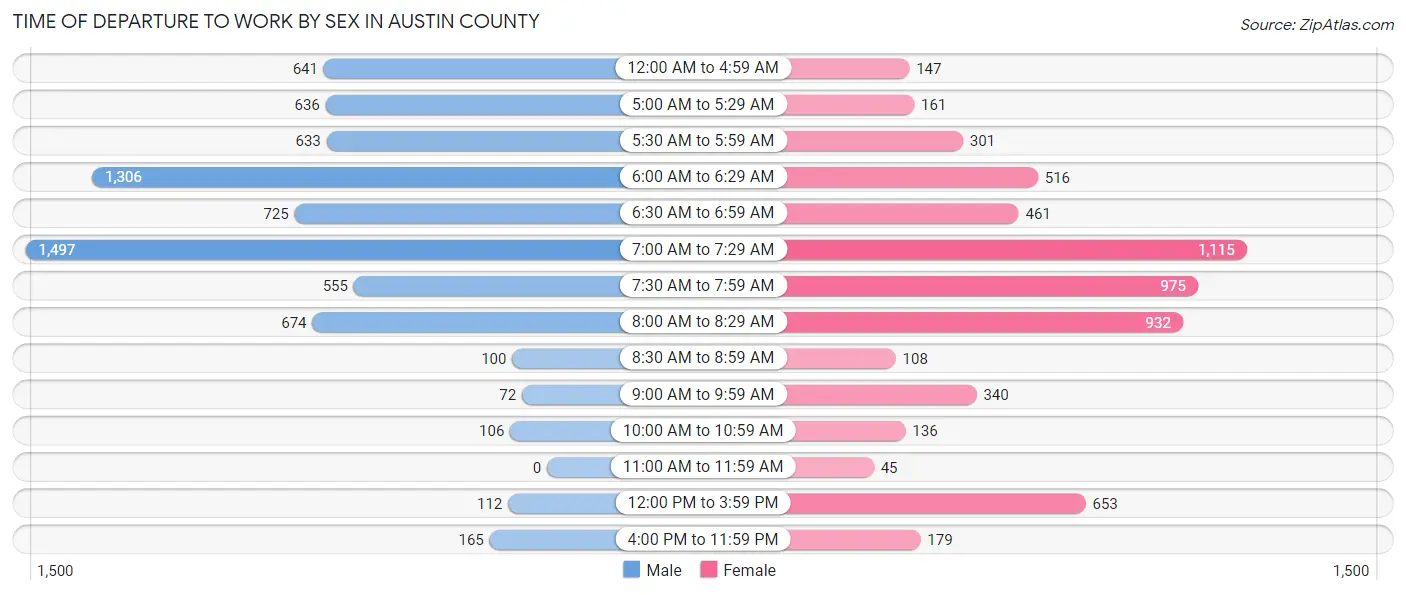
| Time of Departure | Male | Female |
| 12:00 AM to 4:59 AM | 641 (8.9%) | 147 (2.4%) |
| 5:00 AM to 5:29 AM | 636 (8.8%) | 161 (2.6%) |
| 5:30 AM to 5:59 AM | 633 (8.8%) | 301 (5.0%) |
| 6:00 AM to 6:29 AM | 1,306 (18.1%) | 516 (8.5%) |
| 6:30 AM to 6:59 AM | 725 (10.0%) | 461 (7.6%) |
| 7:00 AM to 7:29 AM | 1,497 (20.7%) | 1,115 (18.4%) |
| 7:30 AM to 7:59 AM | 555 (7.7%) | 975 (16.1%) |
| 8:00 AM to 8:29 AM | 674 (9.3%) | 932 (15.4%) |
| 8:30 AM to 8:59 AM | 100 (1.4%) | 108 (1.8%) |
| 9:00 AM to 9:59 AM | 72 (1.0%) | 340 (5.6%) |
| 10:00 AM to 10:59 AM | 106 (1.5%) | 136 (2.2%) |
| 11:00 AM to 11:59 AM | 0 (0.0%) | 45 (0.7%) |
| 12:00 PM to 3:59 PM | 112 (1.5%) | 653 (10.8%) |
| 4:00 PM to 11:59 PM | 165 (2.3%) | 179 (2.9%) |
| Total | 7,222 (100.0%) | 6,069 (100.0%) |
Housing Occupancy in Austin County
Occupancy by Ownership in Austin County
Of the total 11,913 dwellings in Austin County, owner-occupied units account for 9,490 (79.7%), while renter-occupied units make up 2,423 (20.3%).
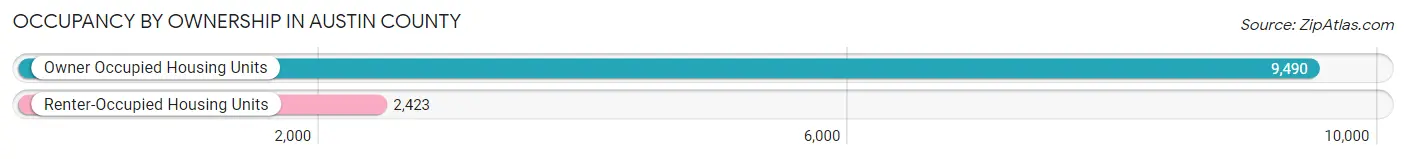
| Occupancy | # Housing Units | % Housing Units |
| Owner Occupied Housing Units | 9,490 | 79.7% |
| Renter-Occupied Housing Units | 2,423 | 20.3% |
| Total Occupied Housing Units | 11,913 | 100.0% |
Occupancy by Household Size in Austin County
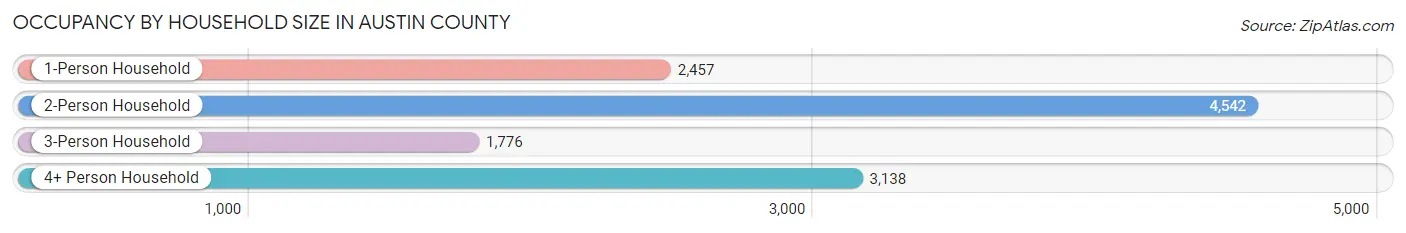
| Household Size | # Housing Units | % Housing Units |
| 1-Person Household | 2,457 | 20.6% |
| 2-Person Household | 4,542 | 38.1% |
| 3-Person Household | 1,776 | 14.9% |
| 4+ Person Household | 3,138 | 26.3% |
| Total Housing Units | 11,913 | 100.0% |
Occupancy by Ownership by Household Size in Austin County
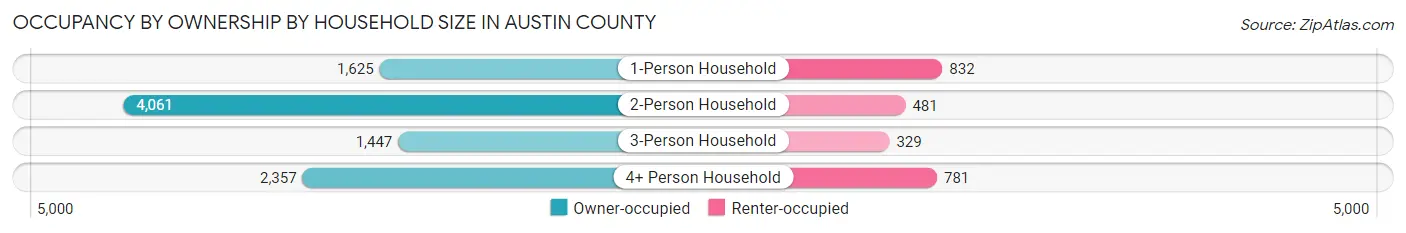
| Household Size | Owner-occupied | Renter-occupied |
| 1-Person Household | 1,625 (66.1%) | 832 (33.9%) |
| 2-Person Household | 4,061 (89.4%) | 481 (10.6%) |
| 3-Person Household | 1,447 (81.5%) | 329 (18.5%) |
| 4+ Person Household | 2,357 (75.1%) | 781 (24.9%) |
| Total Housing Units | 9,490 (79.7%) | 2,423 (20.3%) |
Occupancy by Educational Attainment in Austin County
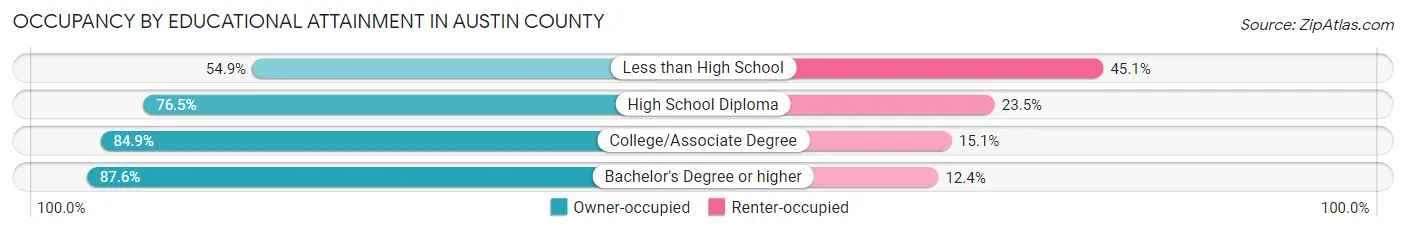
| Household Size | Owner-occupied | Renter-occupied |
| Less than High School | 691 (54.9%) | 567 (45.1%) |
| High School Diploma | 2,937 (76.5%) | 904 (23.5%) |
| College/Associate Degree | 3,451 (84.9%) | 612 (15.1%) |
| Bachelor's Degree or higher | 2,411 (87.6%) | 340 (12.4%) |
Occupancy by Age of Householder in Austin County
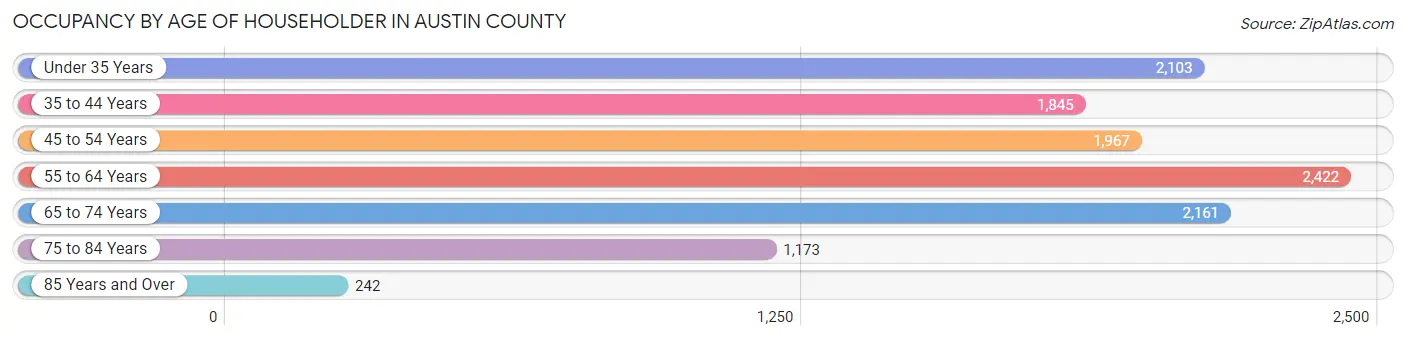
| Age Bracket | # Households | % Households |
| Under 35 Years | 2,103 | 17.6% |
| 35 to 44 Years | 1,845 | 15.5% |
| 45 to 54 Years | 1,967 | 16.5% |
| 55 to 64 Years | 2,422 | 20.3% |
| 65 to 74 Years | 2,161 | 18.1% |
| 75 to 84 Years | 1,173 | 9.9% |
| 85 Years and Over | 242 | 2.0% |
| Total | 11,913 | 100.0% |
Housing Finances in Austin County
Median Income by Occupancy in Austin County
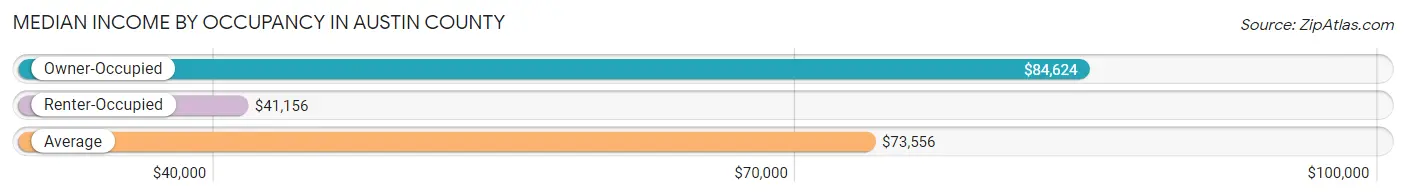
| Occupancy Type | # Households | Median Income |
| Owner-Occupied | 9,490 (79.7%) | $84,624 |
| Renter-Occupied | 2,423 (20.3%) | $41,156 |
| Average | 11,913 (100.0%) | $73,556 |
Occupancy by Householder Income Bracket in Austin County
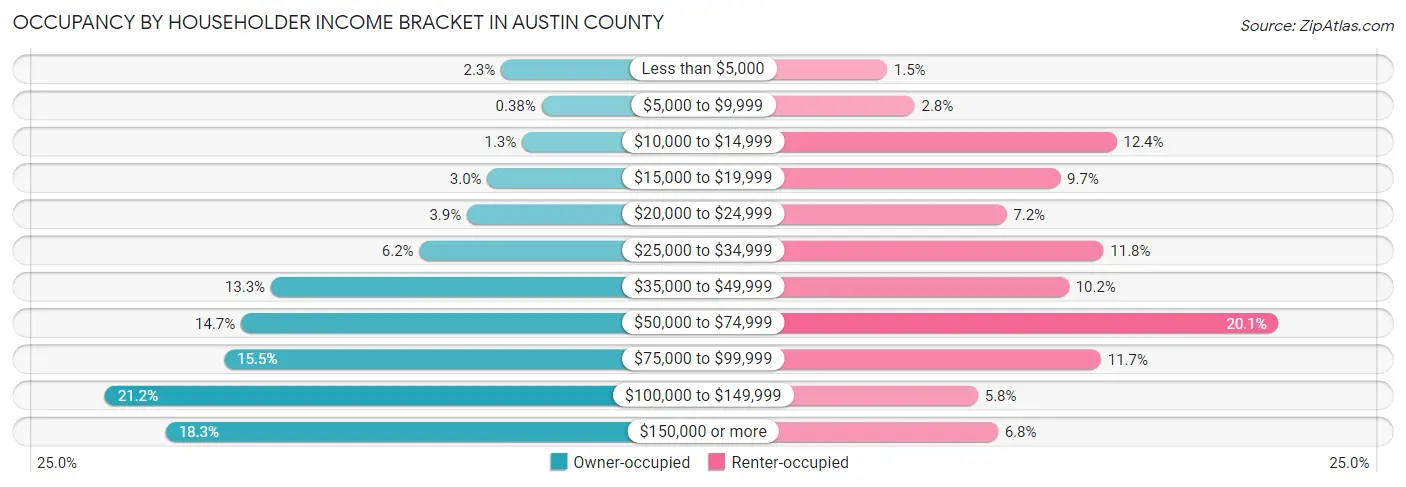
| Income Bracket | Owner-occupied | Renter-occupied |
| Less than $5,000 | 219 (2.3%) | 36 (1.5%) |
| $5,000 to $9,999 | 36 (0.4%) | 68 (2.8%) |
| $10,000 to $14,999 | 124 (1.3%) | 301 (12.4%) |
| $15,000 to $19,999 | 281 (3.0%) | 236 (9.7%) |
| $20,000 to $24,999 | 373 (3.9%) | 174 (7.2%) |
| $25,000 to $34,999 | 588 (6.2%) | 286 (11.8%) |
| $35,000 to $49,999 | 1,259 (13.3%) | 246 (10.2%) |
| $50,000 to $74,999 | 1,394 (14.7%) | 488 (20.1%) |
| $75,000 to $99,999 | 1,471 (15.5%) | 283 (11.7%) |
| $100,000 to $149,999 | 2,010 (21.2%) | 141 (5.8%) |
| $150,000 or more | 1,735 (18.3%) | 164 (6.8%) |
| Total | 9,490 (100.0%) | 2,423 (100.0%) |
Monthly Housing Cost Tiers in Austin County
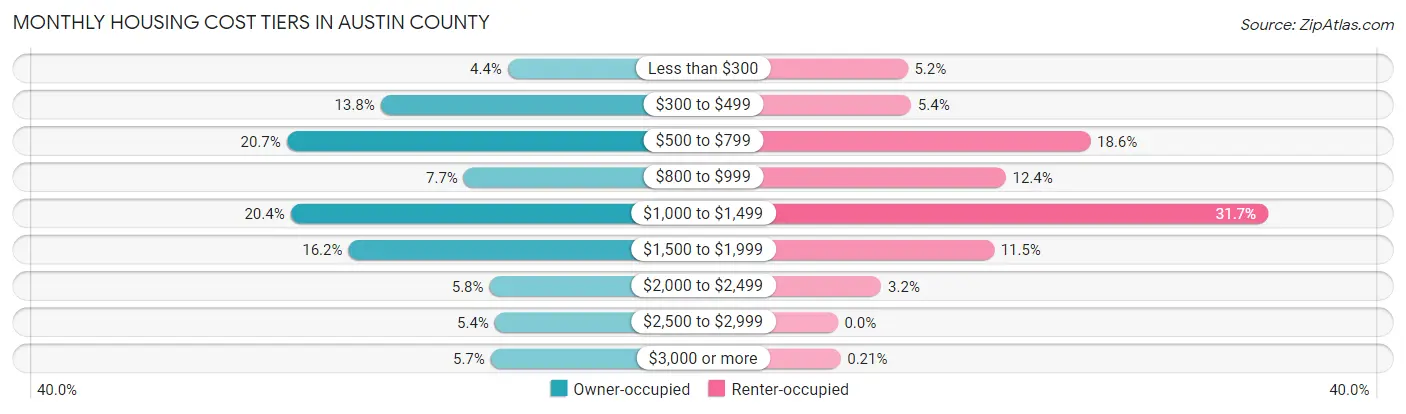
| Monthly Cost | Owner-occupied | Renter-occupied |
| Less than $300 | 419 (4.4%) | 125 (5.2%) |
| $300 to $499 | 1,309 (13.8%) | 131 (5.4%) |
| $500 to $799 | 1,965 (20.7%) | 451 (18.6%) |
| $800 to $999 | 727 (7.7%) | 300 (12.4%) |
| $1,000 to $1,499 | 1,938 (20.4%) | 768 (31.7%) |
| $1,500 to $1,999 | 1,534 (16.2%) | 279 (11.5%) |
| $2,000 to $2,499 | 548 (5.8%) | 78 (3.2%) |
| $2,500 to $2,999 | 511 (5.4%) | 0 (0.0%) |
| $3,000 or more | 539 (5.7%) | 5 (0.2%) |
| Total | 9,490 (100.0%) | 2,423 (100.0%) |
Physical Housing Characteristics in Austin County
Housing Structures in Austin County
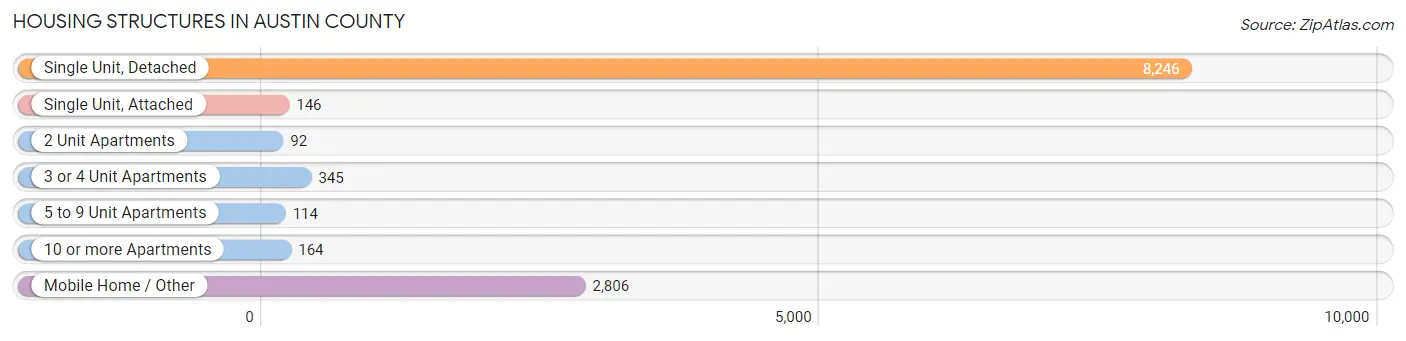
| Structure Type | # Housing Units | % Housing Units |
| Single Unit, Detached | 8,246 | 69.2% |
| Single Unit, Attached | 146 | 1.2% |
| 2 Unit Apartments | 92 | 0.8% |
| 3 or 4 Unit Apartments | 345 | 2.9% |
| 5 to 9 Unit Apartments | 114 | 1.0% |
| 10 or more Apartments | 164 | 1.4% |
| Mobile Home / Other | 2,806 | 23.5% |
| Total | 11,913 | 100.0% |
Housing Structures by Occupancy in Austin County
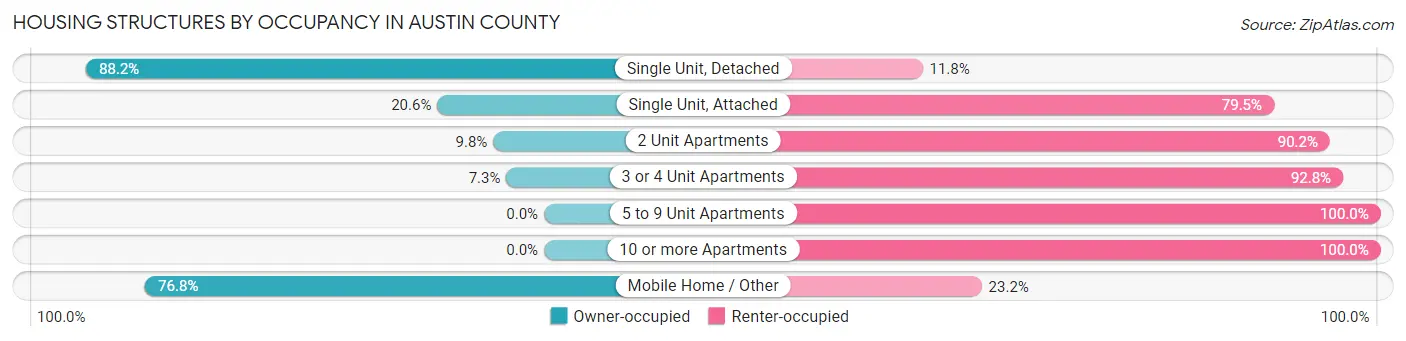
| Structure Type | Owner-occupied | Renter-occupied |
| Single Unit, Detached | 7,271 (88.2%) | 975 (11.8%) |
| Single Unit, Attached | 30 (20.5%) | 116 (79.4%) |
| 2 Unit Apartments | 9 (9.8%) | 83 (90.2%) |
| 3 or 4 Unit Apartments | 25 (7.2%) | 320 (92.7%) |
| 5 to 9 Unit Apartments | 0 (0.0%) | 114 (100.0%) |
| 10 or more Apartments | 0 (0.0%) | 164 (100.0%) |
| Mobile Home / Other | 2,155 (76.8%) | 651 (23.2%) |
| Total | 9,490 (79.7%) | 2,423 (20.3%) |
Housing Structures by Number of Rooms in Austin County
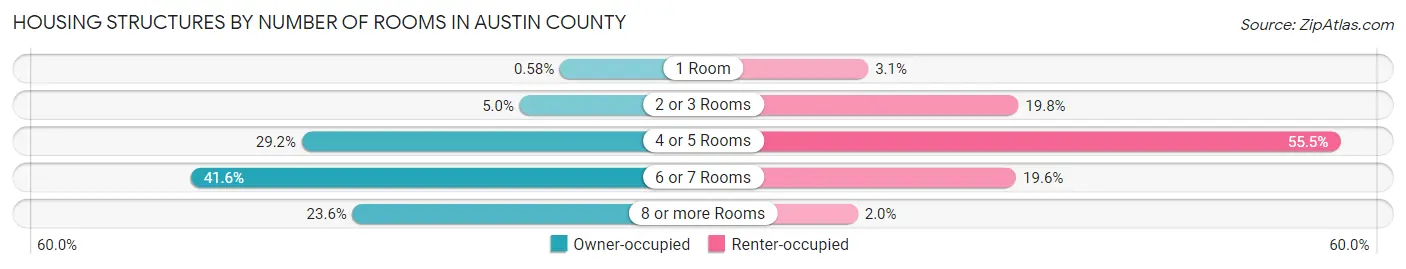
| Number of Rooms | Owner-occupied | Renter-occupied |
| 1 Room | 55 (0.6%) | 76 (3.1%) |
| 2 or 3 Rooms | 478 (5.0%) | 480 (19.8%) |
| 4 or 5 Rooms | 2,774 (29.2%) | 1,345 (55.5%) |
| 6 or 7 Rooms | 3,944 (41.6%) | 474 (19.6%) |
| 8 or more Rooms | 2,239 (23.6%) | 48 (2.0%) |
| Total | 9,490 (100.0%) | 2,423 (100.0%) |
Housing Structure by Heating Type in Austin County
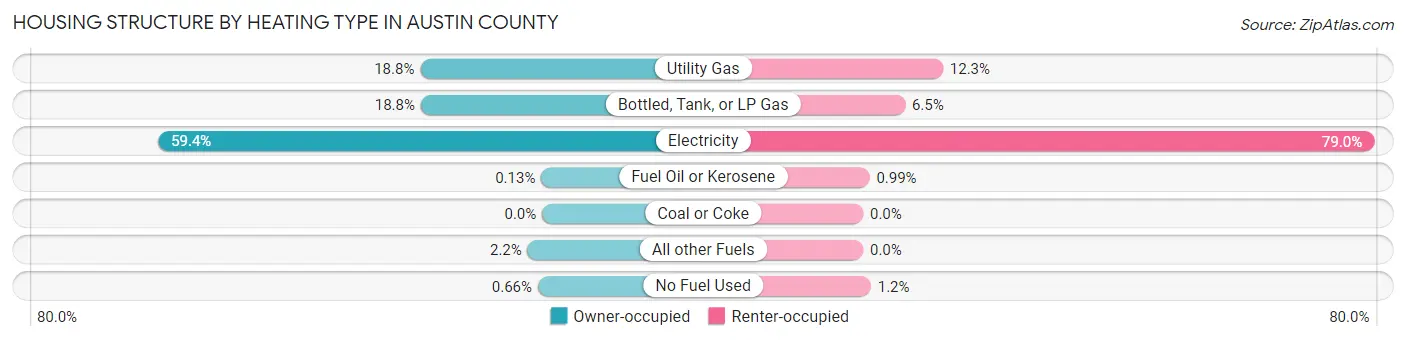
| Heating Type | Owner-occupied | Renter-occupied |
| Utility Gas | 1,788 (18.8%) | 299 (12.3%) |
| Bottled, Tank, or LP Gas | 1,779 (18.8%) | 157 (6.5%) |
| Electricity | 5,635 (59.4%) | 1,914 (79.0%) |
| Fuel Oil or Kerosene | 12 (0.1%) | 24 (1.0%) |
| Coal or Coke | 0 (0.0%) | 0 (0.0%) |
| All other Fuels | 213 (2.2%) | 0 (0.0%) |
| No Fuel Used | 63 (0.7%) | 29 (1.2%) |
| Total | 9,490 (100.0%) | 2,423 (100.0%) |
Household Vehicle Usage in Austin County
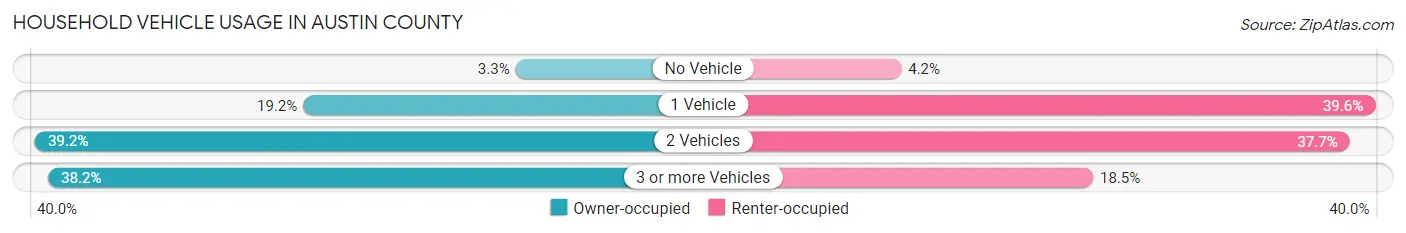
| Vehicles per Household | Owner-occupied | Renter-occupied |
| No Vehicle | 317 (3.3%) | 102 (4.2%) |
| 1 Vehicle | 1,822 (19.2%) | 959 (39.6%) |
| 2 Vehicles | 3,722 (39.2%) | 913 (37.7%) |
| 3 or more Vehicles | 3,629 (38.2%) | 449 (18.5%) |
| Total | 9,490 (100.0%) | 2,423 (100.0%) |
Real Estate & Mortgages in Austin County
Real Estate and Mortgage Overview in Austin County
| Characteristic | Without Mortgage | With Mortgage |
| Housing Units | 5,082 | 4,408 |
| Median Property Value | $212,400 | $265,300 |
| Median Household Income | $70,459 | $1,061 |
| Monthly Housing Costs | $618 | $493 |
| Real Estate Taxes | $2,672 | $95 |
Property Value by Mortgage Status in Austin County
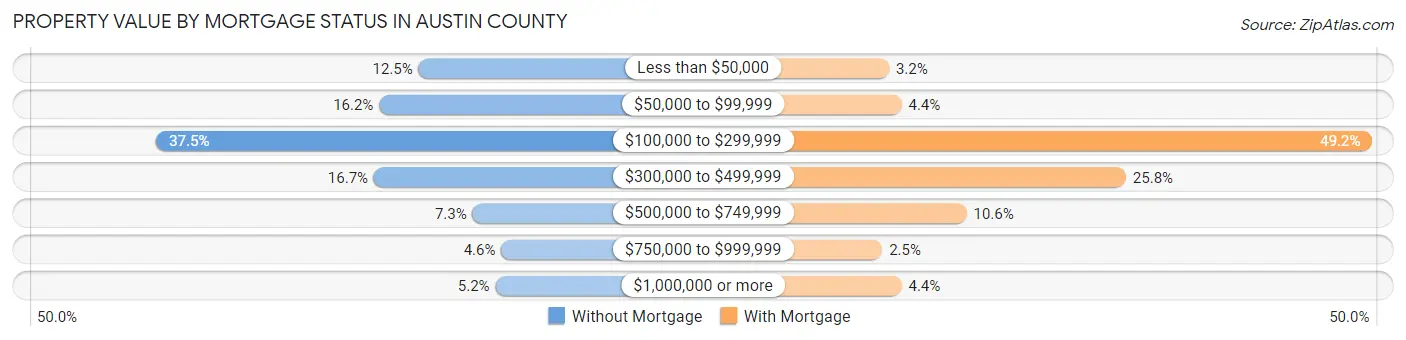
| Property Value | Without Mortgage | With Mortgage |
| Less than $50,000 | 634 (12.5%) | 140 (3.2%) |
| $50,000 to $99,999 | 825 (16.2%) | 193 (4.4%) |
| $100,000 to $299,999 | 1,904 (37.5%) | 2,169 (49.2%) |
| $300,000 to $499,999 | 850 (16.7%) | 1,135 (25.8%) |
| $500,000 to $749,999 | 373 (7.3%) | 466 (10.6%) |
| $750,000 to $999,999 | 234 (4.6%) | 112 (2.5%) |
| $1,000,000 or more | 262 (5.2%) | 193 (4.4%) |
| Total | 5,082 (100.0%) | 4,408 (100.0%) |
Household Income by Mortgage Status in Austin County
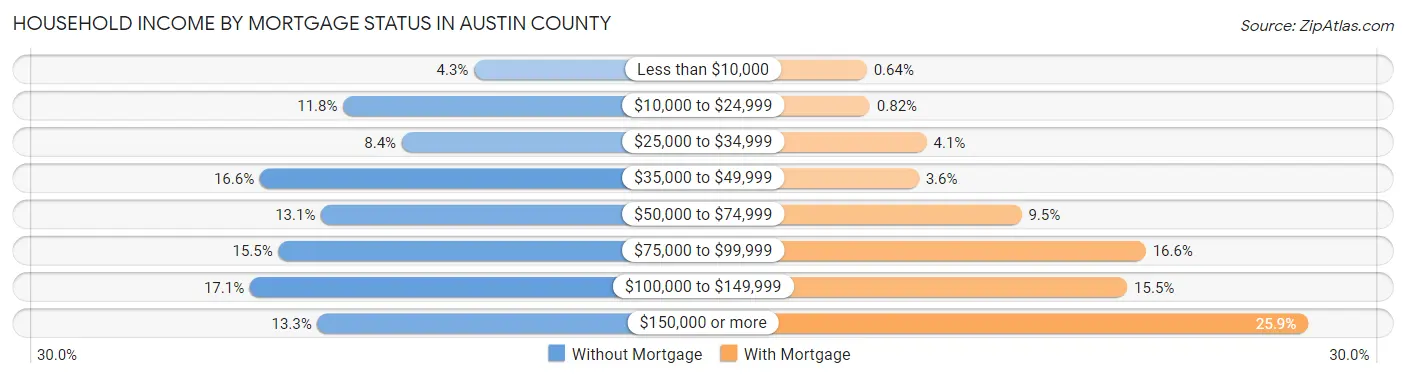
| Household Income | Without Mortgage | With Mortgage |
| Less than $10,000 | 219 (4.3%) | 28 (0.6%) |
| $10,000 to $24,999 | 599 (11.8%) | 36 (0.8%) |
| $25,000 to $34,999 | 429 (8.4%) | 179 (4.1%) |
| $35,000 to $49,999 | 841 (16.6%) | 159 (3.6%) |
| $50,000 to $74,999 | 663 (13.1%) | 418 (9.5%) |
| $75,000 to $99,999 | 787 (15.5%) | 731 (16.6%) |
| $100,000 to $149,999 | 870 (17.1%) | 684 (15.5%) |
| $150,000 or more | 674 (13.3%) | 1,140 (25.9%) |
| Total | 5,082 (100.0%) | 4,408 (100.0%) |
Property Value to Household Income Ratio in Austin County
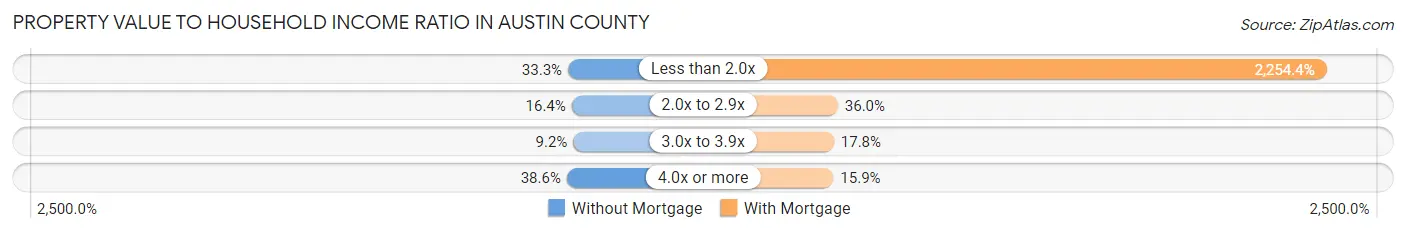
| Value-to-Income Ratio | Without Mortgage | With Mortgage |
| Less than 2.0x | 1,690 (33.3%) | 99,375 (2,254.4%) |
| 2.0x to 2.9x | 835 (16.4%) | 1,587 (36.0%) |
| 3.0x to 3.9x | 465 (9.1%) | 783 (17.8%) |
| 4.0x or more | 1,959 (38.6%) | 699 (15.9%) |
| Total | 5,082 (100.0%) | 4,408 (100.0%) |
Real Estate Taxes by Mortgage Status in Austin County
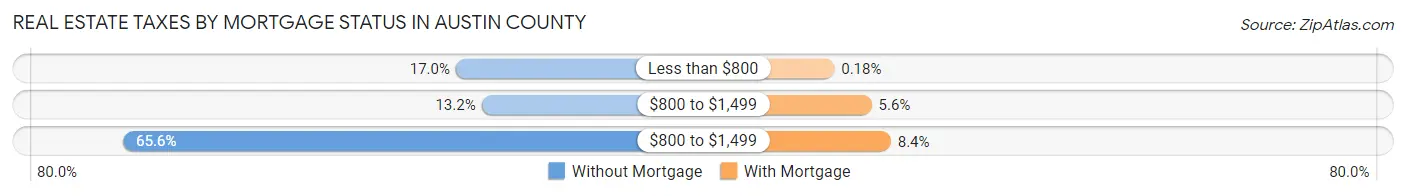
| Property Taxes | Without Mortgage | With Mortgage |
| Less than $800 | 864 (17.0%) | 8 (0.2%) |
| $800 to $1,499 | 673 (13.2%) | 248 (5.6%) |
| $800 to $1,499 | 3,334 (65.6%) | 372 (8.4%) |
| Total | 5,082 (100.0%) | 4,408 (100.0%) |
Health & Disability in Austin County
Health Insurance Coverage by Age in Austin County
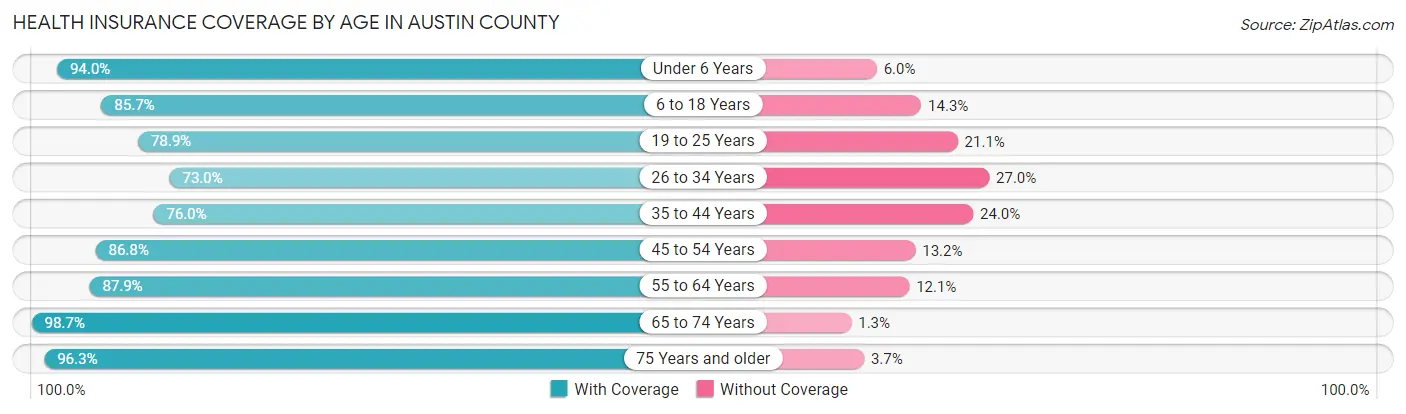
| Age Bracket | With Coverage | Without Coverage |
| Under 6 Years | 1,742 (94.0%) | 112 (6.0%) |
| 6 to 18 Years | 4,861 (85.7%) | 813 (14.3%) |
| 19 to 25 Years | 1,705 (78.9%) | 457 (21.1%) |
| 26 to 34 Years | 2,376 (73.0%) | 879 (27.0%) |
| 35 to 44 Years | 2,686 (76.0%) | 849 (24.0%) |
| 45 to 54 Years | 2,961 (86.8%) | 452 (13.2%) |
| 55 to 64 Years | 3,800 (87.9%) | 523 (12.1%) |
| 65 to 74 Years | 3,567 (98.7%) | 47 (1.3%) |
| 75 Years and older | 2,233 (96.3%) | 85 (3.7%) |
| Total | 25,931 (86.0%) | 4,217 (14.0%) |
Health Insurance Coverage by Citizenship Status in Austin County
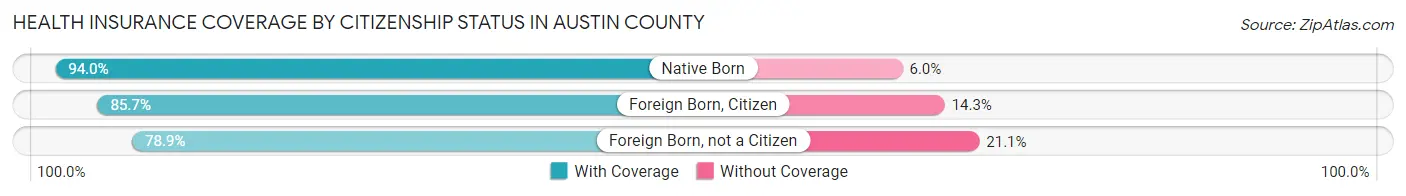
| Citizenship Status | With Coverage | Without Coverage |
| Native Born | 1,742 (94.0%) | 112 (6.0%) |
| Foreign Born, Citizen | 4,861 (85.7%) | 813 (14.3%) |
| Foreign Born, not a Citizen | 1,705 (78.9%) | 457 (21.1%) |
Health Insurance Coverage by Household Income in Austin County
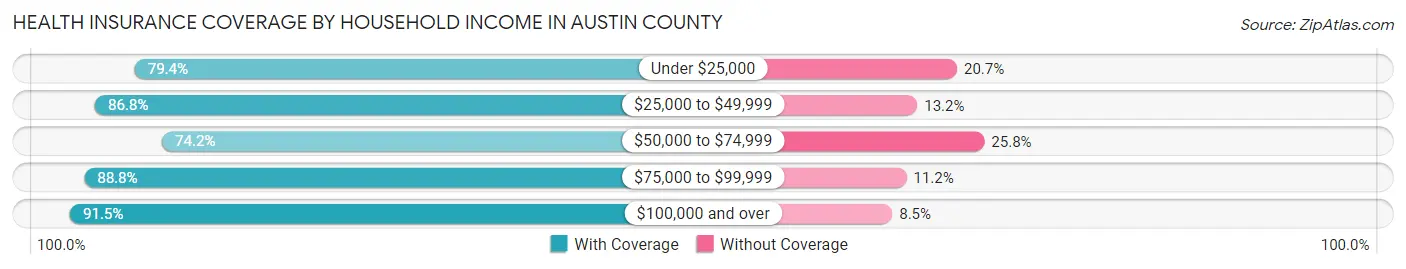
| Household Income | With Coverage | Without Coverage |
| Under $25,000 | 2,475 (79.3%) | 644 (20.6%) |
| $25,000 to $49,999 | 4,461 (86.8%) | 679 (13.2%) |
| $50,000 to $74,999 | 3,887 (74.2%) | 1,350 (25.8%) |
| $75,000 to $99,999 | 4,252 (88.8%) | 536 (11.2%) |
| $100,000 and over | 10,807 (91.5%) | 1,007 (8.5%) |
Public vs Private Health Insurance Coverage by Age in Austin County
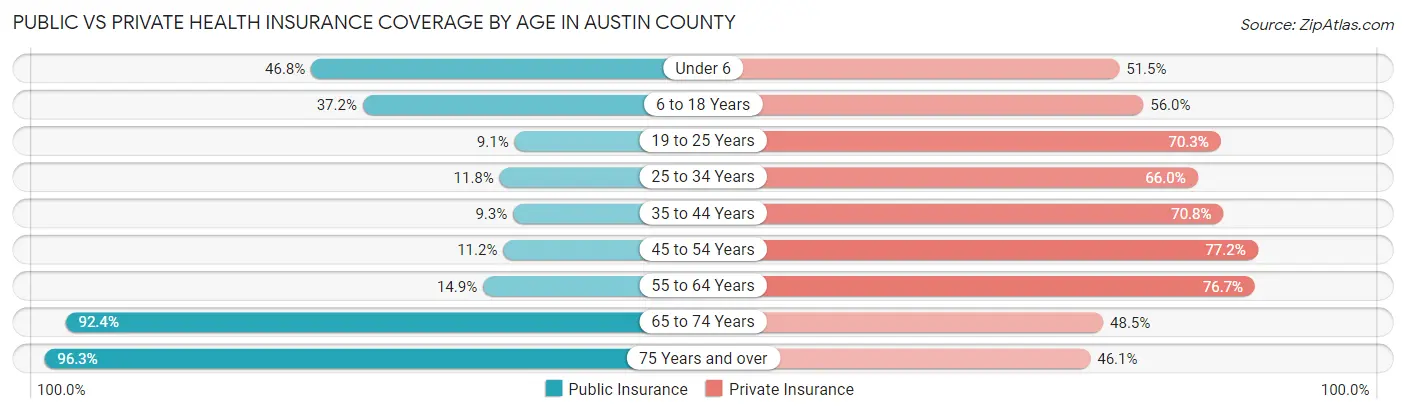
| Age Bracket | Public Insurance | Private Insurance |
| Under 6 | 868 (46.8%) | 955 (51.5%) |
| 6 to 18 Years | 2,113 (37.2%) | 3,176 (56.0%) |
| 19 to 25 Years | 196 (9.1%) | 1,520 (70.3%) |
| 25 to 34 Years | 385 (11.8%) | 2,149 (66.0%) |
| 35 to 44 Years | 330 (9.3%) | 2,503 (70.8%) |
| 45 to 54 Years | 381 (11.2%) | 2,633 (77.1%) |
| 55 to 64 Years | 645 (14.9%) | 3,315 (76.7%) |
| 65 to 74 Years | 3,339 (92.4%) | 1,753 (48.5%) |
| 75 Years and over | 2,233 (96.3%) | 1,069 (46.1%) |
| Total | 10,490 (34.8%) | 19,073 (63.3%) |
Disability Status by Sex by Age in Austin County
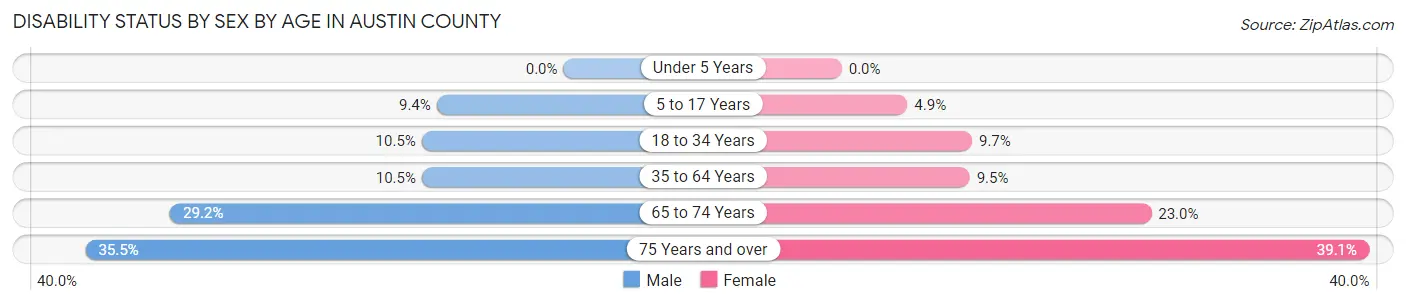
| Age Bracket | Male | Female |
| Under 5 Years | 0 (0.0%) | 0 (0.0%) |
| 5 to 17 Years | 259 (9.4%) | 133 (4.9%) |
| 18 to 34 Years | 310 (10.5%) | 277 (9.7%) |
| 35 to 64 Years | 596 (10.5%) | 532 (9.5%) |
| 65 to 74 Years | 514 (29.2%) | 426 (23.0%) |
| 75 Years and over | 380 (35.5%) | 488 (39.1%) |
Disability Class by Sex by Age in Austin County
Disability Class: Hearing Difficulty
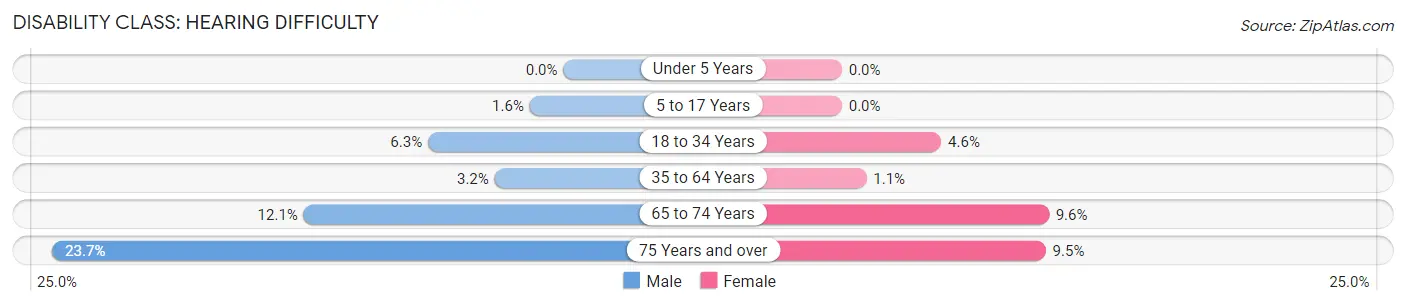
| Age Bracket | Male | Female |
| Under 5 Years | 0 (0.0%) | 0 (0.0%) |
| 5 to 17 Years | 43 (1.6%) | 0 (0.0%) |
| 18 to 34 Years | 185 (6.3%) | 132 (4.6%) |
| 35 to 64 Years | 181 (3.2%) | 64 (1.1%) |
| 65 to 74 Years | 212 (12.0%) | 178 (9.6%) |
| 75 Years and over | 254 (23.7%) | 118 (9.5%) |
Disability Class: Vision Difficulty
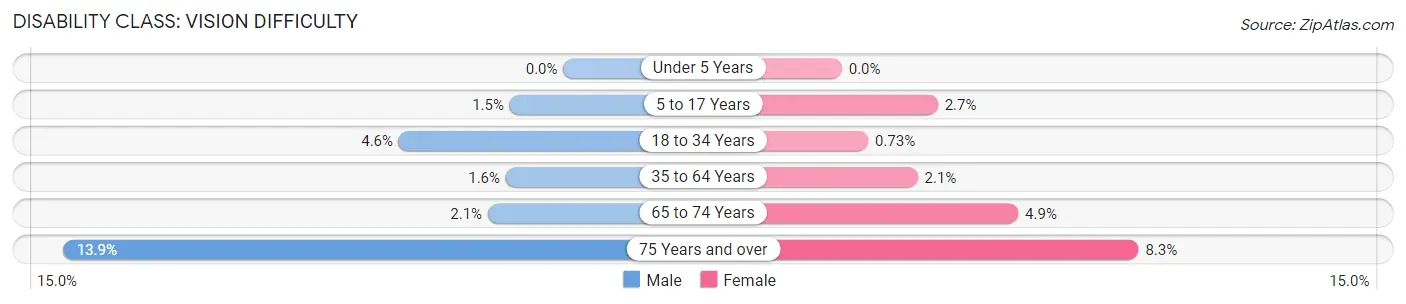
| Age Bracket | Male | Female |
| Under 5 Years | 0 (0.0%) | 0 (0.0%) |
| 5 to 17 Years | 41 (1.5%) | 73 (2.7%) |
| 18 to 34 Years | 135 (4.6%) | 21 (0.7%) |
| 35 to 64 Years | 91 (1.6%) | 118 (2.1%) |
| 65 to 74 Years | 37 (2.1%) | 91 (4.9%) |
| 75 Years and over | 149 (13.9%) | 103 (8.3%) |
Disability Class: Cognitive Difficulty
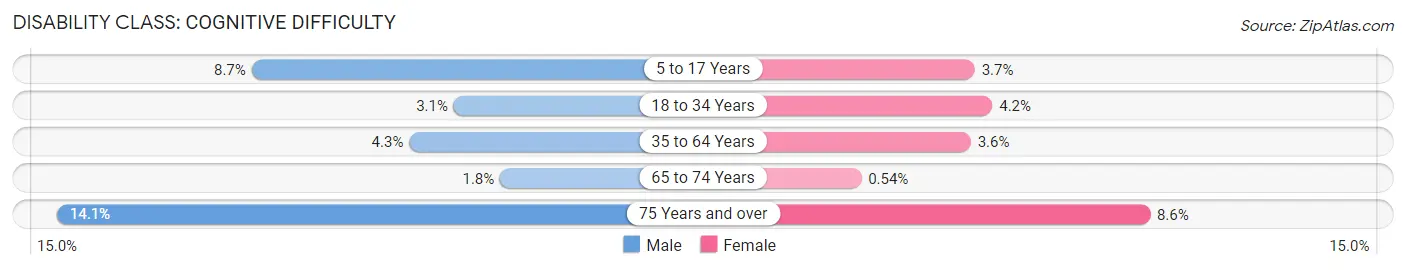
| Age Bracket | Male | Female |
| 5 to 17 Years | 239 (8.7%) | 101 (3.7%) |
| 18 to 34 Years | 90 (3.0%) | 120 (4.2%) |
| 35 to 64 Years | 243 (4.3%) | 201 (3.6%) |
| 65 to 74 Years | 31 (1.8%) | 10 (0.5%) |
| 75 Years and over | 151 (14.1%) | 107 (8.6%) |
Disability Class: Ambulatory Difficulty
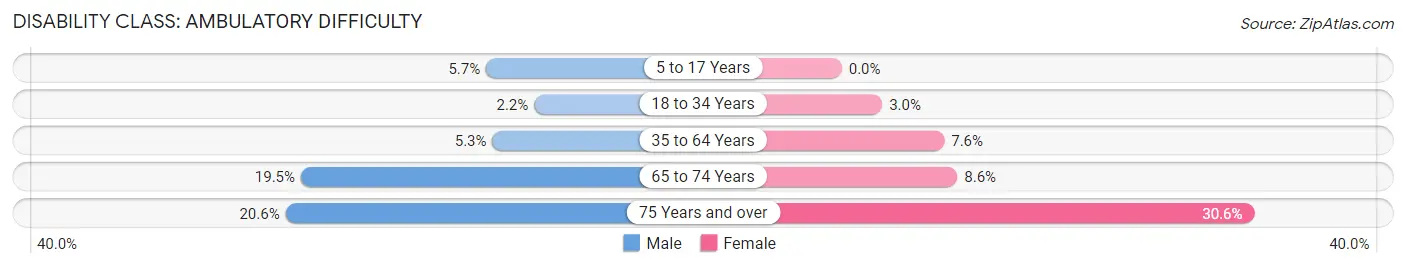
| Age Bracket | Male | Female |
| 5 to 17 Years | 158 (5.7%) | 0 (0.0%) |
| 18 to 34 Years | 64 (2.2%) | 86 (3.0%) |
| 35 to 64 Years | 299 (5.3%) | 426 (7.6%) |
| 65 to 74 Years | 343 (19.5%) | 159 (8.6%) |
| 75 Years and over | 221 (20.6%) | 382 (30.6%) |
Disability Class: Self-Care Difficulty
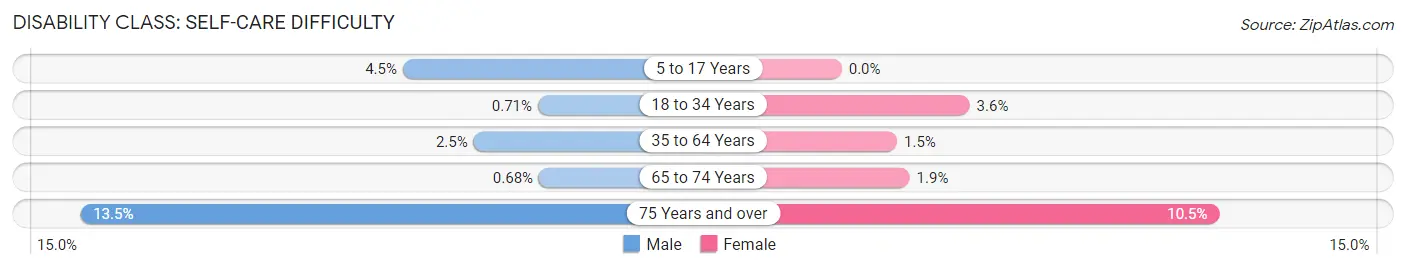
| Age Bracket | Male | Female |
| 5 to 17 Years | 123 (4.5%) | 0 (0.0%) |
| 18 to 34 Years | 21 (0.7%) | 102 (3.6%) |
| 35 to 64 Years | 142 (2.5%) | 86 (1.5%) |
| 65 to 74 Years | 12 (0.7%) | 35 (1.9%) |
| 75 Years and over | 144 (13.5%) | 131 (10.5%) |
Technology Access in Austin County
Computing Device Access in Austin County
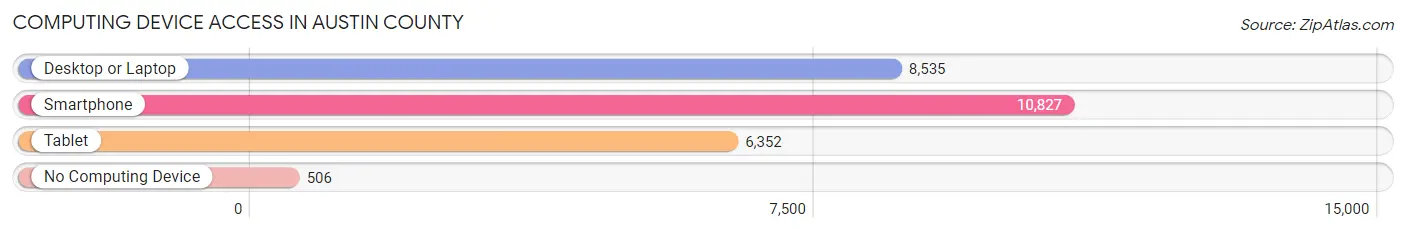
| Device Type | # Households | % Households |
| Desktop or Laptop | 8,535 | 71.6% |
| Smartphone | 10,827 | 90.9% |
| Tablet | 6,352 | 53.3% |
| No Computing Device | 506 | 4.3% |
| Total | 11,913 | 100.0% |
Internet Access in Austin County
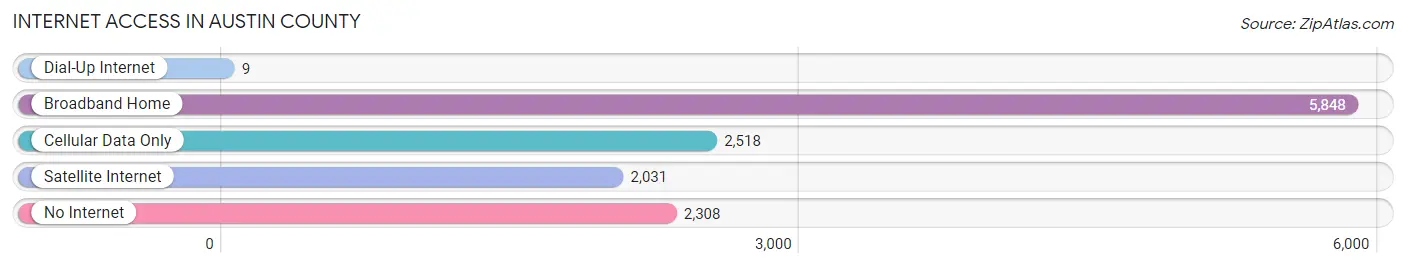
| Internet Type | # Households | % Households |
| Dial-Up Internet | 9 | 0.1% |
| Broadband Home | 5,848 | 49.1% |
| Cellular Data Only | 2,518 | 21.1% |
| Satellite Internet | 2,031 | 17.1% |
| No Internet | 2,308 | 19.4% |
| Total | 11,913 | 100.0% |
Austin County Summary
Austin County is located in the southeastern part of Texas, and is part of the Greater Houston metropolitan area. It is bordered by Waller County to the north, Fort Bend County to the east, Colorado County to the south, and Washington and Fayette counties to the west. The county seat is Bellville, and the largest city is Sealy. The county has a total area of 590 square miles, and a population of 28,417 as of the 2010 census.
History
Austin County was established in 1837 and named after Stephen F. Austin, the “Father of Texas.” The county was originally part of the Municipality of Viesca, which was created in 1824. The county was organized in 1837, and the first county seat was located in San Felipe. In 1846, the county seat was moved to Bellville, where it remains today.
During the Civil War, Austin County was a major center of Confederate activity. The county was home to several Confederate military camps, and the Battle of Mill Creek was fought in the county in 1863. After the war, the county experienced a period of growth and development, with the establishment of several towns and the construction of the Houston and Texas Central Railway in 1871.
Geography
Austin County is located in the southeastern part of Texas, and is part of the Greater Houston metropolitan area. It is bordered by Waller County to the north, Fort Bend County to the east, Colorado County to the south, and Washington and Fayette counties to the west. The county has a total area of 590 square miles, and is mostly flat with some rolling hills. The terrain is mostly covered in grasslands, with some wooded areas. The county is drained by the Brazos River, which forms its northern border.
Economy
The economy of Austin County is largely based on agriculture and oil and gas production. The county is home to several large farms, and the main crops grown in the area are corn, cotton, and hay. The county is also home to several oil and gas production sites, and the industry is a major contributor to the local economy. Other industries in the county include manufacturing, retail, and tourism.
Demographics
As of the 2010 census, Austin County had a population of 28,417. The racial makeup of the county was 79.3% White, 14.2% Hispanic or Latino, 8.2% African American, 0.7% Native American, 0.4% Asian, and 0.2% Pacific Islander. The median household income was $50,945, and the median family income was $58,945. The per capita income was $22,945.
Conclusion
Austin County is a rural county located in the southeastern part of Texas. It has a rich history, and is home to several large farms and oil and gas production sites. The county has a population of 28,417, and the economy is largely based on agriculture and oil and gas production. The county is also home to several retail and tourism businesses, and is part of the Greater Houston metropolitan area.
Common Questions
What is Per Capita Income in Austin County?
Per Capita income in Austin County is $36,399.
What is the Median Family Income in Austin County?
Median Family Income in Austin County is $87,105.
What is the Median Household income in Austin County?
Median Household Income in Austin County is $73,556.
What is Income or Wage Gap in Austin County?
Income or Wage Gap in Austin County is 44.2%.
Women in Austin County earn 55.8 cents for every dollar earned by a man.
What is Family Income Deficit in Austin County?
Family Income Deficit in Austin County is $10,222.
Families that are below poverty line in Austin County earn $10,222 less on average than the poverty threshold level.
What is Inequality or Gini Index in Austin County?
Inequality or Gini Index in Austin County is 0.42.
What is the Total Population of Austin County?
Total Population of Austin County is 30,406.
What is the Total Male Population of Austin County?
Total Male Population of Austin County is 15,298.
What is the Total Female Population of Austin County?
Total Female Population of Austin County is 15,108.
What is the Ratio of Males per 100 Females in Austin County?
There are 101.26 Males per 100 Females in Austin County.
What is the Ratio of Females per 100 Males in Austin County?
There are 98.76 Females per 100 Males in Austin County.
What is the Median Population Age in Austin County?
Median Population Age in Austin County is 41.0 Years.
What is the Average Family Size in Austin County
Average Family Size in Austin County is 2.9 People.
What is the Average Household Size in Austin County
Average Household Size in Austin County is 2.5 People.
How Large is the Labor Force in Austin County?
There are 15,134 People in the Labor Forcein in Austin County.
What is the Percentage of People in the Labor Force in Austin County?
62.9% of People are in the Labor Force in Austin County.
What is the Unemployment Rate in Austin County?
Unemployment Rate in Austin County is 3.8%.