Atascosa County, TX Map & Demographics
Atascosa County Map
Atascosa County Overview
$27,386
PER CAPITA INCOME
$77,582
AVG FAMILY INCOME
$67,442
AVG HOUSEHOLD INCOME
33.2%
WAGE / INCOME GAP [ % ]
66.8¢/ $1
WAGE / INCOME GAP [ $ ]
$9,470
FAMILY INCOME DEFICIT
0.43
INEQUALITY / GINI INDEX
49,403
TOTAL POPULATION
24,580
MALE POPULATION
24,823
FEMALE POPULATION
99.02
MALES / 100 FEMALES
100.99
FEMALES / 100 MALES
35.8
MEDIAN AGE
3.6
AVG FAMILY SIZE
3.1
AVG HOUSEHOLD SIZE
21,995
LABOR FORCE [ PEOPLE ]
58.1%
PERCENT IN LABOR FORCE
6.4%
UNEMPLOYMENT RATE
Income in Atascosa County
Income Overview in Atascosa County
Per Capita Income in Atascosa County is $27,386, while median incomes of families and households are $77,582 and $67,442 respectively.
| Characteristic | Number | Measure |
| Per Capita Income | 49,403 | $27,386 |
| Median Family Income | 11,859 | $77,582 |
| Mean Family Income | 11,859 | $91,810 |
| Median Household Income | 15,920 | $67,442 |
| Mean Household Income | 15,920 | $81,385 |
| Income Deficit | 11,859 | $9,470 |
| Wage / Income Gap (%) | 49,403 | 33.15% |
| Wage / Income Gap ($) | 49,403 | 66.85¢ per $1 |
| Gini / Inequality Index | 49,403 | 0.43 |
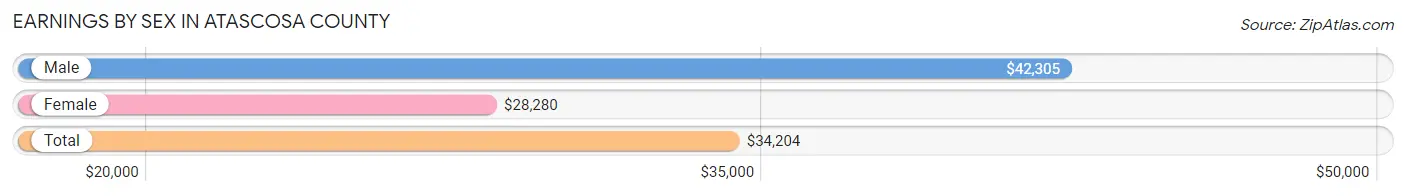
Earnings by Sex in Atascosa County
Average Earnings in Atascosa County are $34,204, $42,305 for men and $28,280 for women, a difference of 33.2%.
| Sex | Number | Average Earnings |
| Male | 12,798 (55.8%) | $42,305 |
| Female | 10,144 (44.2%) | $28,280 |
| Total | 22,942 (100.0%) | $34,204 |
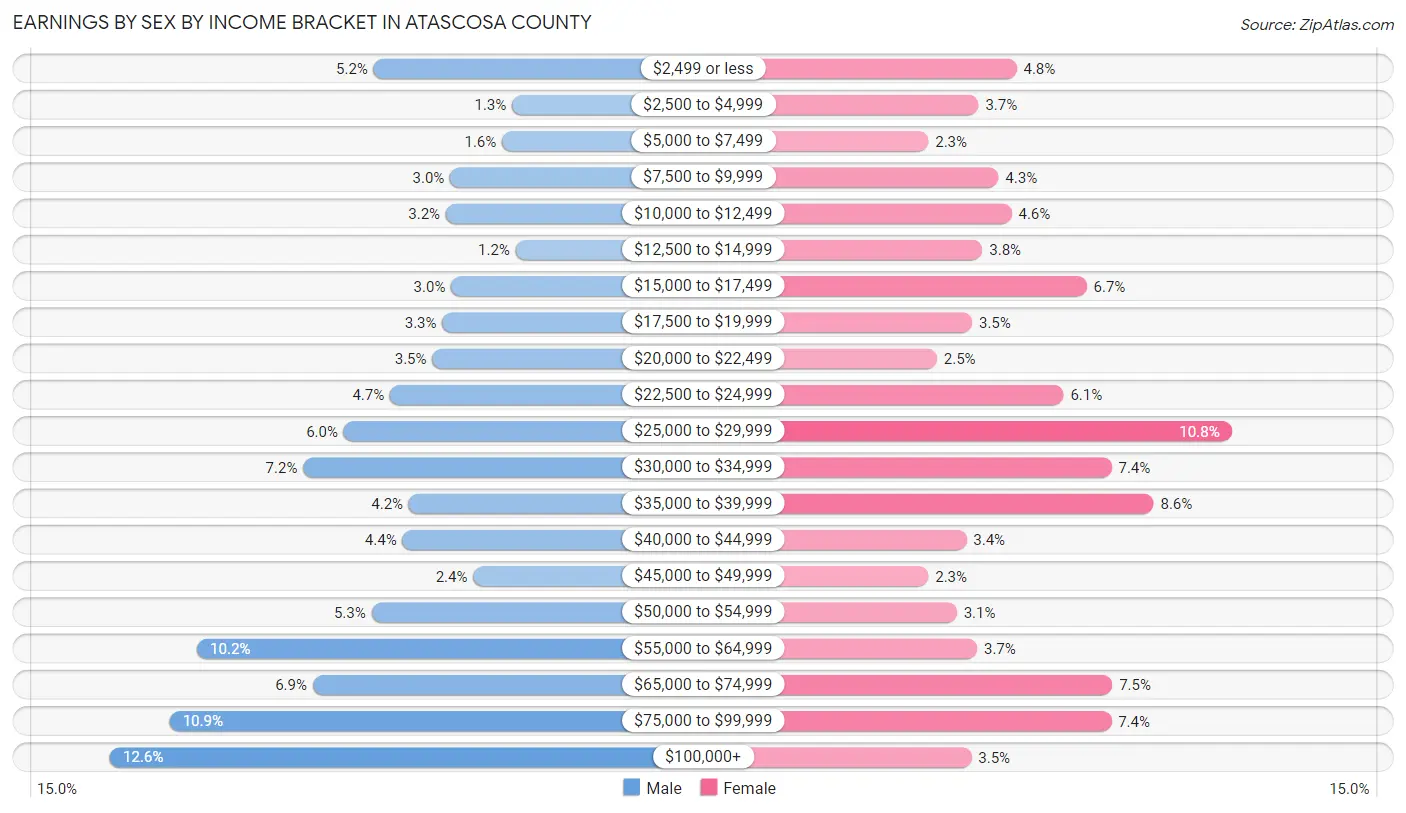
Earnings by Sex by Income Bracket in Atascosa County
The most common earnings brackets in Atascosa County are $100,000+ for men (1,612 | 12.6%) and $25,000 to $29,999 for women (1,097 | 10.8%).
| Income | Male | Female |
| $2,499 or less | 664 (5.2%) | 484 (4.8%) |
| $2,500 to $4,999 | 167 (1.3%) | 375 (3.7%) |
| $5,000 to $7,499 | 202 (1.6%) | 232 (2.3%) |
| $7,500 to $9,999 | 389 (3.0%) | 432 (4.3%) |
| $10,000 to $12,499 | 405 (3.2%) | 470 (4.6%) |
| $12,500 to $14,999 | 153 (1.2%) | 386 (3.8%) |
| $15,000 to $17,499 | 385 (3.0%) | 684 (6.7%) |
| $17,500 to $19,999 | 417 (3.3%) | 357 (3.5%) |
| $20,000 to $22,499 | 453 (3.5%) | 257 (2.5%) |
| $22,500 to $24,999 | 605 (4.7%) | 618 (6.1%) |
| $25,000 to $29,999 | 772 (6.0%) | 1,097 (10.8%) |
| $30,000 to $34,999 | 918 (7.2%) | 755 (7.4%) |
| $35,000 to $39,999 | 538 (4.2%) | 874 (8.6%) |
| $40,000 to $44,999 | 560 (4.4%) | 341 (3.4%) |
| $45,000 to $49,999 | 306 (2.4%) | 232 (2.3%) |
| $50,000 to $54,999 | 672 (5.2%) | 313 (3.1%) |
| $55,000 to $64,999 | 1,299 (10.2%) | 371 (3.7%) |
| $65,000 to $74,999 | 883 (6.9%) | 757 (7.5%) |
| $75,000 to $99,999 | 1,398 (10.9%) | 754 (7.4%) |
| $100,000+ | 1,612 (12.6%) | 355 (3.5%) |
| Total | 12,798 (100.0%) | 10,144 (100.0%) |
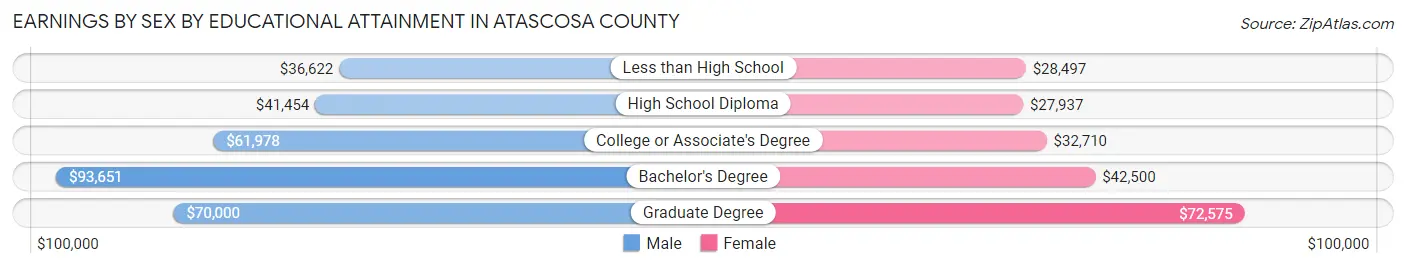
Earnings by Sex by Educational Attainment in Atascosa County
Average earnings in Atascosa County are $51,449 for men and $31,733 for women, a difference of 38.3%. Men with an educational attainment of bachelor's degree enjoy the highest average annual earnings of $93,651, while those with less than high school education earn the least with $36,622. Women with an educational attainment of graduate degree earn the most with the average annual earnings of $72,575, while those with high school diploma education have the smallest earnings of $27,937.
| Educational Attainment | Male Income | Female Income |
| Less than High School | $36,622 | $28,497 |
| High School Diploma | $41,454 | $27,937 |
| College or Associate's Degree | $61,978 | $32,710 |
| Bachelor's Degree | $93,651 | $42,500 |
| Graduate Degree | $70,000 | $72,575 |
| Total | $51,449 | $31,733 |
Family Income in Atascosa County
Family Income Brackets in Atascosa County
According to the Atascosa County family income data, there are 2,585 families falling into the $100,000 to $149,999 income range, which is the most common income bracket and makes up 21.8% of all families. Conversely, the less than $10,000 income bracket is the least frequent group with only 273 families (2.3%) belonging to this category.
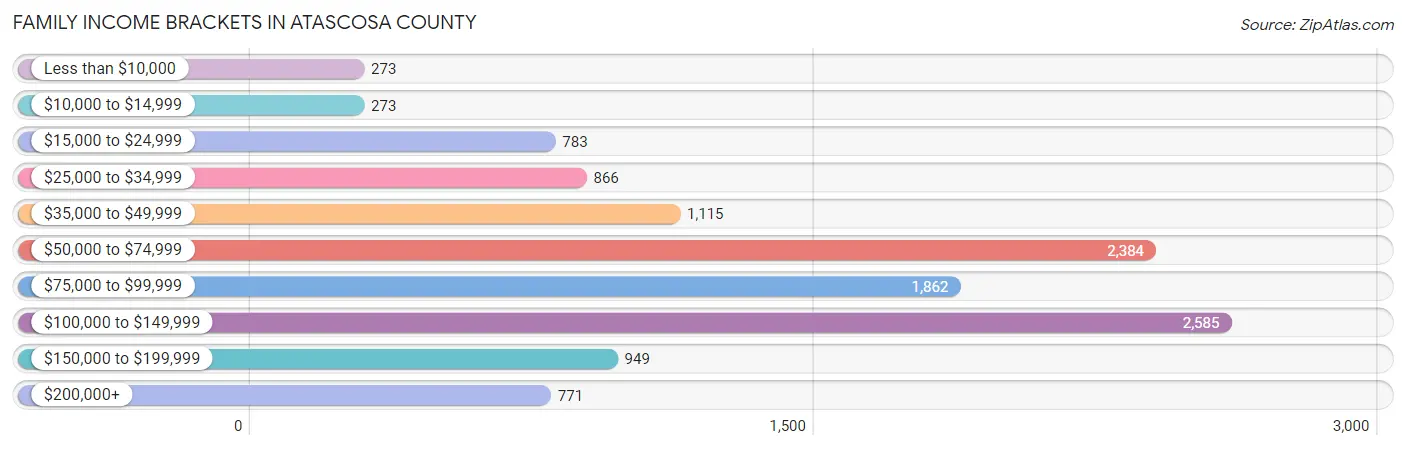
| Income Bracket | # Families | % Families |
| Less than $10,000 | 273 | 2.3% |
| $10,000 to $14,999 | 273 | 2.3% |
| $15,000 to $24,999 | 783 | 6.6% |
| $25,000 to $34,999 | 866 | 7.3% |
| $35,000 to $49,999 | 1,115 | 9.4% |
| $50,000 to $74,999 | 2,384 | 20.1% |
| $75,000 to $99,999 | 1,862 | 15.7% |
| $100,000 to $149,999 | 2,585 | 21.8% |
| $150,000 to $199,999 | 949 | 8.0% |
| $200,000+ | 771 | 6.5% |
Family Income by Famaliy Size in Atascosa County
7+ person families (574 | 4.8%) account for the highest median family income in Atascosa County with $126,429 per family, while 2-person families (4,996 | 42.1%) have the highest median income of $36,638 per family member.
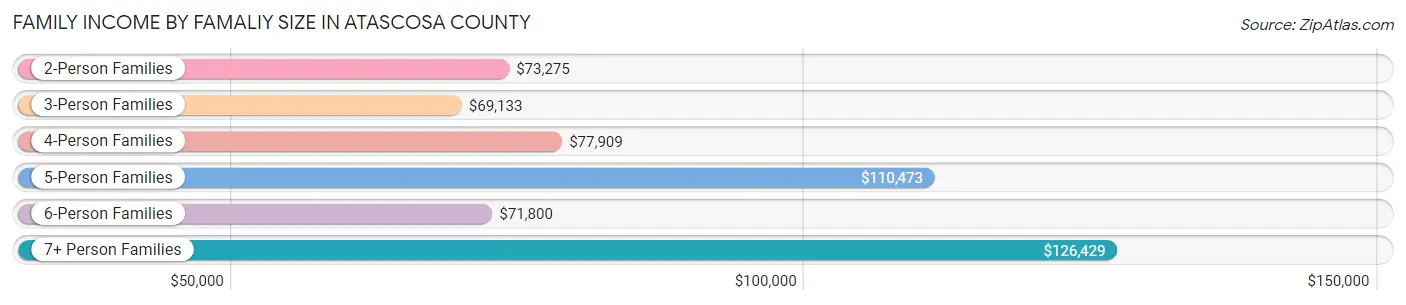
| Income Bracket | # Families | Median Income |
| 2-Person Families | 4,996 (42.1%) | $73,275 |
| 3-Person Families | 2,419 (20.4%) | $69,133 |
| 4-Person Families | 2,254 (19.0%) | $77,909 |
| 5-Person Families | 1,281 (10.8%) | $110,473 |
| 6-Person Families | 335 (2.8%) | $71,800 |
| 7+ Person Families | 574 (4.8%) | $126,429 |
| Total | 11,859 (100.0%) | $77,582 |
Family Income by Number of Earners in Atascosa County
The median family income in Atascosa County is $77,582, with families comprising 3+ earners (1,543) having the highest median family income of $126,397, while families with no earners (1,688) have the lowest median family income of $48,375, accounting for 13.0% and 14.2% of families, respectively.
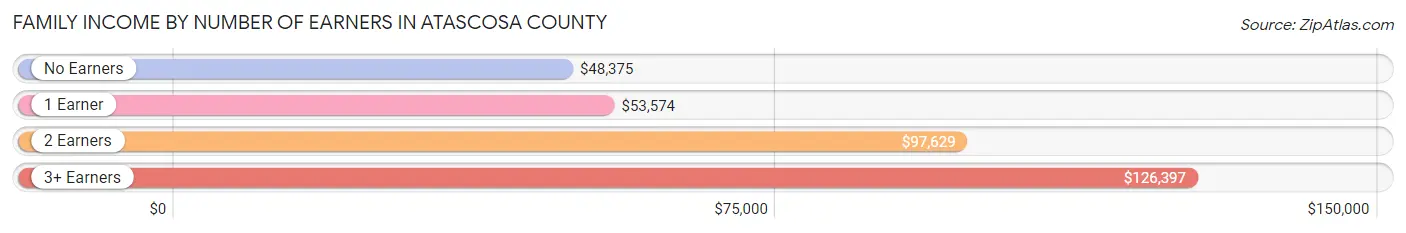
| Number of Earners | # Families | Median Income |
| No Earners | 1,688 (14.2%) | $48,375 |
| 1 Earner | 4,070 (34.3%) | $53,574 |
| 2 Earners | 4,558 (38.4%) | $97,629 |
| 3+ Earners | 1,543 (13.0%) | $126,397 |
| Total | 11,859 (100.0%) | $77,582 |
Household Income in Atascosa County
Household Income Brackets in Atascosa County
With 2,945 households falling in the category, the $100,000 to $149,999 income range is the most frequent in Atascosa County, accounting for 18.5% of all households. In contrast, only 732 households (4.6%) fall into the less than $10,000 income bracket, making it the least populous group.
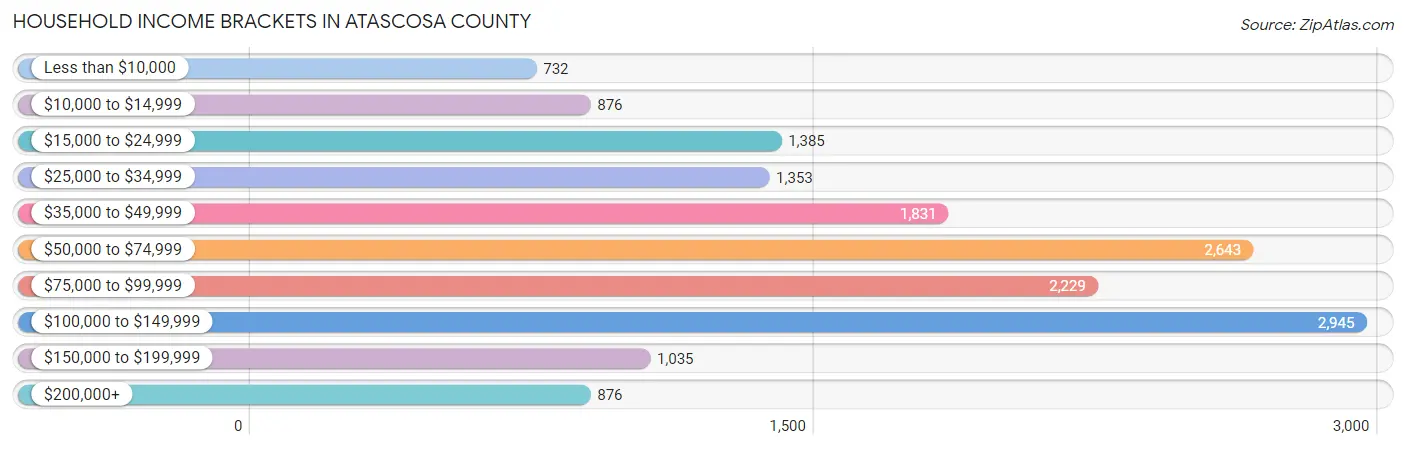
| Income Bracket | # Households | % Households |
| Less than $10,000 | 732 | 4.6% |
| $10,000 to $14,999 | 876 | 5.5% |
| $15,000 to $24,999 | 1,385 | 8.7% |
| $25,000 to $34,999 | 1,353 | 8.5% |
| $35,000 to $49,999 | 1,831 | 11.5% |
| $50,000 to $74,999 | 2,643 | 16.6% |
| $75,000 to $99,999 | 2,229 | 14.0% |
| $100,000 to $149,999 | 2,945 | 18.5% |
| $150,000 to $199,999 | 1,035 | 6.5% |
| $200,000+ | 876 | 5.5% |
Household Income by Householder Age in Atascosa County
The median household income in Atascosa County is $67,442, with the highest median household income of $75,897 found in the 45 to 64 years age bracket for the primary householder. A total of 6,310 households (39.6%) fall into this category. Meanwhile, the 15 to 24 years age bracket for the primary householder has the lowest median household income of $0, with 182 households (1.1%) in this group.
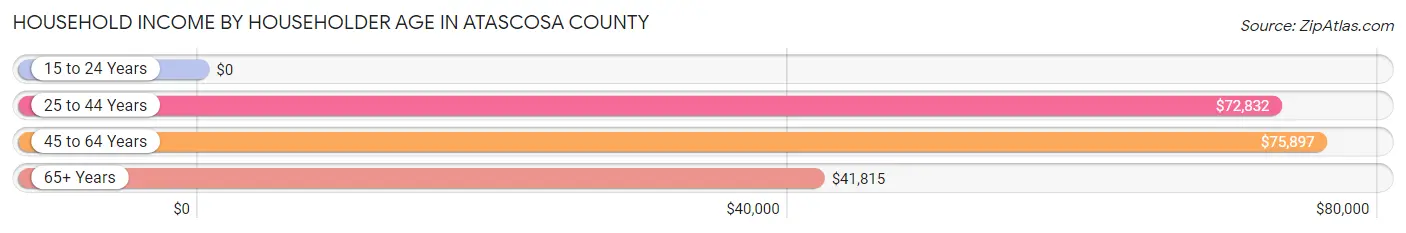
| Income Bracket | # Households | Median Income |
| 15 to 24 Years | 182 (1.1%) | $0 |
| 25 to 44 Years | 5,215 (32.8%) | $72,832 |
| 45 to 64 Years | 6,310 (39.6%) | $75,897 |
| 65+ Years | 4,213 (26.5%) | $41,815 |
| Total | 15,920 (100.0%) | $67,442 |
Poverty in Atascosa County
Income Below Poverty by Sex and Age in Atascosa County
With 13.0% poverty level for males and 15.1% for females among the residents of Atascosa County, 12 to 14 year old males and 15 year old females are the most vulnerable to poverty, with 297 males (24.8%) and 78 females (21.9%) in their respective age groups living below the poverty level.
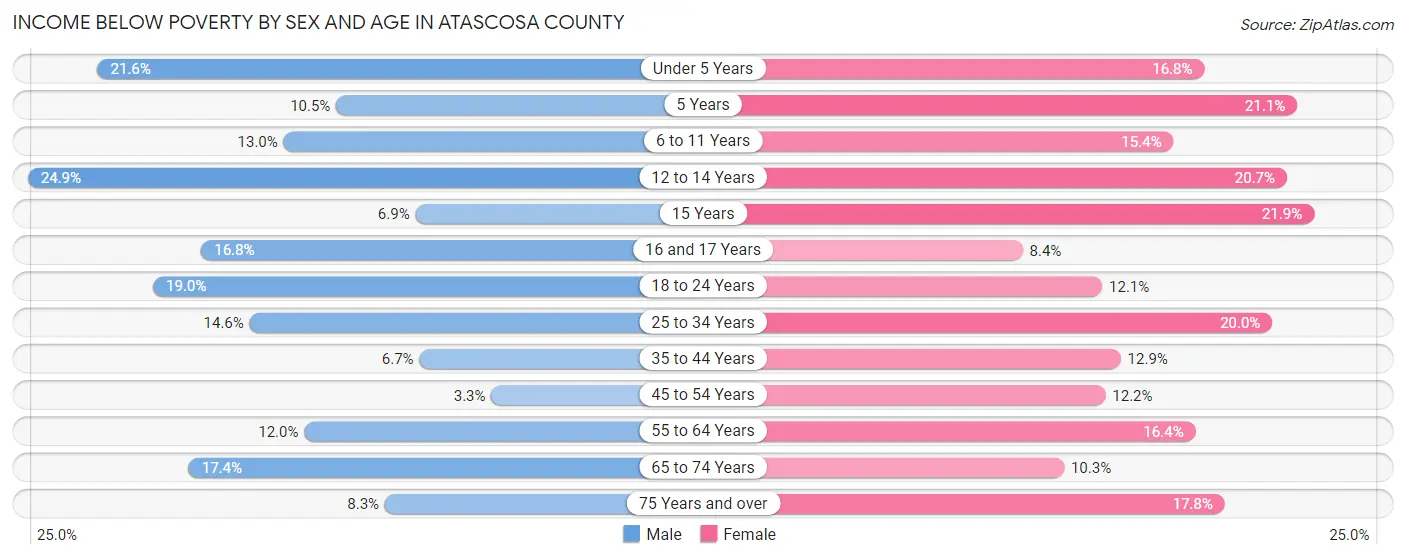
| Age Bracket | Male | Female |
| Under 5 Years | 374 (21.6%) | 273 (16.8%) |
| 5 Years | 39 (10.5%) | 60 (21.1%) |
| 6 to 11 Years | 275 (13.0%) | 309 (15.4%) |
| 12 to 14 Years | 297 (24.8%) | 272 (20.6%) |
| 15 Years | 14 (6.9%) | 78 (21.9%) |
| 16 and 17 Years | 170 (16.8%) | 62 (8.4%) |
| 18 to 24 Years | 434 (19.0%) | 275 (12.1%) |
| 25 to 34 Years | 460 (14.6%) | 603 (20.0%) |
| 35 to 44 Years | 214 (6.7%) | 412 (12.9%) |
| 45 to 54 Years | 100 (3.3%) | 352 (12.2%) |
| 55 to 64 Years | 334 (12.0%) | 478 (16.4%) |
| 65 to 74 Years | 347 (17.4%) | 225 (10.3%) |
| 75 Years and over | 102 (8.3%) | 278 (17.8%) |
| Total | 3,160 (13.0%) | 3,677 (15.1%) |
Income Above Poverty by Sex and Age in Atascosa County
According to the poverty statistics in Atascosa County, males aged 45 to 54 years and females aged 16 and 17 years are the age groups that are most secure financially, with 96.7% of males and 91.6% of females in these age groups living above the poverty line.
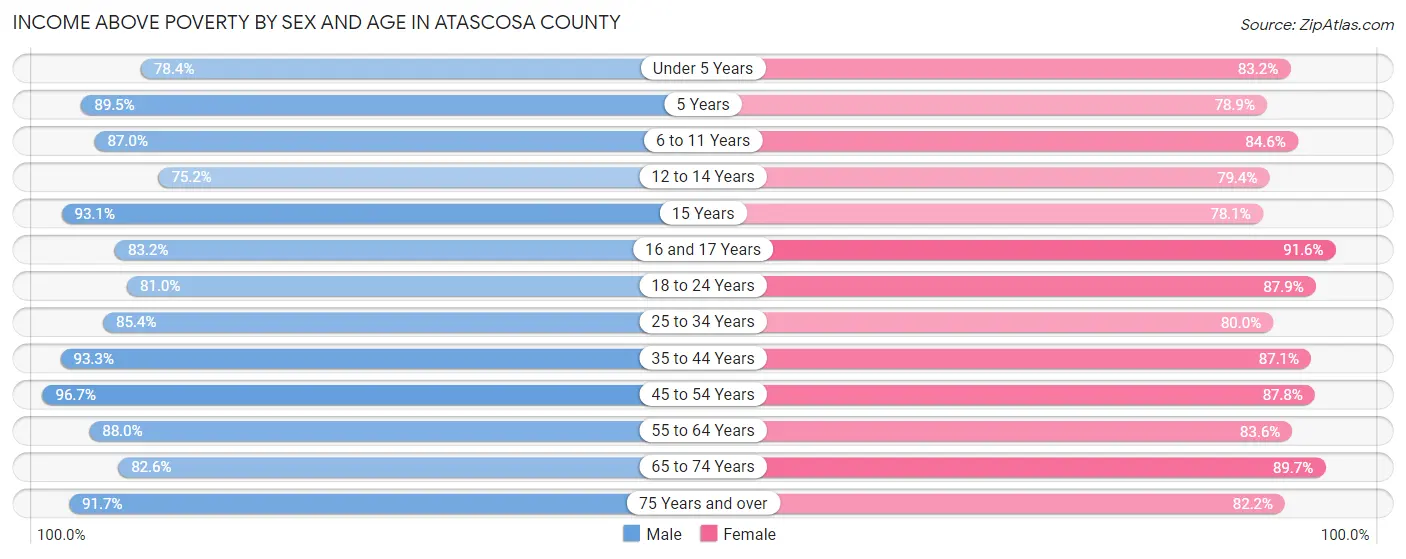
| Age Bracket | Male | Female |
| Under 5 Years | 1,357 (78.4%) | 1,350 (83.2%) |
| 5 Years | 331 (89.5%) | 224 (78.9%) |
| 6 to 11 Years | 1,844 (87.0%) | 1,699 (84.6%) |
| 12 to 14 Years | 898 (75.1%) | 1,045 (79.3%) |
| 15 Years | 190 (93.1%) | 278 (78.1%) |
| 16 and 17 Years | 842 (83.2%) | 677 (91.6%) |
| 18 to 24 Years | 1,845 (81.0%) | 2,002 (87.9%) |
| 25 to 34 Years | 2,700 (85.4%) | 2,416 (80.0%) |
| 35 to 44 Years | 2,989 (93.3%) | 2,773 (87.1%) |
| 45 to 54 Years | 2,892 (96.7%) | 2,526 (87.8%) |
| 55 to 64 Years | 2,445 (88.0%) | 2,434 (83.6%) |
| 65 to 74 Years | 1,649 (82.6%) | 1,958 (89.7%) |
| 75 Years and over | 1,130 (91.7%) | 1,286 (82.2%) |
| Total | 21,112 (87.0%) | 20,668 (84.9%) |
Income Below Poverty Among Married-Couple Families in Atascosa County
The poverty statistics for married-couple families in Atascosa County show that 6.7% or 549 of the total 8,166 families live below the poverty line. Families with 1 or 2 children have the highest poverty rate of 12.0%, comprising of 296 families. On the other hand, families with 5 or more children have the lowest poverty rate of 2.7%, which includes 6 families.
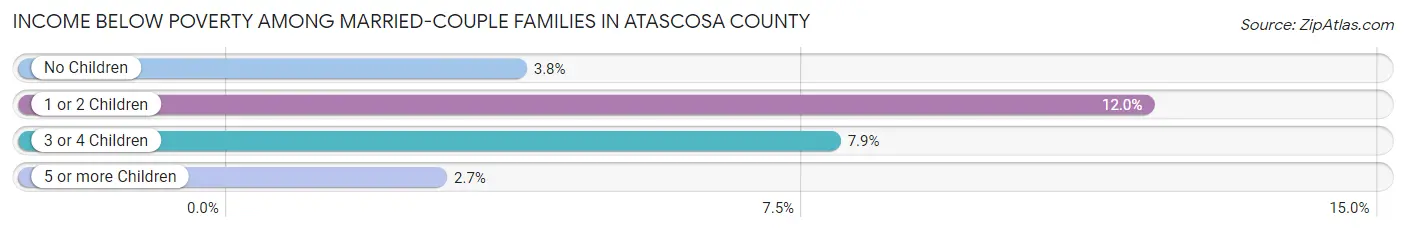
| Children | Above Poverty | Below Poverty |
| No Children | 4,311 (96.2%) | 169 (3.8%) |
| 1 or 2 Children | 2,179 (88.0%) | 296 (12.0%) |
| 3 or 4 Children | 913 (92.1%) | 78 (7.9%) |
| 5 or more Children | 214 (97.3%) | 6 (2.7%) |
| Total | 7,617 (93.3%) | 549 (6.7%) |
Income Below Poverty Among Single-Parent Households in Atascosa County
According to the poverty data in Atascosa County, 16.0% or 237 single-father households and 24.8% or 547 single-mother households are living below the poverty line. Among single-father households, those with 3 or 4 children have the highest poverty rate, with 21 households (19.8%) experiencing poverty. Likewise, among single-mother households, those with 3 or 4 children have the highest poverty rate, with 98 households (58.0%) falling below the poverty line.
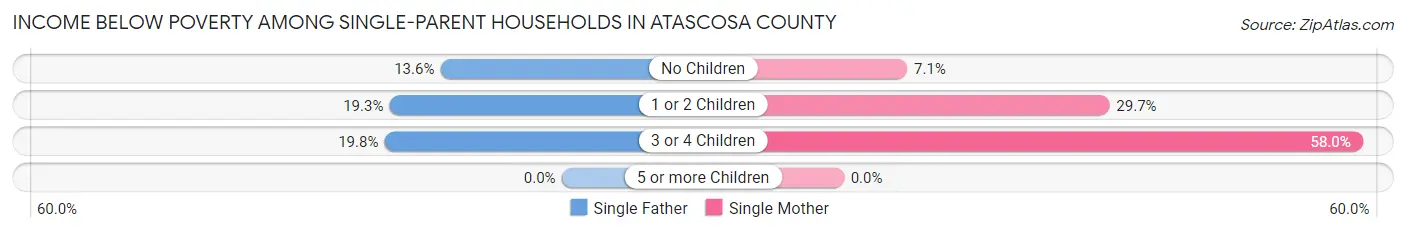
| Children | Single Father | Single Mother |
| No Children | 118 (13.6%) | 49 (7.1%) |
| 1 or 2 Children | 98 (19.3%) | 400 (29.7%) |
| 3 or 4 Children | 21 (19.8%) | 98 (58.0%) |
| 5 or more Children | 0 (0.0%) | 0 (0.0%) |
| Total | 237 (16.0%) | 547 (24.8%) |
Income Below Poverty Among Married-Couple vs Single-Parent Households in Atascosa County
The poverty data for Atascosa County shows that 549 of the married-couple family households (6.7%) and 784 of the single-parent households (21.2%) are living below the poverty level. Within the married-couple family households, those with 1 or 2 children have the highest poverty rate, with 296 households (12.0%) falling below the poverty line. Among the single-parent households, those with 3 or 4 children have the highest poverty rate, with 119 household (43.3%) living below poverty.
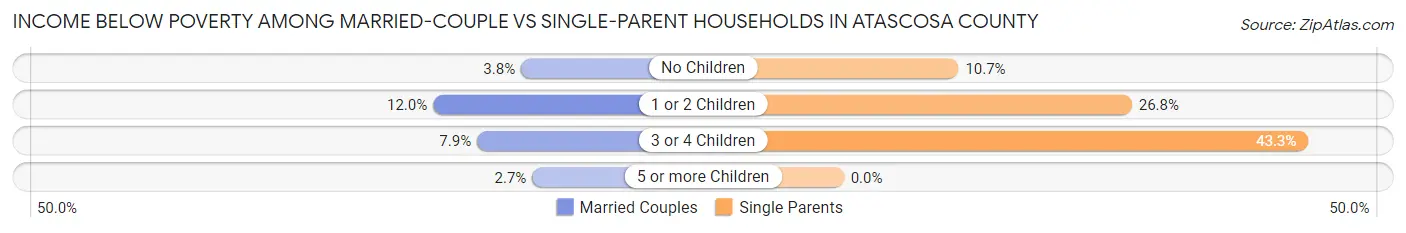
| Children | Married-Couple Families | Single-Parent Households |
| No Children | 169 (3.8%) | 167 (10.7%) |
| 1 or 2 Children | 296 (12.0%) | 498 (26.8%) |
| 3 or 4 Children | 78 (7.9%) | 119 (43.3%) |
| 5 or more Children | 6 (2.7%) | 0 (0.0%) |
| Total | 549 (6.7%) | 784 (21.2%) |
Race in Atascosa County
The most populous races in Atascosa County are Hispanic or Latino (32,436 | 65.7%), White / Caucasian (31,643 | 64.0%), and Two or more Races (13,595 | 27.5%).
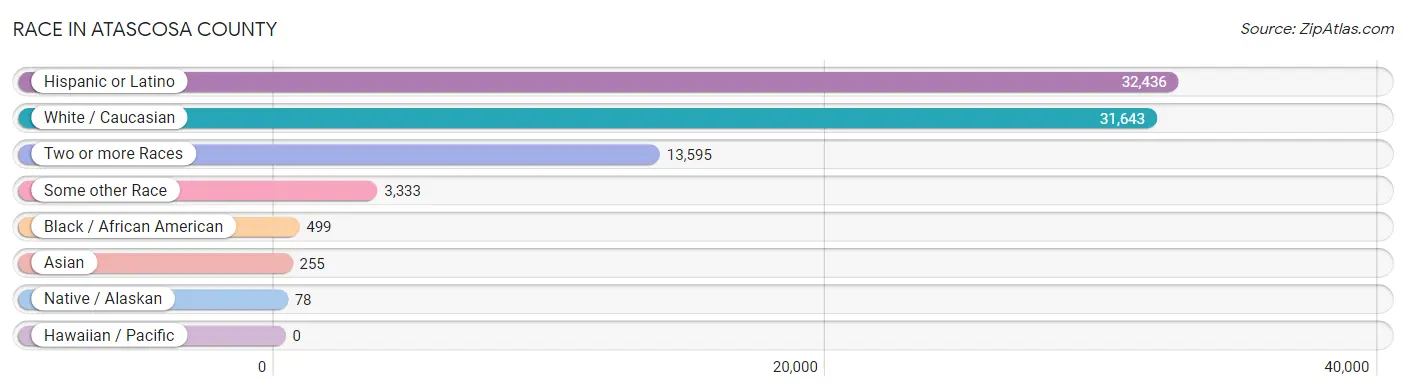
| Race | # Population | % Population |
| Asian | 255 | 0.5% |
| Black / African American | 499 | 1.0% |
| Hawaiian / Pacific | 0 | 0.0% |
| Hispanic or Latino | 32,436 | 65.7% |
| Native / Alaskan | 78 | 0.2% |
| White / Caucasian | 31,643 | 64.0% |
| Two or more Races | 13,595 | 27.5% |
| Some other Race | 3,333 | 6.8% |
| Total | 49,403 | 100.0% |
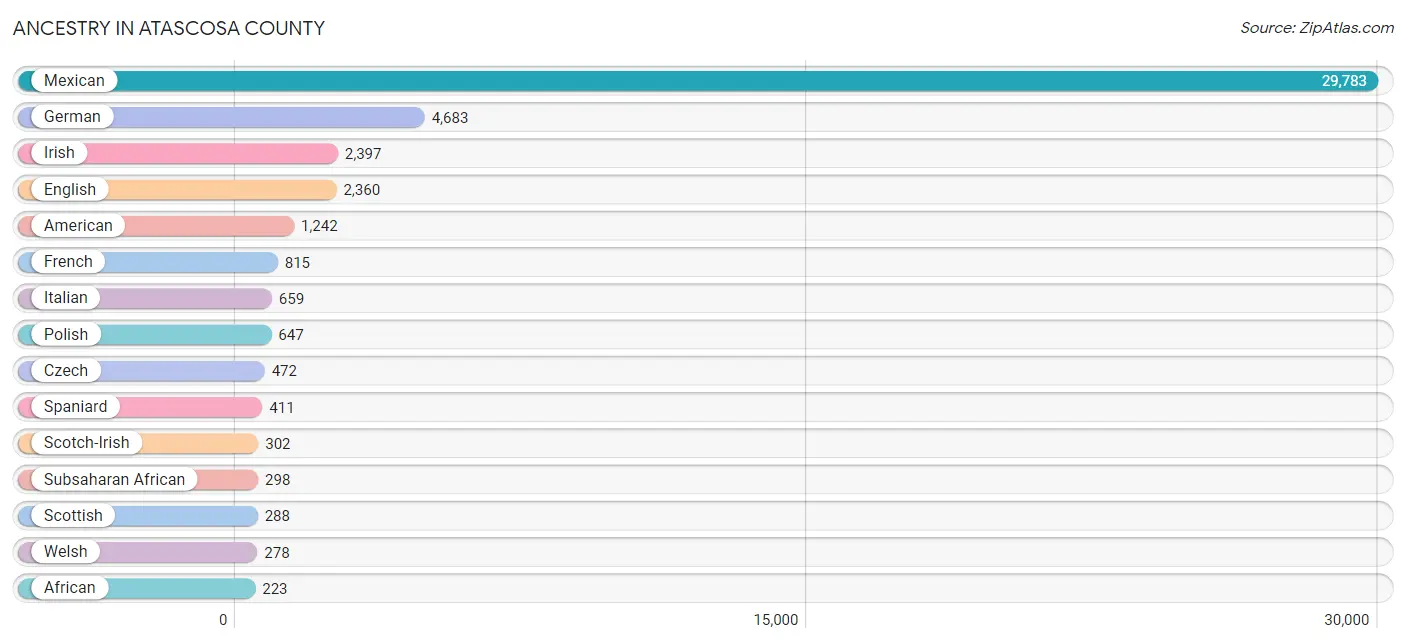
Ancestry in Atascosa County
The most populous ancestries reported in Atascosa County are Mexican (29,783 | 60.3%), German (4,683 | 9.5%), Irish (2,397 | 4.9%), English (2,360 | 4.8%), and American (1,242 | 2.5%), together accounting for 81.9% of all Atascosa County residents.
| Ancestry | # Population | % Population |
| African | 223 | 0.4% |
| American | 1,242 | 2.5% |
| Apache | 105 | 0.2% |
| Arab | 6 | 0.0% |
| Belgian | 5 | 0.0% |
| Blackfeet | 36 | 0.1% |
| Brazilian | 57 | 0.1% |
| British | 89 | 0.2% |
| Burmese | 13 | 0.0% |
| Cajun | 10 | 0.0% |
| Celtic | 121 | 0.2% |
| Central American | 194 | 0.4% |
| Central American Indian | 131 | 0.3% |
| Cherokee | 139 | 0.3% |
| Cheyenne | 72 | 0.2% |
| Chickasaw | 12 | 0.0% |
| Chippewa | 115 | 0.2% |
| Choctaw | 25 | 0.1% |
| Comanche | 35 | 0.1% |
| Cuban | 72 | 0.2% |
| Czech | 472 | 1.0% |
| Czechoslovakian | 142 | 0.3% |
| Danish | 31 | 0.1% |
| Dominican | 8 | 0.0% |
| Dutch | 81 | 0.2% |
| English | 2,360 | 4.8% |
| European | 158 | 0.3% |
| French | 815 | 1.7% |
| French Canadian | 125 | 0.3% |
| German | 4,683 | 9.5% |
| Greek | 13 | 0.0% |
| Guatemalan | 42 | 0.1% |
| Honduran | 91 | 0.2% |
| Hungarian | 9 | 0.0% |
| Indian (Asian) | 15 | 0.0% |
| Irish | 2,397 | 4.9% |
| Italian | 659 | 1.3% |
| Korean | 114 | 0.2% |
| Lebanese | 6 | 0.0% |
| Mexican | 29,783 | 60.3% |
| Mexican American Indian | 50 | 0.1% |
| Navajo | 29 | 0.1% |
| Norwegian | 174 | 0.4% |
| Pennsylvania German | 12 | 0.0% |
| Polish | 647 | 1.3% |
| Portuguese | 140 | 0.3% |
| Puerto Rican | 90 | 0.2% |
| Russian | 65 | 0.1% |
| Salvadoran | 61 | 0.1% |
| Scandinavian | 9 | 0.0% |
| Scotch-Irish | 302 | 0.6% |
| Scottish | 288 | 0.6% |
| Seminole | 22 | 0.0% |
| Sioux | 115 | 0.2% |
| South American | 51 | 0.1% |
| Spaniard | 411 | 0.8% |
| Spanish | 143 | 0.3% |
| Sri Lankan | 9 | 0.0% |
| Subsaharan African | 298 | 0.6% |
| Sudanese | 75 | 0.2% |
| Swedish | 18 | 0.0% |
| Swiss | 45 | 0.1% |
| Thai | 67 | 0.1% |
| U.S. Virgin Islander | 5 | 0.0% |
| Venezuelan | 51 | 0.1% |
| Welsh | 278 | 0.6% |
| Yaqui | 9 | 0.0% | View All 67 Rows |
Immigrants in Atascosa County
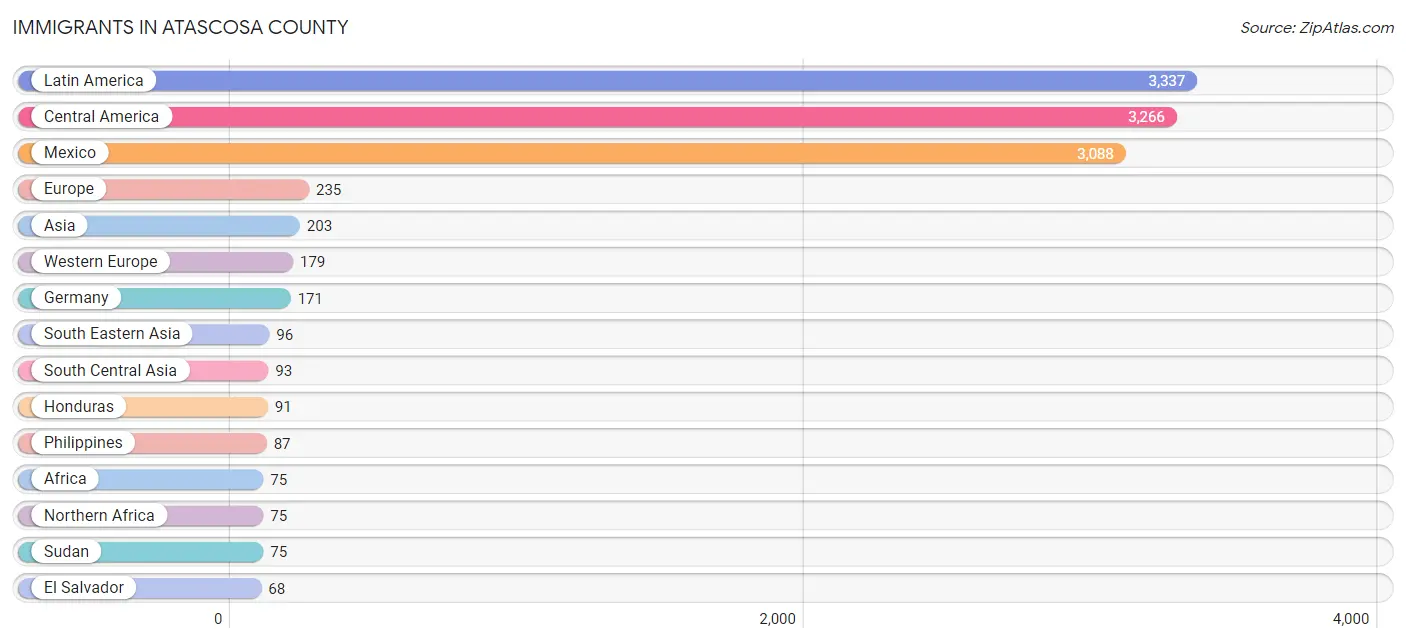
The most numerous immigrant groups reported in Atascosa County came from Latin America (3,337 | 6.8%), Central America (3,266 | 6.6%), Mexico (3,088 | 6.2%), Europe (235 | 0.5%), and Asia (203 | 0.4%), together accounting for 20.5% of all Atascosa County residents.
| Immigration Origin | # Population | % Population |
| Africa | 75 | 0.2% |
| Asia | 203 | 0.4% |
| Caribbean | 20 | 0.0% |
| Central America | 3,266 | 6.6% |
| China | 14 | 0.0% |
| Cuba | 20 | 0.0% |
| Eastern Asia | 14 | 0.0% |
| El Salvador | 68 | 0.1% |
| England | 45 | 0.1% |
| Europe | 235 | 0.5% |
| France | 8 | 0.0% |
| Germany | 171 | 0.4% |
| Guatemala | 19 | 0.0% |
| Honduras | 91 | 0.2% |
| India | 34 | 0.1% |
| Latin America | 3,337 | 6.8% |
| Mexico | 3,088 | 6.2% |
| Northern Africa | 75 | 0.2% |
| Northern Europe | 56 | 0.1% |
| Pakistan | 59 | 0.1% |
| Philippines | 87 | 0.2% |
| South America | 51 | 0.1% |
| South Central Asia | 93 | 0.2% |
| South Eastern Asia | 96 | 0.2% |
| Sudan | 75 | 0.2% |
| Venezuela | 51 | 0.1% |
| Vietnam | 9 | 0.0% |
| Western Europe | 179 | 0.4% | View All 28 Rows |
Sex and Age in Atascosa County
Sex and Age in Atascosa County
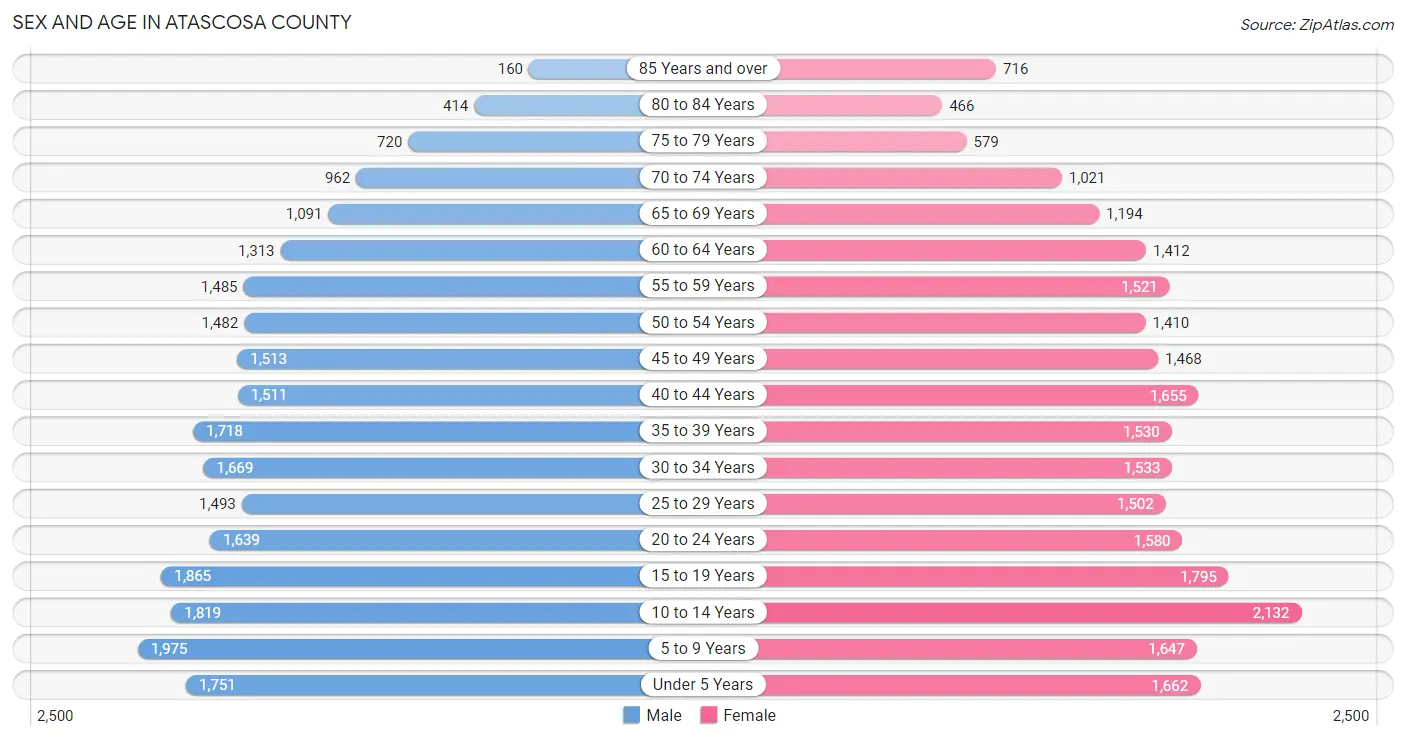
The most populous age groups in Atascosa County are 5 to 9 Years (1,975 | 8.0%) for men and 10 to 14 Years (2,132 | 8.6%) for women.
| Age Bracket | Male | Female |
| Under 5 Years | 1,751 (7.1%) | 1,662 (6.7%) |
| 5 to 9 Years | 1,975 (8.0%) | 1,647 (6.6%) |
| 10 to 14 Years | 1,819 (7.4%) | 2,132 (8.6%) |
| 15 to 19 Years | 1,865 (7.6%) | 1,795 (7.2%) |
| 20 to 24 Years | 1,639 (6.7%) | 1,580 (6.4%) |
| 25 to 29 Years | 1,493 (6.1%) | 1,502 (6.0%) |
| 30 to 34 Years | 1,669 (6.8%) | 1,533 (6.2%) |
| 35 to 39 Years | 1,718 (7.0%) | 1,530 (6.2%) |
| 40 to 44 Years | 1,511 (6.1%) | 1,655 (6.7%) |
| 45 to 49 Years | 1,513 (6.2%) | 1,468 (5.9%) |
| 50 to 54 Years | 1,482 (6.0%) | 1,410 (5.7%) |
| 55 to 59 Years | 1,485 (6.0%) | 1,521 (6.1%) |
| 60 to 64 Years | 1,313 (5.3%) | 1,412 (5.7%) |
| 65 to 69 Years | 1,091 (4.4%) | 1,194 (4.8%) |
| 70 to 74 Years | 962 (3.9%) | 1,021 (4.1%) |
| 75 to 79 Years | 720 (2.9%) | 579 (2.3%) |
| 80 to 84 Years | 414 (1.7%) | 466 (1.9%) |
| 85 Years and over | 160 (0.6%) | 716 (2.9%) |
| Total | 24,580 (100.0%) | 24,823 (100.0%) |
Families and Households in Atascosa County
Median Family Size in Atascosa County
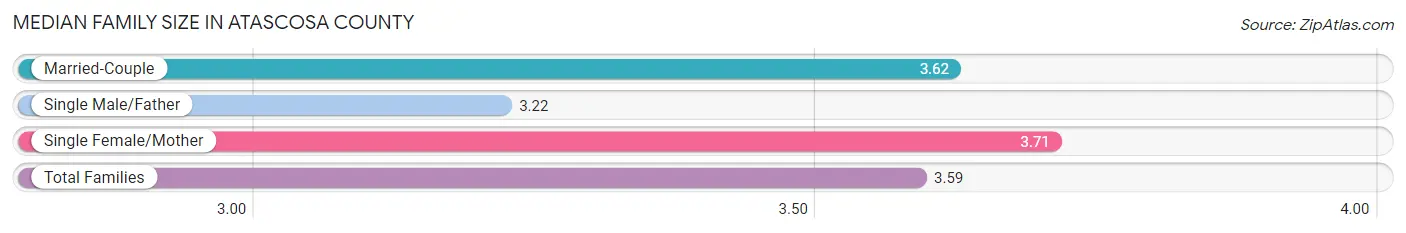
The median family size in Atascosa County is 3.59 persons per family, with single female/mother families (2,207 | 18.6%) accounting for the largest median family size of 3.71 persons per family. On the other hand, single male/father families (1,486 | 12.5%) represent the smallest median family size with 3.22 persons per family.
| Family Type | # Families | Family Size |
| Married-Couple | 8,166 (68.9%) | 3.62 |
| Single Male/Father | 1,486 (12.5%) | 3.22 |
| Single Female/Mother | 2,207 (18.6%) | 3.71 |
| Total Families | 11,859 (100.0%) | 3.59 |
Median Household Size in Atascosa County
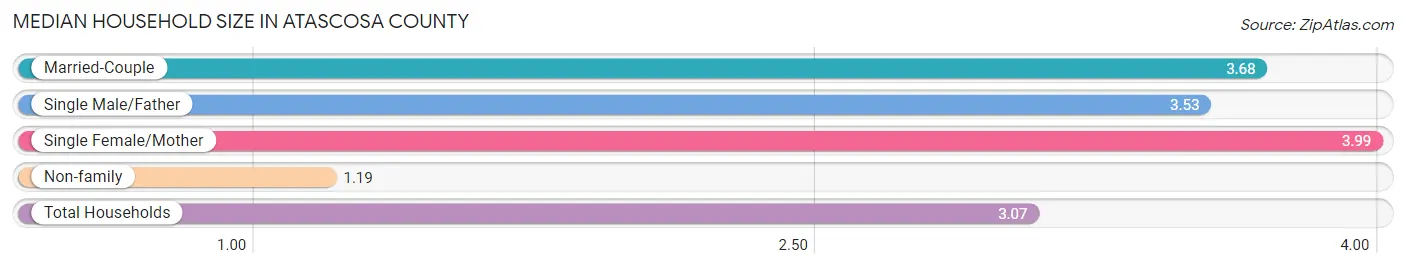
The median household size in Atascosa County is 3.07 persons per household, with single female/mother households (2,207 | 13.9%) accounting for the largest median household size of 3.99 persons per household. non-family households (4,061 | 25.5%) represent the smallest median household size with 1.19 persons per household.
| Household Type | # Households | Household Size |
| Married-Couple | 8,166 (51.3%) | 3.68 |
| Single Male/Father | 1,486 (9.3%) | 3.53 |
| Single Female/Mother | 2,207 (13.9%) | 3.99 |
| Non-family | 4,061 (25.5%) | 1.19 |
| Total Households | 15,920 (100.0%) | 3.07 |
Household Size by Marriage Status in Atascosa County
Out of a total of 15,920 households in Atascosa County, 11,859 (74.5%) are family households, while 4,061 (25.5%) are nonfamily households. The most numerous type of family households are 2-person households, comprising 4,827, and the most common type of nonfamily households are 1-person households, comprising 3,670.
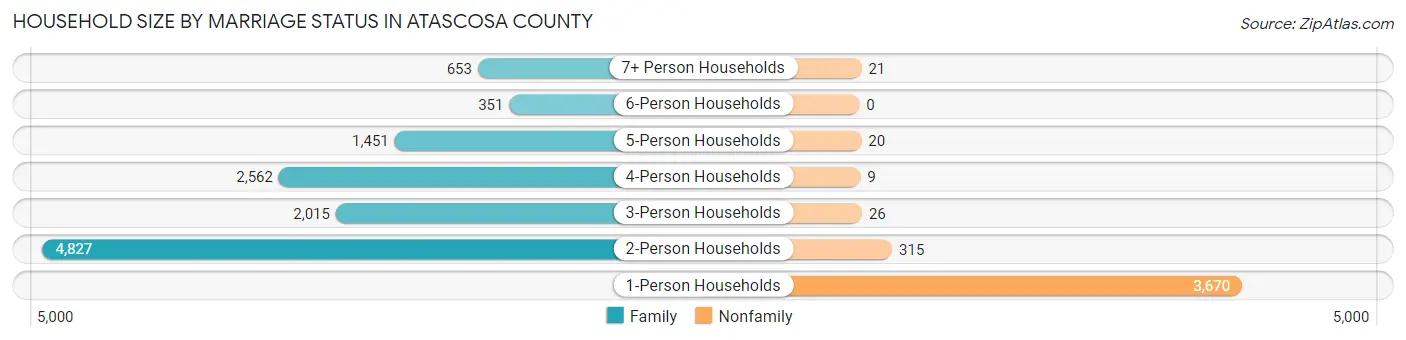
| Household Size | Family Households | Nonfamily Households |
| 1-Person Households | - | 3,670 (23.1%) |
| 2-Person Households | 4,827 (30.3%) | 315 (2.0%) |
| 3-Person Households | 2,015 (12.7%) | 26 (0.2%) |
| 4-Person Households | 2,562 (16.1%) | 9 (0.1%) |
| 5-Person Households | 1,451 (9.1%) | 20 (0.1%) |
| 6-Person Households | 351 (2.2%) | 0 (0.0%) |
| 7+ Person Households | 653 (4.1%) | 21 (0.1%) |
| Total | 11,859 (74.5%) | 4,061 (25.5%) |
Female Fertility in Atascosa County
Fertility by Age in Atascosa County
Average fertility rate in Atascosa County is 73.0 births per 1,000 women. Women in the age bracket of 20 to 34 years have the highest fertility rate with 125.0 births per 1,000 women. Women in the age bracket of 20 to 34 years acount for 71.3% of all women with births.
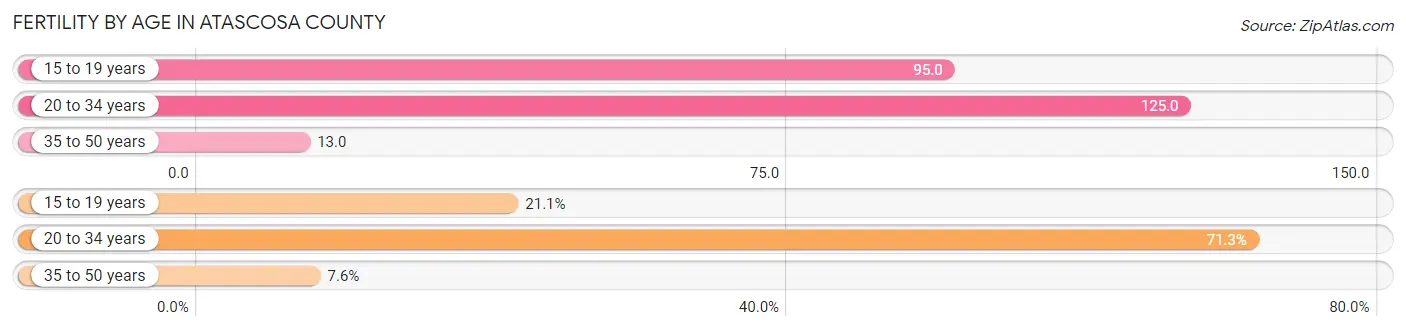
| Age Bracket | Women with Births | Births / 1,000 Women |
| 15 to 19 years | 171 (21.1%) | 95.0 |
| 20 to 34 years | 579 (71.3%) | 125.0 |
| 35 to 50 years | 62 (7.6%) | 13.0 |
| Total | 812 (100.0%) | 73.0 |
Fertility by Age by Marriage Status in Atascosa County
55.4% of women with births (812) in Atascosa County are married. The highest percentage of unmarried women with births falls into 15 to 19 years age bracket with 91.8% of them unmarried at the time of birth, while the lowest percentage of unmarried women with births belong to 20 to 34 years age bracket with 29.9% of them unmarried.
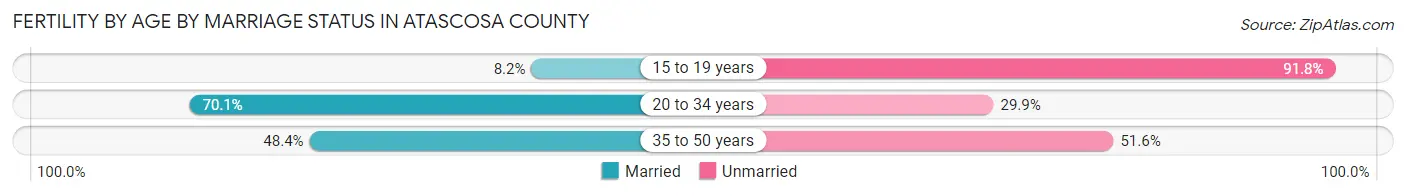
| Age Bracket | Married | Unmarried |
| 15 to 19 years | 14 (8.2%) | 157 (91.8%) |
| 20 to 34 years | 406 (70.1%) | 173 (29.9%) |
| 35 to 50 years | 30 (48.4%) | 32 (51.6%) |
| Total | 450 (55.4%) | 362 (44.6%) |
Fertility by Education in Atascosa County
Average fertility rate in Atascosa County is 73.0 births per 1,000 women. Women with the education attainment of high school diploma have the highest fertility rate of 112.0 births per 1,000 women, while women with the education attainment of less than high school have the lowest fertility at 36.0 births per 1,000 women. Women with the education attainment of high school diploma represent 60.6% of all women with births.
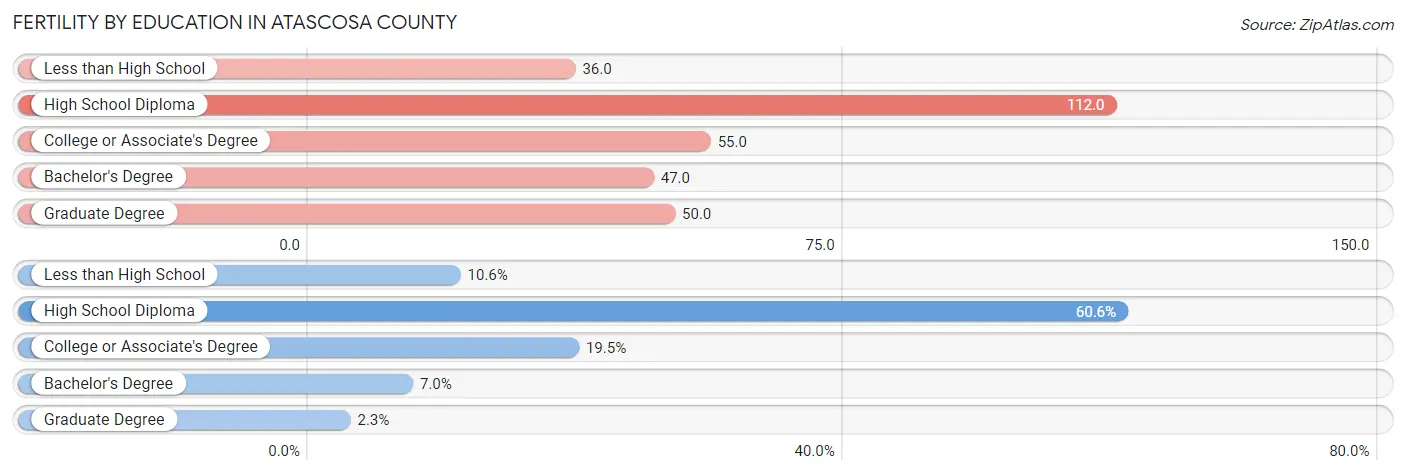
| Educational Attainment | Women with Births | Births / 1,000 Women |
| Less than High School | 86 (10.6%) | 36.0 |
| High School Diploma | 492 (60.6%) | 112.0 |
| College or Associate's Degree | 158 (19.5%) | 55.0 |
| Bachelor's Degree | 57 (7.0%) | 47.0 |
| Graduate Degree | 19 (2.3%) | 50.0 |
| Total | 812 (100.0%) | 73.0 |
Fertility by Education by Marriage Status in Atascosa County
44.6% of women with births in Atascosa County are unmarried. Women with the educational attainment of bachelor's degree are most likely to be married with 100.0% of them married at childbirth, while women with the educational attainment of college or associate's degree are least likely to be married with 60.8% of them unmarried at childbirth.
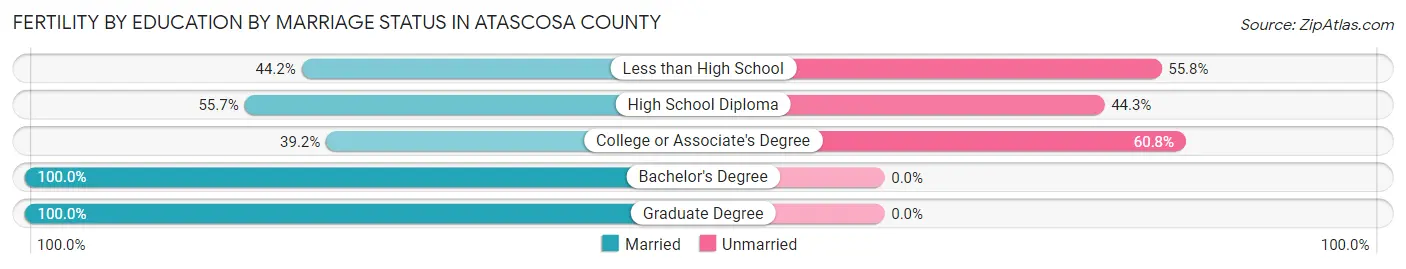
| Educational Attainment | Married | Unmarried |
| Less than High School | 38 (44.2%) | 48 (55.8%) |
| High School Diploma | 274 (55.7%) | 218 (44.3%) |
| College or Associate's Degree | 62 (39.2%) | 96 (60.8%) |
| Bachelor's Degree | 57 (100.0%) | 0 (0.0%) |
| Graduate Degree | 19 (100.0%) | 0 (0.0%) |
| Total | 450 (55.4%) | 362 (44.6%) |
Employment Characteristics in Atascosa County
Employment by Class of Employer in Atascosa County
Among the 20,318 employed individuals in Atascosa County, private company employees (14,408 | 70.9%), local government employees (1,760 | 8.7%), and self-employed (not incorporated) (1,660 | 8.2%) make up the most common classes of employment.
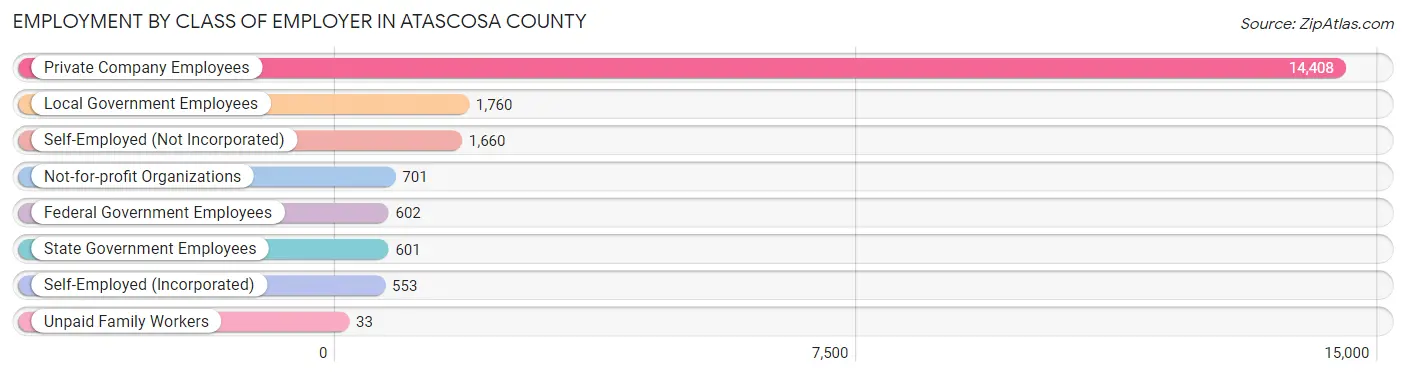
| Employer Class | # Employees | % Employees |
| Private Company Employees | 14,408 | 70.9% |
| Self-Employed (Incorporated) | 553 | 2.7% |
| Self-Employed (Not Incorporated) | 1,660 | 8.2% |
| Not-for-profit Organizations | 701 | 3.5% |
| Local Government Employees | 1,760 | 8.7% |
| State Government Employees | 601 | 3.0% |
| Federal Government Employees | 602 | 3.0% |
| Unpaid Family Workers | 33 | 0.2% |
| Total | 20,318 | 100.0% |
Employment Status by Age in Atascosa County
According to the labor force statistics for Atascosa County, out of the total population over 16 years of age (37,857), 58.1% or 21,995 individuals are in the labor force, with 6.4% or 1,408 of them unemployed. The age group with the highest labor force participation rate is 30 to 34 years, with 83.0% or 2,658 individuals in the labor force. Within the labor force, the 20 to 24 years age range has the highest percentage of unemployed individuals, with 16.7% or 383 of them being unemployed.
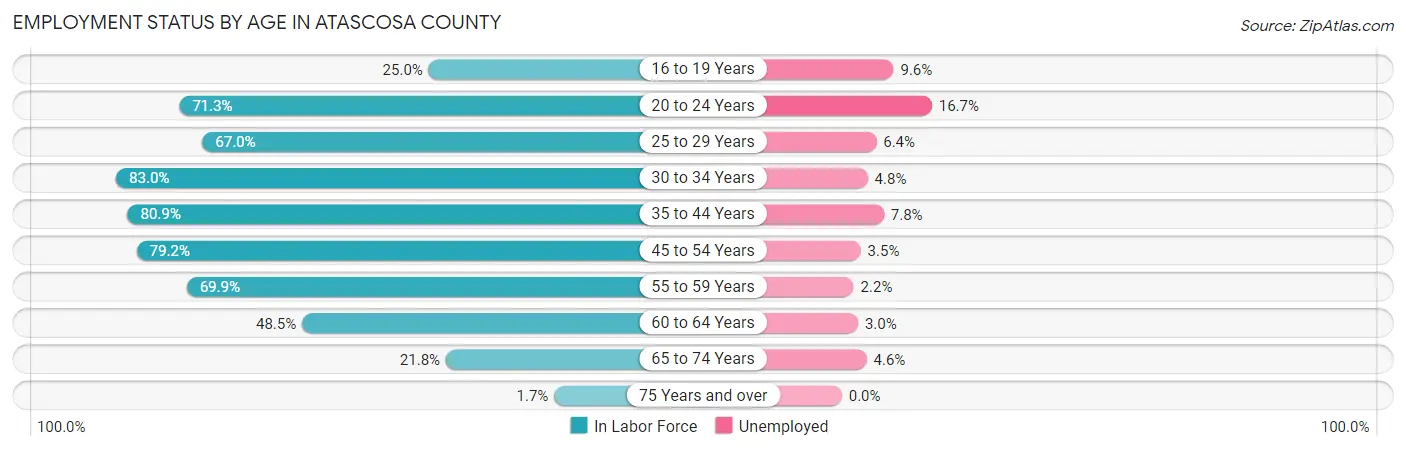
| Age Bracket | In Labor Force | Unemployed |
| 16 to 19 Years | 775 (25.0%) | 74 (9.6%) |
| 20 to 24 Years | 2,295 (71.3%) | 383 (16.7%) |
| 25 to 29 Years | 2,007 (67.0%) | 128 (6.4%) |
| 30 to 34 Years | 2,658 (83.0%) | 128 (4.8%) |
| 35 to 44 Years | 5,189 (80.9%) | 405 (7.8%) |
| 45 to 54 Years | 4,651 (79.2%) | 163 (3.5%) |
| 55 to 59 Years | 2,101 (69.9%) | 46 (2.2%) |
| 60 to 64 Years | 1,322 (48.5%) | 40 (3.0%) |
| 65 to 74 Years | 930 (21.8%) | 43 (4.6%) |
| 75 Years and over | 52 (1.7%) | 0 (0.0%) |
| Total | 21,995 (58.1%) | 1,408 (6.4%) |
Employment Status by Educational Attainment in Atascosa County
According to labor force statistics for Atascosa County, 74.0% of individuals (17,919) out of the total population between 25 and 64 years of age (24,215) are in the labor force, with 5.1% or 914 of them being unemployed. The group with the highest labor force participation rate are those with the educational attainment of bachelor's degree or higher, with 83.7% or 3,146 individuals in the labor force. Within the labor force, individuals with less than high school education have the highest percentage of unemployment, with 7.4% or 168 of them being unemployed.
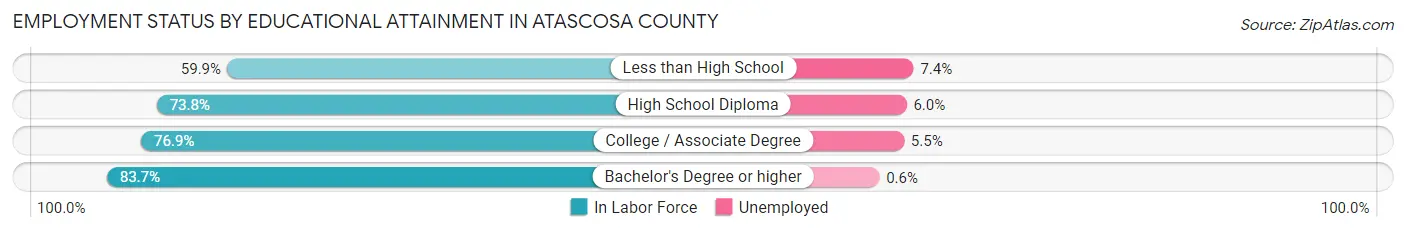
| Educational Attainment | In Labor Force | Unemployed |
| Less than High School | 2,268 (59.9%) | 280 (7.4%) |
| High School Diploma | 7,271 (73.8%) | 591 (6.0%) |
| College / Associate Degree | 5,243 (76.9%) | 375 (5.5%) |
| Bachelor's Degree or higher | 3,146 (83.7%) | 23 (0.6%) |
| Total | 17,919 (74.0%) | 1,235 (5.1%) |
Employment Occupations by Sex in Atascosa County
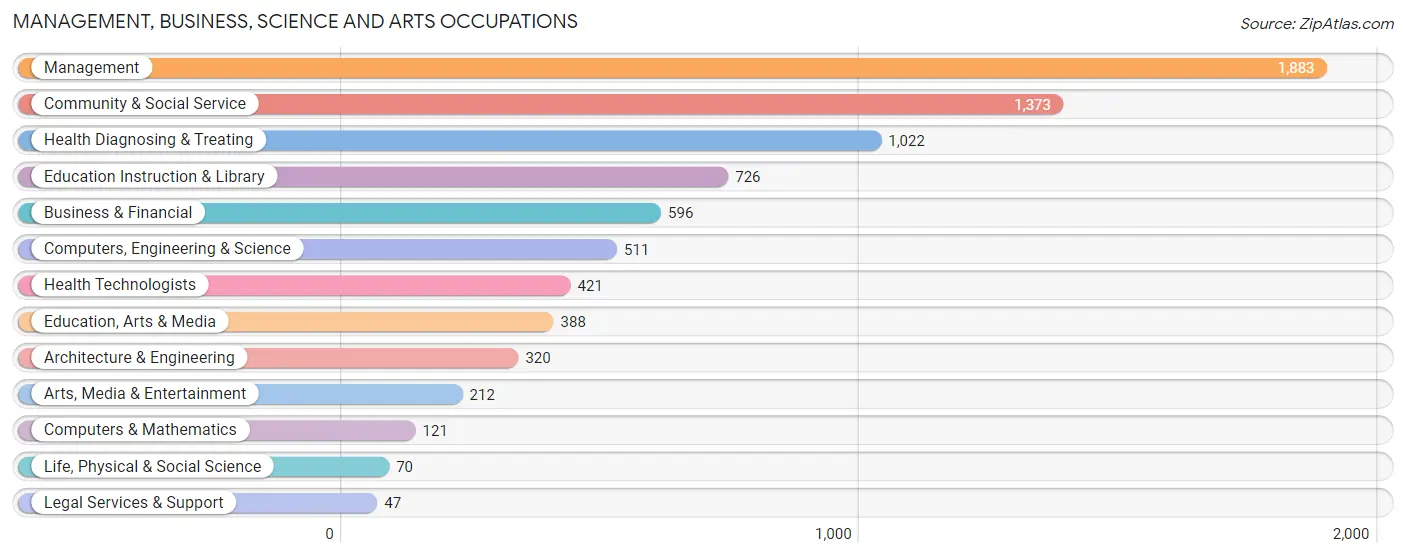
Management, Business, Science and Arts Occupations
The most common Management, Business, Science and Arts occupations in Atascosa County are Management (1,883 | 9.2%), Community & Social Service (1,373 | 6.7%), Health Diagnosing & Treating (1,022 | 5.0%), Education Instruction & Library (726 | 3.5%), and Business & Financial (596 | 2.9%).
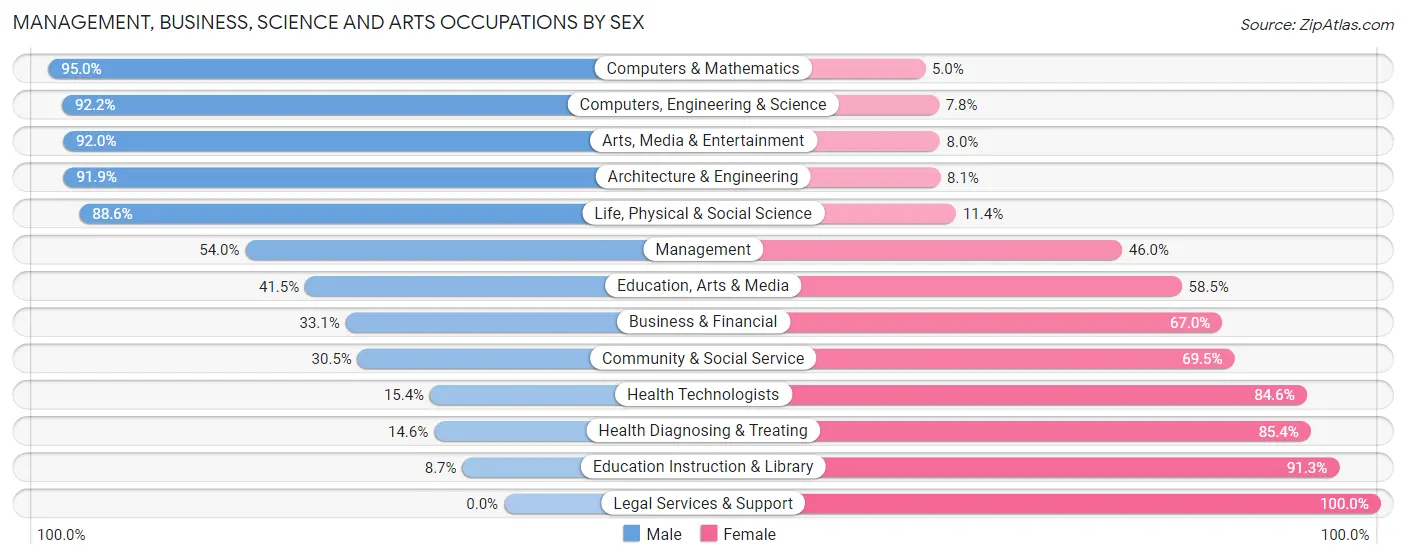
Management, Business, Science and Arts Occupations by Sex
Within the Management, Business, Science and Arts occupations in Atascosa County, the most male-oriented occupations are Computers & Mathematics (95.0%), Computers, Engineering & Science (92.2%), and Arts, Media & Entertainment (92.0%), while the most female-oriented occupations are Legal Services & Support (100.0%), Education Instruction & Library (91.3%), and Health Diagnosing & Treating (85.4%).
| Occupation | Male | Female |
| Management | 1,016 (54.0%) | 867 (46.0%) |
| Business & Financial | 197 (33.1%) | 399 (66.9%) |
| Computers, Engineering & Science | 471 (92.2%) | 40 (7.8%) |
| Computers & Mathematics | 115 (95.0%) | 6 (5.0%) |
| Architecture & Engineering | 294 (91.9%) | 26 (8.1%) |
| Life, Physical & Social Science | 62 (88.6%) | 8 (11.4%) |
| Community & Social Service | 419 (30.5%) | 954 (69.5%) |
| Education, Arts & Media | 161 (41.5%) | 227 (58.5%) |
| Legal Services & Support | 0 (0.0%) | 47 (100.0%) |
| Education Instruction & Library | 63 (8.7%) | 663 (91.3%) |
| Arts, Media & Entertainment | 195 (92.0%) | 17 (8.0%) |
| Health Diagnosing & Treating | 149 (14.6%) | 873 (85.4%) |
| Health Technologists | 65 (15.4%) | 356 (84.6%) |
| Total (Category) | 2,252 (41.8%) | 3,133 (58.2%) |
| Total (Overall) | 11,346 (55.2%) | 9,202 (44.8%) |
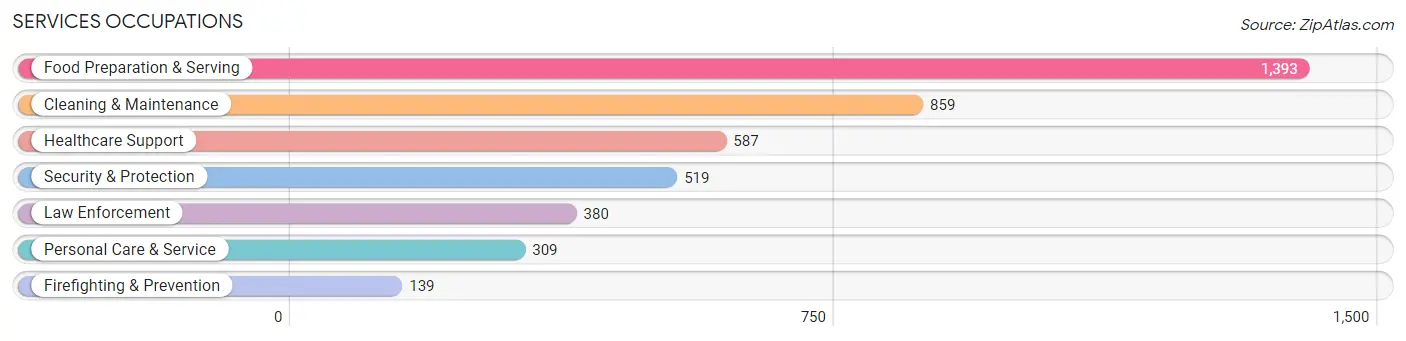
Services Occupations
The most common Services occupations in Atascosa County are Food Preparation & Serving (1,393 | 6.8%), Cleaning & Maintenance (859 | 4.2%), Healthcare Support (587 | 2.9%), Security & Protection (519 | 2.5%), and Law Enforcement (380 | 1.8%).
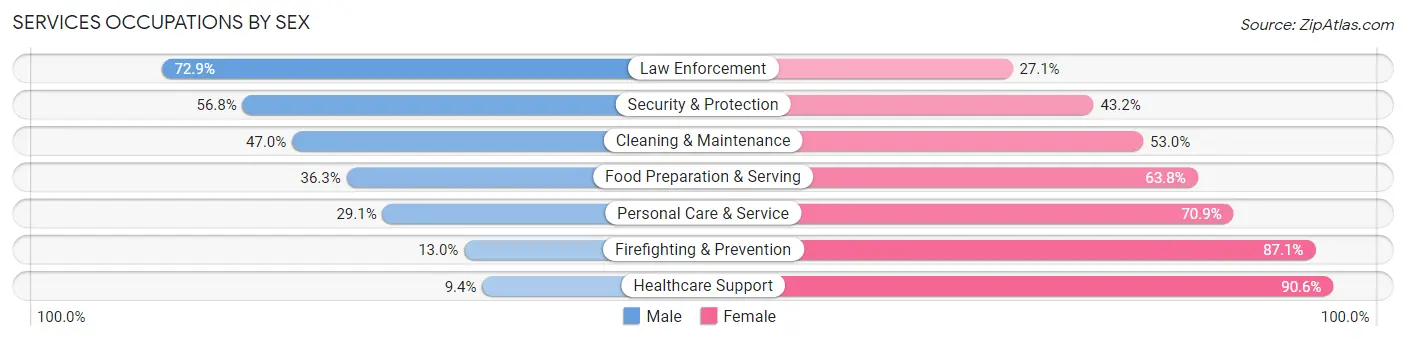
Services Occupations by Sex
Within the Services occupations in Atascosa County, the most male-oriented occupations are Law Enforcement (72.9%), Security & Protection (56.8%), and Cleaning & Maintenance (47.0%), while the most female-oriented occupations are Healthcare Support (90.6%), Firefighting & Prevention (87.1%), and Personal Care & Service (70.9%).
| Occupation | Male | Female |
| Healthcare Support | 55 (9.4%) | 532 (90.6%) |
| Security & Protection | 295 (56.8%) | 224 (43.2%) |
| Firefighting & Prevention | 18 (13.0%) | 121 (87.1%) |
| Law Enforcement | 277 (72.9%) | 103 (27.1%) |
| Food Preparation & Serving | 505 (36.2%) | 888 (63.7%) |
| Cleaning & Maintenance | 404 (47.0%) | 455 (53.0%) |
| Personal Care & Service | 90 (29.1%) | 219 (70.9%) |
| Total (Category) | 1,349 (36.8%) | 2,318 (63.2%) |
| Total (Overall) | 11,346 (55.2%) | 9,202 (44.8%) |
Sales and Office Occupations
The most common Sales and Office occupations in Atascosa County are Office & Administration (2,260 | 11.0%), and Sales & Related (2,062 | 10.0%).
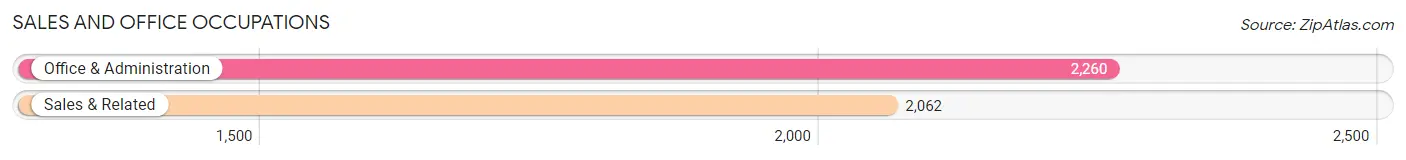
Sales and Office Occupations by Sex

| Occupation | Male | Female |
| Sales & Related | 824 (40.0%) | 1,238 (60.0%) |
| Office & Administration | 553 (24.5%) | 1,707 (75.5%) |
| Total (Category) | 1,377 (31.9%) | 2,945 (68.1%) |
| Total (Overall) | 11,346 (55.2%) | 9,202 (44.8%) |
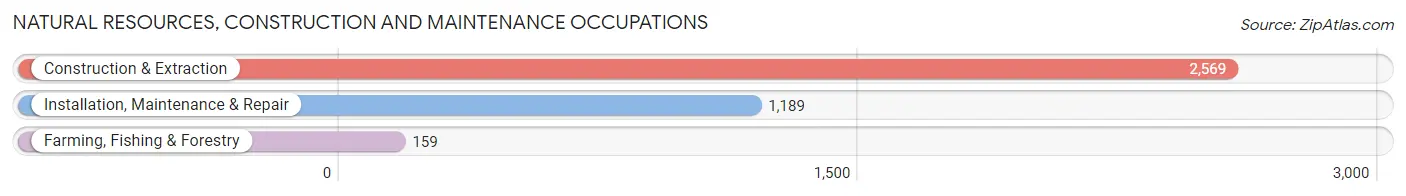
Natural Resources, Construction and Maintenance Occupations
The most common Natural Resources, Construction and Maintenance occupations in Atascosa County are Construction & Extraction (2,569 | 12.5%), Installation, Maintenance & Repair (1,189 | 5.8%), and Farming, Fishing & Forestry (159 | 0.8%).
Natural Resources, Construction and Maintenance Occupations by Sex
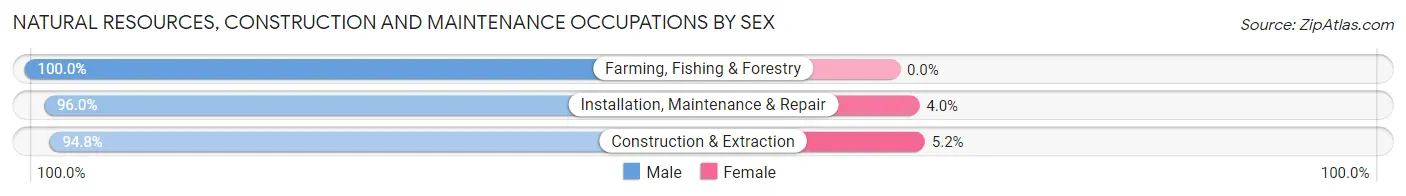
| Occupation | Male | Female |
| Farming, Fishing & Forestry | 159 (100.0%) | 0 (0.0%) |
| Construction & Extraction | 2,436 (94.8%) | 133 (5.2%) |
| Installation, Maintenance & Repair | 1,141 (96.0%) | 48 (4.0%) |
| Total (Category) | 3,736 (95.4%) | 181 (4.6%) |
| Total (Overall) | 11,346 (55.2%) | 9,202 (44.8%) |
Production, Transportation and Moving Occupations
The most common Production, Transportation and Moving occupations in Atascosa County are Transportation (1,142 | 5.6%), Production (1,110 | 5.4%), and Material Moving (1,005 | 4.9%).
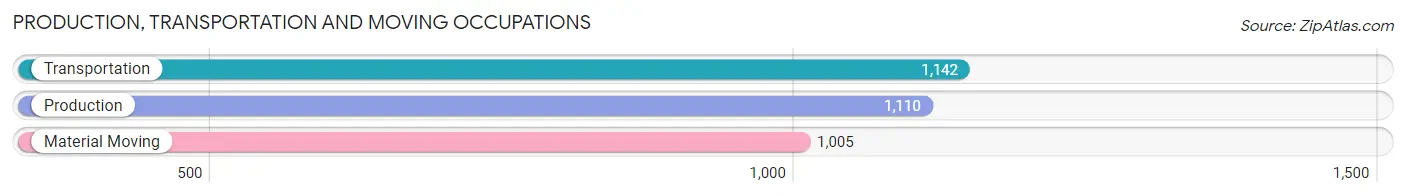
Production, Transportation and Moving Occupations by Sex
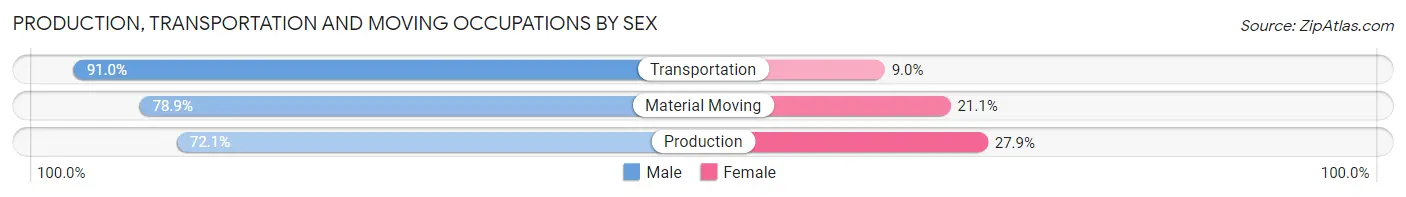
| Occupation | Male | Female |
| Production | 800 (72.1%) | 310 (27.9%) |
| Transportation | 1,039 (91.0%) | 103 (9.0%) |
| Material Moving | 793 (78.9%) | 212 (21.1%) |
| Total (Category) | 2,632 (80.8%) | 625 (19.2%) |
| Total (Overall) | 11,346 (55.2%) | 9,202 (44.8%) |
Employment Industries by Sex in Atascosa County
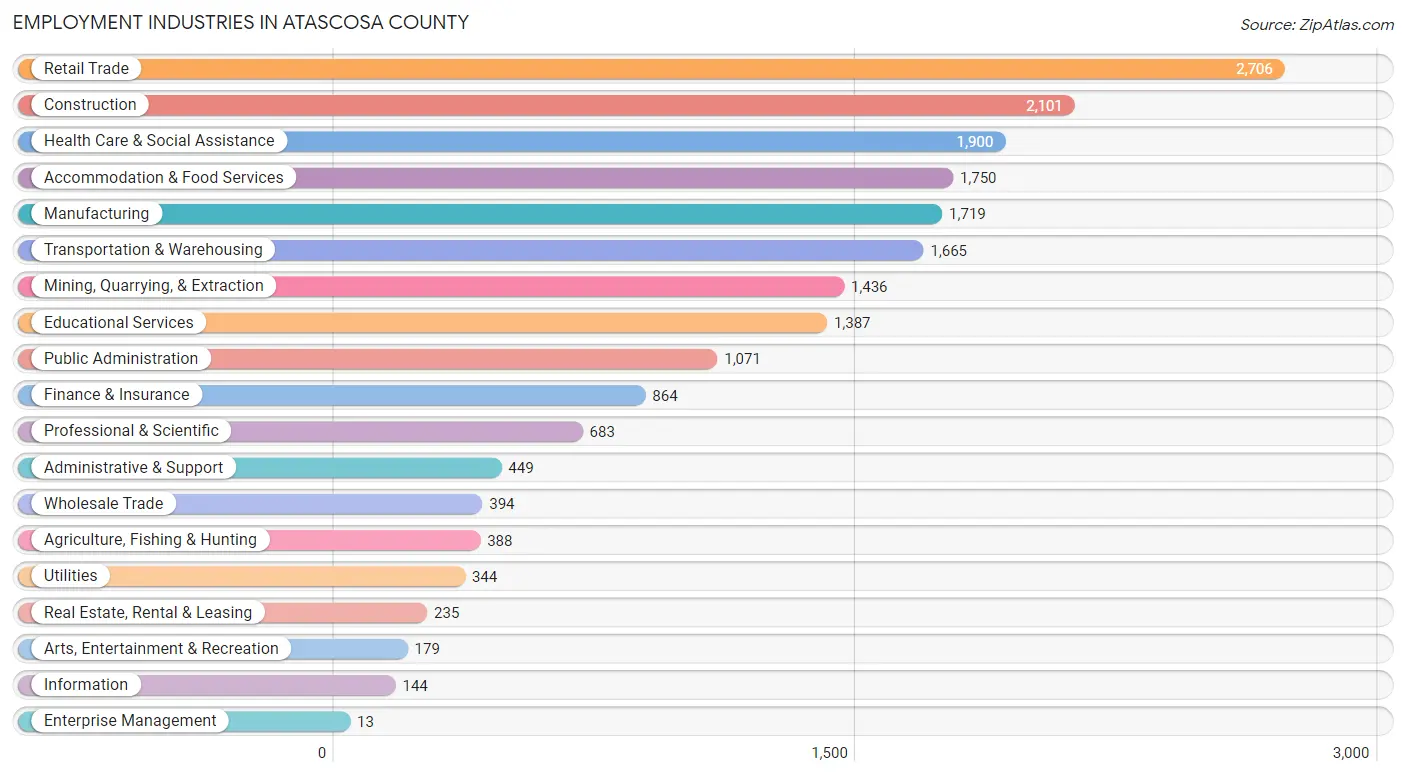
Employment Industries in Atascosa County
The major employment industries in Atascosa County include Retail Trade (2,706 | 13.2%), Construction (2,101 | 10.2%), Health Care & Social Assistance (1,900 | 9.2%), Accommodation & Food Services (1,750 | 8.5%), and Manufacturing (1,719 | 8.4%).
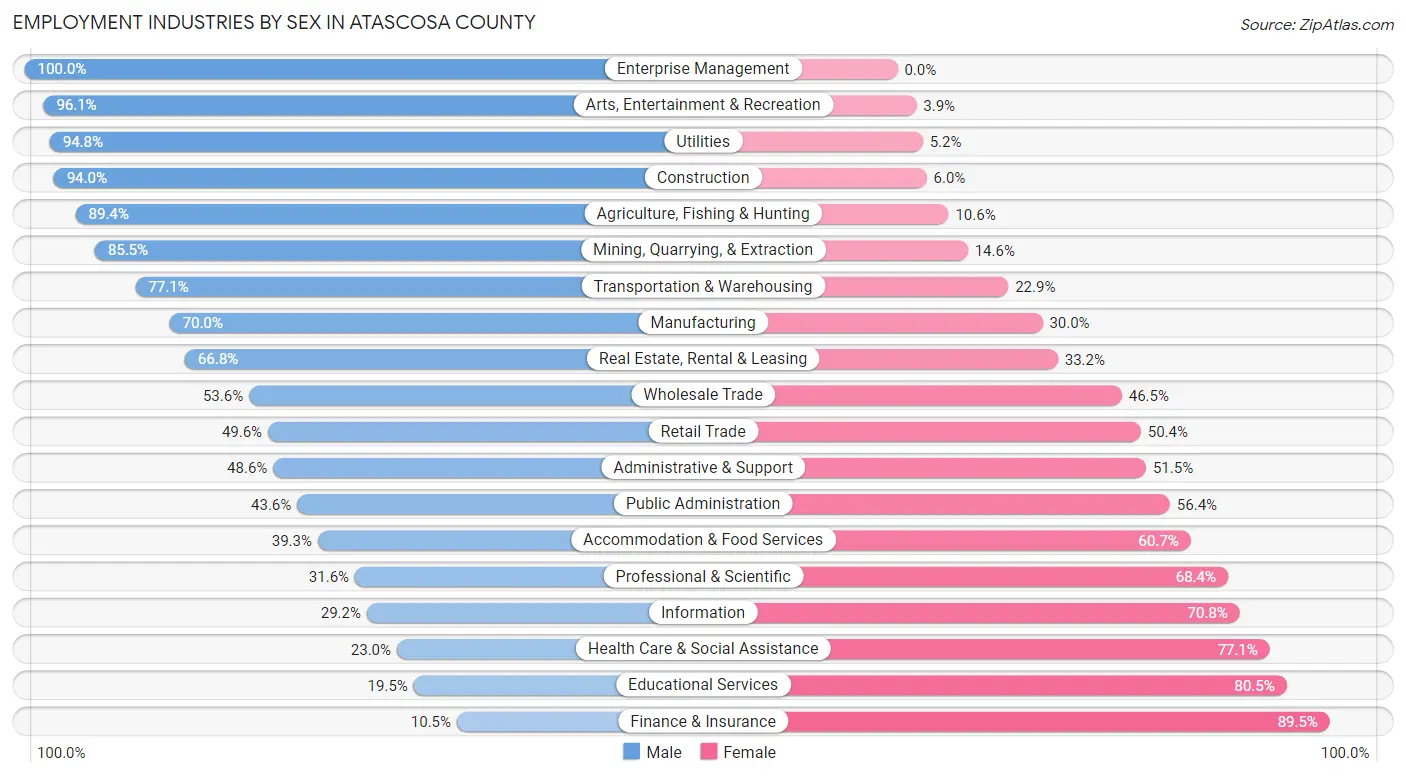
Employment Industries by Sex in Atascosa County
The Atascosa County industries that see more men than women are Enterprise Management (100.0%), Arts, Entertainment & Recreation (96.1%), and Utilities (94.8%), whereas the industries that tend to have a higher number of women are Finance & Insurance (89.5%), Educational Services (80.5%), and Health Care & Social Assistance (77.0%).
| Industry | Male | Female |
| Agriculture, Fishing & Hunting | 347 (89.4%) | 41 (10.6%) |
| Mining, Quarrying, & Extraction | 1,227 (85.5%) | 209 (14.5%) |
| Construction | 1,974 (94.0%) | 127 (6.0%) |
| Manufacturing | 1,203 (70.0%) | 516 (30.0%) |
| Wholesale Trade | 211 (53.5%) | 183 (46.5%) |
| Retail Trade | 1,343 (49.6%) | 1,363 (50.4%) |
| Transportation & Warehousing | 1,283 (77.1%) | 382 (22.9%) |
| Utilities | 326 (94.8%) | 18 (5.2%) |
| Information | 42 (29.2%) | 102 (70.8%) |
| Finance & Insurance | 91 (10.5%) | 773 (89.5%) |
| Real Estate, Rental & Leasing | 157 (66.8%) | 78 (33.2%) |
| Professional & Scientific | 216 (31.6%) | 467 (68.4%) |
| Enterprise Management | 13 (100.0%) | 0 (0.0%) |
| Administrative & Support | 218 (48.5%) | 231 (51.4%) |
| Educational Services | 270 (19.5%) | 1,117 (80.5%) |
| Health Care & Social Assistance | 436 (23.0%) | 1,464 (77.0%) |
| Arts, Entertainment & Recreation | 172 (96.1%) | 7 (3.9%) |
| Accommodation & Food Services | 688 (39.3%) | 1,062 (60.7%) |
| Public Administration | 467 (43.6%) | 604 (56.4%) |
| Total | 11,346 (55.2%) | 9,202 (44.8%) |
Education in Atascosa County
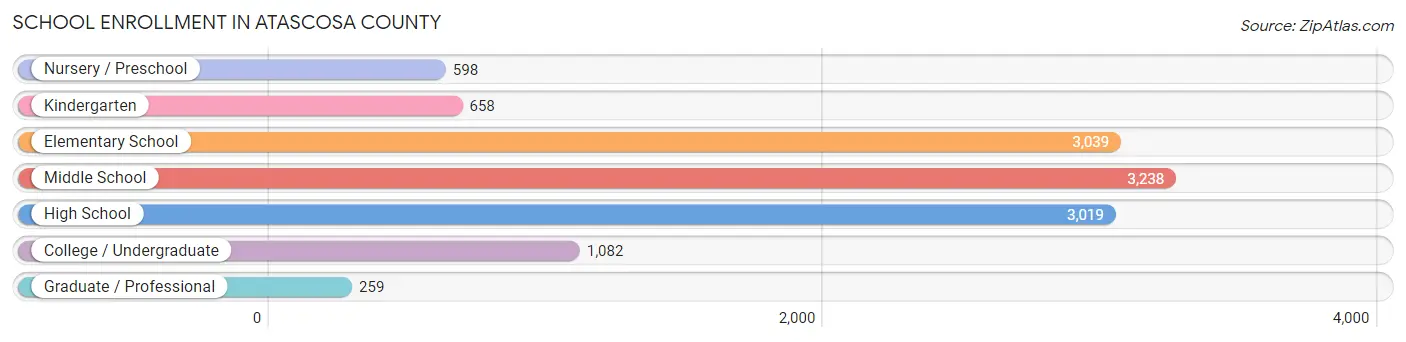
School Enrollment in Atascosa County
The most common levels of schooling among the 11,893 students in Atascosa County are middle school (3,238 | 27.2%), elementary school (3,039 | 25.6%), and high school (3,019 | 25.4%).
| School Level | # Students | % Students |
| Nursery / Preschool | 598 | 5.0% |
| Kindergarten | 658 | 5.5% |
| Elementary School | 3,039 | 25.6% |
| Middle School | 3,238 | 27.2% |
| High School | 3,019 | 25.4% |
| College / Undergraduate | 1,082 | 9.1% |
| Graduate / Professional | 259 | 2.2% |
| Total | 11,893 | 100.0% |
School Enrollment by Age by Funding Source in Atascosa County
Out of a total of 11,893 students who are enrolled in schools in Atascosa County, 904 (7.6%) attend a private institution, while the remaining 10,989 (92.4%) are enrolled in public schools. The age group of 3 to 4 year olds has the highest likelihood of being enrolled in private schools, with 188 (38.4% in the age bracket) enrolled. Conversely, the age group of 15 to 17 year olds has the lowest likelihood of being enrolled in a private school, with 2,176 (97.4% in the age bracket) attending a public institution.
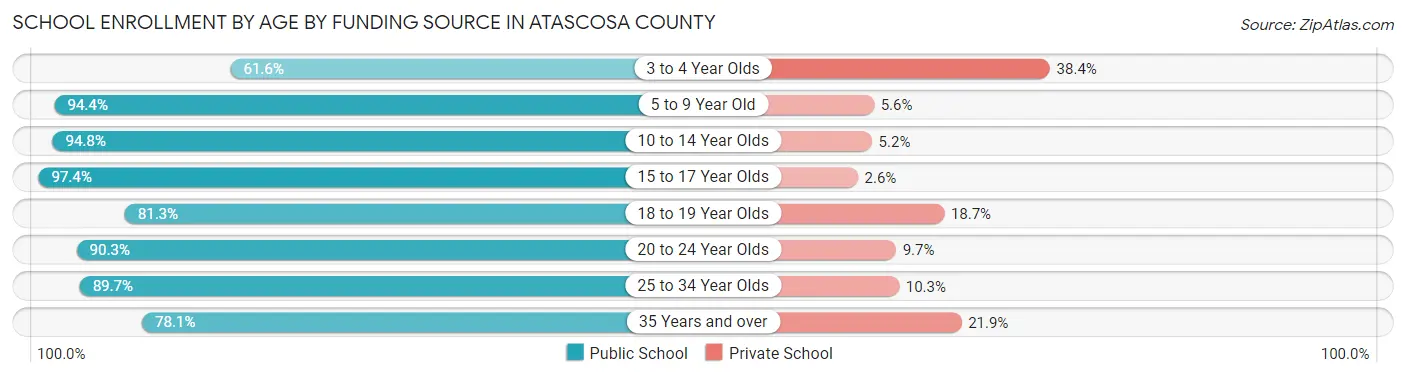
| Age Bracket | Public School | Private School |
| 3 to 4 Year Olds | 302 (61.6%) | 188 (38.4%) |
| 5 to 9 Year Old | 3,177 (94.4%) | 188 (5.6%) |
| 10 to 14 Year Olds | 3,745 (94.8%) | 206 (5.2%) |
| 15 to 17 Year Olds | 2,176 (97.4%) | 58 (2.6%) |
| 18 to 19 Year Olds | 457 (81.3%) | 105 (18.7%) |
| 20 to 24 Year Olds | 522 (90.3%) | 56 (9.7%) |
| 25 to 34 Year Olds | 402 (89.7%) | 46 (10.3%) |
| 35 Years and over | 207 (78.1%) | 58 (21.9%) |
| Total | 10,989 (92.4%) | 904 (7.6%) |
Educational Attainment by Field of Study in Atascosa County
Education (1,176 | 24.5%), business (1,065 | 22.2%), bio, nature & agricultural (458 | 9.5%), science & technology (394 | 8.2%), and engineering (284 | 5.9%) are the most common fields of study among 4,805 individuals in Atascosa County who have obtained a bachelor's degree or higher.
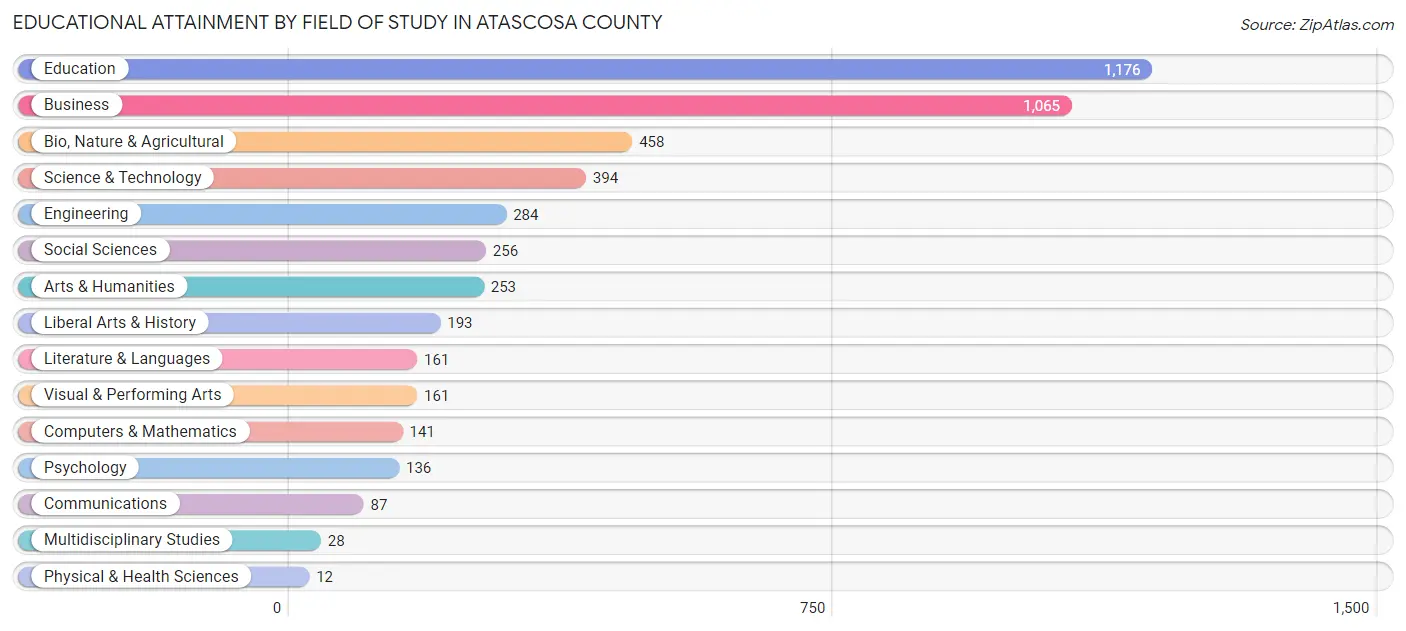
| Field of Study | # Graduates | % Graduates |
| Computers & Mathematics | 141 | 2.9% |
| Bio, Nature & Agricultural | 458 | 9.5% |
| Physical & Health Sciences | 12 | 0.3% |
| Psychology | 136 | 2.8% |
| Social Sciences | 256 | 5.3% |
| Engineering | 284 | 5.9% |
| Multidisciplinary Studies | 28 | 0.6% |
| Science & Technology | 394 | 8.2% |
| Business | 1,065 | 22.2% |
| Education | 1,176 | 24.5% |
| Literature & Languages | 161 | 3.4% |
| Liberal Arts & History | 193 | 4.0% |
| Visual & Performing Arts | 161 | 3.4% |
| Communications | 87 | 1.8% |
| Arts & Humanities | 253 | 5.3% |
| Total | 4,805 | 100.0% |
Transportation & Commute in Atascosa County
Vehicle Availability by Sex in Atascosa County
The most prevalent vehicle ownership categories in Atascosa County are males with 2 vehicles (4,521, accounting for 39.9%) and females with 2 vehicles (3,402, making up 50.3%).
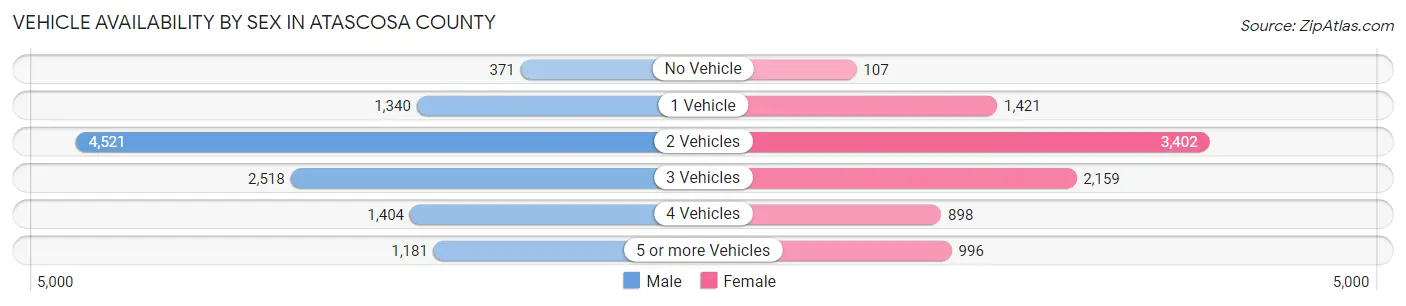
| Vehicles Available | Male | Female |
| No Vehicle | 371 (3.3%) | 107 (1.2%) |
| 1 Vehicle | 1,340 (11.8%) | 1,421 (15.8%) |
| 2 Vehicles | 4,521 (39.9%) | 3,402 (37.9%) |
| 3 Vehicles | 2,518 (22.2%) | 2,159 (24.0%) |
| 4 Vehicles | 1,404 (12.4%) | 898 (10.0%) |
| 5 or more Vehicles | 1,181 (10.4%) | 996 (11.1%) |
| Total | 11,335 (100.0%) | 8,983 (100.0%) |
Commute Time in Atascosa County
The most frequently occuring commute durations in Atascosa County are 45 to 59 minutes (2,880 commuters, 15.4%), 30 to 34 minutes (2,715 commuters, 14.5%), and 10 to 14 minutes (2,366 commuters, 12.6%).
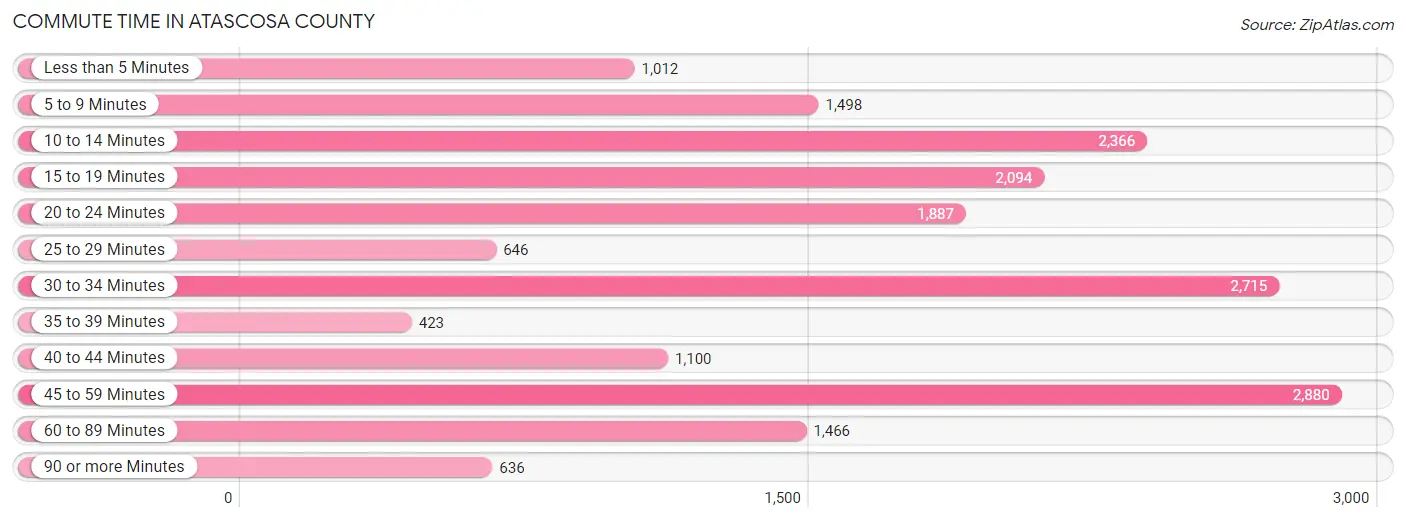
| Commute Time | # Commuters | % Commuters |
| Less than 5 Minutes | 1,012 | 5.4% |
| 5 to 9 Minutes | 1,498 | 8.0% |
| 10 to 14 Minutes | 2,366 | 12.6% |
| 15 to 19 Minutes | 2,094 | 11.2% |
| 20 to 24 Minutes | 1,887 | 10.1% |
| 25 to 29 Minutes | 646 | 3.5% |
| 30 to 34 Minutes | 2,715 | 14.5% |
| 35 to 39 Minutes | 423 | 2.3% |
| 40 to 44 Minutes | 1,100 | 5.9% |
| 45 to 59 Minutes | 2,880 | 15.4% |
| 60 to 89 Minutes | 1,466 | 7.8% |
| 90 or more Minutes | 636 | 3.4% |
Commute Time by Sex in Atascosa County
The most common commute times in Atascosa County are 45 to 59 minutes (1,811 commuters, 17.3%) for males and 30 to 34 minutes (1,431 commuters, 17.4%) for females.
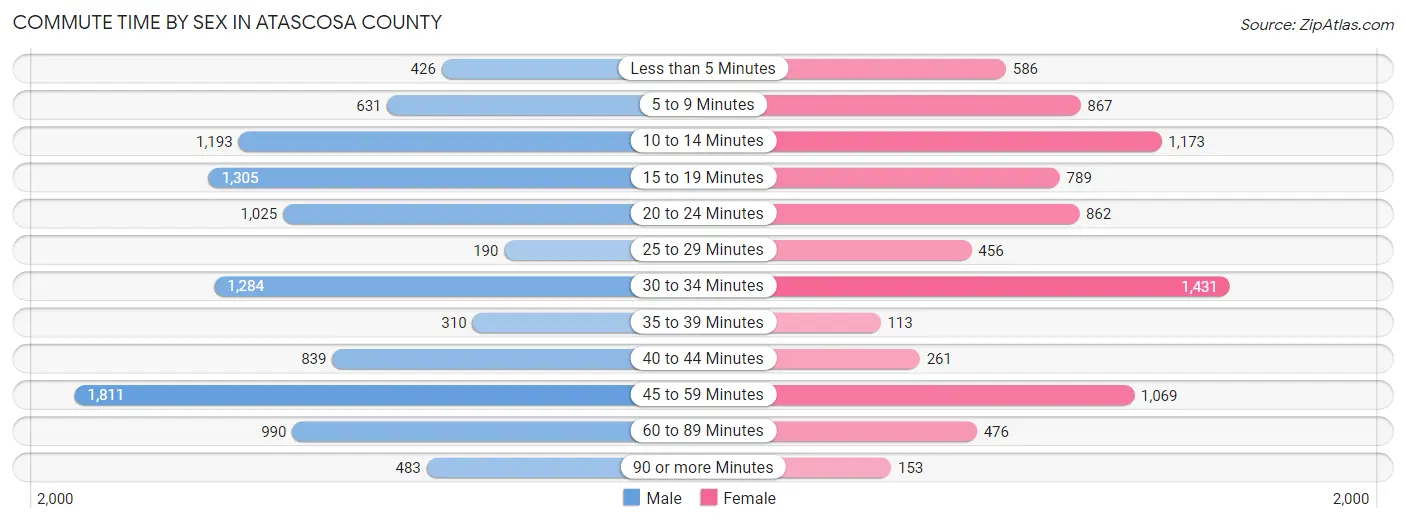
| Commute Time | Male | Female |
| Less than 5 Minutes | 426 (4.1%) | 586 (7.1%) |
| 5 to 9 Minutes | 631 (6.0%) | 867 (10.5%) |
| 10 to 14 Minutes | 1,193 (11.4%) | 1,173 (14.2%) |
| 15 to 19 Minutes | 1,305 (12.4%) | 789 (9.6%) |
| 20 to 24 Minutes | 1,025 (9.8%) | 862 (10.5%) |
| 25 to 29 Minutes | 190 (1.8%) | 456 (5.5%) |
| 30 to 34 Minutes | 1,284 (12.2%) | 1,431 (17.4%) |
| 35 to 39 Minutes | 310 (3.0%) | 113 (1.4%) |
| 40 to 44 Minutes | 839 (8.0%) | 261 (3.2%) |
| 45 to 59 Minutes | 1,811 (17.3%) | 1,069 (13.0%) |
| 60 to 89 Minutes | 990 (9.4%) | 476 (5.8%) |
| 90 or more Minutes | 483 (4.6%) | 153 (1.9%) |
Time of Departure to Work by Sex in Atascosa County
The most frequent times of departure to work in Atascosa County are 7:00 AM to 7:29 AM (1,844, 17.6%) for males and 7:00 AM to 7:29 AM (1,430, 17.4%) for females.
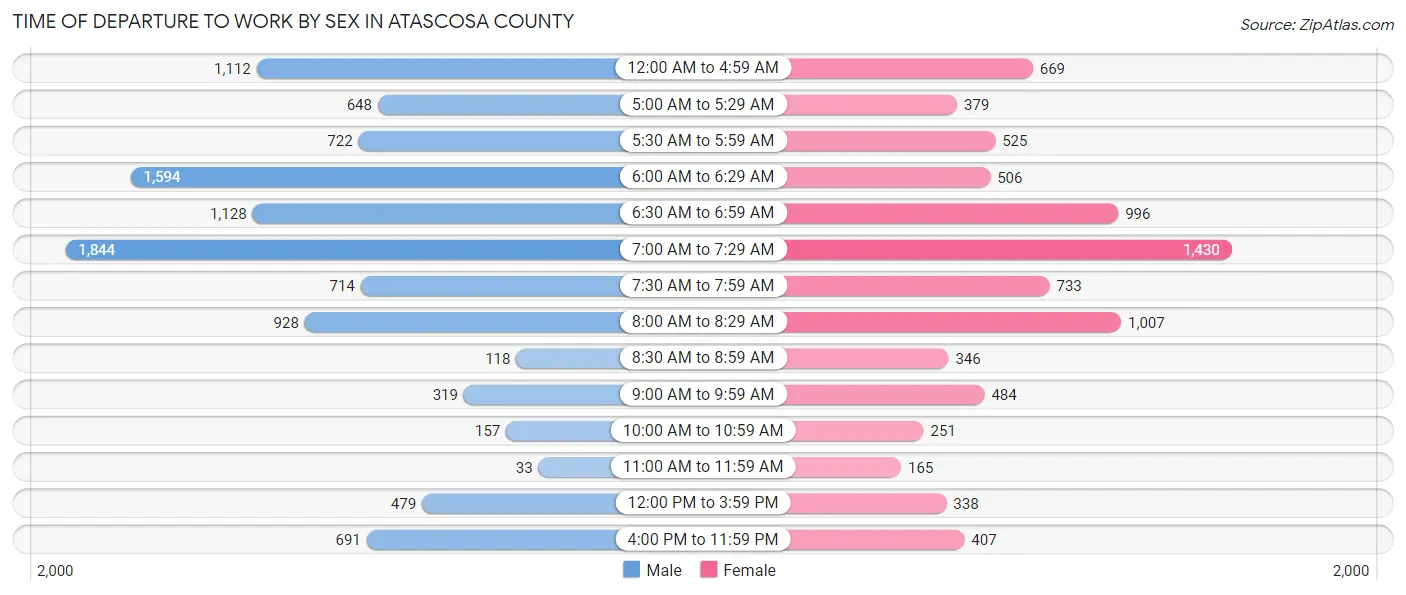
| Time of Departure | Male | Female |
| 12:00 AM to 4:59 AM | 1,112 (10.6%) | 669 (8.1%) |
| 5:00 AM to 5:29 AM | 648 (6.2%) | 379 (4.6%) |
| 5:30 AM to 5:59 AM | 722 (6.9%) | 525 (6.4%) |
| 6:00 AM to 6:29 AM | 1,594 (15.2%) | 506 (6.1%) |
| 6:30 AM to 6:59 AM | 1,128 (10.8%) | 996 (12.1%) |
| 7:00 AM to 7:29 AM | 1,844 (17.6%) | 1,430 (17.4%) |
| 7:30 AM to 7:59 AM | 714 (6.8%) | 733 (8.9%) |
| 8:00 AM to 8:29 AM | 928 (8.8%) | 1,007 (12.2%) |
| 8:30 AM to 8:59 AM | 118 (1.1%) | 346 (4.2%) |
| 9:00 AM to 9:59 AM | 319 (3.0%) | 484 (5.9%) |
| 10:00 AM to 10:59 AM | 157 (1.5%) | 251 (3.0%) |
| 11:00 AM to 11:59 AM | 33 (0.3%) | 165 (2.0%) |
| 12:00 PM to 3:59 PM | 479 (4.6%) | 338 (4.1%) |
| 4:00 PM to 11:59 PM | 691 (6.6%) | 407 (4.9%) |
| Total | 10,487 (100.0%) | 8,236 (100.0%) |
Housing Occupancy in Atascosa County
Occupancy by Ownership in Atascosa County
Of the total 15,920 dwellings in Atascosa County, owner-occupied units account for 11,957 (75.1%), while renter-occupied units make up 3,963 (24.9%).
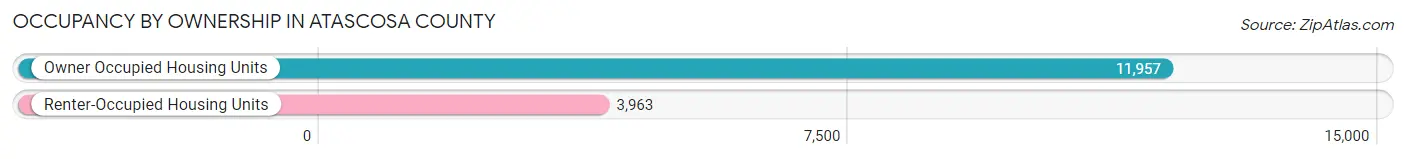
| Occupancy | # Housing Units | % Housing Units |
| Owner Occupied Housing Units | 11,957 | 75.1% |
| Renter-Occupied Housing Units | 3,963 | 24.9% |
| Total Occupied Housing Units | 15,920 | 100.0% |
Occupancy by Household Size in Atascosa County
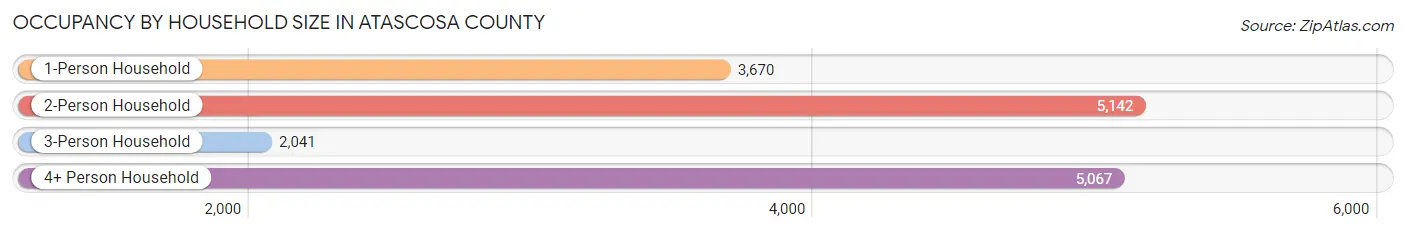
| Household Size | # Housing Units | % Housing Units |
| 1-Person Household | 3,670 | 23.1% |
| 2-Person Household | 5,142 | 32.3% |
| 3-Person Household | 2,041 | 12.8% |
| 4+ Person Household | 5,067 | 31.8% |
| Total Housing Units | 15,920 | 100.0% |
Occupancy by Ownership by Household Size in Atascosa County
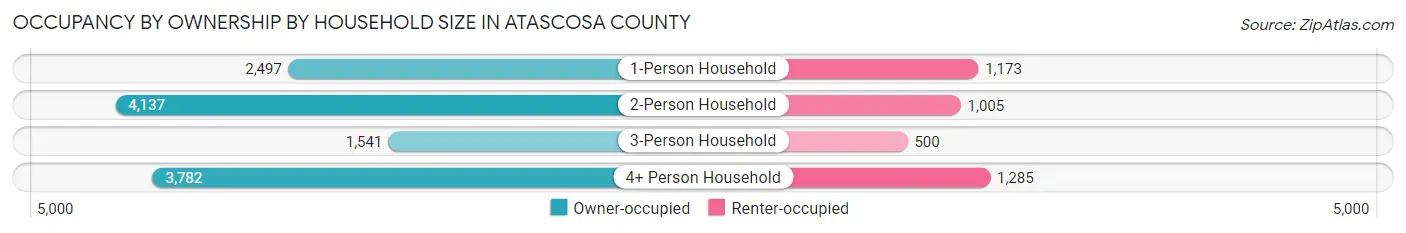
| Household Size | Owner-occupied | Renter-occupied |
| 1-Person Household | 2,497 (68.0%) | 1,173 (32.0%) |
| 2-Person Household | 4,137 (80.5%) | 1,005 (19.5%) |
| 3-Person Household | 1,541 (75.5%) | 500 (24.5%) |
| 4+ Person Household | 3,782 (74.6%) | 1,285 (25.4%) |
| Total Housing Units | 11,957 (75.1%) | 3,963 (24.9%) |
Occupancy by Educational Attainment in Atascosa County
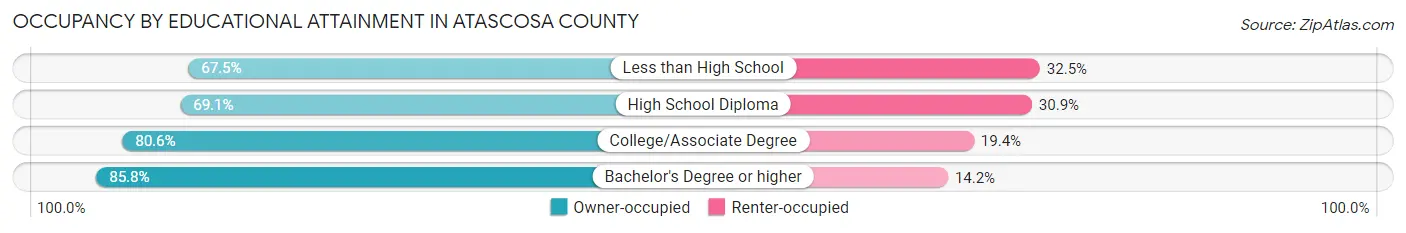
| Household Size | Owner-occupied | Renter-occupied |
| Less than High School | 1,679 (67.5%) | 807 (32.5%) |
| High School Diploma | 4,197 (69.1%) | 1,875 (30.9%) |
| College/Associate Degree | 3,652 (80.6%) | 878 (19.4%) |
| Bachelor's Degree or higher | 2,429 (85.8%) | 403 (14.2%) |
Occupancy by Age of Householder in Atascosa County
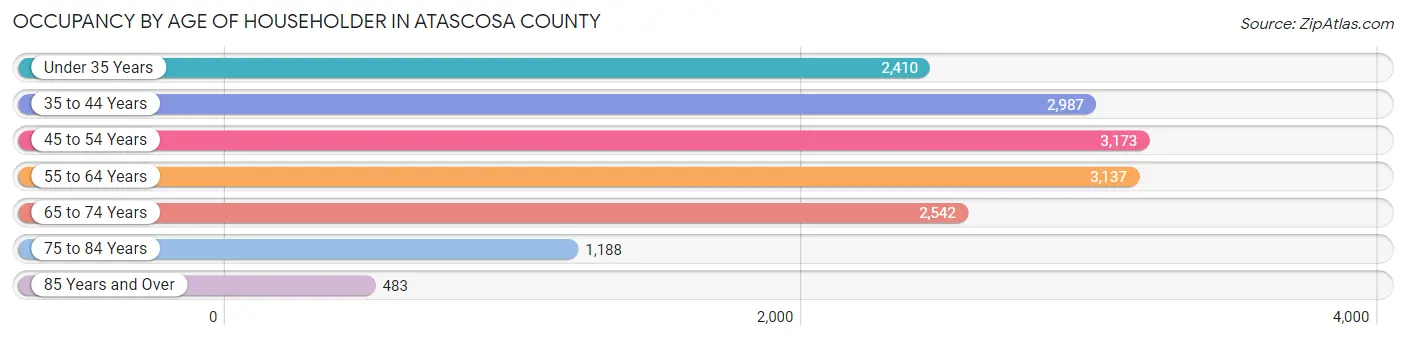
| Age Bracket | # Households | % Households |
| Under 35 Years | 2,410 | 15.1% |
| 35 to 44 Years | 2,987 | 18.8% |
| 45 to 54 Years | 3,173 | 19.9% |
| 55 to 64 Years | 3,137 | 19.7% |
| 65 to 74 Years | 2,542 | 16.0% |
| 75 to 84 Years | 1,188 | 7.5% |
| 85 Years and Over | 483 | 3.0% |
| Total | 15,920 | 100.0% |
Housing Finances in Atascosa County
Median Income by Occupancy in Atascosa County
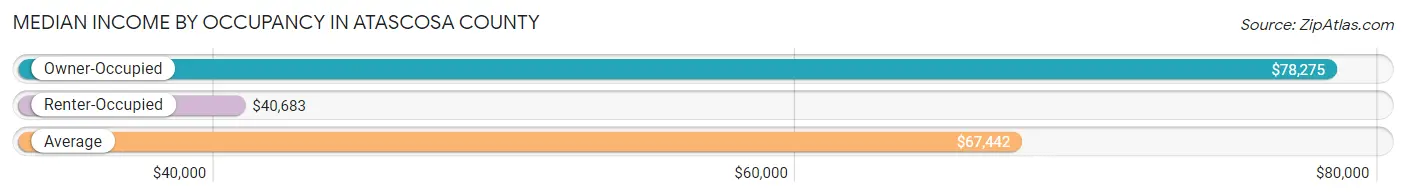
| Occupancy Type | # Households | Median Income |
| Owner-Occupied | 11,957 (75.1%) | $78,275 |
| Renter-Occupied | 3,963 (24.9%) | $40,683 |
| Average | 15,920 (100.0%) | $67,442 |
Occupancy by Householder Income Bracket in Atascosa County
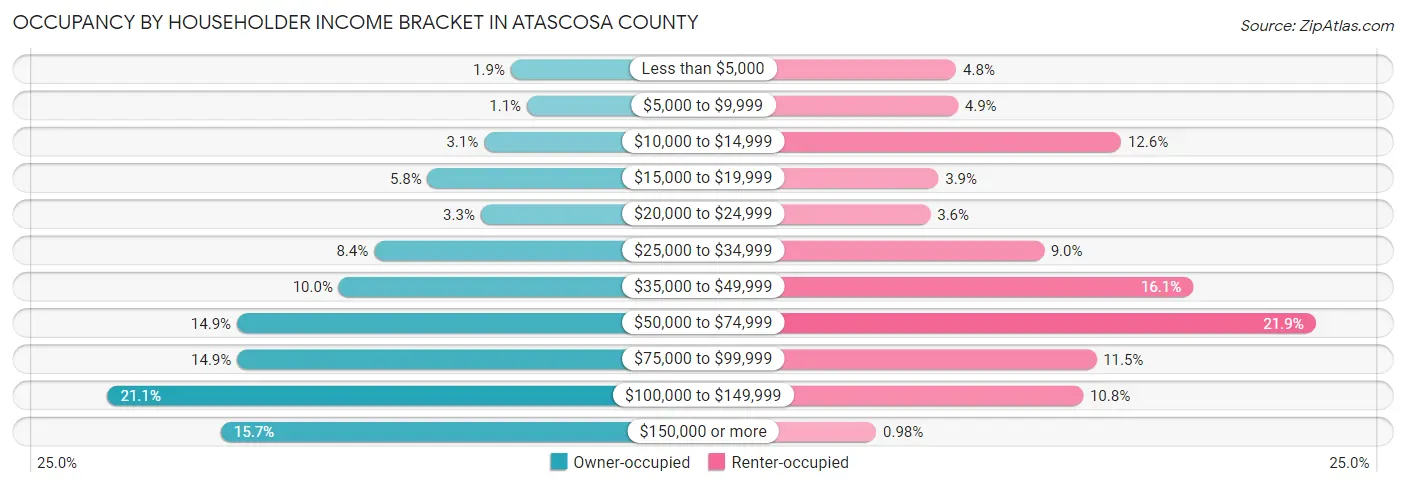
| Income Bracket | Owner-occupied | Renter-occupied |
| Less than $5,000 | 221 (1.8%) | 190 (4.8%) |
| $5,000 to $9,999 | 129 (1.1%) | 193 (4.9%) |
| $10,000 to $14,999 | 373 (3.1%) | 501 (12.6%) |
| $15,000 to $19,999 | 695 (5.8%) | 156 (3.9%) |
| $20,000 to $24,999 | 392 (3.3%) | 141 (3.6%) |
| $25,000 to $34,999 | 1,000 (8.4%) | 355 (9.0%) |
| $35,000 to $49,999 | 1,200 (10.0%) | 637 (16.1%) |
| $50,000 to $74,999 | 1,780 (14.9%) | 868 (21.9%) |
| $75,000 to $99,999 | 1,779 (14.9%) | 454 (11.5%) |
| $100,000 to $149,999 | 2,517 (21.0%) | 429 (10.8%) |
| $150,000 or more | 1,871 (15.7%) | 39 (1.0%) |
| Total | 11,957 (100.0%) | 3,963 (100.0%) |
Monthly Housing Cost Tiers in Atascosa County
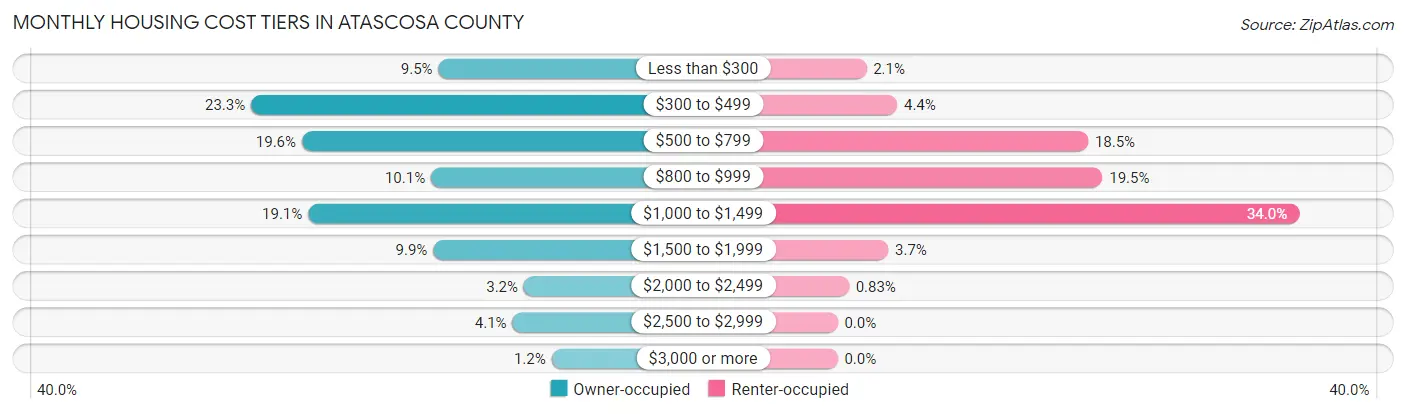
| Monthly Cost | Owner-occupied | Renter-occupied |
| Less than $300 | 1,138 (9.5%) | 84 (2.1%) |
| $300 to $499 | 2,788 (23.3%) | 174 (4.4%) |
| $500 to $799 | 2,341 (19.6%) | 731 (18.4%) |
| $800 to $999 | 1,204 (10.1%) | 773 (19.5%) |
| $1,000 to $1,499 | 2,286 (19.1%) | 1,347 (34.0%) |
| $1,500 to $1,999 | 1,185 (9.9%) | 148 (3.7%) |
| $2,000 to $2,499 | 386 (3.2%) | 33 (0.8%) |
| $2,500 to $2,999 | 487 (4.1%) | 0 (0.0%) |
| $3,000 or more | 142 (1.2%) | 0 (0.0%) |
| Total | 11,957 (100.0%) | 3,963 (100.0%) |
Physical Housing Characteristics in Atascosa County
Housing Structures in Atascosa County
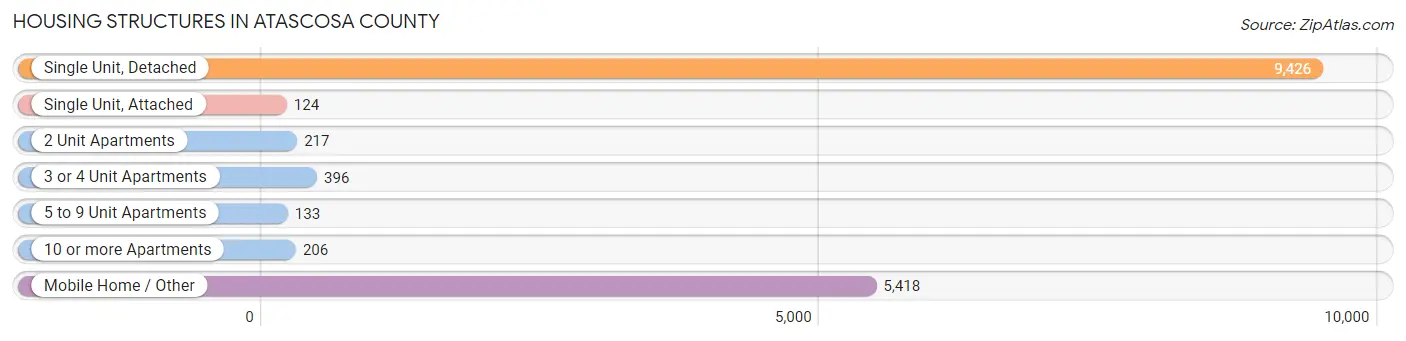
| Structure Type | # Housing Units | % Housing Units |
| Single Unit, Detached | 9,426 | 59.2% |
| Single Unit, Attached | 124 | 0.8% |
| 2 Unit Apartments | 217 | 1.4% |
| 3 or 4 Unit Apartments | 396 | 2.5% |
| 5 to 9 Unit Apartments | 133 | 0.8% |
| 10 or more Apartments | 206 | 1.3% |
| Mobile Home / Other | 5,418 | 34.0% |
| Total | 15,920 | 100.0% |
Housing Structures by Occupancy in Atascosa County
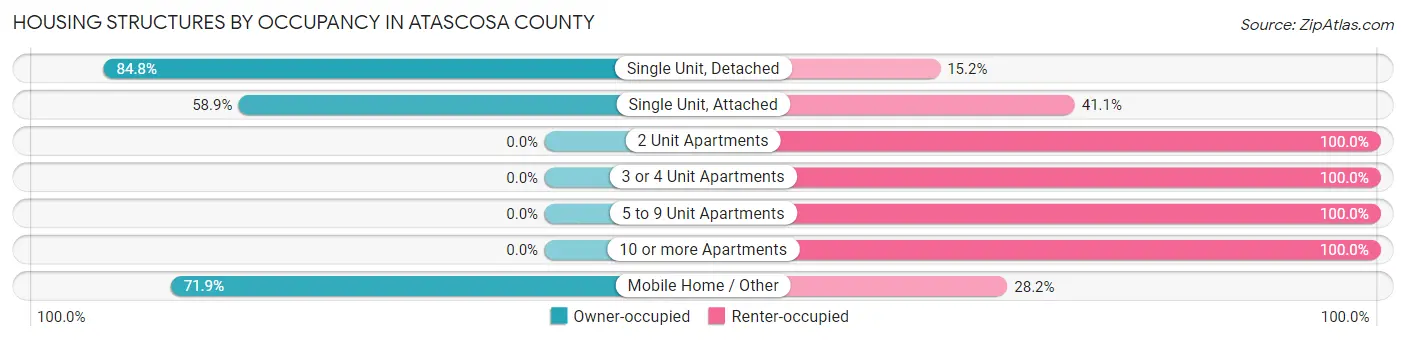
| Structure Type | Owner-occupied | Renter-occupied |
| Single Unit, Detached | 7,991 (84.8%) | 1,435 (15.2%) |
| Single Unit, Attached | 73 (58.9%) | 51 (41.1%) |
| 2 Unit Apartments | 0 (0.0%) | 217 (100.0%) |
| 3 or 4 Unit Apartments | 0 (0.0%) | 396 (100.0%) |
| 5 to 9 Unit Apartments | 0 (0.0%) | 133 (100.0%) |
| 10 or more Apartments | 0 (0.0%) | 206 (100.0%) |
| Mobile Home / Other | 3,893 (71.9%) | 1,525 (28.1%) |
| Total | 11,957 (75.1%) | 3,963 (24.9%) |
Housing Structures by Number of Rooms in Atascosa County
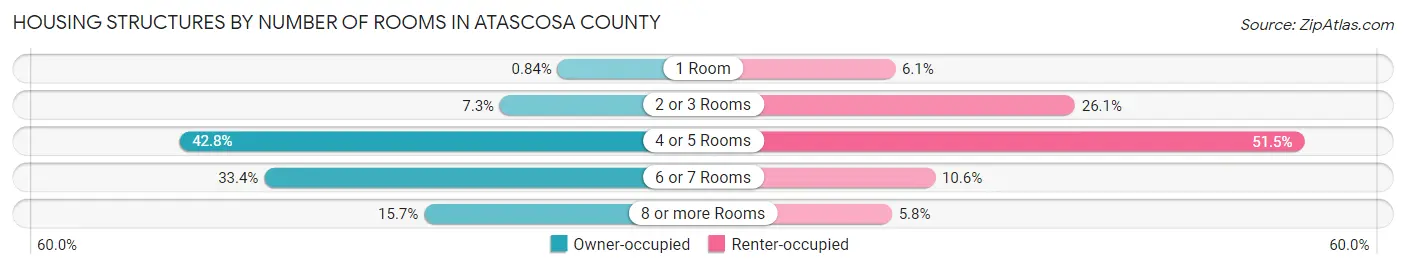
| Number of Rooms | Owner-occupied | Renter-occupied |
| 1 Room | 101 (0.8%) | 242 (6.1%) |
| 2 or 3 Rooms | 867 (7.2%) | 1,033 (26.1%) |
| 4 or 5 Rooms | 5,122 (42.8%) | 2,042 (51.5%) |
| 6 or 7 Rooms | 3,995 (33.4%) | 418 (10.5%) |
| 8 or more Rooms | 1,872 (15.7%) | 228 (5.8%) |
| Total | 11,957 (100.0%) | 3,963 (100.0%) |
Housing Structure by Heating Type in Atascosa County
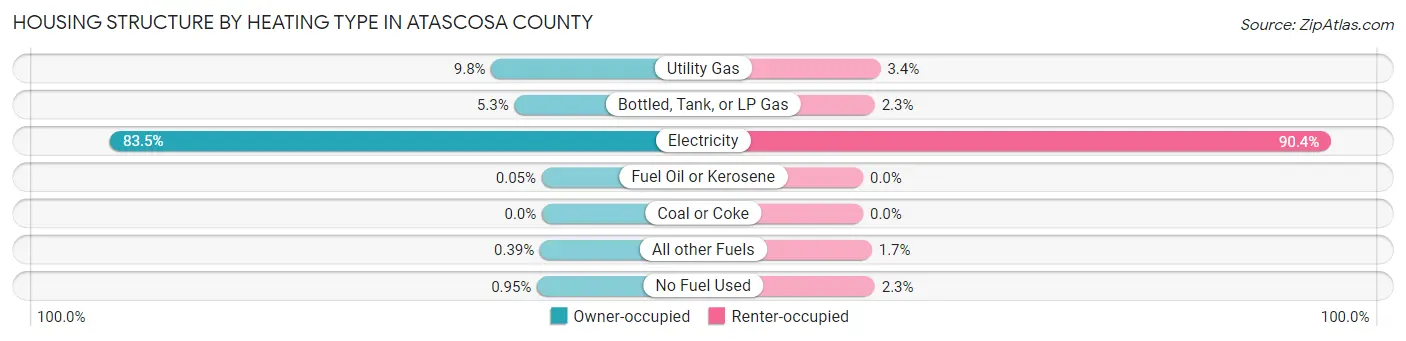
| Heating Type | Owner-occupied | Renter-occupied |
| Utility Gas | 1,171 (9.8%) | 133 (3.4%) |
| Bottled, Tank, or LP Gas | 639 (5.3%) | 89 (2.2%) |
| Electricity | 9,980 (83.5%) | 3,584 (90.4%) |
| Fuel Oil or Kerosene | 6 (0.1%) | 0 (0.0%) |
| Coal or Coke | 0 (0.0%) | 0 (0.0%) |
| All other Fuels | 47 (0.4%) | 67 (1.7%) |
| No Fuel Used | 114 (0.9%) | 90 (2.3%) |
| Total | 11,957 (100.0%) | 3,963 (100.0%) |
Household Vehicle Usage in Atascosa County
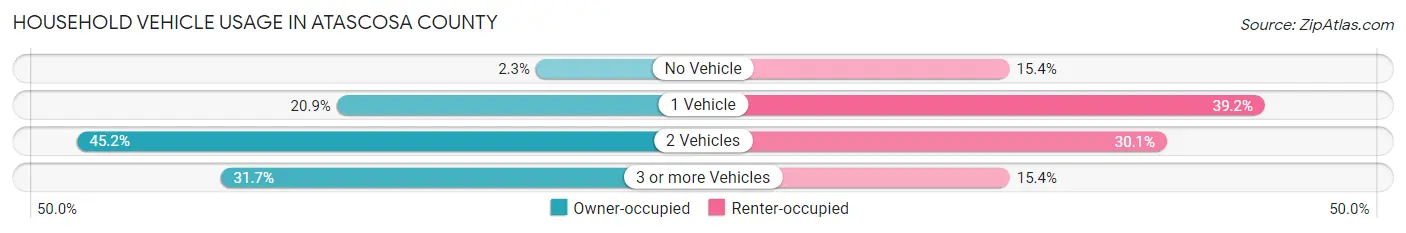
| Vehicles per Household | Owner-occupied | Renter-occupied |
| No Vehicle | 273 (2.3%) | 609 (15.4%) |
| 1 Vehicle | 2,495 (20.9%) | 1,553 (39.2%) |
| 2 Vehicles | 5,399 (45.2%) | 1,191 (30.0%) |
| 3 or more Vehicles | 3,790 (31.7%) | 610 (15.4%) |
| Total | 11,957 (100.0%) | 3,963 (100.0%) |
Real Estate & Mortgages in Atascosa County
Real Estate and Mortgage Overview in Atascosa County
| Characteristic | Without Mortgage | With Mortgage |
| Housing Units | 6,841 | 5,116 |
| Median Property Value | $115,300 | $164,500 |
| Median Household Income | $54,752 | $1,223 |
| Monthly Housing Costs | $465 | $122 |
| Real Estate Taxes | $1,919 | $271 |
Property Value by Mortgage Status in Atascosa County
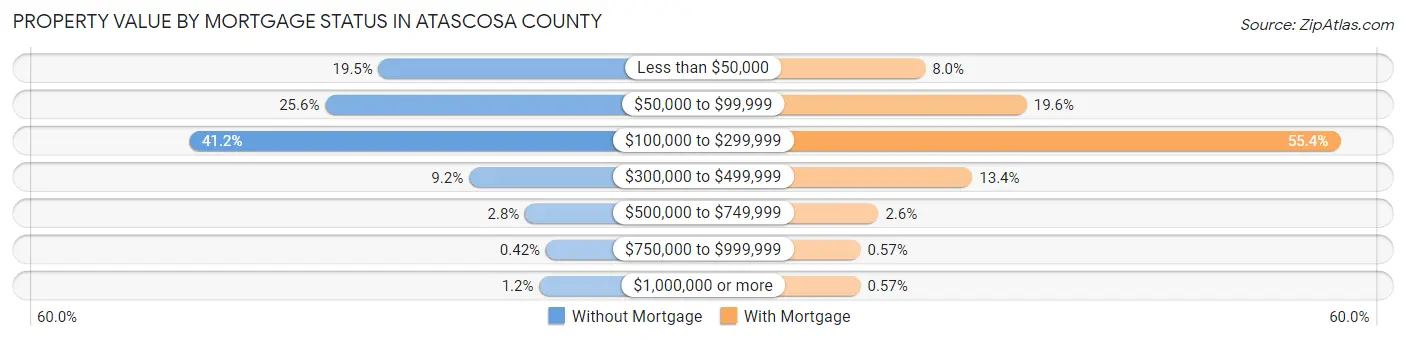
| Property Value | Without Mortgage | With Mortgage |
| Less than $50,000 | 1,337 (19.5%) | 408 (8.0%) |
| $50,000 to $99,999 | 1,754 (25.6%) | 1,001 (19.6%) |
| $100,000 to $299,999 | 2,819 (41.2%) | 2,832 (55.4%) |
| $300,000 to $499,999 | 630 (9.2%) | 683 (13.4%) |
| $500,000 to $749,999 | 191 (2.8%) | 134 (2.6%) |
| $750,000 to $999,999 | 29 (0.4%) | 29 (0.6%) |
| $1,000,000 or more | 81 (1.2%) | 29 (0.6%) |
| Total | 6,841 (100.0%) | 5,116 (100.0%) |
Household Income by Mortgage Status in Atascosa County
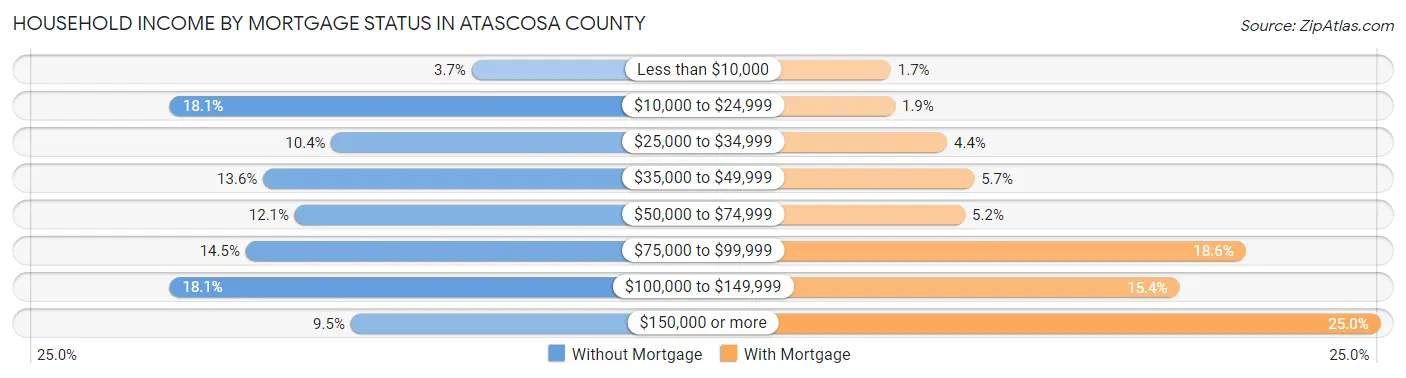
| Household Income | Without Mortgage | With Mortgage |
| Less than $10,000 | 254 (3.7%) | 86 (1.7%) |
| $10,000 to $24,999 | 1,237 (18.1%) | 96 (1.9%) |
| $25,000 to $34,999 | 711 (10.4%) | 223 (4.4%) |
| $35,000 to $49,999 | 933 (13.6%) | 289 (5.7%) |
| $50,000 to $74,999 | 830 (12.1%) | 267 (5.2%) |
| $75,000 to $99,999 | 990 (14.5%) | 950 (18.6%) |
| $100,000 to $149,999 | 1,238 (18.1%) | 789 (15.4%) |
| $150,000 or more | 648 (9.5%) | 1,279 (25.0%) |
| Total | 6,841 (100.0%) | 5,116 (100.0%) |
Property Value to Household Income Ratio in Atascosa County
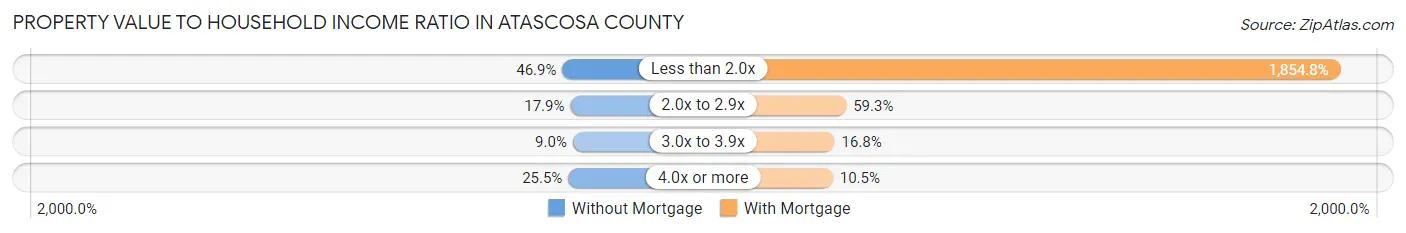
| Value-to-Income Ratio | Without Mortgage | With Mortgage |
| Less than 2.0x | 3,207 (46.9%) | 94,889 (1,854.7%) |
| 2.0x to 2.9x | 1,225 (17.9%) | 3,033 (59.3%) |
| 3.0x to 3.9x | 614 (9.0%) | 858 (16.8%) |
| 4.0x or more | 1,747 (25.5%) | 539 (10.5%) |
| Total | 6,841 (100.0%) | 5,116 (100.0%) |
Real Estate Taxes by Mortgage Status in Atascosa County
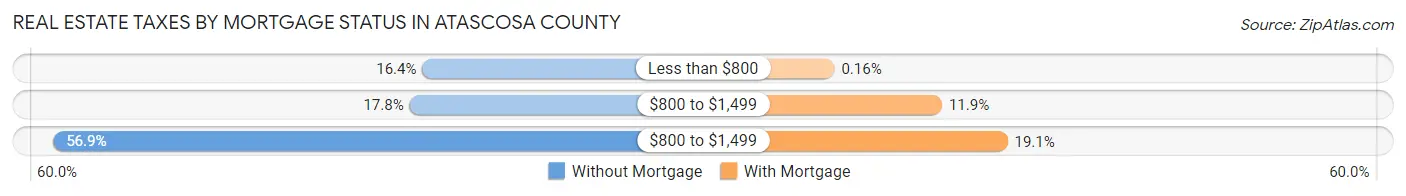
| Property Taxes | Without Mortgage | With Mortgage |
| Less than $800 | 1,123 (16.4%) | 8 (0.2%) |
| $800 to $1,499 | 1,219 (17.8%) | 611 (11.9%) |
| $800 to $1,499 | 3,890 (56.9%) | 978 (19.1%) |
| Total | 6,841 (100.0%) | 5,116 (100.0%) |
Health & Disability in Atascosa County
Health Insurance Coverage by Age in Atascosa County
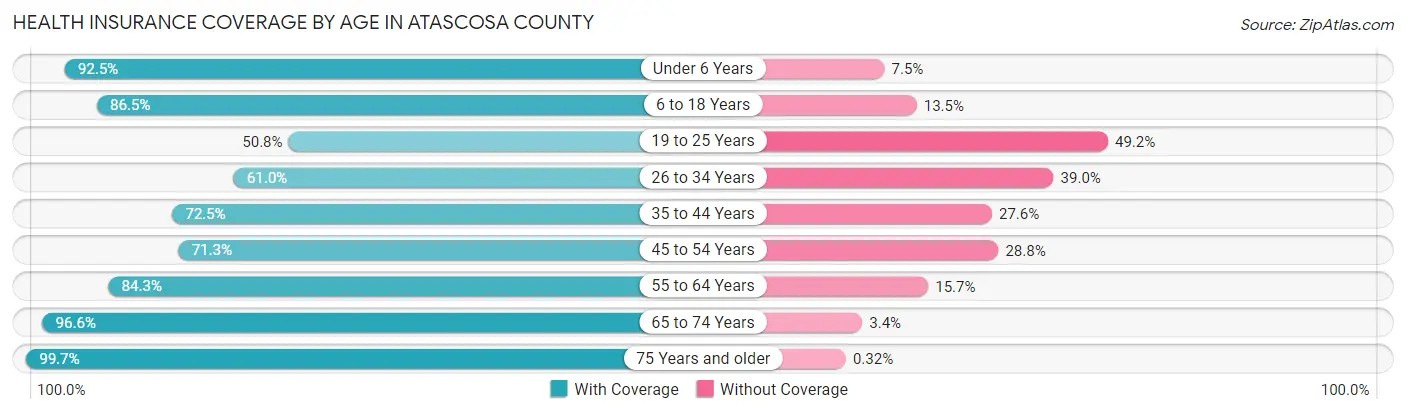
| Age Bracket | With Coverage | Without Coverage |
| Under 6 Years | 3,761 (92.5%) | 306 (7.5%) |
| 6 to 18 Years | 8,603 (86.5%) | 1,345 (13.5%) |
| 19 to 25 Years | 2,156 (50.8%) | 2,087 (49.2%) |
| 26 to 34 Years | 3,512 (61.0%) | 2,249 (39.0%) |
| 35 to 44 Years | 4,628 (72.5%) | 1,760 (27.6%) |
| 45 to 54 Years | 4,175 (71.3%) | 1,685 (28.7%) |
| 55 to 64 Years | 4,799 (84.3%) | 892 (15.7%) |
| 65 to 74 Years | 4,038 (96.6%) | 141 (3.4%) |
| 75 Years and older | 2,787 (99.7%) | 9 (0.3%) |
| Total | 38,459 (78.6%) | 10,474 (21.4%) |
Health Insurance Coverage by Citizenship Status in Atascosa County
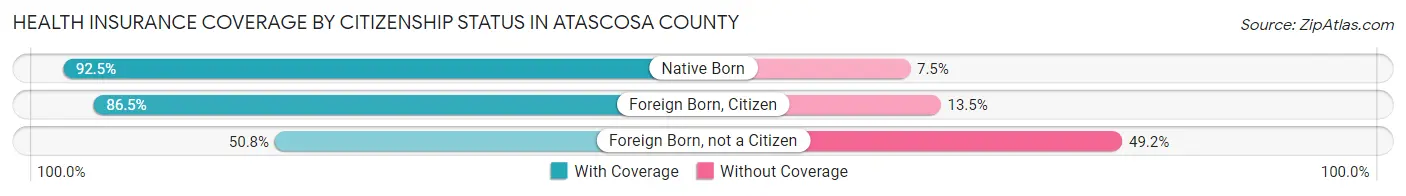
| Citizenship Status | With Coverage | Without Coverage |
| Native Born | 3,761 (92.5%) | 306 (7.5%) |
| Foreign Born, Citizen | 8,603 (86.5%) | 1,345 (13.5%) |
| Foreign Born, not a Citizen | 2,156 (50.8%) | 2,087 (49.2%) |
Health Insurance Coverage by Household Income in Atascosa County
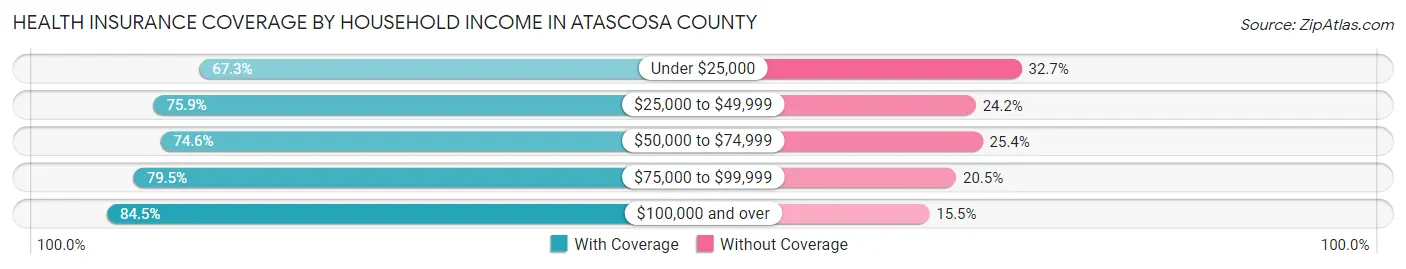
| Household Income | With Coverage | Without Coverage |
| Under $25,000 | 3,770 (67.3%) | 1,835 (32.7%) |
| $25,000 to $49,999 | 6,462 (75.8%) | 2,057 (24.1%) |
| $50,000 to $74,999 | 6,185 (74.6%) | 2,110 (25.4%) |
| $75,000 to $99,999 | 5,770 (79.5%) | 1,485 (20.5%) |
| $100,000 and over | 16,268 (84.5%) | 2,978 (15.5%) |
Public vs Private Health Insurance Coverage by Age in Atascosa County
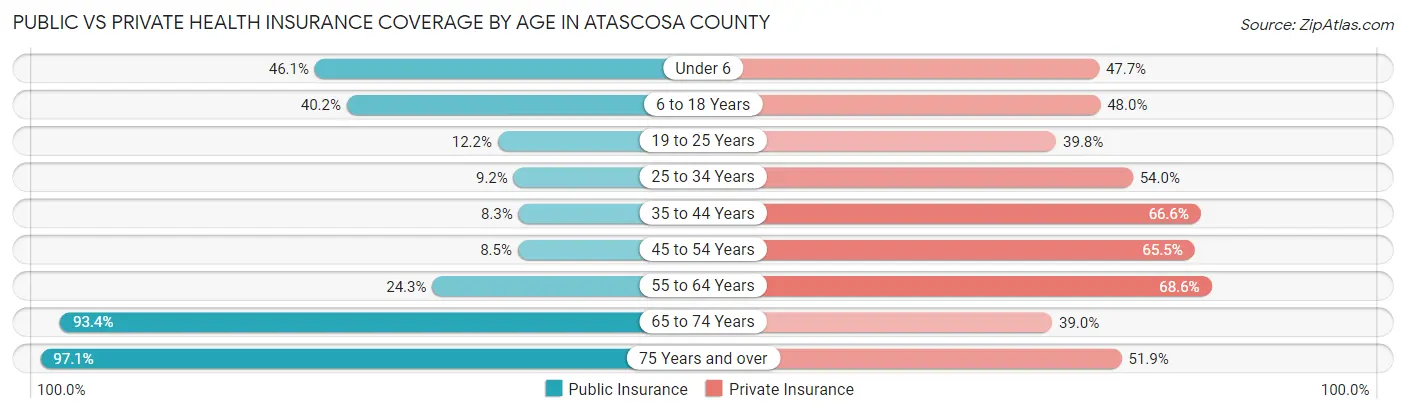
| Age Bracket | Public Insurance | Private Insurance |
| Under 6 | 1,876 (46.1%) | 1,941 (47.7%) |
| 6 to 18 Years | 3,999 (40.2%) | 4,772 (48.0%) |
| 19 to 25 Years | 516 (12.2%) | 1,688 (39.8%) |
| 25 to 34 Years | 532 (9.2%) | 3,111 (54.0%) |
| 35 to 44 Years | 531 (8.3%) | 4,256 (66.6%) |
| 45 to 54 Years | 495 (8.5%) | 3,837 (65.5%) |
| 55 to 64 Years | 1,384 (24.3%) | 3,904 (68.6%) |
| 65 to 74 Years | 3,904 (93.4%) | 1,631 (39.0%) |
| 75 Years and over | 2,714 (97.1%) | 1,452 (51.9%) |
| Total | 15,951 (32.6%) | 26,592 (54.3%) |
Disability Status by Sex by Age in Atascosa County
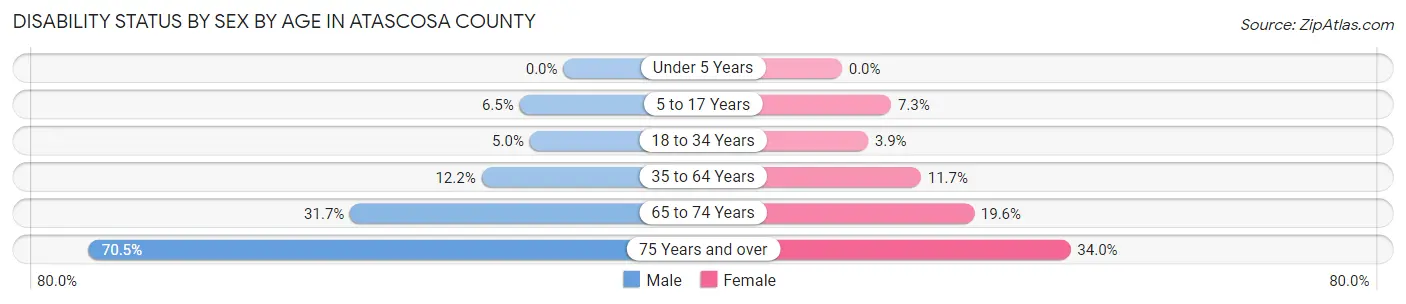
| Age Bracket | Male | Female |
| Under 5 Years | 0 (0.0%) | 0 (0.0%) |
| 5 to 17 Years | 326 (6.5%) | 356 (7.3%) |
| 18 to 34 Years | 271 (5.0%) | 205 (3.9%) |
| 35 to 64 Years | 1,090 (12.2%) | 1,053 (11.7%) |
| 65 to 74 Years | 632 (31.7%) | 428 (19.6%) |
| 75 Years and over | 868 (70.5%) | 531 (34.0%) |
Disability Class by Sex by Age in Atascosa County
Disability Class: Hearing Difficulty
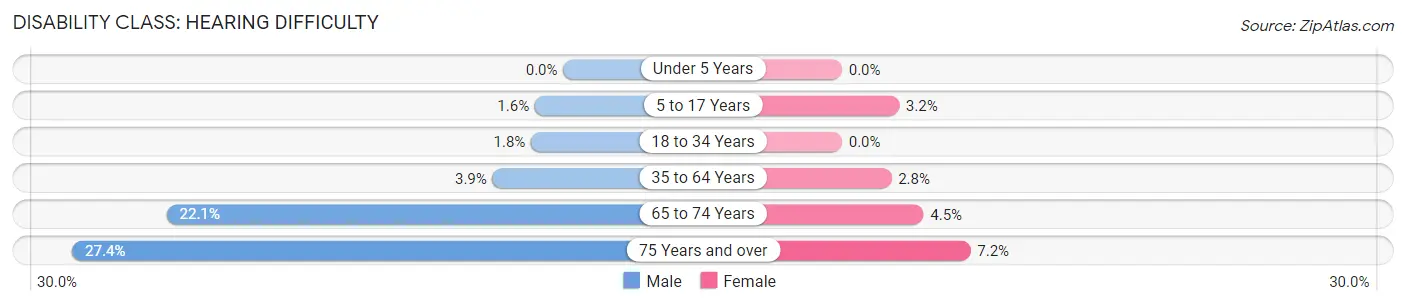
| Age Bracket | Male | Female |
| Under 5 Years | 0 (0.0%) | 0 (0.0%) |
| 5 to 17 Years | 79 (1.6%) | 155 (3.2%) |
| 18 to 34 Years | 97 (1.8%) | 0 (0.0%) |
| 35 to 64 Years | 353 (3.9%) | 247 (2.8%) |
| 65 to 74 Years | 441 (22.1%) | 99 (4.5%) |
| 75 Years and over | 337 (27.4%) | 112 (7.2%) |
Disability Class: Vision Difficulty
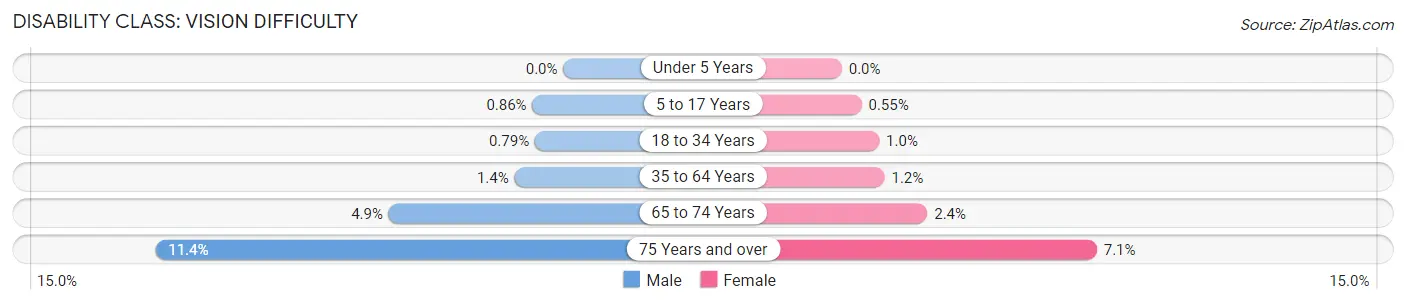
| Age Bracket | Male | Female |
| Under 5 Years | 0 (0.0%) | 0 (0.0%) |
| 5 to 17 Years | 43 (0.9%) | 27 (0.5%) |
| 18 to 34 Years | 43 (0.8%) | 55 (1.0%) |
| 35 to 64 Years | 122 (1.4%) | 107 (1.2%) |
| 65 to 74 Years | 97 (4.9%) | 52 (2.4%) |
| 75 Years and over | 140 (11.4%) | 111 (7.1%) |
Disability Class: Cognitive Difficulty
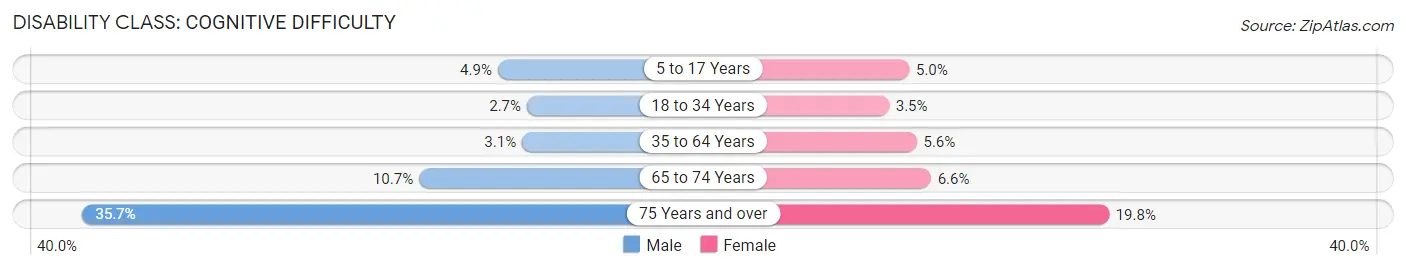
| Age Bracket | Male | Female |
| 5 to 17 Years | 244 (4.9%) | 243 (5.0%) |
| 18 to 34 Years | 147 (2.7%) | 185 (3.5%) |
| 35 to 64 Years | 275 (3.1%) | 498 (5.6%) |
| 65 to 74 Years | 214 (10.7%) | 144 (6.6%) |
| 75 Years and over | 440 (35.7%) | 310 (19.8%) |
Disability Class: Ambulatory Difficulty
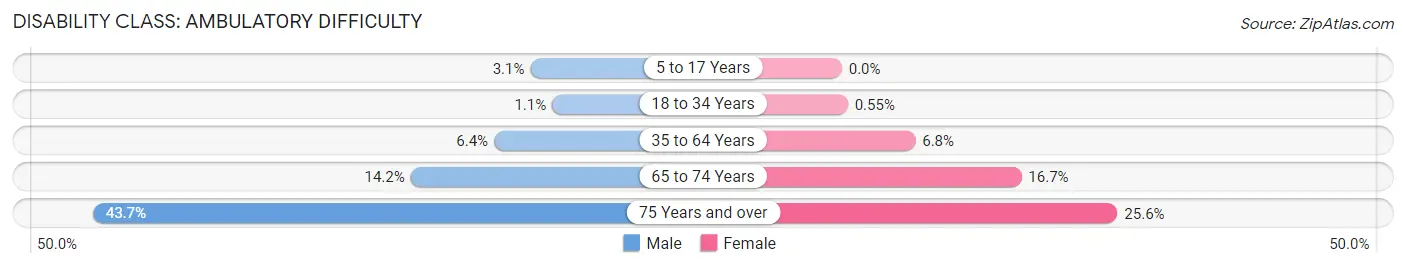
| Age Bracket | Male | Female |
| 5 to 17 Years | 154 (3.1%) | 0 (0.0%) |
| 18 to 34 Years | 57 (1.1%) | 29 (0.5%) |
| 35 to 64 Years | 577 (6.4%) | 612 (6.8%) |
| 65 to 74 Years | 283 (14.2%) | 364 (16.7%) |
| 75 Years and over | 538 (43.7%) | 400 (25.6%) |
Disability Class: Self-Care Difficulty
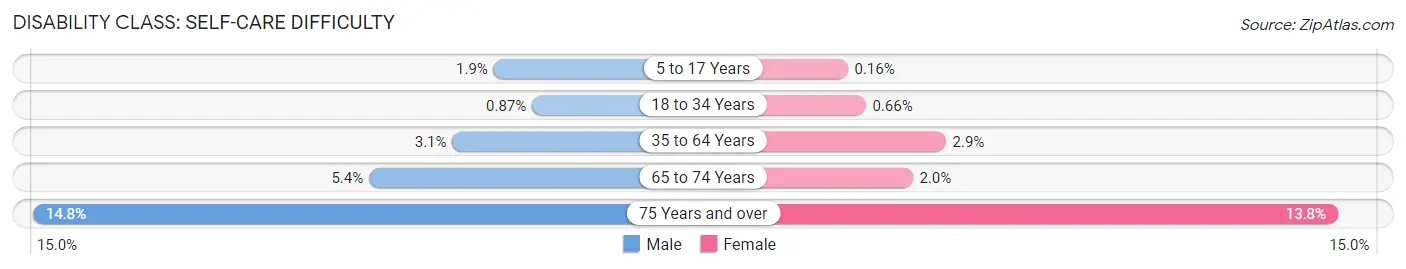
| Age Bracket | Male | Female |
| 5 to 17 Years | 97 (1.9%) | 8 (0.2%) |
| 18 to 34 Years | 47 (0.9%) | 35 (0.7%) |
| 35 to 64 Years | 277 (3.1%) | 259 (2.9%) |
| 65 to 74 Years | 108 (5.4%) | 43 (2.0%) |
| 75 Years and over | 182 (14.8%) | 216 (13.8%) |
Technology Access in Atascosa County
Computing Device Access in Atascosa County
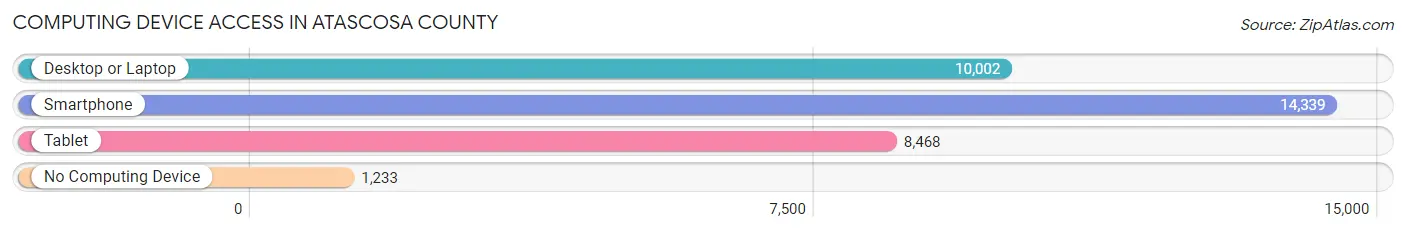
| Device Type | # Households | % Households |
| Desktop or Laptop | 10,002 | 62.8% |
| Smartphone | 14,339 | 90.1% |
| Tablet | 8,468 | 53.2% |
| No Computing Device | 1,233 | 7.7% |
| Total | 15,920 | 100.0% |
Internet Access in Atascosa County
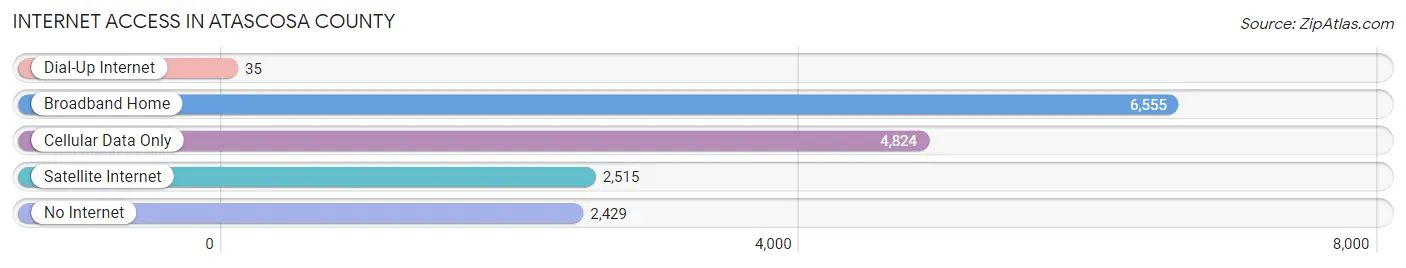
| Internet Type | # Households | % Households |
| Dial-Up Internet | 35 | 0.2% |
| Broadband Home | 6,555 | 41.2% |
| Cellular Data Only | 4,824 | 30.3% |
| Satellite Internet | 2,515 | 15.8% |
| No Internet | 2,429 | 15.3% |
| Total | 15,920 | 100.0% |
Atascosa County Summary
Atascosa County is located in the south-central region of Texas, and is part of the San Antonio-New Braunfels Metropolitan Statistical Area. The county is bordered by Bexar County to the north, Wilson County to the east, Karnes County to the south, and Frio County to the west. The county seat is Jourdanton, and the largest city is Pleasanton. As of the 2010 census, the population of Atascosa County was 44,911.
History
Atascosa County was established in 1856 from parts of Bexar and Wilson counties. It was named for the Atascosa River, which was named by Spanish explorers in the 18th century. The county was originally populated by Native American tribes, including the Coahuiltecan, Lipan Apache, and Tonkawa.
In the late 19th century, the county began to be settled by ranchers and farmers, and the population began to grow. The first railroad line was built in 1881, connecting the county to San Antonio. The county was also home to several military installations, including Camp Atascosa, which was established in 1876.
Geography
Atascosa County covers an area of 1,233 square miles, making it the second-largest county in Texas. The county is located in the Edwards Plateau region of Texas, and is mostly flat with rolling hills. The terrain is mostly covered in grasslands, with some areas of woodlands. The county is drained by the Atascosa River and its tributaries.
The climate of Atascosa County is semi-arid, with hot summers and mild winters. The average annual temperature is 68°F, and the average annual precipitation is 28 inches.
Economy
Atascosa County’s economy is largely based on agriculture and oil and gas production. The county is home to several large ranches, and the main crops grown in the county are cotton, corn, sorghum, and wheat. The county is also home to several oil and gas fields, and the production of oil and gas is a major contributor to the local economy.
In addition to agriculture and oil and gas production, Atascosa County is home to several manufacturing companies, including a steel mill and a paper mill. The county is also home to several retail stores, restaurants, and other businesses.
Demographics
As of the 2010 census, the population of Atascosa County was 44,911, and the population density was 36.3 people per square mile. The racial makeup of the county was 79.2% White, 0.7% African American, 0.7% Native American, 0.3% Asian, 0.1% Pacific Islander, 16.7% from other races, and 2.4% from two or more races. Hispanic or Latino of any race were 57.2% of the population.
The median income for a household in Atascosa County was $41,945, and the median income for a family was $48,945. The per capita income for the county was $19,845. About 17.2% of the population was below the poverty line.
Common Questions
What is Per Capita Income in Atascosa County?
Per Capita income in Atascosa County is $27,386.
What is the Median Family Income in Atascosa County?
Median Family Income in Atascosa County is $77,582.
What is the Median Household income in Atascosa County?
Median Household Income in Atascosa County is $67,442.
What is Income or Wage Gap in Atascosa County?
Income or Wage Gap in Atascosa County is 33.2%.
Women in Atascosa County earn 66.8 cents for every dollar earned by a man.
What is Family Income Deficit in Atascosa County?
Family Income Deficit in Atascosa County is $9,470.
Families that are below poverty line in Atascosa County earn $9,470 less on average than the poverty threshold level.
What is Inequality or Gini Index in Atascosa County?
Inequality or Gini Index in Atascosa County is 0.43.
What is the Total Population of Atascosa County?
Total Population of Atascosa County is 49,403.
What is the Total Male Population of Atascosa County?
Total Male Population of Atascosa County is 24,580.
What is the Total Female Population of Atascosa County?
Total Female Population of Atascosa County is 24,823.
What is the Ratio of Males per 100 Females in Atascosa County?
There are 99.02 Males per 100 Females in Atascosa County.
What is the Ratio of Females per 100 Males in Atascosa County?
There are 100.99 Females per 100 Males in Atascosa County.
What is the Median Population Age in Atascosa County?
Median Population Age in Atascosa County is 35.8 Years.
What is the Average Family Size in Atascosa County
Average Family Size in Atascosa County is 3.6 People.
What is the Average Household Size in Atascosa County
Average Household Size in Atascosa County is 3.1 People.
How Large is the Labor Force in Atascosa County?
There are 21,995 People in the Labor Forcein in Atascosa County.
What is the Percentage of People in the Labor Force in Atascosa County?
58.1% of People are in the Labor Force in Atascosa County.
What is the Unemployment Rate in Atascosa County?
Unemployment Rate in Atascosa County is 6.4%.