Aransas County, TX Map & Demographics
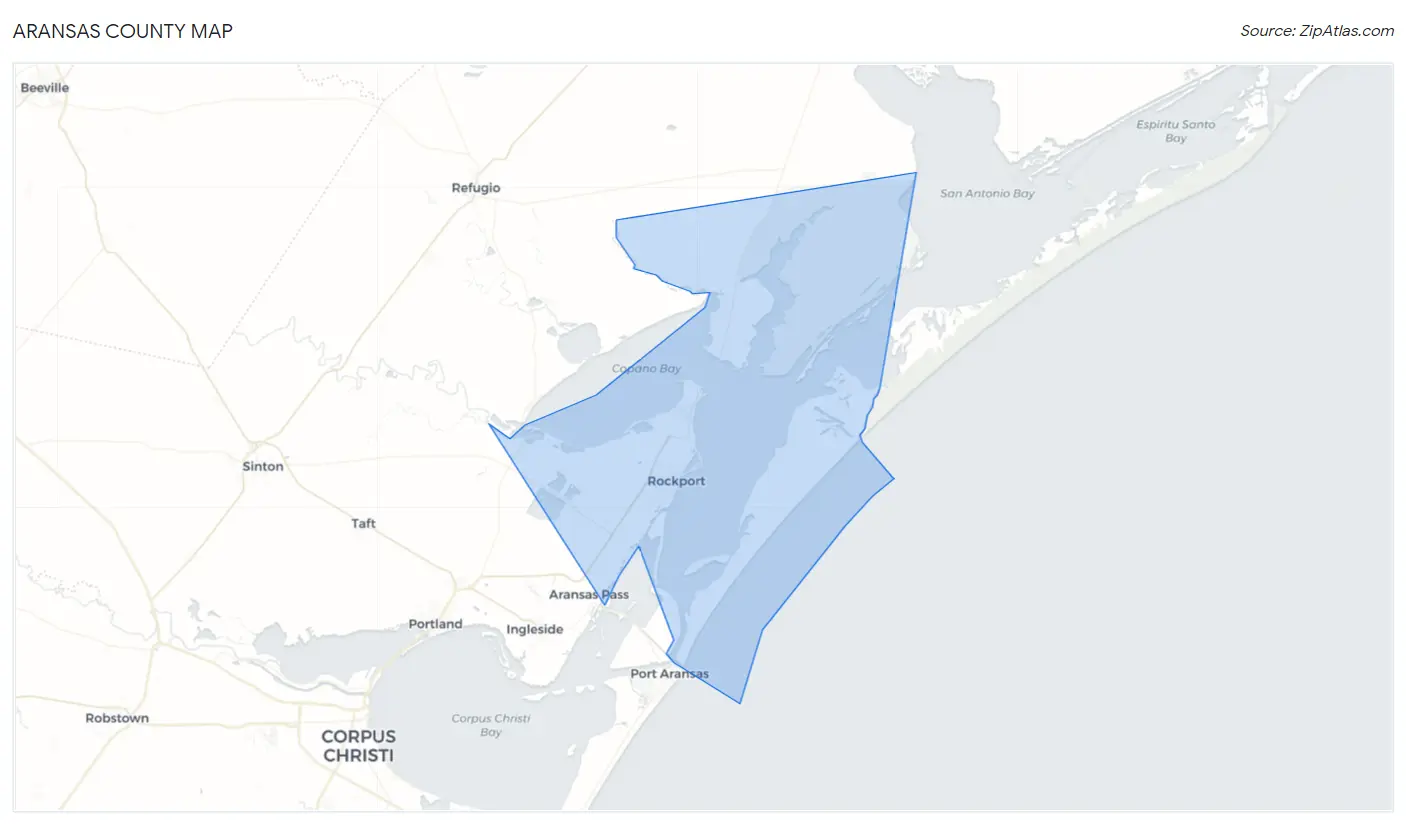
Aransas County Map
Aransas County Overview
$40,890
PER CAPITA INCOME
$71,896
AVG FAMILY INCOME
$58,168
AVG HOUSEHOLD INCOME
33.4%
WAGE / INCOME GAP [ % ]
66.6¢/ $1
WAGE / INCOME GAP [ $ ]
$13,433
FAMILY INCOME DEFICIT
0.51
INEQUALITY / GINI INDEX
24,048
TOTAL POPULATION
11,986
MALE POPULATION
12,062
FEMALE POPULATION
99.37
MALES / 100 FEMALES
100.63
FEMALES / 100 MALES
51.0
MEDIAN AGE
2.5
AVG FAMILY SIZE
2.1
AVG HOUSEHOLD SIZE
9,707
LABOR FORCE [ PEOPLE ]
47.8%
PERCENT IN LABOR FORCE
4.4%
UNEMPLOYMENT RATE
Aransas County Area Codes
Income in Aransas County
Income Overview in Aransas County
Per Capita Income in Aransas County is $40,890, while median incomes of families and households are $71,896 and $58,168 respectively.
| Characteristic | Number | Measure |
| Per Capita Income | 24,048 | $40,890 |
| Median Family Income | 7,139 | $71,896 |
| Mean Family Income | 7,139 | $100,837 |
| Median Household Income | 11,412 | $58,168 |
| Mean Household Income | 11,412 | $87,039 |
| Income Deficit | 7,139 | $13,433 |
| Wage / Income Gap (%) | 24,048 | 33.45% |
| Wage / Income Gap ($) | 24,048 | 66.55¢ per $1 |
| Gini / Inequality Index | 24,048 | 0.51 |
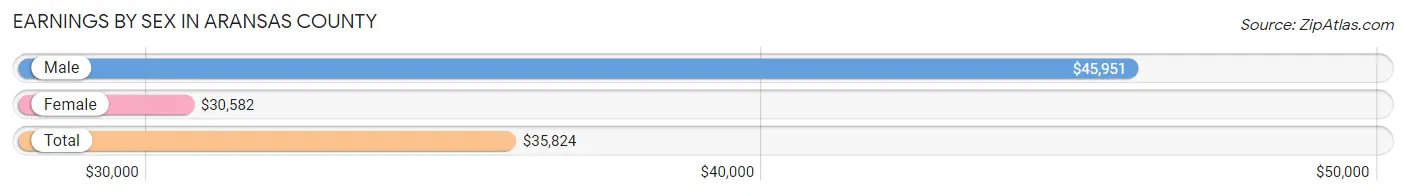
Earnings by Sex in Aransas County
Average Earnings in Aransas County are $35,824, $45,951 for men and $30,582 for women, a difference of 33.5%.
| Sex | Number | Average Earnings |
| Male | 5,908 (53.7%) | $45,951 |
| Female | 5,090 (46.3%) | $30,582 |
| Total | 10,998 (100.0%) | $35,824 |
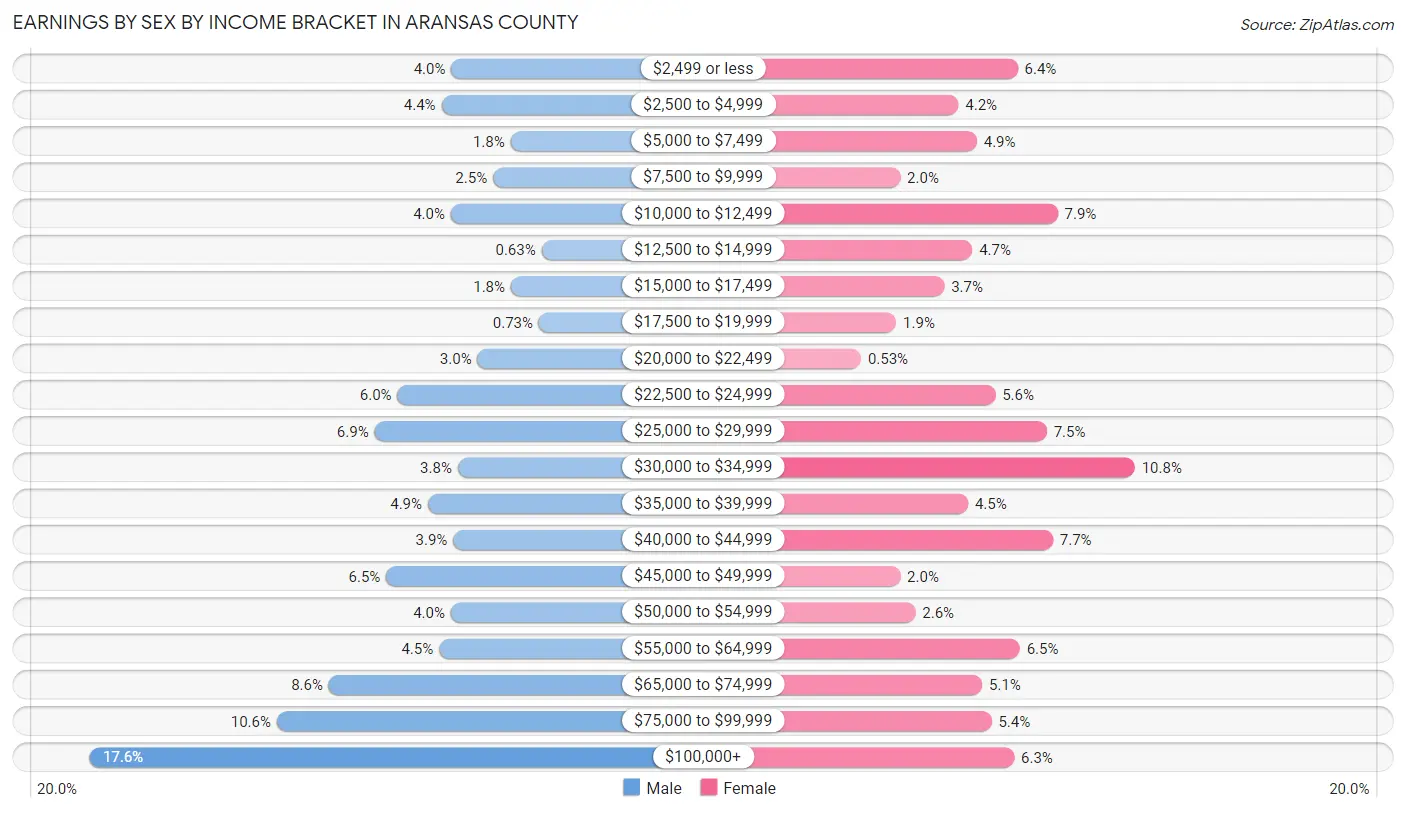
Earnings by Sex by Income Bracket in Aransas County
The most common earnings brackets in Aransas County are $100,000+ for men (1,037 | 17.5%) and $30,000 to $34,999 for women (549 | 10.8%).
| Income | Male | Female |
| $2,499 or less | 237 (4.0%) | 326 (6.4%) |
| $2,500 to $4,999 | 259 (4.4%) | 213 (4.2%) |
| $5,000 to $7,499 | 106 (1.8%) | 248 (4.9%) |
| $7,500 to $9,999 | 145 (2.5%) | 102 (2.0%) |
| $10,000 to $12,499 | 238 (4.0%) | 402 (7.9%) |
| $12,500 to $14,999 | 37 (0.6%) | 239 (4.7%) |
| $15,000 to $17,499 | 105 (1.8%) | 186 (3.6%) |
| $17,500 to $19,999 | 43 (0.7%) | 94 (1.8%) |
| $20,000 to $22,499 | 179 (3.0%) | 27 (0.5%) |
| $22,500 to $24,999 | 356 (6.0%) | 283 (5.6%) |
| $25,000 to $29,999 | 407 (6.9%) | 381 (7.5%) |
| $30,000 to $34,999 | 223 (3.8%) | 549 (10.8%) |
| $35,000 to $39,999 | 289 (4.9%) | 231 (4.5%) |
| $40,000 to $44,999 | 233 (3.9%) | 393 (7.7%) |
| $45,000 to $49,999 | 381 (6.5%) | 102 (2.0%) |
| $50,000 to $54,999 | 238 (4.0%) | 131 (2.6%) |
| $55,000 to $64,999 | 264 (4.5%) | 330 (6.5%) |
| $65,000 to $74,999 | 508 (8.6%) | 258 (5.1%) |
| $75,000 to $99,999 | 623 (10.5%) | 276 (5.4%) |
| $100,000+ | 1,037 (17.5%) | 319 (6.3%) |
| Total | 5,908 (100.0%) | 5,090 (100.0%) |
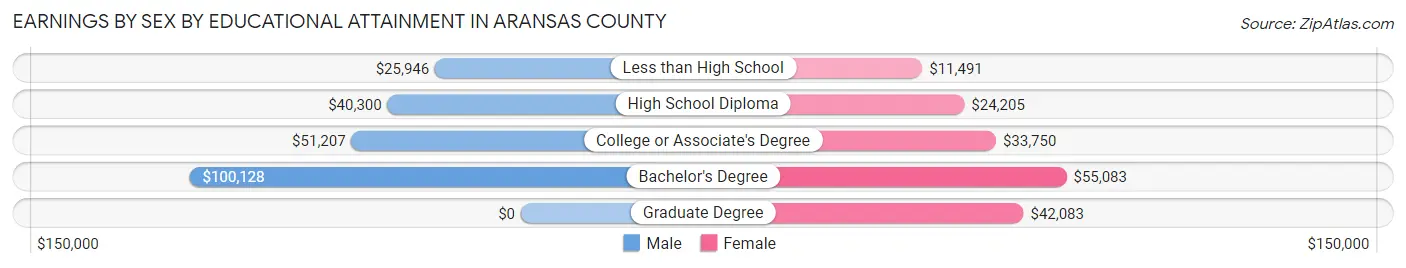
Earnings by Sex by Educational Attainment in Aransas County
Average earnings in Aransas County are $46,887 for men and $32,750 for women, a difference of 30.1%. Men with an educational attainment of bachelor's degree enjoy the highest average annual earnings of $100,128, while those with less than high school education earn the least with $25,946. Women with an educational attainment of bachelor's degree earn the most with the average annual earnings of $55,083, while those with less than high school education have the smallest earnings of $11,491.
| Educational Attainment | Male Income | Female Income |
| Less than High School | $25,946 | $11,491 |
| High School Diploma | $40,300 | $24,205 |
| College or Associate's Degree | $51,207 | $33,750 |
| Bachelor's Degree | $100,128 | $55,083 |
| Graduate Degree | - | - |
| Total | $46,887 | $32,750 |
Family Income in Aransas County
Family Income Brackets in Aransas County
According to the Aransas County family income data, there are 1,249 families falling into the $100,000 to $149,999 income range, which is the most common income bracket and makes up 17.5% of all families. Conversely, the $10,000 to $14,999 income bracket is the least frequent group with only 178 families (2.5%) belonging to this category.
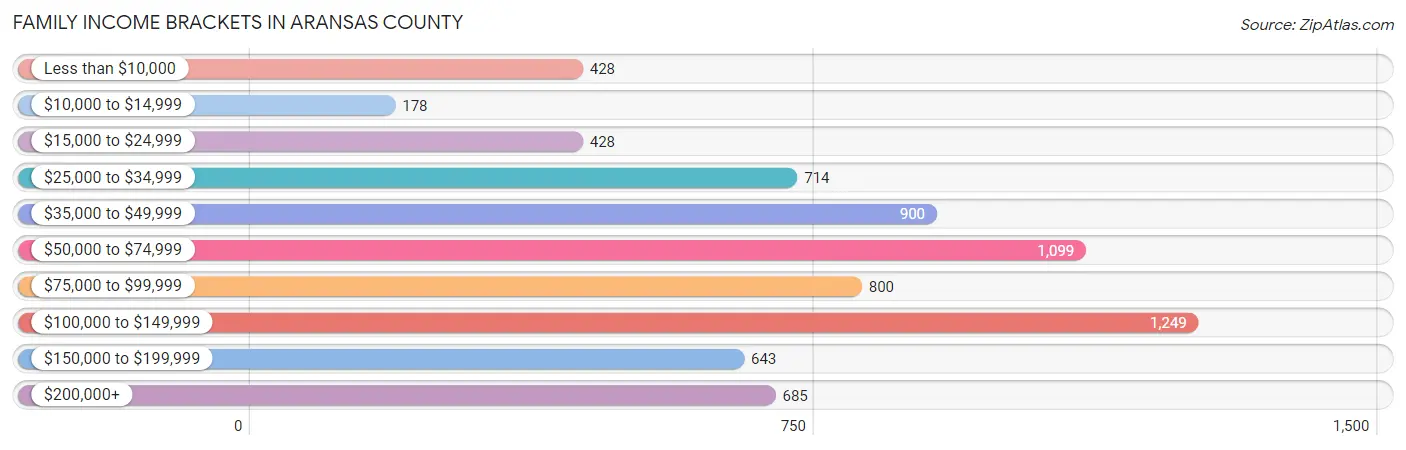
| Income Bracket | # Families | % Families |
| Less than $10,000 | 428 | 6.0% |
| $10,000 to $14,999 | 178 | 2.5% |
| $15,000 to $24,999 | 428 | 6.0% |
| $25,000 to $34,999 | 714 | 10.0% |
| $35,000 to $49,999 | 900 | 12.6% |
| $50,000 to $74,999 | 1,099 | 15.4% |
| $75,000 to $99,999 | 800 | 11.2% |
| $100,000 to $149,999 | 1,249 | 17.5% |
| $150,000 to $199,999 | 643 | 9.0% |
| $200,000+ | 685 | 9.6% |
Family Income by Famaliy Size in Aransas County
5-person families (484 | 6.8%) account for the highest median family income in Aransas County with $133,533 per family, while 2-person families (4,470 | 62.6%) have the highest median income of $34,929 per family member.
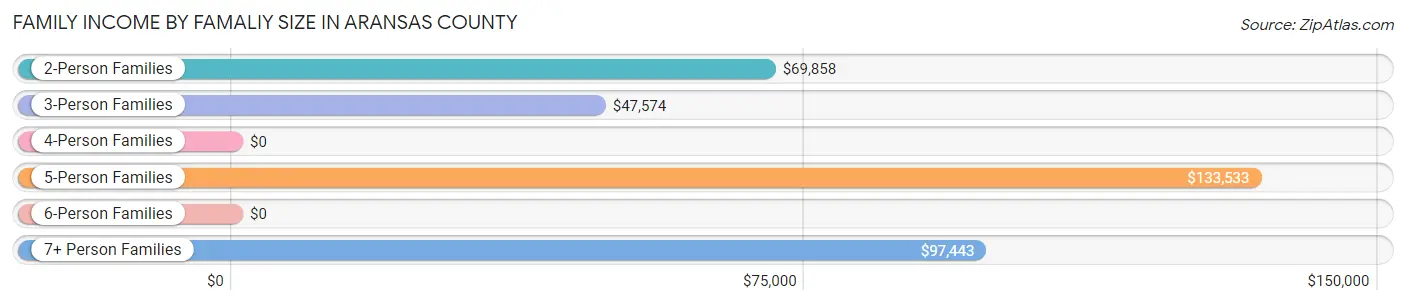
| Income Bracket | # Families | Median Income |
| 2-Person Families | 4,470 (62.6%) | $69,858 |
| 3-Person Families | 1,279 (17.9%) | $47,574 |
| 4-Person Families | 663 (9.3%) | $0 |
| 5-Person Families | 484 (6.8%) | $133,533 |
| 6-Person Families | 170 (2.4%) | $0 |
| 7+ Person Families | 73 (1.0%) | $97,443 |
| Total | 7,139 (100.0%) | $71,896 |
Family Income by Number of Earners in Aransas County
The median family income in Aransas County is $71,896, with families comprising 3+ earners (448) having the highest median family income of $125,000, while families with no earners (2,048) have the lowest median family income of $47,500, accounting for 6.3% and 28.7% of families, respectively.
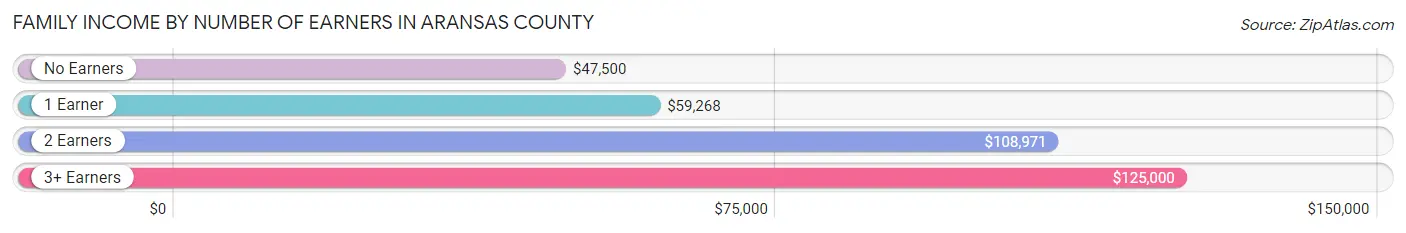
| Number of Earners | # Families | Median Income |
| No Earners | 2,048 (28.7%) | $47,500 |
| 1 Earner | 2,653 (37.2%) | $59,268 |
| 2 Earners | 1,990 (27.9%) | $108,971 |
| 3+ Earners | 448 (6.3%) | $125,000 |
| Total | 7,139 (100.0%) | $71,896 |
Household Income in Aransas County
Household Income Brackets in Aransas County
With 1,929 households falling in the category, the $50,000 to $74,999 income range is the most frequent in Aransas County, accounting for 16.9% of all households. In contrast, only 605 households (5.3%) fall into the $10,000 to $14,999 income bracket, making it the least populous group.
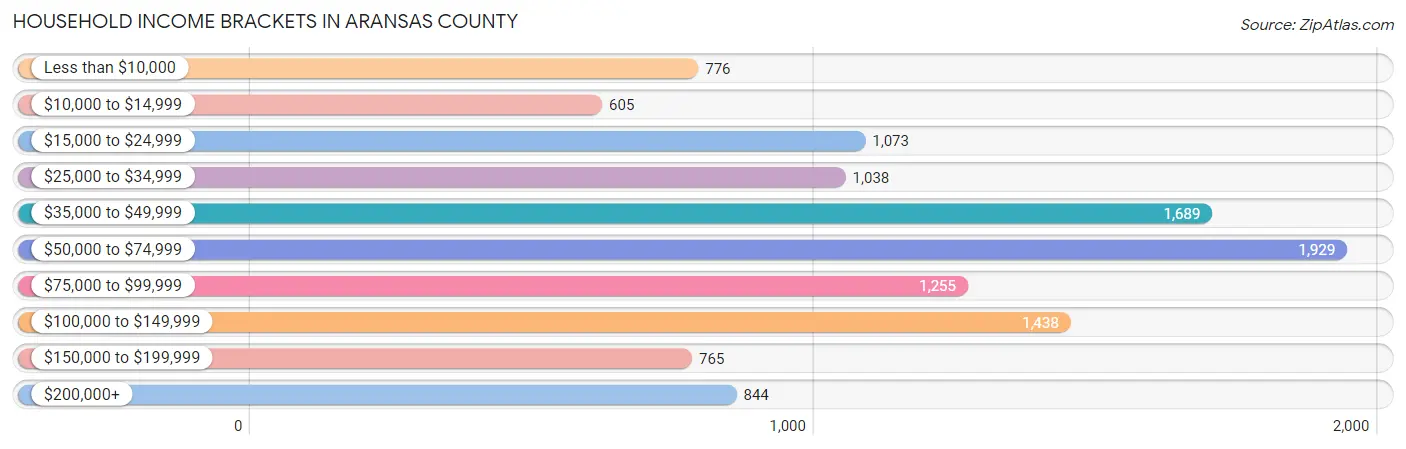
| Income Bracket | # Households | % Households |
| Less than $10,000 | 776 | 6.8% |
| $10,000 to $14,999 | 605 | 5.3% |
| $15,000 to $24,999 | 1,073 | 9.4% |
| $25,000 to $34,999 | 1,038 | 9.1% |
| $35,000 to $49,999 | 1,689 | 14.8% |
| $50,000 to $74,999 | 1,929 | 16.9% |
| $75,000 to $99,999 | 1,255 | 11.0% |
| $100,000 to $149,999 | 1,438 | 12.6% |
| $150,000 to $199,999 | 765 | 6.7% |
| $200,000+ | 844 | 7.4% |
Household Income by Householder Age in Aransas County
The median household income in Aransas County is $58,168, with the highest median household income of $67,881 found in the 25 to 44 years age bracket for the primary householder. A total of 2,954 households (25.9%) fall into this category. Meanwhile, the 15 to 24 years age bracket for the primary householder has the lowest median household income of $0, with 143 households (1.3%) in this group.
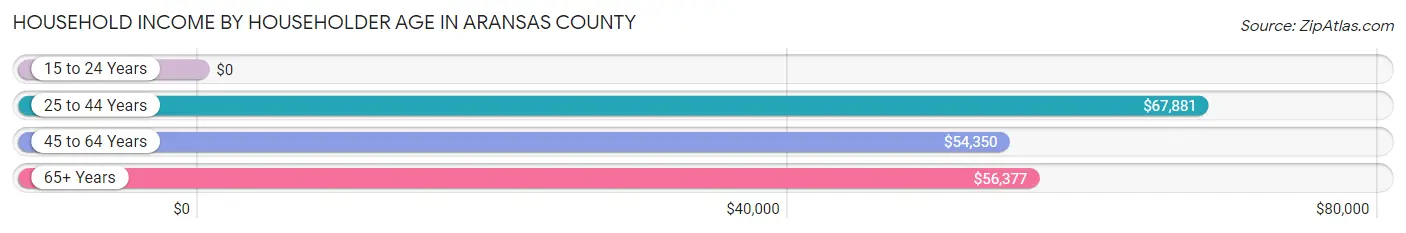
| Income Bracket | # Households | Median Income |
| 15 to 24 Years | 143 (1.3%) | $0 |
| 25 to 44 Years | 2,954 (25.9%) | $67,881 |
| 45 to 64 Years | 4,134 (36.2%) | $54,350 |
| 65+ Years | 4,181 (36.6%) | $56,377 |
| Total | 11,412 (100.0%) | $58,168 |
Poverty in Aransas County
Income Below Poverty by Sex and Age in Aransas County
With 16.6% poverty level for males and 19.1% for females among the residents of Aransas County, 6 to 11 year old males and 15 year old females are the most vulnerable to poverty, with 398 males (47.2%) and 25 females (36.8%) in their respective age groups living below the poverty level.
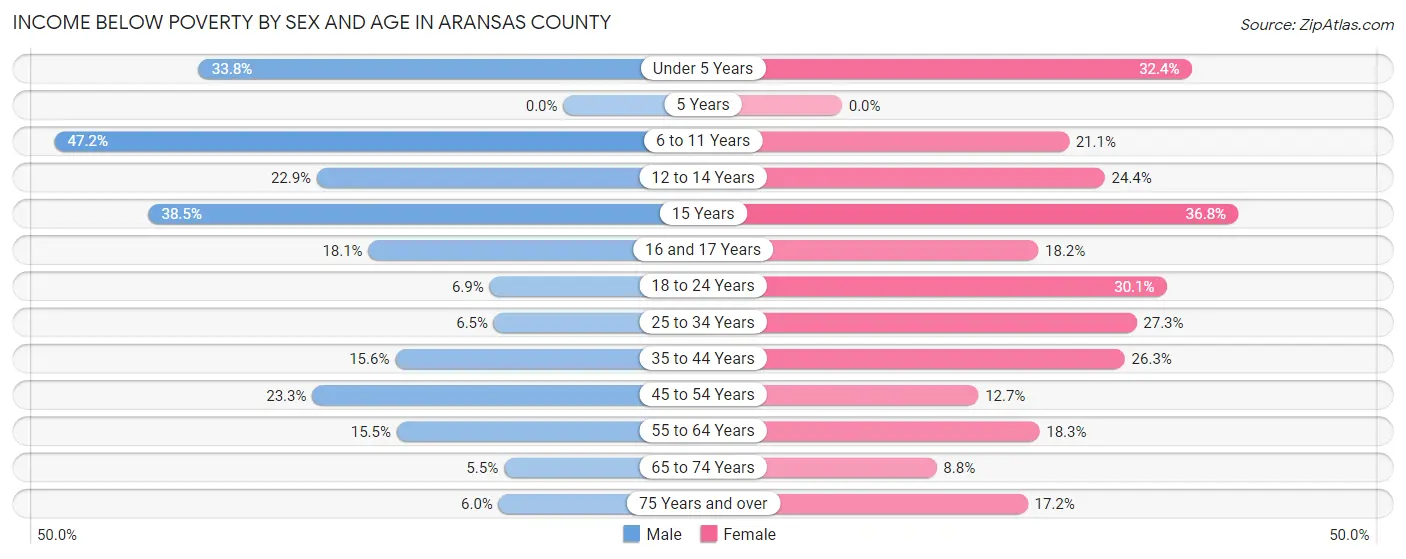
| Age Bracket | Male | Female |
| Under 5 Years | 187 (33.8%) | 156 (32.4%) |
| 5 Years | 0 (0.0%) | 0 (0.0%) |
| 6 to 11 Years | 398 (47.2%) | 99 (21.1%) |
| 12 to 14 Years | 67 (22.9%) | 120 (24.4%) |
| 15 Years | 112 (38.5%) | 25 (36.8%) |
| 16 and 17 Years | 36 (18.1%) | 45 (18.2%) |
| 18 to 24 Years | 27 (6.9%) | 131 (30.1%) |
| 25 to 34 Years | 70 (6.5%) | 321 (27.3%) |
| 35 to 44 Years | 245 (15.6%) | 379 (26.3%) |
| 45 to 54 Years | 353 (23.3%) | 185 (12.7%) |
| 55 to 64 Years | 298 (15.5%) | 383 (18.3%) |
| 65 to 74 Years | 100 (5.5%) | 159 (8.8%) |
| 75 Years and over | 78 (6.0%) | 267 (17.2%) |
| Total | 1,971 (16.6%) | 2,270 (19.1%) |
Income Above Poverty by Sex and Age in Aransas County
According to the poverty statistics in Aransas County, males aged 5 years and females aged 5 years are the age groups that are most secure financially, with 100.0% of males and 100.0% of females in these age groups living above the poverty line.
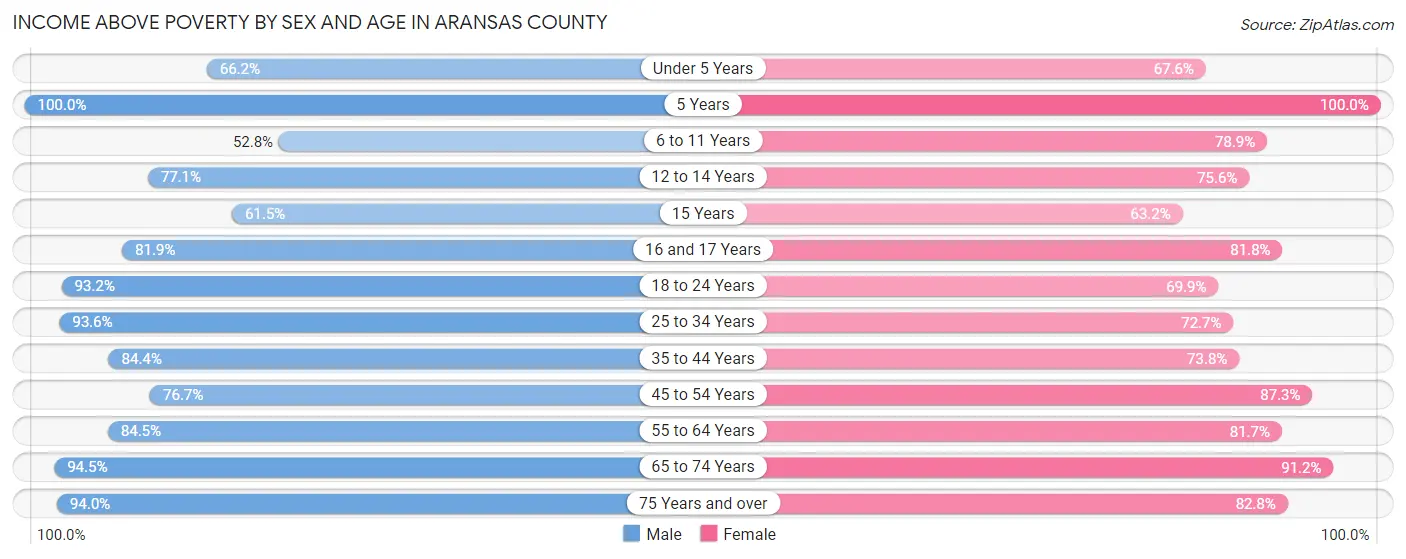
| Age Bracket | Male | Female |
| Under 5 Years | 366 (66.2%) | 325 (67.6%) |
| 5 Years | 56 (100.0%) | 165 (100.0%) |
| 6 to 11 Years | 445 (52.8%) | 371 (78.9%) |
| 12 to 14 Years | 226 (77.1%) | 372 (75.6%) |
| 15 Years | 179 (61.5%) | 43 (63.2%) |
| 16 and 17 Years | 163 (81.9%) | 202 (81.8%) |
| 18 to 24 Years | 367 (93.1%) | 304 (69.9%) |
| 25 to 34 Years | 1,016 (93.5%) | 853 (72.7%) |
| 35 to 44 Years | 1,326 (84.4%) | 1,065 (73.8%) |
| 45 to 54 Years | 1,162 (76.7%) | 1,276 (87.3%) |
| 55 to 64 Years | 1,629 (84.5%) | 1,707 (81.7%) |
| 65 to 74 Years | 1,715 (94.5%) | 1,652 (91.2%) |
| 75 Years and over | 1,223 (94.0%) | 1,282 (82.8%) |
| Total | 9,873 (83.4%) | 9,617 (80.9%) |
Income Below Poverty Among Married-Couple Families in Aransas County
The poverty statistics for married-couple families in Aransas County show that 8.2% or 452 of the total 5,546 families live below the poverty line. Families with 3 or 4 children have the highest poverty rate of 18.1%, comprising of 56 families. On the other hand, families with no children have the lowest poverty rate of 5.9%, which includes 254 families.
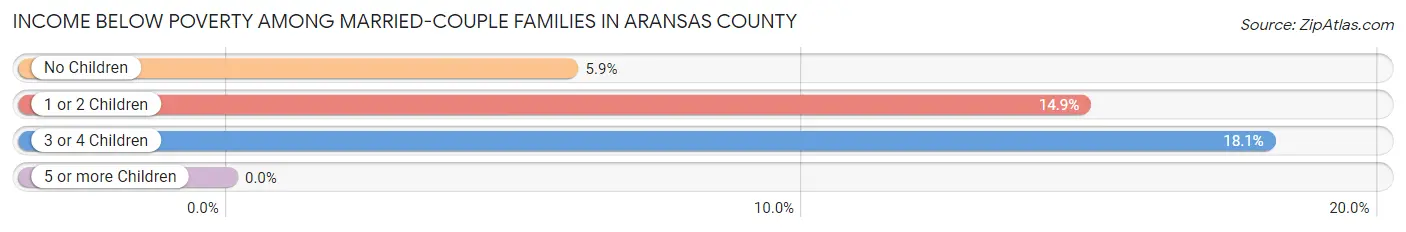
| Children | Above Poverty | Below Poverty |
| No Children | 4,026 (94.1%) | 254 (5.9%) |
| 1 or 2 Children | 814 (85.2%) | 142 (14.8%) |
| 3 or 4 Children | 254 (81.9%) | 56 (18.1%) |
| 5 or more Children | 0 (0.0%) | 0 (0.0%) |
| Total | 5,094 (91.8%) | 452 (8.2%) |
Income Below Poverty Among Single-Parent Households in Aransas County
According to the poverty data in Aransas County, 25.0% or 73 single-father households and 28.5% or 371 single-mother households are living below the poverty line. Among single-father households, those with 1 or 2 children have the highest poverty rate, with 73 households (51.0%) experiencing poverty. Likewise, among single-mother households, those with 3 or 4 children have the highest poverty rate, with 341 households (100.0%) falling below the poverty line.
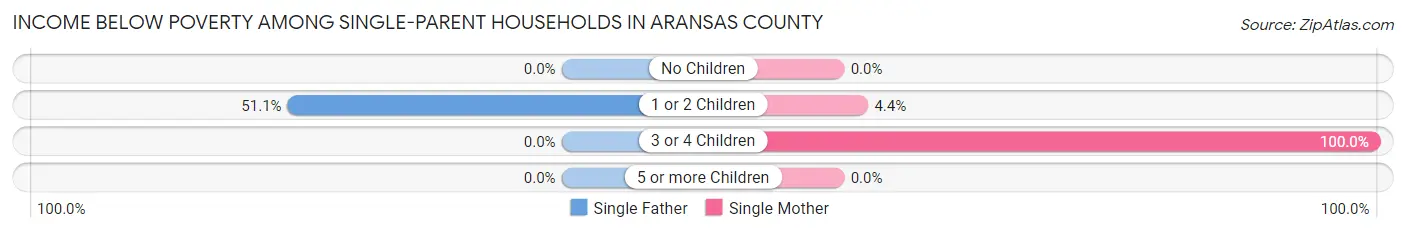
| Children | Single Father | Single Mother |
| No Children | 0 (0.0%) | 0 (0.0%) |
| 1 or 2 Children | 73 (51.0%) | 30 (4.4%) |
| 3 or 4 Children | 0 (0.0%) | 341 (100.0%) |
| 5 or more Children | 0 (0.0%) | 0 (0.0%) |
| Total | 73 (25.0%) | 371 (28.5%) |
Income Below Poverty Among Married-Couple vs Single-Parent Households in Aransas County
The poverty data for Aransas County shows that 452 of the married-couple family households (8.2%) and 444 of the single-parent households (27.9%) are living below the poverty level. Within the married-couple family households, those with 3 or 4 children have the highest poverty rate, with 56 households (18.1%) falling below the poverty line. Among the single-parent households, those with 3 or 4 children have the highest poverty rate, with 341 household (100.0%) living below poverty.
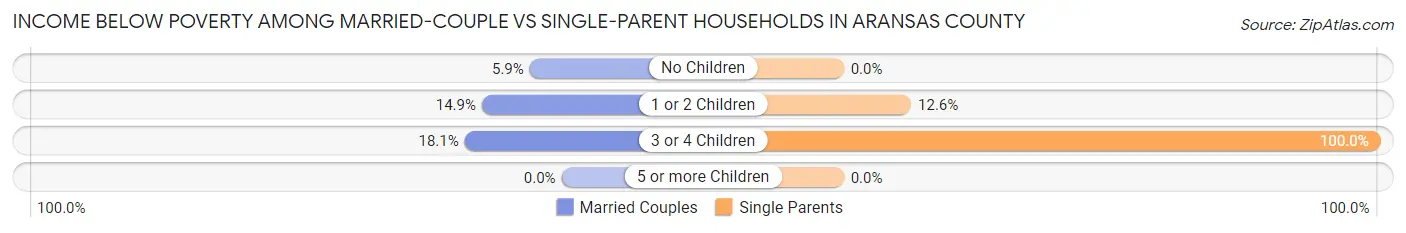
| Children | Married-Couple Families | Single-Parent Households |
| No Children | 254 (5.9%) | 0 (0.0%) |
| 1 or 2 Children | 142 (14.8%) | 103 (12.6%) |
| 3 or 4 Children | 56 (18.1%) | 341 (100.0%) |
| 5 or more Children | 0 (0.0%) | 0 (0.0%) |
| Total | 452 (8.2%) | 444 (27.9%) |
Race in Aransas County
The most populous races in Aransas County are White / Caucasian (19,514 | 81.1%), Hispanic or Latino (6,951 | 28.9%), and Two or more Races (2,828 | 11.8%).
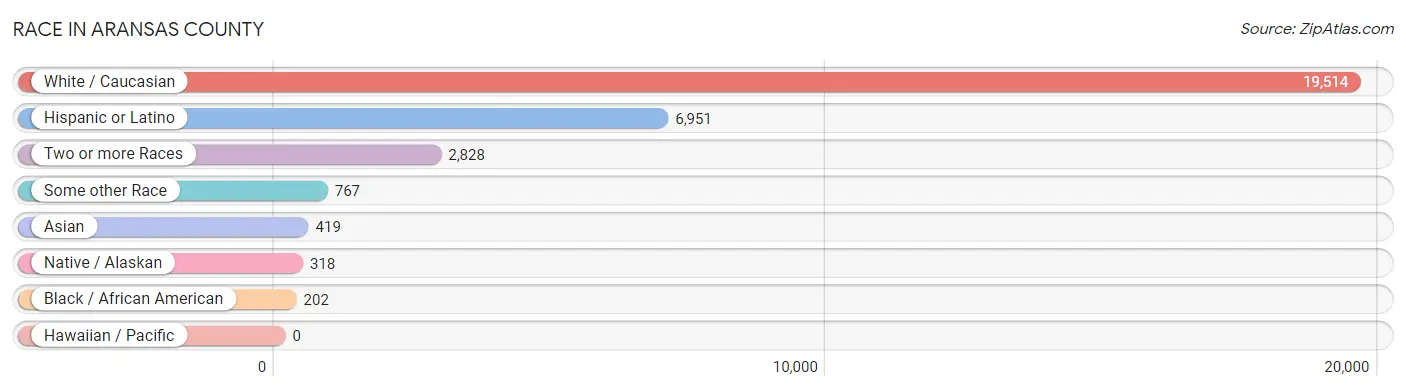
| Race | # Population | % Population |
| Asian | 419 | 1.7% |
| Black / African American | 202 | 0.8% |
| Hawaiian / Pacific | 0 | 0.0% |
| Hispanic or Latino | 6,951 | 28.9% |
| Native / Alaskan | 318 | 1.3% |
| White / Caucasian | 19,514 | 81.1% |
| Two or more Races | 2,828 | 11.8% |
| Some other Race | 767 | 3.2% |
| Total | 24,048 | 100.0% |
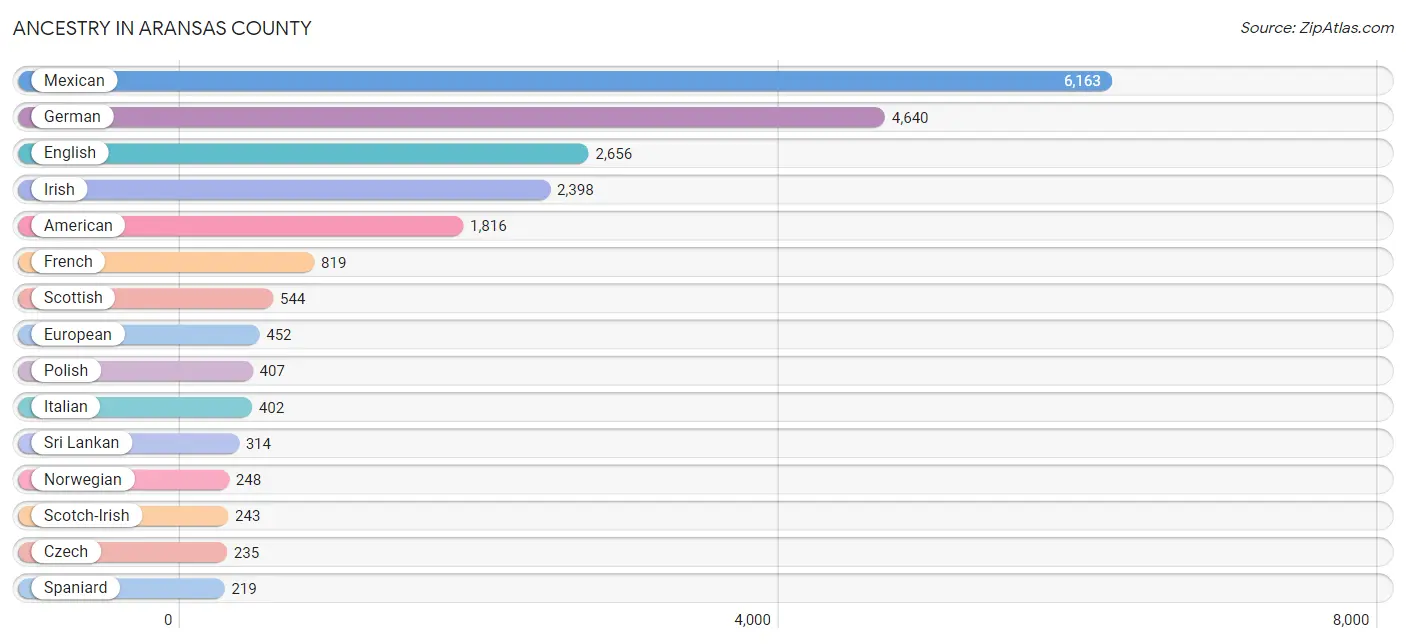
Ancestry in Aransas County
The most populous ancestries reported in Aransas County are Mexican (6,163 | 25.6%), German (4,640 | 19.3%), English (2,656 | 11.0%), Irish (2,398 | 10.0%), and American (1,816 | 7.5%), together accounting for 73.5% of all Aransas County residents.
| Ancestry | # Population | % Population |
| African | 4 | 0.0% |
| American | 1,816 | 7.5% |
| Apache | 74 | 0.3% |
| Arab | 37 | 0.2% |
| Austrian | 11 | 0.1% |
| Bhutanese | 133 | 0.5% |
| British | 205 | 0.9% |
| Burmese | 80 | 0.3% |
| Canadian | 3 | 0.0% |
| Carpatho Rusyn | 48 | 0.2% |
| Central American | 24 | 0.1% |
| Central American Indian | 41 | 0.2% |
| Cherokee | 164 | 0.7% |
| Chickasaw | 20 | 0.1% |
| Chilean | 13 | 0.1% |
| Choctaw | 80 | 0.3% |
| Colombian | 38 | 0.2% |
| Comanche | 74 | 0.3% |
| Cuban | 35 | 0.2% |
| Czech | 235 | 1.0% |
| Czechoslovakian | 66 | 0.3% |
| Danish | 19 | 0.1% |
| Dutch | 158 | 0.7% |
| Dutch West Indian | 11 | 0.1% |
| Eastern European | 16 | 0.1% |
| Ecuadorian | 41 | 0.2% |
| English | 2,656 | 11.0% |
| European | 452 | 1.9% |
| Filipino | 6 | 0.0% |
| Finnish | 53 | 0.2% |
| French | 819 | 3.4% |
| French Canadian | 57 | 0.2% |
| German | 4,640 | 19.3% |
| German Russian | 58 | 0.2% |
| Greek | 66 | 0.3% |
| Guatemalan | 24 | 0.1% |
| Haitian | 4 | 0.0% |
| Iraqi | 9 | 0.0% |
| Irish | 2,398 | 10.0% |
| Iroquois | 17 | 0.1% |
| Italian | 402 | 1.7% |
| Kenyan | 3 | 0.0% |
| Korean | 78 | 0.3% |
| Lebanese | 28 | 0.1% |
| Lithuanian | 20 | 0.1% |
| Mexican | 6,163 | 25.6% |
| Mexican American Indian | 126 | 0.5% |
| Northern European | 38 | 0.2% |
| Norwegian | 248 | 1.0% |
| Osage | 2 | 0.0% |
| Pennsylvania German | 9 | 0.0% |
| Polish | 407 | 1.7% |
| Portuguese | 17 | 0.1% |
| Potawatomi | 47 | 0.2% |
| Puerto Rican | 49 | 0.2% |
| Scandinavian | 74 | 0.3% |
| Scotch-Irish | 243 | 1.0% |
| Scottish | 544 | 2.3% |
| Slovak | 5 | 0.0% |
| South American | 92 | 0.4% |
| Spaniard | 219 | 0.9% |
| Spanish | 44 | 0.2% |
| Sri Lankan | 314 | 1.3% |
| Subsaharan African | 7 | 0.0% |
| Swedish | 140 | 0.6% |
| Swiss | 70 | 0.3% |
| Welsh | 43 | 0.2% | View All 67 Rows |
Immigrants in Aransas County
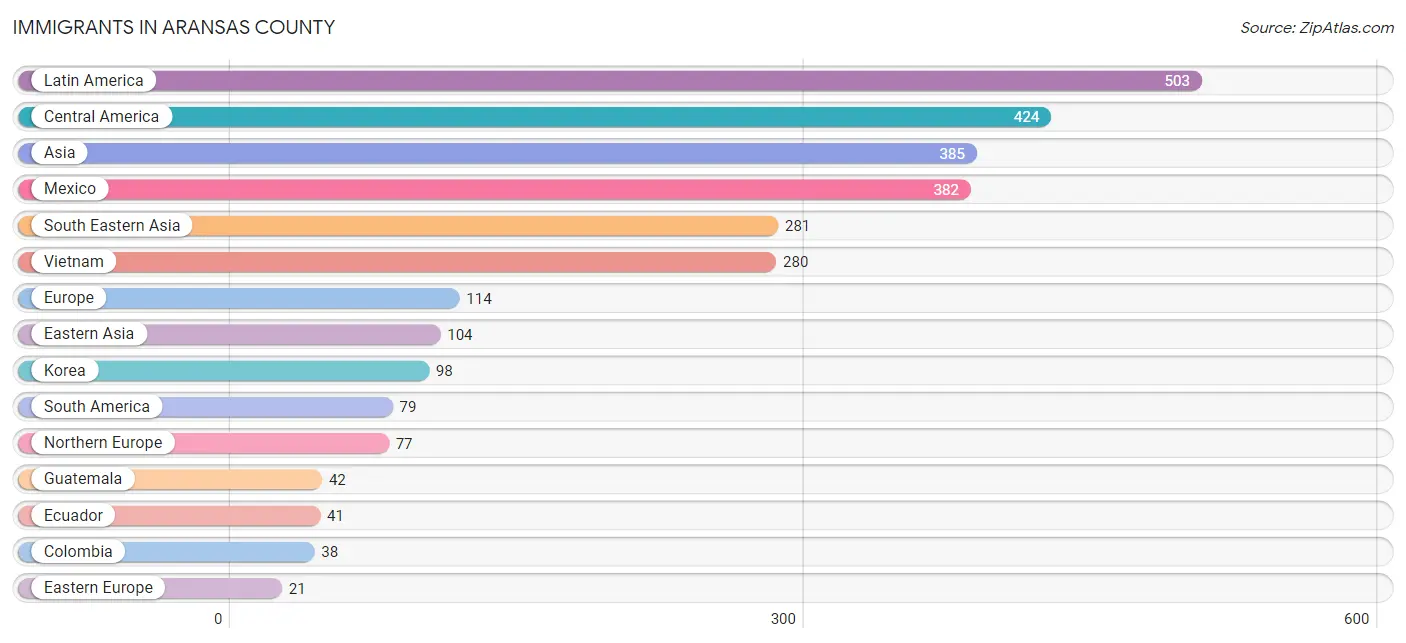
The most numerous immigrant groups reported in Aransas County came from Latin America (503 | 2.1%), Central America (424 | 1.8%), Asia (385 | 1.6%), Mexico (382 | 1.6%), and South Eastern Asia (281 | 1.2%), together accounting for 8.2% of all Aransas County residents.
| Immigration Origin | # Population | % Population |
| Africa | 4 | 0.0% |
| Asia | 385 | 1.6% |
| Australia | 19 | 0.1% |
| Central America | 424 | 1.8% |
| China | 6 | 0.0% |
| Colombia | 38 | 0.2% |
| Eastern Africa | 4 | 0.0% |
| Eastern Asia | 104 | 0.4% |
| Eastern Europe | 21 | 0.1% |
| Ecuador | 41 | 0.2% |
| England | 7 | 0.0% |
| Ethiopia | 1 | 0.0% |
| Europe | 114 | 0.5% |
| Germany | 16 | 0.1% |
| Guatemala | 42 | 0.2% |
| Ireland | 5 | 0.0% |
| Kenya | 3 | 0.0% |
| Korea | 98 | 0.4% |
| Latin America | 503 | 2.1% |
| Mexico | 382 | 1.6% |
| Northern Europe | 77 | 0.3% |
| Norway | 13 | 0.1% |
| Oceania | 19 | 0.1% |
| Philippines | 1 | 0.0% |
| Poland | 21 | 0.1% |
| Scotland | 13 | 0.1% |
| South America | 79 | 0.3% |
| South Eastern Asia | 281 | 1.2% |
| Taiwan | 6 | 0.0% |
| Vietnam | 280 | 1.2% |
| Western Europe | 16 | 0.1% | View All 31 Rows |
Sex and Age in Aransas County
Sex and Age in Aransas County
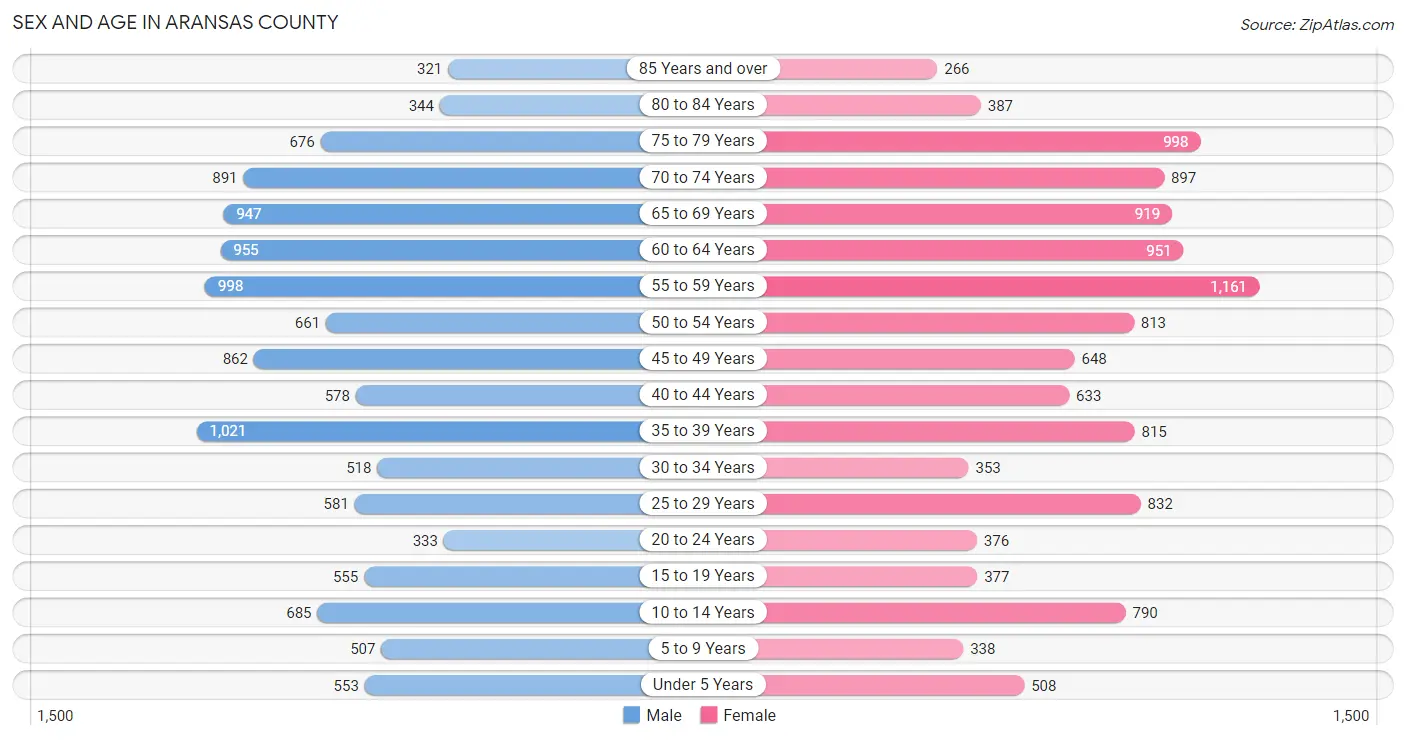
The most populous age groups in Aransas County are 35 to 39 Years (1,021 | 8.5%) for men and 55 to 59 Years (1,161 | 9.6%) for women.
| Age Bracket | Male | Female |
| Under 5 Years | 553 (4.6%) | 508 (4.2%) |
| 5 to 9 Years | 507 (4.2%) | 338 (2.8%) |
| 10 to 14 Years | 685 (5.7%) | 790 (6.6%) |
| 15 to 19 Years | 555 (4.6%) | 377 (3.1%) |
| 20 to 24 Years | 333 (2.8%) | 376 (3.1%) |
| 25 to 29 Years | 581 (4.9%) | 832 (6.9%) |
| 30 to 34 Years | 518 (4.3%) | 353 (2.9%) |
| 35 to 39 Years | 1,021 (8.5%) | 815 (6.8%) |
| 40 to 44 Years | 578 (4.8%) | 633 (5.2%) |
| 45 to 49 Years | 862 (7.2%) | 648 (5.4%) |
| 50 to 54 Years | 661 (5.5%) | 813 (6.7%) |
| 55 to 59 Years | 998 (8.3%) | 1,161 (9.6%) |
| 60 to 64 Years | 955 (8.0%) | 951 (7.9%) |
| 65 to 69 Years | 947 (7.9%) | 919 (7.6%) |
| 70 to 74 Years | 891 (7.4%) | 897 (7.4%) |
| 75 to 79 Years | 676 (5.6%) | 998 (8.3%) |
| 80 to 84 Years | 344 (2.9%) | 387 (3.2%) |
| 85 Years and over | 321 (2.7%) | 266 (2.2%) |
| Total | 11,986 (100.0%) | 12,062 (100.0%) |
Families and Households in Aransas County
Median Family Size in Aransas County
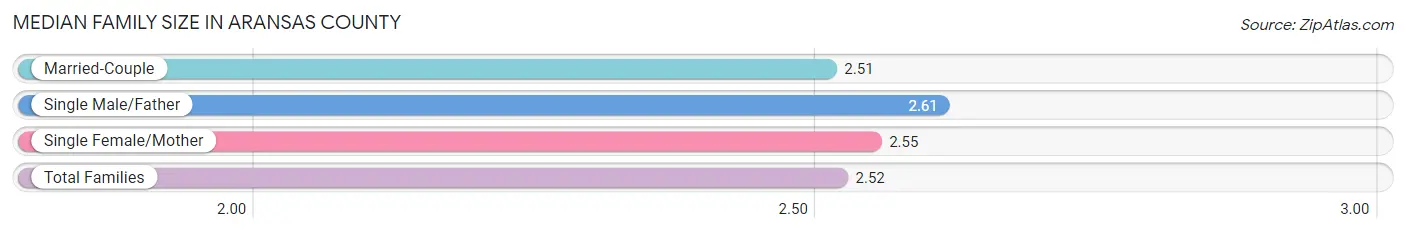
The median family size in Aransas County is 2.52 persons per family, with single male/father families (292 | 4.1%) accounting for the largest median family size of 2.61 persons per family. On the other hand, married-couple families (5,546 | 77.7%) represent the smallest median family size with 2.51 persons per family.
| Family Type | # Families | Family Size |
| Married-Couple | 5,546 (77.7%) | 2.51 |
| Single Male/Father | 292 (4.1%) | 2.61 |
| Single Female/Mother | 1,301 (18.2%) | 2.55 |
| Total Families | 7,139 (100.0%) | 2.52 |
Median Household Size in Aransas County
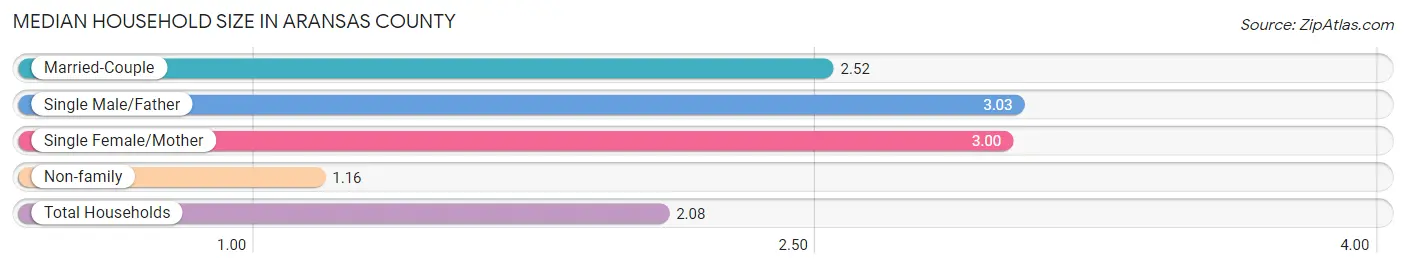
The median household size in Aransas County is 2.08 persons per household, with single male/father households (292 | 2.6%) accounting for the largest median household size of 3.03 persons per household. non-family households (4,273 | 37.4%) represent the smallest median household size with 1.16 persons per household.
| Household Type | # Households | Household Size |
| Married-Couple | 5,546 (48.6%) | 2.52 |
| Single Male/Father | 292 (2.6%) | 3.03 |
| Single Female/Mother | 1,301 (11.4%) | 3.00 |
| Non-family | 4,273 (37.4%) | 1.16 |
| Total Households | 11,412 (100.0%) | 2.08 |
Household Size by Marriage Status in Aransas County
Out of a total of 11,412 households in Aransas County, 7,139 (62.6%) are family households, while 4,273 (37.4%) are nonfamily households. The most numerous type of family households are 2-person households, comprising 4,359, and the most common type of nonfamily households are 1-person households, comprising 3,556.
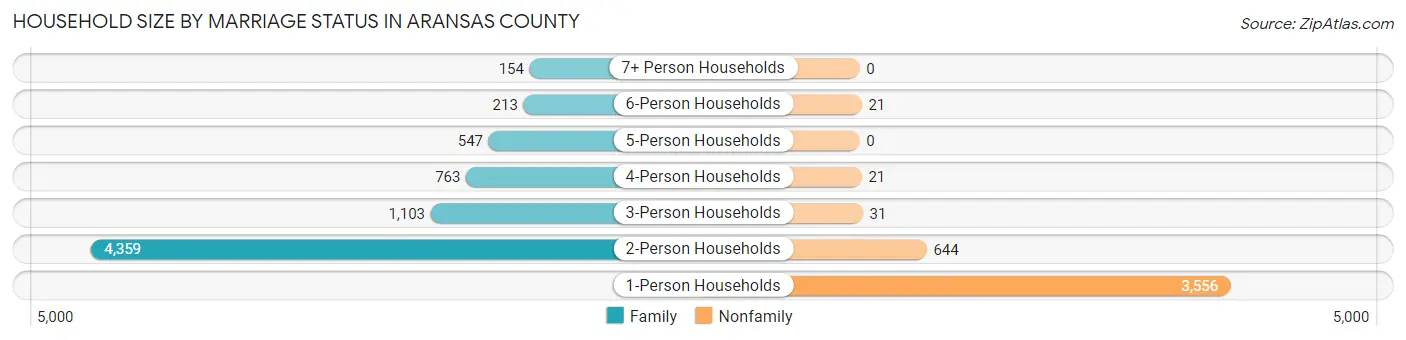
| Household Size | Family Households | Nonfamily Households |
| 1-Person Households | - | 3,556 (31.2%) |
| 2-Person Households | 4,359 (38.2%) | 644 (5.6%) |
| 3-Person Households | 1,103 (9.7%) | 31 (0.3%) |
| 4-Person Households | 763 (6.7%) | 21 (0.2%) |
| 5-Person Households | 547 (4.8%) | 0 (0.0%) |
| 6-Person Households | 213 (1.9%) | 21 (0.2%) |
| 7+ Person Households | 154 (1.3%) | 0 (0.0%) |
| Total | 7,139 (62.6%) | 4,273 (37.4%) |
Female Fertility in Aransas County
Fertility by Age in Aransas County
Average fertility rate in Aransas County is 111.0 births per 1,000 women. Women in the age bracket of 20 to 34 years have the highest fertility rate with 180.0 births per 1,000 women. Women in the age bracket of 20 to 34 years acount for 62.2% of all women with births.
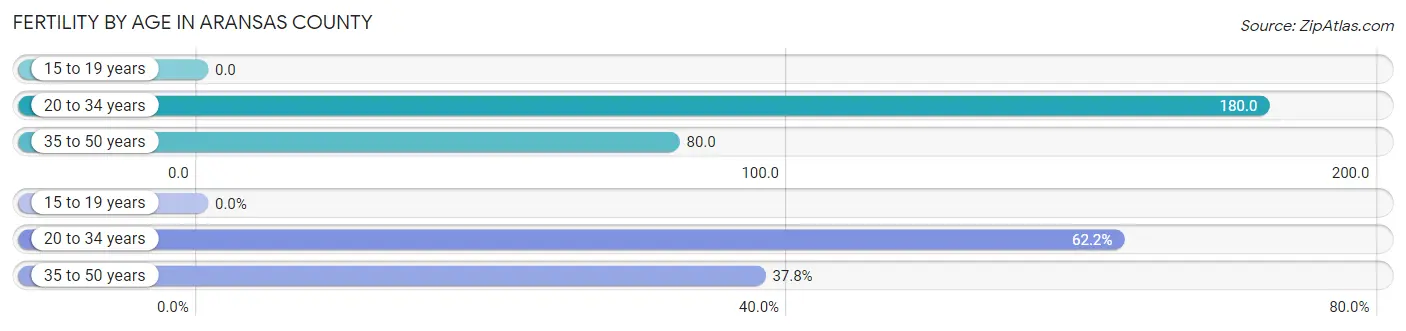
| Age Bracket | Women with Births | Births / 1,000 Women |
| 15 to 19 years | 0 (0.0%) | 0.0 |
| 20 to 34 years | 281 (62.2%) | 180.0 |
| 35 to 50 years | 171 (37.8%) | 80.0 |
| Total | 452 (100.0%) | 111.0 |
Fertility by Age by Marriage Status in Aransas County
53.5% of women with births (452) in Aransas County are married. The highest percentage of unmarried women with births falls into 20 to 34 years age bracket with 71.9% of them unmarried at the time of birth, while the lowest percentage of unmarried women with births belong to 35 to 50 years age bracket with 4.7% of them unmarried.
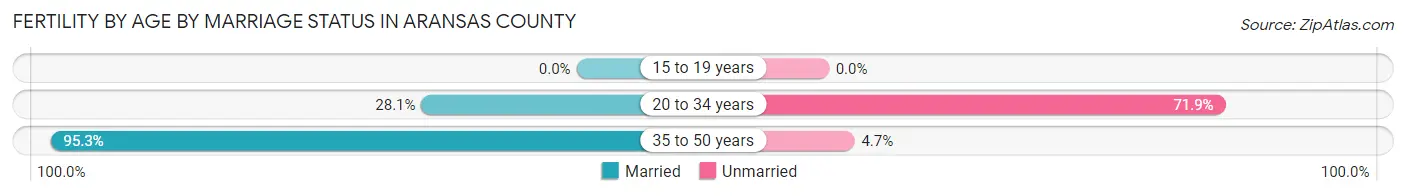
| Age Bracket | Married | Unmarried |
| 15 to 19 years | 0 (0.0%) | 0 (0.0%) |
| 20 to 34 years | 79 (28.1%) | 202 (71.9%) |
| 35 to 50 years | 163 (95.3%) | 8 (4.7%) |
| Total | 242 (53.5%) | 210 (46.5%) |
Fertility by Education in Aransas County
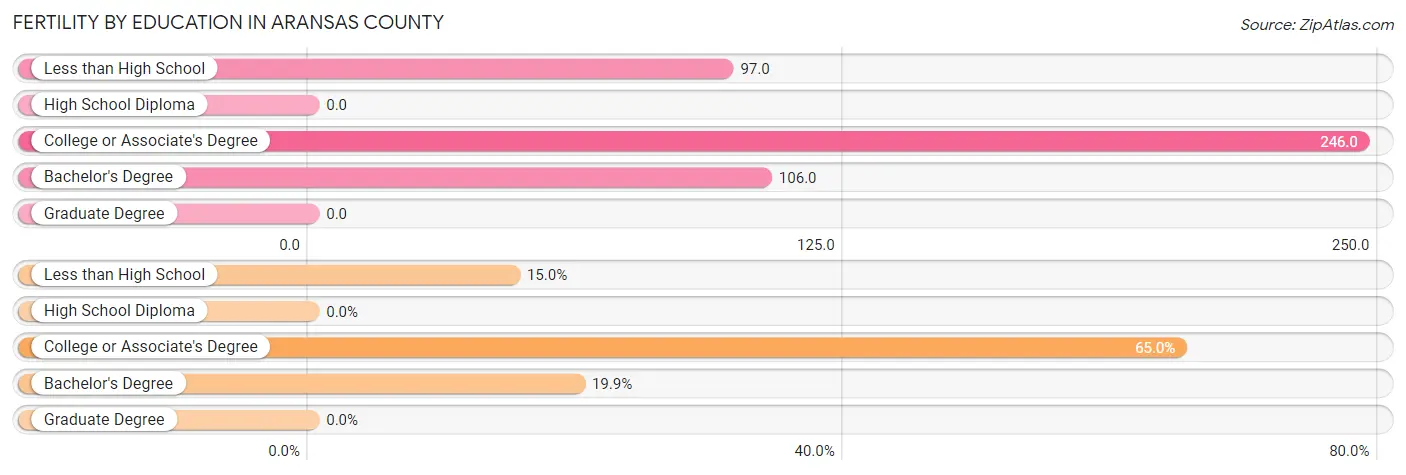
| Educational Attainment | Women with Births | Births / 1,000 Women |
| Less than High School | 68 (15.0%) | 97.0 |
| High School Diploma | 0 (0.0%) | 0.0 |
| College or Associate's Degree | 294 (65.0%) | 246.0 |
| Bachelor's Degree | 90 (19.9%) | 106.0 |
| Graduate Degree | 0 (0.0%) | 0.0 |
| Total | 452 (100.0%) | 111.0 |
Fertility by Education by Marriage Status in Aransas County
46.5% of women with births in Aransas County are unmarried. Women with the educational attainment of bachelor's degree are most likely to be married with 78.9% of them married at childbirth, while women with the educational attainment of less than high school are least likely to be married with 88.2% of them unmarried at childbirth.
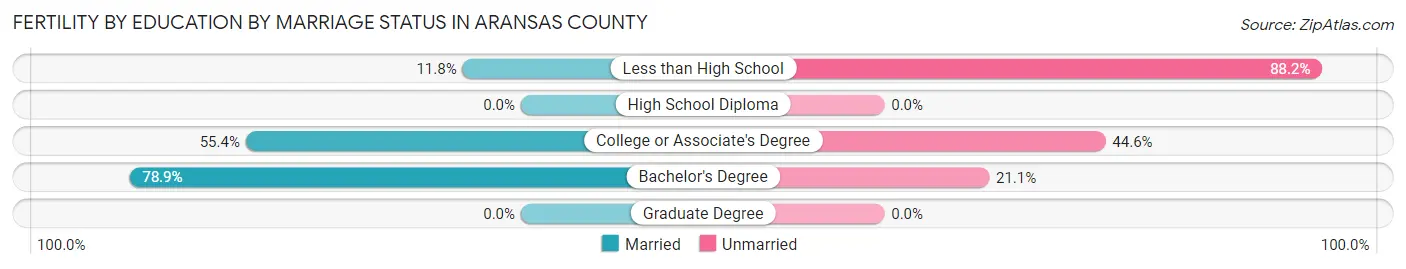
| Educational Attainment | Married | Unmarried |
| Less than High School | 8 (11.8%) | 60 (88.2%) |
| High School Diploma | 0 (0.0%) | 0 (0.0%) |
| College or Associate's Degree | 163 (55.4%) | 131 (44.6%) |
| Bachelor's Degree | 71 (78.9%) | 19 (21.1%) |
| Graduate Degree | 0 (0.0%) | 0 (0.0%) |
| Total | 242 (53.5%) | 210 (46.5%) |
Employment Characteristics in Aransas County
Employment by Class of Employer in Aransas County
Among the 8,833 employed individuals in Aransas County, private company employees (4,873 | 55.2%), local government employees (1,485 | 16.8%), and self-employed (not incorporated) (932 | 10.5%) make up the most common classes of employment.
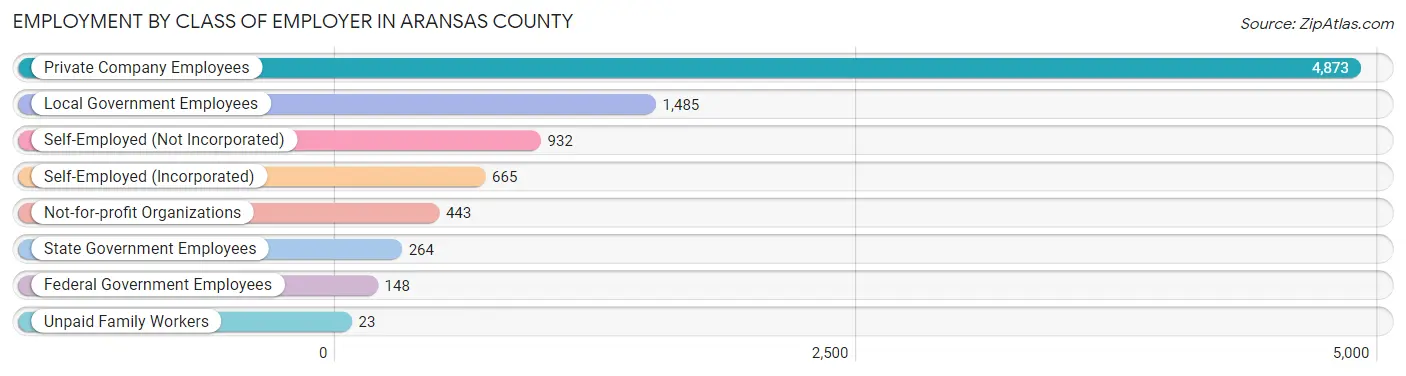
| Employer Class | # Employees | % Employees |
| Private Company Employees | 4,873 | 55.2% |
| Self-Employed (Incorporated) | 665 | 7.5% |
| Self-Employed (Not Incorporated) | 932 | 10.5% |
| Not-for-profit Organizations | 443 | 5.0% |
| Local Government Employees | 1,485 | 16.8% |
| State Government Employees | 264 | 3.0% |
| Federal Government Employees | 148 | 1.7% |
| Unpaid Family Workers | 23 | 0.3% |
| Total | 8,833 | 100.0% |
Employment Status by Age in Aransas County
According to the labor force statistics for Aransas County, out of the total population over 16 years of age (20,308), 47.8% or 9,707 individuals are in the labor force, with 4.4% or 427 of them unemployed. The age group with the highest labor force participation rate is 25 to 29 years, with 89.9% or 1,270 individuals in the labor force. Within the labor force, the 16 to 19 years age range has the highest percentage of unemployed individuals, with 31.7% or 40 of them being unemployed.
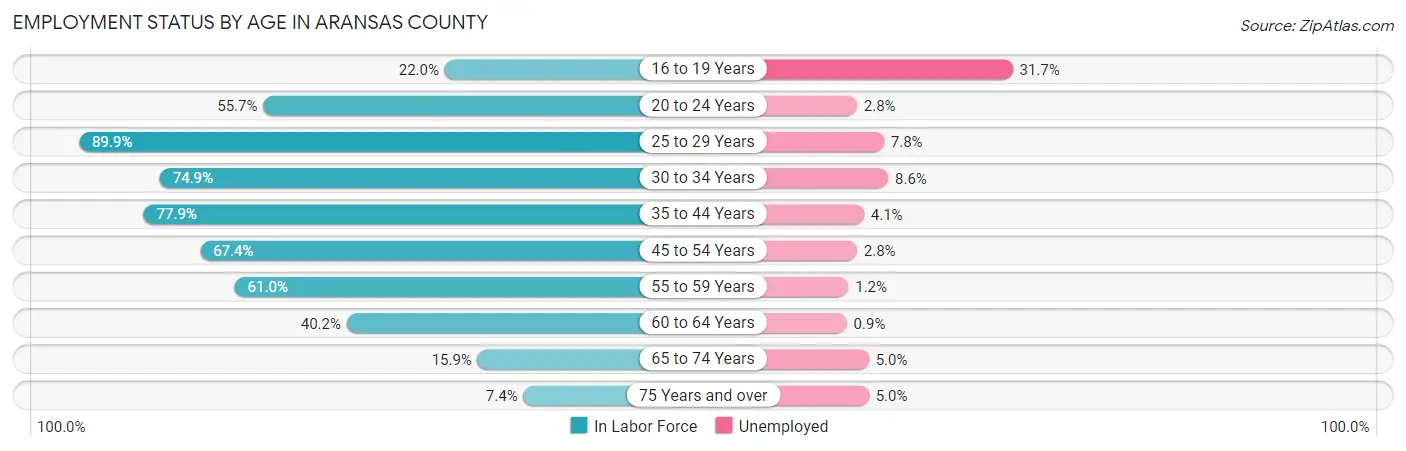
| Age Bracket | In Labor Force | Unemployed |
| 16 to 19 Years | 126 (22.0%) | 40 (31.7%) |
| 20 to 24 Years | 395 (55.7%) | 11 (2.8%) |
| 25 to 29 Years | 1,270 (89.9%) | 99 (7.8%) |
| 30 to 34 Years | 652 (74.9%) | 56 (8.6%) |
| 35 to 44 Years | 2,374 (77.9%) | 97 (4.1%) |
| 45 to 54 Years | 2,011 (67.4%) | 56 (2.8%) |
| 55 to 59 Years | 1,317 (61.0%) | 16 (1.2%) |
| 60 to 64 Years | 766 (40.2%) | 7 (0.9%) |
| 65 to 74 Years | 581 (15.9%) | 29 (5.0%) |
| 75 Years and over | 221 (7.4%) | 11 (5.0%) |
| Total | 9,707 (47.8%) | 427 (4.4%) |
Employment Status by Educational Attainment in Aransas County
According to labor force statistics for Aransas County, 67.8% of individuals (8,394) out of the total population between 25 and 64 years of age (12,380) are in the labor force, with 4.0% or 336 of them being unemployed. The group with the highest labor force participation rate are those with the educational attainment of bachelor's degree or higher, with 77.4% or 2,207 individuals in the labor force. Within the labor force, individuals with less than high school education have the highest percentage of unemployment, with 5.9% or 58 of them being unemployed.
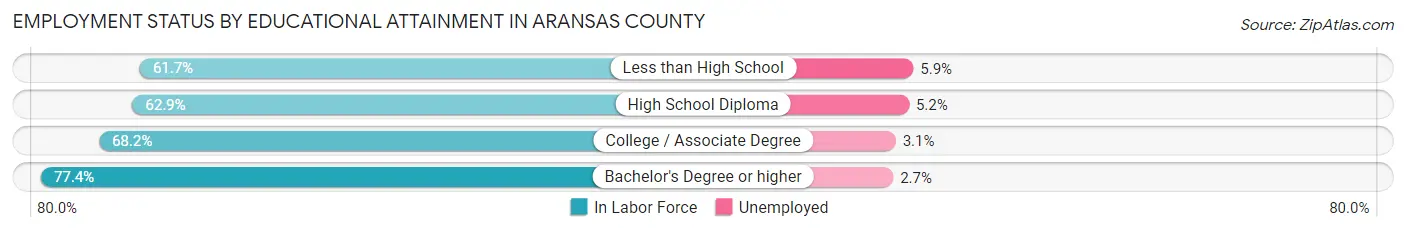
| Educational Attainment | In Labor Force | Unemployed |
| Less than High School | 977 (61.7%) | 93 (5.9%) |
| High School Diploma | 2,532 (62.9%) | 209 (5.2%) |
| College / Associate Degree | 2,672 (68.2%) | 121 (3.1%) |
| Bachelor's Degree or higher | 2,207 (77.4%) | 77 (2.7%) |
| Total | 8,394 (67.8%) | 495 (4.0%) |
Employment Occupations by Sex in Aransas County
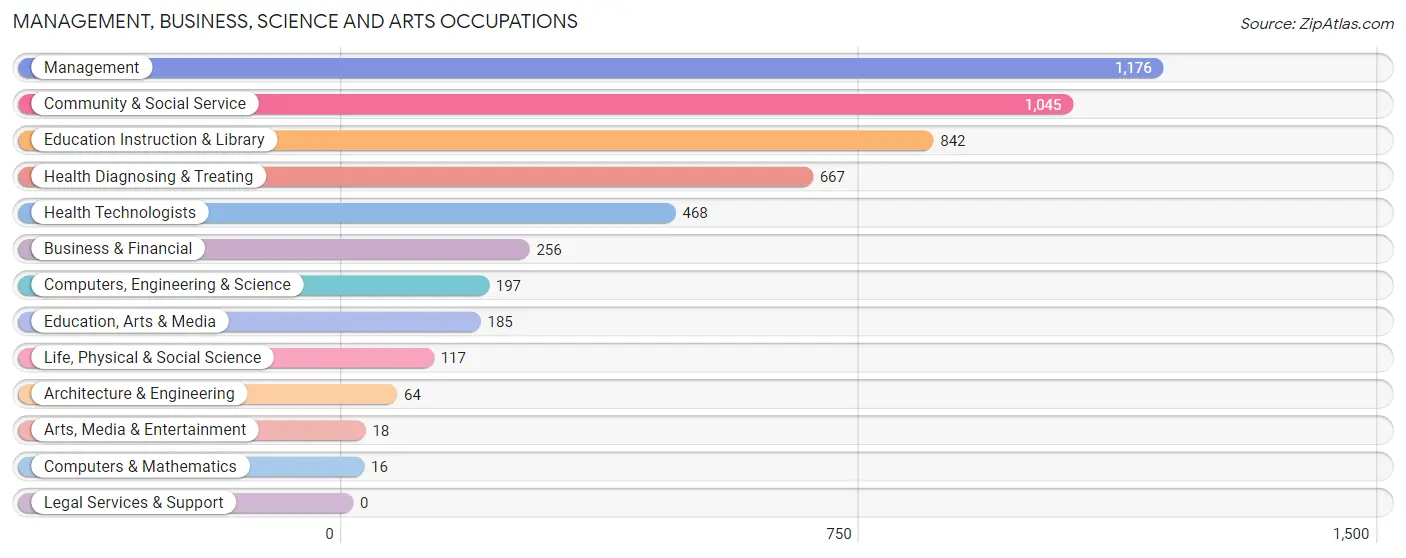
Management, Business, Science and Arts Occupations
The most common Management, Business, Science and Arts occupations in Aransas County are Management (1,176 | 12.7%), Community & Social Service (1,045 | 11.3%), Education Instruction & Library (842 | 9.1%), Health Diagnosing & Treating (667 | 7.2%), and Health Technologists (468 | 5.0%).
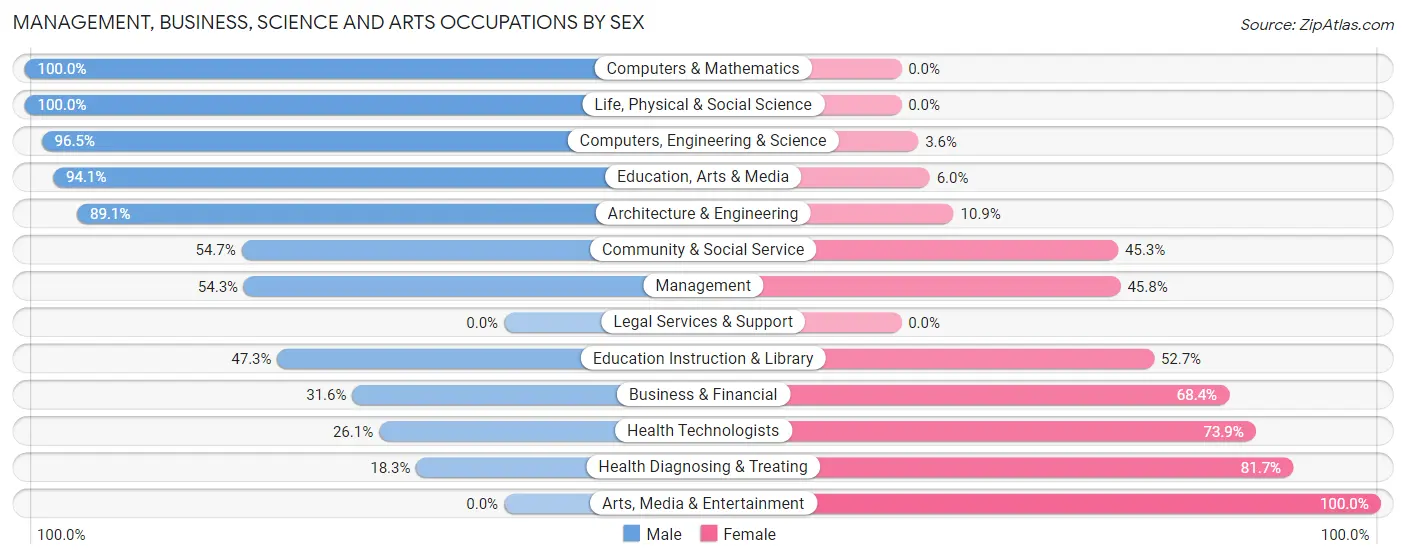
Management, Business, Science and Arts Occupations by Sex
Within the Management, Business, Science and Arts occupations in Aransas County, the most male-oriented occupations are Computers & Mathematics (100.0%), Life, Physical & Social Science (100.0%), and Computers, Engineering & Science (96.5%), while the most female-oriented occupations are Arts, Media & Entertainment (100.0%), Health Diagnosing & Treating (81.7%), and Health Technologists (73.9%).
| Occupation | Male | Female |
| Management | 638 (54.2%) | 538 (45.8%) |
| Business & Financial | 81 (31.6%) | 175 (68.4%) |
| Computers, Engineering & Science | 190 (96.5%) | 7 (3.5%) |
| Computers & Mathematics | 16 (100.0%) | 0 (0.0%) |
| Architecture & Engineering | 57 (89.1%) | 7 (10.9%) |
| Life, Physical & Social Science | 117 (100.0%) | 0 (0.0%) |
| Community & Social Service | 572 (54.7%) | 473 (45.3%) |
| Education, Arts & Media | 174 (94.1%) | 11 (5.9%) |
| Legal Services & Support | 0 (0.0%) | 0 (0.0%) |
| Education Instruction & Library | 398 (47.3%) | 444 (52.7%) |
| Arts, Media & Entertainment | 0 (0.0%) | 18 (100.0%) |
| Health Diagnosing & Treating | 122 (18.3%) | 545 (81.7%) |
| Health Technologists | 122 (26.1%) | 346 (73.9%) |
| Total (Category) | 1,603 (48.0%) | 1,738 (52.0%) |
| Total (Overall) | 5,025 (54.1%) | 4,266 (45.9%) |
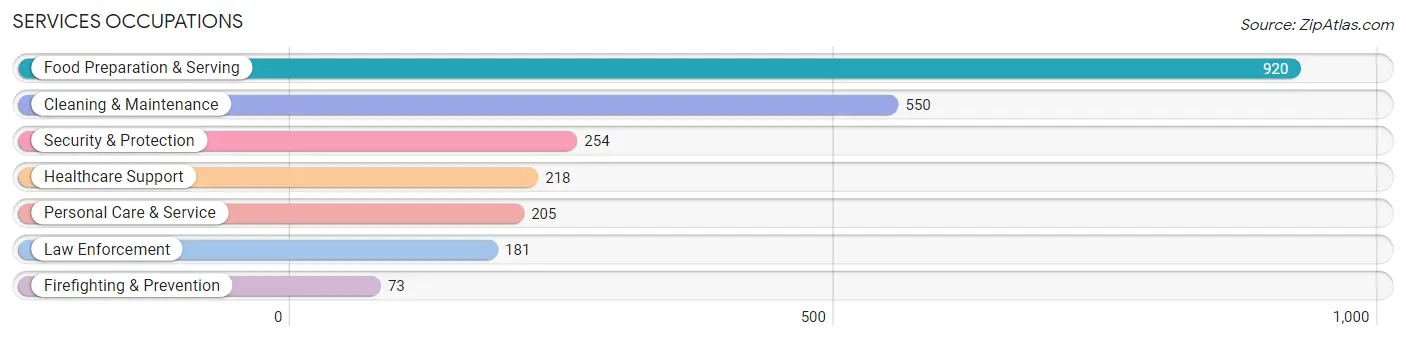
Services Occupations
The most common Services occupations in Aransas County are Food Preparation & Serving (920 | 9.9%), Cleaning & Maintenance (550 | 5.9%), Security & Protection (254 | 2.7%), Healthcare Support (218 | 2.4%), and Personal Care & Service (205 | 2.2%).
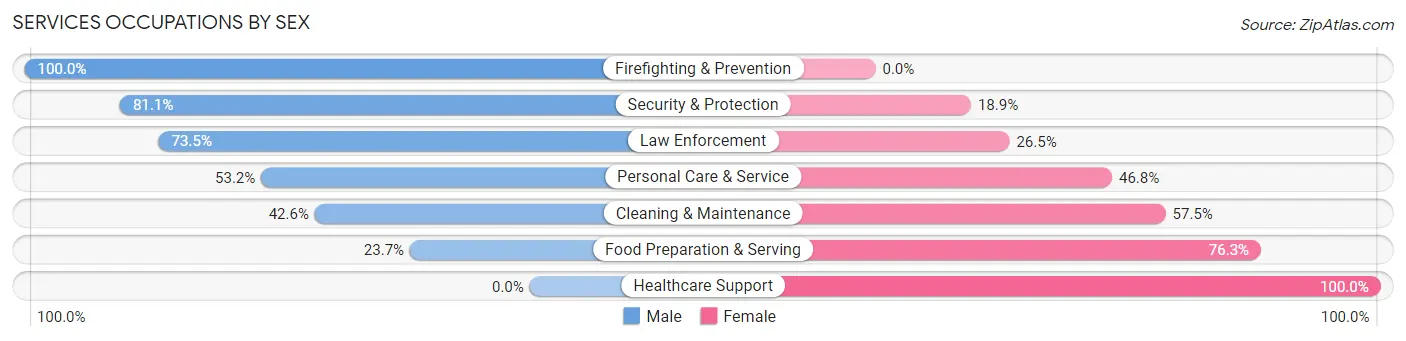
Services Occupations by Sex
Within the Services occupations in Aransas County, the most male-oriented occupations are Firefighting & Prevention (100.0%), Security & Protection (81.1%), and Law Enforcement (73.5%), while the most female-oriented occupations are Healthcare Support (100.0%), Food Preparation & Serving (76.3%), and Cleaning & Maintenance (57.5%).
| Occupation | Male | Female |
| Healthcare Support | 0 (0.0%) | 218 (100.0%) |
| Security & Protection | 206 (81.1%) | 48 (18.9%) |
| Firefighting & Prevention | 73 (100.0%) | 0 (0.0%) |
| Law Enforcement | 133 (73.5%) | 48 (26.5%) |
| Food Preparation & Serving | 218 (23.7%) | 702 (76.3%) |
| Cleaning & Maintenance | 234 (42.5%) | 316 (57.5%) |
| Personal Care & Service | 109 (53.2%) | 96 (46.8%) |
| Total (Category) | 767 (35.7%) | 1,380 (64.3%) |
| Total (Overall) | 5,025 (54.1%) | 4,266 (45.9%) |
Sales and Office Occupations
The most common Sales and Office occupations in Aransas County are Sales & Related (878 | 9.5%), and Office & Administration (631 | 6.8%).

Sales and Office Occupations by Sex

| Occupation | Male | Female |
| Sales & Related | 448 (51.0%) | 430 (49.0%) |
| Office & Administration | 42 (6.7%) | 589 (93.3%) |
| Total (Category) | 490 (32.5%) | 1,019 (67.5%) |
| Total (Overall) | 5,025 (54.1%) | 4,266 (45.9%) |
Natural Resources, Construction and Maintenance Occupations
The most common Natural Resources, Construction and Maintenance occupations in Aransas County are Construction & Extraction (945 | 10.2%), Installation, Maintenance & Repair (183 | 2.0%), and Farming, Fishing & Forestry (13 | 0.1%).
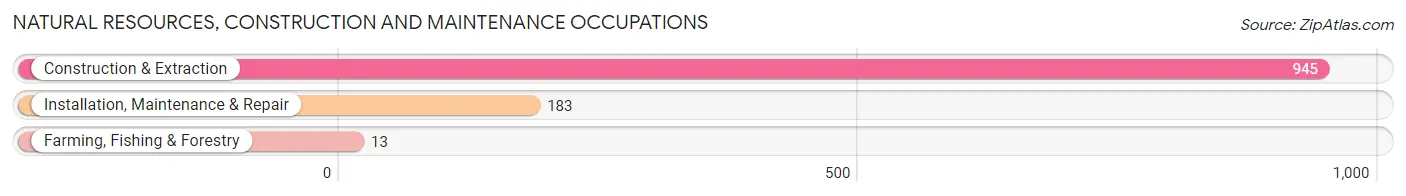
Natural Resources, Construction and Maintenance Occupations by Sex
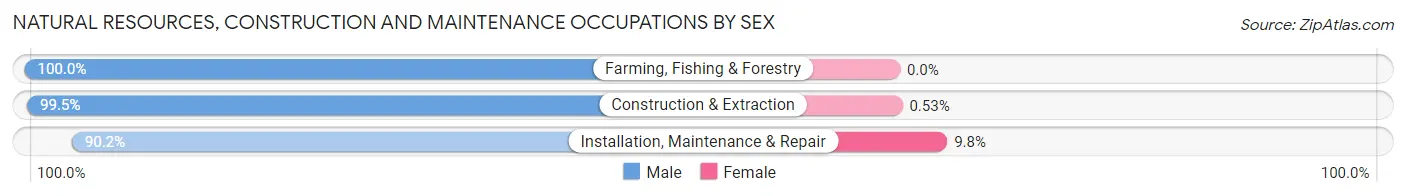
| Occupation | Male | Female |
| Farming, Fishing & Forestry | 13 (100.0%) | 0 (0.0%) |
| Construction & Extraction | 940 (99.5%) | 5 (0.5%) |
| Installation, Maintenance & Repair | 165 (90.2%) | 18 (9.8%) |
| Total (Category) | 1,118 (98.0%) | 23 (2.0%) |
| Total (Overall) | 5,025 (54.1%) | 4,266 (45.9%) |
Production, Transportation and Moving Occupations
The most common Production, Transportation and Moving occupations in Aransas County are Transportation (523 | 5.6%), Material Moving (323 | 3.5%), and Production (307 | 3.3%).
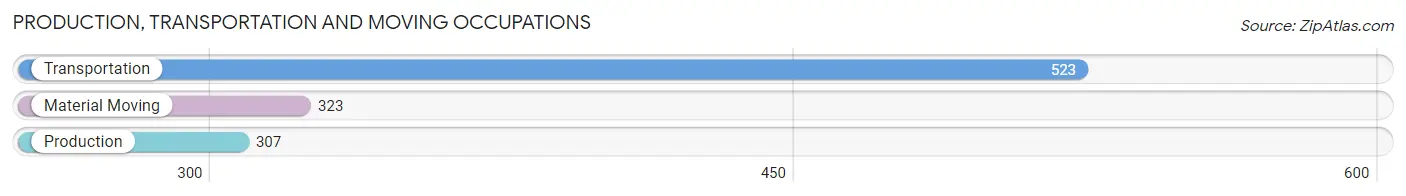
Production, Transportation and Moving Occupations by Sex
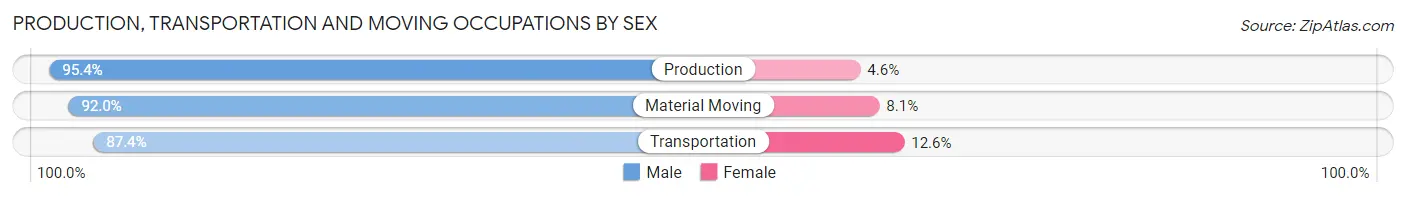
| Occupation | Male | Female |
| Production | 293 (95.4%) | 14 (4.6%) |
| Transportation | 457 (87.4%) | 66 (12.6%) |
| Material Moving | 297 (91.9%) | 26 (8.1%) |
| Total (Category) | 1,047 (90.8%) | 106 (9.2%) |
| Total (Overall) | 5,025 (54.1%) | 4,266 (45.9%) |
Employment Industries by Sex in Aransas County
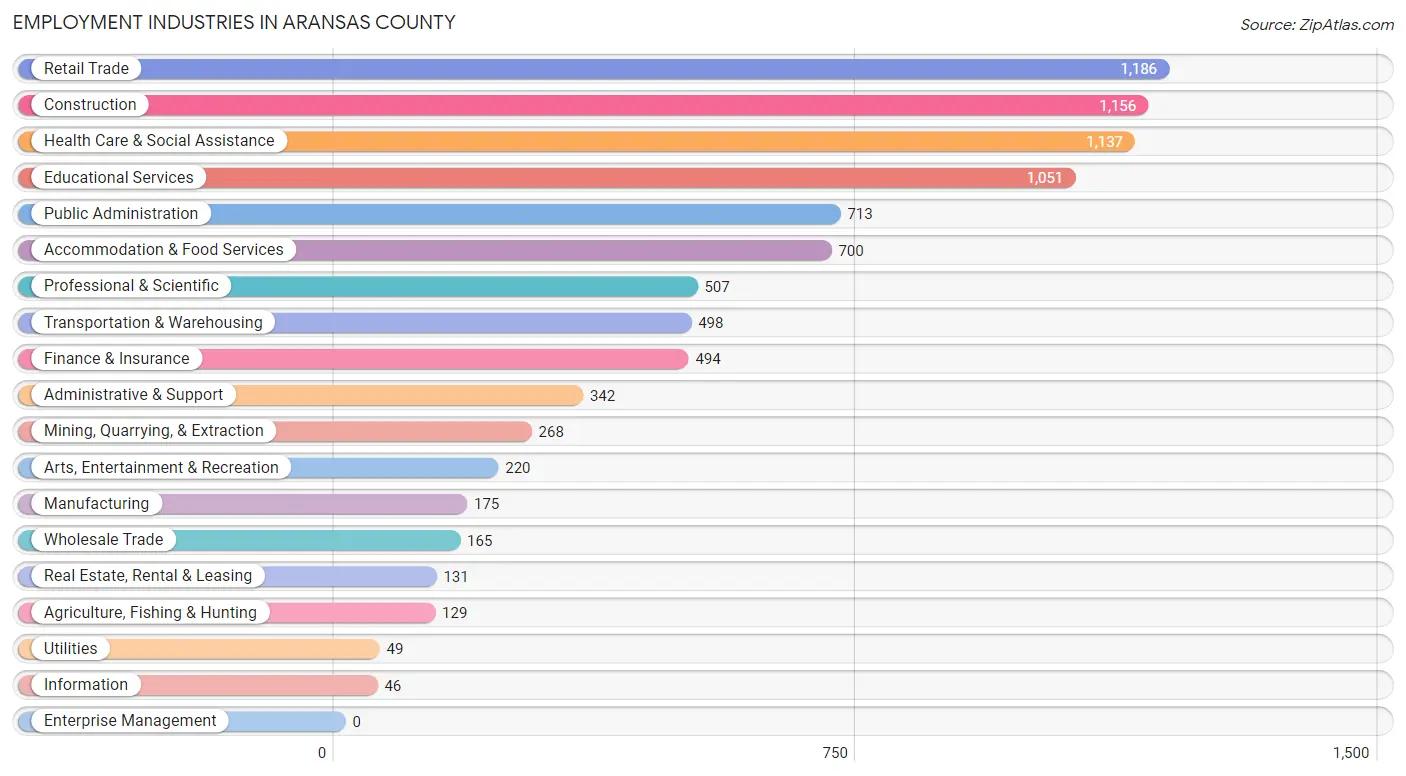
Employment Industries in Aransas County
The major employment industries in Aransas County include Retail Trade (1,186 | 12.8%), Construction (1,156 | 12.4%), Health Care & Social Assistance (1,137 | 12.2%), Educational Services (1,051 | 11.3%), and Public Administration (713 | 7.7%).
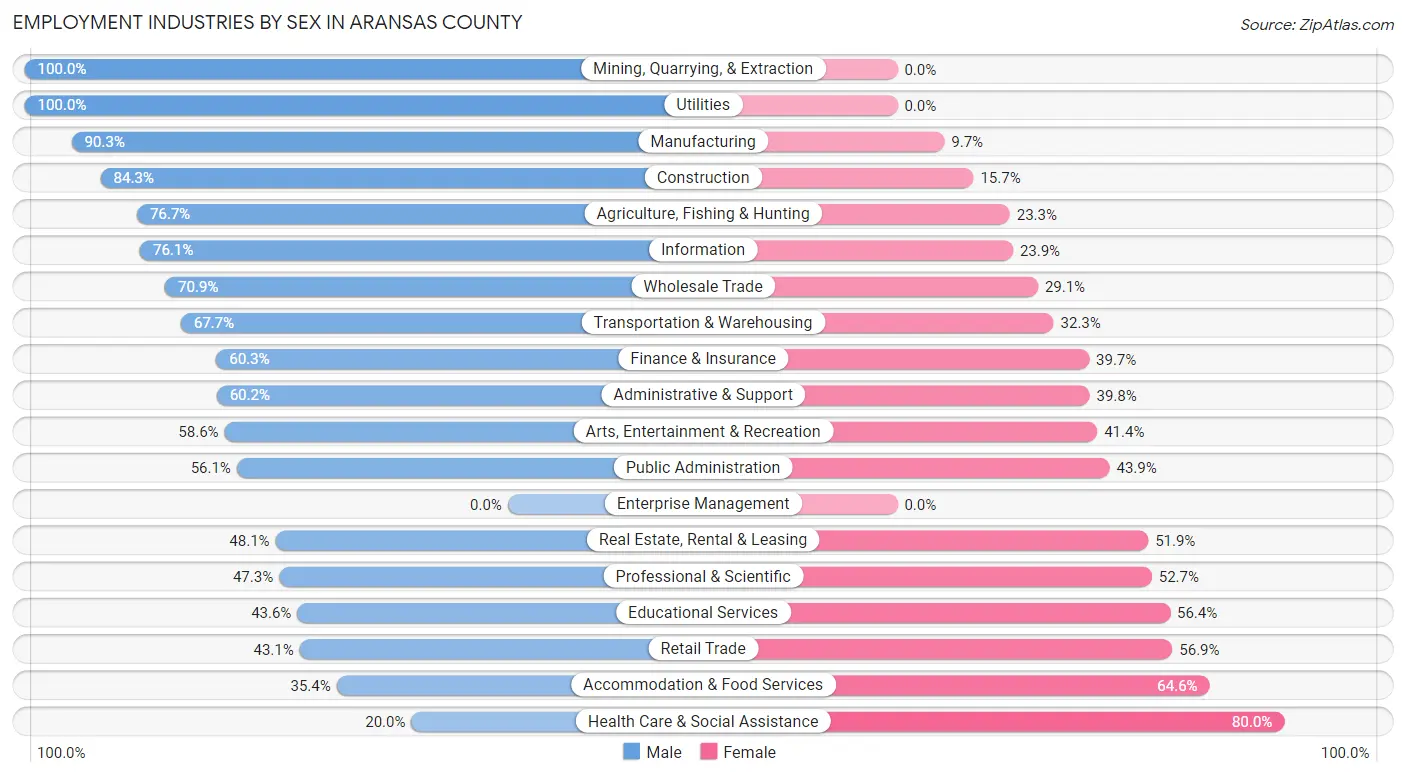
Employment Industries by Sex in Aransas County
The Aransas County industries that see more men than women are Mining, Quarrying, & Extraction (100.0%), Utilities (100.0%), and Manufacturing (90.3%), whereas the industries that tend to have a higher number of women are Health Care & Social Assistance (80.0%), Accommodation & Food Services (64.6%), and Retail Trade (56.9%).
| Industry | Male | Female |
| Agriculture, Fishing & Hunting | 99 (76.7%) | 30 (23.3%) |
| Mining, Quarrying, & Extraction | 268 (100.0%) | 0 (0.0%) |
| Construction | 974 (84.3%) | 182 (15.7%) |
| Manufacturing | 158 (90.3%) | 17 (9.7%) |
| Wholesale Trade | 117 (70.9%) | 48 (29.1%) |
| Retail Trade | 511 (43.1%) | 675 (56.9%) |
| Transportation & Warehousing | 337 (67.7%) | 161 (32.3%) |
| Utilities | 49 (100.0%) | 0 (0.0%) |
| Information | 35 (76.1%) | 11 (23.9%) |
| Finance & Insurance | 298 (60.3%) | 196 (39.7%) |
| Real Estate, Rental & Leasing | 63 (48.1%) | 68 (51.9%) |
| Professional & Scientific | 240 (47.3%) | 267 (52.7%) |
| Enterprise Management | 0 (0.0%) | 0 (0.0%) |
| Administrative & Support | 206 (60.2%) | 136 (39.8%) |
| Educational Services | 458 (43.6%) | 593 (56.4%) |
| Health Care & Social Assistance | 227 (20.0%) | 910 (80.0%) |
| Arts, Entertainment & Recreation | 129 (58.6%) | 91 (41.4%) |
| Accommodation & Food Services | 248 (35.4%) | 452 (64.6%) |
| Public Administration | 400 (56.1%) | 313 (43.9%) |
| Total | 5,025 (54.1%) | 4,266 (45.9%) |
Education in Aransas County
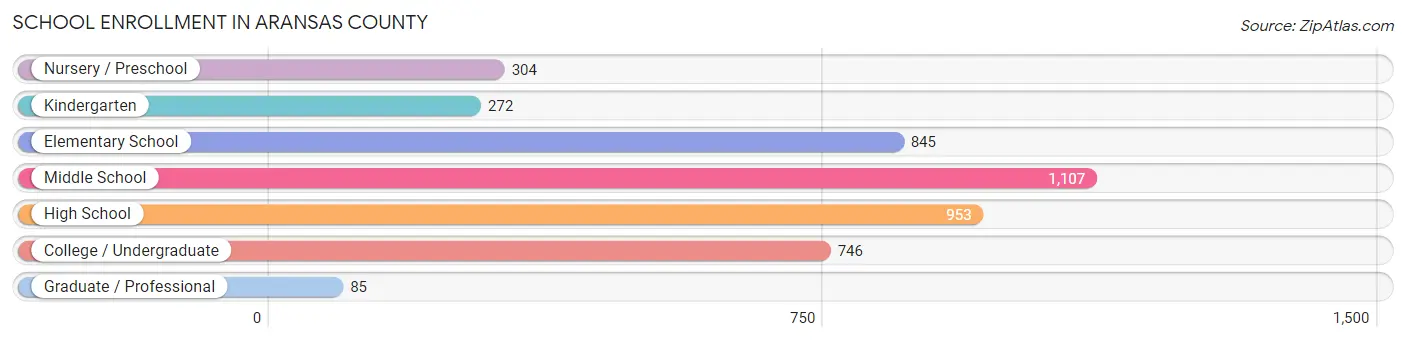
School Enrollment in Aransas County
The most common levels of schooling among the 4,312 students in Aransas County are middle school (1,107 | 25.7%), high school (953 | 22.1%), and elementary school (845 | 19.6%).
| School Level | # Students | % Students |
| Nursery / Preschool | 304 | 7.0% |
| Kindergarten | 272 | 6.3% |
| Elementary School | 845 | 19.6% |
| Middle School | 1,107 | 25.7% |
| High School | 953 | 22.1% |
| College / Undergraduate | 746 | 17.3% |
| Graduate / Professional | 85 | 2.0% |
| Total | 4,312 | 100.0% |
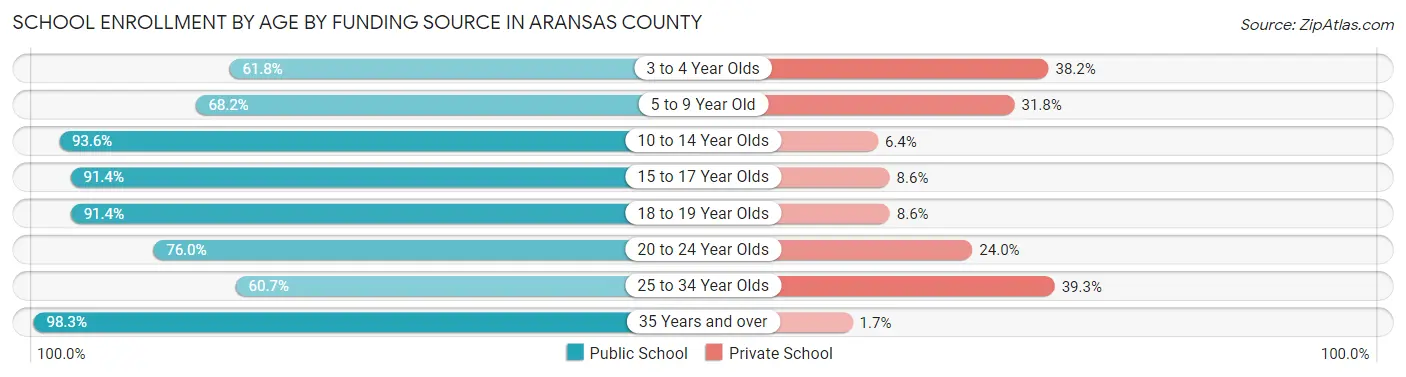
School Enrollment by Age by Funding Source in Aransas County
Out of a total of 4,312 students who are enrolled in schools in Aransas County, 703 (16.3%) attend a private institution, while the remaining 3,609 (83.7%) are enrolled in public schools. The age group of 25 to 34 year olds has the highest likelihood of being enrolled in private schools, with 57 (39.3% in the age bracket) enrolled. Conversely, the age group of 35 years and over has the lowest likelihood of being enrolled in a private school, with 295 (98.3% in the age bracket) attending a public institution.
| Age Bracket | Public School | Private School |
| 3 to 4 Year Olds | 188 (61.8%) | 116 (38.2%) |
| 5 to 9 Year Old | 576 (68.2%) | 269 (31.8%) |
| 10 to 14 Year Olds | 1,360 (93.6%) | 93 (6.4%) |
| 15 to 17 Year Olds | 736 (91.4%) | 69 (8.6%) |
| 18 to 19 Year Olds | 85 (91.4%) | 8 (8.6%) |
| 20 to 24 Year Olds | 279 (76.0%) | 88 (24.0%) |
| 25 to 34 Year Olds | 88 (60.7%) | 57 (39.3%) |
| 35 Years and over | 295 (98.3%) | 5 (1.7%) |
| Total | 3,609 (83.7%) | 703 (16.3%) |
Educational Attainment by Field of Study in Aransas County
Business (982 | 20.6%), education (816 | 17.2%), science & technology (515 | 10.8%), bio, nature & agricultural (412 | 8.7%), and visual & performing arts (403 | 8.5%) are the most common fields of study among 4,756 individuals in Aransas County who have obtained a bachelor's degree or higher.
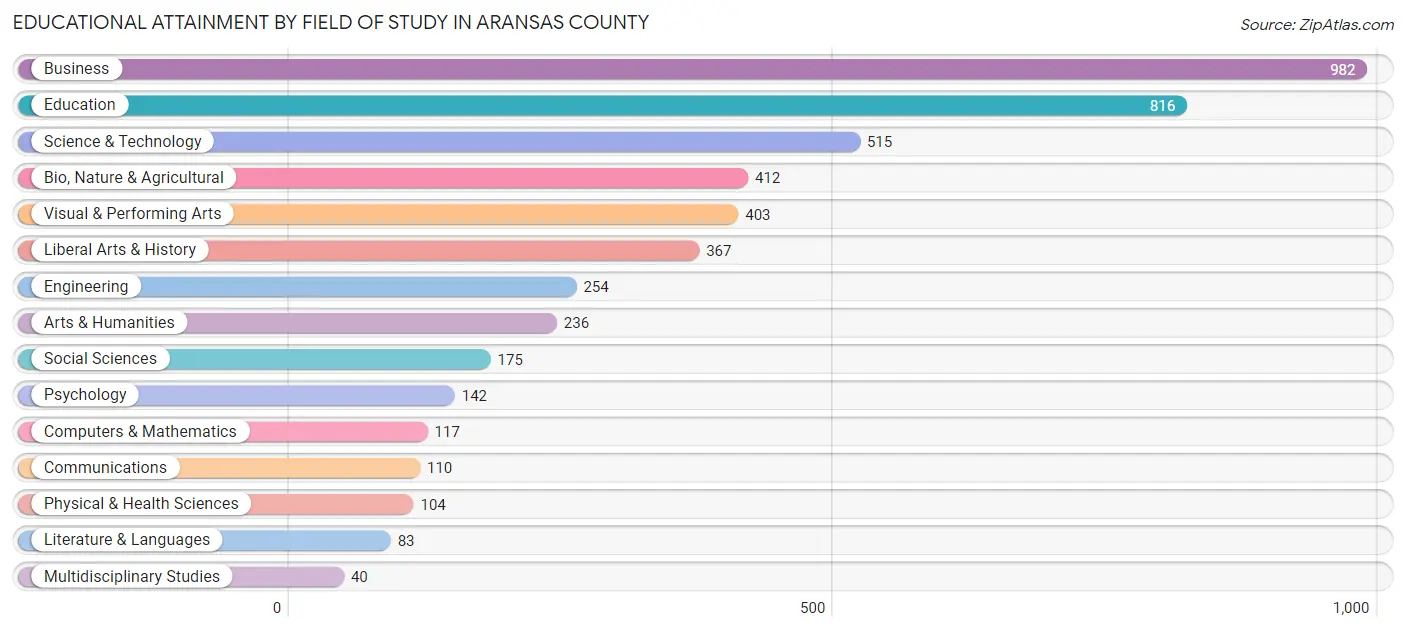
| Field of Study | # Graduates | % Graduates |
| Computers & Mathematics | 117 | 2.5% |
| Bio, Nature & Agricultural | 412 | 8.7% |
| Physical & Health Sciences | 104 | 2.2% |
| Psychology | 142 | 3.0% |
| Social Sciences | 175 | 3.7% |
| Engineering | 254 | 5.3% |
| Multidisciplinary Studies | 40 | 0.8% |
| Science & Technology | 515 | 10.8% |
| Business | 982 | 20.6% |
| Education | 816 | 17.2% |
| Literature & Languages | 83 | 1.8% |
| Liberal Arts & History | 367 | 7.7% |
| Visual & Performing Arts | 403 | 8.5% |
| Communications | 110 | 2.3% |
| Arts & Humanities | 236 | 5.0% |
| Total | 4,756 | 100.0% |
Transportation & Commute in Aransas County
Vehicle Availability by Sex in Aransas County
The most prevalent vehicle ownership categories in Aransas County are males with 2 vehicles (2,024, accounting for 41.3%) and females with 2 vehicles (1,924, making up 51.7%).
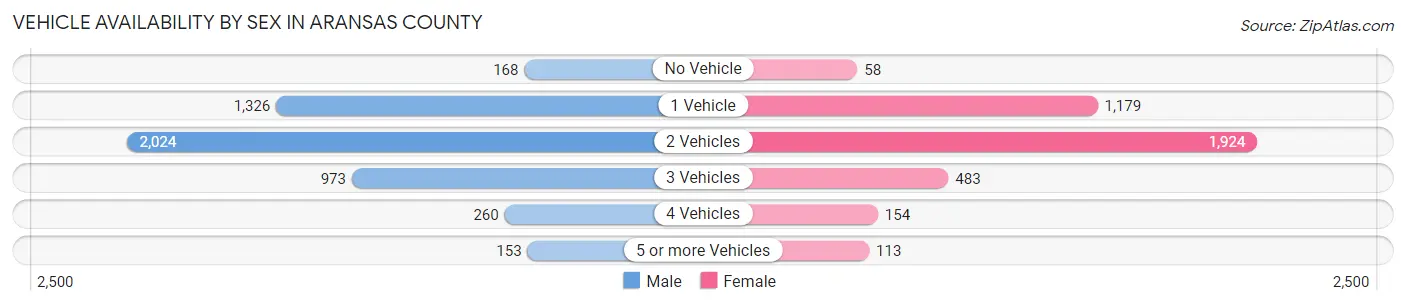
| Vehicles Available | Male | Female |
| No Vehicle | 168 (3.4%) | 58 (1.5%) |
| 1 Vehicle | 1,326 (27.0%) | 1,179 (30.1%) |
| 2 Vehicles | 2,024 (41.3%) | 1,924 (49.2%) |
| 3 Vehicles | 973 (19.8%) | 483 (12.3%) |
| 4 Vehicles | 260 (5.3%) | 154 (3.9%) |
| 5 or more Vehicles | 153 (3.1%) | 113 (2.9%) |
| Total | 4,904 (100.0%) | 3,911 (100.0%) |
Commute Time in Aransas County
The most frequently occuring commute durations in Aransas County are 10 to 14 minutes (1,923 commuters, 24.4%), 15 to 19 minutes (1,509 commuters, 19.1%), and 5 to 9 minutes (1,151 commuters, 14.6%).
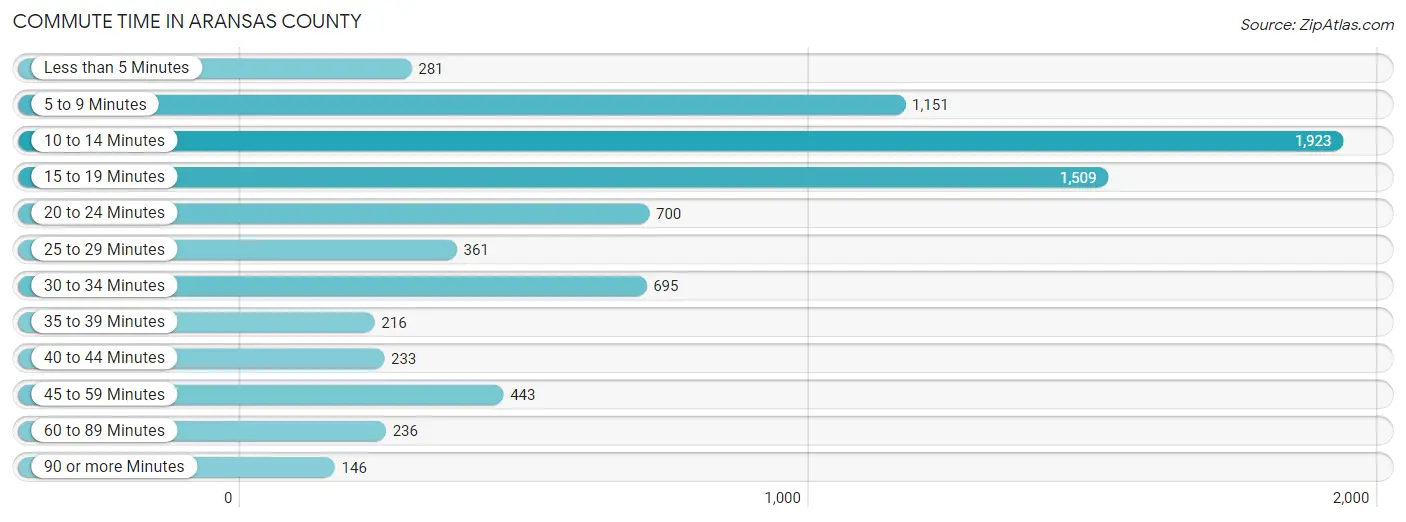
| Commute Time | # Commuters | % Commuters |
| Less than 5 Minutes | 281 | 3.6% |
| 5 to 9 Minutes | 1,151 | 14.6% |
| 10 to 14 Minutes | 1,923 | 24.4% |
| 15 to 19 Minutes | 1,509 | 19.1% |
| 20 to 24 Minutes | 700 | 8.9% |
| 25 to 29 Minutes | 361 | 4.6% |
| 30 to 34 Minutes | 695 | 8.8% |
| 35 to 39 Minutes | 216 | 2.7% |
| 40 to 44 Minutes | 233 | 2.9% |
| 45 to 59 Minutes | 443 | 5.6% |
| 60 to 89 Minutes | 236 | 3.0% |
| 90 or more Minutes | 146 | 1.8% |
Commute Time by Sex in Aransas County
The most common commute times in Aransas County are 10 to 14 minutes (1,212 commuters, 27.1%) for males and 5 to 9 minutes (761 commuters, 22.2%) for females.
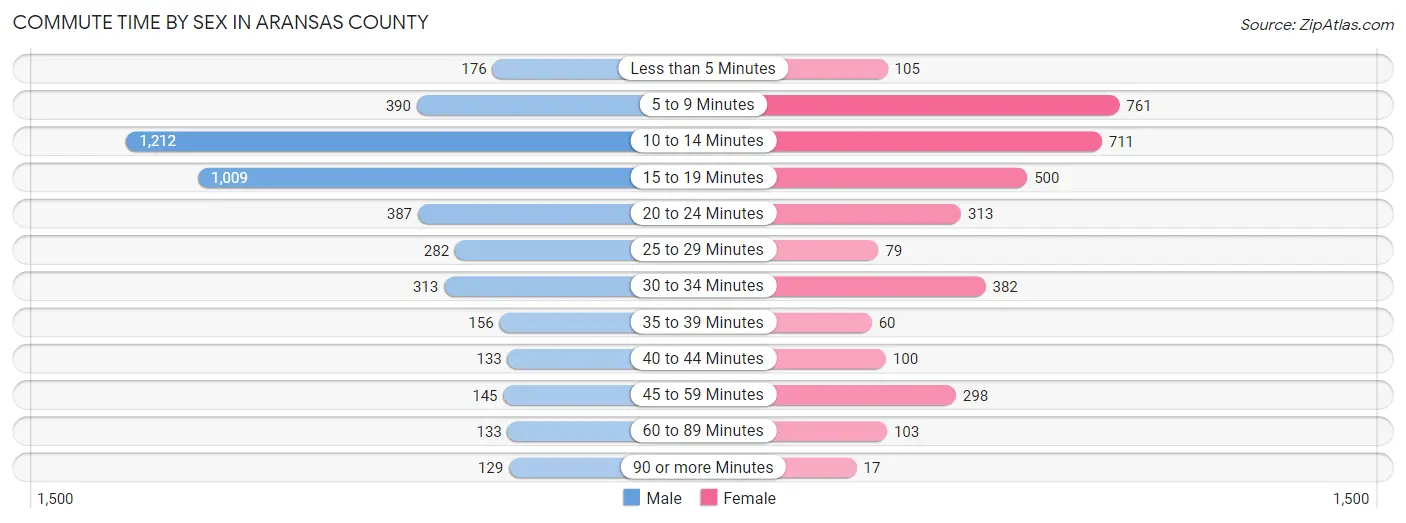
| Commute Time | Male | Female |
| Less than 5 Minutes | 176 (3.9%) | 105 (3.1%) |
| 5 to 9 Minutes | 390 (8.7%) | 761 (22.2%) |
| 10 to 14 Minutes | 1,212 (27.1%) | 711 (20.7%) |
| 15 to 19 Minutes | 1,009 (22.6%) | 500 (14.6%) |
| 20 to 24 Minutes | 387 (8.7%) | 313 (9.1%) |
| 25 to 29 Minutes | 282 (6.3%) | 79 (2.3%) |
| 30 to 34 Minutes | 313 (7.0%) | 382 (11.1%) |
| 35 to 39 Minutes | 156 (3.5%) | 60 (1.8%) |
| 40 to 44 Minutes | 133 (3.0%) | 100 (2.9%) |
| 45 to 59 Minutes | 145 (3.3%) | 298 (8.7%) |
| 60 to 89 Minutes | 133 (3.0%) | 103 (3.0%) |
| 90 or more Minutes | 129 (2.9%) | 17 (0.5%) |
Time of Departure to Work by Sex in Aransas County
The most frequent times of departure to work in Aransas County are 7:00 AM to 7:29 AM (854, 19.1%) for males and 7:00 AM to 7:29 AM (742, 21.6%) for females.
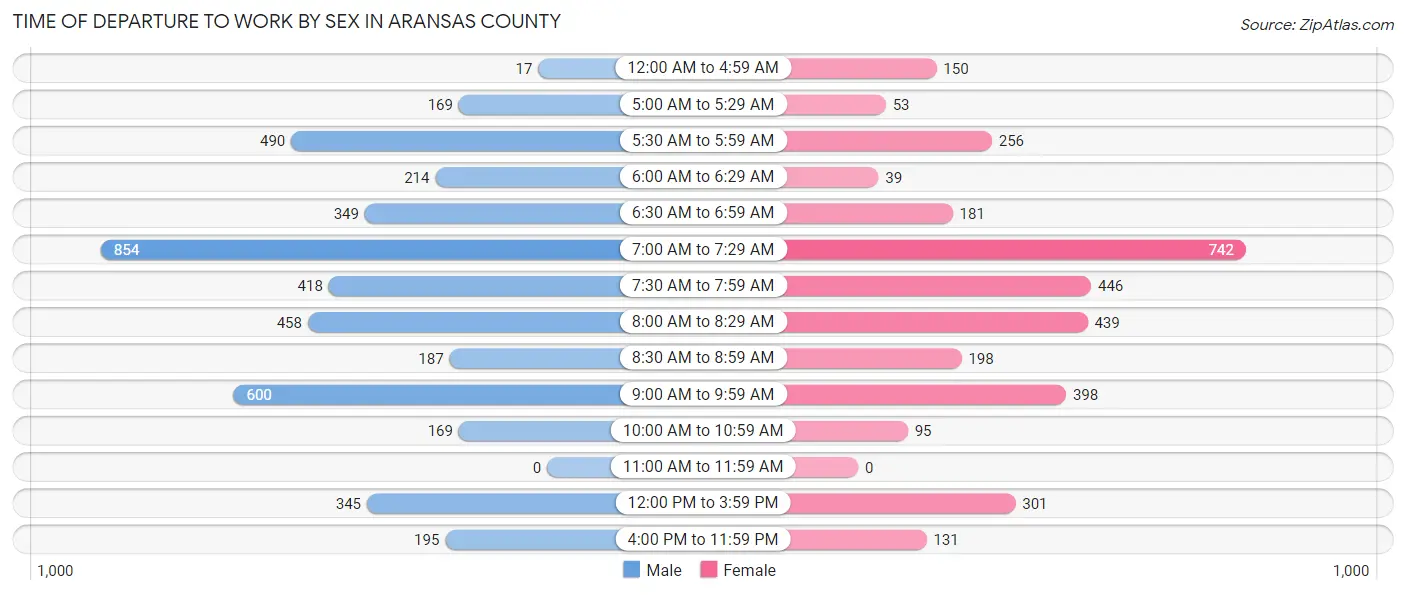
| Time of Departure | Male | Female |
| 12:00 AM to 4:59 AM | 17 (0.4%) | 150 (4.4%) |
| 5:00 AM to 5:29 AM | 169 (3.8%) | 53 (1.5%) |
| 5:30 AM to 5:59 AM | 490 (11.0%) | 256 (7.5%) |
| 6:00 AM to 6:29 AM | 214 (4.8%) | 39 (1.1%) |
| 6:30 AM to 6:59 AM | 349 (7.8%) | 181 (5.3%) |
| 7:00 AM to 7:29 AM | 854 (19.1%) | 742 (21.6%) |
| 7:30 AM to 7:59 AM | 418 (9.4%) | 446 (13.0%) |
| 8:00 AM to 8:29 AM | 458 (10.3%) | 439 (12.8%) |
| 8:30 AM to 8:59 AM | 187 (4.2%) | 198 (5.8%) |
| 9:00 AM to 9:59 AM | 600 (13.4%) | 398 (11.6%) |
| 10:00 AM to 10:59 AM | 169 (3.8%) | 95 (2.8%) |
| 11:00 AM to 11:59 AM | 0 (0.0%) | 0 (0.0%) |
| 12:00 PM to 3:59 PM | 345 (7.7%) | 301 (8.8%) |
| 4:00 PM to 11:59 PM | 195 (4.4%) | 131 (3.8%) |
| Total | 4,465 (100.0%) | 3,429 (100.0%) |
Housing Occupancy in Aransas County
Occupancy by Ownership in Aransas County
Of the total 11,412 dwellings in Aransas County, owner-occupied units account for 9,020 (79.0%), while renter-occupied units make up 2,392 (21.0%).
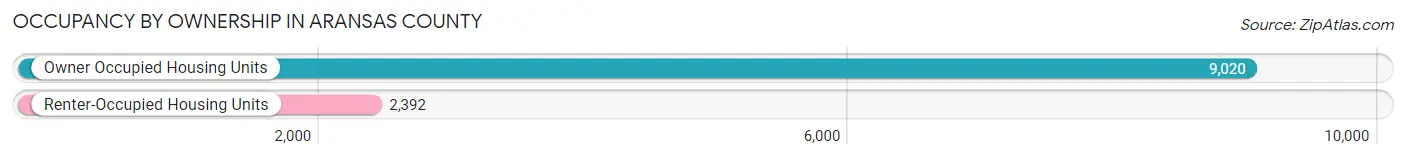
| Occupancy | # Housing Units | % Housing Units |
| Owner Occupied Housing Units | 9,020 | 79.0% |
| Renter-Occupied Housing Units | 2,392 | 21.0% |
| Total Occupied Housing Units | 11,412 | 100.0% |
Occupancy by Household Size in Aransas County
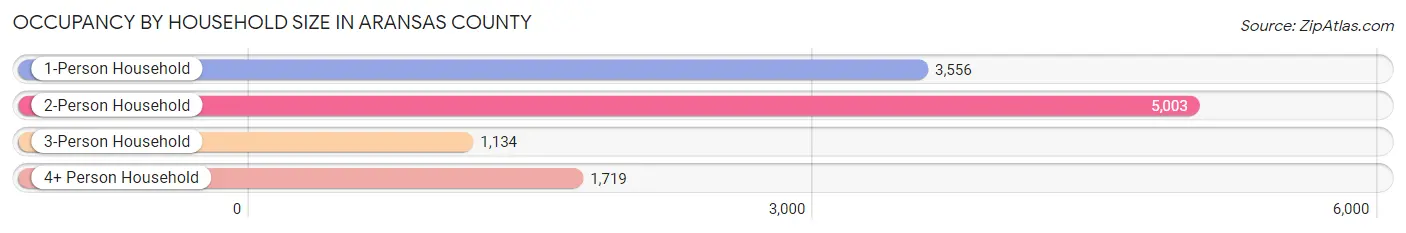
| Household Size | # Housing Units | % Housing Units |
| 1-Person Household | 3,556 | 31.2% |
| 2-Person Household | 5,003 | 43.8% |
| 3-Person Household | 1,134 | 9.9% |
| 4+ Person Household | 1,719 | 15.1% |
| Total Housing Units | 11,412 | 100.0% |
Occupancy by Ownership by Household Size in Aransas County
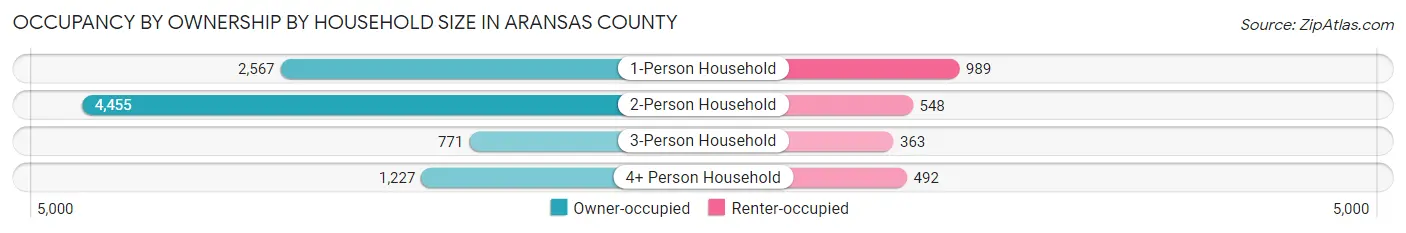
| Household Size | Owner-occupied | Renter-occupied |
| 1-Person Household | 2,567 (72.2%) | 989 (27.8%) |
| 2-Person Household | 4,455 (89.0%) | 548 (11.0%) |
| 3-Person Household | 771 (68.0%) | 363 (32.0%) |
| 4+ Person Household | 1,227 (71.4%) | 492 (28.6%) |
| Total Housing Units | 9,020 (79.0%) | 2,392 (21.0%) |
Occupancy by Educational Attainment in Aransas County
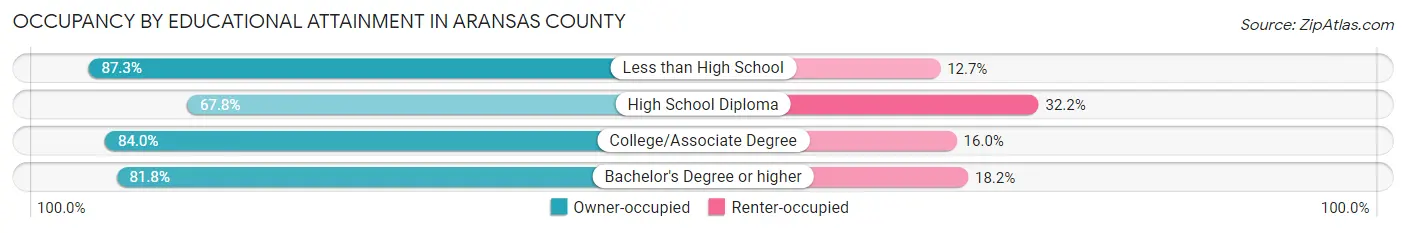
| Household Size | Owner-occupied | Renter-occupied |
| Less than High School | 1,190 (87.3%) | 173 (12.7%) |
| High School Diploma | 2,301 (67.8%) | 1,093 (32.2%) |
| College/Associate Degree | 3,218 (84.0%) | 611 (16.0%) |
| Bachelor's Degree or higher | 2,311 (81.8%) | 515 (18.2%) |
Occupancy by Age of Householder in Aransas County
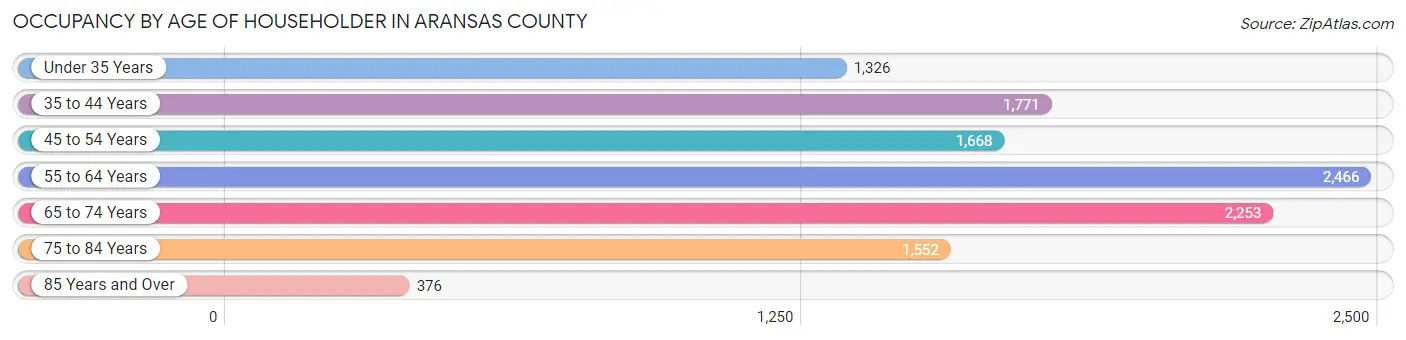
| Age Bracket | # Households | % Households |
| Under 35 Years | 1,326 | 11.6% |
| 35 to 44 Years | 1,771 | 15.5% |
| 45 to 54 Years | 1,668 | 14.6% |
| 55 to 64 Years | 2,466 | 21.6% |
| 65 to 74 Years | 2,253 | 19.7% |
| 75 to 84 Years | 1,552 | 13.6% |
| 85 Years and Over | 376 | 3.3% |
| Total | 11,412 | 100.0% |
Housing Finances in Aransas County
Median Income by Occupancy in Aransas County
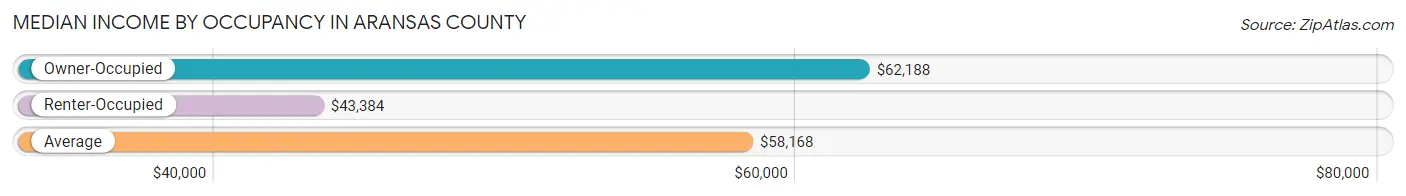
| Occupancy Type | # Households | Median Income |
| Owner-Occupied | 9,020 (79.0%) | $62,188 |
| Renter-Occupied | 2,392 (21.0%) | $43,384 |
| Average | 11,412 (100.0%) | $58,168 |
Occupancy by Householder Income Bracket in Aransas County
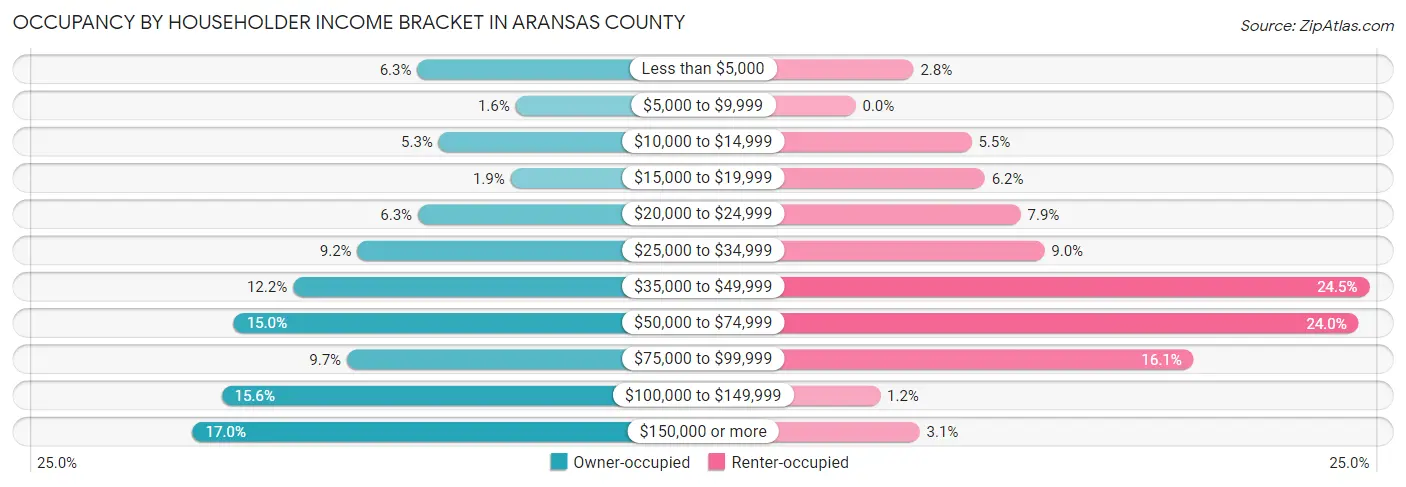
| Income Bracket | Owner-occupied | Renter-occupied |
| Less than $5,000 | 568 (6.3%) | 66 (2.8%) |
| $5,000 to $9,999 | 146 (1.6%) | 0 (0.0%) |
| $10,000 to $14,999 | 476 (5.3%) | 132 (5.5%) |
| $15,000 to $19,999 | 168 (1.9%) | 147 (6.1%) |
| $20,000 to $24,999 | 566 (6.3%) | 188 (7.9%) |
| $25,000 to $34,999 | 825 (9.1%) | 215 (9.0%) |
| $35,000 to $49,999 | 1,102 (12.2%) | 585 (24.5%) |
| $50,000 to $74,999 | 1,357 (15.0%) | 573 (23.9%) |
| $75,000 to $99,999 | 870 (9.7%) | 385 (16.1%) |
| $100,000 to $149,999 | 1,409 (15.6%) | 28 (1.2%) |
| $150,000 or more | 1,533 (17.0%) | 73 (3.0%) |
| Total | 9,020 (100.0%) | 2,392 (100.0%) |
Monthly Housing Cost Tiers in Aransas County
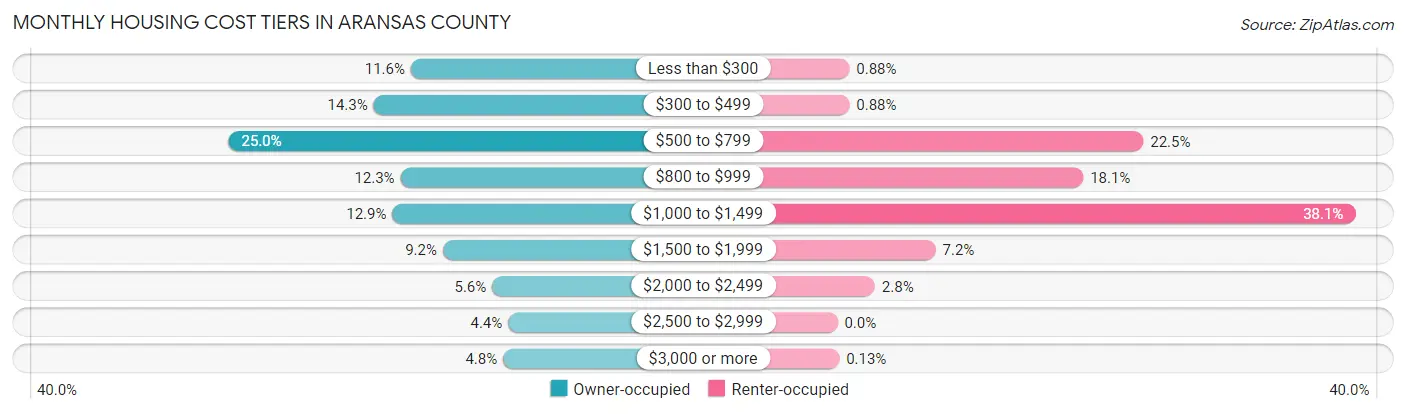
| Monthly Cost | Owner-occupied | Renter-occupied |
| Less than $300 | 1,043 (11.6%) | 21 (0.9%) |
| $300 to $499 | 1,290 (14.3%) | 21 (0.9%) |
| $500 to $799 | 2,254 (25.0%) | 539 (22.5%) |
| $800 to $999 | 1,111 (12.3%) | 433 (18.1%) |
| $1,000 to $1,499 | 1,165 (12.9%) | 912 (38.1%) |
| $1,500 to $1,999 | 830 (9.2%) | 173 (7.2%) |
| $2,000 to $2,499 | 502 (5.6%) | 66 (2.8%) |
| $2,500 to $2,999 | 396 (4.4%) | 0 (0.0%) |
| $3,000 or more | 429 (4.8%) | 3 (0.1%) |
| Total | 9,020 (100.0%) | 2,392 (100.0%) |
Physical Housing Characteristics in Aransas County
Housing Structures in Aransas County
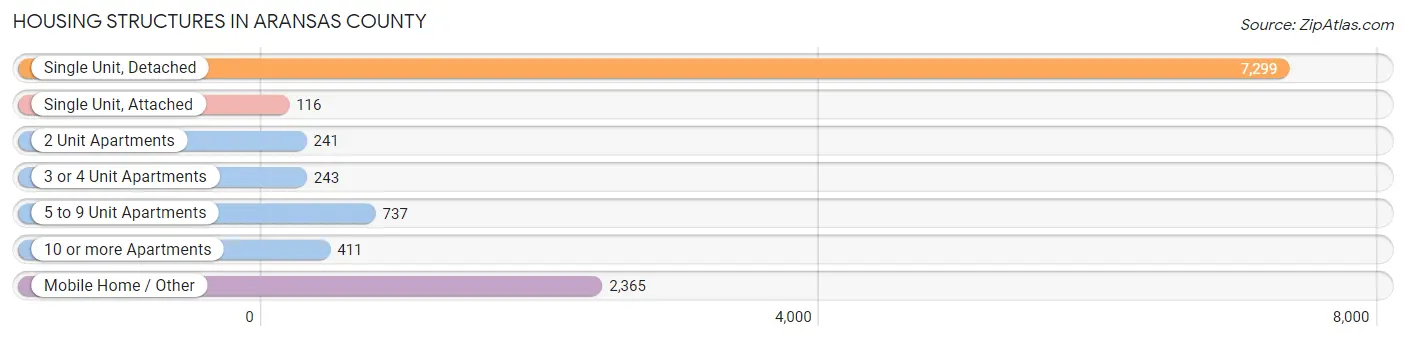
| Structure Type | # Housing Units | % Housing Units |
| Single Unit, Detached | 7,299 | 64.0% |
| Single Unit, Attached | 116 | 1.0% |
| 2 Unit Apartments | 241 | 2.1% |
| 3 or 4 Unit Apartments | 243 | 2.1% |
| 5 to 9 Unit Apartments | 737 | 6.5% |
| 10 or more Apartments | 411 | 3.6% |
| Mobile Home / Other | 2,365 | 20.7% |
| Total | 11,412 | 100.0% |
Housing Structures by Occupancy in Aransas County
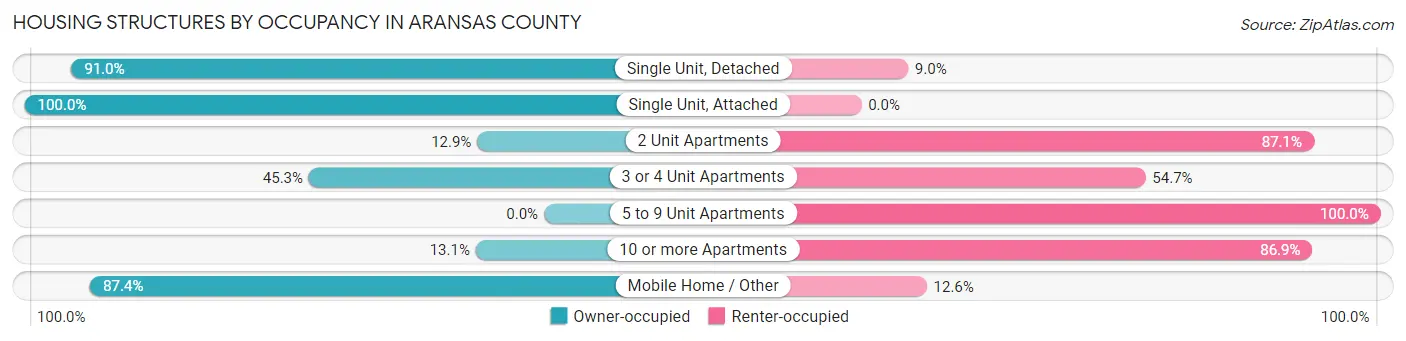
| Structure Type | Owner-occupied | Renter-occupied |
| Single Unit, Detached | 6,642 (91.0%) | 657 (9.0%) |
| Single Unit, Attached | 116 (100.0%) | 0 (0.0%) |
| 2 Unit Apartments | 31 (12.9%) | 210 (87.1%) |
| 3 or 4 Unit Apartments | 110 (45.3%) | 133 (54.7%) |
| 5 to 9 Unit Apartments | 0 (0.0%) | 737 (100.0%) |
| 10 or more Apartments | 54 (13.1%) | 357 (86.9%) |
| Mobile Home / Other | 2,067 (87.4%) | 298 (12.6%) |
| Total | 9,020 (79.0%) | 2,392 (21.0%) |
Housing Structures by Number of Rooms in Aransas County
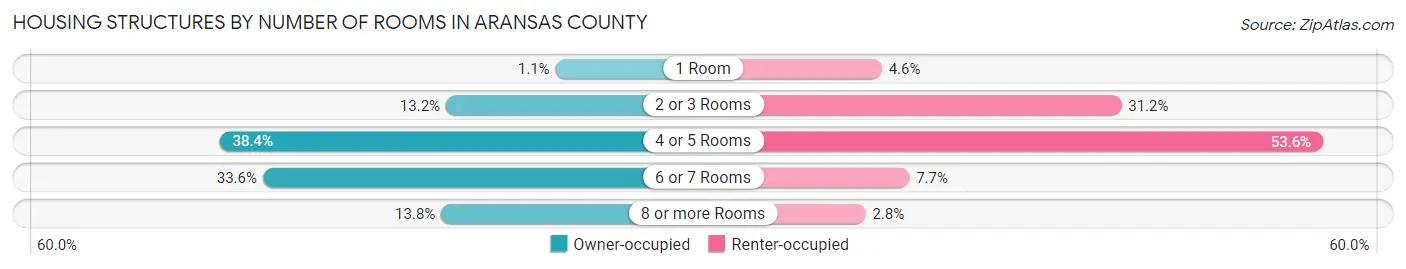
| Number of Rooms | Owner-occupied | Renter-occupied |
| 1 Room | 98 (1.1%) | 111 (4.6%) |
| 2 or 3 Rooms | 1,194 (13.2%) | 747 (31.2%) |
| 4 or 5 Rooms | 3,459 (38.4%) | 1,282 (53.6%) |
| 6 or 7 Rooms | 3,027 (33.6%) | 184 (7.7%) |
| 8 or more Rooms | 1,242 (13.8%) | 68 (2.8%) |
| Total | 9,020 (100.0%) | 2,392 (100.0%) |
Housing Structure by Heating Type in Aransas County
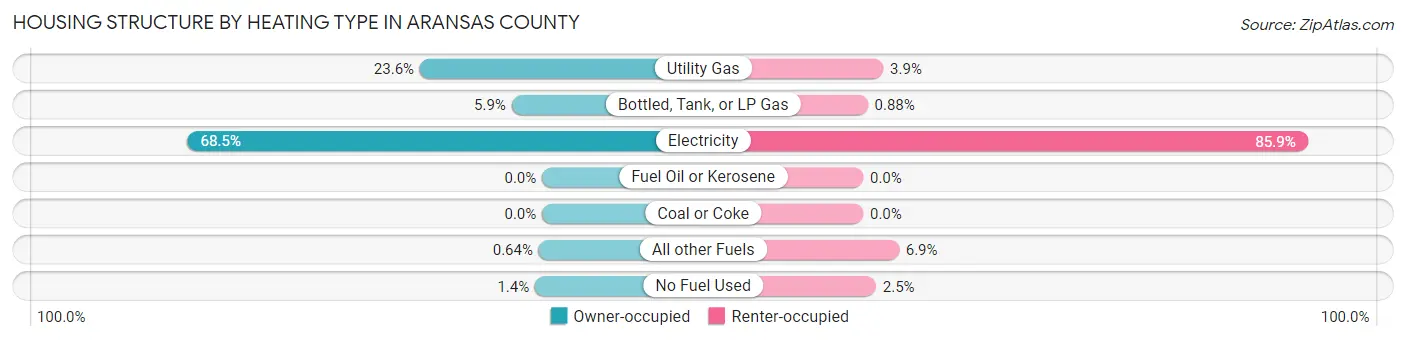
| Heating Type | Owner-occupied | Renter-occupied |
| Utility Gas | 2,130 (23.6%) | 93 (3.9%) |
| Bottled, Tank, or LP Gas | 530 (5.9%) | 21 (0.9%) |
| Electricity | 6,179 (68.5%) | 2,054 (85.9%) |
| Fuel Oil or Kerosene | 0 (0.0%) | 0 (0.0%) |
| Coal or Coke | 0 (0.0%) | 0 (0.0%) |
| All other Fuels | 58 (0.6%) | 165 (6.9%) |
| No Fuel Used | 123 (1.4%) | 59 (2.5%) |
| Total | 9,020 (100.0%) | 2,392 (100.0%) |
Household Vehicle Usage in Aransas County
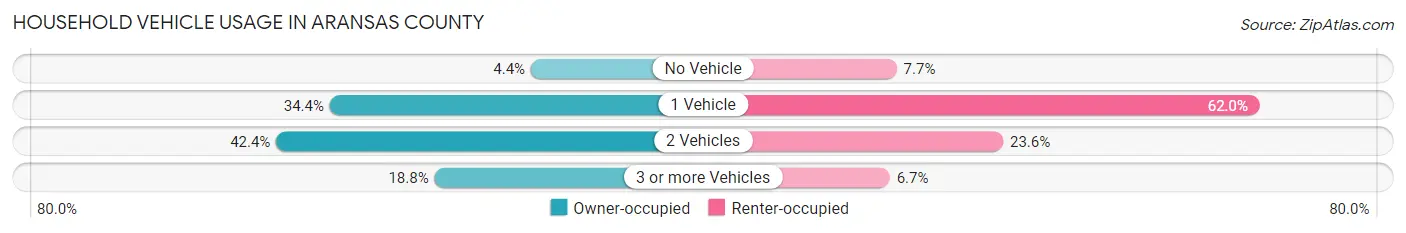
| Vehicles per Household | Owner-occupied | Renter-occupied |
| No Vehicle | 395 (4.4%) | 185 (7.7%) |
| 1 Vehicle | 3,105 (34.4%) | 1,482 (62.0%) |
| 2 Vehicles | 3,826 (42.4%) | 565 (23.6%) |
| 3 or more Vehicles | 1,694 (18.8%) | 160 (6.7%) |
| Total | 9,020 (100.0%) | 2,392 (100.0%) |
Real Estate & Mortgages in Aransas County
Real Estate and Mortgage Overview in Aransas County
| Characteristic | Without Mortgage | With Mortgage |
| Housing Units | 5,739 | 3,281 |
| Median Property Value | $196,600 | $267,600 |
| Median Household Income | $49,577 | $768 |
| Monthly Housing Costs | $565 | $400 |
| Real Estate Taxes | $1,843 | $172 |
Property Value by Mortgage Status in Aransas County
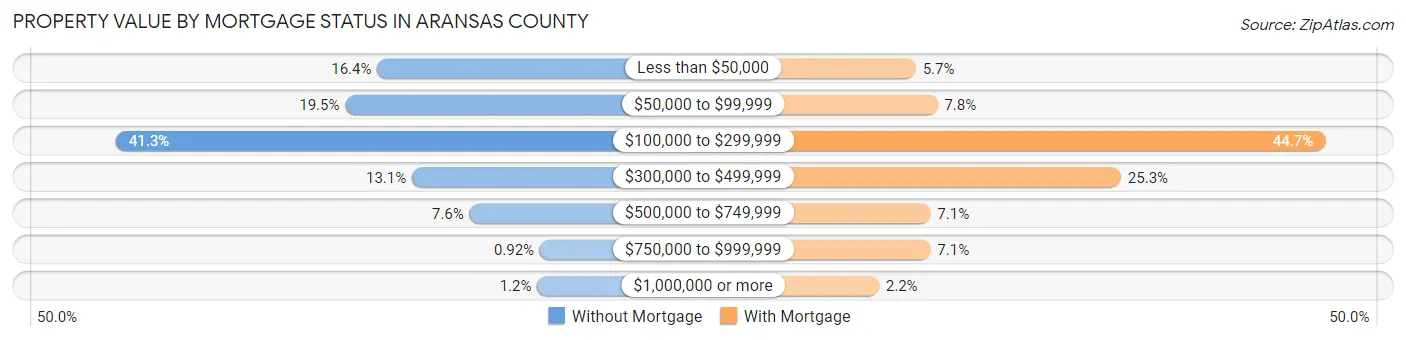
| Property Value | Without Mortgage | With Mortgage |
| Less than $50,000 | 942 (16.4%) | 188 (5.7%) |
| $50,000 to $99,999 | 1,117 (19.5%) | 256 (7.8%) |
| $100,000 to $299,999 | 2,370 (41.3%) | 1,467 (44.7%) |
| $300,000 to $499,999 | 752 (13.1%) | 829 (25.3%) |
| $500,000 to $749,999 | 438 (7.6%) | 234 (7.1%) |
| $750,000 to $999,999 | 53 (0.9%) | 234 (7.1%) |
| $1,000,000 or more | 67 (1.2%) | 73 (2.2%) |
| Total | 5,739 (100.0%) | 3,281 (100.0%) |
Household Income by Mortgage Status in Aransas County
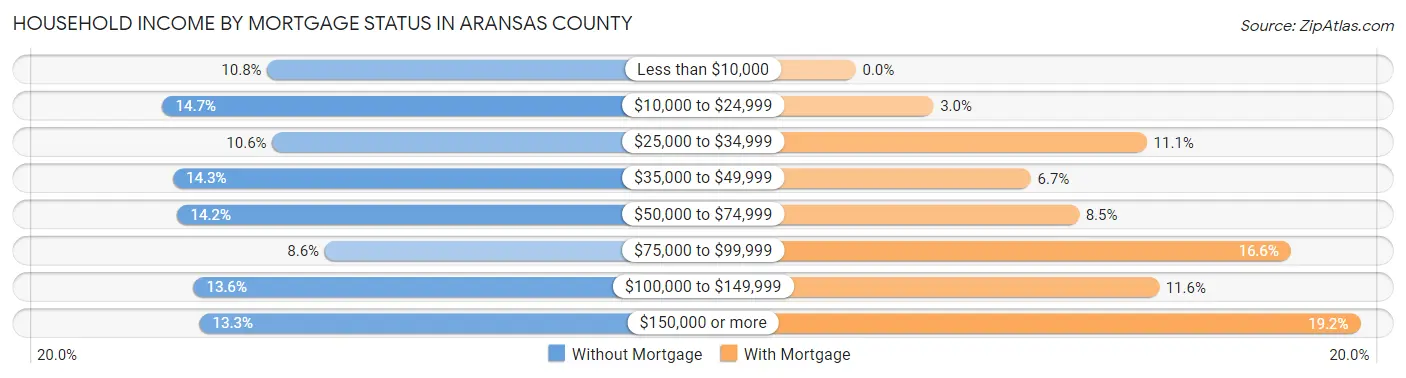
| Household Income | Without Mortgage | With Mortgage |
| Less than $10,000 | 617 (10.7%) | 0 (0.0%) |
| $10,000 to $24,999 | 846 (14.7%) | 97 (3.0%) |
| $25,000 to $34,999 | 606 (10.6%) | 364 (11.1%) |
| $35,000 to $49,999 | 823 (14.3%) | 219 (6.7%) |
| $50,000 to $74,999 | 813 (14.2%) | 279 (8.5%) |
| $75,000 to $99,999 | 491 (8.6%) | 544 (16.6%) |
| $100,000 to $149,999 | 778 (13.6%) | 379 (11.6%) |
| $150,000 or more | 765 (13.3%) | 631 (19.2%) |
| Total | 5,739 (100.0%) | 3,281 (100.0%) |
Property Value to Household Income Ratio in Aransas County
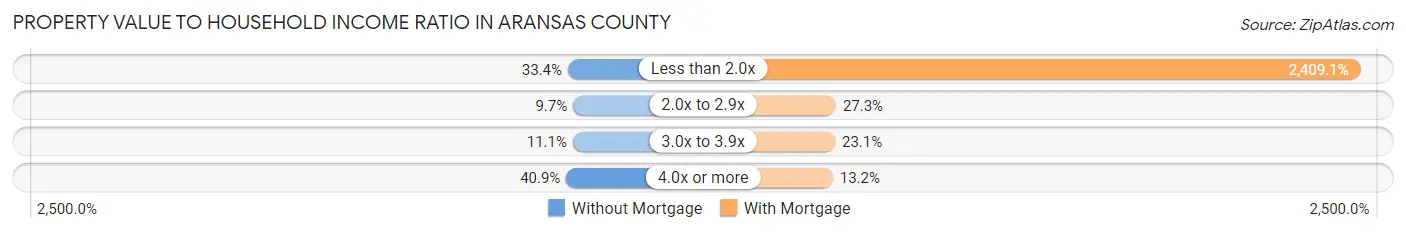
| Value-to-Income Ratio | Without Mortgage | With Mortgage |
| Less than 2.0x | 1,917 (33.4%) | 79,044 (2,409.1%) |
| 2.0x to 2.9x | 555 (9.7%) | 897 (27.3%) |
| 3.0x to 3.9x | 638 (11.1%) | 758 (23.1%) |
| 4.0x or more | 2,347 (40.9%) | 433 (13.2%) |
| Total | 5,739 (100.0%) | 3,281 (100.0%) |
Real Estate Taxes by Mortgage Status in Aransas County
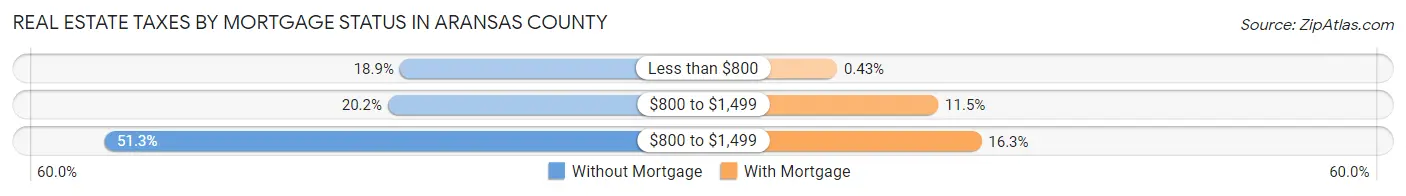
| Property Taxes | Without Mortgage | With Mortgage |
| Less than $800 | 1,084 (18.9%) | 14 (0.4%) |
| $800 to $1,499 | 1,159 (20.2%) | 378 (11.5%) |
| $800 to $1,499 | 2,943 (51.3%) | 533 (16.3%) |
| Total | 5,739 (100.0%) | 3,281 (100.0%) |
Health & Disability in Aransas County
Health Insurance Coverage by Age in Aransas County
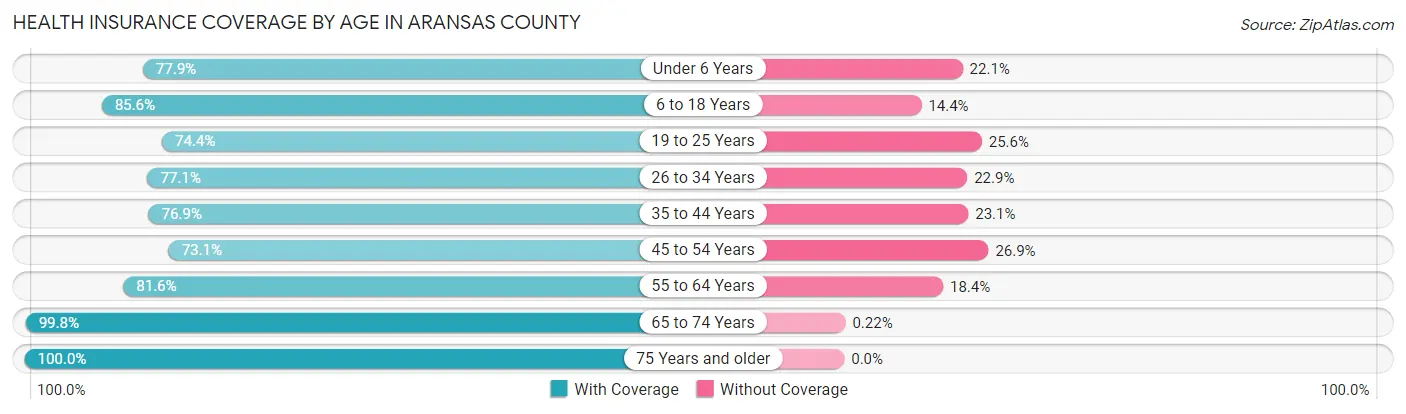
| Age Bracket | With Coverage | Without Coverage |
| Under 6 Years | 999 (77.9%) | 283 (22.1%) |
| 6 to 18 Years | 2,552 (85.6%) | 429 (14.4%) |
| 19 to 25 Years | 638 (74.4%) | 220 (25.6%) |
| 26 to 34 Years | 1,660 (77.1%) | 494 (22.9%) |
| 35 to 44 Years | 2,318 (76.9%) | 697 (23.1%) |
| 45 to 54 Years | 2,176 (73.1%) | 800 (26.9%) |
| 55 to 64 Years | 3,277 (81.6%) | 740 (18.4%) |
| 65 to 74 Years | 3,618 (99.8%) | 8 (0.2%) |
| 75 Years and older | 2,850 (100.0%) | 0 (0.0%) |
| Total | 20,088 (84.6%) | 3,671 (15.4%) |
Health Insurance Coverage by Citizenship Status in Aransas County
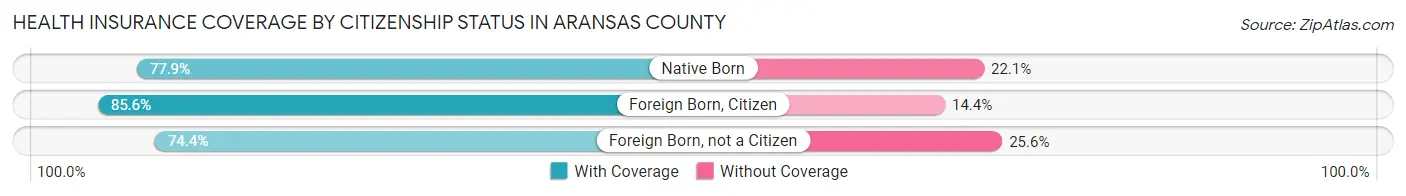
| Citizenship Status | With Coverage | Without Coverage |
| Native Born | 999 (77.9%) | 283 (22.1%) |
| Foreign Born, Citizen | 2,552 (85.6%) | 429 (14.4%) |
| Foreign Born, not a Citizen | 638 (74.4%) | 220 (25.6%) |
Health Insurance Coverage by Household Income in Aransas County
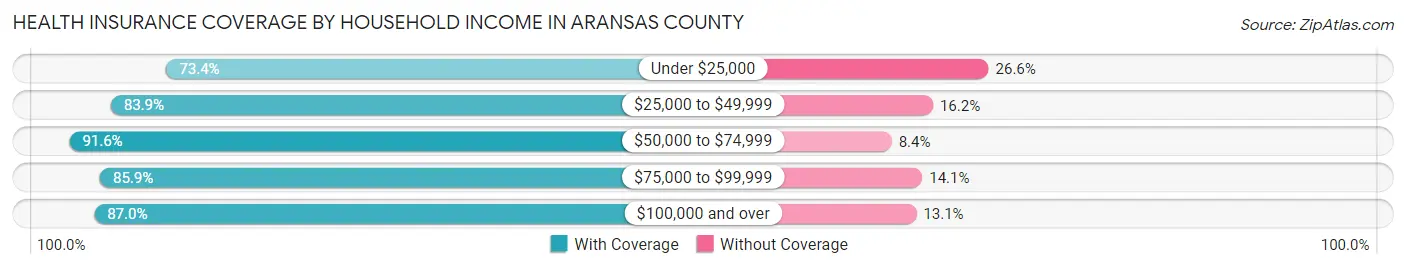
| Household Income | With Coverage | Without Coverage |
| Under $25,000 | 2,943 (73.4%) | 1,065 (26.6%) |
| $25,000 to $49,999 | 4,230 (83.9%) | 815 (16.2%) |
| $50,000 to $74,999 | 3,203 (91.6%) | 294 (8.4%) |
| $75,000 to $99,999 | 2,447 (85.9%) | 403 (14.1%) |
| $100,000 and over | 7,229 (87.0%) | 1,085 (13.1%) |
Public vs Private Health Insurance Coverage by Age in Aransas County
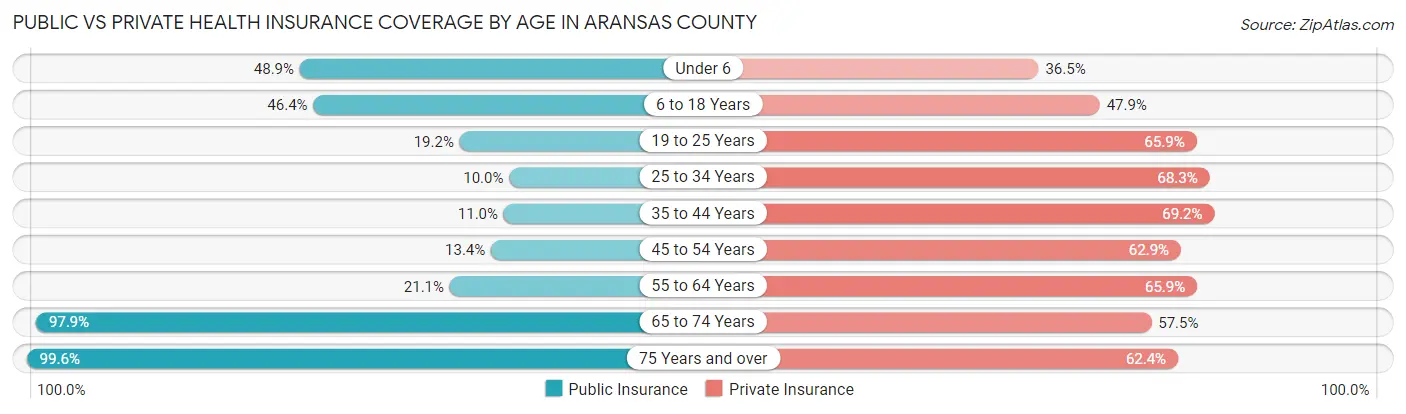
| Age Bracket | Public Insurance | Private Insurance |
| Under 6 | 627 (48.9%) | 468 (36.5%) |
| 6 to 18 Years | 1,383 (46.4%) | 1,427 (47.9%) |
| 19 to 25 Years | 165 (19.2%) | 565 (65.8%) |
| 25 to 34 Years | 216 (10.0%) | 1,470 (68.2%) |
| 35 to 44 Years | 333 (11.0%) | 2,085 (69.2%) |
| 45 to 54 Years | 399 (13.4%) | 1,873 (62.9%) |
| 55 to 64 Years | 846 (21.1%) | 2,649 (65.9%) |
| 65 to 74 Years | 3,550 (97.9%) | 2,083 (57.5%) |
| 75 Years and over | 2,839 (99.6%) | 1,778 (62.4%) |
| Total | 10,358 (43.6%) | 14,398 (60.6%) |
Disability Status by Sex by Age in Aransas County
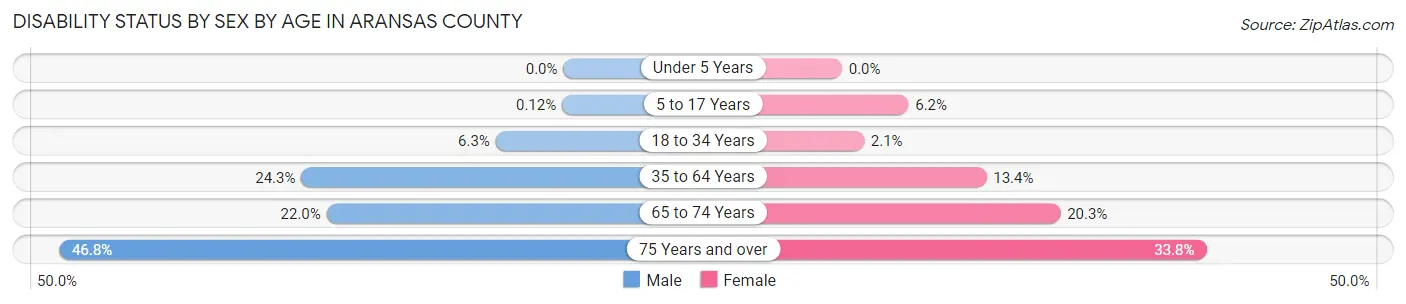
| Age Bracket | Male | Female |
| Under 5 Years | 0 (0.0%) | 0 (0.0%) |
| 5 to 17 Years | 2 (0.1%) | 89 (6.2%) |
| 18 to 34 Years | 93 (6.3%) | 33 (2.1%) |
| 35 to 64 Years | 1,219 (24.3%) | 670 (13.4%) |
| 65 to 74 Years | 399 (22.0%) | 367 (20.3%) |
| 75 Years and over | 609 (46.8%) | 524 (33.8%) |
Disability Class by Sex by Age in Aransas County
Disability Class: Hearing Difficulty
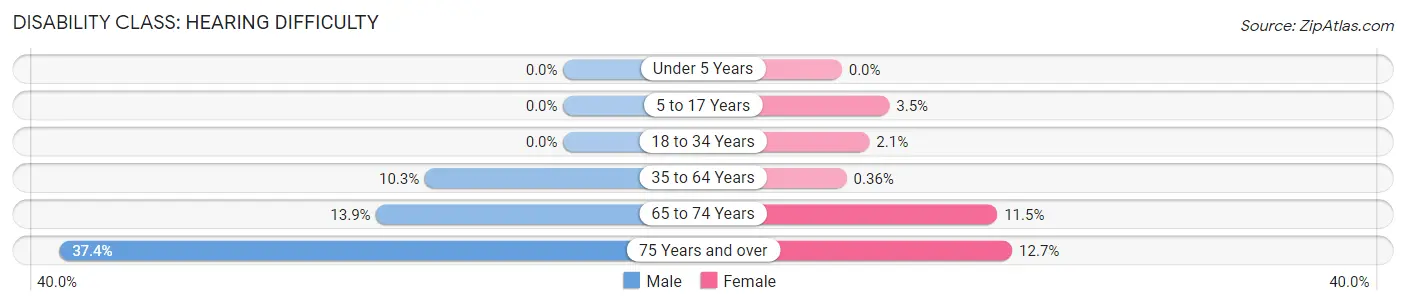
| Age Bracket | Male | Female |
| Under 5 Years | 0 (0.0%) | 0 (0.0%) |
| 5 to 17 Years | 0 (0.0%) | 51 (3.5%) |
| 18 to 34 Years | 0 (0.0%) | 33 (2.1%) |
| 35 to 64 Years | 515 (10.3%) | 18 (0.4%) |
| 65 to 74 Years | 252 (13.9%) | 209 (11.5%) |
| 75 Years and over | 487 (37.4%) | 196 (12.7%) |
Disability Class: Vision Difficulty
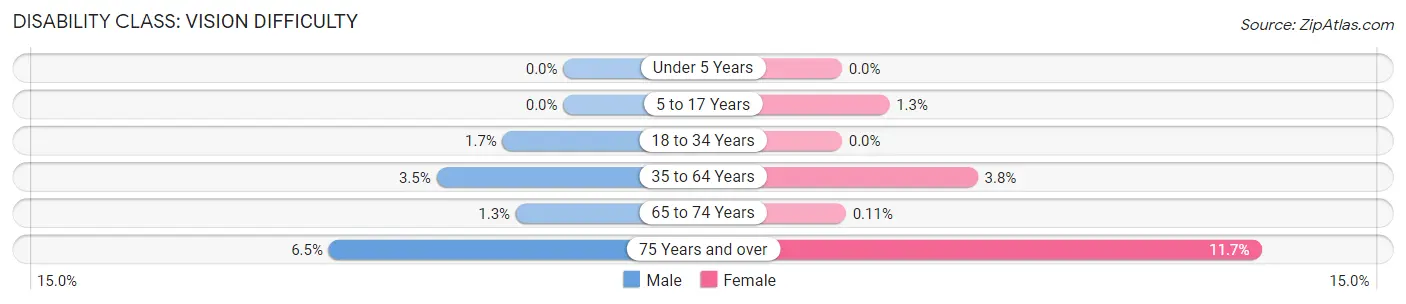
| Age Bracket | Male | Female |
| Under 5 Years | 0 (0.0%) | 0 (0.0%) |
| 5 to 17 Years | 0 (0.0%) | 19 (1.3%) |
| 18 to 34 Years | 25 (1.7%) | 0 (0.0%) |
| 35 to 64 Years | 177 (3.5%) | 189 (3.8%) |
| 65 to 74 Years | 24 (1.3%) | 2 (0.1%) |
| 75 Years and over | 85 (6.5%) | 181 (11.7%) |
Disability Class: Cognitive Difficulty
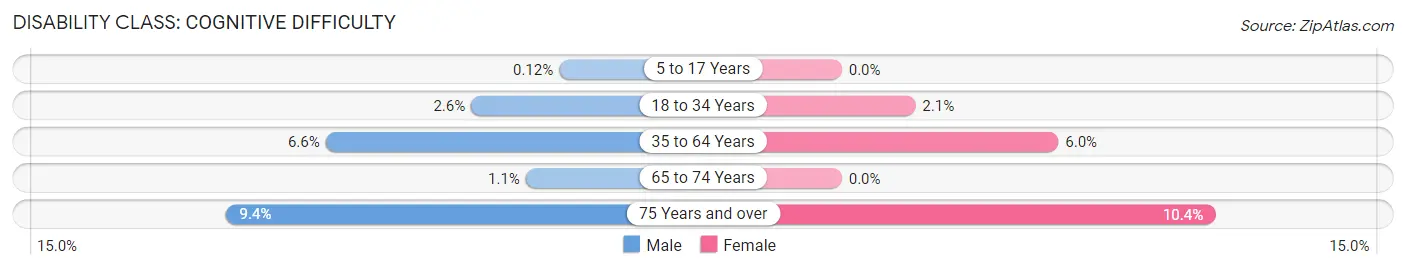
| Age Bracket | Male | Female |
| 5 to 17 Years | 2 (0.1%) | 0 (0.0%) |
| 18 to 34 Years | 38 (2.6%) | 33 (2.1%) |
| 35 to 64 Years | 332 (6.6%) | 301 (6.0%) |
| 65 to 74 Years | 19 (1.1%) | 0 (0.0%) |
| 75 Years and over | 122 (9.4%) | 161 (10.4%) |
Disability Class: Ambulatory Difficulty
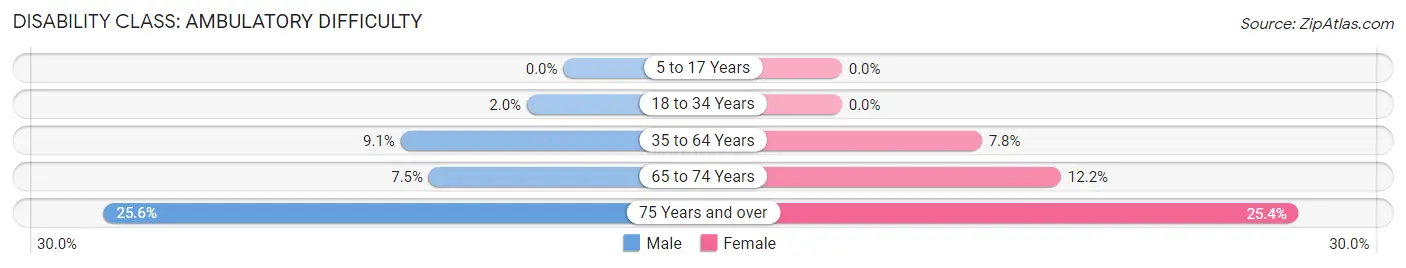
| Age Bracket | Male | Female |
| 5 to 17 Years | 0 (0.0%) | 0 (0.0%) |
| 18 to 34 Years | 30 (2.0%) | 0 (0.0%) |
| 35 to 64 Years | 454 (9.1%) | 389 (7.8%) |
| 65 to 74 Years | 136 (7.5%) | 221 (12.2%) |
| 75 Years and over | 333 (25.6%) | 394 (25.4%) |
Disability Class: Self-Care Difficulty
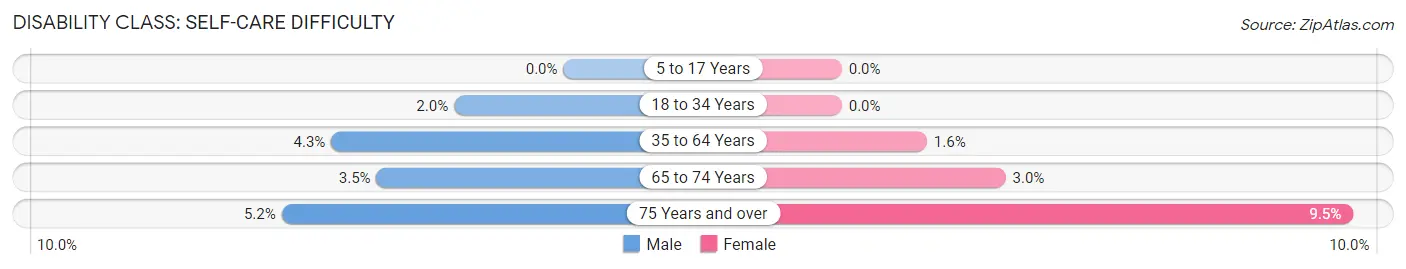
| Age Bracket | Male | Female |
| 5 to 17 Years | 0 (0.0%) | 0 (0.0%) |
| 18 to 34 Years | 30 (2.0%) | 0 (0.0%) |
| 35 to 64 Years | 216 (4.3%) | 79 (1.6%) |
| 65 to 74 Years | 63 (3.5%) | 55 (3.0%) |
| 75 Years and over | 68 (5.2%) | 147 (9.5%) |
Technology Access in Aransas County
Computing Device Access in Aransas County
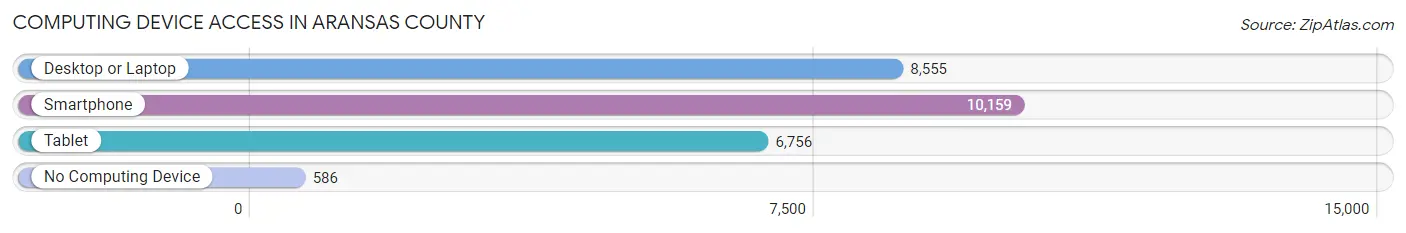
| Device Type | # Households | % Households |
| Desktop or Laptop | 8,555 | 75.0% |
| Smartphone | 10,159 | 89.0% |
| Tablet | 6,756 | 59.2% |
| No Computing Device | 586 | 5.1% |
| Total | 11,412 | 100.0% |
Internet Access in Aransas County
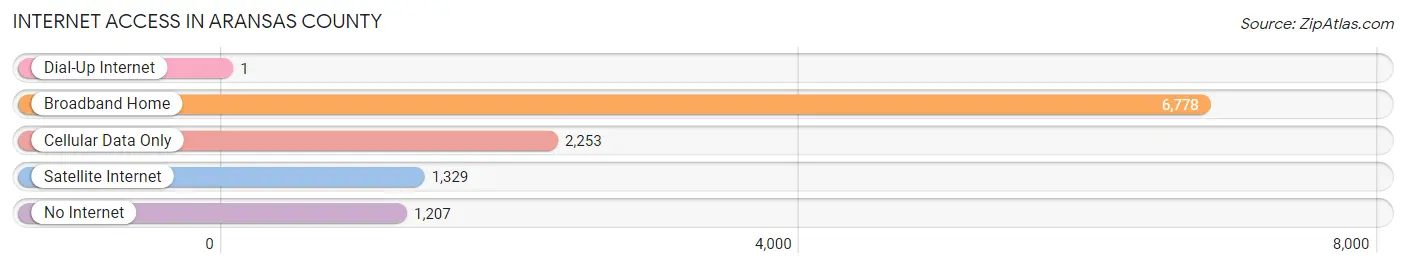
| Internet Type | # Households | % Households |
| Dial-Up Internet | 1 | 0.0% |
| Broadband Home | 6,778 | 59.4% |
| Cellular Data Only | 2,253 | 19.7% |
| Satellite Internet | 1,329 | 11.7% |
| No Internet | 1,207 | 10.6% |
| Total | 11,412 | 100.0% |
Aransas County Summary
Aransas County is located in the Coastal Bend region of Texas, along the Gulf of Mexico. It is bordered by Refugio County to the north, San Patricio County to the east, Nueces County to the south, and Kleberg County to the west. The county seat is Rockport, and the largest city is Aransas Pass. The county covers an area of 837 square miles and has a population of approximately 24,000 people.
History
Aransas County was established in 1871 from parts of Refugio and San Patricio counties. It was named for the Aransas Bay, which was named by Spanish explorer Alonso de León in 1686. The bay was named after the Spanish word for “rabbit”, which was the name of a local Native American tribe.
The first settlers in the area were ranchers, who were attracted by the abundance of wild game and the mild climate. The first town in the county was Rockport, which was founded in 1867. The town was named after the nearby rock formations.
In the late 19th century, the area began to attract more settlers, and the economy began to diversify. Fishing and shrimping became important industries, and the area also became known for its citrus production.
Geography
Aransas County is located in the Coastal Bend region of Texas, along the Gulf of Mexico. It is bordered by Refugio County to the north, San Patricio County to the east, Nueces County to the south, and Kleberg County to the west. The county covers an area of 837 square miles and has a population of approximately 24,000 people.
The terrain of the county is mostly flat, with some rolling hills in the northern part of the county. The climate is subtropical, with hot summers and mild winters. The average annual temperature is 72 degrees Fahrenheit, and the average annual precipitation is 33 inches.
The county is home to several bodies of water, including Aransas Bay, Copano Bay, St. Charles Bay, and Redfish Bay. The county also contains several wildlife refuges, including Aransas National Wildlife Refuge, Matagorda Island National Wildlife Refuge, and St. Charles Bay National Wildlife Refuge.
Economy
The economy of Aransas County is largely based on tourism, fishing, and agriculture. The county is home to several popular tourist attractions, including the Rockport Beach Park, Goose Island State Park, and the Aransas National Wildlife Refuge.
Fishing and shrimping are important industries in the county, and the area is known for its seafood. The county is also home to several citrus farms, and the area is known for its production of oranges, grapefruits, and tangerines.
Demographics
As of the 2010 census, the population of Aransas County was 24,505. The racial makeup of the county was 81.3% White, 8.2% Hispanic or Latino, 6.2% African American, 1.7% Native American, 0.7% Asian, and 1.9% from other races.
The median household income in the county was $41,945, and the median family income was $50,945. The per capita income was $21,945. Approximately 14.3% of the population was below the poverty line.
Common Questions
What is Per Capita Income in Aransas County?
Per Capita income in Aransas County is $40,890.
What is the Median Family Income in Aransas County?
Median Family Income in Aransas County is $71,896.
What is the Median Household income in Aransas County?
Median Household Income in Aransas County is $58,168.
What is Income or Wage Gap in Aransas County?
Income or Wage Gap in Aransas County is 33.4%.
Women in Aransas County earn 66.6 cents for every dollar earned by a man.
What is Family Income Deficit in Aransas County?
Family Income Deficit in Aransas County is $13,433.
Families that are below poverty line in Aransas County earn $13,433 less on average than the poverty threshold level.
What is Inequality or Gini Index in Aransas County?
Inequality or Gini Index in Aransas County is 0.51.
What is the Total Population of Aransas County?
Total Population of Aransas County is 24,048.
What is the Total Male Population of Aransas County?
Total Male Population of Aransas County is 11,986.
What is the Total Female Population of Aransas County?
Total Female Population of Aransas County is 12,062.
What is the Ratio of Males per 100 Females in Aransas County?
There are 99.37 Males per 100 Females in Aransas County.
What is the Ratio of Females per 100 Males in Aransas County?
There are 100.63 Females per 100 Males in Aransas County.
What is the Median Population Age in Aransas County?
Median Population Age in Aransas County is 51.0 Years.
What is the Average Family Size in Aransas County
Average Family Size in Aransas County is 2.5 People.
What is the Average Household Size in Aransas County
Average Household Size in Aransas County is 2.1 People.
How Large is the Labor Force in Aransas County?
There are 9,707 People in the Labor Forcein in Aransas County.
What is the Percentage of People in the Labor Force in Aransas County?
47.8% of People are in the Labor Force in Aransas County.
What is the Unemployment Rate in Aransas County?
Unemployment Rate in Aransas County is 4.4%.