Angelina County, TX Map & Demographics
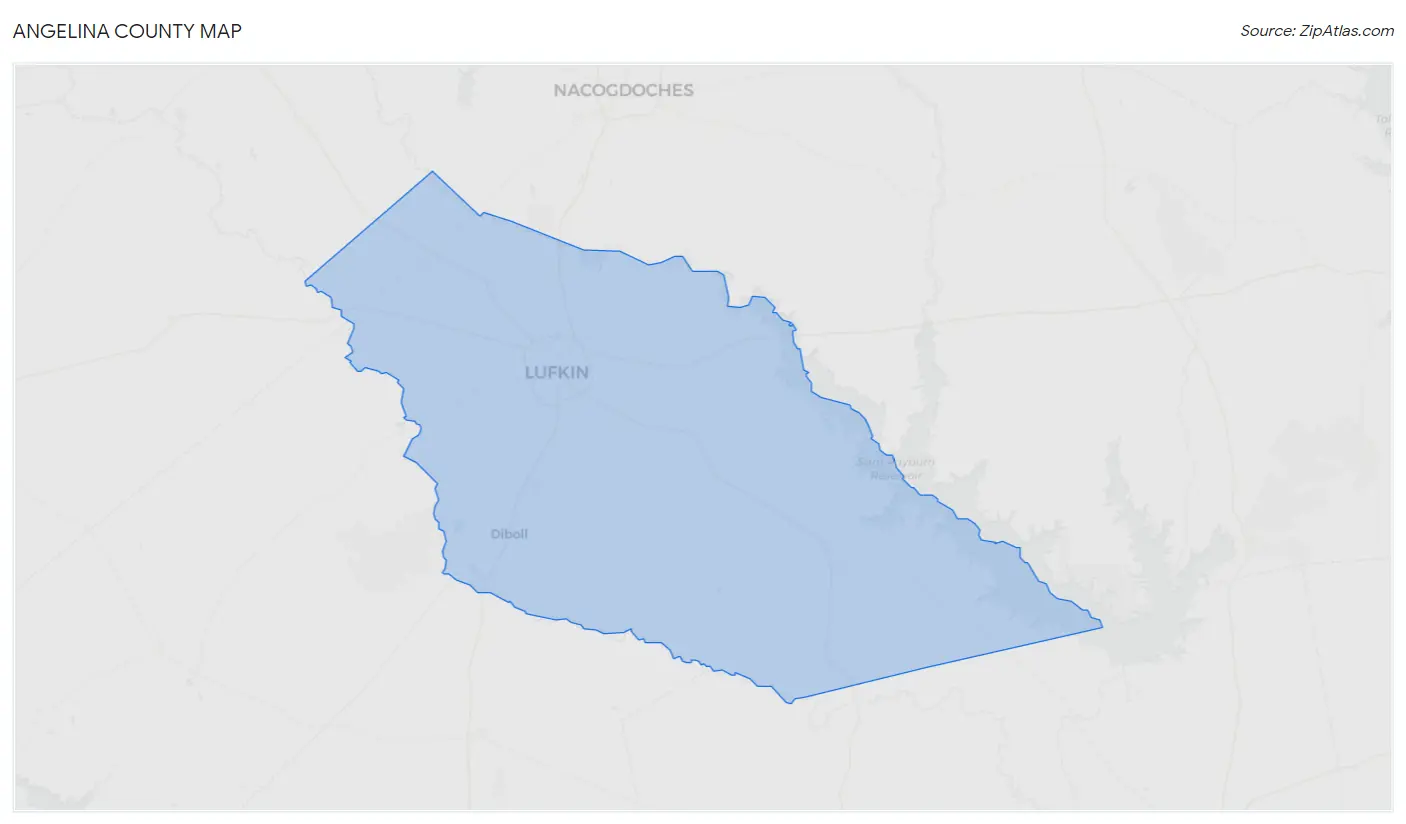
Angelina County Map
Angelina County Overview
$27,460
PER CAPITA INCOME
$66,502
AVG FAMILY INCOME
$57,055
AVG HOUSEHOLD INCOME
37.0%
WAGE / INCOME GAP [ % ]
63.0¢/ $1
WAGE / INCOME GAP [ $ ]
$11,373
FAMILY INCOME DEFICIT
0.43
INEQUALITY / GINI INDEX
86,608
TOTAL POPULATION
42,586
MALE POPULATION
44,022
FEMALE POPULATION
96.74
MALES / 100 FEMALES
103.37
FEMALES / 100 MALES
37.8
MEDIAN AGE
3.1
AVG FAMILY SIZE
2.6
AVG HOUSEHOLD SIZE
39,762
LABOR FORCE [ PEOPLE ]
59.4%
PERCENT IN LABOR FORCE
6.0%
UNEMPLOYMENT RATE
Angelina County Area Codes
Income in Angelina County
Income Overview in Angelina County
Per Capita Income in Angelina County is $27,460, while median incomes of families and households are $66,502 and $57,055 respectively.
| Characteristic | Number | Measure |
| Per Capita Income | 86,608 | $27,460 |
| Median Family Income | 22,445 | $66,502 |
| Mean Family Income | 22,445 | $82,479 |
| Median Household Income | 31,583 | $57,055 |
| Mean Household Income | 31,583 | $73,244 |
| Income Deficit | 22,445 | $11,373 |
| Wage / Income Gap (%) | 86,608 | 36.96% |
| Wage / Income Gap ($) | 86,608 | 63.04¢ per $1 |
| Gini / Inequality Index | 86,608 | 0.43 |
Earnings by Sex in Angelina County
Average Earnings in Angelina County are $33,359, $40,438 for men and $25,491 for women, a difference of 37.0%.
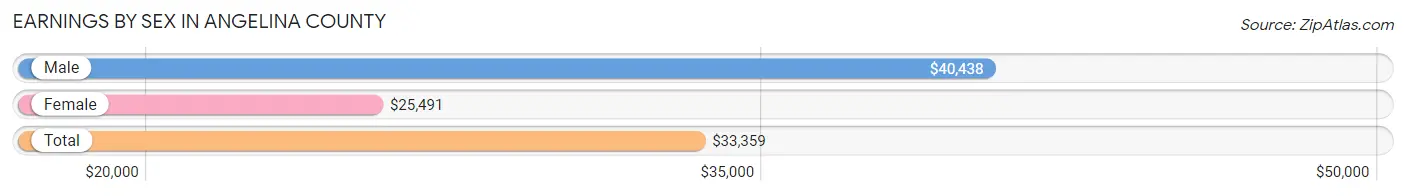
| Sex | Number | Average Earnings |
| Male | 21,373 (51.5%) | $40,438 |
| Female | 20,084 (48.4%) | $25,491 |
| Total | 41,457 (100.0%) | $33,359 |
Earnings by Sex by Income Bracket in Angelina County
The most common earnings brackets in Angelina County are $100,000+ for men (2,621 | 12.3%) and $25,000 to $29,999 for women (1,682 | 8.4%).
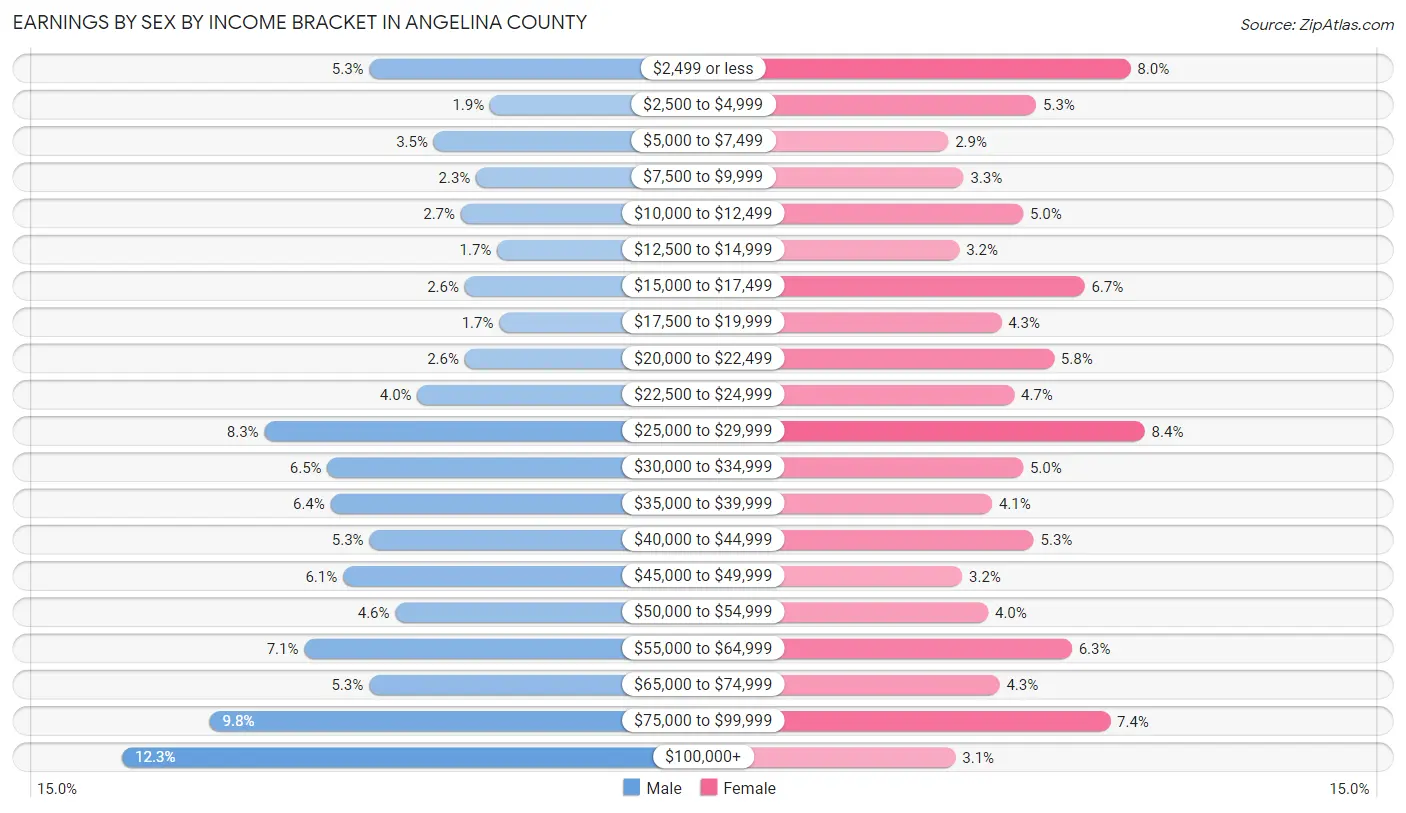
| Income | Male | Female |
| $2,499 or less | 1,134 (5.3%) | 1,600 (8.0%) |
| $2,500 to $4,999 | 411 (1.9%) | 1,069 (5.3%) |
| $5,000 to $7,499 | 749 (3.5%) | 573 (2.9%) |
| $7,500 to $9,999 | 493 (2.3%) | 658 (3.3%) |
| $10,000 to $12,499 | 585 (2.7%) | 994 (5.0%) |
| $12,500 to $14,999 | 368 (1.7%) | 635 (3.2%) |
| $15,000 to $17,499 | 562 (2.6%) | 1,342 (6.7%) |
| $17,500 to $19,999 | 355 (1.7%) | 872 (4.3%) |
| $20,000 to $22,499 | 563 (2.6%) | 1,169 (5.8%) |
| $22,500 to $24,999 | 847 (4.0%) | 944 (4.7%) |
| $25,000 to $29,999 | 1,765 (8.3%) | 1,682 (8.4%) |
| $30,000 to $34,999 | 1,388 (6.5%) | 994 (5.0%) |
| $35,000 to $39,999 | 1,368 (6.4%) | 820 (4.1%) |
| $40,000 to $44,999 | 1,135 (5.3%) | 1,054 (5.2%) |
| $45,000 to $49,999 | 1,292 (6.0%) | 651 (3.2%) |
| $50,000 to $54,999 | 978 (4.6%) | 797 (4.0%) |
| $55,000 to $64,999 | 1,526 (7.1%) | 1,269 (6.3%) |
| $65,000 to $74,999 | 1,138 (5.3%) | 862 (4.3%) |
| $75,000 to $99,999 | 2,095 (9.8%) | 1,487 (7.4%) |
| $100,000+ | 2,621 (12.3%) | 612 (3.0%) |
| Total | 21,373 (100.0%) | 20,084 (100.0%) |
Earnings by Sex by Educational Attainment in Angelina County
Average earnings in Angelina County are $46,662 for men and $29,482 for women, a difference of 36.8%. Men with an educational attainment of graduate degree enjoy the highest average annual earnings of $100,244, while those with less than high school education earn the least with $36,213. Women with an educational attainment of graduate degree earn the most with the average annual earnings of $60,672, while those with less than high school education have the smallest earnings of $17,489.
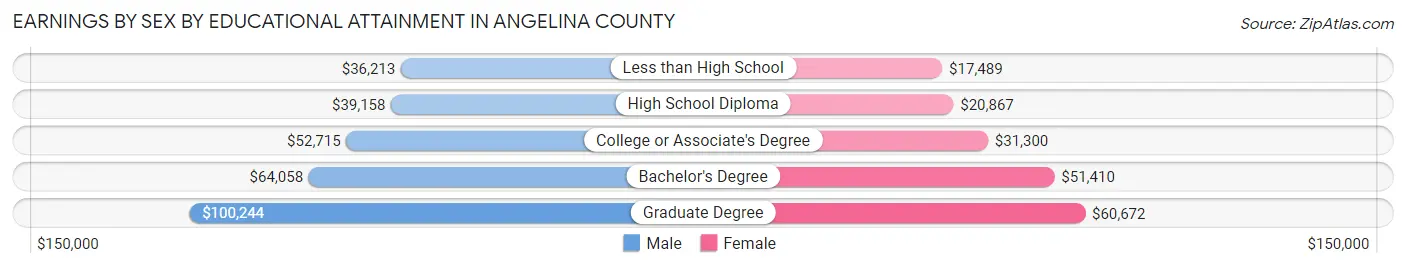
| Educational Attainment | Male Income | Female Income |
| Less than High School | $36,213 | $17,489 |
| High School Diploma | $39,158 | $20,867 |
| College or Associate's Degree | $52,715 | $31,300 |
| Bachelor's Degree | $64,058 | $51,410 |
| Graduate Degree | $100,244 | $60,672 |
| Total | $46,662 | $29,482 |
Family Income in Angelina County
Family Income Brackets in Angelina County
According to the Angelina County family income data, there are 4,669 families falling into the $50,000 to $74,999 income range, which is the most common income bracket and makes up 20.8% of all families. Conversely, the $10,000 to $14,999 income bracket is the least frequent group with only 584 families (2.6%) belonging to this category.
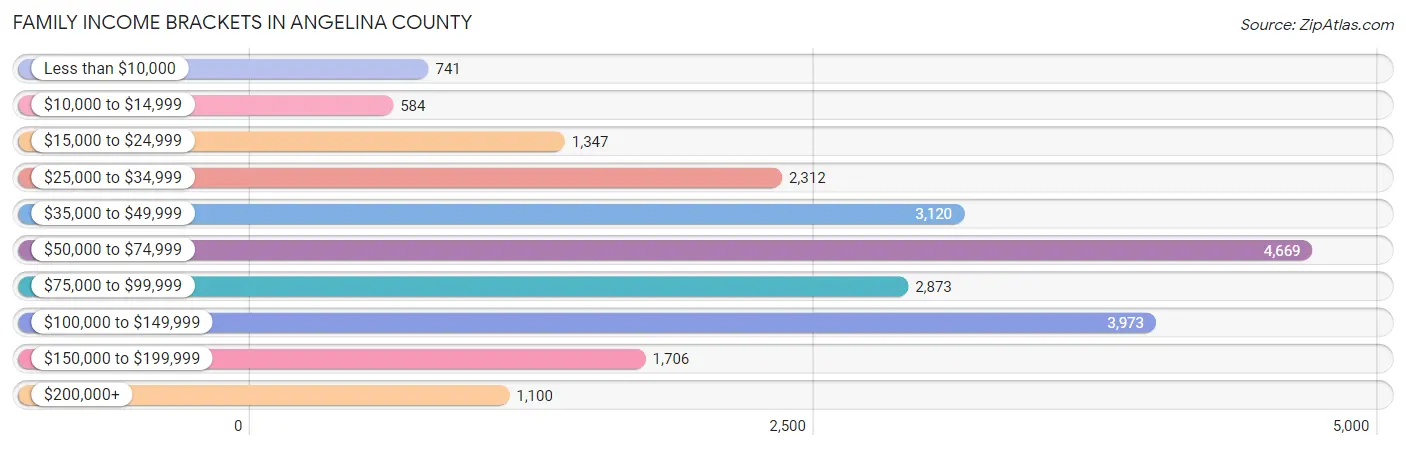
| Income Bracket | # Families | % Families |
| Less than $10,000 | 741 | 3.3% |
| $10,000 to $14,999 | 584 | 2.6% |
| $15,000 to $24,999 | 1,347 | 6.0% |
| $25,000 to $34,999 | 2,312 | 10.3% |
| $35,000 to $49,999 | 3,120 | 13.9% |
| $50,000 to $74,999 | 4,669 | 20.8% |
| $75,000 to $99,999 | 2,873 | 12.8% |
| $100,000 to $149,999 | 3,973 | 17.7% |
| $150,000 to $199,999 | 1,706 | 7.6% |
| $200,000+ | 1,100 | 4.9% |
Family Income by Famaliy Size in Angelina County
3-person families (5,088 | 22.7%) account for the highest median family income in Angelina County with $77,951 per family, while 2-person families (10,429 | 46.5%) have the highest median income of $28,558 per family member.
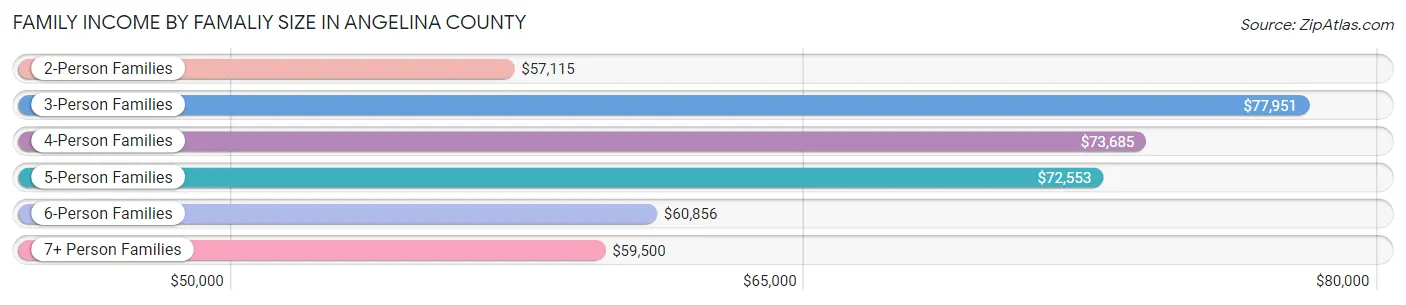
| Income Bracket | # Families | Median Income |
| 2-Person Families | 10,429 (46.5%) | $57,115 |
| 3-Person Families | 5,088 (22.7%) | $77,951 |
| 4-Person Families | 3,421 (15.2%) | $73,685 |
| 5-Person Families | 2,218 (9.9%) | $72,553 |
| 6-Person Families | 849 (3.8%) | $60,856 |
| 7+ Person Families | 440 (2.0%) | $59,500 |
| Total | 22,445 (100.0%) | $66,502 |
Family Income by Number of Earners in Angelina County
The median family income in Angelina County is $66,502, with families comprising 3+ earners (2,012) having the highest median family income of $124,792, while families with no earners (3,637) have the lowest median family income of $40,513, accounting for 9.0% and 16.2% of families, respectively.
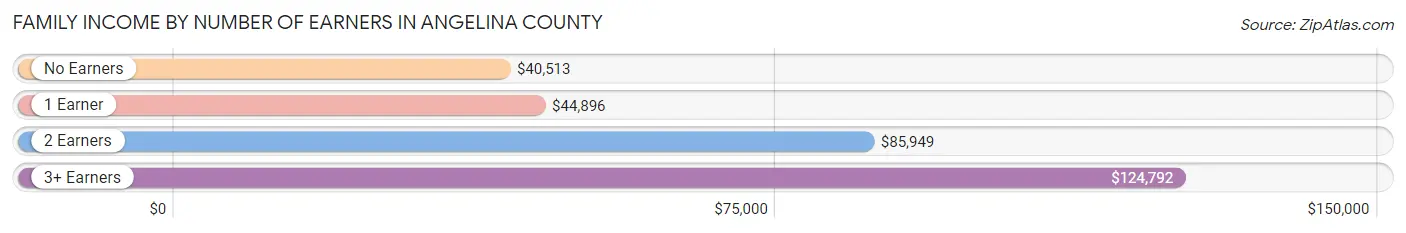
| Number of Earners | # Families | Median Income |
| No Earners | 3,637 (16.2%) | $40,513 |
| 1 Earner | 7,355 (32.8%) | $44,896 |
| 2 Earners | 9,441 (42.1%) | $85,949 |
| 3+ Earners | 2,012 (9.0%) | $124,792 |
| Total | 22,445 (100.0%) | $66,502 |
Household Income in Angelina County
Household Income Brackets in Angelina County
With 5,874 households falling in the category, the $50,000 to $74,999 income range is the most frequent in Angelina County, accounting for 18.6% of all households. In contrast, only 1,200 households (3.8%) fall into the $200,000+ income bracket, making it the least populous group.
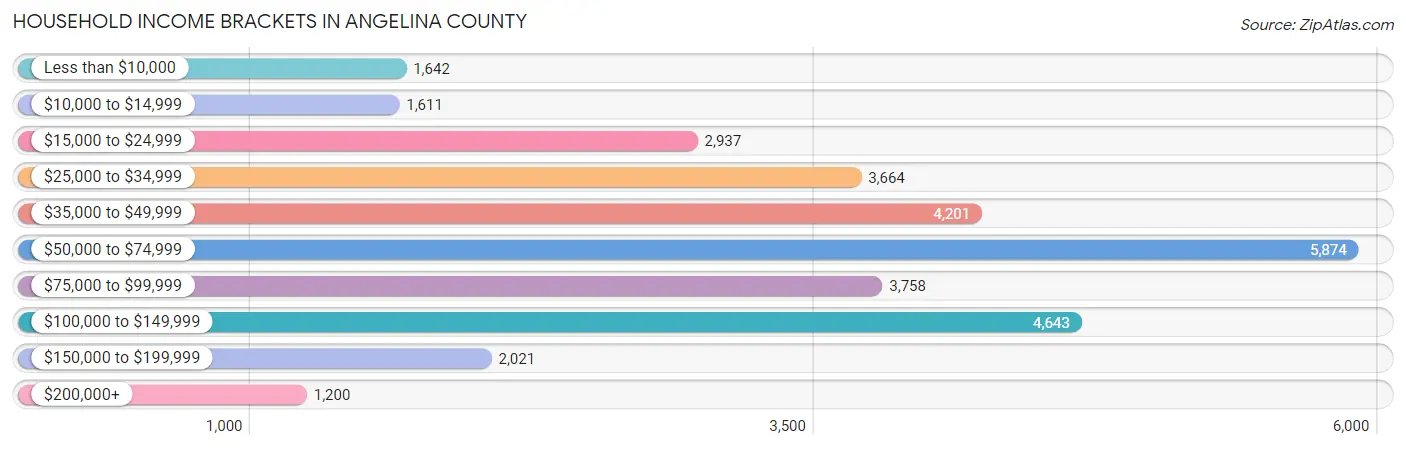
| Income Bracket | # Households | % Households |
| Less than $10,000 | 1,642 | 5.2% |
| $10,000 to $14,999 | 1,611 | 5.1% |
| $15,000 to $24,999 | 2,937 | 9.3% |
| $25,000 to $34,999 | 3,664 | 11.6% |
| $35,000 to $49,999 | 4,201 | 13.3% |
| $50,000 to $74,999 | 5,874 | 18.6% |
| $75,000 to $99,999 | 3,758 | 11.9% |
| $100,000 to $149,999 | 4,643 | 14.7% |
| $150,000 to $199,999 | 2,021 | 6.4% |
| $200,000+ | 1,200 | 3.8% |
Household Income by Householder Age in Angelina County
The median household income in Angelina County is $57,055, with the highest median household income of $68,277 found in the 25 to 44 years age bracket for the primary householder. A total of 9,917 households (31.4%) fall into this category. Meanwhile, the 15 to 24 years age bracket for the primary householder has the lowest median household income of $37,572, with 1,754 households (5.6%) in this group.
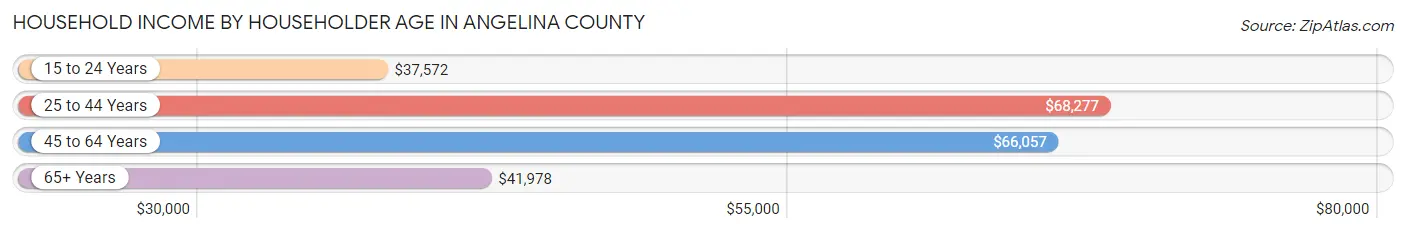
| Income Bracket | # Households | Median Income |
| 15 to 24 Years | 1,754 (5.6%) | $37,572 |
| 25 to 44 Years | 9,917 (31.4%) | $68,277 |
| 45 to 64 Years | 11,699 (37.0%) | $66,057 |
| 65+ Years | 8,213 (26.0%) | $41,978 |
| Total | 31,583 (100.0%) | $57,055 |
Poverty in Angelina County
Income Below Poverty by Sex and Age in Angelina County
With 14.9% poverty level for males and 17.2% for females among the residents of Angelina County, 6 to 11 year old males and 5 year old females are the most vulnerable to poverty, with 1,018 males (28.1%) and 163 females (26.9%) in their respective age groups living below the poverty level.
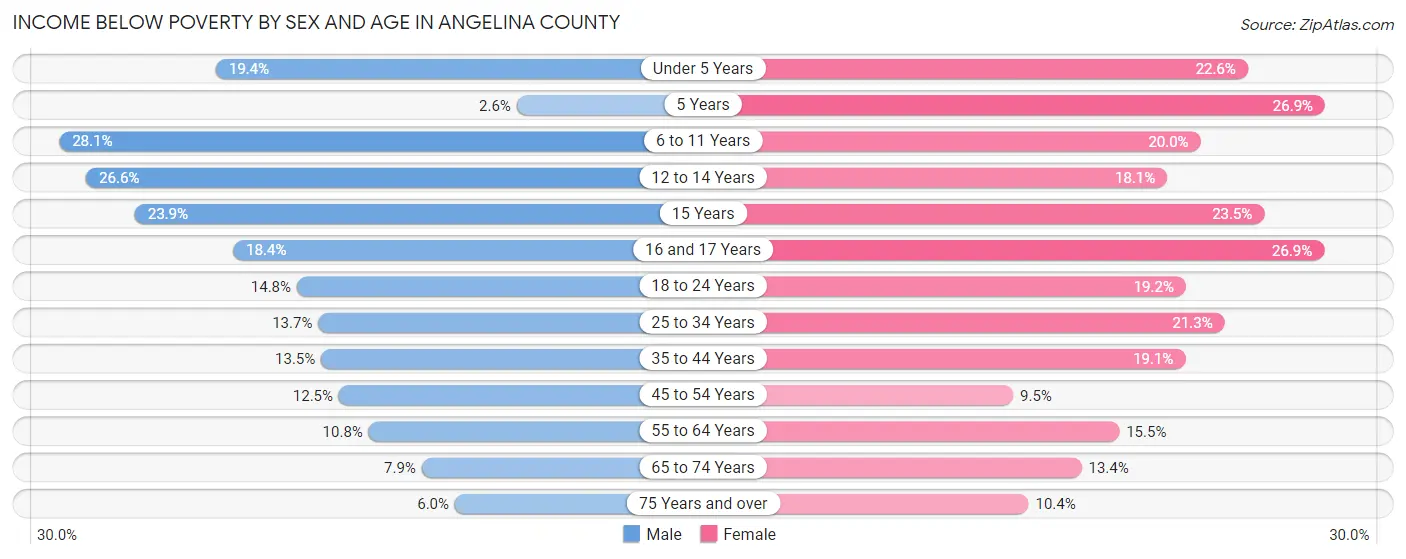
| Age Bracket | Male | Female |
| Under 5 Years | 557 (19.4%) | 614 (22.6%) |
| 5 Years | 11 (2.6%) | 163 (26.9%) |
| 6 to 11 Years | 1,018 (28.1%) | 785 (20.0%) |
| 12 to 14 Years | 576 (26.6%) | 261 (18.1%) |
| 15 Years | 172 (23.9%) | 187 (23.5%) |
| 16 and 17 Years | 226 (18.4%) | 297 (26.9%) |
| 18 to 24 Years | 577 (14.8%) | 713 (19.2%) |
| 25 to 34 Years | 712 (13.7%) | 1,183 (21.3%) |
| 35 to 44 Years | 669 (13.5%) | 999 (19.1%) |
| 45 to 54 Years | 629 (12.5%) | 505 (9.5%) |
| 55 to 64 Years | 555 (10.8%) | 819 (15.4%) |
| 65 to 74 Years | 272 (7.9%) | 576 (13.4%) |
| 75 Years and over | 135 (6.0%) | 325 (10.4%) |
| Total | 6,109 (14.9%) | 7,427 (17.2%) |
Income Above Poverty by Sex and Age in Angelina County
According to the poverty statistics in Angelina County, males aged 5 years and females aged 45 to 54 years are the age groups that are most secure financially, with 97.4% of males and 90.5% of females in these age groups living above the poverty line.
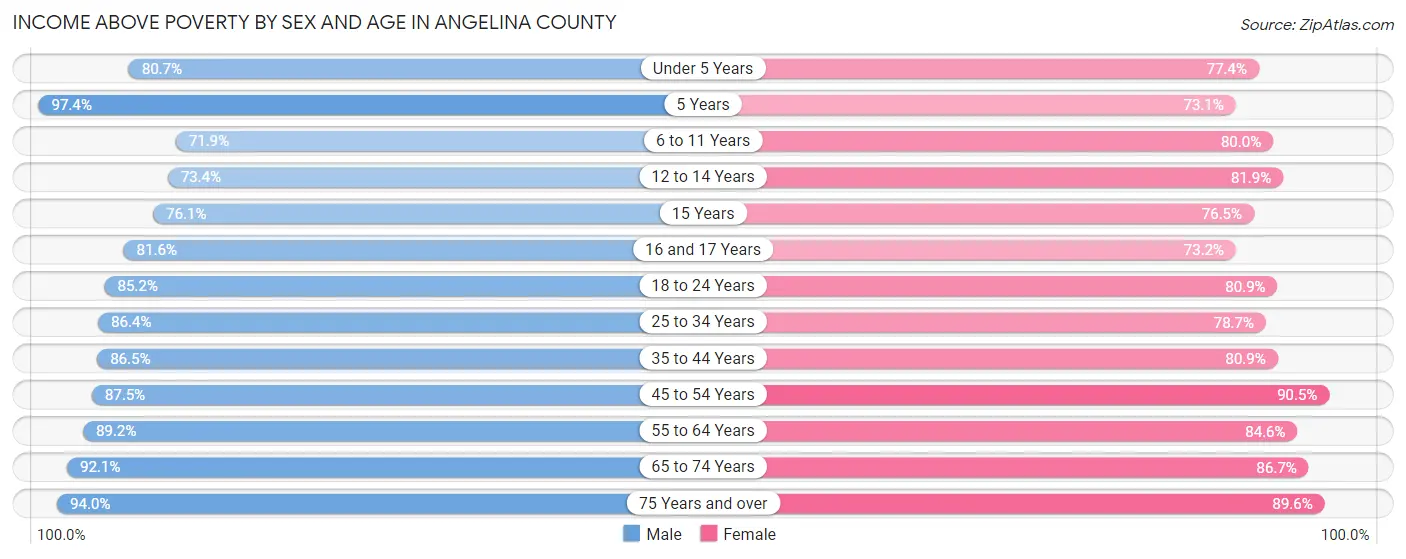
| Age Bracket | Male | Female |
| Under 5 Years | 2,321 (80.6%) | 2,103 (77.4%) |
| 5 Years | 412 (97.4%) | 443 (73.1%) |
| 6 to 11 Years | 2,609 (71.9%) | 3,146 (80.0%) |
| 12 to 14 Years | 1,592 (73.4%) | 1,180 (81.9%) |
| 15 Years | 549 (76.1%) | 608 (76.5%) |
| 16 and 17 Years | 1,003 (81.6%) | 809 (73.2%) |
| 18 to 24 Years | 3,311 (85.2%) | 3,011 (80.8%) |
| 25 to 34 Years | 4,503 (86.4%) | 4,368 (78.7%) |
| 35 to 44 Years | 4,289 (86.5%) | 4,226 (80.9%) |
| 45 to 54 Years | 4,405 (87.5%) | 4,788 (90.5%) |
| 55 to 64 Years | 4,566 (89.2%) | 4,483 (84.6%) |
| 65 to 74 Years | 3,175 (92.1%) | 3,740 (86.7%) |
| 75 Years and over | 2,099 (94.0%) | 2,800 (89.6%) |
| Total | 34,834 (85.1%) | 35,705 (82.8%) |
Income Below Poverty Among Married-Couple Families in Angelina County
The poverty statistics for married-couple families in Angelina County show that 4.8% or 720 of the total 15,137 families live below the poverty line. Families with 5 or more children have the highest poverty rate of 62.5%, comprising of 100 families. On the other hand, families with 1 or 2 children have the lowest poverty rate of 2.0%, which includes 93 families.
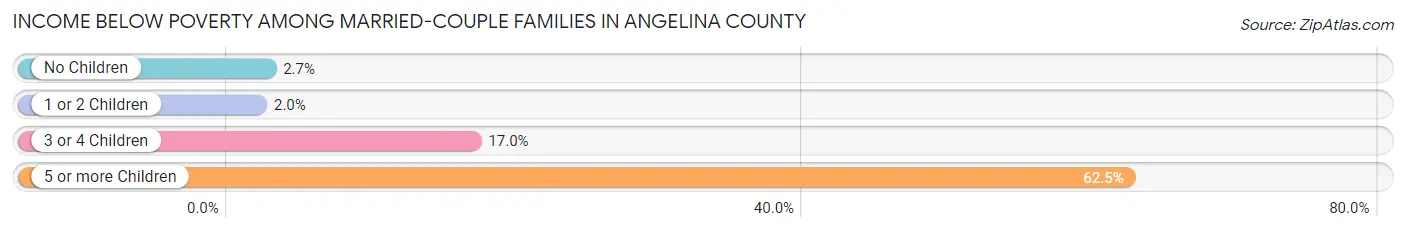
| Children | Above Poverty | Below Poverty |
| No Children | 8,393 (97.3%) | 229 (2.7%) |
| 1 or 2 Children | 4,504 (98.0%) | 93 (2.0%) |
| 3 or 4 Children | 1,460 (83.1%) | 298 (17.0%) |
| 5 or more Children | 60 (37.5%) | 100 (62.5%) |
| Total | 14,417 (95.2%) | 720 (4.8%) |
Income Below Poverty Among Single-Parent Households in Angelina County
According to the poverty data in Angelina County, 13.6% or 235 single-father households and 28.1% or 1,566 single-mother households are living below the poverty line. Among single-father households, those with 5 or more children have the highest poverty rate, with 9 households (100.0%) experiencing poverty. Likewise, among single-mother households, those with 3 or 4 children have the highest poverty rate, with 392 households (62.2%) falling below the poverty line.
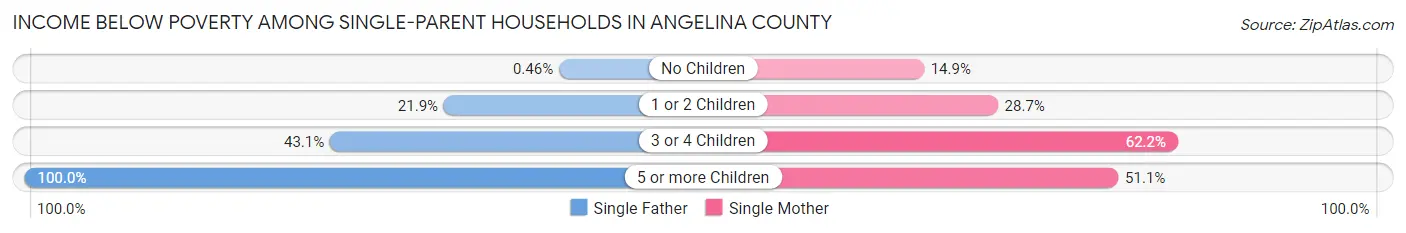
| Children | Single Father | Single Mother |
| No Children | 4 (0.5%) | 298 (14.9%) |
| 1 or 2 Children | 150 (21.9%) | 808 (28.7%) |
| 3 or 4 Children | 72 (43.1%) | 392 (62.2%) |
| 5 or more Children | 9 (100.0%) | 68 (51.1%) |
| Total | 235 (13.6%) | 1,566 (28.1%) |
Income Below Poverty Among Married-Couple vs Single-Parent Households in Angelina County
The poverty data for Angelina County shows that 720 of the married-couple family households (4.8%) and 1,801 of the single-parent households (24.6%) are living below the poverty level. Within the married-couple family households, those with 5 or more children have the highest poverty rate, with 100 households (62.5%) falling below the poverty line. Among the single-parent households, those with 3 or 4 children have the highest poverty rate, with 464 household (58.2%) living below poverty.
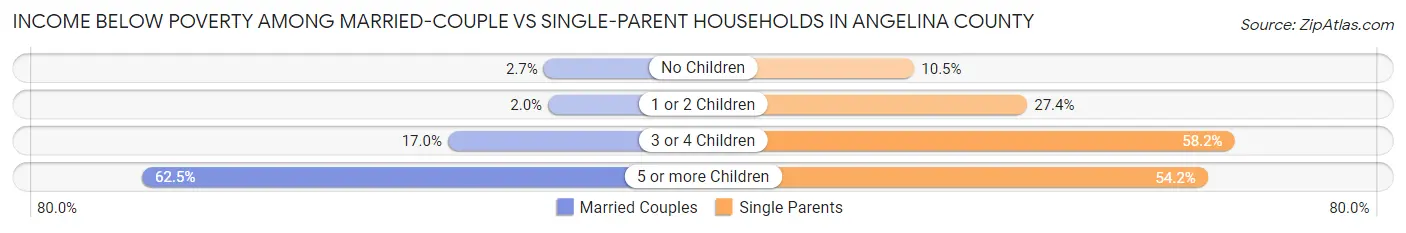
| Children | Married-Couple Families | Single-Parent Households |
| No Children | 229 (2.7%) | 302 (10.5%) |
| 1 or 2 Children | 93 (2.0%) | 958 (27.4%) |
| 3 or 4 Children | 298 (17.0%) | 464 (58.2%) |
| 5 or more Children | 100 (62.5%) | 77 (54.2%) |
| Total | 720 (4.8%) | 1,801 (24.6%) |
Race in Angelina County
The most populous races in Angelina County are White / Caucasian (61,095 | 70.5%), Hispanic or Latino (19,893 | 23.0%), and Black / African American (10,924 | 12.6%).
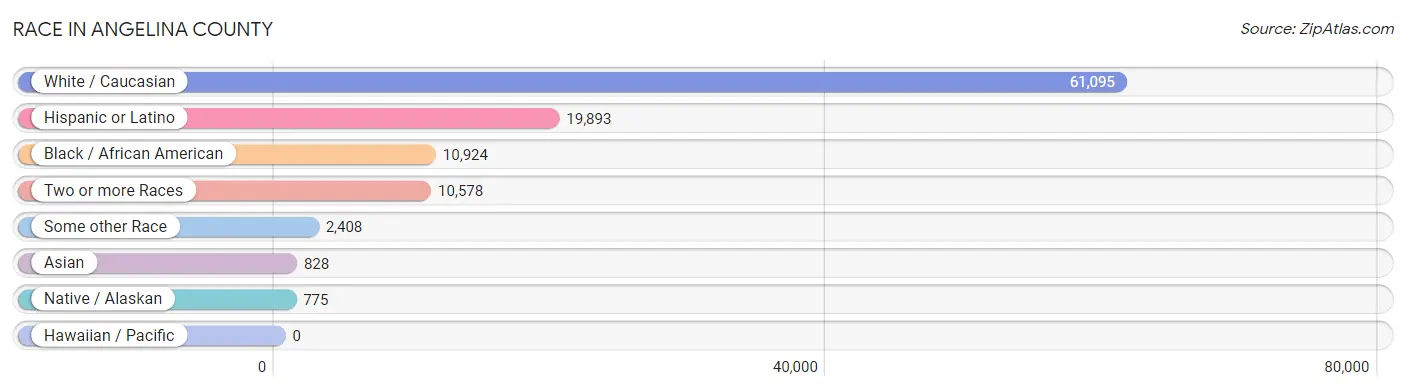
| Race | # Population | % Population |
| Asian | 828 | 1.0% |
| Black / African American | 10,924 | 12.6% |
| Hawaiian / Pacific | 0 | 0.0% |
| Hispanic or Latino | 19,893 | 23.0% |
| Native / Alaskan | 775 | 0.9% |
| White / Caucasian | 61,095 | 70.5% |
| Two or more Races | 10,578 | 12.2% |
| Some other Race | 2,408 | 2.8% |
| Total | 86,608 | 100.0% |
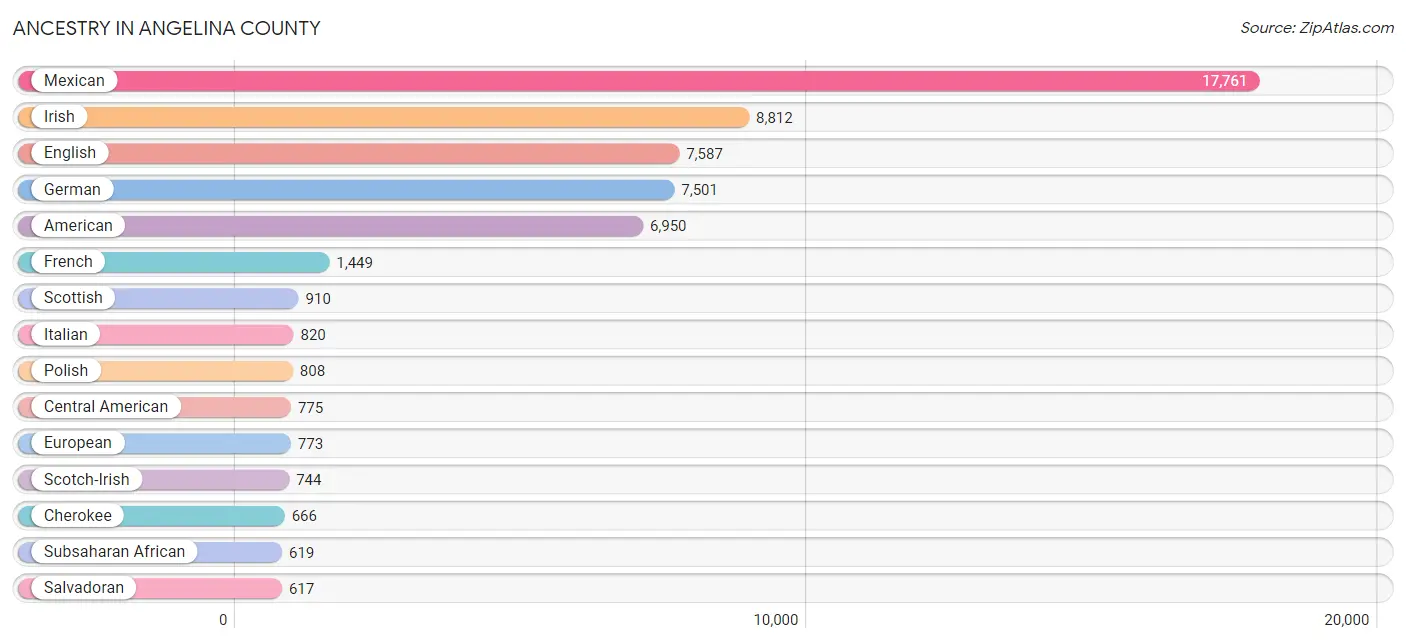
Ancestry in Angelina County
The most populous ancestries reported in Angelina County are Mexican (17,761 | 20.5%), Irish (8,812 | 10.2%), English (7,587 | 8.8%), German (7,501 | 8.7%), and American (6,950 | 8.0%), together accounting for 56.1% of all Angelina County residents.
| Ancestry | # Population | % Population |
| African | 468 | 0.5% |
| American | 6,950 | 8.0% |
| Apache | 2 | 0.0% |
| Arab | 106 | 0.1% |
| Argentinean | 1 | 0.0% |
| Australian | 12 | 0.0% |
| Austrian | 58 | 0.1% |
| Bahamian | 6 | 0.0% |
| Bangladeshi | 12 | 0.0% |
| Belgian | 27 | 0.0% |
| Bhutanese | 69 | 0.1% |
| Blackfeet | 50 | 0.1% |
| British | 355 | 0.4% |
| Burmese | 25 | 0.0% |
| Cajun | 125 | 0.1% |
| Canadian | 76 | 0.1% |
| Central American | 775 | 0.9% |
| Central American Indian | 65 | 0.1% |
| Cherokee | 666 | 0.8% |
| Chinese | 35 | 0.0% |
| Choctaw | 23 | 0.0% |
| Comanche | 11 | 0.0% |
| Costa Rican | 11 | 0.0% |
| Croatian | 21 | 0.0% |
| Cuban | 39 | 0.1% |
| Czech | 452 | 0.5% |
| Czechoslovakian | 84 | 0.1% |
| Danish | 105 | 0.1% |
| Dominican | 217 | 0.3% |
| Dutch | 427 | 0.5% |
| Dutch West Indian | 14 | 0.0% |
| Eastern European | 209 | 0.2% |
| Egyptian | 33 | 0.0% |
| English | 7,587 | 8.8% |
| European | 773 | 0.9% |
| French | 1,449 | 1.7% |
| French American Indian | 13 | 0.0% |
| French Canadian | 515 | 0.6% |
| German | 7,501 | 8.7% |
| German Russian | 7 | 0.0% |
| Greek | 15 | 0.0% |
| Guatemalan | 59 | 0.1% |
| Haitian | 36 | 0.0% |
| Honduran | 88 | 0.1% |
| Hungarian | 47 | 0.1% |
| Indian (Asian) | 134 | 0.2% |
| Inupiat | 38 | 0.0% |
| Irish | 8,812 | 10.2% |
| Italian | 820 | 0.9% |
| Korean | 402 | 0.5% |
| Latvian | 29 | 0.0% |
| Lebanese | 16 | 0.0% |
| Liberian | 36 | 0.0% |
| Mexican | 17,761 | 20.5% |
| Mexican American Indian | 215 | 0.3% |
| Navajo | 212 | 0.2% |
| Nigerian | 51 | 0.1% |
| Northern European | 2 | 0.0% |
| Norwegian | 474 | 0.5% |
| Pakistani | 62 | 0.1% |
| Palestinian | 57 | 0.1% |
| Pennsylvania German | 115 | 0.1% |
| Peruvian | 7 | 0.0% |
| Pima | 5 | 0.0% |
| Polish | 808 | 0.9% |
| Portuguese | 11 | 0.0% |
| Puerto Rican | 275 | 0.3% |
| Salvadoran | 617 | 0.7% |
| Scandinavian | 39 | 0.1% |
| Scotch-Irish | 744 | 0.9% |
| Scottish | 910 | 1.1% |
| Seminole | 8 | 0.0% |
| South American | 51 | 0.1% |
| Spaniard | 132 | 0.2% |
| Spanish | 292 | 0.3% |
| Spanish American Indian | 97 | 0.1% |
| Sri Lankan | 180 | 0.2% |
| Subsaharan African | 619 | 0.7% |
| Swedish | 343 | 0.4% |
| Swiss | 148 | 0.2% |
| Thai | 111 | 0.1% |
| Tongan | 12 | 0.0% |
| Turkish | 56 | 0.1% |
| Ukrainian | 19 | 0.0% |
| Venezuelan | 43 | 0.1% |
| Welsh | 244 | 0.3% |
| Yugoslavian | 9 | 0.0% | View All 87 Rows |
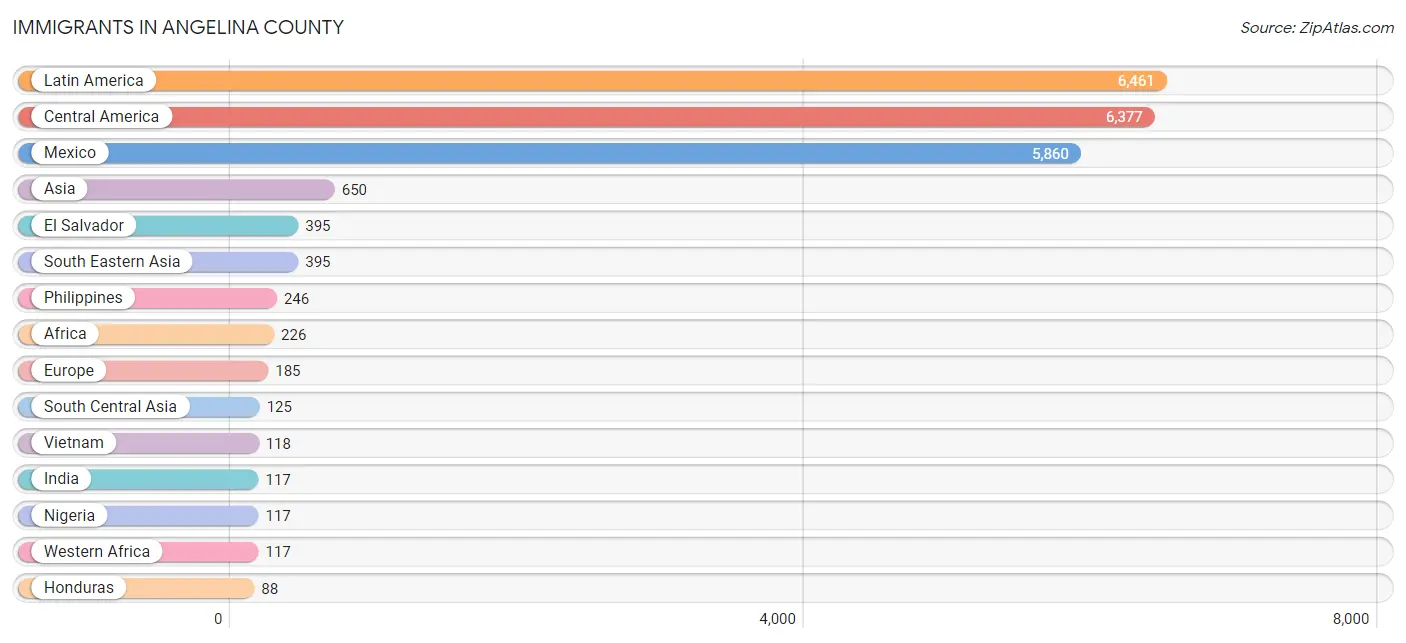
Immigrants in Angelina County
The most numerous immigrant groups reported in Angelina County came from Latin America (6,461 | 7.5%), Central America (6,377 | 7.4%), Mexico (5,860 | 6.8%), Asia (650 | 0.7%), and El Salvador (395 | 0.5%), together accounting for 22.8% of all Angelina County residents.
| Immigration Origin | # Population | % Population |
| Africa | 226 | 0.3% |
| Argentina | 1 | 0.0% |
| Asia | 650 | 0.7% |
| Bahamas | 6 | 0.0% |
| Canada | 33 | 0.0% |
| Caribbean | 50 | 0.1% |
| Central America | 6,377 | 7.4% |
| China | 9 | 0.0% |
| Costa Rica | 11 | 0.0% |
| Cuba | 44 | 0.1% |
| Eastern Africa | 38 | 0.0% |
| Eastern Asia | 72 | 0.1% |
| Eastern Europe | 12 | 0.0% |
| Egypt | 33 | 0.0% |
| El Salvador | 395 | 0.5% |
| England | 40 | 0.1% |
| Europe | 185 | 0.2% |
| France | 27 | 0.0% |
| Germany | 35 | 0.0% |
| Guatemala | 23 | 0.0% |
| Honduras | 88 | 0.1% |
| India | 117 | 0.1% |
| Iran | 8 | 0.0% |
| Japan | 38 | 0.0% |
| Kenya | 26 | 0.0% |
| Korea | 25 | 0.0% |
| Latin America | 6,461 | 7.5% |
| Latvia | 12 | 0.0% |
| Mexico | 5,860 | 6.8% |
| Nigeria | 117 | 0.1% |
| Northern Africa | 33 | 0.0% |
| Northern Europe | 57 | 0.1% |
| Norway | 1 | 0.0% |
| Philippines | 246 | 0.3% |
| South America | 34 | 0.0% |
| South Central Asia | 125 | 0.1% |
| South Eastern Asia | 395 | 0.5% |
| Southern Europe | 54 | 0.1% |
| Spain | 54 | 0.1% |
| Thailand | 31 | 0.0% |
| Turkey | 1 | 0.0% |
| Venezuela | 33 | 0.0% |
| Vietnam | 118 | 0.1% |
| Western Africa | 117 | 0.1% |
| Western Asia | 1 | 0.0% |
| Western Europe | 62 | 0.1% | View All 46 Rows |
Sex and Age in Angelina County
Sex and Age in Angelina County
The most populous age groups in Angelina County are 10 to 14 Years (3,939 | 9.2%) for men and 15 to 19 Years (3,297 | 7.5%) for women.
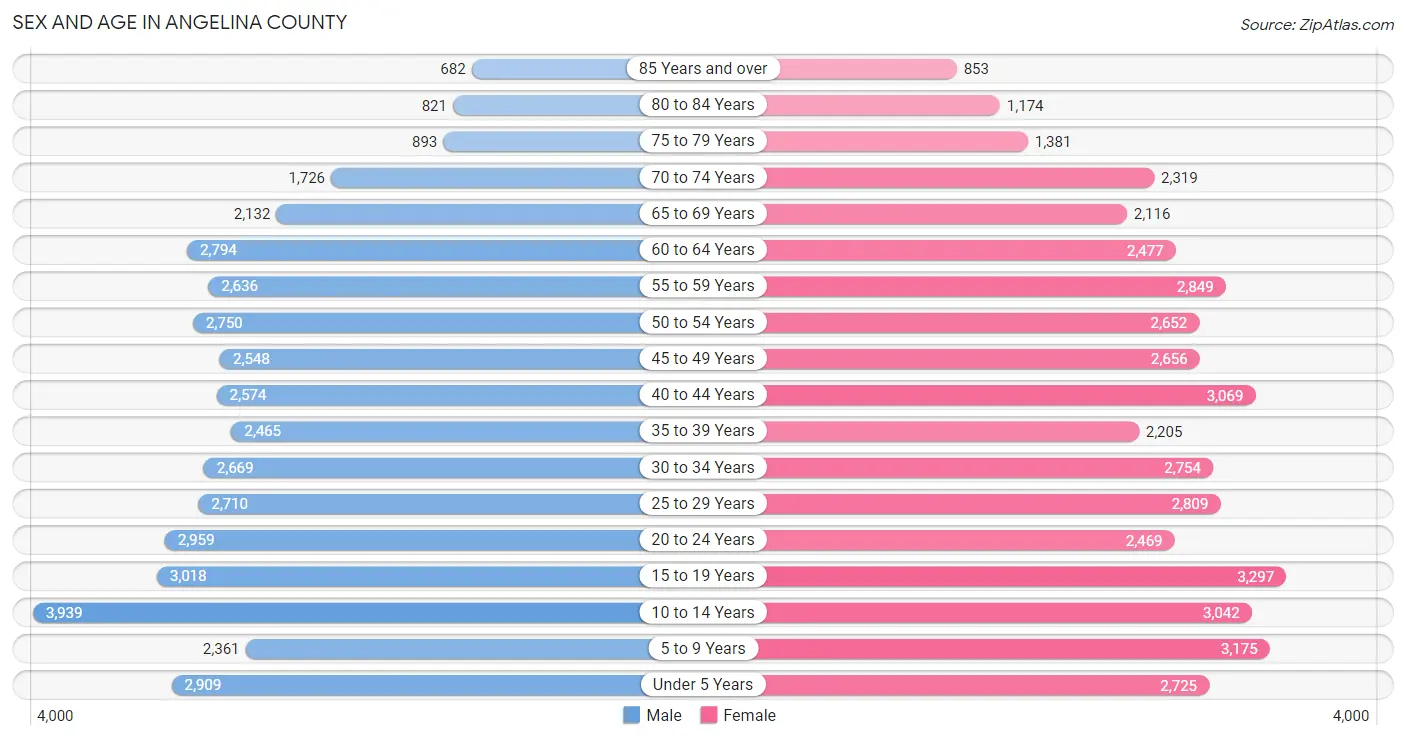
| Age Bracket | Male | Female |
| Under 5 Years | 2,909 (6.8%) | 2,725 (6.2%) |
| 5 to 9 Years | 2,361 (5.5%) | 3,175 (7.2%) |
| 10 to 14 Years | 3,939 (9.2%) | 3,042 (6.9%) |
| 15 to 19 Years | 3,018 (7.1%) | 3,297 (7.5%) |
| 20 to 24 Years | 2,959 (7.0%) | 2,469 (5.6%) |
| 25 to 29 Years | 2,710 (6.4%) | 2,809 (6.4%) |
| 30 to 34 Years | 2,669 (6.3%) | 2,754 (6.3%) |
| 35 to 39 Years | 2,465 (5.8%) | 2,205 (5.0%) |
| 40 to 44 Years | 2,574 (6.0%) | 3,069 (7.0%) |
| 45 to 49 Years | 2,548 (6.0%) | 2,656 (6.0%) |
| 50 to 54 Years | 2,750 (6.5%) | 2,652 (6.0%) |
| 55 to 59 Years | 2,636 (6.2%) | 2,849 (6.5%) |
| 60 to 64 Years | 2,794 (6.6%) | 2,477 (5.6%) |
| 65 to 69 Years | 2,132 (5.0%) | 2,116 (4.8%) |
| 70 to 74 Years | 1,726 (4.1%) | 2,319 (5.3%) |
| 75 to 79 Years | 893 (2.1%) | 1,381 (3.1%) |
| 80 to 84 Years | 821 (1.9%) | 1,174 (2.7%) |
| 85 Years and over | 682 (1.6%) | 853 (1.9%) |
| Total | 42,586 (100.0%) | 44,022 (100.0%) |
Families and Households in Angelina County
Median Family Size in Angelina County
The median family size in Angelina County is 3.14 persons per family, with married-couple families (15,137 | 67.4%) accounting for the largest median family size of 3.2 persons per family. On the other hand, single male/father families (1,729 | 7.7%) represent the smallest median family size with 3.02 persons per family.
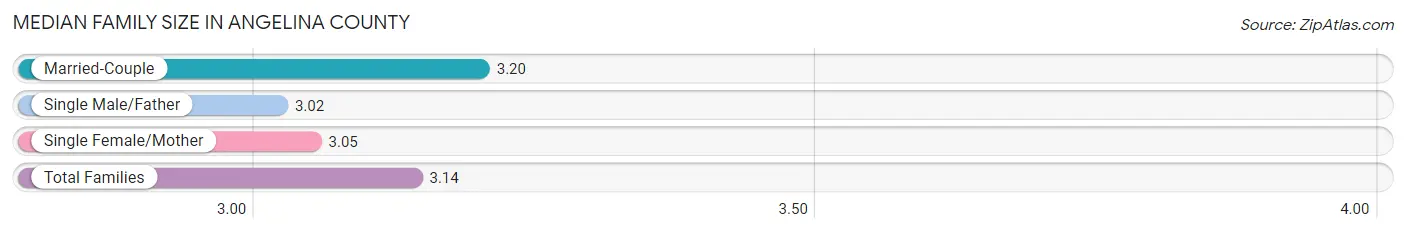
| Family Type | # Families | Family Size |
| Married-Couple | 15,137 (67.4%) | 3.20 |
| Single Male/Father | 1,729 (7.7%) | 3.02 |
| Single Female/Mother | 5,579 (24.9%) | 3.05 |
| Total Families | 22,445 (100.0%) | 3.14 |
Median Household Size in Angelina County
The median household size in Angelina County is 2.64 persons per household, with single male/father households (1,729 | 5.5%) accounting for the largest median household size of 3.34 persons per household. non-family households (9,138 | 28.9%) represent the smallest median household size with 1.21 persons per household.
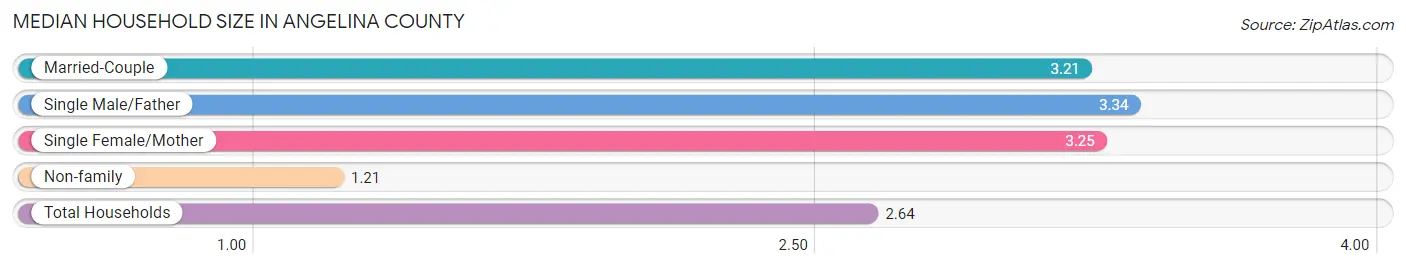
| Household Type | # Households | Household Size |
| Married-Couple | 15,137 (47.9%) | 3.21 |
| Single Male/Father | 1,729 (5.5%) | 3.34 |
| Single Female/Mother | 5,579 (17.7%) | 3.25 |
| Non-family | 9,138 (28.9%) | 1.21 |
| Total Households | 31,583 (100.0%) | 2.64 |
Household Size by Marriage Status in Angelina County
Out of a total of 31,583 households in Angelina County, 22,445 (71.1%) are family households, while 9,138 (28.9%) are nonfamily households. The most numerous type of family households are 2-person households, comprising 9,789, and the most common type of nonfamily households are 1-person households, comprising 7,823.
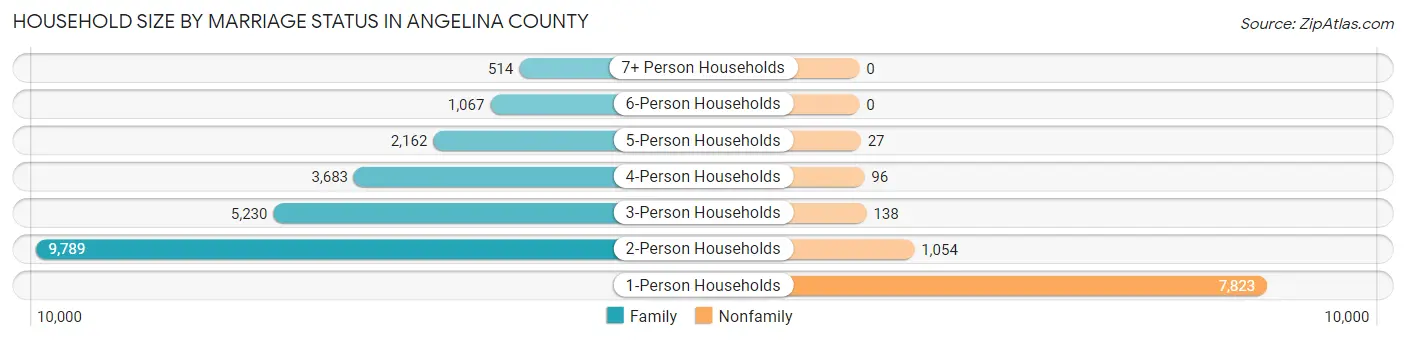
| Household Size | Family Households | Nonfamily Households |
| 1-Person Households | - | 7,823 (24.8%) |
| 2-Person Households | 9,789 (31.0%) | 1,054 (3.3%) |
| 3-Person Households | 5,230 (16.6%) | 138 (0.4%) |
| 4-Person Households | 3,683 (11.7%) | 96 (0.3%) |
| 5-Person Households | 2,162 (6.9%) | 27 (0.1%) |
| 6-Person Households | 1,067 (3.4%) | 0 (0.0%) |
| 7+ Person Households | 514 (1.6%) | 0 (0.0%) |
| Total | 22,445 (71.1%) | 9,138 (28.9%) |
Female Fertility in Angelina County
Fertility by Age in Angelina County
Average fertility rate in Angelina County is 40.0 births per 1,000 women. Women in the age bracket of 20 to 34 years have the highest fertility rate with 95.0 births per 1,000 women. Women in the age bracket of 20 to 34 years acount for 95.6% of all women with births.
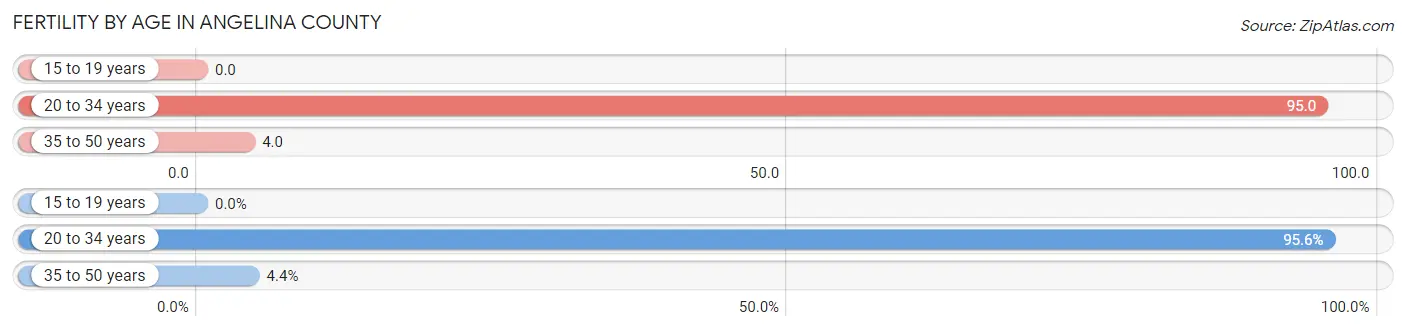
| Age Bracket | Women with Births | Births / 1,000 Women |
| 15 to 19 years | 0 (0.0%) | 0.0 |
| 20 to 34 years | 765 (95.6%) | 95.0 |
| 35 to 50 years | 35 (4.4%) | 4.0 |
| Total | 800 (100.0%) | 40.0 |
Fertility by Age by Marriage Status in Angelina County
57.8% of women with births (800) in Angelina County are married. The highest percentage of unmarried women with births falls into 35 to 50 years age bracket with 85.7% of them unmarried at the time of birth, while the lowest percentage of unmarried women with births belong to 20 to 34 years age bracket with 40.3% of them unmarried.
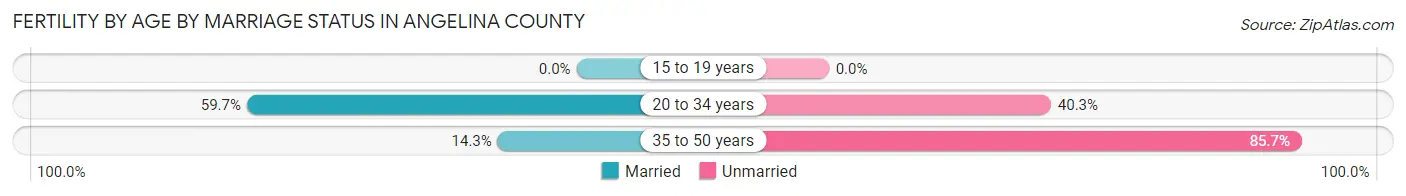
| Age Bracket | Married | Unmarried |
| 15 to 19 years | 0 (0.0%) | 0 (0.0%) |
| 20 to 34 years | 457 (59.7%) | 308 (40.3%) |
| 35 to 50 years | 5 (14.3%) | 30 (85.7%) |
| Total | 462 (57.8%) | 338 (42.2%) |
Fertility by Education in Angelina County
Average fertility rate in Angelina County is 40.0 births per 1,000 women. Women with the education attainment of college or associate's degree have the highest fertility rate of 62.0 births per 1,000 women, while women with the education attainment of graduate degree have the lowest fertility at 11.0 births per 1,000 women. Women with the education attainment of college or associate's degree represent 56.1% of all women with births.
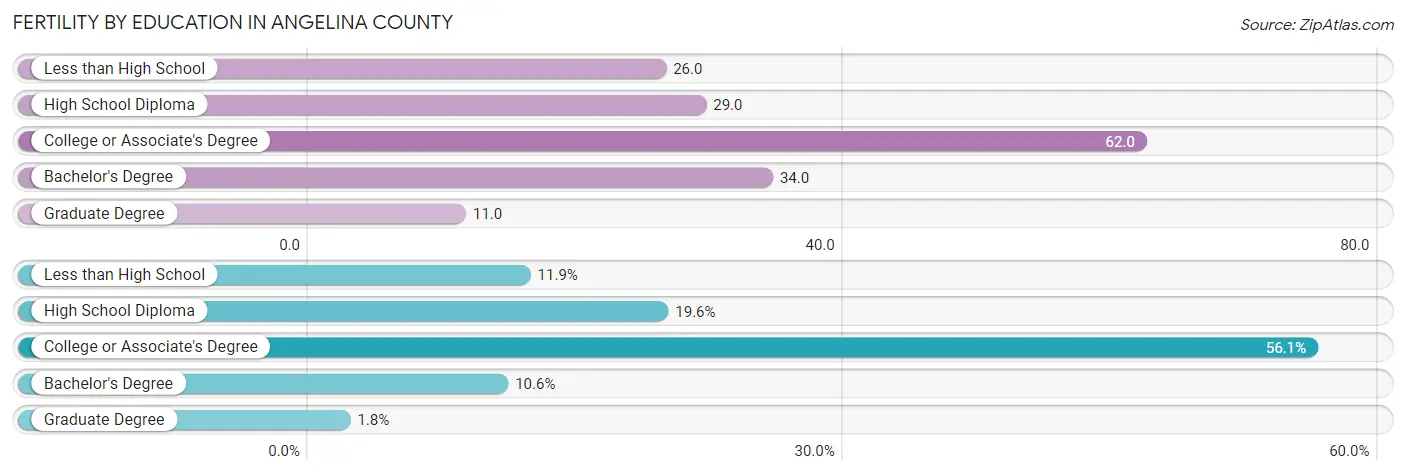
| Educational Attainment | Women with Births | Births / 1,000 Women |
| Less than High School | 95 (11.9%) | 26.0 |
| High School Diploma | 157 (19.6%) | 29.0 |
| College or Associate's Degree | 449 (56.1%) | 62.0 |
| Bachelor's Degree | 85 (10.6%) | 34.0 |
| Graduate Degree | 14 (1.8%) | 11.0 |
| Total | 800 (100.0%) | 40.0 |
Fertility by Education by Marriage Status in Angelina County
42.2% of women with births in Angelina County are unmarried. Women with the educational attainment of graduate degree are most likely to be married with 100.0% of them married at childbirth, while women with the educational attainment of less than high school are least likely to be married with 76.8% of them unmarried at childbirth.
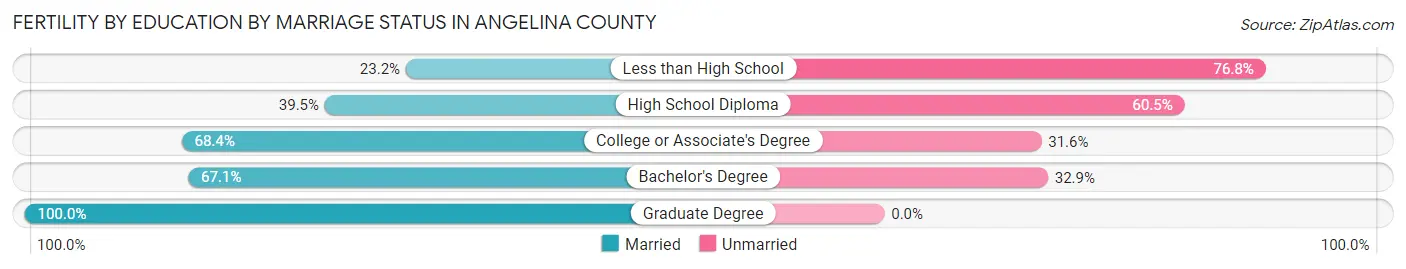
| Educational Attainment | Married | Unmarried |
| Less than High School | 22 (23.2%) | 73 (76.8%) |
| High School Diploma | 62 (39.5%) | 95 (60.5%) |
| College or Associate's Degree | 307 (68.4%) | 142 (31.6%) |
| Bachelor's Degree | 57 (67.1%) | 28 (32.9%) |
| Graduate Degree | 14 (100.0%) | 0 (0.0%) |
| Total | 462 (57.8%) | 338 (42.2%) |
Employment Characteristics in Angelina County
Employment by Class of Employer in Angelina County
Among the 36,669 employed individuals in Angelina County, private company employees (23,929 | 65.3%), local government employees (3,262 | 8.9%), and state government employees (2,848 | 7.8%) make up the most common classes of employment.
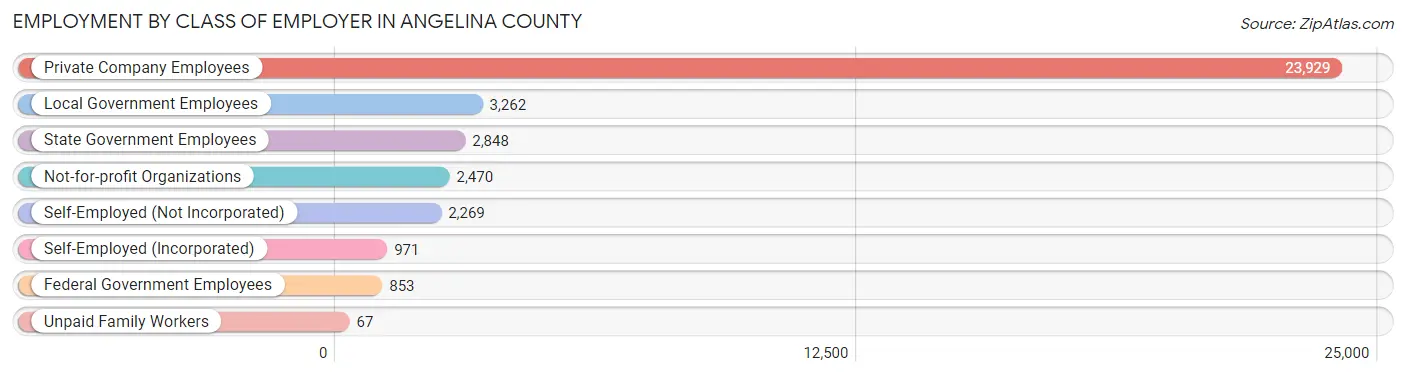
| Employer Class | # Employees | % Employees |
| Private Company Employees | 23,929 | 65.3% |
| Self-Employed (Incorporated) | 971 | 2.6% |
| Self-Employed (Not Incorporated) | 2,269 | 6.2% |
| Not-for-profit Organizations | 2,470 | 6.7% |
| Local Government Employees | 3,262 | 8.9% |
| State Government Employees | 2,848 | 7.8% |
| Federal Government Employees | 853 | 2.3% |
| Unpaid Family Workers | 67 | 0.2% |
| Total | 36,669 | 100.0% |
Employment Status by Age in Angelina County
According to the labor force statistics for Angelina County, out of the total population over 16 years of age (66,940), 59.4% or 39,762 individuals are in the labor force, with 6.0% or 2,386 of them unemployed. The age group with the highest labor force participation rate is 20 to 24 years, with 80.0% or 4,342 individuals in the labor force. Within the labor force, the 16 to 19 years age range has the highest percentage of unemployed individuals, with 24.4% or 547 of them being unemployed.
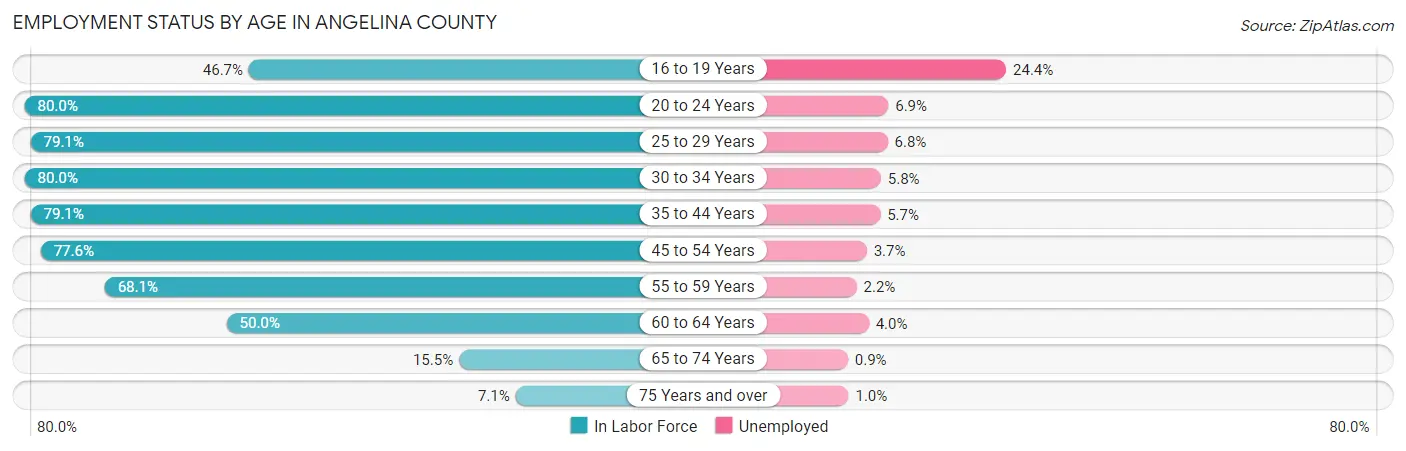
| Age Bracket | In Labor Force | Unemployed |
| 16 to 19 Years | 2,241 (46.7%) | 547 (24.4%) |
| 20 to 24 Years | 4,342 (80.0%) | 300 (6.9%) |
| 25 to 29 Years | 4,366 (79.1%) | 297 (6.8%) |
| 30 to 34 Years | 4,338 (80.0%) | 252 (5.8%) |
| 35 to 44 Years | 8,158 (79.1%) | 465 (5.7%) |
| 45 to 54 Years | 8,230 (77.6%) | 305 (3.7%) |
| 55 to 59 Years | 3,735 (68.1%) | 82 (2.2%) |
| 60 to 64 Years | 2,636 (50.0%) | 105 (4.0%) |
| 65 to 74 Years | 1,285 (15.5%) | 12 (0.9%) |
| 75 Years and over | 412 (7.1%) | 4 (1.0%) |
| Total | 39,762 (59.4%) | 2,386 (6.0%) |
Employment Status by Educational Attainment in Angelina County
According to labor force statistics for Angelina County, 73.8% of individuals (31,451) out of the total population between 25 and 64 years of age (42,617) are in the labor force, with 4.8% or 1,510 of them being unemployed. The group with the highest labor force participation rate are those with the educational attainment of bachelor's degree or higher, with 87.8% or 7,300 individuals in the labor force. Within the labor force, individuals with less than high school education have the highest percentage of unemployment, with 7.2% or 254 of them being unemployed.
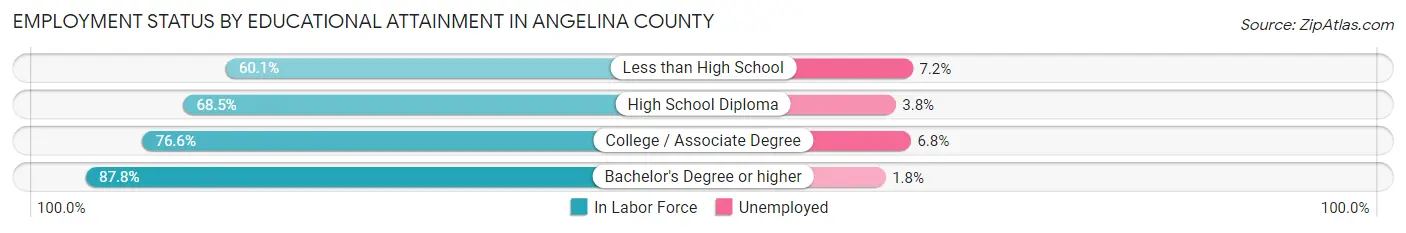
| Educational Attainment | In Labor Force | Unemployed |
| Less than High School | 3,531 (60.1%) | 423 (7.2%) |
| High School Diploma | 9,647 (68.5%) | 535 (3.8%) |
| College / Associate Degree | 10,988 (76.6%) | 975 (6.8%) |
| Bachelor's Degree or higher | 7,300 (87.8%) | 150 (1.8%) |
| Total | 31,451 (73.8%) | 2,046 (4.8%) |
Employment Occupations by Sex in Angelina County
Management, Business, Science and Arts Occupations
The most common Management, Business, Science and Arts occupations in Angelina County are Community & Social Service (3,901 | 10.4%), Management (3,019 | 8.1%), Education Instruction & Library (2,612 | 7.0%), Health Diagnosing & Treating (2,380 | 6.4%), and Computers, Engineering & Science (1,568 | 4.2%).
Management, Business, Science and Arts Occupations by Sex
Within the Management, Business, Science and Arts occupations in Angelina County, the most male-oriented occupations are Architecture & Engineering (91.2%), Computers, Engineering & Science (73.0%), and Computers & Mathematics (61.2%), while the most female-oriented occupations are Health Diagnosing & Treating (78.4%), Health Technologists (73.8%), and Education Instruction & Library (72.7%).
| Occupation | Male | Female |
| Management | 1,616 (53.5%) | 1,403 (46.5%) |
| Business & Financial | 559 (47.0%) | 631 (53.0%) |
| Computers, Engineering & Science | 1,144 (73.0%) | 424 (27.0%) |
| Computers & Mathematics | 298 (61.2%) | 189 (38.8%) |
| Architecture & Engineering | 753 (91.2%) | 73 (8.8%) |
| Life, Physical & Social Science | 93 (36.5%) | 162 (63.5%) |
| Community & Social Service | 1,239 (31.8%) | 2,662 (68.2%) |
| Education, Arts & Media | 263 (31.2%) | 581 (68.8%) |
| Legal Services & Support | 142 (60.7%) | 92 (39.3%) |
| Education Instruction & Library | 712 (27.3%) | 1,900 (72.7%) |
| Arts, Media & Entertainment | 122 (57.8%) | 89 (42.2%) |
| Health Diagnosing & Treating | 513 (21.5%) | 1,867 (78.4%) |
| Health Technologists | 344 (26.2%) | 968 (73.8%) |
| Total (Category) | 5,071 (42.1%) | 6,987 (57.9%) |
| Total (Overall) | 19,428 (52.0%) | 17,930 (48.0%) |
Services Occupations
The most common Services occupations in Angelina County are Food Preparation & Serving (2,179 | 5.8%), Cleaning & Maintenance (1,914 | 5.1%), Healthcare Support (1,479 | 4.0%), Security & Protection (1,139 | 3.0%), and Firefighting & Prevention (570 | 1.5%).
Services Occupations by Sex
Within the Services occupations in Angelina County, the most male-oriented occupations are Firefighting & Prevention (79.3%), Security & Protection (78.3%), and Law Enforcement (77.3%), while the most female-oriented occupations are Personal Care & Service (94.0%), Healthcare Support (93.7%), and Food Preparation & Serving (59.6%).
| Occupation | Male | Female |
| Healthcare Support | 93 (6.3%) | 1,386 (93.7%) |
| Security & Protection | 892 (78.3%) | 247 (21.7%) |
| Firefighting & Prevention | 452 (79.3%) | 118 (20.7%) |
| Law Enforcement | 440 (77.3%) | 129 (22.7%) |
| Food Preparation & Serving | 881 (40.4%) | 1,298 (59.6%) |
| Cleaning & Maintenance | 994 (51.9%) | 920 (48.1%) |
| Personal Care & Service | 34 (6.0%) | 533 (94.0%) |
| Total (Category) | 2,894 (39.8%) | 4,384 (60.2%) |
| Total (Overall) | 19,428 (52.0%) | 17,930 (48.0%) |
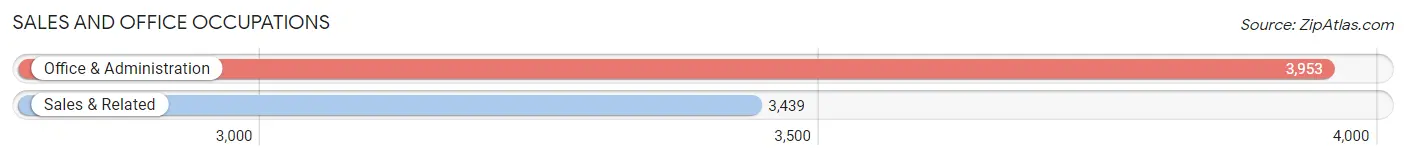
Sales and Office Occupations
The most common Sales and Office occupations in Angelina County are Office & Administration (3,953 | 10.6%), and Sales & Related (3,439 | 9.2%).
Sales and Office Occupations by Sex

| Occupation | Male | Female |
| Sales & Related | 1,537 (44.7%) | 1,902 (55.3%) |
| Office & Administration | 601 (15.2%) | 3,352 (84.8%) |
| Total (Category) | 2,138 (28.9%) | 5,254 (71.1%) |
| Total (Overall) | 19,428 (52.0%) | 17,930 (48.0%) |
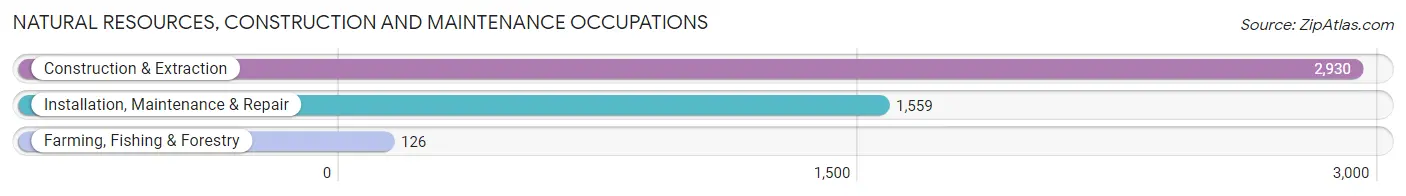
Natural Resources, Construction and Maintenance Occupations
The most common Natural Resources, Construction and Maintenance occupations in Angelina County are Construction & Extraction (2,930 | 7.8%), Installation, Maintenance & Repair (1,559 | 4.2%), and Farming, Fishing & Forestry (126 | 0.3%).
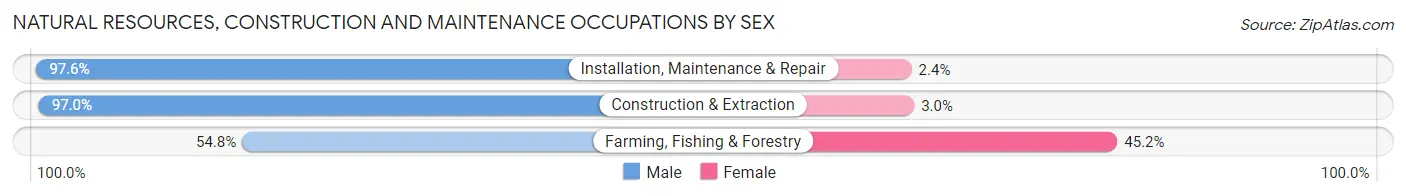
Natural Resources, Construction and Maintenance Occupations by Sex
| Occupation | Male | Female |
| Farming, Fishing & Forestry | 69 (54.8%) | 57 (45.2%) |
| Construction & Extraction | 2,843 (97.0%) | 87 (3.0%) |
| Installation, Maintenance & Repair | 1,521 (97.6%) | 38 (2.4%) |
| Total (Category) | 4,433 (96.1%) | 182 (3.9%) |
| Total (Overall) | 19,428 (52.0%) | 17,930 (48.0%) |
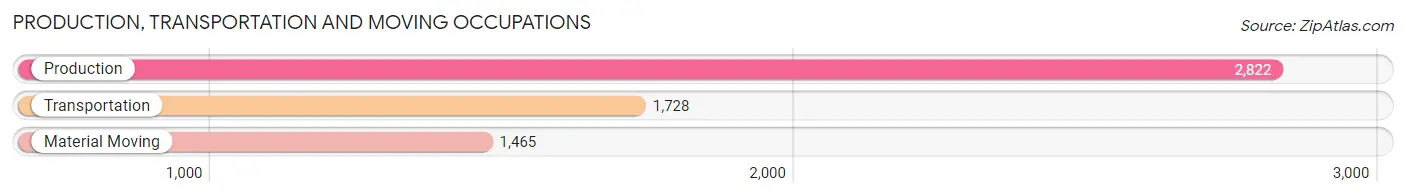
Production, Transportation and Moving Occupations
The most common Production, Transportation and Moving occupations in Angelina County are Production (2,822 | 7.5%), Transportation (1,728 | 4.6%), and Material Moving (1,465 | 3.9%).
Production, Transportation and Moving Occupations by Sex
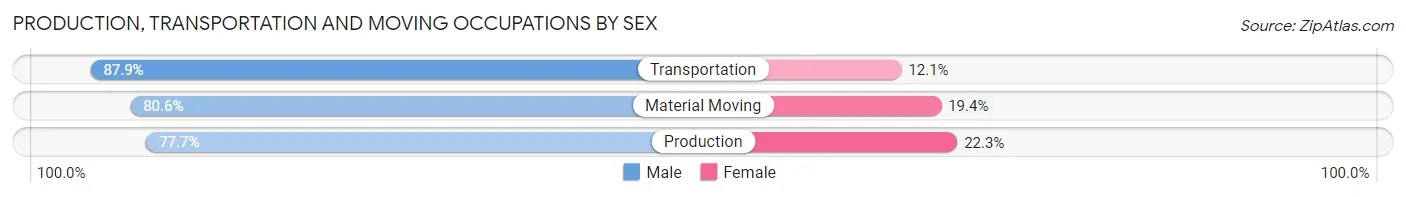
| Occupation | Male | Female |
| Production | 2,192 (77.7%) | 630 (22.3%) |
| Transportation | 1,519 (87.9%) | 209 (12.1%) |
| Material Moving | 1,181 (80.6%) | 284 (19.4%) |
| Total (Category) | 4,892 (81.3%) | 1,123 (18.7%) |
| Total (Overall) | 19,428 (52.0%) | 17,930 (48.0%) |
Employment Industries by Sex in Angelina County
Employment Industries in Angelina County
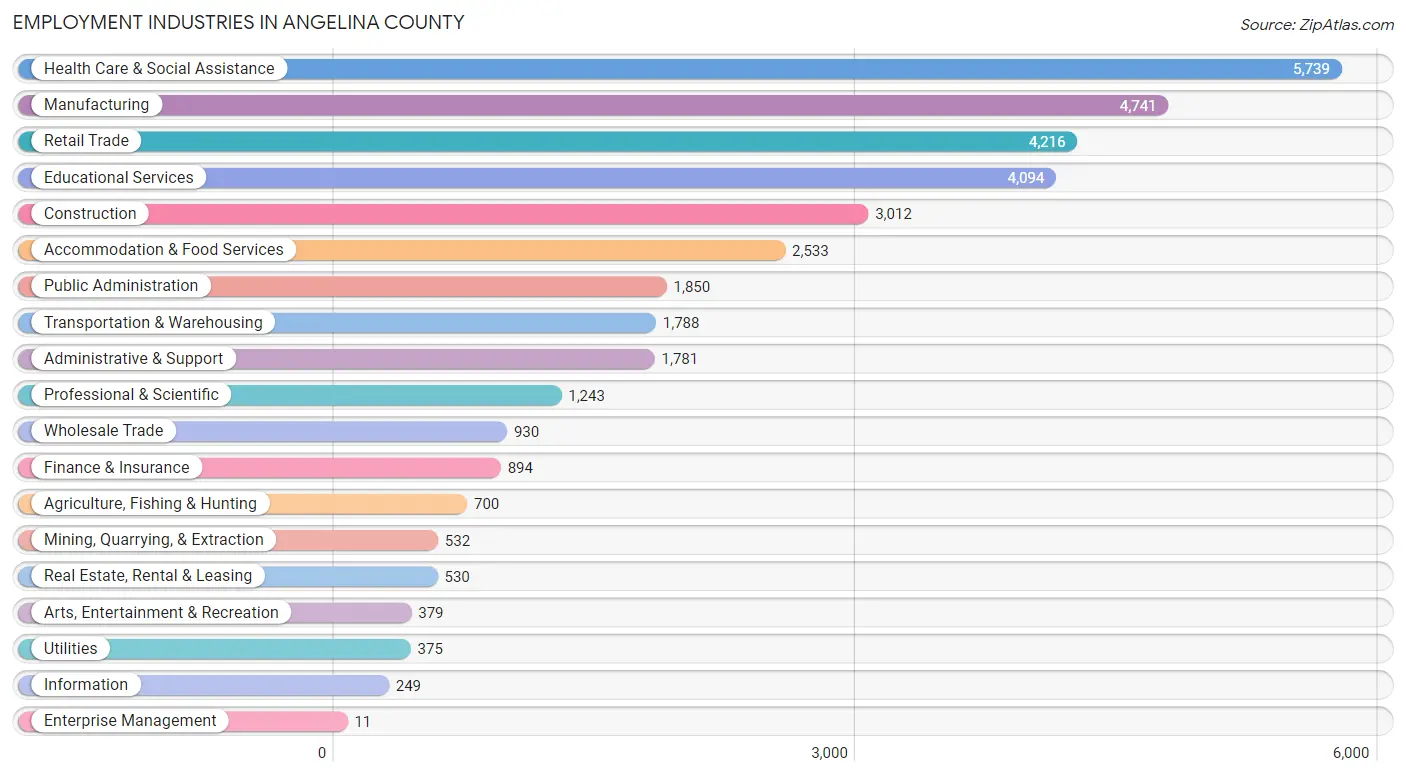
The major employment industries in Angelina County include Health Care & Social Assistance (5,739 | 15.4%), Manufacturing (4,741 | 12.7%), Retail Trade (4,216 | 11.3%), Educational Services (4,094 | 11.0%), and Construction (3,012 | 8.1%).
Employment Industries by Sex in Angelina County
The Angelina County industries that see more men than women are Mining, Quarrying, & Extraction (95.1%), Construction (93.4%), and Utilities (90.1%), whereas the industries that tend to have a higher number of women are Health Care & Social Assistance (85.6%), Finance & Insurance (72.0%), and Educational Services (69.0%).
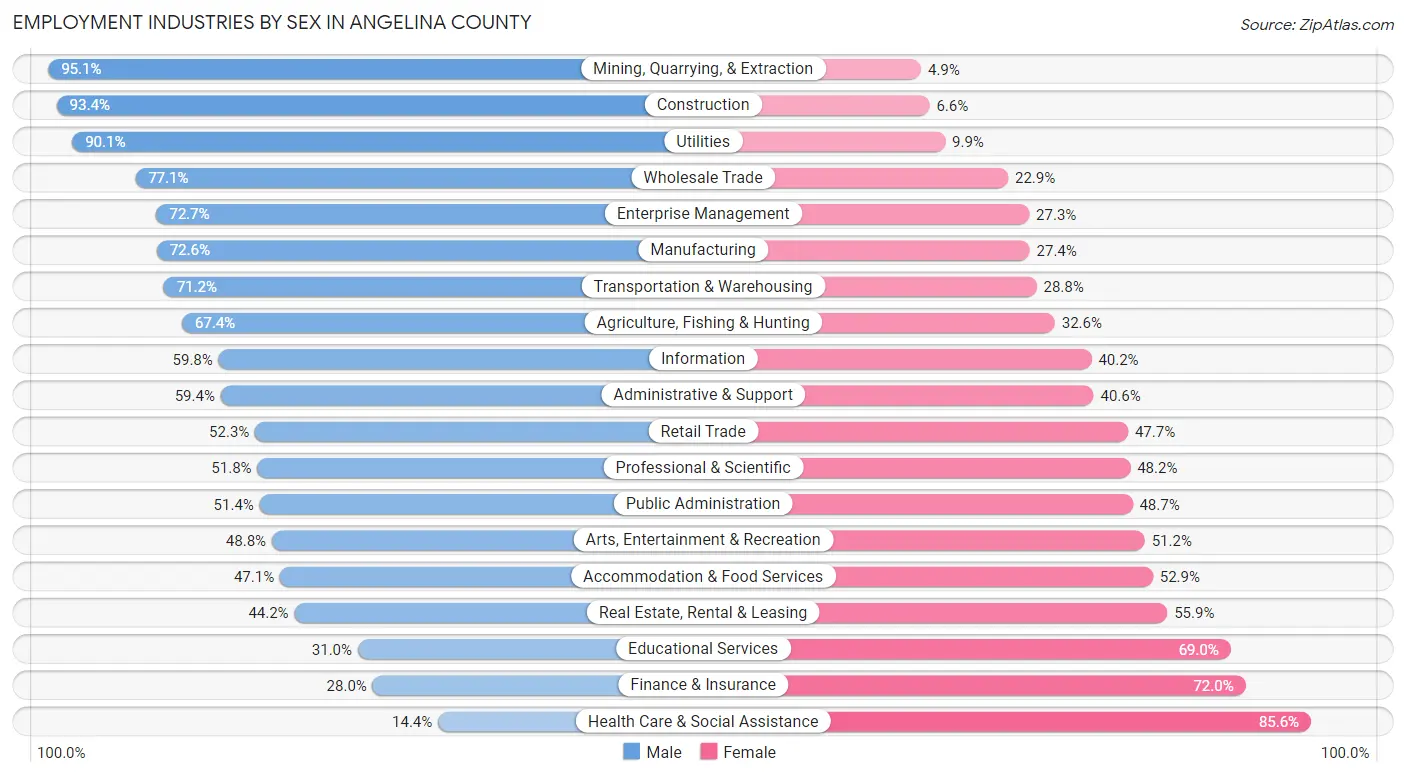
| Industry | Male | Female |
| Agriculture, Fishing & Hunting | 472 (67.4%) | 228 (32.6%) |
| Mining, Quarrying, & Extraction | 506 (95.1%) | 26 (4.9%) |
| Construction | 2,812 (93.4%) | 200 (6.6%) |
| Manufacturing | 3,444 (72.6%) | 1,297 (27.4%) |
| Wholesale Trade | 717 (77.1%) | 213 (22.9%) |
| Retail Trade | 2,204 (52.3%) | 2,012 (47.7%) |
| Transportation & Warehousing | 1,273 (71.2%) | 515 (28.8%) |
| Utilities | 338 (90.1%) | 37 (9.9%) |
| Information | 149 (59.8%) | 100 (40.2%) |
| Finance & Insurance | 250 (28.0%) | 644 (72.0%) |
| Real Estate, Rental & Leasing | 234 (44.2%) | 296 (55.8%) |
| Professional & Scientific | 644 (51.8%) | 599 (48.2%) |
| Enterprise Management | 8 (72.7%) | 3 (27.3%) |
| Administrative & Support | 1,058 (59.4%) | 723 (40.6%) |
| Educational Services | 1,270 (31.0%) | 2,824 (69.0%) |
| Health Care & Social Assistance | 827 (14.4%) | 4,912 (85.6%) |
| Arts, Entertainment & Recreation | 185 (48.8%) | 194 (51.2%) |
| Accommodation & Food Services | 1,194 (47.1%) | 1,339 (52.9%) |
| Public Administration | 950 (51.3%) | 900 (48.6%) |
| Total | 19,428 (52.0%) | 17,930 (48.0%) |
Education in Angelina County
School Enrollment in Angelina County
The most common levels of schooling among the 20,877 students in Angelina County are middle school (5,138 | 24.6%), elementary school (4,830 | 23.1%), and high school (4,785 | 22.9%).
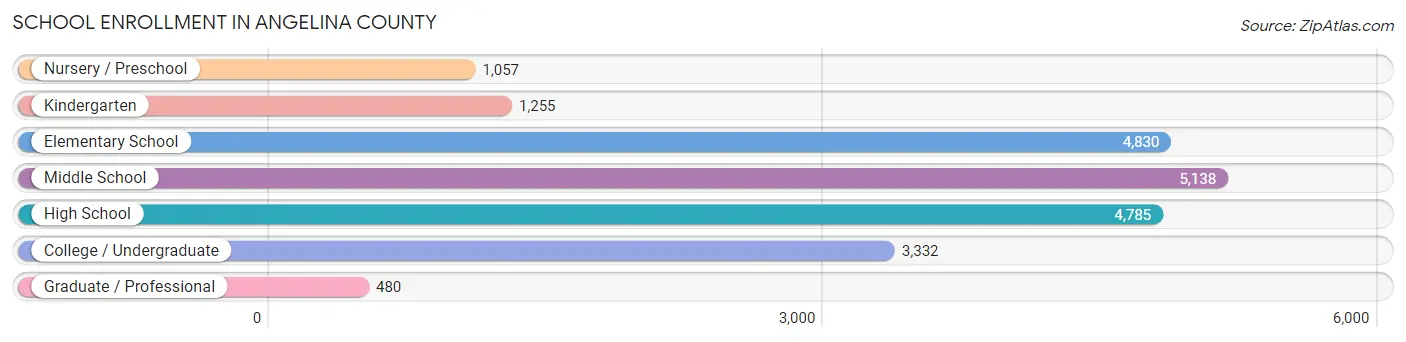
| School Level | # Students | % Students |
| Nursery / Preschool | 1,057 | 5.1% |
| Kindergarten | 1,255 | 6.0% |
| Elementary School | 4,830 | 23.1% |
| Middle School | 5,138 | 24.6% |
| High School | 4,785 | 22.9% |
| College / Undergraduate | 3,332 | 16.0% |
| Graduate / Professional | 480 | 2.3% |
| Total | 20,877 | 100.0% |
School Enrollment by Age by Funding Source in Angelina County
Out of a total of 20,877 students who are enrolled in schools in Angelina County, 1,691 (8.1%) attend a private institution, while the remaining 19,186 (91.9%) are enrolled in public schools. The age group of 35 years and over has the highest likelihood of being enrolled in private schools, with 289 (28.4% in the age bracket) enrolled. Conversely, the age group of 15 to 17 year olds has the lowest likelihood of being enrolled in a private school, with 3,469 (96.0% in the age bracket) attending a public institution.
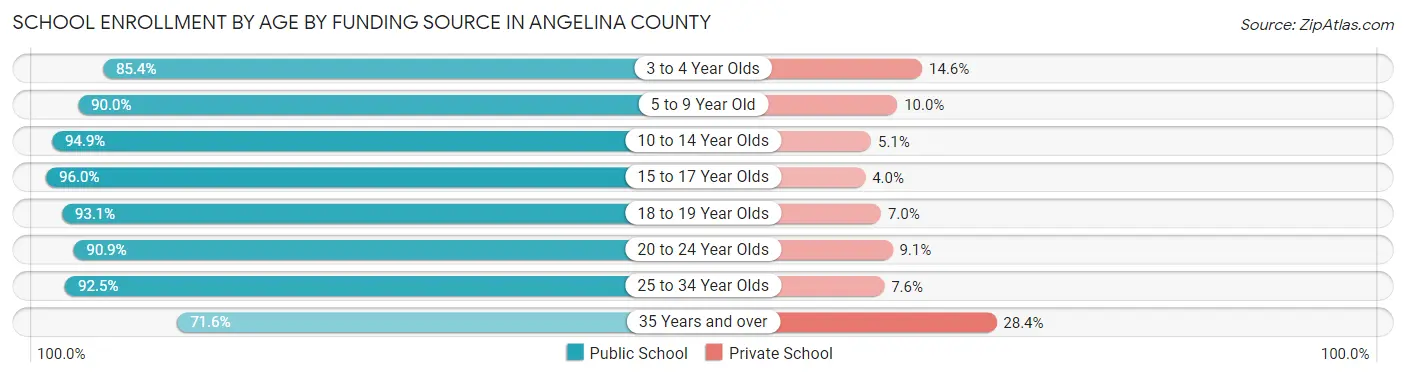
| Age Bracket | Public School | Private School |
| 3 to 4 Year Olds | 707 (85.4%) | 121 (14.6%) |
| 5 to 9 Year Old | 4,721 (90.0%) | 523 (10.0%) |
| 10 to 14 Year Olds | 6,267 (94.9%) | 337 (5.1%) |
| 15 to 17 Year Olds | 3,469 (96.0%) | 145 (4.0%) |
| 18 to 19 Year Olds | 1,339 (93.0%) | 100 (7.0%) |
| 20 to 24 Year Olds | 1,300 (90.9%) | 130 (9.1%) |
| 25 to 34 Year Olds | 649 (92.4%) | 53 (7.5%) |
| 35 Years and over | 727 (71.6%) | 289 (28.4%) |
| Total | 19,186 (91.9%) | 1,691 (8.1%) |
Educational Attainment by Field of Study in Angelina County
Business (2,172 | 18.7%), education (1,880 | 16.2%), science & technology (1,326 | 11.4%), arts & humanities (1,241 | 10.7%), and bio, nature & agricultural (866 | 7.4%) are the most common fields of study among 11,623 individuals in Angelina County who have obtained a bachelor's degree or higher.
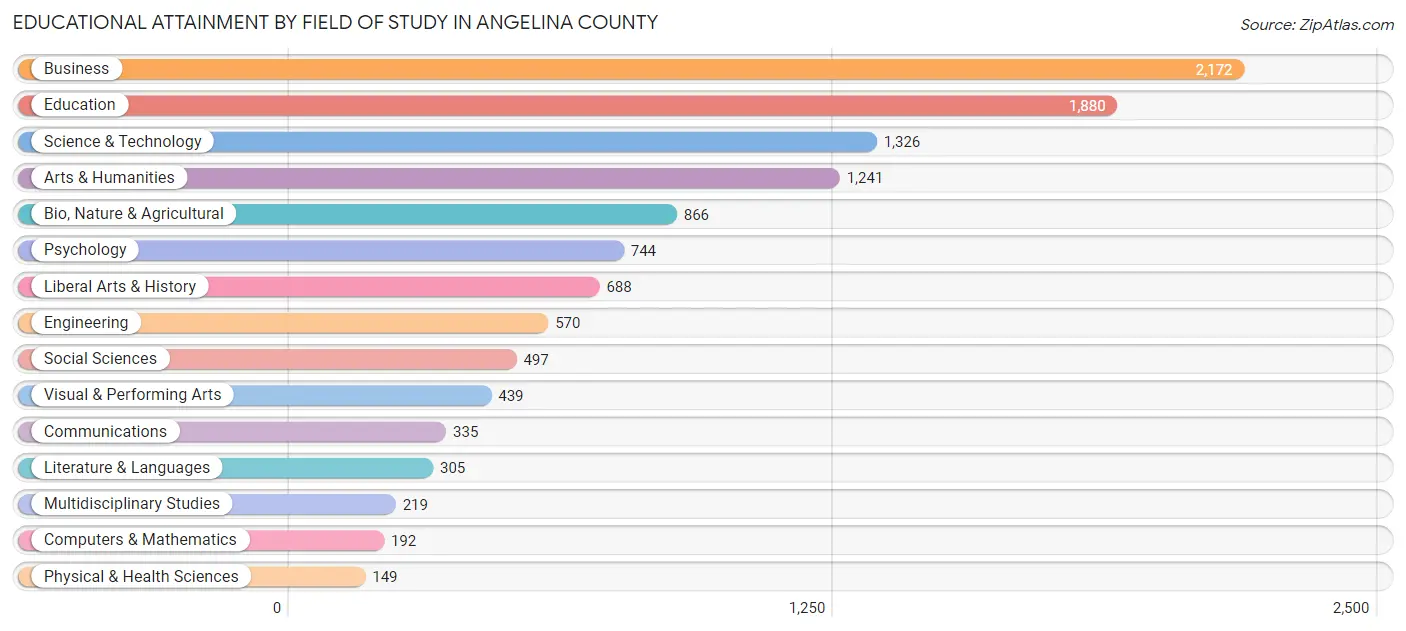
| Field of Study | # Graduates | % Graduates |
| Computers & Mathematics | 192 | 1.7% |
| Bio, Nature & Agricultural | 866 | 7.4% |
| Physical & Health Sciences | 149 | 1.3% |
| Psychology | 744 | 6.4% |
| Social Sciences | 497 | 4.3% |
| Engineering | 570 | 4.9% |
| Multidisciplinary Studies | 219 | 1.9% |
| Science & Technology | 1,326 | 11.4% |
| Business | 2,172 | 18.7% |
| Education | 1,880 | 16.2% |
| Literature & Languages | 305 | 2.6% |
| Liberal Arts & History | 688 | 5.9% |
| Visual & Performing Arts | 439 | 3.8% |
| Communications | 335 | 2.9% |
| Arts & Humanities | 1,241 | 10.7% |
| Total | 11,623 | 100.0% |
Transportation & Commute in Angelina County
Vehicle Availability by Sex in Angelina County
The most prevalent vehicle ownership categories in Angelina County are males with 2 vehicles (7,962, accounting for 41.8%) and females with 2 vehicles (7,420, making up 45.8%).
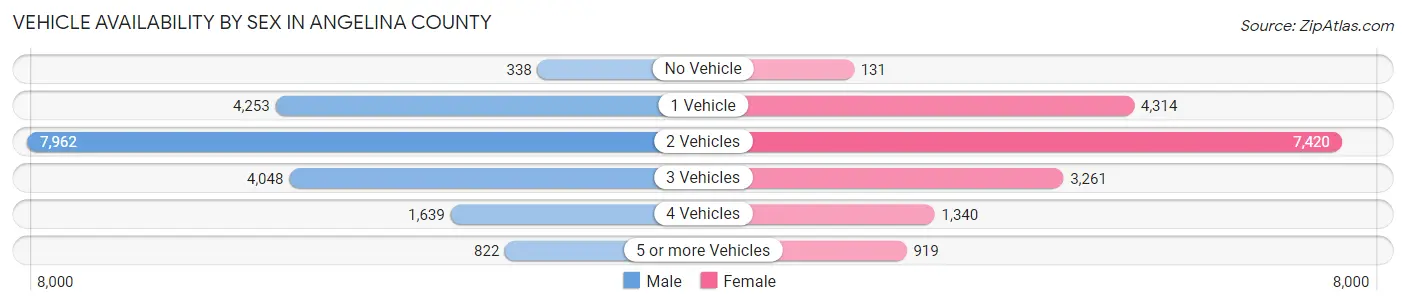
| Vehicles Available | Male | Female |
| No Vehicle | 338 (1.8%) | 131 (0.7%) |
| 1 Vehicle | 4,253 (22.3%) | 4,314 (24.8%) |
| 2 Vehicles | 7,962 (41.8%) | 7,420 (42.7%) |
| 3 Vehicles | 4,048 (21.2%) | 3,261 (18.8%) |
| 4 Vehicles | 1,639 (8.6%) | 1,340 (7.7%) |
| 5 or more Vehicles | 822 (4.3%) | 919 (5.3%) |
| Total | 19,062 (100.0%) | 17,385 (100.0%) |
Commute Time in Angelina County
The most frequently occuring commute durations in Angelina County are 10 to 14 minutes (9,041 commuters, 25.8%), 15 to 19 minutes (6,607 commuters, 18.9%), and 5 to 9 minutes (5,480 commuters, 15.6%).
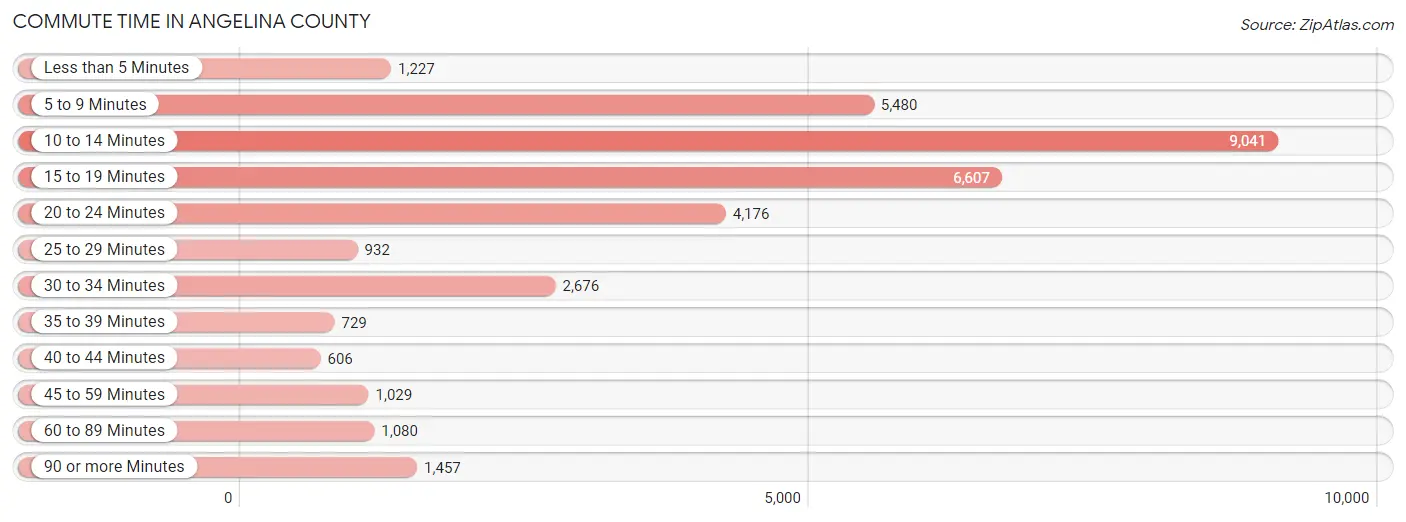
| Commute Time | # Commuters | % Commuters |
| Less than 5 Minutes | 1,227 | 3.5% |
| 5 to 9 Minutes | 5,480 | 15.6% |
| 10 to 14 Minutes | 9,041 | 25.8% |
| 15 to 19 Minutes | 6,607 | 18.9% |
| 20 to 24 Minutes | 4,176 | 11.9% |
| 25 to 29 Minutes | 932 | 2.7% |
| 30 to 34 Minutes | 2,676 | 7.6% |
| 35 to 39 Minutes | 729 | 2.1% |
| 40 to 44 Minutes | 606 | 1.7% |
| 45 to 59 Minutes | 1,029 | 2.9% |
| 60 to 89 Minutes | 1,080 | 3.1% |
| 90 or more Minutes | 1,457 | 4.2% |
Commute Time by Sex in Angelina County
The most common commute times in Angelina County are 10 to 14 minutes (4,045 commuters, 21.8%) for males and 10 to 14 minutes (4,996 commuters, 30.4%) for females.
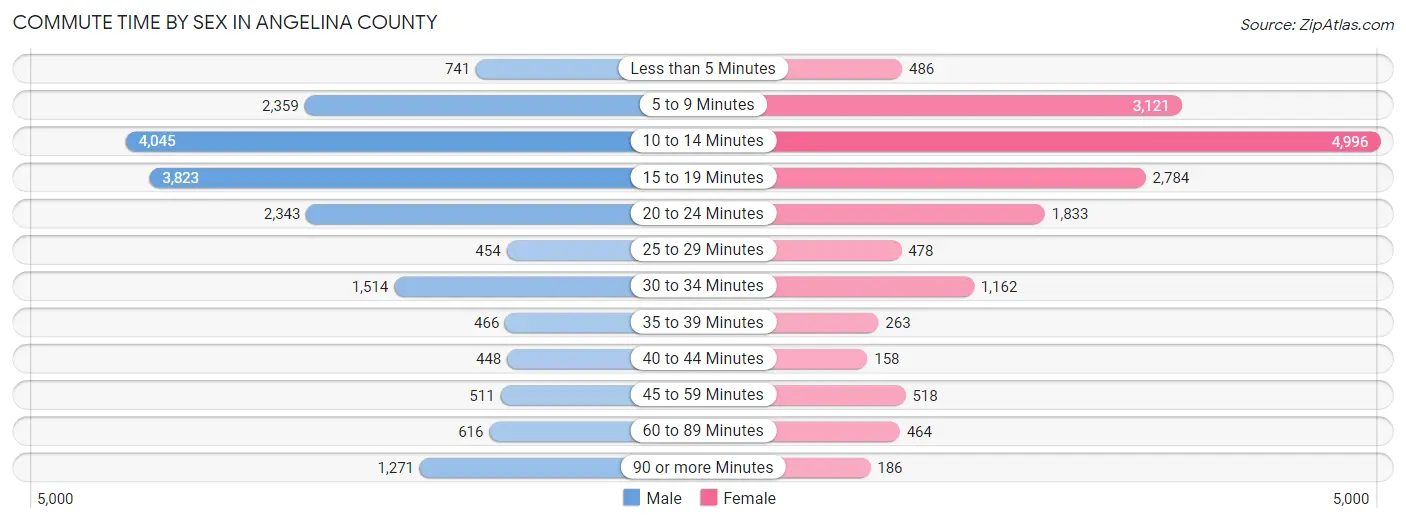
| Commute Time | Male | Female |
| Less than 5 Minutes | 741 (4.0%) | 486 (2.9%) |
| 5 to 9 Minutes | 2,359 (12.7%) | 3,121 (19.0%) |
| 10 to 14 Minutes | 4,045 (21.8%) | 4,996 (30.4%) |
| 15 to 19 Minutes | 3,823 (20.6%) | 2,784 (16.9%) |
| 20 to 24 Minutes | 2,343 (12.6%) | 1,833 (11.1%) |
| 25 to 29 Minutes | 454 (2.4%) | 478 (2.9%) |
| 30 to 34 Minutes | 1,514 (8.1%) | 1,162 (7.1%) |
| 35 to 39 Minutes | 466 (2.5%) | 263 (1.6%) |
| 40 to 44 Minutes | 448 (2.4%) | 158 (1.0%) |
| 45 to 59 Minutes | 511 (2.8%) | 518 (3.2%) |
| 60 to 89 Minutes | 616 (3.3%) | 464 (2.8%) |
| 90 or more Minutes | 1,271 (6.8%) | 186 (1.1%) |
Time of Departure to Work by Sex in Angelina County
The most frequent times of departure to work in Angelina County are 7:30 AM to 7:59 AM (2,873, 15.4%) for males and 7:30 AM to 7:59 AM (3,890, 23.6%) for females.
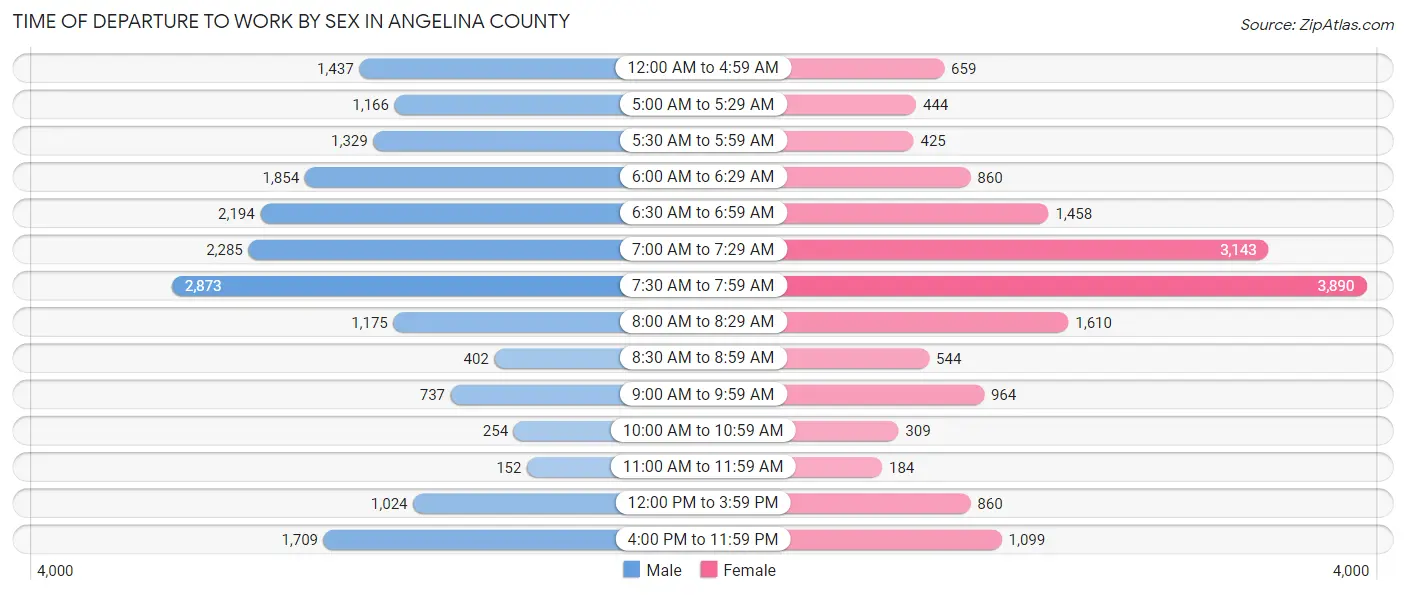
| Time of Departure | Male | Female |
| 12:00 AM to 4:59 AM | 1,437 (7.7%) | 659 (4.0%) |
| 5:00 AM to 5:29 AM | 1,166 (6.3%) | 444 (2.7%) |
| 5:30 AM to 5:59 AM | 1,329 (7.1%) | 425 (2.6%) |
| 6:00 AM to 6:29 AM | 1,854 (10.0%) | 860 (5.2%) |
| 6:30 AM to 6:59 AM | 2,194 (11.8%) | 1,458 (8.9%) |
| 7:00 AM to 7:29 AM | 2,285 (12.3%) | 3,143 (19.1%) |
| 7:30 AM to 7:59 AM | 2,873 (15.4%) | 3,890 (23.6%) |
| 8:00 AM to 8:29 AM | 1,175 (6.3%) | 1,610 (9.8%) |
| 8:30 AM to 8:59 AM | 402 (2.2%) | 544 (3.3%) |
| 9:00 AM to 9:59 AM | 737 (4.0%) | 964 (5.9%) |
| 10:00 AM to 10:59 AM | 254 (1.4%) | 309 (1.9%) |
| 11:00 AM to 11:59 AM | 152 (0.8%) | 184 (1.1%) |
| 12:00 PM to 3:59 PM | 1,024 (5.5%) | 860 (5.2%) |
| 4:00 PM to 11:59 PM | 1,709 (9.2%) | 1,099 (6.7%) |
| Total | 18,591 (100.0%) | 16,449 (100.0%) |
Housing Occupancy in Angelina County
Occupancy by Ownership in Angelina County
Of the total 31,583 dwellings in Angelina County, owner-occupied units account for 20,380 (64.5%), while renter-occupied units make up 11,203 (35.5%).
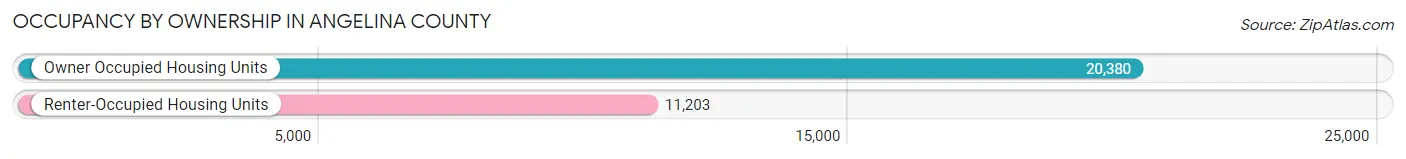
| Occupancy | # Housing Units | % Housing Units |
| Owner Occupied Housing Units | 20,380 | 64.5% |
| Renter-Occupied Housing Units | 11,203 | 35.5% |
| Total Occupied Housing Units | 31,583 | 100.0% |
Occupancy by Household Size in Angelina County
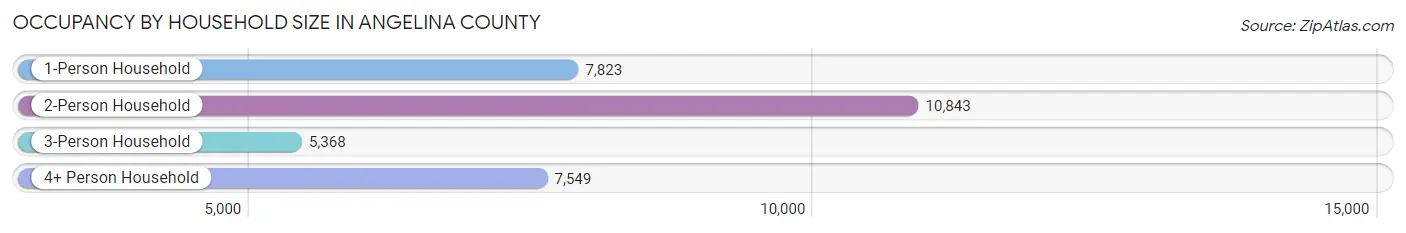
| Household Size | # Housing Units | % Housing Units |
| 1-Person Household | 7,823 | 24.8% |
| 2-Person Household | 10,843 | 34.3% |
| 3-Person Household | 5,368 | 17.0% |
| 4+ Person Household | 7,549 | 23.9% |
| Total Housing Units | 31,583 | 100.0% |
Occupancy by Ownership by Household Size in Angelina County
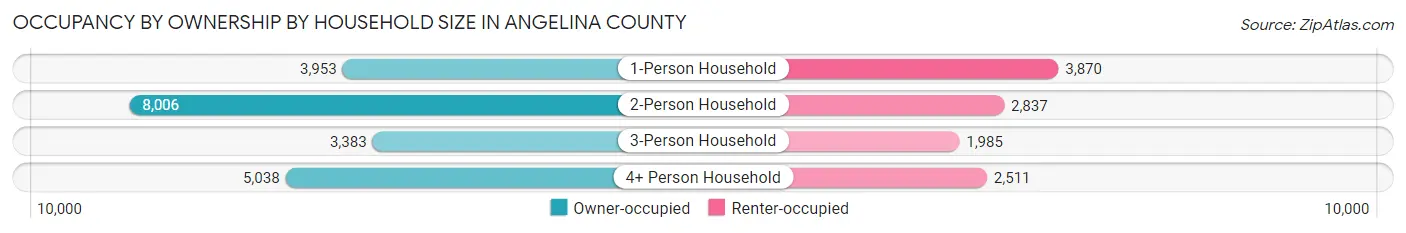
| Household Size | Owner-occupied | Renter-occupied |
| 1-Person Household | 3,953 (50.5%) | 3,870 (49.5%) |
| 2-Person Household | 8,006 (73.8%) | 2,837 (26.2%) |
| 3-Person Household | 3,383 (63.0%) | 1,985 (37.0%) |
| 4+ Person Household | 5,038 (66.7%) | 2,511 (33.3%) |
| Total Housing Units | 20,380 (64.5%) | 11,203 (35.5%) |
Occupancy by Educational Attainment in Angelina County
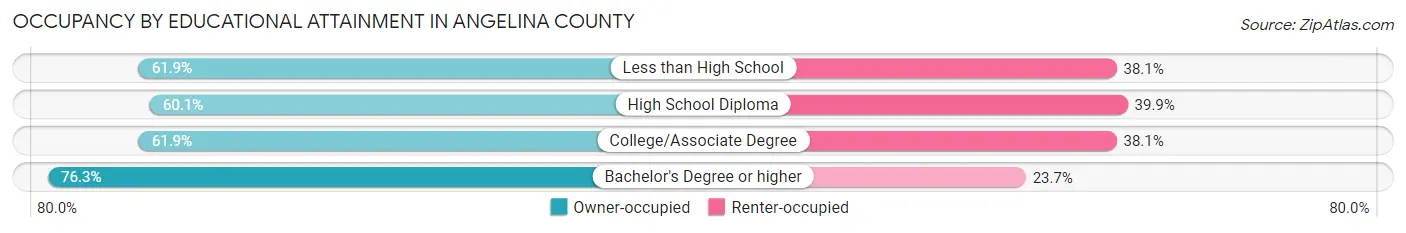
| Household Size | Owner-occupied | Renter-occupied |
| Less than High School | 2,708 (61.9%) | 1,668 (38.1%) |
| High School Diploma | 5,411 (60.1%) | 3,589 (39.9%) |
| College/Associate Degree | 6,987 (61.9%) | 4,306 (38.1%) |
| Bachelor's Degree or higher | 5,274 (76.3%) | 1,640 (23.7%) |
Occupancy by Age of Householder in Angelina County
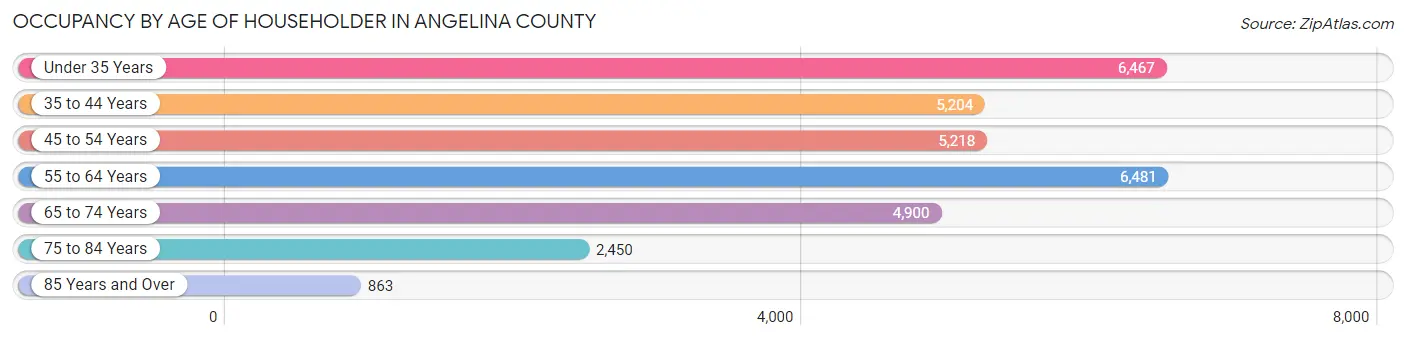
| Age Bracket | # Households | % Households |
| Under 35 Years | 6,467 | 20.5% |
| 35 to 44 Years | 5,204 | 16.5% |
| 45 to 54 Years | 5,218 | 16.5% |
| 55 to 64 Years | 6,481 | 20.5% |
| 65 to 74 Years | 4,900 | 15.5% |
| 75 to 84 Years | 2,450 | 7.8% |
| 85 Years and Over | 863 | 2.7% |
| Total | 31,583 | 100.0% |
Housing Finances in Angelina County
Median Income by Occupancy in Angelina County
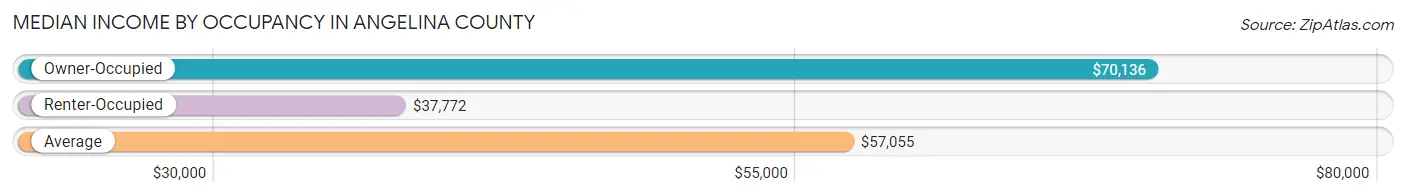
| Occupancy Type | # Households | Median Income |
| Owner-Occupied | 20,380 (64.5%) | $70,136 |
| Renter-Occupied | 11,203 (35.5%) | $37,772 |
| Average | 31,583 (100.0%) | $57,055 |
Occupancy by Householder Income Bracket in Angelina County
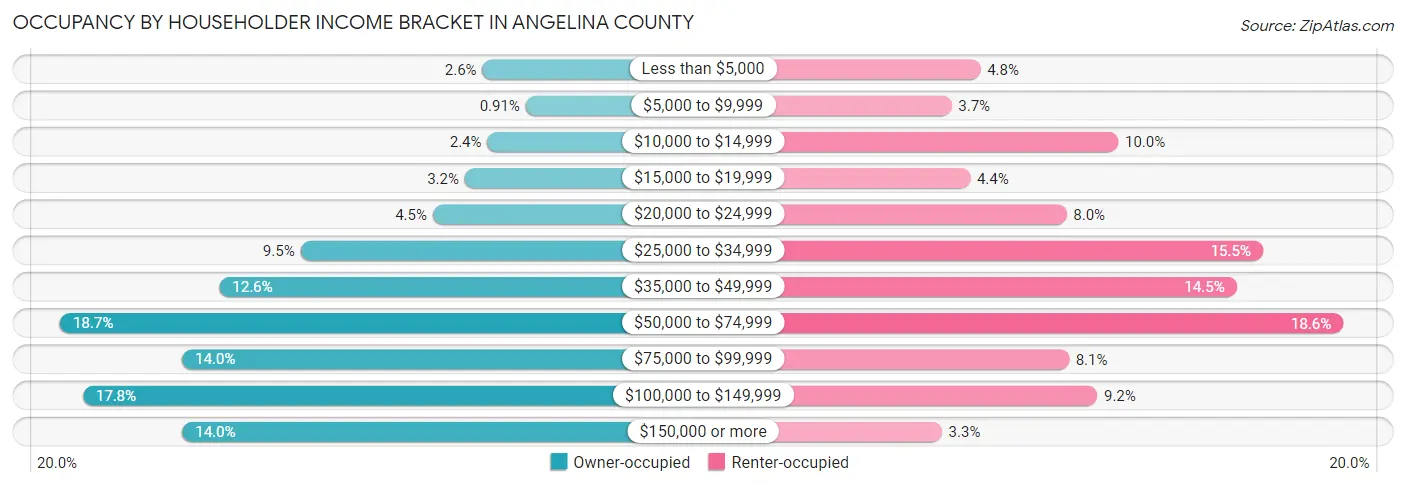
| Income Bracket | Owner-occupied | Renter-occupied |
| Less than $5,000 | 521 (2.6%) | 532 (4.8%) |
| $5,000 to $9,999 | 185 (0.9%) | 409 (3.6%) |
| $10,000 to $14,999 | 484 (2.4%) | 1,120 (10.0%) |
| $15,000 to $19,999 | 658 (3.2%) | 489 (4.4%) |
| $20,000 to $24,999 | 906 (4.4%) | 900 (8.0%) |
| $25,000 to $34,999 | 1,934 (9.5%) | 1,738 (15.5%) |
| $35,000 to $49,999 | 2,563 (12.6%) | 1,626 (14.5%) |
| $50,000 to $74,999 | 3,800 (18.6%) | 2,080 (18.6%) |
| $75,000 to $99,999 | 2,854 (14.0%) | 910 (8.1%) |
| $100,000 to $149,999 | 3,623 (17.8%) | 1,031 (9.2%) |
| $150,000 or more | 2,852 (14.0%) | 368 (3.3%) |
| Total | 20,380 (100.0%) | 11,203 (100.0%) |
Monthly Housing Cost Tiers in Angelina County
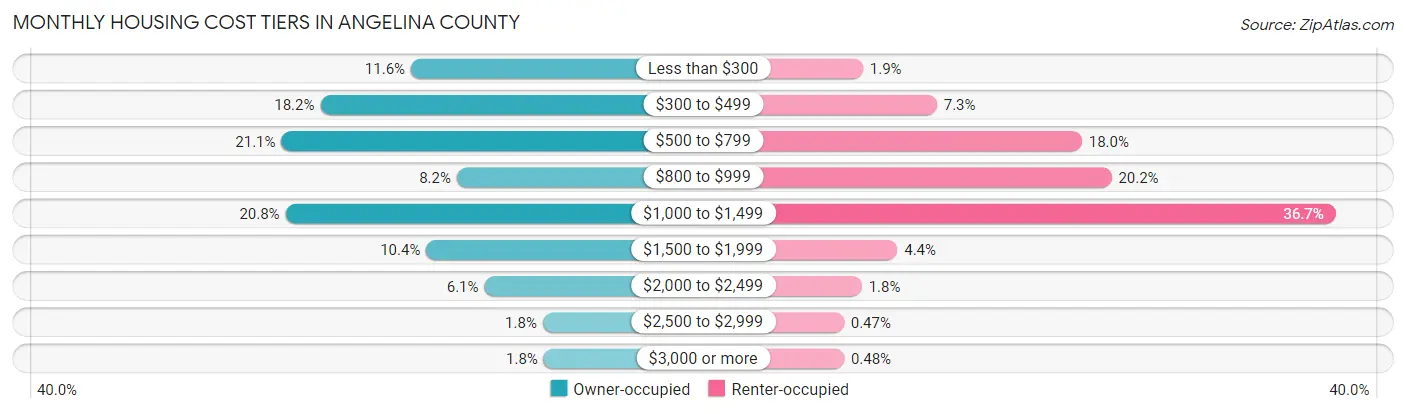
| Monthly Cost | Owner-occupied | Renter-occupied |
| Less than $300 | 2,354 (11.6%) | 210 (1.9%) |
| $300 to $499 | 3,713 (18.2%) | 820 (7.3%) |
| $500 to $799 | 4,298 (21.1%) | 2,017 (18.0%) |
| $800 to $999 | 1,666 (8.2%) | 2,261 (20.2%) |
| $1,000 to $1,499 | 4,237 (20.8%) | 4,110 (36.7%) |
| $1,500 to $1,999 | 2,124 (10.4%) | 494 (4.4%) |
| $2,000 to $2,499 | 1,251 (6.1%) | 200 (1.8%) |
| $2,500 to $2,999 | 376 (1.8%) | 53 (0.5%) |
| $3,000 or more | 361 (1.8%) | 54 (0.5%) |
| Total | 20,380 (100.0%) | 11,203 (100.0%) |
Physical Housing Characteristics in Angelina County
Housing Structures in Angelina County
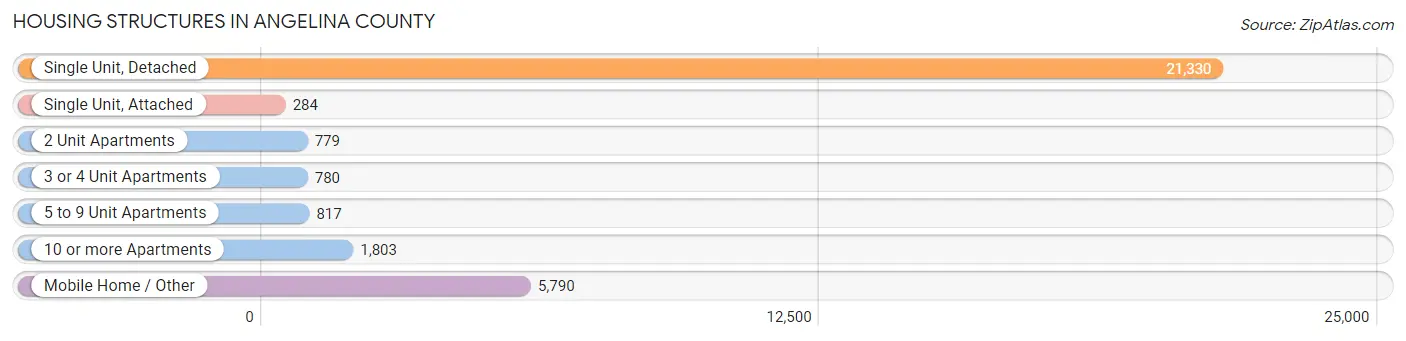
| Structure Type | # Housing Units | % Housing Units |
| Single Unit, Detached | 21,330 | 67.5% |
| Single Unit, Attached | 284 | 0.9% |
| 2 Unit Apartments | 779 | 2.5% |
| 3 or 4 Unit Apartments | 780 | 2.5% |
| 5 to 9 Unit Apartments | 817 | 2.6% |
| 10 or more Apartments | 1,803 | 5.7% |
| Mobile Home / Other | 5,790 | 18.3% |
| Total | 31,583 | 100.0% |
Housing Structures by Occupancy in Angelina County
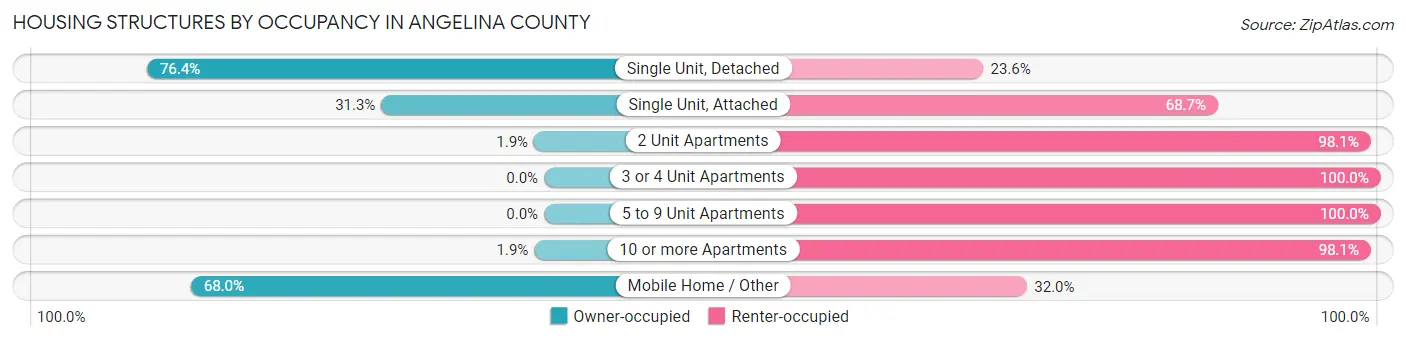
| Structure Type | Owner-occupied | Renter-occupied |
| Single Unit, Detached | 16,305 (76.4%) | 5,025 (23.6%) |
| Single Unit, Attached | 89 (31.3%) | 195 (68.7%) |
| 2 Unit Apartments | 15 (1.9%) | 764 (98.1%) |
| 3 or 4 Unit Apartments | 0 (0.0%) | 780 (100.0%) |
| 5 to 9 Unit Apartments | 0 (0.0%) | 817 (100.0%) |
| 10 or more Apartments | 34 (1.9%) | 1,769 (98.1%) |
| Mobile Home / Other | 3,937 (68.0%) | 1,853 (32.0%) |
| Total | 20,380 (64.5%) | 11,203 (35.5%) |
Housing Structures by Number of Rooms in Angelina County
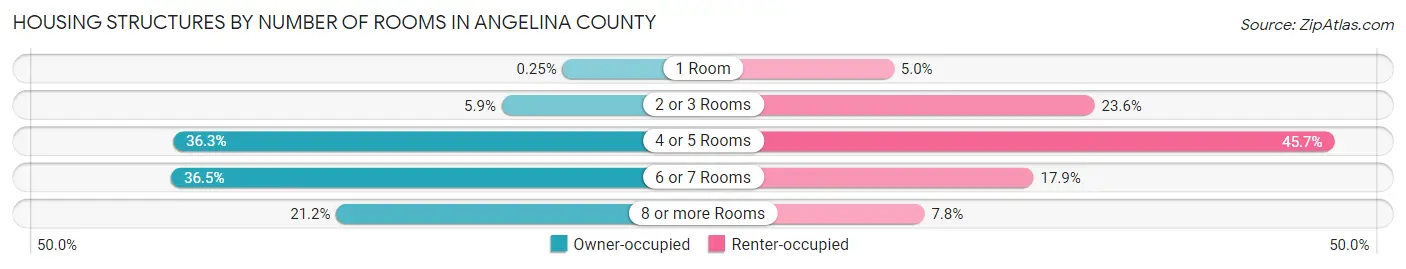
| Number of Rooms | Owner-occupied | Renter-occupied |
| 1 Room | 50 (0.3%) | 559 (5.0%) |
| 2 or 3 Rooms | 1,197 (5.9%) | 2,639 (23.6%) |
| 4 or 5 Rooms | 7,389 (36.3%) | 5,122 (45.7%) |
| 6 or 7 Rooms | 7,429 (36.4%) | 2,007 (17.9%) |
| 8 or more Rooms | 4,315 (21.2%) | 876 (7.8%) |
| Total | 20,380 (100.0%) | 11,203 (100.0%) |
Housing Structure by Heating Type in Angelina County
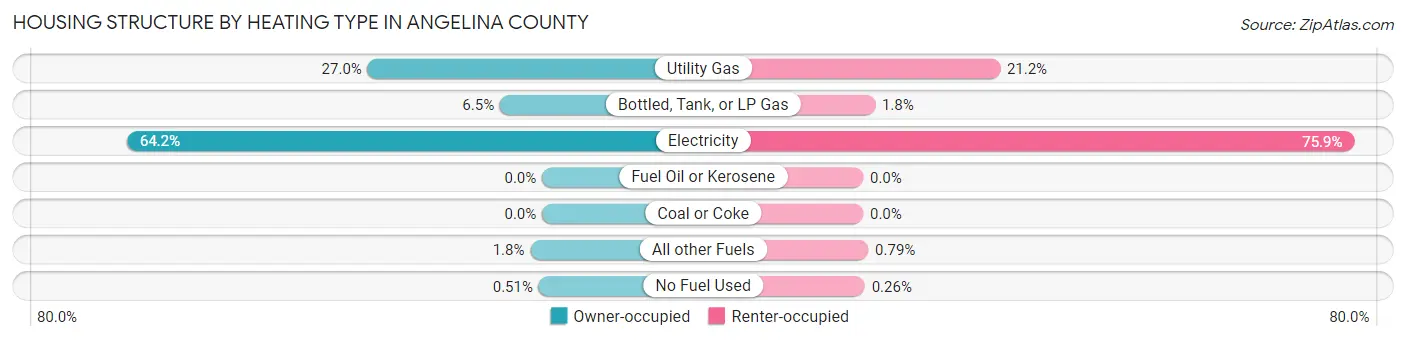
| Heating Type | Owner-occupied | Renter-occupied |
| Utility Gas | 5,497 (27.0%) | 2,371 (21.2%) |
| Bottled, Tank, or LP Gas | 1,326 (6.5%) | 206 (1.8%) |
| Electricity | 13,083 (64.2%) | 8,508 (75.9%) |
| Fuel Oil or Kerosene | 0 (0.0%) | 0 (0.0%) |
| Coal or Coke | 0 (0.0%) | 0 (0.0%) |
| All other Fuels | 370 (1.8%) | 89 (0.8%) |
| No Fuel Used | 104 (0.5%) | 29 (0.3%) |
| Total | 20,380 (100.0%) | 11,203 (100.0%) |
Household Vehicle Usage in Angelina County
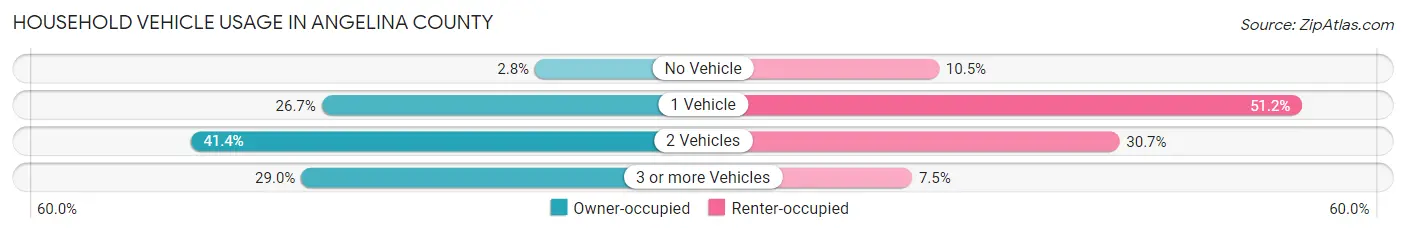
| Vehicles per Household | Owner-occupied | Renter-occupied |
| No Vehicle | 576 (2.8%) | 1,180 (10.5%) |
| 1 Vehicle | 5,448 (26.7%) | 5,738 (51.2%) |
| 2 Vehicles | 8,442 (41.4%) | 3,444 (30.7%) |
| 3 or more Vehicles | 5,914 (29.0%) | 841 (7.5%) |
| Total | 20,380 (100.0%) | 11,203 (100.0%) |
Real Estate & Mortgages in Angelina County
Real Estate and Mortgage Overview in Angelina County
| Characteristic | Without Mortgage | With Mortgage |
| Housing Units | 11,506 | 8,874 |
| Median Property Value | $98,800 | $169,200 |
| Median Household Income | $53,669 | $1,870 |
| Monthly Housing Costs | $485 | $345 |
| Real Estate Taxes | $1,159 | $216 |
Property Value by Mortgage Status in Angelina County
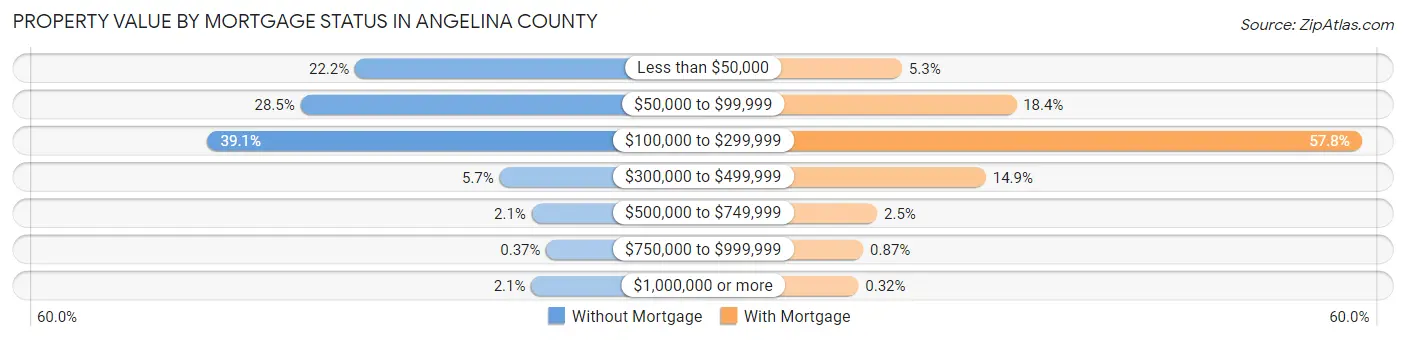
| Property Value | Without Mortgage | With Mortgage |
| Less than $50,000 | 2,558 (22.2%) | 470 (5.3%) |
| $50,000 to $99,999 | 3,275 (28.5%) | 1,629 (18.4%) |
| $100,000 to $299,999 | 4,497 (39.1%) | 5,131 (57.8%) |
| $300,000 to $499,999 | 658 (5.7%) | 1,321 (14.9%) |
| $500,000 to $749,999 | 236 (2.1%) | 218 (2.5%) |
| $750,000 to $999,999 | 42 (0.4%) | 77 (0.9%) |
| $1,000,000 or more | 240 (2.1%) | 28 (0.3%) |
| Total | 11,506 (100.0%) | 8,874 (100.0%) |
Household Income by Mortgage Status in Angelina County
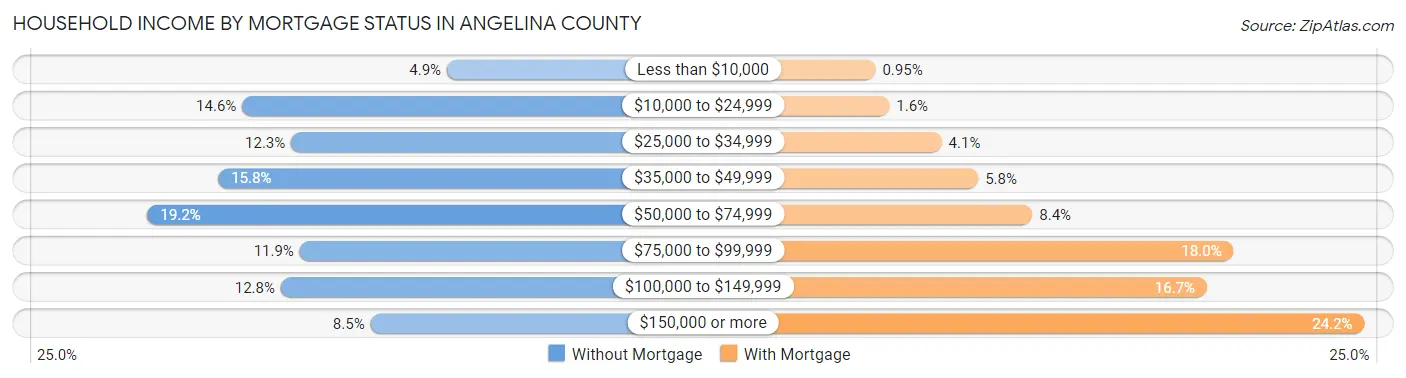
| Household Income | Without Mortgage | With Mortgage |
| Less than $10,000 | 563 (4.9%) | 84 (0.9%) |
| $10,000 to $24,999 | 1,684 (14.6%) | 143 (1.6%) |
| $25,000 to $34,999 | 1,416 (12.3%) | 364 (4.1%) |
| $35,000 to $49,999 | 1,816 (15.8%) | 518 (5.8%) |
| $50,000 to $74,999 | 2,203 (19.2%) | 747 (8.4%) |
| $75,000 to $99,999 | 1,369 (11.9%) | 1,597 (18.0%) |
| $100,000 to $149,999 | 1,473 (12.8%) | 1,485 (16.7%) |
| $150,000 or more | 982 (8.5%) | 2,150 (24.2%) |
| Total | 11,506 (100.0%) | 8,874 (100.0%) |
Property Value to Household Income Ratio in Angelina County
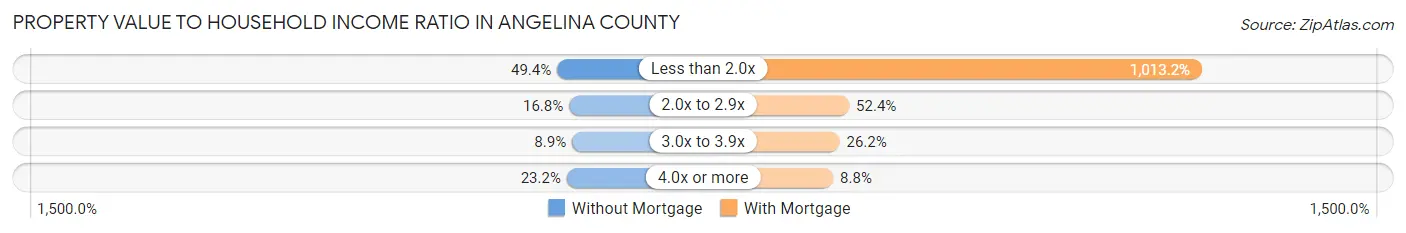
| Value-to-Income Ratio | Without Mortgage | With Mortgage |
| Less than 2.0x | 5,687 (49.4%) | 89,914 (1,013.2%) |
| 2.0x to 2.9x | 1,938 (16.8%) | 4,652 (52.4%) |
| 3.0x to 3.9x | 1,018 (8.8%) | 2,326 (26.2%) |
| 4.0x or more | 2,665 (23.2%) | 780 (8.8%) |
| Total | 11,506 (100.0%) | 8,874 (100.0%) |
Real Estate Taxes by Mortgage Status in Angelina County
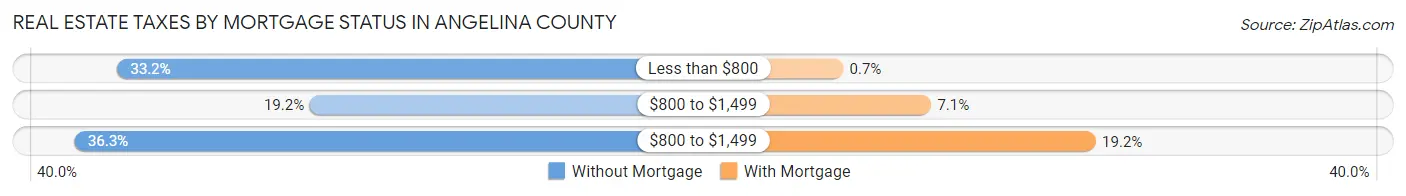
| Property Taxes | Without Mortgage | With Mortgage |
| Less than $800 | 3,822 (33.2%) | 62 (0.7%) |
| $800 to $1,499 | 2,203 (19.2%) | 632 (7.1%) |
| $800 to $1,499 | 4,179 (36.3%) | 1,699 (19.2%) |
| Total | 11,506 (100.0%) | 8,874 (100.0%) |
Health & Disability in Angelina County
Health Insurance Coverage by Age in Angelina County
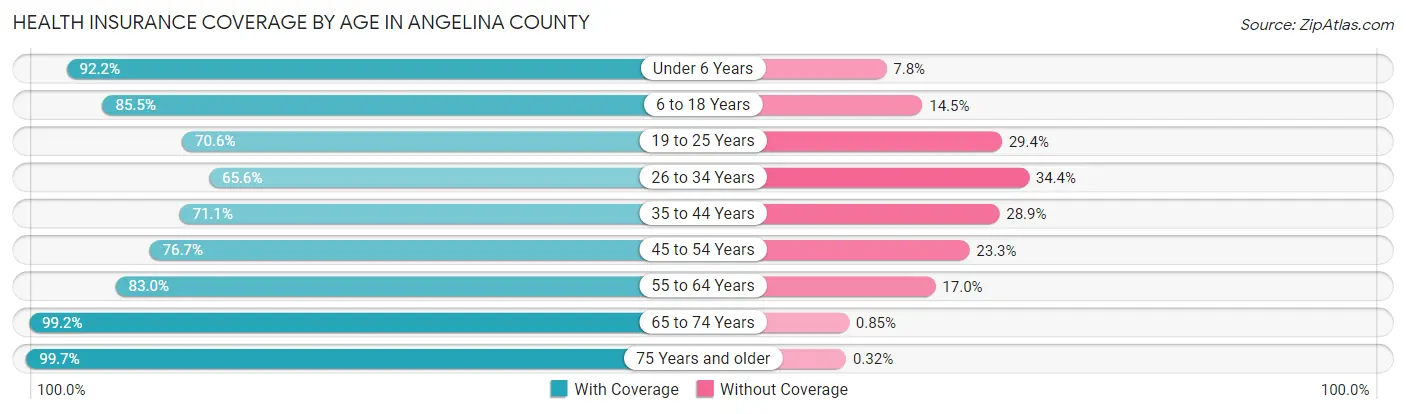
| Age Bracket | With Coverage | Without Coverage |
| Under 6 Years | 6,209 (92.2%) | 528 (7.8%) |
| 6 to 18 Years | 13,927 (85.5%) | 2,370 (14.5%) |
| 19 to 25 Years | 5,656 (70.6%) | 2,351 (29.4%) |
| 26 to 34 Years | 6,268 (65.6%) | 3,287 (34.4%) |
| 35 to 44 Years | 7,222 (71.1%) | 2,935 (28.9%) |
| 45 to 54 Years | 7,919 (76.7%) | 2,408 (23.3%) |
| 55 to 64 Years | 8,652 (83.0%) | 1,771 (17.0%) |
| 65 to 74 Years | 7,697 (99.2%) | 66 (0.9%) |
| 75 Years and older | 5,342 (99.7%) | 17 (0.3%) |
| Total | 68,892 (81.4%) | 15,733 (18.6%) |
Health Insurance Coverage by Citizenship Status in Angelina County

| Citizenship Status | With Coverage | Without Coverage |
| Native Born | 6,209 (92.2%) | 528 (7.8%) |
| Foreign Born, Citizen | 13,927 (85.5%) | 2,370 (14.5%) |
| Foreign Born, not a Citizen | 5,656 (70.6%) | 2,351 (29.4%) |
Health Insurance Coverage by Household Income in Angelina County
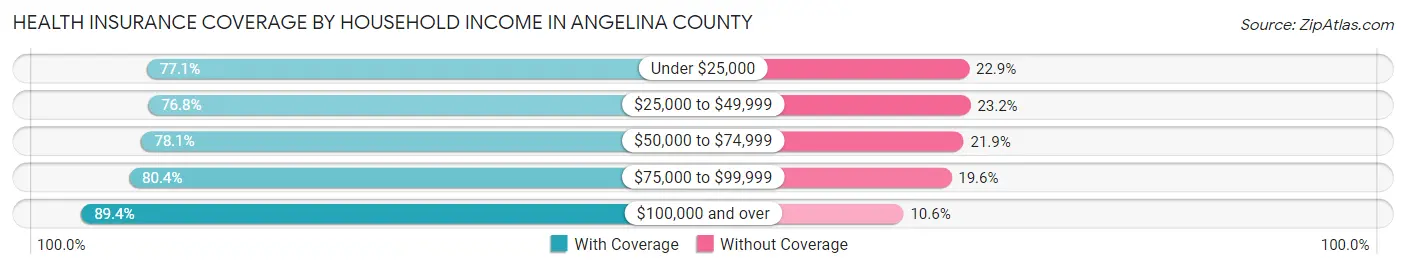
| Household Income | With Coverage | Without Coverage |
| Under $25,000 | 9,558 (77.1%) | 2,841 (22.9%) |
| $25,000 to $49,999 | 14,607 (76.8%) | 4,406 (23.2%) |
| $50,000 to $74,999 | 12,596 (78.1%) | 3,526 (21.9%) |
| $75,000 to $99,999 | 9,558 (80.4%) | 2,327 (19.6%) |
| $100,000 and over | 21,466 (89.4%) | 2,551 (10.6%) |
Public vs Private Health Insurance Coverage by Age in Angelina County
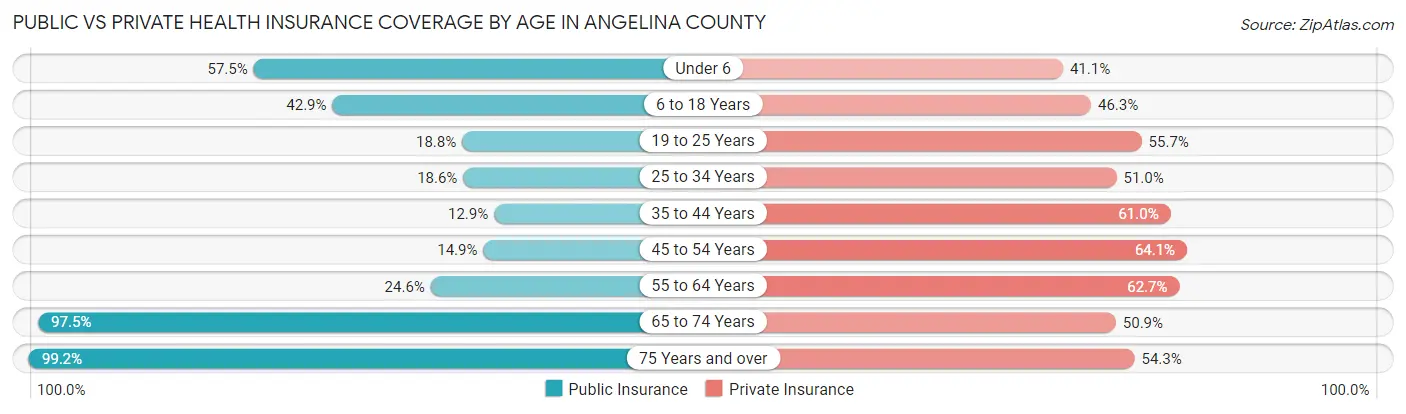
| Age Bracket | Public Insurance | Private Insurance |
| Under 6 | 3,874 (57.5%) | 2,766 (41.1%) |
| 6 to 18 Years | 6,987 (42.9%) | 7,539 (46.3%) |
| 19 to 25 Years | 1,505 (18.8%) | 4,457 (55.7%) |
| 25 to 34 Years | 1,776 (18.6%) | 4,873 (51.0%) |
| 35 to 44 Years | 1,306 (12.9%) | 6,196 (61.0%) |
| 45 to 54 Years | 1,535 (14.9%) | 6,615 (64.1%) |
| 55 to 64 Years | 2,567 (24.6%) | 6,530 (62.6%) |
| 65 to 74 Years | 7,567 (97.5%) | 3,949 (50.9%) |
| 75 Years and over | 5,316 (99.2%) | 2,912 (54.3%) |
| Total | 32,433 (38.3%) | 45,837 (54.2%) |
Disability Status by Sex by Age in Angelina County
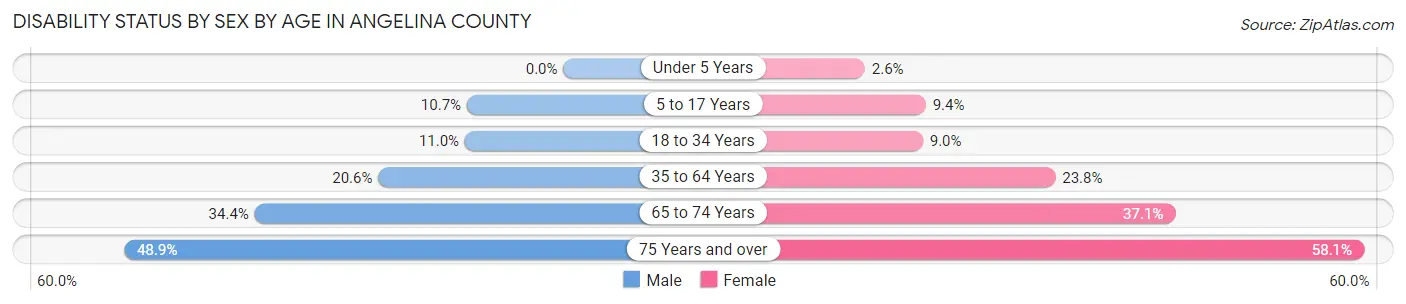
| Age Bracket | Male | Female |
| Under 5 Years | 0 (0.0%) | 70 (2.6%) |
| 5 to 17 Years | 886 (10.7%) | 759 (9.3%) |
| 18 to 34 Years | 1,006 (11.0%) | 849 (9.0%) |
| 35 to 64 Years | 3,109 (20.6%) | 3,762 (23.8%) |
| 65 to 74 Years | 1,185 (34.4%) | 1,602 (37.1%) |
| 75 Years and over | 1,093 (48.9%) | 1,817 (58.1%) |
Disability Class by Sex by Age in Angelina County
Disability Class: Hearing Difficulty
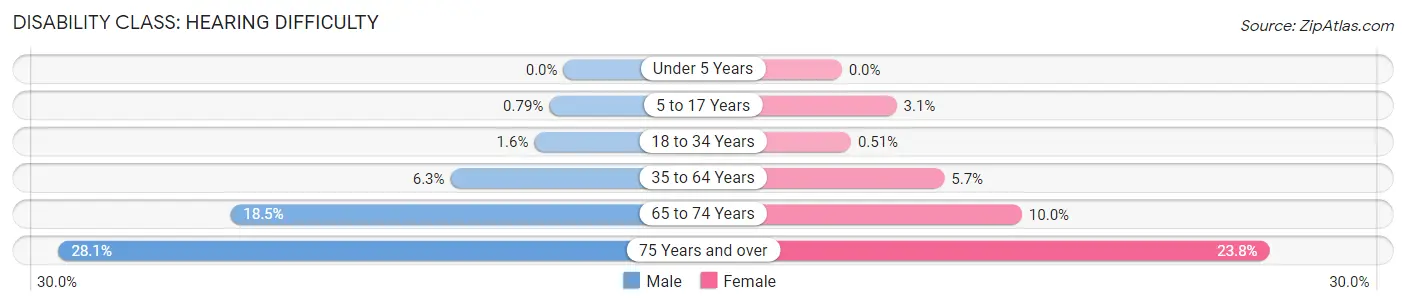
| Age Bracket | Male | Female |
| Under 5 Years | 0 (0.0%) | 0 (0.0%) |
| 5 to 17 Years | 65 (0.8%) | 248 (3.0%) |
| 18 to 34 Years | 149 (1.6%) | 48 (0.5%) |
| 35 to 64 Years | 949 (6.3%) | 903 (5.7%) |
| 65 to 74 Years | 639 (18.5%) | 433 (10.0%) |
| 75 Years and over | 628 (28.1%) | 744 (23.8%) |
Disability Class: Vision Difficulty
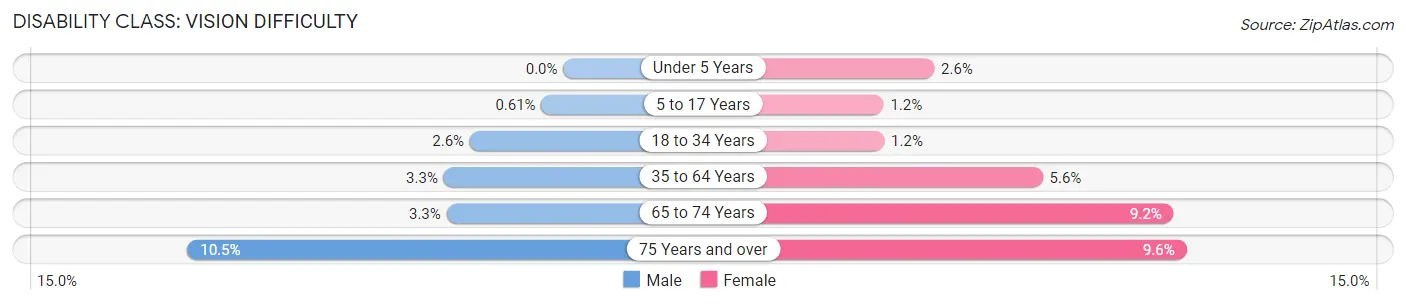
| Age Bracket | Male | Female |
| Under 5 Years | 0 (0.0%) | 70 (2.6%) |
| 5 to 17 Years | 50 (0.6%) | 94 (1.2%) |
| 18 to 34 Years | 239 (2.6%) | 111 (1.2%) |
| 35 to 64 Years | 503 (3.3%) | 884 (5.6%) |
| 65 to 74 Years | 112 (3.3%) | 399 (9.2%) |
| 75 Years and over | 234 (10.5%) | 300 (9.6%) |
Disability Class: Cognitive Difficulty
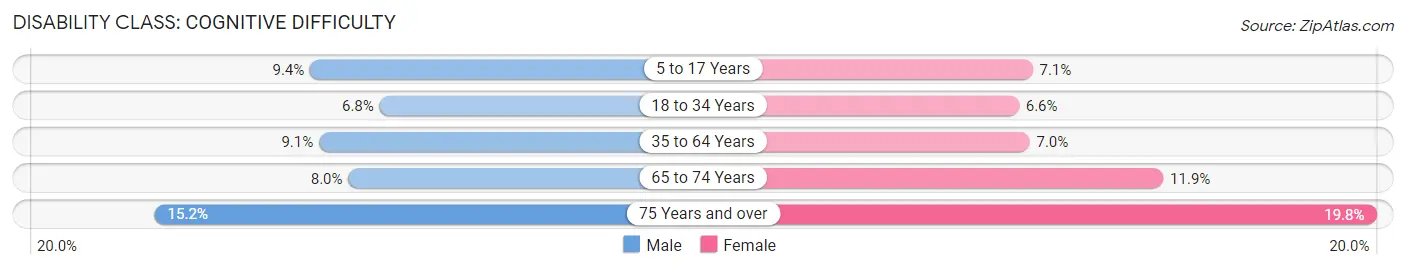
| Age Bracket | Male | Female |
| 5 to 17 Years | 775 (9.4%) | 575 (7.1%) |
| 18 to 34 Years | 626 (6.8%) | 619 (6.6%) |
| 35 to 64 Years | 1,368 (9.1%) | 1,103 (7.0%) |
| 65 to 74 Years | 275 (8.0%) | 515 (11.9%) |
| 75 Years and over | 339 (15.2%) | 620 (19.8%) |
Disability Class: Ambulatory Difficulty
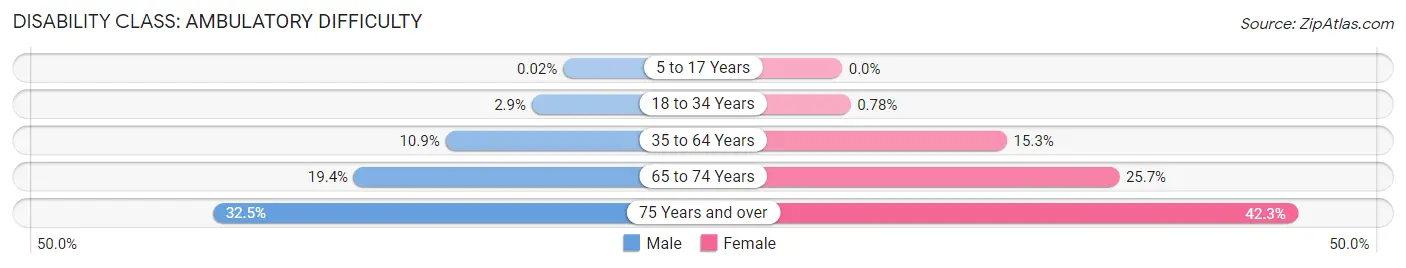
| Age Bracket | Male | Female |
| 5 to 17 Years | 2 (0.0%) | 0 (0.0%) |
| 18 to 34 Years | 269 (2.9%) | 73 (0.8%) |
| 35 to 64 Years | 1,650 (10.9%) | 2,420 (15.3%) |
| 65 to 74 Years | 670 (19.4%) | 1,110 (25.7%) |
| 75 Years and over | 727 (32.5%) | 1,322 (42.3%) |
Disability Class: Self-Care Difficulty
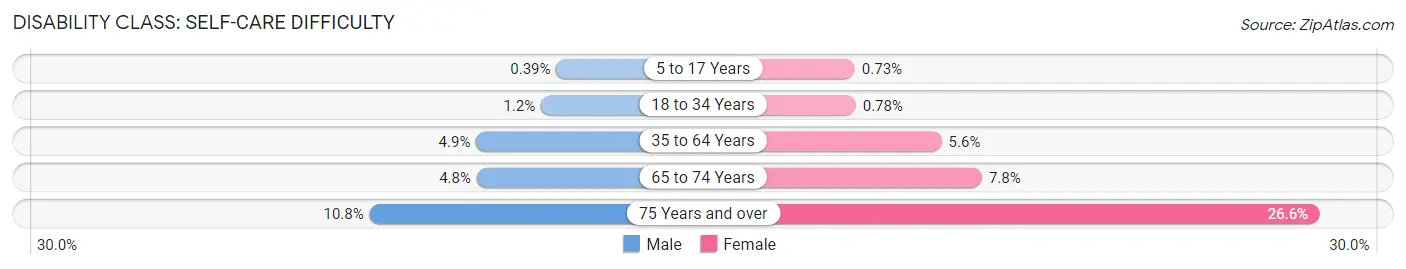
| Age Bracket | Male | Female |
| 5 to 17 Years | 32 (0.4%) | 59 (0.7%) |
| 18 to 34 Years | 114 (1.2%) | 73 (0.8%) |
| 35 to 64 Years | 731 (4.9%) | 880 (5.6%) |
| 65 to 74 Years | 166 (4.8%) | 337 (7.8%) |
| 75 Years and over | 241 (10.8%) | 832 (26.6%) |
Technology Access in Angelina County
Computing Device Access in Angelina County
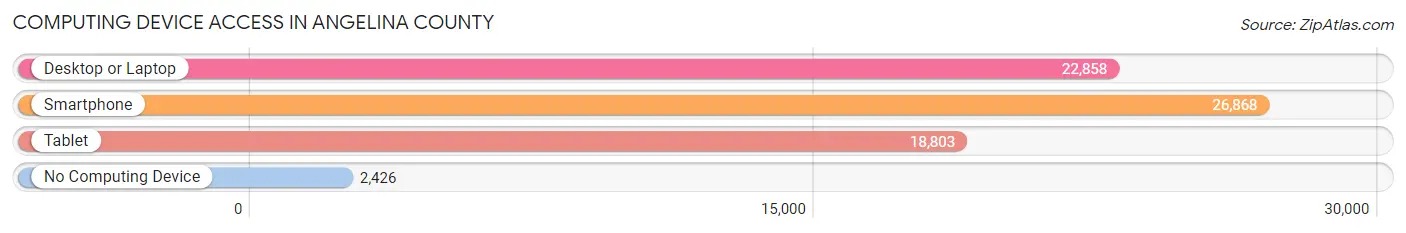
| Device Type | # Households | % Households |
| Desktop or Laptop | 22,858 | 72.4% |
| Smartphone | 26,868 | 85.1% |
| Tablet | 18,803 | 59.5% |
| No Computing Device | 2,426 | 7.7% |
| Total | 31,583 | 100.0% |
Internet Access in Angelina County
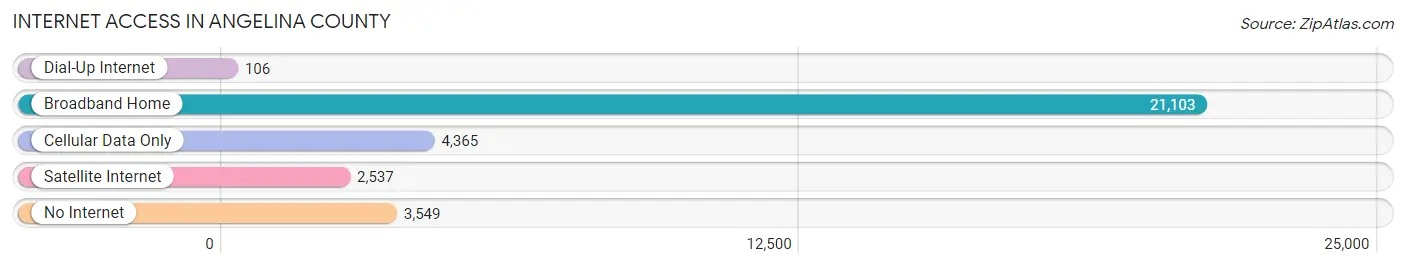
| Internet Type | # Households | % Households |
| Dial-Up Internet | 106 | 0.3% |
| Broadband Home | 21,103 | 66.8% |
| Cellular Data Only | 4,365 | 13.8% |
| Satellite Internet | 2,537 | 8.0% |
| No Internet | 3,549 | 11.2% |
| Total | 31,583 | 100.0% |
Angelina County Summary
Angeline County is located in the East Texas region of the United States. It is bordered by Nacogdoches County to the north, San Augustine County to the east, Sabine County to the south, and Shelby County to the west. The county seat is Lufkin, and the largest city is Lufkin. The county was created in 1846 and is named for a Hasinai Native American woman who assisted early Spanish missionaries.
Geography
Angelina County is located in the East Texas region of the United States. It is bordered by Nacogdoches County to the north, San Augustine County to the east, Sabine County to the south, and Shelby County to the west. The county has a total area of 1,079 square miles, of which 1,072 square miles is land and 7.2 square miles is water. The county is located in the Piney Woods region of Texas, and is home to the Angelina National Forest. The county is also home to the Sam Rayburn Reservoir, which is the largest lake in Texas.
Demographics
As of the 2010 United States Census, there were 86,771 people, 32,845 households, and 22,845 families residing in the county. The population density was 81.2 people per square mile. There were 37,919 housing units at an average density of 35.4 per square mile. The racial makeup of the county was 74.2% White, 17.2% Black or African American, 0.7% Native American, 0.7% Asian, 0.1% Pacific Islander, 5.3% from other races, and 2.0% from two or more races. 13.7% of the population were Hispanic or Latino of any race.
Economy
Angelina County is home to a diverse economy. The county is home to a number of manufacturing and industrial companies, including Lufkin Industries, which produces oilfield equipment, and Temple-Inland, which produces paper products. The county is also home to a number of timber and lumber companies, as well as a number of agricultural operations. The county is also home to a number of retail and service businesses, as well as a number of healthcare and educational institutions.
The county is also home to a number of tourist attractions, including the Angelina National Forest, the Sam Rayburn Reservoir, and the Texas State Railroad. The county is also home to a number of festivals and events, including the annual Lufkin Azalea Trail Festival.
Conclusion
Angelina County is a diverse and vibrant county located in the East Texas region of the United States. The county is home to a number of manufacturing and industrial companies, as well as a number of timber and lumber companies, agricultural operations, and retail and service businesses. The county is also home to a number of tourist attractions, festivals, and events. The county has a population of 86,771, and the racial makeup of the county is 74.2% White, 17.2% Black or African American, 0.7% Native American, 0.7% Asian, 0.1% Pacific Islander, 5.3% from other races, and 2.0% from two or more races. 13.7% of the population are Hispanic or Latino of any race. Angelina County is a vibrant and diverse county with a strong economy and a rich history.
Common Questions
What is Per Capita Income in Angelina County?
Per Capita income in Angelina County is $27,460.
What is the Median Family Income in Angelina County?
Median Family Income in Angelina County is $66,502.
What is the Median Household income in Angelina County?
Median Household Income in Angelina County is $57,055.
What is Income or Wage Gap in Angelina County?
Income or Wage Gap in Angelina County is 37.0%.
Women in Angelina County earn 63.0 cents for every dollar earned by a man.
What is Family Income Deficit in Angelina County?
Family Income Deficit in Angelina County is $11,373.
Families that are below poverty line in Angelina County earn $11,373 less on average than the poverty threshold level.
What is Inequality or Gini Index in Angelina County?
Inequality or Gini Index in Angelina County is 0.43.
What is the Total Population of Angelina County?
Total Population of Angelina County is 86,608.
What is the Total Male Population of Angelina County?
Total Male Population of Angelina County is 42,586.
What is the Total Female Population of Angelina County?
Total Female Population of Angelina County is 44,022.
What is the Ratio of Males per 100 Females in Angelina County?
There are 96.74 Males per 100 Females in Angelina County.
What is the Ratio of Females per 100 Males in Angelina County?
There are 103.37 Females per 100 Males in Angelina County.
What is the Median Population Age in Angelina County?
Median Population Age in Angelina County is 37.8 Years.
What is the Average Family Size in Angelina County
Average Family Size in Angelina County is 3.1 People.
What is the Average Household Size in Angelina County
Average Household Size in Angelina County is 2.6 People.
How Large is the Labor Force in Angelina County?
There are 39,762 People in the Labor Forcein in Angelina County.
What is the Percentage of People in the Labor Force in Angelina County?
59.4% of People are in the Labor Force in Angelina County.
What is the Unemployment Rate in Angelina County?
Unemployment Rate in Angelina County is 6.0%.